Table of Contents
As filed with the Securities and Exchange Commission on February 24, 2015
UNITED STATES
SECURITIES AND EXCHANGE COMMISSION
WASHINGTON, D.C. 20549
Form 20-F
(Mark one)
| ¨ | REGISTRATION STATEMENT PURSUANT TO SECTION 12(b) OR (g) OF THE SECURITIES EXCHANGE ACT OF 1934 |
OR
| x | ANNUAL REPORT PURSUANT TO SECTION 13 OR 15(d) OF THE SECURITIES EXCHANGE ACT OF 1934 |
For the fiscal year ended December 31, 2014
OR
| ¨ | TRANSITION REPORT PURSUANT TO SECTION 13 OR 15(d) OF THE SECURITIES EXCHANGE ACT OF 1934 |
OR
| ¨ | SHELL COMPANY REPORT PURSUANT TO SECTION 13 OR 15(d) OF THE SECURITIES EXCHANGE ACT OF 1934 |
Commission file number 001-05146-01
KONINKLIJKE PHILIPS N.V.
(Exact name of Registrant as specified in charter)
ROYAL PHILIPS
(Translation of Registrant’s name into English)
The Netherlands
(Jurisdiction of incorporation or organization)
Philips Center, Amstelplein 2, 1096 BC Amsterdam, The Netherlands
(Address of principal executive office)
Marnix van Ginneken, Chief Legal Officer & Secretary to the Board of Management
+31 20 59 77232, marnix.van.ginneken@philips.com, Philips Center, Amstelplein 2, 1096 BC Amsterdam, The Netherlands
(Name, Telephone, E-mail and/or Facsimile number and Address of Company Contact Person)
Securities registered or to be registered pursuant to Section 12(b) of the Act:
| Title of each class | Name of each exchange on which registered | |||
| Common Shares – par value | New York Stock Exchange | |||
| Euro (EUR) 0.20 per share | ||||
Securities registered or to be registered pursuant to Section 12(g) of the Act:
None
Securities for which there is a reporting obligation pursuant to Section 15(d) of the Act:
None
(Title of class)
Indicate the number of outstanding shares of each of the issuer’s classes of capital or common stock as of the close of the period covered by the annual report:
| Class | Outstanding at December 31, 2014 | |
| Koninklijke Philips N.V. | 934,819,413 shares, including | |
| Common Shares par value EUR 0.20 per share | 20,430,544 treasury shares |
Indicate by check mark if the registrant is a well-known seasoned issuer, as defined in Rule 405 of the Securities Act. x Yes ¨ No
If this report is an annual or transition report, indicate by check mark if the registrant is not required to file reports pursuant to section 13 or 15(d) of the Securities Exchange Act of 1934. ¨ Yes x No
Note-Checking the box above will not relieve any registrant required to file reports pursuant to Section 13 or 15(d) of the Securities Exchange Act of 1934 from their obligations under those Sections.
Indicate by check mark whether the registrant (1) has filed all reports required to be filed by Section 13 or 15(d) of the Securities Exchange Act of 1934 during the preceding 12 months (or for such shorter period that the registrant was required to file such reports), and (2) has been subject to such filing requirements for the past 90 days. x Yes ¨ No
Indicate by check mark whether the registrant has submitted electronically and posted on its corporate Web site, if any, every Interactive Data File required to be submitted and posted pursuant to Rule 405 of Regulation S-T (§232.405 of this chapter) during the preceding 12 months (or for such shorter period that the registrant was required to submit and post such files). ¨ Yes ¨ No
Indicate by check mark whether the registrant is a large accelerated filer, an accelerated filer, or a non-accelerated filer. See definition of “accelerated filer and large accelerated filer” in Rule 12b-2 of the Exchange Act. (Check one):
Large accelerated filer x Accelerated filer ¨ Non-accelerated filer ¨
Indicate by check mark which basis of accounting the registrant has used to prepare the financial statements included in this filing:
|
U.S. GAAP ¨ |
International Financial Reporting Standards as issued by by the International Accounting Standards Board x |
Other ¨ |
If “Other” has been checked in response to the previous question, indicate by check mark which financial statement item the registrant has elected to follow. ¨ Item 17 ¨ Item 18
If this is an annual report, indicate by check mark whether the registrant is a shell company (as defined in Rule 12b-2 of the Exchange Act). ¨ Yes x No
Table of Contents
Significant developments
In September 2014 Philips announced its plan to sharpen its strategic focus by establishing two stand-alone companies focused on the HealthTech and Lighting Solutions opportunities.
To achieve this transformation, from January 1, 2015, Philips started to integrate the sectors Consumer Lifestyle and Healthcare into one operating company focused on our HealthTech businesses. At the same time Philips is taking the next step in the implementation of its new operating model which will give the company a dedicated, focused and lean management structure, as a result of the planned integration of the relevant sector and group layers.
The establishment of the two stand-alone companies will also involve the split and allocation of the current Innovation, Group & Services sector to each company in 2015. This means that in the course of 2015 the IG&S sector as currently described in this Annual Report will disappear and no longer be presented as a separate segment for reporting purposes.
Philips also started the process to carve out its Lighting business into a separate legal structure and will consider various options for ownership structures for this company with direct access to capital markets. The proposed separation of the Lighting business impacts all businesses and markets as well as all supporting functions and all assets and liabilities of the Group and may require complex and time consuming disentanglement efforts. Philips expects the separation will take approximately 12-18 months and currently estimates separation costs to be in the range of EUR 300-400 million in 2015. However, the separation could take more time than originally planned or anticipated, which may expose Philips to risks of additional cost and other adverse consequences. It should be noted that there is no certainty as to the method or timing of the separation of the Lighting business. For further information on specific risks involved in the separation please refer to chapter 7, Risk management, of this report.
Finally, Philips is in discussion with external investors for the combined Lumileds and Automotive Lighting businesses and expects to complete a transaction in the first half of 2015. Therefore, the combined businesses of Lumileds and Automotive are reported as discontinued operations in the Consolidated statements of income and cash flows. As a result, Lumileds and Automotive sales and Adjusted IFO are no longer included in the Lighting and Group results of continuing operations. Prior-period financial information presented and discussed in this Annual Report have been restated for the treatment of the combined businesses of Lumileds and Automotive as discontinued operations (see note 3, Discontinued operations and other assets classified as held for sale). The applicable assets and liabilities of these combined businesses are reported under Assets and Liabilities classified as held for sale in the consolidated balance sheets as of December 31, 2014.
These developments will have a significant impact on Philips and its organization in many respects. From an external financial reporting perspective, it should be noted that the planned organizational changes will require Philips to transition to a new reporting structure in the course of 2015. At that stage, and in view of applicable IFRS requirements, Philips will report and discuss its financial performance on the basis of different reportable segments than the sectors currently presented and discussed in this Annual Report.
Further updates will be provided in the course of 2015.
2 Annual Report 2014
Table of Contents


Annual Report 2014 3
Table of Contents
| 19 | Exhibits | 276 | ||||
|
19.1 |
Index of exhibits | 276 | ||||
|
19.2 |
Signatures | 277 | ||||
|
19.3 |
Exhibits | 278 | ||||
|
19.4 |
Exhibit 1 English translation of the Articles of Association of the Company | 279 | ||||
|
19.5 |
Exhibit 7 | 293 | ||||
|
19.6 |
Exhibit 8 List of subsidiaries | 294 | ||||
|
19.7 |
Exhibit 12 (a) Certification | 302 | ||||
|
19.8 |
Exhibit 12 (b) Certification | 303 | ||||
|
19.9 |
Exhibit 13 (a) | 304 | ||||
|
19.10 |
Exhibit 13 (b) | 305 | ||||
|
19.11 |
Exhibit 15 (a) | 306 | ||||
|
19.12 |
Exhibit 15 (b) | 307 | ||||
4 Annual Report 2014
Table of Contents
Introduction
This document contains information required for the Annual Report on Form 20-F for the year ended December 31, 2014 of Koninklijke Philips N.V. (the 2014 Form 20-F). Reference is made to the Form 20-F cross reference table herein. Only (i) the information in this document that is referenced in the Form 20-F cross reference table, (ii) this introduction, the cautionary statement “forward-looking statements” and explanation on “use of non-GAAP information” on the next three pages and (iii) the Exhibits shall be deemed to be filed with the Securities and Exchange Commission for any purpose. Any additional information in this document which is not referenced in the Form 20-F cross reference table, or the Exhibits themselves, shall not be deemed to be so incorporated by reference, shall not be part of the 2014 Form 20-F and is furnished to the Securities and Exchange Commission for information only.
The terms “Philips”, the “Company”, “Group”, “we”, “our” and “us” refer to Koninklijke (Royal) Philips N.V. and as applicable to its subsidiaries and/or its interest in joint ventures and associates.
IFRS based information
The audited consolidated financial statements as of December 31, 2014 and 2013, and for each of the years in the three-year period ended December 31, 2014, included in the 2014 Form 20-F have been prepared in accordance with International Financial Reporting Standards (IFRS) as endorsed by the European Union (EU). All standards and interpretations issued by the International Accounting Standards Board (IASB) and the IFRS Interpretations Committee effective year-end 2014 have been endorsed by the EU, except that the EU did not adopt certain paragraphs of IAS 39 applicable to certain hedge transactions. Philips has no hedge transactions to which these paragraphs are applicable. Consequently, the accounting policies applied by Philips also comply with IFRS as issued by the IASB.
Non-GAAP information
In presenting and discussing the Philips Group’s financial position, operating results and cash flows, management uses certain non-GAAP financial measures such as: comparable growth; adjusted income from operations; net operating capital; net debt; cash flow before financing activities; net capital expenditures and free cash flow. These non-GAAP financial measures should not be viewed in isolation as alternatives to the equivalent IFRS measure and should be used in conjunction with the most directly comparable IFRS measure(s). Reference is made to the section titled “Use of non-GAAP information” for further information.
Third-party market share data
Statements regarding market share, contained in this document, including those regarding Philips’ competitive position, are based on outside sources such as specialized research institutes, industry and dealer panels in combination with management estimates. Where full year information regarding 2014 is not yet available to Philips, market share statements may also be based on estimates and projections prepared by outside sources or management. Rankings are based on sales unless otherwise stated.
Fair value information
In presenting the Philips Group’s financial position, fair values are used for the measurement of various items in accordance with the applicable accounting standards. These fair values are based on market prices, where available, and are obtained from sources that are deemed to be reliable. Readers are cautioned that these values are subject to changes over time and are only valid at the balance sheet date. When quoted prices or observable market values do not exist, fair values are estimated using valuation models, which we believe are appropriate for their purpose. They require management to make significant assumptions with respect to future developments which are inherently uncertain and may therefore deviate from actual developments. Critical assumptions used are disclosed in the financial statements. In certain cases, independent valuations are obtained to support management’s determination of fair values.
Documents on display
It is possible to read and copy documents referred to in the 2014 Form 20-F that have been filed with the SEC at the SEC’s public reference room located at 100 F Street, N.E., Room 1580, Washington, D.C. 20549. Please call the SEC at 1-800-SEC-0330 for further information on the public reference rooms and their copy charges. Philips SEC filings are also publicly available through the SEC’s website at www.sec.gov .
For definitions and abbreviations reference is made to chapter 18, Definitions and abbreviations, of this report.
Annual Report 2014 5
Table of Contents
Introduction
Pursuant to provisions of the United States Private Securities Litigation Reform Act of 1995, Philips is providing the following cautionary statement.
This document, including the information referred to in the Form 20-F cross reference table, contains certain forward-looking statements with respect to the financial condition, results of operations and business of Philips and certain of the plans and objectives of Philips with respect to these items, in particular, among other statements, certain statements in Item 4 “Information on the Company” with regard to management objectives, market trends, market standing, product volumes, business risks, the implementation of our Accelerate! program, the statements in Item 8 “Financial Information” relating to legal proceedings and goodwill, the statements in Item 5 “Operating and financial review and prospects” with regard to trends in results of operations, margins, overall market trends, risk management, exchange rates and statements in Item 11 “Quantitative and qualitative disclosures about market risks” relating to risk caused by derivative positions, interest rate fluctuations and other financial exposure are forward- looking in nature. Forward-looking statements can be identified generally as those containing words such as “anticipates”, “assumes”, “believes”, “estimates”, “expects”, “should”, “will”, “will likely result”, “forecast”, “outlook”, “projects”, “may” or similar expressions. By their nature, forward-looking statements involve risk and uncertainty, because they relate to events that depend on circumstances that will occur in the future. There are a number of factors that could cause actual results and developments to differ materially from those expressed or implied by these forward-looking statements.
These factors include, but are not limited to, domestic and global economic and business conditions, developments within the euro zone, the successful implementation of our strategy and our ability to realize the benefits of this strategy, our ability to develop and market new products, changes in legislation, legal claims, changes in exchange and interest rates, changes in tax rates, pension costs and actuarial assumptions, raw materials and employee costs, our ability to identify and complete successful acquisitions and to integrate those acquisitions into our business, our ability to successfully exit certain businesses or restructure our operations, the rate of technological changes, political, economic and other developments in countries where Philips operates, industry consolidation and competition.
As a result, Philips’ actual future results may differ materially from the plans, goals and expectations set forth in such forward-looking statements. For a discussion of factors that could cause future results to differ from such forward-looking statements, reference is made to the information in Item 3D “Risk Factors”.
Koninklijke Philips N.V. believes that an understanding of sales performance is enhanced when the effects of currency movements and acquisitions and divestments (changes in consolidation) are excluded. Accordingly, in addition to presenting ‘nominal sales growth’, ‘comparable sales growth’ is provided.
Comparable sales exclude the effects of currency movements and changes in consolidation. As indicated in the note 1, Significant accounting policies, sales and income are translated from foreign currencies into the Company’s reporting currency, the euro, at the exchange rate on transaction dates during the respective years. As a result of significant currency movements during the years presented, the effects of translating foreign currency sales amounts into euros could have a material impact. Therefore, these impacts have been excluded in arriving at the comparable sales in euros. Currency effects have been calculated by translating previous years’ foreign currency sales amounts into euros at the following year’s exchange rates in comparison with the sales in euros as historically reported. The years under review were characterized by a number of acquisitions and divestments, as a result of which activities were consolidated or deconsolidated. The effect of consolidation changes has also been excluded in arriving at the comparable sales. For the purpose of calculating comparable sales, when a previously consolidated entity is sold or contributed to a venture that is not consolidated by the Company, relevant sales are excluded from impacted prior-year periods. Similarly, when an entity is acquired, relevant sales are excluded from impacted periods.
Philips discusses “adjusted income from operations” in the 2014 Form 20-F. Adjusted income from operations represents income from operations before amortization and impairment of intangible assets generated in acquisitions (excluding software and capitalized development expenses).
The Company uses the term “adjusted income from operations” to evaluate the performance of the Philips Group and its sectors. Referencing “adjusted income from operations” is considered appropriate in light of the following:
Philips has announced that one of its strategic drivers is to increase profitability through re-allocation of its resources towards opportunities offering more consistent and higher returns. Moreover, Philips intends to redeploy capital through value-creating acquisitions. Since 2006, management has used the “adjusted income from operations” measurement internally to monitor performance of the businesses on a comparable basis. As of 2007, Philips has also set external performance targets based on this
6 Annual Report 2014
Table of Contents
Introduction
measurement as it will not be distorted by the unpredictable effects of future, unidentified acquisitions.
Philips believes that an understanding of the Group’s financial condition is enhanced by the disclosure of net operating capital (NOC), as this figure is used by Philips’ management to evaluate the capital efficiency of the Philips Group and its operating sectors. NOC is defined as: total assets excluding assets classified as held for sale less : (a) cash and cash equivalents, (b) deferred tax assets, (c) other non-current financial assets and current financial assets, (d) investments in associates, and after deduction of: (e) provisions, (f) accounts and notes payable, (g) accrued liabilities, (h) other non-current liabilities and other current liabilities.
Net debt is defined as the sum of long- and short-term debt minus cash and cash equivalents. The net debt position as a percentage of the sum of group equity (shareholders’ equity and non-controlling interests) and net debt is presented to express the financial strength of the Company. This measure is widely used by management and investment analysts and is therefore included in the disclosure.
Cash flows before financing activities, being the sum total of net cash from operating activities and net cash from investing activities, and free cash flow, being net cash from operating activities minus net capital expenditures, are presented separately to facilitate the reader’s understanding of the Company’s funding requirements.
Net capital expenditures comprise of purchase of intangible assets, proceeds from sale of intangible assets, expenditures on development assets, capital expenditures on property, plant and equipment and proceeds from disposals of property, plant and equipment. This measure is widely used by management to calculate free cash flow.
Annual Report 2014 7
Table of Contents
Form 20-F cross reference table
Form 20-F cross reference table
Only (i) the information in this document that is referenced in the Form 20-F cross reference table, (ii) the Introduction, the cautionary statements concerning Forward-looking statements and explanation on use of non-GAAP information, of this report on pages 5-7, and (iii) the Exhibits shall be deemed to be filed with the Securities and Exchange Commission for any purpose. The content of Philips’ websites and other websites referenced herein should not be considered to be a part of or incorporated into the 2014 Form 20-F. Any additional information which is not referenced in the Form 20-F cross reference table or the Exhibits themselves shall not be deemed to be so incorporated by reference, shall not be part of the 2014 Form 20-F and is furnished to the Securities and Exchange Commission for information only.
The table below sets out the location in this document of the information required by SEC Form 20-F. The exact location is included in the column ‘Location in this document’. The column ‘Page’ includes the starting page of the section/ paragraph for reference only.
8 Annual Report 2014
Table of Contents
Form 20-F cross reference table
| Item | Form 20-F caption | Location in this document | Page | |||||
|
|
||||||||
|
1 |
Identity of directors, senior management and advisors | Not applicable | ||||||
|
2 |
Offer statistics and expected timetable | Not applicable | ||||||
|
3 |
Key information | |||||||
| A Selected financial data | 16.1. Five-year overview (condensed) | 259 | ||||||
| 17.1. Key financials and dividend policy - Proposed distribution | 260 | |||||||
| 17.1. Key financials and dividend policy - Information for investors in New York Registry shares program | 260 | |||||||
| B Capitalization and indebtedness | Not applicable | |||||||
| C Reason for the offer and use of proceeds | Not applicable | |||||||
| D Risk factors | 7.2. Risk categories and factors - Second paragraph | 89 | ||||||
| 7.3. Strategic risks | 89 | |||||||
| 7.4. Operational risks | 91 | |||||||
| 7.5. Compliance risks | 93 | |||||||
| 7.6. Financial risks | 94 | |||||||
| 7.7. Separation risk | 95 | |||||||
|
4 |
Information on the Company | |||||||
| A History and development of the company | Significant developments | 2 | ||||||
| 5.1.6. Restructuring and impairment charges | 38 | |||||||
| 5.1.11. Discontinued operations | 40 | |||||||
| 5.1.13. Acquisitions and divestments | 41 | |||||||
| 5.1.15. Cash flows provided by continuing operations | 42 | |||||||
| 6. Sector performance - Our structure in 2014 & 2015 and beyond | 63 | |||||||
| 11. Corporate governance - Corporate governance of the Philips Group - Introduction | 110 | |||||||
| 11.5. Investor Relations - Corporate seat and head office | 121 | |||||||
| Note 3 Discontinued operations and other assets classified as held for sale | 154 | |||||||
| Note 4 Acquisitions and divestments | 155 | |||||||
| Note 32 Subsequent events | 200 | |||||||
| 17.6. Investor contact - How to reach us | 268 | |||||||
| B Business Overview | Introduction - Third-party market share data | 5 | ||||||
| 5.1. Financial performance- from 5.1.1 to 5.1.2 and from 5.1.4 to 5.1.14 | 31 | |||||||
| 5.1.24. Supply management | 48 | |||||||
| 5.2.11. Conflict minerals: issues further down the chain | 55 | |||||||
| 6. Sector performance - Our structure in 2014 | 63 | |||||||
| 6.1.2. About Philips Healthcare | 64 | |||||||
| 6.1.4. 2014 financial performance | 66 | |||||||
| 6.2.2. About Philips Consumer Lifestyle | 71 | |||||||
| 6.2.4. 2014 financial performance | 72 | |||||||
| 6.3.2. About Philips Lighting | 77 | |||||||
| 6.3.4. 2014 financial performance | 78 | |||||||
| 6.4.1. About Innovation, Group & Services | 82 | |||||||
| 6.4.2. 2014 financial performance | 85 | |||||||
| 7.1. Our approach to risk management and business control | 87 | |||||||
| 7.3. Strategic risks- Last paragraph | 89 | |||||||
| 7.4. Operational risks - Third & fourth paragraph | 91 | |||||||
| 7.5. Compliance risks | 93 | |||||||
| 11. Corporate governance- Corporate governance of the Philips Group - Introduction | 110 | |||||||
| Note 2 Information by sector and main country | 151 | |||||||
| 14.2.8. Supplier indicators - Addressing issues deeper in the supply chain | 225 | |||||||
| 18. Definitions and abbreviations | 274 | |||||||
| C Organizational structure | 6. Sector performance - Our structure in 2014 | 63 | ||||||
| Note 2 Information by sector and main country | 151 | |||||||
Annual Report 2014 9
Table of Contents
Form 20-F cross reference table
| Item | Form 20-F caption | Location in this document | Page | |||
| Note 5 Interests in entities | 156 | |||||
| 19.6. Exhibit 8 List of subsidiaries | 294 | |||||
| D Property, plant and equipment |
|
151 | ||||
|
|
165 | |||||
|
|
174 | |||||
| Note 25 Contractual obligations | 183 | |||||
|
|
184 | |||||
|
4A |
Unresolved staff comments | Not applicable | ||||
|
5 |
Operating and financial review and prospects | |||||
| A Operating results | Use of non-GAAP information | 6 | ||||
| 5.1. Financial performance- Management summary | 31 | |||||
| 5.1. Financial performance - from 5.1.1 to 5.1.2 and from 5.1.4 to 5.1.14 | 31 | |||||
| 6.1.2. About Philips Healthcare - Regulatory requirements | 64 | |||||
| 6.1.4. 2014 financial performance | 66 | |||||
| 6.2.2. About Philips Consumer Lifestyle - Regulatory requirements | 71 | |||||
| 6.2.4. 2014 financial performance | 72 | |||||
| 6.3.2. About Philips Lighting - Regulatory requirements | 77 | |||||
| 6.3.4. 2014 financial performance | 78 | |||||
| 6.4.2. 2014 financial performance | 85 | |||||
| 5.6. Critical accounting policies | 61 | |||||
|
|
154 | |||||
|
|
155 | |||||
|
|
159 | |||||
|
|
166 | |||||
|
|
168 | |||||
| Note 31 Details of treasury / other financial risks | 196 | |||||
| 7.3. Strategic risks | 89 | |||||
| 7.4. Operational risks | 91 | |||||
| 7.5. Compliance risks | 93 | |||||
| 7.6. Financial risks | 94 | |||||
| 7.7. Separation risk | 95 | |||||
| 15. Reconciliation of non-GAAP information | 252 | |||||
| B Liquidity and capital resources | 5.1. Financial performance - from 5.1.15 to 5.1.23 | 31 | ||||
| Note 17 Equity | 171 | |||||
|
|
174 | |||||
| Note 25 Contractual obligations | 183 | |||||
| Note 31 Details of treasury / other financial risks | 196 | |||||
| C Research and development, patents and licenses, etc. | 5.1.4. Research and development | 37 | ||||
| 6.4.1. About Innovation, Group & Services | 82 | |||||
| D Trend information | 5.5. Outlook | 60 | ||||
| E Off-balance sheet arrangements | 5.1.23. Cash obligations | 47 | ||||
| Note 25 Contractual obligations | 183 | |||||
|
|
184 | |||||
| Note 31 Details of treasury / other financial risks | 196 | |||||
| F Tabular disclosure of contractual obligations | 5.1.23. Cash obligations | 47 | ||||
|
|
183 | |||||
| G Safe Harbor | Forward-looking statements | 6 | ||||
|
6 |
Directors, senior management and employees | |||||
10 Annual Report 2014
Table of Contents
Form 20-F cross reference table
| Item | Form 20-F caption | Location in this document | Page | |||||
| A Directors and senior management | 8. Management | 96 | ||||||
| 9. Supervisory Board | 98 | |||||||
| 11.1. Board of Management - Introduction | 110 | |||||||
| 11.1. Board of Management - (Term of) Appointment and conflicts of interest | 110 | |||||||
| 11.2. Supervisory Board - (Term of) Appointment, individual data and conflicts of interests | 114 | |||||||
| B Compensation |
|
177 | ||||||
| Note 28 Share-based compensation | 187 | |||||||
| Note 29 Information on remuneration | 190 | |||||||
| 10.2. Report of the Remuneration Committee | 103 | |||||||
| C Board practices | 8. Management | 96 | ||||||
| 9. Supervisory Board | 98 | |||||||
| 10. Supervisory Board report | 100 | |||||||
| 11.1. Board of Management | 110 | |||||||
| 11.2. Supervisory Board | 114 | |||||||
| 11.4. Meeting logistics and other information - Internal controls and disclosure policies | 119 | |||||||
| 11.4. Meeting logistics and other information - Auditor information | 119 | |||||||
| D Employees | 5.2.4. Employment | 51 | ||||||
|
|
157 | |||||||
| E Share ownership | 11.1. Board of Management- Amount and composition of the remuneration of the Board of Management | 110 | ||||||
|
|
171 | |||||||
|
|
187 | |||||||
|
|
190 | |||||||
|
7 |
Major shareholders and related party transactions | |||||||
| A Major shareholders | 11.5. Investor Relations - Major shareholders and other information for shareholders | 121 | ||||||
| 11.6. Additional information - Articles of association | 123 | |||||||
| B Related party transactions | 11.1. Board of Management | 110 | ||||||
|
|
156 | |||||||
|
|
187 | |||||||
| C Interests of experts and counsel |
Not applicable
|
|||||||
|
8 |
Financial information | |||||||
| A Consolidated statements and other financial information | 12. Group financial statements | 128 | ||||||
| 17.1. Key financials and dividend policy - Dividend policy | 260 | |||||||
| B Significant changes |
|
200 | ||||||
|
9 |
The offer and listing | |||||||
| A Offer and listing details | 17.4. Performance in relation to market indices | 265 | ||||||
| B Plan of distribution | Not applicable | |||||||
| C Markets | 17.4. Performance in relation to market indices | 265 | ||||||
| D Selling shareholders | Not applicable | |||||||
| E Dilution | Not applicable | |||||||
Annual Report 2014 11
Table of Contents
Form 20-F cross reference table
| Item | Form 20-F caption | Location in this document | Page | |||
| F Expense of the issue | Not applicable | |||||
|
10 |
Additional information | |||||
| A Share capital | Not applicable | |||||
| B Memorandum and articles of association | 11.1. Board of Management - (Term of) Appointment and conflicts of interest | 110 | ||||
| 11.2. Supervisory Board - (Term of) Appointment, individual data and conflicts of interest | 114 | |||||
| 11.3. General Meeting of Shareholders - Main powers of the General Meeting of Shareholders | 117 | |||||
| 11.4. Meeting logistics and other information | 119 | |||||
| 11.6. Additional information - Articles of association | 123 | |||||
| 19.1. Index of exhibits - Exhibit 1 | 276 | |||||
| C Material contracts | 10.2.2. Contracts | 104 | ||||
| 19.1. Index of exhibits - Exhibit 4 (a), (b) and (c) | 276 | |||||
| D Exchange controls | 11.6. Additional information- Exchange controls | 123 | ||||
| E Taxation | 17.7. Taxation | 270 | ||||
| F Dividends and paying agents | Not applicable | |||||
| G Statements by experts | Not applicable | |||||
| H Documents on display | Introduction - Documents on display | 5 | ||||
| I Subsidiary information |
Not applicable
|
|||||
|
11 |
Quantitative and qualitative disclosure about market risk | |||||
| A Quantitative information about market risk | Note 31 Details of treasury / other financial risks | 196 | ||||
| B Qualitative information about market risk | Note 31 Details of treasury / other financial risks | 196 | ||||
| C Interim periods | Not applicable | |||||
| D Safe harbor |
|
196 | ||||
| Forward-looking statements | 6 | |||||
| E Small business issuers |
Not applicable
|
|||||
|
12 |
Description of securities other than equity securities | |||||
| A Debt securities | Not applicable | |||||
| B Warranty and rights | Not applicable | |||||
| C Other securities | Not applicable | |||||
| D American depository shares |
17.8. New York Registry Shares
|
273 | ||||
|
|
||||||
|
13 |
Defaults, dividend arrearages and delinquencies | Not applicable | ||||
12 Annual Report 2014
Table of Contents
Form 20-F cross reference table
| Item | Form 20-F caption | Location in this document | Page | |||
|
14 |
Material modifications to the rights of security holders and use of proceeds | Not applicable | ||||
|
15 |
Controls and procedures | |||||
| A Disclosure controls and procedures | 12.1.1. Disclosure controls and procedures | 129 | ||||
| B Management Annual Report on internal control over financial reporting | 12.1. Management’s report on internal control | 129 | ||||
| C Attestation report of the registered public accounting firm | 12.3.1. Independent auditors’ report on the consolidated financial statements | 131 | ||||
|
D Changes in internal control over financial reporting
|
12.1.2. Changes in internal control over financial reporting | 129 | ||||
|
16A |
Audit Committee Financial Expert | 11.2. Supervisory Board - The Audit Committee | 114 | |||
|
16B |
Code of Ethics | 7.1. Our approach to risk management and business control - Financial Code of Ethics | 87 | |||
|
16C |
Principal Accountant Fees and Services | 10.3. Report of the Audit Committee | 108 | |||
| 11.4. Meeting logistics and other information - Auditor policy | 119 | |||||
|
|
157 | |||||
|
16D |
Exemptions from the Listing Standards for Audit Committees | Not applicable | ||||
|
16E |
Purchases of Equity Securities by the Issuer and Affiliated Purchasers | 11.3. General Meeting of Shareholders - Repurchase and issue of (rights to) own shares | 117 | |||
|
17.2. Share information - Share repurchase programs for capital reduction purposes
|
262 | |||||
|
16F |
Change in Registrant’s Certifying Accountant | Not applicable | ||||
|
16G |
Corporate Governance | 11. Corporate governance - Corporate governance of the Philips Group - Introduction | 110 | |||
| 11.6. Additional information - General | 123 | |||||
|
16H |
Mine Safety Disclosure |
Not applicable
|
||||
|
|
||||||
|
17 |
Financial statements | Not applicable | ||||
|
18 |
Financial statements | 12. Group financial statements | 128 | |||
|
19 |
Exhibits | 19.1. Index of exhibits | 276 | |||
Annual Report 2014 13
Table of Contents
Performance highlights 1
Prior-period financial information has been restated for the treatment of the combined businesses of Lumileds and Automotive as discontinued operations (see note 3, Discontinued operations and other assets classified as held for sale) and for two voluntary accounting policy changes (see note 1, Significant accounting policies). For a reconciliation to the most directly comparable GAAP measures, see chapter 15, Reconciliation of non-GAAP information, of this report.
Philips Group
Key data in millions of EUR unless otherwise stated
2013 - 2014
|
|
|
|||||||
| 2013 | 2014 | |||||||
|
|
|
|||||||
|
Sales |
21,990 | 21,391 | ||||||
|
Comparable sales growth |
3 | % | (1 | )% | ||||
|
Adjusted IFO |
2,276 | 821 | ||||||
|
as a % of sales |
10.4 | % | 3.8 | % | ||||
|
IFO |
1,855 | 486 | ||||||
|
as a % of sales |
8.4 | % | 2.3 | % | ||||
|
Net income (loss) |
1,172 | 411 | ||||||
|
Net income attributable to shareholders per common share in EUR: |
||||||||
|
basic |
1.28 | 0.45 | ||||||
|
diluted |
1.27 | 0.45 | ||||||
|
Net operating capital |
10,238 | 8,838 | ||||||
|
Free cash flow |
82 | 497 | ||||||
|
Shareholders’ equity |
11,214 | 10,867 | ||||||
|
Employees at December 31 |
116,082 | 113,678 | ||||||
|
of which discontinued operations |
10,445 | 8,313 | ||||||
|
|
|
|||||||

Performance in millions of EUR unless otherwise stated
2013 - 2014
|
|
|
|||||||||||||||||||||||||||||||||||||||||||||||
| Group | Healthcare | Consumer Lifestyle | Lighting | |||||||||||||||||||||||||||||||||||||||||||||
| 2013 | 2014 | 2013 | 2014 | 2013 | 2014 | 2013 | 2014 | |||||||||||||||||||||||||||||||||||||||||
|
|
|
|||||||||||||||||||||||||||||||||||||||||||||||
|
Sales |
21,990 | 21,391 |
3%

|
9,575 | 9,186 |
4%
|
4,605 | 4,731 |
3%

|
7,145 | 6,869 |
4%
|
||||||||||||||||||||||||||||||||||||
|
Green Product sales |
10,997 | 11,065 |
1%
|
3,690 | 3,508 |
4%
|
2,270 | 2,605 |
15%
|
5,037 | 4,952 |
2%
|
||||||||||||||||||||||||||||||||||||
|
Sales in mature geographies 1) |
14,322 | 14,004 |
2%
|
7,154 | 6,890 |
4%
|
2,418 | 2,508 |
4%
|
4,254 | 4,182 |
2%
|
||||||||||||||||||||||||||||||||||||
|
Sales in growth geographies 1) |
7,668 | 7,387 |
4%
|
2,421 | 2,296 |
5%
|
2,187 | 2,223 |
2%
|
2,891 | 2,687 |
7%
|
||||||||||||||||||||||||||||||||||||
|
Adjusted IFO |
2,276 | 821 |
64%
|
1,512 | 616 |
59%
|
483 | 573 |
19%
|
580 | 293 |
49%
|
||||||||||||||||||||||||||||||||||||
|
Net operating capital |
10,238 | 8,838 |
14%
|
7,437 | 7,565 |
2%
|
1,261 | 1,353 |
7%
|
4,462 | 3,638 |
18%
|
||||||||||||||||||||||||||||||||||||
|
|
|
|||||||||||||||||||||||||||||||||||||||||||||||
| 1) |
For a definition of mature and growth geographies see chapter 18, Definitions and abbreviations, of this report |
14 Annual Report 2014
Table of Contents
Performance highlights 1

Annual Report 2014 15
Table of Contents
Message from the CEO 2

“We believe that our active reshaping of the portfolio is the best way to create value for our shareholders and to ensure a successful future for the customers and employees of both companies.” Frans van Houten, CEO Royal Philips
Dear stakeholder,
In 2014 we further sharpened our strategic focus and took the next step on our Accelerate! transformation journey by announcing our plan to establish two pure-play, customer-focused companies in the areas of HealthTech and Lighting Solutions – both leveraging the trusted Philips brand.
In light of the mega-trends that are shaping our world – growing and aging populations, the increase in chronic diseases, urbanization, energy resource constraints, etc. – both companies will be well placed to capture growth opportunities as innovative technology solutions & services partners.
Royal Philips will help address the challenges facing the health care ecosystem through new, more integrated forms of care delivery across the health continuum – aided by Big Data, clinical decision support, and the Internet of Things.
The convergence of our consumer technologies that facilitate healthy living, our medical technologies that help clinicians to deliver better treatment, and our mobile and cloud-based technologies that allow data sharing will help health care systems to improve patient outcomes, quality of care delivery and cost productivity.
We see considerable scope to grow in this space, both organically and through bolt-on acquisitions. Our acquisition of Volcano is the next step in building out our HealthTech portfolio and will strengthen our leadership in the growing image-guided therapy market.
Similarly, in the Lighting Solutions space, our LED- based connected value propositions are going beyond illumination and transforming the way we use our personal and public spaces. By giving people satisfying and inspiring experiences, solutions such as Power over Ethernet office lighting, city-wide lighting management and our Philips Hue smart home lighting are set to transform the very fabric of modern life.
16 Annual Report 2014
Table of Contents
Message from the CEO 2
The separation of our Lighting business into a lean, agile, stand-alone company will ensure it is better positioned to capture growth as the world leader in energy-efficient, digital lighting solutions.
We believe that this active reshaping of the portfolio, including the projected sale of the combined Lumileds and Automotive Lighting components businesses, is the best way to create value for our shareholders and to ensure a successful future for the customers and employees of both companies.
Performance in 2014 - a challenging year
As we had expected, 2014 was a difficult year. We continued to improve operational performance in most businesses, yet saw significant headwinds (e.g. market slowdown, exchange rate fluctuations) and other items (e.g. legal matters, restructuring, internal quality and supply chain issues) denting our results, with Adjusted IFO declining by 6.6 percentage points of sales.
Sales were 1% lower on a comparable basis, reflecting sustained softness in a number of markets, including China and Russia, and the voluntary temporary suspension of production at our Cleveland facility.
These factors – compounded by currency effects and the delayed ramp-up of production and shipment from our Cleveland facility – also impacted profitability, resulting in reported Adjusted IFO of 3.8% of sales.
Having said that, the overall figures mask some encouraging performance and strategic shifts. At Healthcare, a major effort was made to remediate the situation in Cleveland and secure external certification of the updated quality management system – setting the stage for a better 2015 as the resumption of shipments gathers momentum. Expanding its offering to help consumers make healthier choices, Consumer Lifestyle continued to perform very well, posting strong growth and earnings. And, pursuing its four-pillar strategy, Lighting recorded a 32% increase in LED-based sales.
We also took decisive action to address underperformance. At Healthcare in the US we rolled out a new go-to-market model for enterprise-level integrated account management. Also in North America, we strengthened Professional Lighting Solutions’ management team and refined a multi-channel go-to-market model to unlock the potential we see in that market. And in Europe, we acted to strengthen Consumer Luminaires’ fundamentals and cost structure, including an optimized portfolio and supply chain.
By the end of 2014 we had completed 41% of our EUR 1.5 billion share buy-back program, and we continue working to further improve the efficiency of our balance sheet.
Supported by Accelerate!
Our Accelerate! transformation program helped us manage through this challenging year, driving improvements across the organization, not least in serving our customers better. Strong customer focus was key to securing long-term partnerships with Karolinska University Hospital and Stockholm County Council in Sweden, Mayo Clinic in the US, and Reinier de Graaf hospital in the Netherlands.
We are seeing quarter-to-quarter growth in the number of such deals, which are all about clinical knowledge, in-depth relationships, and integrated solutions rather than discrete products. Customers are not asking for specific items of equipment, but rather our advice and help in devising, for example, a care pathway to ensure a patient is accurately diagnosed as quickly as possible and in the operating room within 90 minutes of having a stroke. Faced with challenges like these, our combination of customer focus, innovative strength and solutions thinking is key to delivering a successful outcome.
In this context, I am very pleased that the KLAS organization presented Philips with the Best in KLAS award for 2014 during a ceremony at the annual RSNA event in Chicago. The Best in KLAS rankings are based on feedback from customers.
In 2014 we continued to apply Lean methodology to transform our customer value chains. This again enabled us to speed up time-to-market for our innovations – locally relevant value propositions, such as our affordable VISIQ ultra-mobile ultrasound system, our smart Air Purifier in China, and our flat SlimStyle LED light bulb. Innovations like these make a real difference to people’s lives.
Accelerate! also helped us to deliver gross overhead cost savings of EUR 284 million in the year, keeping us on track to hit our 2016 cumulative target of EUR 1.8 billion.
Other key developments in 2014
In Interbrand’s annual ranking of the world’s top 100 brands, our brand value rose by 5%, passing the USD 10 billion mark for the first time.
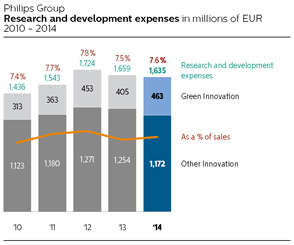
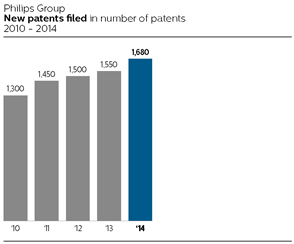
In Philips Research’s centenary year, we underscored our commitment to meaningful innovation by investing EUR 1,635 million in Research & Development in line with prior years and achieving our target of EUR 2 billion spend on Green Innovation a year ahead of schedule. Turning investment into intellectual property, we filed 1,680 patent applications. And with a view to capturing opportunities to create a healthier, more sustainable Africa, we set up an Innovation Hub for the continent in Kenya.
We continued to deliver on our EcoVision commitments in 2014, and our sustainability drive again received widespread recognition – a #14 ranking in Interbrand’s
Annual Report 2014 17
Table of Contents
Message from the CEO 2
top 50 Best Global Green Brands, acknowledgement as a leader in both carbon disclosure and performance by the Carbon Disclosure Project, and top scores in the Dow Jones Sustainability Index. We also continued to upscale our efforts in the area of circular economy, which we believe presents a significant value-creation opportunity. For instance, we opened a new refurbishment center for medical imaging systems in Best (Netherlands), signed an agreement with the island of Aruba to revamp its entire public lighting system, and expanded our partnership with the Ellen MacArthur Foundation, a circular economy advocate.
I am also delighted that we were able to set up the Philips Foundation, a registered charity organization dedicated to helping enable lasting social change in disadvantaged communities through the application of innovation, talent and resources provided by Philips.
An exciting future
With our decision to create two companies in the areas of HealthTech and Lighting Solutions, we have clearly set our strategic direction.
The road ahead is clear, and our determination to succeed absolute. By continuing to execute our Accelerate! program, we will serve our customers better and compete more effectively in the coming years. We will listen closely to our customers, so we continue to understand and anticipate their needs and market requirements.
We will improve operational excellence in everything we do, enhance our capabilities, and implement a standard operating model. Building upon the Philips Business System, this operating model will make us a simpler, more agile company, while also reducing overhead cost.
In order to drive growth, we have encouraged locally relevant innovation, invested in developing business with governments, boosted our advertising and promotion investments, and started new business creation in areas such as Healthcare Informatics, Solutions & Services, Healthcare Transformation Services and Personal Health Solutions.
Over the coming year we will also maintain our focus on improving gross margins, e.g. through our Design for Excellence (DfX) program. And we will realize productivity gains from the overhaul of our business model architecture, with all businesses adopting one of four standardized business models.
In conclusion
We are proposing to the upcoming Annual General Meeting of Shareholders to maintain this year’s distribution at EUR 0.80 per share, in cash or stock.

Looking ahead, we remain cautious about the macroeconomic outlook and expect ongoing volatility in some of our end-markets. We also anticipate further restructuring and separation costs in 2015 and 2016.
As of year-end 2014 we are tracking one percentage point behind on the path to achieving each of our 2016 Group financial targets. We are convinced that this does not change our longer-term performance potential, considering the attractiveness of the Lighting Solutions and HealthTech markets and our competitive position. Later this year, as we progress with the separation of Philips and reallocation of IG&S, we will update the market about the integral performance targets for each of the two operating companies.
On behalf of my colleagues on the Executive Committee, I would like to thank all our employees for their hard work over the past year, as well as their willingness to embrace change. And I wish to thank our customers, shareholders and other stakeholders for the trust and support they continue to give us.

Frans van Houten
Chief Executive Officer
18 Annual Report 2014
Table of Contents
Philips in 2014 at a glance 3

Annual Report 2014 19
Table of Contents
Our strategic focus 4
4.1 Addressing global challenges
For 124 years, Philips has been a leader in building and shaping markets with our meaningful innovations. We have always been guided by our passion to improve people’s lives – true to our vision of making the world healthier and more sustainable through innovation.
In 2014 we announced the next phase of our Accelerate! transformation, moving from a holding company structured around multiple divisions to two stand-alone operating companies – in HealthTech and Lighting Solutions – with the ambition of capturing growth and creating value, both leveraging the trusted Philips brand.
Market opportunities
With our understanding of many of the longer-term challenges our world faces, we see major opportunities to apply our innovative competencies and create value for our stakeholders by delivering technology solutions that improve people’s lives more effectively.
We see a growing need for integrated health care delivery
As the population gets older, with more chronic and lifestyle-related diseases, health care systems are struggling to increase access and quality of care while managing spiraling costs. At the same time, people are increasingly looking for new ways to proactively monitor and manage their health. This is driving the convergence of professional health care and consumer end-markets across the health continuum.
With customers expressing a need for integrated solutions, Royal Philips’ businesses in HealthTech – with their combined clinical and consumer capabilities and cloud-based digital health platform – are well positioned to capture growth in an increasingly connected world, where people are wanting to live healthier lives and societies are looking for more effective and lower-cost solutions along the health continuum. Their total addressable market is estimated at over EUR 100 billion.

20 Annual Report 2014
Table of Contents
Our strategic focus 4.1

We see increasing demand for energy-efficient and digital lighting
The lighting industry is undergoing a radical transformation, driven by the market’s transition to LED and digital technology. Three mega-trends are providing a huge opportunity.
The rapid rise in the world’s population and in new lighting applications is increasing global demand for light. At the same time, with lighting accounting for 19% of global electricity consumption, the world really needs that light to be energy-efficient. And with the integration of LED technology, lighting controls and software opening up new functionality and services, the world will also benefit from the compelling new applications that digital light can offer.
As a stand-alone company, the Lighting Solutions business will be better positioned to capture the value which is shifting from individual products to connected LED lighting systems and services, more than offsetting the decline of conventional lighting. Its total addressable market is estimated at over EUR 60 billion.

Annual Report 2014 21
Table of Contents
Our strategic focus 4.1
Understanding and meeting people’s needs
At Philips, our starting point is always to understand the specific challenges local people face – whether they be a hospital director, a city planner, a doctor, a real estate developer, a consumer, etc.
Having gained these deep insights, we then apply our outstanding innovation capabilities, strong brand, global footprint and talented and engaged people – often in value-adding partnerships – to deliver solutions that meet these needs and make the world healthier and more sustainable.
We measure the impact our solutions are having around the world with our independently verified Lives Improved model. We take a two-dimensional approach – social and ecological – to improving people’s lives. Products and solutions that directly support the curative (care) or preventive (well-being) side of people’s health, determine the contribution to the social dimension. The contribution to the ecological dimension is determined by means of our Green Product portfolio, such as our energy-efficient lighting.
Our business system
To ensure that success is repeatable, i.e. that we create value for our stakeholders time and time again and deliver on our mission and vision, we have adopted the Philips Business System.
Having a single business system reduces complexity, increases speed and, crucially, allows us to spend more time with customers and driving improvement across the company.
Our mission
To improve people’s lives through meaningful innovation
Our vision
At Philips, we strive to make the world healthier and more sustainable through innovation. Our goal is to improve the lives of 3 billion people a year by 2025. We will be the best place to work for people who share our passion. Together we will deliver superior value for our customers and shareholders.
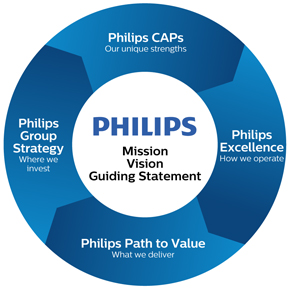
Group strategy
We manage our portfolio with clearly defined strategies and allocate resources to maximize value creation.
CAPs
We strengthen and leverage our core Capabilities, Assets and Positions as they create differential value: deep customer insight, technology innovation, our brand, global footprint, and our people.
Excellence
We are a learning organization that applies common operating principles and practices to deliver to our customers with excellence.
Path to Value
We define and execute business plans that deliver sustainable results along a credible Path to Value.
The ‘Creating value for our stakeholders’ diagram, based on the International Integrated Reporting Council framework, shows how – with the Philips Business System at the heart of our endeavors – we use six different forms of capital to drive value in the short, medium and long term.
22 Annual Report 2014
Table of Contents
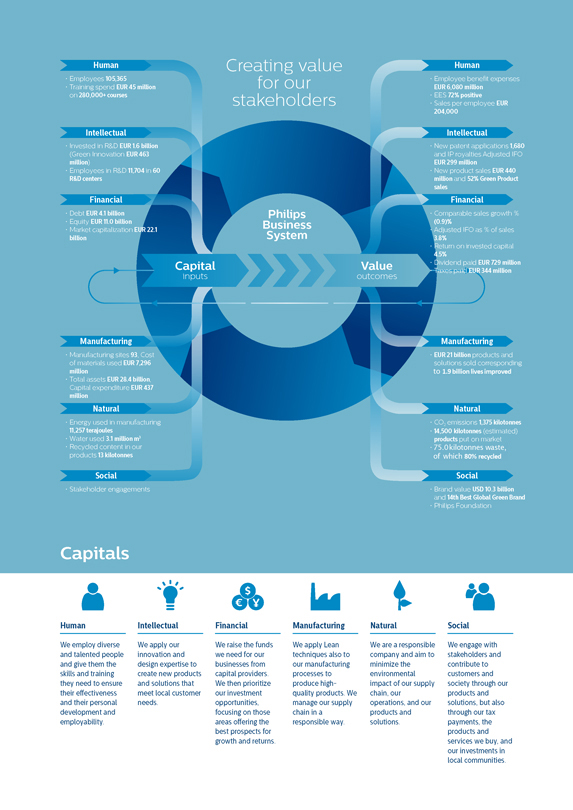
Table of Contents
Our strategic focus 4.2
4.3 Accelerate! journey continues
Path to Value
In 2011 we embarked upon our multi-year Accelerate! journey of change and performance improvement. This program is made up of five streams intended to:
| • |
make us more customer-focused |
| • |
resource our business/market combinations to win |
| • |
create lean end-to-end customer value chains |
| • |
implement a simpler, standardized operating model |
| • |
drive a growth and performance culture |
Designed to transform Philips into a truly agile and entrepreneurial company, Accelerate! is all about delivering meaningful innovation to our customers in local markets – and doing so in a fast and efficient way.
We are now in the fourth year of this transformation process, and our Path to Value is clearly mapped out:

To achieve our value creation goal, we have set ourselves targets to be realized by the end of 2016. These indicate the value we create, as measured by sales growth, profitability and our use of capital.
Group financial targets for 2016
| • |
Comparable sales growth 4-6% |
| • |
Reported Adjusted IFO margin 11-12% |
| • |
Return on invested capital >14% |
As of year-end 2014 we are tracking 1 percentage point behind on the path to achieving each of these targets. We are convinced that this does not change our longer-term performance potential, considering the attractiveness of the Lighting Solutions and HealthTech markets and our competitive position. Later in 2015, as we progress with the separation of the Lighting business from the Philips Group and the re-allocation of IG&S, we will update the market about the integral performance targets for each of the two operating companies.
24 Annual Report 2014
Table of Contents
Our strategic focus 4.4

| Markets | Sales |
Number of
employees |
Employees
female |
Employees male | R&D centers |
Manufacturing
sites |
Tangible and
intangible assets |
|||||||||||||||||||||
|
Asia & Pacific |
6,226 | 40,049 | 36 | % | 64 | % | 10 | 21 | 1,796 | |||||||||||||||||||
|
EMEA |
7,261 | 34,417 | 32 | % | 68 | % | 28 | 34 | 2,916 | |||||||||||||||||||
|
Latin America |
1,226 | 7,910 | 46 | % | 54 | % | 2 | 6 | 110 | |||||||||||||||||||
|
North America |
6,678 | 22,989 | 35 | % | 65 | % | 20 | 32 | 7,799 | |||||||||||||||||||
Annual Report 2014 25
Table of Contents
Our strategic focus 4.6

Family-centered care for newborns
In a child’s first precious weeks of life, every parent knows their family is the center of the universe. And when that child is sick, medics need every tool to ensure that family gets the best care.
“Family-centered care is our philosophy, we want to combine technology with humanization and place the mother and newborn at the center of this,” says Professor Fabio Mosca, Director of the Intensive Neonatal Unit at Italy’s Mangiagalli Hospital.
Instead of his intensive care unit being a place defined by life and death, it has, thanks to Philips, become a unit remarkably attuned to the specific rhythms of mother and baby. The entire unit’s environment has been adapted specifically for two main reasons. First, to boost the baby’s immune system and, second, to improve a mother’s chance of breast-feeding successfully.
This is a great example of the kind of partnership Philips has perfected – improving people’s lives through using innovative technologies, skills and know-how throughout the continuum of care. By sharing the philosophy of the Family Center Care, the collaboration ensures the well-being of all the people involved – the child, the family and the healthcare staff.

26 Annual Report 2014
Table of Contents
Our strategic focus 4.6

Getting to the heart of health
Recent research suggests that the ongoing health of our teeth and gums has a connection with the health of our heart.
Which is why some innovative thinking from Philips specifically focused on how to improve dental care has had such a profound effect on the way we manage our lifestyles, no matter how old we are or where we live. Everyone knows that brushing teeth regularly is essential for good oral hygiene, but sometimes to truly improve people’s lives, we need a helping hand from technology. As Michael Noack, Professor of Dental Care & Periodontology at the University of Cologne states, the applied technology of the revolutionary Philips Sonicare electric toothbrush protects gums and removes plaque far better than regular toothbrushes. The difference between the two is obvious, he says.
A consumer medical breakthrough that was first developed in the 1980s and which has been continuously perfected since, the Sonicare electric toothbrush is designed to empower people to take control of their personal dental care. It’s the very embodiment of the sort of meaningful, impactful innovations that Philips has become synonymous with.

“My personal experience is that patients who use Philips Sonicare have an easier time removing biofilm plaque.” Michael Noack, Professor of Dental Care & Periodontology, University of Cologne
Annual Report 2014 27
Table of Contents
Our strategic focus 4.6

Illumination and beyond
Connected lighting systems combine intelligent illumination with data and connectivity to deliver the best possible lighting experience and extraordinary value beyond illumination.
In a connected lighting system, every light point is networked together and digitally controlled, creating a more intelligent, flexible, efficient, and dynamic lighting system.
When merged with the IT network in a building or city and connected to lighting management software, a connected lighting system allows the managers of spaces to simplify and streamline the commissioning, monitoring, and management of lighting in a city or facility, exercise greater control over the ambience and atmosphere of illuminated spaces, and improve energy efficiency.
By outfitting light points with motion, occupancy, and other kinds of sensors, a connected lighting system can provide deeper insight into the usage and activities of indoor and outdoor spaces.
With real-time and historical occupancy data, managers can specifically target the distribution of lighting and other resources, such as heating, cooling, and cleaning, to achieve unprecedented levels of energy efficiency and sustainability.
In indoor spaces, light points can also be outfitted with wireless communications. Because lighting is installed virtually everywhere that people go, the lighting system becomes a pervasive platform for information and services.
Businesses can create mobile apps to deliver in-context information and a range of location-based services to the users of indoor spaces, including indoor wayfinding, in-context information, personalization, and targeted discounts.
Connected lighting can also integrate with third-party technologies, creating flexible, scalable systems that can be configured to respond to the specific requirements of professional and public environments.
28 Annual Report 2014
Table of Contents
Our strategic focus 4.6

Small in size, big in recycled plastics
With high recycled plastic content and other sustainability credentials, the new SENSEO ® Up coffee machine is part of a major initiative to incorporate recycled plastics into product design.
In designing SENSEO ® Up – our first one-cup coffee machine aimed at single or double households – we challenged our designers to specify recycled plastics right from the start of the design process.
The designers had to contend with two challenges. The first was a question of aesthetics. Recycled plastics are only available in dark colors, but not a real deep black. We overcame this problem by using a different architecture built around an internal frame that is not visible to the end-user.
The second challenge was to use recycled plastics in the baseplate. First, we textured the part to give the recycled plastic a high-quality look and feel. Then we used one matt black color for the complete range instead of many color variations. And thirdly, we made the baseplate less visible by focusing attention on the colored housing above it. This approach allowed us to make the baseplate from 90% ABS plastic from post-consumer electronic waste.

By designing-in the use of recycled plastics from the outset, we succeeded in launching the new SENSEO ® Up with 13% recycled plastics content. SENSEO ® Up offers other environmental benefits too. Its compact size means that it needs less packaging and causes fewer emissions in transport. And it goes to off mode immediately after the coffee is brewed, saving 10% energy compared to other SENSEO ® machines shutting off automatically.
Annual Report 2014 29
Table of Contents
Our strategic focus 4.6

Slim LED bulb, slimmer utility bills
Breaking with traditional design, the Philips SlimStyle LED bulb shows that a value-priced offering can deliver the innovation, energy efficiency and light quality that consumers want.
“The main drive to start the SlimStyle project was to maintain our leadership position in LED lighting worldwide,” says Agnieszka Kudyba, Integral Project Leader at Philips Lighting. “We’re in the midst of the LED revolution. Now we need to make sure we get mass adoption. The challenge was to get a replacement for the 60 W bulb, lasting for 25,000 hours, below 10 dollars. And we had to get it on the shelf within six months in order to strengthen our position as a leader in LED lighting. And we did it!”
The main architectural challenges in this project were to achieve the lowest cost possible and to fulfill US ENERGY STAR requirements. “From past experience we learned that we needed to reduce the number of components of the lamp,” explains Gon Weijers, Architect, Philips Lighting. “So we moved from more than 10 parts to only five parts in this lamp, which makes disassembly and recycling of the lamp much easier. And also, its compactness and low weight reduces shipping costs and CO2 emissions. The combination of all these insights led us to the design of this lamp, which is flat, functional and innovative.”
Having defined the required design, there were still significant technical hurdles to be overcome. As Peter Bukkems, Senior Mechanical Engineer, Philips Lighting explains: “For me as mechanical engineer the biggest challenge was to combine the thermal and optical disciplines into one product. We solved the thermal performance by removing the expensive aluminum heat sink and making direct contact from the LED board towards the covers. We integrated the optics into the clean plastic materials. We made the assembly complete by using ultrasonic welding – we didn’t use any screws or glue in the design, but simply melted the two covers together.”
Innovative design, affordable price, lasting energy savings, and no compromise on light quality – it’s a winning combination.
30 Annual Report 2014
Table of Contents
Group performance 5

“Overall, 2014 was a setback in our performance trajectory. We have taken clear action to drive stronger operational performance across our business, and expect sales growth and Adjusted IFO margin improvements in 2015 and beyond.” Ron Wirahadiraksa, CFO Royal Philips
Prior-period financial information has been restated for the treatment of the combined businesses of Lumileds and Automotive as discontinued operations (see note 3, Discontinued operations and other assets classified as held for sale) and for two voluntary accounting policy changes (see note 1, Significant accounting policies).
Management summary
The year 2014
| • |
In 2014, we continued to improve operational performance in most businesses, yet saw significant headwinds - ranging from geo-political crises and exchange rate fluctuations, to legal matters and the voluntary suspension of production at the Cleveland facility. In 2014, the voluntary suspension of production at our Cleveland facility and the jury verdict in the Masimo litigation strongly impacted our 2014 performance. |
At our Healthcare facility in Cleveland, Ohio, certain issues in the general area of manufacturing process controls were identified during an ongoing US Food and Drug Administration (FDA) inspection. To address these issues, on January 10, 2014 we started a voluntary, temporary suspension of new production at the facility, primarily to strengthen manufacturing process controls. The suspension negatively impacted Healthcare’s sales and Adjusted IFO in 2014.
On October 3, 2014 Philips announced that it would appeal the jury verdict in the patent infringement lawsuit by Masimo Corporation (Masimo), in which Masimo was awarded compensation of USD 467 million (EUR 366 million). The jury verdict is part of extensive litigation, which started in 2009, between Masimo and Philips involving several claims and counterclaims related to a large number of patents.
| • |
Net income for the year amounted to EUR 411 million, as lower operational earnings were partly offset by lower income tax expense and higher results from investments in associates and discontinued operations. |
| • |
Sales amounted to EUR 21,391 million, a 3% nominal decline for the year. Excluding unfavorable currency effects, comparable sales were 1% below the level of 2013, |
Annual Report 2014 31
Table of Contents
Group performance 5.1
|
due to Healthcare and Lighting. Healthcare comparable sales declined by 2%, mainly due to Imaging Systems. Lighting comparable sales were 3% below the level of 2013, as declines at Light Sources & Electronics and Consumer Luminaires were tempered by growth at Professional Lighting Solutions. Comparable sales at Consumer Lifestyle were 6% above the level of 2013, mainly driven by double-digit growth at Health& Wellness. |
| • |
Comparable sales in growth geographies were in line with 2013, while mature geographies declined by 1% as a result of the overall macroeconomic developments. In 2014, growth geographies accounted for 35% of total sales. |
| • |
IFO amounted to EUR 486 million, or 2.3% of sales, compared to EUR 1,855 million, or 8.4% of sales, in 2013. IFO declines at Healthcare, Lighting and IG&S were partly offset by an improvement at Consumer Lifestyle. |
| • |
Operating activities generated cash flows of EUR 1,303 million, which was EUR 391 million higher than in 2013. The increase was mainly due to higher cash inflows and working capital reductions in 2014, as well as the payment of the European Commission fine in 2013. Cash flows before financing activities were EUR 269 million higher than in 2013, as an increase in cash flows from operating activities was partly offset by higher outflows related to acquisitions of new businesses. |
| • |
By the end of 2014, Philips had completed 41% of the EUR 1.5 billion share buy-back program. |
Philips Group
Key data in millions of EUR unless otherwise stated
2012 - 2014
|
|
|
|||||||||||
| 2012 | 2013 | 2014 | ||||||||||
|
|
|
|||||||||||
|
Condensed statement of income |
||||||||||||
|
Sales |
22,234 | 21,990 | 21,391 | |||||||||
|
Adjusted IFO 1) |
1,003 | 2,276 | 821 | |||||||||
|
as a % of sales |
4.5 | % | 10.4 | % | 3.8 | % | ||||||
|
IFO |
592 | 1,855 | 486 | |||||||||
|
as a % of sales |
2.7 | % | 8.4 | % | 2.3 | % | ||||||
|
Financial income and expenses |
(329 | ) | (330 | ) | (301 | ) | ||||||
|
Income tax expense |
(218 | ) | (466 | ) | (26 | ) | ||||||
|
Results of investments in associates |
(211 | ) | (25 | ) | 62 | |||||||
|
|
|
|||||||||||
|
Income (loss) from continuing operations |
(166 | ) | 1,034 | 221 | ||||||||
|
Income from discontinued operations - net of income tax |
136 | 138 | 190 | |||||||||
|
|
|
|||||||||||
|
Net income (loss) |
(30 | ) | 1,172 | 411 | ||||||||
|
Other indicators |
||||||||||||
|
Net income (loss) attributable to shareholders per common share in EUR: |
||||||||||||
|
basic |
(0.04 | ) | 1.28 | 0.45 | ||||||||
|
diluted |
(0.04 | ) | 1.27 | 0.45 | ||||||||
|
Net operating capital (NOC) 1) |
9,316 | 10,238 | 8,838 | |||||||||
|
Cash flows before financing activities 1) |
1,174 | 50 | 319 | |||||||||
|
Employees (FTEs) |
118,087 | 116,082 | 113,678 | |||||||||
|
of which discontinued operations |
10,631 | 10,445 | 8,313 | |||||||||
|
|
|
|||||||||||
| 1) | For a reconciliation to the most directly comparable GAAP measures, see chapter 15, Reconciliation of non-GAAP information, of this report |
The year 2013
| • |
In 2013 we continued to make good progress in a challenging economic environment, particularly in the United States and Western Europe. We recorded 3% comparable sales growth (1% nominal decline), with a strong contribution from growth geographies. The profitability improved substantially, with all sectors delivering solid earnings. Net income for the year amounted to EUR 1,172 million, mainly driven by strong operational performance, including significant gross margin improvement and productivity gains coming from the Accelerate! program. |
| • |
Sales amounted to EUR 22 billion, a 1% nominal decline for the year. Excluding unfavorable currency effects, comparable sales were 3% above 2012, driven by all three operating sectors. Healthcare sales grew 1%, mainly driven by Customer Services. Lighting sales were 1% above 2012, growth at Light Sources and Electronics was tempered by a sales decline at Consumer Luminaires. Sales at Consumer Lifestyle were 10% above 2012, with double-digit growth at Domestic Appliances and high-single-digit growth at Personal Care and Health & Wellness. |
| • |
Our growth geographies achieved 9% comparable growth, while mature geographies declined by 1%, as a result of the overall macroeconomic developments, such as the continued economic uncertainty in North America. In 2013, growth geographies accounted for 35% of total sales, compared to 33% in 2012. |
| • |
IFO amounted to EUR 1,855 million, or 8.4% of sales, compared to EUR 592 million, or 2.7% of sales, in 2012. IFO improvement was seen at all sectors, but was mainly driven by Lighting and Healthcare. |
| • |
In 2013 we generated EUR 912 million of cash flow from operating activities, which was EUR 974 million lower than in 2012. The decrease is mainly a result of the payment of the European Commission fine in Q1 2013, increased working capital requirements and the payout of restructuring provisions in 2013. Our cash flows before financing activities were EUR 1,124 million lower than in 2012, due to a decrease in cash flows from operating activities and proceeds from divestments, partly offset by lower outflows related to acquisitions of new businesses. |
| • |
In 2013 we completed the execution of our EUR 2 billion share buy-back program, thereby improving the efficiency of our balance sheet. |
5.1.1 Sales
The year 2014
The composition of sales growth in percentage terms in 2014, compared to 2013, is presented in the table below.
32 Annual Report 2014
Table of Contents
Group performance 5.1.1
Philips Group
Sales growth composition in %
2014 versus 2013
|
|
|
|||||||||||||||
|
comparable
growth |
currency effects |
consolidation
changes |
nominal
growth |
|||||||||||||
|
|
|
|||||||||||||||
|
Healthcare |
(2.0 | ) | (1.6 | ) | (0.5 | ) | (4.1 | ) | ||||||||
|
Consumer Lifestyle |
5.8 | (3.1 | ) | 0.0 | 2.7 | |||||||||||
|
Lighting |
(2.6 | ) | (2.3 | ) | 1.0 | (3.9 | ) | |||||||||
|
Innovation, Group & Services |
(11.8 | ) | (0.1 | ) | 2.9 | (9.0 | ) | |||||||||
|
|
|
|||||||||||||||
|
Philips Group |
(0.9 | ) | (2.0 | ) | 0.2 | (2.7 | ) | |||||||||
|
|
|
|||||||||||||||
Group sales amounted to EUR 21,391 million in 2014, which represents a 3% nominal decline compared to 2013.
Adjusted for a 2% negative currency effect, comparable sales were 1% below the level of 2013. Comparable sales were up 6% at Consumer Lifestyle. Healthcare and Lighting saw comparable sales decline by 2% and 3% respectively.
Healthcare sales amounted to EUR 9,186 million, which was EUR 389 million lower than in 2013. Mid-single-digit growth at Customer Services and low-single-digit growth at Patient Care & Monitoring Solutions were offset by a double-digit decline at Imaging Systems.
Healthcare Informatics, Solutions & Services sales were in line with 2013. Mature geographies recorded a low-single-digit decline, mainly due to North America and Western Europe. Growth geographies also recorded a low-single-digit decline, with solid growth in Latin America and Middle East & Turkey offset by a double-digit decline in China.
Consumer Lifestyle reported sales of EUR 4,731 million, which was EUR 126 million higher than in 2013, or 6% higher on a comparable basis. Health & Wellness achieved double-digit growth and Domestic Appliances high-single-digit growth, while Personal Care recorded low-single-digit growth. Growth geographies achieved high-single-digit growth, driven by strong growth in China, India and Middle East & Turkey. Mature geographies recorded low-single-digit growth, with mid-single-digit growth in Western Europe and other mature geographies and low-single-digit growth in North America.
Lighting sales amounted to EUR 6,869 million, which was EUR 276 million lower than in 2013, or 3% lower on a comparable basis. A high-single-digit decline at Consumer Luminaires and mid-single-digit decline at Light Sources & Electronics were tempered by low-single-digit growth at Professional Lighting Solutions. A low-single-digit decline was seen in mature geographies, largely due to Western Europe and North America. Growth geographies recorded a mid-single-digit decline, mainly driven by China.
IG&S reported sales of EUR 605 million, which was EUR 60 million lower than in 2013, mainly due to lower royalty income.
The year 2013
The composition of sales growth in percentage terms in 2013, compared to 2012, is presented in the table below.
Philips Group
Sales growth composition in %
2013 versus 2012
|
|
|
|||||||||||||||
|
comparable
growth |
currency
effects |
consolidation
changes |
nominal
growth |
|||||||||||||
|
|
|
|||||||||||||||
|
Healthcare |
0.8 | (4.6 | ) | (0.3 | ) | (4.1 | ) | |||||||||
|
Consumer Lifestyle |
10.0 | (3.4 | ) | 0.0 | 6.6 | |||||||||||
|
Lighting |
1.3 | (3.5 | ) | 0.0 | (2.2 | ) | ||||||||||
|
Innovation, Group & Services |
(0.3 | ) | (0.4 | ) | 6.4 | 5.7 | ||||||||||
|
|
|
|||||||||||||||
|
Philips Group |
2.7 | (3.9 | ) | 0.1 | (1.1 | ) | ||||||||||
|
|
|
|||||||||||||||
Group sales amounted to EUR 21,990 million in 2013, which represents a 1% nominal decline compared to 2012.
Adjusting for a 4% negative currency effect comparable sales were 3% above 2012. Comparable sales were up 10% at Consumer Lifestyle, while Lighting and Healthcare were 1% higher than the previous year.
Healthcare sales amounted to EUR 9,575 million, which was EUR 408 million lower than in 2012, but 1% higher on a comparable basis. Higher comparable sales were driven by mid-single-digit growth at Customer Services and low-single-digit growth at Patient Care & Clinical Solutions. HealthCare Informatics Solutions, and Services were in line with last year, while Imaging Systems posted a mid-single-digit decline. Increases in growth geographies were tempered by a decline in North America and Western Europe.
Consumer Lifestyle reported sales of EUR 4,605 million, which was EUR 286 million higher than in 2012, or 10% higher on a comparable basis. We achieved double-digit growth at Domestic Appliances and high-single-digit growth at Health & Wellness and Personal Care.
Lighting sales amounted to EUR 7,145 million, which was EUR 158 million lower than in 2012, but 1% higher on a comparable basis. Low-single-digit growth at Light Sources & Electronics was tempered by a low-single-digit decline at Consumer Luminaires. while Professional Lighting Solutions was flat year-on-year.
IG&S reported sales of EUR 665 million, which was EUR 36 million higher than in 2012, due to higher royalty income.
Annual Report 2014 33
Table of Contents
Group performance 5.1.2
5.1.2 Earnings
The year 2014
In 2014, Philips’ gross margin was EUR 8,206 million, or 38.4% of sales, compared to EUR 9,337 million, or 42.5% of sales, in 2013. Gross margin in 2014 included EUR 249 million of restructuring and acquisition-related charges, whereas 2013 included EUR 48 million of restructuring and acquisition-related charges. 2014 also included charges of EUR 366 million related to the jury verdict in the Masimo litigation, EUR 68 million of impairment and other charges, and EUR 49 million of mainly inventory write-downs related to the voluntary suspension of production at the Cleveland facility. Excluding these items, the year-on-year decline was mainly driven by operational decline at Healthcare and Lighting as well as negative currency impacts.
Selling expenses increased from EUR 5,057 million in 2013 to EUR 5,124 million in 2014. 2014 included EUR 128 million of restructuring and acquisition-related charges, compared to EUR 45 million of restructuring charges in 2013. The year-on-year increase was mainly attributable to higher restructuring activities. Selling expenses increased from 23.0% of sales to 24.0%.
General and administrative expenses amounted to EUR 747 million in 2014, compared to EUR 825 million in 2013. As a percentage of sales, costs decreased from 3.8% in 2013 to 3.5% in 2014. 2014 included EUR 23 million of restructuring and acquisition related-charges, compared to EUR 5 million in 2013. 2014 also included a EUR 67 million past-service pension gain in the Netherlands, while 2013 included a pension settlement loss of EUR 31 million.
Research and development costs decreased from EUR 1,659 million in 2013 to EUR 1,635 million in 2014. Research and development costs in 2014 included EUR 34 million of restructuring and acquisition-related charges, compared to EUR 2 million in 2013. The year-on-year decrease was mainly due to lower spend at IG&S, partly offset by higher restructuring costs in all sectors. As a percentage of sales, research and development costs increased from 7.5% in 2013 to 7.6% in 2014.
The overview below shows sales, IFO and Adjusted IFO according to the 2014 sector classifications.
Philips Group
Sales, IFO and Adjusted IFO
in millions of EUR unless otherwise stated
2013 - 2014
|
|
|
|||||||||||||||||||
| Sales | IFO | % |
Adjusted IFO 1) |
% | ||||||||||||||||
|
|
|
|||||||||||||||||||
|
2014 |
||||||||||||||||||||
|
Healthcare |
9,186 | 456 | 5.0 | % | 616 | 6.7 | % | |||||||||||||
|
Consumer Lifestyle |
4,731 | 520 | 11.0 | % | 573 | 12.1 | % | |||||||||||||
|
Lighting |
6,869 | 185 | 2.7 | % | 293 | 4.3 | % | |||||||||||||
|
Innovation, Group & Services |
605 | (675 | ) | — | (661 | ) | — | |||||||||||||
|
|
|
|||||||||||||||||||
|
Philips Group |
21,391 | 486 | 2.3 | % | 821 | 3.8 | % | |||||||||||||
|
|
|
|||||||||||||||||||
|
2013 |
||||||||||||||||||||
|
Healthcare |
9,575 | 1,315 | 13.7 | % | 1,512 | 15.8 | % | |||||||||||||
|
Consumer Lifestyle |
4,605 | 429 | 9.3 | % | 483 | 10.5 | % | |||||||||||||
|
Lighting |
7,145 | 413 | 5.8 | % | 580 | 8.1 | % | |||||||||||||
|
Innovation, Group & Services |
665 | (302 | ) | — | (299 | ) | — | |||||||||||||
|
|
|
|||||||||||||||||||
|
Philips Group |
21,990 | 1,855 | 8.4 | % | 2,276 | 10.4 | % | |||||||||||||
|
|
|
|||||||||||||||||||
| 1) | For a reconciliation to the most directly comparable GAAP measures, see chapter 15, Reconciliation of non-GAAP information, of this report |
In 2014, IFO decreased by EUR 1,369 million year-on-year to EUR 486 million, or 2.3% of sales. 2014 included EUR 434 million of restructuring and acquisition-related charges, compared to EUR 100 million in 2013. 2014 included EUR 366 million related to the jury verdict in the Masimo litigation, EUR 49 million mainly related to inventory write-downs in the Cleveland facility, charges of EUR 244 million related to legal matters, EUR 68 million of impairment and other charges related to industrial assets at Lighting, and a EUR 67 million past-service pension cost gain in the Netherlands. 2013 IFO was also impacted by a net gain of EUR 47 million from a past-service pension cost gain and related settlement loss in the US, as well as a EUR 21 million gain on the sale of a business in Healthcare.
Amortization and impairment of intangibles, excluding software and capitalized product development costs, amounted to EUR 332 million in 2014, compared to EUR 393 million in 2013. In 2014, goodwill impairment charges amount to EUR 3 million consisting of impairments on divested businesses in Healthcare and Lighting. In 2013, goodwill impairment charges amounted to EUR 28 million, including EUR 26 million as a result of reduced growth expectations in Consumer Luminaires, see note 11, Goodwill.
Adjusted IFO declined from EUR 2,276 million, or 10.4% of sales, in 2013 to EUR 821 million, or 3.8% of sales, in 2014. Adjusted IFO showed a year-on-year decrease at all sectors except Consumer Lifestyle.
Healthcare
Adjusted IFO decreased from EUR 1,512 million, or 15.8% of sales, in 2013 to EUR 616 million, or 6.7% of sales, in 2014. Restructuring and acquisition-related charges in 2013 were close to zero, compared to EUR 70 million in 2014. 2014 included EUR 366 million related to the jury
34 Annual Report 2014
Table of Contents
Group performance 5.1.2
verdict in the Masimo litigation, EUR 49 million mainly related to inventory write-downs in the Cleveland facility, and a EUR 16 million past-service pension cost gain in the Netherlands. 2013 included a past-service pension cost gain of EUR 61 million and a gain on the sale of a business of EUR 21 million. The decline in Adjusted IFO was largely due to operational losses related to the voluntary suspension of production at the Cleveland facility and negative currency impacts.
Consumer Lifestyle
Adjusted IFO improved from EUR 483 million, or 10.5% of sales, in 2013 to EUR 573 million, or 12.1% of sales, in 2014. 2014 included restructuring and acquisition- related charges of EUR 9 million and a EUR 11 million past-service pension cost gain in the Netherlands. 2013 included restructuring and acquisition-related charges of EUR 14 million and a past-service pension cost gain of EUR 1 million in the US. The increase was largely driven by higher sales and operational improvements.
Lighting
Adjusted IFO declined from EUR 580 million, or 8.1% of sales, in 2013 to EUR 293 million, or 4.3% of sales, in 2014. Restructuring and acquisition-related charges amounted to EUR 245 million in 2014, compared to EUR 83 million in 2013. 2014 Adjusted IFO included EUR 68 million of impairment and other charges related to industrial assets and a EUR 13 million past-service pension cost gain in the Netherlands, while 2013 Adjusted IFO included a past-service pension cost gain of EUR 10 million in the US. The decrease in Adjusted IFO was largely driven by higher restructuring charges and lower sales volume.
Innovation, Group & Services
Adjusted IFO declined from a loss of EUR 299 million in 2013 to a loss of EUR 661 million in 2014. 2014 Adjusted IFO included restructuring and acquisition-related charges of EUR 110 million, provisions of EUR 244 million related to legal matters and a EUR 27 million gain from a past-service pension cost gain in the Netherlands. 2013 included restructuring and acquisition-related charges of EUR 3 million and a pension settlement loss of EUR 25 million. Excluding these items, the year-on-year Adjusted IFO decline was mainly driven by higher investments in emerging business areas and lower IP income.
The year 2013
In 2013, Philips’ gross margin was EUR 9,337 million, or 42.5% of sales, compared to EUR 8,729 million, or 39.3% of sales, in 2012. Gross margin in 2013 included EUR 48 million of restructuring and acquisition-related charges, whereas 2012 included EUR 282 million of restructuring and acquisition-related charges. Higher gross margin percentages were seen in all sectors.
Selling expenses decreased from EUR 5,239 million in 2012 to EUR 5,057 million in 2013. 2013 included EUR 45 million of restructuring and acquisition-related charges, compared to EUR 184 million of restructuring charges in 2012. The year-on-year decrease was mainly attributable to lower restructuring activities and overhead reductions in our commercial organizations. In relation to sales, selling expenses decreased from 23.5% to 23.0%. Selling expenses as a percentage of sales were lower in all sectors.
General and administrative expenses amounted to EUR 825 million in 2013, compared to EUR 848 million in 2012. As a percentage of sales, costs decreased from 3.8% in 2012 to 3.7%. 2013 included EUR 5 million of restructuring and acquisition related-charges, compared to EUR 31 million in 2012. The 2012 figure included a EUR 25 million past-service pension cost gain from a change in a medical retiree plan, while 2013 included a pension settlement loss of EUR 31 million.
Research and development costs decreased from EUR 1,723 million in 2012 to EUR 1,659 million in 2013.
Research and development costs in 2013 included EUR 2 million of restructuring and acquisition-related charges, compared to EUR 57 million in 2012. The year- on-year decrease was largely attributable to lower restructuring charges and currency effects. As a percentage of sales, research and development costs decreased from 7.7% in 2012 to 7.5% in 2013.
The overview below shows sales, IFO and Adjusted IFO according to the 2014 sector classifications.
Philips Group
Sales, IFO and Adjusted IFO in millions of EUR
2012
|
|
|
|||||||||||||||||||
| Sales | IFO | % |
Adjusted
IFO 1) |
% | ||||||||||||||||
|
|
|
|||||||||||||||||||
|
Healthcare |
9,983 | 1,026 | 10.3 | % | 1,226 | 12.3 | % | |||||||||||||
|
Consumer Lifestyle |
4,319 | 400 | 9.3 | % | 456 | 10.6 | % | |||||||||||||
|
Lighting |
7,303 | (78 | ) | (1.1 | )% | 69 | 0.9 | % | ||||||||||||
|
IG&S |
629 | (756 | ) | — | (748 | ) | — | |||||||||||||
|
|
|
|||||||||||||||||||
|
Philips Group |
22,234 | 592 | 2.7 | % | 1,003 | 4.5 | % | |||||||||||||
|
|
|
|||||||||||||||||||
| 1) | For reconciliation to the most directly comparable GAAP measures, see chapter 15, Reconciliation of non-GAAP information, of this report. |
In 2013, IFO increased by EUR 1,263 million year-on-year to EUR 1,855 million, or 8.4% of sales. 2013 included EUR 100 million of restructuring and acquisition-related charges, compared to EUR 554 million in 2012. 2013 IFO was also impacted by a net gain of EUR 47 million from a past-service pension cost gain and related settlement loss in the US, as well as a EUR 21 million gain on the sale of a business in Healthcare.
2012 IFO included a EUR 313 million impact of the European Commission fine related to the alleged violation of competition rules in the Cathode-Ray Tube (CRT) industry, EUR 132 million of provisions related to various legal matters, a net gain on EUR 197 million on the sale of assets, mainly for the Senseo and High Tech Campus transactions, and a EUR 81 million loss on the sale of industrial assets at Lighting. In addition, 2012 IFO also included a past-service cost gain of EUR 25 million related to a retiree medical plan.
Annual Report 2014 35
Table of Contents
Group performance 5.1.3
Amortization and impairment of intangibles, excluding software and capitalized product development costs, amounted to EUR 393 million in 2013, compared to EUR 410 million in 2012. Additionally, goodwill impairment charges of EUR 28 million were taken in the fourth quarter of 2013 mainly as a result of reduced growth expectations at Consumer Luminaires.
Adjusted IFO improved from EUR 1,106 million, or 4.7% of sales, in 2012 to EUR 2,276 million, or 10.5% of sales, in 2013. Adjusted IFO showed a year-on-year increase at all Sectors.
Healthcare
Adjusted IFO increased from EUR 1,226 million, or 12.3% of sales, in 2012 to EUR 1,512 million, or 15.8% of sales, in 2013. Adjusted IFO improvements were realized across all businesses, due to higher sales and reduced expenses resulting from cost-saving programs.
Restructuring and acquisition-related charges in 2013 were close to zero, compared to EUR 134 million in 2012. 2013 included a past-service pension cost gain of EUR 61 million and a gain on the sale of a business of EUR 21 million.
Consumer Lifestyle
Adjusted IFO improved from EUR 456 million, or 10.6% of sales, in 2012 to EUR 483 million, or 10.5% of sales, in 2013. Restructuring and acquisition-related charges amounted to EUR 14 million in 2013, compared to EUR 56 million in 2012. 2012 Adjusted IFO included a EUR 160 million gain on the Senseo transaction, while 2013 Adjusted IFO included a past-service pension cost gain of EUR 1 million.
Lighting
Adjusted IFO improved from EUR 69 million, or 0.9% of sales, in 2012 to EUR 580 million, or 8.1% of sales, in 2013. Restructuring and acquisition-related charges amounted to EUR 83 million in 2013, compared to EUR 308 million in 2012. 2012 Adjusted IFO included EUR 81 million of losses related to the sale of industrial assets, while 2013 Adjusted IFO included a past-service pension cost gain of EUR 10 million. Excluding these impacts, the increase in Adjusted IFO was mainly attributable to higher operational performance.
Innovation, Group & Services
Adjusted IFO improved from a loss of EUR 748 million in 2012 to a loss of EUR 299 million in 2013. Restructuring and acquisition-related charges amounted to EUR 3 million in 2013, compared to EUR 56 million in 2012. 2013 Adjusted IFO included a net EUR 25 million loss from a past-service pension cost gain and related settlement loss. 2012 Adjusted IFO included a EUR 313 million impact of the European Commission fine, EUR 132 million of provisions related to various legal matters, a EUR 37 million gain on the sale of the High Tech Campus, and a EUR 25 million past-service cost gain related to a medical retiree plan.
For further information regarding the performance of the sectors, see chapter 6, Sector performance, of this report.
5.1.3 Advertising and promotion
The year 2014
Philips’ total advertising and promotion expenses were EUR 913 million in 2014, an increase of 5% compared to 2013. The increase was mainly due to investments in mature markets, such as the Netherlands, Germany and United States. The advertising and promotion spend in key growth geographies decreased by 5% compared to 2013, largely due to lower spend in China. The total advertising and promotion investment as a percentage of sales was 4.3% in 2014, compared to 4.0% in 2013.
Philips increased its brand value by 5% to over USD 10.3 billion in the 2014 ranking of the world’s 100 most valuable brands, as measured by Interbrand. In the 2014 listing, Philips is now ranked the 42nd most valuable brand in the world.
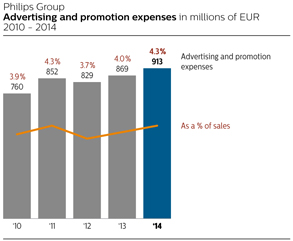
The year 2013
Philips’ total advertising and promotion expenses were EUR 869 million in 2013, an increase of 5% compared to 2012. The increase was mainly due to the launch of our new brand positioning as well as higher investments in growth geographies, such as China. Accordingly, the advertising and promotion spend in key growth geographies increased by 5% compared to 2012. The total advertising and promotion investment as a percentage of sales was 4.0% in 2013, compared to 3.7% in 2012.
Philips increased its brand value by 8% in 2013 to over USD 9.8 billion in the ranking of the world’s 100 most valuable brands, as measured by Interbrand. In the 2013 listing, Philips moved up one position to the 40th most valuable brand in the world.
36 Annual Report 2014
Table of Contents
Group performance 5.1.4
5.1.4 Research and development
The year 2014
Research and development costs decreased from EUR 1,659 million in 2013 to EUR 1,635 million in 2014. 2014 included EUR 34 million of restructuring and acquisition-related charges, compared to EUR 2 million in 2013. The year-on-year decrease was driven by IG&S, partly offset by increases at Healthcare and Lighting. As a percentage of sales, research and development costs increased from 7.5% in 2013 to 7.6%.
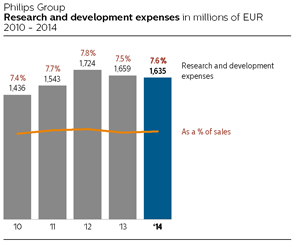
Philips Group
Research and development expenses in millions of EUR
2012 - 2014
|
|
|
|||||||||||
| 2012 | 2013 | 2014 | ||||||||||
|
|
|
|||||||||||
|
Healthcare |
858 | 810 | 822 | |||||||||
|
Consumer Lifestyle |
256 | 268 | 263 | |||||||||
|
Lighting |
341 | 313 | 330 | |||||||||
|
Innovation, Group & Services |
269 | 268 | 220 | |||||||||
|
|
|
|||||||||||
|
Philips Group |
1,724 | 1,659 | 1,635 | |||||||||
|
|
|
|||||||||||
The year 2013
Research and development costs decreased from EUR 1,724 million in 2012 to EUR 1,659 million in 2013. 2013 included EUR 20 million of restructuring and acquisition-related charges, compared to EUR 58 million in 2012. As a percentage of sales, research and development costs decreased from 7.8% in 2012 to 7.5%. The year-on-year decrease was largely attributable to currency effects and lower restructuring charges.
5.1.5 Pensions
The year 2014
In 2014, the total costs of post-employment benefits amounted to EUR 241 million for defined-benefit plans and EUR 144 million for defined-contribution plans, compared to EUR 291 million and EUR 134 million respectively in 2013.
The above costs are reported in Operating expenses except for the net interest cost component which is reported in Financial income and expense. The net interest cost for defined-benefit plans was EUR 59 million in 2014 (2013: EUR 71 million).
2014 included past-service cost gains in the Netherlands of EUR 67 million, which were mainly related to the mandatory plan change in the Netherlands, where a salary cap of EUR 100,000 must be applied to the pension salary with effect from January 1, 2015. This change lowers the Company’s Defined Benefit Obligation which is recognized as a past-service cost gain. Compensatory measures are given in wages for employees impacted.
2013 included past-service cost gains of EUR 81 million, which included EUR 78 million related to the announced freeze of accrual after December 31, 2015 for salaried workers in the Company’s US defined-benefit pension plan. In the same US plan a settlement loss of EUR 31 million was recognized in 2013 following a lump-sum offering to terminated vested employees. This offering resulted in settling the pension obligations towards these employees. The past-service cost gain is allocated to the respective sectors of the US employees involved, whereas the settlement loss is allocated fully to Pensions in IG&S as it related to inactive employees.
The overall funded status of our defined-benefit pension plans in 2014 decreased compared to 2013 due to a decrease in discount rates used to measure the defined benefit obligation. The deficits recognized on our balance sheet increased by approximately EUR 393 million due to lower discount rates in the US and Germany and a new adopted mortality table in the US.
In 2014, further progress was made in managing the financial exposure to defined-benefit plans by two further buy-ins in the UK plan.
For further information, refer to Post-employment benefits.
The year 2013
In 2013, the total costs of post-employment benefits amounted to EUR 291 million for defined-benefit plans and EUR 134 million for defined-contribution plans, compared to EUR 285 million and EUR 134 million respectively in 2012.
The above costs are reported in operating expenses except for the included net interest cost component which is reported in financial income and expense. The net interest cost for defined-benefit plans was EUR 71 million in 2013 (2012: EUR 85 million).
2013 included past-service cost gains of EUR 81 million, which included EUR 78 million related to the announced freeze of accrual after December 31, 2015 for salaried workers in the Company’s US defined-benefit pension plan. In the same US plan a settlement
Annual Report 2014 37
Table of Contents
Group performance 5.1.6
loss of EUR 31 million was recognized in 2013 following a lump-sum offering to terminated vested employees. This offering resulted in settling the pension obligations towards these employees. The past-service cost gain is allocated to the respective sectors of the US employees involved whereas the settlement loss is allocated fully to Pensions in IG&S as it related to inactive employees.
In 2012, past-service cost gains of EUR 31 million were recognized of which EUR 25 million in the Dutch pension plan due to a restructuring. In one of the Company’s defined-benefit retiree medical plans, a past-service cost gain of EUR 25 million was recognized due to a benefit change.
The overall funded status of our defined-benefit pension plans in 2013 was comparable to that of 2012. The deficits recognized on our balance sheet decreased by approximately EUR 400 million due to a higher discount rate in the US, cash contributions and the US events described above. The surpluses of the plans in the Netherlands and UK decreased, but as Philips does not recognize a surplus in these countries, the net balance sheet position was not impacted.
In 2013, major progress was made in managing the financial exposure to defined-benefit plans, such as the changes in the funding of the Dutch pension plan, the changes in the US plan as described above, and a buy-in in the UK plan.
For further information, refer to note 20, Post-employment benefits.
5.1.6 Restructuring and impairment charges
The year 2014
In 2014, IFO included net charges totaling EUR 414 million for restructuring. In addition to the annual goodwill-impairment tests for Philips, trigger-based impairment tests were performed during the year, resulting in a goodwill impairment of EUR 1 million at Healthcare and EUR 2 million at Lighting.
2013 included EUR 84 million of restructuring charges and a goodwill impairment of EUR 26 million at Consumer Luminaires, mainly as a consequence of reduced growth rates resulting from a slower-than-anticipated recovery of certain markets, as well as delays in the introduction of new product ranges.
For further information on sensitivity analysis, please refer to note 11, Goodwill.
In 2014, the most significant restructuring projects related to Lighting and IG&S and were driven by industrial footprint rationalization and the Accelerate! transformation program. Restructuring projects at Lighting centered on Light Sources & Electronics and Professional Lighting Solutions, the largest of which took place in the Belgium, Netherlands and France. Innovation, Group & Services restructuring projects mainly were related to IT and group and country overheads and centered primarily on the Netherlands, US and Belgium. Restructuring projects at Healthcare mainly took place in the US and the Netherlands. Consumer Lifestyle restructuring projects were mainly in the Netherlands.
In 2013, the more significant restructuring projects were related to industrial footprint rationalization at Lighting. The largest projects were centered at Consumer Luminaires and Light Sources & Electronics, mainly in the Unites States, France and Belgium. Innovation Group & Services restructuring projects were largely focused on the Financial Operations Service Units, primarily in Italy, France and the United States.
Restructuring projects at Consumer Lifestyle were mainly seen at Personal Care in the Netherlands and Austria and Coffee in Italy.
For further information on restructuring, refer to note 19, Provisions.
Philips Group
Restructuring and related charges in millions of EUR
2012 - 2014
|
|
|
|||||||||||
| 2012 | 2013 | 2014 | ||||||||||
|
|
|
|||||||||||
|
Restructuring and related charges per sector: |
||||||||||||
|
Healthcare |
116 | (6 | ) | 68 | ||||||||
|
Consumer Lifestyle |
38 | 10 | 8 | |||||||||
|
Lighting |
294 | 77 | 225 | |||||||||
|
Innovation, Group & Services |
56 | 3 | 113 | |||||||||
|
|
|
|||||||||||
|
Continuing operations |
504 | 84 | 414 | |||||||||
|
Discontinued operations |
36 | 33 | 18 | |||||||||
|
Cost breakdown of restructuring and related charges: |
||||||||||||
|
Personnel lay-off costs |
414 | 95 | 354 | |||||||||
|
Release of provision |
(33 | ) | (62 | ) | (36 | ) | ||||||
|
Restructuring-related asset impairment |
66 | 25 | 57 | |||||||||
|
Other restructuring-related costs |
57 | 26 | 39 | |||||||||
|
|
|
|||||||||||
|
Continuing operations |
504 | 84 | 414 | |||||||||
|
Discontinued operations |
36 | 33 | 18 | |||||||||
|
|
|
|||||||||||
The year 2013
In 2013, IFO included net charges totaling EUR 84 million for restructuring. In addition to the annual goodwill-impairment tests for Philips, trigger-based impairment tests were performed during the year, resulting in a goodwill impairment of EUR 26 million at Consumer Luminaires, mainly as a consequence of reduced growth rates resulting from a slower-than-anticipated recovery of certain markets, as well as delays in the introduction of new product ranges.
2012 included EUR 504 million of restructuring charges.
For further information on sensitivity analysis, please refer to Goodwill.
In 2013, the most significant restructuring projects related to Lighting and were driven by the industrial footprint rationalization. Restructuring projects at
38 Annual Report 2014
Table of Contents
Group performance 5.1.7
Lighting centered on Luminaires businesses and Light Sources & Electronics, the largest of which took place in the United States, France and Belgium. Innovation, Group & Services restructuring projects mainly focused on the Financial Operations Service Unit, primarily in Italy, France and the United States. Consumer Lifestyle restructuring charges mainly related to Personal Care (primarily in the Netherlands and Austria) and Coffee (mainly Italy).
In 2012, the most significant restructuring projects related to Lighting and Healthcare and were driven by Accelerate! transformation program. Restructuring projects at Lighting centered on Luminaires businesses and Light Sources & Electronics, the largest of which took place in the Netherlands, Germany and various locations in the United States. In Healthcare, the largest projects were undertaken at Imaging Systems and Patient Care & Monitoring Solutions, in various locations in the United States, to reduce operating costs and simplify the organization. Innovation, Group & Services restructuring projects focused on the IT and Financial Operations Service Units (primarily in the Netherlands), Group & Regional Overheads (mainly in the Netherlands and Italy) and Philips Innovation Services (in the Netherlands and Belgium). Consumer Lifestyle restructuring charges mainly related to Coffee (mainly Italy) and Health & Wellness (in the United States).
For further information on restructuring, refer to note 19, Provisions.
5.1.7 Financial income and expenses
The year 2014
A breakdown of Financial income and expenses is presented in the table below.
Philips Group
Financial income and expenses in millions of EUR
2012 - 2014
|
|
|
|||||||||||
| 2012 | 2013 | 2014 | ||||||||||
|
|
|
|||||||||||
|
Interest expense (net) |
(326 | ) | (269 | ) | (251 | ) | ||||||
|
Sale of securities |
1 | — | 60 | |||||||||
|
Impairments |
(8 | ) | (10 | ) | (17 | ) | ||||||
|
Other |
4 | (51 | ) | (93 | ) | |||||||
|
|
|
|||||||||||
|
Financial income and expenses |
(329 | ) | (330 | ) | (301 | ) | ||||||
|
|
|
|||||||||||
Net interest expense in 2014 was EUR 18 million lower than in 2013, mainly as a result of lower average outstanding debt and interest related to pensions in 2014.
The gain from the sale of stakes in 2014 amounted to EUR 60 million, mainly from Neusoft, Chimei Innolux, Gilde III and Sapiens.
Other financial expense amounted to EUR 93 million in 2014, primarily consisting of interest expense related to the jury verdict in the Masimo litigation, and accretion expense associated with other discounted provisions and uncertain tax positions.
For further information, refer to note 7, Financial income and expenses.
The year 2013
The net interest expense in 2013 was EUR 57 million lower than in 2012, mainly as a result of lower average outstanding debt and interest related to pensions in 2013.
Other financial income was a EUR 51 million loss in 2013, primarily consisting of a EUR 25 million accretion expense (mainly associated with discounted provisions) and EUR 24 million of other financing charges.
Other financial income was a EUR 4 million gain in 2012, primarily consisting of a EUR 46 million gain related to a change in estimate on the valuation of long-term derivative contracts and remaining other financial income of EUR 20 million. This was offset by a EUR 22 million accretion expense (mainly associated with discounted provisions) and EUR 41 million other financing charges.
For further information, refer to note 7, Financial income and expenses.
5.1.8 Income taxes
The year 2014
Income taxes amounted to EUR 26 million, compared to EUR 466 million in 2013. The effective income tax rate was 14.1%. The decrease in 2014 was mainly due to lower income before tax and application of favorable tax regulations relating to R&D investments. The comparable effective income tax rate for 2013 was 30.6%.
For 2015, the effective tax rate is expected to be in the range of 28% and 30%. However, the actual rate will depend on the geographical mix of actual profits.
For further information, refer to note 8, Income taxes.
The year 2013
Income taxes amounted to EUR 466 million, compared to EUR 218 million in 2012. The effective income tax rate was 30.6%, compared to 82.9% in 2012. Excluding the non-tax-deductible European Commission fine and charges related to various legal matters in 2012, the effective tax rate in 2012 was 32.2%. The 1.6 percentage points decrease in 2013 was mainly related to lower new loss carryforwards not expected to be realized.
Annual Report 2014 39
Table of Contents
Group performance 5.1.9
5.1.9 Results of investments in associates
The year 2014
Philips Group
Results of investments in associates in millions of EUR
2012 - 2014
|
|
|
|||||||||||
| 2012 | 2013 | 2014 | ||||||||||
|
|
|
|||||||||||
|
Company’s participation in income |
(5 | ) | 5 | 30 | ||||||||
|
Investment impairment and other charges |
(206 | ) | (30 | ) | — | |||||||
|
Dilution gain |
— | — | 32 | |||||||||
|
|
|
|||||||||||
|
Results of Investments in associates |
(211 | ) | (25 | ) | 62 | |||||||
|
|
|
|||||||||||
The results related to investments in associates improved from a loss of EUR 25 million in 2013 to a gain of EUR 62 million in 2014. 2014 included a EUR 32 million dilution gain related to Philips’ stake in Corindus Vascular Robotics, while 2013 included a provision for the net impact of expected payments related to the agreed transfer of the remaining 30% stake in the TP Vision joint venture.
The Company’s participation in income increased from EUR 5 million in 2013 to a gain of EUR 30 million in 2014. The gain in 2013 was mainly attributable to the results of Philips Medical Capital.
For further information, refer to note 5, Interests in entities.
The year 2013
The results related to investments in associates improved from a loss of EUR 211 million in 2012 to a loss of EUR 25 million in 2013, largely attributable to a charge of EUR 196 million related to the former LG.Philips Displays joint venture in 2012.
The European Commission imposed fines in relation to alleged violations of competition rules in the Cathode-Ray Tube industry. Philips recorded a total charge of EUR 509 million, of which EUR 313 million was directly related to Philips and therefore recorded in Income from operations, while EUR 196 million related to LG.Philips Displays and was therefore recorded in Results of investments in associates.
The Company’s participation in income increased from a loss of EUR 5 million in 2012 to a gain of EUR 5 million in 2013. The gain in 2013 was mainly attributable to the results of Philips Medical Capital, while the loss in 2012 was mainly due to the results of EMGO.
For further information, refer to note 5, Interests in entities.
5.1.10 Non-controlling interests
The year 2014
Net income attributable to non-controlling interests amounted to a loss of EUR 4 million in 2014, compared to a gain of EUR 3 million in 2013.
The year 2013
Net income attributable to non-controlling interests amounted to EUR 3 million in 2013, compared to EUR 5 million in 2012.
5.1.11 Discontinued operations
The year 2014
Discontinued operations consist primarily of the combined businesses of Lumileds and Automotive, the Audio, Video, Multimedia and Accessories (AVM&A) business, and the Television business. The results related to these businesses are reported under Discontinued operations in the Consolidated statements of income and Consolidated statements of cash flows.
On June 30, 2014, Philips announced the start of the process to combine the Lumileds and Automotive Lighting businesses into a stand-alone company and explore strategic options to attract capital from third-party investors for this combined business. Philips is actively discussing the sale of the business with potential buyers and expects a transaction to be completed in the first half of 2015.
The AVM&A business, also known as WooX Innovations, was divested to Gibson Brands Inc. in June 2014.
The Television business was divested as part of a strategic partnership agreement with TPV Technology Ltd (TPV) that was signed on April 1, 2012. Philips retained a 30% interest in TP Vision Holdings BV (TP Vision venture) and on May 29, 2014 transferred the remaining 30% stake in TP Vision to TPV. After completion, TPV fully owns TP Vision, which will enable further integration with TPV’s TV business.
Income from discontinued operations increased by EUR 52 million to EUR 190 million in 2014. The year-on-year increase was mainly due to a net gain related to the divestment of our Television business. Income from discontinued operations mainly consisted of net income of EUR 141 million related to the combined businesses of Lumileds and Automotive, EUR 18 million related to AVM&A, and EUR 31 million mainly related to other dicontinued operations mainly net income on the Television business, partly offset by the European Commission’s Smartcard fine.
For further information, refer to note 3, Discontinued operations and other assets classified as held for sale.
The year 2013
Discontinued operations consist primarily of the combined businesses of Lumileds and Automotive, the Audio, Video, Multimedia and Accessories (AVM&A) business, and the Television business. The results related to these businesses are reported under Discontinued operations in the Consolidated statements of income and Consolidated statements of cash flows.
40 Annual Report 2014
Table of Contents
Group performance 5.1.12
The AVM&A business is also known as WooX Innovations.
The Television business was divested as part of a strategic partnership agreement with TPV Technology Ltd (TPV) that was signed on April 1, 2012. Philips retained a 30% interest in TP Vision Holdings BV (TP Vision venture).
Income from discontinued operations increased by EUR 2 million to EUR 138 million in 2013, improved operational results at the combined businesses of Lumileds and Automotive were partly offset by lower results at the AVM&A and Television business. Income from discontinued operations mainly consisted of net income of EUR 133 million related to the combined businesses of Lumileds and Automotive, EUR 6 million related to AVM&A, and a net loss of EUR 1 million related to the Television business.
For further information, refer to note 3, Discontinued operations and other assets classified as held for sale.
5.1.12 Net income
The year 2014
Net income decreased from EUR 1,172 million in 2013 to EUR 411 million in 2014. The decrease was largely due to lower IFO of EUR 1,369 million, partly offset by lower income tax charges of EUR 440 million and higher results from investment in associates of EUR 87 million.
Basic earnings per common share from net income attributable to shareholders decreased from EUR 1.28 per common share in 2013 to EUR 0.45 per common share in 2014.
The year 2013
Net income increased from a net loss of EUR 30 million in 2012 to a net profit of EUR 1,172 million in 2013. The increase was largely due higher IFO of EUR 1,263 million and better results of investments in associates, partly offset by higher income tax charges of EUR 248 million.
Basic earnings per common share from net income attributable to shareholders increased from negative EUR 0.04 per common share in 2012 to EUR 1.28 per common share in 2013.
5.1.13 Acquisitions and divestments
Acquisitions
In 2014, Philips acquired Unisensor, a Danish healthcare company, and a 51% interest in General Lighting Company (GLC) based in The Kingdom of Saudi Arabia (KSA). Philips also purchased some minor magnetic resonance imaging (MRI) activities from Hologic, a US healthcare company. Acquisitions in 2014 and previous years led to post-merger integration charges of EUR 1 million in Healthcare, EUR 1 million in Consumer Lifestyle and EUR 19 million in Lighting.
In 2013, there were four minor acquisitions. Acquisitions in 2013 and previous years led to post-merger integration charges totaling EUR 16 million in 2013: Healthcare EUR 6 million, Consumer Lifestyle EUR 4 million, and Lighting EUR 6 million.
In 2012, Philips completed the acquisition of Indal within Lighting. Acquisitions in 2012 and previous years led to post-merger integration charges totaling EUR 50 million in 2012: Healthcare EUR 18 million, Consumer Lifestyle EUR 18 million, and Lighting EUR 14 million.
Divestments
In 2014, Philips completed the divestment of its Lifestyle Entertainment activities to Gibson Brands Inc. Philips also completed two other divestments of business activities which related to Healthcare and Lighting activities.
In 2013, Philips completed several divestments of business activities, mainly related to certain Healthcare activities.
In 2012, Philips completed several divestments of business activities, namely the Television business, certain Lighting manufacturing activities, Speech Processing activities and certain Healthcare service activities.
Also in 2012, Philips agreed to extend its partnership with Sara Lee Corp (Sara Lee) to drive growth in the global coffee market. Under a new exclusive partnership framework, which will run through to 2020, Philips will be the exclusive SENSEO ® consumer appliance manufacturer and distributor for the duration of the agreement. As part of the agreement, Philips divested its 50% ownership right in the SENSEO ® trademark to Sara Lee.
For details, please refer to note 4, Acquisitions and divestments.
5.1.14 Performance by geographic cluster
The year 2014
In 2014, sales declined 1% on a comparable basis (-3% nominally largely attributable due to unfavorable foreign exchange impacts) mainly due to Healthcare and Lighting.
Sales in mature geographies were EUR 318 million lower than in 2013, or 1% lower on a comparable basis. Sales in Western Europe were 1% lower than in 2013, with declines at Healthcare and Lighting partly offset by growth at Consumer Lifestyle. Sales in North America declined by EUR 205 million, or 2% on a comparable basis. Comparable sales in other mature geographies showed a 1% decline, with growth at Healthcare and Consumer Lifestyle offset by a decline at Lighting and IG&S.
In growth geographies, sales declined by EUR 281 million mainly due to unfavorable foreign exchange impacts and were flat on a comparable basis, with high-single-digit growth at Consumer Lifestyle offset by a decline at
Annual Report 2014 41
Table of Contents
Group performance 5.1.15
Healthcare and Lighting. Strong growth was achieved in India and Middle East & Turkey, while decline was seen in China and Russia & Central Asia.
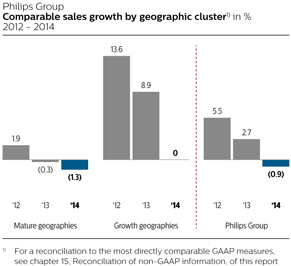

The year 2013
In 2013, sales grew 3% on a comparable basis (-1% nominally), driven by growth at Consumer Lifestyle, notably in growth geographies.
Sales in mature geographies were EUR 525 million lower than in 2012, but flat on a comparable basis. Sales in Western Europe were impacted by macroeconomic developments and were flat on a comparable basis.
Growth at Lighting and Consumer Lifestyle was offset by a decline at Healthcare. Sales in North America declined by EUR 457 million or 3% lower on a comparable basis, mainly due to declines at Healthcare and Lighting. Both nominal and comparable sales in other mature geographies showed strong growth.
Comparable sales in other mature geographies showed double-digit growth, mainly driven by strong performance at Consumer Lifestyle and Healthcare.
In growth geographies, sales grew by EUR 281 million, or 9% on a comparable basis, driven by double-digit growth at Consumer Lifestyle and Lighting. In China and Latin America, we achieved solid double-digit nominal and comparable growth.
5.1.15 Cash flows provided by continuing operations
The year 2014
Cash flows from operating activities
Net cash flows from operating activities amounted to EUR 1,303 million in 2014, which was EUR 391 million higher than in 2013, mainly due to higher inflows from working capital reductions.
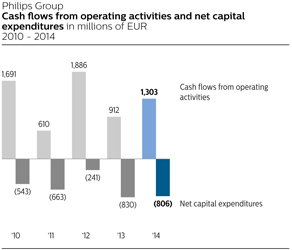
42 Annual Report 2014
Table of Contents
Group performance 5.1.15
Condensed consolidated statements of cash flows for the years ended December 31, 2012, 2013 and 2014 are presented below:
Philips Group
Condensed consolidated cash flow statements 1)
in millions of EUR
2012 - 2014
|
|
|
|||||||||||
| 2012 | 2013 | 2014 | ||||||||||
|
|
|
|||||||||||
|
Net income (loss) |
(30 | ) | 1,172 | 411 | ||||||||
|
Adjustments to reconcile net income to net cash provided by operating activities |
1,916 | (260 | ) | 892 | ||||||||
|
|
|
|||||||||||
|
Net cash provided by operating activities |
1,886 | 912 | 1,303 | |||||||||
|
Net cash used for investing activities |
(712 | ) | (862 | ) | (984 | ) | ||||||
|
|
|
|||||||||||
|
Cash flows before financing activities 2) |
1,174 | 50 | 319 | |||||||||
|
Net cash used for financing activities |
(293 | ) | (1,241 | ) | (1,189 | ) | ||||||
|
|
|
|||||||||||
|
Cash (used for) provided by continuing operations |
881 | (1,191 | ) | (870 | ) | |||||||
|
Net cash (used for) provided by discontinued operations |
(143 | ) | (115 | ) | 193 | |||||||
|
Effect of changes in exchange rates on cash and cash equivalents |
(51 | ) | (63 | ) | 85 | |||||||
|
|
|
|||||||||||
|
Total change in cash and cash equivalents |
687 | (1,369 | ) | (592 | ) | |||||||
|
Cash and cash equivalents at the beginning of year |
3,147 | 3,834 | 2,465 | |||||||||
|
|
|
|||||||||||
|
Cash and cash equivalents at the end of year |
3,834 | 2,465 | 1,873 | |||||||||
|
|
|
|||||||||||
| 1) |
Please refer to section 12.7, Consolidated statements of cash flows, of this report |
| 2) |
Please refer to chapter 15, Reconciliation of non-GAAP information, of this report |
Cash flows from investing activities
In 2014, cash flows from investing activities resulted in a net outflow of EUR 984 million. This was attributable to EUR 806 million cash used for net capital expenditures, EUR 258 million used for acquisitions of businesses and non-current financial assets, and EUR 7 million used for derivatives and current financial assets, partly offset by EUR 87 million of net proceeds from non-current financial assets and divestments.
In 2013, cash flows from investing activities resulted in a net outflow of EUR 862 million. This was attributable to EUR 830 million cash used for net capital expenditures, EUR 101 million cash used for derivatives and current financial assets, as well as EUR 24 million used for acquisitions of businesses and non-current financial assets, partly offset by EUR 93 million of net proceeds mainly from divestment.
Net capital expenditures
Net capital expenditures amounted to a cash outflow of EUR 806 million, compared to an outflow of EUR 830 million in 2013. The year-on-year decrease was mainly due to lower investments at Healthcare and Lighting.
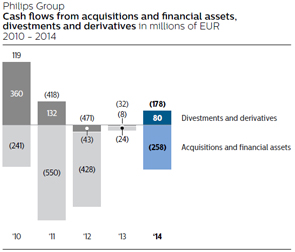
Acquisitions and financial assets
The net cash impact of acquisitions of businesses and financial assets in 2014 was a total of EUR 258 million. There was a EUR 177 million outflow for acquisitions of businesses, mainly related to the acquisition of a 51% interest in the General Lighting Company (GLC) in The Kingdom of Saudi Arabia (KSA), and a EUR 81 million outflow for financial assets, mainly in the form of a EUR 60 million loan to TPV Technology Limited.
The net cash impact of acquisitions of businesses and financial assets in 2013, was a total of EUR 24 million. There was a EUR 11 million outflow for acquisitions of businesses and a EUR 13 million outflow for financial assets.
Divestments and derivatives
Cash proceeds of EUR 87 million were received mainly from divestment of the Shakespeare business and the sale of shares in Neusoft. Cash flows from derivatives and current financial assets led to a net cash outflow of EUR 7 million.
In 2013, cash proceeds of EUR 93 million were received from divestments, mainly of non-strategic businesses within Healthcare. Cash flows from derivatives and current financial assets led to a net cash outflow of EUR 101 million.
Cash flows from financing activities
Net cash used for financing activities in 2014 was EUR 1,189 million. Philips’ shareholders were given EUR 729 million in the form of a dividend, of which the cash portion of the dividend amounted to EUR 292 million. The net impact of changes in debt was a decrease of EUR 301 million. Additionally, net cash outflows for share buy-back and share delivery totaled EUR 596 million.
Net cash used for financing activities in 2013 was EUR 1,241 million. Philips’ shareholders were given EUR 678 million in the form of a dividend, of which the cash portion of the dividend amounted to EUR 272 million. The net impact of changes in debt was a decrease of
Annual Report 2014 43
Table of Contents
Group performance 5.1.16
EUR 407 million, including the redemption of a USD 143 million bond. Additionally, net cash outflows for share buy-back and share delivery totaled EUR 562 million.
The year 2013
Cash flows from operating activities
Net cash flow from operating activities amounted to EUR 912 million in 2013, which is EUR 974 million lower than in 2012. The decrease is mainly a result of the payment of the European Commission fine, increased working capital usage and the payout of restructuring charges in 2013.
Cash flows from investing activities
In 2013, cash flow from investing activities resulted in a net outflow of EUR 862 million. This was attributable to EUR 830 million cash used for net capital expenditures, EUR 101 million cash used for derivatives and current financial assets, as well as EUR 24 million used for acquisitions of businesses and non-current financial assets, partly offset by EUR 93 million of net proceeds from divestment.
In 2012, cash flows from investing activities resulted in a net outflow of EUR 712 million. This was mainly attributable to EUR 241 million cash used for net capital expenditures, EUR 261 million used for acquisitions, as well as a EUR 167 million outflow for financial assets, mainly due to loans provided to TPV and the TP Vision venture in connection with the divestment of the Television business (EUR 151 million in aggregate).
Net capital expenditures
Net capital expenditures totaled EUR 830 million, which was EUR 589 million higher than in 2012, mainly reflecting the impact of proceeds received in 2012 from the sale of the High Tech Campus of EUR 425 million and the 2012 divestment of Philips’ 50% ownership right in the Senseo trademark to Sara Lee for EUR 170 million.
Acquisitions and financial assets
The net cash impact of acquisitions of businesses and financial assets in 2013 was a total of EUR 24 million. There was a EUR 11 million outflow for acquisitions of businesses and a EUR 13 million outflow for financial assets.
The net cash impact of acquisitions of businesses and financial assets in 2012 was a total of EUR 428 million, mainly related to the acquisition of Indal. The EUR 167 million outflow for financial assets mainly related to loans provided to TPV and the TP Vision venture in connection with the divestment of the Television business (EUR 151 million in aggregate).
Divestments and derivatives
Cash proceeds of EUR 93 million were received from divestments, mainly of non-strategic businesses within Healthcare. Cash flows from derivatives and current financial assets led to a net cash outflow of EUR 101 million.
In 2012, cash proceeds of EUR 3 million were received from divestments. Cash flows from derivatives and securities led to a net cash outflow of EUR 46 million.
Cash flows from financing activities
Net cash used for financing activities in 2013 was EUR 1,241 million. Philips’ shareholders were given EUR 678 million in the form of a dividend, of which the cash portion of the dividend amounted to EUR 272 million. The net impact of changes in debt was a decrease of EUR 407 million, including the redemption of a USD 143 million bond. Additionally, net cash outflows for share buy-back and share delivery totaled EUR 562 million.
Net cash used for financing activities in 2012 was EUR 293 million. Philips’ shareholders were given EUR 687 million in the form of a dividend, of which the cash portion of the dividend amounted to EUR 255 million. The net impact of changes in debt was an increase of EUR 731 million, including the issuance of USD 1.5 billion in bonds, partially offset by the early redemption of a USD 500 million bond. Additionally, net cash outflows for share buy-back and share delivery totaled EUR 768 million.
5.1.16 Cash flows from discontinued operations
The year 2014
In 2014, cash from discontinued operations amounted to an inflow of EUR 193 million. The combined Automotive and Lumileds businesses had a cash inflow of EUR 240 million attributable to operating activities. The Television business used net cash of EUR 8 million, attributable to operating activities. The Audio, Video, Multimedia and Accessories business used net cash of EUR 19 million, with cash outflows from operating activities of EUR 107 million, partly offset by EUR 88 million of cash inflows from investing activities.
In 2013, EUR 115 million cash was used by discontinued operations. The combined Automotive and Lumileds businesses had a cash inflow of EUR 94 million attributable to operating activities. The Television business used net cash of EUR 138 million, attributable to cash outflows of EUR 91 million for operating activities and EUR 47 million for investing activities. The Audio, Video, Multimedia and Accessories business used net cash of EUR 72 million attributable to operating activities.
The year 2013
In 2013, EUR 115 million cash was used by discontinued operations. The Television business used net cash of EUR 138, attributable to cash outflows of EUR 91 million for operating activities and EUR 47 million for investing activities. The Audio, Video Multimedia and Accessories business used net cash of EUR 72 million attributable to operating activities. The Automotive and Lumileds business had cash inflow of EUR 94 million attributable to operating activities.
44 Annual Report 2014
Table of Contents
Group performance 5.1.17
In 2012, EUR 143 million cash was used by discontinued operations. The Television business used net cash of EUR 256 million, attributable to operating cash outflows of EUR 296 million partly offset by cash inflows from investing activities of EUR 40 million. The Audio, Video Multimedia and Accessories business generated a cash inflow of EUR 121 million attributable to operating activities. The Automotive and Lumileds business had cash ouflow of EUR 8 million attributable to operating activities.
5.1.17 Financing
The year 2014
Condensed consolidated balance sheets for the years 2012, 2013 and 2014 are presented below:
Philips Group
2012 - 2014
|
|
|
|||||||||||
| 2012 | 2013 | 2014 | ||||||||||
|
|
|
|||||||||||
|
Intangible assets |
10,679 | 9,766 | 10,526 | |||||||||
|
Property, plant and equipment |
2,959 | 2,780 | 2,095 | |||||||||
|
Inventories |
3,495 | 3,240 | 3,314 | |||||||||
|
Receivables |
4,858 | 4,892 | 5,040 | |||||||||
|
Assets held for sale |
43 | 507 | 1,613 | |||||||||
|
Other assets |
3,213 | 2,909 | 3,891 | |||||||||
|
Payables |
(6,210 | ) | (5,435 | ) | (5,293 | ) | ||||||
|
Provisions |
(2,956 | ) | (2,554 | ) | (3,445 | ) | ||||||
|
Liabilities directly associated with assets held for sale |
(27 | ) | (348 | ) | (349 | ) | ||||||
|
Other liabilities |
(4,169 | ) | (3,094 | ) | (4,193 | ) | ||||||
|
|
|
|||||||||||
|
Net asset employed |
11,885 | 12,663 | 13,199 | |||||||||
|
Cash and cash equivalents |
3,834 | 2,465 | 1,873 | |||||||||
|
Debt |
(4,534 | ) | (3,901 | ) | (4,104 | ) | ||||||
|
|
|
|||||||||||
|
Net debt |
(700 | ) | (1,436 | ) | (2,231 | ) | ||||||
|
Non-controlling interests |
(34 | ) | (13 | ) | (101 | ) | ||||||
|
Shareholders’ equity |
(11,151 | ) | (11,214 | ) | (10,867 | ) | ||||||
|
|
|
|||||||||||
|
Financing |
(11,885 | ) | (12,663 | ) | (13,199 | ) | ||||||
|
|
|
|||||||||||
| 1) |
Please refer to section 12.6, Consolidated balance sheets, of this report |
The financing structure in 2015 will be broadly in line with 2014.
5.1.18 Cash and cash equivalents
The year 2014
In 2014, cash and cash equivalents decreased by EUR 592 million to EUR 1,873 million at year-end. The decrease was mainly attributable to an outflow on cash outflows for treasury share transactions of EUR 596 million, cash dividend payout of EUR 292 million, EUR 301 million from decreases in debt and a EUR 258 million outflow related to acquisitions. This was partly offset by a EUR 497 million free cash flow.
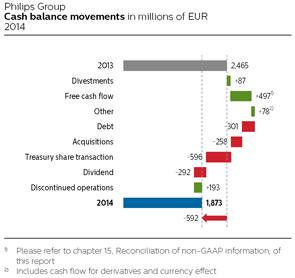
The year 2013
In 2013, cash and cash equivalents decreased by EUR 1,369 million to EUR 2,465 million at year-end. The decrease was mainly attributable to an outflow on net capital expenditures of EUR 830 million, cash outflows for treasury share transactions of EUR 562 million, cash dividend payout of EUR 272 million, EUR 407 million from decreases in debt and a EUR 115 million outflow related to discontinued operations. This was partly offset by a EUR 912 million inflow from operations.
In 2012, cash and cash equivalents increased by EUR 687 million to EUR 3,834 million at year-end. The increase was mainly attributable to cash inflows from operations amounting to EUR 1,886 million and EUR 730 million from increases in debt. This was partly offset by a EUR 768 million outflow for treasury share transactions, an outflow on net capital expenditures of EUR 241 million, a EUR 528 million outflow for acquisitions of businesses and financial assets, a EUR 255 million outflow for the cash dividend payout, and a EUR 144 million outflow related to discontinued operations.
5.1.19 Debt position
The year 2014
Total debt outstanding at the end of 2014 was EUR 4,104 million, compared with EUR 3,901 million at the end of 2013.
Philips Group
Changes in debt in millions of EUR
2012 - 2014
|
|
|
|||||||||||
| 2012 | 2013 | 2014 | ||||||||||
|
|
|
|||||||||||
|
New borrowings |
(1,361 | ) | (64 | ) | (69 | ) | ||||||
|
Repayments |
631 | 471 | 370 | |||||||||
|
Currency effects and consolidation changes |
56 | 226 | (504 | ) | ||||||||
|
|
|
|||||||||||
|
Changes in debt |
(674 | ) | 633 | (203 | ) | |||||||
|
|
|
|||||||||||
Annual Report 2014 45
Table of Contents
Group performance 5.1.20
In 2014, total debt increased by EUR 203 million. New borrowings of EUR 69 million consisted mainly of replacements to lease contracts. Repayment of EUR 370 million included a EUR 250 million repayment of a five year loan. Other changes resulting from consolidation and currency effects led to an increase of EUR 504 million.
In 2013, total debt decreased by EUR 633 million. New borrowings of EUR 64 million consisted mainly of replacements to lease contracts. Repayment of EUR 471 million included a USD 143 million redemption on USD bonds as well as payments on short-term debt. Other changes resulting from consolidation and currency effects led to a decrease of EUR 226 million.
Long-term debt as a proportion of the total debt stood at 90% at the end of 2014 with an average remaining term of 11.6 years, compared to 85% and 12.8 years at the end of 2013.
For further information, please refer to note 18, Debt.
The year 2013
Total debt outstanding at the end of 2013 was EUR 3,901 million, compared with EUR 4,534 million at the end of 2012.
In 2013, total debt decreased by EUR 633 million. New borrowings of EUR 64 million consisted mainly of replacements to lease contracts. Repayment of EUR 471 million included a USD 143 million redemption on USD bonds as well as payments on short-term debt. Other changes resulting from consolidation and currency effects led to a decrease of EUR 226 million.
In 2012, total debt increased by EUR 674 million. New borrowings of EUR 1,361 million included the issuance of USD 1.5 billion in bonds. Repayment of EUR 631 million included early redemption of a USD 500 million bond. Other changes resulting from consolidation and currency effects led to a decrease of EUR 56 million.
Long-term debt as a proportion of the total debt stood at 85% at the end of 2013 with an average remaining term of 12.8 years, compared to 82% and 12.7 years at the end of 2012.
For further information, please refer to note 18, Debt.
5.1.20 Shareholders’ equity
The year 2014
Shareholders’ equity decreased by EUR 347 million in 2014 to EUR 10,867 million at December 31, 2014. The decrease was mainly a result of EUR 714 million related to purchase shares for the share buy-back program and coverage for the LTI program, partially offset by EUR 415 million net income and EUR 50 million of other comprehensive income. The dividend payment to shareholders in 2014 reduced equity by EUR 293 million including tax and service charges, while the delivery of treasury shares increased equity by EUR 116 million and share-based compensation plans increased equity by EUR 88 million.
The number of outstanding common shares of Royal Philips at December 31, 2014 was 914 million (2013: 913 million). At the end of 2014, the Company held 17.1 million shares in treasury to cover the future delivery of shares (2013: 20.7 million shares). This was in connection with the 40.8 million rights outstanding at the end of 2014 (2013: 44.3 million rights) under the Company’s long-term incentive plans. At the end of 2014, the Company held 3.3 million shares for cancellation (2013: 3.9 million shares).
The year 2013
Shareholders’ equity increased by EUR 63 million in 2013 to EUR 11,214 million at December 31, 2013. The increase was mainly a result of EUR 1,169 million net income, partially offset by EUR 476 million of currency translation losses and EUR 669 million related to the purchase of treasury shares. The dividend payment to shareholders in 2013 reduced equity by EUR 272 million, while the delivery of treasury shares increased equity by EUR 118 million and share-based compensation plans increased equity by EUR 105 million.
Shareholders’ equity decreased by EUR 1,177 million in 2012 to EUR 11,151 million at December 31, 2012. The decrease was mainly as a result of EUR 816 million related to the purchase of treasury shares, EUR 100 million of currency translation losses and a EUR 35 million net loss. The dividend payment to shareholders in 2012 reduced equity by EUR 259 million. The decrease was partially offset by a EUR 50 million increase related to the delivery of treasury shares and share-based compensation plans increased equity by EUR 84 million.
The number of outstanding common shares of Royal Philips at December 31, 2013 was 913 million (2012: 915 million).
At the end of 2013, the Company held 20.7 million shares in treasury to cover the future delivery of shares (2012: 28.7 million shares). This was in connection with the 44.3 million rights outstanding at the end of 2013 (2012: 52.3 million rights) under the Company’s long-term incentive plans. At the end of 2013, the Company held 3.9 million shares for cancellation (2012: 13.8 million shares).
5.1.21 Net debt to group equity
The year 2014
Philips ended 2014 in a net debt position (total debt less cash and cash equivalents) of EUR 2,231 million, compared to a net debt position of EUR 1,436 million at the end of 2013.
46 Annual Report 2014
Table of Contents
Group performance 5.1.22

The year 2013
Philips ended 2013 in a net debt position (cash and cash equivalents, net of debt) of EUR 1,436 million, compared to a net debt position of EUR 700 million at the end of 2012.
5.1.22 Liquidity position
The year 2014
Including the Company’s cash position (cash and cash equivalents), as well as its EUR 1.8 billion committed revolving credit facility the Company had access to available liquidity of EUR 3.673 million vs. Gross Debt (including short and long term) of EUR 4.104 million as of December 31, 2014.
As of December 31, 2013 the Company had access to net available liquid resources of EUR 429 million including the Company’s net debt (cash) position (cash and cash equivalents, net of debt), listed available-for-sale financial assets, as well as its EUR 1.8 billion committed revolving credit facility.
Philips Group
Liquidity position in millions of EUR
2012 - 2014
|
|
|
|||||||||||
| 2012 | 2013 | 2014 | ||||||||||
|
|
|
|||||||||||
|
Cash and cash equivalents |
3,834 | 2,465 | 1,873 | |||||||||
|
Committed revolving credit facility/CP program/Bilateral loan |
1,800 | 1,800 | 1,800 | |||||||||
|
|
|
|||||||||||
|
Liquidity |
5,634 | 4,265 | 3,673 | |||||||||
|
Available-for-sale financial assets at fair value |
120 | 65 | 75 | |||||||||
|
Short-term debt |
(809 | ) | (592 | ) | (392 | ) | ||||||
|
Long-term debt |
(3,725 | ) | (3,309 | ) | (3,712 | ) | ||||||
|
|
|
|||||||||||
|
Net available liquidity resources |
1,220 | 429 | (356 | ) | ||||||||
|
|
|
|||||||||||
Philips has a EUR 1.8 billion committed revolving credit facility that can be used for general group purposes and as a backstop of its commercial paper program. In January 2013, the EUR 1.8 billion facility was extended by 2 years until February 2018. The commercial paper program amounts to USD 2.5 billion, under which Philips can issue commercial paper up to 364 days in tenor, both in the US and in Europe, in any major freely convertible currency. There is a panel of banks, in Europe and in the US, which service the program. The interest is at market rates prevailing at the time of issuance of the commercial paper. There is no collateral requirement in the commercial paper program. Also, there are no limitations on Philips’ use of funds from the program. As at December 31, 2014, Philips did not have any loans outstanding under these facilities.
Philips’ existing long-term debt is rated A3 (with stable outlook) by Moody’s and A- (with negative outlook) by Standard & Poor’s. As part of the capital allocation policy, it is Philips’ ambition to manage its financial ratios to be in line with an A3/A- rating. There is no assurance that Philips will be able to achieve this goal. Ratings are subject to change at any time. The Company’s outstanding long-term debt and credit facilities do not contain financial covenants or cross acceleration provisions that are based on adverse changes in ratings or on material adverse change.
As at December 31, 2014, Philips had total cash and cash equivalents of EUR 1,873 million. Philips pools cash from subsidiaries to the extent legally and economically feasible. Cash not pooled remains available for local operational or investment needs. Philips had a total gross debt position of EUR 4,104 million at year-end 2014.
Philips believes its current liquidity is sufficient to meet its present working capital requirements. Philips intends to finance the acquisition of Volcano through a combination of cash on hand and the issuance of short-term debt.
The year 2013
Including the Company’s net debt (cash) position (cash and cash equivalents, net of debt), listed available-for-sale financial assets, as well as its EUR 1.8 billion committed revolving credit facility, the Company had access to net available liquid resources of EUR 429 million as of December 31, 2013, compared to EUR 1,220 million one year earlier.
5.1.23 Cash obligations
Contractual cash obligations
Presented below is a summary of the Group’s contractual cash obligations and commitments at December 31, 2014.
Annual Report 2014 47
Table of Contents
Group performance 5.1.23
Philips Group
Contractual cash obligations 1) in millions of EUR
2014
|
|
|
|||||||||||||||||||
| Payments due by period | ||||||||||||||||||||
|
|
|
|||||||||||||||||||
| less | ||||||||||||||||||||
| than 1 | 1-3 | 3-5 | after 5 | |||||||||||||||||
| total | year | years | years | years | ||||||||||||||||
|
|
|
|||||||||||||||||||
|
Long-term debt 2) |
3,665 | 94 | 6 | 1,030 | 2,535 | |||||||||||||||
|
Finance lease obligations |
232 | 61 | 80 | 37 | 54 | |||||||||||||||
|
Short-term debt |
244 | 244 | — | — | — | |||||||||||||||
|
Operating leases |
986 | 236 | 293 | 159 | 298 | |||||||||||||||
|
Derivative liabilities |
860 | 353 | 166 | 253 | 88 | |||||||||||||||
|
Interest on debt 3) |
2,617 | 198 | 387 | 299 | 1,733 | |||||||||||||||
|
Purchase obligations 4) |
131 | 70 | 51 | 10 | — | |||||||||||||||
|
Trade and other payables |
2,499 | 2,499 | — | — | — | |||||||||||||||
|
|
|
|||||||||||||||||||
|
Contractual cash obligations |
11,234 | 3,755 | 983 | 1,788 | 4,708 | |||||||||||||||
|
|
|
|||||||||||||||||||
| 1) |
Obligations in this table are undiscounted |
| 2) |
Long-term debt includes short-term portion of long-term debt and excludes finance lease obligations |
| 3) |
Approximately 15% of the debt bears interest at a floating rate. The majority of the interest payments on variable interest rate loans in the table above reflect market forward interest rates at the period end and these amounts may change as the market interest rate changes |
| 4) |
Philips has commitments related to the ordinary course of business which in general relate to contracts and purchase order commitments for less than 12 months. In the table, only the commitments for multiple years are presented, including their short-term portion |
Philips has no material commitments for capital expenditures.
Additionally, Philips has a number of commercial agreements, such as supply agreements, which provide that certain penalties may be charged to the Company if it does not fulfill its commitments.
Certain Philips suppliers factor their trade receivables from Philips with third parties through supplier finance arrangements. At December 31, 2014 approximately EUR 357 million of the Philips accounts payables were known to have been sold onward under such arrangements whereby Philips confirms invoices. Philips continues to recognize these liabilities as trade payables and will settle the liabilities in line with the original payment terms of the related invoices.
Other cash commitments
The Company and its subsidiaries sponsor post-employment benefit plans in many countries in accordance with legal requirements, customs and the local situation in the countries involved. For a discussion of the plans and expected cash outflows, please refer to note 20, Post-employment benefits.
The Company had EUR 380 million restructuring-related provisions by the end of 2014, of which EUR 230 million is expected to result in cash outflows in 2015.
Refer to note 19, Provisions for details of restructuring provisions and potential cash flow impact for 2014 and further.
A proposal will be submitted to the upcoming Annual General Meeting of Shareholders to declare a distribution of EUR 0.80 per common share (up to EUR 735 million), in cash or shares at the option of the shareholder, against the net income and retained earnings for 2014. Further details will be given in the agenda for the Annual General Meeting of Shareholders, to be held on May 7, 2015.
Guarantees
Philips’ policy is to provide guarantees and other letters of support only in writing. Philips does not provide other forms of support. At the end of 2014, the total fair value of guarantees recognized on the balance sheet amounted to less than EUR 1 million (December 31, 2013: less than EUR 1 million). Remaining off-balance-sheet business and credit-related guarantees provided on behalf of third parties and associates decreased by EUR 13 million during 2014 to EUR 21 million. Off-balance-sheet guarantees for year end 2013 were restated from EUR 333 million to EUR 34 million to reflect guarantees related to associates and third-party only.
5.1.24 Supply management
The year 2014
Throughout 2014, market prices for energy and raw materials showed diverse trends. These commodities represent approximately 15% of our direct and indirect spend. Within the metals commodity group, copper prices declined in the course of the year, whereas others, e.g. aluminum, showed an upward trend. Also, in steel and resins, differences were seen between grades and regions. In general, annual average market prices were around 2013 levels. The global slowdown in the economy, and more specifically slow growth in China, did not yet lead to lower commodity market prices in the first quarters of 2014. From Q4, prices for raw materials, and especially oil, started to significantly decline as a consequence of the continuing macro-economic weakness, resulting in oversupplied markets.
Rare earth element prices continued to slide, and this contributed to higher savings levels in 2014. Contingency measures are in place to delay and mitigate the impact of a possible new hike in the price of rare earths in the future. The tight availability of xenon for halogen lamps has relaxed, and also the price level has started to come down. This is partly caused by lower demand for halogen lamps in end-markets. The availability and price of helium continues to be a concern, but measures have been taken to mitigate the impact.
48 Annual Report 2014
Table of Contents
Group performance 5.1.24
The rapid progress of the Procurement transformation has led to a continued improvement in overall Procurement results. This has had a major positive and structural impact on overall cost levels in all Philips businesses.
The year 2013
Throughout 2013 the average market prices for energy and raw materials, which represent approximately 15% of our direct and indirect spend, remained fairly stable compared to the average for 2012. The potential impact of improving economic conditions in mature economies in the second half of the year was offset by a simultaneous slow-down of demand in growth geographies, especially in China. Steel and other metals prices were stable at a historically low level, while oil and plastics stabilized at a higher level. Given the economic circumstances it was remarkable that packaging market prices increased in 2013.
Rare earth element prices continued to slide, and this contributed to higher savings levels in 2013. Contingency measures were put in place to delay and mitigate the impact of a possible new hike in the price of rare earths in the future. The major successes of eco-halogen lamps and similar products in the market have fueled demand for xenon, which is used as a filler gas in these lamps. Since global production did not increase, this led to tight supply and a price peak. Therefore a major effort was made resulting in replacement of xenon by an alternative gas for a large part of the portfolio by the end of 2013. The availability of helium remained a constant concern, though acute shortages did not occur. Technical measures were taken to almost completely prevent loss of helium in our operations.
Thanks to a rigid procurement focus on organizational set-up and performance drivers, the overall procurement performance improved substantially in 2013 in accordance with the plan to save an additional EUR 1 billion.
Our businesses provide innovative solutions that address major trends affecting the world – the demand for affordable healthcare, the need for greater energy efficiency, and the desire for personal well-being. Philips further strengthened its focus on sustainability in 2014 through a number of initiatives described in the Social and Environmental performance sections.
5.2.1 Improving people’s lives
At Philips, we strive to make the world healthier and more sustainable through innovation. Our goal is to improve the lives of 3 billion people a year by 2025. To guide our efforts and measure our progress, we take a two-dimensional approach – social and ecological – to improving people’s lives. Products and solutions from our portfolio that directly support the curative (care) or preventive (well-being) side of people’s health, determine the contribution to the social dimension. As healthy ecosystems are also needed for people to live a healthy life, the contribution to the ecological dimension is determined by means of our steadily growing Green Product portfolio, such as our energy-efficient lighting.
Through Philips products and solutions that directly support the curative or preventive side of people’s health, we improved the lives of 670 million people in 2014, driven by our Healthcare sector. Additionally, our well-being products that help people live a healthy life, and our Green Products that contribute to a healthy ecosystem, improved the lives of 290 million and 1.5 billion people respectively. After the elimination of double counts – people touched multiple times – we arrived at 1.9 billion lives. This is an increase of 200 million compared to 2013, mainly driven by Consumer Lifestyle in Greater China, Lighting in North America, Central & Eastern Europe, and Middle East & Turkey, and Healthcare in Greater China and the ASEAN countries. Our baseline of 1.7 billion people a year, established in 2012, has been adjusted to 1.6 billion to reflect the impact of the exclusion of the Automotive and Lumileds businesses. More information on this metric can be found in chapter 14, Sustainability statements, of this report.
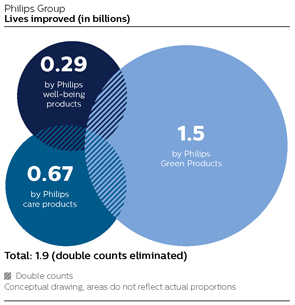
Annual Report 2014 49
Table of Contents
Group performance 5.2.2
5.2.2 Employee engagement
Employee engagement is key to our competitive performance. Engaged employees help us meet our business goals and help make Philips a great place to work. We have used employee engagement surveys for over a decade to gather feedback and focus areas and have seen tangible results along our journey.
As announced in 2012, we survey Employee Engagement on a bi-annual basis, starting in 2013. In 2014 we implemented a brief, complementary, team-focused survey called My Accelerate! Survey (MAS).
We have observed and shown via research the correlation between the Employee Engagement Index and the Net Promoter Score question “ How likely is it you would recommend Philips as a great place to work? “ (the measurement that cumulatively covers emotional commitment, pride and active recommendation). We used the Net Promoter Score as a proxy for the EES results in 2014 which was based on survey results of some 17,000 employees. In 2015 we will perform a full Employee Engagement Survey again.
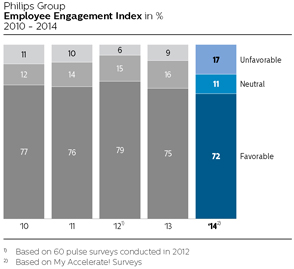
For more information on MAS, please refer to sub-section 14.2.1, Engaging our employees, of this report.
5.2.3 Diversity and inclusion
Based on the deployment of our comprehensive strategy, in 2014 Philips continued making progress on its diversity and inclusion (D&I) agenda. We believe a diverse workforce and an inclusive work environment are essential to a thriving innovative business and we strive to attract employees from a wide range of backgrounds.
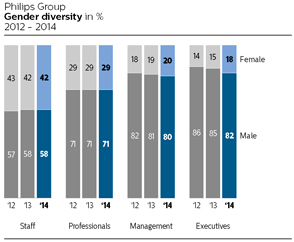
Regarding gender diversity, we recorded an increase in the share of female executives to 18% at year-end 2014 – up from 15% in 2013. We are well on track to achieve the aspiration of 20% female executives by year-end 2016 – having embedded D&I objectives in HR processes and culture-building activities, combined with the active engagement of senior female leaders globally.
One of the key drivers of progress is the redesigned talent management approach, which includes a comprehensive approach to succession planning for all executives and other key positions in order to also drive development and career planning for individuals. In 2014, 28% of new executives internally promoted were women, and women represented 31% of all external executive hires. Demonstrating the Group’s commitment to D&I, development of gender diversity has been made a key performance indicator for Philips.
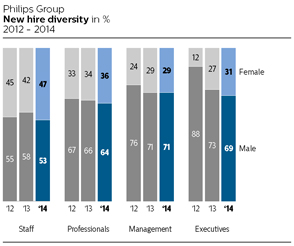
Philips has one woman on its Executive Committee and three female members of its Supervisory Board. Our executives originate from more than 30 countries.
In 2014, Philips employed 35% females, the same percentage as in 2013.
50 Annual Report 2014
Table of Contents
Group performance 5.2.3
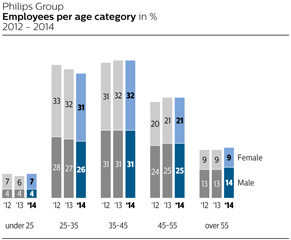
In 2014, employee turnover amounted to 15.7% (of which 8.7% was voluntary), slightly below 2013 and mainly caused by the changing industrial footprint, the company’s overhead reduction program and the high turnover of manufacturing staff in our factories, mainly in the growth markets.
Philips Group
Employee turnover in %
2014
|
|
|
|||||||||||||||||||
| Staff | Professionals | Management | Executives | Total | ||||||||||||||||
|
|
|
|||||||||||||||||||
|
Female |
22.4 | 12.0 | 9.8 | 9.9 | 18.2 | |||||||||||||||
|
Male |
19.1 | 10.2 | 8.8 | 14.0 | 14.1 | |||||||||||||||
|
|
|
|||||||||||||||||||
|
Philips Group |
20.5 | 10.7 | 9.0 | 13.3 | 15.7 | |||||||||||||||
|
|
|
|||||||||||||||||||
Philips Group
Voluntary turnover in %
2014
|
|
|
|||||||||||||||||||
| Staff | Professionals | Management | Executives | Total | ||||||||||||||||
|
|
|
|||||||||||||||||||
|
Female |
13.5 | 7.0 | 5.2 | 5.9 | 10.8 | |||||||||||||||
|
Male |
10.3 | 5.5 | 3.9 | 7.4 | 7.5 | |||||||||||||||
|
|
|
|||||||||||||||||||
|
Philips Group |
11.6 | 5.9 | 4.2 | 7.2 | 8.7 | |||||||||||||||
|
|
|
|||||||||||||||||||
Compared to the percentage of women employed by Philips in 2014, we see a relatively higher outflow of women in the Staff and Professionals categories and a lower outflow of female Executives.
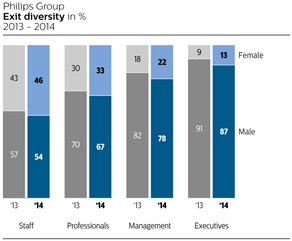
5.2.4 Employment
The year 2014
The total number of Philips Group employees (continuing operations) was 105,365 at the end of 2014, compared to 105,637 at the end of 2013. Approximately 36% were employed in the Lighting sector, 35% in the Healthcare sector and approximately 16% in the Consumer Lifestyle sector.
Philips Group
Employees per sector in FTEs at year-end
2012 - 2014
|
|
|
|||||||||||
| 2012 | 2013 | 2014 | ||||||||||
|
|
|
|||||||||||
|
Healthcare |
37,460 | 37,008 | 37,065 | |||||||||
|
Consumer Lifestyle |
16,542 | 17,255 | 16,639 | |||||||||
|
Lighting |
41,757 | 38,671 | 37,808 | |||||||||
|
Innovation, Group & Services |
11,697 | 12,703 | 13,853 | |||||||||
|
|
|
|||||||||||
|
Continuing operations |
107,456 | 105,637 | 105,365 | |||||||||
|
Discontinued operations |
10,631 | 10,445 | 8,313 | |||||||||
|
|
|
|||||||||||
|
Philips Group |
118,087 | 116,082 | 113,678 | |||||||||
|
|
|
|||||||||||
Compared to 2013, the number of employees in continuing operations decreased by 272. The decrease reflects industrial footprint rationalization at Lighting, divestments at Healthcare, and a reduction in third-party workers at Consumer Lifestyle, partly offset by the consolidation of the General Lighting Company (GLC) acquisition at Lighting and an increase in temporary workers in the IT Service Units at IG&S.
Approximately 52% of the Philips workforce was located in mature geographies, and about 48% in growth geographies. In 2014, the number of employees in mature geographies decreased by 1,733, mainly due to the company’s overhead reduction program and the industrial footprint reduction at Lighting. Growth geographies headcount increased by 1,461, largely driven by the GLC acquisition in The Kingdom of Saudi Arabia (KSA).
Philips Group
Employees per geographic cluster in FTEs at year-end
2012 - 2014
|
|
|
|||||||||||
| 2012 | 2013 | 2014 | ||||||||||
|
|
|
|||||||||||
|
Western Europe |
29,803 | 28,944 | 29,105 | |||||||||
|
North America |
25,375 | 24,401 | 22,283 | |||||||||
|
Other mature geographies |
3,304 | 3,419 | 3,643 | |||||||||
|
|
|
|||||||||||
|
Mature geographies |
58,482 | 56,764 | 55,031 | |||||||||
|
Growth geographies |
48,974 | 48,873 | 50,334 | |||||||||
|
|
|
|||||||||||
|
Continuing operations |
107,456 | 105,637 | 105,365 | |||||||||
|
Discontinued operations |
10,631 | 10,445 | 8,313 | |||||||||
|
|
|
|||||||||||
|
Philips Group |
118,087 | 116,082 | 113,678 | |||||||||
|
|
|
|||||||||||
Annual Report 2014 51
Table of Contents
Group performance 5.2.5
Philips Group
Employment in FTEs at year-end
2012 - 2014
|
|
|
|||||||||||
| 2012 | 2013 | 2014 | ||||||||||
|
|
|
|||||||||||
|
Balance as of January 1 |
125,240 | 118,087 | 116,082 | |||||||||
|
Consolidation changes: |
||||||||||||
|
Acquisitions |
909 | — | 1,506 | |||||||||
|
Divestments |
(1,024 | ) | (705 | ) | (247 | ) | ||||||
|
Changes in discontinued operations |
(3,545 | ) | (186 | ) | (2,132 | ) | ||||||
|
Other changes |
(3,493 | ) | (1,114 | ) | (1,531 | ) | ||||||
|
|
|
|||||||||||
|
Balance as of December 31 |
118,087 | 116,082 | 113,678 | |||||||||
|
|
|
|||||||||||
In 2015, the number of employees is expected to remain broadly in line with 2014, with increases from our acquisition of Volcano Corporation to be offset by reductions from footprint-related initiatives.
The year 2013
The total number of Philips Group employees was 105,637 at the end of 2013, compared to 107,465 at the end of 2012. Approximately 37% were employed in the Lighting sector, due to the continued vertical integration in this business. Some 35% were employed in the Healthcare sector and approximately 16% in the Consumer Lifestyle sector.
Compared to 2012, the number of employees decreased by 1,819. This decrease reflects industrial footprint rationalization at Lighting, divestments at Healthcare, and the company’s overhead reduction program.
Approximately 54% of the Philips workforce was located in mature geographies, and about 46% in growth geographies. In 2012, the number of employees in mature geographies decreased by 1,718, largely due to industrial footprint rationalization at Lighting. Growth geographies decreased by 101, mainly due to divestments.
5.2.5 Developing our people
Our drive to build a learning organization which is leader led has progressed significantly, and the Philips University was launched formally in Q4. Philips University is embracing 70:20:10 as part of the long-term journey to build a learning culture that allows us to become a learning organization: 70% of learning is carried out on the job, 20% through coaching and mentoring (through others), and the remaining 10% through formal learning methods (classroom and e-learning).
Training spend
Our external training spend in 2014 amounted to EUR 44.7 million, a decrease compared to EUR 47.3 million in 2013, which is the result of the rationalization of content made in 2013.
For more information on developing our people, please refer to sub-section 14.2.2, People development, of this report.
5.2.6 Health and Safety
Philips strives for an injury-free and illness-free work environment, with a sharp focus on reducing the number of injuries and improving processes. The Lost Workday Injury Cases (LWIC) rate is defined as a KPI, on which we set yearly targets for the company and our individual sectors.
We regret to report that one of our Healthcare Field Service employees passed away after a traffic accident in France whilst traveling home.
In 2014 we recorded 227 LWIC, i.e. occupational injury cases where the injured person is unable to work one or more days after the injury. This represents a significant decrease compared with 280 in 2013, and continues the consecutive reduction trend from 2010. The LWIC rate decreased to 0.23 per 100 FTEs, compared with 0.27 in 2013. The number of Lost Workdays caused by injuries increased by 403 days to 9,068 days in 2014.
For more information on Health and Safety, please refer to sub-section 14.2.4, Health and Safety performance, of this report.
5.2.7 Philips’ General Business Principles renewed
Our General Business Principles (GBP) set the standard for how to conduct business, both for individual employees and for the company itself. In our drive for continuous improvement, the GBP were revised in 2014 to help ensure that everyone acts with integrity, and also to better reflect the changing business landscape in which we operate.
For a description of GBP processes and policies, please refer to section 7.1, Our approach to risk management and business control, of this report.
The General Business Principles have been rewritten, but without deviating from the fundamental principles for doing business which are firmly rooted in Philips’ heritage. Without making substantial changes to these standards, the GBP have been turned into a document that is easy to read and understand for everyone. They have been translated into 32 languages, allowing almost every employee to read them in their native language. The GBP form an integral part of labor contracts in virtually every country in which Philips operates.
Training and awareness
Following the updating of the General Business Principles, a new e-learning was launched in October. In this mandatory online training course employees are informed about the contents of the GBP and the way in which Philips applies them. This course, in which every employee with an e-mail account has been invited to participate, is available in 21 languages and is taken by every new hire joining the company. During the last quarter of 2014, out of the 73,000 employees with an e-mail account, well over 57,000 (77%) took this e-
52 Annual Report 2014
Table of Contents
Group performance 5.2.7
learning. At the end of the training course employees are asked to confirm that they will always act with integrity. In addition, GBP Compliance Officers around the world also attended a series of face-to-face training courses aimed at helping them perform their supporting role more effectively.
The launch of the e-learning was just one of the events that formed part of the global communication campaign on the GBP. These communication efforts culminated in a ‘GBP dialog week’, for the second year in a row, in which managers were invited to host dialog sessions with their teams about the Philips GBP. Tens of thousands of Philips employees participated in these sessions and managers reported very high levels of engagement.
The results of the monitoring measures in place are given in sub-section 14.2.5, General Business Principles, of this report.
5.2.8 Working with stakeholders
In organizing ourselves around customers and markets, we create dialogues with our stakeholders in order to explore common ground for addressing societal challenges, building partnerships and jointly developing supporting ecosystems for our innovations. Working with partners is crucial in delivering on our vision to make the world healthier and more sustainable through innovation. An overview of stakeholders and topics discussed is provided in chapter 14, Sustainability statements, of this report.
For more information on our stakeholder engagement activities, please refer to sub-section 14.2.7, Stakeholder Engagement, of this report.
5.2.9 Social Investment Programs
2014 was a transition year for Philips’ social investment program. With the creation of the Philips Foundation, a new global strategy was rolled out, focusing on disaster relief, local community investment and social entrepreneurship. The Philips Foundation is responsible for the overall strategy and global non-profit partnerships. Philips’ country organizations, while aligning with the global strategy, have the ability to drive regional programs that fit the specific needs of local communities.
For example, in 2014, Philips Brazil rolled out the program “Light Up Your Game” across 10 countries in Latin America. Working together with non-profit organizations such as the KNVB and IDEAAS, they were able to install over 27 solar and semi-solar Community Light Centers, which provide safe and functional space for sports and other community activities after dark.
In North America, the Philips Cares program provides ways for employees to work together to improve people’s lives by creating healthy, sustainable communities that contribute to the success and well-being of future generations. This can take many forms:
from helping a child to excel in math, or providing safety and energy-efficient home improvements for the disadvantaged, to raising awareness about the importance of cardiac health. In 2014 alone, more than 5,000 employee volunteers participated in community outreach projects that suited their needs, schedules, and passions through partnerships with organizations such as the American Heart Association, Rebuilding Together, and the National 4-H Council.
In 2015 and beyond, all programs run by Philips country organizations on social investments will come under the umbrella of the Philips Foundation.
More information about the Philips Foundation and its purpose and scope can be found at sub-section 14.2.6, The Philips Foundation, of this report.
5.2.10 Supplier sustainability
Many of our products are being created and manufactured in close cooperation with a wide range of business partners, both in the electronics industry and other industries. Philips needs suppliers to share our commitment to sustainability, and not just in the development and manufacturing of products but also in the way they conduct their business. We require suppliers to provide a safe working environment for their workers, to treat workers with respect, and to work in an environmentally sound way. Our programs are designed to engage and support our suppliers on a shared journey towards continuous improvement in supply chain sustainability.
As a leading company in sustainability, Philips acts as a catalyst and supports our suppliers in their pursuit of continuous improvement in social and environmental performance. We recognize that this is a huge challenge requiring an industry-wide effort in collaboration with other societal stakeholders. Therefore, we take a leading role, together with peers in the industry, in the Electronic Industry Citizenship Coalition ( EICC ) and encourage our strategic suppliers to join the EICC too. In 2014, Philips initiated a new EICC taskforce on process chemicals in the supply chain. We will also continue to seek active cooperation and dialogue with other societal stakeholders including governments and civil society organizations, either directly or through institutions like the EICC, the multi-stakeholder programs of the Sustainable Trade Initiative IDH, and the OECD.
Supplier Sustainability Involvement Program
The Philips Supplier Sustainability Involvement Program is our overarching program to help improve the sustainability performance of our suppliers. We create commitment from our suppliers by requiring them to comply with our Regulated Substances List and the Philips Supplier Sustainability Declaration, which we include in all purchasing contracts. The Declaration is based on the EICC code of conduct and we have added requirements on Freedom of Association and Collective Bargaining. The topics covered in the
Annual Report 2014 53
Table of Contents
Group performance 5.2.10
Declaration are listed below. We monitor supplier compliance with the Declaration through a system of regular audits.

2014 supplier audits in risk countries
In 2014, Philips conducted 203 full-scope audits. Additionally, 35 audits of potential suppliers were performed. Potential suppliers are audited as part of the supplier approval process, and they need to close any zero-tolerance issues before they can start delivering to Philips. In our new audit approach, we place more focus on capacity-building programs to realize structural improvements leading to better audit results.
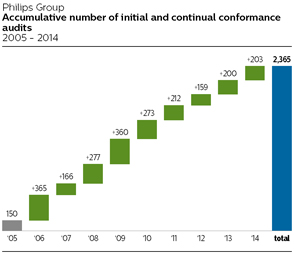
As in previous years, the majority of the audits in 2014 were done in China. The total number of full-scope audits carried out since we started the program in 2005 is 2,365. This number includes repeated audits (129 in 2014), since we execute a full-scope audit at our risk suppliers every three years. The audit program covers 90% of our spend with risk suppliers.
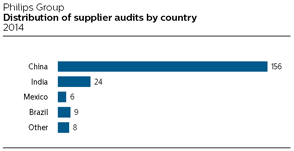
Audit findings
We believe it is important to be transparent about the issues we observe during the audits. Therefore we have published a detailed list of identified major non-compliances in our Annual Report since 2010.
To track improvements, Philips measures the ‘compliance rate’ for the identified risk suppliers, i.e. the percentage of risk suppliers that were audited within the last three years and do not have any – or have resolved all – major non-compliances. During 2014 we achieved a compliance rate of 86% (2013: 77%).
Please refer to sub-section 14.2.8, Supplier indicators, of this report for the detailed findings of 2014.
Supplier development and capacity building
Based on many years of experience with the audit program, we know that a combination of audits, capacity building, consequence management and structural attention from management is crucial to realize structural and lasting changes at supplier production sites. In 2014 we continued our focus on capacity-building initiatives which are offered to help suppliers improve their practices. Our supplier sustainability experts in China organized training, visited suppliers for on-site consultancy, conducted pre-audit checks and helped suppliers to train their own employees on topics like occupational health and safety, emergency preparedness, chemicals management, dust explosion and prevention, and fire safety.
We also teamed up with peers in the industry and civil society organizations to work on capacity building at Chinese factories via the IDH Electronics Program , an innovative multi-stakeholder initiative sponsored by the Sustainable Trade Initiative (Initiatief Duurzame Handel). The goal is to improve working conditions for more than 500,000 employees in the electronics sector. Three years ago the program was kicked-off in China’s Pearl River Delta, and has now expanded to
54 Annual Report 2014
Table of Contents
Group performance 5.2.10
also cover supplier factories in the Yangtze River Delta area. A total of 21 Philips suppliers are now participating in the program.
5.2.11 Conflict minerals: issues further down the chain
In line with Philips’ commitment to supply-chain sustainability, we are concerned about the situation in eastern DRC (the Democratic Republic of the Congo), where proceeds from the mining sector are used to finance rebel conflicts in the region. Philips does not directly source minerals from the DRC and the mines are typically seven or more tiers away from our direct suppliers. Philips nevertheless feels obliged to address this issue through the means and influencing mechanisms available to us.
We were one of the first companies to survey our suppliers to identify smelters used in the supply chain that produce the metals of concern, and one of the four companies to have our SEC Conflict Minerals report audited in 2014. We are cooperating with industry to drive the identified smelters to become compliant with the Conflict-Free Smelter Program or an equivalent third-party audit program. We also realize how important it is not to boycott the minerals from the DRC and neighboring countries entirely. That is why we are supporting verified conflict-free supply chains that contribute to economic development in the DRC region.
For more details and results of our supplier sustainability program, please refer to sub-section 14.2.8, Supplier indicators, of this report.
EcoVision
Philips has a long sustainability history stretching all the way back to our founding fathers. In 1994 we launched our first program and set sustainability targets for our own operations. Next we launched our first EcoVision program in 1998 which focused on the environmental dimension of our operations and products. We also started to focus on sustainability in our supply chain in 2003. We extended our scope further in 2010 by including the social dimension of products and solutions, which is now reflected in our company vision:
We strive to make the world healthier and more sustainable through innovation. Our goal is to improve the lives of 3 billion people a year by 2025.
Philips publishes every year a full Integrated Annual Report with the highest (reasonable) assurance level on the financial, social and environmental performance. With that overall reasonable assurance level Philips is a frontrunner in this field. KPMG has provided reasonable assurance on whether the information in chapter 14, Sustainability statements, of this report, section 5.2, Social performance, of this report and section 5.3, Environmental performance, of this report presents fairly, in all material respects, the sustainability performance in accordance with the reporting criteria. We refer to section 14.4, Independent Auditor’s Assurance Report, of this report.
The main elements of the EcoVision program are:
| • |
Improving people’s lives |
| • |
Green Product sales |
| • |
Green Innovation, including Circular Economy |
| • |
Green Operations |
| • |
Health and Safety |
| • |
Supplier Sustainability |
In this Environmental performance section an overview is given of the most important environmental parameters of the program. Improving people’s lives, Health and Safety, and Supplier Sustainability are addressed in the Social performance section. Details of the EcoVision parameters can be found in the chapter 14, Sustainability statements, of this report.
5.3.1 Green Innovation
Green Innovation is the Research & Development spend related to the development of new generations of Green Products and Green Technologies. We announced in 2010 our plan to invest a cumulative EUR 2 billion in Green Innovation during the coming 5 years. In 2014, Philips already achieved this EUR 2 billion target a year ahead of schedule as we invested some EUR 463 million in Green Innovation, excluding Lumileds and Automotive. Lighting continued to be the largest contributor, mainly as a result of investments in LED. The impact of Lumileds and Automotive on Green Innovation is significant at EUR 105 million in 2014 and EUR 104 million in 2013.

Healthcare
Healthcare develops innovative solutions across the continuum of care in collaboration with clinicians and customers, to improve patient outcomes, provide better value, and expand access to care. Healthcare investments in Green Innovation in 2014 amounted to EUR 90 million, an increase of EUR 10 million compared to 2013. In hardware innovation, we take into account all Green Focal Areas and aim to reduce environmental
Annual Report 2014 55
Table of Contents
Group performance 5.3.1
impact over the total lifecycle, with a focus on energy efficiency and substance management. Other areas covered include increased levels of recycled content in our products, remote servicing and closing the materials loop contributing to a circular economy, e.g. through upgrading strategies, parts harvesting and refurbishing. Healthcare actively supports a voluntary industry initiative (COCIR) for improving the energy efficiency of imaging equipment. Moreover, we are actively partnering with care providers to look together for innovative ways to reduce the environmental impact of healthcare, for example by optimizing energy efficient use of medical equipment.
Consumer Lifestyle
Increased R&D investments at Consumer Lifestyle are also reflected in increased Green Innovation which amounted to EUR 97 million in 2014 compared to EUR 75 million in 2013. This increase resulted in higher Green Product sales in all Business Groups. The sector continued its work on improving the energy efficiency of its products, closing the materials loop (e.g. by using recycled materials in products and packaging) and the voluntary phase-out of polyvinyl chloride (PVC), brominated flame retardants (BFR) and Bisphenol A (BPA) from food contact products. In particular, more than 80% of the shaving, grooming and oral healthcare products are completely PVC/BFR-free.
Lighting
At Lighting, we strive to make the world healthier and more sustainable through energy-efficient lighting systems. With a 2014 investment of EUR 255 million in Green Innovation (excluding Lumileds and Automotive at EUR 105 million), Lighting invested EUR 32 million more than in 2013. Increasing investments in digital lighting solutions have led to further improvements in the area of energy efficiency. In 2014, Lighting piloted a breakthrough connected lighting system for offices, featuring Power-over-Ethernet (PoE-enabled) luminaires. By offering employees personal control of the lighting above their desks, the system delivers appropriate task lighting levels while keeping general lighting levels lower, enhancing both worker efficiency and energy efficiency. The connected lighting system integrates with other building systems such as heating, ventilation, and IT services to realize significant energy savings — not only on lighting, but also on HVAC and other services, which together account for up to 70% of a building’s energy usage.
Beyond significant energy efficiency benefits, the connected lighting system supports the transition to a more circular economy. PoE-enabled luminaires eliminate the need for power cabling, simplifying installation and lowering initial costs. A flexible and open system architecture streamlines servicing and maintenance, affords an easy upgrade path, and extends system lifetime.
Philips Group Innovation
Philips Group Innovation invested EUR 21 million in Green Innovations, spread over projects focused on global challenges related to water, air, waste, energy, food and access to affordable healthcare. Group Innovation used the Sustainable Innovations Assessment tool, in which innovation projects are mapped, categorized and scored along the environmental and social dimension in order to identify those innovation projects that drive sustainable innovation.
Philips Green Patent portfolio
At the end of 2014, Philips’ IP portfolio comprised 8% green patent families, which means that all these patent families were labeled with at least one Green Focal Area. In 2014, 10% of our total patent filings were flagged as green patent family. Energy efficiency is the most frequently occurring Green Focal Area throughout the portfolio. Multiplying the portfolio percentage with our annual patent portfolio cost in 2014 determines the amount that we invest in Green IP, which constitutes part of Philips investment in Green Innovation.
While a product can become green by incorporating an environmentally friendly technology, such technology cannot necessarily be protected in a patent because of lack of patentability over the state-of-the-art technology. Therefore not all Green Technologies implemented in our Green Products can be captured in patents.
Energy efficiency of products
Energy efficiency is a key Green Focal Area for our Green Products. According to our analysis, about 97% of the energy consumed during the use phase of our products is attributable to Lighting products. The remaining 3% is split over Consumer Lifestyle and Healthcare. Therefore, we focus on the energy efficiency of our Lighting products in the calculation. The annual energy consumption per product category is calculated by multiplying the power consumption of a product by the average annual operating hours and the annual pieces sold and then dividing the light output (lumens) by the energy consumed (watts). The average energy efficiency of our total product portfolio increased slightly in 2014 to 40.5 lumen per watt (but improved 21% compared to 2009, the baseline year). The exclusion of Lumileds and Automotive has a limited upward effect on the energy efficiency of the portfolio.
In 2014 LED sales advanced well, but demand for conventional lighting remained fairly stable due to the challenging economic environment. Since the number of traditional lamps sold is significantly higher than LEDs, the energy efficiency improvement of the total Lighting portfolio in 2014 was limited. We expect the energy efficiency to improve in the coming years as the traditional incandescent lamp is banned in more countries. Our target for 2015 is a 50% improvement compared to the 2009 baseline. In this target setting, assumptions were made about the speed of the
56 Annual Report 2014
Table of Contents
Group performance 5.3.1
regulatory developments in this area, which fell short of expectations. Therefore, in 2015 the target of 50% improvement will not yet be achieved. Further details on this parameter and the methodology can be found in the document ‘Energy efficiency of Philips products’ at www.philips.com/sustainability .
Circular Economy
The transition from a linear to a circular economy is essential to create a sustainable world. A circular economy aims to decouple economic growth from the use of natural resources and ecosystems by using these resources more effectively. It is a driver of innovation in the areas of material, component and product re-use, as well as new business models such as system solutions and services. In a circular economy, more effective (re)use of materials enables the creation of more value, both by means of cost savings and by developing new markets or growing existing ones.
For more information on our Circular Economy activities, please refer to sub-section 14.3.1, EcoVision, of this report.
Closing the materials loop
The amount of collection and recycling for 2013 (reported in 2014) was calculated at 31,500 tonnes, a 3% increase compared to 31,000 tonnes reported in 2013, mainly driven by lower weight of products and components in Healthcare, offset by higher volumes in Lighting. The 2009 baseline for global collection and recycling amounts was around 22,500 tonnes, based on the data retrieved from the WEEE collection schemes and from our own recycling and refurbishment services (mainly Healthcare).
Recycled materials
We calculated the amount of recycled materials used in our products in 2014 at some 13,000 tonnes (2013: 14,000 tonnes), by focusing on the material streams plastics (Consumer Lifestyle), aluminum (Lighting), refurbished products, and spare parts harvesting (Healthcare) depending on the relevance in each sector.
Our target is to double global collection and recycling and the amount of recycled materials in our products by 2015 compared to 2009, when the baseline was set at 7,500 tonnes. Further details on this parameter and the methodology can be found in the document ‘Closing the materials loop’ at www.philips.com/sustainability .
5.3.2 Green Product sales
Green Products offer a significant environmental improvement in one or more Green Focal Areas: Energy efficiency, Packaging, Hazardous substances, Weight, Recycling and disposal and Lifetime reliability. Sales from Green Products, excluding the Lumileds and Automotive business, increased to EUR 11.1 billion in 2014, or 52% of sales (50% in 2013), thereby reaching a record level for Philips.
The exclusion of Lumileds and Automotive had a 1% negative impact on the total Green Product sales percentage.

Through our EcoDesign process, we aim to create products that have significantly less impact on the environment during their whole lifecycle. Overall, the most significant improvements have been realized in our energy efficiency Green Focal Area, an important objective of our EcoVision program, although there was also growing attention for hazardous substances and recyclability in all sectors in 2014, the latter driven by our Circular Economy initiatives.
New Green Products from each sector include the following examples.
Healthcare
During 2014, Healthcare expanded the Green Product portfolio with seven new products, although Green Product sales decreased slightly due to the Cleveland production suspension. The newly introduced products improve patient outcomes, provide better value, and expand access to care, while reducing environmental impact. Philips’ new Affinity platform, for example, delivers superb image quality and performance, and features a modern and elegant cart design with a simple-to-use touchscreen-based control panel, and ease-of-use imaging workflow. At the same time it reduces energy use by almost 40% compared to its predecessor model. Other examples are new X-ray systems such as DuraDiagnost compact and MobileDiagnost Opta systems, which feature significantly lower product and packaging weight (ranging between 20% and 38%), and, in the case of the MobileDiagnost Opta, a 67% reduction in energy usage compared to its predecessor model. Green Products from Patient Care & Monitoring Systems include the MX550 patient monitor, Avalon CL fetal monitor and PageWriter TC10 cardiograph, for which product weight, energy consumption and packaging weight have been significantly reduced (by between 24% and 62%).
Annual Report 2014 57
Table of Contents
Group performance 5.3.2
Consumer Lifestyle
Consumer Lifestyle focuses on Green Products which meet or exceed our minimum requirements in the areas of energy consumption, packaging, and substances of concern. The sales of Green Products in 2014 surpassed 55% of total sales. All our Green Products with rechargeable batteries (like toothbrushes, shavers, and grooming products) exceed the stringent California energy efficiency norm by at least 10%. We are making steady progress in developing PVC/BFR-free products. More than 60% of sales consist of PVC/BFR-free products, with the exception of the power cords, for which there are not yet economical viable alternatives available.
In 2014, more vacuum cleaners, coffee machines and irons were launched with parts made of recycled plastics. In total we have applied some 625 tons of recycled plastics in our products. An example is the new SENSEO ® Up, the plastic parts of which consist of 13% recycled material.
Lighting
Green Product sales within Lighting increased from 70% in 2013 to 72% in 2014. Connected lighting systems contributed to Green Product sales with solutions like CityTouch, a system for outdoor lighting management. CityTouch offers simple web applications to remotely control street lights and analyze related data. This gives cities the flexibility to dim lights to low levels wherever possible to save energy, or to boost light levels at the touch of a button when more light is needed (for example, in the case of an accident). The system helps cities save energy and operate more efficiently, while increasing citizens’ feeling of safety.
CityTouch technology is spreading around the world, with installations in Buenos Aires, Rotterdam, and Markham, Ontario, Canada. In the Spanish town of Salobre, CityTouch software combines with LED luminaires to reduce the municipality’s energy consumption by more than 70% and cut CO 2 emissions by 29 tons per year. In a number of London boroughs, over 70,000 light points will be managed by CityTouch.
5.3.3 Green Operations
The Green Operations program focuses on the main contributors to climate change, recycling of waste, reduction of water consumption and reduction of emissions of restricted and hazardous substances. Full details can be found in chapter 14, Sustainability statements, of this report.
Carbon footprint and energy efficiency
After achieving our EcoVision4 carbon emissions reduction target in 2012, we continued our energy efficiency improvement programs across different disciplines. In 2014 our carbon footprint decreased by 5% compared to 2013, resulting in a total of 1,375 kilotonnes CO 2 . This was mainly achieved by emissions reductions in our manufacturing facilities, resulting from operational changes and decreased energy usage due to lower load with an increased share coming from renewable sources (some 55% in 2014), and less transport activities. These reductions were, however, partly offset by increased emissions from our non- industrial activities, the floor space of our global non- industrial property portfolio increased by 2%. Business travel emissions remained stable compared to 2013, however we have noted a decrease in emissions from lease cars due to our successful Green Lease car program, whilst air travel increased over the course of 2014. We continue to promote video conferencing as an alternative to travel.
Our operational energy efficiency increased 2% from 1.17 terajoules per million euro sales in 2013 to 1.14 terajoules per million euro sales in 2014 as a result of energy efficiency programs in our industrial sites.
The impact of the exclusion of Lumileds and Automotive is displayed as discontinued operations in the graph below; the size of which varies over the years, but averages around 10% over the past 5 years. Emissions from discontinued operations in our industrial activities have been identified exactly. Emissions from our non-industrial facilities and business travel have been estimated based on FTE data. For our logistics emissions the part of discontinued operations has been estimated using revenue share as a proxy where applicable.
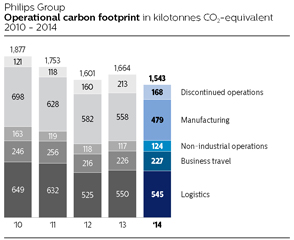
Philips Group
Operational carbon footprint by Greenhouse Gas Protocol scopes in kilotonnes CO 2 -equivalent
2010 - 2014
|
|
|
|||||||||||||||||||
| 2010 | 2011 | 2012 | 2013 | 2014 | ||||||||||||||||
|
|
|
|||||||||||||||||||
|
Scope 1 |
403 | 378 | 355 | 360 | 320 | |||||||||||||||
|
Scope 2 |
458 | 368 | 345 | 315 | 283 | |||||||||||||||
|
Scope 3 |
895 | 889 | 741 | 776 | 772 | |||||||||||||||
|
|
|
|||||||||||||||||||
|
Philips Group |
1,756 | 1,635 | 1,441 | 1,451 | 1,375 | |||||||||||||||
|
|
|
|||||||||||||||||||
58 Annual Report 2014
Table of Contents
Group performance 5.3.3
Philips Group
Ratios relating to carbon emissions and energy use
2010 - 2014
|
|
|
|||||||||||||||||||
| 2010 | 2011 | 2012 | 2013 | 2014 | ||||||||||||||||
|
|
|
|||||||||||||||||||
|
Operational CO 2 emissions in kilotonnes CO 2 -equivalent |
1,756 | 1,635 | 1,441 | 1,451 | 1,375 | |||||||||||||||
|
Operational CO 2 efficiency in tonnes CO 2 -equivalent per million euro sales |
91 | 82 | 65 | 66 | 64 | |||||||||||||||
|
Operational energy use in terajoules |
28,030 | 26,570 | 25,052 | 25,646 | 24,464 | |||||||||||||||
|
Operational energy efficiency in terajoules per million euro sales |
1.45 | 1.33 | 1.13 | 1.17 | 1.14 | |||||||||||||||
|
|
|
|||||||||||||||||||
Water
Total water intake in 2014 was 3.1 million m3, about 6% lower than in 2013. This decrease was mainly due to lower production volumes at multiple Lighting sites as well as a significant reduction at a Consumer Lifestyle site in China which implemented various water savings actions. This was partly offset by one Healthcare site that cooled magnets with water instead of helium. Many Philips sites have water savings programs.
Lighting represents around 66% of total water usage. In this sector, water is used in manufacturing as well as for domestic purpose. The other sectors use water mainly for domestic purposes. The exclusion of Lumileds and Automotive has a significant downward impact on the water consumption of Philips. In 2014, Lumileds and Automotive accounted for 1.7 million m 3 of water.
Philips Group
Water intake in thousands of m 3
2010 - 2014
|
|
|
|||||||||||||||||||
| 2010 | 2011 | 2012 | 2013 | 2014 | ||||||||||||||||
|
|
|
|||||||||||||||||||
|
Healthcare |
256 | 308 | 421 | 454 | 514 | |||||||||||||||
|
Consumer Lifestyle |
351 | 338 | 303 | 586 | 537 | |||||||||||||||
|
Lighting |
2,282 | 2,249 | 2,413 | 2,249 | 2,052 | |||||||||||||||
|
Innovation, Group & Services |
7 | — | — | — | — | |||||||||||||||
|
|
|
|||||||||||||||||||
|
Continuing operations |
2,896 | 2,895 | 3,137 | 3,289 | 3,103 | |||||||||||||||
|
Discontinued operations |
1,322 | 1,433 | 1,720 | 1,755 | 1,700 | |||||||||||||||
|
|
|
|||||||||||||||||||
|
Philips Group |
4,218 | 4,328 | 4,857 | 5,044 | 4,803 | |||||||||||||||
|
|
|
|||||||||||||||||||
In 2014, 72% of water was purchased and 28% was extracted from groundwater wells.
Waste
In 2014, total waste was comparable to 2013 at 75 kilotonnes. Lighting contributed to 72% of total waste, Consumer Lifestyle to 15% and Healthcare to 13%. Waste generated by 8 new reporting sites was offset by 5 discontinued sites. The exclusion of Lumileds and Automotive had a 7% downward impact on total waste. In 2013, an Automotive site in the Netherlands reported 10 kilotonnes of demolition scrap.
Philips Group
Total waste in kilotonnes
2010 - 2014
|
|
|
|||||||||||||||||||
| 2010 | 2011 | 2012 | 2013 | 2014 | ||||||||||||||||
|
|
|
|||||||||||||||||||
|
Healthcare |
11.2 | 9.3 | 10.4 | 9.6 | 9.8 | |||||||||||||||
|
Consumer Lifestyle |
23.2 | 19.6 | 12.7 | 11.4 | 11.3 | |||||||||||||||
|
Lighting |
61.7 | 58.1 | 57.5 | 54.9 | 53.9 | |||||||||||||||
|
Innovation, Group & Services |
0.1 | — | — | — | — | |||||||||||||||
|
|
|
|||||||||||||||||||
|
Continuing operations |
96.2 | 87.0 | 80.6 | 75.9 | 75.0 | |||||||||||||||
|
Discontinued operations |
8.4 | 7.0 | 7.0 | 16.1 | 5.4 | |||||||||||||||
|
|
|
|||||||||||||||||||
|
Philips Group |
104.6 | 94.0 | 87.6 | 92.0 | 80.4 | |||||||||||||||
|
|
|
|||||||||||||||||||
Total waste consists of waste that is delivered for landfill, incineration or recycling. Materials delivered for recycling via an external contractor comprised 60 kilotonnes, which equals 80% of total waste, an improvement compared to 79% in 2013, as our manufacturing sites implemented recycling programs. Of the 20% remaining waste, 75% comprised non-hazardous waste and 25% hazardous waste.
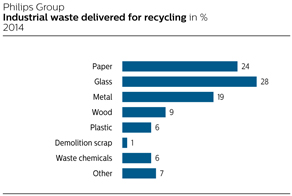
Emissions
Emissions of restricted substances totaled 9 kilos in 2014, on par with 2013, as our mercury emissions at Lighting were for the second year in a row as low as reasonably achievable, according to our assessment. The level of emissions of hazardous substances decreased from 35,118 kilos to 28,310 kilos (-19%), driven by a reduction of Xylene emissions at various Consumer Lifestyle sites, due to a decrease in use of specific lacquers and thinners. All sectors have reduction programs for the restricted and hazardous substances.
Annual Report 2014 59
Table of Contents
Group performance 5.3.3
Philips Group
Restricted and hazardous substances in kilos
2010 - 2014
|
|
|
|||||||||||||||||||
| 2010 | 2011 | 2012 | 2013 | 2014 | ||||||||||||||||
|
|
|
|||||||||||||||||||
|
Restricted substances |
188 | 111 | 55 | 9 | 9 | |||||||||||||||
|
Hazardous substances |
60,272 | 63,604 | 67,530 | 35,118 | 28,310 | |||||||||||||||
|
|
|
|||||||||||||||||||
For more details on restricted and hazardous substances, please refer to sub-section 14.3.3, Green Operations, of this report
5.4 Proposed distribution to shareholders
Pursuant to article 34 of the articles of association of Royal Philips, a dividend will first be declared on preference shares out of net income. The remainder of the net income, after reservations made with the approval of the Supervisory Board, shall be available for distribution to holders of common shares subject to shareholder approval after year-end. As of December 31, 2014, the issued share capital consists only of common shares; no preference shares have been issued. Article 33 of the articles of association of Royal Philips gives the Board of Management the power to determine what portion of the net income shall be retained by way of reserve, subject to the approval of the Supervisory Board.
A proposal will be submitted to the 2015 Annual General Meeting of Shareholders to declare a dividend of EUR 0.80 per common share (up to EUR 735 million), in cash or in shares at the option of the shareholder, against the net income for 2014 and retained earnings.
Shareholders will be given the opportunity to make their choice between cash and shares between May 13, 2015 and June 5, 2015. If no choice is made during this election period the dividend will be paid in shares. On June 5, 2015 after close of trading, the number of share dividend rights entitled to one new common share will be determined based on the volume weighted average price of all traded common shares Koninklijke Philips N.V. at Euronext Amsterdam on June 3,4 and 5, 2015. The Company will calculate the number of share dividend rights entitled to one new common share (the ‘ratio’), such that the gross dividend in shares will be approximately equal to the gross dividend in cash. On June 9, 2015 the ratio and the number of shares to be issued will be announced. Payment of the dividend and delivery of new common shares, with settlement of fractions in cash, if required, will take place from June 10, 2015. The distribution of dividend in cash to holders of New York Registry shares will be made in USD at the USD/EUR rate fixed by the European Central Bank on June 8, 2015.
Dividend in cash is in principle subject to 15% Dutch dividend withholding tax, which will be deducted from the dividend in cash paid to the shareholders. Dividend in shares paid out of net income and retained earnings is subject to 15% dividend withholding tax, but only in respect of the par value of the shares (EUR 0.20 per share).
In 2014, a dividend of EUR 0.80 per common share was paid in cash or shares, at the option of the shareholder. For 60% of the shares, the shareholders elected for a share dividend resulting in the issue of 18,811,534 new common shares, leading to a 2.1% percent dilution. EUR 292 million was paid in cash. For additional information, see chapter 17, Investor Relations, of this report.
The balance sheet presented in this report, as part of the Company financial statements for the period ended December 31, 2014, is before appropriation of the result for the financial year 2014.
Overall, 2014 was a setback in our performance trajectory. We have been taking clear actions to drive stronger operational performance across our businesses and expect sales growth and Adjusted IFO margin improvements in 2015 and beyond. However, looking ahead, we remain cautious regarding the macroeconomic outlook and expect ongoing volatility of some of our end-markets. We also anticipate further restructuring and separation costs in 2015 and 2016.
Due to these factors, we are tracking 1 percentage point behind on the path to achieving each of our 2016 comparable sales growth, Adjusted IFO and ROIC Group targets. We are convinced that this does not change our longer-term performance potential, considering the attractiveness of the Lighting Solutions and HealthTech markets and our competitive position. Later this year, as we progress with the separation of Philips and reallocation of IG&S, we will update the market about the integral performance targets for each of the two operating companies.
60 Annual Report 2014
Table of Contents
Group performance 5.6
5.6 Critical accounting policies
Critical accounting policies
The preparation of Philips’ financial statements requires us to make estimates and judgments that affect the reported amounts of assets and liabilities at the date of our financial statements. The policies that management considers both to be most important to the presentation of Philips’ financial condition and results of operations and to make the most significant demands on management’s judgments and estimates about matters that are inherently uncertain, are discussed below. Management cautions that future events often vary from forecasts and that estimates routinely require adjustment. A more detailed description of Philips’ accounting policies appears in the note 1, Significant accounting policies section.
Accounting for income taxes
As part of the process of preparing consolidated financial statements, the Company is required to estimate income taxes in each of the jurisdictions in which it conducts business. This process involves estimating actual current tax expense and temporary differences between tax and financial reporting. Temporary differences result in deferred tax assets and liabilities, which are included in the consolidated balance sheet. The Company regularly reviews the deferred tax assets for recoverability and will only recognize these if it is believed that sufficient future taxable profit is available, including income from forecasted operating earnings, the reversal of existing taxable temporary differences and established tax planning relating to the same taxation authority and the same taxable entity. For a discussion of the fiscal uncertainties, please refer to the information under the heading “Tax risks” in note 8, Income taxes.
Multi-element sales transactions
From time to time the Company is engaged in complex sales transactions relating to multi-element deliveries (for example a single sales transaction that combines the delivery of goods and rendering of services). The process of revenue recognition of such multi-element sales transactions involves the identification of the different sales components, the allocation of revenue to these different components and the timing of revenue recognition per component. Each of these process steps can be complex and requires judgment. In order to identify different components in a single sales contract, the Company verifies if a component has a stand-alone value to the customer and whether the fair value of the component can be measured reliably. Allocation of revenue to the different components is performed based on either a relative fair value approach or by means of a residual or fair value method, depending on which method is deemed most appropriate to the transaction. Eventually, revenue for each component is recognised when meeting the revenue recognition criteria in accordance with IAS 18 or IAS 11.
Provisions and Contingent liabilities
The Company and certain of its group companies and former group companies are involved as a party in legal proceedings, including regulatory and other governmental proceedings, and discussions on potential remedial actions, relating to such matters as antitrust laws, competition issues, commercial transactions, product liabilities, participations and environmental pollution. Since the ultimate disposition of asserted claims and proceedings and investigations cannot be predicted with certainty, an adverse outcome could have a material adverse effect on the Company’s Consolidated financial statements.
The Company recognizes a liability when it is probable that an outflow of resources embodying economic benefits will result from the settlement of a present obligation and the amount at which the outflow will take place can be measured reliably. If the likelihood of the outcome is less than probable and more than remote or a reliable estimate is not determinable, the matter is disclosed as a contingent liability if management concludes that it is material.
In determining the provision for losses associated with environmental remediation obligations, significant judgments are necessary. The Company utilizes experts in the estimation process. The Company accrues for losses associated with environmental obligations when such losses are probable and can be estimated reliably. The provisions are adjusted as new information becomes available and they are remeasured at the end of each period using the current discount rate.
Provisions on restructuring represents estimated costs of initiated reorganizations, the most significant of which have been approved by the Board of Management. A liability is recognized for those costs only when the Company has a detailed formal plan for the restructuring and has raised a valid expectation with those affected that it will carry out the restructuring by starting to implement that plan or announcing its main features to those affected by it.
The Company provides for warranty costs based on historical trends in product return rates and the expected material and labor costs to provide warranty services. The provision is based on historical warranty data and a weighing of possible outcomes against their associated probabilities.
Impairment of non-financial assets
Goodwill is not amortized, but tested for impairment annually and whenever impairment indicators require so. The Company reviews non-financial assets, other than goodwill for impairment, when events or circumstances indicate that carrying amounts may not be recoverable.
In determining impairments of non-current assets like intangible assets, property, plant and equipment, investments in associates and goodwill, management
Annual Report 2014 61
Table of Contents
Group performance 5.6
must make significant judgments and estimates to determine whether the recoverable amount is lower than the carrying value. Changes in assumptions and estimates included within the impairment reviews and tests could result in significantly different results than those recorded in the consolidated financial statements.
Goodwill is allocated to the cash generating units. The basis of the recoverable amount used in the annual impairment test (performed in Q2) and trigger-based impairment tests is generally the value in use. Key assumptions used in the impairment tests were sales growth rates, income from operations and the rates used for discounting the projected cash flows. These cash flow projections were determined using management’s internal forecasts that cover an initial period from 2014 to 2018 that matches the period used for our strategic review. Projections were extrapolated with stable or declining growth rates for a period of five years, after which a terminal value was calculated. For terminal value calculation, growth rates were capped at a historical long term average growth rate.
The sales growth rates and margins used to estimate cash flows are based on past performance, external market growth assumptions and industry long-term growth averages. Income from operations in all units is expected to increase over the projection period as a result of volume growth and cost efficiencies. Please refer to note 11, Goodwill.
Discontinued operations and non-current assets held for sale
Non-current assets (disposal groups comprising assets and liabilities), that are expected to be recovered primarily through sale rather than through continuing use, are classified as held for sale. A discontinued operation is a component of an entity that either has been disposed of, or that is classified as held for sale, and (a) represents a separate major line of business or geographical area of operations; and (b) is a part of a single coordinated plan to dispose of a separate major line of business or geographical area of operations; or (c) is a subsidiary acquired exclusively with a view to sell. Non-current assets held for sale and discontinued operations are carried at the lower of carrying amount or fair value less costs to sell.
Determining whether a non-current asset will be primarily recovered through sale rather than through continuing use requires judgment. The Company assesses whether such asset is available for immediate sale in its present condition subject only to terms that are usual and customary for sales of such assets or disposal groups, and its sale is assessed to be highly probably. Furthermore, in order to determine if that component qualifies as discontinued operations, judgment is required when the Company assesses whether a component of an entity represents a major line of business or geographical area compared to the whole of the Company and whether the sale is a part of a single coordinated plan.
New Accounting Standards
For a description of the new pronouncements, please refer to the information under the heading “IFRS accounting standard adopted as from 2014” in note 1, Significant accounting policies.
Off-balance sheet arrangements
Please refer to the information under the heading “Guarantees” in sub-section 5.1.23, Cash obligations, of this report and in note 26, Contingent assets and liabilities.
62 Annual Report 2014
Table of Contents
Sector performance 6

Our structure in 2014
Koninklijke Philips N.V. (the ‘Company’) is the parent company of the Philips Group (‘Philips’ or the ‘Group’). The Company is managed by the members of the Board of Management and Executive Committee under the supervision of the Supervisory Board. The Executive Committee operates under the chairmanship of the Chief Executive Officer and shares responsibility for the deployment of Philips’ strategy and policies, and the achievement of its objectives and results.
In 2014, Philips’ activities in the field of health and well-being were organized on a sector basis, with each operating sector – Healthcare, Consumer Lifestyle and Lighting – being responsible for the management of its businesses worldwide.
The Innovation, Group & Services sector includes the activities of Group Innovation and Group and regional management organizations. Additionally, the global shared business services for procurement, finance, human resources, IT and real estate are reported in this sector, as well as certain pension costs.
At the end of 2014, Philips had 93 production sites in 25 countries, sales and service outlets in approximately 100 countries, and 113,678 employees.
2015 and beyond
In September 2014 Philips announced its plan to sharpen its strategic focus by establishing two stand-alone companies focused on the HealthTech and Lighting Solutions opportunities.
To achieve this transformation, from January 1, 2015, Philips started to integrate the sectors Consumer Lifestyle and Healthcare into one operating company focused on our HealthTech businesses. At the same time Philips is taking the next step in the implementation of its new operating model which will give the company a dedicated, focused and lean management structure, as a result of the planned integration of the relevant sector and group layers.
Philips also started the process to carve out its Lighting business into a separate legal structure and will consider various options for ownership structures with direct access to capital markets.
The establishment of the two stand-alone companies will also involve the split and allocation of the current Innovation, Group & Services sector to each company in 2015. This means that in the course of 2015 the IG&S sector as currently described in this Annual Report will disappear and no longer be presented as a separate segment for reporting purposes.
Annual Report 2014 63
Table of Contents
Sector performance 6.1

“We remain steadfast in our commitment to enable the best possible care provision at the lowest cost wherever care is provided, from the hospital to the home.” Frans van Houten, CEO Royal Philips
| • |
By leveraging world-class innovation, deep clinical expertise and extensive relationships, global access to healthcare providers, and an integrated solutions portfolio, we provide greater value while helping lower the cost of care across the health continuum. |
| • |
Our multi-year Accelerate! program continues to improve our operational performance, helping offset market headwinds. |
| • |
We are focused on delivering on our financial commitments and driving growth, despite ongoing softness in a number of markets, including the US, Europe and China. |
| • |
Capitalizing on the convergence of professional healthcare and consumer end-markets, we will leverage our consumer and healthcare businesses to capture the vast opportunities along the health continuum – from healthy living to preventative care, definitive diagnostics, minimally invasive therapy, and hospital and home care for recovering and chronically ill patients. |
6.1.1 Health care landscape
Health care systems around the world are under increasing economic pressure. More people are living longer, and more are living with chronic conditions – driving healthcare spending to unsustainable levels.
Shortages of healthcare professionals are also adding to the relentless challenge of delivering better care at lower cost to growing patient populations.
Fundamental transformative changes are already taking place in the health care industry to enable the provision of affordable, quality care to everyone who needs it. There is a shift in emphasis from volume to value, and from a singular focus on clinical outcomes to a more holistic approach to population health. Greater attention is also being paid to the benefits of healthy living and home care as a way to lessen the burden on health systems.
Increasingly, providers and patients see the need for patients to take a more active role in managing their health – giving rise to the health consumer. Mobile and digital technologies will be significant enablers of this trend, leading to new care delivery models that give patients more control and responsibility for their healthcare, and offer providers more solutions for improving access and outcomes while managing costs.
6.1.2 About Philips Healthcare
At Philips, we deliver innovative, integral technology solutions designed to create value by improving the quality and delivery of care while lowering cost. Our
64 Annual Report 2014
Table of Contents
Sector performance 6.1.2
broad and deep clinical expertise and technology leadership across the health continuum and commitment to customer collaboration are core to our business and truly differentiate us.
Philips is one of the world’s leading health care companies (based on sales) along with General Electric and Siemens. The competitive landscape in the health care industry is evolving with the emergence of a considerable number of new market players. The United States, our largest market, represented 40% of Healthcare’s global sales in 2014, followed by China, Japan and Germany. Growth geographies accounted for 25% of Healthcare sales. Philips Healthcare has approximately 37,000 employees worldwide.
In 2014, our Healthcare business was organized around four strategic business groups, including the newly formed Healthcare Informatics, Solutions & Services group, which brings together key assets across Healthcare to address opportunities arising from rapid changes in the industry and the increasing importance of technologies, such as mobile devices, the Cloud, social media, Big Data and the Internet of Things. In 2014, these business groups were:
| • |
Imaging Systems : Integrated clinical solutions that include radiation oncology and portfolio management; advanced diagnostic imaging, including computed tomography (CT), magnetic resonance imaging (MRI) and molecular imaging (MI); diagnostic X-ray, including digital X-ray and mammography; interventional X-ray, encompassing cardiology, radiology, surgery and other areas; and ultrasound, a modality with diverse customers and broad clinical presence |
| • |
Patient Care & Monitoring Solutions : Enterprise-wide patient monitoring solutions, from value solutions to sophisticated connected solutions, for real-time clinical information at the patient’s bedside; patient analytics, patient monitoring and clinical decision support systems; mother and child care, including products and solutions for pregnancy, labor and delivery, newborn and neonatal intensive care and the transition home; and therapeutic care, including cardiac resuscitation, emergency care solutions, therapeutic temperature management, anesthesia care, hospital respiratory systems and ventilation, sleep management, respiratory care and non-invasive ventilation |
| • |
Customer Services: Product and solution services and support, including clinical support and performance services; education and value-added services; installation; remote proactive monitoring; and customer service agreement |
| • |
Healthcare Informatics, Solutions & Services: Advanced Healthcare IT consisting of integrated software solutions, imaging informatics for radiology and cardiology departments, Picture Archiving and Communication systems (PACS) and fully integrated Electronic Medical Record (EMR) systems; a professional services business (Healthcare Transformation Services) spanning consulting, education, clinical and business performance improvement, program management, system integration services; specialized solutions including care coordination, home monitoring to make the aging experience better, and primary and secondary care solutions to expand access to care in emerging markets. All solutions and software businesses will be supported by the Philips HealthSuite Digital Platform to enable interoperability, Big Data analytics, optimized workflows and care pathways, rapid application development, enhanced patient centricity and engagement. |

Sales at Healthcare are generally higher in the second half of the year largely due to the timing of new product availability and customer spending patterns.
Regulatory requirements
Philips Healthcare is subject to extensive regulation. We are committed to compliance with regulatory product approval and quality system requirements in every market we serve, by addressing specific terms and conditions of local and national regulatory authorities, including the US FDA, the SFDA in China, and other comparable foreign agencies. Obtaining regulatory approval is costly and time-consuming, but a prerequisite for market introduction.
Progress was made in 2014 in the remediation of the quality management system at our Healthcare facility in Cleveland, Ohio. Following external certification of the updated quality management system we resumed production, which had been voluntarily suspended earlier in the year, with production ramp-up expected to continue through 2015.
With regard to sourcing, please refer to sub-section 14.2.8, Supplier indicators, of this report.
6.1.3 2014 highlights
The health continuum of healthy living, prevention, diagnosis, treatment, recovery and home care remained a growing and exciting market for Philips Healthcare. Leveraging our portfolio, insights and
Annual Report 2014 65
Table of Contents
Sector performance 6.1.3
capabilities, we focused on creating value across our businesses and markets through collaborative innovation, including:
| • |
Large-scale partnerships – We entered into a number of strategic, multi-year agreements that address government and health system goals of improving population health and delivering quality care more effectively. These included a 15-year contract with Reinier de Graaf Hospital in the Netherlands, a 14-year contract with Karolinska University Hospital and the Stockholm County Council in Sweden, and a 10-year contract related to the 700-bed Philippine Orthopedic Centre in the Philippines. |
| • |
Co-created solutions – We collaborated on smart solutions co-created in the clinical environment, such as working with the University of Washington on advancements in diagnostics and informatics to improve outcomes, drive operational efficiency and reduce costs per patient. |
| • |
Strategic alliances – We formed key partnerships to help drive healthcare transformation, including an alliance with Salesforce.com to deliver an open, cloud-based healthcare platform that will enable collaborative care management between patients and healthcare professionals. |
We also introduced locally relevant solutions for making quality care accessible to wider patient populations in markets such as India and Africa. These innovations included VISIQ, an ultra-mobile, tablet-based system for ultrasound imaging, and Efficia DFM100, an integrated defibrillator and monitor solution.
We are proud that customers named Philips Healthcare as the overall Best in KLAS Imaging Equipment Company in 2014 for the second year in a row.
In 2014, we entered the fourth year of our Accelerate! journey, which continued to drive improvements in operational performance, as we focused on strengthening our innovation pipeline while making progress on cost savings.
In December 2014 Philips entered into an agreement to acquire Volcano Corporation, a global leader in catheter-based imaging and measurement solutions for cardiovascular applications. Volcano’s complementary portfolio and expertise will create opportunities to accelerate revenue growth for our image-guided therapy business.
6.1.4 2014 financial performance
| Philips Healthcare | ||||||||||||
| Key data in millions of EUR unless otherwise stated | ||||||||||||
| 2012 - 2014 | ||||||||||||
|
|
|
|||||||||||
| 2012 | 2013 | 2014 | ||||||||||
|
|
|
|||||||||||
|
Sales |
9,983 | 9,575 | 9,186 | |||||||||
|
Sales growth |
||||||||||||
|
% increase (decrease), nominal |
13 | % | (4 | )% | (4 | )% | ||||||
|
% increase (decrease), comparable 1 ) |
6 | % | 1 | % | (2 | )% | ||||||
|
Adjusted IFO 1 ) |
1,226 | 1,512 | 616 | |||||||||
|
as a % of sales |
12.3 | % | 15.8 | % | 6.7 | % | ||||||
|
IFO |
1,026 | 1,315 | 456 | |||||||||
|
as a % of sales |
10.3 | % | 13.7 | % | 5.0 | % | ||||||
|
Net operating capital (NOC) 1 ) |
7,976 | 7,437 | 7,565 | |||||||||
|
Cash flows before financing activities 1 ) |
1,298 | 1,292 | 910 | |||||||||
|
Employees (in FTEs) |
37,460 | 37,008 | 37,065 | |||||||||
|
|
|
|||||||||||
| 1) |
For a reconciliation to the most directly comparable GAAP measures, see chapter 15, Reconciliation of non-GAAP information, of this report |
In 2014, sales amounted to EUR 9,186 million, 4% lower than in 2013 on a nominal basis. Excluding a 2% negative currency effect, comparable sales decreased by 2%. Customer Services achieved mid-single-digit growth and Patient Care & Monitoring Solutions posted low-single-digit growth, while HealthCare Informatics, Services & Solutions sales were in line with 2013. Imaging Systems recorded a double-digit decline. Green Product sales amounted to EUR 3,508 million, or 38% of sector sales.
Geographically, comparable sales in growth geographies showed a low-single-digit decline, with strong growth in Latin America and Middle East & Turkey offset by a double-digit decline in China. In mature geographies, comparable sales also showed a low-single-digit decline. The year-on-year sales decrease was largely attributable to North America and Western Europe, as sales in other mature geographies showed a low-single-digit increase, led mainly by Japan.
Adjusted IFO decreased from EUR 1,512 million, or 15.8% of sales, in 2013 to EUR 616 million, or 6.7% of sales, in 2014. Restructuring and acquisition-related charges amounted to EUR 70 million in 2014, while in 2013 they were close to zero. 2014 Adjusted IFO included charges of EUR 366 million related to the jury verdict in the Masimo litigation, EUR 49 million of mainly inventory write-downs related to the Cleveland facility, and a EUR 16 million past-service pension cost gain in the Netherlands.
In 2014, the voluntary suspension of production at our Cleveland facility and the jury verdict in the Masimo litigation strongly impacted our 2014 performance. At our Healthcare facility in Cleveland, Ohio, certain issues in the general area of manufacturing process controls were identified during an ongoing US Food and Drug Administration (FDA) inspection. To address these issues, on January 10, 2014 we started a voluntary,
66 Annual Report 2014
Table of Contents
Sector performance 6.1.4
temporary suspension of new production at the facility, primarily to strengthen manufacturing process controls. The suspension negatively impacted Healthcare’s sales and Adjusted IFO in 2014.
On October 3, 2014 Philips announced that it would appeal the jury verdict in the patent infringement lawsuit by Masimo Corporation (Masimo), in which Masimo was awarded compensation of USD 467 million (EUR 366 million). The jury verdict is part of extensive litigation, which started in 2009, between Masimo and Philips involving several claims and counterclaims related to a large number of patents.
Adjusted IFO in 2013 also included EUR 61 million from a past-service pension gain and a EUR 21 million gain on the sale of a business excluding these items. The decrease in Adjusted IFO was mainly driven by operational losses related to the voluntary suspension of production at the Cleveland facility and negative currency impacts.
IFO amounted to EUR 456 million, or 5.0% of sales, and included EUR 159 million of charges related to intangible assets.
Net operating capital increased by EUR 128 million to EUR 7,565 million. Higher provisions and lower fixed assets were offset by currency impacts.
Cash flows before financing activities decreased from EUR 1,292 million in 2013 to EUR 910 million in 2014, largely due to lower earnings.
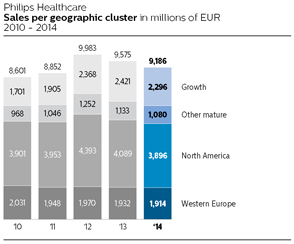


2013 financial performance
In 2013, sales amounted to EUR 9,575 million, 4% lower than in 2012 on a nominal basis. Excluding a 5% negative currency effect, comparable sales increased by 1%. Customer Services achieved mid-single-digit growth and Patient Care & Monitoring Systems recorded low-single-digit growth. HealthCare Informatics, Solutions & Services was in line with last year, while Imaging Systems recorded a mid-single- digit decline. Green Product sales amounted to EUR 3,690 million, or 39% of sector sales.
Geographically, comparable sales in growth geographies showed high-single digit growth, largely driven by strong double-digit growth in China and Latin America, partly offset by a decline in Russia & Central Asia. In mature geographies, comparable sales declined by 1%. The year-on-year sales decrease was largely attributable to North America and Western Europe, as sales in other mature geographies showed a high-single-digit increase, led mainly by Japan.
Annual Report 2014 67
Table of Contents
Sector performance 6.1.5
Adjusted IFO increased from EUR 1,226 million, or 12.3% of sales, in 2012 to EUR 1,512 million, or 15.8% of sales, in 2013. All businesses delivered improved Adjusted IFO, largely as a result of cost-saving programs related to overhead reduction. Restructuring and acquisition-related charges were close to zero, compared with EUR 134 million in 2012. Adjusted IFO in 2013 also included EUR 61 million from a past-service pension gain and a EUR 21 million gain on the sale of a business.
IFO amounted to EUR 1,315 million, or 13.7% of sales, and included EUR 197 million of charges related to intangible assets.
Net operating capital decreased by EUR 539 million to EUR 7.4 billion, mainly due to currency effects and lower fixed assets.
Cash flows before financing activities decreased from EUR 1,298 million in 2012 to EUR 1,292 million, as higher earnings were more than offset by higher outflows from working capital and provisions.
6.1.5 Delivering on EcoVision sustainability commitments
The increasing population and rising levels of human development worldwide pose a number of challenges, such as scarcity of natural resources, pollution, and stressed health care systems. Philips Healthcare continues to help increase the number of lives improved annually around the globe by developing solutions that improve access to care, while at the same time respecting the boundaries of natural resources.
In 2014, Green Product sales in Healthcare amounted to EUR 3.5 billion and we introduced seven new Green Products to support energy efficiency, materials reduction and other sustainability goals. We are also actively collaborating with care providers to look for innovative ways to reduce the environmental impact of health care, for example by improving the energy efficiency of medical equipment. Another example is the launch of a new imaging systems refurbishment facility in Best, the Netherlands, in support of the transition to a circular economy in Healthcare.
Philips was presented with the 2014 “Champion for Change” Award by Practice Greenhealth. The award honors businesses who have not only taken steps to improve their organization’s green practices, but have also gone the extra mile to help their clients and associates expand their sustainable practices as well.
6.1.6 2015 and beyond
In September 2014 Philips announced its plan to sharpen its strategic focus by establishing two stand- alone companies focused on the HealthTech and Lighting Solutions opportunities. To achieve this transformation, from January 1, 2015, Philips started to integrate the sectors Healthcare and Consumer Lifestyle into one operating company focused on our HealthTech businesses.
In the HealthTech space, Royal Philips will focus on the vast market opportunities created by the convergence of professional healthcare and consumer end-markets across the health continuum, from healthy living and prevention to diagnosis, treatment, recovery and home care.
Building on combined clinical and consumer capabilities, we will focus on solutions aimed at empowering consumers and patients to take greater control of their own health, enabling payers and providers to improve outcomes while managing overall cost, and helping governments increase access to high-quality, affordable care.
From an external financial reporting perspective, it should be noted that the planned organizational changes will require Philips to transition to a new reporting structure in the course of 2015. At that stage, and in view of applicable IFRS requirements, Philips will report and discuss its financial performance on the basis of different reportable segments than the sectors currently presented and discussed in this Annual Report.
Further updates will be provided in the course of 2015.
68 Annual Report 2014
Table of Contents
Sector performance 6.1.6

Innovating on the ward
A unique partnership with a hospital in China has yielded astonishing results in the field of diagnostics, in a country with rising health problems, where many specialists are unable to cope with increased workloads.
The huge West China Hospital in the country’s fourth largest city, Chengdu, plays host to a ground-breaking collaboration between doctors and engineers from Philips. China accounts for half of all new cases of liver cancer in Asia, but old cancer diagnostic technologies involved complex and time-consuming invasive procedures that presented risk to the patient and meant their recovery times were lengthened.
The Philips ElastPQ is a non-invasive machine using state-of-the-art ultrasound technology. It provides medics with valuable data that can be used to accurately diagnose liver cancer – both at a fraction of the cost and at greater speed. However, it’s not simply the innovation – the presence of Philips engineers on site facilitates ongoing research and development in a hospital setting. This continuous innovation is an inspiring medical partnership where doctors and engineers join forces to match technology with actual clinical need. It’s leading to faster and more accurate cancer diagnosis – with all the obvious benefits that entails for patients.

“Having joined forces (with Philips), we’re bridging the gap to match technology with actual clinical need. Today the focus is on liver cancer, but I hope to expand the collaboration to other areas.” Dr. Yan Luo, Director of the Ultrasound Department, West China Hospital
Annual Report 2014 69
Table of Contents
Sector performance 6.2

“Across the world people are looking for new ways to take greater control of their personal health. Ways to cook healthily, to breathe clean air, to ensure good oral health. Ways to care for themselves and their families at home. At Consumer Lifestyle we are playing a key role in this consumerization of healthcare, expanding our offering to help consumers make healthier choices every day. We empower them to be healthy and live well, avoiding illness through conscious healthy behavior.” Pieter Nota, CEO Philips Consumer Lifestyle
| • |
We are rigorously executing our strategy, with locally relevant innovation delivering strong growth and driving profitability. |
| • |
Future growth drivers are clearly set: grow the core businesses through local and global innovation platforms, and geographical expansion of proven propositions; further expand in the domain of personal health by exploring new business adjacencies and new business areas. |
| • |
The sector has made strong progress to reposition towards a healthy living and disease prevention portfolio, in more attractive markets, with better margins. |
| • |
Our multi-year Accelerate! program has transformed the sector into a market-driven organization, by changing our operating model and instilling a strong performance culture and end-to-end approach. |
6.2.1 Lifestyle retail landscape
Across the world, consumers are looking for solutions that help them to be healthy, live well and enjoy life. They want to be in control of their personal health and to care for their family and friends. They want to look and feel good.
70 Annual Report 2014
Table of Contents
Sector performance 6.2.1
In a connected, digital world, consumers are looking for smart, personalized solutions. Purchase decisions are increasingly made or influenced online; this is as true of consumers in growth geographies such as China, as it is in developed markets such as Western Europe.
The rise of the middle class in growth geographies is another trend impacting the retail landscape. This rapidly expanding group has increasing spending power.
In 2014, economic headwinds caused continued pressure on consumer spending in some markets. However, living a healthy life remained a high priority for consumers.
6.2.2 About Philips Consumer Lifestyle
At Consumer Lifestyle we aim to make a difference to people’s lives by enabling them to make healthy choices every day, and through conscious healthy behavior avoid illness. In recent years, Consumer Lifestyle has been responding to the need and desire of consumers to take greater control of their own health. We have largely reshaped our portfolio toward the healthy living and disease prevention areas of the health continuum, targeting more attractive markets with better margins.
The sector is focused on value creation through category leadership and operational excellence. We are increasing the quality and local relevance of product innovation, the speed with which we innovate, and expanding our distribution to capture increasing spending power in growth geographies.
Consumer Lifestyle is built around businesses and markets, enabling us to direct investments to where the growth is, addressing locally relevant consumer needs. We take locally developed platforms and adapt them for other markets or on a global scale.
Our end-to-end approach is accelerating specialist capability development in mature markets, to enable effective partnerships with customers and consumers, and in growth geographies, to enable development of go-to-market strategies
In 2014 the Consumer Lifestyle sector consisted of the following areas of business:
| • |
Health & Wellness: mother and child care, oral healthcare, pain management |
| • |
Personal Care: male grooming, beauty |
| • |
Domestic Appliances: kitchen appliances, coffee, garment care, floor care, air purification |
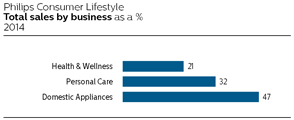
We offer a broad range of products from high to low price/value quartiles, necessitating a diverse distribution model. We continue to expand our portfolio and increase its accessibility, particularly in lower-tier cities in growth geographies. We are well positioned to increasingly capture growth in online sales. Over the course of 2014 we implemented innovative approaches in online and social media to build our brand and drive sales in local markets and globally. On the Philips Global Facebook page for instance, an educational personal health and well-being campaign helped increase the number of fans from 4 million to 6 million. More locally, a UK-focused Domestic Appliances campaign, which was activated on several social channels, generated interest from almost 2 million consumers in just 3 months.
Under normal economic conditions, the Consumer Lifestyle sector experiences seasonality, with higher sales in the fourth quarter.
Consumer Lifestyle employs approximately 16,600 people worldwide. Our global sales and service organization covers more than 50 developed and growth geographies. In addition, we operate manufacturing and business creation organizations in Argentina, Austria, Brazil, China, India, Indonesia, Italy, the Netherlands, Romania, the UK and the US.
Regulatory requirements
Consumer Lifestyle is subject to regulatory requirements in the markets where it operates. This includes the European Union’s Waste from Electrical and Electronic Equipment (WEEE), Restriction of Hazardous Substances (RoHS), Registration, Evaluation, Authorization and Restriction of Chemicals (REACH), Energy-use of Products (EuP) requirements and Product Safety Regulations. Consumer Lifestyle has a growing portfolio of medically regulated products in its Health & Wellness and Personal Care businesses. For these products we are subject to the applicable requirements of the US FDA, the European Medical Device Directive, the SFDA in China and comparable regulations in other countries. Through our growing beauty, oral healthcare and mother and child care product portfolio the range of applicable regulations has been extended to include requirements relating to cosmetics and, on a very small scale, pharmaceuticals.
With regard to sourcing, please refer to sub-section 14.2.8, Supplier indicators, of this report.
Annual Report 2014 71
Table of Contents
Sector performance 6.2.3
6.2.3 2014 highlights
| • |
Empowering consumers to take control of their own health with digital solutions for healthy living and disease prevention, Philips launched its latest connected devices and apps at IFA in Berlin. Highlights included a smart air purifier, an app to manage treatment of chronic pain and an oral healthcare app to help kids brush their teeth more effectively. |
| • |
Continuing the geographical expansion of Philips product innovations, the Philips Airfryer is now available in more than 100 countries. Philips is a leader in the world’s low-fat fryer market. |
| • |
The success of established propositions like the Philips Sonicare DiamondClean and the Philips Sonicare AirFloss, along with new introductions like Philips Sonicare for Kids, drove continued growth across the world, in particular in China, Japan, Germany and North America. |
| • |
Delivering on its male grooming growth strategy to drive loyalty and create more value among existing users, Philips launched the Philips Shaver Series 9000, our most advanced shaver yet, in 47 countries around the world. |
| • |
Award-winning designs and advanced technology further strengthened Philips’ leadership position in the Chinese air purification market, with consumers responding to innovations such as the Vitashield Intelligent Purification System, which removes indoor contaminants that can impact health and well-being. |
| • |
Professional endorsement and channel expansion are core to the growth momentum of Philips’ Mother and Childcare business (Avent). In Germany, distribution was further extended in the drugstore channel, with professional endorsement a key trigger for consumers. In China, distribution was expanded to more cities, with a continued focus to make Philips Avent the brand that is most recommended by mothers. |
6.2.4 2014 financial performance
Philips Consumer Lifestyle
Key data in millions of EUR unless otherwise stated
2012 - 2014
|
|
|
|||||||||||
| 2012 | 2013 | 2014 | ||||||||||
|
|
|
|||||||||||
|
Sales |
4,319 | 4,605 | 4,731 | |||||||||
|
Sales growth |
||||||||||||
|
% increase (decrease), nominal |
15 | % | 7 | % | 3 | % | ||||||
|
% increase (decrease), comparable 1 ) |
9 | % | 10 | % | 6 | % | ||||||
|
Adjusted IFO 1 ) |
456 | 483 | 573 | |||||||||
|
as a % of sales |
10.6 | % | 10.5 | % | 12.1 | % | ||||||
|
IFO |
400 | 429 | 520 | |||||||||
|
as a % of sales |
9.3 | % | 9.3 | % | 11.0 | % | ||||||
|
Net operating capital (NOC) 1 ) |
1,205 | 1,261 | 1,353 | |||||||||
|
Cash flows before financing activities 1 ) |
413 | 480 | 553 | |||||||||
|
Employees (in FTEs) |
16,542 | 17,255 | 16,639 | |||||||||
|
|
|
|||||||||||
| 1) |
For a reconciliation to the most directly comparable GAAP measures, see chapter 15, Reconciliation of non-GAAP information, of this report |
Sales amounted to EUR 4,731 million, a nominal increase of 3% compared to 2013. Excluding a 3% negative currency impact, comparable sales were 6% higher year-on-year. Health & Wellness achieved double-digit-growth and Domestic Appliances recorded high-single-digit growth, while Personal Care recorded low-single-digit growth. Green Product sales amounted to EUR 2,605 million, or 55% of total sector sales.
From a geographical perspective, comparable sales showed an 8% increase in growth geographies and 3% growth in mature geographies. In growth geographies, increase was mainly driven by China and Middle East & Turkey, primarily in the Health & Wellness and Domestic Appliances businesses. Growth geographies’ share of sector sales was in line with 2013 at 47%.
Adjusted IFO increased from EUR 483 million, or 10.5% of sales, in 2013 to EUR 573 million, or 12.1% of sales, in 2014. Restructuring and acquisition-related charges amounted to EUR 9 million in 2014, compared to EUR 14 million in 2013. Adjusted IFO in 2013 also included a EUR 1 million past-service pension cost gain in the US. The year-on-year Adjusted IFO increase was driven by improved earnings in all businesses and more than offset currency headwinds.
IFO amounted to EUR 520 million, or 11.0% of sales, which included EUR 53 million of amortization charges, mainly related to intangible assets at Health & Wellness and Domestic Appliances.
Net operating capital increased from EUR 1,261 million in 2013 to EUR 1,353 million in 2014, due to higher working capital and a reduction in provisions.
Cash flows before financing activities increased from EUR 480 million in 2013 to EUR 553 million in 2014, mainly attributable to higher earnings.
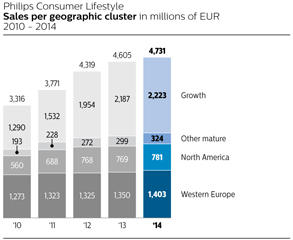
72 Annual Report 2014
Table of Contents
Sector performance 6.2.4
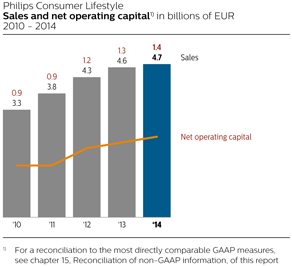
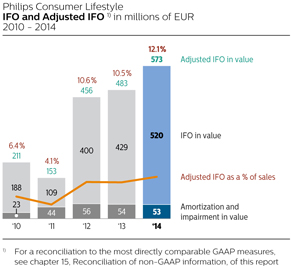
2013 financial performance
Sales amounted to EUR 4,605 million, a nominal increase of 7% compared to 2012. Excluding a 3% negative currency impact, comparable sales were 10% higher year-on-year. Domestic Appliances achieved strong double-digit growth, while Health & Wellness and Personal Care recorded high-single-digit growth. Green Product sales amounted to EUR 2,271 million, or 49% of total sector sales.
From a geographical perspective, comparable sales showed a 17% increase in growth geographies and 4% growth in mature geographies. In growth geographies, the year-on-year sales increase was driven by Russia and China, primarily in our Domestic Appliances and Personal Care businesses. Growth geographies’ share of sector sales increased from 45% in 2012 to 47% in 2013.
Adjusted IFO increased from EUR 456 million, or 10.6% of sales, in 2012 to EUR 483 million, or 10.5% of sales, in 2013. Restructuring and acquisition-related charges amounted to EUR 14 million in 2013, compared to EUR 56 million in 2012. Adjusted IFO in 2012 included a EUR 160 million one-time gain from the extension of our partnership with Sara Lee, including the transfer of our 50% ownership right to the Senseo trademark. Excluding this one-time gain, the year-on-year Adjusted IFO increase was driven by improved earnings in all businesses.
IFO amounted to EUR 429 million, or 9.3% of sales, which included EUR 54 million of amortization charges, mainly related to intangible assets at Health & Wellness and Domestic Appliances.
Net operating capital increased from EUR 1,205 million in 2012 to EUR 1,261 million in 2013, due to higher working capital and lower provisions.
Cash flows before financing activities increased from EUR 413 million in 2012 to EUR 480 million in 2013. Excluding the cash proceeds of EUR 170 million received in 2012 from the Senseo transaction, cash flows before financing activities increased by EUR 237 million mainly attributable to higher cash earnings.
6.2.5 Delivering on EcoVision sustainability commitments
Sustainability plays an important role at Consumer Lifestyle, with the main focus on optimizing the sustainability performance of our products and operations. Green Products, which meet or exceed our minimum requirements in the area of energy consumption, packaging and/or substances of concern, accounted for 55% of total sales in 2014. All Green Products with rechargeable batteries exceed the stringent California energy efficiency standard. And over 60% of total sales are PVC- and/or BFR-free products (excluding power cords).
In 2014 we continued to increase the use of recycled materials in our products. Over 625 tons of recycled plastics were used in vacuum cleaners, irons and coffee machines. We also launched the new SENSEO ® Up, of which the plastic parts consist of 13% recycled material. In our operations we continue to use more energy from renewable sources, with the ultimate aim of having CO2-neutral production sites. In 2014, 68% of the electricity used in factories came from renewable sources and 80% of the industrial waste was recycled.
6.2.6 2015 and beyond
In September 2014 Philips announced its plan to sharpen its strategic focus by establishing two stand- alone companies focused on the HealthTech and Lighting Solutions opportunities. To achieve this transformation, from January 1, 2015, Philips started to integrate the sectors Consumer Lifestyle and Healthcare into one operating company focused on our HealthTech businesses.
In the HealthTech space, Royal Philips will focus on the vast market opportunities created by the convergence of professional healthcare and consumer end-markets
Annual Report 2014 73
Table of Contents
Sector performance 6.2.6
across the health continuum, from healthy living and prevention to diagnosis, treatment, recovery and home care.
Building on combined clinical and consumer capabilities, we will focus on solutions aimed at empowering consumers and patients to take greater control of their own health, enabling payers and providers to improve outcomes while managing overall cost, and helping governments increase access to high-quality, affordable care.
From an external financial reporting perspective, it should be noted that the planned organizational changes will require Philips to transition to a new reporting structure in the course of 2015. At that stage, and in view of applicable IFRS requirements, Philips will report and discuss its financial performance on the basis of different reportable segments than the sectors currently presented and discussed in this Annual Report.
Further updates will be provided in the course of 2015.
74 Annual Report 2014
Table of Contents
Sector performance 6.2.6

New ways to fry
Fried food is somewhat of a tradition in Saudi Arabia, as it is in many countries. It has become so popular that almost a quarter of students eschew a healthy diet and are now classified as obese.
In addition, almost three quarters of over-40s in the country are overweight, which puts enormous strain on the medical system.

Dental assistant Mai Matbouli had to change her lifestyle because she was overweight and this was impacting on her health and ability to walk. So, as part of a unique experiment, Saudi medical professionals gave her a Philips Airfryer, along with other patients suffering from high blood pressure or diabetes, to see if using the Philips Airfryer could help her lose weight.
The Airfryer uses innovative Rapid Air Technology so that up to 80% less fat is used to cook dishes like French fries* – but with remarkably similar results. Nutritious recipes, inspired by a clever and meaningful kitchen tool such as the Airfryer, can transform the health of both kitchen novices and those who think of themselves as culinary experts.
| * | Compared to frying fresh fries in a conventional Philips deep-fat fryer |
Annual Report 2014 75
Table of Contents
Sector performance 6.3

“We are leading the industry transformation, capturing market opportunities and creating value for our customers. Going forward, Philips Lighting will become a stand-alone Lighting Solutions company. This will enable us to further capitalize on the fundamental changes taking place in the lighting industry and deliver innovations that create value and boost growth.” Eric Rondolat, CEO Philips Lighting
| • |
The lighting industry is undergoing a radical transformation. |
| • |
The lighting market is being driven by the transition to LED and digital applications. |
| • |
With our four-pillar strategy our goal is to create further value as a world-class lighting solutions provider. |
| • |
We continue on our Accelerate! journey to achieve operational excellence across our businesses. |
| • |
The separation process is fully under way and is expected to take approximately 12-18 months. |
6.3.1 Lighting business landscape
We are witnessing a number of trends and transitions that are affecting the lighting industry and changing the way people use and experience light.
We serve a large and attractive market that is driven by the need for more light, the need for energy-efficient lighting, and the need for digital lighting. The world’s population is forecast to grow from 7 billion today to over 9 billion people by 2050. At the same time, we are witnessing unprecedented urbanization, with over 70% of the world’s population expected to live in urban areas by 2050. These trends will increase demand for light. In addition, in the face of resource constraints and climate change, the world needs that light to be energy- efficient. At the same time, the lighting industry is moving from conventional to LED lighting, which is changing the way people use, experience and interact with light. LED technology, when combined with sensors, controls and software and linked into a network, is allowing light points to achieve a degree of intelligence. This is further opening up the possibility of new functionalities and services based on the transmission and analysis of data.
The lighting market is expected to grow by 3-5% per annum between 2013 and 2018. The majority of this growth will be driven by LED-based solutions and applications – heading towards a 60-65% share by 2018 – and growth geographies.
76 Annual Report 2014
Table of Contents
Sector performance 6.3.2
6.3.2 About Philips Lighting
Philips Lighting is a global market leader with recognized expertise in the development, manufacture and application of innovative, energy-efficient lighting products, systems and services that improve people’s lives. We have pioneered many of the key breakthroughs in lighting over the past 124 years, laying the basis for our current strength and leading position in the digital transformation.
We have a firm strategy which is based upon four pillars:
| • |
Lead the technological revolution – strengthening our leadership position through continued innovation in high-quality, energy-efficient and connected LED systems. |
| • |
Win in the consumer market – meeting consumers’ needs by building on our strength in lighting to deliver high-quality LED lamps and luminaires. We are pioneering and shaping the market with innovative products, such as the Hue connected home lighting system that can be controlled by a smartphone or tablet. In addition, we are expanding new channels to market including online, retailers in food and consumer electronics, and children’s retail. |
| • |
Drive innovation in professional lighting systems and services – providing integrated offerings for this market, which has been an early adopter of energy-efficient LED and now connected lighting technologies. |
| • |
Accelerate! – We have entered the next phase and will transition into a separate legal structure to further our position as a world-class provider of lighting solutions. We aim to fuel growth by strengthening our capabilities and simplifying our organizational structure to become faster and more agile. |
We aim to further invest in LED leadership while at the same time capitalizing on our broad portfolio, distribution and brand in conventional lighting by flexibly anticipating and managing the phase-out of conventional products.
We address people’s lighting needs across a full range of market segments. Indoors, we offer lighting solutions for homes, shops, offices, schools, hotels, factories and hospitals. Outdoors, we offer solutions for roads, streets, public spaces, residential areas and sports arenas, as well as solar-powered LED off-grid lighting. In addition, we address the desire for light-inspired experiences through architectural projects. Finally, we offer specific applications of lighting in specialized areas, such as horticulture and water purification.
In 2014, Philips Lighting spanned the entire lighting value chain – from light sources, luminaires, electronics and controls to application-specific systems and services – through the following businesses:
| • |
Light Sources & Electronics: LED, eco-halogen, (compact) fluorescent, high-intensity discharge and incandescent light sources, plus electronic and electromagnetic gear, modules and drivers |
| • |
Consumer Luminaires: functional, decorative, lifestyle, scene-setting luminaires |
| • |
Professional Lighting Solutions: controls and luminaires for city beautification, road lighting, sports lighting, office lighting, shop/hospitality lighting, industry lighting |
| • |
Automotive Lighting: car headlights and signaling* |
| • |
Lumileds: packaged LEDs* |
| * | On June 30, 2014, Philips announced the start of the process to combine the Lumileds and Automotive Lighting businesses into a stand-alone company and explore strategic options to attract capital from third-party investors for this combined business. The results of the combined Lumileds/Automotive Lighting components business are reported as discontinued operations. |
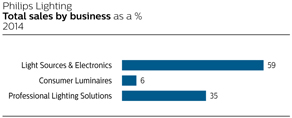
The Light Sources & Electronics business conducts its sales and marketing activities through the professional, OEM and consumer channels, the latter also being used by our Consumer Luminaires business. Professional Lighting Solutions is organized in a trade business (commodity products) and a project solutions business (project luminaires, systems and services).
The conventional lamps industry is highly consolidated, with GE and Osram as established key competitors. The LED lighting market, on the other hand, is very dynamic. We face new competition from Asia and new players from the semiconductor and building management sectors. The luminaires industry is fragmented, with our competition varying per region and per market segment.
Under normal economic conditions, Lighting’s sales are generally not materially affected by seasonality.
Philips Lighting has manufacturing facilities in some 25 countries in all major regions of the world, and sales organizations in more than 60 countries. Commercial activities in other countries are handled via distributors
Annual Report 2014 77
Table of Contents
Sector performance 6.3.2
working with our International Sales organization. Lighting has approximately 37,800 employees worldwide.
Regulatory requirements
Lighting is subject to significant regulatory requirements in the markets where it operates. These include the European Union’s Waste from Electrical and Electronic Equipment (WEEE), Restriction of Hazardous Substances (RoHS), Registration, Evaluation, Authorization and Restriction of Chemicals (REACH), Energy-using Products (EuP) and Energy Performance of Buildings (EPBD) directives.
6.3.3 2014 highlights
In 2014, our lighting innovations underlined our four-pillar strategy aimed at delivering even greater value for our customers and other stakeholders.
| • |
Philips is to provide the city of Madrid, Spain with 225,000 energy-efficient street lights. The renewal of the city’s entire street lighting system makes it the world’s largest street lighting upgrade to date. |
| • |
Groundbreaking innovations in LED bulbs include: elimination of the heat sink to make our SlimStyle range flat, so reducing costs; including an innovative lens for a sparkling light effect to mimic the light of an incandescent light bulb; creating CrispWhite, a technological innovation that makes white appear whiter and colors richer, an ideal lighting solution to display products at their best. |
| • |
In addition to these innovations for retrofit lamps, we created new concepts by integrating LEDs into carpets and ceiling panels. |
| • |
We continued to pioneer innovations in connected lighting, broadening applications in segments such as home, retail, office, sports and city lighting. For offices, we installed the first commercially available Power-over-Ethernet (PoE) connected lighting system, which connects office lighting fixtures to a building’s IT network. The lighting system gathers data about how space is being used, helping to reduce energy, heating and cleaning costs, for example, while allowing office workers to set their own personal lighting using their smartphone. |
| • |
In cities we continue to install our connected CityTouch lighting system. This intelligent lighting system enables cities to remotely control light points from a single, online user interface to deliver light where and when it is needed, ensuring people feel safe in well-lit streets even while reducing energy consumption. It can dim light points outside of peak hours, detect failures and provide smart lighting workflow support, reducing energy and maintenance costs. |
| • |
At the major sports events in Russia (Sochi) and Brazil, we lit up the majority of the stadiums. For Chelsea FC we installed a LED pitch lighting solution designed to provide players, fans and Television broadcasters with an outstanding visual experience. This was the world’s first LED pitch lighting to be used by a ‘top flight’ soccer club that meet the stringent requirements of broadcasters and sports federations. As the official lighting partner of FC Bayern München, Philips will transform the façade of the Allianz Stadium, into a dynamic and colorful LED display. |
| • |
With Philips Hue, our innovative connected lighting system for the home, we continue to transform the way we use light to personalize our homes and bring extraordinary experiences into the living room. We offer the most comprehensive portfolio of lighting products that can be connected to the smart home ecosystem: controls, connected luminaires, connected strips, connected lamps. We also team up with partners like Apple, Logitech, Deutsche Telekom, Syfy Universal and more to deliver a seamless experience, and the ever-growing number of apps developed by third parties will ensure further new experiences over time. |
| • |
Philips acquired 51% of General Lighting Company (GLC) in the Kingdom of Saudi Arabia. This company combines Philips’ expertise in LED technology and global supply base with GLC’s deep local market knowledge and strong commercial capabilities, making it the leading lighting player in the largest economy in the Middle East. |
6.3.4 2014 financial performance
| Philips Lighting | ||||||||||||
| Key data in millions of EUR unless otherwise stated | ||||||||||||
| 2012 - 2014 | ||||||||||||
|
|
|
|||||||||||
| 2012 | 2013 | 2014 | ||||||||||
|
|
|
|||||||||||
|
Sales |
7,303 | 7,145 | 6,869 | |||||||||
|
Sales growth |
||||||||||||
|
% increase (decrease), nominal |
11 | % | (2 | )% | (4 | )% | ||||||
|
% increase (decrease), comparable 1) |
4 | % | 1 | % | (3 | )% | ||||||
|
Adjusted IFO 1) |
69 | 580 | 293 | |||||||||
|
as a % of sales |
0.9 | % | 8.1 | % | 4.3 | % | ||||||
|
IFO |
(78 | ) | 413 | 185 | ||||||||
|
as a % of sales |
(1.1 | )% | 5.8 | % | 2.7 | % | ||||||
|
Net operating capital (NOC) 1) |
4,635 | 4,462 | 3,638 | |||||||||
|
Cash flows before financing activities 1) |
314 | 418 | 442 | |||||||||
|
Employees (in FTEs) |
41,757 | 38,671 | 37,808 | |||||||||
|
|
|
|||||||||||
| 1) |
For a reconciliation to the most directly comparable GAAP measures, see chapter 15, Reconciliation of non-GAAP information, of this report |
In 2014, sales amounted to EUR 6,869 million, 4% lower on a nominal basis. Excluding a 1% negative currency effect, comparable sales decreased by 3%. Light Sources & Electronics recorded mid-single-digit growth and Consumer Luminaires posted a high-single-digit decline, while Professional Lighting Solutions recorded low-single-digit growth.
From a geographical perspective, comparable sales in growth geographies showed a mid-single-digit decline, largely driven by decline across all businesses in China. As a result, sales in growth geographies decreased from 40% of total sales in 2013 to 39% in 2014. Comparable sales in mature geographies showed a low-single-digit
78 Annual Report 2014
Table of Contents
Sector performance 6.3.4
decline, with Western Europe and North America recording a low-single-digit decline and other mature geographies registering a mid-single-digit decline.
Sales of LED-based products grew to 34% of total sales, up from 25% in 2013, driven by Light Sources & Electronics and Professional Lighting Solutions. Sales of energy-efficient Green Products exceeded EUR 4,952 million, or 72% of sector sales.
Adjusted IFO declined from EUR 580 million, or 8.1% of sales, in 2013 to EUR 293 million, or 4.3% of sales in 2014. Restructuring and acquisition-related charges amounted to EUR 245 million in 2014, compared to EUR 83 million in 2013. 2014 also included a EUR 13 million past-service pension cost gain in the Netherlands and EUR 68 million of impairment and other charges related to industrial assets, while 2013 included a EUR 10 million past-service pension cost gain. The decrease in Adjusted IFO was mainly attributable to higher restructuring and acquisition-related charges and lower sales volume.
IFO amounted to EUR 185 million, or 2.7% of sales, which included EUR 106 million of amortization charges, mainly related to intangible assets at Professional Lighting Solutions.
Net operating capital decreased by EUR 824 million to EUR 3.6 billion. The decrease was mainly due to the reclassification of Lumileds and Automotive as assets held for sale in 2014, partly offset by positive currency impacts.
Cash flows before financing activities increased from EUR 418 million in 2013 to EUR 442 million, as lower earnings were partly offset by a reduction in working capital.
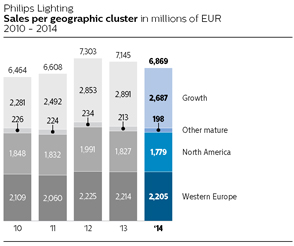

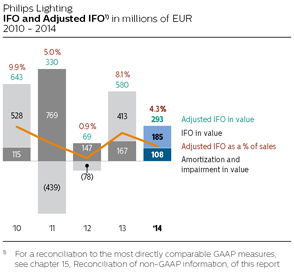
2013 financial performance
In 2013, sales amounted to EUR 7,145 million, 2% lower on a nominal basis. Excluding a 3% negative currency effect, comparable sales increased by 1%. Light Sources & Electronics recorded low-single-digit growth, while comparable sales at Professional Lighting Solutions were in line with 2012. Consumer Luminaires showed a low-single-digit decline.
The year-on-year comparable sales increase was substantially driven by growth geographies, which grew 7% on a comparable basis. As a proportion of total sales, sales in growth geographies increased to 40% of total Lighting sales, driven by solid mid-single-digit growth in China and India, compared to 39% in 2012. In mature geographies, sales showed a low-single-digit decline, largely due to lower demand in North America while Western Europe remained in line wth 2012.
Sales of LED-based products grew to 25% of total sales, up from 18% in 2012, driven by Light Sources & Electronics and Professional Lighting Solutions. Sales of energy-efficient Green Products amounted to EUR 5,037 million, or 71% of sector sales.
Annual Report 2014 79
Table of Contents
Sector performance 6.3.5
Adjusted IFO improved from EUR 69 million, or 0.9% of sales, in 2012 to EUR 580 million, or 8.1% of sales, in 2013. Restructuring and acquisition-related charges amounted to EUR 83 million in 2013, compared to EUR 309 million in 2012. The increase in Adjusted IFO was mainly attributable to higher operational earnings, as well as lower restructuring and acquisition-related charges. Additionally, 2012 included losses on the sale of industrial assets amounting to EUR 81 million.
IFO amounted to EUR 413 million, or 5.8% of sales, which included EUR 141 million of amortization charges, mainly related to intangible assets at Professional Lighting Solutions, and an impairment of EUR 32 million related to customer relationships at Consumer Luminaires. Additionally, a goodwill impairment charge of EUR 26 million was taken in the fourth quarter of 2013 due to reduced growth expectations.
Net operating capital decreased by EUR 173 million to EUR 4.5 billion, primarily due to currency effects, partly offset by a reduction in restructuring provisions.
Cash flows before financing activities increased from EUR 314 million in 2012 to EUR 418 million, mainly due to higher cash earnings and lower net capital expenditures, partly offset by higher outflows for working capital.
6.3.5 Delivering on EcoVision sustainability commitments
In 2014, Philips Lighting invested EUR 255 million in Green Innovation, compared to EUR 223 million in 2013 (excluding Lumileds and Automotive at EUR 105 million and EUR 104 million respectively). Investments continue to be made in energy-saving technologies such as LED and connected lighting systems and services. In January, Philips announced the introduction of the new InstantFit LED T8, which reduces costs for facility managers replacing fluorescent tube lighting with energy-efficient LED technology, known as LED tube lamps (TLEDs). TLEDs use up to 40% less energy compared to linear fluorescent tube lighting and require less maintenance due to their long lifetime. If current fluorescent lighting was replaced by TLED lamps globally the energy saving potential would be equivalent to the output of 210 medium-sized power plants.
The energy efficiency of the total product portfolio increased slightly from 40.1 lumens per watt in 2013 to 40.5 lumens per watt in 2014 due to a volume shift in the portfolio. Within the framework of the Green Operations 2015 program, Philips Lighting has reduced its carbon footprint in manufacturing (scope 1 and 2 emissions) by approximately 40% since the baseline year of 2007. In 2014, 81% of our total industrial waste was re-used as a result of recycling.
6.3.6 2015 and beyond
In September 2014 Philips announced its plan to sharpen its strategic focus by establishing two stand-alone companies focused on the HealthTech and Lighting Solutions opportunities. To achieve this transformation, Philips started the process to carve out its Lighting business into a separate legal structure and will consider various options for ownership structures with direct access to capital markets.
As a stand-alone company, the Lighting Solutions business will be better positioned to capture the value which is shifting from individual products to connected LED lighting systems and services.
Philips is also in discussion with external investors for the combined Lumileds and Automotive Lighting businesses and expects to complete a transaction in the first half of 2015. Therefore, the combined businesses of Lumileds and Automotive are reported as discontinued operations in the Consolidated statements of income and cash flows.
From an external financial reporting perspective, it should be noted that the planned organizational changes will require Philips to transition to a new reporting structure during the course of 2015. At that stage, and in view of applicable IFRS requirements, Philips will report and discuss its financial performance on the basis of different reportable segments than the sectors currently presented and discussed in this Annual Report.
Further updates will be provided in the course of 2015.
80 Annual Report 2014
Table of Contents
Sector performance 6.3.6

Putting a bridge back on the map
The port city of Corpus Christi, Texas, has always been dominated by its magnificent bridge across the bay. But as times got tougher, the lights on the bridge went out and a nocturnal landmark disappeared.
Happily it’s now back – and, with the help of thousands of energy-saving and environmentally-friendly LEDs, it’s infinitely more striking than ever before. An exciting new project to re-illuminate the structure, in which the city authorities worked in partnership with Philips, gave the Corpus Christi Harbor Bridge a makeover by treating it as a living work of art.
They didn’t just demonstrate how LED lighting in cities can transform a space – they created a vibrant attraction that allowed this industrial design jewel to show itself in a new, 21st century guise. Multi-colored strip lights now pick out the contours of the bridge in a beautiful, ever-changing, ultra-modern display that has become a tourist attraction in its own right and revitalized the area.
“Philips had a very innovative design department. They’ve been here every day to help us through the process,” says Terry Orf, Senior Architect at Naismith Engineers.
Because the locals love the Corpus Christi Harbor Bridge so much, it has even boosted the fortunes of one local photographer, who now uses the bridge as a dramatic outdoor studio.

Annual Report 2014 81
Table of Contents
Sector performance 6.4
6.4 Innovation, Group & Services

“In 2014, we continued to strengthen our innovation process, becoming much more efficient, effective and faster. We are improving our ability to innovate end-to-end and increasing our focus on digital innovation. By using technology, data and algorithms we are making our innovations even more relevant and meaningful for people on an individual level.” Jim Andrew, Chief Innovation & Strategy Officer
| • |
Philips Research celebrated its 100 th anniversary in 2014 – a century-long track record of innovations that improved the world. |
| • |
Philips established its Africa Innovation Hub in Nairobi, Kenya, enabling the co-creation of locally relevant solutions, business models and partnerships to address key challenges in the continent. |
| • |
Philips rose to number 3 global position of patent applicants at the European Patent Office. |
| • |
For Philips Design, 2014 was a record-breaking year with 137 design awards. |
Introduction
Innovation, Group & Services comprises the activities of Philips Group Innovation, Group headquarters, including country and regional management, and certain costs of pension and other post-retirement benefit plans. Additionally, the global shared business services for procurement, finance, human resources, IT and real estate are reported in this sector.
6.4.1 About Innovation, Group & Services
Philips Group Innovation
At Philips, our innovation efforts are closely aligned with our business strategy. Philips Group Innovation (PGI) feeds the innovation pipeline, enabling its business partners – the Philips operating businesses – to create new business options through new technologies, new business creation, and intellectual property development. Focused research and development improvement activities drive time-to-market efficiency and increased innovation effectiveness.
PGI boosts innovation from idea to product as co-creator and strategic partner for the Philips businesses and complementary Open Innovation ecosystem partners. It does so through cooperation between research, design, marketing, strategy and businesses in interdisciplinary teams along the innovation chain, from front-end to first-of-a-kind product development. In
82 Annual Report 2014
Table of Contents
Sector performance 6.4.1
addition, PGI opens up new value spaces beyond the direct scope of current businesses (Emerging Business Areas), manages the Company-funded R&D portfolio, and creates synergy for cross-sector initiatives.
PGI encompasses Philips Research, Philips Innovation Services, the Philips Innovation Campus in Bangalore, the Philips Innovation Center Shanghai, Philips Design, the Philips Healthcare Incubator, and the Emerging Business Areas. In total, PGI employs some 5,000 professionals around the globe.
PGI actively participates in Open Innovation through relationships with academic and industrial partners, as well as via European and regional projects, in order to improve innovation effectiveness and efficiency, capture and generate new ideas, enhance technology partnering capabilities, and share the related financial exposure. The High Tech Campus in Eindhoven (Netherlands), the Philips Innovation Campus in Bangalore (India), and the Philips Innovation Center in Shanghai (China) are prime examples of environments enabling Open Innovation.
Through Open Innovation, Philips also seeks to ensure proximity of innovation activities to growth geographies. Underlining its commitment to locally relevant innovations, Philips established an Innovation Hub for Africa in Nairobi (Kenya), which is enabling the co-creation of new solutions, business models and partnerships to address key challenges in the continent and provide meaningful innovations. This innovation hub cooperates closely with local universities, NGOs and start-ups. As a result, the first Philips Community Life Center was opened in Kenya, which provides access to healthcare, enables social, educational and commercial activities after dark, and enhances neighborhood safety and security.
A joint initiative between PGI, IT and multiple Philips businesses aims at speeding up digital innovation to create personalized solutions. One of the results in 2014 was that Philips, together with Radboud University in Nijmegen, the Netherlands, created the first wearable diagnostic prototype for patients with a chronic obstructive pulmonary disease (COPD) that feeds data collected from patients at home to clinicians through the Philips HealthSuite Digital Platform.
Philips Research
Philips Research, which celebrated its 100th anniversary in 2014, is the main partner of Philips’ operating businesses for technology-enabled innovation. It creates new technologies and the related intellectual property (IP), which enables Philips to grow in businesses and markets. Together with the businesses and the markets, Philips Research co-creates innovations to strengthen the core businesses as well as to open up new opportunities in adjacent business areas. Research’s innovation pipeline is aligned with Philips’ vision and strategy and inspired by unmet customer needs as well as major societal challenges.
At Light & Building, the world’s leading trade fair for lighting and building services technology, Philips launched Power-over-Ethernet connected lighting. This ground-breaking lighting system enables the connection of office lighting fixtures to a building’s IT network, via standard network cables. The lighting system acts as an information pathway, enabling workers to control and access other building services via their smartphones and reduces the cost of ownership for building owners.
In the area of Healthcare, Philips Research co-created with John Hopkins University and Hospital a new 3D MRI-based technology to assess liver tumor response after chemo-embolization. This 3D technology can precisely measure living and dying tumor tissue to quickly show whether highly toxic chemotherapy – delivered directly through a tumor’s blood supply – is working.
Together with Consumer Lifestyle, several digital propositions for connected products have been co-created, such as the Smart Air Purifier, which provides insights into the cleanness of the air via an app. Another example is the iGrooming app, which provides consumers with a style preview and advice for shaving.
Philips and Eindhoven University of Technology (TU/e) announced a strategic cooperation aimed at accelerating the exploration and development of digital innovations in healthcare, lighting and data science.
Philips Innovation Services
Philips Innovation Services offers a wide range of technical and industry consulting services in development, industrialization and supply chain. Innovation Services’ skills are leveraged by Philips Businesses, Markets and Philips Group Innovation in all regions and in a wide range of projects across the end-to-end value chain.
Examples of recent contributions by Innovation Services are: the Vereos PET/CT scanner; the Smart Air Purifier; the SlimStyle LED lamp and Luminous Carpets. Innovation Services also supports Philips’ drive to deliver innovations that are locally relevant, such as a low-cost LED lamp for Africa.
Philips Innovation Campus Bangalore
Philips Innovation Campus Bangalore (PIC) hosts activities from most of our operating businesses, Philips Research, Design, IP&S, and IT. Healthcare is the largest R&D organization at PIC, with activities in Imaging Systems, Patient Care & Monitoring Solutions, and Healthcare Informatics, Solutions & Services. While PIC originally started as a software center, it has since developed into a broad product development center (including mechanical, electronics, and supply chain
Annual Report 2014 83
Table of Contents
Sector performance 6.4.1
capabilities). Several Healthcare businesses have also located business organizations focusing on growth geographies at PIC.
Philips Innovation Center Shanghai
Philips Research China is Philips’ second-largest research lab globally. The organization has staff working in the Healthcare, Consumer Lifestyle and Lighting programs and cooperates extensively with Philips labs across the world. Research China anchors our broader commitment to our Shanghai R&D campus as an innovation hub.
Philips Design
Philips Design partners with the Philips businesses, Group Innovation, and functions to ensure that our innovations are people-focused, meaningful and locally relevant, and that the Philips brand experience is differentiating, consistent and drives customer preference across all its touch-points.
Philips Design is a global function within the company, comprised of a Group Design team that leads the function and develops new competencies, and fully integrated sector Design teams ensuring close alignment with the Philips businesses. The organization is made up of designers across various disciplines, as well as psychologists, ergonomists, sociologists and anthropologists – all working together to understand people’s needs and desires and to translate these into relevant solutions and experiences that create value for people and business. Design’s forward-looking exploration projects deliver vital insights for new business development.
Together with the Healthcare Transformation Services business, Philips Design is developing in-depth consulting relationships with our Healthcare partners. The Experience Design team recently supported the complete renovation of the Infusion Center for cancer patients at the Broward Health Medical Center in Florida, USA, in order to improve the experience for patients and optimize workflow for staff. The successful design outcome was recognized with an Avatar Patient Experience award and the Healthcare Design award in 2014.
Philips Design is widely recognized as a world leader in design, and 2014 was a record-breaking year with 137 design awards. Especially worth mentioning is the impressive haul of 47 iF awards and 39 Red Dot Awards, the latter including a ‘best of the best’ award for the Ambient Experience IBA Proton Therapy Suite installed at the Willis-Knighton Cancer Center in Shreveport, Louisiana (US).
Philips Healthcare Incubator
The Philips Healthcare Incubator is a business group dedicated to identifying, developing and bringing to market breakthrough products and services that drive the future of healthcare. One example is by empowering pathologists with a complete connected digital pathology solution that is designed to optimize productivity and workflow, and ultimately to improve the quality of diagnosis.
Another proposition called Minicare provides direct diagnostic information at the patients’ bedside, enabling physicians to make medical decisions on the spot. Based on innovative technologies, we have designed easy-to-use, patient-centric IVD (in-vitro diagnostics)-enabled solutions and connected services that have the potential to revolutionize health management and improve existing workflows.
In the third quarter of 2014, Philips completed the acquisition of Unisensor, a start-up company offering technology which we plan to leverage for miniaturized, mobile diagnostics solutions.
Philips Emerging Business Areas
Philips Emerging Business Areas identify, create and grow new activities that are outside the scope of the current operating businesses. The portfolio is managed on a venturing basis. The opportunities and business models identified by the individual new business activities determine the approach to commercial partnerships, sourcing of technology, and platforms to reach customers. Current examples of successful new solution businesses or enablers for these include Horticulture, Light for Health, Photonics, and Wearable Sensing Technologies.
Philips is ushering in a new era of indoor farming with LED ‘light recipes’ that help optimize crop yield and quality. Indoor farms grow vegetables sustainably and locally in areas where traditional field farming is not feasible. Philips Horticulture LED solutions are being applied on a large scale at forward-thinking growers worldwide like Green Sense Farms near Chicago, the city farm of Osaka Prefecture University, and the tomato nurseries Wim Peters in the Netherlands and R&L Holt in the UK.
Leveraging its advanced understanding of the biological effects of light, a team of Philips Light for Health researchers, collaborating with leading research institutions and hospitals, has developed a number of products that feature LED light and offer proven medical benefits.
Philips Photonics is a global leader in VCSEL technology and designs, manufactures, markets and sells VCSEL-based solutions for data communications, consumer and industrial applications. VCSELs are LED- like lasers enabling applications like gesture control, environmental sensing, precise scene illumination for surveillance cameras, and ultra-fast data communication. Philips Photonics has enabled the introduction of laser-based PC mice and high-bit-rate active optical cables, as well as introducing VCSEL- based solutions for industrial processing of plastic materials.
84 Annual Report 2014
Table of Contents
Sector performance 6.4.1
Philips Wearable Sensing Technologies (WeST) delivers accurate and reliable continuous personal health measurements through modules specifically designed for integration in wearable devices. The first-generation module fueled a new product category of heart rate-monitoring sport watches that work without a chest-strap.
Philips Intellectual Property & Standards
Philips IP&S proactively pursues the creation of new intellectual property in close co-operation with Philips’ operating businesses and Philips Group Innovation. IP&S is a leading industrial IP organization providing world-class IP solutions to Philips’ businesses to support their growth, competitiveness and profitability.
Philips’ IP portfolio currently consists of approximately 14,200 patent families (68,400 patent rights), 2,780 trademark families (46,600 trademark rights), 3,650 design families (91,400 design rights) and 2,130 domain name families (4,850 domain names). Philips filed 1,680 patent applications in 2014, with a strong focus on the growth areas in health and well-being.
IP&S participates in the setting of standards to create new business opportunities for the Philips operating businesses. A substantial portion of revenue and costs is allocated to the operating businesses. Philips believes its business as a whole is not materially dependent on any particular patent or license, or any particular group of patents and licenses.
Group and Regional Costs
Group and Regional organizations support the creation of value, connecting Philips with key stakeholders, especially our employees, customers, government and society. These organizations include the Executive Committee, Brand Management, Sustainability, New Venture Integration, the Group functions related to strategy, human resources, legal and finance, as well as country and regional management.
Accelerate! investments
Innovation, Group & Services plays an important role in the Accelerate! program, notably by helping to improve the end-to-end value chain. The End-to-End approach consists of three core processes: Idea-to-Market, Market-to-Order, and Order-to-Cash. Innovation, Group & Services supports a more efficient and effective Idea-to-Market process in five focal areas: speeding up time-to-market, portfolio optimization, driving breakthrough innovation, improving innovation competencies, and strengthening the position of Philips as an innovation leader.
6.4.2 2014 financial performance
|
Philips Innovation, Group & Services |
||||||||||||
| Key data in millions of EUR unless otherwise stated | ||||||||||||
|
2012 - 2014 |
||||||||||||
|
|
|
|||||||||||
| 2012 | 2013 | 2014 | ||||||||||
|
|
|
|||||||||||
|
Sales |
629 | 665 | 605 | |||||||||
|
Sales growth |
||||||||||||
|
% increase (decrease), nominal |
(8 | )% | 6 | % | (9 | )% | ||||||
|
% increase (decrease), comparable 1) |
(6 | )% | 0 | % | (12 | )% | ||||||
|
Adjusted IFO of: |
||||||||||||
|
Group Innovation |
(149 | ) | (134 | ) | (197 | ) | ||||||
|
IP Royalties |
253 | 312 | 299 | |||||||||
|
Group and regional costs |
(161 | ) | (175 | ) | (205 | ) | ||||||
|
Accelerate! investment |
(128 | ) | (137 | ) | (131 | ) | ||||||
|
Pensions |
24 | (41 | ) | (12 | ) | |||||||
|
Service units and other |
(587 | ) | (124 | ) | (415 | ) | ||||||
|
|
|
|||||||||||
|
Adjusted IFO 1) |
(748 | ) | (299 | ) | (661 | ) | ||||||
|
IFO |
(756 | ) | (302 | ) | (675 | ) | ||||||
|
Net operating capital (NOC) 1) |
(4,500 | ) | (2,922 | ) | (3,718 | ) | ||||||
|
Cash flows before financing activities 1) |
(851 | ) | (2,140 | ) | (1,586 | ) | ||||||
|
Employees (in FTEs) |
11,697 | 12,703 | 13,853 | |||||||||
|
|
|
|||||||||||
| 1) |
For a reconciliation to the most directly comparable GAAP measures, see chapter 15, Reconciliation of non-GAAP information, of this report |
In 2014, sales amounted to EUR 605 million, and were mainly related to IP Royalty income and our OEM Remote Control business. Sales were EUR 60 million lower than in 2013, mainly due to lower income from Group Innovation and IP Royalties.
Adjusted IFO amounted to a loss of EUR 661 million, compared to a loss of EUR 299 million in 2013. In 2014, Adjusted IFO included EUR 110 million of restructuring and acquisition-related charges, EUR 244 million of provisions related to various legal matters and a EUR 27 million past-service pension gain in the Netherlands. 2013 Adjusted IFO included EUR 3 million of restructuring and acquisition-related charges and a pension settlement loss of EUR 25 million.
Adjusted IFO at Group Innovation was a EUR 63 million higher net cost than in 2013, mainly due to higher restructuring charges and higher investments in emerging business areas.
Adjusted IFO at Group and Regional Overhead costs were EUR 30 million lower than in 2013, mainly due to higher restructuring costs.
Accelerate! investments amounted to EUR 131 million in 2014, and include investments in IT infrastructure, internal departments and external consultancy dedicated to the Accelerate! program.
Adjusted IFO at Pensions amounted to a net cost of EUR 12 million, and represent costs related to deferred pensioners covered by company plans. In 2013, Pensions amounted to a net cost of EUR 41 million and
Annual Report 2014 85
Table of Contents
Sector performance 6.4.2
was impacted by a EUR 31 million settlement loss arising from a lump-sum offering to terminated vested employees in our US pension plan.
Adjusted IFO at Service Units and Other decreased from a loss of EUR 124 million in 2013 to a loss of EUR 415 million in 2014. The decrease was largely driven by EUR 243 million of charges related to legal matters.
Net operating capital decreased to negative EUR 3.7 billion, mainly due to an increase in working capital.
Cash flows before financing activities improved from an outflow of EUR 2,140 million in 2013 to an outflow of EUR 1,586 million.
2013 financial performance
In 2013, sales amounted to EUR 665 million, EUR 36 million higher than in 2012, due to higher royalty income.
Adjusted IFO in 2013 amounted to a loss of EUR 299 million, compared to a loss of EUR 748 million in 2012. In 2012, Adjusted IFO included the EUR 313 million impact of the European Commission fine and provisions related to various legal matters totaling EUR 132 million. Restructuring and acquisition-related charges amounted to EUR 3 million in 2013, compared to EUR 56 million in 2012. 2013 Adjusted IFO also included a past-service pension settlement loss of EUR 25 million, which was recorded across Group Innovation, IP Royalties, Group and Regional Overheads and Service Units and Others.
Adjusted IFO at Group Innovation was a EUR 15 million lower net cost than in 2012, mainly due to lower restructuring charges.
Group & Regional Overhead costs were EUR 14 million lower than in 2012, mainly due to increased costs related to our new brand positioning.
Accelerate! investments amounted to EUR 137 million in 2013, and include investments in IT infrastructure, internal departments and external consultancy dedicated to the Accelerate! program.
Pensions amounted to a net cost of EUR 41 million, and represent costs related to deferred pensioners covered by company plans. In 2013, Adjusted IFO was impacted by a EUR 31 million settlement loss arising from a lump-sum offering to terminated vested employees in our US pension plan. In 2012, Adjusted IFO was positively impacted by a EUR 25 million gain from a change in a medical retiree plan.
Adjusted IFO at Service Units and Other increased from a loss of EUR 599 million in 2012 to a loss of EUR 165 million. In 2012, Adjusted IFO included the EUR 313 million impact of the European Commission fine and provisions related to various legal matters totaling EUR 132 million, as well as a gain on the sale of the High Tech Campus of EUR 37 million. Excluding these impacts, the increase in Adjusted IFO in 2013 was mainly due to lower restructuring costs as well as releases of environmental provisions.
Net operating capital increased to negative EUR 2.9 billion in 2013, primarily related to the payment of the European Commission fine, a decrease in pension liabilities, an increase in the value of currency hedges as well as a reclassification of real estate assets from the sectors to the Service Units.
Cash flows before financing activities decreased from an outflow of EUR 851 million in 2012 to an outflow of EUR 2,140 million, mainly due to the payment of the European Commission fine and lower cash inflows from the sale of fixed assets.
6.4.3 2015 and beyond
In September 2014 Philips announced its plan to sharpen its strategic focus by establishing two stand-alone companies focused on the HealthTech and Lighting Solutions opportunities.
The establishment of the two stand-alone companies will also involve the split and allocation of the current Innovation, Group & Services sector to each company in 2015. This means that in the course of 2015 the IG&S sector as currently described in this Annual Report will disappear and no longer be presented as a separate segment for reporting purposes.
Further updates will be provided in the course of 2015.
86 Annual Report 2014
Table of Contents
Risk management 7
7.1 Our approach to risk management and business control
The following section presents an overview of Philips’ approach to risk management and business controls and a description of the nature and the extent of its exposure to risks. Philips’ risk management focuses on the following risk categories: Strategic, Operational, Compliance and Financial risks. These categories are further described in section 7.2, Risk categories and factors, of this report. The risk overview highlights the main risks known to Philips, which could hinder it in achieving its strategic and financial business objectives. The risk overview may, however, not include all the risks that may ultimately affect Philips. Some risks not yet known to Philips, or currently believed not to be material, could ultimately have a major impact on Philips’ businesses, objectives, revenues, income, assets, liquidity or capital resources.
All oral and written forward-looking statements made on or after the date of this Annual Report and attributable to Philips are expressly qualified in their entirety by the factors described in the cautionary statement included in Forward-looking statements, of this report and the overview of risk factors described in section 7.2, Risk categories and factors, of this report.
Risk management and controls forms an integral part of the business planning and review cycle. The company’s risk and control policy is designed to provide reasonable assurance that objectives are met by integrating management control into the daily operations, by ensuring compliance with legal requirements and by safeguarding the integrity of the company’s financial reporting and its related disclosures. It makes management responsible for identifying the critical business risks and for the implementation of fit-for-purpose risk responses. Philips’ risk management approach is embedded in the areas of corporate governance, Philips Business Control Framework and Philips General Business Principles.
Corporate governance
Corporate governance is the system by which a company is directed and controlled. Philips believes that good corporate governance is a critical factor in achieving business success. Good corporate governance derives from, amongst other things, solid internal controls and high ethical standards.
The quality of Philips’ systems of business controls and the findings of internal and external audits are reported to and discussed by the Audit Committee of the Supervisory Board. Internal auditors monitor the quality of the business controls through risk-based operational audits, inspections of financial reporting controls and compliance audits. Audit committees at group level (Group, Finance, Innovation and IT), at Global Market level and at Business level (Healthcare, Lighting, Consumer Lifestyle) meet quarterly to address weaknesses in the business controls infrastructure as reported by internal and external auditors or revealed by self-assessment of management, and to take corrective action where necessary. These audit committees are also involved in determining the desired company-wide internal audit planning as approved by the Audit Committee of the Supervisory Board. An in-depth description of Philips’ corporate governance structure can be found in chapter 11, Corporate governance, of this report.
Philips Business Control Framework
The Philips Business Control Framework (BCF) sets the standard for risk management and business control in Philips. The objectives of the BCF are to maintain integrated management control of the company’s operations, in order to ensure the integrity of the financial reporting, as well as compliance with laws and regulations. Philips has designed its BCF based on the “Internal Control-Integrated Framework (2013)” established by the Committee of Sponsoring Organizations of the Treadway Commission (COSO).
As part of the BCF, Philips has implemented a global standard for internal control over financial reporting (ICS). The ICS, together with Philips’ established accounting procedures, is designed to provide reasonable assurance that assets are safeguarded, that the books and records properly reflect transactions necessary to permit preparation of financial statements, that policies and procedures are carried out by qualified personnel and that published financial statements are properly prepared and do not contain any material misstatements. ICS has been deployed in all material reporting units, where business process owners perform an extensive number of controls, document the results each quarter, and take corrective action where necessary. ICS supports business and functional management in a quarterly cycle of assessment and monitoring of its control environment. The findings of management’s evaluation are reported to the Executive Committee and the Supervisory Board quarterly.
As part of the Annual Report process, management’s accountability for business controls is enforced through the formal issuance of a Statement on Business Controls and a Letter of Representation by business and functional management to the Executive Committee. Any deficiencies noted in the design and operating effectiveness of controls over financial reporting which were not completely remediated are
Annual Report 2014 87
Table of Contents
Risk management 7.1
evaluated at year-end by the Executive Committee. The Executive Committee’s report, including its conclusions regarding the effectiveness of internal control over financial reporting, can be found in section 12.1, Management’s report on internal control, of this report.
Philips General Business Principles
The Philips General Business Principles (GBP) set the standard for our core behavior – ‘Acting with integrity’ – and they apply to the behavior of individual employees as well as to corporate actions. They incorporate the fundamental principles adopted within Philips for conducting business. The GBP have been revised in 2014 to make the GBP more accessible to Philips employees and to reflect certain changes in the business environment.
The GBP form an integral part of virtually all labor contracts. It is the responsibility of each employee to live up to our GBP. In addition, the management of each business unit signs off on compliance with the GBP, with this confirmation forming part of the annual Statement on Business Controls.
As part of the Philips Business Control Framework, a GBP self-assessment process is fully embedded in an automated workflow application (ICS), which helps management to monitor the internal controls. With the GBP self-assessment forming part of ICS, GBP compliance necessarily forms part of management’s quarterly ICS/SOx (Sarbanes-Oxley) monitoring process. Non-compliance issues are highlighted and, if significant, they are reported to the Board of Management/Executive Committee through the Quarterly Certification Statement process.
Managers are viewed as the principal point of contact in cases where employees wish to raise a concern. To further facilitate this process, the GBP include a reporting policy, standardized complaint reporting and a formal escalation procedure. The Philips Ethics Line platform enables employees to file a complaint by telephone in their native language. Additionally, concerns can now also be raised using an online reporting form, a facility that is available as part of the Philips Ethics Line. Every country organization and all main production sites are supported by a GBP Compliance Officer. This network of Compliance Officers is supervised by the General Business Principles Review Committee. Alleged violations of the GBP, which are either filed directly through the Philips Ethics Line or raised through a GBP Compliance Officer, are registered consistently in a single database and are investigated in accordance with standardized investigation procedures.
Since 2013 it has become mandatory for all executives to sign off on the General Business Principles. To drive the practical deployment of the General Business Principles, more detailed underlying policies have been developed. Where necessary, these policies can be adapted to reflect ongoing (regulatory) developments, both internal and external. In addition, there are separate Codes of Ethics that apply to employees working in specific areas of our business, i.e. the Procurement Code of Ethics and the Financial Code of Ethics. Details can be found at www.philips.com/gbp .
The relevant employees sign off on the Financial and the Procurement Codes of Ethics each year to confirm that they are aware of, and will comply with, the respective codes.
Financial Code of Ethics
The Company recognizes that its businesses have responsibilities within the communities in which they operate. The Company has a Financial Code of Ethics which applies to the CEO (the principal executive officer) and CFO (the principal financial and principal accounting officer), and to the heads of the Group Control, Group Treasury, Group Fiscal and Group Internal Audit departments of the Company. The Company has published its Financial Code of Ethics within the investor section of its website located at www.philips.com. No changes were considered necessary and no changes have been made to the Financial Code of Ethics since its adoption and no waivers have been granted therefrom to the officers mentioned above in 2014.
For more information, please refer to sub-section 5.2.7, Philips’ General Business Principles renewed, of this report.
88 Annual Report 2014
Table of Contents
Risk management 7.2
7.2 Risk categories and factors
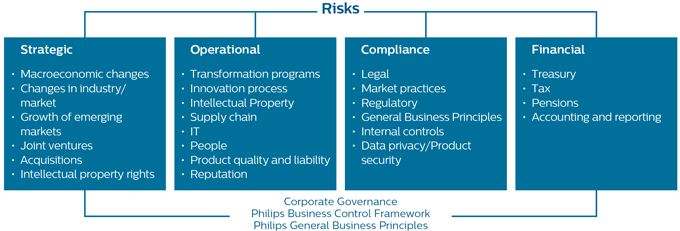
Taking risks is an inherent part of entrepreneurial behavior. A structured risk management process allows management to take risks in a controlled manner. In order to provide a comprehensive view of Philips’ business activities, risks and opportunities are identified in a structured way combining elements of a top-down and bottom-up approach. Risks are reported on a regular basis as part of the ‘Business Performance Management’ process. All relevant risks and opportunities are prioritized in terms of impact and likelihood, considering quantitative and/or qualitative aspects. The bottom-up identification and prioritization process is supported by workshops with the respective management at Business, Market and Group Function level. The top-down element allows potential new risks and opportunities to be discussed at management level and included in the subsequent reporting process, if found to be applicable. Reported risks and opportunities are analyzed for potential cumulative effects and are aggregated at Business, Market and Group level. Philips has a structured risk management process to address different risk categories: Strategic, Operational, Compliance and Financial risks.
Strategic risks and opportunities may affect Philips’ strategic ambitions. Operational risks include adverse unexpected developments resulting from internal processes, people and systems, or from external events that are linked to the actual running of each business (examples are solution and product creation, and supply chain management). Compliance risks cover unanticipated failures to implement, or comply with, appropriate laws, regulations, policies and procedures. Within the area of Financial risks, Philips identifies risks related to Treasury, Accounting and reporting, Pensions and Tax. Philips does not classify these risk categories in order of importance. Separation risk is covered in section 7.7, Separation risk, of this report.
Philips describes the risk factors within each risk category in order of Philips’ current view of expected significance, to give stakeholders an insight into which risks and opportunities it considers more prominent than others at present. The risk overview highlights the main risks and opportunities known to Philips, which could hinder it in achieving its strategic and financial business objectives. The risk overview may, however, not include all the risks that may ultimately affect Philips. Describing risk factors in their order of expected significance within each risk category does not mean that a lower listed risk factor may not have a material and adverse impact on Philips’ business, strategic objectives, revenues, income, assets, liquidity, capital resources or achievement of Philips’ 2016 goals. Furthermore, a risk factor described after other risk factors may ultimately prove to have more significant adverse consequences than those other risk factors. Over time Philips may change its view as to the relative significance of each risk factor.
As Philips’ business is global, its operations are exposed to economic and political developments in countries across the world that could adversely impact its revenues and income.
Philips’ business environment is influenced by political and economic conditions in the domestic and global markets. Philips experienced changes in macro economic development in various geographies during 2014 in particular in China where customer demand was negatively affected by the lowest level of economic growth in the last 24 years. The monetary easing policy in Japan did not result in the targeted economic growth. Macro economic conditions in the Eurozone weakened with increasing concerns about lack of growth and potential deflation, adversely affecting the recovery of southern European economies and reintroducing concerns about the stability of the Eurozone and the euro. On the other the hand the US economy provided a more favorable environment with increasing macro economic growth. Significant downward movement of the oil price negatively affected the currencies of countries depending on oil and gas revenues. In particular for Russia the lower oil price in combination with the political conflict with Ukraine had a significant negative impact on the Russian economy and currency.
Annual Report 2014 89
Table of Contents
Risk management 7.3
The very disparate macroeconomic outlook for the main geographies, political conflicts and the unknown potential impact of new initiatives in Eurozone monetary policy continues to provide uncertainty on the levels of capital expenditures in general, unemployment levels and consumer and business confidence, which could adversely affect demand for products and services offered by Philips.
General political developments in 2014 were unfavorable for the business environment due to increasing political conflicts and terrorism, e.g. the financial/economic sanctions imposed on Russia and the response from the Russian government. Numerous other factors, such as sustained lower levels of energy and raw material prices, as well as global political conflicts in the Middle East, Russia and Ukraine and other regions, could continue to impact macroeconomic factors and the international capital and credit markets. Economic and political uncertainty may have a material adverse impact on Philips’ financial condition or results of operations and can also make it more difficult for Philips to budget and forecast accurately. Philips may encounter difficulty in planning and managing operations due to the lack of adequate infrastructure and unfavorable political factors, including unexpected legal or regulatory changes such as foreign exchange import or export controls, increased healthcare regulation, nationalization of assets or restrictions on the repatriation of returns from foreign investments. Given that growth geographies are becoming increasingly important in Philips’ operations, the above-mentioned risks are also expected to grow and could have a material adverse effect on Philips’ financial condition and operating results.
Philips may be unable to adapt swiftly to changes in industry or market circumstances, which could have a material adverse impact on its financial condition and results.
Fundamental shifts in the industry, like the transition from traditional lighting to LED lighting, may drastically change the business environment. If Philips is unable to recognize these changes in good time, is late in adjusting its business models, or if circumstances arise such as pricing actions by competitors, then this could have a material adverse effect on Philips’ growth ambitions, financial condition and operating result.
Philips’ overall performance in the coming years is dependent on realizing its growth ambitions in growth geographies.
Growth geographies are becoming increasingly important in the global market. In addition, Asia is an important production, sourcing and design center for Philips. Philips faces strong competition to attract the best talent in tight labor markets and intense competition from local companies as well as other global players for market share in growth geographies. Philips needs to maintain and grow its position in growth geographies, invest in local talents, understand developments in end-user preferences and localize the portfolio in order to stay competitive. If Philips fails to achieve this, then this could have a material adverse effect on growth ambitions, financial condition and operating result.
The growth ambitions of Philips may be adversely affected by economic volatility inherent in growth geographies and the impact of changes in macroeconomic circumstances on growth economies.
Philips may not control joint ventures or associated companies in which it invests, which could limit the ability of Philips to identify and manage risks.
Philips has invested or will invest in joint ventures or associated companies in which Philips will have a non-controlling interest. In these cases, Philips has limited influence over, and limited or no control of, the governance, performance and cost of operations of joint ventures or associated companies. Some of these joint ventures or associated companies may represent significant investments. The joint ventures and associated companies that Philips does not control may make business, financial or investment decisions contrary to Philips’ interests or decisions different from those, which Philips itself may have made. Additionally, Philips partners or members of a joint venture or associated company may not be able to meet their financial or other obligations, which could expose Philips to additional financial or other obligations, as well as have a material adverse effect on the value of its investments in those entities or potentially subject Philips to additional claims.
Acquisitions could expose Philips to integration risks and challenge management in continuing to reduce the complexity of the company.
Philips’ acquisitions may continue to expose Philips in the future to integration risks in areas such as sales and service force integration, logistics, regulatory compliance, information technology and finance. Integration difficulties and complexity may adversely impact the realization of an increased contribution from acquisitions. Philips may incur significant acquisition, administrative and other costs in connection with these transactions, including costs related to the integration of acquired businesses.
Furthermore, organizational simplification and resulting cost savings may be difficult to achieve. Acquisitions may also lead to a substantial increase in long-lived assets, including goodwill. Write-downs of these assets due to unforeseen business developments may have a material adverse effect on Philips’ earnings, particularly in Healthcare and Lighting, which have significant amounts of goodwill (see also note 11, Goodwill).
90 Annual Report 2014
Table of Contents
Risk management 7.3
Philips’ inability to secure and retain intellectual property rights for products, whilst maintaining overall competitiveness, could have a material adverse effect on its results.
Philips is dependent on its ability to obtain and retain licenses and other intellectual property (IP) rights covering its products and its design and manufacturing processes. The IP portfolio is the result of an extensive patenting process that could be influenced by a number of factors, including innovation. The value of the IP portfolio is dependent on the successful promotion and market acceptance of standards developed or co-developed by Philips. This is particularly applicable to Consumer Lifestyle where third-party licenses are important and a loss or impairment could have a material adverse impact on Philips’ financial condition and operating results.
Transformation programs
In 2011 Philips started a very extensive transformation program (Accelerate!) to unlock Philips’ full potential. Accelerate! spans a time period of several years. In 2014 as a next phase in the Accelerate! transformation program Philips announced that it would separate its businesses into two new fit for purpose companies, HealthTech and Lighting Solutions. Failure to achieve the objectives of the transformation programs may have a material adverse effect on the mid and long term financial targets.
In addition the transformation program of the Finance function may expose Philips to adverse changes in the quality of its systems of internal control.
Failure to achieve improvements in Philips’ solution and product creation process and/or increased speed in innovation-to-market could hamper Philips’ profitable growth ambitions.
Further improvements in Philips’ solution and product creation process, ensuring timely delivery of new solutions and products at lower cost and upgrading of customer service levels to create sustainable competitive advantage, are important in realizing Philips’ profitable growth ambitions. The emergence of new low-cost competitors, particularly in Asia, further underlines the importance of improvements in the product creation process. The success of new solution and product creation, however, depends on a number of factors, including timely and successful completion of development efforts, market acceptance, Philips’ ability to manage the risks associated with new products and production ramp-up issues, the ability of Philips to attract and retain employees with the appropriate skills, the availability of products in the right quantities and at appropriate costs to meet anticipated demand and the risk that new products and services may have quality or other defects in the early stages of introduction. Accordingly, Philips cannot determine in advance the ultimate effect that new solutions and product creations will have on its financial condition and operating results. If Philips fails to accelerate its innovation-to-market processes and fails to ensure that end-user insights are fully captured and translated into solution and product creations that improve product mix and consequently contribution, it may face an erosion of its market share and competitiveness, which could have a material adverse effect on its financial condition and operating results.
Risk of unauthorized use of intellectual property rights
Philips produces and sells products and services which incorporates technology protected by intellectual property rights. Philips develops and acquires intellectual property rights on regular basis. Philips is exposed to the risk that intellectual property rights on technology applied in its products and services is claimed to be owned by third parties, who, in case their claims of infringement of such intellectual property rights are awarded, would be entitled to damages and fines.
If Philips is unable to ensure effective supply chain management, e.g. facing an interruption of its supply chain, including the inability of third parties to deliver parts, components and services on time, and if it is subject to rising raw material prices, it may be unable to sustain its competitiveness in its markets.
If Philips is unable to ensure effective supply chain management, e.g. facing an interruption of its supply chain, including the inability of third parties to deliver parts, components and services on time, Philips may be unable to sustain its competitiveness in its markets. Philips is continuing the process of creating a leaner supply base with fewer suppliers, while maintaining dual / multiple sourcing strategies where possible. This strategy very much requires close cooperation with suppliers to enhance, among other things, time to market and quality. In addition, Philips is continuing its initiatives to reduce assets through outsourcing. These processes may result in increased dependency on external suppliers and providers. Although Philips works closely with its suppliers to avoid supply-related problems, there can be no assurance that it will not encounter supply problems in the future or that it will be able to timely replace a supplier that is not able to meet its demand.
Shortages or delays could materially harm its business. Most of Philips’ activities are conducted outside of the Netherlands, and international operations bring challenges. For example, production and procurement of products and parts in Asian countries are increasing, and this creates a risk that production and shipping of products and parts could be interrupted by regional conflicts or a natural disaster, such as occurred in Japan in 2011. A general shortage of materials, components or subcomponents as a result of natural disasters also
Annual Report 2014 91
Table of Contents
Risk management 7.4
bears the risk of unforeseeable fluctuations in prices and demand, which could have a material adverse effect on its financial condition and operating results.
Businesses purchase raw materials including so-called rare earth metals, copper, steel, aluminum, noble gases and oil-related products, which exposes them to fluctuations in energy and raw material prices. In recent times, commodities have been subject to volatile markets, and such volatility is expected to continue. If Philips is not able to compensate for increased costs or pass them on to customers, price increases could have a material adverse impact on Philips’ results. In contrast, in times of falling commodity prices, Philips may not fully benefit from such price decreases as Philips attempts to reduce the risk of rising commodity prices by several means, such as including long-term contracting or physical and financial hedging.
Diversity in information technology (IT) could result in ineffective or inefficient business management. IT outsourcing and off-shoring strategies could result in complexities in service delivery and contract management.
Philips is engaged in a continuous drive to create a more open, standardized and consequently, more cost-effective IT landscape. This is leading to an approach involving further outsourcing, off-shoring, commoditization and ongoing reduction in the number of IT systems. This could introduce additional risk with regard to the delivery of IT services, the availability of IT systems and the scope and nature of the functionality offered by IT systems.
Philips observes a global increase in IT security threats and higher levels of sophistication in computer crime, posing a risk to the confidentiality, availability and integrity of data and information.
The global increase in security threats and higher levels of professionalism in computer crime have increased the importance of effective IT security measures, including proper identity management processes to protect against unauthorized systems access. Nevertheless, Philips’ systems, networks, products, solutions and services remain potentially vulnerable to attacks, which could potentially lead to the leakage of confidential information, improper use of its systems and networks or defective products, which could in turn materially adversely affect Philips’ financial condition and operating results. In recent years, the risks that we and other companies face from cyber-attacks have increased significantly. The objectives of these cyber-attacks vary widely and may include, among things, disruptions of operations including provision of services to customers or theft of intellectual property or other sensitive information belonging to us or other business partners. Successful cyber-attacks may result in substantial costs and other negative consequences, which may include, but are not limited to, lost revenues, reputational damage, remediation costs, and other liabilities to customers and partners. Furthermore, enhanced protection measures can involve significant costs. Although we have experienced cyber-attacks but to date have not incurred any significant damage as a result and did not incur significant monetary cost in taking corrective action, there can be no assurance that in the future Philips will be as successful in avoiding damages from cyber-attacks. Additionally, the integration of new companies and successful outsourcing of business processes are highly dependent on secure and well controlled IT systems.
Due to the fact that Philips is dependent on its personnel for leadership and specialized skills, the loss of its ability to attract and retain such personnel would have an adverse effect on its business.
The attraction and retention of talented employees in sales and marketing, research and development, finance and general management, as well as of highly specialized technical personnel, especially in transferring technologies to low-cost countries, is critical to Philips’ success. This is particularly valid in times of economic recovery. The loss of specialized skills could also result in business interruptions. There can be no assurance that Philips will continue to be successful in attracting and retaining all the highly qualified employees and key personnel needed in the future.
Warranty and product liability claims against Philips could cause Philips to incur significant costs and affect Philips’ results as well as its reputation and relationships with key customers.
Philips is from time to time subject to warranty and product liability claims with regard to product performance and effects. Philips could incur product liability losses as a result of repair and replacement costs in response to customer complaints or in connection with the resolution of contemplated or actual legal proceedings relating to such claims. In addition to potential losses arising from claims and related legal proceedings, product liability claims could affect Philips’ reputation and its relationships with key customers (both customers for end products and customers that use Philips’ products in their production process). As a result, product liability claims could materially impact Philips’ financial condition and operating results.
Any damage to Philips’ reputation could have an adverse effect on its businesses.
Philips is exposed to developments which could affect its reputation. Such developments could be of an environmental or social nature, or connected to the behavior of individual employees or suppliers and could relate to adherence to regulations related to labor, health and safety, environmental and chemical
92 Annual Report 2014
Table of Contents
Risk management 7.4
management. Reputational damage could materially impact Philips’ financial condition and operating results.
Legal proceedings covering a range of matters are pending in various jurisdictions against Philips and its current and former group companies. Due to the uncertainty inherent in legal proceedings, it is difficult to predict the final outcome.
Philips, including a certain number of its current and former group companies, is involved in legal proceedings relating to such matters as competition issues, commercial transactions, product liability, participations and environmental pollution. Since the ultimate outcome of asserted claims and proceedings, or the impact of any claims that may be asserted in the future, cannot be predicted with certainty, Philips’ financial position and results of operations could be affected materially by adverse outcomes.
Please refer to note 26, Contingent assets and liabilities, for additional disclosure relating to specific legal proceedings.
Philips is exposed to governmental investigations and legal proceedings with regard to possible anti-competitive market practices.
Philips is facing increased scrutiny by national and European authorities of possible anti-competitive market practices. Philips’ financial position and results could be materially affected by an adverse final outcome of governmental investigations and litigation, as well as any potential related claims.
Philips’ global presence exposes the company to regional and local regulatory rules, changes to which may affect the realization of business opportunities and investments in the countries in which Philips operates.
Philips has established subsidiaries in over 80 countries. These subsidiaries are exposed to changes in governmental regulations and unfavorable political developments, which may affect the realization of business opportunities or impair Philips’ local investments. Philips’ increased focus on the healthcare sector increases its exposure to highly regulated markets, where obtaining clearances or approvals for new products is of great importance, and where there is a dependency on the available funding for healthcare systems. In addition, changes in reimbursement policies may affect spending on healthcare.
Philips is exposed to non-compliance with General Business Principles.
Philips’ attempts to realize its growth ambitions could expose it to the risk of non-compliance with the Philips General Business Principles, such as anti-bribery provisions. This risk is heightened in growth geographies as the legal and regulatory environment is less developed in growth geographies compared to mature geographies. Examples include commission payments to third parties, remuneration payments to agents, distributors, consultants and the like, and the acceptance of gifts, which may be considered in some markets to be normal local business practice. (See also note 26, Contingent assets and liabilities.)
Defective internal controls would adversely affect our financial reporting and management process.
The reliability of reporting is important in ensuring that management decisions for steering the businesses and managing both top-line and bottom-line growth are based on top-quality data. Flaws in internal control systems could adversely affect the financial position and results and hamper expected growth.
The correctness of disclosures provides investors and other market professionals with significant information for a better understanding of Philips’ businesses. Imperfections or lack of clarity in the disclosures could create market uncertainty regarding the reliability of the data presented and could have a negative impact on the Philips share price.
The reliability of revenue and expenditure data is key for steering the business and for managing top-line and bottom-line growth. The long lifecycle of healthcare sales, from order acceptance to accepted installation, together with the complexity of the accounting rules for when revenue can be recognized in the accounts, presents a challenge in terms of ensuring there is consistency of application of the accounting rules throughout Philips Healthcare’s global business.
Philips is exposed to non-compliance with data privacy and product safety laws.
Philips’ brand image and reputation would be adversely impacted by non-compliance with various data protection and product security laws. In light of Philips digital strategy, data privacy laws are increasingly important. Also, Philips Healthcare is subject to various (patient) data protection and safety laws. In Philips Healthcare, privacy and product safety and security issues may arise, especially with respect to remote access or monitoring of patient data or loss of data on our customers’ systems.
Philips operates in a highly regulated product safety and quality environment. Philips’ products are subject to regulation by various government agencies, including the FDA (US) and comparable foreign agencies. Obtaining their approval is costly and time consuming, but a prerequisite for market introduction. A delay or inability to obtain the necessary regulatory approvals for new products could have a material adverse effect on business. The risk exists that product safety incidents or user concerns could trigger FDA
Annual Report 2014 93
Table of Contents
Risk management 7.5
business reviews which, if failed, could lead to business interruption which in turn could adversely affect Philips’ financial condition and operating results. E.g. the voluntary, temporary suspension of new production at our Healthcare facility in Cleveland, Ohio targets to further strengthen manufacturing process controls after certain issues in this area were identified during an ongoing FDA inspection.
Philips is exposed to a variety of treasury risks and other financial risks including liquidity risk, currency risk, interest rate risk, commodity price risk, credit risk, country risk and other insurable risk.
Negative developments impacting the global liquidity markets could affect the ability of Philips to raise or re-finance debt in the capital markets or could lead to significant increases in the cost of such borrowing in the future. If the markets expect a downgrade or downgrades by the rating agencies or if such a downgrade has actually taken place, it could increase the cost of borrowing, reduce our potential investor base and adversely affect our business.
Philips operates in approximately 100 countries and its earnings are therefore inevitably exposed to fluctuations in exchange rates of foreign currencies against the euro. Philips’ sales are sensitive in particular to movements in the US dollar, Japanese yen and a wide range of other currencies from developed and emerging markets. However, Philips’ sourcing and manufacturing spend is concentrated in the Eurozone, United States and China. Therefore the net (revenues less spend) sensitivity of Income from Operations to US dollar and Chinese renminbi is relatively small. Income from Operations is sensitive to movements in currencies from countries where the Group has none or small manufacturing/sourcing activity such as Japan and a range of emerging markets such as Russia, Korea, Indonesia, India and Brazil.
The credit risk of financial and non-financial counterparties with outstanding payment obligations creates exposures for Philips, particularly in relation to accounts receivable with customers and liquid assets and fair values of derivatives and insurance receivables contracts with financial counterparties. A default by counterparties in such transactions can have a material adverse effect on Philips’ financial condition and operating results.
Philips’ supply chain is exposed to fluctuations in energy and raw material prices. Commodities such as oil are subject to volatile markets and significant price increases from time to time. If Philips is not able to compensate for, or pass on, its increased costs to customers, such price increases could have an adverse impact on its financial condition and operating results.
Philips is exposed to interest rate risk, particularly in relation to its long-term debt position; this risk can take the form of either fair value or cash flow risk. Failure to effectively hedge this risk can impact Philips’ financial condition and operating results.
For further analysis, please refer to note 31, Details of treasury / other financial risks.
Philips is exposed to a number of different fiscal uncertainties which could have a significant impact on local tax results.
Philips is exposed to a number of different tax uncertainties which could result in double taxation, penalties and interest payments. These include transfer pricing uncertainties on internal cross-border deliveries of goods and services, tax uncertainties related to acquisitions and divestments, tax uncertainties related to the use of tax credits and permanent establishments, tax uncertainties due to losses carried forward and tax credits carried forward and potential changes in tax law that could result in higher tax expense and payments. Those uncertainties may have a significant impact on local tax, results which in turn could adversely affect Philips’ financial condition and operating results.
The value of the losses carried forward is subject to having sufficient taxable income available within the loss-carried-forward period, but also to having sufficient taxable income within the foreseeable future in the case of losses carried forward with an indefinite carry-forward period. The ultimate realization of the Company’s deferred tax assets, including tax losses and credits carried forward, is dependent upon the generation of future taxable income in the countries where the temporary differences, unused tax losses and unused tax credits were incurred and during the periods in which the deferred tax assets become deductible. Additionally, in certain instances, realization of such deferred tax assets is dependent upon the successful execution of tax planning strategies. Accordingly, there can be no absolute assurance that all (net) tax losses and credits carried forward will be realized.
For further details, please refer to the tax risks paragraph in note 8, Income taxes.
Philips has defined-benefit pension plans in a number of countries. The funded status and the cost of maintaining these plans are influenced by movements in financial market and demographic developments, creating volatility in Philips’ financials.
A significant proportion of employees in Europe and North America is covered by defined-benefit pension plans. The accounting for defined-benefit pension plans requires management to make estimates on discount rates, inflation, longevity and expected rates of compensation. Movements (e.g. due to the movements of financial markets) in these assumptions
94 Annual Report 2014
Table of Contents
Risk management 7.6
can have a significant impact on the Defined Benefit Obligation and pension cost. A negative performance of the financial markets could have a material impact on cash funding requirements and pension costs and also affect the value of certain financial assets and liabilities of the company.
Philips is exposed to a number of reporting risks.
A risk rating is assigned for each risk identified, based on the likelihood of occurrence and the potential impact of the risk on the financial statements and related disclosures. In determining the probability that a risk will result in a misstatement of a more than inconsequential amount or material nature, the following factors are considered to be critical: complexity of the associated accounting activity or transaction process, history of accounting and reporting errors, likelihood of significant (contingent) liabilities arising from activities, exposure to losses, existence of a related party transaction, volume of activity and homogeneity of the individual transactions processed and changes to the prior period in accounting characteristics compared to the previous period.
For important critical reporting risk areas identified within Philips we refer to the “Use of estimates” section in the note 1, Significant accounting policies, as the Company assessed that reporting risk is closely related to the use of estimates and application of judgment.
Philips is exposed to risks associated with the planned separation into HealthTech and Lighting Solutions.
In September 2014 Philips announced its plan to separate into two standalone companies in the HealthTech and Lighting Solutions, positioning each one to better capitalize on the highly attractive HealthTech and Lighting solutions opportunities. This is a complex process which involves certain risks to Philips.
The separation into HealthTech and Lightings Solutions is unlike divestments or carve out transactions that Philips has implemented in the past, which affected very specific parts of the business of Philips. The proposed separation impacts all businesses and markets as well as all supporting functions and all assets and liabilities of the Group and will require complex and time consuming disentanglement efforts.
The design and implementation of the separation requires the devotion of substantial time and attention from management and staff. Although Philips has set-up a dedicated senior project team to work on a successful separation, the separation efforts could distract from and have an adverse effect on the conduct of normal business and our strategy. The separation could increase the likelihood of occurrence and/or potential impact of the risks as described in section 7.2, Risk categories and factors, of this report, such as strategic risks (e.g. insufficient integration of acquisitions), operational risks (e.g. delays in innovation-to-market), compliance risk (e.g. ineffective internal controls) and financial risks (e.g. reporting risks). Philips has made no final decision as to what actions it may take with respect to Lighting Solutions once it has become a separate company. Such actions may include public offerings of ownership stakes in Lighting Solutions.
The design and implementation of the separation will involve and depend on support from external legal, tax, financial and other professional consultants and as a result Philips will incur substantial cost. The separation could take more time than originally anticipated, which may expose Philips to risks of additional cost and other adverse consequences.
The separation of businesses, assets, liabilities, contractual or contingent rights and obligations and legal entities may require Philips to recognize expenses and/or incur financial payments, which otherwise would not have been incurred.
While it is the firm intention to complete the separation, Philips has reserved the right not to proceed with the separation if it determines that it would be in the Company’s interest not to do so. If it does proceed with the separation, no assurances can be given that the separation will ultimately lead to the increased benefits contemplated by Philips currently.
Annual Report 2014 95
Table of Contents
Management 8
Koninklijke Philips N.V. is managed by an Executive Committee which comprises the members of the Board of Management and certain key officers from functions, businesses and markets.
The Executive Committee operates under the chairmanship of the Chief Executive Officer and shares responsibility for the deployment of Philips’ strategy and policies, and the achievement of its objectives and results.
Under Dutch Law, the Board of Management is accountable for the actions and decisions of the Executive Committee and has ultimate responsibility for the management and external reporting of Koninklijke Philips N.V. and is answerable to shareholders at the Annual General Meeting of Shareholders. Pursuant to the two-tier corporate structure, the Board of Management is accountable for its performance to a separate and independent Supervisory Board.
The Rules of Procedure of the Board of Management and Executive Committee are published on the Company’s website ( www.philips.com/investor ).
Corporate governance
A full description of the Company’s corporate governance structure is published in chapter 11, Corporate governance, of this report.

Frans van Houten
Born 1960, Dutch
President/Chief Executive Officer (CEO)
Chairman of the Board of Management since April 2011
Group responsibilities: Chairman of the Executive Committee,
Sector Healthcare, Internal Audit, Information Technology,
Supply Management, Marketing & Communication, Accelerate! -
Overall transformation, End2End

Jim Andrew
Born 1962, American
Executive Vice President &
Chief Strategy and Innovation Officer
Group responsibilities: Strategy, Innovation, Design,
Sustainability, Accelerate! - Resource to win

Marnix van Ginneken
Born 1973, Dutch/American
Executive Vice President & Chief Legal Officer
Corporate responsibilities: Legal and General Secretary
96 Annual Report 2014
Table of Contents
Management 8

Denise Haylor
Born 1964, English/American
Executive Vice President & Chief Human Resources Officer
Corporate responsibilities: Human Resources, Accelerate! - Culture

Ronald de Jong
Born 1967, Dutch
Executive Vice President &
Chief Market Leader
Group responsibilities: Markets, Areas & Countries (except
Greater China & North America), Accelerate! - Customer Centricity

Patrick Kung
Born 1951, American
Executive Vice President &
Chief Executive Officer Philips Greater China
Group responsibilities: Philips Greater China

Pieter Nota
Born 1964, Dutch
Executive Vice President &
Chief Executive Officer of Philips Consumer Lifestyle
Member of the Board of Management since April 2011
Group responsibilities: Sector Consumer Lifestyle, Accelerate! -
Resource to Win

Eric Rondolat
Born 1966, Italian/French
Executive Vice President &
Chief Executive Officer Philips Lighting
Group responsibilities: Sector Lighting

Ron Wirahadiraksa
Born 1960, Dutch
Executive Vice President &
Chief Financial Officer (CFO)
Member of the Board of Management since April 2011
Group responsibilities: Finance, Mergers & Acquisitions,
Accelerate! - Operating Model
Annual Report 2014 97
Table of Contents
Supervisory Board 9
The Supervisory Board supervises the policies of the executive management and the general course of affairs of Koninklijke Philips N.V. and advises the executive management thereon. The Supervisory Board, in the two-tier corporate structure under Dutch law, is a separate and independent corporate body.
The Rules of Procedure of the Supervisory Board are published on the Company’s website. For details on the activities of the Supervisory Board, see chapter 10, Supervisory Board report, of this report and section 11.2, Supervisory Board, of this report.

Jeroen van der Veer
Born 1947, Dutch ** ***
Chairman
Chairman of the Corporate Governance and Nomination & Selection Committee
Member of the Supervisory Board since 2009; second term expires in 2017
Former Chief Executive of Royal Dutch Shell and Chairman of the Supervisory Board of ING Group. Member of the Supervisory Board of Concertgebouw N.V.

Orit Gadiesh
Born 1951, Israeli/American *
Member of the Supervisory Board since 2014; first term expires in 2018
Currently Chairman of Bain & Company. Member of the International Business Leaders’ Advisory Council for the Mayor of Shanghai (IBLAC) and the Foundation Board of the World Economic Forum (WEF) and its International Business Council. Member of the Supervisory Board of privately held RMAG-Renova. Also serves on the Advisory Board for the British-American Business council

Kees van Lede
Born 1942, Dutch *
Member of the Supervisory Board since 2003; third term expires in 2015
Former Chairman of the Board of Management of Akzo Nobel and currently Chairman of the Supervisory Board of Royal Imtech N.V. Member of the Supervisory Boards of AirFrance/KLM, Air Liquide and Senior Advisor JP Morgan Plc.
98 Annual Report 2014
Table of Contents
Supervisory Board 9

Ewald Kist
Born 1944, Dutch **
Member of the Supervisory Board since 2004; third term expires in 2016
Former Chairman of the Executive Board of ING Group and currently member of the Supervisory Boards of DSM, Moody’s Investor Service and Stage Entertainment

Heino von Prondzynski
Born 1949, German * ** ***
Chairman of the Remuneration Committee Member of the Supervisory Board since 2007; second term expires in 2015
Former member of the Corporate Executive Committee of the F. Hofmann-La Roche Group and former CEO of Roche Diagnostics, currently Chairman of the Supervisory Boards of HTL Strefa and Epigenomics AG. Member of the Supervisory Boards of Hospira, Inc. and Quotient Ltd.

Neelam Dhawan
Born 1959, Indian *
Member of the Supervisory Board since 2012; first term expires in 2016
Currently Managing Director of Hewlett-Packard India

Jackson Tai
Born 1950, American *
Chairman of Audit Committee
Member of the Supervisory Board since 2011; first term expires in 2015
Former Vice-Chairman and CEO of DBS Group and DBS Bank Ltd and former Managing Director at J.P. Morgan &Co.
Incorporated. Currently a member of the Boards of Directors of The Bank of China Limited, MasterCard Incorporated and Eli Lilly and Company. Also Non-Executive Director of privately-held Russell Reynolds Associates and of Vapor Stream

Christine Poon
Born 1952, American ** ***
Vice-chairman and Secretary
Member of the Supervisory Board since 2009; second term expires in 2017
Former Vice-Chairman of Johnson & Johnson, member of the Board of Directors, and Worldwide Chairman of the Pharmaceuticals Group. Currently Professor of management of Ohio State University’s Fisher College of Business and member of the Board of Directors of Prudential, Regeneron and Sherwin-Williams
| * | member of the Audit Committee |
| ** | member of the Remuneration Committee |
| *** | member of the Corporate Governance and Nomination & Selection Committee |
Annual Report 2014 99
Table of Contents
Supervisory Board report 10
Introduction
We as members of the Supervisory Board are fully committed to our role and responsibility in respect of the proper functioning of the corporate governance of Philips. The Supervisory Board supervises and advises the Board of Management and Executive Committee in performing their management tasks and setting the direction of the business of the Philips Group. The Supervisory Board acts, and we as individual members of the Board act, in the interests of Koninklijke Philips N.V., its business and all its stakeholders. This report includes a more specific description of the Supervisory Board’s activities during the financial year 2014 and other relevant information on its functioning.
Activities of the Supervisory Board
The overview below indicates a number of matters that we discussed during meetings throughout 2014:
| • |
Performance of the Philips Group and its underlying businesses and financial headroom; |
| • |
Philips’ strategic direction and the proposal to separate the group into two companies: one focused on HealthTech businesses and one focused on Lighting Solutions businesses, which was announced during the Capital Markets Day in September 2014. As part of this discussion, the Supervisory Board discussed the various strategic options available to Philips and the benefits and challenges presented by each option, the strategic rationale for a separation and the aspects of why a separation is favored over other options; |
| • |
In connection with this, we discussed the combination of the Healthcare Sector and the Consumer Lifestyle Sector and the organizational changes that would occur as a consequence of this; |
| • |
Philips’ annual management commitment and annual operating plan for 2015; |
| • |
The strategic rationale and implications behind the decision to make a tender offer to acquire Volcano Corporation; |
| • |
Enterprise risk management (which included an annual risk assessment and discussion of the changing nature of the risks faced by Philips and the possible impact of such risks). Such risks included the impact of negative market conditions and the transition to new business models; |
| • |
Changes in the composition of the Executive Committee; |
| • |
Comprehensive review of underlying production processes and standards, as well as regulatory compliance, within the Healtcare sector, and necessary remedial efforts at the Company’s Healthcare factory in Cleveland; |
| • |
Significant civil litigation claims and public investigations against or into the company; |
| • |
The tender process for selecting a new external auditor and the resulting proposal to appoint Ernst & Young Accountants LLP; |
| • |
Quality and regulatory matters; and |
| • |
Intended divestment of the combined Lumileds and Automotive Lighting components businesses. |
The Supervisory Board conducted “deep dives” on a range of topics such as: the Philips Integrated Landscape (which concerns the IT infrastructure for the company), and a review of the company’s quality and regulatory systems.
The Board reviewed the company’s deployment of its General Business Principles (GBP) and approved an updated version of the GBP.
Additionally, we received updates on the Company’s sustainability efforts and initiatives in the area of the “circular economy”, the annual dividend, the share buy-back program and the impact of currency headwinds on results.
On multiple occasions, we were briefed on the various aspects of the Accelerate! program. This included the transformation of the Finance and IT functions and also the progress made in transforming the culture within Philips and simplifying its operating model.
The Supervisory Board also reviewed Philips’ annual and interim financial statements, including non-financial information, prior to publication thereof.
Supervisory Board meetings and attendance
In 2014, the Supervisory Board convened for seven regular meetings and two extraordinary meetings. Moreover, we collectively and individually interacted with members of the Executive Committee and with senior management outside the formal Supervisory Board meetings. The Chairman of the Supervisory Board and the CEO met regularly for bilateral discussions about the progress of the Company on a variety of matters. The Chairman also held bilateral meetings with several members of the Executive Committee to discuss a range of topics.
The Supervisory Board meetings were well attended in 2014. The attendance percentage at the meetings - including the committee meetings - was again high (in excess of 95%). The Supervisory Board committees also convened regularly (see the separate reports of the committees below) and all of the committees regularly reported back on their activities to the full Supervisory Board. In addition to the formal meetings of the Board and its Committees, the Board members also held private meetings. We as members of the Board devoted
100 Annual Report 2014
Table of Contents
Supervisory Board report 10
sufficient time to engage (proactively if the circumstances so required) in our supervisory responsibilities.
Composition, diversity and self-evaluation by the Supervisory Board
The Supervisory Board is a separate corporate body that is independent of the Board of Management (and the Executive Committee). Its independence is also reflected in the requirement that a member of the Supervisory Board cannot be a member of the Board of Management, of the Executive Committee or an employee of Philips. The Supervisory Board furthermore considers all its members to be independent pursuant to the Dutch Corporate Governance Code. We will continue to pay close attention to applicable independence criteria.
The Supervisory Board currently consists of eight members.
We were deeply saddened in 2014 by the passing of James Schiro, shortly after he stepped down from the Supervisory Board. James became a member of Philips’ Supervisory Board in 2005 and he was appointed for three consecutive terms. In 2012, James became the Vice-Chairman of the Supervisory Board, the Chairman of the Remuneration Committee and a member of the Nomination & Selection Committee; he also served on the Audit Committee from 2005 until 2011. James was instrumental in the introduction of the new Remuneration Policy and Long-term Incentive Plan that was approved by shareholders in 2013. James was an excellent Supervisory Board member and a loyal friend, he was full of integrity, modest and humble: truly a fine man. Philips and we as members of the Supervisory Board will miss him dearly.
Ms Orit Gadiesh was appointed as a member of the Supervisory Board at the 2014 Annual General Meeting of Shareholders. The agenda for the upcoming 2015 Annual General Meeting of Shareholders includes a proposal to reappoint Mr Heino von Prondzynski and Mr Jackson Tai to the Supervisory Board for an additional term of four years. The Supervisory Board will also recommend to the General Meeting of Shareholders to re-appoint Mr Kees van Lede for an additional term of two years. The re-appointment would represent Kees fourth term on the Supervisory Board. The Board proposes to re-appoint Mr van Lede because his past experience and strong knowledge of corporate governance will be of particular benefit as the company goes through a period of transition.
In 2014, there were also a number of changes to the chairmanships and memberships within the Board. Christine Poon was appointed as Vice-Chairman of the Supervisory Board and Heino von Prondzynski was appointed as Chairman of the Remuneration Committee. Mr von Prondzynski also joined the Corporate Governance and Nomination & Selection Committee. Orit Gadiesh joined the Audit Committee.
The profile of the Supervisory Board remains unchanged and aims for an appropriate combination of knowledge and experience among its members, encompassing marketing, manufacturing, technology, financial, economic, social and legal aspects of international business, government and public administration in relation to the global and multi-product character of Philips’ businesses. The Supervisory Board pays great value to diversity in its composition. More particular it aims for having members with both European and non-European backgrounds (nationality, working experience or otherwise) and one or more members who have held an executive or similar position in business or society.
In addition, we support Philips’ policy to appoint a well-balanced mix of women and men to its Board of Management, Executive Committee and Supervisory Board, including the requirement under Dutch legislation for companies to pursue a policy of having at least 30% of the seats on the Board of Management and the Supervisory Board held by women and at least 30% of the seats held by men.
We believe we are making good progress in implementing this policy, the appointment of Orit Gadiesh brought the Supervisory Board’s gender diversity within the statutory criteria. We note that there may be various pragmatic reasons – such as other relevant selection criteria and the availability of suitable candidates within Philips – that could play a role in the achievement of our diversity targets.
In 2014, the members of the Supervisory Board again completed a questionnaire to verify compliance in 2014 with applicable corporate governance rules and its Rules of Procedure. The outcome of this survey was satisfactory.
In addition, we each submitted to the Chairman responses to a questionnaire designed to self-evaluate the functioning of the Supervisory Board. As in previous years, the questionnaire covered topics such as the composition and competence of the Supervisory Board (for example, the Board’s size and the education and training requirements of its members), access to information, the frequency and quality of the meetings, quality and timeliness of the meeting materials, the nature of the topics discussed during meetings and the functioning of the Supervisory Board’s committees.
The responses to the questionnaire were aggregated into a report, which was discussed by the Supervisory Board in a private meeting. Certain areas were identified that could be improved and it was decided that the Chairman would follow-up with individual members to address specific issues. The Chairman was evaluated by the Vice-Chairman. The responses provided by the Supervisory Board members indicated that the Board continues to be a well-functioning team and we believe a diversity of experience and skills is represented on the Board. The Board has spent time throughout 2014
Annual Report 2014 101
Table of Contents
Supervisory Board report 10
considering its composition and it will continue to devote attention to this topic during 2015. The functioning of the Supervisory Board committees was considered to be commendable (or better) and specific feedback will be addressed by the Chairman of each committee with its members.
In 2015, the use of an external evaluator to measure the functioning of the Supervisory Board may be reconsidered.
Supervisory Board committees
The Supervisory Board has assigned certain of its tasks to three permanent committees: the Corporate Governance and Nomination & Selection Committee, the Remuneration Committee and the Audit Committee. The function of the committees is to prepare the decision-making of the full Supervisory Board, and the committees currently have no independent or assigned powers. The full Board retains overall responsibility for the activities of its committees. The separate reports of the committees are part of this Supervisory Board report and are published below.
Supervisory Board remuneration
As the base fee for the remuneration of the Supervisory Board was not changed since 2008, and in view of the increased activities and responsibilities of the Supervisory Board, the agenda for the upcoming 2015 Annual General Meeting of Shareholders will include a proposal to determine the remuneration of the members of the Supervisory Board and its Committees.
Composition Board of Management
The agenda for the upcoming 2015 Annual General Meeting of Shareholders will include proposals to re-appoint the members of the Board of Management for an additional term of four years. The Supervisory Board is very pleased that Messrs. Van Houten, Wirahadiraksa and Nota remain available as members of the Board of Management. Their re-appointment is recommended in view of their performance and the importance of continuity in the ongoing transformation process of the Philips Group and the proposed separation of the Lighting business from Royal Philips.
Financial Statements 2014
The financial statements of the company for 2014, as presented by the Board of Management, have been audited by KPMG Accountants N.V. as independent external auditor appointed by the General Meeting of Shareholders. Its reports have been included in section 13.5, Independent auditor’s report, of this report. We have approved these financial statements, and all individual members of the Supervisory Board (together with the members of the Board of Management) have signed these documents.
We recommend to shareholders that they adopt the 2014 financial statements. We likewise recommend to shareholders that they adopt the proposal of the Board of Management to make a distribution of EUR 0.80 per common share (up to EUR 735 million), in cash or in shares at the option of the shareholder, against the net income for 2014 and retained earnings.
Finally, we would like to express our thanks to the members of the Executive Committee and all other employees for their continued contribution during the year.
February 24, 2015
The Supervisory Board
Jeroen van der Veer
Christine Poon
Neelam Dhawan
Orit Gadiesh
Ewald Kist
Kees van Lede
Heino von Prondzynski
Jackson Tai
Further information
To gain a better understanding of the responsibilities of the Supervisory Board and the internal regulations and procedures governing for its functioning and that of its committees, please refer to chapter 11, Corporate governance, of this report and to the following documents published on the company’s website:
| • |
Articles of Association |
| • |
Rules of Procedure Supervisory Board, including the Charters of the Board committees |
| • |
Rules of Conduct with respect to Inside Information |
| • |
(Re)appointment scheme |
Changes Supervisory Board and committees 2014
| • |
James Schiro stepped down from the Supervisory Board shortly before he passed away. |
| • |
Christine Poon was appointed as Vice-Chairman of the Supervisory Board. |
| • |
Heino von Pronzynski was appointed as Chairman of the Remuneration Committee and as a member of the Corporate Governance and Nomination & Selection Committee. |
| • |
Orit Gadiesh was appointed as a member of the Supervisory Board and was appointed as a member of the Audit Committee. |
102 Annual Report 2014
Table of Contents
Supervisory Board report 10
Changes and re-appointments Supervisory Board 2015
| • |
It is proposed to re-appoint Kees van Lede, Heino von Prondzynski and Jackson Tai as members of the Supervisory Board. |
(Appointment subject to approval by the General Meeting of Shareholders.)
Changes Management 2014
| • |
Denise Haylor was appointed as Chief Human Resources Officer. |
| • |
Marnix van Ginneken was appointed as Chief Legal Officer. |
| • |
Deborah DiSanzo left the company. |
Board of Management 2015
| • |
It is proposed to re-appoint Frans van Houten, Ron Wirahadiraksa and Pieter Nota as members of the Board of Management. |
10.1 Report of the Corporate Governance and Nomination & Selection Committee
The Corporate Governance and Nomination & Selection Committee is chaired by Jeroen van der Veer and its other members are Christine Poon and Heino von Prondzynski. James Schiro was also a member of the Committee until he stepped down in July 2014.
The Committee is responsible for the review of selection criteria and appointment procedures for the Board of Management, the Executive Committee, as well as the Supervisory Board.
In 2014, the Committee devoted time on the appointment or reappointment of candidates to fill current and future vacancies on the Board of Management, Executive Committee and Supervisory Board. The Committee consulted with the CEO and other members of the Board of Management. Following those consultations it prepared decisions and advised the Supervisory Board on the candidates for appointment. This resulted in the proposed re-appointment at the upcoming 2015 Annual General Meeting of Shareholders of members of the Board of Management and Supervisory Board, as explained in chapter 10, Supervisory Board report, of this report. In 2014 this also resulted in the appointment of Denise Haylor as Chief Human Resources Officer and Marnix van Ginneken as Chief Legal Officer. As it does each year, the Committee discussed succession planning for Executive Committee members. The Committee also discussed the departure of Deborah DiSanzo. The Committee has also started to consider the implications of the Company into two companies for governance, succession and talent development.
As indicated in its report above, the Supervisory Board believes it is making good progress in implementing a policy of gender diversity. The Committee strives to continue this trend and give appropriate weight to the diversity policy in the nomination and appointment process on future vacancies, while taking into account the overall profile and selection criteria for appointments of suitable candidates to the Board of Management, Executive Committee and Supervisory Board.
Under its responsibility for the selection criteria and appointment procedures for Philips’ senior management, the Committee reviewed the succession plans for top 70 positions and emergency candidates for key roles in the Company.
With respect to corporate governance matters, the Committee discussed relevant developments and legislative changes. Finally, the Committee discussed possible agenda items for the upcoming 2015 Annual General Meeting of Shareholders.
10.2 Report of the Remuneration Committee
Introduction
The Remuneration Committee is chaired per September 1, 2014, by Heino von Prondzynski, who took over the chairmanship from James Schiro. Its other members are Jeroen van der Veer, Ewald Kist and Christine Poon. The Committee is responsible for preparing decisions of the Supervisory Board on the remuneration of individual members of the Board of Management and the Executive Committee. In performing its duties and responsibilities the Remuneration Committee is assisted by an external consultant and in-house remuneration expert acting on the basis of a protocol which ensures that he acts on the instructions of the Remuneration Committee. Currently, no member of the Remuneration Committee is a member of the management board of another listed company. In line with applicable statutory and other regulations, this report focuses on the employment and remuneration of the members of the Board of Management.
10.2.1 Remuneration policy
The objective of the remuneration policy for members of the Board of Management, as adopted by the General Meeting of Shareholders, is in line with that for executives throughout the Philips Group: to attract, motivate and retain qualified senior executives of the highest caliber with an international mindset and the background essential for the successful leadership and effective management of a large global company. The Board of Management remuneration policy is
Annual Report 2014 103
Table of Contents
Supervisory Board report 10.2.1
benchmarked regularly against companies in the general industry and aims at the median market position.
One of the goals behind the policy is to focus on improving the performance of the company and to enhance the value of the Philips Group. Consequently, the remuneration package includes a variable part in the form of an annual cash incentive and a long-term incentive consisting of performance shares. The policy does not encourage inappropriate risk-taking.
The performance targets for the members of the Board of Management are determined annually at the beginning of the year. The Supervisory Board determines whether performance conditions have been met and can adjust the payout of the annual cash incentive and the long-term incentive grant upward or downward if the predetermined performance criteria were to produce an inappropriate result in extraordinary circumstances. The authority for such adjustments exists on the basis of contractual ultimum-remedium and claw-back clauses. In addition, pursuant to Dutch legislation effective January 1, 2014, incentives may, under certain circumstances, be amended or clawed back pursuant to statutory powers. For more information please refer to chapter 11, Corporate governance, of this report. Further information on the performance targets is given in the chapters on the Annual Incentive (see sub-section 10.2.6, Annual Incentive, of this report) and the Long-Term Incentive Plan (see sub-section 10.2.7, Long-Term Incentive Plan, of this report) respectively.
Key features of our Executive Committee Compensation Program
The list below highlights Philips’ approach to remuneration, in particular taking into account Corporate Governance practices in the Netherlands.
What we do
| • |
We pay for performance |
| • |
We conduct scenario analyses |
| • |
We have robust stock ownership guidelines |
| • |
We have claw-back policies incorporated into our incentive plans |
| • |
We have a simple and transparent remuneration structure in place |
What we do not do
| • |
We do not pay dividend equivalents on stock options and unvested restricted share or performance share units |
| • |
We do not offer executive contracts with longer than 12 months’ separation payments |
| • |
We do not have a remuneration policy in place that encourages our Board of Management to take any inappropriate risks or to act in their own interests |
| • |
We do not reward failing members of the Board of Management upon termination of employment |
| • |
We do not grant loans or give guarantees to the Board of Management |
10.2.2 Contracts
Below, the main elements of the contracts of the members of the Board of Management are included. These contracts expire at the end of the Annual General Meeting on May 7, 2015. Please refer to sub-section 10.2.11, Year 2015, of this report at the end of this section.
Term of appointment
The members of the Board of Management are appointed for a period of 4 years it being understood that this period expires no later than at the end of the following general meeting of shareholders (AGM) held in the fourth year after the year of appointment.
Philips Group
Contract terms for current members
|
|
|
|||
| end of term | ||||
|
|
|
|||
|
F.A. van Houten |
AGM 2015 | |||
|
R.H. Wirahadiraksa |
AGM 2015 | |||
|
P.A.J. Nota |
AGM 2015 | |||
|
|
|
|||
Notice period
Termination of the contract by a member of the Board of Management is subject to three months’ notice. A notice period of six months will be applicable in the case of termination by the Company.
Severance payment
The severance payment is set at a maximum of one year’s salary.
Share ownership
Simultaneously with the introduction of the current LTI Plan in 2013, the guideline for members of the Board of Management to hold a certain number of shares in the Company has been increased to the level of at least 200% of base pay (300% for the CEO). Until this level has been reached the members of the Board of Management are required to retain all after-tax shares derived from any long-term incentive plan.
Both Ron Wirahadiraksa and Pieter Nota have reached the required level and the CEO has increased his ownership significantly throughout the year to currently 70% of his target.
10.2.3 Scenario analysis
The Remuneration Committee conducts a scenario analysis annually. This includes the calculation of remuneration under different scenarios, whereby different Philips performance assumptions and corporate actions are examined. The Supervisory Board concluded that the current policy has proven to function well in terms of a relationship between the strategic objectives and the chosen performance criteria and believes that the Annual and Long-Term Incentive Plans support this relationship.
10.2.4 Remuneration costs
The table below gives an overview of the costs incurred by the Company in the financial year in relation to the remuneration of the Board of Management. Costs
104 Annual Report 2014
Table of Contents
Supervisory Board report 10.2.4
related to performance shares, stock option and restricted share right grants are taken by the Company over a number of years. As a consequence, the costs mentioned below in the performance shares, stock options and restricted share rights columns are the accounting cost of multi-year grants given to members of the Board of Management during their board membership.
Philips Group
Remuneration Board of Management 1) in EUR
2014
|
|
|
|||||||||||||||||||||||||||||||
| Costs in the year | ||||||||||||||||||||||||||||||||
|
|
|
|||||||||||||||||||||||||||||||
|
annual base salary 2) |
base salary |
realized annual incentive |
performance shares |
stock options |
restricted share rights |
pension costs |
other compensation |
|||||||||||||||||||||||||
|
|
|
|||||||||||||||||||||||||||||||
|
F.A. van Houten |
1,150,000 | 1,137,500 | 349,600 | 860,564 | 101,344 | 76,951 | 485,655 | 86,554 | ||||||||||||||||||||||||
|
R.H. Wirahadiraksa |
725,000 | 712,500 | 156,600 | 446,337 | 68,914 | 52,965 | 298,995 | 35,909 | ||||||||||||||||||||||||
|
P.A.J. Nota |
650,000 | 643,750 | 258,180 | 406,358 | 68,914 | 57,200 | 267,037 | 63,507 | ||||||||||||||||||||||||
|
|
|
|||||||||||||||||||||||||||||||
| 2,493,750 | 764,380 | 1,713,259 | 239,172 | 187,116 | 1,051,687 | 185,970 | ||||||||||||||||||||||||||
|
|
|
|||||||||||||||||||||||||||||||
| 1) |
Reference date for board membership is December 31, 2014 |
| 2) |
Salary as of April 1, 2014 |
10.2.5 Base salary
The base salaries of the members of the Board of Management have been reviewed in April 2014 as part of the regular remuneration review. The salary of Frans van Houten has been increased per April 1, 2014, from EUR 1,100,000 to EUR 1,150,000. The salary of the CFO, Ron Wirahadiraksa, has been increased from EUR 675,000 to EUR 725,000. The salary of Pieter Nota has been increased from EUR 625,000 to EUR 650,000. All increases were made to move base salary levels closer to market levels.
10.2.6 Annual Incentive
Each year, a variable cash incentive (Annual Incentive) can be earned, based on the achievement of specific and challenging targets. The Annual Incentive criteria are made up for 80% of the financial indicators of the Company and for 20% of the team targets comprising, among others, sustainability targets as part of our EcoVision program.
The on-target Annual Incentive percentage is set at 80% of the base salary for the CEO and at 60% of the base salary for other members of the Board of Management. The maximum Annual Incentive achievable is 160% of the annual base salary for the CEO and 120% of the annual base salary for members of the Board of Management.
To support the performance culture, the Annual Incentive plan is based on (financial) targets at ‘own level’ and ‘group’ level results (line-of-sight). The 2014 payouts, shown in the table below, reflect the below target performance of Adjusted IFO, CSG and ROIC at the Group level. In addition, the average Team Target payout was also less than the target level.
Philips Group
Annual Incentive realization in EUR
2014 (payout in 2015)
|
|
|
|||||||
|
realized annual incentive |
as a % of base salary (2014) |
|||||||
|
|
|
|||||||
|
F.A. van Houten |
349,600 | 30.4 | % | |||||
|
R.H. Wirahadiraksa |
156,600 | 21.6 | % | |||||
|
P.A.J. Nota |
258,180 | 39.7 | % | |||||
|
|
|
|||||||
10.2.7 Long-Term Incentive Plan
Grants made under the 2014 LTI Plan consist of performance shares only.
Grant size
The annual grant size is set by reference to a multiple of base salary. For the CEO the annual grant size is set at 120% of base salary and for the other members of the Board of Management at 100% of base salary. This is broadly at a mid-market level against leading European listed companies. The actual number of performance shares to be awarded is determined by reference to the average of the closing price of the Philips share on the day of publication of the quarterly results and the four subsequent dealing days.
Vesting schedule
Dependent upon the achievement of the performance conditions, cliff-vesting applies three years after the date of grant. During the vesting period, the value of dividends will be added to the performance shares in the form of shares. These dividend-equivalent shares will only be delivered to the extent that the award actually vests.
Performance conditions
Vesting of the performance shares is based on two equally weighted performance conditions:
| • |
50% Adjusted Earnings per Share growth (“EPS”) and |
| • |
50% Relative Total Shareholder Return (“TSR”) |
Annual Report 2014 105
Table of Contents
Supervisory Board report 10.2.7
EPS
EPS growth is calculated by applying the simple point-to-point method at year end. Earnings are the income from continued operations attributable to shareholders, as reported in the Annual Report.
The following performance-incentive zone applies for EPS:
Philips Group
Performance-incentive zone for EPS in %
|
|
|
|||||||||||||||
| Below | ||||||||||||||||
| threshold | Threshold | Target | Maximum | |||||||||||||
|
|
|
|||||||||||||||
|
Payout |
0 | 40 | 100 | 200 | ||||||||||||
|
|
|
|||||||||||||||
The EPS targets are set annually by the Supervisory Board. Given that these targets are considered to be company sensitive, disclosure will take place retrospectively at the end of the performance period. EPS targets and the achieved performance are published in the Annual Report after the relevant performance period.
TSR
The TSR peer group for the LTI Plan consists of the following 21 companies:
Philips Group
TSR peer group
| ABB | Hitachi | Panasonic | ||
| Covidien | Honeywell Int. | Procter & Gamble | ||
| Danaher | Johnson Controls | Schneider Electric | ||
| Eaton | Johnson & Johnson | Siemens | ||
| Electrolux | Legrand | Smiths Group | ||
| Emerson Electric | LG Electronics | Toshiba | ||
| General Electric | Medtronic | 3M |
A ranking approach to TSR applies with Philips itself excluded from the peer group to permit interpolation.
The performance incentive-zone is outlined in the table below:
Philips Group
Performance-incentive zone for TSR in %
|
|
|
|||||||||||||||||||||||||||||||||||
| Position |
³ 21 -14 |
³ 13 | ³ 12 | ³ 11 | ³ 10 | ³ 9 | ³ 8 | ³ 7 |
³ 6 -1 |
|||||||||||||||||||||||||||
|
|
|
|||||||||||||||||||||||||||||||||||
|
Payout |
0 | 60 | 60 | 100 | 120 | 140 | 160 | 180 | 200 | |||||||||||||||||||||||||||
|
|
|
|||||||||||||||||||||||||||||||||||
Under the LTI Plan members of the Board of Management were granted 117,936 performance shares in 2014.
The following tables provide an overview of granted but not yet vested (locked up) stock option grants, an overview of performance shares granted but not yet vested and an overview of restricted share rights granted but not yet released. The reference date for board membership is December 31, 2014.
Philips Group
Performance shares 1)
|
|
|
|||||||||||||||||||||||
| grant date |
number of performance
shares originally granted |
value at grant date |
end of
vesting period |
number of performance
in 2014 |
value at vesting date
in 2014 |
|||||||||||||||||||
|
|
|
|||||||||||||||||||||||
|
F.A. van Houten |
2013 | 2) | 55,000 | 1,233,650 | 2014 | 55,000 | 1,425,600 | |||||||||||||||||
| 2013 | 62,559 | 1,320,000 | 2016 | n.a. | n.a. | |||||||||||||||||||
| 2014 | 59,075 | 1,380,000 | 2017 | n.a. | n.a. | |||||||||||||||||||
|
R.H. Wirahadiraksa |
2013 | 2) | 38,500 | 863,555 | 2014 | 38,500 | 997,920 | |||||||||||||||||
| 2013 | 31,991 | 675,000 | 2016 | n.a. | n.a. | |||||||||||||||||||
| 2014 | 31,036 | 725,000 | 2017 | n.a. | n.a. | |||||||||||||||||||
|
P.A.J. Nota |
2013 | 2) | 38,500 | 863,555 | 2014 | 38,500 | 997,920 | |||||||||||||||||
| 2013 | 29,621 | 625,000 | 2016 | n.a. | n.a. | |||||||||||||||||||
| 2014 | 27,825 | 650,000 | 2017 | n.a. | n.a. | |||||||||||||||||||
|
|
|
|||||||||||||||||||||||
1) Dividend performance shares not included
2) Accelerate! Grant
106 Annual Report 2014
Table of Contents
Supervisory Board report 10.2.7
Philips Group
Stock options
|
|
|
|||||||||||||||||||
| grant date |
number of stock
options |
value at grant date 1) | end of lock-up period |
value at end of lock-
up period 1) |
||||||||||||||||
|
|
|
|||||||||||||||||||
|
F.A. van Houten |
2011 | 75,000 | 366,000 | 2014 | 368,468 | |||||||||||||||
| 2012 | 75,000 | 212,550 | 2015 | n.a. | ||||||||||||||||
| 2013 | 2) | 55,000 | 242,534 | 2016 | n.a. | |||||||||||||||
|
R.H. Wirahadiraksa |
2011 | 51,000 | 248,880 | 2014 | 250,558 | |||||||||||||||
| 2012 | 51,000 | 144,534 | 2015 | n.a. | ||||||||||||||||
| 2013 | 2) | 38,500 | 169,773 | 2016 | n.a. | |||||||||||||||
|
P.A.J. Nota |
2011 | 51,000 | 248,880 | 2014 | 250.558 | |||||||||||||||
| 2012 | 51,000 | 144,534 | 2015 | n.a. | ||||||||||||||||
| 2013 | 2) | 38,500 | 169,773 | 2016 | n.a. | |||||||||||||||
|
|
|
|||||||||||||||||||
1) Value based on Black & Scholes value
2) Accelerate! Grant
Philips Group
Restricted share rights
|
|
|
|||||||||||||||||||
| grant date |
number of
restricted share rights originally granted |
value at grant date |
number of restricted
share rights released in 2014 |
value at release date
in 2014 |
||||||||||||||||
|
|
|
|||||||||||||||||||
|
F.A. van Houten |
2011 | 20,001 | 418,021 | 6,667 | 145,607 | |||||||||||||||
| 2012 | 20,001 | 296,415 | 6,667 | 136,807 | ||||||||||||||||
|
R.H. Wirahadiraksa |
2011 | 13,602 | 284,282 | 4,534 | 99,023 | |||||||||||||||
| 2012 | 13,602 | 201,582 | 4,534 | 93,038 | ||||||||||||||||
|
P.A.J. Nota |
2011 | 13,602 | 284,282 | 4,534 | 99,023 | |||||||||||||||
| 2012 | 13,602 | 201,582 | 4,534 | 93,038 | ||||||||||||||||
|
|
|
|||||||||||||||||||
For more details of the LTI Plan see note 28, Share-based compensation.
10.2.8 Pensions
In 2014 Members of the Board of Management participated in the Executives Pension Plan in the Netherlands consisting of a combination of a defined-benefit (career average) and defined-contribution plan. The target retirement age under the plan is 62.5. The plan does not require employee contributions. For more details, see note 29, Information on remuneration. With effect from January 1, 2015, a revised approach to pensions was implemented driven by changes in Dutch pension legislation, see 2015 outlook at the end of this section for more details.
10.2.9 Additional arrangements
In addition to the main conditions of employment, a number of additional arrangements apply to members of the Board of Management. These additional arrangements, such as expense and relocation allowances, medical insurance, accident insurance and company car arrangements, are in line with those for Philips executives in the Netherlands. In the event of disablement, members of the Board of Management are entitled to benefits in line with those for other Philips executives in the Netherlands.
Unless the law provides otherwise, the members of the Board of Management and of the Supervisory Board shall be reimbursed by the Company for various costs and expenses, like reasonable costs of defending claims, as formalized in the Articles of Association.
Under certain circumstances, described in the Articles of Association, such as an action or failure to act by a member of the Board of Management or a member of the Supervisory Board that can be characterized as intentional (“opzettelijk”), intentionally reckless (“bewust roekeloos”) or seriously culpable (“ernstig verwijtbaar”), there will be no entitlement to this reimbursement. The Company has also taken out liability insurance (D&O—Directors & Officers) for the persons concerned.
10.2.10 Remuneration of Supervisory Board
The table below gives an overview of the remuneration structure, which has remained unchanged since 2008.
Philips Group
Remuneration Supervisory Board 1) in EUR
2014
|
|
|
|
|
|||||
| Chairman | Member | |||||||
|
|
|
|
|
|||||
|
Supervisory Board |
110,000 | 65,000 | ||||||
|
Audit Committee |
15,000 | 10,000 | ||||||
|
Remuneration Committee |
12,500 | 8,000 | ||||||
|
Corporate Governance and Nomination & Selection Committee |
12,500 | 6,000 | ||||||
|
Fee for intercontinental traveling per trip |
3,000 | 3,000 | ||||||
|
Entitlement to Philips product arrangement |
2,000 | 2,000 | ||||||
|
|
|
|
|
|||||
1) For more details, see note 29, Information on remuneration
Annual Report 2014 107
Table of Contents
Supervisory Board report 10.2.11
10.2.11 Year 2015
Services agreements Board of Management
For the members of the Board of Management, who will be proposed to be re-appointed at the Annual General Meeting on May 7, 2015, an agreement of provision of services for a fixed 4-year period will be concluded instead of a contract of employment pursuant to Dutch law, effective January 1, 2013. In future this will apply to all newly appointed members of the Board of Management.
These agreements will be made public no later than the date on which the 2015 Annual General Meeting of Shareholders will be convened.
The main elements of the (proposed) services agreements will be materially the same as the main elements of the current contracts described above.
Pensions
Due to legislative changes in the Netherlands, the pension arrangement applicable to the members of the Board of Management, the other members of the Executive Committee and the Executives, all working in the Netherlands, needed to be reviewed as of January 1, 2015.
As of this date pension plans which allow pension accrual based on a pensionable salary exceeding an amount of EUR 100,000 are, for fiscal purposes, considered to be non-qualifying schemes. For this reason the Executive Pension Plan in the Netherlands will be terminated.
The following pension arrangement will apply to the members of the Board of Management with effect from January 1, 2015:
| • |
members will participate in the Flex Pension Plan in the Netherlands (retirement age: 67), which is a defined-benefit plan with an accrual percentage of 1.85 and a maximum pensionable salary of EUR 100,000; |
| • |
a gross Pension Allowance will be paid equal to 25% of the base salary exceeding EUR 100,000; |
| • |
for a maximum period of 8 years (first 5 years in full; year 6: 75%; year 7: 50%, year 8: 25%) a gross Transition Allowance will be paid to those members who were eligible to it under the former pension arrangement and will be based on the age and salary of the Executive on December 31, 2014. |
The total contribution of the Company towards this new pension arrangement (including the temporary Transition Allowance) will be comparable to the contribution made under the former pension arrangement.
10.3 Report of the Audit Committee
The Audit Committee is chaired by Jackson Tai, and its other members are Neelam Dhawan, Kees van Lede, Heino von Prondzynski and Orit Gadiesh. Jeroen van der Veer also regularly participated in Audit Committee meetings. The Committee assists the Supervisory Board in fulfilling its supervisory responsibilities for (inter alia) ensuring the integrity of the Company’s financial statements and reviewing the Company’s internal controls.
The Audit Committee met for four quarterly meetings and one education and training session during 2014 and reported its findings to the plenary Supervisory Board. The CEO, the CFO, the Chief Legal Officer, the Head of Internal Audit, the Group Controller and the external auditor (KPMG Accountants N.V.) attended all regular meetings.
Furthermore, the Committee met each quarter separately with each of the CEO, the CFO, the Chief Legal Officer, the Head of Internal Audit and the external auditor as well as on an ad hoc basis with other company employees, such as the Group Treasurer, the Group Controller and Head of Financial Risk and Pensions Management.
The overview below indicates some of the matters that were discussed during meetings throughout 2014:
| • |
The Company’s 2014 annual and interim financial statements, including non-financial information, prior to publication thereof. The Committee also assessed in its quarterly meetings the adequacy and appropriateness of internal control policies and internal audit programs and their findings. |
| • |
Matters relating to accounting policies, financial risks and compliance with accounting standards. Compliance with statutory and legal requirements and regulations, particularly in the financial domain, was also reviewed. Important findings, Philips’ major areas of risk (including the internal auditor’s reporting thereon, and the Chief Legal Officer’s review of litigation and other claims) and follow-up action and appropriate measures were examined thoroughly. |
Specifically, the Committee reviewed the Company’s pension liabilities and its program to de-risk future pension liabilities and related economic, accounting and legal implications. The Committee reviewed the Company’s cash flow generation, liquidity and headroom throughout the year to undertake its financial commitments, including the Company’s share repurchase program and payment of dividends. The Committee also reviewed the goodwill impairment test performed in the second quarter, risk management, tax issues, IT strategy and transformation (including information security) and remediation of IT-related internal control findings, the company’s finance transformation,
108 Annual Report 2014
Table of Contents
Supervisory Board report 10.3
developments in regulatory investigations as well as legal proceedings including antitrust investigations and related provisions, environmental exposures, the Company’s outsourcing of certain services, specific finance topics including non-manufacturing costs, the Company’s currency hedging practices and the impact of certain potential acquisitions.
| • |
With regard to the internal audit, the Committee reviewed, and if required approved, the internal audit charter, audit plan, audit scope and its coverage in relation to the scope of the external audit, as well as the staffing, independence and organizational structure of the internal audit function. |
| • |
With regard to the external audit, the Committee reviewed the proposed audit scope, approach and fees, the independence of the external auditor, non-audit services provided by the external auditor in conformity with the Philips Auditor Policy, as well as any changes to this policy. The Committee also reviewed the independence as well as its professional fitness and good standing of the external auditor and its engagement partners. For information on the fees of KPMG Accountants N.V., please refer to the table ‘Fees KPMG’ in note 6, Income from operations. |
| • |
The Company’s policy on business controls, the General Business Principles including the deployment thereof and amendments thereto. The Committee was informed on, and it discussed and monitored closely the Company’s internal control certification processes, in particular compliance with section 404 of the US Sarbanes-Oxley Act and its requirements regarding assessment, review and monitoring of internal controls. It also discussed on a regular basis the developments in and findings resulting from investigations into alleged violations of the Philips GBP and, if required, any measures taken. |
Under Dutch legislation on mandatory auditor rotation, which has also been reflected in the Auditor Policy (please refer to chapter 11, Corporate governance, of this report for more information), Philips must engage a new audit firm for its statutory audit for the financial year starting January 1, 2016. The Committee, jointly with management, conducted a comprehensive tender and selection process for a new external auditor (incorporating an interim period of one year with the current external auditor) and resolved to recommend to the Supervisory Board the appointment of a new auditor. This resulted in the Supervisory Board proposing and recommending the appointment of Ernst & Young Accountants LLP as the company’s new auditor at the upcoming 2015 Annual General Meeting of Shareholders. Please refer to the agenda and explanatory notes thereto for such meetings for more information.
During each Audit Committee meeting, the Committee reviewed the report from the external auditor in which the auditor set forth its findings and attention points during the relevant period. The Committee also assessed the overall performance of the external auditor, as required by the Auditor Policy. Please refer to the agenda and explanatory notes thereto for the upcoming 2015 Annual General Meeting of Shareholders for more information on the proposed appointment of the external auditor.
Finally, the Audit Committee also participated in an education session during 2014 on the quality and regulatory aspects of the industries in which the company is active.
Annual Report 2014 109
Table of Contents
Corporate governance 11
Corporate governance of the Philips Group - Introduction
Koninklijke Philips N.V., a company organized under Dutch law, is the parent company of the Philips Group. The Company, which started as a limited partnership with the name Philips & Co in Eindhoven, the Netherlands, in 1891, was converted into the company with limited liability N.V. Philips’ Gloeilampenfabrieken on September 11, 1912. The Company’s name was changed to Philips Electronics N.V. on May 6, 1994, to Koninklijke Philips Electronics N.V. on April 1, 1998, and to Koninklijke Philips N.V. on May 15, 2013. Its shares have been listed on the Amsterdam Stock Exchange, Euronext Amsterdam, since 1912. The shares have been traded in the United States since 1962 and have been listed on the New York Stock Exchange since 1987.
Over the last decades the Company has pursued a consistent policy to improve its corporate governance in line with Dutch, US and international (codes of) best practices. The Company has incorporated a fair disclosure practice in its investor relations policy, has strengthened the accountability of its executive management and its independent supervisory directors, and has increased the rights and powers of shareholders and the communication with investors. The Company is required to comply with, inter alia, Dutch Corporate Governance rules, the US Sarbanes-Oxley Act, other US securities laws and related regulations (including applicable stock exchange rules), insofar as applicable to the Company. A summary of significant differences between the Company’s corporate governance practice and the New York Stock Exchange corporate governance standards is published on the Company’s website ( www.philips.com/investor ).
In this report, the Company addresses its overall corporate governance structure and states to what extent and how it applies the principles and best practice provisions of the Dutch Corporate Governance Code (as revised on December 10, 2008; the ‘Dutch Corporate Governance Code’). This report also includes the information which the Company is required to disclose pursuant to the Dutch governmental decree on Article 10 Takeover Directive and the governmental decree on Corporate Governance. Deviations from aspects of the corporate governance structure of the Company, when deemed necessary in the interests of the Company, will be disclosed in the Annual Report. Substantial changes in the Company’s corporate governance structure and in the Company’s compliance with the Dutch Corporate Governance Code, if any, will be submitted to the General Meeting of Shareholders for discussion under a separate agenda item. The Supervisory Board and the Board of Management, which are responsible for the corporate governance structure of the Company, are of the opinion that the principles and best practice provisions of the Dutch Corporate Governance Code that are addressed to the Board of Management and the Supervisory Board, interpreted and implemented in line with the best practices followed by the Company, are being applied.
Introduction
The Board of Management is entrusted with the management of the Company. Certain key officers have been appointed to manage the Company together with the Board of Management. The members of the Board of Management and these key officers together constitute the Executive Committee (the ‘Executive Committee’). Under the chairmanship of the President/Chief Executive Officer (‘CEO’) the members of the Executive Committee share responsibility for the deployment of its strategy and policies, and the achievement of its objectives and results. The Executive Committee has, for practical purposes, adopted a division of responsibilities indicating the functional and business areas monitored and reviewed by the individual members. For the purpose of this document, where the Executive Committee is mentioned this also includes the Board of Management unless the context requires otherwise.
The Board of Management remains accountable for the actions and decisions of the Executive Committee and has ultimate responsibility for the Company’s management and the external reporting and is answerable to shareholders of the Company at the Annual General Meeting of Shareholders.
All resolutions of the Executive Committee are adopted by majority vote comprising the majority of the members of the Board of Management present or represented, such majority comprising the vote of the CEO. The Board of Management retains the authority to, at all times and in all circumstances, adopt resolutions without the participation of the other members of the Executive Committee. In discharging its duties, the Executive Committee shall be guided by the interests of the Company and its affiliated enterprise, taking into consideration the interests of the Company’s stakeholders.
The Executive Committee is supervised by the Supervisory Board and provides the latter with all information the Supervisory Board needs to fulfill its own responsibilities. Major decisions of the Board of Management and Executive Committee require the approval of the Supervisory Board; these include decisions concerning (a) the operational and financial objectives of the Company, (b) the strategy designed to achieve the objectives, (c) if necessary, the parameters to be applied in relation to the strategy and (d) corporate social responsibility issues that are relevant to the Company.
110 Annual Report 2014
Table of Contents
Corporate governance 11.1
The Executive Committee follows the Rules of Procedure of the Board of Management and Executive Committee, which set forth procedures for meetings, resolutions and minutes. These Rules of Procedure are published on the Company’s website.
(Term of) Appointment and conflicts of interests
Members of the Board of Management as well as the CEO are appointed by the General Meeting of Shareholders upon a binding recommendation drawn up by the Supervisory Board after consultation with the CEO. This binding recommendation may be overruled by a resolution of the General Meeting of Shareholders adopted by a simple majority of the votes cast and representing at least one-third of the issued share capital. If a simple majority of the votes cast is in favor of the resolution to overrule the binding recommendation, but such majority does not represent at least one-third of the issued share capital, a new meeting may be convened at which the resolution may be passed by a simple majority of the votes cast, regardless of the portion of the issued share capital represented by such majority. In the event a binding recommendation has been overruled, a new binding recommendation shall be submitted to the General Meeting of Shareholders. If such second binding recommendation has been overruled, the General Meeting of Shareholders shall be free to appoint a board member.
Members of the Board of Management and the CEO are appointed for a term of four years, it being understood that this term expires at the end of the General Meeting of Shareholders to be held in the fourth year after the year of their appointment. Reappointment is possible for consecutive terms of four years or, if applicable, until a later retirement date or other contractual termination date in the fourth year, unless the General Meeting of Shareholders resolves otherwise. Members may be suspended by the Supervisory Board and by the General Meeting of Shareholders and dismissed by the latter. Individual data on the members of the Board of Management and Executive Committee are published in chapter 8, Management, of this report.
The other members of the Executive Committee are appointed, suspended and dismissed by the CEO, subject to approval by the Supervisory Board.
The acceptance by a member of the Board of Management of a position as a member of a supervisory board or a position of non-executive director in a one-tier board (a ‘Non-Executive Directorship’) at another company requires the approval of the Supervisory Board. The Supervisory Board is required to be notified of other important positions (to be) held by a member of the Board of Management. Under the Dutch Corporate Governance Code, no member of the Board of Management shall hold more than two Non-Executive Directorships at listed companies, or is a chairman of a supervisory board or one-tier board, other than of a Group company or participating interest of the Company. Dutch legislation provides for further limitations on the Non-Executive Directorships. No member of the Board of Management shall hold more than two Non-Executive Directorships at ‘large’ companies (naamloze vennootschappen or besloten vennootschappen) or ‘large’ foundations (stichtingen) as defined under Dutch law and no member of the Board of Management shall hold the position of chairman of another one-tier board or the position of chairman of another supervisory board. In order for a company or foundation to be regarded as large, it must meet at least two of the following criteria: (i) the value of the assets according to the balance sheet with explanatory notes, considering the acquisition or manufacturing price, exceeds EUR 17.5 million; (ii) the net turnover exceeds EUR 35 million; or (iii) the average number of employees equals or exceeds 250. During the financial year 2014 all members of the Board of Management complied with the limitations on Non-Executive Directorships described above.
Pursuant to Dutch legislation on board diversity, the Company must pursue a policy of having at least 30% of the seats on the Board of Management held by men and at least 30% of the seats held by women. The rule will cease to have effect on January 1, 2016. For more details on board diversity please be referred to section 10.1, Report of the Corporate Governance and Nomination & Selection Committee, of this report.
Dutch legislation on conflicts of interests provides that a member of the Board of Management may not participate in the adoption of resolutions if he or she has a direct or indirect personal conflict of interest with the Company or related enterprise. If all members of the Board of Management have a conflict, the resolution concerned will be adopted by the Supervisory Board. The Company’s corporate governance includes rules to specify situations in which a (potential) conflict may exist, to avoid (potential) conflicts of interests as much as possible, and to deal with such conflicts should they arise. The rules on conflicts of interests apply to the other members of the Executive Committee correspondingly.
Relevant matters relating to conflicts of interests, if any, shall be mentioned in the Annual Report for the financial year in question. No such matters have occurred during the financial year 2014.
Amount and composition of the remuneration of the Board of Management
The remuneration of the individual members of the Board of Management is determined by the Supervisory Board on the proposal of the Remuneration Committee of the Supervisory Board, and must be consistent with the policy thereon as adopted by the General Meeting of Shareholders. The current remuneration policy applicable to the Board of Management was adopted by the 2013 Annual General Meeting of Shareholders, and is published on the Company’s website. A full and detailed description of the composition of the remuneration of the individual
Annual Report 2014 111
Table of Contents
Corporate governance 11.1
members of the Board of Management is included in section 10.2, Report of the Remuneration Committee, of this report.
Pursuant to Dutch legislation, the remuneration of the members of the Board of Management and the Supervisory Board must be included as a separate agenda item in the convening notice for a General Meeting of Shareholders and must be dealt with before the meeting can proceed to consider and adopt the Annual Accounts.
The remuneration structure of the Company, including severance pay, is such that it promotes the interests of the Company in the medium and long-term, does not encourage members of the Board of Management to act in their own interests and neglect the interests of the Company, and does not reward failing members of the Board of Management upon termination of their employment. The level and structure of remuneration shall be determined in the light of factors such as the results, the share price performance and other developments relevant to the Company. Deviations on elements of the remuneration policy in extraordinary circumstances, when deemed necessary in the interests of the Company, will be disclosed in the Annual Report or, in case of an appointment, in good time prior to the appointment of the person concerned.
All current members of the Board of Management are employed by means of a contract of employment. Pursuant to Dutch legislation, effective January 1, 2013, a newly appointed or a re-appointed member of the Board of Management will be engaged by means of a services agreement (‘overeenkomst van opdracht’). The main elements of the services agreement - including the amount of the fixed base compensation, the structure and amount of the variable compensation component, any severance plan, pension arrangements and the general performance criteria - shall be made public no later than at the time of issuance of the notice convening the General Meeting of Shareholders in which a proposal for (re-)appointment of that member of the Board of Management has been placed on the agenda. In compliance with the Dutch Corporate Governance Code, the term of the services agreement of the members of the Board of Management is set at four years, and in case of termination, severance payment is limited to a maximum of one year’s base compensation; if the maximum of one-year’s base compensation would be manifestly unreasonable for a member of the Board of Management who is dismissed during his first term of office, the member of the Board of Management shall be eligible for a severance payment not exceeding twice the annual base compensation.
From 2003 until 2013, Philips maintained a Long-Term Incentive Plan (‘LTI Plan’) consisting of a mix of restricted shares rights and stock options for members of the Board of Management, Philips executives and other key employees. Since the full revision in 2013 of the LTI Plan applicable to members of the Board of Management, the plan consists of performance shares only, with a three year post-grant performance measurement. For more details please be referred to section 10.2, Report of the Remuneration Committee, of this report.
The so-called ultimum remedium clause and claw-back clause of best practice provisions II.2.10 and II.2.11 of the Dutch Corporate Governance Code are applicable to Annual Incentive payments and LTI grants for the year 2009 onwards to all members of the Board of Management. In respect of the LTI grants, the ultimum remedium clause can be applied to the performance-related actual number of stock options, restricted share rights and/or performance shares that is granted. In addition, pursuant to new Dutch legislation, effective January 1, 2014, the Supervisory Board will be authorized to change unpaid bonuses awarded to members of the Board of Management if payment or delivery of the bonus would be unacceptable according to the principles of reasonableness and fairness. The Company, which in this respect may also be represented by the Supervisory Board or a special representative appointed for this purpose by the General Meeting of Shareholders, may also claim repayment of bonuses paid or delivered (after December 31, 2013) insofar as these have been granted on the basis of incorrect information on the fulfillment of the relevant performance criteria or other conditions. Bonuses are broadly defined as ‘non-fixed’ remuneration, either in cash or in the form of share-based compensation, that is conditional in whole or in part on the achievement of certain targets or the occurrence of certain circumstances. The explanatory notes to the balance sheet shall report on any moderation and/or claim for repayment of board remuneration. No such moderation or claim for repayment has occurred during the financial year 2014. The new legislation also introduces an obligation for the Company to reduce the remuneration of a member of the Board of Management, if and to the extent the value of such member’s share-based remuneration would have increased as a result of the announcement of a large transaction (requiring shareholder approval) or a public offer for the Company.
Members of the Board of Management hold shares in the Company for the purpose of long-term investment and are required to refrain from short-term transactions in Philips securities. According to the Philips Rules of Conduct on Inside Information, members of the Board of Management are only allowed to trade in Philips securities (including the exercise of stock options) during ‘windows’ of twenty business days following the publication of annual and quarterly results (provided the person involved has no ‘inside information’ regarding Philips at that time unless an exemption is available). Furthermore, the Rules of Procedure of the Board of Management and Executive Committee contain provisions concerning ownership of and transactions in non-Philips securities by members of the Board of Management. Members of the Board of Management are prohibited from trading, directly or indirectly, in securities of any of the companies belonging to the peer group, during one week preceding the disclosure of Philips’ annual or quarterly results. The rules
112 Annual Report 2014
Table of Contents
Corporate governance 11.1
referred to above in this paragraph apply to members of the Executive Committee correspondingly. Transactions in shares in the Company carried out by members of the Board of Management or members of the Supervisory Board and other Insiders (if applicable) are notified to the Netherlands Authority for the Financial Markets (AFM) in accordance with Dutch law and, if necessary, to other relevant authorities.
Indemnification of members of the Board of Management and Supervisory Board
Unless the law provides otherwise, the members of the Board of Management and of the Supervisory Board shall be reimbursed by the Company for various costs and expenses, such as the reasonable costs of defending claims, as formalized in the Articles of Association. Under certain circumstances, described in the Articles of Association, such as an act or failure to act by a member of the Board of Management or a member of the Supervisory Board that can be characterized as intentional (‘opzettelijk’), intentionally reckless (‘bewust roekeloos’) or seriously culpable (‘ernstig verwijtbaar’), there will be no entitlement to this reimbursement unless the law or the principles of reasonableness and fairness require otherwise. The Company has also taken out liability insurance (D&O - Directors & Officers) for the persons concerned.
In line with regulatory requirements, the Company’s policy forbids personal loans to and guarantees on behalf of members of the Board of Management or the Supervisory Board, and no loans and guarantees have been granted and issued, respectively, to such members in 2014, nor are any loans or guarantees outstanding as of December 31, 2014.
The aggregate share ownership of the members of the Board of Management and the Supervisory Board represents less than 1% of the outstanding ordinary shares in the Company.
Risk management approach
Within Philips, risk management forms an integral part of business management. The Company has implemented a risk management and internal control system that is designed to provide reasonable assurance that strategic objectives are met by creating focus, by integrating management control over the Company’s operations, by ensuring compliance with applicable laws and regulations and by safeguarding the reliability of the financial reporting and its disclosures. The Executive Committee reports on and accounts for internal risk management and control systems to the Supervisory Board and its Audit Committee. The Company has designed its internal control system based on the “Internal Control-Integrated Framework (2013)” established by the Committee of Sponsoring Organizations of the Treadway Commission (COSO).
The Company’s risk management approach is embedded in the periodic business planning and review cycle and forms an integral part of business management. On the basis of risk assessments, management determines the risks and appropriate risk responses related to the achievement of business objectives and critical business processes. Risk factors and the risk management approach, as well as the sensitivity of the Company’s results to external factors and variables, are described in more detail in chapter 7, Risk management, of this report. Significant changes and improvements in the Company’s risk management and internal control system have been discussed with the Supervisory Board’s Audit Committee and the external auditor and are disclosed in that section as well.
With respect to financial reporting a structured self-assessment and monitoring process is used company-wide to assess, document, review and monitor compliance with internal control over financial reporting. Internal representations received from management, regular management reviews, reviews of the design and effectiveness of internal controls and reviews in group and sector audit committees are integral parts of the Company’s risk management approach. On the basis thereof, the Board of Management confirms that internal controls over financial reporting provide a reasonable level of assurance that the financial reporting does not contain any material inaccuracies, and confirms that these controls have properly functioned in 2014. The financial statements fairly represent the financial condition and result of operations of the Company and provide the required disclosures.
It should be noted that the above does not imply that these systems and procedures provide certainty as to the realization of operational and financial business objectives, nor can they prevent all misstatements, inaccuracies, errors, fraud and non-compliances with rules and regulations.
In view of the above the Board of Management believes that it is in compliance with the requirements of recommendation II.1.4. of the Dutch Corporate Governance Code. The above statement on internal controls should not be construed as a statement in response to the requirements of section 404 of the US Sarbanes-Oxley Act. The statement as to compliance with section 404 is set forth in the section 12.1, Management’s report on internal control, of this report.
Philips has a financial code of ethics which applies to certain senior officers, including the CEO and CFO, and to employees performing an accounting or financial function (the financial code of ethics has been published on the Company’s website). The Company, through the Supervisory Board’s Audit Committee, also has appropriate procedures in place for the receipt, retention and treatment of complaints received by the Company regarding accounting, internal accounting
Annual Report 2014 113
Table of Contents
Corporate governance 11.1
controls or auditing matters and the confidential, anonymous submission by employees of concerns regarding questionable accounting or auditing matters. Internal ‘whistleblowers’ have the opportunity, without jeopardizing their position, to report on irregularities of a general, operational or financial nature and to report complaints about members of the Executive Committee to the Chairman of the Supervisory Board.
In view of the requirements under the US Securities Exchange Act, procedures are in place to enable the CEO and the CFO to provide certifications with respect to the Annual Report on Form 20-F.
A Disclosure Committee is in place, which advises the various officers and departments involved, including the CEO and the CFO, on the timely review, publication and filing of periodic and current (financial) reports. In addition to the certification by the CEO and CFO under US law, each individual member of the Board of Management and the Supervisory Board must under Dutch law, sign the Group and Company financial statements being disclosed and submitted to the General Meeting of Shareholders for adoption. If one or more of their signatures is missing, this shall be stated, and the reasons given for this. The members of the Board of Management issue the responsibility statement with regard to chapter 12, Group financial statements, of this report, as required by applicable Dutch company law and securities law.
Introduction
The Supervisory Board supervises the policies of the Board of Management and Executive Committee and the general course of affairs of Philips and advises the executive management thereon. The Supervisory Board, in the two-tier corporate structure under Dutch law, is a separate body that is independent of the Board of Management. Its independent character is also reflected in the requirement that members of the Supervisory Board can be neither a member of the Board of Management nor an employee of the Company. The Supervisory Board considers all its members to be independent pursuant to the Dutch Corporate Governance Code and under the applicable US Securities and Exchange Commission standards.
The Supervisory Board, acting in the interests of the Company and the Group and taking into account the relevant interest of the Company’s stakeholders, supervises and advises the Board of Management and Executive Committee in performing its management tasks and setting the direction of the Group’s business, including (a) the Philips group’s performance, (b) the Philips group’s general strategy and the risks connected to its business activities, (c) the operational and financial objectives, (d) the parameters to be approved in relation to the strategy, (e) corporate social responsibility issues (f) the structure and management of the systems of internal business controls, (g) the financial reporting process, (h) the compliance with applicable laws and regulations, (i) the company-shareholders relationship, and (j) the corporate governance structure of the Company. The Group’s strategy and major management decisions are discussed with and approved by the Supervisory Board. For a description of further responsibilities and tasks of the Supervisory Board please refer to the Supervisory Board’s Rules of Procedure which is published on the Company’s website.
In its report, the Supervisory Board describes the composition and functioning of the Supervisory Board and its committees, the activities of the board and its committees in the financial year, the number of committee meetings and the main items discussed.
Rules of Procedure of the Supervisory Board
The Supervisory Board’s Rules of Procedure set forth its own governance rules (including meetings, items to be discussed, resolutions, appointment and re-election, committees, conflicts of interests, trading in securities, profile of the Supervisory Board). Its composition follows the profile, which aims for an appropriate combination of knowledge and experience among its members encompassing marketing, technological, manufacturing, financial, economic, social and legal aspects of international business and government and public administration in relation to the global and multi-product character of the Group’s businesses. The Supervisory Board attaches great importance to diversity in its composition. More particularly, it aims at having members with a European and a non-European background (nationality, working experience or otherwise) and one or more members with an executive or similar position in business or society no longer than 5 years ago.
Pursuant to Dutch legislation on board diversity, the Company shall pursue a policy of having at least 30% of the seats on the Supervisory Board held by men and at least 30% of the seats held by women. The rule will cease to have effect on January 1, 2016. For more details on board diversity please be referred to section 10.1, Report of the Corporate Governance and Nomination & Selection Committee, of this report.
The Rules of Procedure of the Supervisory Board are published on the Company’s website. They include the charters of its committees, to which the plenary Supervisory Board, while retaining overall responsibility, has assigned certain tasks: the Corporate Governance and Nomination & Selection Committee, the Audit Committee and the Remuneration Committee. Each committee reports, and submits its minutes for information, to the Supervisory Board.
In line with US and Dutch best practices, the Chairman of the Supervisory Board must be independent pursuant to the Dutch Corporate Governance Code and under the applicable US standards. Furthermore, the Dutch Corporate Governance Code allows a maximum
114 Annual Report 2014
Table of Contents
Corporate governance 11.2
of one member of each Supervisory Board committee not to be independent (as defined by the Code). As mentioned in the introduction of this section 11.2 above, the Supervisory Board considers all its members to be independent.
The Supervisory Board is assisted by the General Secretary of the Company. The General Secretary sees to it that correct procedures are followed and that the Supervisory Board acts in accordance with its statutory obligations and its obligations under the Articles of Association. Furthermore the General Secretary assists the Chairman of the Supervisory Board in the actual organization of the affairs of the Supervisory Board (information, agenda, evaluation, introductory program) and is the contact person for interested parties who want to make concerns known to the Supervisory Board. The General Secretary shall, either on the recommendation of the Supervisory Board or otherwise, be appointed and may be dismissed by the Board of Management, after the approval of the Supervisory Board has been obtained.
(Term of) Appointment, individual data and conflicts of interests
The Supervisory Board consists of at least five members (currently eight), including a Chairman, Vice-Chairman and Secretary. The Dutch ‘structure regime’ does not apply to the Company itself. Members are currently appointed by the General Meeting of Shareholders for fixed terms of four years, upon a binding recommendation from the Supervisory Board. According to the Company’s Articles of Association, this binding recommendation may be overruled by a resolution of the General Meeting of Shareholders adopted by a simple majority of the votes cast and representing at least one-third of the issued share capital. If a simple majority of the votes cast is in favor of the resolution to overrule the binding recommendation, but such majority does not represent at least one-third of the issued share capital, a new meeting may be convened at which the resolution may be passed by a simple majority of the votes cast, regardless of the portion of the issued share capital represented by such majority. In the event a binding recommendation has been overruled, a new binding recommendation shall be submitted to the General Meeting of Shareholders. If such second binding recommendation has been overruled, the General Meeting of Shareholders shall be free to appoint a board member.
There is no age limit applicable, and members are eligible for re-election twice (unless the Supervisory Board resolves to deviate in a specific case). The date of expiration of the terms of Supervisory Board members is published on the Company’s website. Individual data on the members of the Supervisory Board are published in the Annual Report, and updated on the Company’s website. Members may be suspended and dismissed by the General Meeting of Shareholders. In the event of inadequate performance, structural incompatibility of interests, and in other instances in which resignation is deemed necessary in the opinion of the Supervisory Board, the Supervisory Board shall submit to the General Meeting of Shareholders a proposal to dismiss the respective member of the Supervisory Board.
After their appointment, all members of the Supervisory Board shall follow an introductory program, which covers general financial and legal affairs, financial reporting by the Company, any specific aspects that are unique to the Company and its business activities, and the responsibilities of a Supervisory Board member. Any need for further training or education of members will be reviewed annually, also on the basis of an annual evaluation survey.
Under the Dutch Corporate Governance Code, no member of the Supervisory Board shall hold more than five supervisory board memberships of Dutch listed companies, the chairmanship of a supervisory board counting as two regular memberships. In addition, Dutch legislation provides that no member of the Supervisory Board shall hold more than five Non-Executive Directorships at ‘large’ companies or foundations as defined under Dutch law (see section 11.1, Board of Management, of this report), with a position as chairman counting for two. During the financial year 2014 all members of the Supervisory Board complied with the limitations on Non-Executive Directorships described above.
Dutch legislation on conflicts of interests provides that a member of the Supervisory Board may not participate in the adoption of resolutions if he or she has a direct or indirect personal conflict of interest with the Company or related enterprise. If all members of the Supervisory Board have a conflict, the resolution concerned will be adopted by the General Meeting of Shareholders. The Company’s corporate governance includes rules to specify situations in which a (potential) conflict may exist, to avoid (potential) conflicts of interests as much as possible, and to deal with such conflicts should they arise.
Relevant matters relating to conflicts of interests, if any, shall be mentioned in the Annual Report for the financial year in question. No decisions to enter into material transactions in which there are conflicts of interest with members of the Supervisory Board were taken during the financial year 2014.
Meetings of the Supervisory Board
The Supervisory Board meets at least six times per year, including a meeting on strategy. The Supervisory Board, on the advice of its Audit Committee, also discusses, in any event at least once a year, the main risks of the business, and the result of the assessment of the structure and operation of the internal risk management and control systems, as well as any significant changes thereto. The members of the Executive Committee attend meetings of the
Annual Report 2014 115
Table of Contents
Corporate governance 11.2
Supervisory Board except in matters such as the desired profile, composition and competence of the Supervisory Board and the Executive Committee, as well as the remuneration and performance of individual members of the Executive Committee and the conclusions that must be drawn on the basis thereof. In addition to these items, the Supervisory Board, being responsible for the quality of its own performance, discusses, at least once a year on its own, without the members of the Executive Committee being present, (i) both its own functioning and that of the individual members, and the conclusions that must be drawn on the basis thereof, as well as (ii) both the functioning of the Board of Management and that of the individual members, and the conclusions that must be drawn on the basis thereof. The President/CEO and other members of the Executive Committee have regular contacts with the Chairman and other members of the Supervisory Board. The Executive Committee is required to keep the Supervisory Board informed of all facts and developments concerning Philips that the Supervisory Board may need in order to function as required and to properly carry out its duties, to consult it on important matters and to submit certain important decisions to it for its prior approval. The Supervisory Board and its individual members each have their own responsibility to request from the Executive Committee and the external auditor all information that the Supervisory Board needs in order to be able to carry out its duties properly as a supervisory body. If the Supervisory Board considers it necessary, it may obtain information from officers and external advisers of the Company. The Company provides the necessary means for this purpose. The Supervisory Board may also require that certain officers and external advisers attend its meetings.
The Chairman of the Supervisory Board
The Supervisory Board’s Chairman will see to it that: (a) the members of the Supervisory Board follow their introductory program, (b) the members of the Supervisory Board receive in good time all information which is necessary for the proper performance of their duties, (c) there is sufficient time for consultation and decision-making by the Supervisory Board, (d) the committees of the Supervisory Board function properly, (e) the performance of the Executive Committee members and Supervisory Board members is assessed at least once a year, and (f) the Supervisory Board elects a Vice-Chairman. The Vice-Chairman of the Supervisory Board shall deputize for the Chairman when the occasion arises. The Vice-Chairman shall act as contact of individual members of the Supervisory Board or the Board of Management concerning the functioning of the Chairman of the Supervisory Board.
Remuneration of the Supervisory Board and share ownership
The remuneration of the individual members of the Supervisory Board, as well as the additional remuneration for its Chairman and the members of its committees is determined by the General Meeting of Shareholders. The remuneration of a Supervisory Board member is not dependent on the results of the Company. Further details are published in the Supervisory Board report.
Shares or rights to shares shall not be granted to a Supervisory Board member. In accordance with the Rules of Procedure of the Supervisory Board, any shares in the Company held by a Supervisory Board member are long-term investments. The Supervisory Board has adopted a policy on ownership of and transactions in non-Philips securities by members of the Supervisory Board. This policy is included in the Rules of Procedure of the Supervisory Board.
The Corporate Governance and Nomination & Selection Committee
The Corporate Governance and Nomination & Selection Committee consists of at least the Chairman and Vice-Chairman of the Supervisory Board. The Committee reviews the corporate governance principles applicable to the Company at least once a year, and advises the Supervisory Board on any changes to these principles as it deems appropriate. It also (a) draws up selection criteria and appointment procedures for members of the Supervisory Board, the Board of Management and the Executive Committee; (b) periodically assesses the size and composition of the Supervisory Board, the Board of Management and the Executive Committee, and makes the proposals for a composition profile of the Supervisory Board, if appropriate; (c) periodically assesses the functioning of individual members of the Supervisory Board, the Board of Management and the Executive Committee, and reports on this to the Supervisory Board. The Committee also consults with the President/CEO and the Executive Committee on candidates to fill vacancies on the Supervisory Board, the Executive Committee, and advises the Supervisory Board on the candidates for appointment. It further supervises the policy of the Executive Committee on the selection criteria and appointment procedures for Philips Executives.
The Remuneration Committee
The Remuneration Committee meets at least twice a year and is responsible for preparing decisions of the Supervisory Board on the remuneration of individual members of the Board of Management and the Executive Committee.
The Remuneration Committee prepares an annual remuneration report. The remuneration report contains an account of the manner in which the remuneration policy has been implemented in the past financial year, as well as an overview of the implementation of the remuneration policy planned by the Supervisory Board for the next year(s). The Supervisory Board aims to have appropriate experience available within the Remuneration Committee. No more than one member of the Remuneration Committee shall be an executive board member of another Dutch listed company.
116 Annual Report 2014
Table of Contents
Corporate governance 11.2
In performing its duties and responsibilities the Remuneration Committee is assisted by an in-house remuneration expert acting on the basis of a protocol ensuring that the expert acts on the instructions of the Remuneration Committee and on an independent basis in which conflicts of interests are avoided.
The Audit Committee
The Audit Committee meets at least four times a year, before the publication of the annual, semi-annual and quarterly results. All of the members of the Audit Committee are considered to be independent under the applicable US Securities and Exchange Commission rules and at least one of the members of the Audit Committee, which currently consists of five members of the Supervisory Board, is a financial expert as set out in the Dutch Corporate Governance Code and each member is financially literate. In accordance with this code, a financial expert has relevant knowledge and experience of financial administration and accounting at the company in question. None of the members of the Audit Committee is designated as an Audit Committee financial expert as defined under the regulations of the US Securities and Exchange Commission. The Supervisory Board considers the fact of being compliant with the Dutch Corporate Governance Code, in combination with the expertise and experience available in the Audit Committee as well as the possibility to take advice from internal and external experts and advisors, to be sufficient for the fulfillment of the tasks and responsibilities of the Audit Committee. The Audit Committee may not be chaired by the Chairman of the Supervisory Board or by a (former) member of the Board of Management.
The tasks and functions of the Audit Committee, as described in its charter, which is published on the Company’s website as part of the Rules of Procedure of the Supervisory Board, include the duties recommended in the Dutch Corporate Governance Code. More specifically, the Audit Committee assists the Supervisory Board in fulfilling its oversight responsibilities for the integrity of the Company’s financial statements, the financial reporting process, the system of internal business controls and risk management, the internal and external audit process, the internal and external auditor’s qualifications, its independence and its performance, as well as the Company’s process for monitoring compliance with laws and regulations and the General Business Principles (GBP). It reviews the Company’s annual and interim financial statements, including non-financial information, prior to publication and advises the Supervisory Board on the adequacy and appropriateness of internal control policies and internal audit programs and their findings.
In reviewing the Company’s annual and interim statements, including non-financial information, and advising the Supervisory Board on internal control policies and internal audit programs, the Audit Committee reviews matters relating to accounting policies and compliance with accounting standards, compliance with statutory and legal requirements and regulations, particularly in the financial domain. Important findings and identified risks are examined thoroughly by the Audit Committee in order to allow appropriate measures to be taken. With regard to the internal audit, the Audit Committee, in cooperation with the external auditor, reviews the internal audit charter, audit plan, audit scope and its coverage in relation to the scope of the external audit, staffing, independence and organizational structure of the internal audit function.
With regard to the external audit, the Audit Committee reviews the proposed audit scope, approach and fees, the independence of the external auditor, its performance and its (re-)appointment, audit and permitted non-audit services provided by the external auditor in conformity with the Philips Policy on Auditor Independence, as well as any changes to this policy. The Audit Committee also considers the report of the external auditor and its report with respect to the annual financial statements. According to the procedures, the Audit Committee acts as the principal contact for the external auditor if the auditor discovers irregularities in the content of the financial reports. It also advises on the Supervisory Board’s statement to shareholders in the annual accounts. The Audit Committee periodically discusses the Company’s policy on business controls, the GBP including the deployment thereof, overviews on tax, IT, litigation and legal proceedings, environmental exposures, financial exposures in the area of treasury, real estate, pensions, and the Group’s major areas of risk. The Company’s external auditor, in general, attends all Audit Committee meetings and the Audit Committee meets separately at least on a quarterly basis with each of the President/ CEO, the CFO, the internal auditor and the external auditor.
11.3 General Meeting of Shareholders
Introduction
A General Meeting of Shareholders is held at least once a year to discuss the Annual Report, including the report of the Board of Management, the annual financial statements with explanatory notes thereto and additional information required by law, and the Supervisory Board report, any proposal concerning dividends or other distributions, the appointment of members of the Board of Management and Supervisory Board (if any), important management decisions as required by Dutch law, and any other matters proposed by the Supervisory Board, the Board of Management or shareholders in accordance with the provisions of the Company’s Articles of Association. The Annual Report, the financial statements and other regulated information such as defined in the Dutch Act on Financial Supervision ( Wet op het Financieel Toezicht ), will solely be published in English. As a separate agenda item and in application of Dutch law, the General Meeting of Shareholders discusses the
Annual Report 2014 117
Table of Contents
Corporate governance 11.3
discharge of the members of the Board of Management and the Supervisory Board from responsibility for the performance of their respective duties in the preceding financial year. However, this discharge only covers matters that are known to the Company and the General Meeting of Shareholders when the resolution is adopted. The General Meeting of Shareholders is held in Eindhoven, Amsterdam, Rotterdam, The Hague, Utrecht or Haarlemmermeer (Schiphol Airport) no later than six months after the end of the financial year.
Meetings are convened by public notice, via the Company’s website or other electronic means of communication and to registered shareholders by letter or by the use of electronic means of communication, at least 42 days prior to the (Extraordinary) General Meeting of Shareholders. Extraordinary General Meetings of Shareholders may be convened by the Supervisory Board or the Board of Management if deemed necessary and must be held if shareholders jointly representing at least 10% of the outstanding share capital make a written request to that effect to the Supervisory Board and the Board of Management, specifying in detail the business to be dealt with. The agenda of a General Meeting of Shareholders shall contain such business as may be placed thereon by the Board of Management or the Supervisory Board, and agenda items will be explained where necessary in writing. The agenda shall list which items are for discussion and which items are to be voted upon. Material amendments to the Articles of Association and resolutions for the appointment of members of the Board of Management and Supervisory Board shall be submitted separately to the General Meeting of Shareholders, it being understood that amendments and other proposals that are connected in the context of a proposed (part of the) governance structure may be submitted as one proposal. In accordance with the Articles of Association and Dutch law, requests from shareholders for items to be included on the agenda will generally be honored, subject to the Company’s rights to refuse to include the requested agenda item under Dutch law, provided that such requests are made in writing at least 60 days before a General Meeting of Shareholders to the Board of Management and the Supervisory Board by shareholders representing at least 1% of the Company’s outstanding capital or, according to the official price list of Euronext Amsterdam, representing a value of at least EUR 50 million. Written requests may be submitted electronically and shall comply with the procedure stipulated by the Board of Management, which procedure is posted on the Company’s website. Pursuant to Dutch legislation, shareholders requesting an item to be included on the agenda, have an obligation to disclose their full economic interest (i.e. long position and short position) to the Company. The Company has the obligation to publish such disclosures on its website.
Main powers of the General Meeting of Shareholders
All outstanding shares carry voting rights. The main powers of the General Meeting of Shareholders are to appoint, suspend and dismiss members of the Board of Management and of the Supervisory Board, to adopt the annual accounts, declare dividends and to discharge the Board of Management and the Supervisory Board from responsibility for the performance of their respective duties for the previous financial year, to appoint the external auditor as required by Dutch law, to adopt amendments to the Articles of Association and proposals to dissolve or liquidate the Company, to issue shares or rights to shares, to restrict or exclude pre-emptive rights of shareholders and to repurchase or cancel outstanding shares. Following common corporate practice in the Netherlands, the Company each year requests limited authorization to issue (rights to) shares, to restrict or exclude pre-emptive rights and to repurchase shares. In compliance with Dutch law, decisions of the Board of Management that are so far-reaching that they would greatly change the identity or nature of the Company or the business require the approval of the General Meeting of Shareholders. This includes resolutions to (a) transfer the business of the Company, or almost the entire business of the Company, to a third-party (b) enter into or discontinue long-term cooperation by the Company or a subsidiary with another legal entity or company or as a fully liable partner in a limited partnership or ordinary partnership, if this cooperation or its discontinuation is of material significance to the Company or (c) acquire or dispose of a participating interest in the capital of a company to the value of at least one-third of the amount of the assets according to the balance sheet and notes thereto or, if the Company prepares a consolidated balance sheet, according to the consolidated balance sheet and notes thereto as published in the last adopted annual accounts of the Company, by the Company or one of its subsidiaries. Thus the Company applies principle IV.1 of the Dutch Corporate Governance Code within the framework of the Articles of Association and Dutch law and in the manner as described in this corporate governance report.
The Board of Management and Supervisory Board are also accountable, at the Annual General Meeting of Shareholders, for the policy on the additions to reserves and dividends (the level and purpose of the additions to reserves, the amount of the dividend and the type of dividend). This subject is dealt with and explained as a separate agenda item at the Annual General Meeting of Shareholders. A resolution to pay a dividend is dealt with as a separate agenda item at the General Meeting of Shareholders.
The Board of Management and the Supervisory Board are required to provide the General Meeting of Shareholders with all requested information, unless this would be prejudicial to an overriding interest of the Company. If the Board of Management and the
118 Annual Report 2014
Table of Contents
Corporate governance 11.3
Supervisory Board invoke an overriding interest in refusing to provide information, reasons must be given. If a serious private bid is made for a business unit or a participating interest and the value of the bid exceeds a certain threshold (currently one-third of the amount of the assets according to the balance sheet and notes thereto or, if the Company prepares a consolidated balance sheet, according to the consolidated balance sheet and notes thereto as published in the last adopted annual accounts of the Company), and such bid is made public, the Board of Management shall, at its earliest convenience, make public its position on the bid and the reasons for this position.
A resolution to dissolve the Company or change its Articles of Association can be adopted at a General Meeting of Shareholders by at least three-fourths of the votes cast, at which meeting more than half of the issued share capital is represented. If the requisite share capital is not represented, a further meeting shall be convened, to be held within eight weeks of the first meeting, to which no quorum requirement applies. Furthermore, the resolution requires the approval of the Supervisory Board. If the resolution is proposed by the Board of Management, the adoption needs an absolute majority of votes and no quorum requirement applies to the meeting.
Repurchase and issue of (rights to) own shares
At the 2014 Annual General Meeting of Shareholders it was resolved to authorize the Board of Management, subject to the approval of the Supervisory Board, to acquire shares in the Company within the limits of the Articles of Association and within a certain price range up to and including October 31, 2015. The maximum number of shares the company may hold, will not exceed 10% of the issued share capital as of May 1, 2014, which number may be increased by 10% of the issued capital as of that same date in connection with the execution of share repurchase programs for capital reduction programs.
In addition, at the 2014 Annual General Meeting of Shareholders it was resolved to authorize the Board of Management, subject to the approval of the Supervisory Board, to issue shares or grant rights to acquire shares in the Company as well as to restrict or exclude the pre-emption right accruing to shareholders up to and including October 31, 2015. This authorization is limited to a maximum of 10% of the number of shares issued as of May 1, 2014 plus 10% of the issued capital in connection with or on the occasion of mergers and acquisitions.
11.4 Meeting logistics and other information
Introduction
Pursuant to Dutch law, the record date for the exercise of the voting rights and the rights relating to General Meetings of Shareholders is set at the 28th day prior to the day of the meeting. Shareholders registered at such date are entitled to attend the meeting and to exercise the other shareholder rights (in the meeting in question) notwithstanding subsequent sale of their shares thereafter. This date will be published in advance of every General Meeting of Shareholders.
Information which is required to be published or deposited pursuant to the provisions of company law and securities law applicable to the Company and which is relevant to the shareholders, is placed and updated on the Company’s website, or hyperlinks are established. The Board of Management and Supervisory Board shall ensure that the General Meeting of Shareholders is informed of facts and circumstances relevant to proposed resolutions in explanatory notes to the agenda and, if deemed appropriate, by means of a ‘shareholders circular’ published on the Company’s website.
Resolutions adopted at a General Meeting of Shareholders shall be recorded by a civil law notary and co-signed by the chairman of the meeting; such resolutions shall also be published on the Company’s website within 15 days after the meeting. A draft summary of the discussions during the General Meeting of Shareholders, in the language of the meeting, is made available to shareholders, on request, no later than three months after the meeting. Shareholders shall have the opportunity to respond to this summary for three months, after which a final summary is adopted by the chairman of the meeting in question. Such final summary shall be made available on the Company’s website.
Registration, attending meetings and proxy voting
Holders of common shares who wish to exercise the rights attached to their shares in respect of a General Meeting of Shareholders, are required to register for such meeting. Shareholders may attend a General Meeting of Shareholders in person, or may grant a power of attorney to a third-party to attend the meeting and to vote on their behalf. Holders of common shares in bearer form will also be able to give voting instructions via Internet (assuming the agenda for such meeting includes voting items). In addition, the Company will distribute a voting instruction form for a General Meeting of Shareholders. By giving voting instructions via Internet or by returning the form, shareholders grant power to an independent proxy holder who will vote according to the instructions expressly given on the voting instruction form. Also other persons entitled to vote shall be given the possibility to give voting proxies or instructions to an independent third-party prior to the meeting. Details on the registration for meetings, attending and proxy voting will be included in the notice convening a General Meeting of Shareholders.
Annual Report 2014 119
Table of Contents
Corporate governance 11.4
Preference shares and the Stichting Preferente Aandelen Philips
As a means to protect the Company and its stakeholders against an unsolicited attempt to obtain (de facto) control of the Company, the General Meeting of Shareholders in 1989 adopted amendments to the Company’s Articles of Association that allow the Board of Management and the Supervisory Board to issue (rights to) preference shares to a third-party. As a result, the Stichting Preferente Aandelen Philips (the ‘Foundation’) was created, which was granted the right to acquire preference shares in the Company. The mere notification that the Foundation wishes to exercise its rights, should a third-party ever seem likely in the judgment of the Foundation to obtain (de facto) control of the Company, will result in the preference shares being effectively issued. The Foundation may exercise this right for as many preference shares as there are ordinary shares in the Company outstanding at that time. No preference shares have been issued as of December 31, 2014. In addition, the Foundation has the right to file a petition with the Enterprise Chamber of the Amsterdam Court of Appeal to commence an inquiry procedure within the meaning of section 2:344 Dutch Civil Code.
The object of the Foundation is to represent the interests of the Company, the enterprises maintained by the Company and its affiliated companies within the Group, in such a way that the interests of Philips, those enterprises and all parties involved with them are safeguarded as effectively as possible, and that they are afforded maximum protection against influences which, in conflict with those interests, may undermine the autonomy and identity of Philips and those enterprises, and also to do anything related to the above ends or conducive to them. In the event of (an attempt at) a hostile takeover or other attempt to obtain (de facto) control of the Company this arrangement will allow the Company and its Board of Management and Supervisory Board to determine its position in relation to the third-party and its plans, seek alternatives and defend Philips’ interests and those of its stakeholders from a position of strength. The members of the self-electing Board of the Foundation are Messrs P.A.F.W. Elverding, M.W. den Boogert and F.J.G.M. Cremers. No Philips board members or officers are represented on the board of the Foundation.
The Company does not have any other anti-takeover measures in the sense of other measures which exclusively or almost exclusively have the purpose of frustrating future public bids for the shares in the capital of the Company in case no agreement is reached with the Board of Management on such public bid. Furthermore, the Company does not have measures which specifically have the purpose of preventing a bidder who has acquired 75% of the shares in the capital of the Company from appointing or dismissing members of the Board of Management and subsequently amending the Articles of Association of the Company. It should be noted that also in the event of (an attempt at) a hostile takeover or other attempt to obtain (de facto) control of the Company, the Board of Management and the Supervisory Board are authorized to exercise in the interests of Philips all powers vested in them.
Audit of the financial reporting and the position of the external auditor
The annual financial statements are prepared by the Board of Management and reviewed by the Supervisory Board upon the advice of its Audit Committee and taking into account the report of the external auditor. Upon approval by the Supervisory Board, the accounts are signed by all members of both the Board of Management and the Supervisory Board and are published together with the opinion of the external auditor. The Board of Management is responsible, under the supervision of the Supervisory Board, for the quality and completeness of such publicly disclosed financial reports. The annual financial statements are presented for discussion and adoption at the Annual General Meeting of Shareholders, to be convened subsequently. The Company, under US securities regulations, separately files its Annual Report on Form 20-F, incorporating major parts of the Annual Report as prepared under the requirements of Dutch law.
Internal controls and disclosure policies
Comprehensive internal procedures, compliance with which is supervised by the Supervisory Board, are in place for the preparation and publication of the Annual Report, the annual accounts, the quarterly figures and ad hoc financial information. As from 2003, the internal assurance process for business risk assessment has been strengthened and the review frequency has been upgraded to a quarterly review cycle, in line with best practices in this area.
As part of these procedures, a Disclosure Committee has been appointed by the Board of Management to oversee the Company’s disclosure activities and to assist the Executive Committee in fulfilling its responsibilities in this respect. The Committee’s purpose is to ensure that the Company implements and maintains internal procedures for the timely collection, evaluation and disclosure, as appropriate, of information potentially subject to public disclosure under the legal, regulatory and stock exchange requirements to which the Company is subject. Such procedures are designed to capture information that is relevant to an assessment of the need to disclose developments and risks that pertain to the Company’s various businesses, and their effectiveness for this purpose will be reviewed periodically.
Auditor information
In accordance with the procedures laid down in the Philips Auditor Policy and as mandatorily required by Dutch law, the external auditor of the Company is appointed by the General Meeting of Shareholders on the proposal of the Supervisory Board, after the latter
120 Annual Report 2014
Table of Contents
Corporate governance 11.4
has been advised by the Audit Committee and the Board of Management. Under this Auditor Policy, as updated in 2013, the Supervisory Board and the Audit Committee assesses the functioning of the external auditor. The main conclusions of this assessment shall be communicated to the General Meeting of Shareholders for the purposes of assessing the nomination for the appointment of the external auditor. The current auditor of the Company, KPMG Accountants N.V., was appointed by the 1995 General Meeting of Shareholders. In 2002, when the Auditor Policy was adopted, the appointment of KPMG Accountants N.V. was confirmed by the Supervisory Board for an additional three years. The 2008, 2011 and 2014 General Meetings of Shareholders resolved to re-appoint KPMG Accountants N.V. as auditor, at the latest meeting up to and including the financial year 2015.
Mr E.H.W. Weusten is the current partner of KPMG Accountants N.V. in charge of the audit duties for Philips. The external auditor shall attend the Annual General Meeting of Shareholders. Questions may be put to him at the meeting about his report. The Board of Management and the Audit Committee of the Supervisory Board shall report on their dealings with the external auditor to the Supervisory Board on an annual basis, particularly with regard to the auditor’s independence. The Supervisory Board shall take this into account when deciding upon its nomination for the appointment of an external auditor. Dutch legislation on mandatory auditor rotation will become effective January 1, 2016, meaning the Company must engage a new audit firm for its statutory audit starting per January 1, 2016.
The agenda of the 2015 Annual General Meeting of Shareholders will include a proposal to appoint Ernst & Young Accountants LLP as the Company’s new auditor as of January 1, 2016.
The external auditor attends, in principle, all meetings of the Audit Committee. The findings of the external auditor, the audit approach and the risk analysis are also discussed at these meetings. The external auditor attends the meeting of the Supervisory Board at which the report of the external auditor with respect to the audit of the annual accounts is discussed, and at which the annual accounts are approved. In its audit report on the annual accounts to the Board of Management and the Supervisory Board, the external auditor refers to the financial reporting risks and issues that were identified during the audit, internal control matters, and any other matters, as appropriate, requiring communication under the auditing and other standards generally accepted in the Netherlands and the US.
Auditor policy
Dutch law requires the separation of audit and non-audit services, meaning the Company’s external auditor is no longer allowed to provide non-audit services, with an exception (until 2015) for non-audit service arrangements already in place on December 31, 2012. In light of this legislation, the Auditor Policy was updated in 2013. The policy is published on the Company’s website. The policy is also in line with US Securities and Exchange Commission rules under which the appointed external auditor must be independent of the Company both in fact and appearance.
The Auditor Policy includes rules for the pre-approval by the Audit Committee of all services to be provided by the external auditor. Proposed services may be pre-approved at the beginning of the year by the Audit Committee (annual pre-approval) or may be pre-approved during the year by the Audit Committee in respect of a particular engagement (specific pre-approval). The annual pre-approval is based on a detailed, itemized list of services to be provided, designed to ensure that there is no management discretion in determining whether a service has been approved and to ensure the Audit Committee is informed of each services it is pre-approving. Unless pre-approval with respect to a specific service has been given at the beginning of the year, each proposed service requires specific pre-approval during the year. Any annually pre-approved services where the fee for the engagement is expected to exceed pre-approved cost levels or budgeted amounts will also require specific pre-approval. The term of any annual pre-approval is 12 months from the date of the pre-approval unless the Audit Committee states otherwise. During 2014, there were no services provided to the Company by the external auditor which were not pre-approved by the Audit Committee.
Introduction
The Company is continually striving to improve relations with its shareholders. In addition to communication with its shareholders at the Annual General Meeting of Shareholders, Philips elaborates its financial results during (public) conference calls, which are broadly accessible. It publishes informative annual, semi-annual and quarterly reports and press releases, and informs investors via its extensive website. The Company is strict in its compliance with applicable rules and regulations on fair and non-selective disclosure and equal treatment of shareholders.
Each year the Company organizes Philips Capital Market Days and participates in several broker conferences, announced in advance on the Company’s website and by means of press releases. Shareholders can follow in real time, by means of webcasting or telephone lines, the meetings and presentations organized by the Company. Thus the Company applies recommendation IV.3.1 of the Dutch Corporate Governance Code, which in its perception and in view of market practice does not extend to less important analyst meetings and presentations. It is Philips’ policy to post presentations to analysts and shareholders on the Company’s website. These meetings and
Annual Report 2014 121
Table of Contents
Corporate governance 11.5
presentations will not take place shortly before the publication of annual, semi-annual and quarterly financial information.
Furthermore, the Company engages in bilateral communications with investors. These communications either take place at the initiative of the Company or at the initiative of individual investors. During these communications the Company is generally represented by its Investor Relations department. However, on a limited number of occasions the Investor Relations department is accompanied by one or more members of the Board of Management. The subject matter of the bilateral communications ranges from single queries from investors to more elaborate discussions on the back of disclosures that the Company has made such as its annual and quarterly reports. Also here, the Company is strict in its compliance with applicable rules and regulations on fair and non-selective disclosure and equal treatment of shareholders.
The Company shall not, in advance, assess, comment upon or correct, other than factually, any analyst’s reports and valuations. No fee(s) will be paid by the Company to parties for the carrying-out of research for analysts’ reports or for the production or publication of analysts’ reports, with the exception of credit-rating agencies.
Major shareholders and other information for shareholders
The Dutch Act on Financial Supervision imposes an obligation on persons holding certain interests to disclose (inter alia) percentage holdings in the capital and/or voting rights in the Company when such holdings reach, exceed or fall below 3, 5, 10, 15, 20, 25, 30, 40, 50, 60, 75 and 95 percent (as a result of an acquisition or disposal by a person, or as a result of a change in the company’s total number of voting rights or capital issued). Certain cash settled derivatives are also taken into account when calculating the capital interest. The statutory obligation to disclose capital interest does not only relate to gross long positions, but also to gross short positions. Required disclosures must be made to the Netherlands Authority for the Financial Markets (AFM) without delay. The AFM then notifies such disclosures to the Company and includes them in a register which is published on the AFM’s website. Furthermore, an obligation to disclose (net) short positions is set out in the EU Regulation on Short Selling.
On January 3, 2014 the Company received notification from the AFM that it had received disclosure under the Dutch Act on Financial Supervision of a substantial holding of 3.08% by Norges Bank. On May 9, 2014 the Company received notification from the AFM that it had received disclosure under such Act of a substantial holding of 3.02% by Harris Associates L.P. On February 3, 2015 the Company received notification from the AFM that it had received disclosure under such Act of a substantial holding of 3% by State Street Corporation. As per December 31, 2014, approximately 90% of the common shares were held in bearer form and approximately 10% of the common shares were represented by registered shares of New York Registry issued in the name of approximately 1,167 holders of record, including Cede & Co. Cede & Co acts as nominee for the Depository Trust Company holding the shares (indirectly) for individual investors as beneficiaries. Citibank, N.A., 388 Greenwich Street, New York, New York 10013 is the transfer agent and registrar.
Only bearer shares are traded on the stock market of Euronext Amsterdam. Only shares of New York Registry are traded on the New York Stock Exchange. Bearer shares and registered shares may be exchanged for each other. Since certain shares are held by brokers and other nominees, these numbers may not be representative of the actual number of United States beneficial holders or the number of Shares of New York Registry beneficially held by US residents.
The provisions applicable to all corporate bonds that have been issued by the Company in March 2008 and 2012 contain a ‘Change of Control Triggering Event’. This means that if the Company experienced such an event with respect to a series of corporate bonds the Company might be required to offer to purchase the bonds of that series at a purchase price equal to 101% of their principal amount, plus accrued and unpaid interest, if any.
Corporate seat and head office
The statutory seat of the Company is Eindhoven, the Netherlands, and the statutory list of all subsidiaries and affiliated companies, prepared in accordance with the relevant legal requirements (Dutch Civil Code, Book 2, Sections 379 and 414), forms part of the notes to the consolidated financial statements and is deposited at the office of the Commercial Register in Eindhoven, the Netherlands (file no. 17001910).
The executive offices of the Company are located at the Philips Center, Amstelplein 2, 1096 BC Amsterdam, the Netherlands, telephone 0031 (0)20 59 77 777.
Compliance with the Dutch Corporate Governance Code
In accordance with the governmental decree of December 10, 2009, the Company fully complies with the Dutch Corporate Governance Code and applies all its principles and best practice provisions that are addressed to the Board of Management or the Supervisory Board. The full text of the Dutch Corporate Governance Code can be found at the website of the Monitoring Commission Corporate Governance Code ( www.commissiecorporategovernance.nl ).
February 24, 2015
122 Annual Report 2014
Table of Contents
Corporate governance 11.6
Set forth below is a summary of certain provisions of the Articles of Association of the Company, applicable Dutch law and related Company policies. This summary does not constitute legal advice regarding those matters and should not be regarded as such.
Articles of association
Object and purpose
The objects of the Company are to establish, participate in, administer and finance legal entities, companies and other legal forms for the purpose of the manufacture and trading of electrical, electronic, mechanical or chemical products, the development and exploitation of technical and other expertise, including software, or for the purpose of other activities, and to do everything pertaining thereto or connected therewith, including the provision of security in particular for commitments of business undertakings which belong to its group, all this in the widest sense, as may also be conducive to the proper continuity of the collectivity of business undertakings, in the Netherlands and abroad, which are carried on by the Company and the companies in which it directly or indirectly participates.
Share Capital
As of December 31, 2014, the issued share capital consists only of common shares; no preference shares have been issued.
Voting rights
Each common share and each preference share is entitled to one vote. All common shares vote together on all voting matters presented at a General Meeting of Shareholders. Major shareholders do not have different voting rights than other shareholders.
Dividends
A dividend will first be declared on preference shares out of net income. The Board of Management has the power to determine what portion of the net income shall be retained by way of reserve, subject to the approval of the Supervisory Board. The remainder of the net income, after reservations made, shall be available for distribution to holders of common shares subject to shareholder approval after year-end.
Liquidation rights
In the event of the dissolution and liquidation of the Company, the assets remaining after payment of all debts and liquidation expenses are to be distributed in the following order of priority: to the holders of preference shares, the amount paid thereon; and the remainder to the holders of the common shares.
Preemptive rights
Shareholders have a pro rata preferential right of subscription to any common share issuance unless the right is restricted or excluded. If designated by the General Meeting of Shareholders, the Board of Management has the power to restrict or exclude the preferential subscription rights. A designation of the Board of Management will be effective for a specified period of up to five years and may be renewed. Currently, the Board of Management has been granted the power to restrict or exclude the preferential right of subscription up to and including October 31, 2015. If the Board of Management has not been designated, the General Meeting of Shareholders has the power to restrict or exclude such rights, upon the proposal of the Board of Management, which proposal must be approved by the Supervisory Board. Resolutions by the General Meeting of Shareholders referred to in this paragraph require approval of at least two-thirds of the votes cast if less than half of the issued share capital is represented at the meeting.
The foregoing provisions also apply to the issuance of rights to subscribe for shares.
General Meeting of Shareholders
The Annual General Meeting of Shareholders shall be held each year not later than the thirtieth day of June and, at the Board of Management’s option, in Eindhoven, Amsterdam, The Hague, Rotterdam, Utrecht or Haarlemmermeer (including Schiphol airport); the notice convening the meeting shall inform the shareholders accordingly.
Without prejudice to applicable laws and regulations, the Board of Management may resolve to give notice to holders of bearer shares via the Company’s website and/or by other electronic means representing a public announcement, which announcement remains directly and permanently accessible until the General Meeting of shareholders. Holders of registered shares shall be notified by letter, unless the Board of Management resolves to give notice to holders of registered shares by electronic means of communication by sending a legible and reproducible message to the address indicated by the shareholder to the Company for such purpose provided the relevant shareholder has agreed hereto.
In principle all shareholders are entitled to attend the General Meeting of Shareholders, to address the meeting and to vote, except for shares held in treasury by the Company. They may exercise the aforementioned rights at a meeting only for the common shares which on the record date are registered in their name. The record date is published in the above announcement. Holders of registered shares must advise the Company in writing of their intention to attend the General Meeting of Shareholders. Holders of bearer shares who either in person or by proxy wish to attend the General Meeting of Shareholders, should notify ABN AMRO Bank N.V. acting as agent for the Company. They must submit a confirmation by a participating institution, in which administration they are registered as holders of the shares, that such shares are registered and will remain registered in its administration up to and including the record date,
Annual Report 2014 123
Table of Contents
Corporate governance 11.6
whereupon the holder will receive an admission ticket for the General Meeting of Shareholders. Holders of shares who wish to attend by proxy have to submit the proxy at the same time. A participating institution is a bank or broker which according to the Dutch Securities Depository Act (‘Wet giraal effectenverkeer’) is a participating institution (‘aangesloten instelling’) of Nederlands Centraal Instituut voor Giraal Effectenverkeer B.V. (Euroclear Nederland).
In connection with the General Meeting of Shareholders, the Company doesn’t solicit proxies within the United States.
The Articles of Association of the Company provide that there are no quorum requirements to hold a General Meeting of Shareholders and, unless specified otherwise in the articles of association of the Company, resolutions of the General Meeting of Shareholders shall be adopted by a simple majority of votes. Certain shareholder actions and certain resolutions may require a quorum.
Limitations on right to hold or vote Common Shares
There are no limitations imposed by Dutch law or by the Articles of Association on the right of non-resident owners to hold or vote the Common Shares.
Exchange controls
Cash dividends payable in Euros on Netherlands registered shares and bearer shares may be officially transferred from the Netherlands and converted into any other currency without Dutch legal restrictions, except that for statistical purposes such payments and transactions must be reported to the Dutch Central Bank, and furthermore, no payments, including dividend payments, may be made to jurisdictions subject to sanctions adopted by the government of the Netherlands and implementing resolutions of the Security Council of the United Nations.
The Articles of Association of the Company provide that cash distributions on Shares of New York Registry shall be paid in US dollars, converted at the rate of exchange on the stock market of Euronext Amsterdam at the close of business on the day fixed and announced for that purpose by the Board of Management.
General
The corporate governance rules introduced by the New York Stock Exchange (“NYSE”) allow foreign private issuers, like the Company, to follow home country practices on most corporate governance matters instead of those that apply to US domestic issuers, provided that they disclose any significant ways in which their corporate governance practices differ from those applying to listed domestic US companies under the NYSE listing standards. A summary of significant differences between certain Dutch practices on corporate governance matters and the corporate governance provisions applicable to US companies under the NYSE listing standards appears below.
Dutch corporate governance provisions
The Company is a company organized under Dutch law, with its Common Shares listed on Euronext Amsterdam, and is subject to the Dutch Corporate Governance Code of December 10, 2008 (the ‘Dutch Corporate Governance Code’). Philip’s New York Registry Shares, representing Common Shares of the Company, are listed on the NYSE.
Board structure
The NYSE listing standards prescribe regularly scheduled executive sessions of non-executive directors. The Company has a two-tier corporate structure consisting of a Board of Management consisting of executive directors under the supervision of a Supervisory Board consisting exclusively of non-executive directors. Members of the Board of Management and other officers and employees cannot simultaneously act as member of the Supervisory Board. The Supervisory Board must approve specified decisions of the Board of Management.
Independence of members of our Supervisory Board
Under the Dutch Corporate Governance Code all members of the Supervisory Board with the exception of not more than one person, must be independent. The present members of our Supervisory Board are all independent within the meaning of the Dutch Corporate Governance Code. The definitions of independence under the Dutch Corporate Governance Code, however, differ in their details from the definitions of independence under the NYSE listing standards. In some cases the Dutch requirements are stricter than the NYSE listing standards and in other cases the NYSE listing standards are the stricter of the two.
Committees of our Supervisory Board
The Company has established an Audit Committee, a Remuneration Committee and a Corporate Governance and Nomination & Selection Committee, consisting of members of the Supervisory Board only. The roles, responsibilities and composition of these committees reflect the requirements of the Dutch Corporate Governance Code, the company’s Articles of Association and Dutch law, which differ from the NYSE listing standards in these respects. The role of each committee is to advise the Supervisory Board and to prepare the decision-making of the Supervisory Board. In principle, the entire Supervisory Board remains responsible for its decisions even if they were prepared by one of the Supervisory Board’s committees.
The NYSE requires that, when an audit committee member of a US domestic listed company serves on four or more audit committees of public companies, the listed company should disclose (either on its website or in its Annual Report on Form 10-K) that the board of directors has determined that this simultaneous service would not impair the director’s service to the listed company. Dutch law does not require the Company to make such a determination.
124 Annual Report 2014
Table of Contents
Corporate governance 11.6
In accordance with the procedures laid down in the Philips Auditor Policy and as mandatorily required by Dutch law, the external auditor of the Company is appointed by the General Meeting of Shareholders on the proposal of the Supervisory Board, after the latter has been advised by the Audit Committee and the Board of Management.
Major shareholders as filed with SEC
On February 6, 2012, Southeastern Asset Management Inc. filed a Schedule 13G with the SEC indicating that it beneficially owned 7.1% (representing 72,051,468 shares) of the Company’s common shares. On February 10, 2012, Dodge & Cox filed a Schedule 13G with the SEC indicating that it beneficially owned 5.3% (representing 53,180,318 shares) of the Company’s common shares. On January 30, 2013, BlackRock Inc. filed a Schedule 13G with the SEC indicating that it beneficially owned 5.09% (48,728,999 shares) of the Company’s common shares. On February 13, 2013, Dodge & Cox filed a Schedule 13G with the SEC indicating that it beneficially owned 6.7% (63,848,817 shares) of the Company’s common shares. On February 14, 2013, Southeastern Asset Management Inc. filed a Schedule 13G with the SEC indicating that it beneficially owned 6.5% (62,001,965 shares) of the Company’s common shares. On March 11, 2013, BlackRock Inc. filed a Schedule 13G with the SEC indicating that it beneficially owned 4.73% (45,264,486 shares) of the Company’s common shares. On August 9, 2013, Southeastern Asset Management Inc. filed a Schedule 13G with the SEC indicating that beneficially owned 4.93% (48,050,0713 shares) of the Company’s common shares. On February 13, 2014, Dodge & Cox filed a Schedule 13G with the SEC indicating that it beneficially owned 5.7% (53,107,793 shares) of the Company’s common shares. On February 13, 2015, Southeastern Asset Management Inc. filed a Schedule 13G with the SEC indicating that it beneficially owned 5.4% (50,880,362 shares) of the Company’s common shares. On February 13, 2015, Dodge & Cox filed a Schedule 13G with the SEC indicating that it beneficially owned 6.3% (59,366,413 shares) of the Company’s common shares.
Equity compensation plans
The Company complies with Dutch legal requirements regarding shareholder approval of equity compensation plans. Dutch law does not require shareholder approval of certain equity compensation plans for which the NYSE listing standards would require such approval. The Company is subject to a requirement to seek shareholder approval for equity compensation-plans for its members of the Board of Management.
Code of business conduct
The listing standards of the NYSE prescribe certain parameters for listed company codes of business conduct and ethics. The Company has implemented the Philips General Business Principles applicable to all employees and a Financial Code of Ethics applicable to all employees performing an accounting or financial function. Waivers granted to Senior (Financial) Officers (as defined in our Financial Code of Ethics) will be disclosed. In 2014 the Company did not grant any waivers of the Financial Code of Ethics.
KPMG
In June 2014, KPMG Accountants N.V. (KPMG), the Company’s independent registered public accounting firm, selected a new Chief Executive Officer who was the Chief Financial Officer of Philips in the period 1997-2005. He receives a monthly pension payment, which is immaterial to his net worth, from the Philips Pension Fund. The Philips Pension Fund is a separate and financially independent entity with an independent Board of Trustees who are legally responsible to safeguard the retirement benefits of the participants of the Philips Pension Fund. Royal Philips is not liable for any financial deficits of the Philips Pension Fund and Royal Philips has no discretion over the level and payments of benefits to participants. The Philips Pension Fund is considered an affiliate of Philips under SEC independence rules, which are applicable to KPMG audit of Philips, and accordingly, the financial relationship violates the US Securities and Exchange Commission’s regulations. KPMG is not the independent auditor of the Philips Pension Fund. KPMG has put in place a process whereby the KPMG CEO is not in the chain of command with respect to the Philips’ audit or the ratings or compensation of partners who work on the Philips’ audit. KPMG has advised Philips’ management and its audit committee that this situation, considering the actions taken by the firm, does not impact the firm’s ability to apply objective and impartial judgment on all matters encompassed within their annual audits of Philips. Philips’ audit committee concurs that this financial relationship does not impact the firm’s ability to apply objective and impartial judgment on all matters encompassed within the annual audits of Philips.
Annual Report 2014 125
Table of Contents
Performance Statements
|
12 |
Group financial statements | 128 | ||||
|
12.1 |
Management’s report on internal control | 129 | ||||
|
12.2 |
Report of the independent auditor | 130 | ||||
|
12.3 |
Independent auditors’ reports on the consolidated financial statements and on internal control over financial reporting | 131 | ||||
|
12.4 |
Consolidated statements of income | 133 | ||||
|
12.5 |
Consolidated statements of comprehensive income | 134 | ||||
|
12.6 |
Consolidated balance sheets | 135 | ||||
|
12.7 |
Consolidated statements of cash flows | 137 | ||||
|
12.8 |
Consolidated statements of changes in equity | 139 | ||||
|
12.9 |
Notes | 140 | ||||
|
13 |
Company financial statements | 201 | ||||
|
13.1 |
Balance sheets before appropriation of results | 202 | ||||
|
13.2 |
Statements of income | 203 | ||||
|
13.3 |
Statement of changes in equity | 203 | ||||
|
13.4 |
Notes | 204 | ||||
|
13.5 |
Independent auditor’s report | 209 | ||||
|
14 |
Sustainability statements | 213 | ||||
|
14.1 |
Economic indicators | 219 | ||||
|
14.2 |
Social statements | 219 | ||||
|
14.3 |
Environmental statements | 235 | ||||
|
14.4 |
Independent Auditor’s Assurance Report | 240 | ||||
|
14.5 |
Global Reporting Initiative (GRI) table 4.0 | 241 |
126 Annual Report 2014
Table of Contents
Notes overview
Annual Report 2014 127
Table of Contents
Group financial statements 12
1 2 Group financial statements
Introduction
This section of the Annual Report contains the audited consolidated financial statements including the notes thereon that have been prepared in accordance with International Financial Reporting Standards (IFRS) as endorsed by the European Union (EU) and with the statutory provisions of Part 9, Book 2 of the Dutch Civil Code. All standards and interpretations issued by the International Accounting Standards Board (IASB) and the IFRS Interpretations Committee effective year-end 2014 have been endorsed by the EU, except that the EU did not adopt some paragraphs of IAS 39 applicable to certain hedge transactions. Philips has no hedge transactions to which these paragraphs are applicable. Consequently, the accounting policies applied by Philips also comply fully with IFRS as issued by the IASB.
Together with the section Company financial statements, this section contains the statutory financial statements of the Company.
The following sections and chapters:
| • |
chapter 4, Our strategic focus, of this report |
| • |
chapter 5, Group performance, of this report |
| • |
chapter 6, Sector performance, of this report |
| • |
chapter 7, Risk management, of this report |
| • |
chapter 10, Supervisory Board report, of this report |
| • |
section 10.1, Report of the Corporate Governance and Nomination & Selection Committee, of this report |
| • |
section 10.2, Report of the Remuneration Committee, of this report |
| • |
chapter 11, Corporate governance, of this report |
| • |
Forward-looking statements, of this report |
form the Management report within the meaning of section 2:391 of the Dutch Civil Code (and related Decrees).
The sections Group performance and Sector performance provide an extensive analysis of the developments during the financial year 2014 and the results. The term EBIT has the same meaning as Income from operations (IFO), and is used to evaluate the performance of the business. These sections also provide information on the business outlook, investments, financing, personnel and research and development activities.
The Statement of income included in the section Company financial statements has been prepared in accordance with section 2:402 of the Dutch Civil Code, which allows a simplified Statement of income in the Company financial statements in the event that a comprehensive Statement of income is included in the consolidated Group financial statements.
For ‘Additional information’ within the meaning of section 2:392 of the Dutch Civil Code, please refer to section 13.5, Independent auditor’s report, of this report on the financial statements, section 5.4, Proposed distribution to shareholders, of this report, and note 32, Subsequent events.
Please refer to Forward-looking statements, of this report for more information about forward-looking statements, third-party market share data, fair value information, and revisions and reclassifications.
The Board of Management of the Company hereby declares that, to the best of our knowledge, the Group financial statements and Company financial statements give a true and fair view of the assets, liabilities, financial position and profit or loss of the Company and the undertakings included in the consolidation taken as a whole and that the management report referred to above gives a true and fair view concerning the position as per the balance sheet date, the development and performance of the business during the financial year of the Company and the undertakings included in the consolidation taken as a whole, together with a description of the principal risks that they face.
Board of Management
Frans van Houten
Ron Wirahadiraksa
Pieter Nota
February 24, 2015
128 Annual Report 2014
Table of Contents
Group financial statements 12.1
12.1 Management’s report on internal control
Management’s report on internal control over financial reporting pursuant to section 404 of the US Sarbanes-Oxley Act
The Board of Management of Koninklijke Philips N.V. (the Company) is responsible for establishing and maintaining an adequate system of internal control over financial reporting (as such term is defined in Rule 13a-15(f) under the US Securities Exchange Act). Internal control over financial reporting is a process to provide reasonable assurance regarding the reliability of our financial reporting for external purposes in accordance with IFRS as issued by the IASB.
Internal control over financial reporting includes maintaining records that, in reasonable detail, accurately and fairly reflect our transactions; providing reasonable assurance that transactions are recorded as necessary for preparation of our financial statements; providing reasonable assurance that receipts and expenditures of company assets are made in accordance with management authorization; and providing reasonable assurance that unauthorized acquisition, use or disposition of company assets that could have a material effect on our financial statements would be prevented or detected on a timely basis. Because of its inherent limitations, internal control over financial reporting is not intended to provide absolute assurance that a misstatement of our financial statements would be prevented or detected. Also, projections of any evaluation of the effectiveness of internal control over financial reporting to future periods are subject to the risk that the controls may become inadequate because of changes in conditions, or that the degree of compliance with the policies or procedures may deteriorate.
The Board of Management conducted an assessment of the Company’s internal control over financial reporting based on the “Internal Control - Integrated Framework (2013)” established by the Committee of Sponsoring Organizations of the Treadway Commission (COSO). Based on that assessment, the Board of Management concluded that, as of December 31, 2014, the Company’s internal control over Group financial reporting is considered effective.
The Board of Management’s assessment of the effectiveness of the Company’s internal control over financial reporting as of December 31, 2014, excluded the following company acquired by the Company on September 2, 2014: Philips Lighting Saudi Arabia (PLSA) formerly known as General Lighting Company (GLC), domiciled in The Kingdom of Saudi Arabia. The Company owns 51% of the shares in PLSA. The total assets of this acquisition represented 1,5% of consolidated total assets as of December 31, 2014, the sales of this acquisition represented less than 1% of consolidated sales of the Company for the year ended December 31, 2014.
The effectiveness of the Company’s internal control over financial reporting as of December 31, 2014, as included in this section Group financial statements, has been audited by KPMG Accountants N.V., an independent registered public accounting firm, as stated in their report which follows hereafter.
Board of Management
Frans van Houten
Ron Wirahadiraksa
Pieter Nota
February 24, 2015
12.1.1 Disclosure controls and procedures
The Company’s Chief Executive Officer and Chief Financial Officer have evaluated the effectiveness of the design and operation of the Company’s disclosure controls and procedures (as defined in Rules 13a-15(e) and 15d-15(e) under the Securities Exchange Act of 1934) as of the end of the period covered by the Annual Report. Based on that evaluation, the Chief Executive Officer and Chief Financial Officer have concluded that these disclosure controls and procedures are effective as of December 31, 2014.
12.1.2 Changes in internal control over financial reporting
During the year ended December 31, 2014, there have been no changes in our internal control over financial reporting that have materially affected, or are reasonably likely to materially affect, our internal control over financial reporting.
Annual Report 2014 129
Table of Contents
Group financial statements 12.1.2
12.2 Report of the independent auditor
Management’s report on internal control over financial reporting is set out in section 12.1, Management’s report on internal control, of this report. The report set out in sub-section 12.3.2, Independent auditors’ report on internal control over financial reporting, of this report, is provided in compliance with auditing standards of the Public Company Accounting Oversight Board in the US and includes an opinion on the effectiveness of internal control over financial reporting as at December 31, 2014.
KPMG Accountants N.V. has also issued a report on the consolidated financial statements in accordance with the standards of the Public Company Accounting Oversight Board in the US, which is set out in sub-section 12.3.1, Independent auditors’ report on the consolidated financial statements, of this report.
KPMG Accountants N.V. has also issued a report on the consolidated financial statements and the Company financial statements, in accordance with Dutch law, including the Dutch standards on auditing, of Koninklijke Philips N.V., which is set out in section 13.5, Independent auditor’s report, of this report.
130 Annual Report 2014
Table of Contents
Group financial statements 12.2
12.3 Independent auditors’ reports on the consolidated financial statements and on internal control over financial reporting
12.3.1 Independent auditors’ report on the consolidated financial statements
Report of Independent Registered Public Accounting Firm
To: The Supervisory Board and Shareholders of Koninklijke Philips N.V.
We have audited the accompanying consolidated balance sheets of Koninklijke Philips N.V. and subsidiaries as of December 31, 2014 and 2013, and the related consolidated statements of income, comprehensive income, cash flows, and changes in equity for each of the years in the three-year period ended December 31, 2014. These consolidated financial statements are the responsibility of the Koninklijke Philips N.V.’s management. Our responsibility is to express an opinion on these consolidated financial statements based on our audits.
We conducted our audits in accordance with the standards of the Public Company Accounting Oversight Board (United States). Those standards require that we plan and perform the audit to obtain reasonable assurance about whether the financial statements are free of material misstatement. An audit includes examining, on a test basis, evidence supporting the amounts and disclosures in the financial statements. An audit also includes assessing the accounting principles used and significant estimates made by management, as well as evaluating the overall financial statement presentation. We believe that our audits provide a reasonable basis for our opinion.
In our opinion, the consolidated financial statements referred to above present fairly, in all material respects, the financial position of Koninklijke Philips N.V. and subsidiaries as of December 31, 2014 and 2013, and the results of their operations and their cash flows for each of the years in the three-year period ended December 31, 2014, in conformity with International Financial Reporting Standards as issued by the International Accounting Standards Board.
We also have audited, in accordance with the standards of the Public Company Accounting Oversight Board (United States), Koninklijke Philips N.V.‘s internal control over financial reporting as of December 31, 2014, based on criteria established in Internal Control — Integrated Framework (2013) issued by the Committee of Sponsoring Organizations of the Treadway Commission (COSO), and our report dated February 24, 2015, expressed an unqualified opinion on the effectiveness of the Koninklijke Philips N.V.’s internal control over financial reporting.
Amsterdam, The Netherlands
February 24, 2015
/s/ KPMG Accountants N.V.
Note that the report set out above is included for the purpose of Koninklijke Philips N.V.’s Annual Report on Form 20-F for 2014 only and does not form part of Koninklijke Philips N.V.’s Annual Report for 2014.
Annual Report 2014 131
Table of Contents
Group financial statements 12.3.1
12.3.2 Independent auditors’ report on internal control over financial reporting
Report of Independent Registered Public Accounting Firm
To: The Supervisory Board and Shareholders of Koninklijke Philips N.V.
We have audited Koninklijke Philips N.V.’s internal control over financial reporting as of December 31, 2014, based on criteria established in Internal Control — Integrated Framework (2013) issued by the Committee of Sponsoring Organizations of the Treadway Commission (COSO). Koninklijke Philips N.V.’s management is responsible for maintaining effective internal control over financial reporting and for its assessment of the effectiveness of internal control over financial reporting, included in the accompanying section 12.1, “Management’s report on internal control”, of this Form 20-F. Our responsibility is to express an opinion on the Company’s internal control over financial reporting based on our audit.
We conducted our audit in accordance with the standards of the Public Company Accounting Oversight Board (United States). Those standards require that we plan and perform the audit to obtain reasonable assurance about whether effective internal control over financial reporting was maintained in all material respects. Our audit included obtaining an understanding of internal control over financial reporting, assessing the risk that a material weakness exists, and testing and evaluating the design and operating effectiveness of internal control based on the assessed risk. Our audit also included performing such other procedures as we considered necessary in the circumstances. We believe that our audit provides a reasonable basis for our opinion.
A company’s internal control over financial reporting is a process designed to provide reasonable assurance regarding the reliability of financial reporting and the preparation of financial statements for external purposes in accordance with generally accepted accounting principles. A company’s internal control over financial reporting includes those policies and procedures that (1) pertain to the maintenance of records that, in reasonable detail, accurately and fairly reflect the transactions and dispositions of the assets of the company; (2) provide reasonable assurance that transactions are recorded as necessary to permit preparation of financial statements in accordance with generally accepted accounting principles, and that receipts and expenditures of the company are being made only in accordance with authorizations of management and directors of the company; and (3) provide reasonable assurance regarding prevention or timely detection of unauthorized acquisition, use, or disposition of the company’s assets that could have a material effect on the financial statements.
Because of its inherent limitations, internal control over financial reporting may not prevent or detect misstatements. Also, projections of any evaluation of effectiveness to future periods are subject to the risk that controls may become inadequate because of changes in conditions, or that the degree of compliance with the policies or procedures may deteriorate.
Koninklijke Philips N.V. acquired Philips Lighting Saudi Arabia (PLSA), formerly known as General Lighting Company (GLC) during 2014 and management excluded from its assessment of the effectiveness of Koninklijke Philips N.V.’s internal control over financial reporting as of December 31, 2014, PLSA’s internal control over financial reporting associated with total assets of approximately 1.5% of consolidated total assets and sales of less than 1.0% of consolidated sales included in the consolidated financial statements of Koninklijke Philips N.V. and subsidiaries as of and for the year ended December 31, 2014. Our audit of internal control over financial reporting of Koninklijke Philips N.V. also excluded an evaluation of the internal control over financial reporting of PLSA.
In our opinion, Koninklijke Philips N.V. maintained, in all material respects, effective internal control over financial reporting as of December 31, 2014, based on criteria established in Internal Control — Integrated Framework (2013) issued by the Committee of Sponsoring Organizations of the Treadway Commission (COSO).
We also have audited, in accordance with the standards of the Public Company Accounting Oversight Board (United States), the consolidated balance sheets of Koninklijke Philips N.V. and subsidiaries as of December 31, 2014 and 2013, and the related consolidated statements of income, comprehensive income, cash flows, and changes in equity for each of the years in the three-year period ended December 31, 2014, and our report dated February 24, 2015, expressed an unqualified opinion on those consolidated financial statements.
Amsterdam, The Netherlands
February 24, 2015
/s/ KPMG Accountants N.V.
132 Annual Report 2014
Table of Contents
Group financial statements 12.3.2
| Philips Group | ||||||||||||||
|
Consolidated statements of income in millions of EUR unless otherwise stated For the years ended December 31 |
||||||||||||||
|
|
|
|||||||||||||
| 2012 | 2013 | 2014 | ||||||||||||
|
|
|
|||||||||||||
| Sales | 22,234 | 21,990 | 21,391 | |||||||||||
| Cost of sales | (13,505 | ) | (12,653 | ) | (13,185 | ) | ||||||||
|
|
|
|||||||||||||
| Gross margin | 8,729 | 9,337 | 8,206 | |||||||||||
| Selling expenses | (5,240 | ) | (5,057 | ) | (5,124 | ) | ||||||||
| Research and development expenses | (1,724 | ) | (1,659 | ) | (1,635 | ) | ||||||||
| General and administrative expenses | (847 | ) | (825 | ) | (747 | ) | ||||||||
| Impairment of goodwill | — | (28 | ) | (3 | ) | |||||||||
| Other business income | 272 | 122 | 63 | |||||||||||
| Other business expenses | (598 | ) | (35 | ) | (274 | ) | ||||||||
|
|
|
|||||||||||||

|
Income from operations | 592 | 1,855 | 486 | ||||||||||

|
Financial income | 106 | 70 | 114 | ||||||||||
|
|
Financial expenses | (435 | ) | (400 | ) | (415 | ) | |||||||
|
|
|
|||||||||||||
| Income before taxes | 263 | 1,525 | 185 | |||||||||||

|
Income tax expense | (218 | ) | (466 | ) | (26 | ) | |||||||
|
|
|
|||||||||||||
| Income after taxes | 45 | 1,059 | 159 | |||||||||||

|
Results relating to investments in associates: | |||||||||||||
| Company’s participation in income | (5 | ) | 5 | 30 | ||||||||||
| Other results | (206 | ) | (30 | ) | 32 | |||||||||
|
|
|
|||||||||||||
| Income (loss) from continuing operations | (166 | ) | 1,034 | 221 | ||||||||||

|
Discontinued operations - net of income tax | 136 | 138 | 190 | ||||||||||
|
|
|
|||||||||||||
| Net income (loss) | (30 | ) | 1,172 | 411 | ||||||||||
| Attribution of net income (loss) | ||||||||||||||
| Net income (loss) attributable to Koninklijke Philips N.V. shareholders | (35 | ) | 1,169 | 415 | ||||||||||
| Net income (loss) attributable to non-controlling interests | 5 | 3 | (4 | ) | ||||||||||
|
|
|
|||||||||||||
| Philips Group | ||||||||||||||
|
Earnings per common share attributable to shareholders 1) in EUR unless otherwise stated For the years ended December 31 |
||||||||||||||
|
|
|
|||||||||||||
| 2012 | 2013 | 2014 | ||||||||||||
|
|
|
|||||||||||||
| Basic earnings per common share in EUR | ||||||||||||||

|
Income (loss) from continuing operations attributable to shareholders | (0.19 | ) | 1.13 | 0.25 | |||||||||
|
|
Net income (loss) attributable to shareholders | (0.04 | ) | 1.28 | 0.45 | |||||||||
| Diluted earnings per common share in EUR 2) | ||||||||||||||
|
|
Income (loss) from continuing operations attributable to shareholders | (0.19 | ) | 1.12 | 0.24 | |||||||||
|
|
Net income (loss) attributable to shareholders | (0.04 | ) | 1.27 | 0.45 | |||||||||
|
|
|
|||||||||||||
Prior-period financial statements have been restated for the treatment of the combined businesses of Lumileds and Automotive as discontinued operations (see note 3, Discontinued operations and other assets classified as held for sale) and for two voluntary accounting policy changes (see note 1, Significant accounting policies). The accompanying notes are an integral part of these consolidated financial statements.
| 1) |
Shareholders in this table refer to shareholders of Koninklijke Philips N.V. |
| 2) |
The Dilutive potential common shares are not taken into account in the periods for which there is a loss, as the effect would be antidilutive |
Annual Report 2014 133
Table of Contents
Group financial statements 12.5
12.5 Consolidated statements of comprehensive income
| Philips Group | ||||||||||||
|
Consolidated statements of comprehensive income in millions of EUR unless otherwise stated For the years ended December 31
|
|
|||||||||||
|
|
|
|||||||||||
| 2012 | 2013 | 2014 | ||||||||||
|
|
|
|||||||||||
| Net income (loss) for the period | (30 | ) | 1,172 | 411 | ||||||||
| Pensions and other post-employment plans: | ||||||||||||
|
Remeasurements |
(206 | ) | 139 | (972 | ) | |||||||
|
Income tax effect on remeasurements |
60 | (77 | ) | 289 | ||||||||
| Revaluation reserve: | ||||||||||||
|
Release revaluation reserve |
(16 | ) | (31 | ) | (10 | ) | ||||||
|
Reclassification directly into retained earnings |
16 | 31 | 10 | |||||||||
|
|
|
|||||||||||
|
Total of items that will not be reclassified to profit or loss |
(146 | ) | 62 | (683 | ) | |||||||
| Currency translation differences: | ||||||||||||
|
Net current period change, before tax |
(99 | ) | (427 | ) | 600 | |||||||
|
Income tax effect |
— | (35 | ) | 203 | ||||||||
|
Reclassification adjustment for gain realized |
(1 | ) | (14 | ) | (5 | ) | ||||||
| Available-for-sale financial assets: | ||||||||||||
|
Net current period change, before tax |
8 | (5 | ) | 30 | ||||||||
|
Income tax effect |
(2 | ) | — | (4 | ) | |||||||
|
Reclassification adjustment for loss (gain) realized |
3 | 6 | (54 | ) | ||||||||
| Cash flow hedges: | ||||||||||||
|
Net current period change, before tax |
23 | 68 | (40 | ) | ||||||||
|
Income tax effect |
(8 | ) | (2 | ) | 10 | |||||||
|
Reclassification adjustment for loss (gain) realized |
14 | (62 | ) | (7 | ) | |||||||
|
|
|
|||||||||||
| Total of items that are or may be reclassified to profit or loss | (62 | ) | (471 | ) | 733 | |||||||
|
|
|
|||||||||||
| Other comprehensive (loss) income for period | (208 | ) | (409 | ) | 50 | |||||||
|
|
|
|||||||||||
| Total comprehensive income (loss) for the period | (238 | ) | 763 | 461 | ||||||||
| Total comprehensive income (loss) attributable to : | ||||||||||||
|
Shareholders of Koninklijke Philips N.V. |
(243 | ) | 760 | 465 | ||||||||
|
Non-controlling interests |
5 | 3 | (4 | ) | ||||||||
|
|
|
|||||||||||
The accompanying notes are an integral part of these consolidated financial statements.
134 Annual Report 2014
Table of Contents
Group financial statements 12.6
12.6 Consolidated balance sheets
| Philips Group | ||||||||||||||||||||||
|
Consolidated balance sheets in millions of EUR unless stated otherwise As of December 31 |
|
|||||||||||||||||||||
|
|
|
|||||||||||||||||||||
| 2013 | 2014 | |||||||||||||||||||||
|
|
|
|||||||||||||||||||||
| Non-current assets | ||||||||||||||||||||||

|

|

|
Property, plant and equipment: | |||||||||||||||||||
| - At cost | 7,692 | 6,844 | ||||||||||||||||||||
| - Less accumulated depreciation | (4,912 | ) | (4,749 | ) | ||||||||||||||||||
|
|
|
|
|
|||||||||||||||||||
| 2,780 | 2,095 | |||||||||||||||||||||
|
|
|
Goodwill | 6,504 | 7,158 | ||||||||||||||||||
|
|
|
Intangible assets excluding goodwill: | ||||||||||||||||||||
| - At cost | 7,638 | 8,020 | ||||||||||||||||||||
| - Less accumulated amortization | (4,376 | ) | (4,652 | ) | ||||||||||||||||||
|
|
|
|
|
|||||||||||||||||||
| 3,262 | 3,368 | |||||||||||||||||||||
|
|
Non-current receivables | 144 | 177 | |||||||||||||||||||
|
|
Investments in associates | 161 | 157 | |||||||||||||||||||
|
|
Other non-current financial assets | 496 | 462 | |||||||||||||||||||
|
|
Deferred tax assets | 1,675 | 2,460 | |||||||||||||||||||
|
|
Other non-current assets | 63 | 69 | |||||||||||||||||||
|
|
|
|||||||||||||||||||||
| Total non-current assets | 15,085 | 15,946 | ||||||||||||||||||||
| Current assets | ||||||||||||||||||||||
|
|
Inventories | 3,240 | 3,314 | |||||||||||||||||||
|
|
Current financial assets | 10 | 125 | |||||||||||||||||||
|
|
Other current assets | 354 | 411 | |||||||||||||||||||
|
|
Derivative financial assets | 150 | 207 | |||||||||||||||||||
|
|
Income tax receivable | 70 | 140 | |||||||||||||||||||
|
|
|
Receivables: | ||||||||||||||||||||
| - Accounts receivable | 4,420 | 4,476 | ||||||||||||||||||||
| - Accounts receivable from related parties | 39 | 14 | ||||||||||||||||||||
| - Other current receivables | 219 | 233 | ||||||||||||||||||||
|
|
|
|
|
|||||||||||||||||||
| 4,678 | 4,723 | |||||||||||||||||||||
|
|
Assets classified as held for sale | 507 | 1,613 | |||||||||||||||||||
|
|
Cash and cash equivalents | 2,465 | 1,873 | |||||||||||||||||||
|
|
|
|||||||||||||||||||||
| Total current assets | 11,474 | 12,406 | ||||||||||||||||||||
|
|
|
|||||||||||||||||||||
| Total assets | 26,559 | 28,352 | ||||||||||||||||||||
|
|
|
|||||||||||||||||||||
Annual Report 2014 135
Table of Contents
Group financial statements 12.6
|
|
|
|||||||||||||||||||
| 2013 | 2014 | |||||||||||||||||||
|
|
|
|||||||||||||||||||
| Equity | ||||||||||||||||||||
|
|
Shareholders’ equity: | |||||||||||||||||||
| Preference shares, par value EUR 0.20 per share: | ||||||||||||||||||||
| - Authorized: 2,000,000,000 shares (2013: 2,000,000,000 shares), issued none | ||||||||||||||||||||
| Common shares, par value EUR 0.20 per share: | ||||||||||||||||||||
| - Authorized: 2,000,000,000 shares (2013: 2,000,000,000 shares) | ||||||||||||||||||||
| - Issued and fully paid: 934,819,413 shares (2013: 937,845,789 shares) | 188 | 187 | ||||||||||||||||||
| Capital in excess of par value | 1,796 | 2,181 | ||||||||||||||||||
| Retained earnings | 10,415 | 8,790 | ||||||||||||||||||
| Revaluation reserve | 23 | 13 | ||||||||||||||||||
| Currency translation differences | (569 | ) | 229 | |||||||||||||||||
| Available-for-sale financial assets | 55 | 27 | ||||||||||||||||||
| Cash flow hedges | 24 | (13 | ) | |||||||||||||||||
| Treasury shares, at cost 20,430,544 shares (2013: 24,508,022 shares) | (718 | ) | (547 | ) | ||||||||||||||||
|
|
|
|
|
|||||||||||||||||
| 11,214 | 10,867 | |||||||||||||||||||
|
|
Non-controlling interests | 13 | 101 | |||||||||||||||||
|
|
|
|||||||||||||||||||
| Group equity | 11,227 | 10,968 | ||||||||||||||||||
| Non-current liabilities | ||||||||||||||||||||
|
|
|
Long-term debt | 3,309 | 3,712 | ||||||||||||||||
|
|
|
Long-term provisions | 1,903 | 2,500 | ||||||||||||||||
|
|
Deferred tax liabilities | 76 | 107 | |||||||||||||||||
|
|
Other non-current liabilities | 1,568 | 1,838 | |||||||||||||||||
|
|
|
|||||||||||||||||||
| Total non-current liabilities | 6,856 | 8,157 | ||||||||||||||||||
| Current liabilities | ||||||||||||||||||||
|
|
|
Short-term debt | 592 | 392 | ||||||||||||||||
|
|
Derivative financial liabilities | 368 | 857 | |||||||||||||||||
|
|
Income tax payable | 143 | 102 | |||||||||||||||||
|
|
|
Accounts and notes payable: | ||||||||||||||||||
| - Trade creditors | 2,458 | 2,495 | ||||||||||||||||||
| - Accounts payable to related parties | 4 | 4 | ||||||||||||||||||
|
|
|
|
|
|||||||||||||||||
| 2,462 | 2,499 | |||||||||||||||||||
|
|
Accrued liabilities | 2,830 | 2,692 | |||||||||||||||||
|
|
|
Short-term provisions | 651 | 945 | ||||||||||||||||
|
|
Liabilities directly associated with assets held for sale | 348 | 349 | |||||||||||||||||
|
|
Other current liabilities | 1,082 | 1,391 | |||||||||||||||||
|
|
|
|||||||||||||||||||
| Total current liabilities | 8,476 | 9,227 | ||||||||||||||||||
|
|
|
|||||||||||||||||||
| Total liabilities and group equity | 26,559 | 28,352 | ||||||||||||||||||
|
|
|
|||||||||||||||||||
The accompanying notes are an integral part of these consolidated financial statements.
136 Annual Report 2014
Table of Contents
Group financial statements 12.7
| Philips Group | ||||||||||||||
|
Consolidated statements of cash flows in millions of EUR unless otherwise stated For the years ended December 31 |
|
|||||||||||||
|
|
|
|||||||||||||
| 2012 | 2013 | 2014 | ||||||||||||
|
|
|
|||||||||||||
| Cash flows from operating activities | ||||||||||||||
| Net income (loss) | (30 | ) | 1,172 | 411 | ||||||||||
| Result of discontinued operations - net of income tax | (136 | ) | (138 | ) | (190 | ) | ||||||||
| Adjustments to reconcile net income (loss) to net cash provided by operating activities: | ||||||||||||||
| Depreciation, amortization, and impairments of fixed assets | 1,242 | 1,177 | 1,187 | |||||||||||
| Impairment of goodwill and other non-current financial assets | 14 | 38 | 21 | |||||||||||
| Net gain on sale of assets | (141 | ) | (54 | ) | (83 | ) | ||||||||
| Interest income | (37 | ) | (54 | ) | (39 | ) | ||||||||
| Interest expense on debt, borrowings and other liabilities | 283 | 258 | 231 | |||||||||||
| Income taxes expense | 218 | 466 | 26 | |||||||||||
| Results from investments in associates | 5 | 25 | (62 | ) | ||||||||||
| (Increase) decrease in working capital | 586 | (1,272 | ) | 590 | ||||||||||
| Increase in receivables and other current assets | (109 | ) | (500 | ) | (48 | ) | ||||||||
| (Increase) decrease in inventories | 18 | (165 | ) | (77 | ) | |||||||||
| (Decrease) increase in accounts payable, accrued and other current liabilities | 677 | (607 | ) | 715 | ||||||||||
| Increase in non-current receivables, other assets and other liabilities | (140 | ) | (159 | ) | (690 | ) | ||||||||
| (Decrease) increase in provisions | 417 | (194 | ) | 640 | ||||||||||
| Other items | 171 | 299 | (242 | ) | ||||||||||
| Interest paid | (270 | ) | (267 | ) | (232 | ) | ||||||||
| Interest received | 34 | 52 | 38 | |||||||||||
| Dividends received from investments in associates | 15 | 6 | 41 | |||||||||||
| Dividends paid to non-controlling interests | (4 | ) | (7 | ) | — | |||||||||
| Income taxes paid | (341 | ) | (436 | ) | (344 | ) | ||||||||
|
|
|
|||||||||||||
| Net cash provided by operating activities | 1,886 | 912 | 1,303 | |||||||||||
| Cash flows from investing activities | ||||||||||||||
| Net capital expenditures | (241 | ) | (830 | ) | (806 | ) | ||||||||
| Purchase of intangible assets | (33 | ) | (49 | ) | (114 | ) | ||||||||
| Proceeds from sale of intangible assets | 160 | — | — | |||||||||||
| Expenditures on development assets | (311 | ) | (326 | ) | (295 | ) | ||||||||
| Capital expenditures on property, plant and equipment | (479 | ) | (482 | ) | (437 | ) | ||||||||
| Proceeds from sales of property, plant and equipment | 422 | 27 | 40 | |||||||||||

|
Cash used for derivatives and current financial assets | (45 | ) | (101 | ) | (7 | ) | |||||||

|
Purchase of other non-current financial assets | (167 | ) | (13 | ) | (81 | ) | |||||||
|
|
Proceeds from other non-current financial assets | 3 | 14 | 107 | ||||||||||
| Purchase of businesses, net of cash acquired | (261 | ) | (11 | ) | (177 | ) | ||||||||
| Proceeds from sale of interests in businesses, net of cash disposed of | (1 | ) | 79 | (20 | ) | |||||||||
|
|
|
|||||||||||||
| Net cash used for investing activities | (712 | ) | (862 | ) | (984 | ) | ||||||||
| Cash flows from financing activities | ||||||||||||||
| Proceeds from issuance (payments) of short-term debt | 133 | (285 | ) | (37 | ) | |||||||||
| Principal payments of long-term debt | (631 | ) | (186 | ) | (333 | ) | ||||||||
| Proceeds from issuance of long-term debt | 1,228 | 64 | 69 | |||||||||||
| Treasury shares transactions | (768 | ) | (562 | ) | (596 | ) | ||||||||
| Dividends paid | (255 | ) | (272 | ) | (292 | ) | ||||||||
|
|
|
|||||||||||||
| Net cash used for financing activities | (293 | ) | (1,241 | ) | (1,189 | ) | ||||||||
|
|
|
|||||||||||||
| Net cash (used for) provided by continuing operations | 881 | (1,191 | ) | (870 | ) | |||||||||
|
|
|
|||||||||||||
Annual Report 2014 137
Table of Contents
Group financial statements 12.7
|
|
|
|||||||||||||
| 2012 | 2013 | 2014 | ||||||||||||
|
|
|
|||||||||||||
| Cash flows from discontinued operations | ||||||||||||||
|
Net cash (used for) provided by operating activities |
(183 | ) | (68 | ) | 105 | |||||||||
|
Net cash (used for) provided by investing activities |
40 | (47 | ) | 88 | ||||||||||
|
|
|
|||||||||||||
|
Net cash (used for) provided by discontinued operations |
(143 | ) | (115 | ) | 193 | |||||||||
|
|
|
|||||||||||||
|
Net cash (used for) provided by continuing and discontinued operations |
738 | (1,306 | ) | (677 | ) | |||||||||
|
Effect of changes in exchange rates on cash and cash equivalents |
(51 | ) | (63 | ) | 85 | |||||||||
|
Cash and cash equivalents at the beginning of the year |
3,147 | 3,834 | 2,465 | |||||||||||
|
|
|
|||||||||||||
|
Cash and cash equivalents at the end of the year |
3,834 | 2,465 | 1,873 | |||||||||||
|
|
|
|||||||||||||
Prior-period financial statements have been restated for the treatment of the combined businesses of Lumileds and Automotive as discontinued operations (see note 3, Discontinued operations and other assets classified as held for sale) and for two voluntary accounting policy changes (see note 1, Significant accounting policies). The accompanying notes are an integral part of these consolidated financial statements.
For a number of reasons, principally the effects of translation differences and consolidation changes, certain items in the statements of cash flows do not correspond to the differences between the balance sheet amounts for the respective items.
138 Annual Report 2014
Table of Contents
Group financial statements 12.8
12.8 Consolidated statements of changes in equity
Philips Group
Consolidated statements of changes in equity in millions of EUR unless otherwise stated
For the year ended December 31
|
|
|
|||||||||||||||||||||||||||||||||||||||||||
|
common
shares |
capital in
excess of par value |
retained
earnings |
revaluation
reserve |
currency
translation differences |
available-
for-sale financial assets |
cash
flow hedges |
treasury
shares at cost |
total
shareholders’ equity |
non-controlling
interests |
Group equity |
||||||||||||||||||||||||||||||||||
|
|
|
|||||||||||||||||||||||||||||||||||||||||||
|
Balance as of Jan. 1, 2012 |
202 | 813 | 12,890 | 70 | 7 | 45 | (9 | ) | (1,690 | ) | 12,328 | 34 | 12,362 | |||||||||||||||||||||||||||||||
|
Total comprehensive income (loss) |
(165 | ) | (16 | ) | (100 | ) | 9 | 29 | — | (243 | ) | 5 | (238 | ) | ||||||||||||||||||||||||||||||
|
Dividend distributed |
6 | 422 | (687 | ) | (259 | ) | (259 | ) | ||||||||||||||||||||||||||||||||||||
|
Movement in non-controlling interests |
— | — | (5 | ) | (5 | ) | ||||||||||||||||||||||||||||||||||||||
|
Cancellation of treasury shares |
(17 | ) | — | (1,221 | ) | 1,238 | — | — | ||||||||||||||||||||||||||||||||||||
|
Purchase of treasury shares |
— | (47 | ) | (769 | ) | (816 | ) | (816 | ) | |||||||||||||||||||||||||||||||||||
|
Re-issuance of treasury shares |
(22 | ) | (46 | ) | 118 | 50 | 50 | |||||||||||||||||||||||||||||||||||||
|
Share-based compensation plans |
84 | — | 84 | 84 | ||||||||||||||||||||||||||||||||||||||||
|
Income tax share-based compensation plans |
7 | — | 7 | 7 | ||||||||||||||||||||||||||||||||||||||||
|
|
|
|||||||||||||||||||||||||||||||||||||||||||
|
Balance as of Dec. 31, 2012 |
191 | 1,304 | 10,724 | 54 | (93 | ) | 54 | 20 | (1,103 | ) | 11,151 | 34 | 11,185 | |||||||||||||||||||||||||||||||
|
Total comprehensive income (loss) |
1,262 | (31 | ) | (476 | ) | 1 | 4 | — | 760 | 3 | 763 | |||||||||||||||||||||||||||||||||
|
Dividend distributed |
4 | 402 | (678 | ) | (272 | ) | (272 | ) | ||||||||||||||||||||||||||||||||||||
|
Movement in non-controlling interests |
— | — | (24 | ) | (24 | ) | ||||||||||||||||||||||||||||||||||||||
|
Cancellation of treasury shares |
(7 | ) | (780 | ) | 787 | — | — | |||||||||||||||||||||||||||||||||||||
|
Purchase of treasury shares |
(38 | ) | (631 | ) | (669 | ) | (669 | ) | ||||||||||||||||||||||||||||||||||||
|
Re-issuance of treasury shares |
(36 | ) | (75 | ) | 229 | 118 | 118 | |||||||||||||||||||||||||||||||||||||
|
Share-based compensation plans |
105 | 105 | 105 | |||||||||||||||||||||||||||||||||||||||||
|
Income tax share-based compensation plans |
21 | 21 | 21 | |||||||||||||||||||||||||||||||||||||||||
|
|
|
|||||||||||||||||||||||||||||||||||||||||||
|
Balance as of Dec. 31, 2013 |
188 | 1,796 | 10,415 | 23 | (569 | ) | 55 | 24 | (718 | ) | 11,214 | 13 | 11,227 | |||||||||||||||||||||||||||||||
|
Total comprehensive income (loss) |
(258 | ) | (10 | ) | 798 | (28 | ) | (37 | ) | — | 465 | (4 | ) | 461 | ||||||||||||||||||||||||||||||
|
Dividend distributed |
3 | 433 | (729 | ) | (293 | ) | (293 | ) | ||||||||||||||||||||||||||||||||||||
|
Movement in non-controlling interests |
— | — | 92 | 92 | ||||||||||||||||||||||||||||||||||||||||
|
Cancellation of treasury shares |
(4 | ) | (529 | ) | 533 | — | — | |||||||||||||||||||||||||||||||||||||
|
Purchase of treasury shares |
(26 | ) | (688 | ) | (714 | ) | (714 | ) | ||||||||||||||||||||||||||||||||||||
|
Re-issuance of treasury shares |
(127 | ) | (83 | ) | 326 | 116 | 116 | |||||||||||||||||||||||||||||||||||||
|
Share-based compensation plans |
88 | 88 | 88 | |||||||||||||||||||||||||||||||||||||||||
|
Income tax share-based compensation plans |
(9 | ) | (9 | ) | (9 | ) | ||||||||||||||||||||||||||||||||||||||
|
|
|
|||||||||||||||||||||||||||||||||||||||||||
|
Balance as of Dec. 31, 2014 |
187 | 2,181 | 8,790 | 13 | 229 | 27 | (13 | ) | (547 | ) | 10,867 | 101 | 10,968 | |||||||||||||||||||||||||||||||
|
|
|
|||||||||||||||||||||||||||||||||||||||||||
The accompanying notes are an integral part of these consolidated financial statements.
Annual Report 2014 139
Table of Contents
Group financial statements 12.9

Separation - HealthTech and Lighting Solutions
In September 2014 Philips announced its plan to sharpen its strategic focus by establishing two stand-alone companies focused on the HealthTech and Lighting Solutions opportunities.
To achieve this transformation, from January 1, 2015, Philips started to integrate the sectors Consumer Lifestyle and Healthcare into one operating company focused on our HealthTech businesses. At the same time Philips is taking the next step in the implementation of its new operating model which will give the company a dedicated, focused and lean management structure, as a result of the planned integration of the relevant sector and group layers.
The establishment of the two stand-alone companies will also involve the split and allocation of the current Innovation, Group & Services sector to each company in 2015. This means that in the course of 2015 the IG&S sector as currently described in these financial statements will disappear and no longer be presented as a separate segment for reporting purposes.
Philips also started the process to carve out its Lighting business into a separate legal structure and will consider various options for ownership structures with direct access to capital markets. The proposed separation of the Lighting business impacts all businesses and markets as well as all supporting functions and all assets and liabilities of the Group and may require complex and time consuming disentanglement efforts.
Prior-period restatements
Prior-period financial statements have been restated for the treatment of the combined businesses of Lumileds and Automotive as discontinued operations (see note 3, Discontinued operations and other assets classified as held for sale) and for two voluntary accounting policy changes (see note 1, Significant accounting policies). Movement schedules of balance sheet items include items from continuing and discontinued operations and therefore cannot be reconciled to income from continuing operations and cash flow from continuing operations only.
Notes to the Consolidated financial statements of the Philips Group
Significant accounting policies
The Consolidated financial statements in the Group financial statements section have been prepared in accordance with International Financial Reporting Standards (IFRS) as endorsed by the European Union (EU) and with the statutory provisions of Part 9, Book 2 of the Dutch Civil Code. All standards and interpretations issued by the International Accounting Standards Board (IASB) and the IFRS Interpretations Committee effective year-end 2014 have been endorsed by the EU, except that the EU did not adopt some of the paragraphs of IAS 39 applicable to certain hedge transactions. Koninklijke Philips N.V. (hereafter: the ‘Company’ or ‘Philips’) has no hedge transactions to which these paragraphs are applicable. Consequently, the accounting policies applied by Philips also comply with IFRS as issued by the IASB. These accounting policies have been applied by group entities.
The Consolidated financial statements have been prepared under the historical cost convention, unless otherwise indicated. The Consolidated financial statements are presented in euros, which is the Company’s presentation currency.
On February 24, 2015, the Board of Management authorized the Consolidated financial statements for issue. The Consolidated financial statements as presented in this report are subject to adoption by the Annual General Meeting of Shareholders, to be held on May 7, 2015.
Use of estimates
The preparation of the Consolidated financial statements in conformity with IFRS requires management to make judgments, estimates and assumptions that affect the application of accounting policies and the reported amounts of assets, liabilities, income and expenses. These estimates inherently contain a degree of uncertainty. Actual results may differ from these estimates under different assumptions or conditions.
These estimates and assumptions affect the reported amounts of assets and liabilities, the disclosure of contingent liabilities at the date of the Consolidated financial statements, and the reported amounts of revenues and expenses during the reporting period. We evaluate these estimates and judgments on an ongoing basis and base our estimates on historical experience, current and expected future outcomes, third-party evaluations and various other assumptions that we believe are reasonable under the circumstances. The results of these estimates form the basis for making judgments about the carrying values of assets and liabilities as well as identifying and assessing the accounting treatment with respect to commitments and contingencies. We revise material estimates if changes occur in the circumstances or there is new information or experience on which an estimate was or can be based.
The areas where the most significant judgments and estimates are made are goodwill and other intangibles acquired, deferred tax asset recoverability, impairments, financial instruments, the accounting for an arrangement containing a lease, revenue recognition (multiple element arrangements), assets and liabilities from employee benefit plans, other provisions, uncertain tax positions and other contingencies, classification of assets and liabilities held for sale and the presentation of items of profit and loss and cash flows as continued or discontinued, as well as when determining the fair values of acquired identifiable intangible assets based on an assessment of future cash flows.
140 Annual Report 2014
Table of Contents
Group financial statements 12.9
Further judgment is applied when analyzing impairments of goodwill and intangible assets not yet ready for use that are performed annually and whenever a triggering event has occurred to determine whether the carrying value exceeds the recoverable amount. These analyses generally are based on estimates of future cash flows. Furthermore, the Company applies judgment when actuarial assumptions are established to anticipate future events and are used in calculating post-employment benefit expenses and liabilities. These factors include assumptions with respect to interest rates, rates of increase in health care costs, rates of future compensation increases, turnover rates and life expectancy.
Changes in accounting policies
The accounting policies set out in this section have been applied consistently for all periods presented in these Consolidated financial statements, except for certain voluntary accounting policy changes as explained below and changes in accounting policies as a result of New Standards and Interpretations (see next section).
Prior-period financial statements have been reclassified for two accounting policy changes applied as of January 1, 2014:
| • |
A reclassification of cost by function in the income statement. Company-wide overhead and indirect Business function costs will be brought more in line with the actual activities performed in the markets. This change has no net effect on Income from operations. |
Philips Group
Reclassification of cost by function 1) in millions of EUR
2012 - 2013
|
|
|
|||||||
| 2012 | 2013 | |||||||
|
|
|
|||||||
|
Cost of sales |
87 | 73 | ||||||
|
Selling expenses |
(53 | ) | (123 | ) | ||||
|
Research and development expenses |
(4 | ) | (44 | ) | ||||
|
General and administrative expenses |
(30 | ) | 94 | |||||
|
|
|
|||||||
|
Income from operations |
— | — | ||||||
|
|
|
|||||||
| 1) |
Excludes the reclassification made for the combined businesses of Lumileds and Automotive. |
| • |
A change in the presentation in the Statements of cash flows. Up and until 2013 the cash flows related to interest, tax and pensions were presented in a table separate from the primary Statements of cash flows. The presentation change results in the separate presentation of the interest and tax cash flows in cash flow from operating activities. The pension cash flows are separately presented as part of the pension disclosures. The presentation change has no impact on the net cash flows from operating activities nor the total net cash balance as these cash flows previously used to be part of other aggregated sub lines of the Statements of cash flows. |
Prior-year information
The presentation of certain prior-year disclosures have been adjusted to align with the current year disclosures.
New Standards and Interpretations
IFRS accounting standards adopted as from 2014
The Company has adopted the following new and amended Standards and Interpretations as of January 1, 2014:
IFRIC 21 Levies
IFRIC 21 provides guidance on the accounting for certain outflows imposed on entities by governments in accordance with laws and/or regulations (levies). The Interpretation identifies the obligating event for the recognition of a liability as the activity that triggers the payment of the levy in accordance with the relevant legislation. This Interpretation does not have a material impact on the financial statements. The Company early-adopted IFRIC 21, as endorsed by the EU, to align with the IASB effective date of January 1, 2014.
Changes to other standards, following from Amendments and the Annual Improvement Cycles, do not have a material impact on the Company’s financial statements. In case of the absence of explicit transition requirements for new accounting pronouncements, the Company accounts for any change in accounting policies retrospectively.
IFRS accounting standards adopted as from 2015 and onwards
A number of new standards and amendments to existing standards have been published and are mandatory for the Company beginning on or after January 1, 2015 or later periods, and the Company has not adopted them. Those which may be the most relevant to the Company are set out below. Changes to other standards, following from Amendments and the Annual Improvement Cycles, do not have a material impact on the Company’s financial statements.
IFRS 9 Financial Instruments
IFRS 9 Financial Instruments brings together the classification and measurement, impairment and hedge accounting phases of the IASB’s project to replace IAS 39 Financial Instruments: Recognition and Measurement. IFRS 9 adds a new expected loss impairment model and limited amendments to classification and measurement for financial assets. The impairment model is based on the concept of providing for expected losses at inception of a contract, except in the case of purchased or originated credit-impaired financial assets, where expected credit losses are incorporated into the effective interest rate. The Standard supersedes all previous versions of IFRS 9 and is effective for periods beginning on or after January 1, 2018. The Company is currently assessing the impact of the new Standard.
Annual Report 2014 141
Table of Contents
Group financial statements 12.9
IFRS 15 Revenue from Contracts with Customers
IFRS 15 specifies how and when revenue is recognized as well as describes more informative and relevant disclosures. The Standard supersedes IAS 18 Revenue, IAS 11 Construction Contracts and a number of revenue-related interpretations.
The new Standard provides a single, principles based five-step model to be applied to all contracts with customers. Furthermore, it provides new guidance on whether revenue should be recognized at a point in time or over time. The standard also introduces new guidance on costs of fulfilling and obtaining a contract, specifying the circumstances in which such costs should be capitalized. Costs that do not meet the criteria must be expensed when incurred.
IFRS 15 must be applied for periods beginning on or after January 1, 2017. The Company is currently assessing the impact of the new Standard.
Specific choices within IFRS
Sometimes IFRS allows alternative accounting treatments for measurement and/or disclosure. The most important of these alternative treatments are mentioned below.
Tangible and intangible fixed assets
Under IFRS, an entity shall choose either the cost model or the revaluation model as its accounting for tangible and intangible fixed assets. In this respect, items of property, plant and equipment are measured at cost less accumulated depreciation and accumulated impairment losses. The useful lives and residual values are evaluated annually. Furthermore, the Company chose to apply the cost model meaning that costs relating to product development, the development and purchase of software for both internal use and software intended to be sold and other intangible assets are capitalized and subsequently amortized over the estimated useful life.
Employee benefit accounting
IFRS does not specify how an entity should present its service costs related to pensions and net interest on the net defined benefit liability (asset) in the Statement of income. With regards to these elements, the Company presents service costs in Income from operations and the net interest expenses related to defined benefit plans in Financial expense.
Cash flow statements
Under IFRS, an entity shall report cash flows from operating activities using either the direct method (whereby major classes of gross cash receipts and gross cash payments are disclosed) or the indirect method (whereby profit or loss is adjusted for the effects of transactions of a non-cash nature, any deferrals or accruals of past or future operating cash receipts or payments, and items of income or expense associated with investing or financing cash flows). In this respect, the Company chose to prepare the cash flow statements using the indirect method.
Furthermore, interest cash flows are presented in cash flows from operating activities rather than financing or investing cash flows, because they enter into the determination of profit or loss. The Company choose to present dividends paid to shareholders of Koninklijke Philips N.V. as a component of cash flows from financing activities, rather than to present such dividends as operating cash flows which is an allowed alternative under IFRS.
Policies that are more critical in nature
Revenue recognition
Revenue from the sale of goods in the course of the ordinary activities is measured at the fair value of the consideration received or receivable, net of returns, trade discounts and volume rebates. Revenue for sale of goods is recognized when the significant risks and rewards of ownership have been transferred to the buyer, recovery of the consideration is probable, the associated costs and possible return of the goods can be estimated reliably, there is no continuing involvement with goods, and the amount of revenue can be measured reliably. If it is probable that discounts will be granted and the amount can be measured reliably, then the discount is recognized as a reduction of revenue as the sales are recognized.
Transfer of risks and rewards varies depending on the individual terms of the contract of sale. For consumer-type products in the sectors Lighting and Consumer Lifestyle these criteria are met at the time the product is shipped and delivered to the customer and title and risk have passed to the customer (depending on the delivery conditions) and acceptance of the product has been obtained. Examples of delivery conditions are ‘Free on Board point of delivery’ and ‘Costs, Insurance Paid point of delivery’, where the point of delivery may be the shipping warehouse or any other point of destination as agreed in the contract with the customer and where title and risk for the goods pass to the customer.
Revenues of transactions that have separately identifiable components are recognized based on their relative fair values. These transactions mainly occur in the Healthcare sector and include arrangements that require subsequent installation and training activities in order to become operable for the customer. However, since payment for the equipment is contingent upon the completion of the installation process, revenue recognition is generally deferred until the installation has been completed and the product is ready to be used by the customer in the way contractually agreed.
Revenues are recorded net of sales taxes, customer discounts, rebates and similar charges. For products for which a right of return exists during a defined period, revenue recognition is determined based on the historical pattern of actual returns, or in cases where
142 Annual Report 2014
Table of Contents
Group financial statements 12.9
such information is not available, revenue recognition is postponed until the return period has lapsed. Return policies are typically based on customary return arrangements in local markets.
In case of loss under a sales agreement, the loss is recognized immediately.
Shipping and handling billed to customers is recognized as revenues. Expenses incurred for shipping and handling of internal movements of goods are recorded as cost of sales. Shipping and handling related to sales to third parties are recorded as selling expenses. When shipping and handling is part of a project and billed to the customer, then the related expenses are recorded as cost or sales. Service revenue related to repair and maintenance activities for goods sold is recognized ratably over the service period or as services are rendered.
A provision for product warranty is made at the time of revenue recognition and reflects the estimated costs of replacement and free-of-charge services that will be incurred by the Company with respect to the products. For certain products, the customer has the option to purchase an extension of the warranty, which is subsequently billed to the customer. Revenue recognition occurs on a straight-line basis over the contract period.
Revenue from services is recognized when the Company can reliably measure the amount of revenue and the associated cost related to the stage of completion of a contract or transaction, and the recovery of the consideration is considered probable. Royalty income, which is generally earned based upon a percentage of sales or a fixed amount per product sold, is recognized on an accrual basis based on actual or reliably estimated sales made by the licensees.
Grants from the government are recognized at their fair value where there is a reasonable assurance that the grant will be received and the Company will comply with all attached conditions. Government grants relating to costs are deferred and recognized in the Statement of income over the period necessary to match them with the costs that they are intended to compensate.
Income tax
Income tax comprises current and deferred tax. Income tax is recognized in the Statement of income except to the extent that it relates to items recognized directly within equity or in other comprehensive income. Current tax is the expected tax payable on the taxable income for the year, using tax rates enacted or substantially-enacted at the reporting date, and any adjustment to tax payable in respect of previous years.
Deferred tax assets and liabilities are recognized, using the balance sheet method, for the expected tax consequences of temporary differences between the carrying amounts of assets and liabilities and the amounts used for taxation purposes. Deferred tax is not recognized for the following temporary differences: the initial recognition of goodwill, the initial recognition of assets and liabilities in a transaction that is not a business combination and that affects neither accounting nor taxable profit, and differences relating to investments in subsidiaries to the extent that they probably will not reverse in the foreseeable future. Deferred tax is measured at the tax rates that are expected to be applied to temporary differences when they reverse, based on the laws that have been enacted or substantially-enacted by the reporting date. Deferred tax assets and liabilities are offset if there is a legally-enforceable right to offset current tax liabilities and assets, and they relate to income taxes levied by the same tax authority on the same taxable entity, or on different tax entities, but they intend to settle current tax liabilities and assets on a net basis or their tax assets and liabilities will be realized simultaneously.
A deferred tax asset is recognized for unused tax losses, tax credits and deductible temporary differences, to the extent that it is probable that future taxable profits will be available against which they can be utilized. The ultimate realization of deferred tax assets is dependent upon the generation of future taxable income in the countries where the deferred tax assets originated and during the periods when the deferred tax assets become deductible. Management considers the scheduled reversal of deferred tax liabilities, projected future taxable income, and tax planning strategies in making this assessment.
Deferred tax liabilities for withholding taxes are recognized for subsidiaries in situations where the income is to be paid out as dividend in the foreseeable future and for undistributed earnings of unconsolidated companies to the extent that these withholding taxes are not expected to be refundable or deductible. Changes in tax rates are reflected in the period when the change has been enacted or substantially-enacted by the reporting date.
Provisions
Provisions are recognized if, as a result of a past event, the Company has a present legal or constructive obligation that can be estimated reliably, and it is probable that an outflow of economic benefits will be required to settle the obligation. Provisions are measured at the present value of the expenditures expected to be required to settle the obligation using a pre-tax discount rate that reflects current market assessments of the time value of money. The increase in the provision due to passage of time is recognized as interest expense. The accounting for some of the Company’s provisions is as follows:
| • |
A provision for warranties is recognized when the underlying products or services are sold. The provision is based on historical warranty data and a weighing of possible outcomes against their associated probabilities. |
Annual Report 2014 143
Table of Contents
Group financial statements 12.9
| • |
Measurement of liabilities associated with environmental obligations, is based on current legal and constructive requirements. Liabilities and expected insurance recoveries, if any, are recorded separately. The carrying amount of environmental liabilities is regularly reviewed and adjusted for new facts and changes in law. |
| • |
The provision for restructuring relates to the estimated costs of initiated reorganizations, the most significant of which have been approved by the Board of Management, and which generally involve the realignment of certain parts of the industrial and commercial organization. When such reorganizations require discontinuance and/or closure of lines of activities, the anticipated costs of closure or discontinuance are included in restructuring provisions. A liability is recognized for those costs only when the Company has a detailed formal plan for the restructuring and has raised a valid expectation with those affected that it will carry out the restructuring by starting to implement that plan or announcing its main features to those affected by it. Before a provision is established, the Company recognizes any impairment loss on the assets associated with the restructuring. |
Goodwill
Measurement of goodwill at initial recognition is described under Basis of consolidation below. Goodwill is subsequently measured at cost less accumulated impairment losses. In respect of investments in associates, the carrying amount of goodwill is included in the carrying amount of investment, and an impairment loss on such investment is allocated to the investment as a whole.
Intangible assets other than goodwill
Acquired finite-lived intangible assets are amortized using the straight-line method over their estimated useful life. The useful lives are evaluated annually. Patents and trademarks with a finite useful life acquired from third parties either separately or as part of the business combination are capitalized at cost and amortized over their remaining useful lives. Intangible assets acquired as part of a business combination are capitalized at their acquisition-date fair value.
The Company expenses all research costs as incurred. Expenditure on development activities, whereby research findings are applied to a plan or design for the production of new or substantially improved products and processes, is capitalized as an intangible asset if the product or process is technically and commercially feasible and the Company has sufficient resources and the intention to complete development.
The development expenditure capitalized comprises of all directly attributable costs (including the cost of materials and direct labor). Other development expenditures and expenditures on research activities are recognized in the Statement of income. Capitalized development expenditure is stated at cost less accumulated amortization and impairment losses. Amortization of capitalized development expenditure is charged to the Statement of income on a straight-line basis over the estimated useful lives of the intangible assets.
Discontinued operations and non-current assets held for sale
Non-current assets (disposal groups comprising assets and liabilities) that are expected to be recovered primarily through sale rather than through continuing use are classified as held for sale.
A discontinued operation is a component of an entity that either has been disposed of, or that is classified as held for sale, and (a) represents a separate major line of business or geographical area of operations; and (b) is a part of a single coordinated plan to dispose of a separate major line of business or geographical area of operations; or (c) is a subsidiary acquired exclusively with a view to sell. A component that previously was held for use will have one or more cash-generating units.
Non-current assets held for sale and discontinued operations are carried at the lower of carrying amount or fair value less cost to sell. Any gain or loss from disposal, together with the results of these operations until the date of disposal, is reported separately as discontinued operations. The financial information of discontinued operations is excluded from the respective captions in the Consolidated financial statements and related notes for all periods presented. Comparatives in the balance sheet are not represented when a non-current asset or disposal group is classified as held for sale. Comparatives are restated for presentation of discontinued operations in the Statement of cash flow and Statement of income.
Adjustments in the current period to amounts previously presented in discontinued operations that are directly related to the disposal of a discontinued operation in a prior period are classified separately in discontinued operations. Circumstances to which these adjustments may relate include resolution of uncertainties that arise from the terms of the disposal transaction, such as the resolution of a purchase price adjustments and indemnifications, resolution of uncertainties that arise from and are directly related to the operations of the component before its disposal, such as environmental and product warranty obligations retained by the Company, or the settlement of employee benefit plan obligations provided that the settlement is directly related to the disposal transaction.
Impairment
Impairment of goodwill, intangible assets not yet ready for use and indefinite-lived intangible assets
Goodwill, intangible assets not yet ready for use and indefinite-lived intangible assets are not amortized but tested for impairment annually and whenever impairment indicators require. In most cases the Company identified
144 Annual Report 2014
Table of Contents
Group financial statements 12.9
its cash generating units as one level below that of an operating segment. Cash flows at this level are substantially independent from other cash flows and this is the lowest level at which goodwill is monitored by the Executive Committee. The Company performed and completed annual impairment tests in the same quarter of all years presented in the Statements of income. An impairment loss is recognized in the Statement of income whenever and to the extent that the carrying amount of a cash-generating unit exceeds the unit’s recoverable amount, which is the greater of its value in use and fair value less cost to sell. Value in use is measured as the present value of future cash flows expected to be generated by the asset.
Impairment of non-financial assets other than goodwill, intangible assets not yet ready for use, indefinite-lived intangible assets, inventories and deferred tax assets
Non-financial assets other than goodwill, intangible assets not yet ready for use, indefinite-lived intangible assets, inventories and deferred tax assets are reviewed for impairment whenever events or changes in circumstances indicate that the carrying amount of an asset may not be recoverable. Recoverability of assets to be held and used is recognized and measured by a comparison of the carrying amount of an asset with the greater of its value in use and fair value less cost to sell. Value in use is measured as the present value of future cash flows expected to be generated by the asset. If the carrying amount of an asset is deemed not recoverable, an impairment charge is recognized in the amount by which the carrying amount of the asset exceeds the recoverable amount. The review for impairment is carried out at the level where cash flows occur that are independent of other cash flows.
Impairment losses recognized in prior periods are assessed at each reporting date for any indications that the loss has decreased or no longer exists. An impairment loss is reversed if and to the extent there has been a change in the estimates used to determine the recoverable amount. The loss is reversed only to the extent that the asset’s carrying amount does not exceed the carrying amount that would have been determined, net of depreciation or amortization, if no impairment loss had been recognized. Reversals of impairment are recognized in the Statement of income.
Impairment of financial assets
A financial asset is considered to be impaired if objective evidence indicates that one or more events have had a negative effect on the estimated future cash flows of that asset. In case of available-for-sale financial assets, a significant or prolonged decline in the fair value of the financial assets below its cost is considered an indicator that the financial assets are impaired. If any such evidence exists for available-for-sale financial assets, the cumulative loss - measured as the difference between the acquisition cost and the current fair value, less any impairment loss on that financial asset previously recognized in the Statement of income - is reclassified from the fair value reserve in equity (through Other comprehensive income) to the Statement of income.
If objective evidence indicates that financial assets that are carried at cost need to be tested for impairment, calculations are based on information derived from business plans and other information available for estimating their fair value. Any impairment loss is charged to the Statement of income.
An impairment loss related to financial assets is reversed if in a subsequent period, the fair value increases and the increase can be related objectively to an event occurring after the impairment loss was recognized. The loss is reversed only to the extent that the asset’s carrying amount does not exceed the carrying amount that would have been determined if no impairment loss had been recognized. Reversals of impairment are recognized in the Statement of income except for reversals of impairment of available-for-sale equity securities, which are recognized in Other comprehensive income.
Other policies
Foreign currencies
Foreign currency transactions
The financial statements of all group entities are measured using the currency of the primary economic environment in which the entity operates (functional currency). The euro (EUR) is the functional and presentation currency of the Company. Foreign currency transactions are translated into the functional currency using the exchange rates prevailing at the dates of the transactions or valuation where items are remeasured. Foreign exchange gains and losses resulting from the settlement of such transactions and from the translation at year-end exchange rates of monetary assets and liabilities denominated in foreign currencies are recognized in the Statement of income, except when deferred in Other comprehensive income as qualifying cash flow hedges and qualifying net investment hedges.
Foreign currency differences arising from translation are recognized in the Statement of income, except for available-for-sale equity investments which are recognized in Other comprehensive income, except on impairment in which case foreign currency differences that have been recognized in Other comprehensive income are reclassified to the Statement of income.
All exchange difference items are presented as part of Cost of sales, with the exception of tax items and financial income and expense, which are recognized in the same line item as they relate in the Statement of income.
Non-monetary assets and liabilities denominated in foreign currencies that are measured at fair value are retranslated to the functional currency using the exchange rate at the date the fair value was determined. Non-
Annual Report 2014 145
Table of Contents
Group financial statements 12.9
monetary items in a foreign currency that are measured based on historical cost are translated using the exchange rate at the transaction date.
Foreign operations
The assets and liabilities of foreign operations, including goodwill and fair value adjustments arising on acquisition, are translated to euro at exchange rates at the reporting date. The income and expenses of foreign operations are translated to euro at exchange rates at the dates of the transactions.
Foreign currency differences arising on translation of foreign operations into euro are recognized in Other comprehensive income, and presented as part of Currency translation differences in Equity. However, if the operation is a non-wholly owned subsidiary, then the relevant proportionate share of the translation difference is allocated to Non-controlling interests.
When a foreign operation is disposed of such that control, significant influence or joint control is lost, the cumulative amount in the Currency translation differences related to the foreign operation is reclassified to the Statement of income as part of the gain or loss on disposal. When the Company disposes of only part of its interest in a subsidiary that includes a foreign operation while retaining control, the respective proportion of the cumulative amount is reattributed to Non-controlling interests. When the Company disposes of only part of its investment in an associate or joint venture that includes a foreign operation while retaining significant influence or joint control, the relevant proportion of the cumulative amount is reclassified to the Statement of income.
Financial instruments
Non-derivative financial instruments
Non-derivative financial instruments are recognized initially at fair value when the Company becomes a party to the contractual provisions of the instrument.
Regular way purchases and sales of financial instruments are accounted for at the trade date. Dividend and interest income are recognized when earned. Gains or losses, if any, are recorded in Financial income and expense.
Non-derivative financial instruments comprise cash and cash equivalents, receivables, other non-current financial assets, debt and other financial liabilities that are not designated as hedges.
Cash and cash equivalents
Cash and cash equivalents include all cash balances and short-term highly liquid investments with an original maturity of three months or less that are readily convertible into known amounts of cash.
Receivables
Receivables are carried at the lower of amortized cost or the present value of estimated future cash flows, taking into account discounts given or agreed. The present value of estimated future cash flows is determined through the use of value adjustments for uncollectible amounts. As soon as individual trade accounts receivable can no longer be collected in the normal way and are expected to result in a loss, they are designated as doubtful trade accounts receivable and valued at the expected collectible amounts. They are written off when they are deemed to be uncollectible because of bankruptcy or other forms of receivership of the debtors. The allowance for the risk of non-collection of trade accounts receivable takes into account credit-risk concentration, collective debt risk based on average historical losses, and specific circumstances such as serious adverse economic conditions in a specific country or region.
Other non-current financial assets
Other non-current financial assets include held-to-maturity investments, loans and available-for-sale financial assets and financial assets at fair value through profit or loss.
Held-to-maturity investments are those debt securities which the Company has the ability and intent to hold until maturity. Held-to-maturity debt investments are recorded at amortized cost, adjusted for the amortization or accretion of premiums or discounts using the effective interest method.
Loans receivable are stated at amortized cost, less impairment.
Available-for-sale financial assets are non-derivative financial assets that are designated as available-for-sale and that are not classified in any of the other categories of financial assets. Subsequent to initial recognition, they are measured at fair value and changes therein, other than impairment losses and foreign currency differences on available for sale-debt instruments are recognized in Other comprehensive income and presented in the fair value reserve in equity. When an investment is derecognized, the gain or loss accumulated in equity is reclassified to the Statement of income.
Available-for-sale financial assets including investments in privately-held companies that are not associates, and do not have a quoted market price in an active market and whose fair value could not be reliably determined, are carried at cost.
A financial asset is classified as fair value through profit or loss if it is classified as held for trading or is designated as such upon initial recognition. Financial assets are designated as fair value through profit or loss if the Company manages such investments and makes purchase and sale decisions based on their fair value in accordance with the Company’s documented risk management or investment strategy. Financial assets at
146 Annual Report 2014
Table of Contents
Group financial statements 12.9
fair value through profit or loss are measured at fair value, and changes therein are recognized in the Statement of income. Attributable transaction costs are recognized in the Statement of income as incurred.
Equity
Common shares are classified as equity. Incremental costs directly attributable to the issuance of shares are recognized as a deduction from equity. Where the Company purchases the Company’s equity share capital (treasury shares), the consideration paid, including any directly attributable incremental transaction costs (net of income taxes), is deducted from equity attributable to the Company’s equity holders until the shares are cancelled or reissued. Where such ordinary shares are subsequently reissued, any consideration received, net of any directly attributable incremental transaction costs and the related income tax effects, is included in equity attributable to the Company’s equity holders.
Dividends are recognized as a liability in the period in which they are declared. The income tax consequences of dividends are recognized when a liability to pay the dividend is recognized.
Debt and other liabilities
Debt and liabilities other than provisions are stated at amortized cost. However, loans that are hedged under a fair value hedge are remeasured for the changes in the fair value that are attributable to the risk that is being hedged.
Derivative financial instruments, including hedge accounting
The Company uses derivative financial instruments principally to manage its foreign currency risks and, to a more limited extent, for managing interest rate and commodity price risks. All derivative financial instruments are classified as current assets or liabilities and are accounted for at the trade date. Embedded derivatives are separated from the host contract and accounted for separately if the economic characteristics and risks of the host contract and the embedded derivative are not closely related. The Company measures all derivative financial instruments at fair value derived from market prices of the instruments, or calculated as the present value of the estimated future cash flows based on observable interest yield curves, basis spread, credit spreads and foreign exchange rates, or from option pricing models, as appropriate. Gains or losses arising from changes in fair value of derivatives are recognized in the Statement of income, except for derivatives that are highly effective and qualify for cash flow or net investment hedge accounting.
Changes in the fair value of derivatives that are designated and qualify as fair value hedges are recorded in the Statement of income, together with any changes in the fair value of the hedged asset or liability that are attributable to the hedged risk. For interest rate swaps designated as a fair value hedge of an interest bearing asset or liability that are unwound, the amount of the fair value adjustment to the asset or liability for the risk being hedged is released to the Statement of income over the remaining life of the asset or liability based on the recalculated effective yield.
Changes in the fair value of a derivative that is highly effective and that is designated and qualifies as a cash flow hedge, are recorded in Other comprehensive income, until the Statement of income is affected by the variability in cash flows of the designated hedged item. To the extent that the hedge is ineffective, changes in the fair value are recognized in the Statement of income.
The Company formally assesses, both at the hedge’s inception and on an ongoing basis, whether the derivatives that are used in hedging transactions are highly effective in offsetting changes in fair values or cash flows of hedged items. When it is established that a derivative is not highly effective as a hedge or that it has ceased to be a highly effective hedge, the Company discontinues hedge accounting prospectively. When hedge accounting is discontinued because it is expected that a forecasted transaction will not occur, the Company continues to carry the derivative on the Balance sheet at its fair value, and gains and losses that were accumulated in equity are recognized immediately in the Statement of income. If there is a delay and it is expected that the transaction will still occur, the amount in equity remains there until the forecasted transaction affects income. In all other situations in which hedge accounting is discontinued, the Company continues to carry the derivative at its fair value on the Balance sheet, and recognizes any changes in its fair value in the Statement of income.
Foreign currency differences arising on the retranslation of financial instruments designated as a hedge of a net investment in a foreign operation are recognized directly as a separate component of equity through Other comprehensive income, to the extent that the hedge is effective. To the extent that the hedge is ineffective, such differences are recognized in the Statement of income.
Offsetting and master netting agreements
The Company presents financial assets and financial liabilities on a gross basis as separate line items in the Consolidated balance sheet.
Master netting agreements may be entered into when the Company undertakes a number of financial instrument transactions with a single counterparty. Such an agreement provides for a net settlement of all financial instruments covered by the agreement in the event of default or certain termination events on any of the transactions. A master netting agreement may create a right of offset that becomes enforceable and affects the realization or settlement of individual financial assets and financial liabilities only following a specified termination event. However, if this contractual right is subject to certain limitations then it does not necessarily provide a basis for
Annual Report 2014 147
Table of Contents
Group financial statements 12.9
offsetting unless both of the offsetting criteria are met, i.e. there is a legally enforceable right and an intention to settle net or simultaneously.
Property, plant and equipment
Assets manufactured by the Company include direct manufacturing costs and production overheads. Government grants are deducted from the cost of the related asset.
Depreciation is calculated using the straight-line method over the useful life of the asset. Depreciation of special tooling is generally also based on the straight-line method. Gains and losses on the sale of property, plant and equipment are included in Other business income. Costs related to repair and maintenance activities are expensed in the period in which they are incurred unless leading to an extension of the original lifetime or capacity.
Plant and equipment under finance leases and leasehold improvements are amortized using the straight-line method over the shorter of the lease term or the estimated useful life of the asset. The gain realized on sale and operating leaseback transactions that are concluded based upon market conditions is recognized at the time of the sale.
Leased assets
Leases in which the Company is the lessee and has substantially all the risks and rewards of ownership are classified as finance leases. Finance leases are capitalized at the commencement of the lease at the lower of the fair value of the leased assets and the present value of the minimum lease payments. Each lease payment is allocated between the liability and finance charges. The interest element of the finance cost is charged to the Statement of income over the lease period so as to produce a constant periodic rate of interest on the remaining balance of the liability for each period. The corresponding rental obligations, net of finance charges, are included in other short-term and other non-current liabilities. The property, plant and equipment acquired under finance leases is depreciated over the shorter of the useful life of the assets and the lease term.
Leases in which substantially all risks and rewards of ownership are retained by the lessor are classified as operating leases. Payments made under operating leases (net of any incentives received from the lessor) are recognized in the Statement of income on a straight-line basis over the term of the lease.
Inventories
Inventories are stated at the lower of cost or net realizable value. The cost of inventories comprises all costs of purchase, costs of conversion and other costs incurred in bringing the inventories to their present location and condition. The costs of conversion of inventories include direct labor and fixed and variable production overheads, taking into account the stage of completion and the normal capacity of production facilities. Costs of idle facility and abnormal waste are expensed. The cost of inventories is determined using the first-in, first-out (FIFO) method. Inventory is reduced for the estimated losses due to obsolescence. This reduction is determined for groups of products based on purchases in the recent past and/or expected future demand.
Employee benefit accounting
A defined contribution plan is a post-employment benefit plan under which an entity pays fixed contributions into a separate entity and will have no legal or constructive obligation to pay further amounts. Obligations for contributions to defined contribution pension plans are recognized as an employee benefit expense in the Statement of income in the periods during which services are rendered by employees.
A defined benefit plan is a post-employment benefit plan other than a defined contribution plan. The net pension asset or liability recognized in the Consolidated balance sheets in respect of defined benefit post-employment plans is the fair value of plan assets less the present value of the projected defined benefit obligation (DBO) at the balance sheet date. The projected defined benefit obligation is calculated annually by qualified actuaries using the projected unit credit method. Recognized assets are limited to the present value of any reductions in future contributions or any future refunds.
For the Company’s major plans, a full discount rate curve of high-quality corporate bonds is used to determine the defined benefit obligation. The curves are based on Towers Watson’s RATE:Link which uses data of corporate bonds rated AA or equivalent. For the other plans a single point discount rate is used based on corporate bonds for which there is deep market and the plan’s maturity. Plans in countries without a deep corporate bond market use a discount rate based on the local sovereign curve and the plan’s maturity.
Pension costs in respect of defined benefit post-employment plans primarily represent the increase of the actuarial present value of the obligation for post-employment benefits based on employee service during the year and the interest on the net recognized asset or liability in respect of employee service in previous years.
Remeasurements of the net defined benefit liability comprise actuarial gains and losses, the return on plan assets (excluding interest) and the effect of the asset ceiling (excluding interest). The Company immediately recognizes all remeasurements in Other comprehensive income.
The Company recognizes gains and losses on the settlement of a defined benefit plan when the settlement occurs. The gain or loss on settlement comprises any resulting change in the fair value of plan assets and change in the present value of defined
148 Annual Report 2014
Table of Contents
Group financial statements 12.9
benefit obligation. Past service costs following from the introduction of a change to the benefit payable under a plan or a significant reduction of the number of employees covered by a plan, are recognized in full in the Statement of income.
Short-term employee benefit obligations are measured on an undiscounted basis and are expensed as the related service is provided. The Company recognizes a liability and an expense for bonuses and profit-sharing, based on a formula that takes into consideration the profit attributable to the Company’s shareholders after certain adjustments. The Company recognizes a provision where contractually obliged or where there is a past practice that has created a constructive obligation and the obligation can be measured reliably.
The Company’s net obligation in respect of long-term employee benefits is the amount of future benefit that employees have earned in return for their service in the current and prior periods, such as jubilee entitlements. That benefit is discounted to determine its present value. Remeasurements are recognized in the income statement in the period in which they arise.
Share-based payment
The grant-date fair value of equity-settled share-based payment awards granted to employees is recognized as personnel expense, with a corresponding increase in equity, over the vesting period of the award. The Company uses the Black-Scholes option-pricing model and Monte Carlo sampling to determine the fair value of the awards, depending on the type of instruments granted and certain vesting conditions.
Financial income and expenses
Financial income comprises interest income on funds invested (including available-for-sale financial assets), dividend income, net gains on the disposal of available-for-sale financial assets, net fair value gains on financial assets at fair value through profit or loss, net gains on the remeasurement to fair value of any preexisting available-for-sale interest in an acquiree, and net gains on hedging instruments that are recognized in the Statement of income.
Interest income is recognized on accrual basis in the Statement of income, using the effective interest method. Dividend income is recognized in the Statement of income on the date that the Company’s right to receive payment is established, which in the case of quoted securities is normally the ex-dividend date.
Financial expenses comprise interest expenses on borrowings and on the net defined benefit liability, unwinding of the discount on provisions and contingent consideration, losses on disposal of available-for-sale financial assets, net fair value losses on financial assets at fair value through profit or loss, impairment losses recognized on financial assets (other than trade receivables), net interest expenses related to defined benefit plans and net losses on hedging instruments that are recognized in the Statement of income.
Financial guarantees
The Company recognizes a liability at the fair value of the obligation at the inception of a financial guarantee contract. The guarantee is subsequently measured at the higher of the best estimate of the obligation or the amount initially recognized.
Basis of consolidation
The Consolidated financial statements include the accounts of Koninklijke Philips N.V. and all subsidiaries that the Company controls, i.e. when it is exposed, or has rights, to variable returns from its involvement with the investee and has the ability to affect those returns through its power over the investee. The existence and effect of potential voting rights are considered when assessing whether the Company controls another entity. Subsidiaries are fully consolidated from the date that control commences until the date that control ceases. All intercompany balances and transactions have been eliminated in the Consolidated financial statements. Unrealized losses are eliminated in the same way as unrealized gains, but only to the extent that there is no evidence of impairment.
Business combinations
Business combinations are accounted for using the acquisition method. Under the acquisition method, the identifiable assets acquired, liabilities assumed and any non-controlling interest in the acquiree are recognized at the acquisition date, which is the date on which control is transferred to the Company.
The Company measures goodwill at the acquisition date as:
| • |
the fair value of the consideration transferred; plus |
| • |
the recognized amount of any non-controlling interest in the acquiree; plus |
| • |
if the business combination is achieved in stages, the fair value of the existing equity interest in the acquiree; less |
| • |
the net recognized amount (generally fair value) of the identifiable assets acquired and liabilities assumed. |
Costs related to the acquisition, other than those associated with the issue of debt or equity securities, that the Company incurs are expensed as incurred.
Any contingent consideration payable is recognized at fair value at the acquisition date and initially is presented as Long-term provisions. When the timing and amount of the consideration become more certain, it is reclassified to Accrued liabilities. If the contingent consideration is classified as equity, it is not remeasured and settlement is accounted for within equity.
Annual Report 2014 149
Table of Contents
Group financial statements 12.9
Otherwise, subsequent changes to the fair value of the contingent consideration are recognized in the Statement of income.
Acquisitions of and adjustments to non-controlling interests
Acquisitions of non-controlling interests are accounted for as transactions with owners in their capacity as owners and therefore no goodwill is recognized. Adjustments to non-controlling interests arising from transactions that do not involve the loss of control are based on a proportionate amount of the net assets of the subsidiary.
Loss of control
Upon the loss of control, the Company derecognizes the assets and liabilities of the subsidiary, any non-controlling interests and the other components of equity related to the subsidiary. Any surplus or deficit arising on the loss of control is recognized in the Statement of income. If the Company retains any interest in the previous subsidiary, then such interest is measured at fair value at the date the control is lost. Subsequently it is accounted for as either an equity-accounted investee (associate) or as an available-for-sale financial asset, depending on the level of influence retained.
Investments in associates (equity-accounted investees)
Associates are all entities over which the Company has significant influence, but does not control. Significant influence is presumed with a shareholding of between 20% and 50% of the voting rights. Investments in associates are accounted for using the equity method of accounting and are initially recognized at cost. The Company’s investments in associates includes goodwill identified on acquisition, net of any accumulated impairment loss.
The Company’s share of the net income of these companies is included in Results relating to investments in associates in the Statement of income, after adjustments to align the accounting policies with those of the Company, from the date that significant influence commences until the date that significant influence ceases. Dilution gains and losses arising from investments in associates are recognized in the Statement of income as part of Other results relating to investments in associates. When the Company’s share of losses exceeds its interest in an associate, the carrying amount of that interest (including any long-term loans) is reduced to zero and recognition of further losses is discontinued except to the extent that the Company has incurred legal or constructive obligations or made payments on behalf of the associate. Unrealized gains on transactions between the Company and its associates are eliminated to the extent of the Company’s interest in the associates. Unrealized losses are also eliminated unless the transaction provides evidence of an impairment of the asset transferred. Remeasurement differences of equity stake resulting from gaining control over the investee previously recorded as associate are recorded under Results relating to investments in associates.
Cash flow statements
Cash flows arising from transactions in a foreign currency are translated in the Company’s functional currency using the exchange rate at the date of the cash flow. Cash flows from derivative instruments that are accounted for as fair value hedges or cash flow hedges are classified in the same category as the cash flows from the hedged items. Cash flows from other derivative instruments are classified consistent with the nature of the instrument.
Segment information
Operating segments are components of the Company’s business activities about which separate financial information is available that is evaluated regularly by the chief operating decision maker (the Executive Committee of the Company). The Executive Committee decides how to allocate resources and assesses performance. Reportable segments comprise the operating sectors Healthcare, Consumer Lifestyle and Lighting. Innovation, Group & Services (IG&S) is a sector but not a separate reportable segment and holds, amongst others, headquarters, overhead and regional/ country organization expenses. Segment accounting policies are the same as the accounting policies as applied to the Group.
Earnings per Share
The Company presents basic and diluted earnings per share (EPS) data for its common shares. Basic EPS is calculated by dividing the Net income (loss) attributable to shareholders by the weighted average number of common shares outstanding during the period, adjusted for own shares held. Diluted EPS is determined by adjusting the Net income (loss) attributable to shareholders and the weighted average number of common shares outstanding during the period, adjusted for own shares held, for the effects of all dilutive potential common shares, which comprises of restricted shares, performance shares and share options granted to employees.
150 Annual Report 2014
Table of Contents
Group financial statements 12.9
I
nformation by sector and main country
Philips Group
Information on income statement and cash flow by sector in millions of EUR unless otherwise stated
2012 - 2014
|
|
|
|||||||||||||||||||||||
| sales |
sales including
intercompany |
research and
development expenses |
income from
operations |
income from
operations as a % of sales |
cash flow before
financing activities |
|||||||||||||||||||
|
|
|
|||||||||||||||||||||||
| 2014 | ||||||||||||||||||||||||
|
Healthcare |
9,186 | 9,209 | (822 | ) | 456 | 5.0 | % | 910 | ||||||||||||||||
|
Consumer Lifestyle |
4,731 | 4,739 | (263 | ) | 520 | 11.0 | % | 553 | ||||||||||||||||
|
Lighting |
6,869 | 6,927 | (330 | ) | 185 | 2.7 | % | 442 | ||||||||||||||||
|
Innovation, Group & Services |
605 | 934 | (220 | ) | (675 | ) | — | (1,586 | ) | |||||||||||||||
|
Inter-sector eliminations |
(418 | ) | ||||||||||||||||||||||
|
|
|
|||||||||||||||||||||||
|
Philips Group |
21,391 | 21,391 | (1,635 | ) | 486 | 2.3 | % | 319 | ||||||||||||||||
| 2013 | ||||||||||||||||||||||||
|
Healthcare |
9,575 | 9,600 | (810 | ) | 1,315 | 13.7 | % | 1,292 | ||||||||||||||||
|
Consumer Lifestyle |
4,605 | 4,622 | (268 | ) | 429 | 9.3 | % | 480 | ||||||||||||||||
|
Lighting |
7,145 | 7,211 | (313 | ) | 413 | 5.8 | % | 418 | ||||||||||||||||
|
Innovation, Group & Services |
665 | 977 | (268 | ) | (302 | ) | — | (2,140 | ) | |||||||||||||||
|
Inter-sector eliminations |
(420 | ) | ||||||||||||||||||||||
|
|
|
|||||||||||||||||||||||
|
Philips Group |
21,990 | 21,990 | (1,659 | ) | 1,855 | 8.4 | % | 50 | ||||||||||||||||
| 2012 | ||||||||||||||||||||||||
|
Healthcare |
9,983 | 10,005 | (858 | ) | 1,026 | 10.3 | % | 1,298 | ||||||||||||||||
|
Consumer Lifestyle |
4,319 | 4,329 | (256 | ) | 400 | 9.3 | % | 413 | ||||||||||||||||
|
Lighting |
7,303 | 7,366 | (341 | ) | (78 | ) | (1.1 | )% | 314 | |||||||||||||||
|
Innovation, Group & Services |
629 | 900 | (269 | ) | (756 | ) | — | (851 | ) | |||||||||||||||
|
Inter-sector eliminations |
(366 | ) | ||||||||||||||||||||||
|
|
|
|||||||||||||||||||||||
|
Philips Group |
22,234 | 22,234 | (1,724 | ) | 592 | 2.7 | % | 1,174 | ||||||||||||||||
|
|
|
|||||||||||||||||||||||
Our sectors are organized based on the nature of the products and services. The four sectors comprise Healthcare, Consumer Lifestyle, Lighting and Innovation, Group & Services as shown in the table above. A short description of these sectors is as follows:
Healthcare: Consists of the following businesses - Imaging Systems, Healthcare Informatics, Services & Solutions, Patient Care & Monitoring Solutions, and Customer Services.
Consumer Lifestyle: Consists of the following businesses - Personal Care, Domestic Appliances, and Health & Wellness.
Lighting: Consists of the following businesses - Light Sources & Electronics, Professional Lighting Solutions, and Consumer Luminaires.
Innovation, Group & Services: Consists of group headquarters, as well as the overhead expenses of regional and country organizations. Also included are the net results of group innovation, intellectual property & services, the global service units and Philips’ pension and other postretirement benefit costs not directly allocated to the other sectors.
Transactions between the sectors mainly relate to services provided by the sector Innovation, Group & Services to the other sectors. The pricing of such transactions is determined on an arm’s length basis.
Annual Report 2014 151
Table of Contents
Group financial statements 12.9
Philips Group
Information on balance sheet and capital expenditure in millions of EUR
2012 - 2014
|
|
|
|||||||||||||||||||||||||||
| total assets |
net operating
capital |
total liabilities
excl. debt |
current accounts
receivable, net |
tangible and
intangible assets |
depreciation and
amortization 1) |
capital
expenditures |
||||||||||||||||||||||
|
|
|
|||||||||||||||||||||||||||
| 2014 | ||||||||||||||||||||||||||||
|
Healthcare |
11,274 | 7,565 | 3,629 | 2,112 | 6,934 | (480 | ) | 127 | ||||||||||||||||||||
|
Consumer Lifestyle |
3,049 | 1,353 | 1,696 | 791 | 1,647 | (198 | ) | 109 | ||||||||||||||||||||
|
Lighting |
5,739 | 3,638 | 2,081 | 1,438 | 3,167 | (351 | ) | 84 | ||||||||||||||||||||
|
Innovation, Group & Services |
6,677 | (3,718 | ) | 5,525 | 135 | 873 | (158 | ) | 117 | |||||||||||||||||||
|
|
|
|||||||||||||||||||||||||||
|
Sector totals |
26,739 | 8,838 | 12,931 | 4,476 | 12,621 | (1,187 | ) | 437 | ||||||||||||||||||||
|
Assets classified as held for sale |
1,613 | 349 | ||||||||||||||||||||||||||
|
|
|
|
|
|||||||||||||||||||||||||
|
Total assets/liabilities (excl. debt) |
28,352 | 13,280 | ||||||||||||||||||||||||||
| 2013 | ||||||||||||||||||||||||||||
|
Healthcare |
10,465 | 7,437 | 2,943 | 1,978 | 6,467 | (517 | ) | 132 | ||||||||||||||||||||
|
Consumer Lifestyle |
2,832 | 1,261 | 1,571 | 743 | 1,574 | (199 | ) | 135 | ||||||||||||||||||||
|
Lighting |
6,711 | 4,462 | 2,229 | 1,567 | 3,857 | (333 | ) | 117 | ||||||||||||||||||||
|
Innovation, Group & Services |
6,044 | (2,922 | ) | 4,340 | 132 | 648 | (128 | ) | 98 | |||||||||||||||||||
|
|
|
|||||||||||||||||||||||||||
|
Sector totals |
26,052 | 10,238 | 11,083 | 4,420 | 12,546 | (1,177 | ) | 482 | ||||||||||||||||||||
|
Assets classified as held for sale |
507 | 348 | ||||||||||||||||||||||||||
|
|
|
|
|
|||||||||||||||||||||||||
|
Total assets/liabilities (excl. debt) |
26,559 | 11,431 | ||||||||||||||||||||||||||
| 2012 | ||||||||||||||||||||||||||||
|
Healthcare |
11,248 | 7,976 | 3,186 | 1,967 | 7,130 | (543 | ) | 135 | ||||||||||||||||||||
|
Consumer Lifestyle |
3,280 | 1,205 | 2,075 | 865 | 1,694 | (198 | ) | 128 | ||||||||||||||||||||
|
Lighting |
6,970 | 4,635 | 2,313 | 1,364 | 4,293 | (388 | ) | 111 | ||||||||||||||||||||
|
Innovation, Group & Services |
7,540 | (4,500 | ) | 5,761 | 138 | 521 | (113 | ) | 105 | |||||||||||||||||||
|
|
|
|||||||||||||||||||||||||||
|
Sector totals |
29,038 | 9,316 | 13,335 | 4,334 | 13,638 | (1,242 | ) | 479 | ||||||||||||||||||||
|
Assets classified as held for sale |
43 | 27 | ||||||||||||||||||||||||||
|
|
|
|
|
|||||||||||||||||||||||||
|
Total assets/liabilities (excl. debt) |
29,081 | 13,362 | ||||||||||||||||||||||||||
|
|
|
|||||||||||||||||||||||||||
| 1) |
Includes impairments of tangible and intangible assets excluding goodwill |
Philips Group
Goodwill assigned to sectors in millions of EUR
2013 - 2014
|
|
|
|||||||||||||||||||||||||||||||
|
carrying value at January 1 |
reclassification | acquisitions |
purchase
price
|
impairments |
divestments
to assets
|
translation
differences |
carrying value
at December 31 |
|||||||||||||||||||||||||
|
|
|
|||||||||||||||||||||||||||||||
| 2014 | ||||||||||||||||||||||||||||||||
|
Healthcare |
4,275 | — | 1 | 8 | — | (2 | ) | 497 | 4,779 | |||||||||||||||||||||||
|
Consumer Lifestyle |
632 | — | — | — | — | — | 54 | 686 | ||||||||||||||||||||||||
|
Lighting |
1,586 | — | 58 | — | — | (155 | ) | 187 | 1,676 | |||||||||||||||||||||||
|
Innovation, Group & Services |
11 | — | 9 | — | — | (3 | ) | — | 17 | |||||||||||||||||||||||
|
|
|
|||||||||||||||||||||||||||||||
|
Philips Group |
6,504 | — | 68 | 8 | — | (160 | ) | 738 | 7,158 | |||||||||||||||||||||||
152 Annual Report 2014
Table of Contents
Group financial statements 12.9
|
carrying value at January 1 |
reclassification | acquisitions |
purchase
price
|
impairments |
divestments
to assets
|
translation
differences |
carrying value
at December 31 |
|||||||||||||||||||||||||
| 2013 | ||||||||||||||||||||||||||||||||
|
Healthcare |
4,573 | — | 3 | 11 | — | (40 | ) | (272 | ) | 4,275 | ||||||||||||||||||||||
|
Consumer Lifestyle |
668 | — | — | — | — | (18 | ) | (18 | ) | 632 | ||||||||||||||||||||||
|
Lighting |
1,707 | (8 | ) | 1 | (15 | ) | (26 | ) | — | (73 | ) | 1,586 | ||||||||||||||||||||
|
Innovation, Group & Services |
— | 8 | — | — | — | 3 | — | 11 | ||||||||||||||||||||||||
|
|
|
|||||||||||||||||||||||||||||||
|
Philips Group |
6,948 | — | 4 | (4 | ) | (26 | ) | (55 | ) | (363 | ) | 6,504 | ||||||||||||||||||||
|
|
|
|||||||||||||||||||||||||||||||
Philips Group
Main countries in millions of EUR
2012 - 2014
|
|
|
|||||||
| sales 1) | tangible and intangible assets | |||||||
|
|
|
|||||||
| 2014 | ||||||||
|
Netherlands |
594 | 937 | ||||||
|
United States |
6,160 | 7,649 | ||||||
|
China |
2,362 | 1,135 | ||||||
|
Germany |
1,351 | 153 | ||||||
|
Japan |
908 | 379 | ||||||
|
France |
839 | 52 | ||||||
|
United Kingdom |
722 | 594 | ||||||
|
Other countries |
8,455 | 1,722 | ||||||
|
|
|
|||||||
|
Total main countries |
21,391 | 12,621 | ||||||
|
Assets classified as held for sale |
989 | |||||||
|
|
|
|||||||
|
Total tangible and intangible assets |
13,610 | |||||||
| 2013 2) | ||||||||
|
Netherlands |
649 | 915 | ||||||
|
United States |
6,325 | 7,384 | ||||||
|
China |
2,616 | 1,057 | ||||||
|
Germany |
1,316 | 288 | ||||||
|
Japan |
943 | 401 | ||||||
|
France |
890 | 80 | ||||||
|
United Kingdom |
677 | 573 | ||||||
|
Other countries |
8,574 | 1,848 | ||||||
|
|
|
|||||||
|
Total main countries |
21,990 | 12,546 | ||||||
|
Assets classified as held for sale |
62 | |||||||
|
|
|
|||||||
|
Total tangible and intangible assets |
12,608 | |||||||
| 2012 2) | ||||||||
|
Netherlands |
619 | 886 | ||||||
|
United States |
6,733 | 8,007 | ||||||
|
China |
2,391 | 1,114 | ||||||
|
Germany |
1,277 | 271 | ||||||
|
Japan |
1,068 | 537 | ||||||
|
France |
920 | 90 | ||||||
|
United Kingdom |
664 | 628 | ||||||
|
Other countries |
8,562 | 2,105 | ||||||
|
|
|
|||||||
|
Total main countries |
22,234 | 13,638 | ||||||
|
Assets classified as held for sale |
6 | |||||||
|
|
|
|||||||
|
Total tangible and intangible assets |
13,644 | |||||||
|
|
|
|||||||
| 1) |
The sales are reported based on country of destination. |
| 2) |
The previous years’ presentation reflects the sales and tangible and intangible assets of the main countries of 2014 for the respective years. |
Annual Report 2014 153
Table of Contents
Group financial statements 12.9
Discontinued operations and other assets classified as held for sale
Discontinued operations included in the Consolidated statements of income and the Consolidated statements of cash flows consist of the combined Lumileds and Automotive businesses, the Audio, Video, Multimedia and Accessories (AVM&A) business and certain other divestments reported as discontinued operations.
Discontinued operations: Combined Lumileds and Automotive businesses
Philips announced in a press release on June 30, 2014, that it will start the process to combine its Lumileds (LED components) and Automotive businesses into a stand-alone company within the Philips Group and that it will explore strategic options to attract capital from third-party investors for this business.
The company is in discussion with external investors for the combined Lumileds and Automotive Lighting businesses and expects to complete a transaction in the first half of 2015.
The combined businesses of Lumileds and Automotive were reported as discontinued operations in the Consolidated statements of income and Consolidated statements of cash flows with the related assets and liabilities as per the end of November 2014 included as Assets classified as held for sale and Liabilities directly associated with assets held for sale in the Consolidated balance sheet.
The following table summarizes the results of the combined businesses of Lumileds and Automotive included in the Consolidated statements of income as discontinued operations.
Philips Group
Results of combined Lumileds and Automotive Lighting businesses in millions of EUR
2012 - 2014
|
|
|
|||||||||||
| 2012 | 2013 | 2014 | ||||||||||
|
|
|
|||||||||||
|
Sales |
1,139 | 1,268 | 1,416 | |||||||||
|
Costs and expenses |
(1,083 | ) | (1,134 | ) | (1,202 | ) | ||||||
|
|
|
|||||||||||
|
Income before taxes |
56 | 134 | 214 | |||||||||
|
Income taxes |
33 | (1 | ) | (73 | ) | |||||||
|
|
|
|||||||||||
|
Results from discontinued operations |
89 | 133 | 141 | |||||||||
|
|
|
|||||||||||
Upon disposal, the associated currency translation differences, part of Shareholders’ equity, will be recognized in the Consolidated statement of income. At December 31, 2014, the estimated release amounts to a EUR 24 million gain.
The following table presents the assets and liabilities of the combined Lumileds and Automotive business, as Assets classified as held for sale and Liabilities directly associated with assets classified as held for sale in the Consolidated balance sheet as of 2014.
Philips Group
Assets and liabilities of combined Lumileds and Automotive Lighting businesses in millions of EUR
2014
|
|
|
|||
| 2014 | ||||
|
|
|
|||
|
Property, plant and equipment |
666 | |||
|
Intangible assets including goodwill |
295 | |||
|
Inventories |
248 | |||
|
Accounts receivable |
278 | |||
|
Other assets |
14 | |||
|
|
|
|||
|
Assets classified as held for sale |
1,501 | |||
|
Accounts payable |
(134 | ) | ||
|
Provisions |
(34 | ) | ||
|
Other liabilities |
(149 | ) | ||
|
|
|
|||
|
Liabilities directly associated with assets held for sale |
(317 | ) | ||
|
|
|
|||
Non-transferrable balance sheet positions, such as certain accounts receivable, accounts payable, accrued liabilities and provisions are reported on the respective balance sheet captions.
Discontinued operations: Audio, Video, Multimedia and Accessories business
As announced on April 28, 2014, the AVM&A business was divested to Gibson Brands, Inc. The transfer was effected on June 29, 2014 and in December 2014 a final settlement closed the deal.
The following table summarizes the results of the AVM&A business included in the Consolidated statements of income as Discontinued operations.
Philips Group
Results of Audio, Video, Multimedia and Accessories business in millions of EUR
2012 - 2014
|
|
|
|||||||||||
| 2012 | 2013 | 2014 | ||||||||||
|
|
|
|||||||||||
|
Sales |
1,414 | 1,189 | 469 | |||||||||
|
Costs and expenses |
(1,295 | ) | (1,180 | ) | (473 | ) | ||||||
|
Gain on sale of business |
— | — | 10 | |||||||||
|
|
|
|||||||||||
|
Income before taxes |
119 | 9 | 6 | |||||||||
|
Income taxes |
(38 | ) | (3 | ) | 12 | |||||||
|
Investments in associates |
(3 | ) | ||||||||||
|
|
|
|||||||||||
|
Results from discontinued operations |
78 | 6 | 18 | |||||||||
|
|
|
|||||||||||
The following table shows the components of the gain on the sale of the AVM&A business.
Philips Group
Gain on the sale of the Audio, Video, Multimedia and Accessories business in millions of EUR
2014
|
|
|
|||
| 2014 | ||||
|
|
|
|||
|
Consideration |
74 | |||
|
Carrying value of net assets disposed |
(61 | ) | ||
|
Cost of disposal |
(3 | ) | ||
|
|
|
|||
|
Gain on sale of business |
10 | |||
|
Income taxes |
12 | |||
|
|
|
|||
|
Net gain on sale of business |
22 | |||
|
|
|
|||
Assets classified as held for sale amounted to EUR 484 million at moment of disposal (December 31, 2013: EUR 400 million). Liabilities directly associated with the
154 Annual Report 2014
Table of Contents
 Group financial statements 12.9
assets held for sale amounted to EUR 423 million at moment of disposal (December 31, 2013: EUR 348 million) in the Consolidated balance sheets.
Discontinued operations: Other
Certain results of other divestments including the Television business formerly reported as discontinued operations are included with a net gain of EUR 31 million in 2014 (2013: a net loss of EUR 1 million; 2012: a net loss of EUR 31 million).
Other assets classified as held for sale
On July 1, 2013, Philips announced to transfer certain assets and cash proceeds from the sale of certain assets to the Dutch pension plan. In total EUR 38 million of related assets are classified as held for sale as of December 31, 2014 (December 31, 2013: EUR 94 million). For more details see note 20, Post-employment benefits.
Assets and liabilities directly associated with assets held for sale relate to property, plant and equipment for an amount of EUR 23 million (December 31, 2013: EUR 13 million) and businesses classified as held for sale amounted to EUR 19 million at December 31, 2014 (December 31, 2013 EUR nil million).
In 2014, property, plant and equipment divested assets classified as held for sale amounted to EUR 17 million with proceeds of EUR 19 million. Other non-current financial assets divested assets classified as held for sale amounted to EUR 76 million with proceeds of EUR 76 million. Businesses divested assets classified as held for sale amounted to EUR 49 million and liabilities directly associated with the assets held for sale amounted to EUR 3 million. The businesses divested had proceeds of EUR 45 million.
2014
Acquisitions
Philips completed three acquisitions in 2014. These acquisitions involved an aggregated purchase price of EUR 171 million.
One of the acquisitions in 2014, was General Lighting Company (GLC), domiciled in The Kingdom of Saudi Arabia (KSA). This acquisition enables Philips to grow its business in KSA, the largest economy in the Middle East by GDP, particularly in LED lighting.
On September 2, 2014, the Company acquired 51% of GLC from a consortium of shareholders for a total amount of EUR 146 million (on a cash-free, debt-free basis). Taking into account closing conditions, Philips paid an amount of EUR 148 million. The overall cash position of GLC on the transaction date was EUR 23 million resulting in a net cash outflow related to this acquisition of EUR 125 million. Acquisition related costs that were recognized in General and administrative expenses amounted to EUR 4 million.
Subsequent to the acquisition, Philips’ existing Lighting activities in KSA were combined with GLC. This combined entity was renamed Philips Lighting Saudi Arabia.
Alliance Holding Ltd. is the company that holds a 49% non-controlling interest in Philips Lighting Saudi Arabia.
As of September 2, 2014, Philips Lighting Saudi Arabia is consolidated as part of the Professional Lighting Solutions business within the Lighting sector. The condensed balance sheet of GLC, immediately before and after the acquisition is as follows:
GLC
Balance sheet in millions of EUR
2014
|
|
|
|||||||
|
before
date |
after
date |
|||||||
|
|
|
|||||||
|
Goodwill |
58 | |||||||
|
Other intangible assets |
158 | |||||||
|
Property, plant and equipment |
18 | 18 | ||||||
|
Working capital |
112 | 122 | ||||||
|
Provisions |
(15 | ) | (56 | ) | ||||
|
Cash |
23 | 23 | ||||||
|
|
|
|||||||
|
Total assets and liabilities |
138 | 323 | ||||||
|
Group equity |
47 | 146 | ||||||
|
Non-controlling interests |
— | 86 | ||||||
|
Loans |
91 | 91 | ||||||
|
|
|
|||||||
|
Financed by |
138 | 323 | ||||||
|
|
|
|||||||
The fair value of assets and liabilities after the acquisition is provisional pending a final assessment in the course of 2015.
The goodwill is primarily related to the synergies expected to be achieved from integrating GLC in the Lighting sector. The goodwill is not tax deductible.
Other intangible assets are comprised of the following:
GLC
Other intangible assets in millions of EUR
2014
|
|
|
|||||||
| amount |
amortization
period in years |
|||||||
|
|
|
|||||||
|
Order backlog |
17 | 0.2 | ||||||
|
Brand name |
57 | 20 | ||||||
|
Customer relationships |
84 | 10 | ||||||
|
|
|
|||||||
|
Total other intangible assets |
158 | |||||||
|
|
|
|||||||
For the period from September 2, 2014, Philips Lighting Saudi Arabia contributed sales of EUR 86 million and loss from operations of EUR 19 million mainly due to amortization of other intangible assets.
Annual Report 2014 155
Table of Contents
Group financial statements 12.9
Divestments
Apart from the divestment of the Lifestyle Entertainment activities described in note 3, Discontinued operations and other assets classified as held for sale, Philips completed two other divestments of business activities during 2014, which related to Healthcare and Lighting activities. The two transactions involved an aggregate consideration of EUR 43 million.
2013
There were four acquisitions in 2013. These acquisitions involved an aggregated purchase price of EUR 10 million.
Philips completed five divestments of business activities during 2013, mainly related to certain Healthcare service activities. The transactions involved an aggregate consideration of EUR 99 million.
In this section we discuss the nature of, and risks associated with, the Company’s interests in its consolidated entities and associates, and the effects of those interests on the Company’s financial position and financial performance. Interests in entities relates to:
| • |
Interests in subsidiaries |
| • |
Investments in associates |
Interests in subsidiaries
Wholly owned subsidiaries
The Group financial statements comprise the assets and liabilities of approximately 400 legal entities. Set out below is a list of material subsidiaries representing greater than 5% of either the consolidated group sales, income from operations or net income (before any intra-group eliminations). All of the entities are 100% owned and have been for the last 3 years.
Philips Group
Interests in materially wholly owned subsidiaries in alphabetical order
2014
|
|
||
|
Legal entity name |
Principal country of business |
|
|
Invivo Corporation |
United States | |
|
Philips (China) Investment Company, Ltd. |
China | |
|
Philips Consumer Lifestyle B.V. |
Netherlands | |
|
Philips Domestic Appliances and Personal Care Co |
China | |
|
Philips Electronics China B.V. |
Netherlands | |
|
Philips Electronics Japan, Ltd. |
Japan | |
|
Philips Electronics North America Corporation |
United States | |
|
Philips Electronics UK Limited |
United Kingdom | |
|
Philips GmbH |
Germany | |
|
Philips Lighting Poland S.A. |
Poland | |
|
Philips Lumileds Lighting Company Sdn. Bhd. |
Malaysia | |
|
Philips Medical Systems Technologies Ltd. |
Israel | |
|
Philips Nederland B.V. |
Netherlands | |
|
Philips Oral Healthcare, Inc. |
United States | |
|
Philips Respironics GK |
Japan | |
|
Philips Societa per Azioni |
Italy | |
|
Philips Ultrasound, Inc. |
United States | |
|
RI Finance, Inc. |
United States | |
|
RIC Investments, LLC |
United States | |
|
|
||
Not wholly owned subsidiaries
In total, 21 consolidated subsidiaries are not wholly owned by the Company. Among the consolidated legal entities is Philips Lighting Saudi Arabia created after the acquisition of General Lighting Company (GLC) where the Company owns 51% of the voting power. GLC was acquired on September 2, 2014. The Company controls this entity. The sales, income from operations and net income of this entity is less than 1% of the consolidated financial data. The non-controlling interest of 49% represents an amount of EUR 86 million as per December 31, 2014. The non-controlling interest related to GLC at the acquisition date was measured at the holders’ proportionate interest in the recognized amount of the identifiable net assets, which means that goodwill recognized by Philips in this transaction relates only to the 51% interest acquired.
Also among the consolidated legal entities is Philips India Limited where the Company owns 96% of the voting power. The non-controlling interest of 4% represents an amount of EUR 8 million as per December 31, 2014.
The sales, income from operations and net income of the remaining not wholly owned subsidiaries (before any intra-group eliminations) are less than 3% of the consolidated financial data of the Company and are therefore not considered material.
Investments in associates
Philips has investments in a number of associates, none of them are regarded as individually material.
156 Annual Report 2014
Table of Contents
Group financial statements 12.9
The changes during 2014 are as follows:
Philips Group
Investments in associates in millions of EUR
2014
|
|
|
|||
| Total investments | ||||
|
|
|
|||
|
Balance as of January 1, 2014 |
161 | |||
|
Changes: |
||||
|
Acquisitions/additions |
10 | |||
|
Sales/Redemption |
(1 | ) | ||
|
Reclassifications |
(8 | ) | ||
|
Share in income |
30 | |||
|
Dividends declared |
(41 | ) | ||
|
Translation and exchange rate differences |
16 | |||
|
Transfer to assets classified as held for sale |
(10 | ) | ||
|
|
|
|||
|
Balance as of December 31, 2014 |
157 | |||
|
|
|
|||
Included in the line acquisitions/additions is an investment of EUR 6 million where the Company owns less than 20% in the capital of the underlying company but is able to exercise significant influence and is therefore accounted for as an Investment in associate.
During 2014 the Company’s shareholding in one of its investments in associates was diluted and subsequently an amount of EUR 8 million was reclassified to available-for-sale financial assets, this movement is shown in the reclassifications line in the table above. The dilution gain of EUR 32 million is recognized in Results relating to investments in associates.
The Company owns three equity interests which represent more than 20% in the capital of the underlying companies. With respect to these equity interests, the Company cannot exercise significant influence based on governance agreements concluded among shareholders. These equity interests are accounted for as Other non-current financial assets. In 2014, the Company’s share in net income of these entities was insignificant.
Summarized information of investments in associates
Unaudited summarized financial information on the Company’s most significant investments in associates, on a combined basis and not adjusted for the percentage of ownership held by Philips, is presented below. It is based on the most recent available financial information.
Included from April 2012 until December 31, 2013 is the 30%-interest in TP Vision Holding which includes the former Philips Television business.
Philips Group
Summarized income statement of investments in associates in millions of EUR
2012 - 2014
|
|
|
|||||||||||
| 2012 | 2013 | 2014 | ||||||||||
|
|
|
|||||||||||
|
Net sales |
2,534 | 2,180 | 341 | |||||||||
|
Income before taxes |
(7 | ) | (243 | ) | 126 | |||||||
|
Income taxes |
2 | 12 | (37 | ) | ||||||||
|
|
|
|||||||||||
|
Net income |
(5 | ) | (231 | ) | 89 | |||||||
|
Total share in net income of associates recognized in the Consolidated statements of income |
(5 | ) | 5 | 30 | ||||||||
|
|
|
|||||||||||
Philips Group
Summarized net asset value of investments in associates in millions of EUR
2013 - 2014
|
|
|
|||||||
| 2013 | 2014 | |||||||
|
|
|
|||||||
|
Current assets |
1,368 | 584 | ||||||
|
Non-current assets |
412 | 190 | ||||||
|
|
|
|||||||
|
Total assets |
1,780 | 774 | ||||||
|
Current liabilities |
(1,327 | ) | (360 | ) | ||||
|
Non-current liabilities |
(278 | ) | (45 | ) | ||||
|
|
|
|||||||
|
Net asset value |
175 | 369 | ||||||
|
Investments in associates included in the Consolidated balance sheet |
161 | 157 | ||||||
|
|
|
|||||||
For information related to Sales and tangible and intangible assets on a geographical and sector basis, see note 2, Information by sector and main country.
Philips Group
Sales and costs by nature in millions of EUR
2012 - 2014
|
|
|
|||||||||||
| 2012 | 2013 | 2014 | ||||||||||
|
|
|
|||||||||||
|
Sales |
22,234 | 21,990 | 21,391 | |||||||||
|
Costs of materials used |
(7,852 | ) | (7,494 | ) | (7,296 | ) | ||||||
|
Employee benefit expenses |
(6,361 | ) | (5,814 | ) | (6,080 | ) | ||||||
|
Depreciation and amortization |
(1,242 | ) | (1,177 | ) | (1,187 | ) | ||||||
|
Shipping and handling |
(749 | ) | (762 | ) | (741 | ) | ||||||
|
Advertising and promotion |
(829 | ) | (869 | ) | (913 | ) | ||||||
|
Lease expense |
(360 | ) | (344 | ) | (318 | ) 1) | ||||||
|
Other operational costs |
(3,923 | ) | (3,734 | ) | (4,156 | ) 2) | ||||||
|
Impairment of goodwill |
– | (28 | ) | (3 | ) | |||||||
|
Other business income (expenses) |
(326 | ) | 87 | (211 | ) | |||||||
|
|
|
|||||||||||
|
Income from operations |
592 | 1,855 | 486 | |||||||||
|
|
|
|||||||||||
| 1) |
Lease expense includes EUR 35 million (2013: EUR 42 million) of other costs, such as fuel and electricity, and taxes to be paid and reimbursed to the lessor |
| 2) |
Other operational costs contain items which are dissimilar in nature and individually insignificant in amount to disclose separately. These costs contain among others expenses for outsourcing services, mainly in IT and HR, 3 rd party workers, warranty, patents and costs for travelling and external legal services. |
Annual Report 2014 157
Table of Contents
Group financial statements 12.9
Sales composition
Philips Group
Sales composition in millions of EUR
2012 - 2014
|
|
|
|||||||||||
| 2012 | 2013 | 2014 | ||||||||||
|
|
|
|||||||||||
|
Goods |
18,715 | 18,398 | 17,972 | |||||||||
|
Services |
3,121 | 3,130 | 2,948 | |||||||||
|
Royalties |
398 | 462 | 471 | |||||||||
|
|
|
|||||||||||
|
Sales |
22,234 | 21,990 | 21,391 | |||||||||
|
|
|
|||||||||||
Philips has no single external customer that represents 10% or more of sales.
Costs of materials used
Cost of materials used represents the inventory recognized in cost of sales.
Employee benefit expenses
Philips Group
Employee benefit expenses in millions of EUR
2012 - 2014
|
|
||||||
| 2012 | 2013 | 2014 | ||||
|
|
||||||
|
Salaries and wages |
5,221 | 4,722 | 5,018 | |||
|
Post-employment benefits costs |
334 | 354 | 326 | |||
|
Other social security and similar charges: |
||||||
|
- Required by law |
639 | 621 | 623 | |||
|
- Voluntary |
167 | 117 | 113 | |||
|
|
||||||
|
Employee benefit expenses |
6,361 | 5,814 | 6,080 | |||
|
|
||||||
The employee benefit expense relate to employees who are working on the payroll of Philips, both with permanent and temporary contracts.
For further information on post-employment benefit costs, see note 20, Post-employment benefits.
For details on the remuneration of the members of the Board of Management and the Supervisory Board, see note 29, Information on remuneration.
Employees
The average number of employees by category is summarized as follows:
Philips Group
Employees in FTEs
2012 - 2014
|
|
|
|||||||||||
| 2012 | 2013 | 2014 | ||||||||||
|
|
|
|||||||||||
|
Production |
52,055 | 50,628 | 48,110 | |||||||||
|
Research and development |
12,470 | 11,757 | 11,714 | |||||||||
|
Other |
32,134 | 31,673 | 32,684 | |||||||||
|
|
|
|||||||||||
|
Employees |
96,659 | 94,058 | 92,508 | |||||||||
|
3rd party workers |
13,968 | 12,194 | 12,562 | |||||||||
|
|
|
|||||||||||
|
Continuing operations |
110,627 | 106,252 | 105,070 | |||||||||
|
Discontinued operations |
11,507 | 10,792 | 9,222 | |||||||||
|
|
|
|||||||||||
Employees consist of those persons working on the payroll of Philips and whose costs are reflected in the Employee benefit expenses table. 3 rd party workers consist of personnel hired on a per-period basis, via external companies.
Depreciation and amortization
Depreciation of property, plant and equipment and amortization of intangible assets, including impairments, are as follows:
Philips Group
Depreciation and amortization in millions of EUR
2012 - 2014
|
|
|
|||||||||||
| 2012 | 2013 | 2014 | ||||||||||
|
|
|
|||||||||||
|
Depreciation of property, plant and equipment |
588 | 521 | 592 | |||||||||
|
Amortization of internal-use software |
45 | 39 | 32 | |||||||||
|
Amortization of other intangible assets |
411 | 393 | 332 | |||||||||
|
Amortization of development costs |
198 | 224 | 231 | |||||||||
|
|
|
|||||||||||
|
Depreciation and amortization |
1,242 | 1,177 | 1,187 | |||||||||
|
|
|
|||||||||||
Depreciation of property, plant and equipment is primarily included in cost of sales. Amortization of the categories of other intangible assets are reported in selling expenses for brand names and customer relationships and are reported in cost of sales for technology based and other intangible assets. Amortization of development cost is included in research and development expenses.
Shipping and handling
Shipping and handling costs are included in cost of sales and selling expenses.
Advertising and promotion
Advertising and promotion costs are included in selling expenses.
Audit fees
Philips Group
Fees KPMG in millions of EUR
2012 - 2014
|
|
|
|||||||||||
| 2012 | 2013 | 2014 | ||||||||||
|
|
|
|||||||||||
|
Audit fees |
14.7 | 15.6 | 14.9 | |||||||||
|
- consolidated financial statements |
9.7 | 10.1 | 9.6 | |||||||||
|
- statutory financial statements |
5.0 | 5.5 | 5.3 | |||||||||
|
Audit-related fees 1) |
5.6 | 2.2 | 3.9 | |||||||||
|
- acquisitions and divestments |
2.9 | 0.4 | 2.4 | |||||||||
|
- sustainability assurance |
0.8 | 0.7 | 0.6 | |||||||||
|
- other |
1.9 | 1.1 | 0.9 | |||||||||
|
Tax fees 2) |
1.3 | 0.8 | 0.2 | |||||||||
|
- tax compliance services |
1.3 | 0.8 | 0.2 | |||||||||
|
Other fees |
0.7 | 1.3 | 0.0 | |||||||||
|
- royalty investigation |
0.1 | 0.0 | 0.0 | |||||||||
|
- other |
0.6 | 1.3 | 0.0 | |||||||||
|
|
|
|||||||||||
|
Fees KPMG |
22.3 | 19.9 | 19.0 | |||||||||
|
|
|
|||||||||||
| 1) |
The percentage of audit-related fees in 2014 is 20.5% of the total fees |
| 2) |
The percentage of tax fees in 2014 is 1.1% of the total fees |
This table ‘Fees KPMG’ forms an integral part of the Company Financial Statements, please refer to note B, Audit fees.
Impairment of goodwill
In 2014, goodwill impairment charges amount to EUR 3 million consisting of impairments on divested businesses in Healthcare and Lighting. In 2013, goodwill
158 Annual Report 2014
Table of Contents
Group financial statements 12.9
impairment charges amounted to EUR 28 million, including EUR 26 million as result of reduced growth expectations in Consumer Luminaires, see note 11, Goodwill.
Other business income (expenses)
Other business income (expenses) consists of the following:
Philips Group
Other business income (expenses) in millions of EUR
2012 - 2014
|
|
|
|||||||||||
| 2012 | 2013 | 2014 | ||||||||||
|
|
|
|||||||||||
|
Result on disposal of businesses: |
||||||||||||
|
- income |
9 | 50 | 7 | |||||||||
|
- expense |
(84 | ) | (1 | ) | (2 | ) | ||||||
|
Result on disposal of fixed assets: |
||||||||||||
|
- income |
222 | 18 | 18 | |||||||||
|
- expense |
(7 | ) | (13 | ) | (1 | ) | ||||||
|
Result on other remaining businesses: |
||||||||||||
|
- income |
41 | 54 | 38 | |||||||||
|
- expense |
(507 | ) | (21 | ) | (271 | ) | ||||||
|
|
|
|||||||||||
|
Other business income (expenses) |
(326 | ) | 87 | (211 | ) | |||||||
|
|
|
|||||||||||
|
Total other business income |
272 | 122 | 63 | |||||||||
|
Total other business expense |
(598 | ) | (35 | ) | (274 | ) | ||||||
|
|
|
|||||||||||
In 2014, result on disposal of businesses was mainly due to divestment of non-strategic businesses. For further information, see note 4, Acquisitions and divestments.
In 2014, result on disposal of fixed assets was mainly due to sale of real estate assets.
In 2014, result on other remaining businesses mainly relates to certain parts of the Cathode Ray Tube antitrust litigation as mentioned in note 26, Contingent assets and liabilities for which the Company concluded it was able to make a reliable estimate of the cash outflow or was able to reach a settlement with the relevant plaintiffs.
Philips Group
Financial income and expenses in millions of EUR
2012 - 2014
|
|
|
|||||||||||
| 2012 | 2013 | 2014 | ||||||||||
|
|
|
|||||||||||
|
Interest income |
37 | 54 | 39 | |||||||||
|
Interest income from loans and receivables |
20 | 32 | 22 | |||||||||
|
Interest income from cash and cash equivalents |
17 | 22 | 17 | |||||||||
|
Dividend income from available for sale financial assets |
4 | 5 | 4 | |||||||||
|
Net gains from disposal of financial assets |
1 | — | 60 | |||||||||
|
Net change in fair value of financial liabilities at fair value through profit or loss |
44 | — | — | |||||||||
|
Other financial income |
20 | 11 | 11 | |||||||||
|
|
|
|||||||||||
|
Financial income |
106 | 70 | 114 | |||||||||
|
Interest expense |
(363 | ) | (323 | ) | (290 | ) | ||||||
|
Interest on debt and borrowings |
(271 | ) | (245 | ) | (224 | ) | ||||||
|
Finance charges under finance lease contract |
(7 | ) | (7 | ) | (7 | ) | ||||||
|
Interest expenses - pensions |
(85 | ) | (71 | ) | (59 | ) | ||||||
|
Provision-related accretion and interest |
(22 | ) | (25 | ) | (80 | ) | ||||||
|
Net foreign exchange losses |
— | (6 | ) | (1 | ) | |||||||
|
Impairment loss of financial assets |
(8 | ) | (10 | ) | (17 | ) | ||||||
|
Net change in fair value of financial assets at fair value through profit or loss |
(2 | ) | (9 | ) | (6 | ) | ||||||
|
Net change in fair value of financial liabilities at fair value through profit or loss |
— | (3 | ) | (2 | ) | |||||||
|
Other financial expenses |
(40 | ) | (24 | ) | (19 | ) | ||||||
|
|
|
|||||||||||
|
Financial expense |
(435 | ) | (400 | ) | (415 | ) | ||||||
|
|
|
|||||||||||
|
Financial income and expenses |
(329 | ) | (330 | ) | (301 | ) | ||||||
|
|
|
|||||||||||
Net financial income and expense showed a EUR 301 million expenses in 2014, which was 29 million lower than in 2013. Interest expense in 2014 was EUR 33 million lower than in 2013, mainly as a result of lower average outstanding debt and lower interest related to pensions. The gain from disposal of financial assets in 2014 amounted to EUR 60 million, mainly from Neusoft, Chimei Innolux, Gilde III and Sapiens. The impairment charges in 2014 amounted to EUR 17 million, mainly from shareholdings in Chimei Innolux, Prime Technology, Timesys and loans to Open Gate Capital. Provision-related accretion and interest in 2014 primarily consisted of interest expense related to the jury verdict in the Masimo litigation, and accretion expense associated with other discounted provisions and uncertain tax positions.
Interest expense in 2013 was EUR 40 million lower than in 2012, mainly as a result of lower average outstanding debt and lower interest related to pensions in 2013. In 2013 impairment charges amounted to EUR 10 million, mainly from shareholdings in Lighting Science Group and Gilde III.
Annual Report 2014 159
Table of Contents
Group financial statements 12.9
Net financial income and expense showed a EUR 329 million expense in 2012. Total financial income of EUR 106 million included a EUR 46 million gain related to a change in estimate on the valuation of long term derivative contracts.
The tax expense on income before tax of continuing operations amounted to EUR 26 million (2013: EUR 466 million, 2012: EUR 218 million).
The components of income before taxes and income tax expense are as follows:
Philips Group
Income tax expense in millions of EUR
2012 - 2014
|
|
|
|||||||||||
| 2012 | 2013 | 2014 | ||||||||||
|
|
|
|||||||||||
|
Netherlands |
(186 | ) | 281 | 665 | ||||||||
|
Foreign |
449 | 1,244 | (480 | ) | ||||||||
|
|
|
|||||||||||
|
Income before taxes of continuing operations |
263 | 1,525 | 185 | |||||||||
|
Netherlands: |
||||||||||||
|
Current tax income (expense) |
(74 | ) | — | 17 | ||||||||
|
Deferred tax income (expense) |
13 | (107 | ) | (29 | ) | |||||||
|
|
|
|||||||||||
|
Total tax expense (Netherlands) |
(61 | ) | (107 | ) | (12 | ) | ||||||
|
Foreign: |
||||||||||||
|
Current tax expense |
(283 | ) | (280 | ) | (275 | ) | ||||||
|
Deferred tax income (expense) |
143 | (89 | ) | 250 | ||||||||
|
|
|
|||||||||||
|
Total tax expense (foreign) |
(140 | ) | (369 | ) | (25 | ) | ||||||
|
Income tax expense of continuing operations |
(218 | ) | (466 | ) | (26 | ) | ||||||
|
Income tax expense of discontinued operations |
17 | (10 | ) | (11 | ) | |||||||
|
|
|
|||||||||||
|
Income tax expense |
(201 | ) | (476 | ) | (37 | ) | ||||||
|
|
|
|||||||||||
The components of income tax expense are as follows:
Philips Group
Current income tax expense in millions of EUR
2012 - 2014
|
|
|
|||||||||||
| 2012 | 2013 | 2014 | ||||||||||
|
|
|
|||||||||||
|
Current tax expense |
(369 | ) | (268 | ) | (281 | ) | ||||||
|
Prior year results |
12 | (12 | ) | 23 | ||||||||
|
|
|
|||||||||||
|
Current tax expense |
(357 | ) | (280 | ) | (258 | ) | ||||||
|
|
|
|||||||||||
Philips Group
Deferred income tax expense in millions of EUR
2012 - 2014
|
|
|
|||||||||||
| 2012 | 2013 | 2014 | ||||||||||
|
|
|
|||||||||||
|
Recognition of previously unrecognized tax losses |
1 | 20 | 18 | |||||||||
|
Current year tax loss carried forwards not recognized |
(50 | ) | (29 | ) | (65 | ) | ||||||
|
Temporary differences (not recognized) recognized |
2 | (3 | ) | (47 | ) | |||||||
|
Prior year results |
(2 | ) | 15 | 34 | ||||||||
|
Tax rate changes |
(4 | ) | — | 12 | ||||||||
|
Origination and reversal of temporary differences |
209 | (199 | ) | 269 | ||||||||
|
|
|
|||||||||||
|
Deferred tax income (expense) |
156 | (196 | ) | 221 | ||||||||
|
|
|
|||||||||||
Philips’ operations are subject to income taxes in various foreign jurisdictions. The statutory income tax rates vary from 10.0% to 39.4%, which results in a difference between the weighted average statutory income tax rate and the Netherlands’ statutory income tax rate of 25.0% (2013: 25.0%; 2012: 25.0%).
A reconciliation of the weighted average statutory income tax rate to the effective income tax rate of continuing operations is as follows:
Philips Group
Effective tax rate in %
2012 - 2014
|
|
|
|||||||||||
| 2012 | 2013 | 2014 | ||||||||||
|
|
|
|||||||||||
|
Weighted average statutory income tax rate in % |
30.0 | 29.2 | 7.9 | |||||||||
|
Tax rate effect of: |
||||||||||||
|
Changes related to: |
||||||||||||
|
- utilization of previously reserved loss carryforwards |
(0.2 | ) | (1.3 | ) | (9.6 | ) | ||||||
|
- new loss carryforwards not expected to be realized |
19.1 | 1.9 | 34.9 | |||||||||
|
- addition (releases) of temporary differences not expected to be realized |
(0.7 | ) | 0.2 | 25.5 | ||||||||
|
Non-tax-deductible impairment charges |
0.8 | 0.7 | 1.8 | |||||||||
|
Non-taxable income |
(22.7 | ) | (8.9 | ) | (100.1 | ) | ||||||
|
Non-tax-deductible expenses |
83.3 | 8.1 | 51.6 | |||||||||
|
Withholding and other taxes |
8.3 | 0.9 | 13.4 | |||||||||
|
Tax rate changes |
1.4 | 0.0 | (6.3 | ) | ||||||||
|
Prior year tax results |
(3.7 | ) | (0.2 | ) | (30.8 | ) | ||||||
|
Tax expenses due to other liabilities |
8.2 | 0.3 | 5.6 | |||||||||
|
Tax incentives and other |
(40.9 | ) | (0.3 | ) | 20.2 | |||||||
|
|
|
|||||||||||
|
Effective tax rate |
82.9 | 30.6 | 14.1 | |||||||||
|
|
|
|||||||||||
The weighted average statutory income tax rate decreased in 2014 compared to 2013, as a consequence of a significant change in the mix of profits and losses in the various countries.
The effective income tax rate is higher than the weighted average statutory income tax rate in 2014, mainly due to the non-deductible expenses, new loss carryforwards and temporary differences not expected to be realized which are partly offset by non-taxable income. Non-taxable income is predominantly attributable to favorable tax regulations relating to R&D investments.
160 Annual Report 2014
Table of Contents
Group financial statements 12.9
Deferred tax assets and liabilities
Net deferred tax assets relate to the following balance sheet captions and tax loss carryforwards (including tax credit carryforwards), of which the movements during the years 2014 and 2013 respectively are as follows:
Philips Group
Deferred tax assets and liabilities in millions of EUR
2014
|
|
|
|||||||||||||||||||||||
|
Balance as of
2014 |
recognized in income |
recognized in OCI |
acquisitions/
divestments |
other 1) |
Balance as of
2014 |
|||||||||||||||||||
|
|
|
|||||||||||||||||||||||
|
Intangible assets |
(871 | ) | 59 | — | (40 | ) | (128 | ) | (980 | ) | ||||||||||||||
|
Property, plant and equipment |
58 | 9 | — | — | 6 | 73 | ||||||||||||||||||
|
Inventories |
264 | 24 | — | — | 23 | 311 | ||||||||||||||||||
|
Prepaid pension assets |
(1 | ) | (40 | ) | 139 | — | — | 98 | ||||||||||||||||
|
Other receivables |
50 | 6 | — | — | (7 | ) | 49 | |||||||||||||||||
|
Other assets |
32 | (8 | ) | (9 | ) | — | 9 | 24 | ||||||||||||||||
|
Provisions: |
||||||||||||||||||||||||
|
- pensions |
426 | (49 | ) | 146 | — | 39 | 562 | |||||||||||||||||
|
- guarantees |
29 | (25 | ) | — | — | — | 4 | |||||||||||||||||
|
- termination benefits |
97 | 23 | (13 | ) | — | 2 | 109 | |||||||||||||||||
|
- other postretirement benefits |
57 | 2 | 4 | — | 8 | 71 | ||||||||||||||||||
|
- other provisions |
567 | 126 | (7 | ) | — | 97 | 783 | |||||||||||||||||
|
Other liabilities |
192 | (1 | ) | 2 | — | 16 | 209 | |||||||||||||||||
|
Deferred tax assets on tax loss carryforwards (including tax credit carryforwards) |
699 | 95 | 190 | 1 | 55 | 1,040 | ||||||||||||||||||
|
|
|
|||||||||||||||||||||||
|
Net deferred tax assets |
1,599 | 221 | 452 | (39 | ) | 120 | 2,353 | |||||||||||||||||
|
|
|
|||||||||||||||||||||||
Philips Group
Deferred tax assets and liabilities in millions of EUR
2013
|
|
|
|||||||||||||||||||||||
|
Balance as of
2013 |
recognized in income |
recognized in OCI |
acquisitions/
divestments |
other 1) |
Balance as of
2013 |
|||||||||||||||||||
|
|
|
|||||||||||||||||||||||
|
Intangible assets |
(928 | ) | 13 | — | — | 44 | (871 | ) | ||||||||||||||||
|
Property, plant and equipment |
68 | — | — | — | (10 | ) | 58 | |||||||||||||||||
|
Inventories |
258 | 9 | — | — | (3 | ) | 264 | |||||||||||||||||
|
Prepaid pension costs |
— | (24 | ) | 23 | — | — | (1 | ) | ||||||||||||||||
|
Other receivables |
55 | (3 | ) | 1 | — | (3 | ) | 50 | ||||||||||||||||
|
Other assets |
42 | (4 | ) | (2 | ) | (1 | ) | (3 | ) | 32 | ||||||||||||||
|
Provisions: |
||||||||||||||||||||||||
|
- pensions |
598 | (70 | ) | (82 | ) | — | (20 | ) | 426 | |||||||||||||||
|
- guarantees |
26 | 4 | — | — | (1 | ) | 29 | |||||||||||||||||
|
- termination benefits |
118 | (28 | ) | 8 | — | (1 | ) | 97 | ||||||||||||||||
|
- other postretirement benefits |
72 | (5 | ) | (7 | ) | — | (3 | ) | 57 | |||||||||||||||
|
- other provisions |
605 | (32 | ) | 16 | — | (22 | ) | 567 | ||||||||||||||||
|
Other liabilities |
171 | 27 | — | — | (6 | ) | 192 | |||||||||||||||||
|
Deferred tax assets on tax loss carryforwards (including tax credit carryforwards) |
742 | (83 | ) | (11 | ) | — | 51 | 699 | ||||||||||||||||
|
|
|
|||||||||||||||||||||||
|
Net deferred tax assets |
1,827 | (196 | ) | (54 | ) | (1 | ) | 23 | 1,599 | |||||||||||||||
|
|
|
|||||||||||||||||||||||
| 1) |
Primarily includes foreign currency translation differences which were recognized in OCI |
Annual Report 2014 161
Table of Contents
Group financial statements 12.9
Deferred tax assets and liabilities relate to the balance sheet captions, as follows:
Philips Group
Deferred tax assets and liabilities in millions of EUR
2013 - 2014
|
|
|
|||||||||||
| assets | liabilities | net | ||||||||||
|
|
|
|||||||||||
| 2014 | ||||||||||||
|
Intangible assets |
114 | (1,094 | ) | (980 | ) | |||||||
|
Property, plant and equipment |
120 | (47 | ) | 73 | ||||||||
|
Inventories |
317 | (6 | ) | 311 | ||||||||
|
Prepaid pension costs |
99 | (1 | ) | 98 | ||||||||
|
Other receivables |
58 | (9 | ) | 49 | ||||||||
|
Other assets |
45 | (21 | ) | 24 | ||||||||
|
Provisions: |
||||||||||||
|
- pensions |
562 | — | 562 | |||||||||
|
- guarantees |
4 | — | 4 | |||||||||
|
- termination benefits |
109 | — | 109 | |||||||||
|
- other postretirement |
71 | — | 71 | |||||||||
|
- other |
791 | (8 | ) | 783 | ||||||||
|
Other liabilities |
226 | (17 | ) | 209 | ||||||||
|
Deferred tax assets on tax loss carryforwards (including tax credit carryforwards) |
1,040 | — | 1,040 | |||||||||
|
|
|
|||||||||||
|
Total allocations |
3,556 | (1,203 | ) | 2,353 | ||||||||
|
Set-off of deferred tax positions |
(1,096 | ) | 1,096 | — | ||||||||
|
|
|
|||||||||||
|
Net deferred tax assets |
2,460 | (107 | ) | 2,353 | ||||||||
| 2013 | ||||||||||||
|
Intangible assets |
116 | (987 | ) | (871 | ) | |||||||
|
Property, plant and equipment |
107 | (49 | ) | 58 | ||||||||
|
Inventories |
271 | (7 | ) | 264 | ||||||||
|
Prepaid pension costs |
1 | (2 | ) | (1 | ) | |||||||
|
Other receivables |
60 | (10 | ) | 50 | ||||||||
|
Other assets |
48 | (16 | ) | 32 | ||||||||
|
Provisions: |
||||||||||||
|
- pensions |
426 | — | 426 | |||||||||
|
- guarantees |
29 | — | 29 | |||||||||
|
- termination benefits |
97 | — | 97 | |||||||||
|
- other postretirement |
57 | — | 57 | |||||||||
|
- other |
581 | (14 | ) | 567 | ||||||||
|
Other liabilities |
213 | (21 | ) | 192 | ||||||||
|
Deferred tax assets on tax loss carryforwards (including tax credit carryforwards) |
699 | — | 699 | |||||||||
|
|
|
|||||||||||
| 2,705 | (1,106 | ) | 1,599 | |||||||||
|
Set-off of deferred tax positions |
(1,030 | ) | 1,030 | — | ||||||||
|
|
|
|||||||||||
|
Net deferred tax assets |
1,675 | (76 | ) | 1,599 | ||||||||
|
|
|
|||||||||||
Deferred tax assets are recognized for temporary differences, unused tax losses, and unused tax credits to the extent that realization of the related tax benefits is probable. The ultimate realization of deferred tax assets is dependent upon the generation of future taxable income in the countries where the deferred tax assets originated and during the periods when the deferred tax assets become deductible. Management considers the scheduled reversal of deferred tax liabilities, projected future taxable income, and tax planning strategies in making this assessment.
The net deferred tax assets of EUR 2,353 million (2013: EUR 1,599 million) consist of deferred tax assets of EUR 2,460 million (2013: EUR 1,675 million) in countries with a net deferred tax asset position and deferred tax liabilities of EUR 107 million (2013: EUR 76 million) in countries with a net deferred tax liability position. Of the total deferred tax assets of EUR 2,460 million at December 31, 2014, (2013: EUR 1,675 million), EUR 1,352 million (2013: EUR 543 million) is recognized in respect of fiscal entities in various countries where there have been fiscal losses in the current or preceding period. Management’s projections support the assumption that it is probable that the results of future operations will generate sufficient taxable income to utilize these deferred tax assets.
At December 31, 2014 and 2013, there were no recognized deferred tax liabilities for taxes that would be payable on the unremitted earnings of certain foreign subsidiaries of Philips Holding USA since it has been determined that undistributed profits of such subsidiaries will not be distributed in the foreseeable future. The temporary differences associated with the investments in subsidiaries of Philips Holding USA, for which a deferred tax liability has not been recognized, aggregate to EUR 47 million (2013: EUR 32 million).
At December 31, 2014, operating loss carryforwards expire as follows:
Philips Group
Expiry year operating loss carryforwards in millions of EUR
|
|
||||||||||||||||||||||||||||||||
|
Total |
2015 | 2016 | 2017 | 2018 | 2019 |
2020/
2024 |
later | unlimited | ||||||||||||||||||||||||
|
5,889 |
— | — | 5 | 4 | 14 | 817 | 1,114 | 3,935 | ||||||||||||||||||||||||
|
|
|
|
|
|
|
|
|
|
|
|
|
|
|
|
|
|||||||||||||||||
The Company also has tax credit carryforwards of EUR 174 million, which are available to offset future tax, if any, and which expire as follows:
Philips Group
Expiry year tax credit carryforwards in millions of EUR
|
|
||||||||||||||||||||||||||||||||
|
Total |
2015 | 2016 | 2017 | 2018 | 2019 |
2020/
2024 |
later | unlimited | ||||||||||||||||||||||||
|
174 |
1 | — | 4 | 3 | 26 | 104 | 29 | 7 | ||||||||||||||||||||||||
|
|
|
|
|
|
|
|
|
|
|
|
|
|
|
|
|
|||||||||||||||||
At December 31, 2014, operating loss and tax credit carryforwards for which no deferred tax assets have been recognized in the balance sheet, expire as follows:
Philips Group
Operating loss and tax credit carryforwards for which no deferred tax asset has been recognized in millions of EUR
|
|
||||||||||||||||||||||||||||||||
|
Total |
2015 | 2016 | 2017 | 2018 | 2019 |
2020/
2024 |
later | unlimited | ||||||||||||||||||||||||
|
2,136 |
— | — | 1 | 3 | 2 | 55 | 18 | 2,057 | ||||||||||||||||||||||||
|
|
|
|
|
|
|
|
|
|
|
|
|
|
|
|
|
|||||||||||||||||
At December 31, 2014, the amount of deductible temporary differences for which no deferred tax asset has been recognized in the balance sheet is EUR 190 million (2013: EUR 151 million).
162 Annual Report 2014
Table of Contents
Group financial statements 12.9
Classification of the income tax payable and receivable is as follows:
Philips Group
Income tax payable and receivable in millions of EUR
2013 - 2014
|
|
|
|||||||
| 2013 | 2014 | |||||||
|
|
|
|||||||
|
Income tax receivable |
70 | 140 | ||||||
|
Income tax receivable - under non-current receivables |
— | — | ||||||
|
Income tax payable |
(143 | ) | (102 | ) | ||||
|
Income tax payable - under non-current liabilities |
(1 | ) | (1 | ) | ||||
|
|
|
|||||||
Tax risks
Philips is exposed to tax uncertainties. These uncertainties include amongst others the following:
Transfer pricing uncertainties
Philips has issued transfer pricing directives, which are in accordance with international guidelines such as those of the Organization of Economic Co-operation and Development. As transfer pricing has a cross-border effect, the focus of local tax authorities on implemented transfer pricing procedures in a country may have an impact on results in another country. In order to reduce the transfer pricing uncertainties, monitoring procedures are carried out by Group Tax and Internal Audit to safeguard the correct implementation of the transfer pricing directives.
Tax uncertainties on general and specific service agreements and licensing agreements
Due to the centralization of certain activities in a limited number of countries (such as research and development, centralized IT, group functions and head office), costs are also centralized. As a consequence, these costs and/or revenues must be allocated to the beneficiaries, i.e. the various Philips entities. For that purpose, specific allocation contracts for costs and revenues, general service agreements and licensing agreements are signed with a large number of group entities. Tax authorities review the implementation of these intra-group service and licensing agreements or audit the use of tax credits attached to the resulting service fee and royalty payments, and may reject the implemented procedures. Furthermore, buy in/out situations in the case of (de)mergers could affect the cost allocation resulting from the service agreements between countries. The same applies to the specific allocation contracts.
Tax uncertainties due to disentanglements and acquisitions
When a subsidiary of Philips is disentangled, or a new company is acquired, related tax uncertainties arise. Philips creates merger and acquisition (M&A) teams for these disentanglements or acquisitions. In addition to representatives from the involved sector, these teams consist of specialists from various group functions and are formed, amongst other things, to identify hidden tax uncertainties that could subsequently surface when companies are acquired and to reduce tax claims related to disentangled entities. These tax uncertainties are investigated and assessed to mitigate tax uncertainties in the future of the extent possible. Several tax uncertainties may surface from M&A activities. Examples of uncertainties are: applicability of the participation exemption, allocation issues, and non-deductibility of parts of the purchase price.
Tax uncertainties due to permanent establishments
In countries where Philips starts new operations or alters business models, the issue of permanent establishment may arise. This is because when operations in a country involves a Philips organization in another country, there is a risk that tax claims will arise in the former country as well as in the latter country.
Annual Report 2014 163
Table of Contents
Group financial statements 12.9
Philips Group
Earnings per share in millions of EUR unless stated otherwise 1)
2012 - 2014
|
|
|
|||||||||||||||||||||||
| 2012 | 2013 | 2014 | ||||||||||||||||||||||
|
|
|
|||||||||||||||||||||||
|
Income (loss) from continuing operations |
(166 | ) | 1,034 | 221 | ||||||||||||||||||||
|
Income (loss) attributable to non-controlling interest |
5 | 3 | (4 | ) | ||||||||||||||||||||
|
|
|
|||||||||||||||||||||||
|
Income (loss) from continuing operations attributable to shareholders |
(171 | ) | 1,031 | 225 | ||||||||||||||||||||
|
Income from discontinued operations |
136 | 138 | 190 | |||||||||||||||||||||
|
|
|
|||||||||||||||||||||||
|
Net income (loss) attributable to shareholders |
(35 | ) | 1,169 | 415 | ||||||||||||||||||||
|
Weighted average number of common shares outstanding (after deduction of treasury shares) during the year |
922,101,005 | 911,071,970 | 915,192,683 | |||||||||||||||||||||
|
Plus incremental shares from assumed conversions of: |
||||||||||||||||||||||||
|
Options and restricted share rights |
5,014,991 | 10,896,583 | 7,521,591 | |||||||||||||||||||||
|
Convertible debentures |
106,204 | 103,899 | — | |||||||||||||||||||||
|
|
|
|
|
|
|
|||||||||||||||||||
|
Dilutive potential common shares |
5,121,195 | 11,000,482 | 7,521,591 | |||||||||||||||||||||
|
Adjusted weighted average number of shares (after deduction of treasury shares) during the year |
927,222,200 | 922,072,452 | 922,714,274 | |||||||||||||||||||||
| Basic earnings per common share in EUR 2) | ||||||||||||||||||||||||
|
Income (loss) from continuing operations |
(0.18 | ) | 1.13 | 0.24 | ||||||||||||||||||||
|
Income from discontinued operations |
0.15 | 0.15 | 0.21 | |||||||||||||||||||||
|
Income (loss) from continuing operations attributable to shareholders |
(0.19 | ) | 1.13 | 0.25 | ||||||||||||||||||||
|
Net income (loss) attributable to shareholders |
(0.04 | ) | 1.28 | 0.45 | ||||||||||||||||||||
| Diluted earnings per common share in EUR 2,3,4) | ||||||||||||||||||||||||
|
Income (loss) from continuing operations |
(0.18 | ) | 1.12 | 0.24 | ||||||||||||||||||||
|
Income from discontinued operations |
0.15 | 0.15 | 0.21 | |||||||||||||||||||||
|
Income (loss) from continuing operations attributable to shareholders |
(0.19 | ) | 1.12 | 0.24 | ||||||||||||||||||||
|
Net income (loss) attributable to shareholders |
(0.04 | ) | 1.27 | 0.45 | ||||||||||||||||||||
|
Dividend distributed per common share in euros |
0.75 | 0.75 | 0.80 | |||||||||||||||||||||
|
|
|
|||||||||||||||||||||||
| 1) |
Shareholders in this table refer to shareholders of Koninklijke Philips N.V. |
| 2) |
The effect on income of convertible debentures affecting earnings per share is considered immaterial |
| 3) |
In 2014, 2013 and 2012, respectively 19 million, 14 million and 36 million securities that could potentially dilute basic EPS were not included in the computation of dilutive EPS because the effect would have been antidilutive for the periods presented |
| 4) |
The Dilutive potential common shares are not taken into account in the periods for which there is a loss, as the effect would be antidilutive |
164 Annual Report 2014
Table of Contents
Group financial statements 12.9
Philips Group
Property, plant and equipment in millions of EUR
2014
|
|
|
|||||||||||||||||||
|
land and
buildings |
machinery
and installations |
other
equipment |
prepayments and
progress |
total | ||||||||||||||||
|
|
|
|||||||||||||||||||
|
Balance as of January 1, 2014: |
||||||||||||||||||||
|
Cost |
1,899 | 3,948 | 1,586 | 259 | 7,692 | |||||||||||||||
|
Accumulated depreciation |
(872 | ) | (2,885 | ) | (1,155 | ) | — | (4,912 | ) | |||||||||||
|
|
|
|||||||||||||||||||
|
Book value |
1,027 | 1,063 | 431 | 259 | 2,780 | |||||||||||||||
|
Change in book value: |
||||||||||||||||||||
|
Capital expenditures |
6 | 86 | 68 | 368 | 528 | |||||||||||||||
|
Assets available for use |
79 | 220 | 132 | (431 | ) | — | ||||||||||||||
|
Acquisitions |
7 | 6 | 4 | 2 | 19 | |||||||||||||||
|
Disposals and sales |
— | (5 | ) | (7 | ) | — | (12 | ) | ||||||||||||
|
Depreciation |
(91 | ) | (295 | ) | (178 | ) | — | (564 | ) | |||||||||||
|
Impairments |
(26 | ) | (74 | ) | (21 | ) | (1 | ) | (122 | ) | ||||||||||
|
Transfer to assets classified as held for sale |
(190 | ) | (451 | ) | (10 | ) | (37 | ) | (688 | ) | ||||||||||
|
Translation differences |
60 | 57 | 28 | 9 | 154 | |||||||||||||||
|
|
|
|||||||||||||||||||
|
Total changes |
(155 | ) | (456 | ) | 16 | (90 | ) | (685 | ) | |||||||||||
|
Balance as of December 31, 2014: |
||||||||||||||||||||
|
Cost |
1,803 | 3,127 | 1,745 | 169 | 6,844 | |||||||||||||||
|
Accumulated depreciation |
(931 | ) | (2,520 | ) | (1,298 | ) | — | (4,749 | ) | |||||||||||
|
|
|
|||||||||||||||||||
|
Book value |
872 | 607 | 447 | 169 | 2,095 | |||||||||||||||
|
|
|
|||||||||||||||||||
Philips Group
Property, plant and equipment in millions of EUR
2013
|
|
|
|||||||||||||||||||
|
land and
buildings |
machinery
and installations |
other
equipment |
prepayments and
progress |
total | ||||||||||||||||
|
|
|
|||||||||||||||||||
|
Balance as of January 1, 2013: |
||||||||||||||||||||
|
Cost |
1,924 | 4,004 | 1,658 | 294 | 7,880 | |||||||||||||||
|
Accumulated depreciation |
(835 | ) | (2,851 | ) | (1,235 | ) | — | (4,921 | ) | |||||||||||
|
|
|
|||||||||||||||||||
|
Book value |
1,089 | 1,153 | 423 | 294 | 2,959 | |||||||||||||||
|
Change in book value: |
||||||||||||||||||||
|
Capital expenditures |
8 | 88 | 61 | 461 | 618 | |||||||||||||||
|
Assets available for use |
79 | 244 | 160 | (483 | ) | — | ||||||||||||||
|
Acquisitions |
— | — | — | — | — | |||||||||||||||
|
Disposals and sales |
(1 | ) | (14 | ) | (7 | ) | (4 | ) | (26 | ) | ||||||||||
|
Depreciation |
(87 | ) | (321 | ) | (163 | ) | — | (571 | ) | |||||||||||
|
Impairments |
(15 | ) | (26 | ) | (22 | ) | — | (63 | ) | |||||||||||
|
Transfer to assets classified as held for sale |
(17 | ) | (4 | ) | (4 | ) | — | (25 | ) | |||||||||||
|
Translation differences |
(29 | ) | (57 | ) | (17 | ) | (9 | ) | (112 | ) | ||||||||||
|
|
|
|||||||||||||||||||
|
Total changes |
(62 | ) | (90 | ) | 8 | (35 | ) | (179 | ) | |||||||||||
|
Balance as of December 31, 2013: |
||||||||||||||||||||
|
Cost |
1,899 | 3,948 | 1,586 | 259 | 7,692 | |||||||||||||||
|
Accumulated depreciation |
(872 | ) | (2,885 | ) | (1,155 | ) | — | (4,912 | ) | |||||||||||
|
|
|
|||||||||||||||||||
|
Book value |
1,027 | 1,063 | 431 | 259 | 2,780 | |||||||||||||||
|
|
|
|||||||||||||||||||
Land with a book value of EUR 89 million at December 31, 2014 (2013: EUR 133 million) is not depreciated. Impairment charges of EUR 49 million are related to industrial assets in Lighting in 2014. Transfer to assets classified as held for sale in 2014 mainly relate to combined businesses of Lumileds and Automotive.
Property, plant and equipment includes financial lease assets with a book value of EUR 192 million at December 31, 2014 (2013: EUR 187 million).
The expected useful lives of property, plant and equipment are as follows:
Philips Group
Useful lives of property, plant and equipment in years
|
Buildings |
from 5 to 50 | |||
|
Machinery and installations |
from 3 to 20 | |||
|
Other equipment |
from 1 to 10 | |||
|
|
|
Annual Report 2014 165
Table of Contents
Group financial statements 12.9

The changes in 2013 and 2014 were as follows:
Philips Group
Goodwill in millions of EUR
2013 - 2014
|
|
|
|||||||
| 2013 | 2014 | |||||||
|
|
|
|||||||
|
Balance as of January 1: |
||||||||
|
Cost |
9,119 | 8,596 | ||||||
|
Amortization and impairments |
(2,171 | ) | (2,092 | ) | ||||
|
|
|
|||||||
|
Book value |
6,948 | 6,504 | ||||||
|
Changes in book value: |
||||||||
|
Acquisitions |
4 | 68 | ||||||
|
Purchase price allocation adjustment |
(4 | ) | 8 | |||||
|
Impairments |
(26 | ) | — | |||||
|
Divestments and transfers to assets classified as held for sale |
(55 | ) | (160 | ) | ||||
|
Translation differences |
(363 | ) | 738 | |||||
|
Balance as of December 31: |
||||||||
|
Cost |
8,596 | 9,151 | ||||||
|
Amortization and impairments |
(2,092 | ) | (1,993 | ) | ||||
|
|
|
|||||||
|
Book value |
6,504 | 7,158 | ||||||
|
|
|
|||||||
Acquisitions in 2014 which included goodwill mainly related to the acquisition of General Lighting Company (GLC) for EUR 58 million. In addition, goodwill changed due to the finalization of purchase price accounting related to acquisitions in the prior year. Divestments and transfer to assets classified as held for sale in 2014 relate to the sectors Healthcare and Lighting. In 2014 the movement of EUR 738 million in translation differences is mainly explained by the increase of the USD/EUR rate which impacted the goodwill nominated in USD.
In 2013 the movement of EUR 55 million in divestments and transfers to assets classified as held for sale mainly relate to divestments in the Healthcare sector.
For impairment testing, goodwill is allocated to (groups of) cash-generating units (typically one level below operating sector level), which represent the lowest level at which the goodwill is monitored internally for management purposes.
In 2014, a cash-generating unit Healthcare Informatics Services & Solutions was created in the Healthcare sector. As a result of the change, a portion of the goodwill associated with the unit Patient Care & Clinical Informatics and the unit Home Monitoring was allocated to Healthcare Informatics Services & Solutions. The name of the cash-generating unit Patient Care & Clinical Informatics was changed in 2014 to Patient Care & Monitoring Solutions.
Goodwill allocated to the cash-generating units Respiratory Care & Sleep Management, Imaging Systems, Patient Care & Monitoring Solutions and Professional Lighting Solutions is considered to be significant in comparison to the total book value of goodwill for the Group at December 31, 2014. The amounts associated as of December 31, 2014, are presented below:
Philips Group
Goodwill allocated to the cash-generating units in millions of EUR
2013 - 2014
|
|
|
|||||||
| 2013 | 2014 | |||||||
|
|
|
|||||||
|
Respiratory Care & Sleep Management |
1,544 | 1,704 | ||||||
|
Imaging Systems |
1,414 | 1,592 | ||||||
|
Patient Care & Monitoring Solutions |
1,063 | 1) | 1,317 | |||||
|
Professional Lighting Solutions |
1,266 | 1,470 | ||||||
|
Other (units carrying a non-significant goodwill balance) |
1,217 | 1,075 | ||||||
|
|
|
|||||||
|
Book value |
6,504 | 7,158 | ||||||
|
|
|
|||||||
| 1) |
Revised to reflect the new organizational structure of the Healthcare sector |
The basis of the recoverable amount used in the impairment tests for the units disclosed in this note is the value in use. In the 2014 annual impairment test, performed in the second quarter, and in the tests performed in the second half of 2014, the estimated recoverable amounts of the cash-generating units tested approximated or exceeded the carrying value of the units, therefore no impairment loss was recognized.
Key assumptions used in the impairment tests for the units were sales growth rates, income from operations and the rates used for discounting the projected cash flows. These cash flow projections were determined using management’s internal forecasts that cover an initial period from 2014 to 2018 that matches the period used for our strategic process. Projections were extrapolated with stable or declining growth rates for a period of 5 years, after which a terminal value was calculated. For terminal value calculation, growth rates were capped at a historical long-term average growth rate.
The sales growth rates and margins used to estimate cash flows are based on past performance, external market growth assumptions and industry long-term growth averages.
Income from operations in all units is expected to increase over the projection period as a result of volume growth and cost efficiencies.
Cash flow projections of Respiratory Care & Sleep Management, Imaging Systems, Patient Care & Monitoring Solutions and Professional Lighting Solutions for 2014 were based on the key assumptions included in the table below. These assumptions are based on the annual impairment test performed in the second quarter except for the unit Professional Lighting Solutions which performed an updated test in Q4 2014 given the acquisition of GLC in the second half of the year.
166 Annual Report 2014
Table of Contents
Group financial statements 12.9
Philips Group
Key assumptions in %
2014
|
|
|
|||||||||||||||
| compound sales growth rate 1) | ||||||||||||||||
|
|
|
|||||||||||||||
|
initial
forecast period |
extra-
polation period 2) |
used to
calculate terminal value |
pre-tax
discount rates |
|||||||||||||
|
|
|
|||||||||||||||
|
Respiratory Care & Sleep Management |
4.2 | 3.6 | 2.7 | 11.4 | ||||||||||||
|
Imaging Systems |
3.3 | 3.1 | 2.7 | 12.8 | ||||||||||||
|
Patient Care & Monitoring Solutions |
4.9 | 3.8 | 2.7 | 12.8 | ||||||||||||
|
Professional Lighting Solutions |
10.1 | 6.5 | 2.7 | 13.8 | ||||||||||||
|
|
|
|||||||||||||||
| 1) |
Compound sales growth rate is the annualized steady growth rate over the forecast period |
| 2) |
Also referred to later in the text as compound long-term sales growth rate |
The assumptions used for the 2013 cash flow projections were as follows:
Philips Group
Key assumptions in %
2013
|
|
|
|||||||||||||||
| compound sales growth rate 1) | ||||||||||||||||
|
|
|
|||||||||||||||
|
initial
forecast period |
extra-
polation period 2) |
used to
calculate terminal value |
pre-tax
discount rates |
|||||||||||||
|
|
|
|||||||||||||||
|
Respiratory Care & Sleep Management |
4.9 | 3.7 | 2.7 | 11.3 | ||||||||||||
|
Imaging Systems |
3.9 | 3.4 | 2.7 | 12.4 | ||||||||||||
|
Patient Care & Clinical Informatics |
4.1 | 3.5 | 2.7 | 13.2 | ||||||||||||
|
Professional Lighting Solutions |
7.4 | 5.4 | 2.7 | 12.8 | ||||||||||||
|
|
|
|||||||||||||||
| 1) |
Compound sales growth rate is the annualized steady growth rate over the forecast period |
| 2) |
Also referred to later in the text as compound long-term sales growth rate |
Among the mentioned units, Respiratory Care & Sleep Management and Professional Lighting Solutions have the highest amount of goodwill and the lowest excess of the recoverable amount over the carrying amount. Based on the annual impairment test performed in the second quarter, the headroom of Respiratory Care & Sleep Management was estimated at EUR 820 million. Based on the updated test performed in Q4, the headroom of Professional Lighting Solutions was estimated at EUR 1,000 million. The following changes could, individually, cause the value in use to fall to the level of the carrying value:
Philips Group
Sensitivity analysis
|
|
|
|||||||||||
|
increase in
pre-tax discount rate, basis points |
decrease in
compound long-term sales growth rate, basis points |
decrease in
terminal value amount, % |
||||||||||
|
|
|
|||||||||||
|
Respiratory Care & Sleep Management |
380 | 680 | 49 | |||||||||
|
Professional Lighting Solutions |
400 | 1,030 | 47 | |||||||||
|
|
|
|||||||||||
The results of the annual impairment test of Imaging Systems and Patient Care & Monitoring Solutions have indicated that a reasonably possible change in key assumptions would not cause the value in use to fall to the level of the carrying value.
Impairment charge 2013
In the fourth quarter of 2013, the updated impairment test for Consumer Luminaires resulted in EUR 26 million impairment. This was mainly a consequence of reduced growth rate due to slower anticipated recovery of certain markets and introduction delays of new product ranges. The pre-tax discount rate applied in the mentioned Q4 2013 test was 13.5%. The pre-tax discount rate applied in the 2013 annual impairment test was 13.4%. Compared to the previous impairment test there has been no change in the organization structure which impacts how goodwill is allocated to this cash-generating unit.
Additional information 2014
In addition to the units with significant goodwill, other cash-generating units are sensitive to fluctuations in the assumptions as set out above.
Based on the most recent impairment test, it was noted that the headroom for the cash-generating unit Home Monitoring was EUR 30 million. An increase of 150 points in the pre-tax discount rate, a 310 basis points decline in the compound long-term sales growth rate or a 21% decrease in terminal value would cause its value in use to fall to the level of its carrying value. The goodwill allocated to Home Monitoring at December 31, 2014 amounts to EUR 34 million.
Based on the most recent impairment test, it was noted that with regard to the headroom for the cash-generating unit Consumer Luminaires the estimated recoverable amount approximates the carrying value of this cash-generating unit. Consequently, any adverse change in key assumptions would, individually, cause an impairment loss to be recognized. The goodwill allocated to Consumer Luminaires at December 31, 2014 amounts to EUR 112 million.
Please refer to note 2, Information by sector and main country for a specification of goodwill by sector.
Annual Report 2014 167
Table of Contents
Group financial statements 12.9

Intangible assets excluding goodwill
The changes were as follows:
Philips Group
Intangible assets excluding goodwill in millions of EUR
2014
|
|
|
|||||||||||||||
|
other
intangible assets |
product
development |
software | total | |||||||||||||
|
|
|
|||||||||||||||
|
Balance as of January 1, 2014: |
||||||||||||||||
|
Cost |
5,533 | 1,761 | 344 | 7,638 | ||||||||||||
|
Amortization/impairments |
(3,173 | ) | (916 | ) | (287 | ) | (4,376 | ) | ||||||||
|
|
|
|||||||||||||||
|
Book value |
2,360 | 845 | 57 | 3,262 | ||||||||||||
|
Changes in book value: |
||||||||||||||||
|
Additions |
15 | 323 | 101 | 439 | ||||||||||||
|
Acquisitions |
170 | 2 | 1 | 173 | ||||||||||||
|
Purchase price allocation adjustment |
(8 | ) | (8 | ) | ||||||||||||
|
Amortization |
(355 | ) | (231 | ) | (31 | ) | (617 | ) | ||||||||
|
Impairments |
(1 | ) | (25 | ) | (2 | ) | (28 | ) | ||||||||
|
Divestments and transfers to assets classified as held for sale |
(62 | ) | (96 | ) | — | (158 | ) | |||||||||
|
Translation differences |
231 | 71 | 3 | 305 | ||||||||||||
|
|
|
|||||||||||||||
|
Total changes |
(10 | ) | 44 | 72 | 106 | |||||||||||
|
Balance as of December 31, 2014: |
||||||||||||||||
|
Cost |
5,721 | 1,853 | 446 | 8,020 | ||||||||||||
|
Amortization/impairments |
(3,371 | ) | (964 | ) | (317 | ) | (4,652 | ) | ||||||||
|
|
|
|||||||||||||||
|
Book Value |
2,350 | 889 | 129 | 3,368 | ||||||||||||
|
|
|
|||||||||||||||
Philips Group
Intangible assets excluding goodwill in millions of EUR
2013
|
|
|
|||||||||||||||
|
other
intangible assets |
product
development |
software | total | |||||||||||||
|
|
|
|||||||||||||||
|
Balance as of January 1, 2013: |
||||||||||||||||
|
Cost |
5,868 | 1,584 | 369 | 7,821 | ||||||||||||
|
Amortization/impairments |
(2,972 | ) | (817 | ) | (301 | ) | (4,090 | ) | ||||||||
|
|
|
|||||||||||||||
|
Book value |
2,896 | 767 | 68 | 3,731 | ||||||||||||
|
Changes in book value: |
||||||||||||||||
|
Additions |
19 | 357 | 30 | 406 | ||||||||||||
|
Acquisitions |
15 | — | — | 15 | ||||||||||||
|
Amortization |
(387 | ) | (213 | ) | (37 | ) | (637 | ) | ||||||||
|
Impairments |
(50 | ) | (33 | ) | (2 | ) | (85 | ) | ||||||||
|
Reversal of impairment |
5 | — | — | 5 | ||||||||||||
|
Divestments and transfer to assets classified as held for sale |
(28 | ) | (9 | ) | (1 | ) | (38 | ) | ||||||||
|
Translation differences |
(118 | ) | (25 | ) | (1 | ) | (144 | ) | ||||||||
|
Other |
8 | 1 | — | 9 | ||||||||||||
|
|
|
|||||||||||||||
|
Total changes |
(536 | ) | 78 | (11 | ) | (469 | ) | |||||||||
|
Balance as of December 31, 2013: |
||||||||||||||||
|
Cost |
5,533 | 1,761 | 344 | 7,638 | ||||||||||||
|
Amortization/impairments |
(3,173 | ) | (916 | ) | (287 | ) | (4,376 | ) | ||||||||
|
|
|
|||||||||||||||
|
Book value |
2,360 | 845 | 57 | 3,262 | ||||||||||||
|
|
|
|||||||||||||||
The additions for 2014 contain internally generated assets of EUR 323 million for product development, and EUR 83 million for software. (2013: EUR 357 million, EUR 0 million). The acquisitions through business combinations in 2014 mainly consist of the acquired intangible assets of General Lighting Company (GLC) for EUR 158 million.
In addition, other intangible fixed assets changed due to the finalization of purchase price accounting related to acquisitions in the prior year. Transfer to assets classified as held for sale in 2014 mainly relate to combined businesses of Lumileds and Automotive.
The impairment charges in 2013 include an impairment charge of EUR 24 million in Imaging Systems, which relate to capitalized product development for EUR 7 million and other intangibles for EUR 17 million. The impairment charge is based on a trigger-based test on
168 Annual Report 2014
Table of Contents
 Group financial statements
12.9
Group financial statements
12.9
a specific business unit in Imaging Systems. A change in the business outlook coming from a slower than expected sales ramp up resulted in the mentioned impairment charge. The basis of the recoverable amount used in this test is the value in use and a pre-tax discount rate of 9,6% is applied. After the impairment charge the carrying value of the related intangible assets is zero.
The impairment charges in 2013 include an impairment charge of EUR 32 million for customer relationships in Consumer Luminaires. The charge is based on a trigger-based test on specific mature markets following the initiated turnaround plan, reconsidering product ranges and growth rates. The basis of the recoverable amount used in this test is the value in use and a pre-tax discount rate of 11.4% is applied. After the impairment charge the carrying value of the related intangible assets is zero.
The amortization of intangible assets is specified in note 6, Income from operations.
Other intangible assets consist of:
Philips Group
Amortization of other intangible assets in millions of EUR
2013 - 2014
|
|
|
|||||||||||||||
|
Balance as of
December 31, 2013 |
Balance as of
|
|||||||||||||||
| gross |
amortization/
impairments |
gross |
amortization/
impairments |
|||||||||||||
|
|
|
|||||||||||||||
|
Brand names |
909 | (424 | ) | 1,018 | (497 | ) | ||||||||||
|
Customer relationships |
2,856 | (1,447 | ) | 3,045 | (1,622 | ) | ||||||||||
|
Technology |
1,678 | (1,226 | ) | 1,543 | (1,151 | ) | ||||||||||
|
Other |
90 | (76 | ) | 115 | (101 | ) | ||||||||||
|
|
|
|||||||||||||||
|
Other intangibles |
5,533 | (3,173 | ) | 5,721 | (3,371 | ) | ||||||||||
|
|
|
|||||||||||||||
The estimated amortization expense for other intangible assets for each of the next five years is:
Philips Group
Estimated amortization expense for other intangible assets
in years
|
2015 |
321 | |||
|
2016 |
290 | |||
|
2017 |
265 | |||
|
2018 |
259 | |||
|
2019 |
244 | |||
|
|
|
The expected useful lives of the intangible assets excluding goodwill are as follows:
Philips Group
Expected useful lives of intangible assets excluding goodwill
in years
|
Brand names |
2-20 | |||
|
Customer relationships |
2-25 | |||
|
Technology |
3-20 | |||
|
Other |
1-8 | |||
|
Software |
1-10 | |||
|
Product development |
3-7 | |||
|
|
|
The weighted average expected remaining life of other intangible assets is 8.5 years as of December 31, 2014 (2013: 8.5 years).
The capitalized product development costs and software for which amortization has not yet commenced amounted to EUR 450 million as of December 31, 2014 (2013: EUR 356 million).
At December 31, 2014 the carrying amount of customer relationships of Respiratory Care & Sleep Management was EUR 468 million (USD 569 million) with a remaining amortization period of 9.2 years (2013: EUR 459 million, USD 633 million; 10.2 years).
Other non-current financial assets
The changes during 2014 were as follows:
Philips Group
Other non-current financial assets in millions of EUR
2014
|
|
|
|||||||||||||||||||
|
available-
for-sale financial assets |
loans and
receivables |
held-to-
maturity
ments |
financial
assets at fair value through profit or loss |
total | ||||||||||||||||
|
|
|
|||||||||||||||||||
|
Balance as of January 1, 2014 |
192 | 273 | 3 | 28 | 496 | |||||||||||||||
|
Changes: |
||||||||||||||||||||
|
Reclassifications |
5 | (119 | ) | — | — | (114 | ) | |||||||||||||
|
Acquisitions/additions |
23 | 69 | 1 | — | 93 | |||||||||||||||
|
Sales/redemptions/reductions |
(15 | ) | (2 | ) | — | (2 | ) | (19 | ) | |||||||||||
|
Impairment |
(10 | ) | (3 | ) | (1 | ) | — | (14 | ) | |||||||||||
|
Transfer to assets classified as held for sale |
(38 | ) | — | — | — | (38 | ) | |||||||||||||
|
Value adjustments |
50 | 6 | — | (7 | ) | 49 | ||||||||||||||
|
Translation and exchange differences |
3 | 2 | (1 | ) | 5 | 9 | ||||||||||||||
|
|
|
|||||||||||||||||||
|
Balance as of December 31, 2014 |
210 | 226 | 2 | 24 | 462 | |||||||||||||||
|
|
|
|||||||||||||||||||
Available-for-sale financial assets
The Company’s investments in available-for-sale financial assets mainly consist of investments in common stock of companies in various industries. An amount of EUR 38 million has been reclassified to assets held for sale mainly relating to the contribution agreement between the Philips Pension Fund, Philips and Dutch trade unions on July 1, 2013.
Annual Report 2014 169
Table of Contents
Group financial statements 12.9


Loans and receivables
The reclassification line includes loans of EUR 121 million transferred to Current financial assets (see below). The acquisitions/additions line mainly relates to a new loan of EUR 60 million issued to TPV Technology Limited.
Financial assets at fair value through profit or loss
In 2010 Philips sold its entire holding of common shares in NXP Semiconductors B.V. (NXP) to Philips Pension Trustees Limited (herein referred to as “UK Pension Fund”). The purchase agreement with the UK Pension Fund included an arrangement that entitled Philips to a cash payment from the UK Pension Fund on or after September 7, 2014, if certain conditions were met. As of December 31, 2013, management’s best estimate of the fair value of the arrangement was EUR 7 million. At the date of expiration on September 7, 2014 the arrangement did not represent any value. The decline in fair value in 2014 is reported under value adjustments in the table above and also recognized in Financial income and expense.
Current financial assets
The amount of EUR 125 million mostly relates to loans issued to TPV Technology Limited. These loans are due in 2015 and have therefore been reclassified from non-current to Current financial assets.
Other non-current assets
Other non-current assets in 2014 are comprised of prepaid pension costs of EUR 2 million (2013: EUR 5 million) and prepaid expenses of EUR 67 million (2013: EUR 58 million).
For further details see note 20, Post-employment benefits.
Other current assets
Other current assets include prepaid expenses of EUR 411 million (2013: EUR 354 million).
Inventories are summarized as follows:
Philips Group
Inventories in millions of EUR
2013 - 2014
|
|
|
|||||||
| 2013 | 2014 | |||||||
|
|
|
|||||||
|
Raw materials and supplies |
1,029 | 962 | ||||||
|
Work in process |
375 | 481 | ||||||
|
Finished goods |
1,836 | 1,871 | ||||||
|
|
|
|||||||
|
Inventories |
3,240 | 3,314 | ||||||
|
|
|
|||||||
The balance as per December 31, 2014 excludes EUR 248 million of inventories associated with Lumileds and Automotive businesses and classified as Assets held for sale. For more details, please refer to note 3, Discontinued operations and other assets classified as held for sale.
The write-down of inventories to net realizable value amounted in 2014 to EUR 217 million (2013: EUR 178 million). The write-down is included in cost of sales.
Non-current receivables
Non-current receivables are associated mainly with customer financing in Healthcare and insurance receivables in Innovation, Group & Services. The balance as per December 31, 2014 includes an allowance for doubtful accounts of EUR 2 million (2013: EUR 7 million).
Current receivables
The accounts receivable, net, per sector are as follows:
Philips Group
Accounts receivables-net in millions of EUR
2013 - 2014
|
|
|
|||||||
| 2013 | 2014 | |||||||
|
|
|
|||||||
|
Healthcare |
1,978 | 2,112 | ||||||
|
Consumer Lifestyle |
743 | 791 | ||||||
|
Lighting |
1,567 | 1,438 | ||||||
|
Innovation, Group & Services |
132 | 135 | ||||||
|
|
|
|||||||
|
Accounts receivable-net |
4,420 | 4,476 | ||||||
|
|
|
|||||||
The balance of Lighting accounts receivables as per December 31, 2014 excludes EUR 274 million of account receivables associated with Lumileds and Automotive businesses and classified as Assets held for sale. For more details, please refer to note 3, Discontinued operations and other assets classified as held for sale.
The aging analysis of accounts receivable, net, is set out below:
Philips Group
Aging analysis in millions of EUR
2013 - 2014
|
|
|
|||||||
| 2013 | 2014 | |||||||
|
|
|
|||||||
|
current |
3,671 | 3,719 | ||||||
|
overdue 1-30 days |
287 | 251 | ||||||
|
overdue 31-180 days |
305 | 335 | ||||||
|
overdue > 180 days |
157 | 171 | ||||||
|
|
|
|||||||
|
Accounts receivable-net |
4,420 | 4,476 | ||||||
|
|
|
|||||||
The above net accounts receivable represent current and overdue but not impaired receivables.
170 Annual Report 2014
Table of Contents
 Group financial statements 12.9
The changes in the allowance for doubtful accounts receivable are as follows:
Philips Group
Allowance for doubtful accounts receivable in millions of EUR
2012 - 2014
|
|
|
|||||||||||
| 2012 1) | 2013 1) | 2014 | ||||||||||
|
|
|
|||||||||||
|
Balance as of January 1 |
265 | 230 | 204 | |||||||||
|
Additions charged to expense |
13 | 29 | 48 | |||||||||
|
Deductions from allowance 2) |
(49 | ) | (33 | ) | (46 | ) | ||||||
|
Other movements |
1 | (22 | ) | 21 | ||||||||
|
|
|
|||||||||||
|
Balance as of December 31 |
230 | 204 | 227 | |||||||||
|
|
|
|||||||||||
| 1) |
Amounts have been revised following reclassification |
| 2) |
Write-offs for which an allowance was previously provided |
The allowance for doubtful accounts receivable has been primarily established for receivables that are past due.
Included in above balances as per December 31, 2014 are allowances for individually impaired receivables of EUR 200 million (2013: EUR 172 million; 2012: EUR 194 million).
Common shares
As of December 31, 2014, the issued and fully paid share capital consists of 934,819,413 common shares, each share having a par value of EUR 0.20.
In June 2014, Philips settled a dividend of EUR 0.80 per common share, representing a total value of EUR 729 million. Shareholders could elect for a cash dividend or a share dividend. 60% of the shareholders elected for a share dividend, resulting in the issuance of 18,811,534 new common shares. The settlement of the cash dividend resulted in a payment of EUR 293 million including tax and service charges.
The following table shows the movements in the outstanding number of shares:
Philips Group
Outstanding number of shares in number of shares
2013 - 2014
|
|
|
|||||||
| 2013 | 2014 | |||||||
|
|
|
|||||||
|
Balance as of January 1 |
914,591,275 | 913,337,767 | ||||||
|
Dividend distributed |
18,491,337 | 18,811,534 | ||||||
|
Purchase of treasury shares |
(27,811,356 | ) | (28,537,921 | ) | ||||
|
Re-issuance of treasury shares |
8,066,511 | 10,777,489 | ||||||
|
Balance as of December 31 |
913,337,767 | 914,388,869 | ||||||
|
|
|
|||||||
Preference shares
The ‘Stichting Preferente Aandelen Philips’ has been granted the right to acquire preference shares in the Company. Such right has not been exercised. As a means to protect the Company and its stakeholders against an unsolicited attempt to acquire (de facto) control of the Company, the General Meeting of Shareholders in 1989 adopted amendments to the Company’s articles of association that allow the Board of Management and the Supervisory Board to issue (rights to acquire) preference shares to a third-party. As of December 31, 2014, no preference shares have been issued.
Option rights/restricted and performance shares
The Company has granted stock options on its common shares and rights to receive common shares in the future (see note 28, Share-based compensation).
Treasury shares
In connection with the Company’s share repurchase programs, shares which have been repurchased and are held in treasury for (i) delivery upon exercise of options, performance and restricted share programs and employee share purchase programs, and (ii) capital reduction purposes, are accounted for as a reduction of shareholders’ equity. Treasury shares are recorded at cost, representing the market price on the acquisition date. When issued, shares are removed from treasury shares on a first-in, first-out (FIFO) basis.
When treasury shares are reissued under the Company’s option plans, the difference between the cost and the cash received is recorded in retained earnings.
Dividend withholding tax in connection with the Company’s purchase of treasury shares is recorded in retained earnings.
The following transactions took place resulting from employee option and share plans:
Philips Group
Employee option and share plan transactions
2013 - 2014
|
|
|
|||||||
| 2013 | 2014 | |||||||
|
|
|
|||||||
|
Shares acquired |
3,984 | 7,254,606 | ||||||
|
Average market price |
EUR 22.51 | EUR 24.53 | ||||||
|
Amount paid |
EUR 0 million | EUR 178 million | ||||||
|
Shares delivered |
8,066,511 | 10,777,489 | ||||||
|
Average market price |
EUR 28.35 | EUR 30.26 | ||||||
|
Cost of delivered shares |
EUR 229 million | EUR 326 million | ||||||
|
Total shares in treasury at year-end |
20,650,427 | 17,127,544 | ||||||
|
Total cost |
EUR 618 million | EUR 470 million | ||||||
|
|
|
|||||||
Annual Report 2014 171
Table of Contents
Group financial statements 12.9
In order to reduce share capital, the following transactions took place:
Philips Group
Share capital transactions
2013 - 2014
|
|
|
|||||||
| 2013 | 2014 | |||||||
|
|
|
|||||||
|
Shares acquired |
27,807,372 | 21,283,315 | ||||||
|
Average market price |
EUR 22.69 | EUR 23.95 | ||||||
|
Amount paid |
EUR 631 million | EUR 510 million | ||||||
|
Reduction of capital stock (shares) |
37,778,510 | 21,837,910 | ||||||
|
Reduction of capital stock (EUR) |
EUR 787 million | EUR 533 million | ||||||
|
Total shares in treasury at year-end |
3,857,595 | 3,303,000 | ||||||
|
Total cost |
EUR 100 million | EUR 77 million | ||||||
|
|
|
|||||||
Stock purchase transactions related to employee option and share plans, as well as transactions related to the reduction of share capital involved a cash outflow of EUR 712 million, which includes the impact of taxes. Settlements of stock based compensation plans involved a cash inflow of EUR 116 million.
Dividend distribution
A proposal will be submitted to the 2015 Annual General Meeting of Shareholders to pay a dividend of EUR 0.80 per common share, in cash or shares at the option of the shareholder, from the 2014 net income and retained earnings of the Company.
Limitations in the distribution of shareholders’ equity
As at December 31, 2014, pursuant to Dutch law, certain limitations exist relating to the distribution of shareholders’ equity of EUR 1,515 million. Such limitations relate to common shares of EUR 187 million, as well as to legal reserves required by Dutch law included under retained earnings of EUR 1,059 million, revaluation reserves of EUR 13 million, available-for-sale financial assets EUR 27 million and unrealized currency translation differences of EUR 229 million. The unrealized losses related to cash flow hedges of EUR 13 million, although qualifying as a legal reserve, reduce the distributable amount by their nature.
As at December 31, 2013, these limitations in distributable amounts were EUR 1,609 million and related to common shares of EUR 188 million, as well as to legal reserves required by Dutch law included under retained earnings of EUR 1,319 million, revaluation reserves of EUR 23 million, available-for-sale financial assets of EUR 55 million and cash flow hedges EUR 24 million. The unrealized losses related to currency translation differences of EUR 569 million, although qualifying as a legal reserve, reduce the distributable amount by their nature.
The legal reserve required by Dutch law of EUR 1,059 million included under retained earnings relates to any legal or economic restrictions on the ability of affiliated companies to transfer funds to the parent company in the form of dividends.
Non-controlling interests
Non-controlling interests relate to minority stakes held by third parties in consolidated group companies. The Net loss attributable to non-controlling interests amounted to EUR 4 million in 2014 (Net income attributable to non-controlling interests 2013: EUR 3 million).
In 2014 Philips increased its non-controlling interest mainly due to the acquisition of General Lighting Company, in which Alliance Holding domiciled in Kingdom of Saudi Arabia holds an ownership percentage of 49% (please refer to note 4, Acquisitions and divestments).
Objectives, policies and processes for managing capital
Philips manages capital based upon the measures net operating capital (NOC), net debt and cash flows before financing activities.
The Company believes that an understanding of the Philips Group’s financial condition is enhanced by the disclosure of net operating capital (NOC), as this figure is used by Philips’ management to evaluate the capital efficiency of the Philips Group and its operating sectors. NOC is defined as: total assets excluding assets classified as held for sale less: (a) cash and cash equivalents, (b) deferred tax assets, (c) other non-current financial assets and current financial assets, (d) investments in associates, and after deduction of: (e) provisions (f) accounts and notes payable, (g) accrued liabilities, (h) other non-current liabilities and other current liabilities.
Net debt is defined as the sum of long- and short-term debt minus cash and cash equivalents. The net debt position as a percentage of the sum of group equity (shareholders’ equity and non-controlling interests) and net debt is presented to express the financial strength of the Company. This measure is widely used by management and investment analysts and is therefore included in the disclosure. Our net debt position is managed in such a way that we expect to continuously meet our objective to retain our target at A3 rating with stable outlook (Moody’s,) and A-rating with negative outlook (Standard and Poor’s). Furthermore, the Group’s objective when managing the net debt position is to fulfill our commitment to a stable dividend policy with a 40% to 50% target pay-out from continuing net income.
172 Annual Report 2014
Table of Contents
Group financial statements 12.9
Cash flows before financing activities, being the sum of net cash from operating activities and net cash from investing activities, are presented separately to facilitate the reader’s understanding of the Company’s funding requirements.
Philips Group
Net operating capital composition in millions of EUR
2012 - 2014
|
|
|
|||||||||||
| 2012 | 2013 | 2014 | ||||||||||
|
|
|
|||||||||||
|
Intangible assets |
10,679 | 9,766 | 10,526 | |||||||||
|
Property, plant and equipment |
2,959 | 2,780 | 2,095 | |||||||||
|
Remaining assets |
8,921 | 8,699 | 9,041 | |||||||||
|
Provisions |
(2,956 | ) | (2,554 | ) | (3,445 | ) | ||||||
|
Other liabilities |
(10,287 | ) | (8,453 | ) | (9,379 | ) | ||||||
|
|
|
|||||||||||
|
Net operating capital |
9,316 | 10,238 | 8,838 | |||||||||
|
|
|
|||||||||||
Philips Group
Composition of net debt to group equity in millions of EUR unless otherwise stated
2012 - 2014
|
|
|
|||||||||||
| 2012 | 2013 | 2014 | ||||||||||
|
|
|
|||||||||||
|
Long-term debt |
3,725 | 3,309 | 3,712 | |||||||||
|
Short-term debt |
809 | 592 | 392 | |||||||||
|
|
|
|||||||||||
|
Total debt |
4,534 | 3,901 | 4,104 | |||||||||
|
Cash and cash equivalents |
3,834 | 2,465 | 1,873 | |||||||||
|
|
|
|||||||||||
|
Net debt 1) |
700 | 1,436 | 2,231 | |||||||||
|
Shareholders’ equity |
11,151 | 11,214 | 10,867 | |||||||||
|
Non-controlling interests |
34 | 13 | 101 | |||||||||
|
|
|
|||||||||||
|
Group equity |
11,185 | 11,227 | 10,968 | |||||||||
|
Net debt and group equity |
11,885 | 12,663 | 13,199 | |||||||||
|
Net debt divided by net debt and group equity (in %) |
6 | % | 11 | % | 17 | % | ||||||
|
Group equity divided by net debt and group equity (in %) |
94 | % | 89 | % | 83 | % | ||||||
|
|
|
|||||||||||
| 1) |
Total debt less cash and cash equivalents |
Philips Group
Composition of cash flows in millions of EUR
2012 - 2014
|
|
|
|||||||||||
| 2012 | 2013 | 2014 | ||||||||||
|
|
|
|||||||||||
|
Cash flows from operating activities |
1,886 | 912 | 1,303 | |||||||||
|
Cash flows from investing activities |
(712 | ) | (862 | ) | (984 | ) | ||||||
|
|
|
|||||||||||
|
Cash flows before financing activities |
1,174 | 50 | 319 | |||||||||
|
|
|
|||||||||||
Annual Report 2014 173
Table of Contents
Group financial statements 12.9


Philips Group
Long-term debt in millions of EUR unless otherwise stated
2013 - 2014
|
|
|
|||||||||||||||||||||||||||||||
|
(range of)
interest rates |
average
rate of interest |
amount
outstanding 2014 |
amount
due in 1 year |
amount
due after 1 year |
amount
due after 5 years |
average
remaining term (in years) |
amount
outstanding 2013 |
|||||||||||||||||||||||||
|
|
|
|||||||||||||||||||||||||||||||
|
USD bonds |
3.8 - 7.8 | % | 5.6 | % | 3,355 | — | 3,355 | 2,333 | 12.7 | 2,958 | ||||||||||||||||||||||
|
Bank borrowings |
0 - 7.8 | % | 1.9 | % | 258 | 51 | 207 | 201 | 5.7 | 466 | ||||||||||||||||||||||
|
Other long-term debt |
2.1 - 19.9 | % | 4.9 | % | 52 | 43 | 9 | 1 | 1.4 | 48 | ||||||||||||||||||||||
|
|
|
|||||||||||||||||||||||||||||||
|
Institutional financing |
3,665 | 94 | 3,571 | 2,535 | 3,472 | |||||||||||||||||||||||||||
|
Finance leases |
0 - 14.4 | % | 3.8 | % | 195 | 54 | 141 | 43 | 3.8 | 199 | ||||||||||||||||||||||
|
|
|
|||||||||||||||||||||||||||||||
|
Long-term debt |
5.2 | % | 3,860 | 148 | 3,712 | 2,578 | 3,671 | |||||||||||||||||||||||||
|
Corresponding data of previous year |
5.0 | % | 3,671 | 362 | 3,309 | 2,315 | 3,976 | |||||||||||||||||||||||||
|
|
|
|||||||||||||||||||||||||||||||
The following amounts of long-term debt as of December 31, 2014, are due in the next five years:
Philips Group
Long-term debts due in the next five years in millions of EUR
2013 - 2014
|
2015 |
148 | |||
|
2016 |
43 | |||
|
2017 |
32 | |||
|
2018 |
1,046 | |||
|
2019 |
13 | |||
|
|
|
|||
|
Long term debt |
1,282 | |||
|
Corresponding amount of previous year |
1,356 | |||
|
|
|
Philips Group
Unsecured USD Bonds in millions of EUR unless otherwise stated
2013 - 2014
|
|
|
|||||||||||
|
effective
rate |
2013 | 2014 | ||||||||||
|
|
|
|||||||||||
|
Due 5/15/25; 7 3/4% |
7.429 | % | 72 | 81 | ||||||||
|
Due 6/01/26; 7 1/5% |
6.885 | % | 120 | 136 | ||||||||
|
Due 5/15/25; 7 1/8% |
6.794 | % | 74 | 84 | ||||||||
|
Due 3/11/18; 5 3/4% 1) |
6.066 | % | 907 | 1,028 | ||||||||
|
Due 3/11/38; 6 7/8% 1) |
7.210 | % | 726 | 823 | ||||||||
|
Due 3/15/22; 3 3/4% 1) |
3.906 | % | 726 | 823 | ||||||||
|
Due 3/15/42; 5% 1) |
5.273 | % | 363 | 411 | ||||||||
|
Adjustments 2) |
(30 | ) | (31 | ) | ||||||||
|
|
|
|||||||||||
|
Unsecured USD Bonds |
2,958 | 3,355 | ||||||||||
|
|
|
|||||||||||
| 1) |
The provisions applicable to these bonds, issued in March 2008 and in March 2012, contain a ‘Change of Control Triggering Event’. If the Company would experience such an event with respect to a series of corporate bonds, the Company may be required to offer to purchase the bonds of the series at a purchase price equal to 101% of the principal amount, plus accrued and unpaid interest, if any. |
| 2) |
Adjustments relate to issued bond discounts, transaction costs and fair value adjustments for interest rate derivatives |
Secured liabilities
In 2014, none of the long-term and short-term debt was secured by collateral (2013: EUR nil million).
Short-term debt
Philips Group
Short-term debt in millions of EUR
2013 - 2014
|
|
|
|||||||
| 2013 | 2014 | |||||||
|
|
|
|||||||
|
Short-term bank borrowings |
207 | 225 | ||||||
|
Other short-term loans |
23 | 19 | ||||||
|
Current portion of long-term debt |
362 | 148 | ||||||
|
|
|
|||||||
|
Short-term debt |
592 | 392 | ||||||
|
|
|
|||||||
During 2014, the weighted average interest rate on the bank borrowings was 8.3% (2013: 6.4%).
Philips has a USD 2.5 billion Commercial Paper Program and a EUR 1.8 billion revolving credit facility that can be used for general group purposes and as a backstop of its commercial paper program. In January 2013, the EUR 1.8 billion facility was extended by 2 years until February 18, 2018. As of December 31, 2014 Philips did not have any loans outstanding under either facility.
Philips Group
Provisions in millions of EUR
2013 - 2014
|
|
|
|||||||||||||||
| 2013 | 2014 | |||||||||||||||
|
|
|
|||||||||||||||
|
long-
term |
short-
term |
long-
term |
short-
term |
|||||||||||||
|
|
|
|||||||||||||||
|
Provisions for defined-benefit plans (see note 20) |
754 | 51 | 881 | 52 | ||||||||||||
|
Other postretirement benefits (see note 20) |
200 | 14 | 226 | 16 | ||||||||||||
|
Product warranty |
59 | 207 | 77 | 225 | ||||||||||||
|
Environmental provisions |
249 | 62 | 301 | 59 | ||||||||||||
|
Restructuring-related provisions |
75 | 128 | 150 | 230 | ||||||||||||
|
Litigation provisions |
232 | 4 | 480 | 173 | ||||||||||||
|
Other provisions |
334 | 185 | 385 | 190 | ||||||||||||
|
|
|
|||||||||||||||
|
Provisions |
1,903 | 651 | 2,500 | 945 | ||||||||||||
|
|
|
|||||||||||||||
174 Annual Report 2014
Table of Contents
Group financial statements 12.9
Product warranty
The provision for product warranty reflects the estimated costs of replacement and free-of-charge services that will be incurred by the Company with respect to products sold. The Company expects the provision will be utilized mainly within the next year.
Philips Group
Provision for product warranty in millions of EUR
2012 - 2014
|
|
|
|||||||||||
| 2012 | 2013 | 2014 | ||||||||||
|
|
|
|||||||||||
|
Balance as of January 1 |
378 | 319 | 266 | |||||||||
|
Changes: |
||||||||||||
|
Additions |
370 | 350 | 332 | |||||||||
|
Utilizations |
(427 | ) | (363 | ) | (316 | ) | ||||||
|
Transfer to assets classified as held for sale |
— | (24 | ) | (3 | ) | |||||||
|
Translation differences |
(4 | ) | (16 | ) | 23 | |||||||
|
Changes in consolidation |
2 | — | — | |||||||||
|
|
|
|||||||||||
|
Balance as of December 31 |
319 | 266 | 302 | |||||||||
|
|
|
|||||||||||
Environmental provisions
The environmental provisions include accrued losses recorded with respect to environmental remediation in various countries. In the United States, subsidiaries of the Company have been named as potentially responsible parties in state and federal proceedings for the clean-up of certain sites.
Provisions for environmental remediation can change significantly due to the emergence of additional information regarding the extent or nature of the contamination, the need to utilize alternative technologies, actions by regulatory authorities as well as changes in judgments and discount rates.
Approximately half of this provision is expected to be utilized within the next five years. The remaining portion relates to longer-term remediation activities.
Philips Group
Environmental provisions in millions of EUR
2012 - 2014
|
|
|
|||||||||||
| 2012 | 2013 | 2014 | ||||||||||
|
|
|
|||||||||||
|
Balance as of January 1 |
305 | 375 | 311 | |||||||||
|
Changes: |
||||||||||||
|
Additions |
48 | 30 | 29 | |||||||||
|
Utilizations |
(22 | ) | (21 | ) | (23 | ) | ||||||
|
Releases |
(1 | ) | (16 | ) | (15 | ) | ||||||
|
Changes in discount rate |
18 | (40 | ) | 30 | ||||||||
|
Accretion |
6 | 6 | 8 | |||||||||
|
Translation differences |
(4 | ) | (8 | ) | 16 | |||||||
|
Purchase price allocation adjustment |
— | (15 | ) | — | ||||||||
|
Changes in consolidation |
25 | — | 4 | |||||||||
|
|
|
|||||||||||
|
Balance as of December 31 |
375 | 311 | 360 | |||||||||
|
|
|
|||||||||||
The increase of provision due to changes in discount rate in 2014 relates to an overall decrease of the market rates used in discounting.
For more details on the environmental remediation reference is made to note 26, Contingent assets and liabilities.
Restructuring-related provisions
The most significant projects in 2014
In 2014, the most significant restructuring projects related to Lighting and IG&S and were driven by industrial footprint rationalization and the Accelerate! transformation program.
Restructuring projects at Lighting centered on Light Sources & Electronics and Professional Lighting Solutions, the largest of which took place in Belgium, the Netherlands and France.
Innovation, Group & Services restructuring projects mainly were related to IT and group and country overheads and centered primarily in the Netherlands, US and Belgium.
Restructuring projects at Healthcare mainly took place in the US and Netherlands.
Consumer Lifestyle restructuring projects were mainly in the Netherlands.
The Company expects the provision will be utilized mainly within the next year. The movements in the provisions and liabilities for restructuring in 2014 are presented by sector as follows:
Philips Group
Restructuring-related provisions in millions of EUR
2014
|
|
|
|||||||||||||||||||||||
|
Jan. 1, 2014 |
additions | utilizations | releases |
other
changes 1) |
Dec. 31, 2014 |
|||||||||||||||||||
|
|
|
|||||||||||||||||||||||
|
Healthcare |
17 | 67 | (27 | ) | (9 | ) | — | 48 | ||||||||||||||||
|
Consumer Lifestyle |
21 | 7 | (10 | ) | (7 | ) | 1 | 12 | ||||||||||||||||
|
Lighting |
130 | 180 | (90 | ) | (16 | ) | (9 | ) | 195 | |||||||||||||||
|
Innovation, Group and Services |
35 | 110 | (15 | ) | (5 | ) | — | 125 | ||||||||||||||||
|
|
|
|||||||||||||||||||||||
|
Philips Group |
203 | 364 | (142 | ) | (37 | ) | (8 | ) | 380 | |||||||||||||||
|
|
|
|||||||||||||||||||||||
| 1) |
Other changes primarily relate to translation differences and assets classified as held for sale reclassifications |
The most significant projects in 2013
In 2013, the most significant restructuring projects related to Lighting and were driven by the industrial footprint rationalization.
In Healthcare, the largest projects were undertaken in Customer Services, Home Healthcare Solutions and Imaging Systems in the United States, Italy and the Netherlands to reduce the operating costs and simplify the organization.
Consumer Lifestyle restructuring charges were mainly related to Personal Care (primarily in the Netherlands and Austria) and Coffee (mainly Italy).
Annual Report 2014 175
Table of Contents
Group financial statements 12.9
Restructuring projects at Lighting centered on Luminaires businesses and Light Sources & Electronics, the largest of which took place in the United States, France and Belgium.
Innovation, Group & Services restructuring projects mainly focused on the Financial Operations Service Unit, primarily in Italy, France and the United States.
The movements in the provisions and liabilities for restructuring in 2013 are presented by sector as follows:
Philips Group
Restructuring-related provisions in millions of EUR
2013
|
|
|
|||||||||||||||||||||||
|
Jan.1,
2013 |
addi- tions |
utilizations | releases |
other
changes 1) |
Dec 31,
2013 |
|||||||||||||||||||
|
|
|
|||||||||||||||||||||||
|
Healthcare |
77 | 14 | (50 | ) | (23 | ) | (1 | ) | 17 | |||||||||||||||
|
Consumer Lifestyle |
48 | 11 | (27 | ) | (10 | ) | (1 | ) | 21 | |||||||||||||||
|
Lighting |
198 | 64 | (110 | ) | (19 | ) | (3 | ) | 130 | |||||||||||||||
|
Innovation, Group and Services |
62 | 16 | (30 | ) | (15 | ) | 2 | 35 | ||||||||||||||||
|
|
|
|||||||||||||||||||||||
|
Philips Group |
385 | 105 | (217 | ) | (67 | ) | (3 | ) | 203 | |||||||||||||||
|
|
|
|||||||||||||||||||||||
| 1) |
Other changes primarily relate to translation differences and transfers between sectors |
The most significant projects in 2012
In 2012, the most significant restructuring projects related to Lighting and Healthcare and were driven by our change program Accelerate!.
In Healthcare, the largest projects were undertaken in Imaging Systems and Patient Care & Clinical Informatics in various locations in the United States, the Netherlands and Germany to reduce the operating costs and simplify the organization.
Consumer Lifestyle restructuring charges were mainly related to Lifestyle Entertainment (primarily in Hong Kong and the United States) and Coffee (mainly Italy).
Restructuring projects at Lighting centered on Luminaires businesses and Light Sources & Electronics, the largest of which took place in the Netherlands, Belgium and in various locations in the US.
Innovation, Group & Services restructuring projects focused on the IT and Financial Operations Service Units (primarily in the Netherlands), Group & Regional Overheads (mainly in the Netherlands and Italy) and Philips Innovation Services (in the Netherlands and Belgium).
The movements in the provisions and liabilities for restructuring in 2012 are presented by sector as follows:
Philips Group
Restructuring-related provisions in millions of EUR
2012
|
|
|
|||||||||||||||||||||||
|
Jan.1,
2012 |
addi- tions |
utilizations | releases |
other
changes 1) |
Dec. 31,
2012 |
|||||||||||||||||||
|
|
|
|||||||||||||||||||||||
|
Healthcare |
18 | 100 | (29 | ) | (7 | ) | (5 | ) | 77 | |||||||||||||||
|
Consumer Lifestyle |
39 | 58 | (41 | ) | (8 | ) | — | 48 | ||||||||||||||||
|
Lighting |
52 | 225 | (61 | ) | (16 | ) | (2 | ) | 198 | |||||||||||||||
|
Innovation, Group and Services |
60 | 67 | (47 | ) | (10 | ) | (8 | ) | 62 | |||||||||||||||
|
|
|
|||||||||||||||||||||||
|
Philips Group |
169 | 450 | (178 | ) | (41 | ) | (15 | ) | 385 | |||||||||||||||
|
|
|
|||||||||||||||||||||||
| 1) |
Other changes primarily relate to translation differences and transfers between sectors |
Litigation provisions
The Company and certain of its group companies and former group companies are involved as a party in legal proceedings, including regulatory and other governmental proceedings.
Philips Group
Litigation provisions in millions of EUR
2012 - 2014
|
|
|
|||||||||||
| 2012 | 2013 | 2014 | ||||||||||
|
|
|
|||||||||||
|
Balance as of January 1 |
101 | 238 | 236 | |||||||||
|
Changes: |
||||||||||||
|
Additions |
234 | 48 | 563 | |||||||||
|
Utilizations |
(85 | ) | (17 | ) | (170 | ) | ||||||
|
Releases |
(7 | ) | (15 | ) | (23 | ) | ||||||
|
Accretion |
— | — | 6 | |||||||||
|
Translation differences |
(5 | ) | (18 | ) | 41 | |||||||
|
|
|
|||||||||||
|
Balance as of December 31 |
238 | 236 | 653 | |||||||||
|
|
|
|||||||||||
The additions in 2014 include the patent infringement lawsuit by Masimo Corporation in the Unites States District Court for the District of Delaware against Philips in which Masimo was awarded a compensation of USD 467 million (EUR 366 million).
The majority of the remaining 2014 additions and of the utilization of the provisions, as well as of the remaining ending balance as of December 31, 2014 relates to certain parts of the Cathode Ray Tube antitrust litigation as mentioned in note 26, Contingent assets and liabilities for which the Company concluded it was able to make a reliable estimate of the cash outflow or was able to reach a settlement.
The Company expects to use the provisions within the next five years. For more details reference is made to note 26, Contingent assets and liabilities.
Other provisions
The main elements of other provisions are: provision for post-employment benefits and obligatory severance payments of EUR 50 million (2013: 66 million), onerous contract provisions for unfavorable supply contracts as part of divestment transactions, onerous (sub)lease
176 Annual Report 2014
Table of Contents
 Group financial statements 12.9
contracts and expected losses on existing projects / orders totaling EUR 103 million (2013: 93 million), provision for employee jubilee funds EUR 74 million (2013: EUR 76 million), self-insurance liabilities of EUR 65 million (2013: EUR 56 million), provisions for rights of return of EUR 52 million (2013: EUR 45 million), provision for possible taxes/social security of EUR 97 million (2013: EUR 65 million) and provision for decommissioning costs of EUR 36 million (2013: EUR 33 million).
Less than half of the provision for employee jubilee funds, provision for possible taxes/social security and provision for decommissioning costs is expected to be utilized within next five years. The provision for self-insurance liabilities is expected to be used within the next five years. All other provisions are expected to be utilized mainly within the next three years, except for provision for rights of return, which the Company expects to use within the next year.
Philips Group
Other provisions in millions of EUR
2012 - 2014
|
|
|
|||||||||||
| 2012 | 2013 | 2014 | ||||||||||
|
|
|
|||||||||||
|
Balance as of January 1 |
640 | 529 | 519 | |||||||||
|
Changes: |
||||||||||||
|
Additions |
322 | 198 | 213 | |||||||||
|
Utilizations |
(489 | ) | (224 | ) | (153 | ) | ||||||
|
Releases |
(28 | ) | (48 | ) | (37 | ) | ||||||
|
Reclassification |
84 | 80 | 17 | |||||||||
|
Liabilities directly associated with assets held for sale |
— | (3 | ) | (13 | ) | |||||||
|
Accretion |
1 | — | 6 | |||||||||
|
Translation differences |
(1 | ) | (13 | ) | 23 | |||||||
|
|
|
|||||||||||
|
Balance as of December 31 |
529 | 519 | 575 | |||||||||
|
|
|
|||||||||||
Employee post-employment plans have been established in many countries in accordance with the legal requirements, customs and the local practice in the countries involved.
The Company sponsors a number of defined-benefit pension plans. The benefits provided by these plans are based on employees’ years of service and compensation levels. The Company also sponsors a limited number of defined-benefit retiree medical plans. The benefits provided by these plans are typically covering a part of the healthcare insurance costs after retirement. Most employees that take part in a Company pension plan however are covered by defined-contribution (DC) pension plans.
The largest defined-benefit pension plans are in:
| • |
The Netherlands, |
| • |
The United Kingdom (UK) and |
| • |
The United States (US). |
Together these plans account for more than 90% of the total defined-benefit obligation and plan assets. Philips is one of the sponsors of Philips Pensionskasse VVaG in Germany, which is a multi-employer plan and is accounted for as a DC plan.
The Netherlands
The pension plan in the Netherlands (the Flexplan) was changed in 2014 following the new funding agreement agreed with the Trustees of the Company Pension Fund. Under the new funding agreement, which became effective January 1, 2014, the Company has no further financial obligation to the Pension Fund other than to pay an agreed fixed contribution for the annual accrual of active members. Executives are in a ‘hybrid plan’ with an accrual rate of 1.25% per service year next to a DC contribution, the level of which depends on the executive grade. Both plans are executed by the Company Pension Fund.
Although the new funding agreement de-risked the plan, the annual premium can be subject to variability after five years due to potential discounts and as a result, the plan continued to be accounted for as a defined-benefit plan. The other 2014 changes in the plan were a new pensionable age of 67 (was 65) and the introduction of an employee contribution. These changes had no material impact on the existing defined-benefit obligation.
As part of the above changes, the Company agreed to transfer a one-off EUR 600 million to the Company Pension Fund of which EUR 433 million has been paid in 2014. The remainder is to be settled before July 2015 and is included in the 2015 cash projection in this note.
In 2014 the Fund adopted the Prognosis mortality table 2014 with new experience rating which resulted in a decrease of the Company’s defined-benefit obligation. This effect is recognized in Other comprehensive income under Remeasurements for pension and other post-employment plans.
New legislation effective January 1, 2015 introduces a mandatory cap of EUR 100 thousand on the pension salary for future pension accrual. The Company has changed the pension plan accordingly at the end of 2014. For employees earning more than this cap the Company has announced certain compensatory measures and the introduction of a voluntary net pension saving scheme for the salary part above the cap. To limit the number of plans the Company further announced to cease the executive pension plan and transfer its members and their accrued defined-benefit rights to the Flexplan. Accrued defined-contribution rights in the executive pension plan are optionally transferred to either the Flexplan or an individual product. The net pension saving scheme and the individual product are with an external provider other than the Company Pension Fund.
The net result of these changes was a EUR 68 million
Annual Report 2014 177
Table of Contents
Group financial statements 12.9
decrease in the Company’s defined-benefit obligation which is recognized in the 2014 income statement as a past service cost gain of which EUR 1 million in discontinued operations.
United Kingdom
The UK plan is executed by a Company Pension Fund. In the UK plan the accrual of new benefits ceased in 2011. A legally mandatory indexation for accrued benefits still applies. The Company does not pay regular contributions, other than an agreed portion of the administration costs.
In 2014 the Trustee of the UK Fund entered into two further bulk insurance contracts - buy-ins - which provide for payment in respect of a part of the Fund’s pensioners. The asset value related to the buy-ins included in the UK plan assets equals the defined-benefit obligation of the related pensioners and is EUR 1,299 million per December 31, 2014 which is some 30% of the total assets.
United States
The US defined-benefit plan covers certain hourly workers and salaried workers hired before January 1, 2005.
The accrual for salaried workers in the US plan will end per December 31, 2015 after which the remaining members become eligible for the existing US DC plan. In 2014 the Company adopted a new Mortality table as published by the US Society of Actuaries which increased the US plan’s defined-benefit obligation with some 6%. This effect is recognized in Other comprehensive income under Remeasurements for pension and other post-employment plans.
Indexation of benefits is not mandatory. The Company pays contributions for the annual service costs as well as additional contributions to cover a deficit. The assets of the US plan are in a Trust governed by Trustees.
Risks related to defined-benefit plans
These defined-benefit plans except the Netherlands plan expose the Company to various demographic and economic risks such as longevity risk, investment risks, currency and interest rate risk and in some cases inflation risk. The latter plays a role in the assumed wage increase and in the UK plan where indexation is mandatory. Pension fund Trustees are responsible for and have full discretion over the investment strategy of the plan assets. In general Trustees manage pension fund risks by diversifying the investments of plan assets and by (partially) matching interest rate risk of liabilities.
The Company has an active de-risking strategy in which it constantly looks for opportunities to reduce the risks associated with its defined-benefit plans. Liability driven investment strategies, lump sum cash-out options, buy-ins, buy-outs and the above mentioned 2014 change in the funding agreement of the Dutch plan are examples of that strategy. The larger plans are either governed by independent Boards or by Trustees who have a legal obligation to evenly balance the interests of all stakeholders and operate under the local regulatory framework.
Balance sheet positions
The net balance sheet position presented in this note can be explained as follows:
| • |
The surpluses in our plans in the Netherlands, UK as well some other countries are not recognized as a net defined-benefit asset because in The Netherlands the current surplus will not bring sufficient future economic benefits to the Company (asset ceiling restrictions) whereas the regulatory framework in the other countries involved explicitly prohibits refunds to the employer. |
| • |
The deficit of the US defined-benefit plan presented under other liabilities and the provisions of the unfunded plans therefore count for the largest part of the net balance sheet position. |
The measurement date for all defined-benefit plans is December 31.
Summary of pre-tax costs for post-employment benefits
The below table contains the total of current- and past service costs, administration costs and settlement results as included in Income from operations and the interest cost as included in Financial expenses.
Philips Group
Pre-tax costs for post-employment benefits in millions of EUR
2012 - 2014
|
|
|
|||||||||||
| 2012 | 2013 | 2014 | ||||||||||
|
|
|
|||||||||||
|
Defined-benefit plans |
290 | 297 | 245 | |||||||||
|
included in operating cost |
200 | 220 | 182 | |||||||||
|
included in financial expense |
85 | 71 | 59 | |||||||||
|
included in discontinued operations |
5 | 6 | 4 | |||||||||
|
Defined-contribution plans including multi-employer plans |
144 | 142 | 148 | |||||||||
|
included in operating cost |
134 | 134 | 144 | |||||||||
|
included in discontinued operations |
10 | 8 | 4 | |||||||||
|
|
|
|||||||||||
178 Annual Report 2014
Table of Contents
Group financial statements 12.9
Defined-benefit plans: Pensions
Movements in the net liabilities and assets for defined benefit pension plans:
Philips Group
Defined-benefit obligations in millions of EUR
2013 - 2014
|
|
|
|||||||||||||||||||||||
| 2013 | 2014 | |||||||||||||||||||||||
|
|
|
|||||||||||||||||||||||
| Netherlands | other | total | Netherlands | other | total | |||||||||||||||||||
|
|
|
|||||||||||||||||||||||
|
Balance as of January 1 |
14,433 | 9,021 | 23,454 | 14,294 | 7,911 | 22,205 | ||||||||||||||||||
|
Service cost |
183 | 77 | 260 | 174 | 65 | 239 | ||||||||||||||||||
|
Interest cost |
467 | 351 | 818 | 478 | 361 | 839 | ||||||||||||||||||
|
Employee contributions |
— | 4 | 4 | 5 | 4 | 9 | ||||||||||||||||||
|
Actuarial (gains) / losses |
||||||||||||||||||||||||
|
– demographic assumptions |
205 | 17 | 222 | (80 | ) | 197 | 117 | |||||||||||||||||
|
– financial assumptions |
(214 | ) | (385 | ) | (599 | ) | 3,487 | 782 | 4,269 | |||||||||||||||
|
– experience adjustment |
(75 | ) | (32 | ) | (107 | ) | 23 | 25 | 48 | |||||||||||||||
|
(Negative) past service cost |
(1 | ) | (80 | ) | (81 | ) | (68 | ) | (1 | ) | (69 | ) | ||||||||||||
|
Acquisitions |
— | — | — | — | 12 | 12 | ||||||||||||||||||
|
Divestments |
— | (3 | ) | (3 | ) | — | — | — | ||||||||||||||||
|
Settlements |
— | (279 | ) | (279 | ) | — | (9 | ) | (9 | ) | ||||||||||||||
|
Benefits paid |
(704 | ) | (462 | ) | (1,166 | ) | (699 | ) | (506 | ) | (1,205 | ) | ||||||||||||
|
Exchange rate differences |
— | (318 | ) | (318 | ) | — | 624 | 624 | ||||||||||||||||
|
Miscellaneous |
— | — | — | 2 | — | 2 | ||||||||||||||||||
|
|
|
|||||||||||||||||||||||
|
Balance as of December 31 |
14,294 | 7,911 | 22,205 | 17,616 | 9,465 | 27,081 | ||||||||||||||||||
|
Present value of funded obligations at December 31 |
14,288 | 7,112 | 21,400 | 17,609 | 8,532 | 26,141 | ||||||||||||||||||
|
Present value of unfunded obligations at December 31 |
6 | 799 | 805 | 7 | 933 | 940 | ||||||||||||||||||
|
|
|
|||||||||||||||||||||||
|
Philips Group Plan assets in millions of EUR 2013 - 2014
|
||||||||||||||||||||||||
|
|
|
|||||||||||||||||||||||
|
2013 |
2014 | |||||||||||||||||||||||
|
|
|
|||||||||||||||||||||||
| Netherlands | other | total | Netherlands | other | total | |||||||||||||||||||
|
|
|
|||||||||||||||||||||||
|
Balance as of January 1 |
15,203 | 7,588 | 22,791 | 14,843 | 6,728 | 21,571 | ||||||||||||||||||
|
Interest income on plan assets |
496 | 317 | 813 | 508 | 330 | 838 | ||||||||||||||||||
|
Admin expenses paid |
(9 | ) | (5 | ) | (14 | ) | (9 | ) | (6 | ) | (15 | ) | ||||||||||||
|
Return on plan assets excluding interest income |
(426 | ) | (338 | ) | (764 | ) | 2,534 | 674 | 3,208 | |||||||||||||||
|
Employee contributions |
— | 4 | 4 | 5 | 4 | 9 | ||||||||||||||||||
|
Employer contributions |
283 | 187 | 470 | 665 | 199 | 864 | ||||||||||||||||||
|
Divestments |
— | (1 | ) | (1 | ) | — | — | — | ||||||||||||||||
|
Settlements |
— | (311 | ) | (311 | ) | — | (8 | ) | (8 | ) | ||||||||||||||
|
Benefits paid |
(704 | ) | (407 | ) | (1,111 | ) | (699 | ) | (445 | ) | (1,144 | ) | ||||||||||||
|
Exchange rate differences |
— | (306 | ) | (306 | ) | — | 540 | 540 | ||||||||||||||||
|
|
|
|||||||||||||||||||||||
|
Balance as of December 31 |
14,843 | 6,728 | 21,571 | 17,847 | 8,016 | 25,863 | ||||||||||||||||||
|
Funded status |
549 | (1,183 | ) | (634 | ) | 231 | (1,449 | ) | (1,218 | ) | ||||||||||||||
|
Unrecognized net assets |
(555 | ) | (428 | ) | (983 | ) | (238 | ) | (554 | ) | (792 | ) | ||||||||||||
|
|
|
|||||||||||||||||||||||
|
Net balance sheet position |
(6 | ) | (1,611 | ) | (1,617 | ) | (7 | ) | (2,003 | ) | (2,010 | ) | ||||||||||||
|
|
|
|||||||||||||||||||||||
The classification of the net balance is as follows:
Philips Group
Net balance of defined-benefit pension plans in millions of EUR
2013 - 2014
|
|
|
|||||||||||||||||||||||
|
2013 |
2014 | |||||||||||||||||||||||
|
|
|
|||||||||||||||||||||||
| Netherlands | other | total | Netherlands | other | total | |||||||||||||||||||
|
|
|
|||||||||||||||||||||||
|
Prepaid pension costs under other non-current assets |
— | 5 | 5 | — | 2 | 2 | ||||||||||||||||||
|
Accrued pension costs under other liabilities |
— | (817 | ) | (817 | ) | — | (1,072 | ) | (1,072 | ) | ||||||||||||||
|
Provision for pensions under provisions |
(6 | ) | (799 | ) | (805 | ) | (7 | ) | (926 | ) | (933 | ) | ||||||||||||
|
Provision in assets held for sale |
— | (7 | ) | (7 | ) | |||||||||||||||||||
|
|
|
|||||||||||||||||||||||
|
Net balance of defined-benefit plans |
(6 | ) | (1,611 | ) | (1,617 | ) | (7 | ) | (2,003 | ) | (2,010 | ) | ||||||||||||
|
|
|
|||||||||||||||||||||||
Annual Report 2014 179
Table of Contents
Group financial statements 12.9
Philips Group
Changes in the effect of the asset ceiling in millions of EUR
2013 - 2014
|
|
|
|||||||||||||||||||||||
|
2013 |
2014 | |||||||||||||||||||||||
|
|
|
|||||||||||||||||||||||
| Netherlands | other | total | Netherlands | other | total | |||||||||||||||||||
|
|
|
|||||||||||||||||||||||
|
Balance as of January 1 |
777 | 586 | 1,363 | 555 | 428 | 983 | ||||||||||||||||||
|
Interest on unrecognized assets |
25 | 31 | 56 | 19 | 28 | 47 | ||||||||||||||||||
|
Remeasurements |
(247 | ) | (155 | ) | (402 | ) | (336 | ) | 73 | (263 | ) | |||||||||||||
|
Exchange rate differences |
— | (34 | ) | (34 | ) | — | 25 | 25 | ||||||||||||||||
|
|
|
|||||||||||||||||||||||
|
Balance as of December 31 |
555 | 428 | 983 | 238 | 554 | 792 | ||||||||||||||||||
|
|
|
|||||||||||||||||||||||
Plan assets allocation
The asset allocation in the Company’s pension plans at December 31 was as follows:
Philips Group
Plan assets allocation in millions of EUR
2013 - 2014
|
|
|
|||||||||||||||
| 2013 | 2014 | |||||||||||||||
|
|
|
|||||||||||||||
| Netherlands | other | Netherlands | other | |||||||||||||
|
|
|
|||||||||||||||
|
Matching portfolio: |
||||||||||||||||
|
- Debt securities |
11,238 | 4,282 | 10,663 | 5,051 | ||||||||||||
|
- Other |
— | 508 | — | 1,299 | ||||||||||||
|
Return portfolio: |
||||||||||||||||
|
- Equity securities |
2,524 | 910 | 5,088 | 388 | ||||||||||||
|
- Real estate |
790 | 9 | 1,784 | 13 | ||||||||||||
|
- Other |
291 | 1,019 | 312 | 1,265 | ||||||||||||
|
|
|
|||||||||||||||
|
Total assets |
14,843 | 6,728 | 17,847 | 8,016 | ||||||||||||
|
|
|
|||||||||||||||
Asset values related to buy-in contracts are now included in the Matching portfolio under Other.
The assets in 2014 contain 17% (2013: 14%) unquoted assets, the increase compared to 2013 mainly related to the new buy-in value in the UK plan. Plan assets in 2014 do not include property occupied by or financial instruments issued by the Company.
Assumptions
The mortality tables used for the Company’s major schemes are:
| • |
Netherlands: Prognosis table 2014 including experience rating TW2014. |
| • |
UK: SAPS 2002- Core CMI 2011 projection |
| • |
US: RP2014 HA/EE Fully Generational scaled with MP2014 |
The weighted averages of the assumptions used to calculate the defined-benefit obligations as of December 31 were as follows:
Philips Group
Assumptions used for defined-benefit obligations in %
2013 - 2014
|
|
|
|||||||||||||||
| 2013 | 2014 | |||||||||||||||
|
|
|
|||||||||||||||
| Netherlands | other | Netherlands | other | |||||||||||||
|
|
|
|||||||||||||||
|
Discount rate |
3.4 | % | 4.5 | % | 2.1 | % | 3.7 | % | ||||||||
|
Rate of compensation increase 1) |
2.0 | % | 3.2 | % | 2.0 | % | 3.0 | % | ||||||||
|
|
|
|||||||||||||||
| 1) |
The rate of compensation increase for the Netherlands consists of a general 2% compensation increase and an individual salary increase based on merit, seniority and promotion. The Company regularly determines new turnover and disability rates and individual salary rates for all active participants. Current figures are based on the period 2010-2012. The individual increase at the average age of 45 is 1.75% (2013: 1.75%). The indexation assumption used to calculate the defined-benefit obligations for the Netherlands is 1.0% (2013: 1.0%). |
Due to the nature of the pension plan in the Netherlands an assumption is required for the future pension accrual rate. If the fixed premium does not cover the cost of the target accrual of 1,85% per annum a lower percentage must be applied for which the cost will be covered by the fixed premium. The Fund in the Netherlands has set aside part of the EUR 600 million received for active members accrual or indexation. The accrual rate for the next 5 years starting 2015 is expected to be 1,85%. Per 31 December 2014 the average future accrual rate used to calculate the defined-benefit obligation and service cost is fixed at 1,74% (2013: 1,85%) as after the five year period a lower percentage will apply assuming the current fixed premium level.
The (average) duration of the defined-benefit obligation of the pension plans is 17 years for the Netherlands (2013: 15 years) and 12 years for other countries (2013: 11 years).
180 Annual Report 2014
Table of Contents
Group financial statements 12.9
Defined-benefit plans: retiree medical plans
Movements in the net liability for retiree medical plans:
Philips Group
Liability for retiree medical plans in millions of EUR
2013 - 2014
|
|
|
|||||||
| 2013 | 2014 | |||||||
|
|
|
|||||||
|
Balance as of January 1 |
250 | 213 | ||||||
|
Service cost |
1 | 2 | ||||||
|
Interest cost |
10 | 11 | ||||||
|
Actuarial (gains) or losses arising from: |
||||||||
|
– Demographic assumptions |
— | 3 | ||||||
|
– Financial assumptions |
(17 | ) | 9 | |||||
|
– Experience adjustment |
— | (3 | ) | |||||
|
Past service cost |
— | — | ||||||
|
Benefits paid |
(15 | ) | (15 | ) | ||||
|
Exchange rate differences |
(16 | ) | 21 | |||||
|
|
|
|||||||
|
Balance as of December 31 |
213 | 241 | ||||||
|
Present value of funded obligations as of December 31 |
— | — | ||||||
|
Present value of unfunded obligations as of December 31 |
213 | 241 | ||||||
|
Funded status |
(213 | ) | (241 | ) | ||||
|
|
|
|||||||
|
Net balances |
(213 | ) | (241 | ) | ||||
|
Classification of the net balance is as follows: |
||||||||
|
Provision for other postretirement benefits |
(213 | ) | (241 | ) | ||||
|
|
|
|||||||
The weighted average assumptions used to calculate the defined-benefit obligations for retiree medical plans as of December 31 were as follows:
Philips Group
Weighted average assumptions for retiree medical plans in %
2013 - 2014
|
|
|
|||||||
| 2013 | 2014 | |||||||
|
|
|
|||||||
|
Discount rate |
4.8 | % | 5.0 | % | ||||
|
Compensation increase (where applicable) |
0.0 | % | 0.0 | % | ||||
|
|
|
|||||||
Assumed healthcare cost trend rates at December 31:
Philips Group
Assumed healthcare cost trend rates in %
2013 - 2014
|
|
|
|||||||
| 2013 | 2014 | |||||||
|
|
|
|||||||
|
Healthcare cost trend rate assumed for next year |
7.5 | % | 7.0 | % | ||||
|
Rate that the cost trend rate will gradually reach |
5.2 | % | 5.3 | % | ||||
|
Year of reaching the rate at which it is assumed to remain |
2019 | 2024 | ||||||
|
|
|
|||||||
The average duration of the define-benefit obligation of the retiree medical plans is 8 years (2013: 9 years).
Investment policy in our largest pension plans
It must be acknowledged that trustees of the Philips pension plans are responsible for and have full discretion over the investment strategy of the plan assets.
The objective of the investment strategy of the Philips pension Plan in the Netherlands, is to achieve its agreed ambition, i.e. an indexed retirement income for all participants. The fund’s indexation policy is dependent on the funding ratio and requires a sustainable (regulatory required) basis before allowing any indexation. To meet its ambitions, the fund has strategically allocated 60% of its assets to fixed income and 40% to return assets. Within fixed income circa 90% is invested in so called liability-driven assets (euro and global government bonds, investment grade credits, interest rate and inflation swaps and mortgages) and the remaining part in high yield bonds and emerging market debt. The return assets mainly consist of global equities and real estate.
The Philips pension plan in the UK operates a fixed income portfolio that aims to fully hedge the interest rate and inflation rate sensitivities of the fair value of the plan’s pension liabilities. Some 30% of the portfolio is now invested in a buy-in policy, in which an insurance company guarantees all future benefit payments to the plan, thereby matching the investment and longevity risks of the pension liabilities covered in the buy-in policy.
The plan assets of the Philips pension plan in the US are invested in a well diversified portfolio. The interest rate sensitivity of the fixed income portfolio is closely aligned to that of the plan’s pension liabilities. Any contributions from the sponsoring company are used to further increase the fixed income part of the assets. As part of the investment strategy, any additional investment returns of the return portfolio are used to further decrease the interest rate mismatch between the plan assets and the pension liabilities.
Cash flows and costs in 2015
The Company expects considerable cash outflows in relation to post-employment benefits which are estimated to amount to EUR 1,032 million in 2015, consisting of:
| • |
EUR 819 million employer contributions to defined benefit pension plans |
| • |
EUR 140 million employer contributions to defined contribution pension plans |
| • |
EUR 54 million expected cash outflows in relation to unfunded pension plans and |
| • |
EUR 19 million in relation to unfunded retiree medical plans. |
The employer contributions to defined benefit pension plans are expected to amount to EUR 196 million for the Netherlands and EUR 623 million for other countries. The Company continues to fund a part of the existing deficit in the US pension plan in 2015. For the funding of the deficit in the US plan the Group adheres to the minimum funding requirements of the US Pension Protection Act and in 2015 plans to contribute an additional EUR 300 million which amount is included in the amounts aforementioned. The UK plan is currently in a surplus on a regulatory basis and does not require any funding in 2015 other than the agreed administration cost. A new regulatory valuation is scheduled to be performed for the UK Fund during 2015.
Annual Report 2014 181
Table of Contents
Group financial statements 12.9

The funding of the pension fund in the Netherlands for 2015 consists of a fixed percentage of payroll which applies for a period of 5 years i.e. 2014-2018. The remaining part of the EUR 600 million additional contribution to the pension fund for the Netherlands for 2015 is not included in the above figures and is estimated at EUR 167 million excluding interest.
The service and administration cost for 2015 is expected to amount to EUR 332 million, consisting of EUR 331 million for defined-benefit pension plans and EUR 1 million for defined-benefit retiree medical plans. The net interest expense for 2015 is expected to amount to EUR 59 million, consisting of EUR 48 million for defined-benefit pension plans and EUR 11 million for defined-benefit retiree medical plans. The cost for defined-contribution pension plans in 2015 is expected to amount to EUR 140 million.
Sensitivity analysis
The table below illustrates the approximate impact on the defined-benefit obligation (DBO) if the Company were to change key assumptions. The DBO was recalculated using a change in the assumptions of 1% which overall is considered a reasonably possible change. The impact on the DBO because of changes in discount rate is normally accompanied by offsetting movements in plan assets, especially when using matching strategies.
Key assumptions in millions of EUR
2014
|
|
|
|||||||||||
| Defined benefit obligation | ||||||||||||
| Pension | Pension | Retiree | ||||||||||
| Netherlands | other | medical | ||||||||||
|
|
|
|||||||||||
| Increase | ||||||||||||
|
Discount rate (1% movement) |
(2,309 | ) | (1,056 | ) | (18 | ) | ||||||
|
Wage change (1% movement) |
107 | 31 | — | |||||||||
|
Inflation (1% movement) |
1,341 | 555 | — | |||||||||
|
Longevity (see explanation) |
492 | 267 | 7 | |||||||||
|
Medical benefit level (1% price increase) |
— | — | 14 | |||||||||
| Decrease | ||||||||||||
|
Discount rate (1% movement) |
2,998 | 1,250 | 19 | |||||||||
|
Wage change (1% movement) |
(132 | ) | (28 | ) | — | |||||||
|
Inflation (1% movement) |
(1,185 | ) | (486 | ) | — | |||||||
|
|
|
|||||||||||
Key assumptions in millions of EUR
2013
|
|
|
|||||||||||
| Defined benefit obligation | ||||||||||||
| Pension | Pension | Retiree | ||||||||||
| Netherlands | other | medical | ||||||||||
|
|
|
|||||||||||
| Increase | ||||||||||||
|
Discount rate (1% movement) |
(1,708 | ) | (822 | ) | (12 | ) | ||||||
|
Wage change (1% movement) |
165 | 28 | — | |||||||||
|
Inflation (1% movement) |
979 | 461 | — | |||||||||
|
Longevity (see explanation) |
355 | 232 | 7 | |||||||||
|
Medical benefit level (1% price increase) |
— | — | 12 | |||||||||
| Decrease | ||||||||||||
|
Discount rate (1% movement) |
2,158 | 962 | 16 | |||||||||
|
Wage change (1% movement) |
(147 | ) | (26 | ) | — | |||||||
|
Inflation (1% movement) |
(876 | ) | (418 | ) | — | |||||||
|
|
|
|||||||||||
Longevity also impacts post-employment defined-benefit obligation. The above sensitivity table illustrates the impact on the defined-benefit obligation of a further 10% decrease in the assumed rates of mortality for the Company’s major schemes. A 10% decrease in assumed mortality rates equals improvement of life expectancy by 0.5 - 1 year.
Changes in assumed health care cost trend rates can have a significant effect on the amounts reported for the retiree medical plans. A 1%-point increase in medical benefit level is therefore included in the above table as a likely scenario.
Accrued liabilities are summarized as follows:
Philips Group
Accrued liabilities in millions of EUR
2013 - 2014
|
|
|
|||||||
| 2013 | 2014 | |||||||
|
|
|
|||||||
|
Personnel-related costs: |
||||||||
|
- Salaries and wages |
560 | 502 | ||||||
|
- Accrued holiday entitlements |
184 | 179 | ||||||
|
- Other personnel-related costs |
130 | 119 | ||||||
|
Fixed-asset-related costs: |
||||||||
|
- Gas, water, electricity, rent and other |
61 | 47 | ||||||
|
Communication and IT costs |
38 | 51 | ||||||
|
Distribution costs |
104 | 112 | ||||||
|
Sales-related costs: |
||||||||
|
- Commission payable |
24 | 17 | ||||||
|
- Advertising and marketing-related costs |
159 | 161 | ||||||
|
- Other sales-related costs |
98 | 68 | ||||||
|
Material-related costs |
175 | 132 | ||||||
|
Interest-related accruals |
57 | 56 | ||||||
|
Deferred income |
812 | 869 | ||||||
|
Other accrued liabilities |
428 | 379 | ||||||
|
|
|
|||||||
|
Accrued liabilities |
2,830 | 2,692 | ||||||
|
|
|
|||||||
182 Annual Report 2014
Table of Contents
 Group financial statements 12.9
Other non-current liabilities
Other non-current liabilities are summarized as follows:
Philips Group
Other non-current liabilities in millions of EUR
2013 - 2014
|
|
|
|||||||
| 2013 | 2014 | |||||||
|
|
|
|||||||
|
Accrued pension costs |
813 | 1,061 | ||||||
|
Deferred income |
214 | 176 | ||||||
|
Other tax liability |
444 | 499 | ||||||
|
Other liabilities |
97 | 102 | ||||||
|
|
|
|||||||
|
Other non-current liabilities |
1,568 | 1,838 | ||||||
|
|
|
|||||||
The increase in the accrued pension costs is mainly attributable to the US defined benefit plan. See also note 20, Post-employment benefits.
For further details on tax related liabilities refer to note 8, Income taxes.
Other current liabilities
Other current liabilities are summarized as follows:
Philips Group
Other current liabilities in millions of EUR
2013 - 2014
|
|
|
|||||||
| 2013 | 2014 | |||||||
|
|
|
|||||||
|
Accrued customer rebates that cannot be offset with accounts receivables for those customers |
530 | 535 | ||||||
|
Advances received from customers on orders not covered by work in process |
240 | 312 | ||||||
|
Other taxes including social security premiums |
193 | 176 | ||||||
|
Other liabilities |
119 | 368 | ||||||
|
|
|
|||||||
|
Other current liabilities |
1,082 | 1,391 | ||||||
|
|
|
|||||||
The increase of the balance of other liabilities as per December 31, 2014 mainly relates to certain parts of the Cathode Ray Tube antitrust litigation as mentioned in note 26, Contingent assets and liabilities for which the Company was able to reach a settlement. It includes utilization of provisions previously recognized.
Cash used for derivatives and current financial assets
A total of EUR 13 million cash was paid with respect to foreign exchange derivative contracts related to financing activities (2013: EUR 93 million outflow; 2012: EUR 47 million outflow).
A total of EUR 6 million was received with respect to current financial assets (2013: EUR 8 million outflow; 2012: EUR 2 million inflow).
Purchase and proceeds from non-current financial assets
In 2014, the net cash inflow of EUR 26 million was mainly due to the sale of stakes in Neusoft, Chimei Innolux, and Sapiens, offset by loans provided to TPV Technology Limited.
In 2013, there were no significant cash flows resulting from investing activities.
In 2012, the cash outflow was mainly due to loans provided to TPV Technology Limited and TP Vision venture in connection with the divestment of the Television business (EUR 151 million in aggregate).
Philips Group
Contractual cash obligations 1) in millions of EUR
2014
|
|
|
|||||||||||||||||||
| payments due by period | ||||||||||||||||||||
| total |
less than 1 year |
1-3 years | 3-5 years | after 5 years | ||||||||||||||||
|
|
|
|||||||||||||||||||
|
Long-term debt 2) |
3,665 | 94 | 6 | 1,030 | 2,535 | |||||||||||||||
|
Finance lease obligations |
232 | 61 | 80 | 37 | 54 | |||||||||||||||
|
Short-term debt |
244 | 244 | — | — | — | |||||||||||||||
|
Operating lease obligations |
986 | 236 | 293 | 159 | 298 | |||||||||||||||
|
Derivative liabilities |
860 | 353 | 166 | 253 | 88 | |||||||||||||||
|
Interest on debt 3) |
2,617 | 198 | 387 | 299 | 1,733 | |||||||||||||||
|
Purchase obligations 4) |
131 | 70 | 51 | 10 | — | |||||||||||||||
|
Trade and other payables |
2,499 | 2,499 | — | — | — | |||||||||||||||
|
|
|
|||||||||||||||||||
|
Contractual cash obligations |
11,234 | 3,755 | 983 | 1,788 | 4,708 | |||||||||||||||
|
|
|
|||||||||||||||||||
| 1) |
Obligations in this table are undiscounted |
| 2) |
Long-term debt includes short-term portion of long-term debt and excludes finance lease obligations |
| 3) |
Approximately 15% of the debt bears interest at a floating rate. Majority of the interest payments on variable interest rate loans in the table above reflect market forward interest rates at the period end and these amounts may change as market interest rate changes |
| 4) |
Philips has commitments related to the ordinary course of business which in general relate to contracts and purchase order commitments for less than 12 months. In the table, only the commitments for multiple years are presented, including their short-term portion |
The Company entered into contracts with several venture capitalists where it committed itself to make, under certain conditions, capital contributions to investment funds for an aggregated remaining amount of EUR 35 million (2013: EUR 40 million) until June 30, 2021. As at December 31, 2014 capital contributions already made to these investment funds are recorded as available-for-sale financial assets within Other non-current financial assets.
The operating lease obligations are mainly related to the rental of buildings. A number of these leases originate from sale-and-leaseback arrangements. Operating lease payments under sale-and-leaseback arrangements for 2014 totaled EUR 42 million (2013: EUR 42 million).
Annual Report 2014 183
Table of Contents
Group financial statements 12.9

The remaining minimum payments under sale-and-leaseback arrangements included in operating lease obligations above are as follows:
Philips Group
Operating lease - minimum payments under sale-and-leaseback arrangements in millions of EUR
2014
|
2015 |
36 | |||
|
2016 |
36 | |||
|
2017 |
35 | |||
|
2018 |
33 | |||
|
2019 |
33 | |||
|
Thereafter |
142 | |||
|
|
|
Finance lease liabilities
Philips Group
Finance lease liabilities in millions of EUR
2013 - 2014
| 2013 | 2014 | |||||||||||||||||||||||
|
future
mum
ments |
interest |
present
mum
ments |
future
mum
ments |
interest |
present
mum
ments |
|||||||||||||||||||
|
Less than one year |
61 | 7 | 54 | 61 | 7 | 54 | ||||||||||||||||||
|
Between one and five years |
112 | 20 | 92 | 117 | 19 | 98 | ||||||||||||||||||
|
More than five years |
68 | 15 | 53 | 54 | 11 | 43 | ||||||||||||||||||
|
|
|
|||||||||||||||||||||||
|
Finance lease |
241 | 42 | 199 | 232 | 37 | 195 | ||||||||||||||||||
|
|
|
|||||||||||||||||||||||
C
ontingent assets and liabilities
Contingent assets
Zoll
In June 2010, Philips filed a patent infringement lawsuit against Zoll Medical Corporation claiming that its defibrillator related patents were infringed by Zoll’s Automatic External Defibrillator (AED) products. Zoll filed a countersuit claiming patent infringement by Philips’ Advanced Life Support (ALS) products and a method for testing defibrillator electrodes.
In December 2013, the liability phase of the Zoll lawsuit was tried before a jury in the United States District Court for the District Massachusetts. Philips and Zoll were both held to infringe each other’s patents. Philips expects that it will result in a net difference in favor of Philips. The Zoll liability judgment is now pending before the United States Court of Appeals for the Federal Circuit (CAFC). Resolution of the amount ultimately owed to Philips in the Zoll lawsuit is contingent upon both the CAFC affirming the December 2013 jury decision on liability (expected in the second half of 2015) and the subsequent damages trial (expected to take place during the first half of 2016).
Suframa
In 1996, CIEM (Labor Union of Manaus) representing, amongst other companies Philips Brazil, filed a fiscal claim against Manaus Free Trade Zone Superintendence (SUFRAMA), in order to obtain a judicial declaration of the illegality and unconstitutionality of the Public Price tax, charged by SUFRAMA. The Lower Court ruled favorable for Philips. In September 2007, Philips requested the Settlement of Declaratory Judgment, in order to refund the amounts unduly paid to SUFRAMA during 1992 to 1999. In August 2011, a ruling was issued to approve Philips credit for the amount of EUR 36 million. The estimated amount as of year-end 2014 is EUR 43 million, the increase explained by interest.
In 2014 an agreement was made with an external investor under which agreement Philips received upfront EUR 14 million in cash and has the right to receive (“upward potential”) future amounts depending on a favorable outcome of the case and the timeline in which this outcome is reached (EUR 5 million – EUR 1.7 million). In case Philips will lose the case there is no requirement to repay the upfront amount (no recourse basis).
Contingent liabilities
Guarantees
Philips’ policy is to provide guarantees and other letters of support only in writing. Philips does not stand by other forms of support. At the end of 2014, the total fair value of guarantees recognized on the balance sheet amounted to less than EUR 1 million (December 31, 2013: less than EUR 1 million). Remaining off-balance-sheet business and credit-related guarantees provided on behalf of third parties and associates decreased by EUR 13 million during 2014 to EUR 21 million. Off-balance-sheet guarantees for year end 2013 were restated from EUR 333 million to EUR 34 million to reflect guarantees related to associates and third-party only.
Environmental remediation
The Company and its subsidiaries are subject to environmental laws and regulations. Under these laws, the Company and/or its subsidiaries may be required to remediate the effects of certain chemicals on the environment.
Legal proceedings
The Company and certain of its group companies and former group companies are involved as a party in legal proceedings, regulatory and other governmental proceedings, including discussions on potential remedial actions, relating to such matters as competition issues, commercial transactions, product liability, participations and environmental pollution.
184 Annual Report 2014
Table of Contents
Group financial statements 12.9
Since the ultimate disposition of asserted claims and proceedings and investigations cannot be predicted with certainty, an adverse outcome could have a material adverse effect on the Company’s consolidated financial position, results of operations and cash flows.
Provided below are disclosures of the more significant cases:
Cathode-Ray Tubes (CRT)
On November 21, 2007, the Company announced that competition law authorities in several jurisdictions had commenced investigations into possible anticompetitive activities in the Cathode-Ray Tubes, or CRT industry. On December 5, 2012, the European Commission issued a decision imposing fines on (former) CRT manufacturers including the Company. The European Commission imposed a fine of EUR 313 million on the Company and a fine of EUR 392 million jointly and severally on the Company and LG Electronics, Inc. In total a payable of EUR 509 million was recognized in 2012 and the fine was paid in the first quarter of 2013. The Company appealed the decision of the European Commission and in November 2014 the Company presented its defense at a Hearing with the General Court.
United States
Subsequent to the public announcement of these investigations in 2007, certain Philips Group companies were named as defendants in class action antitrust complaints by direct and indirect purchasers of CRTs filed in various federal district courts in the United States. These actions allege anticompetitive conduct by manufacturers of CRTs and seek treble damages on a joint and several liability basis under federal antitrust law, as well as various state antitrust and unfair competition laws. These actions have been consolidated for pretrial proceedings in the United States District Court for the Northern District of California. In addition, sixteen individual plaintiffs, principally large retailers of CRT products who opted-out of the direct purchaser class, filed separate complaints against the Company and other defendants based on the same substantive allegations as the putative class plaintiff complaints. These cases also are consolidated for pre-trial purposes with the putative class actions in the Northern District of California.
In 2012 a settlement agreement was approved between the Company and counsel for direct purchaser plaintiffs fully resolving all claims of the direct purchaser class. Also, the Company recently reached a settlement with the indirect purchaser class, subject to court approval, that would fully resolve all claims of the indirect purchaser class and release all claims of the indirect purchaser class. The Company reached in the past year settlements with a number of the individual plaintiffs resolving all claims by those retailers on a global basis. The settlements reached to date represent the majority of CRT sales attributed to the Company by the individual plaintiffs. Several of the remaining individual plaintiff cases are scheduled for trial in 2015, with the remainder expected to be transferred back to their original venues for further proceedings. Trial dates in these other cases have not yet been set.
In addition, the state attorneys general of California, Florida, Illinois, Oregon and Washington filed actions against Philips and other defendants seeking to recover damages on behalf of the states and, acting as parens patriae , their consumers. In 2012 the Florida complaint was withdrawn. In 2013 a settlement agreement was reached with the state attorney general of California that has been approved subject to review by the California Court of Appeal. The actions brought by the state attorneys general of Illinois, Oregon and Washington are pending in the respective state courts of the plaintiffs. The Oregon Attorney General action has been set for trial in July 2016. Trial dates for the Washington and Illinois actions have not been set and there is no timetable for resolution of these cases.
Canada
In 2007, certain Philips Group companies were also been named as defendants, in proposed class proceedings in Ontario, Quebec and British Columbia, Canada, along with numerous other participants in the industry. After years of inactivity, in 2014, plaintiffs in the Ontario action initiated the class certification proceedings with class certification hearings scheduled for late April 2015.
Other civil claims related to CRT
In 2014, the Company was named as a defendant in a consumer class action lawsuit filed in Israel in which damages are claimed against several defendants based on alleged anticompetitive activities in the CRT industry. In addition, an electronics manufacturer filed a claim against the Company and several co-defendants with a court in the Netherlands, also seeking compensation for the alleged damage sustained as a result from the alleged anticompetitive activities in the CRT industry. The Company has received indications that more civil claims may be filed in other jurisdictions in due course.
Except for what has been provided or accrued for as disclosed in note 19, Provisions and note 21, Accrued liabilities, the Company has concluded that due to the considerable uncertainty associated with certain of these matters, on the basis of current knowledge, potential losses cannot be reliably estimated with respect to these matters. These investigations and litigation could have a materially adverse effect on the Company’s consolidated financial position, results of operations and cash flows.
Annual Report 2014 185
Table of Contents
Group financial statements 12.9
Optical Disc Drive (ODD)
On October 27, 2009, the Antitrust Division of the United States Department of Justice confirmed that it had initiated an investigation into possible anticompetitive practices in the Optical Disc Drive (ODD) industry. Philips Lite-On Digital Solutions Corp. (PLDS), a joint venture owned by the Company and Lite-On IT Corporation, as an ODD market participant, is included in this investigation. PLDS and the Company have been accepted under the Corporate Leniency program of the US Department of Justice and have continued to cooperate with the authorities in these investigations. On this basis, the Company expects to be immune from governmental fines.
In July 2012, the European Commission issued a Statement of Objections addressed to (former) ODD suppliers including the Company and PLDS. The European Commission granted the Company and PLDS immunity from fines, conditional upon the Company’s continued cooperation. The Company responded to the Statement of Objections both in writing and at an oral hearing. The Company and PLDS are also subject to similar investigations outside the US and Europe relating to the ODD market. Where relevant, they are cooperating with the authorities.
Subsequent to the public announcement of these investigations in 2009, the Company, PLDS and Philips & Lite-On Digital Solutions USA, Inc. (PLDS USA), among other industry participants, were named as defendants in numerous class action antitrust complaints filed in various federal district courts in the United States. These actions allege anticompetitive conduct by manufacturers of ODDs and seek treble damages on behalf of direct and indirect purchasers of ODDs and products incorporating ODDs. These complaints assert claims under federal antitrust law, as well as various state antitrust and unfair competition laws and may involve joint and several liability among the named defendants. These actions have been consolidated for pre-trial proceedings in the United States District Court for the Northern District of California. The plaintiffs’ applications for certification of both the direct and indirect purchaser classes were denied on October 3, 2014. The representatives of these putative classes tried appealing the denial of class certification to the United States Court of Appeals for the Ninth Circuit. However, the Ninth Circuit declined this request to appeal.
In addition, various individual entities have filed separate actions against the Company, PLDS, PLDS USA and other defendants. The allegations contained in these individual complaints are substantially identical to the allegations in the direct purchaser class complaints. All of these matters have been consolidated into the action in the Northern District of California for pre-trial purposes and discovery is being coordinated. The Company intends to vigorously defend all of the civil actions in the US courts.
Also, in June 2013, the State of Florida filed a separate complaint in the Northern District of California against the Company, PLDS, PLDS USA and other defendants containing largely the same allegations as the class and individual complaints. Florida seeks to recover damages sustained in its capacity as a buyer of ODDs and, in its parens patriae capacity, on behalf of its citizens. The defendants’ motion to dismiss has been denied and Philips filed an answer to the complaint. This case has been joined with the ODD class action cases in the Northern District of California for pre-trial purposes.
The Company and certain Philips Group companies have also been named as defendants, in proposed class proceedings in Ontario, Quebec, British Columbia, Manitoba and Saskatchewan, Canada along with numerous other participants in the industry. These complaints assert claims against various ODD manufacturers under federal competition laws as well as tort laws and may involve joint and several liability among the named defendants. Philips intends to vigorously defend these lawsuits. Plaintiffs in the British Columbia case have proceeded with their application to certify that proceeding as a class action. The hearing was held in January 2015 and the Court’s decision is pending.
Due to the considerable uncertainty associated with these matters, on the basis of current knowledge, the Company has concluded that potential losses cannot be reliably estimated with respect to these matters. These matters could have a materially adverse effect on the Company’s consolidated financial position, results of operations and cash flows.
Consumer Electronics products and small Domestic Appliances
Several companies, amongst which the Company, are involved in an investigation by the European Commission into alleged restrictions of online sales of consumer electronic products and small domestic appliances. This investigation commenced in December 2013 when Philips was one of the companies that was inspected by officials of the European Commission. Philips is fully cooperating with the European Commission.
Due to the considerable uncertainty associated with this matter, on the basis of current knowledge, the Company has concluded that potential losses cannot be reliably estimated with respect to these matters. This investigation could have a materially adverse effect on the Company’s consolidated financial position, results of operations and cash flows.
Masimo
On October 1, 2014 a jury awarded USD 467 million (EUR 366M) to Masimo Corporation (Masimo) in the patent infringement lawsuit by Masimo in the United States District Court for the District of Delaware against Philips.
186 Annual Report 2014
Table of Contents

 Group financial statements 12.9
The decision by the jury is part of extensive litigation, which started in 2009, between Masimo and Philips involving several claims and counterclaims related to a large number of patents in the field of pulse oximetry. The lawsuit filed by Masimo alleges that certain Philips products infringe certain Masimo patents. In response to these claims, Philips filed its answer and counterclaims alleging infringement of a number of Philips’ patents and violation of US antitrust laws and patent misuse by Masimo. The Court has decided to handle the litigation in several phases, the first phase of which was tried in September 2014. The October 2014 decision by the jury is associated with this first phase of the litigation. Philips intends to pursue all avenues of appeal of this verdict at both the District and Appellate courts in the US.
Due to the considerable uncertainty associated with the next phases of this litigation, including the impact of the appeals thereon, the Company has concluded that, on the basis of current knowledge, potential losses cannot be reliably estimated with respect to the remaining phases of the litigation. The outcome of the litigation could have a materially adverse effect on the company’s consolidated financial position, results of operations and cash flows.
In the normal course of business, Philips purchases and sells goods and services from/to various related parties in which Philips typically holds a 50% or less equity interest and has significant influence. These transactions are generally conducted with terms comparable to transactions with third parties.
Philips Group
Related-party transactions in millions of EUR
2012 - 2014
|
|
|
|||||||||||
| 2012 | 2013 | 2014 | ||||||||||
|
|
|
|||||||||||
|
Sales of goods and services |
288 | 305 | 215 | |||||||||
|
Purchases of goods and services |
130 | 143 | 85 | |||||||||
|
Receivables from related parties |
13 | 39 | 14 | |||||||||
|
Payables to related parties |
4 | 4 | 4 | |||||||||
|
|
|
|||||||||||
Non-recourse financing of third-party receivables provided by an associate amounted to EUR 103 million in 2014 (2013: EUR 84 million; 2012: EUR 52 million).
In light of the composition of the Executive Committee, the Company considers the members of the Executive Committee and the Supervisory board to be the key management personnel as defined in IAS 24 ‘Related parties’.
For remuneration details of the Executive Committee, the Board of Management and the Supervisory Board see note 29, Information on remuneration.
For employee benefit plans see note 20, Post-employment benefits.
The purpose of the share-based compensation plans is to align the interests of management with those of shareholders by providing incentives to improve the Company’s performance on a long-term basis, thereby increasing shareholder value.
The Company has the following plans:
| • |
performance shares: rights to receive common shares in the future based on performance and service conditions; |
| • |
restricted shares: rights to receive common shares in the future based on a service condition; |
| • |
Options on its common shares, including the 2012 and 2013 Accelerate! grant. |
Since 2013 the Board of Management and other members of the Executive Committee, executives and certain selected employees are granted performance shares. Restricted shares are granted only to new employees or certain selected employees. Prior to 2013 restricted shares and options were granted to members of the Board of Management and other members of the Executive Committee, executives and certain selected employees.
Furthermore, as part of the Accelerate! program, the Company has granted options (Accelerate! options) and restricted shares (Accelerate! shares). These Accelerate! options and shares were granted to a group of approximately 500 key employees below the level of Board of Management in January 2012 and to the Board of Management in January 2013. On January 28, 2014 the Supervisory Board resolved that all performance targets under the Accelerate! program, which were based on the 2013 mid-term financial targets have been met. Accelerate! shares fully vested at December 31, 2013.
Share-based compensation costs were EUR 85 million (2013: EUR 104 million, 2012: EUR 80 million). The amount recognized as an expense is adjusted for forfeiture. USD-denominated performance shares, restricted shares and options are granted to employees in the United States only.
Performance shares
The performance is measured over a three-year performance period. The performance shares have two performance conditions, relative Total Shareholders’ Return compared to a peer group of 21 companies and adjusted Earnings Per Share growth. The performance shares vest three years after the grant date. The number of performance shares that will vest is dependent on achieving the two performance conditions, which are equally weighted, and provided that the grantee is still employed with the Company.
Annual Report 2014 187
Table of Contents
Group financial statements 12.9
The amount recognized as an expense is adjusted for actual performance of adjusted Earnings Per Share growth since this is a non-market performance condition. It is not adjusted for non-vesting or extra vesting of performance shares due to a relative Total Shareholders’ Return performance that differs from the performance anticipated at the grant date, since this is a market-based performance condition.
The fair value of the performance shares is measured based on Monte-Carlo simulation, which takes into account dividend payments between the grant date and the vesting date by including reinvested dividends, the market conditions expected to impact relative Total Shareholders’ Return performance in relation to selected peers, and the following weighted-average assumptions:
Philips Group
Assumptions used in Monte-Carlo simulation for valuation in %
2014
|
|
|
|||
| 2014 | ||||
|
|
|
|||
| EUR-denominated | ||||
|
Risk-free interest rate |
0.35 | % | ||
|
Expected dividend yield |
3.9 | % | ||
|
Expected share price volatility |
25 | % | ||
| USD-denominated | ||||
|
Risk-free interest rate |
0.35 | % | ||
|
Expected dividend yield |
3.9 | % | ||
|
Expected share price volatility |
27 | % | ||
|
|
|
|||
The assumptions were used for these calculations only and do not necessarily represent an indication of Management’s expectation of future developments for other purposes. The Company has based its volatility assumptions on historical experience measured over a ten-year period.
A summary of the status of the Company’s performance share plans as of December 31, 2014 and changes during the year are presented below:
Philips Group
Performance share plans
2014
|
|
|
|||||||
| shares 1) |
weighted
average grant-date fair value |
|||||||
|
|
|
|||||||
| EUR-denominated | ||||||||
|
Outstanding at January 1, 2014 |
3,442,923 | 23.53 | ||||||
|
Granted |
3,405,781 | 22.36 | ||||||
|
Forfeited |
544,702 | 23.29 | ||||||
|
|
|
|||||||
|
Outstanding at December 31, 2014 |
6,304,002 | 22.92 | ||||||
| USD-denominated | ||||||||
|
Outstanding at January 1, 2014 |
2,298,226 | 30.77 | ||||||
|
Granted |
2,264,889 | 30.10 | ||||||
|
Forfeited |
362,215 | 30.42 | ||||||
|
|
|
|||||||
|
Outstanding at December 31, 2014 |
4,200,900 | 30.44 | ||||||
|
|
|
|||||||
| 1) |
Excludes dividend declared between grant date and vesting date (EUR-denominated: 332,757 and USD-denominated: 238,833) |
At December 31, 2014, a total of EUR 173 million of unrecognized compensation costs relate to non-vested performance shares. These costs are expected to be recognized over a weighted-average period of 2.0 years.
Restricted shares
The fair value of restricted shares is equal to the share price at grant date less the present value, using the risk-free interest rate, of estimated future dividends which will not be received up to the vesting date.
The Company issues restricted shares that, in general, vest in equal annual installments over a three-year period, starting one year after the date of grant. For grants up to and including January 2013 the Company granted 20% additional (premium) shares, provided the grantee still holds the shares after three years from the delivery date and the grantee is still with the Company on the respective delivery dates.
A summary of the status of the Company’s restricted shares as of December 31, 2014 and changes during the year are presented below:
Philips Group
Restricted shares
2014
|
|
|
|||||||
| shares 1) |
weighted
average grant-date fair value |
|||||||
|
|
|
|||||||
| EUR-denominated | ||||||||
|
Outstanding at January 1, 2014 |
1,065,169 | 15.31 | ||||||
|
Granted |
169,800 | 21.93 | ||||||
|
Vested/Issued |
657,566 | 16.19 | ||||||
|
Forfeited |
51,941 | 14.66 | ||||||
|
|
|
|||||||
|
Outstanding at December 31, 2014 |
525,462 | 16.44 | ||||||
| USD-denominated | ||||||||
|
Outstanding at January 1, 2014 |
1,140,246 | 20.33 | ||||||
|
Granted |
173,906 | 29.99 | ||||||
|
Vested/Issued |
642,209 | 21.27 | ||||||
|
Forfeited |
71,264 | 25.47 | ||||||
|
|
|
|||||||
|
Outstanding at December 31, 2014 |
600,679 | 21.51 | ||||||
|
|
|
|||||||
| 1) |
Excludes 20% additional (premium) shares that may be received if shares delivered under the restricted share rights plan are not sold for a three-year period |
At December 31, 2014, a total of EUR 12 million of unrecognized compensation costs relate to non-vested restricted shares. These costs are expected to be recognized over a weighted-average period of 1.5 years.
Option plans
The Company granted options that expire after 10 years. These options vest after 3 years, provided that the grantee is still employed with the Company. A limited number of options granted to certain employees of acquired business may contain accelerated vesting. As of December 31, 2014 there are no non-vested options which contain non-market performance conditions.
188 Annual Report 2014
Table of Contents
Group financial statements 12.9
The following tables summarize information about the Company’s options as of December 31, 2014 and changes during the year:
Philips Group
Options on EUR-denominated listed share
2014
|
|
|
|||||||
| options |
weighted average
exercise price |
|||||||
|
|
|
|||||||
|
Outstanding at January 1, 2014 |
18,657,828 | 21.63 | ||||||
|
Exercised |
2,436,583 | 21.03 | ||||||
|
Forfeited |
908,220 | 22.33 | ||||||
|
Expired |
236,071 | 24.13 | ||||||
|
|
|
|||||||
|
Outstanding at December 31, 2014 |
15,076,954 | 21.65 | ||||||
|
|
|
|||||||
|
Exercisable at December 31, 2014 |
11,763,646 | 23.54 | ||||||
|
|
|
|||||||
The exercise prices range from EUR 12.63 to EUR 32.04. The weighted average remaining contractual term for options outstanding and options exercisable at December 31, 2014, was 4.6 years and 3.8 years, respectively. The aggregate intrinsic value of the options outstanding and options exercisable at December 31, 2014, was EUR 57 million and EUR 26 million, respectively.
The total intrinsic value of options exercised during 2014 was EUR 11 million (2013: EUR 15 million, 2012: EUR 3 million).
Philips Group
Options on USD-denominated listed share
2014
|
|
|
|||||||
| options |
weighted average
exercise price |
|||||||
|
|
|
|||||||
|
Outstanding at January 1, 2014 |
13,449,570 | 29.74 | ||||||
|
Exercised |
1,271,182 | 28.00 | ||||||
|
Forfeited |
675,761 | 31.37 | ||||||
|
Expired |
140,791 | 28.79 | ||||||
|
|
|
|||||||
|
Outstanding at December 31, 2014 |
11,361,836 | 29.84 | ||||||
|
|
|
|||||||
|
Exercisable at December 31, 2014 |
8,724,979 | 32.93 | ||||||
|
|
|
|||||||
The exercise prices range from USD 16.76 to USD 44.15. The weighted average remaining contractual term for options outstanding and options exercisable at December 31, 2014, was 4.6 years and 3.8 years, respectively. The aggregate intrinsic value of the options outstanding and options exercisable at December 31, 2014, was USD 34 million and USD 10 million, respectively.
The total intrinsic value of options exercised during 2014 was USD 9 million (2013: USD 17 million, 2012: USD 4 million).
At December 31, 2014, a total of EUR 2 million of unrecognized compensation costs relate to non-vested EUR and USD denominated options. These costs are expected to be recognized over a weighted-average period of 0.3 years. Cash received from exercises under the Company’s option plans amounted to EUR 77 million in 2014 (2013: EUR 84 million, 2012: EUR 19 million. The actual tax deductions realized as a result of option exercises totaled approximately EUR 3 million in 2014 (2013: EUR 5 million, 2012: EUR 1 million).
The outstanding options as of December 31, 2014 are categorized in exercise price ranges as follows:
Philips Group
Outstanding options
2014
|
|
|
|||||||||||
|
exercise price |
options |
intrinsic
value in millions |
weighted average
remaining contractual term |
|||||||||
|
|
|
|||||||||||
|
EUR-denominated |
||||||||||||
|
10-15 |
4,259,713 | 42 | 6.6 yrs | |||||||||
|
15-20 |
777,934 | 4 | 1.7 yrs | |||||||||
|
20-25 |
6,413,918 | 11 | 5.2 yrs | |||||||||
|
25-30 |
1,502,505 | — | 1.3 yrs | |||||||||
|
30-35 |
2,122,884 | — | 2.3 yrs | |||||||||
|
|
|
|||||||||||
|
Outstanding options |
15,076,954 | 57 | 4.6 yrs | |||||||||
|
USD-denominated |
||||||||||||
|
15-20 |
3,025,421 | 30 | 6.7 yrs | |||||||||
|
20-25 |
297,375 | 2 | 7.0 yrs | |||||||||
|
25-30 |
2,359,334 | 2 | 5.2 yrs | |||||||||
|
30-35 |
2,478,397 | — | 3.7 yrs | |||||||||
|
35-40 |
1,627,434 | — | 3.2 yrs | |||||||||
|
40-55 |
1,573,875 | — | 2.3 yrs | |||||||||
|
|
|
|||||||||||
|
Outstanding options |
11,361,836 | 34 | 4.6 yrs | |||||||||
|
|
|
|||||||||||
The aggregate intrinsic value in the tables and text above represents the total pre-tax intrinsic value (the difference between the Company’s closing share price on the last trading day of 2014 and the exercise price, multiplied by the number of in-the-money options) that would have been received by the option holders if the options had been exercised on December 31, 2014.
The following table summarizes information about the Company’s Accelerate! options as of December 31, 2014 and changes during the year:
Philips Group
Accelerate! options
2014
|
|
|
|||||||
| options |
weighted average
exercise price |
|||||||
|
|
|
|||||||
|
EUR-denominated |
||||||||
|
Outstanding at January 1, 2014 |
2,854,000 | 15.62 | ||||||
|
Exercised |
1,048,117 | 15.24 | ||||||
|
Forfeited |
37,083 | 15.24 | ||||||
|
|
|
|||||||
|
Outstanding at December 31, 2014 |
1,768,800 | 15.86 | ||||||
|
|
|
|||||||
|
Exercisable at December 31, 2014 |
1,616,800 | 15.24 | ||||||
|
USD-denominated |
||||||||
|
Outstanding at January 1, 2014 |
795,000 | 20.02 | ||||||
|
Exercised |
336,200 | 20.02 | ||||||
|
|
|
|||||||
|
Outstanding at December 31, 2014 |
458,800 | 20.02 | ||||||
|
|
|
|||||||
|
Exercisable at December 31, 2014 |
458,800 | 20.02 | ||||||
|
|
|
|||||||
Annual Report 2014 189
Table of Contents
Group financial statements 12.9

The exercise prices of the Accelerate! options are EUR 15.24 and EUR 22.43 for EUR-denominated options and is USD 20.02 for USD-denominated options. The weighted average remaining contractual term for EUR-denominated Accelerate! options outstanding and exercisable at December 31, 2014 is 7.2 and 7.1 years, respectively. The weighted average remaining contractual term for USD-Accelerate! options outstanding and exercisable at December 31, 2014 is 7.1 years. The aggregate intrinsic value of the EUR-denominated Accelerate! options outstanding and exercisable at December 31, 2014, was EUR 15 million and EUR 14 million, respectively. The aggregate intrinsic value of the USD-denominated Accelerate! options outstanding and exercisable at December 31, 2014, was USD 4 million and USD 4 million, respectively.
Cash received from exercises for EUR-denominated and USD-denominated Accelerate! options amounted to EUR 21 million in 2014. The actual tax deductions realized as a result of Accelerate! options exercises totaled approximately EUR 1 million in 2014.
The total intrinsic value of Accelerate! options exercised during 2014 was EUR 10 million for EUR-denominated options and USD 5 million for USD-denominated options.
Other plans
Employee share purchase plan
Under the terms of employee stock purchase plans established by the Company in various countries, substantially all employees in those countries are eligible to purchase a limited number of Philips shares at discounted prices through payroll withholdings, of which the maximum ranges from 10% to 20% of total salary. Generally, the discount provided to the employees is in the range of 10% to 20%. A total of 1,326,548 shares were bought by employees in 2014 under the plan at an average price of EUR 24.94 (2013: 1,425,048 shares at EUR 21.92; 2012: 1,906,183 shares at EUR 15.69).
Remuneration of the Executive Committee
In 2014, the total remuneration costs relating to the members of the Executive Committee (including the members of the Board of Management) amounted to EUR 16,878,909 (2013: EUR 24,773,537, 2012: EUR 18,585,112) consisting of the elements in the table below.
Philips Group
Remuneration costs of the Executive Committee in EUR
2012 - 2014
|
|
|
|||||||||||
| 2012 | 2013 | 2014 | ||||||||||
|
|
|
|||||||||||
|
Salary |
5,640,090 | 6,011,557 | 6,513,027 | |||||||||
|
Annual incentive 1) |
4,839,949 | 4,422,732 | 1,526,658 | |||||||||
|
Performance shares 2) |
1,049,205 | 6,478,554 | 3,357,142 | |||||||||
|
Stock options 2) |
1,194,444 | 2,020,040 | 583,755 | |||||||||
|
Restricted share rights 2) |
1,566,448 | 1,115,504 | 409,809 | |||||||||
|
Pension costs |
2,054,516 | 2,277,705 | 2,458,759 | |||||||||
|
Other compensation 3) |
2,240,460 | 2,447,445 | 2,029,759 | |||||||||
|
|
|
|||||||||||
| 1) |
The annual incentives are related to the performance in the year reported which are paid out in the subsequent year |
| 2) |
Costs of performance shares, stock options and restricted share rights are based on accounting standards (IFRS) and do not reflect the value of stock options at the end of the lock up period and the value of performance shares and restricted share rights at the vesting/release date. Costs for the Accelerate! Grant are included in 2012 and 2013 |
| 3) |
The stated amounts mainly concern (share of) allowances to members of the Executive Committee that can be considered as remuneration. In a situation where such a share of an allowance can be considered as (indirect) remuneration (for example, private use of the company car), then the share is both valued and accounted for here. The method employed by the fiscal authorities in the Netherlands is the starting point for the value stated. In 2012 and 2013 a crisis levy tax has been imposed by the Dutch government, amounting in total to EUR 1,245,944 for 2013 and to EUR 702,940 for 2012. These amounts are included in the amounts stated under Other compensation. |
At December 31, 2014, the members of the Executive Committee (including the members of the Board of Management) held 1,050,080 (2013: 1,479,498, 2012: 1,376,913) stock options at a weighted average exercise price of EUR 18.53 (2013: EUR 18.69, 2012: EUR 18.23).
Remuneration of the Board of Management
In 2014, the total remuneration costs relating to the members of the Board of Management amounted to EUR 6,635,334 (2013: EUR 10,928,951, 2012: EUR 7,301,335).
At December 31, 2014, the members of the Board of Management held 586,500 stock options (2013: 586,500; 2012: 454,500) at a weighted average exercise price of EUR 19.60 (2013: EUR 19.60; 2012: EUR 18.78).
190 Annual Report 2014
Table of Contents
Group financial statements 12.9
Philips Group
Remuneration costs of individual members of the Board of Management in EUR
2012 - 2014
|
|
|
|||||||||||||||||||||||||||||||
| salary |
annual
incentive 1) |
performance
shares 2) |
stock
options 2) |
restricted
share rights 2) |
pension costs |
other
compensation 3) |
total costs | |||||||||||||||||||||||||
|
|
|
|||||||||||||||||||||||||||||||
| 2014 | ||||||||||||||||||||||||||||||||
|
F.A. van Houten |
1,137,500 | 349,600 | 860,564 | 101,344 | 76,951 | 485,655 | 86,554 | 3,098,168 | ||||||||||||||||||||||||
|
R.H. Wirahadiraksa |
712,500 | 156,600 | 446,337 | 68,914 | 52,965 | 298,995 | 35,909 | 1,772,220 | ||||||||||||||||||||||||
|
P.A.J. Nota |
643,750 | 258,180 | 406,358 | 68,914 | 57,200 | 267,037 | 63,507 | 1,764,946 | ||||||||||||||||||||||||
|
|
|
|||||||||||||||||||||||||||||||
| 2,493,750 | 764,380 | 1,713,259 | 239,172 | 187,116 | 1,051,687 | 185,970 | 6,635,334 | |||||||||||||||||||||||||
| 2013 4) | ||||||||||||||||||||||||||||||||
|
F.A. van Houten |
1,100,000 | 1,081,520 | 1,594,675 | 461,215 | 190,441 | 468,407 | 75,906 | 4,972,164 | ||||||||||||||||||||||||
|
R.H. Wirahadiraksa |
656,250 | 497,745 | 1,040,393 | 307,699 | 128,856 | 263,451 | 35,732 | 2,930,126 | ||||||||||||||||||||||||
|
P.A.J. Nota |
618,750 | 561,713 | 1,025,153 | 352,608 | 146,626 | 253,605 | 68,206 | 3,026,661 | ||||||||||||||||||||||||
|
|
|
|||||||||||||||||||||||||||||||
| 2,375,000 | 2,140,978 | 3,660,221 | 1,121,522 | 465,923 | 985,463 | 179,844 | 10,928,951 | |||||||||||||||||||||||||
| 2012 4) | ||||||||||||||||||||||||||||||||
|
F.A. van Houten |
1,100,000 | 1,279,520 | — | 209,589 | 315,760 | 422,845 | 47,154 | 3,374,868 | ||||||||||||||||||||||||
|
R.H. Wirahadiraksa |
600,000 | 523,440 | — | 149,067 | 217,020 | 243,438 | 34,961 | 1,767,926 | ||||||||||||||||||||||||
|
P.A.J. Nota |
600,000 | 556,200 | — | 188,029 | 253,836 | 247,883 | 60,754 | 1,906,702 | ||||||||||||||||||||||||
|
S.H. Rusckowski 5) |
233,333 | 178,500 | — | (200,400 | ) | (209,638 | ) | 90,211 | 159,833 | 251,839 | ||||||||||||||||||||||
|
|
|
|||||||||||||||||||||||||||||||
| 2,533,333 | 2,537,660 | — | 346,285 | 576,978 | 1,004,377 | 302,702 | 7,301,335 | |||||||||||||||||||||||||
|
|
|
|||||||||||||||||||||||||||||||
| 1) |
The annual incentives are related to the performance in the year reported which are paid out in the subsequent year. For more details on the annual incentives, see sub-section 10.2.6, Annual Incentive, of this report |
| 2) |
Costs of performance shares, stock options and restricted share rights (including the once-only Accelerate! Grant) are based on accounting standards (IFRS) and do not reflect the value of stock options at the end of the lock up period and the value of performance shares and restricted share rights at the vesting/release date |
| 3) |
The stated amounts mainly concern (share of) allowances to members of the Board of Management that can be considered as remuneration. In a situation where such a share of an allowance can be considered as (indirect) remuneration (for example, private use of the company car), then the share is both valued and accounted for here. The method employed by the fiscal authorities in the Netherlands is the starting point for the value stated. |
| 4) |
A crisis levy of 16% has been imposed by the Dutch government amounting to in total EUR 413,405 for 2012 and EUR 681,596 for 2013. This crisis tax levy was payable by the employer and was charged over income of employees exceeding a EUR 150,000 threshold in 2012 and 2013. These expenses do not form part of the remuneration costs mentioned. |
| 5) |
The amount stated relate to the period January 1 - April 30, 2012. |
For further information on remuneration costs, see sub-section 10.2.4, Remuneration costs, of this report.
The tables below give an overview of the performance share plans, restricted share rights and the stock option plans of the Company, held by the members of the Board of Management:
Philips Group
Number of performance shares (holdings) in number of shares
2014
|
|
|
|||||||||||||||||||||||
|
January 1, 2014 |
awarded 2014 |
awarded
dividend shares 2014 |
realized 2014 |
December 31, 2014 |
vesting date | |||||||||||||||||||
|
|
|
|||||||||||||||||||||||
|
F.A. van Houten |
64,671 | — | 2,232 | — | 66,903 | 05.03.2016 | ||||||||||||||||||
| 55,000 | 1) | — | — | 55,000 | — | 01.28.2014 | ||||||||||||||||||
| — | 59,075 | 2,038 | — | 61,113 | 04.28.2017 | |||||||||||||||||||
|
R.H. Wirahadiraksa |
33,071 | — | 1,141 | — | 34,212 | 05.03.2016 | ||||||||||||||||||
| 38,500 | 1) | — | — | 38,500 | — | 01.28.2014 | ||||||||||||||||||
| — | 31,036 | 1,071 | — | 32,107 | 04.28.2017 | |||||||||||||||||||
|
P.A.J. Nota |
30,621 | — | 1,057 | — | 31,678 | 05.03.2016 | ||||||||||||||||||
| 38,500 | 1) | — | — | 38,500 | — | 01.28.2014 | ||||||||||||||||||
| — | 27,825 | 960 | — | 28,785 | 04.28.2017 | |||||||||||||||||||
|
|
|
|||||||||||||||||||||||
|
Performance shares (holdings ) |
260,363 | 117,936 | 8,499 | 132,000 | 254,798 | |||||||||||||||||||
|
|
|
|||||||||||||||||||||||
| 1) |
Once-only Accelerate! Grant |
Annual Report 2014 191
Table of Contents
Group financial statements 12.9
Philips Group
Number of restricted share rights (holdings) in number of shares
2014
|
|
|
|||||||||||||||||||
|
January 1,
2014 |
awarded
2014 |
released
2014 |
December 31,
2014 |
potential
shares |
||||||||||||||||
|
|
|
|||||||||||||||||||
|
F.A. van Houten |
20,001 | — | 13,334 | 6,667 | 8,684 | |||||||||||||||
|
R.H. Wirahadiraksa |
13,602 | — | 9,068 | 4,534 | 6,206 | |||||||||||||||
|
P.A.J. Nota |
13,602 | — | 9,068 | 4,534 | 6,802 | |||||||||||||||
|
|
|
|||||||||||||||||||
|
Restricted share rights (holdings) |
47,205 | — | 31,470 | 15,735 | 21,692 | |||||||||||||||
|
|
|
|||||||||||||||||||
Philips Group
Stock options (holdings) in number of shares
2014
|
|
|
|||||||||||||||||||||||||||||||
| January 1, 2014 | granted | exercised | expired |
December 31,
2014 |
grant price (in euros) |
share (closing)
price on exercise date |
expiry date | |||||||||||||||||||||||||
|
|
|
|||||||||||||||||||||||||||||||
|
F.A. van Houten |
20,400 | 1) | — | — | — | 20,400 | 22.88 | — | 10.18.2020 | |||||||||||||||||||||||
| 75,000 | — | — | — | 75,000 | 20.90 | — | 04.18.2021 | |||||||||||||||||||||||||
| 75,000 | — | — | — | 75,000 | 14.82 | — | 04.23.2022 | |||||||||||||||||||||||||
| 55,000 | — | — | — | 55,000 | 22.43 | — | 01.29.2023 | |||||||||||||||||||||||||
|
R.H. Wirahadiraksa |
10,800 | 1) | — | — | — | 10,800 | 23.11 | — | 04.14.2018 | |||||||||||||||||||||||
| 12,000 | 1) | — | — | — | 12,000 | 12.63 | — | 04.14.2019 | ||||||||||||||||||||||||
| 16,500 | 1) | — | — | — | 16,500 | 24.90 | — | 04.19.2020 | ||||||||||||||||||||||||
| 51,000 | — | — | — | 51,000 | 20.90 | — | 04.18.2021 | |||||||||||||||||||||||||
| 51,000 | — | — | — | 51,000 | 14.82 | — | 04.23.2022 | |||||||||||||||||||||||||
| 38,500 | — | — | — | 38,500 | 22.43 | — | 01.29.2023 | |||||||||||||||||||||||||
|
P.A.J. Nota |
40,800 | 1) | — | — | — | 40,800 | 22.88 | — | 10.18.2020 | |||||||||||||||||||||||
| 51,000 | — | — | — | 51,000 | 20.90 | — | 04.18.2021 | |||||||||||||||||||||||||
| 51,000 | — | — | — | 51,000 | 14.82 | — | 04.23.2022 | |||||||||||||||||||||||||
| 38,500 | — | — | — | 38,500 | 22.43 | — | 01.29.2023 | |||||||||||||||||||||||||
|
|
|
|||||||||||||||||||||||||||||||
|
Stock options (holdings) |
586,500 | — | — | — | 586,500 | |||||||||||||||||||||||||||
|
|
|
|||||||||||||||||||||||||||||||
| 1) |
Awarded before date of appointment as a member of the Board of Management |
See note 28, Share-based compensation for further information on performance shares, stock options and restricted share rights as well sub-section 10.2.7, Long-Term Incentive Plan, of this report.
The accumulated annual pension entitlements and the pension costs of individual members of the Board of Management are as follows (in EUR):
Philips Group
Accumulated annual pension entitlements and the pension costs in EUR
2014
|
|
|
|||||||||||
|
age at
2014 |
accumulated
annual
2014 1) |
pension costs 2) | ||||||||||
|
|
|
|||||||||||
|
F.A. van Houten |
54 | 233,910 | 485,655 | |||||||||
|
R.H. Wirahadiraksa |
54 | 42,068 | 298,995 | |||||||||
|
P.A.J. Nota |
50 | 32,747 | 267,037 | |||||||||
|
|
|
|||||||||||
|
Pension costs |
1,051,687 | |||||||||||
|
|
|
|||||||||||
| 1) |
Under average pay plan, including - if applicable - transferred pension entitlements under pension scheme(s) of previous employer(s) |
| 2) |
Including costs related to employer contribution in defined-contribution pension plan |
When pension rights are granted to members of the Board of Management, necessary payments (if insured) and all necessary provisions are made in accordance with the applicable accounting principles. In 2014, no (additional) pension benefits were granted to former members of the Board of Management.
Remuneration of the Supervisory Board
The remuneration of the members of the Supervisory Board amounted to EUR 816,668 (2013: EUR 747,000; 2012: EUR 799,500); former members received no remuneration.
At December 31, 2014, the members of the Supervisory Board held no stock options.
The individual members of the Supervisory Board received, by virtue of the positions they held, the following remuneration (in EUR):
192 Annual Report 2014
Table of Contents
 Group financial statements 12.9
Philips Group
Remuneration of the Supervisory Board in EUR
2012 - 2014
|
|
|
|||||||||||||||
| membership | committees |
other
compensation 1) |
total | |||||||||||||
|
|
|
|||||||||||||||
| 2014 2) | ||||||||||||||||
|
J.A. van der Veer |
110,000 | 20,500 | 2,000 | 132,500 | ||||||||||||
|
J.J. Schiro (Jan.-Aug.) |
65,000 | 12,334 | 2,000 | 79,334 | ||||||||||||
|
C. Poon |
65,000 | 14,000 | 17,000 | 96,000 | ||||||||||||
|
C.J.A. van Lede |
65,000 | 10,000 | 2,000 | 77,000 | ||||||||||||
|
E. Kist |
65,000 | 8,000 | 2,000 | 75,000 | ||||||||||||
|
H. von Prondzynski |
65,000 | 15,167 | 2,000 | 82,167 | ||||||||||||
|
J.P. Tai |
65,000 | 15,000 | 23,000 | 103,000 | ||||||||||||
|
N. Dhawan |
65,000 | 10,000 | 23,000 | 98,000 | ||||||||||||
|
O. Gadiesh (May-Dec.) |
65,000 | 6,667 | 2,000 | 73,667 | ||||||||||||
|
|
|
|||||||||||||||
| 630,000 | 111,668 | 75,000 | 816,668 | |||||||||||||
| 2013 2) | ||||||||||||||||
|
J. van der Veer |
110,000 | 20,500 | 5,000 | 135,500 | ||||||||||||
|
J.J. Schiro |
65,000 | 18,500 | 8,000 | 91,500 | ||||||||||||
|
C.J.A. van Lede |
65,000 | 10,000 | 5,000 | 80,000 | ||||||||||||
|
E. Kist |
65,000 | 8,000 | 5,000 | 78,000 | ||||||||||||
|
H. von Prondzynski |
65,000 | 10,000 | 5,000 | 80,000 | ||||||||||||
|
C. Poon |
65,000 | 14,000 | 11,000 | 90,000 | ||||||||||||
|
J.P. Tai |
65,000 | 15,000 | 20,000 | 100,000 | ||||||||||||
|
N. Dhawan |
65,000 | 10,000 | 17,000 | 92,000 | ||||||||||||
|
|
|
|||||||||||||||
| 565,000 | 106,000 | 76,000 | 747,000 | |||||||||||||
| 2012 | ||||||||||||||||
|
J. van der Veer |
110,000 | 20,500 | 5,000 | 135,500 | ||||||||||||
|
J.M. Thompson (Jan. - Apr.) |
32,500 | 4,667 | 11,000 | 48,167 | ||||||||||||
|
C.J.A. van Lede |
65,000 | 10,834 | 5,000 | 80,834 | ||||||||||||
|
E. Kist |
65,000 | 10,333 | 5,000 | 80,333 | ||||||||||||
|
J.J. Schiro |
65,000 | 17,000 | 17,000 | 99,000 | ||||||||||||
|
H. von Prondzynski |
65,000 | 10,000 | 5,000 | 80,000 | ||||||||||||
|
C. Poon |
65,000 | 12,666 | 14,000 | 91,666 | ||||||||||||
|
J.P. Tai |
65,000 | 13,333 | 17,000 | 95,333 | ||||||||||||
|
N. Dhawan (Apr. - Dec.) |
65,000 | 6,667 | 17,000 | 88,667 | ||||||||||||
|
|
|
|||||||||||||||
| 597,500 | 106,000 | 96,000 | 799,500 | |||||||||||||
|
|
|
|||||||||||||||
| 1) |
The amounts mentioned under other compensation relate to the fee for intercontinental travel and the entitlement of EUR 2,000 under the Philips product arrangement |
| 2) |
As of 2013, part of the remuneration of members of the Supervisory Board living in the Netherlands is subject to VAT. The amounts mentioned in this table are excluding VAT. |
Supervisory Board members’ and Board of Management members’ interests in Philips shares
Members of the Supervisory Board and of the Board of Management are not allowed to hold any derivatives of Philips securities.
Philips Group
Shares held by Board members 1) in number of shares
2014
|
|
|
|||||||
|
December 31,
2013 |
December 31,
2014 |
|||||||
|
|
|
|||||||
|
J. van der Veer |
17,192 | 17,784 | ||||||
|
H. von Prondzynski |
3,402 | 3.519 | ||||||
|
J.P. Tai |
2,175 | 3,284 | ||||||
|
F.A. van Houten |
37,258 | 109,570 | ||||||
|
R.H. Wirahadiraksa |
27,879 | 65,780 | ||||||
|
P.A.J. Nota |
24,937 | 59,491 | ||||||
|
|
|
|||||||
| 1) |
Reference date for board membership is December 31, 2014 |
Fair value of financial assets and liabilities
The estimated fair value of financial instruments has been determined by the Company using available market information and appropriate valuation methods. The estimates presented are not necessarily indicative of the amounts that will ultimately be realized by the Company upon maturity or disposal. The use of different market assumptions and/or estimation methods may have a material effect on the estimated fair value amounts.
For cash and cash equivalents, current receivables, accounts payable, interest accrual and short-term debts, the carrying amounts approximate fair value because of the short maturity of these instruments, and therefore fair value information is not included in the table below.
Annual Report 2014 193
Table of Contents
Group financial statements 12.9
The fair value of Philips’ debt is estimated on the basis of the quoted market prices for certain issues, or on the basis of discounted cash flow analysis based upon market rates plus Philips’ spread for the particular tenors of the borrowing arrangement. Accrued interest is not included within the carrying amount or estimated fair value of debt.
Philips Group
Fair value of financial assets and liabilities in millions of EUR
2014
|
|
|
|||||||||||||||
|
Balance as of
December 31, 2013 |
Balance as of
December 31, 2014 |
|||||||||||||||
|
|
|
|||||||||||||||
|
carrying
amount |
estimated
fair value |
carrying
amount |
estimated
fair value |
|||||||||||||
|
|
|
|||||||||||||||
|
Financial assets |
||||||||||||||||
|
Carried at fair value: |
||||||||||||||||
|
Available-for-sale financial assets - non-current |
96 | 96 | 115 | 115 | ||||||||||||
|
Available-for-sale financial assets - current |
10 | 10 | — | — | ||||||||||||
|
Securities classified as assets held for sale |
62 | 62 | 38 | 38 | ||||||||||||
|
Fair value through profit and loss - non-current |
29 | 29 | 24 | 24 | ||||||||||||
|
Derivative financial instruments |
150 | 150 | 207 | 207 | ||||||||||||
|
|
|
|||||||||||||||
|
Financial assets carried at fair value |
347 | 384 | ||||||||||||||
|
Carried at (amortized) cost: |
||||||||||||||||
|
Cash and cash equivalents |
2,465 | 1,873 | ||||||||||||||
|
Loans and receivables: |
||||||||||||||||
|
Loans - current |
125 | 125 | ||||||||||||||
|
Non-current loans and receivables |
143 | 143 | 86 | 86 | ||||||||||||
|
Other non-current loans and receivables |
129 | 140 | ||||||||||||||
|
Loans classified as assets held for sale |
30 | — | ||||||||||||||
|
Receivables - current |
4,678 | 4,723 | ||||||||||||||
|
Receivables - non-current |
144 | 144 | 177 | 177 | ||||||||||||
|
Held-to-maturity investments |
3 | 2 | ||||||||||||||
|
Available-for-sale financial assets |
96 | 95 | ||||||||||||||
|
|
|
|||||||||||||||
|
Financial assets carried at (amortized) costs |
7,688 | 7,221 | ||||||||||||||
|
Financial liabilities |
||||||||||||||||
|
Carried at fair value: |
||||||||||||||||
|
Fair value through profit and loss - non-current |
(13 | ) | (13 | ) | — | — | ||||||||||
|
Derivative financial instruments |
(368 | ) | (368 | ) | (857 | ) | (857 | ) | ||||||||
|
|
|
|||||||||||||||
|
Financial liabilities carried at fair value |
(381 | ) | (857 | ) | ||||||||||||
|
Carried at (amortized) cost: |
||||||||||||||||
|
Accounts payable |
(2,462 | ) | (2,499 | ) | ||||||||||||
|
Interest accrual |
(57 | ) | (56 | ) | ||||||||||||
|
Debt (Corporate bond and finance lease) |
(3,157 | ) | (3,545 | ) | (3,551 | ) | (4,164 | ) | ||||||||
|
Debt (Bank loans, overdrafts etc.) |
(744 | ) | (553 | ) | ||||||||||||
|
|
|
|||||||||||||||
|
Financial liabilities carried at (amortized) costs |
(6,420 | ) | (6,659 | ) | ||||||||||||
|
|
|
|||||||||||||||
194 Annual Report 2014
Table of Contents
Group financial statements 12.9
Philips Group
Fair value hierarchy in millions of EUR
2014
|
|
|
|||||||||||||||
| level 1 | level 2 | level 3 | total | |||||||||||||
|
|
|
|||||||||||||||
|
Balance as of December 31, 2014 |
||||||||||||||||
|
Available-for-sale financial assets - non-current |
51 | 43 | 21 | 115 | ||||||||||||
|
Securities classified as assets held for sale |
1 | — | 37 | 38 | ||||||||||||
|
Financial assets designated at fair value through profit and loss - non-current |
24 | — | — | 24 | ||||||||||||
|
Derivative financial instruments - assets |
— | 207 | — | 207 | ||||||||||||
|
Loans - current |
— | 125 | — | 125 | ||||||||||||
|
Non-current loans and receivables |
— | 86 | — | 86 | ||||||||||||
|
Receivables - non-current |
— | 177 | — | 177 | ||||||||||||
|
|
|
|||||||||||||||
|
Total financial assets |
76 | 638 | 58 | 772 | ||||||||||||
|
Derivative financial instruments - liabilities |
— | (857 | ) | — | (857 | ) | ||||||||||
|
Debt |
(3,969 | ) | (195 | ) | — | (4,164 | ) | |||||||||
|
|
|
|||||||||||||||
|
Total financial liabilities |
(3,969 | ) | (1,052 | ) | — | (5,021 | ) | |||||||||
|
Balance as of December 31, 2013 |
||||||||||||||||
|
Available-for-sale financial assets - non-current |
42 | — | 54 | 96 | ||||||||||||
|
Available-for-sale financial assets - current |
6 | 4 | — | 10 | ||||||||||||
|
Securities classified as assets held for sale |
62 | — | — | 62 | ||||||||||||
|
Financial assets designated at fair value through profit and loss -non-current |
22 | — | 7 | 29 | ||||||||||||
|
Derivative financial instruments - assets |
— | 150 | — | 150 | ||||||||||||
|
Non-current loans and receivables |
— | 143 | — | 143 | ||||||||||||
|
Receivables - non-current |
— | 144 | — | 144 | ||||||||||||
|
|
|
|||||||||||||||
|
Total financial assets |
132 | 441 | 61 | 634 | ||||||||||||
|
Financial liabilities designated at fair value through profit and loss - non-current |
— | — | (13 | ) | (13 | ) | ||||||||||
|
Derivative financial instruments - liabilities |
— | (368 | ) | — | (368 | ) | ||||||||||
|
Debt |
(3,345 | ) | (200 | ) | — | (3,545 | ) | |||||||||
|
|
|
|||||||||||||||
|
Total financial liabilities |
(3,345 | ) | (568 | ) | (13 | ) | (3,926 | ) | ||||||||
|
|
|
|||||||||||||||
The table above represents categorization of measurement of the estimated fair values of financial assets and liabilities.
Specific valuation techniques used to value financial instruments include:
Level 1
Instruments included in level 1 are comprised primarily of listed equity investments classified as available-for-sale financial assets, investees and financial assets designated at fair value through profit and loss.
The fair value of financial instruments traded in active markets is based on quoted market prices at the balance sheet date. A market is regarded as active if quoted prices are readily and regularly available from an exchange, dealer, broker, industry group, pricing service, or regulatory agency, and those prices represent actual and regularly occurring market transactions on an arm’s length basis.
Level 2
The fair value of financial instruments that are not traded in an active market (for example, over-the-counter derivatives or convertible bond instruments) are determined by using valuation techniques. These valuation techniques maximize the use of observable market data where it is available and rely as little as possible on entity-specific estimates. If all significant inputs required to fair value an instrument are based on observable market data, the instrument is included in level 2.
The fair value of derivatives is calculated as the present value of the estimated future cash flows based on observable interest yield curves, basis spread and foreign exchange rates.
The valuation of convertible bond instruments uses observable market quoted data for the options and present value calculations using observable yield curves for the fair value of the bonds.
Level 3
If one or more of the significant inputs are not based on observable market data, the instrument is included in level 3.
The arrangement with the UK Pension Fund in conjunction with the sale of NXP is a financial instrument carried at fair value classified as level 3. In
Annual Report 2014 195
Table of Contents
Group financial statements 12.9

September 2014 the option matured with the changes of fair value of EUR 7 million recorded as financial income and expense.
Deferred consideration and loan extension options to TP Vision were included in level 3 in 2013. In May, 2014 Philips transferred the loans from TP Vision to TPV Technology Limited. As a result, the extension options ceased to exist with the changes of fair value of EUR 13 million recorded in the profit and loss.
The table below shows the reconciliation from the beginning balance to the end balance for fair value measured in Level 3 of the fair value hierarchy.
Philips Group
Reconciliation of the fair value hierarchy in millions of EUR
2014
|
|
|
|||||||
| financial assets | financial liabilities | |||||||
|
|
|
|||||||
|
Balance as of January 1, 2014 |
61 | (13 | ) | |||||
|
Total gains and losses recognized in: |
||||||||
|
- profit or loss |
5 | 13 | ||||||
|
- other comprehensive income |
(8 | ) | — | |||||
|
|
|
|||||||
|
Balance as of December 31, 2014 |
58 | — | ||||||
|
|
|
|||||||
Philips has the following balances related to its derivative activities. These transactions are subject to master netting and set-off agreements. In case of certain termination events, under the terms of the Master Agreement, Philips can terminate the outstanding transactions and aggregate their positive and negative values to arrive at a single net termination sum (or close-out amount). This contractual right is subject to the following:
| • |
The right may be limited by local law if the counterparty is subject to bankruptcy proceedings; |
| • |
The right applies on a bilateral basis. |
Philips Group
Financial assets subject to offsetting, enforceable master netting arrangements or similar agreements in millions of EUR
2013 - 2014
|
|
|
|||||||
| 2013 | 2014 | |||||||
|
|
|
|||||||
|
Derivatives |
||||||||
|
Gross amounts of recognized financial assets |
150 | 207 | ||||||
|
Gross amounts of recognized financial liabilities offset in the balance sheet |
— | — | ||||||
|
|
|
|||||||
|
Net amounts of financial assets presented in the balance sheet |
150 | 207 | ||||||
|
Related amounts not offset in the balance sheet |
||||||||
|
Financial instruments |
(85 | ) | (161 | ) | ||||
|
Cash collateral received |
— | — | ||||||
|
|
|
|||||||
|
Net amount |
65 | 46 | ||||||
|
|
|
|||||||
Philips Group
Financial liabilities subject to offsetting, enforceable master netting arrangements or similar agreements in millions of EUR
2013 - 2014
|
|
|
|||||||
| 2013 | 2014 | |||||||
|
|
|
|||||||
|
Derivatives |
||||||||
|
Gross amounts of recognized financial liabilities |
(368 | ) | (857 | ) | ||||
|
Gross amounts of recognized financial assets offset in the balance sheet |
— | — | ||||||
|
|
|
|||||||
|
Net amounts of financial liabilities presented in the balance sheet |
(368 | ) | (857 | ) | ||||
|
Related amounts not offset in the balance sheet |
||||||||
|
Financial instruments |
85 | 161 | ||||||
|
Cash collateral received |
— | — | ||||||
|
|
|
|||||||
|
Net amount |
(283 | ) | (696 | ) | ||||
|
|
|
|||||||
Details of treasury / other financial risks
Philips is exposed to several types of financial risks. This note further analyzes financial risks. Philips does not purchase or hold derivative financial instruments for speculative purposes. Information regarding financial instruments is included in note 30, Fair value of financial assets and liabilities.
Liquidity risk
Liquidity risk is the risk that an entity will encounter difficulty in meeting obligations associated with financial liabilities.
Liquidity risk for the group is monitored through the Treasury liquidity committee which tracks the development of the actual cash flow position for the group and uses input from a number of sources in order to forecast the overall liquidity position both on a short and long term basis. Group Treasury invests surplus cash in money market deposits with appropriate maturities to ensure sufficient liquidity is available to meet liabilities when due.
The rating of the Company’s debt by major rating services may improve or deteriorate. As a result, Philips’ future borrowing capacity may be influenced and its financing costs may fluctuate. Philips has various sources to mitigate the liquidity risk for the group. At December 31, 2014, Philips had EUR 1,873 million in cash and cash equivalents (2013: EUR 2,465 million), within which short-term deposits of EUR 1,057 million (2013: EUR 1,714 million) and other liquid assets of EUR 121 million (2013: EUR 18 million). Philips pools cash from subsidiaries to the extent legally and economically feasible; cash not pooled remains available for operational or investment needs by the Company.
Furthermore, Philips has a USD 2.5 billion Commercial Paper Program and a EUR 1.8 billion revolving credit facility that can be used for general group purpose and as a backstop for its commercial paper program. In January 2013 the EUR 1.8 billion facility was extended by 2 years until February 18, 2018. The facility has no financial covenants and repetitive material adverse
196 Annual Report 2014
Table of Contents
Group financial statements 12.9
change clauses and can be used for general group purposes. As of December 31, 2014, Philips did not have any amounts outstanding under any of these facilities. Additionally Philips also held EUR 75 million of equity investments in available-for-sale financial assets (fair value at December 31, 2014).
Currency risk
Currency risk is the risk that the fair value or future cash flows of a financial instrument will fluctuate because of changes in foreign exchange rates. Currency fluctuations may impact Philips’ financial results. Philips is exposed to currency risk in the following areas:
| • |
Transaction exposures, related to forecasted sales and purchases and on-balance-sheet receivables/ payables resulting from such transactions |
| • |
Translation exposure of net income in foreign entities |
| • |
Translation exposure of foreign-currency intercompany and external debt and deposits |
| • |
Translation exposure of foreign-currency-denominated equity invested in consolidated companies |
| • |
Translation exposure to equity interests in non-functional-currency investments in associates and available-for-sale financial assets. |
It is Philips’ policy that significant transaction exposures are hedged by the businesses. Accordingly, all businesses are required to identify and measure their exposures resulting from material transactions denominated in currencies other than their own functional currency. Philips’ policy generally requires committed foreign currency exposures to be fully hedged using forwards. Anticipated transactions may be hedged using forwards or options or a combination thereof. The amount hedged as a proportion of the total anticipated exposure identified varies per business and is a function of the ability to project cash flows, the time horizon for the cash flows and the way in which the businesses can adapt to changing levels of foreign-currency exchange rates. As a result, hedging activities cannot and will not eliminate all currency risks for these anticipated transaction exposures. Generally, the maximum tenor of these hedges is 18 months.
The following table outlines the estimated nominal value in millions of euros for transaction exposure and related hedges for Philips’ most significant currency exposures consolidated as of December 31, 2014:
Philips Group
Estimated transaction exposure and related hedges
in millions of euros
2014
| maturity 0-60 days | maturity over 60 days | |||||||||||||||
| exposure | hedges | exposure | hedges | |||||||||||||
|
Balance as of December 31, 2014 |
||||||||||||||||
|
Receivables |
||||||||||||||||
|
Functional vs. exposure currency |
||||||||||||||||
|
EUR vs. USD |
584 | (564 | ) | 1,887 | (1,295 | ) | ||||||||||
|
USD vs. EUR |
161 | (145 | ) | 737 | (378 | ) | ||||||||||
|
EUR vs. GBP |
80 | (63 | ) | 372 | (192 | ) | ||||||||||
|
USD vs. JPY |
37 | (35 | ) | 173 | (106 | ) | ||||||||||
|
EUR vs. JPY |
40 | (39 | ) | 173 | (122 | ) | ||||||||||
|
EUR vs. CNY |
44 | (41 | ) | 107 | (81 | ) | ||||||||||
|
GBP vs. USD |
16 | (16 | ) | 95 | (71 | ) | ||||||||||
|
EUR vs. PLN |
45 | (43 | ) | 82 | (44 | ) | ||||||||||
|
EUR vs. RON |
14 | (11 | ) | 74 | (31 | ) | ||||||||||
|
EUR vs. CHF |
14 | (12 | ) | 68 | (33 | ) | ||||||||||
|
Others |
193 | (176 | ) | 561 | (302 | ) | ||||||||||
|
|
|
|||||||||||||||
|
Total 2014 |
1,228 | (1,145 | ) | 4,329 | (2,655 | ) | ||||||||||
|
Total 2013 |
971 | (874 | ) | 3,691 | (2,239 | ) | ||||||||||
|
Payables |
||||||||||||||||
|
Functional vs. exposure currency |
||||||||||||||||
|
EUR vs. USD |
(281 | ) | 269 | (1,069 | ) | 603 | ||||||||||
|
USD vs. CNY |
(75 | ) | 72 | (141 | ) | 96 | ||||||||||
|
EUR vs. PLN |
(43 | ) | 34 | (38 | ) | 19 | ||||||||||
|
BRL vs. USD |
(33 | ) | 24 | (27 | ) | 14 | ||||||||||
|
EUR vs. GBP |
(32 | ) | 26 | (147 | ) | 76 | ||||||||||
|
USD vs. EUR |
(28 | ) | 18 | (78 | ) | 31 | ||||||||||
|
IDR vs. USD |
(26 | ) | 16 | — | — | |||||||||||
|
INR vs. USD |
(21 | ) | 21 | (18 | ) | 18 | ||||||||||
|
USD vs. SGD |
(13 | ) | 12 | (21 | ) | 17 | ||||||||||
|
USD vs. MYR |
(12 | ) | 12 | (10 | ) | 10 | ||||||||||
|
Others |
(52 | ) | 48 | (112 | ) | 56 | ||||||||||
|
|
|
|||||||||||||||
|
Total 2014 |
(616 | ) | 552 | (1,661 | ) | 940 | ||||||||||
|
Total 2013 |
(457 | ) | 502 | (1,397 | ) | 831 | ||||||||||
|
|
|
|||||||||||||||
The derivatives related to transactions are, for hedge accounting purposes, split into hedges of on-balance-sheet accounts receivable/payable and forecasted sales and purchases. Changes in the value of on-balance-sheet foreign-currency accounts receivable/ payable, as well as the changes in the fair value of the hedges related to these exposures, are reported in the income statement under costs of sales. Hedges related to forecasted transactions, where hedge accounting is applied, are accounted for as cash flow hedges. The results from such hedges are deferred in other comprehensive income within equity to the extent that the hedge is effective. As of December 31, 2014, a loss of EUR 13 million was deferred in equity as a result of these hedges. The result deferred in equity will be released to earnings mostly during 2015 at the time when the related hedged transactions affect the
Annual Report 2014 197
Table of Contents
Group financial statements 12.9
income statement. During 2014, a net gain of EUR 1 million was recorded in the consolidated statement of income as a result of ineffectiveness on certain anticipated cash flow hedges.
The total net fair value of hedges related to transaction exposure as of December 31, 2014 was an unrealized liability of EUR 27 million. An instantaneous 10% increase in the value of the euro against all currencies would lead to an increase of EUR 96 million in the value of the derivatives; including a EUR 73 million increase related to foreign exchange transactions of the US dollar against the euro, a EUR 14 million increase related to foreign exchange transactions of the Japanese yen against euro, a EUR 14 million increase related to foreign exchange transactions of the Pound sterling, partially offset by a EUR 46 million decrease related to foreign exchange transactions of the euro against the US dollar.
The EUR 96 million increase includes a gain of EUR 28 million that would impact the income statement, which would largely offset the opposite revaluation effect on the underlying accounts receivable and payable, and the remaining gain of EUR 68 million would be recognized in equity to the extent that the cash flow hedges were effective.
The total net fair value of hedges related to transaction exposure as of December 31, 2013 was an unrealized asset of EUR 44 million. An instantaneous 10% increase in the value of the euro against all currencies would lead to an increase of EUR 63 million in the value of the derivatives; including a EUR 56 million increase related to foreign exchange transactions of the US dollar against the euro, a EUR 15 million increase related to foreign exchange transactions of the Pound Sterling against euro, a EUR 13 million increase related to foreign exchange transactions of the Japanese yen, partially offset by a EUR 45 million decrease related to foreign exchange transactions of the euro against the US dollar.
Foreign exchange exposure also arises as a result of inter-company loans and deposits. Where the Company enters into such arrangements the financing is generally provided in the functional currency of the subsidiary entity. The currency of the Company’s external funding and liquid assets is matched with the required financing of subsidiaries either directly through external foreign currency loans and deposits, or synthetically by using foreign exchange derivatives, including cross currency interest rate swaps and foreign exchange forward contracts. In certain cases where group companies may also have external foreign currency debt or liquid assets, these exposures are also hedged through the use of foreign exchange derivatives. Changes in the fair value of hedges related to this exposure are either recognized within financial income and expenses in the statements of income, accounted for as cash flow hedges or where such loans would be considered part of the net investment in the subsidiary then net investment hedging would be applied. Translation exposure of foreign-currency equity invested in consolidated entities may be hedged. If a hedge is entered into, it is accounted for as a net investment hedge. Net current period change, before tax, of the currency translation reserve of EUR 600 million relates to the positive impact of the weaker EURO against the foreign currencies of countries in which Philips’ operations are located, partially offset by net investment hedging instruments. The change in currency translation reserve was mostly related to development of the USD and to a lesser extent to other currencies such as the CNY, GBP and INR.
As of December 31, 2014 cross currency interest rate swaps and foreign exchange forward contracts with a fair value liability of EUR 655 million and external bond funding for a nominal value of USD 4,059 million were designated as net investment hedges of our financing investments in foreign operations. During 2014 a total gain of EUR 0.2 million was recognized in the income statement as ineffectiveness on net investment hedges. The total net fair value of these financing derivatives as of December 31, 2014, was a liability of EUR 623 million. An instantaneous 10% increase in the value of the euro against all currencies would lead to an increase of EUR 301 million in the value of the derivatives, including a EUR 323 million increase related to the US dollar.
As of December 31, 2013 cross currency interest rate swaps and foreign exchange forward contracts with a fair value liability of EUR 262 million and external bond funding for a nominal value of USD 4,059 million were designated as net investment hedges of our financing investments in foreign operations. During 2013 a total gain of EUR 2 million was recognized in the income statement as ineffectiveness on net investment hedges. The total net fair value of these financing derivatives as of December 31, 2013, was a liability of EUR 260 million. An instantaneous 10% increase in the value of the euro against all currencies would lead to an increase of EUR 228 million in the value of the derivatives, including a EUR 255 million increase related to the US dollar.
Philips does not currently hedge the foreign exchange exposure arising from equity interests in non-functional-currency investments in associates and available-for-sale financial assets.
Interest rate risk
Interest rate risk is the risk that the fair value or future cash flows of a financial instrument will fluctuate because of changes in market interest rates. Philips had outstanding debt of EUR 4,104 million, which created an inherent interest rate risk. Failure to effectively hedge this risk could negatively impact financial results. At year-end, Philips held EUR 1,873 million in cash and cash equivalents, total long-term debt of EUR 3,712 million and total short-term debt of EUR 392 million. At December 31, 2014, Philips had a ratio of fixed-rate long-term debt to total outstanding debt of approximately 85%, compared to 80% one year earlier.
198 Annual Report 2014
Table of Contents
Group financial statements 12.9
A sensitivity analysis conducted as of January 2015 shows that if long-term interest rates were to decrease instantaneously by 1% from their level of December 31, 2014, with all other variables (including foreign exchange rates) held constant, the fair value of the long-term debt would increase by approximately EUR 342 million. If there was an increase of 1% in long-term interest rates, this would reduce the market value of the long-term debt by approximately EUR 341 million.
If interest rates were to increase instantaneously by 1% from their level of December 31, 2014, with all other variables held constant, the annualized net interest expense would decrease by approximately EUR 13 million. This impact was based on the outstanding net cash position at December 31, 2014.
A sensitivity analysis conducted as of January 2014 shows that if long-term interest rates were to decrease instantaneously by 1% from their level of December 31, 2013, with all other variables (including foreign exchange rates) held constant, the fair value of the long-term debt would increase by approximately EUR 317 million. If there was an increase of 1% in long-term interest rates, this would reduce the market value of the long-term debt by approximately EUR 251 million.
If interest rates were to increase instantaneously by 1% from their level of December 31, 2013, with all other variables held constant, the annualized net interest expense would decrease by approximately EUR 18 million. This impact was based on the outstanding net cash position at December 31, 2013.
Equity price risk
Equity price risk is the risk that the fair value or future cash flows of a financial instrument will fluctuate because of changes in equity prices.
Philips is a shareholder in some publicly listed companies, including TPV Technology Limited. As a result, Philips is exposed to potential financial loss through movements in their share prices. The aggregate equity price exposure in such financial assets amounted to approximately EUR 12 million at year-end 2014 (2013: EUR 71 million). Philips does not hold derivatives in its own stock or in the abovementioned listed companies. Philips is also a shareholder in several privately-owned companies amounting to EUR 117 million. As a result, Philips is exposed to potential value adjustments.
Commodity price risk
Commodity price risk is the risk that the fair value or future cash flows of a financial instrument will fluctuate because of changes in commodity prices.
Philips is a purchaser of certain base metals, precious metals and energy. Philips hedges certain commodity price risks using derivative instruments to minimize significant, unanticipated earnings fluctuations caused by commodity price volatility. The commodity price derivatives that Philips enters into are accounted for as cash flow hedges to offset forecasted purchases. As of December 2014, a loss of EUR 0.7 million was deferred in equity as a result of these hedges. A 10% increase in the market price of all commodities as of December 31, 2014 would increase the fair value of the derivatives by EUR 0.7 million.
As of December 2013, a loss of EUR 2.2 million was deferred in equity as a result of these hedges. A 10% increase in the market price of all commodities as of December 31, 2013 would increase the fair value of the derivatives by EUR 1.4 million.
Credit risk
Credit risk represents the loss that would be recognized at the reporting date, if counterparties failed completely to perform their payment obligations as contracted. Credit risk is present within Philips trade receivables. To have better insights into the credit exposures, Philips performs ongoing evaluations of the financial and non-financial condition of its customers and adjusts credit limits when appropriate. In instances where the creditworthiness of a customer is determined not to be sufficient to grant the credit limit required, there are a number of mitigation tools that can be utilized to close the gap including reducing payment terms, cash on delivery, pre-payments and pledges on assets.
Philips invests available cash and cash equivalents with various financial institutions and is exposed to credit risk with these counterparties. Philips is also exposed to credit risks in the event of non-performance by financial institutions with respect to financial derivative instruments. Philips actively manages concentration risk and on a daily basis measures the potential loss under certain stress scenarios, should a financial institution default. These worst-case scenario losses are monitored and limited by the Company.
The Company does not enter into any financial derivative instruments to protect against default by financial institutions. However, where possible the Company requires all financial institutions with whom it deals in derivative transactions to complete legally enforceable netting agreements under an International Swap Dealers Association master agreement or otherwise prior to trading, and whenever possible, to have a strong credit rating from Standard & Poor’s and Moody’s Investor Services. Philips also regularly monitors the development of the credit risk of its financial counterparties. Wherever possible, cash is invested and financial transactions are concluded with financial institutions with strong credit ratings or with governments or government-backed institutions.
Annual Report 2014 199
Table of Contents
Group financial statements 12.9

Below table shows the credit ratings of the financial institutions with which Philips had short-term deposits above EUR 25 million as of December 31, 2014:
Philips Group
Credit risk with number of counterparties
for deposits above EUR 25 million
2014
|
|
|
|||||||||||
|
25-100
million |
100-500 million |
500-2,000 million |
||||||||||
|
|
|
|||||||||||
|
AA-rated governments |
— | — | — | |||||||||
|
AA-rated government banks |
— | — | — | |||||||||
|
AAA-rated bank counterparties |
— | — | — | |||||||||
|
AA-rated bank counterparties |
2 | 1 | — | |||||||||
|
A-rated bank counterparties |
7 | 3 | — | |||||||||
|
|
|
|||||||||||
| 9 | 4 | — | ||||||||||
|
|
|
|||||||||||
For an overview of the overall maximum credit exposure of the group’s financial assets, please refer to note 30, Fair value of financial assets and liabilities for details of carrying amounts and fair value.
Country risk
Country risk is the risk that political, legal, or economic developments in a single country could adversely impact our performance. The country risk per country is defined as the sum of the equity of all subsidiaries and associated companies in country cross-border transactions, such as intercompany loans, accounts receivable from third parties and intercompany accounts receivable. The country risk is monitored on a regular basis.
As of December 31, 2014, the Company had country risk exposure of EUR 8.5 billion in the United States, EUR 2.6 billion in Belgium and EUR 1.8 billion in China (including Hong Kong). Other countries higher than EUR 500 million are United Kingdom (EUR 709 million) and Japan (EUR 576 million). Countries where the risk exceeded EUR 300 million but was less than EUR 500 million are Germany, Malaysia, Poland and Saudi Arabia. The degree of risk of a country is taken into account when new investments are considered. The Company does not, however, use financial derivative instruments to hedge country risk.
Other insurable risks
Philips is covered for a broad range of losses by global insurance policies in the areas of property damage/ business interruption, general and product liability, transport, directors’ and officers’ liability, employment practice liability, crime, and aviation product liability. The counterparty risk related to the insurance companies participating in the above mentioned global insurance policies are actively managed. As a rule Philips only selects insurance companies with a S&P credit rating of at least A-. Throughout the year the counterparty risk is monitored on a regular basis.
To lower exposures and to avoid potential losses, Philips has a global Risk Engineering program in place. The main focus of this program is on property damage and business interruption risks including company interdependencies. Regular on-site assessments take place at Philips locations and business critical suppliers by risk engineers of the insurer in order to provide an accurate assessment of the potential loss and its impact. The results of these assessments are shared across the Company’s stakeholders. On-site assessments are carried out against the predefined Risk Engineering standards which are agreed between Philips and the insurers. Recommendations are made in a Risk Improvement report and are monitored centrally. This is the basis for decision-making by the local management of the business as to which recommendations will be implemented.
For all policies, deductibles are in place, which vary from EUR 250,000 to EUR 2,500,000 per occurrence and this variance is designed to differentiate between the existing risk categories within Philips. Above this first layer of working deductibles, Philips operates its own re-insurance captive, which during 2014 retained EUR 2.5 million per occurrence for property damage and business interruption losses and EUR 5 million in the aggregate per year. For general and product liability claims, the captive retained EUR 1.5 million per claim and EUR 6 million in the aggregate. New contracts were signed on December 31, 2014, for the coming year, whereby the re-insurance captive retentions remained unchanged.
Acquisition of Volcano
On December 17, 2014, Philips and Volcano Corporation (Volcano) announced that they had entered into a definitive merger agreement. Volcano is a US-based global leader in catheter based imaging and measurement solutions for cardio vascular applications and is very complementary to the Philips vision, strategy, and portfolio in image-guided therapy. On February 17, 2015, Philips completed a tender offer to acquire all of the issued and outstanding shares of Volcano for USD 18.00 per share. The total equity purchase price and the settlement of stock option rights involved an amount of USD 955 million (approximately EUR 840 million) and was paid in cash at closing date. Philips is financing the acquisition through a combination of cash on hand and the issuance of debt. Philips will consolidate 100% of Volcano as of February 17, 2015. Due to the recent closing date, additional IFRS disclosures cannot be made until the initial accounting for the business combination has been completed.
200 Annual Report 2014
Table of Contents
Company financial statements 13
13 Company financial statements
Introduction
Statutory financial statements
The sections Group financial statements and Company financial statements contain the statutory financial statements of Koninklijke Philips N.V. (the Company).
A description of the Company’s activities and group structure is included in the Consolidated Financial Statements.
Accounting policies applied
The financial statements of the Company included in this section are prepared in accordance with Part 9 of Book 2 of the Dutch Civil Code. Section 362 (8), Book 2, Dutch Civil Code, allows companies that apply IFRS as endorsed by the European Union in their consolidated financial statements to use the same measurement principles in their company financial statements. The Company has prepared these Company financial statements using this provision.
The accounting policies are described in note 1, Significant accounting policies.
Investments in group companies are accounted for using the equity method in these Company financial statements.
Presentation of Company financial statements
The structure of the Company balance sheets is aligned with the Consolidated balance sheets in order to achieve optimal transparency between the Group financial statements and the Company financial statements. Consequently, the presentation of the Company balance sheets deviates from Dutch regulations.
The Company balance sheet has been prepared before the appropriation of result.
The Company statement of income has been prepared in accordance with Section 2:402 of the Dutch Civil Code, which allows a simplified Statement of income in the Company financial statements in the event that a comprehensive Statement of income is included in the consolidated Group financial statements.
Additional information
For ‘Additional information’ within the meaning of Section 2:392 of the Dutch Civil Code, please refer to section 13.5, Independent auditor’s report, of this report, and section 5.4, Proposed distribution to shareholders, of this report.
Annual Report 2014 201
Table of Contents
Company financial statements 13.1
13.1 Balance sheets before appropriation of results
Koninklijke Philips N.V.
Balance sheets in millions of EUR unless otherwise stated
As of December 31
|
|
|
|||||||||||||||
| 2013 | 2014 | |||||||||||||||
|
|
|
|||||||||||||||
|
Assets |
||||||||||||||||
|
Non-current assets: |
||||||||||||||||
|
Property, plant and equipment |
18 | 1 | ||||||||||||||
|
|
55 | 57 | ||||||||||||||
|
|
19,535 | 19,676 | ||||||||||||||
|
Non-current receivables |
32 | 46 | ||||||||||||||
|
Deferred tax assets |
161 | 479 | ||||||||||||||
|
|
283 | 229 | ||||||||||||||
|
|
|
|||||||||||||||
|
Total non-current assets |
20,084 | 20,488 | ||||||||||||||
|
Current assets: |
||||||||||||||||
|
|
121 | |||||||||||||||
|
|
7,500 | 8,469 | ||||||||||||||
|
Assets classified as held for sale |
45 | 54 | ||||||||||||||
|
Cash and cash equivalents |
1,282 | 701 | ||||||||||||||
|
|
|
|||||||||||||||
|
Total current assets |
8,827 | 9,345 | ||||||||||||||
|
|
|
|||||||||||||||
|
Total assets |
28,911 | 29,833 | ||||||||||||||
|
Liabilities and shareholders’ equity |
||||||||||||||||
|
|
||||||||||||||||
|
Preference shares, par value EUR 0.20 per share: |
||||||||||||||||
|
- Authorized: 2,000,000,000 shares (2013: 2,000,000,000 shares) |
||||||||||||||||
|
- Issued: none |
||||||||||||||||
|
Common shares, par value EUR 0.20 per share: |
||||||||||||||||
|
- Authorized: 2,000,000,000 shares (2013: 2,000,000,000 shares) |
||||||||||||||||
|
- Issued and fully paid: 934,819,413 shares (2013: 937,845,789 shares) |
188 | 187 | ||||||||||||||
|
Capital in excess of par value |
1,796 | 2,181 | ||||||||||||||
|
Legal reserve: revaluation |
23 | 13 | ||||||||||||||
|
Legal reserve: available-for-sale financial assets |
55 | 27 | ||||||||||||||
|
Legal reserve: cash flow hedges |
24 | (13 | ) | |||||||||||||
|
Legal reserve: affiliated companies |
1,319 | 1,059 | ||||||||||||||
|
Legal reserve: currency translation differences |
(569 | ) | 229 | |||||||||||||
|
Retained earnings |
7,927 | 7,316 | ||||||||||||||
|
|
1,169 | 415 | ||||||||||||||
|
Treasury shares, at cost: 20,430,544 shares (2013: 24,508,022 shares) |
(718 | ) | (547 | ) | ||||||||||||
|
|
|
|||||||||||||||
|
Total equity |
11,214 | 10,867 | ||||||||||||||
|
Non-current liabilities: |
||||||||||||||||
|
|
3,158 | 3,555 | ||||||||||||||
|
Long-term provisions |
16 | 10 | ||||||||||||||
|
Deferred tax liabilities |
15 | 12 | ||||||||||||||
|
Other non-current liabilities |
161 | 119 | ||||||||||||||
|
|
|
|||||||||||||||
|
Total non-current liabilities |
3,350 | 3,696 | ||||||||||||||
|
Current liabilities: |
||||||||||||||||
|
|
13,645 | 14,060 | ||||||||||||||
|
|
702 | 1,210 | ||||||||||||||
|
|
|
|||||||||||||||
|
Total current liabilities |
14,347 | 15,270 | ||||||||||||||
|
|
||||||||||||||||
|
|
|
|||||||||||||||
|
Liabilities and shareholders’ equity |
28,911 | 29,833 | ||||||||||||||
|
|
|
|||||||||||||||
| 1) |
Prepared before appropriation of results |
202 Annual Report 2014
Table of Contents
Company financial statements 13.2
Koninklijke Philips N.V.
Statements of income in millions of EUR unless otherwise stated
For the year ended December 31
|
|
|
|||||||
| 2013 | 2014 | |||||||
|
|
|
|||||||
|
Net income from affiliated companies |
1,276 | (432 | ) | |||||
|
Other net income |
(107 | ) | 847 | |||||
|
|
|
|||||||
|
|
1,169 | 415 | ||||||
|
|
|
|||||||
13.3 Statement of changes in equity
Koninklijke Philips N.V.
Statement of changes in equity in millions of EUR unless otherwise stated
For the year ended December 31
|
|
|
|||||||||||||||||||||||||||||||||||||||||||
|
com-
mon
|
capital
in excess of par value |
revalua-
tion
|
available-
for-sale financial assets |
cash
flow hedges |
affiliated
compa- nies |
currency
translation differences |
retained
earnings |
net
income |
treasury
shares |
share-
holders’
|
||||||||||||||||||||||||||||||||||
| legal reserves | ||||||||||||||||||||||||||||||||||||||||||||
|
Balance as of January 1, 2014 |
188 | 1,796 | 23 | 55 | 24 | 1,319 | (569 | ) | 7,927 | 1,169 | (718 | ) | 11,214 | |||||||||||||||||||||||||||||||
|
Appropriation of prior year result |
1,169 | (1,169 | ) | |||||||||||||||||||||||||||||||||||||||||
|
Net income |
415 | 415 | ||||||||||||||||||||||||||||||||||||||||||
|
Release revaluation reserve |
(10 | ) | 10 | — | ||||||||||||||||||||||||||||||||||||||||
|
Net current period change |
30 | (40 | ) | (260 | ) | 600 | (423 | ) | (93 | ) | ||||||||||||||||||||||||||||||||||
|
Income tax on net current period change |
(4 | ) | 10 | 203 | 209 | |||||||||||||||||||||||||||||||||||||||
|
Reclassification into income |
(54 | ) | (7 | ) | (5 | ) | (66 | ) | ||||||||||||||||||||||||||||||||||||
|
Dividend distributed |
3 | 433 | (729 | ) | (293 | ) | ||||||||||||||||||||||||||||||||||||||
|
Cancellation of treasury shares |
(4 | ) | (529 | ) | 533 | — | ||||||||||||||||||||||||||||||||||||||
|
Purchase of treasury shares |
(26 | ) | (688 | ) | (714 | ) | ||||||||||||||||||||||||||||||||||||||
|
Re-issuance of treasury shares |
(127 | ) | (83 | ) | 326 | 116 | ||||||||||||||||||||||||||||||||||||||
|
Share-based compensation plans |
88 | 88 | ||||||||||||||||||||||||||||||||||||||||||
|
Income tax on share-based compensation plans |
(9 | ) | (9 | ) | ||||||||||||||||||||||||||||||||||||||||
|
|
|
|||||||||||||||||||||||||||||||||||||||||||
|
Balance as of December 31, 2014 |
187 | 2,181 | 13 | 27 | (13 | ) | 1,059 | 229 | 7,316 | 415 | (547 | ) | 10,867 | |||||||||||||||||||||||||||||||
|
|
|
|||||||||||||||||||||||||||||||||||||||||||
Annual Report 2014 203
Table of Contents
Company financial statements 13.4


Notes to the Company financial statements
Net income from affiliated companies represents the share of the company in the results of these affiliated companies.
For a summary of the audit fees, please refer to the Group Financial statements, note 6, Income from operations, which is deemed incorporated and repeated herein by reference.
Intangible assets includes mainly licenses and patents. The changes during 2014 are as follows;
Koninklijke Philips N.V.
Intangible assets in millions of EUR
2014
|
Balance as of January 1, 2014: |
||||
|
Cost |
67 | |||
|
Amortization/impairments |
(12 | ) | ||
|
|
|
|||
|
Book value |
55 | |||
|
Changes in book value: |
||||
|
Additions |
20 | |||
|
Amortization |
(18 | ) | ||
|
|
|
|||
|
Total changes |
2 | |||
|
Balance as of December 31, 2014: |
||||
|
Cost |
87 | |||
|
Amortization/impairments |
(30 | ) | ||
|
|
|
|||
|
Book value |
57 | |||
|
|
|
The investments in group companies and associates are presented as financial fixed assets in the balance sheet using the equity method. Goodwill paid upon acquisition of investments in group companies or associates is included in the net equity value of the investment and is not shown separately on the face of the balance sheet.
Loans provided to group companies are stated at amortized cost, less impairment.
A list of investments in group companies, prepared in accordance with the relevant legal requirements (Dutch Civil Code, Book 2, Sections 379 and 414), is deposited at the Chamber of Commerce in Eindhoven, The Netherlands.
Koninklijke Philips N.V.
Financial fixed assets in millions of EUR
2014
|
|
|
|||||||||||||||
|
investments
in group
|
investments
in associates |
loans | total | |||||||||||||
|
|
|
|||||||||||||||
|
Balance as of January 1, 2014 |
13,591 | 71 | 5,873 | 19,535 | ||||||||||||
|
Changes: |
||||||||||||||||
|
Reclassifications |
35 | (8 | ) | — | 27 | |||||||||||
|
Acquisitions/additions |
2,379 | 6 | 749 | 3,134 | ||||||||||||
|
Sales/redemptions |
(1,107 | ) | — | (348 | ) | (1,455 | ) | |||||||||
|
Net income from affiliated companies |
(485 | ) | 16 | — | (469 | ) | ||||||||||
|
Dividends received |
(1,836 | ) | (19 | ) | — | (1,855 | ) | |||||||||
|
Translation differences |
687 | 7 | 676 | 1,370 | ||||||||||||
|
Transfer to assets classified as held for sale |
— | (7 | ) | — | (7 | ) | ||||||||||
|
Other |
(604 | ) | — | — | (604 | ) | ||||||||||
|
|
|
|||||||||||||||
|
Balance as of December 31, 2014 |
12,660 | 66 | 6,950 | 19,676 | ||||||||||||
|
|
|
|||||||||||||||
During 2014, the increase in acquisitions/additions line is mainly related to the purchase of a group company amounting to EUR 2,165 million. The same group company made a capital repayment of EUR 562 million which is reflected as part of the movement in sales/redemptions and issued an interim dividend of EUR 1,458 million shown in the dividends received line. These transactions were executed in view of our continued effort to restructure and optimize our foreign based intra-group finance activities. The remaining movements in sales/redemptions reflect restructuring in the group.
Included in other, under Investments in Group companies, are remeasurements of EUR 683 million related to defined-benefit plans of group companies.
204 Annual Report 2014
Table of Contents


 Company financial statements 13.4
Other non-current financial assets
The changes during 2014 were as follows:
Koninklijke Philips N.V.
Other non-current financial assets in millions of EUR
2014
|
|
|
|||||||||||||||
|
available-
for-sale financial assets |
loans and
receivables |
financial
assets at fair value through profit and loss |
total | |||||||||||||
|
|
|
|||||||||||||||
|
Balance as of January 1, 2014 |
86 | 190 | 7 | 283 | ||||||||||||
|
Changes: |
||||||||||||||||
|
Reclassifications |
8 | (121 | ) | — | (113 | ) | ||||||||||
|
Acquisitions/additions |
10 | 60 | — | 70 | ||||||||||||
|
Sales/redemptions/reductions |
(12 | ) | — | — | (12 | ) | ||||||||||
|
Impairments |
(4 | ) | — | — | (4 | ) | ||||||||||
|
Transfer to assets classified as held for sale |
(37 | ) | — | — | (37 | ) | ||||||||||
|
Value adjustments |
45 | 4 | (7 | ) | 42 | |||||||||||
|
|
|
|||||||||||||||
|
Balance as of December 31, 2014 |
96 | 133 | — | 229 | ||||||||||||
|
|
|
|||||||||||||||
Available-for-sale financial assets
The Company’s investments in available-for-sale financial assets mainly consist of investments in common stock of companies in various industries. An amount of EUR 37 million has been reclassified to assets held for sale in relation to the contribution agreement between the Philips Pension Fund, Philips and Dutch trade unions on July 1, 2013.
Loans and receivables
The reclassification line includes loans of EUR 121 million transferred to Current financial assets (see below). The acquisitions/additions line relates to a new loan of EUR 60 million issued to TPV Technology Limited.
Financial assets at fair value through profit and loss
In 2010 Philips sold its entire holding of common shares in NXP Semiconductors B.V. (NXP) to Philips Pension Trustees Limited (herein referred to as “UK Pension Fund”). The purchase agreement with the UK Pension Fund included an arrangement that entitled Philips to a cash payment from the UK Pension Fund on or after September 7, 2014, if certain conditions were met. As of December 31, 2013, management’s best estimate of the fair value of the arrangement was EUR 7 million. At the date of expiration on September 7, 2014 the arrangement did not represent any value. The decline in fair value in 2014 is reported under value adjustments in the table above.
Current financial assets
The amount of EUR 121 million relates to loans issued to TPV Technology Limited. These loans are due in 2015 and have therefore been reclassified from non-current to Current financial assets.
Koninklijke Philips N.V.
Receivables in millions of EUR
2013 - 2014
|
|
|
|||||||
| 2013 | 2014 | |||||||
|
|
|
|||||||
|
Trade accounts receivable |
80 | 105 | ||||||
|
Affiliated companies |
7,177 | 7,916 | ||||||
|
Other receivables |
5 | 48 | ||||||
|
Advances and prepaid expenses |
28 | 15 | ||||||
|
Derivative instruments—assets |
210 | 385 | ||||||
|
|
|
|||||||
|
Receivables |
7,500 | 8,469 | ||||||
|
|
|
|||||||
Common shares
As of December 31, 2014, the issued and fully paid share capital consists of 934,819,413 common shares, each share having a par value of EUR 0.20.
In June 2014, Philips settled a dividend of EUR 0.80 per common share, representing a total value of EUR 729 million. Shareholders could elect for a cash dividend or a share dividend. 60% of the shareholders elected for a share dividend, resulting in the issuance of 18,811,534 new common shares. The settlement of the cash dividend resulted in a payment of EUR 293 million including tax and service charges.
The following table shows the movements in the outstanding number of shares:
Koninklijke Philips N.V.
Outstanding number of shares in number of shares
2013 - 2014
|
|
|
|||||||
| 2013 | 2014 | |||||||
|
|
|
|||||||
|
Balance as of January 1 |
914,591,275 | 913,337,767 | ||||||
|
Dividend distributed |
18,491,337 | 18,811,534 | ||||||
|
Purchase of treasury shares |
(27,811,356 | ) | (28,537,921 | ) | ||||
|
Re-issuance of treasury shares |
8,066,511 | 10,777,489 | ||||||
|
|
|
|||||||
|
Balance as of December 31 |
913,337,767 | 914,388,869 | ||||||
|
|
|
|||||||
Preference shares
The ‘Stichting Preferente Aandelen Philips’ has been granted the right to acquire preference shares in the Company. Such right has not been exercised. As a means to protect the Company and its stakeholders against an unsolicited attempt to (de facto) take over control of the Company, the General Meeting of Shareholders in 1989 adopted amendments to the Company’s articles of association that allow the Board of Management and the Supervisory Board to issue (rights to acquire) preference shares to a third-party. As of December 31, 2014, no preference shares have been issued.
Option rights/restricted and performance shares
The Company has granted stock options on its common shares and rights to receive common shares in the future. Please refer to note 28, Share-based compensation, which is deemed incorporated and repeated herein by reference.
Annual Report 2014 205
Table of Contents
Company financial statements 13.4
Treasury shares
In connection with the Company’s share repurchase programs, shares which have been repurchased and are held in treasury for (i) delivery upon exercise of options, performance and restricted share programs and employee share purchase programs, and (ii) capital reduction purposes, are accounted for as a reduction of shareholders’ equity. Treasury shares are recorded at cost, representing the market price on the acquisition date. When issued, shares are removed from treasury shares on a FIFO basis.
When treasury shares are reissued under the Company’s option plans, the difference between the cost and the cash received is recorded in retained earnings. When treasury shares are reissued under the Company’s share plans, the difference between the market price of the shares issued and the cost is recorded in retained earnings.
Dividend withholding tax in connection with the Company’s purchase of treasury shares is recorded in retained earnings.
The following transactions took place resulting from employee option and share plans:
Koninklijke Philips N.V.
Employee option and share plan transactions
2013 - 2014
|
|
|
|||||||
| 2013 | 2014 | |||||||
|
|
|
|||||||
|
Shares acquired |
3,984 | 7,254,606 | ||||||
|
Average market price |
EUR 22.51 | EUR 24.53 | ||||||
|
Amount paid |
EUR 0 million | EUR 178 million | ||||||
|
Shares delivered |
8,066,511 | 10,777,489 | ||||||
|
Average market price |
EUR 28.35 | EUR 30.26 | ||||||
|
Cost of delivered shares |
EUR 229 million | EUR 326 million | ||||||
|
Total shares in treasury at year-end |
20,650,427 | 17,127,544 | ||||||
|
Total cost |
EUR 618 million | EUR 470 million | ||||||
|
|
|
|||||||
In order to reduce share capital, the following transactions took place:
Koninklijke Philips N.V.
Share capital transactions
2013 - 2014
|
|
|
|||||||
| 2013 | 2014 | |||||||
|
|
|
|||||||
|
Shares acquired |
27,807,372 | 21,283,315 | ||||||
|
Average market price |
EUR 22.69 | EUR 23.95 | ||||||
|
Amount paid |
EUR 631 million | EUR 510 million | ||||||
|
Reduction of capital stock (shares) |
37,778,510 | 21,837,910 | ||||||
|
Reduction of capital stock (EUR) |
EUR 787 million | EUR 533 million | ||||||
|
Total shares in treasury at year-end |
3,857,595 | 3,303,000 | ||||||
|
Total cost |
EUR 100 million | EUR 77 million | ||||||
|
|
|
|||||||
Stock purchase transactions related to employee option and share plans, as well as transactions related to the reduction of share capital involved a cash outflow of EUR 712 million, which includes the impact of taxes. Settlements of stock based compensation plans involved a cash inflow of EUR 116 million.
Dividend distribution
A proposal will be submitted to the 2015 Annual General Meeting of Shareholders to pay a dividend of EUR 0.80 per common share, in cash or shares at the option of the shareholder, from the 2014 net income and retained earnings of the Company.
Legal reserves
As of December 31, 2014, legal reserves relate to the revaluation of assets and liabilities of acquired companies in the context of multi-stage acquisitions of EUR 13 million (2013: EUR 23 million), unrealized gains on available-for-sale financial assets of EUR 27 million (2013: EUR 55 million), unrealized losses on cash flow hedges of EUR 13 million (2013: EUR 24 million unrealized gains), ‘affiliated companies’ of EUR 1,059 million (2013: EUR 1,319 million) and unrealized currency translation gains of EUR 229 million (2013: EUR 569 million unrealized losses).
The item ‘affiliated companies’ relates to the ‘wettelijke reserve deelnemingen’, which is required by Dutch law. This reserve relates to any legal or economic restrictions on the ability of affiliated companies to transfer funds to the parent company in the form of dividends.
Limitations in the distribution of shareholders’ equity
Pursuant to Dutch law, limitations exist relating to the distribution of shareholders’ equity of EUR 1,515 million as at December 31, 2014. Such limitations relate to common shares of EUR 187 million, as well as to legal reserves included under ‘revaluation’ of EUR 13 million, available-for-sale financial assets of EUR 27 million, unrealized currency translation gains of EUR 229 million and ‘affiliated companies’ of EUR 1,059 million. The unrealized losses related to cash flow hedges of EUR 13 million, although qualifying as a legal reserve, reduce the distributable amount by their nature.
As at December 31, 2013 the limitations on distributable amounts were EUR 1,609 million and related common shares of EUR 188 million, as well as to legal reserves included under ‘revaluation’ of EUR 23 million, available-for-sale financial assets of EUR 55 million, unrealized gains on cash flow hedges of EUR 24 million and ‘affiliated companies’ of EUR 1,319 million. The unrealized losses related to currency translation differences of EUR 569 million, although qualifying as a legal reserve, reduce the distributable amount by their nature.
206 Annual Report 2014
Table of Contents


 Company financial statements
13.4
Company financial statements
13.4
Long-term debt
Koninklijke Philips N.V.
Long-term debt in millions of EUR, unless otherwise stated
2013 - 2014
|
|
|
|||||||||||||||||||||||||||||||
|
(range of)
interest rates |
average
interest rate |
amount
outstanding in 2014 |
amount due in
1 year |
amount due
year |
amount due
after 5 years |
average
remaining term (in years) |
amount
outstanding 2013 |
|||||||||||||||||||||||||
|
|
|
|||||||||||||||||||||||||||||||
|
USD bonds |
3.8 - 7.8 | % | 5.6 | % | 3,355 | — | 3,355 | 2,333 | 12.7 | 2,958 | ||||||||||||||||||||||
|
Intercompany financing |
0.0 - 4.1 | % | 0.8 | % | 3,025 | 3,025 | — | — | — | 2,296 | ||||||||||||||||||||||
|
Bank borrowings |
1.3 - 1.6 | % | 1.5 | % | 200 | — | 200 | 200 | 7.0 | 450 | ||||||||||||||||||||||
|
Other long-term debt |
2.5 - 7.0 | % | 4.5 | % | 43 | 43 | — | — | 1.0 | 47 | ||||||||||||||||||||||
|
|
|
|||||||||||||||||||||||||||||||
| 6,623 | 3,068 | 3,555 | 2,533 | 5,751 | ||||||||||||||||||||||||||||
|
Corresponding data previous year |
5,751 | 2,593 | 3,158 | 2,259 | 4,153 | |||||||||||||||||||||||||||
|
|
|
|||||||||||||||||||||||||||||||
The following amounts of the long-term debt as of December 31, 2014, are due in the next five years:
Koninklijke Philips N.V.
Long-term debt due in the next five years in millions of EUR
2014
|
2015 |
3,068 | |||
|
2016 |
— | |||
|
2017 |
— | |||
|
2018 |
1,022 | |||
|
2019 |
||||
|
|
|
|||
|
Long-term debt |
4,090 | |||
|
Corresponding amount previous year |
3,492 | |||
|
|
|
Short-term debt
Short-term debt includes the current portion of outstanding external and intercompany long-term debt of EUR 3,068 million (2013: EUR 2,593 million), other debt to group companies totaling EUR 10,929 million (2013: EUR 10,976 million) and short-term bank borrowings of EUR 63 million (2013: EUR 76 million).
Koninklijke Philips N.V.
Other current liabilities in millions of EUR
2013 - 2014
|
|
|
|||||||
| 2013 | 2014 | |||||||
|
|
|
|||||||
|
Income tax payable |
4 | — | ||||||
|
Other short-term liabilities |
53 | 63 | ||||||
|
Accrued expenses |
174 | 138 | ||||||
|
Derivative instruments—liabilities |
471 | 1,009 | ||||||
|
|
|
|||||||
|
Other current liabilities |
702 | 1,210 | ||||||
|
|
|
|||||||
The number of persons employed by the Company at year-end 2014 was 10 (2013: 10) and included the members of the Board of Management and certain leaders from functions, businesses and markets, together referred to as the Executive Committee.
For the remuneration of past and present members of both the Board of Management and the Supervisory Board, please refer to note 29, Information on remuneration, which is deemed incorporated and repeated herein by reference.
Contractual obligations and contingent liabilities not appearing in the balance sheet
The Company has entered into a contract with a venture capitalist where it committed itself to make, under certain conditions, capital contributions to its investment funds to an aggregated amount of EUR 35 million (2013: EUR 40 million) until June 30, 2021. As at December 31, 2014 capital contributions already made to this investment fund are recorded as available-for-sale financial assets within Other non-current financial assets. Furthermore, the Company made commitments to third parties in 2014 of EUR 10 million (2013: EUR 16 million) with respect to sponsoring activities. The amounts are due before 2016.
General guarantees as referred to in Section 403, Book 2, of the Dutch Civil Code, have been given by the Company on behalf of several group companies in the Netherlands. The liabilities of these companies to third parties and investments in associates totaled EUR 1,546 million as of year-end 2014 (2013: EUR 1,255 million).
Guarantees totaling EUR 636 million (2013: EUR 613 million) have also been given on behalf of other group companies and credit guarantees totaling EUR 4 million (2013: EUR 15 million) on behalf of unconsolidated companies and third-parties. The Company is the head of a fiscal unity that contains the most significant Dutch wholly-owned group companies. The Company is therefore jointly and severally liable for the tax liabilities of the tax entity as a whole. For additional information, please refer to note 26, Contingent assets and liabilities, which is deemed incorporated and repeated herein by reference.
Annual Report 2014 207
Table of Contents
Company financial statements 13.4

For subsequent events please refer to the Group Financial Statements, note 32, Subsequent events, which is deemed incorporated and repeated herein by reference.
208 Annual Report 2014
Table of Contents
Company financial statements 13.5
13.5 Independent auditor’s report
To: The Annual General Meeting of Shareholders of Koninklijke Philips N.V.
Report on the audit of the financial statements 2014
Our opinion
We have audited the financial statements 2014 of Koninklijke Philips N.V. (the Company), Eindhoven, the Netherlands. The financial statements include the consolidated and company financial statements.
In our opinion:
| • |
the consolidated financial statements give a true and fair view of the financial position of Koninklijke Philips N.V. as at December 31, 2014 and of its result and its cash flows for 2014 in accordance with International Financial Reporting Standards as adopted by the European Union (EU-IFRS) and with Part 9 of Book 2 of the Dutch Civil Code. |
| • |
The company financial statements give a true and fair view of the financial position of Koninklijke Philips N.V. as at December 31, 2014 and of its result for 2014 in accordance with Part 9 of Book 2 of the Dutch Civil Code. |
The consolidated financial statements comprise:
| 1. | the consolidated balance sheet as at December 31, 2014; |
| 2. | the following statements for 2014: consolidated statements of income, comprehensive income, cash flows and changes in equity for the year then ended; and |
| 3. | the notes comprising a summary of the significant accounting policies and other explanatory information. |
The company financial statements comprise:
| 1. | the company balance sheet as at December 31, 2014; |
| 2. | the company statement of income for 2014; and |
| 3. | the notes comprising a summary of the significant accounting policies and other explanatory information. |
Basis for our opinion
We conducted our audit in accordance with Dutch law, including the Dutch Standards on Auditing. Our responsibilities under those standards are further described in the “Our responsibilities for the audit of the financial statements” section of our report.
We are independent of Koninklijke Philips N.V. in accordance with the “Verordening inzake de onafhankelijkheid van accountants bij assurance- opdrachten” (ViO) and other relevant independence regulations in the Netherlands. Furthermore, we have complied with the “Verordening gedrags- en beroepsregels accountants” (VGBA).
We believe that the audit evidence we have obtained is sufficient and appropriate to provide a basis for our opinion.
Materiality
Misstatements can arise from fraud or errors and are considered material if, individually or in the aggregate, they could reasonably be expected to influence the economic decisions of users taken on the basis of these financial statements. The materiality affects the nature, timing and extent of our audit procedures and the evaluation of the effect of identified misstatements on our opinion.
Based on our professional judgment we determined the materiality for the financial statements as a whole at EUR 80 million. Materiality is based on sales, as we consider this benchmark to be the most relevant given the nature of the business and size of the Company and approximates 0.4% of sales. We have also taken into account misstatements and/or possible misstatements that in our opinion are material for qualitative reasons for the users of the financial statements.
We agreed with the Supervisory Board that misstatements in excess of EUR 4 million, which are identified during the audit, would be reported to them, as well as smaller misstatements that in our view must be reported on qualitative grounds.
Scope of our group audit
Koninklijke Philips N.V. is the parent company of the Philips Group (the Group). The financial information of the Group is included in the financial statements of Koninklijke Philips N.V
Considering our ultimate responsibility for the opinion, we are responsible for directing, supervising and performing the group audit. In this context, we have determined the nature and extent of the audit procedures to be performed for group entities (components). Decisive factors were the significance and / or the risk profile of the components. On this basis, we selected the components for which an audit of account balance or specified procedures had to be performed. Furthermore, we have determined the audit procedures that we perform at group level, sector level and in the Finance Operations centers.
We scope components to be involved with the audits of account balances into the group audit where account balances are of significant size, have significant risks of material misstatement to the Group associated with them or are considered significant for other reasons. Where this does not give adequate coverage we use our judgment to scope-in additional procedures on account balances or request the component auditors to perform specified procedures. As a result of our scoping of account balances and the performance of audit procedures at different levels in the organization, our
Annual Report 2014 209
Table of Contents
Company financial statements 13.5
actual coverage varies per account balance and the depth of our audit procedures per account balance varies depending on our risk assessment.
Accordingly, our audit coverage per account balance included in the key audit matters stated below, can be summarized as follows:
| • |
For goodwill, we have applied a centralized audit approach with specified audit procedures on 90% of the goodwill account balance and limited procedures on the remaining of the goodwill account balance. |
| • |
For income taxes, we have identified 10 entities in the group for which we performed an audit of account balances and/or specified procedures at the component level. These 10 entities represent 90% of the income tax accounts deferred tax assets and income tax provisions. The remaining population is covered by limited procedures performed centrally by the group auditor. |
| • |
For revenue recognition, we have identified 31 entities in the group for which we performed an audit of account balances and/or specified procedures at the component level. These 31 entities represent 58% of sales. This scope is extended by specified procedures on sales performed centrally, representing an additional 17% of sales resulting in a coverage of 75% of sales. The remaining population is covered by limited procedures performed. |
| • |
For contingent liabilities and provisions from legal proceedings, we have applied a centralized audit approach with specified audit procedures performed by the component auditors. Our audit procedures cover 96% of the recognized legal claim provision and all significant legal proceedings without a legal claim provision recognized. |
Audits of account balances or specified procedures were performed to materiality levels, the majority of which were based on the relevant local statutory audit materiality which is considerably lower than Group materiality. In the other cases, component materiality was determined by the judgment of the group auditor, having regard to the materiality for the financial statements as a whole and the reporting structure within the Group. Component materiality did not exceed EUR 40 million and the majority of our component auditors applied a component materiality that is significantly less than this threshold.
The group auditor sent detailed instructions to all component auditors, covering the significant areas that should be covered (which included the relevant risks of material misstatement detailed above) and set out the information required to be reported to the group auditor. Based on our risk assessment, the group auditor visited component locations in China, Germany, Indonesia, the Netherlands, Panama, Singapore and the USA. Most of our component auditors visited the Netherlands in 2014 to attend our global audit conference, which is held every three years, to discuss the Group audit, risks, audit approach and instructions.
Telephone calls were also held with the auditors of components that were both physically and not physically visited. During these visits and meetings, the audit approach, findings and observations reported to the group auditor were discussed in more detail.
We have used other auditors for the audit of components outside The Netherlands. By performing the procedures mentioned above at components, combined with additional procedures at group level, sector level and at Finance Operations centers, we have been able to obtain sufficient and appropriate audit evidence regarding the group’s financial information to provide an opinion on the financial statements.
Our key audit matters
Key audit matters are those matters that, in our professional judgment, were of most significance in our audit of the financial statements. We have communicated the key audit matters to the Supervisory Board. The key audit matters are not a comprehensive reflection of all matters discussed.
These matters were addressed in the context of our audit of the financial statements as a whole and in forming our opinion thereon, and we do not provide a separate opinion on these matters.
Finance Transformation
The Company continued to implement its global Accelerate! initiative, which includes a Finance Transformation program. The Finance Transformation has a significant impact on the Company’s business processes, control activities and internal control responsibilities. We focused on the Finance Transformation as part of our audit because there is a significant risk that a material misstatement could occur if the program was not implemented with proper oversight and a focus on maintaining effective internal controls throughout the process.
Our audit procedures included, amongst others, meetings with the Board of Management and the Audit Committee of the Supervisory Board on a regular basis during the year to understand and monitor the effects of changes to the Company’s internal control environment, across the organization. We performed site visits in three major geographic regions to test the effectiveness of controls impacted by the Finance Transformation and instructed our component auditors globally to perform procedures designed to provide reasonable assurance that a material misstatement did not exist in the financial statements as a result of the program. We also tested monitoring activities executed at different levels of the organization designed to ensure continued effectiveness of the internal control framework during the Finance Transformation.
Valuation of goodwill
Under EU-IFRSs, the Company is required to test the amount of goodwill for impairment, both annually and if there is a trigger for testing. The impairment tests were significant to our audit due to the complexity of the
210 Annual Report 2014
Table of Contents
Company financial statements 13.5
assessment process and significant judgments and assumptions involved which are affected by expected future market or economic conditions. At December 31, 2014, the goodwill amounted to EUR 7.2 billion.
Our audit procedures included, amongst others, the involvement of a valuation expert to assist us in evaluating the assumptions and methodologies used by the Company, in particular those relating to the compound sales growth rate and pre-tax discount rate. The cash flow projections, mainly for Healthcare cash-generating units – Respiratory Care & Sleep Management, Imaging Systems, and Patient Care & Monitoring Solutions and Lighting cash-generating units – Professional Lighting Solutions and Consumer Luminaires have been assessed and challenged by us, and includes an assessment of the historical accuracy of management’s estimates and evaluation of business plans. Based on the impairment test, it was noted that with regard to the headroom for cash-generating unit Consumer Luminaires, the estimated recoverable amount approximates the carrying value of the cash- generating unit. We also assessed the adequacy of the disclosures in Section 12.9, Note 11 Goodwill relating to those assumptions to which the outcome of the impairment test is most sensitive, that is, those that have the most significant effect on the determination of the recoverable amount of goodwill.
Accounting for income tax positions
Income tax was significant to our audit because the assessment process is complex and the amounts involved are material to the financial statements as a whole. The Company has extensive international operations and in the normal course of business makes judgments and estimates in relation to tax issues and exposures resulting in the recognition of other tax liabilities. At December 31, 2014, the net deferred tax assets are valued at EUR 2.4 billion and the other tax liability related to tax uncertainties is valued at EUR 499 million.
We have tested the completeness and accuracy of the amounts reported for current and deferred tax including the assessment of disputes with tax authorities. In this area our audit procedures included, amongst others, assessment of correspondence with the relevant tax authorities, testing the effectiveness of the Company’s internal controls around the recording and continuous re- assessment of the other tax liabilities, and the involvement of our local component auditors including tax specialists in those components determined to be the regions with significant tax risk. In respect of deferred tax assets, we tested management’s assumptions used to determine the probability that deferred tax assets recognized in the balance sheet will be recovered through taxable income in the countries where the deferred tax assets originated and during the periods when the deferred tax assets become deductible. During our procedures, we used amongst others budgets, forecasts and tax laws and in addition we assessed the historical accuracy of management’s assumptions. We also assessed the adequacy of the Company’s disclosure included in Section 12.9, Note 8 Income taxes in respect of income tax positions and uncertain tax positions.
Revenue recognition
Sales contracts for certain projects in the Healthcare and Lighting sectors typically involve multi-element contracts, for example a single sales transaction that combines the delivery of goods and rendering of services, and involve separately identifiable components that are recognized based on relative fair value. This gives rise to the risk that sales could be misstated due to the complexity of the multi-element contracts and the incorrect valuation of the relative fair value elements. Sales in the remaining sectors are generally recognized when the risks and rewards of the underlying products have been transferred to the customer and tend not to have multiple deliverable elements. There is a risk that sales may be deliberately overstated as a result of management override resulting from the pressure management may feel to achieve planned results. The management of the Group focuses on sales as a key performance measure which could create an incentive for sales to be recognized before the risks and rewards have been transferred.
Our audit procedures included, amongst others, assessing the appropriateness of the Company’s revenue recognition accounting policies including those relating to multi-element contracts and assess compliance with the policies in terms of EU-IFRS. We tested the effectiveness of the Company’s controls over calculation of rebates, fair value determination of multi-element sales contracts, and the correct timing of revenue recognition. We also assessed sales transactions taking place before and after year-end to ensure that revenue was recognized in the correct period and assessed the accuracy of the sales recorded, based amongst others on inspection of sales contracts, hand over certificates and hours reported after recognition of revenue. We have assessed the appropriateness of management’s response to indications of improper revenue recognition and performed additional work where considered necessary. We also assessed the adequacy of the sales disclosures contained in Section 12.9, Note 2 Information by sector and main country and Note 6 Income from operations.
Contingent liabilities and provisions from claims, proceedings and investigations
The Company and certain of its group companies and former group companies are involved as a party in legal proceedings, including regulatory and other governmental proceedings as well as investigations by authorities. Since the ultimate disposition of asserted claims and proceedings and investigations cannot be predicted with certainty, an adverse outcome could have a material adverse effect on the financial position, results of operations and cashflows, resulting in the identification of a significant financial statement risk.
Annual Report 2014 211
Table of Contents
Company financial statements 13.5
The accounting for (contingent) liabilities from claims, proceedings and investigations is complex and judgemental, and the amounts involved are, or can be material to the financial statements as a whole. At December 31, 2014, the provisions from legal proceedings amount to EUR 653 million, in case the company has a present legal or constructive obligation that cannot be estimated reliably, no provisions have been recognized.
In response to these risks, our audit procedures included, amongst others, testing the effectiveness of the Company’s controls around the identification and evaluation of claims, proceedings and investigations at different levels in the organization, and the recording and continuous re-assessment of the related (contingent) liabilities and provisions and disclosures, in accordance with EU-IFRS. We also inquired with both legal and financial staff in respect of ongoing investigations or claims, proceedings and investigations, inspected relevant correspondence, inspected the minutes of the meetings of the Audit Committee, Supervisory Board and Executive Committee, requested external legal confirmation letters from a selection of external legal counsel and obtained a legal representation letter from the Company.
We evaluated and tested the Company’s policies, procedures and controls surrounding the application of the General Business Principles (GBP), the identification and reporting of violations and assessed management’s response to any GBP violations. We also assessed the disclosure regarding (contingent) liabilities from legal proceedings and investigations as contained in Section 12.9, Note 19 Provisions, Note 22 Other Liabilities and Note 26 Contingent assets and liabilities.
Responsibilities of the Board of Management and the Supervisory Board for the financial statements
The Board of Management is responsible for the preparation and fair presentation of the financial statements in accordance with EU-IFRS and Part 9 of Book 2 of the Dutch Civil Code, and for the preparation of the Management report in accordance with Part 9 of Book 2 of the Dutch Civil Code. Furthermore, the Board of Management is responsible for such internal control as the Board of Management determines is necessary to enable the preparation of the financial statements that are free from material misstatement, whether due to fraud or error.
In preparing the financial statements, the Board of Management is responsible for assessing the Company’s ability to continue as a going concern. Based on the financial reporting frameworks mentioned, the Board of Management should prepare the financial statements using the going concern basis of accounting unless the Board of Management either intends to liquidate the Company or to cease operations, or has no realistic alternative but to do so.
The Board of Management should disclose events and circumstances that may cast significant doubt on the Company’s ability to continue as a going concern in the financial statements.
The Supervisory Board is responsible for overseeing the Company’s financial reporting process.
Our responsibilities for the audit of the financial statements
Our objective is to plan and perform the audit assignment in a manner that allows us to obtain sufficient and appropriate audit evidence for our opinion.
Our audit has been performed with a high, but not absolute, level of assurance, which means we may have not detected all errors and fraud.
For a further description of our responsibilities in respect of an audit of financial statements in general, we refer to the website of the professional body for accountants in the Netherlands (NBA). www.nba.nl/standardtexts-auditorsreport .
Report on other legal and regulatory requirements
Report on the Management report and the other information
Pursuant to legal requirements under Part 9 of Book 2 of the Dutch Civil Code (concerning our obligation to report about the Management report and other information):
| • |
We have no deficiencies to report as a result of our examination whether the Management report, to the extent we can assess, has been prepared in accordance with Part 9 of Book 2 of the Dutch Civil Code, and whether the information as required by Part 9 of Book 2 of the Dutch Civil Code has been annexed. |
| • |
We report that the Management report, to the extent we can assess, is consistent with the financial statements. |
Appointment
We were appointed before 2008 for the first time as auditor of Koninklijke Philips N.V. and operated as auditor since then. We were re-appointed by the Annual General Meeting of Shareholders as auditor of Koninklijke Philips N.V. on March 31, 2011, for the three year period 2012 - 2014. On May 1, 2014, we were appointed by the Annual General Meeting of Shareholders as auditor of Koninklijke Philips N.V. for the year 2015, after which we will mandatorily rotate off from the Philips audit pursuant to Dutch law.
Amsterdam, The Netherlands
February 24, 2015
KPMG Accountants N.V.
E.H.W. Weusten RA
Note that the report set out above is included for the purpose of Koninklijke Philips N.V.’s Annual Report for 2014 only and does not form part of Koninklijke Philips N.V.’s Annual Report on Form 20-F for 2014.
212 Annual Report 2014
Table of Contents
Sustainability statements 14
Approach to sustainability reporting
In 1999 Philips published its first environmental Annual Report. This was expanded in 2003, with the launch of our first sustainability Annual Report, which provided details of our social and economic performance in addition to our environmental results.
In 2008, we decided to publish an integrated financial, social and environmental report, reflecting the progress we have made embedding sustainability in our way of doing business. This is also supported by the inclusion of sustainability in the Philips Mission, Vision and the company strategy. For more information, please refer to chapter 4, Our strategic focus, of this report.
This is our seventh annual integrated financial, social and environmental report which has been prepared in line with the International Integrated Reporting Council (IIRC) Integrated Reporting <IR> framework.
Philips publishes its integrated Annual Report with the highest (reasonable) assurance level on the financial, social and environmental performance. With that overall reasonable assurance level Philips is a frontrunner in this field.
Tracking trends
We continuously follow external trends to determine the issues most relevant for our company and those where we can make a positive contribution to society at large. In addition to our own research, we make use of a variety of sources, including the United Nations Environmental Programme (UNEP), World Bank, World Business Council for Sustainable Development (WBCSD), World Economic Forum and World Health Organization. Our work also involves tracking topics of concern to governments, regulatory bodies, academia, and non-governmental organizations, and following the resulting media coverage.
Stakeholders
We derive significant value from our diverse stakeholders across all our activities and engage with, listen to and learn from them. Working in partnerships is crucial in delivering on our vision to make the world healthier and more sustainable through innovation. When appropriate and relevant to our business, we incorporate their feedback on specific areas of our business into our planning and actions. In addition to engagement with our customers, our suppliers, employees, investors, local communities and governments and non-governmental organizations, we participate in meetings and task forces as a member of organizations including the WBCSD, World Economic Forum, Electronic Industry Citizenship Coalition (EICC) and the Ellen MacArthur Foundation.
A multi-stakeholder project with the Sustainable Trade Initiative (IDH), a number of NGOs, and electronic companies was started in 2011 and continued in 2014. The program focuses on improving working circumstances in the electronics industry in China.
Furthermore, we engaged with the leading Dutch labor union (FNV) and a number of NGOs, including Enough, GoodElectronics, MakeITfair, the Chinese Institute of Public and Environmental Affairs, SOMO, Amnesty International, Greenpeace and Friends of the Earth.
In addition to face-to-face meetings, webinars and social media channels provide us with ongoing feedback on our strategy, performance and emerging topics. Our sustainability e-mail account (philips.sustainability@philips.com) enables stakeholders to share their issues, comments and questions with the sustainability team. As described in the Materiality section below, various stakeholder groups have been invited to provide input to the materiality analysis. The table below provides an overview of the different stakeholder groups, examples of those stakeholders and topics discussed.
Annual Report 2014 213
Table of Contents
Sustainability statements 14
Stakeholder overview (non-exhaustive)
| Examples | Processes | |||
| Employees |
- European Works Council - Individual employees |
Regular meetings, Employee Engagement Survey, employee development process, quarterly update webinars. For more information refer to section 5.2, Social performance, of this report. | ||
| Customers |
- Hospitals - Real estate developers - Consumers |
Joint (research) projects, business development, Lean value chain projects, consumer panels, Net Promoter Scores, Philips Customer Care centers, Training centers | ||
| Suppliers |
- Chinese suppliers in the Pearl and Yangtzhe river deltas - HP, Randstad, Maersk |
Supplier development activities, supplier forums, supplier website, participation in industry working groups like COCIR and EICC. For more information refer to sub-section 14.2.8, Supplier indicators, of this report. | ||
| Governments, municipalities, etc. |
- European Union - Municipalities of Madrid, Rotterdam |
Issues meetings, research projects, policy and legislative developments, business development | ||
| NGOs |
- Dutch Sustainable Trade initiative (IDH) - Friends of the Earth |
Issues meetings, cross-sector (multi-stakeholder) projects, joint projects, social investment program | ||
| Investors |
- Mainstream investors - ESG investors |
Webinars, roadshows, capital markets days, investor relations and sustainability accounts | ||
|
|
||||
Reporting standards
In this report, we have followed relevant best practice standards and international guidelines; the IIRC Integrated Reporting <IR> framework and the Global Reporting Initiative’s (GRI) G4 Sustainability Reporting Guidelines.
Sustainability is integrated in our company strategy and embedded in the organization. We have developed a value creation model (section 4.2, How we create value, of this report), including the six capitals, in line with the <IR> framework. A detailed overview of the G4 Comprehensive Indicators is provided at the end of this section.
We signed on to the United Nations Global Compact in March 2007, joining thousands of companies from all regions of the world as well as international labor and civil society organizations to advance 10 universal principles in the areas of human rights, labor, the environment and anti-corruption. Our General Business Principles, Sustainability and Environmental Policies, and our Supplier Sustainability Declaration are the cornerstones that enable us to live up to the standards set by the Global Compact. This is closely monitored and reported, as illustrated throughout this report, which is also our annual Communication on Progress (COP) submitted to the UN Global Compact Office.
Material aspects and our focus
We identify the environmental, social, and governance aspects which have the greatest impact on our business and the greatest level of concern to stakeholders along our value chain. These direct or indirect aspects may represent opportunities and risks and influence our ability to create, preserve or erode economic, environmental and social value for our stakeholders and Philips. Assessing these aspects enables us to prioritize and focus upon the most material issues and effectively address these in our policies and programs as well as measure and understand their implications in financial and non-financial terms.
Our materiality assessment is based on an ongoing trend analysis, media search, and stakeholder input. In 2014, we have broadened our approach by asking a large group of stakeholders (incl. customers, suppliers, investors and NGOs) to evaluate the materiality of a long-list of aspects. The results are reflected on the vertical axis of the materiality matrix. The scores on the horizontal axis are based on Philips’ assessment. Our materiality assessment has been conducted in the context of the GRI G4 Reporting Framework and the results have been reviewed and approved by the Philips Sustainability Board.
The results of this analysis are given in the matrix below and the key material aspects as well as the links to the relevant sections in this report are provided as well.
214 Annual Report 2014
Table of Contents
Sustainability statements 14
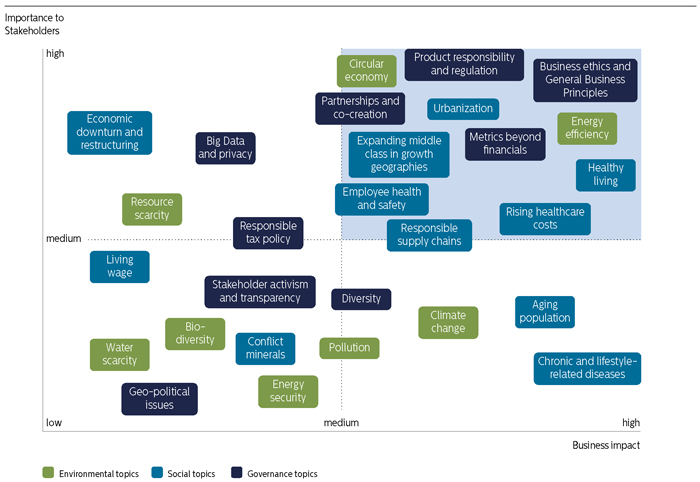
Annual Report 2014 215
Table of Contents
Sustainability statements 14
Key material aspects
|
|
||||
| Reference 1) | ||||
|
Environmental |
Boundaries | |||
|
- Energy efficiency |
section 4.1, Addressing global challenges, of this report section 5.3, Environmental performance, of this report chapter 14, Sustainability statements, of this report |
Supply chain, operations, use phase | ||
|
- Circular Economy |
chapter 2, Message from the CEO, of this report sub-section 5.3.1, Green Innovation, of this report section 5.3, Environmental performance, of this report sub-section 14.2.8, Supplier indicators, of this report |
Supply chain, operations, use phase | ||
|
|
||||
|
|
||||
| Reference 1) | ||||
|
Societal |
Boundaries | |||
|
- Expanding middle class in growth geographies |
chapter 2, Message from the CEO, of this report section 6.2, Consumer Lifestyle, of this report |
Use phase | ||
|
- Rising cost of healthcare |
section 4.1, Addressing global challenges, of this report sub-section 6.1.1, Health care landscape, of this report |
Use phase | ||
|
- Healthy living |
section 4.1, Addressing global challenges, of this report sub-section 6.2.1, Lifestyle retail landscape, of this report |
Use phase | ||
|
- Responsible Supply Chains |
section 5.2, Social performance, of this report chapter 14, Sustainability statements, of this report |
Supply chain | ||
|
- Demographic shift and urbanization |
sub-section 6.3.1, Lighting business landscape, of this report | Use phase | ||
|
- Employee health and safety |
section 5.2, Social performance, of this report | Supply chain, operations | ||
|
|
||||
|
|
||||
| Reference 1) | ||||
|
Governance |
Boundaries | |||
|
- Business ethics and General Business Principles |
section 7.5, Compliance risks, of this report sub-section 5.2.7, Philips’ General Business Principles renewed, of this report |
Supply chain, operations, use phase | ||
|
- Partnerships and co-creation |
sub-section 6.4.1, About Innovation, Group & Services, of this report chapter 14, Sustainability statements, of this report |
Supply chain, use phase | ||
|
- Metrics beyond financials |
section 5.2, Social performance, of this report section 5.3, Environmental performance, of this report chapter 14, Sustainability statements, of this report |
Supply chain, operations, use phase | ||
|
- Product responsibility and regulation |
section 7.5, Compliance risks, of this report sub-section 6.1.2, About Philips Healthcare, of this report sub-section 6.2.2, About Philips Consumer Lifestyle, of this report sub-section 6.3.2, About Philips Lighting, of this report |
Supply chain, operations, use phase | ||
|
|
||||
| 1) |
With the exception of section 5.2, Social performance, of this report, section 5.3, Environmental performance, of this report, and chapter 14, Sustainability statements, of this report, the sections and chapters referred to are not included in the scope of the assurance engagement |
216 Annual Report 2014
Table of Contents
Sustainability statements 14
Programs and targets
Our sustainability commitments are grouped under the label EcoVision, comprising the following key elements, more detailed targets can be found in the respective sections.
Philips Group
Sustainability commitments
2014
|
|
|
|||||||
| target 2015 | baseline year | |||||||
|
|
|
|||||||
|
Green Product Sales |
50% of total sales | |||||||
|
Lives Improved |
2 billion | |||||||
|
Green Innovation |
||||||||
|
- Investments |
EUR 2 billion (cumulative) | 2010 | ||||||
|
- Energy Efficiency |
50.3 lumen/watt (up 50%) | 2009 | ||||||
|
- Materials |
||||||||
|
- Collection & Recycling |
45,000 tonnes (up 100%) | 2009 | ||||||
|
- Recycled content |
15,000 tonnes (up 100%) | 2009 | ||||||
|
Green Operations |
||||||||
|
- CO 2 reduction |
40% | 2007 | ||||||
|
- Health & Safety |
|
0.26 Lost Workday Injury
Cases per 100 FTE |
|
|||||
|
Supplier Sustainability 1) |
72% compliant | |||||||
|
|
|
|||||||
| 1) |
For more information see sub-section 14.2.8, Supplier indicators, of this report |
All of our programs are guided by the Philips General Business Principles, which provide the framework for all of our business decisions and actions.
Boundaries of sustainability reporting
Our sustainability performance reporting encompasses the consolidated Philips Group activities, following the consolidation criteria detailed in this section. As a result of impact assessments of our value chain we have identified the material topics, determined their relative impact in the value chain (supply chain, our own operations, and use phase of our products) and report for each topic on the relevant parts of the value chain. More details on our impact are provided in the relevant sections.
The consolidated selected financial information in this sustainability statements section has been derived from the Group Financial Statements, which are based on IFRS.
Comparability and completeness
We used expert opinions and estimates for some parts of the Key Performance Indicator calculations. There is therefore an inherent uncertainty in our calculations. The figures reported are Philips’ best estimate. As our insight increases, we may enhance the methodology in the future.
Social data cover all employees, including temporary employees, but exclude contract workers. Due to the implementation of new HRM systems, we are able to provide more specific exit information on Philips employees as from 2014. Historical comparisons may not be available, however.
In 2014 the latest DEFRA (UK Department of Environment, Food and Rural Affairs) natural gas emission factor has been applied to the 2014 reporting period. This had an upward impact year-on-year on our CO 2 emissions of some 0.6%.
The emissions of substances data is based on measurements and estimates at manufacturing site level. There is therefore an inherent uncertainty in our calculations. The figures reported are Philips’ best estimate. As our insight increases, we may enhance the methodology in the future.
Integration of newly acquired activities is scheduled according to a defined integration timetable (in principle, first full reporting year after the year of acquisition) and subject to the integration agenda. Data for activities that are divested during the reporting year are not included in full-year reporting. Environmental data are reported for manufacturing sites with more than 50 industrial employees.
In line with the discontinued operations presentation in the Group financial statements regarding the Lumileds and Automotive business, we have excluded this data from the consolidated Sustainability data if relevant. Where the impact of the exclusion was material, we clearly disclosed the impact.
Prior-period sustainability data have been restated where relevant for the treatment of the Lumileds and Automotive business as discontinued operations. As a result, baseline adjustments have been made for Lives Improved, Energy Efficiency, Carbon Footprint and environmental indicators (energy, water, waste and emissions).
Data definitions and scope
Lives improved, energy efficiency and materials
The Key Performance Indicators on ‘lives improved’, ‘energy efficiency’ and ‘materials’ and the scope are defined in the respective methodology documents that can be found at www.philips.com/sustainability .
Health and safety
Health and safety data is reported for units with over 50 FTEs (full-time equivalents) and is voluntary for smaller units. Health and safety data are reported and validated monthly. The focus is on reporting work-related injuries, which predominantly occur in manufacturing operations and Field Services Organizations. The annual number of cases leading to at least one lost workday is reported per 100 FTEs (full-time equivalents). Fatalities are reported for staff, contractors and visitors and include commuting accidents.
General Business Principles
Alleged GBP violations are registered in our intranet-based reporting and validation tool.
Annual Report 2014 217
Table of Contents
Sustainability statements 14
Supplier audits
Supplier audits are primarily focused on identified risk suppliers, based on identified risk countries and on spend of more than EUR 1 million (new suppliers EUR 100,000 and no threshold for high risk suppliers).
| • |
Based on the Maplecroft Human Rights Risk Indexes, risk countries for Supply Management in 2014 were: Brazil, China, India, Indonesia, Mexico, Ukraine, and Russia. |
| • |
Suppliers of new ventures are included to the extent that the integration process of these ventures has been finalized. Normative integration period is two years after closure of the new venture. |
Green Products
Green Products offer a significant environmental improvement in one or more Green Focal Areas: Energy efficiency, Packaging, Hazardous substances, Weight, Recycling and disposal and Lifetime reliability. The life cycle approach is used to determine a product’s overall environmental improvement. It calculates the environmental impact of a product over its total life cycle (raw materials, manufacturing, product use and disposal).
Green Products need to prove leadership in at least one Green Focal Area compared to industry standards, which is defined by a sector specific peer group. This is done either by outperforming reference products (which can be a competitor or predecessor product in the particular product family) by at least 10%, outperforming product-specific eco-requirements or by being awarded with a recognized eco-performance label. Because of different product portfolios, sectors have specified additional criteria for Green Products, including product-specific minimum requirements where relevant.
Green Innovation
Green Innovation comprise all R&D activities directly contributing to the development of Green Products or Green Technologies. A wide set of additional criteria and boundaries have been defined as the basis for internal and external validation.
Environmental data
All environmental data from manufacturing operations are reported on a half-year basis in our sustainability reporting and validation tool, according to defined company guidelines that include definitions, procedures and calculation methods.
Internal validation processes have been implemented and peer audits performed to ensure consistent data quality and to assess the robustness of data reporting systems.
These environmental data from manufacturing are tracked and reported to measure progress against our Green Operations program targets.
Reporting on ISO 14001 certification is based on manufacturing units reporting in the sustainability reporting system.
Operational carbon footprint
The Philips operational carbon footprint (Scope 1, 2 and 3) is calculated on a half-yearly basis and includes:
| • |
Industrial sites – manufacturing and assembly sites |
| • |
Non-industrial sites – offices, warehouses, IT centers and R&D facilities |
| • |
Business travel – lease and rental cars and airplane travel |
| • |
Logistics – air, sea and road transport |
All emission factors used to transform input data (for example, amount of tonne-kilometers transported) into CO 2 emissions are from the Greenhouse Gas Protocol (GHGP), except for business travel, where the service providers supplied CO 2 data based on their own verified methodology. The GHGP distinguishes three scopes. It is mandatory to report on the first two to comply with the GHGP reporting standards.
| • |
Scope 1 – direct CO 2 emissions – is reported on with direct emissions from our industrial and non-industrial sites in full. Emissions from industrial sites, which consist of direct emissions resulting from processes and fossil fuel combustion on site, are reported in the sustainability reporting system. Energy use and CO 2 emissions from non-industrial sites are based on actual data where available. If this is not the case, they are estimated based on square meters, taking the geographical location and building type of the site into account. |
| • |
Scope 2 – CO 2 emissions resulting from the generation of purchased electricity for our premises – is reported on with electricity use from industrial and non-industrial sites in full. Indirect CO 2 emissions resulting from purchased electricity, steam and heat are reported in the sustainability reporting system. Those emissions of industrial sites not yet reporting are calculated on the same basis as described in Scope 1. Indirect emissions of non-industrial sites are calculated in the same manner as described in Scope 1. |
| • |
Scope 3 – other CO 2 emissions related to activities not owned or controlled by the Group is reported on for our business travel and distribution activities. Commuting by our employees, upstream distribution (before suppliers ship to us), outsourced activities and emissions resulting from product use by our customers are not included in our operational carbon footprint. The calculations for business travel by lease cars are based on actual fuel usage and for rental cars on distance traveled. Taxis and chauffeur driven cars used for business travel are not included in the calculations. Emissions from business travel by airplane are calculated by the supplier based on mileage flown and emission factors from DEFRA, distinguishing between short, medium and long |
218 Annual Report 2014
Table of Contents
Sustainability statements 14
|
flights. Further, emissions from air freight for distribution are calculated based on the amount of tonne-kilometers transported between airports (distinguishing between short, medium and long hauls), including an estimate (based on actual data of the lanes with the largest volumes) for trucking from sites and distribution centers to airports and vice versa. Express shipments are generally a mix of road and air transport, depending on the distance. Therefore the assumption is applied that shipments over less than 600 km are transported by road and the rest of the shipments by air (those emissions by air are calculated in the same way as air freight). For sea transport, only data on transported volume were available so an estimate had to be made about the average weight of a container. Transportation to and from ports is not registered. This fore and aft part of sea transport was estimated to be around 3% of the total distance (based on actual data of the lanes with the largest volumes), consisting of a mix of modalities, and was added to the total emissions accordingly. CO2 emissions from road transport were also calculated based on tonne-kilometers. If data were incomplete, the emissions were estimated based on sales volumes. Return travel of vehicles is not included in the data for sea and road distribution. |
Sustainability governance
Sustainability is strongly embedded in our core business processes, like innovation (EcoDesign), sourcing (Supplier Sustainability Involvement Program), manufacturing (Green Manufacturing 2015) and Logistics (Green Logistics) and projects like the Circular Economy initiative.
The Sustainability Board is the highest governing sustainability body in Philips, chaired by Jim Andrew, member of the Executive Committee. Three other Executive Committee members sit in the Sustainability Board jointly with sector and functional executives. The Sustainability Board convenes four times per year, defines Philips’ sustainability strategy and programs, monitors progress and takes corrective action where needed.
Progress on Sustainability is communicated internally on a quarterly basis to Philips staff and at least annually in the Executive Committee and Supervisory Board.
External assurance
KPMG has provided reasonable assurance on whether the information in chapter 14, Sustainability statements, of this report and section 5.2, Social performance, of this report and section 5.3, Environmental performance, of this report presents fairly, in all material respects, the sustainability performance in accordance with the reporting criteria. We refer to section 14.4, Independent Auditor’s Assurance Report, of this report.
This section provides summarized information on contributions on an accruals basis to the most important economic stakeholders as a basis to drive economic growth. For a full understanding of each of these indicators, see the specific financial statements and notes in this report.
Philips Group
Distribution of direct economic benefits in millions of EUR
2012 - 2014
|
|
|
|||||||||||
| 2012 | 2013 | 2014 | ||||||||||
|
|
|
|||||||||||
|
Suppliers: goods and services |
13,505 | 12,653 | 13,185 | |||||||||
|
Employees: salaries and wages |
5,221 | 4,722 | 5,018 | |||||||||
|
Shareholders: distribution from retained earnings |
687 | 678 | 729 | |||||||||
|
Government: corporate income taxes |
218 | 466 | 26 | |||||||||
|
Capital providers: net interest |
326 | 269 | 251 | |||||||||
|
|
|
|||||||||||
Total purchased goods and services amounted to EUR 13.2 billion, representing 62% of total revenues of the Philips Group. Of this amount, 64% was spent with global suppliers, the remainder with local suppliers.
In 2014, the salaries and wages totaled EUR 5.0 billion. This amount is some EUR 300 million higher than in 2013, mainly caused by higher restructuring costs. See note 6, Income from operations for more information.
Philips’ shareholders were given EUR 729 million in the form of a dividend, of which the cash portion of the dividend amounted to EUR 292 million.
Income taxes amounted to EUR 26 million, compared to EUR 466 million in 2013. The effective income tax rate was 14.1%. The decrease in 2014 was mainly due to lower income before tax and application of favorable tax regulations relating to R&D investments. The comparable effective income tax rate for 2013 was 30.6%.
For a further understanding, see note 8, Income taxes. For more information, please refer to Philips’ Tax Principles.
This section provides additional information on (some of) the social performance parameters reported in section 5.2, Social performance, of this report.
14.2.1 Engaging our employees
In 2014 we implemented a brief, complementary, team-focused survey called My Accelerate! Survey (MAS).
The format and set of questions in the MAS allowed a shift of accountability to where it has the biggest impact – at individual team level. The MAS survey, which measures the quantitative data on team effectiveness, helps our leaders to increase team performance through structural interventions and actions.
Annual Report 2014 219
Table of Contents
Sustainability statements 14.2.1
Whilst the MAS results are not directly comparable to our historical matrix of Employee Engagement, we see that 83% of our (targeted) employees provided a favorable answer to the transformation journey question: “ In my team we role model the Philips behaviors ”. There was also an increase in areas concerning “ Speed of decision making ”, resulting in an overall score of 77% favorable answers across the Philips population.
In terms of results, the MAS indicates very high favorable scores within the set of questions referring to Alignment (“ How clear are we about customer needs and business priorities?” ) and Execution (“ How good are we at getting things done?” ).
There are also some improvement areas, particularly within the questions categorized under Renewal (“ How do we stay effective and adapt”) . These improvement areas are structurally addressed by our leadership teams.
The MAS is proving to be a very lean and effective diagnostic in increasing effectiveness and the team’s capacity to solve challenges as and when they occur.
14.2.2 People development
The creation of the Philips University in itself is a great example of raising quality and user friendliness through a central approach of standardization, simplification and innovation, offering world-class learning interventions, supported by one central Learning Management System and accessible through the personalized University Portal.
Over 400 new courses are available including 24 flagship programs on the new Learning Management System. By year-end, all Philips employees with an e-mail account had access to the Philips University, there were close to 2,000 active courses, and some 280,000 enrolments.
As part of our Accelerate! transformation, we are developing our Philips Excellence capabilities globally to deliver faster and better to our customers. Embracing continuous improvement and learning is a fundamental element of our Philips Business System. Philips University underpins our ambition to become operationally excellent by supporting learning and building of Lean capabilities including Continuous Improvement, Change Management, Process Management, Project Management and Performance Management.
The Leadership Academy delivered a simplified and comprehensive system of leadership development initiatives specifically structured to develop a long term leadership pipeline at all levels and across all parts of Philips and to help deliver the business transformation. It significantly boosted the focus on women in leadership, diversity and inclusion via the ‘Next Generation Women’s Leadership’ and ‘Leading Across Cultures’ programs.
The award winning Harvard Manage Mentor leadership suite was also introduced, with more than 9,000 learners registered and more than 17,000 management learning experiences completed.
Transformation and change
In 2014, we continued our commitment to strengthening our leaders’ and our teams’ transformational capabilities to drive change in the organization. As part of this commitment, over 1,400 leading executives have participated in our Accelerate! Leadership Program (ALP) since the start of the program in 2011. In addition to the ALP, the Accelerate! Team Performance (ATP) is a key team effectiveness session designed to accelerate the adoption of new ways of working by addressing behavioral shifts. In 2014 alone, more than 230 teams and 4,000 participants took part in an ATP session, which also reached more than 4,000 employees via viral sessions.
To further enhance team performance, we have continued to build the capability of internal facilitators from the business to deliver our ATP programs. To date, we have trained and certified a total of 80 facilitators, 30 of whom were certified in 2014. We have begun developing a Team Performance Toolkit of simple, accessible tools from the ATP, which managers and team members can apply themselves. This Toolkit will be introduced in 2015.
Other programs
In The Netherlands a special employment progeram called Werkgelegenheidsplan (WGP) is running. Via this WGP, we offer vulnerable groups of external jobseekers a work experience placement, usually combined with some kind of training. The program started in 1983 and over 12,500 people have participated since. After participating in the program, about 70% find a job. In 2014, Philips employed some 185 persons via the WGP program, including young people with autism who are training to become a test engineer. Of the current group of 8 autistic persons, 6 found a job, and 2 are still working as WGP candidate within Philips.
14.2.3 Global talent acquisition
Top sources of talent
Philips’ talent management approach is to continuously build and develop its existing employees, while strategically buying talent where competency areas can be strengthened. In 2014, we recruited talent both internally and externally into over 10,000 vacancies. With an increasing trend, nearly one third of those vacancies were filled with internal candidates, and the remainder filled with qualified talent from the external labor market.
220 Annual Report 2014
Table of Contents
Sustainability statements 14.2.3
In-sourcing executive recruitment
Executive Search Services (ESS), Philips’ in-house executive recruiting services division launched in Q1 2014, delivered 80 high-quality senior-level hires in 2014. ESS provides services such as demand-based executive recruiting, executive intelligence & talent consulting services, and executive-specific referral and onboarding programs. The addition of this focused in-house recruiting capability ensures we are able to offer the most appropriate service to our internal customers.
A strong employer brand as a driver for talent attraction
Philips realizes that it is crucial to attract the best talent in order to deliver on our strategic goals. In 2014 we activated our global Employer Value Proposition by leveraging our recently re-positioned “Innovation and You” brand platform, aligned with audience insights to raise awareness and preference. For employer brand updates and company content, visit the Philips LinkedIn Careers page .
As part of its global Talent Acquisition strategy, Philips seeks to attract talent from proven high quality sources. In 2014, the top 5 sources of hire were:
| • |
Philips employee referral – Historical data has proven that the top performing hires for Philips are those referred by its own employees. Philips engages its employees to share their network through a formal employee referral program which generates close to 30% of its total hires each year. |
| • |
Internal hire – Embedded within the Accelerate! Transformation is a stated cultural imperative to embed a growth and performance culture and facilitate a mobile, diverse workforce. As a result, Philips filled nearly one third of its vacancies with internal top performers each year. |
| • |
Proactively sourced by recruiter – Philips has a dedicated in-house sourcing function that focuses solely on building proactive talent pipelines and requires all its recruitment professionals to contribute to the proactive identification of passive industry talent. |
| • |
Digital career channel (job board, social media site, etc.) – In line with the company’s overall focus on increasing its digital footprint, Philips’ recruitment marketing team invested more heavily in its digital footprint in 2014. As a result, Philips increased its LinkedIn Talent Brand Index by 2.1% and delivered over 1,000 hired candidates. |
| • |
Philips careers website – Philips career website attracts talent by emphasizing its Employer Value Proposition through targeted information sharing and storytelling from its employees and leadership teams. Philips global career website can be found at www.philips.com/careers . |
14.2.4 Health and Safety performance
A number of sites showed outstanding safety performance, for example the Healthcare Pune site in India, which reached a significant milestone by achieving over 2 million man-hours without an LWIC by the end of 2014 (over 2 years without an accident). The Consumer Lifestyle facility in Varginha, Brazil achieved 4 years without an LWIC by the end of 2014.
Philips Group
Lost workday injuries per 100 FTEs
2010 - 2014
|
|
|
|||||||||||||||||||
| 2010 | 2011 | 2012 | 2013 | 2014 | ||||||||||||||||
|
|
|
|||||||||||||||||||
|
Healthcare |
0.25 | 0.20 | 0.22 | 0.19 | 0.20 | |||||||||||||||
|
Consumer Lifestyle |
0.26 | 0.23 | 0.25 | 0.24 | 0.12 | |||||||||||||||
|
Lighting |
0.73 | 0.67 | 0.47 | 0.42 | 0.37 | |||||||||||||||
|
Innovation, Group & Services |
0.13 | 0.04 | 0.05 | 0.04 | 0.02 | |||||||||||||||
|
|
|
|||||||||||||||||||
|
Continuing operations |
0.45 | 0.38 | 0.31 | 0.27 | 0.23 | |||||||||||||||
|
Discontinued operations |
0.84 | 0.59 | 0.55 | 0.37 | 0.25 | |||||||||||||||
|
|
|
|||||||||||||||||||
|
Philips Group |
0.50 | 0.38 | 0.31 | 0.28 | 0.23 | |||||||||||||||
|
|
|
|||||||||||||||||||
Lighting
Lighting achieved a strong decline in reported accident rates in recent years. In 2014, the number of LWIC decreased to 132, compared with 165 in 2013. The LWIC rate decreased to 0.37, compared with 0.42 in 2013. The number of Lost Workdays decreased by 3% to 4,700 days. One major achievement was a zero level of LWIC at 12 significant industrial units (over 100 FTEs) in 2014. Efforts are being made to further reduce these rates through an emphasis on prevention and Behavior-Based Safety, supported by senior management involvement.
In 2014, Health and Safety management in Turnkey Lighting projects was a key focus area. A Health and Safety global framework has been launched to support and provide training for project managers and their teams in the commercial organizations, including contractors. This framework will continue to be rolled out in 2015.
Healthcare
The Health and Safety performance of Healthcare was relatively stable in 2014. The number of LWIC and the LWIC rate remained constant compared to 2013 at 72 and 0.2 respectively. However, the total number of Lost Workdays decreased by 10% year-on-year to 2,242 days. Healthcare continued to focus on Health and Safety improvement actions within their Field Service Organization (FSO), including the launch of a formalized Health and Safety management framework as well as the deployment of renewed targeted trainings for high-risk areas such as radiation and electrical safety. FSO Lost Workdays decreased to 33% of the Sector total compared with 37% in 2013, although the number of LWIC increased to 31 from 28 in 2013.
Consumer Lifestyle
Consumer Lifestyle showed a significant decrease in LWIC from 39 in 2013 to 21 in 2014. The LWIC rate fell by 49% year-on-year to an internal benchmark level of 0.12. The number of Lost Workdays increased, however, from 842 to 1,608 days as recovery periods increased.
Annual Report 2014 221
Table of Contents
Sustainability statements 14.2.4
The new governance structure launched in the Consumer Lifestyle organization in 2013, to embed Health and Safety performance reviews and ownership in the businesses, proved successful.
14.2.5 General Business Principles
In 2014 393 GBP complaints were filed via the Philips Ethics Line and the GBP Compliance Officers. Compared with 2013 (335 complaints), this represents an increase of 17%.
This upward trend in the overall number of concerns can be attributed primarily to significantly more concerns being reported in Latin America (more specifically in Brazil), which now account for 30% of the total number of reports (2013: 17%). Europe and the Middle East (18% of the total) also showed an upward trend in terms of absolute numbers. In EMEA there were 44% more complaints than in 2013. This overall increase is believed to be due to the intensive communication campaigns to increase awareness of employees’ rights with regard to the GBP, as well as to the reporting facilities that are available to them. The number of complaints in the Asia Pacific region (17% of the total) decreased compared with 2013, making the current percentage more comparable with that in 2012 (18%). In North America the absolute number of complaints declined somewhat, accounting for 35% of the total number in 2014 (2013: 43%). We believe the continued dominance of North America and, since the beginning of 2014, Latin America as well, is due to the employees’ very high level of awareness of compliance issues and their ability to assert their rights in this respect.
The most common types of concerns are listed below.
Treatment of employees
As in other years, the most commonly reported concern related to the Treatment of employees, and accounted for 52% of the total. The vast majority of these complaints can be classified as either ‘Equal and fair treatment’ or ‘Respectful treatment’, and together they accounted for 81% of employee-related concerns.
Concerns that fall under ‘Equal and fair treatment’ related primarily to favoritism, discrimination and unfair treatment. More than 33% of these reports originated in the United States, with a further 20% being reported in Brazil. Looking at the ‘Respectful treatment’ category, which concerns primarily reports of verbal abuse, (sexual) harassment and a hostile work environment, again about one third of the complaints originated in the US, with another third coming from Brazil. Some 58% of all complaints filed in Brazil related to these two topics. For the US, this was 50%.
Business integrity
The second most-reported topic, which accounted for 28% of all reported cases, was Business integrity (2013: 33%). The majority (40%) of these concerns originated in the Asia Pacific region, followed by Europe and the Middle East (34%), Latin America (15%) and North America (11%).
More information on these categories can be found in the GBP Directives on www.philips.com/gbp .
Philips Group
Breakdown of reported GBP concerns in number of reports
2010 - 2014
|
|
|
|||||||||||||||||||
| 2010 | 2011 | 2012 | 2013 | 2014 | ||||||||||||||||
|
|
|
|||||||||||||||||||
|
Health & Safety |
3 | 2 | 11 | 3 | 10 | |||||||||||||||
|
Treatment of employees |
184 | 132 | 205 | 203 | 203 | |||||||||||||||
|
- Collective bargaining |
1 | — | 1 | 5 | — | |||||||||||||||
|
- Equal and fair treatment |
64 | 41 | 72 | 80 | 72 | |||||||||||||||
|
- Employee development |
1 | — | — | 4 | — | |||||||||||||||
|
- Employee privacy |
2 | 1 | 1 | 1 | 3 | |||||||||||||||
|
- Employee relations |
4 | 1 | 2 | 5 | 6 | |||||||||||||||
|
- Respectful treatment |
96 | 71 | 102 | 84 | 93 | |||||||||||||||
|
- Remuneration |
12 | 6 | 15 | 15 | 11 | |||||||||||||||
|
- Right to organize |
— | — | 1 | — | — | |||||||||||||||
|
- Working hours |
4 | 2 | — | 3 | 5 | |||||||||||||||
|
- HR other |
— | 10 | 11 | 6 | 13 | |||||||||||||||
|
Legal |
13 | 10 | 19 | 9 | 30 | |||||||||||||||
|
Business Integrity |
112 | 107 | 119 | 109 | 110 | |||||||||||||||
|
Supply management |
4 | 3 | 3 | 5 | 6 | |||||||||||||||
|
IT |
— | — | — | 6 | 7 | |||||||||||||||
|
Other |
22 | 15 | 17 | — | 27 | |||||||||||||||
|
|
|
|||||||||||||||||||
|
Total |
338 | 269 | 374 | 335 | 393 | |||||||||||||||
|
|
|
|||||||||||||||||||
Substantiated/unsubstantiated concerns
Out of the 393 concerns reported in 2014, 133 are still pending closure, especially those that were filed towards the end of the year. The table below shows a comparison between those complaints which, after investigation, could be substantiated and those that could not.
Out of the 260 complaints investigated, 27% were substantiated after investigation. This is approximately the same level as in 2013 (28%) and 2012 (26%). Also, looking at the various types of issue, there were no striking differences in the percentage of substantiated complaints compared to 2013. The biggest difference is the number of substantiated Business integrity complaints, which now stands at 36% compared to 50% in 2013.
Substantiated complaints, i.e. complaints in which a breach of our General Business Principles was detected, were followed up with a range of disciplinary and corrective measures. The action taken varied from termination of employment, written warnings and suspension, to training aimed at raising awareness of organizational measures.
222 Annual Report 2014
Table of Contents
Sustainability statements 14.2.5
Philips Group
Classification of the concerns investigated in number of reports
2012 - 2014
|
|
|
|||||||||||||||||||||||
| 2012 | 2013 | 2014 | ||||||||||||||||||||||
|
|
|
|||||||||||||||||||||||
| substantiated | unsubstantiated | substantiated | unsubstantiated | substantiated | unsubstantiated | |||||||||||||||||||
|
|
|
|||||||||||||||||||||||
|
Health & Safety |
2 | 7 | — | 2 | 1 | 7 | ||||||||||||||||||
|
Treatment of employees |
22 | 150 | 33 | 136 | 32 | 112 | ||||||||||||||||||
|
Legal |
5 | 8 | 2 | 2 | 4 | 9 | ||||||||||||||||||
|
Business Integrity |
37 | 51 | 32 | 32 | 25 | 45 | ||||||||||||||||||
|
Supply Management |
1 | — | — | 3 | 1 | — | ||||||||||||||||||
|
IT |
— | — | 3 | 1 | 2 | — | ||||||||||||||||||
|
Other |
11 | 4 | — | — | 4 | 18 | ||||||||||||||||||
|
|
|
|||||||||||||||||||||||
|
Total |
78 | 220 | 70 | 176 | 69 | 191 | ||||||||||||||||||
|
|
|
|||||||||||||||||||||||
14.2.6 The Philips Foundation
In 2014, Philips established the Philips Foundation, a new initiative dedicated to helping enable lasting social change in disadvantaged communities through the provision and application of innovation, talent and resources provided by Philips. Together with key non-profit partners, the Philips Foundation seeks to identify challenges where a combination of Philips expertise and partner experience can be used to create meaningful solutions that improve people’s lives. The Philips Foundation will provide the vehicle for the Corporate Social Responsibility and social investment program of Philips going forward.
During 2014, the Foundation developed its strategy, governance and operational structure. It established its first strategic partnerships with the International Red Cross and UNICEF with the aim of co-creating innovative solutions for disaster relief and community development and supporting social entrepreneurship. In addition to programs with these global partners, the Foundation will fund local projects run by the Philips markets that are in line with the Foundation strategy. The Foundation also stepped up to coordinate Philips’ contribution to the international fight against Ebola. It provided the opportunity for employees to make a donation to support the work of the Red Cross in West Africa and doubled the amount raised to almost EUR 60,000. Furthermore, several products were donated in response to requests from the Red Cross and other NGOs.
More information about the Philips Foundation and its purpose and scope can be found at www.philips-foundation.com .
14.2.7 Stakeholder Engagement
Working in partnerships is crucial in delivering on our vision to make the world healthier and more sustainable through innovation. A number of our partnerships are described below.
Strategic Partner of the World Economic Forum
The World Economic Forum engages business, political, academic and other leaders of society to shape global, regional and industry agendas in an informal, action focused way. Philips is now entering its third year as Strategic Partner.
2014 was the year Philips substantially strengthened its position in Digital Innovation, Internet of Things and Emerging Technologies. Moreover, health care gained a more prominent place on the global economic agenda at WEF creating many opportunities for Philips in building new relationships and strengthening our business in a transformational industry. The Sustainable Development Agenda was discussed at WEF as well, Philips welcomes the opportunity to contribute to these discussions and shape the global agenda.
Despite the impact of geo-politics on the global economic agenda, our engagements contributed substantially to our objectives of positioning Philips as technology leader in Health & Sustainability, gaining new insights that are relevant for future business, and creating new business opportunities.
Cross-sector collaboration to drive the Circular Economy transformation
For a sustainable world, Philips sees the transition from a linear to a circular economy (CE) as a necessary boundary condition. A circular economy aims to decouple economic growth from the use of natural resources and ecosystems by using those resources more effectively. To promote cross-industry and cross-sector collaboration, Philips joins forces with thought leaders and conveners. One such initiative is Project Mainstream, driven by the Ellen MacArthur Foundation, the WEF and McKinsey. Frans van Houten is in the Steering Board and leads the work stream Asset-tracking. This project addresses the outer circle of the circular economy concept, the material streams where significantly more traction is needed to scale up to mainstream business and improve material quality. A Research team has developed a white paper to describe innovation opportunities to address CE
Annual Report 2014 223
Table of Contents
Sustainability statements 14.2.7
challenges. The paper has been widely distributed internally to all of Philips businesses to stimulate innovation activities across the company.
Every Woman Every Child pledge
In 2014, Philips has pledged its support to the United Nations global initiative “Every Woman Every Child”. With a special focus on sub-Saharan Africa and South East Asia, we aim to improve the lives of at least 100 million women and children by 2025 in these regions by committing to the following:
| • |
Deliver the next generation of care for mothers and their children by improving healthcare infrastructures, transformation and revitalization, clinical education and skills training. |
| • |
Provide better access to health care and create solutions which enable healthier and safer living. Examples include clean cooking stoves, automated respiration monitors, eHealth and mHealth solutions. |
| • |
Promote healthy and nutritious diets for mothers and children, understanding barriers to breastfeeding and supporting breastfeeding in the workplace. |
Collaborating on locally relevant innovation in Africa
The Philips Africa Innovation Hub in Nairobi, Kenya, is our base for creating locally relevant innovations and business models. The Innovation Hub employs African talents and operates on the concept of open innovation, working in close collaboration with the R&D ecosystem of Kenya and Africa.
In order to strengthen primary care in communities, it developed the concept of Community Life Centers (CLCs), a community hub where technology is bundled with services: solar power, indoor and outdoor LED-lighting, health care equipment, laboratory equipment, refrigeration, IT-solutions and water supply and purification. In 2014, the first center was opened in Kenya, which now delivers two babies per day, and receives 13 times more patients than before. Key for success was close co-creation with the local government and involvement of community members. CLC was realized in close public-private partnership with the County Government of Kiambu in Kenya. We also involved community members in the assessment and design in order to create ownership. Health care workers at the site were empowered through clinical coaching and education.
Philips entered a partnership with the South-Africa based non-profit organization PET (PowerFree Education Technology) to further develop, test and commercialize a Wind-Up Doppler Ultrasound Fetal Heart Monitor, a unique, power-independent clinical innovation aimed at addressing the high rates of preventable infant mortality across Africa, designed specifically for low resource settings. Further developed by the Philips Africa Innovation Hub, the Wind-up Fetal Doppler is a device to detect a slowing of the fetal heart rate while the mother is in labor, an important indicator that the fetus is not receiving enough oxygen and may suffer brain damage or die. If this is detected early enough, a midwife or delivering nurse can take the necessary actions to save the child.
Philips and the Medical Credit Fund, part of the PharmAccess Group, started a partnership to improve access to quality health care in Africa. Through the partnership small and medium-sized private clinics in Africa will have access to financing for innovative medical technologies and services from Philips, which is often difficult to obtain from banks due to the high investment risks. The Medical Credit Fund works with African banks to provide these clinics with affordable loans, combined with management training and a quality improvement program, which enhances trust in the clinics among both patients and financial institutions.
Working on global issues
In 2014, Philips continued its engagement in a number of international conferences, events and partnerships that are focused on sustainable development and climate change. The events and conferences include the UN Climate Summit organized by UN Secretary General Ban Ki Moon in New York, the World Summit of Regions organized by Regions20 in Paris, as well as the United Nations Climate Change Conference in Lima, Peru. Most notably we were a co-founder of the Global Energy Efficiency Accelerator Platform that was announced at the UN Climate Summit.
The Global Energy Efficiency Accelerator Platform is a multi-stakeholder partnership between the UN (Sustainable Energy for All - SE4All), (sub)national governments and progressive companies. The objective is to double the rate of Energy Efficiency improvement from the current bandwidth of 1 to 1.5% towards 2.5 to 3% per year. Such doubling of the rate of energy efficiency improvement is a potent driver of economic development (creating jobs in the renovation of city infrastructure and reducing budget deficits), as well as in significantly reducing carbon emissions.
On partnerships the UNEP En.lighten initiative continues to gain traction. Philips is one of the founders of this public private partnership where now 66 emerging and developing countries have committed to phase out incandescent lamps by 2016. This program as well as the Global Energy Efficiency Accelerator will further develop towards COP21 in Paris in December 2015.
With The Climate Group a global ‘LED city consultation program’ was launched at WEF in Davos in January. This is a follow-through of The Climate Group’s ‘Light Savers’ program that has piloted LED street lighting in 12 cities in all regions (including Sydney, Kolkata, London, NYC, Toronto, and Rio de Janeiro) which results were published in partnership with Philips Lighting at Rio+20. The LED City consultation process is identifying and addressing the (remaining) hurdles in
224 Annual Report 2014
Table of Contents
Sustainability statements 14.2.7
the accelerated transition to LED street lighting. Workshops held in 2014 included London, Dubai, Singapore, Austin (Texas), Sao Paulo, and Beijing.
Innovation Experience
Philips organized Innovation Experiences in 2014 in Eindhoven, Dubai and Zurich which were attended by over 2,000 journalists, customers, scientists, partners and employees.
At the event Philips explored how technology can make our homes healthier and more tailored to our lifestyles, how cloud-based solutions can provide care across the health continuum and connect the patient from the hospital to their home, and how personalized digital solutions can help people living with disabilities or chronic diseases manage their condition from the comfort of their own home.
We firmly believe that these challenges can only be addressed through Open Innovation and constructive dialogue with all stakeholders involved.
14.2.8 Supplier indicators
In addition to our own sustainability activities, we also engage our suppliers and their suppliers toward better sustainability practices. To that end, we are active in various supply chain initiatives around the world.
Philips has a direct business relationship with approximately 10,000 product and component suppliers and 30,000 service providers. Given the size and complexity of our supply chain we need to focus our efforts. Therefore, we developed an approach based on the supplier’s sustainability risk profile related to spend, country of production, business risk and type of supplier relationship. The risk profile is used to select suppliers for inclusion in our sustainability audit program, conflict minerals, and IDH Electronics program.
Philips Supplier Sustainability Declaration
The Philips Supplier Sustainability Declaration is based on the EICC Code of Conduct and in line with our General Business Principles, we added requirements on Freedom of Association and Collective Bargaining. The topics covered include labor and human rights, worker health and safety, environmental impact, ethics, and management systems. We monitor supplier compliance to the Declaration through a system of regular audits.
We rolled-out the Declaration via the purchasing contracts signed with suppliers, and via all trainings and audits.
The Declaration requires suppliers to cascade the EICC Code down to their next tier suppliers. Suppliers must regard the Code as a total supply chain initiative and at a minimum, also require its next tier suppliers to acknowledge and implement the Code. This roll-out to deeper levels in the supply chain is reviewed during the on-site audits, where it is assessed how requirements have been communicated to the next tier suppliers and whether there is an effective process in place to ensure that the next tier suppliers implement the Code.
Risk suppliers with who we have a direct business relationship are included in the supplier sustainability audit program, and most of these are tier 1 suppliers. However, sometimes Philips also selects and prescribes the tier 2 suppliers, in which case these tier 2 suppliers will also be included in the audit program.
Supplier Sustainability Audit Program
We monitor supplier compliance with the Declaration through a system of regular audits. During these audits, an independent external party visits the supplier’s site for several man-days to hold interviews with workers and management, do a factory tour, and review documentation. Based on their risk profile, 576 risk suppliers are included in the supplier audit and development program; the majority of these are in China. During the audits, compliance with all sections of the Declaration is reviewed. In the event of non-compliance (NC) we require suppliers to make a corrective action plan, and we monitor its implementation until all major NCs are resolved. Full-scope audits are conducted in a 3-year cycle; to date we have audited 99% of all identified risk suppliers.

Identifying improvement areas
2014 Audits
In 2014 we audited 203 of our current risk suppliers, including 129 continued conformance audits with suppliers that we already audited in 2011. This includes 7 suppliers from discontinued operations. Risk suppliers from recently acquired companies are also included, and this year we audited 11 suppliers from the acquisitions of Povos and Preethi. As in previous years, the majority of the audits were done in China. Also in Brazil, India and Mexico audits were done, as well as a
Annual Report 2014 225
Table of Contents
Sustainability statements 14.2.8
small number of audits in Indonesia, Russia and Ukraine. With these audits we directly or indirectly impacted almost 160,000 workers employed at the production sites that were audited.
On top of the audits with current risk suppliers, we also audited 35 potential suppliers during the supplier selection process. These potential suppliers need to close any zero-tolerance issues before they can start delivering to Philips. Below we report on the findings at existing suppliers only; findings at potential suppliers are not included in this report since these suppliers are not (yet) part of Philips’ supply base. To track improvements Philips measures the ‘compliance rate’ for the identified risk suppliers, being the percentage of risk suppliers audited within the last 3 years and don’t have - or have resolved all - major NCs. During 2014 we achieved a compliance rate of 86% (2013: 77%).
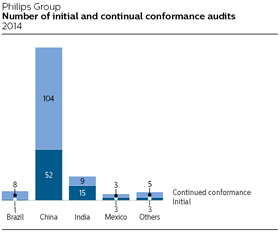
Audit findings
Below table shows the results of the full scope audits done during 2014. When the audit reveals areas of non-compliance we request suppliers to implement corrective actions and our sustainability experts and independent third-party auditors monitor the implementation during resolution audits. The results of the resolution audits are not included in the table below.
226 Annual Report 2014
Table of Contents
Sustainability statements 14.2.8
Philips Group
Summary of 2014 audit findings per region Suppliers without any major non-compliances per category (in % of suppliers audited in 2014) “>90%” means that >90% of the audits done in 2014 showed compliance for a certain category
| China | Asia excl. China | LATAM | EMEA | Total | ||||||||||||||||
|
No. of audits |
156 | 29 | 15 | 3 | 203 | |||||||||||||||
|
Initial audits |
52 | 15 | 4 | 3 | 74 | |||||||||||||||
|
Continued conformance audits |
104 | 14 | 11 | — | 129 | |||||||||||||||
|
Average number of non-compliances per audit |
9 | 22 | 11 | 1 | 11 | |||||||||||||||
|
Workers employed at sites audited |
145,453 | 6,356 | 5,510 | 455 | 157,774 | |||||||||||||||
|
Labor |
||||||||||||||||||||
|
Freely Chosen Employment 1) |
75-90 | % | 10-25 | % | >90 | % | 100 | % | 75-90 | % | ||||||||||
|
Child labor prohibition/young workermanagement 2) |
75-90 | % | 100 | % | 100 | % | 100 | % | 75-90 | % | ||||||||||
|
Working hours |
25-50 | % | 25-50 | % | 100 | % | 100 | % | 50-75 | % | ||||||||||
|
Wages and Benefits |
50-75 | % | 25-50 | % | 100 | % | 100 | % | 50-75 | % | ||||||||||
|
Humane Treatment |
100 | % | >90 | % | >90 | % | 100 | % | >90 | % | ||||||||||
|
Non-discrimination |
>90 | % | 100 | % | 100 | % | 100 | % | >90 | % | ||||||||||
|
Freedom of association |
100 | % | >90 | % | 100 | % | 100 | % | >90 | % | ||||||||||
|
Health & Safety |
||||||||||||||||||||
|
Occupational Safety |
50-75 | % | 25-50 | % | 50-75 | % | 100 | % | 50-75 | % | ||||||||||
|
Emergency Preparedness |
50-75 | % | 10-25 | % | 25-50 | % | 100 | % | 50-75 | % | ||||||||||
|
Occupational Injury and Illness |
50-75 | % | 25-50 | % | 50-75 | % | 50-75 | % | 50-75 | % | ||||||||||
|
Industrial Hygiene |
50-75 | % | 75-90 | % | 75-90 | % | 100 | % | 50-75 | % | ||||||||||
|
Physically demanding work |
100 | % | 75-90 | % | 50-75 | % | 100 | % | >90 | % | ||||||||||
|
Machine safeguarding |
75-90 | % | 75-90 | % | 75-90 | % | 100 | % | 75-90 | % | ||||||||||
|
Food Sanitation and Housing |
50-75 | % | 75-90 | % | 50-75 | % | 100 | % | 50-75 | % | ||||||||||
|
Environment |
||||||||||||||||||||
|
Environmental Permits and Reporting |
75-90 | % | 50-75 | % | >90 | % | 100 | % | 75-90 | % | ||||||||||
|
Pollution prevention and resource reduction |
>90 | % | 50-75 | % | 100 | % | 100 | % | >90 | % | ||||||||||
|
Hazardous substances |
50-75 | % | 75-90 | % | 50-75 | % | 100 | % | 50-75 | % | ||||||||||
|
Waste water and solid waste |
>90 | % | 100 | % | 50-75 | % | 100 | % | >90 | % | ||||||||||
|
Air emissions |
>90 | % | 50-75 | % | 50-75 | % | 100 | % | 75-90 | % | ||||||||||
|
Product content restrictions |
100 | % | 100 | % | 100 | % | 100 | % | 100 | % | ||||||||||
|
Management systems |
||||||||||||||||||||
|
Certified management system |
25-50 | % | 10-25 | % | 10-25 | % | 50-75 | % | 25-50 | % | ||||||||||
|
Company commitment |
>90 | % | 50-75 | % | 50-75 | % | 100 | % | 75-90 | % | ||||||||||
|
Management accountability and responsibility |
75-90 | % | 25-50 | % | 50-75 | % | 50-75 | % | 50-75 | % | ||||||||||
|
Legal and customer requirements |
75-90 | % | 25-50 | % | 50-75 | % | 100 | % | 75-90 | % | ||||||||||
|
Risk assessment and risk management |
75-90 | % | 25-50 | % | 25-50 | % | 100 | % | 50-75 | % | ||||||||||
|
Improvement objectives |
75-90 | % | 25-50 | % | 50-75 | % | 100 | % | 50-75 | % | ||||||||||
|
Training |
75-90 | % | 25-50 | % | 50-75 | % | 100 | % | 75-90 | % | ||||||||||
|
Communication |
75-90 | % | 25-50 | % | 75-90 | % | 100 | % | 75-90 | % | ||||||||||
|
Worker feedback and participation |
>90 | % | 50-75 | % | 50-75 | % | 100 | % | 75-90 | % | ||||||||||
|
Audits and assessments |
50-75 | % | 25-50 | % | 25-50 | % | 100 | % | 50-75 | % | ||||||||||
|
Corrective action process |
75-90 | % | 25-50 | % | 50-75 | % | 100 | % | 75-90 | % | ||||||||||
|
Documentation and records |
75-90 | % | 25-50 | % | >90 | % | 100 | % | 75-90 | % | ||||||||||
|
Supplier responsibility |
75-90 | % | 25-50 | % | 25-50 | % | 100 | % | 50-75 | % | ||||||||||
|
Ethics |
||||||||||||||||||||
|
Business Integrity |
75-90 | % | 10-25 | % | 50-75 | % | 100 | % | 50-75 | % | ||||||||||
|
No improper advantage |
>90 | % | 50-75 | % | 75-90 | % | 100 | % | 75-90 | % | ||||||||||
|
Disclosure of information |
100 | % | 100 | % | 100 | % | 100 | % | 100 | % | ||||||||||
|
Protection of Intellectual Property |
>90 | % | 50-75 | % | 100 | % | 100 | % | >90 | % | ||||||||||
|
Fair business, advertising and competition |
>90 | % | 75-90 | % | 100 | % | 100 | % | >90 | % | ||||||||||
|
Protection of identity |
>90 | % | 50-75 | % | 75-90 | % | 100 | % | 75-90 | % | ||||||||||
|
Responsible sourcing of minerals |
>90 | % | 100 | % | 100 | % | 100 | % | >90 | % | ||||||||||
|
Privacy |
100 | % | 100 | % | 100 | % | 100 | % | 100 | % | ||||||||||
|
Non-retaliation |
>90 | % | 75-90 | % | 100 | % | 100 | % | >90 | % | ||||||||||
|
General |
||||||||||||||||||||
|
EICC Code |
100 | % | 25-50 | % | 100 | % | 100 | % | >90 | % | ||||||||||
| 1) |
Freely Chosen Employment: these cases are related to workers not receiving a contract in their mother language |
| 2) |
Child labor avoidance /young worker management: No cases of child labor were found. The non-compliances identified are related to missing procedures to adequately prevent child labor. |
Annual Report 2014 227
Table of Contents
Sustainability statements 14.2.8
Most frequent areas of non-compliance in 2014
| 1. | Certified Management System (ISO9001, ISO14001, and OHSAS18001) |
| 2. | Emergency Preparedness |
| 3. | Working Hours |
Positive trends compared to last year
| • |
Working Hours (10% less NCs) |
| • |
EICC Code: understanding and commitment of Code and requirements (5% less NCs) |
| • |
Wages and Benefits (5% less NCs) |
Negative trends compared to last year
We see an increase of 5% in the NCs for the following areas:
| • |
Protection of Identity |
| • |
Food, Sanitation and Housing |
| • |
Occupational Injury and Illness |
Management systems
There may be areas where our audits reveal compliance in actual practice, but the related underlying management systems to safeguard continued compliance may not be sufficient. Therefore, also management systems are reviewed during the audits. Although the 2014 audits show improvements compared to previous years, we see this as a continued weak area at suppliers where further capacity building is necessary. Related to management systems the most frequently observed NCs are:
| • |
Certified management system (missing certificate for one or more of these systems: ISO9001, ISO14001, and OHSAS18001) |
| • |
Audits and assessments (no regular self-assessments and follow-up done by supplier) |
| • |
Supplier responsibility (EICC Code requirements have not been communicated to the next tier suppliers) |
Philips Group
Audit progress and targets
|
|
||
| 2014 Goals | Progress | |
|
|
||
| 75% of corrective actions implemented within 90 days (for major NCs found in 2014 audits) | Average NC closure time was around 6 months, mainly due to longer resolution times for working hour issues. Before closing working hours NCs Philips requires at least 3 months’ time records | |
|
2015 Goals
|
||
|
|
||
|
Improve H&S performance of suppliers with 10%
|
||
|
|
||
Implementing corrective actions
On average we see 11 major NCs per supplier audit (2013: 12) and work with each supplier to resolve these NCs within 90 days where possible. Goal is to improve the conditions in the supplier factories. Therefore, we focus on training, supplier development and implementation of corrective action plans with those suppliers. In exceptional cases where the supplier is unwilling to improve, we will decide to end the business relationship, which we did for 3 suppliers in 2014.
If Philips notices that there is a delay in the realization of the corrective action plan by the supplier, Philips uses a stratified approach for consequence management. Depending on the root-cause why the supplier is not taking sufficient corrective actions, Philips can decide to: send a formal warning to the supplier; allocate no new projects; allocate no new orders; or stop doing business.
Collaboration Philips, IPE and suppliers
Next to the supplier sustainability audits that we perform at our suppliers, we also look at insights from external stakeholders to help monitor the performance of our suppliers. For example, we work with the Institute of Public & Environmental Affairs (IPE) who publishes a map of Chinese factories linked to water and air pollution. When we know that one of the mentioned factories is a Philips supplier, we will inform that company to implement corrective actions and will ask IPE to perform a third-party assessment to verify adequate resolution of the issues. By working this way, in we effectively resolved a case of water pollution at a supplier in Guangdong province, China.
Supplier training and capacity building
Based on many years of experience with the audit program, we know that a combination of audits, capacity building, consequence management and structural attention from management is crucial to realize structural and lasting changes at supplier production sites.
We provide classroom training sessions for suppliers, Philips sustainability experts regularly visit suppliers to provide on-site consultancy and training, and we invite
228 Annual Report 2014
Table of Contents
Sustainability statements 14.2.8
suppliers to participate in trainings provided by the EICC. Since 2012 we extended our capacity building initiatives which are offered to help suppliers improve their practices, and we have organized 24 training sessions on the EICC Code of Conduct which were attended by more than 500 Chinese suppliers. We continued our training programs for Philips buyers and quality managers, supporting them to further integrate sustainability in their daily work with suppliers.
To address emerging issues we also provide in-depth capacity building programs to our suppliers on specific topics. These are the highlights from 2014:
| • |
China Health and Safety Program - In August 2014 we kicked-off a program to improve supplier’s health and safety management. It addresses the underlying fundamentals to structurally improve health and safety for workers, e.g. by establishing the necessary management commitment and cultivating a ‘safety first’ culture. Together with 7 pilot suppliers we developed scorecards to measure progress at their production sites. The program now reaches 7,000 workers and will be scaled up in the coming years. |
| • |
Dust Explosion and Prevention - Our safety scans identified 30 suppliers with an unacceptable high safety risk related to dust explosion. We worked on raising awareness with these suppliers, provided training and coaching, and carried out targeted follow-up inspections to ensure suppliers put in place proper controls. |
| • |
Fire Safety - On Philips request, 20 large warehouse suppliers started with monthly self-assessments to improve the fire safety conditions at their storage facilities. |
| • |
Supplier Sustainability Communication Platform - To intensify the transfer of sustainability knowledge and best practices sharing between suppliers, we rolled out an Internet-based information sharing platform. It connects environmental and Health & Safety officers, human resource managers and general managers from 500 suppliers. |
Philips Group
Supplier training and capacity building
|
|
||
| 2014 Goals | Progress | |
|
|
||
| Roll-out best practices and learnings from IDH electronics program to Chinese suppliers included in audit program | During the supplier classroom trainings we included insights from the IDH program. We paid special attention to the relation between worker satisfaction and worker turnover rates, and how factory management can improve these by establishing a communication bridge with workers | |
| Start dedicated 3-year program to improve Health & Safety conditions in supplier factories. Start roll-out to 20% of the Chinese suppliers in 2014 | 57 out of 410 Chinese suppliers now in the program (14%) | |
|
2015 Goals
|
||
|
|
||
| Train 150 suppliers during at least 8 two-day sustainability training sessions to address top sustainability issues from 2014 audits | ||
| Implement corrective actions to close all major NCs identified at supplier sites during 2014. Provide tailor made and on-site capacity building for 90% of the related suppliers in China | ||
|
|
||
IDH Electronics program
Since 2011 Philips has been an active initiator and participant in the IDH Electronics Program , a multi-stakeholder initiative sponsored by the Dutch government to accelerate sustainable trade by building partnerships between leading multinationals, civil society organizations, governments, and other stakeholders.
The IDH Electronics Program aims to support the development of sustainable and innovative workforce management practices for over 75 suppliers. Unlike other CSR programs that have been implemented previously in the industry, this program steers away from traditional auditing methods and seeks to make a significant impact by building and up-scaling the skills of both workers and management. By promoting worker-management dialogue and helping to develop employees’ skills and careers, the program strives to reduce employee turnover and wastage, improve energy efficiency and improve the overall performance of supplier factories. The goal is to jointly improve working conditions for more than 500,000 employees in the electronics sector.
Participating suppliers are given an ‘Entry Point Assessment’ to identify issues that affect factory management and employees, such as worker-management communication, occupational health and safety, production, performance management and environmental issues. This is then used to develop a tailor-made action plan with each supplier, based on improved dialogue between management and employees. Suppliers receive support over a period of up to 24 months, and the cost of the program is shared between the supplier, Philips, and IDH.
In 2013, the program was extended from the Pearl River Delta Area to include the Yangtze River Delta area. Next to Philips, also Apple, Nokia, Dell and Hewlett-Packard and their suppliers are participating in the program. As of year-end 2014, 54 suppliers participate including 21 Philips suppliers.
Annual Report 2014 229
Table of Contents
Sustainability statements 14.2.8
Philips Group
IDH Electronics Program
| 2014 Goals | Progress | |
|
|
||
| Increase number of participating suppliers to 20 | 21 Philips suppliers are now participating | |
| All participating suppliers identify their top 3 improvement actions and develop their work plans | Completed for all 21 suppliers | |
| 70% of all identified top 3 improvement actions implemented by end 2014 | 90% implemented by year-end 2014 | |
|
2015 Goals
|
||
|
|
||
| 3 out of 4 top improvement actions identified for each IDH supplier implemented by end 2015 | ||
|
|
||
Example: IDH case study
N is a Philips supplier participating in the IDH Electronics program since 2013. During their Entry Point Assessment, it quickly became clear that N’s workers and management prioritized two topics: low worker satisfaction and high worker turnover rates. With the help of IDH, the management and workers jointly developed an action plan around three main themes:
| • |
Worker-management dialogue - A worker representative team was elected to help bring messages from the factory floor to top management, including improvement recommendations and worker concerns |
| • |
Worker well-being - Workers designed and implemented a canteen improvement program |
| • |
Working environment - Implementing the 5S methodology to organize the work space for efficiency and effectiveness, including professional working skills training |
During the implementation of above actions in 2014, worker satisfaction increased and N’s management team became increasingly enthusiastic to continue the program in 2015 as worker turnover rates started to decrease and production efficiency improved.
More information on the Supplier Sustainability Involvement Program, the Philips Supplier Sustainability Declaration and audit approach can be found at www.philips.com/suppliers
Addressing issues deeper in the supply chain
Conflict free minerals
Responsible sourcing of minerals is an important part of our supplier sustainability commitment and we implement measures in our chain to ensure that our products are not directly or indirectly funding atrocities in the DRC. Philips works towards the following goals:
| • |
Stop trade in conflict minerals that benefit armed groups in the DRC or an adjoining country |
| • |
Enable legitimate minerals from the region to enter global supply chains, thereby supporting the Congolese economy and the local communities that depend on these exports. |
What are conflict minerals?
Tin, tantalum, tungsten, and gold are used in many different products such as cars, planes, chemicals, jewelry, packaging, and electronics equipment. They come from mines around the world, including mines in the DRC which are estimated to provide 18% of global tantalum production and 2-4% of tin, tungsten, and gold. In the Eastern parts of the DRC a decade-long civil war is continuing. Illegal armed groups control mines and transit routes and use mining profits to fund their violent operations.
The Conflict Free Tin Initiative
Although the DRC has a rich supply of minerals, its economy has collapsed due to decades of ongoing conflict. In an effort to prevent minerals from financing war, many companies worldwide have shied away from purchasing minerals from the DRC, creating a de facto embargo in a region where mining is often the only source of income for local communities. We decided to take the more difficult road, supporting the verifiably conflict-free sourcing from the DRC.
To promote cooperation and economic growth in the DRC region outside the control of the rebels, we launched the Conflict-Free Tin Initiative in 2012 in collaboration with the Dutch Government and other industry partners. This initiative introduced a tightly controlled conflict-free supply chain of tin from a mine in the DRC all the way down to an end-product. The initiative expanded to other mines in the DRC this year and received additional funding from the Dutch Ministry to continue for the next few years. In 2014 we took the decision to include this tin in the regular supply of solder, meaning it is now contained in many different Philips products sold globally.
Conflict-free minerals policy and Supply chain due diligence
Philips has committed not to purchase raw materials, subassemblies, or supplies which we know contain conflict minerals.
230 Annual Report 2014
Table of Contents
Sustainability statements 14.2.8
Philips does not directly source minerals from mines in the DRC or elsewhere, and the supply chain for these metals consists of many tiers, including mines, traders, exporters, smelters, refiners, alloy producers and component manufacturers, before reaching Philips’ direct suppliers.
Cooperation amongst these different tiers in the supply chain, as well as amongst different industries that use these metals, is crucial in effectively breaking the link between mining and conflict financing in the DRC. Therefore Philips continued its active contribution to the Conflict Free Sourcing Initiative which brings together the electronics, automotive and other industries to jointly improve conditions in the extractives industry ( www.conflictfreesourcing.org ). We also continued our engagement with relevant other stakeholders including the European Parliament and local as well as international NGOs.
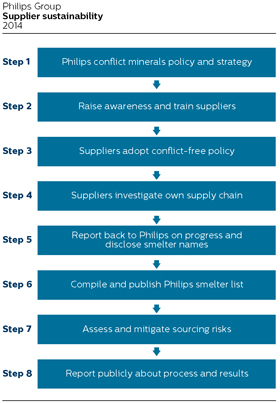
In 2014 we continued our work with 392 priority suppliers – including 13 from discontinued operations – to raise awareness and conduct supply chain investigations into the metal’s country of origin. These suppliers were selected based on largest purchasing spend and metal usage. The Philips conflict minerals support center helps suppliers in undertaking this sometimes daunting task to investigate their long and complex supply chains. We work with suppliers to clarify our expectations, provide support and training, and share our experience and best practices.
We requested our suppliers to adopt and implement a conflict-free minerals policy, to investigate their supply chain and to disclose to us which smelters are used in their supply chains to produce the metals. We carefully reviewed the information received from each supplier, and requested follow-up in case of inconsistent or incomplete answers. The main challenges for suppliers were lack of awareness, limited insight and cooperation at suppliers deeper in the supply chain in order to identify smelters, and the adoption and roll out of a conflict-free supply chain policy.
In line with the US Dodd-Frank Act, we published the first Philips conflict minerals report in June 2014, describing our due diligence process and results. We engaged external auditors to perform an independent private sector audit on this report. Amongst thousands of companies that published their first year reports, Philips is one of only 4 companies that chose to do this voluntary audit.
“I’m impressed that Philips went beyond expectations with its first Conflict Minerals Report, and pleased that the company took a number of actions we consider ‘leading practice’. Philips detailed the supply chain due diligence it undertook, published a list of its identified smelters, and was one of only four companies that had its report independently audited.”
Patricia Jurewicz
Director
Responsible Sourcing Network
Progress identification conflict-free smelters
Smelters mix minerals from many sources and refine them into metal used in our industry. The smelter is at a key point in the supply chain to enforce responsible sourcing by implementing due diligence in selecting their mineral sources. The Conflict-Free Smelter Program (CFSP) identifies smelters that can demonstrate through an independent third-party assessment that the minerals they procure are conflict-free. During 2014 impressive progress was made in validating additional conflict-free smelters, from 64 to 121. As sufficient conflict-free smelters for all four metals become available, Philips will direct its supply chain towards these smelters. See www.conflictfreesmelter.org for more details.
Annual Report 2014 231
Table of Contents
Sustainability statements 14.2.8
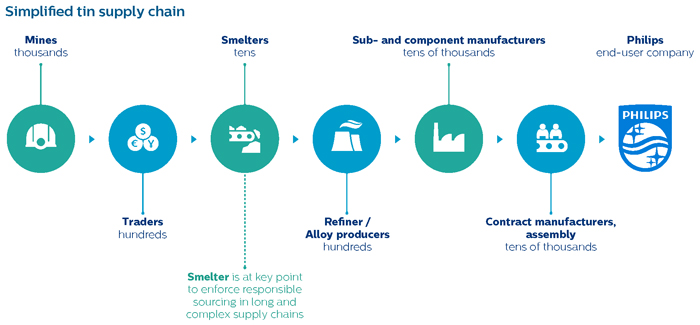
After having identified smelters in our supply chain, we published our smelter list . Back in 2012 Philips was the first company to make its smelter list public. We did this to drive awareness and create a call for action for smelters and all users of these metals. We regularly update the Philips smelter list with new information received from our suppliers. We request the identified smelters to participate in the CFSP.
So far, a total of 257 smelters are included in the Philips smelter list. Majority of these smelters are located in Asia, especially China. 45% (116) of the identified smelters in our chain completed the Conflict-Free Smelter audit (2013: 29%). Within the group of smelters that successfully passed their conflict-free smelter audit, 14 smelters were sourcing conflict-free minerals from the DRC region.
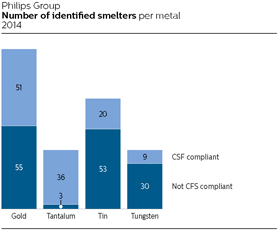
Philips Group
Conflict minerals
2014 - 2015
|
|
||
| 2014 Goals | Progress | |
|
|
||
| Publish a Philips Conflict Minerals Report validated by external auditors | First Conflict Minerals Report was published and Philips was one of the only 4 companies that had their report audited | |
| Implement augmented expectations for supply chain investigations, including stricter criteria for data collection from priority suppliers | In 2014 we worked with suppliers to implement and roll-out a CM policy, collect more information from their next-tier suppliers and disclose additional smelters | |
| Collect Conflict Minerals Reporting Templates from at least 80% of priority suppliers, applying stricter criteria on data quality and completeness than previous year | 98% of the priority suppliers filled out the template questionnaire. 86% were meeting or exceeding the Philips minimum criteria | |
| Conflict Free Tin Initiative: include DRC tin in mainstream solder supply (move from pilot to normal business) | CFTI tin is now part of the regular supply of solder and used in different Philips products | |
|
2015 Goals
|
||
|
|
||
| Request direct suppliers to steer their supply chain towards using only smelters verified as conflict-free by third-party auditors | ||
| Confirm that all active, identified tantalum smelters in our supply chain are verified as conflict-free by third-party auditors | ||
|
|
||
For more details, see www.philips.com/suppliers and the Philips position paper on Conflict Minerals .
232 Annual Report 2014
Table of Contents
Sustainability statements 14.2.8
Tin mining in Indonesia
Indonesia produces roughly one-third of the world’s tin supply, of which the vast majority comes from the islands Bangka and Belitung. Philips is alerted by reports about environmental and social issues associated with this tin production. It is reported that the intensity of tin mining, the illegal small-scale miners and the irresponsible way it is carried out cause environmental devastation and safety risks for miners.
Philips does not directly source tin from Indonesia and there are typically 7 or more tiers in the supply chain between a mine and a Philips supplier. Nevertheless, in 2013 we decided to investigate how we can support the move towards more sustainable mining practices in Indonesia.
We teamed up with other frontrunner companies, the tin industry and civil society in the Indonesian Tin Working Group (TWG), coordinated by the Dutch Sustainable Trade Initiative. The group’s goal is to positively contribute to addressing the sustainability challenges of tin mining and smelting in Bangka and Belitung while recognizing the economic benefits of the sector in terms of development and poverty reduction.
In 2014 the TWG entered the next phase which was co-funded by IDH, Philips and other TWG members. By working with local stakeholders we aim to support Indonesian Government, businesses and civil society efforts, to better formalize Indonesian tin production, make it economically beneficial for local communities, and to reduce negative social and environmental impacts.
“Philips was one of the first companies to step up and show their commitment to supply chain responsibility by working on improving conditions at the deepest level of the supply chain, mineral sourcing. They have taken a proactive leadership role in forming and supporting the IDH Indonesian Tin Working Group in cooperation with Milieudefensie / Friends of the Earth.”
Evert Hassink
Friends of the Earth Netherlands
Other sustainability initiatives in our supply chain
Carbon footprint of our supply chain
To understand the climate change impact of our supply chain, Philips has undertaken two initiatives:
| 1. |
In 2014, we engaged with Trucost to quantify the carbon emissions in our supply chain. Based on supplier spend data analysis by Trucost and extrapolation, estimated CO 2 emissions from purchased goods and services were at approximately 4,200 kilotonnes for the year 2013. This is nearly triple the Philips operational carbon footprint as presented in this report. |
| 2. | Using the CDP (formerly Carbon Disclosure Project) we gain insights into supplier’s climate strategy and carbon footprint to jointly work on reducing emissions in the supply chain. To address our supply chain footprint, we work with first-tier manufacturing and transportation-related suppliers. |
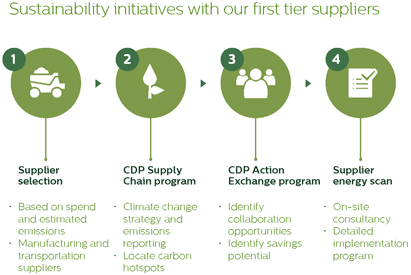
Annual Report 2014 233
Table of Contents
Sustainability statements 14.2.8
CDP supply chain
In 2014 we extended the CDP Supply Chain program to involve an increased number of suppliers by selecting additional suppliers based on spend and expected footprint reduction potential. As a result, we almost doubled the number of suppliers that reported on their carbon footprint and reduction progress. A total of 128 suppliers participated in the CDP Supply Chain program, covering 25% of our procurement spend.
CDP Action Exchange
Having more insight in supplier’s carbon emissions is a first but important step. The next step is footprint reduction by identifying the most impactful interventions in the supply chain. The CDP Action Exchange program supports this second step by connecting suppliers to globally recognized solution providers in the field of energy efficient technology. Philips is a founding member of the CDP Action Exchange program, driven by a willingness to increase focus on energy efficiency in Philips supply chain and to support Philips suppliers to manage their energy strategically and stay competitive.
This year we invited 76 suppliers with the highest CO 2 reduction potential into the CDP Action Exchange program. 24 of these suppliers committed to participate and submitted the necessary information.
Supplier energy scan
As part of the CDP Action Exchange program we piloted a new initiative: the energy scan. This on-site assessment by CDP and the Institute for Industrial Productivity (IIP) looked at energy use, emissions reduction and energy efficiency opportunities and was performed at two supplier facilities in China. The identified savings opportunities are mainly related to optimized energy (re)use and installing more energy efficient technology. The identified energy cost savings potential lies in the range of 3 to 8% with a typical payback period of 1 to 1 1 / 2 year.
Going forward we plan to extend the CDP Supply Chain and Action Exchange programs to an increasing number of suppliers and to offer more suppliers energy scans, with the ambition to further reduce our supply chain carbon footprint.
Philips Group
Carbon footprint of our supply chain
2015 Goals
Extend the CDP Supply Chain invitations to cover top 80% spend from manufacturing and transportation suppliers
Based on CDP Supply Chain results, offer CDP Action Exchange to top 100 suppliers with highest CO 2 reduction potential
Circular Procurement
A key driver in the transition towards a circular economy lies within procurement (see sub-section 14.3.1, EcoVision, of this report). Circular procurement is about making the right choices early on, in the procurement process, to enable reuse of materials at the end-of-use stage. In 2014 initial thoughts and ideas were captured to start making the transition to circular procurement. The expected areas of increased value include:
| • |
Extended and intensified long term business relationships with suppliers and customers |
| • |
Innovative business models addressing access to services and products instead of ownership |
| • |
Re-use of parts and components |
Philips joined the Dutch GreenDeal Circular Procurement in 2014 and it is our objective to actively engage procurement in the realization of a circular economy. 33 organizations are participating in this GreenDeal and it is facilitated by organizations like MVO Nederland, NEVI, and the Dutch Government. Its goal is to accelerate the transition towards a circular economy by implementing circular procurement within purchasing processes, policies and strategy by the end of 2016.
Philips Group
Circular Procurement
2015 Goals
Start 2 circular procurement projects
Train 40% of procurement commodity teams on circular procurement
Process chemicals
In the production process of our products different chemicals are used which can potentially cause environmental and health hazards when used incorrectly. In 2014 we started a new initiative striving to eliminate the usage of hazardous process chemicals in our supply chain and – when no alternatives are available – to minimize the health risks for workers dealing with these chemicals. Philips initiated a new EICC taskforce on process chemicals in the supply chain, which had its start-up meeting in October 2014 in San Francisco.
Objectives of the taskforce are:
| • |
Ensure a safe working environment in supplier factories |
| • |
Develop and define one common industry approach to eliminate hazardous process chemicals |
| • |
Define and maintain one list of “process chemicals of concern” that can be used across different industries, including a plan for substitution or elimination |
| • |
Maintain an active multi-stakeholder dialogue with NGOs and authorities, and share best practices and results |
We will initially focus our efforts on high-risk production processes, including e.g. component manufacturing, sub-assembly and finished goods assembly. A detailed work plan including milestones will be provided by the EICC task force beginning of 2015.
234 Annual Report 2014
Table of Contents
Sustainability statements 14.3
This section provides additional information on (some of) the environmental performance parameters reported section 5.3, Environmental performance, of this report.
14.3.1 EcoVision
Our latest EcoVision program, includes key performance indicators in relation to Green Product sales, Improving people’s lives, Green Innovation, Green Operations, Health & Safety, Employee Engagement and Supplier Sustainability.
Improving people’s lives
At Philips, we strive to make the world healthier and more sustainable through innovation. Our goal is to improve the lives of 3 billion people a year by 2025.
Through Philips products and solutions that directly support the curative or preventive side of people’s health, we improved the lives of 670 million people in 2014, driven by our Healthcare sector. Additionally, our well-being products that help people live a healthy life, and our Green Products that contribute to a healthy ecosystem, improved the lives of 290 million and 1.5 billion people respectively. After the elimination of double counts – people touched multiple times – we arrived at 1.9 billion lives. This is an increase of 200 million compared to in 2013.
Examples of products in the ‘well-being’ category that help people live a healthier life are juicers, blenders, air fryers, but also mother and childcare products. Examples of Green Products, products offering a significant environmental improvement in one or more Green Focal Areas, can be found in sub-section 5.3.2, Green Product sales, of this report. Further details on this parameter and the methodology can be found in the document ‘Improving people’s lives’.
The circular economy program
The circular economy program in Philips has been running for its second year in 2014 and consists of four strategic pillars:
| 1. | Connect to stakeholders outside Philips |
| 2. | Internal employee engagement |
| 3. | Create proof points and metrics |
| 4. | Embed circular economy in Philips processes |
| 1. | Philips takes advantage of the global partnership with the Ellen MacArthur Foundation which includes the CE100 events and education. But also partnerships with Circle Economy Netherlands, Turntoo, World Economic Forum and The Guardian support Philips to take a leading position in driving circular thinking. For example, the opening of the Philips Healthcare Refurbishment factory was followed by a panel discussion on circular economy with Philips, IBM, Ricoh and the Ellen MacArthur Foundation. |
| 2. | Through internal events, presentations, brochures, internal communications, social media, etc. Philips’ employees are inspired and stimulated to start or become involved in circular economy projects. For example, during the Philips Innovation Experience the circular economy framework was explained in detail and demonstrated. |
| 3. | In many Philips business groups circular economy projects have started. These are either linked to customer access over ownership (pay for performance), business model innovations (from transactions to relationships via service and solution models) or reverse cycles (remanufacturing, refurbishment and parts harvesting). To measure progress, a circular economy scorecard has been developed. For example, various Light-as-a-Service projects have started in different areas of the world like in Washington DC with lighting in parking garages of the Washington Metropolitan Area Transit Authority. |
| 4. | As the circular economy touches many different business areas (strategy, design, business development, marketing, finance, etc.) it is important to have the right processes and procedures developed and embedded throughout the company. This is done as part of the development of the Philips Excellence Process Framework. |
More information can be found on the circular economy website .
Operational carbon footprint and energy efficiency – 2014 details
Our operational carbon footprint in 2014 amounted to 1,375 kilotonnes CO 2 -equivalent, a reduction of 36% compared to our 2007 baseline and close to our 40% reduction target for 2015. The 2014 results can be attributed to several factors:
| • |
Accounting for 35% of the total footprint, total CO 2 emissions from manufacturing decreased due to operational changes and decreased energy usage, due to lower load, with an increased share coming from renewable sources. The decrease was in part offset by new acquisitions reporting for the first time. |
| • |
CO 2 emissions from non-industrial operations (offices, warehouses, etc.) represent 9% of the total. The overall floor space in our real estate portfolio increased by 2%. As a result, emissions increased slightly compared to 2013. In 2015 we will continue to focus on the most efficient use of facility space and increase the share of purchased electricity from renewable sources. |
Annual Report 2014 235
Table of Contents
Sustainability statements 14.3.1
| • |
The total CO 2 emissions related to business travel, accounting for 17% of our carbon footprint remained stable compared to 2013. This is mainly attributable to the success of our Green Lease Car policy, as emissions from lease cars decreased by 7%. This mitigated the increase of 5% in our air travel emissions. |
| • |
Overall CO 2 emissions from logistics, representing 39% of the total, decreased slightly by 1% compared to 2013. We recorded an increase of emissions coming from air and parcel freight. However, reduced emissions from road and ocean freight resulted in a downward change for logistics as a total. Due to operational changes, data availability for our road freight activities of Consumer Lifestyle and Healthcare in the APAC region was limited. Therefore, this year we have had to estimate emissions based on revenue trend. During 2015 we will find a suitable solution to ensure data availability. |
Philips Group
Operational carbon footprint for logistics
in kilotonnes CO 2 -equivalent
2010 - 2014
|
|
|
|||||||||||||||||||
| 2010 | 2011 | 2012 | 2013 | 2014 | ||||||||||||||||
|
|
|
|||||||||||||||||||
|
Air transport |
332 | 316 | 295 | 308 | 316 | |||||||||||||||
|
Road transport |
150 | 164 | 98 | 101 | 96 | |||||||||||||||
|
Sea transport |
167 | 152 | 132 | 141 | 133 | |||||||||||||||
|
|
|
|
|
|||||||||||||||||
|
Philips Group |
649 | 632 | 525 | 550 | 545 | |||||||||||||||
|
|
|
|||||||||||||||||||
14.3.2 Biodiversity
Philips recognizes the importance of healthy ecosystems and rich biodiversity for our company, our employees, and society as a whole. We aim to minimize any negative impacts and actively promote ecosystem restoration activities including biodiversity restoration projects with social components, sustainable development, poverty relief.
The Philips Biodiversity policy was issued in 2014 and progress was made on biodiversity management, both on sites (e.g. impact measurement), on natural capital valuation and on the management level. Most initiatives were led by the Philips Leaders for Nature (LFN) team, site management, local sustainability organizations worldwide and Group Sustainability in Eindhoven, the Netherlands. We continued our global partnership with the International Union for the Conservation of Nature (IUCN) Netherlands Committee and our participation in the IUCN LFN program which brings companies, NGOs and governments together to work on the topic of business and biodiversity. Next, we made intensive use of the internal company-wide social network platform to create and share activities and achievements including training programs.
In 2014 a biodiversity impact assessment was performed for all our industrial sites, using the geo-locations of these sites and the Integrated Biodiversity Assessment Tool (IBAT). For every industrial site the nearest Key Biodiversity Area or IUCN protected area was determined as well as the distance to such area. After further validation with our industrial site staff, it appeared that only our Glemsford (UK) site is located within a radius of 1 kilometer from such an area, the Glemsford Pits, but has no impact on its biodiversity. The results of our assessment for all industrial sites can be found at www.philips.com/sustainability .
Philips continued in 2014 to work with Trucost and performed an Environmental Profit and Loss (EP&L) analysis to help identify natural capital dependency “hot spots” and place a financial value on Philips environmental impacts. The environmental impact of Philips itself is limited as the company is not very energy intensive and is not emitting large quantities of high impact substances. The impact of our supply chain however is significantly higher than our own impact. For this reason, we used the identified hot-spots in our supply chain as input for our CDP Supply Chain program. More information on that program can be found at sub-section 14.2.8, Supplier indicators, of this report. In this Annual Report, Philips has also followed the IIRC Integrated Reporting <IR> framework which includes natural capital as a source of value creation. Together with the WBCSD we are further developing the EP&L concept and methodology, including the environmental benefits.
14.3.3 Green Operations
Our Green Operations program, related to improving the environmental performance of our manufacturing facilities, focuses on most contributors to climate change, but also addresses water, recycling of waste and chemical substances.
In the course of 2013 we implemented an improved process to report chemicals used in processes in more detail. New chemicals on which we will focus our reduction efforts and new reduction targets will be incorporated in the next Green Operations program.
236 Annual Report 2014
Table of Contents
Sustainability statements 14.3.3
Philips Group
Green Operations in % unless otherwise stated
2014
|
|
|
|||||||||||
| 2007 | 2014 | 2015 | ||||||||||
| baseline year | actual 1) | target 1) | ||||||||||
|
|
|
|||||||||||
|
Total CO 2 from manufacturing |
|
873 kilotonnes
CO
2
-
equivalent |
|
(46 | ) | (25 | ) | |||||
|
Water |
4.0 million m | 3 | (21 | ) | (10 | ) | ||||||
|
Materials provided for recycling via external contractor per total waste |
79 | 80 | 80 | |||||||||
|
Restricted substances: |
||||||||||||
|
Benzene emission |
52 kg | (100 | ) | (50 | ) | |||||||
|
Mercury emission |
185 kg | (96 | ) | (100 | ) | |||||||
|
CFCs, HCFCs |
156 kg | (100 | ) | (100 | ) | |||||||
|
Hazardous substances |
||||||||||||
|
Lead emission |
1,838 kg | (100 | ) | (100 | ) | |||||||
|
PFCs |
1,534 kg | (100 | ) | (35 | ) | |||||||
|
Toluene emission |
2,210 kg | (93 | ) | (90 | ) | |||||||
|
Xylene emission |
4,502 kg | 410 | (90 | ) | ||||||||
|
Styrene |
80,526 kg | (94 | ) | (90 | ) | |||||||
|
Antimony, Arsenic and their compounds |
18 kg | (100 | ) | (100 | ) | |||||||
|
|
|
|||||||||||
| 1) |
Against the base year 2007 |
Energy use in manufacturing
Total energy usage in manufacturing amounted to 11,257 terajoules in 2014, of which Lighting consumes about 74%. Compared to 2013, energy consumption at Philips went down by 6%. This was driven by a decrease of activities in high energy intensive operations in Lighting, organizational changes, and energy efficiency improvements, partly offset by new acquisitions reporting for the first time. The energy use of our discontinued operations amounted to 2,160 terajoules in 2014 (2013: 2,197 terajoules).
Philips Group
Total energy consumption in manufacturing in terajoules
2010 - 2014
|
|
|
|||||||||||||||||||
| 2010 | 2011 | 2012 | 2013 | 2014 | ||||||||||||||||
|
|
|
|||||||||||||||||||
|
Healthcare |
1,545 | 1,541 | 1,798 | 1,794 | 1,773 | |||||||||||||||
|
Consumer Lifestyle |
1,274 | 1,252 | 1,104 | 1,142 | 1,115 | |||||||||||||||
|
Lighting |
9,618 | 9,237 | 9,112 | 9,027 | 8,369 | |||||||||||||||
|
Innovation, Group & Services |
27 | — | — | — | — | |||||||||||||||
|
|
|
|||||||||||||||||||
|
Philips Group |
12,464 | 12,030 | 12,014 | 11,963 | 11,257 | |||||||||||||||
|
|
|
|||||||||||||||||||
Carbon emissions in manufacturing
The greenhouse gas emissions of our manufacturing operations totaled 474 kilotonnes CO 2 -equivalent in 2014, 10% lower than in 2013. This is the result of the decreased energy usage, operational changes, partly offset with new acquisitions reporting for the first time. Indirect CO 2 emissions overall decreased mainly due to increased usage of electricity generated by renewable sources. The carbon emissions of our discontinued operations amounted to 144 kilotonnes CO 2 -equivalent in 2014 (2013: 187 kilotonnes CO 2 -equivalent). Lumileds operations also reduced the carbon emission due to decreased usage of SF 6 , a substance with very high Global Warming Potential (GWP).
Philips Group
Total carbon emissions in manufacturing
in kilotonnes CO 2 -equivalent
2010 - 2014
|
|
|
|||||||||||||||||||
| 2010 | 2011 | 2012 | 2013 | 2014 | ||||||||||||||||
|
|
|
|||||||||||||||||||
|
Direct CO 2 1) |
295 | 290 | 278 | 276 | 253 | |||||||||||||||
|
Indirect CO 2 |
287 | 238 | 253 | 214 | 191 | |||||||||||||||
|
Other greenhouse gases |
5 | 4 | 6 | 7 | 6 | |||||||||||||||
|
From glass production |
25 | 28 | 27 | 27 | 24 | |||||||||||||||
|
|
|
|||||||||||||||||||
|
Philips Group 2) |
612 | 560 | 564 | 524 | 474 | |||||||||||||||
|
|
|
|||||||||||||||||||
| 1) |
From energy |
| 2) |
Excluding new acquisitions therefore different from Operational carbon footprint |
CO 2 emissions decreased at Healthcare due to energy efficiency improvements and increased use of electricity generated by renewable sources; this was however partly mitigated by new acquisitions reporting for the first time.
At Consumer Lifestyle, CO 2 emissions decreased due to the energy saving programs which more than offset the increase caused by two new reporting sites. Lighting decreased its CO 2 emissions due to lower load of energy intense activities, organizational changes and using more electricity generated by renewable sources.
Philips Group
Total carbon emissions in manufacturing per sector
in kilotonnes CO 2 -equivalent
2010 - 2014
|
|
|
|||||||||||||||||||
| 2010 | 2011 | 2012 | 2013 | 2014 | ||||||||||||||||
|
|
|
|||||||||||||||||||
|
Healthcare |
60 | 56 | 79 | 58 | 52 | |||||||||||||||
|
Consumer Lifestyle |
44 | 41 | 39 | 38 | 34 | |||||||||||||||
|
Lighting |
507 | 463 | 446 | 428 | 388 | |||||||||||||||
|
Innovation, Group & Services |
1 | — | — | — | — | |||||||||||||||
|
|
|
|||||||||||||||||||
|
Philips Group |
612 | 560 | 564 | 524 | 474 | |||||||||||||||
|
|
|
|||||||||||||||||||
Restricted substances
Emissions of restricted substances totaled 9 kilos in 2014, on par with 2013. Mercury, only used in Lighting, accounts for 8 kilos of emissions in this category. With the Green Operations program we continue to focus on a reduction of a selection of the most important substances in our processes. The Lumileds and Automotive operations did not have emissions of restricted substances.
Philips Group
Restricted substances in kilos
2010 - 2014
|
|
|
|||||||||||||||||||
| 2010 | 2011 | 2012 | 2013 | 2014 | ||||||||||||||||
|
|
|
|||||||||||||||||||
|
Benzene and Benzene compounds |
101 | 55 | — | — | — | |||||||||||||||
|
Mercury and Mercury Compounds |
83 | 51 | 54 | 8 | 8 | |||||||||||||||
|
CFCs/HCFCs 1) |
4 | 5 | 1 | 1 | 1 | |||||||||||||||
|
|
|
|||||||||||||||||||
|
Restricted substances |
188 | 111 | 55 | 9 | 9 | |||||||||||||||
|
|
|
|||||||||||||||||||
| 1) |
Excluding cooling systems |
Benzene
Lighting was the only sector that used benzene in manufacturing, but has been successful in 2012 in the phase out of benzene.
Annual Report 2014 237
Table of Contents
Sustainability statements 14.3.3
Mercury
Mercury emissions in Lighting remained stable at 8 kilos in 2013 and 2014. As a result of changes in the manufacturing process, for the second year in a row, Lighting achieved its mercury emission at the as low as reasonably achievable level, according to our assessment.
CFCs/HCFCs
In 2014 total emissions from CFCs/HCFCs remained at 1 kg.
Hazardous substances
As described above, reduction targets have been set on a selected number of hazardous substances in our Green Operations program. In the following section our results are described. The Lumileds and Automotive data was excluded from the overview. The emissions from PFCs is material for a Lumileds site in Asia.
Philips Group
Hazardous substances in kilos
2010 - 2014
|
|
|
|||||||||||||||||||
| 2010 | 2011 | 2012 | 2013 | 2014 | ||||||||||||||||
|
|
|
|||||||||||||||||||
|
Lead and lead compounds |
108 | 44 | 73 | 1 | 8 | |||||||||||||||
|
PFCs (Per Fluorinated Compounds) |
1 | 1 | — | — | — | |||||||||||||||
|
Toluene |
6,745 | 5,745 | 6,184 | 1,188 | 162 | |||||||||||||||
|
Xylene |
30,491 | 37,889 | 18,944 | 28,176 | 22,979 | |||||||||||||||
|
Styrene |
22,920 | 19,920 | 42,329 | 5,753 | 5,161 | |||||||||||||||
|
Antimony, Arsenic and their compounds |
7 | 5 | — | — | — | |||||||||||||||
|
|
|
|||||||||||||||||||
|
Hazardous substances |
60,272 | 63,604 | 67,530 | 35,118 | 28,310 | |||||||||||||||
|
|
|
|||||||||||||||||||
Lead and lead compounds
The very limited increase from 1 kilo in 2013 to 8 kilos in 2014 in lead emissions were the result of adjustments in the calculation method.
PFCs
PFCs were only used in Lumileds sites. As a result of the exclusion of Lumileds and Automotive, Philips does not report any PFCs in 2014. Emissions by Lumileds were 3,392 kilos in 2014, a reduction of 36% compared to 2013.
Toluene
The emission of toluene, mainly used in wet lacquers, decreased by 86% in 2014 largely as a result of phase out programs in 2 sites in Consumer Lifestyle.
Xylene
The use of xylene decreased by 18% in 2014 due to the reduction in use of specific lacquers and thinners in Consumer Lifestyle combined with portfolio changes in Lighting.
Styrene
Two new reporting sites in Consumer Lifestyle emitted some 3,000 kilos of styrene which was mitigated by the termination of activities of a Lighting site in the USA.
Antimony, Arsenic and their compounds
Lighting was successful in phasing-out these substances as of 2012.
ISO 14001 certification
In 2014, 79% of reporting manufacturing sites were certified, the same level as in the previous year. In Lighting, several certified sites were closed, whereas new certificates were obtained by other sites. After Consumer Lifestyle, in 2014 Philips obtained a “One Lighting Certificate” covering most of the Lighting manufacturing sites. All sectors have plans for new acquisitions to be certified.
Philips Group
ISO 14001 certification as a % of all reporting organizations
2010 - 2014
|
|
|
|||||||||||||||||||
| 2010 | 2011 | 2012 | 2013 | 2014 | ||||||||||||||||
|
|
|
|||||||||||||||||||
|
Philips Group |
94 | 87 | 69 | 79 | 79 | |||||||||||||||
|
|
|
|||||||||||||||||||
Environmental Incidents
In 2014, there were neither incidents nor fines reported in Healthcare. Consumer Lifestyle reported two incidents related to waste water and a leakage, and a non-compliance with water which did not result in a fine. Three non-compliances were reported in Lighting relating to emissions, as well as one incident related to waste water. The two fines related to non-compliance which were reported in our sustainability reporting tool were not material. For discontinued operations an incident was reported related to waste and two non-compliances were reported which resulted in one non-material fine.
238 Annual Report 2014
Table of Contents
Sustainability statements 14.3.3
Sustainability world map
| Total waste | Emission (kg) | |||||||||||||||||||||||||||||||
| Markets |
Manufacturing sites |
Lost Workday Injury rate 1) |
CO 2 emitted (Tonnes CO 2 ) |
Waste (Tonnes) |
Recycled (%) |
Water (m 3 ) |
Restricted substances |
Hazardous substances |
||||||||||||||||||||||||
|
Africa |
0 | 0.00 | — | — | — | — | — | — | ||||||||||||||||||||||||
|
ASEAN 2) |
5 | 0.11 | 92,635 | 5,165 | 61 | % | 210,934 | — | 536 | |||||||||||||||||||||||
|
Benelux |
11 | 0.24 | 27,396 | 9,433 | 78 | % | 597,615 | 1 | 109 | |||||||||||||||||||||||
|
Central & East Europe |
7 | 0.24 | 70,804 | 17,744 | 88 | % | 482,069 | 2 | 18,258 | |||||||||||||||||||||||
|
DACH |
4 | 0.48 | 3,829 | 2,258 | 87 | % | 63,867 | 1 | 12 | |||||||||||||||||||||||
|
France |
2 | 0.94 | 1,336 | 538 | 69 | % | 10,071 | — | 25 | |||||||||||||||||||||||
|
Greater China |
11 | 0.13 | 91,134 | 5,735 | 89 | % | 745,281 | 2 | 449 | |||||||||||||||||||||||
|
Iberia |
2 | 0.81 | 2,594 | 1,617 | 74 | % | 44,673 | — | 0 | |||||||||||||||||||||||
|
Indian Subcontinent |
5 | 0.05 | 73,087 | 8,354 | 99 | % | 259,529 | — | 3,030 | |||||||||||||||||||||||
|
Italy, Israel and Greece |
4 | 0.54 | 5,062 | 1,542 | 65 | % | 25,397 | — | 2,764 | |||||||||||||||||||||||
|
Japan |
0 | 0.00 | — | — | — | — | — | — | ||||||||||||||||||||||||
|
Latin America |
6 | 0.03 | 508 | 1,065 | 93 | % | 26,204 | — | 788 | |||||||||||||||||||||||
|
Middle East & Turkey |
0 | 0.00 | — | — | — | — | — | — | ||||||||||||||||||||||||
|
Nordics |
2 | 0.00 | 45 | 139 | 100 | % | 3,828 | — | 0 | |||||||||||||||||||||||
|
North America 3) |
32 | 0.28 | 105,004 | 20,100 | 69 | % | 599,894 | 3 | 2,332 | |||||||||||||||||||||||
|
Russia and Central Asia |
0 | 0.00 | — | — | — | — | — | — | ||||||||||||||||||||||||
|
UK & Ireland |
2 | 0.20 | 1,059 | 1,332 | 83 | % | 33,708 | — | 7 | |||||||||||||||||||||||
| 1) |
Includes manufacturing and non-manufacturing sites |
| 2) |
One manufacturing site did not start to report environmental data yet |
| 3) |
Two manufacturing sites did not start to report environmental data yet |
Annual Report 2014 239
Table of Contents
Sustainability statements 14.4
14.4 Independent Auditor’s Assurance Report
To: The Supervisory Board of Koninklijke Philips N.V.
Our Opinion
We have audited the information in the chapter Sustainability statements and the sections Social performance and Environmental performance in the Annual Report 2014 (further ‘The Sustainability Information’) of Koninklijke Philips N.V., Eindhoven, the Netherlands. In our opinion, The Sustainability Information presents fairly, in all material respects, the sustainability performance of Philips in accordance with the reporting criteria as mentioned below.
We report, to the extent we can assess, that the information on sustainability in the rest of the Annual Report 2014 is consistent with The Sustainability Information.
Basis for our opinion
We conducted our engagement in accordance with the Dutch Standard 3810N: “Assurance engagements relating to sustainability reports”, which is a specified standard under the International Standard on Assurance Engagement (ISAE) 3000: “Assurance Engagement other than Audits or Reviews of Historical Financial Information”.
Our responsibilities under Standard 3810N and procedures performed have been further specified in the paragraph titled “Our responsibility for reasonable assurance on The Sustainability Information”.
We are independent of Koninklijke Philips N.V. in accordance with the “Verordening inzake de onafhankelijkheid van accountants bij assurance-opdrachten” (ViO) and other relevant independence requirements in The Netherlands. Furthermore we have complied with the “Verordening gedrags- en beroepsregels accountants” (VGBA).
We do not provide any assurance on the achievability of the objectives, targets and expectations of Philips.
We believe that the assurance evidence we have obtained is sufficient and appropriate to provide a basis for our opinion.
Responsibilities of the Board of Management for The Sustainability Information
The Board of Management is responsible for the preparation and fair presentation of The Sustainability Information in accordance with the Sustainability Reporting Guidelines G4 of the Global Reporting Initiative, supported by internally developed guidelines as described in Approach to sustainability reporting in the chapter Sustainability statements, of this Annual Report. It is important to view the performance data in the context of these criteria.
As part of this, the Board of Management is responsible for such internal control as the Board of Management determines is necessary to enable the preparation of The Sustainability Information that is free from material misstatement, whether due to fraud and error.
Our responsibility for reasonable assurance on The Sustainability Information
Our objective is to plan and perform the reasonable assurance assignment in a manner that allows us to obtain sufficient and appropriate assurance evidence for our opinion.
Our assurance engagement has been performed with a high, but not absolute, level of assurance, which means we may not have detected all errors and fraud.
Our procedures included performing a risk assessment, assessing the appropriateness of the accounting and other policies used, evaluating the design and implementation, and testing the operating effectiveness of the systems and processes for collecting and processing the qualitative and quantitative information in The Sustainability Information including the implementation of these at a number of sites, and evaluating the overall presentation of sustainability information within our scope. Also we held interviews with relevant management and tested documentation on a sample basis to determine whether the information is supported by sufficient evidence.
Amsterdam, The Netherlands
February 24, 2015
KPMG Accountants N.V.
E.H.W. Weusten RA
240 Annual Report 2014
Table of Contents
Sustainability statements 14.5
14.5 Global Reporting Initiative (GRI) table 4.0
KPMG has audited chapter 12, Group financial statements, of this report and chapter 13, Company financial statements, of this report, as well as sections section 5.2, Social performance, of this report, section 5.3, Environmental performance, of this report and chapter 14, Sustainability statements, of this report. Where in the table cross-reference is made to these parts, the information is included in the scope of one of these audits. For the other information in the report, KPMG has assessed whether this information is consistent with the information in the aforementioned parts. Where there is no cross-reference to a section in the Report, assurance is not applicable. Please refer to section 13.5, Independent auditor’s report, of this report and section 14.4, Independent Auditor’s Assurance Report, of this report.
Annual Report 2014 241
Table of Contents
Sustainability statements 14.5
General Standard Disclosures
|
|
||||||
|
profile disclosure |
description | cross-reference | ||||
| Strategy and analysis | ||||||
| G4-1 | Statement from the most senior decision-maker of the organization (incl. strategy relates to sustainability, impacts of the activities in relation to the stakeholders) | chapter 2, Message from the CEO | ||||
| G4-2 | Description of key impacts, risks, and opportunities |
chapter 2, Message from the CEO section 7.2, Risk categories and factors section 7.3, Strategic risks section 7.4, Operational risks section 7.5, Compliance risks section 7.6, Financial risks section 7.7, Separation risk chapter 14, Sustainability statements - “Material aspects and our focus” |
||||
|
|
||||||
|
|
||||||
|
profile
disclosure |
description | cross-reference | ||||
| Organizational profile | ||||||
| G4-3 | Name of the organization | chapter 11, Corporate governance | ||||
| G4-4 | Primary brands, products, and/or services |
section 4.2, How we create value sub-section 6.1.2, About Philips Healthcare |
||||
| sub-section 6.2.2, About Philips Consumer Lifestyle | ||||||
| sub-section 6.3.2, About Philips Lighting | ||||||
| G4-5 | Location of organization’s headquarters | section 11.5, Investor Relations | ||||
| G4-6 | Number of countries where the organization operates, and names of countries with either major operations or that are specifically relevant to the sustainability issues covered in the report |
chapter 6, Sector performance note 2, Information by sector and main country note 5, Interests in entities Related content: Philips sites |
||||
| G4-7 | Nature of ownership and legal form | chapter 11, Corporate governance | ||||
| G4-8 | Markets served (including geographic breakdown, sectors served and types of customers/beneficiaries) |
chapter 1, Performance highlights section 4.4, Lives improved section 4.5, Global presence chapter 6, Sector performance |
||||
| G4-9 | Scale of the reporting organization | chapter 1, Performance highlights | ||||
| section 4.2, How we create value | ||||||
| section 5.1, Financial performance | ||||||
| note 2, Information by sector and main country | ||||||
|
|
||||||
| note 6, Income from operations | ||||||
| G4-10 | Total workforce by employment type, gender, employment contract and region |
sub-section 5.2.3, Diversity and inclusion sub-section 5.2.4, Employment note 6, Income from operations |
||||
| G4-11 | Percentage of employees covered by collective bargaining agreements | For all Philips businesses, guidance is applicable regarding collective bargaining agreements. See General Business Principles. | ||||
| The actual percentage of employees covered by collective bargaining agreements is managed and monitored at local level. Philips considers this percentage on consolidated level not relevant. | ||||||
| G4-12 | Describe the organization’s supply chain (incl. product or service providers, engaged suppliers in total number, type, and location, payments made to suppliers) |
chapter 14, Sustainability statements section 14.1, Economic indicators sub-section 14.2.8, Supplier indicators Related content: Supplier Sustainability Involvement program |
||||
| G4-13 | Significant changes during the reporting period relating to size, structure, or ownership or its supply chain (incl. changes in location, operations, facilities, capital information and supplier information) |
sub-section 5.1.11, Discontinued operations sub-section 5.1.13, Acquisitions and divestments sub-section 5.1.15, Cash flows provided by continuing operations sub-section 5.1.16, Cash flows from discontinued operations section 17.2, Share information note 3, Discontinued operations and other assets classified as held for sale |
||||
|
note 4, Acquisitions and divestments chapter 14, Sustainability statements sub-section 14.2.8, Supplier indicators |
||||||
| G4-14 | Explanation of whether and how the precautionary approach or principle is addressed by the organization |
section 7.1, Our approach to risk management and business control section 11.1, Board of Management - “Risk management approach” |
||||
| G4-15 | Externally developed economic, environmental, and social charters, principles, or other initiatives to which the organization subscribes or endorses |
sub-section 5.2.8, Working with stakeholders chapter 14, Sustainability statements sub-section 14.2.8, Supplier indicators - “IDH Electronics program” sub-section 14.2.7, Stakeholder Engagement |
||||
242 Annual Report 2014
Table of Contents
Sustainability statements 14.5
|
|
||||||
|
profile disclosure |
description | cross-reference | ||||
| G4-16 | Memberships in associations (such as industry associations) | chapter 14, Sustainability statements – “Stakeholders” sub-section 14.2.7, Stakeholder Engagement | ||||
|
|
||||||
|
|
||||||
|
profile disclosure |
description | cross-reference | ||||
| Identified material aspects and boundaries | ||||||
| G4-17 | Operational structure of the organization, including main divisions, operating companies, subsidiaries, and joint ventures (List all entities in the consolidated financial statements) |
chapter 1, Performance highlights chapter 6, Sector performance note 2, Information by sector and main country |
||||
| G4-18 | Process for defining report content and the Aspect Boundaries and explain how the Reporting Principles has been implemented | chapter 14, Sustainability statements | ||||
| G4-19 | List all the material Aspects identified | chapter 14, Sustainability statements | ||||
| G4-20 |
The Aspect Boundary within the organization: Whether the Aspect is material within the organization; The list of entities included in G4-17 for which the Aspect is or is not material; Specific limitation regarding the Aspect Boundary within the organization |
chapter 14, Sustainability statements | ||||
| G4-21 |
The Aspect Boundary outside the organization: Whether the Aspect is material outside the organization; The list of entities for which the Aspect is material, relate to geographical location; Specific limitation regarding the Aspect Boundary outside the organization |
chapter 14, Sustainability statements | ||||
| G4-22 | Explanation of the effect of any re-statements |
|
||||
| chapter 14, Sustainability statements – “Comparability and completeness” | ||||||
| G4-23 | Significant changes from previous reporting periods in the Scope and Aspect Boundaries | chapter 14, Sustainability statements | ||||
|
|
||||||
|
|
||||||
|
profile
disclosure |
description | cross-reference | ||||
| Stakeholder engagement | ||||||
| G4-24 | List of stakeholder groups engaged by the organization |
sub-section 5.2.8, Working with stakeholders chapter 14, Sustainability statements – “Stakeholders” |
||||
| G4-25 | Basis for identification and selection of stakeholders with whom to engage |
sub-section 5.2.8, Working with stakeholders chapter 14, Sustainability statements – “Stakeholders” |
||||
| G4-26 | Approaches to stakeholder engagement, including frequency of engagement by type and by stakeholder group | sub-section 5.2.8, Working with stakeholders chapter 14, Sustainability statements – “Stakeholders” | ||||
| G4-27 |
Key topics and concerns that have been raised through stakeholder engagement, and how the organization has responded to those key topics and concerns, including through its reporting; Report the stakeholder groups that raised each of the key topics and concerns |
sub-section 5.2.8, Working with stakeholders chapter 14, Sustainability statements sub-section 14.2.7, Stakeholder Engagement |
||||
|
|
||||||
|
|
||||||
|
profile
disclosure |
description | cross-reference | ||||
| Report profile | ||||||
| G4-28 | Reporting period | section 12.1, Management’s report on internal control | ||||
| chapter 14, Sustainability statements | ||||||
| G4-29 | Date of most recent previous report | chapter 16, Five-year overview | ||||
| G4-30 | Reporting cycle | chapter 16, Five-year overview | ||||
| G4-31 | Contact point for questions regarding the report or its contents | section 17.6, Investor contact | ||||
| G4-32 | Table identifying the location of the Standard Disclosures in the report | chapter 14, Sustainability statements – “Reporting standards” | ||||
Annual Report 2014 243
Table of Contents
Sustainability statements 14.5
|
|
||||||
|
profile disclosure |
description | cross-reference | ||||
| section 14.5, Global Reporting Initiative (GRI) table 4.0 | ||||||
| G4-33 | Policy and current practice with regard to seeking external assurance for the report |
section 10.3, Report of the Audit Committee section 11.4, Meeting logistics and other information - “Audit of the financial reporting and the position of the external auditor” section 12.1, Management’s report on internal control section 12.2, Report of the independent auditor section 12.3, Independent auditors’ report on internal control over financial reporting section 13.5, Independent auditor’s report note B, Audit fees section 13.5, Independent auditor’s report chapter 14, Sustainability statements - “External assurance” section 14.4, Independent Auditor’s Assurance Report |
||||
|
|
||||||
|
|
||||||
|
profile
disclosure |
description | cross-reference | ||||
| Governance | ||||||
| G4-34 | Governance structure of the organization (incl. report the committees responsible for decision-making on economic, environmental and social impacts) |
chapter 11, Corporate governance section 11.1, Board of Management section 11.2, Supervisory Board section 11.3, General Meeting of Shareholders section 11.4, Meeting logistics and other information chapter 14, Sustainability statements - “Sustainability governance” |
||||
| G4-35 | Process for delegating authority for economic, environmental and social topics |
section 11.1, Board of Management section 11.2, Supervisory Board chapter 14, Sustainability statements - “Sustainability governance” |
||||
| G4-36 | Whether the organization has appointed an executive-level position or positions with responsibility for economic, environmental and social topics, and whether post holders report directly to the highest governance body |
chapter 8, Management - “Executive Vice President & Chief Strategy and Innovation Officer” section 11.1, Board of Management section 11.2, Supervisory Board chapter 14, Sustainability statements - “Sustainability governance” |
||||
| G4-37 | Processes for consultation between stakeholders and the highest governance body on economic, environmental and social topics (to whom, any feedback) |
sub-section 5.2.2, Employee engagement sub-section 5.2.8, Working with stakeholders section 11.5, Investor Relations chapter 14, Sustainability statements - “Stakeholders” sub-section 14.2.7, Stakeholder Engagement section 17.6, Investor contact |
||||
| G4-38 | The composition of the highest governance body and its committees |
chapter 8, Management - “Executive Vice President & Chief Strategy and Innovation Officer” chapter 9, Supervisory Board section 11.1, Board of Management section 11.2, Supervisory Board chapter 14, Sustainability statements - “Sustainability governance” |
||||
| G4-39 | Indicate whether the Chair of the highest governance body is also an executive officer | section 11.1, Board of Management | ||||
| G4-40 | Process for determining the qualifications and expertise of the members of the highest governance body |
chapter 10, Supervisory Board report section 10.1, Report of the Corporate Governance and Nomination & Selection Committee section 11.2, Supervisory Board |
||||
| G4-41 | Processes in place for the highest governance body to ensure, that conflicts of interest are avoided |
section 11.1, Board of Management section 11.2, Supervisory Board |
||||
| G4-42 | Roles in the development, approval, and updating of the organization’s purpose, value or mission statements, strategies, policies, and goals |
chapter 10, Supervisory Board report section 11.1, Board of Management section 11.2, Supervisory Board section 11.3, General Meeting of Shareholders section 11.4, Meeting logistics and other information chapter 14, Sustainability statements - “Sustainability governance” |
||||
| G4-43 | The measures taken to develop and enhance the highest governance body’s collective knowledge |
chapter 10, Supervisory Board report section 11.1, Board of Management section 11.2, Supervisory Board |
||||
| G4-44 | Processes for evaluating the highest governance body’s own performance |
section 7.1, Our approach to risk management and business control chapter 10, Supervisory Board report section 11.1, Board of Management section 11.2, Supervisory Board chapter 14, Sustainability statements - “Sustainability governance” |
||||
| G4-45 | Procedures of the highest governance body for overseeing the organization’s identification and management of performance, including relevant risks and |
section 7.1, Our approach to risk management and business control chapter 10, Supervisory Board report chapter 11, Corporate governance |
||||
244 Annual Report 2014
Table of Contents
Sustainability statements 14.5
|
|
||||||
|
profile disclosure |
description | cross-reference | ||||
| opportunities, and adherence or compliance with internationally agreed standards, codes of conduct and principles |
section 11.1, Board of Management section 11.2, Supervisory Board |
|||||
| G4-46 | The highest governance body’s role in reviewing the effectiveness of the organization’s risk management processes for economic, environmental and social topics |
section 7.1, Our approach to risk management and business control section 10.3, Report of the Audit Committee section 11.1, Board of Management chapter 14, Sustainability statements - “Sustainability governance” |
||||
| G4-47 | The frequency of the highest governance body’s review of economic, environmental and social impacts, risks, and opportunities |
section 7.1, Our approach to risk management and business control section 10.3, Report of the Audit Committee section 11.1, Board of Management chapter 14, Sustainability statements - “Sustainability governance” |
||||
| G4-48 | The highest committee or position that formally reviews and approves the organization’s sustainability report and ensures that all material Aspects are covered |
chapter 10, Supervisory Board report chapter 14, Sustainability statements - “Sustainability governance” |
||||
| G4-49 | The process for communicating critical concerns to the highest governance body |
sub-section 5.2.7, Philips’ General Business Principles renewed section 7.1, Our approach to risk management and business control section 11.1, Board of Management |
||||
| G4-50 | The nature and total number of critical concerns that were communicated to the highest governance body and the mechanism(s) used to address and resolve them | sub-section 14.2.5, General Business Principles | ||||
| G4-51 | Linkage between compensation for members of the highest governance body, senior managers, and executives, and the organization’s performance | section 10.2, Report of the Remuneration Committee note 29, Information on remuneration | ||||
| G4-52 |
The process for determining remuneration; Whether remuneration consultants are involved |
section 10.2, Report of the Remuneration Committee section 11.1, Board of Management section 11.2, Supervisory Board
|
||||
| G4-53 | Mechanisms for shareholders and employees to provide recommendations or direction to the highest governance body |
section 11.3, General Meeting of Shareholders section 11.4, Meeting logistics and other information section 11.5, Investor Relations |
||||
| G4-54 | The ratio of the annual total compensation for the organization’s highest-paid individual in each country of significant operations to the median annual total compensation for all employees (excluding the highest-paid individual) in the same country |
Philips does not consider this indicator relevant, Philips makes an impact on local communities by the salaries it pays its employees. Salaries are based on industry norms as described in General Business Principles. |
||||
| G4-55 | The ratio of percentage increase in annual total compensation for the organization’s highest-paid individual in each country of significant operations to the median percentage increase in annual total compensation for all employees (excluding the highest-paid individual) in the same country |
Philips does not consider this indicator relevant, Philips makes an impact on local communities by the salaries it pays its employees. Salaries are based on industry norms as described in General Business Principles. |
||||
|
|
||||||
|
|
||||||
|
profile
disclosure |
description | cross-reference | ||||
|
Ethics and integrity |
||||||
| G4-56 | Internally developed statements of mission or values, codes of conduct, and principles relevant to economic, environmental, and social performance and the status of their implementation |
sub-section 5.2.7, Philips’ General Business Principles renewed section 7.1, Our approach to risk management and business control See General Business Principles. |
||||
| G4-57 | The internal and external mechanisms for seeking advice on ethical and lawful behavior, and matters related to organizational integrity, such as helplines or advice lines |
sub-section 5.2.7, Philips’ General Business Principles renewed section 7.1, Our approach to risk management and business control |
||||
| G4-58 | The internal and external mechanisms for reporting concerns about unethical or unlawful behavior, and matters related to organizational integrity, such as escalation through line management, whistleblowing mechanisms or hotlines | sub-section 14.2.5, General Business Principles | ||||
|
|
||||||
Annual Report 2014 245
Table of Contents
Sustainability statements 14.5
| Specific Standard Disclosures | ||||||
|
|
||||||
|
profile disclosure |
description | cross-reference | ||||
| Economic | ||||||
| Economic performance | ||||||
| G4-EC1 |
Direct economic value generated and distributed, including revenues, operating costs, employee wages and benefits, payments to providers of capital, payments to government (by country) and community investments; EVG&D separately at country, regional or market level |
chapter 1, Performance highlights section 4.2, How we create value sub-section 5.2.9, Social Investment Programs sub-section 14.2.6, The Philips Foundation
section 14.1, Economic indicators |
||||
| G4-EC2 | Financial implications and other risks and opportunities for the organization’s activities due to climate change |
sub-section 5.3.1, Green Innovation sub-section 5.3.2, Green Product sales section 7.4, Operational risks - “Any damage to Philips’ reputation could have an adverse effect on its businesses.” sub-section 14.3.1, EcoVision - “Operational carbon footprint and energy efficiency - 2014 details” sub-section 14.3.3, Green Operations |
||||
| G4-EC3 | Coverage of the organization’s defined-benefit plan obligations |
|
||||
| G4-EC4 | Significant financial assistance received from government | Philips does not receive significant financial assistance from governments. | ||||
| Market presence | ||||||
| G4-EC5 | Ratios of standard entry level wage by gender compared to local minimum wage at significant locations of operation |
For all Philips businesses, guidance is applicable regarding equal and fair treatment and wages and payment. See General Business Principles - “1.1 Fair employment practices” Actual ratios are managed and monitored at local level. Philips considers this ratio on consolidated level not relevant. |
||||
| G4-EC6 | Procedures for local hiring and proportion of senior management hired from the local community at significant locations of operation |
sub-section 5.2.3, Diversity and inclusion sub-section 5.2.4, Employment |
||||
| Indirect economic impacts | ||||||
| G4-EC7 | Development and impact of infrastructure investments and services supported |
sub-section 5.2.8, Working with stakeholders sub-section 5.2.9, Social Investment Programs sub-section 6.1.3, 2014 highlights sub-section 6.3.3, 2014 highlights sub-section 14.2.7, Stakeholder Engagement |
||||
| G4-EC8 | Significant indirect economic impacts, including the extent of impacts |
sub-section 5.2.8, Working with stakeholders sub-section 5.2.9, Social Investment Programs sub-section 6.1.3, 2014 highlights sub-section 6.3.3, 2014 highlights sub-section 14.2.7, Stakeholder Engagement |
||||
| Procurement practices | ||||||
| G4-EC9 | Proportion of spending on local suppliers at significant locations of operation |
section 14.1, Economic indicators Related content: Supplier Sustainability Involvement program |
||||
|
|
||||||
|
|
||||||
|
profile
disclosure |
description | cross-reference | ||||
| Environment | ||||||
| Materials | ||||||
| G4-EN1 | Materials used by weight or volume |
sub-section 5.3.3, Green Operations sub-section 14.3.3, Green Operations |
||||
| G4-EN2 | Percentage of materials used that are recycled input materials |
sub-section 5.3.1, Green Innovation sub-section 5.3.3, Green Operations chapter 14, Sustainability statements sub-section 14.3.3, Green Operations |
||||
| Energy | ||||||
| G4-EN3 | Energy consumption within the organization |
sub-section 5.3.3, Green Operations sub-section 14.3.3, Green Operations |
||||
| G4-EN4 | Energy consumption outside of the organization | sub-section 14.2.8, Supplier indicators - “Other sustainability initiatives in our supply chain” | ||||
| G4-EN5 | Energy intensity |
sub-section 5.3.3, Green Operations sub-section 14.3.1, EcoVision |
||||
| G4-EN6 | Reduction of energy consumption |
sub-section 5.3.3, Green Operations sub-section 14.3.3, Green Operations |
||||
| G4-EN7 | Reductions in energy requirements of products and services |
sub-section 5.3.1, Green Innovation sub-section 5.3.2, Green Product sales chapter 14, Sustainability statements |
||||
246 Annual Report 2014
Table of Contents
Sustainability statements 14.5
|
|
||||||
|
profile
disclosure |
description | cross-reference | ||||
| Water | ||||||
| G4-EN8 | Total water withdrawal by source |
sub-section 5.3.3, Green Operations sub-section 14.3.3, Green Operations |
||||
| G4-EN9 | Water sources significantly affected by withdrawal of water | Philips is not a water-intensive company, so this indicator is not applicable for Philips. | ||||
| G4-EN10 | Percentage and total volume of water recycled and reused | Philips is not a water-intensive company, so this indicator is not applicable for Philips. | ||||
| Biodiversity | ||||||
| G4-EN11 | Location and size of land owned, leased, managed in or adjacent to protected areas and areas of high biodiversity value outside protected areas | sub-section 14.3.2, Biodiversity | ||||
| G4-EN12 | Description of significant impacts of activities, products and services on biodiversity in protected areas and areas of high biodiversity value outside protected areas | sub-section 14.3.2, Biodiversity | ||||
| G4-EN13 | Habitats protected or restored | sub-section 14.3.2, Biodiversity | ||||
| G4-EN14 | Total number of IUCN Red List species and national conservation list species with habitats in areas affected by operations, by level of extinction risk | sub-section 14.3.2, Biodiversity | ||||
| Emissions | ||||||
| G4-EN15 | Direct greenhouse gas (GHG) emissions (Scope 1) |
sub-section 5.3.3, Green Operations sub-section 14.3.3, Green Operations |
||||
| G4-EN16 | Indirect greenhouse gas (GHG) emissions (Scope 2) |
sub-section 5.3.3, Green Operations sub-section 14.3.3, Green Operations |
||||
| G4-EN17 | Other indirect greenhouse gas (GHG) emissions (Scope 3) |
sub-section 5.3.3, Green Operations sub-section 14.2.8, Supplier indicators |
||||
| G4-EN18 | Greenhouse gas (GHG) emissions intensity | sub-section 5.3.3, Green Operations | ||||
| G4-EN19 | Emissions of ozone-depleting substances (ODS) | sub-section 14.3.3, Green Operations | ||||
| G4-EN20 | Emissions of ozone-depleting substances by weight | sub-section 14.3.3, Green Operations | ||||
| G4-EN21 | NOx, SOx, and other significant air emissions | Philips does not report this indicator in the Annual Report, but in the Carbon Disclosure Project (CDP) reporting. | ||||
| Effluents and Waste | ||||||
| G4-EN22 | Total water discharge by quality and destination | Philips is not a water-intensive company, so this indicator is not applicable for Philips. | ||||
| G4-EN23 | Total weight of waste by type and disposal method |
sub-section 5.3.3, Green Operations sub-section 14.3.3, Green Operations |
||||
| G4-EN24 | Total number and volume of significant spills | sub-section 14.3.3, Green Operations | ||||
| G4-EN25 | Weight of transported, imported, exported, or treated waste deemed hazardous under the terms of the Basel Convention2 Annex I, II, III, and VIII, and percentage of transported waste shipped internationally | sub-section 14.3.3, Green Operations | ||||
| G4-EN26 | Identity, size, protected status, and biodiversity value of water bodies and related habitats significantly affected by the organization’s discharges of water and runoff | sub-section 14.3.2, Biodiversity | ||||
| Products and Services | ||||||
| G4-EN27 | Extent of impact mitigation of environmental impacts of products and services | sub-section 5.3.1, Green Innovation | ||||
| G4-EN28 | Percentage of products sold and their packaging materials that are reclaimed by category | sub-section 5.3.1, Green Innovation | ||||
| Compliance | ||||||
| G4-EN29 | Monetary value of significant fines and total number of non-monetary sanctions for non-compliance with environmental laws and regulations |
note 26, Contingent assets and liabilities sub-section 14.3.3, Green Operations –“Environmental Incidents” |
||||
| Transport | ||||||
| G4-EN30 | Significant environmental impacts of transporting products and other goods and materials for the organization’s operations, and transporting members of the workforce | sub-section 5.3.3, Green Operations | ||||
| Overall | ||||||
Annual Report 2014 247
Table of Contents
Sustainability statements 14.5
|
|
||||||
|
profile
disclosure |
description | cross-reference | ||||
| G4-EN31 | Total environmental protection expenditures and investments by type |
chapter 14, Sustainability statements sub-section 14.3.2, Biodiversity Philips does not monitor such expenditures at Group level |
||||
| Supplier environmental assessment | ||||||
| G4-EN32 | Percentage of new suppliers that were screened using environmental criteria |
sub-section 5.2.10, Supplier sustainability chapter 14, Sustainability statements - “Supplier audits” |
||||
| G4-EN33 | Significant actual and potential negative environmental impacts in the supply chain and actions taken | sub-section 14.2.8, Supplier indicators | ||||
| Environmental grievance mechanisms | ||||||
| G4-EN34 | Number of grievances about environmental impacts filed, addressed, and resolved through formal grievance mechanisms | sub-section 14.3.3, Green Operations - “Environmental Incidents” | ||||
|
|
||||||
|
|
||||||
|
profile
disclosure |
description | cross-reference | ||||
| Labor practices and decent work | ||||||
| Employment | ||||||
| G4-LA1 | Total workforce by employment type, employment contract and region |
sub-section 5.2.3, Diversity and inclusion sub-section 5.2.4, Employment
|
||||
| G4-LA2 | Benefits provided to full-time employees that are not provided to temporary or part-time employees, by significant locations of operation |
Benefits provided are fully compliant with all applicable national laws. See General Business Principles . |
||||
| G4-LA3 | Return to work and retention rates after parental leave, by gender |
For all Philips businesses, guidance is applicable regarding equal and fair treatment. See General Business Principles . Actual rates are managed and monitored at local level. Philips considers this rate on consolidated level not relevant. |
||||
| Labor/Management relations | ||||||
| G4-LA4 | Minimum notice periods regarding operational changes, including whether these are specified in collective agreements |
For all Philips businesses, guidance is applicable regarding Employment conditions. See General Business Principles . Notice periods are managed and monitored at local level. Philips considers this data on consolidated level not relevant. |
||||
| Occupational health and safety | ||||||
| G4-LA5 | Percentage of total workforce represented in formal joint management–worker health and safety committees that help monitor and advise on occupational health and safety programs |
On sector level, different initiatives exist to help decrease the number and severeness of Lost Workday Injuries cases. See sub-section 5.2.6, Health and Safety The percentage of total workforce represented is managed and monitored at local level. Philips considers this data on consolidated level not relevant. |
||||
| G4-LA6 | Type of injury and rates of injury, occupational diseases, lost days, and absenteeism, and total number of work-related fatalities, by region and by gender |
sub-section 5.2.6, Health and Safety sub-section 14.3.3, Green Operations - “Sustainability world map” On site level, insights exist in gender specific information. Philips considers this data on consolidated level not relevant. |
||||
| G4-LA7 | Workers with high incidence or high risk of diseases related to their occupation | sub-section 5.2.6, Health and Safety | ||||
| G4-LA8 | Health and safety topics covered in formal agreements with trade unions |
See General Business Principles . The content of formal agreements with trade unions varies per country. The inclusion of Health and Safety topics in these agreements is monitored locally and not considered relevant to be reported at Group level. |
||||
| Training and education | ||||||
| G4-LA9 | Average hours of training per year per employee by gender, and by employee category |
sub-section 5.2.5, Developing our people The number of enrollments and the training spend are managed and monitored on consolidated level. The hours of training per year per employee are managed and monitored on local level. Philips considers these data on consolidated level not relevant. |
||||
| G4-LA10 | Programs for skills management and lifelong learning that support the continued employability of employees and assist them in managing career endings | sub-section 5.2.5, Developing our people | ||||
| G4-LA11 | Percentage of employees receiving regular performance and career | sub-section 5.2.5, Developing our people | ||||
248 Annual Report 2014
Table of Contents
Sustainability statements 14.5
|
|
||||||
|
profile
disclosure |
description | cross-reference | ||||
| development reviews, by gender and by employee category | Philips implemented a semi-annual performance review, but does not track the percentage of employees benefitting from this centrally. | |||||
| Diversity and equal opportunity | ||||||
| G4-LA12 | Composition of governance bodies and breakdown of employees per category according to gender, age group, minority group membership and other indicators of diversity |
sub-section 5.2.3, Diversity and inclusion section 11.1, Board of Management section 11.2, Supervisory Board |
||||
| Equal remuneration for women and men | ||||||
| G4-LA13 | Ratio of basic salary and remuneration of women to men by employee category, by significant locations of operation |
For all Philips businesses, guidance is applicable regarding equal and fair treatment and wages and payment. See General Business Principles . Actual ratios are managed and monitored at local level. Philips considers this ratio on consolidated level not relevant. |
||||
| Supplier assessment for labor practices | ||||||
| G4-LA14 | Percentage of new suppliers that were screened using labor practices criteria |
sub-section 5.2.10, Supplier sustainability chapter 14, Sustainability statements - “Supplier audits” |
||||
| G4-LA15 | Significant actual and potential negative impacts for labor practices in the supply chain and actions taken | sub-section 14.2.8, Supplier indicators | ||||
| Labor practices grievance mechanisms | ||||||
| G4-LA16 | Number of grievances about labor practices filed, addressed, and resolved through formal grievance mechanisms |
sub-section 5.2.10, Supplier sustainability sub-section 14.2.5, General Business Principles sub-section 14.2.8, Supplier indicators See General Business Principles . |
||||
|
|
||||||
|
|
||||||
|
profile
disclosure |
description | cross-reference | ||||
| Human rights | ||||||
| Investment | ||||||
| G4-HR1 | Total number and percentage of significant investment agreements and contracts that include human rights clauses or that underwent human rights screening |
sub-section 5.2.10, Supplier sustainability chapter 14, Sustainability statements See General Business Principles . Philips does not monitor the percentage centrally. |
||||
| G4-HR2 | Total hours of employee training on human rights policies or procedures concerning aspects of human rights that are relevant to operations, including the percentage of employees trained |
sub-section 5.2.7, Philips’ General Business Principles renewed sub-section 14.2.5, General Business Principles sub-section 14.2.8, Supplier indicators For all Philips businesses, guidance is applicable regarding employee training on human rights policies as part of the GBP. Total hours of employee training are managed and monitored at local level. Philips considers these data on consolidated level not relevant. |
||||
| Non-discrimination | ||||||
| G4-HR3 | Total number of incidents of discrimination and actions taken |
sub-section 14.2.5, General Business Principles sub-section 14.2.8, Supplier indicators |
||||
| Freedom of association and collective bargaining | ||||||
| G4-HR4 | Operations and suppliers identified in which the right to exercise freedom of association and collective bargaining may be violated or at significant risk, and measures taken to support these rights |
sub-section 14.2.5, General Business Principles sub-section 14.2.8, Supplier indicators |
||||
| Child Labor | ||||||
| G4-HR5 | Operations and suppliers identified as having significant risk for incidents of child labor, and measures taken to contribute to the effective abolition of child labor |
sub-section 14.2.5, General Business Principles sub-section 14.2.8, Supplier indicators |
||||
| Forced or compulsory labor | ||||||
| G4-HR6 | Operations and suppliers identified as having significant risk for incidents of forced or compulsory labor, and measures to contribute to the elimination of all forms of forced or compulsory labor |
sub-section 14.2.5, General Business Principles sub-section 14.2.8, Supplier indicators |
||||
Annual Report 2014 249
Table of Contents
Sustainability statements 14.5
|
|
||||||
|
profile
disclosure |
description | cross-reference | ||||
| Security practices | ||||||
| G4-HR7 | Percentage of security personnel trained in the organization’s human rights policies or procedures that are relevant to operations | The actual percentage of security personnel trained in the organization’s human rights policies or procedures that are relevant to operations is managed and monitored at local level. Philips considers this data on consolidated level not relevant. | ||||
| Indigenous rights | ||||||
| G4-HR8 | Total number of incidents of violations involving rights of indigenous people and actions taken | Philips is not operational in areas with indigenous people. Therefore this indicator is not relevant. | ||||
| Assessment | ||||||
| G4-HR9 | Total number and percentage of operations that have been subject to human rights reviews or impact assessments | The total number and percentage of operations that have been subject to human rights reviews or impact assessments are managed and monitored at local level. Philips considers this data on consolidated level not relevant. | ||||
| Supplier human rights assessment | ||||||
| G4-HR10 | Percentage of new suppliers that were screened using human rights criteria |
sub-section 5.2.10, Supplier sustainability sub-section 5.2.11, Conflict minerals: issues further down the chain chapter 14, Sustainability statements - “Supplier audits” |
||||
| G4-HR11 | Significant actual and potential negative human rights impacts in the supply chain and actions taken | sub-section 14.2.8, Supplier indicators | ||||
| Human rights grievance mechanisms | ||||||
| G4-HR12 | Number of grievances about human rights impacts filed, addressed, and resolved through formal grievance mechanisms |
sub-section 5.2.10, Supplier sustainability sub-section 14.2.5, General Business Principles sub-section 14.2.8, Supplier indicators See General Business Principles . |
||||
|
|
||||||
|
|
||||||
|
profile
disclosure |
description | cross-reference | ||||
| Society | ||||||
| Local Communities | ||||||
| G4-SO1 | Percentage of operations with implemented local community engagement, impact assessments, and development programs |
sub-section 5.2.8, Working with stakeholders sub-section 5.2.9, Social Investment Programs sub-section 6.1.3, 2014 highlights sub-section 6.3.3, 2014 highlights sub-section 14.2.7, Stakeholder Engagement Philips has groupwide community involvement programs and policies that its sites implement and evaluate at local level. Philips does not consider the calculation of an overall percentage as relevant in this context. |
||||
| G4-SO2 | Operations with significant actual or potential negative impacts on local communities | sub-section 14.3.3, Green Operations - “Sustainability world map” | ||||
| Anti-corruption | ||||||
| G4-SO3 | Total number and percentage of operations assessed for risks related to corruption and the significant risks identified |
section 7.1, Our approach to risk management and business control sub-section 14.2.5, General Business Principles |
||||
| G4-SO4 | Communication and training on anti-corruption policies and procedures | sub-section 5.2.7, Philips’ General Business Principles renewed | ||||
| G4-SO5 | Confirmed incidents of corruption and actions taken | sub-section 14.2.5, General Business Principles | ||||
| Public Policy | ||||||
| G4-SO6 | Total value of political contributions by country and recipient/beneficiary | Philips does not make political contributions as defined in General Business Principles - 2.5 Dealing responsibly with government, political parties and politicians. | ||||
| Anti-competitive Behavior | ||||||
| G4-SO7 | Total number of legal actions for anti-competitive behavior, anti-trust, and monopoly practices and their outcomes | section 7.5, Compliance risks | ||||
| Compliance | ||||||
| G4-SO8 | Monetary value of significant fines and total number of non-monetary sanctions for non-compliance with laws and regulations | note 26, Contingent assets and liabilities | ||||
| Supplier assessment for impacts on society | ||||||
250 Annual Report 2014
Table of Contents
Sustainability statements 14.5
|
|
||||||
|
profile
disclosure |
description | cross-reference | ||||
| G4-SO9 | Percentage of new suppliers that were screened using criteria for impacts on society |
sub-section 5.2.10, Supplier sustainability chapter 14, Sustainability statements |
||||
| G4-SO10 | Significant actual and potential negative impacts on society in the supply chain and actions taken | sub-section 14.2.8, Supplier indicators | ||||
| Grievance mechanisms for impacts on society | ||||||
| G4-SO11 | Number of grievances about impacts on society filed, addressed, and resolved through formal grievance mechanisms |
sub-section 5.2.10, Supplier sustainability sub-section 14.2.5, General Business Principles sub-section 14.2.8, Supplier indicators sub-section 14.3.3, Green Operations - “Environmental incidents” See General Business Principles . |
||||
|
|
||||||
|
|
||||||
|
profile disclosure |
description | cross-reference | ||||
| Product responsibility | ||||||
| Customer health and safety | ||||||
| G4-PR1 | Life cycle stages in which health and safety impacts of products and services are assessed for improvement, and percentage of significant products and services categories subject to such procedures | All significant products are assessed in terms of Health and Safety impact during the design phase as part of our EcoDesign procedure, but also during the sourcing phase. For more information on EcoDesign refer to sub-section 5.3.1, Green Innovation, for more information on our sourcing refer to sub-section 14.2.8, Supplier indicators. | ||||
| G4-PR2 | Total number of incidents of non-compliance with regulations and voluntary codes concerning the health and safety impacts of products and services during their life cycle, by type of outcomes |
Philips plans to report on this indicator in 2015. Information on current consumer product recalls can be found on www.recall.philips.com |
||||
| Product and service labeling | ||||||
| G4-PR3 | Type of product and service information required by procedures, and percentage of significant products and services subject to such information requirements | The type of product and service information provided on our products is based on local and/or regional requirements e.g. EU-CE safety marking and performance markings based on ErP directive. For all significant products certain kind of labelling is needed based on different regulations. | ||||
| G4-PR4 | Total number of incidents of non-compliance with regulations and voluntary codes concerning product and service information and labeling, by type of out comes | Philips plans to report on this indicator in 2015. | ||||
| G4-PR5 | Results of surveys measuring customer satisfaction | Philips measures the Net Promoter Scores, but does not disclose these for confidentiality reason. | ||||
| Marketing communications | ||||||
| G4-PR6 | Sale of banned or disputed products | Philips did not sale any banned or disputed products in 2014. | ||||
| G4-PR7 | Total number of incidents of non-compliance with regulations and voluntary codes concerning marketing communications , including advertising, promotion, and sponsorship, by type of outcomes | Philips did not experience any non-compliance related to marketing communications in 2014. | ||||
| Customer privacy | ||||||
| G4-PR8 | Total number of substantiated complaints regarding breaches of customer privacy and losses of customer data | section 7.5, Compliance risks - “Philips is exposed to non-compliance with data privacy and product safety laws.” | ||||
| Compliance | ||||||
| G4-PR9 | Monetary value of significant fines for non-compliance with laws and regulations concerning the provision and use of products and services |
|
||||
|
|
||||||
Disclosure of management approach
|
|
||||||
| Material Aspects | DMA and Indicators | Omissions | External Assurance | |||
| chapter 14, Sustainability statements - “Key material aspects” |
chapter 14, Sustainability statements - “Key material aspects” section 14.5, Global Reporting Initiative (GRI) table 4.0 - “Specific Standard Disclosures” |
section 14.5, Global Reporting Initiative (GRI) table 4.0 - “Cross-reference” | section 14.4, Independent Auditor’s Assurance Report | |||
|
|
||||||
Annual Report 2014 251
Table of Contents
Reconciliation of non-GAAP information 15
15 Reconciliation of non-GAAP information
Explanation of Non-GAAP measures
Koninklijke Philips N.V. (the ‘Company’) believes that an understanding of sales performance is enhanced when the effects of currency movements and acquisitions and divestments (changes in consolidation) are excluded. Accordingly, in addition to presenting ‘nominal growth’, ‘comparable growth’ is provided.
Comparable sales growth
Comparable sales exclude the effects of currency movements and changes in consolidation. As indicated in the note 1, Significant accounting policies, sales and income are translated from foreign currencies into the Company’s reporting currency, the euro, at the exchange rate on transaction dates during the respective years. As a result of significant currency movements during the years presented, the effects of translating foreign currency sales amounts into euros could have a material impact. Therefore, these impacts have been excluded in arriving at the comparable sales in euros. Currency effects have been calculated by translating previous years’ foreign currency sales amounts into euros at the following year’s exchange rates in comparison with the sales in euros as historically reported. Years under review were characterized by a number of acquisitions and divestments, as a result of which activities were consolidated or deconsolidated. The effect of consolidation changes has also been excluded in arriving at the comparable sales. For the purpose of calculating comparable sales growth, when a previously consolidated entity is sold or contributed to a venture that is not consolidated by the Company, relevant sales are excluded from impacted prior-year periods. Similarly, when an entity is acquired, relevant sales are excluded from impacted periods.
Philips Group
Sales growth composition per sector in %
2012 - 2014
|
|
|
|||||||||||||||
| comparable growth | currency effects | consolidation changes | nominal growth | |||||||||||||
|
|
|
|||||||||||||||
|
2014 versus 2013 |
||||||||||||||||
|
Healthcare |
(2.0 | ) | (1.6 | ) | (0.5 | ) | (4.1 | ) | ||||||||
|
Consumer Lifestyle |
5.8 | (3.1 | ) | 0.0 | 2.7 | |||||||||||
|
Lighting |
(2.6 | ) | (2.3 | ) | 1.0 | (3.9 | ) | |||||||||
|
Innovation, Group & Services |
(11.8 | ) | (0.1 | ) | 2.9 | (9.0 | ) | |||||||||
|
|
|
|||||||||||||||
|
Philips Group |
(0.9 | ) | (2.0 | ) | 0.2 | (2.7 | ) | |||||||||
|
2013 versus 2012 |
||||||||||||||||
|
Healthcare |
0.8 | (4.6 | ) | (0.3 | ) | (4.1 | ) | |||||||||
|
Consumer Lifestyle |
10.0 | (3.4 | ) | 0.0 | 6.6 | |||||||||||
|
Lighting |
1.3 | (3.5 | ) | 0.0 | (2.2 | ) | ||||||||||
|
Innovation, Group & Services |
(0.3 | ) | (0.4 | ) | 6.4 | 5.7 | ||||||||||
|
|
|
|||||||||||||||
|
Philips Group |
2.7 | (3.9 | ) | 0.1 | (1.1 | ) | ||||||||||
|
2012 versus 2011 |
||||||||||||||||
|
Healthcare |
6.4 | 6.4 | 0.0 | 12.8 | ||||||||||||
|
Consumer Lifestyle |
8.7 | 4.4 | 1.4 | 14.5 | ||||||||||||
|
Lighting |
3.6 | 4.4 | 2.5 | 10.5 | ||||||||||||
|
Innovation, Group & Services |
(5.6 | ) | 1.7 | (4.5 | ) | (8.4 | ) | |||||||||
|
|
|
|||||||||||||||
|
Philips Group |
5.5 | 5.2 | 0.9 | 11.6 | ||||||||||||
|
|
|
|||||||||||||||
252 Annual Report 2014
Table of Contents
Reconciliation of non-GAAP information 15
Philips Group
Sales growth composition per geographic cluster in %
2012 - 2014
|
|
|
|||||||||||||||
| comparable growth | currency effects | consolidation changes | nominal growth | |||||||||||||
|
|
|
|||||||||||||||
|
2014 versus 2013 |
||||||||||||||||
|
Western Europe |
(0.9 | ) | 0.4 | 0.2 | (0.3 | ) | ||||||||||
|
North America |
(1.8 | ) | (0.9 | ) | (0.3 | ) | (3.0 | ) | ||||||||
|
Other mature geographies |
(0.9 | ) | (4.7 | ) | 0.0 | (5.6 | ) | |||||||||
|
|
|
|||||||||||||||
|
Mature geographies |
(1.3 | ) | (0.8 | ) | (0.1 | ) | (2.2 | ) | ||||||||
|
Growth geographies |
0.0 | (4.4 | ) | 0.7 | (3.7 | ) | ||||||||||
|
|
|
|||||||||||||||
|
Philips Group |
(0.9 | ) | (2.0 | ) | 0.2 | (2.7 | ) | |||||||||
|
2013 versus 2012 |
||||||||||||||||
|
Western Europe |
0.0 | (0.6 | ) | 0.5 | (0.1 | ) | ||||||||||
|
North America |
(2.9 | ) | (3.1 | ) | (0.2 | ) | (6.2 | ) | ||||||||
|
Other mature geographies |
10.1 | (13.5 | ) | 0.0 | (3.4 | ) | ||||||||||
|
|
|
|||||||||||||||
|
Mature geographies |
(0.3 | ) | (3.3 | ) | 0.1 | (3.5 | ) | |||||||||
|
Growth geographies |
8.9 | (5.1 | ) | 0.0 | 3.8 | |||||||||||
|
|
|
|||||||||||||||
|
Philips Group |
2.7 | (3.9 | ) | 0.1 | (1.1 | ) | ||||||||||
|
2012 versus 2011 |
||||||||||||||||
|
Western Europe |
(0.8 | ) | 1.0 | 2.6 | 2.8 | |||||||||||
|
North America |
2.4 | 8.6 | (0.7 | ) | 10.3 | |||||||||||
|
Other mature geographies |
9.2 | 9.1 | (0.1 | ) | 18.2 | |||||||||||
|
|
|
|||||||||||||||
|
Mature geographies |
1.9 | 5.6 | 0.7 | 8.2 | ||||||||||||
|
Growth geographies |
13.6 | 4.3 | 1.4 | 19.3 | ||||||||||||
|
|
|
|||||||||||||||
|
Philips Group |
5.5 | 5.2 | 0.9 | 11.6 | ||||||||||||
|
|
|
|||||||||||||||
Adjusted IFO
The Company uses the term IFO and Adjusted IFO to evaluate the performance of the Philips Group and its operating sectors. The term IFO has the same meaning as Income from operations (IFO). Referencing Adjusted IFO will make the underlying performance of our businesses more transparent by factoring out the amortization of acquired intangible assets. Adjusted IFO represents income from operations before amortization and impairment of intangible assets generated in acquisitions (excluding software and capitalized development expenses).
Philips Group
Adjusted IFO to Income from operations (or IFO) in millions of EUR
2012 - 2014
|
|
|
|||||||||||||||||||
| Philips Group | Healthcare | Consumer Lifestyle | Lighting |
Innovation, Group
& Services |
||||||||||||||||
|
|
|
|||||||||||||||||||
|
2014 |
||||||||||||||||||||
|
Adjusted IFO |
821 | 616 | 573 | 293 | (661 | ) | ||||||||||||||
|
Amortization of intangible assets 1) |
(332 | ) | (159 | ) | (53 | ) | (106 | ) | (14 | ) | ||||||||||
|
Impairment of goodwill |
(3 | ) | (1 | ) | — | (2 | ) | — | ||||||||||||
|
|
|
|||||||||||||||||||
|
Income from operations (or IFO) |
486 | 456 | 520 | 185 | (675 | ) | ||||||||||||||
|
2013 |
||||||||||||||||||||
|
Adjusted IFO |
2,276 | 1,512 | 483 | 580 | (299 | ) | ||||||||||||||
|
Amortization of intangible assets 1) |
(393 | ) | (195 | ) | (54 | ) | (141 | ) | (3 | ) | ||||||||||
|
Impairment of goodwill |
(28 | ) | (2 | ) | — | (26 | ) | — | ||||||||||||
|
|
|
|||||||||||||||||||
|
Income from operations (or IFO) |
1,855 | 1,315 | 429 | 413 | (302 | ) | ||||||||||||||
|
2012 |
||||||||||||||||||||
|
Adjusted IFO |
1,003 | 1,226 | 456 | 69 | (748 | ) | ||||||||||||||
|
Amortization of intangible assets 1) |
(411 | ) | (200 | ) | (56 | ) | (147 | ) | (8 | ) | ||||||||||
|
|
|
|||||||||||||||||||
|
Income from operations (or IFO) |
592 | 1,026 | 400 | (78 | ) | (756 | ) | |||||||||||||
|
|
|
|||||||||||||||||||
| 1) |
Excluding amortization of software and product development. |
Annual Report 2014 253
Table of Contents
Reconciliation of non-GAAP information 15
Net Operating Capital (NOC)
The Company believes that an understanding of the Philips Group’s financial condition is enhanced by the disclosure of net operating capital (NOC), as this figure is used by Philips’ management to evaluate the capital efficiency of the Philips Group and its operating sectors. NOC is defined as: total assets excluding assets classified as held for sale less: (a) cash and cash equivalents, (b) deferred tax assets, (c) other non-current financial assets and current financial assets, (d) investments in associates, and after deduction of: (e) provisions, (f) accounts and notes payable, (g) accrued liabilities, (h) other non-current liabilities and other current liabilities.
Philips Group
Net operating capital to total assets in millions of EUR
2012 - 2014
|
|
|
|||||||||||||||||||
| Philips Group | Healthcare | Consumer Lifestyle | Lighting |
Innovation, Group
& Services |
||||||||||||||||
|
|
|
|||||||||||||||||||
|
2014 |
||||||||||||||||||||
|
Net operating capital (NOC) |
8,838 | 7,565 | 1,353 | 3,638 | (3,718 | ) | ||||||||||||||
|
Exclude liabilities comprised in NOC: |
9,379 | 2,711 | 1,411 | 1,422 | 3,835 | |||||||||||||||
|
- payables/liabilities |
||||||||||||||||||||
|
- intercompany accounts |
— | 125 | 65 | 129 | (319 | ) | ||||||||||||||
|
- provisions |
3,445 | 793 | 220 | 530 | 1,902 | |||||||||||||||
|
Include assets not comprised in NOC: |
157 | 80 | — | 20 | 57 | |||||||||||||||
|
- investments in associates |
||||||||||||||||||||
|
- current financial assets |
125 | — | — | — | 125 | |||||||||||||||
|
- other non-current financial assets |
462 | — | — | — | 462 | |||||||||||||||
|
- deferred tax assets |
2,460 | — | — | — | 2,460 | |||||||||||||||
|
- cash and cash equivalents |
1,873 | — | — | — | 1,873 | |||||||||||||||
|
|
|
|||||||||||||||||||
|
Total assets excluding assets classified as held for sale |
26,739 | 11,274 | 3,049 | 5,739 | 6,677 | |||||||||||||||
|
Assets classified as held for sale |
1,613 | |||||||||||||||||||
|
|
|
|||||||||||||||||||
|
Total assets |
28,352 | |||||||||||||||||||
|
2013 |
||||||||||||||||||||
|
Net operating capital (NOC) |
10,238 | 7,437 | 1,261 | 4,462 | (2,922 | ) | ||||||||||||||
|
Exclude liabilities comprised in NOC: |
||||||||||||||||||||
|
- payables/liabilities |
8,453 | 2,541 | 1,275 | 1,672 | 2,965 | |||||||||||||||
|
- intercompany accounts |
— | 124 | 75 | 105 | (304 | ) | ||||||||||||||
|
- provisions |
2,554 | 278 | 221 | 452 | 1,603 | |||||||||||||||
|
Include assets not comprised in NOC: |
||||||||||||||||||||
|
- investments in associates |
161 | 85 | — | 20 | 56 | |||||||||||||||
|
- current financial assets |
10 | — | — | — | 10 | |||||||||||||||
|
- other non-current financial assets |
496 | — | — | — | 496 | |||||||||||||||
|
- deferred tax assets |
1,675 | — | — | — | 1,675 | |||||||||||||||
|
- cash and cash equivalents |
2,465 | — | — | — | 2,465 | |||||||||||||||
|
|
|
|||||||||||||||||||
|
Total assets excluding assets classified as held for sale |
26,052 | 10,465 | 2,832 | 6,711 | 6,044 | |||||||||||||||
|
Assets classified as held for sale |
507 | |||||||||||||||||||
|
|
|
|||||||||||||||||||
|
Total assets |
26,559 | |||||||||||||||||||
|
2012 |
||||||||||||||||||||
|
Net operating capital (NOC) |
9,316 | 7,976 | 1,205 | 4,635 | (4,500 | ) | ||||||||||||||
|
Exclude liabilities comprised in NOC: |
||||||||||||||||||||
|
- payables/ liabilities |
10,287 | 2,760 | 1,718 | 1,695 | 4,114 | |||||||||||||||
|
- intercompany accounts |
— | 71 | 42 | 37 | (150 | ) | ||||||||||||||
|
- provisions |
2,956 | 355 | 315 | 581 | 1,705 | |||||||||||||||
|
Include assets not comprised in NOC: |
||||||||||||||||||||
|
- investments in associates |
177 | 86 | — | 22 | 69 | |||||||||||||||
|
- other non-current financial assets |
549 | — | — | — | 549 | |||||||||||||||
|
- deferred tax assets |
1,919 | — | — | — | 1,919 | |||||||||||||||
|
- cash and cash equivalents |
3,834 | — | — | — | 3,834 | |||||||||||||||
|
|
|
|||||||||||||||||||
|
Total assets excluding assets classified as held for sale |
29,038 | 11,248 | 3,280 | 6,970 | 7,540 | |||||||||||||||
|
Assets classified as held for sale |
43 | |||||||||||||||||||
|
|
|
|||||||||||||||||||
|
Total assets |
29,081 | |||||||||||||||||||
|
|
|
|||||||||||||||||||
254 Annual Report 2014
Table of Contents
Reconciliation of non-GAAP information 15
Net debt
Net debt is defined as the sum of long- and short-term debt minus cash and cash equivalents. The net debt position as a percentage of the sum of group equity (shareholders’ equity and non-controlling interests) and net debt is presented to express the financial strength of the Company. This measure is widely used by management and investment analysts and is therefore included in the disclosure.
Philips Group
Composition of net debt to group equity in millions of EUR unless otherwise stated
2012 - 2014
|
|
|
|||||||||||
| 2012 | 2013 | 2014 | ||||||||||
|
|
|
|||||||||||
|
Long-term debt |
3,725 | 3,309 | 3,712 | |||||||||
|
Short-term debt |
809 | 592 | 392 | |||||||||
|
|
|
|||||||||||
|
Total debt |
4,534 | 3,901 | 4,104 | |||||||||
|
Cash and cash equivalents |
3,834 | 2,465 | 1,873 | |||||||||
|
|
|
|||||||||||
|
Net debt 1 ) |
700 | 1,436 | 2,231 | |||||||||
|
Shareholders’ equity |
11,151 | 11,214 | 10,867 | |||||||||
|
Non-controlling interests |
34 | 13 | 101 | |||||||||
|
|
|
|||||||||||
|
Group equity |
11,185 | 11,227 | 10,968 | |||||||||
|
Net debt and group equity |
11,885 | 12,663 | 13,199 | |||||||||
|
Net debt divided by net debt and group equity (in %) |
6 | % | 11 | % | 17 | % | ||||||
|
Group equity divided by net debt and group equity (in %) |
94 | % | 89 | % | 83 | % | ||||||
|
|
|
|||||||||||
| 1) |
Total debt less cash and cash equivalents. |
Free Cash Flow
Cash flows before financing activities, being the sum total of net cash from operating activities and net cash from investing activities, and free cash flow, being net cash from operating activities minus net capital expenditures, are presented separately to facilitate the reader’s understanding of the Company’s funding requirements.
Net capital expenditures comprise of purchase of intangible assets, proceeds from sale of intangible assets, expenditures on development assets, capital expenditures on property, plant and equipment and proceeds from disposals of property, plant and equipment. This measure is widely used by management to calculate free cash flow.
Philips Group
Free cash flow in millions of EUR
2012 - 2014
|
|
|
|||||||||||
| 2012 | 2013 | 2014 | ||||||||||
|
|
|
|||||||||||
|
Cash flows from operating activities |
1,886 | 912 | 1,303 | |||||||||
|
Cash flows from investing activities |
(712 | ) | (862 | ) | (984 | ) | ||||||
|
|
|
|||||||||||
|
Cash flows before financing activities |
1,174 | 50 | 319 | |||||||||
|
Cash flows from operating activities |
1,886 | 912 | 1,303 | |||||||||
|
Net capital expenditures: |
(241 | ) | (830 | ) | (806 | ) | ||||||
|
Purchase of intangible assets |
(33 | ) | (49 | ) | (114 | ) | ||||||
|
Proceeds from sale of intangible assets |
160 | — | — | |||||||||
|
Expenditures on development assets |
(311 | ) | (326 | ) | (295 | ) | ||||||
|
Capital expenditures on property, plant and equipment |
(479 | ) | (482 | ) | (437 | ) | ||||||
|
Proceeds from disposals of property, plant and equipment |
422 | 27 | 40 | |||||||||
|
|
|
|||||||||||
|
Free cash flow |
1,645 | 82 | 497 | |||||||||
|
|
|
|||||||||||
Adjustments
Prior-period financial information has been restated for the treatment of the combined businesses of Lumileds and Automotive as discontinued operations (see note 3, Discontinued operations and other assets classified as held for sale) and for two voluntary accounting policy changes (see note 1, Significant accounting policies).
Annual Report 2014 255
Table of Contents
Five-year overview 16
Prior-period financial information has been restated for the treatment of the combined businesses of Lumileds and Automotive as discontinued operations (see note 3, Discontinued operations and other assets classified as held for sale) and for two voluntary accounting policy changes (see note 1, Significant accounting policies).
Due to factors such as acquisitions and divestments, the amounts, percentages and ratios are not directly comparable.
Philips Group
General data in millions of EUR unless otherwise stated
2010 - 2014
|
|
|
|||||||||||||||||||
| 2010 | 2011 | 2012 | 2013 | 2014 | ||||||||||||||||
|
|
|
|||||||||||||||||||
|
Sales |
19,299 | 19,918 | 22,234 | 21,990 | 21,391 | |||||||||||||||
|
% increase over previous year |
11 | % | 3 | % | 12 | % | (1 | )% | (3 | )% | ||||||||||
|
Income from operations (IFO) (loss) |
1,569 | (542 | ) | 592 | 1,855 | 486 | ||||||||||||||
|
Financial income and expenses - net |
(175 | ) | (331 | ) | (329 | ) | (330 | ) | (301 | ) | ||||||||||
|
Income (loss) from continuing operations |
1,051 | (1,106 | ) | (166 | ) | 1,034 | 221 | |||||||||||||
|
Income (loss) from continuing operations attributable to shareholders |
1,045 | (1,110 | ) | (171 | ) | 1,031 | 225 | |||||||||||||
|
Income (loss) from discontinued operations |
250 | (350 | ) | 136 | 138 | 190 | ||||||||||||||
|
Net income (loss) |
1,301 | (1,456 | ) | (30 | ) | 1,172 | 411 | |||||||||||||
|
Net income (loss) attributable to shareholders |
1,295 | (1,460 | ) | (35 | ) | 1,169 | 415 | |||||||||||||
|
Free cash flow |
1,148 | (53 | ) | 1,645 | 82 | 497 | ||||||||||||||
|
Net assets |
15,067 | 12,362 | 11,185 | 11,227 | 10,968 | |||||||||||||||
|
Turnover rate of net operating capital 1 ) |
1.52 | 1.81 | 2.22 | 2.39 | 2.30 | |||||||||||||||
|
Total employees at year-end |
119,775 | 125,240 | 118,087 | 116,082 | 113,678 | |||||||||||||||
|
|
|
|||||||||||||||||||
| 1) |
Calculated based upon the values excluding the businesses restated to discontinued operations. |
Philips Group
Income in millions of EUR unless otherwise stated
2010 - 2014
|
|
|
|||||||||||||||||||
| 2010 | 2011 | 2012 | 2013 | 2014 | ||||||||||||||||
|
|
|
|||||||||||||||||||
|
IFO |
1,569 | (542 | ) | 592 | 1,855 | 486 | ||||||||||||||
|
as a % of sales |
8.1 | % | (2.7 | )% | 2.7 | % | 8.4 | % | 2.3 | % | ||||||||||
|
Adjusted IFO |
1,979 | 1,334 | 1,003 | 2,276 | 821 | |||||||||||||||
|
as a % of sales |
10.3 | % | 6.7 | % | 4.5 | % | 10.4 | % | 3.8 | % | ||||||||||
|
Income taxes |
(361 | ) | (248 | ) | (218 | ) | (466 | ) | (26 | ) | ||||||||||
|
as a % of income before taxes |
(25.9 | )% | 28.4 | % | (82.9 | )% | (30.6 | )% | (14.1 | )% | ||||||||||
|
Income (loss) from continuing operations |
1,051 | (1,106 | ) | (166 | ) | 1,034 | 221 | |||||||||||||
|
as a % of shareholders’ equity (ROE) |
6.9 | % | (8.2 | )% | (1.4 | )% | 9.4 | % | 2.0 | % | ||||||||||
|
Net income (loss) |
1,301 | (1,456 | ) | (30 | ) | 1,172 | 411 | |||||||||||||
|
|
|
|||||||||||||||||||
256 Annual Report 2014
Table of Contents
Five-year overview 16
Philips Group
Capital employed in millions of EUR unless otherwise stated
2010 - 2014
|
|
|
|||||||||||||||||||
| 2010 | 2011 | 2012 | 2013 | 2014 | ||||||||||||||||
|
|
|
|||||||||||||||||||
|
Cash and cash equivalents |
5,833 | 3,147 | 3,834 | 2,465 | 1,873 | |||||||||||||||
|
Receivables and other current assets |
5,324 | 5,570 | 5,156 | 5,262 | 5,606 | |||||||||||||||
|
Assets classified as held for sale |
120 | 551 | 43 | 507 | 1,613 | |||||||||||||||
|
Inventories |
3,865 | 3,625 | 3,495 | 3,240 | 3,314 | |||||||||||||||
|
Non-current financial assets/investments in associates |
660 | 549 | 726 | 657 | 619 | |||||||||||||||
|
Non-current receivables/assets |
1,532 | 1,929 | 2,189 | 1,882 | 2,706 | |||||||||||||||
|
Property, plant and equipment |
3,145 | 3,014 | 2,959 | 2,780 | 2,095 | |||||||||||||||
|
Intangible assets |
12,233 | 11,012 | 10,679 | 9,766 | 10,526 | |||||||||||||||
|
|
|
|||||||||||||||||||
|
Total assets |
32,712 | 29,397 | 29,081 | 26,559 | 28,352 | |||||||||||||||
|
Property, plant and equipment: |
||||||||||||||||||||
|
Capital expenditures for the year |
398 | 477 | 479 | 482 | 437 | |||||||||||||||
|
Depreciation for the year |
538 | 525 | 588 | 521 | 592 | |||||||||||||||
|
Capital expenditures: depreciation |
0.7 | 0.9 | 0.8 | 0.9 | 0.7 | |||||||||||||||
|
Inventories as a % of sales 1 ) |
16.0 | % | 16.5 | % | 14.1 | % | 13.7 | % | 15.5 | % | ||||||||||
|
Inventories excluding discontinued operations |
3,091 | 3,278 | 3,127 | 3,021 | 3,314 | |||||||||||||||
|
Outstanding trade receivables, in days sales 1 ) |
56 | 54 | 50 | 53 | 56 | |||||||||||||||
|
|
|
|||||||||||||||||||
| 1) |
Calculated based upon the values excluding the businesses restated to discontinued operations |
Philips Group
Financial structure in millions of EUR unless otherwise stated
2010 - 2014
|
|
|
|||||||||||||||||||
| 2010 | 2011 | 2012 | 2013 | 2014 | ||||||||||||||||
|
|
|
|||||||||||||||||||
|
Other liabilities |
10,610 | 10,434 | 10,379 | 8,529 | 9,486 | |||||||||||||||
|
Liabilities directly associated with assets held for sale |
— | 61 | 27 | 348 | 349 | |||||||||||||||
|
Debt |
4,658 | 3,860 | 4,534 | 3,901 | 4,104 | |||||||||||||||
|
Provisions |
2,377 | 2,680 | 2,956 | 2,554 | 3,445 | |||||||||||||||
|
|
|
|
|
|||||||||||||||||
|
Total provisions and liabilities |
17,645 | 17,035 | 17,896 | 15,332 | 17,384 | |||||||||||||||
|
Shareholders’ equity |
15,021 | 12,328 | 11,151 | 11,214 | 10,867 | |||||||||||||||
|
Non-controlling interests |
46 | 34 | 34 | 13 | 101 | |||||||||||||||
|
|
|
|||||||||||||||||||
|
Group equity and liabilities |
32,712 | 29,397 | 29,081 | 26,559 | 28,352 | |||||||||||||||
|
Net debt: group equity ratio |
(8):108 | 5:95 | 6:94 | 11:89 | 17:83 | |||||||||||||||
|
Market capitalization at year-end |
21,694 | 15,077 | 18,200 | 24,340 | 22,082 | |||||||||||||||
|
|
|
|||||||||||||||||||
Annual Report 2014 257
Table of Contents
Five-year overview 16
Philips Group
Key figures per share in EUR unless otherwise stated
2010 - 2014
|
|
|
|||||||||||||||||||
| 2010 | 2011 | 2012 | 2013 | 2014 | ||||||||||||||||
|
|
|
|||||||||||||||||||
|
Sales per common share |
20.49 | 20.90 | 24.11 | 24.14 | 23.37 | |||||||||||||||
|
Adjusted IFO per common share - diluted |
2.08 | 1.39 | 1.08 | 2.47 | 0.89 | |||||||||||||||
|
Weighted average amount of shares outstanding: |
||||||||||||||||||||
|
- basic 1 ) |
941,691 | 952,809 | 922,101 | 911,072 | 915,193 | |||||||||||||||
|
- diluted 1 ) |
949,554 | 957,293 | 927,222 | 922,072 | 922,714 | |||||||||||||||
|
Basic earnings per common share: |
||||||||||||||||||||
|
Income (loss) from continuing operations attributable to shareholders per share |
1.11 | (1.16 | ) | (0.19 | ) | 1.13 | 0.25 | |||||||||||||
|
Net income (loss) attributable to shareholders |
1.38 | (1.53 | ) | (0.04 | ) | 1.28 | 0.45 | |||||||||||||
|
Diluted earnings per common share: |
||||||||||||||||||||
|
Income (loss) from continuing operations attributable to shareholders per share |
1.10 | (1.16 | ) | (0.19 | ) | 1.12 | 0.24 | |||||||||||||
|
Net income (loss) attributable to shareholders |
1.36 | (1.53 | ) | (0.04 | ) | 1.27 | 0.45 | |||||||||||||
|
Dividend distributed per common share |
0.70 | 0.75 | 0.75 | 0.75 | 0.80 | |||||||||||||||
|
Total shareholder return per common share |
2.94 | (5.89 | ) | 4.37 | 7.50 | (1.70 | ) | |||||||||||||
|
Shareholders’ equity per common share |
15.87 | 13.31 | 12.19 | 12.28 | 11.88 | |||||||||||||||
|
Price/earnings ratio |
20.65 | (14.03 | ) | (104.74 | ) | 23.58 | 96.60 | |||||||||||||
|
Share price at year-end |
22.92 | 16.28 | 19.90 | 26.65 | 24.15 | |||||||||||||||
|
Highest closing share price during the year |
26.94 | 25.34 | 20.33 | 26.78 | 28.10 | |||||||||||||||
|
Lowest closing share price during the year |
20.34 | 12.23 | 13.76 | 20.26 | 20.98 | |||||||||||||||
|
Average share price |
23.35 | 18.11 | 16.92 | 23.33 | 24.00 | |||||||||||||||
|
Amount of common shares outstanding at year-end 1 ) |
946,506 | 926,095 | 914,591 | 913,338 | 914,389 | |||||||||||||||
|
|
|
|||||||||||||||||||
| 1) |
In thousands of shares |
Philips Group
Sustainability
2010 - 2014
|
|
|
|||||||||||||||||||
| 2010 | 2011 | 2012 | 2013 | 2014 | ||||||||||||||||
|
|
|
|||||||||||||||||||
|
Lives improved, in billions |
1.6 | 1.7 | 1.9 | |||||||||||||||||
|
Energy efficiency of products, in lumen/watt |
35.9 | 37.6 | 39.3 | 40.1 | 40.5 | |||||||||||||||
|
Collection and recycling amount, in tonnes |
22,500 | 27,500 | 30,500 | 31,000 | 31,500 | |||||||||||||||
|
Recycled material in products, in tonnes |
7,500 | 10,000 | 15,000 | 14,000 | 13,000 | |||||||||||||||
|
Green Product sales, as a % of total sales |
36 | % | 39 | % | 46 | % | 50 | % | 52 | % | ||||||||||
|
Green Innovation, in millions of euros |
313 | 363 | 453 | 405 | 463 | |||||||||||||||
|
Operational carbon footprint, in kilotonnes CO 2 -equivalent |
1,756 | 1,635 | 1,441 | 1,451 | 1,375 | |||||||||||||||
|
Operational energy efficiency, in terajoules per million euro sales |
1.45 | 1.33 | 1.13 | 1.17 | 1.14 | |||||||||||||||
|
Total energy consumption in manufacturing, in terajoules 1 ) |
12,464 | 12,030 | 12,014 | 11,963 | 11,257 | |||||||||||||||
|
Total carbon emissions in manufacturing, in kilotonnes CO 2 -equivalent |
612 | 560 | 564 | 524 | 474 | |||||||||||||||
|
Water intake, in thousands m 3 |
2,896 | 2,895 | 3,137 | 3,289 | 3,103 | |||||||||||||||
|
Total waste, in kilotonnes 1 ) |
96.2 | 87.0 | 80.6 | 75.9 | 75.0 | |||||||||||||||
|
Materials provided for recycling via external contractor per total waste, in % |
79 | % | 78 | % | 77 | % | 79 | % | 80 | % | ||||||||||
|
Restricted substances, in kilos |
188 | 111 | 55 | 9 | 9 | |||||||||||||||
|
Hazardous substances, in kilos |
60,272 | 63,604 | 67,530 | 35,118 | 28,310 | |||||||||||||||
|
ISO 14001 certification, as a % of all reporting organizations 1 ) |
94 | % | 87 | % | 69 | % | 79 | % | 79 | % | ||||||||||
|
Employee Engagement Index, % favorable |
77 | % | 76 | % | 79 | % | 75 | % | 72 | % | ||||||||||
|
Female executives, in % of total |
11 | % | 13 | % | 14 | % | 15 | % | 18 | % | ||||||||||
|
Lost Workday Injuries, per 100 FTEs |
0.45 | 0.38 | 0.31 | 0.27 | 0.23 | |||||||||||||||
|
Fatalities |
— | 2 | 7 | 3 | 1 | |||||||||||||||
|
Initial and continual conformance audits, number of audits |
273 | 212 | 159 | 200 | 203 | |||||||||||||||
|
Suppliers audits, compliance rate, in % |
72 | % | 75 | % | 77 | % | 86 | % | ||||||||||||
|
|
|
|||||||||||||||||||
| 1) |
In manufacturing excluding new acquisitions |
258 Annual Report 2014
Table of Contents
Five-year overview 16
16.1 Five-year overview (condensed)
Prior-period financial information has been restated for the treatment of the combined businesses of Lumileds and Automotive as discontinued operations (see note 3, Discontinued operations and other assets classified as held for sale) and for two voluntary accounting policy changes (see note 1, Significant accounting policies).
Due to factors such as acquisitions and divestments, the amounts, percentages and ratios are not directly comparable.
Philips Group
Selected financial data in millions of EUR unless otherwise stated
2010 - 2014
|
|
|
|||||||||||||||||||||||
| 2010 | 2011 | 2012 | 2013 | 2014 | 2014 | |||||||||||||||||||
|
|
|
|||||||||||||||||||||||
| EUR | EUR | EUR | EUR | EUR | USD 1 ) | |||||||||||||||||||
|
|
|
|||||||||||||||||||||||
|
Sales |
19,299 | 19,918 | 22,234 | 21,990 | 21,391 | 26,001 | ||||||||||||||||||
|
Income from operations (IFO) (loss) |
1,569 | (542 | ) | 592 | 1,855 | 486 | 591 | |||||||||||||||||
|
Financial income and expenses - net |
(175 | ) | (331 | ) | (329 | ) | (330 | ) | (301 | ) | (366 | ) | ||||||||||||
|
Income (loss) from continuing operations |
1,051 | (1,106 | ) | (166 | ) | 1,034 | 221 | 269 | ||||||||||||||||
|
Income (loss) from continuing operations attributable to shareholders |
1,045 | (1,110 | ) | (171 | ) | 1,031 | 225 | 273 | ||||||||||||||||
|
Income (loss) from discontinued operations |
250 | (350 | ) | 136 | 138 | 190 | 231 | |||||||||||||||||
|
Net income (loss) |
1,301 | (1,456 | ) | (30 | ) | 1,172 | 411 | 500 | ||||||||||||||||
|
Net income (loss) attributable to shareholders |
1,295 | (1,460 | ) | (35 | ) | 1,169 | 415 | 504 | ||||||||||||||||
|
Total assets |
32,712 | 29,397 | 29,081 | 26,559 | 28,352 | 34,462 | ||||||||||||||||||
|
Net assets |
15,067 | 12,362 | 11,185 | 11,227 | 10,968 | 13,332 | ||||||||||||||||||
|
Debt |
4,658 | 3,860 | 4,534 | 3,901 | 4,104 | 4,988 | ||||||||||||||||||
|
Provisions |
2,377 | 2,680 | 2,956 | 2,554 | 3,445 | 4,187 | ||||||||||||||||||
|
Shareholders’ equity |
15,021 | 12,328 | 11,151 | 11,214 | 10,867 | 13,209 | ||||||||||||||||||
|
Non-controlling interests |
46 | 34 | 34 | 13 | 101 | 123 | ||||||||||||||||||
|
Weighted average shares outstanding: |
||||||||||||||||||||||||
|
- basic 2 ) |
941,691 | 952,809 | 922,101 | 911,072 | 915,193 | 915,193 | ||||||||||||||||||
|
- diluted 2 ) |
949,554 | 957,293 | 927,222 | 922,072 | 922,714 | 922,714 | ||||||||||||||||||
|
Basic earnings per common share 3 ) |
||||||||||||||||||||||||
|
Income (loss) from continuing operations attributable to shareholders |
1.11 | (1.16 | ) | (0.19 | ) | 1.13 | 0.25 | 0.30 | ||||||||||||||||
|
Net income (loss) attributable to shareholders |
1.38 | (1.53 | ) | (0.04 | ) | 1.28 | 0.45 | 0.55 | ||||||||||||||||
|
Diluted earnings per common share 3 ) |
||||||||||||||||||||||||
|
Income (loss) from continuing operations attributable to shareholders |
1.10 | (1.16 | ) | (0.19 | ) | 1.12 | 0.24 | 0.29 | ||||||||||||||||
|
Net income (loss) attributable to shareholders |
1.36 | (1.53 | ) | (0.04 | ) | 1.27 | 0.45 | 0.55 | ||||||||||||||||
|
|
|
|||||||||||||||||||||||
| 1) |
For the convenience of the reader, the euro amounts have been converted into US dollars at the exchange rate used for balance sheet purposes at December 31, 2014 (USD 1 = EUR 0.8227. The US dollar amounts are unaudited.) |
| 2) |
In thousands of shares |
| 3) |
In euros or US dollars as indicated in the header |
Annual Report 2014 259
Table of Contents
Investor Relations 17
17.1 Key financials and dividend policy
Prior-period financial information has been restated for the treatment of the combined businesses of Lumileds and Automotive as discontinued operations (see note 3, Discontinued operations and other assets classified as held for sale) and for two voluntary accounting policy changes (see note 1, Significant accounting policies).
Key financials
Net income attributable to shareholders of Koninklijke Philips N.V. in 2014 showed a gain of EUR 415 million, or EUR 0.45 per common share (diluted; basic EUR 0.45 per common share). This compares to a gain of EUR 1,169 million, or EUR 1.27 per common share (diluted; basic EUR 1.28 per common share), in 2013.
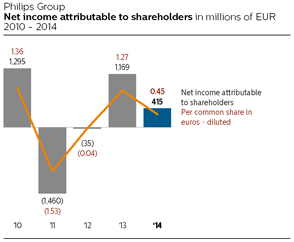
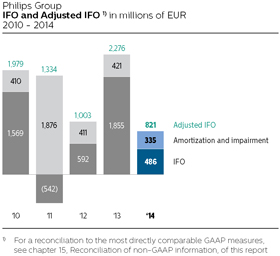
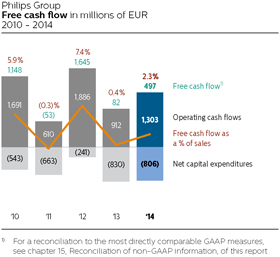
Dividend policy
We are committed to dividend stability and a 40% to 50% pay-out of continuing net income.
Continuing net income is the base figure used to calculate the dividend payout for the year. For 2014, the key exclusions from net income to arrive at continuing net income are the following: the results that are shown as discontinued operations, charges related to legal matters, inventory write-downs and other charges related to the voluntary suspension of production at the Cleveland facility, an impairment and other charges related to industrial assets at Lighting, and a past-service pension cost gain in the Netherlands. Restructuring and acquisition-related charges and the result of the sale of the 30% stake in the TP Vision joint venture are also excluded.
Proposed distribution
A proposal will be submitted to the 2015 Annual General Meeting of Shareholders to declare a dividend of EUR 0.80 per common share (up to EUR 735 million), in cash or in shares at the option of the shareholder, against the net income and retained earnings for 2014.
Shareholders will be given the opportunity to make their choice between cash and shares between May 13, 2015, and June 5, 2015. If no choice is made during this election period, the dividend will be paid in shares. On June 5, 2015 after close of trading, the number of share dividend rights entitled to one new common share will be determined based on the volume-weighted average price of all traded common shares of Koninklijke Philips N.V. at Euronext Amsterdam on 3, 4 and 5 June, 2015. The Company will calculate the number of share dividend rights entitled to one new common share, such that the gross dividend in shares will be approximately equal to the gross dividend in cash. On
260 Annual Report 2014
Table of Contents
Investor Relations 17.1
June 9, 2015 the ratio and the number of shares to be issued will be announced. Payment of the dividend and delivery of new common shares, with settlement of fractions in cash, if required, will take place from June 10, 2015. The distribution of dividend in cash to holders of New York Registry shares will be made in USD at the USD/EUR rate fixed by the European Central Bank on June 8, 2015.
Dividend in cash is in principle subject to 15% Dutch dividend withholding tax, which will be deducted from the dividend in cash paid to the shareholders. Dividend in shares paid out of net income and retained earnings is subject to 15% dividend withholding tax, but only in respect of the par value of the shares (EUR 0.20 per share). Shareholders are advised to consult their own tax advisor on the applicable situation with respect to taxes on the dividend received.
In 2014, a dividend of EUR 0.80 per common share was paid in cash or shares, at the option of the shareholder. For 60% of the shares, the shareholders elected for a share dividend, resulting in the issue of 18,811,534 new common shares, leading to a 2.1% dilution. EUR 292 million was paid in cash. For additional information, see section 5.4, Proposed distribution to shareholders, of this report.
|
|
|
|||||||||||
| ex-dividend date | record date | payment date | ||||||||||
|
|
|
|||||||||||
|
Amsterdam shares |
May 11, 2015 | May 12, 2015 | June 10, 2015 | |||||||||
|
New York shares |
May 8, 2015 | May 12, 2015 | June 10, 2015 | |||||||||
|
|
|
|||||||||||
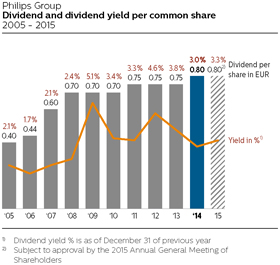
Information for investors in New York Registry shares program
Dividends and distributions per common share
The following table sets forth in euros the gross dividends on the common shares in the fiscal years indicated (from prior-year profit distribution) and such amounts as converted into US dollars and paid to holders of shares of the New York Registry:
Philips Group
Gross dividends on the common shares in EUR
2010 - 2014
|
|
|
|||||||||||||||||||
| 2010 | 2011 | 2012 | 2013 | 2014 | ||||||||||||||||
|
|
|
|||||||||||||||||||
|
in EUR |
0.70 | 0.75 | 0.75 | 0.75 | 0.80 | |||||||||||||||
|
in USD |
0.93 | 1.11 | 0.94 | 0.98 | 1.09 | |||||||||||||||
|
|
|
|||||||||||||||||||
Exchange rates USD : EUR
The following two tables set forth, for the periods and dates indicated, certain information concerning the exchange rate for US dollars into euros based on the Noon Buying Rate in New York City for cable transfers in foreign currencies as certified for customs purposes by the Federal Reserve Bank of New York (the “Noon Buying Rate”). The Noon Buying Rate on February 13, 2015 was EUR 0.8766 per USD 1.
Philips Group
Exchange rate (based on the “Noon Buying Rate”)
EUR per USD
2010 - 2014
|
|
|
|||||||||||||||
| period end | average | high | low | |||||||||||||
|
|
|
|||||||||||||||
|
2010 |
0.7536 | 0.7579 | 0.8362 | 0.6879 | ||||||||||||
|
2011 |
0.7708 | 0.7186 | 0.7736 | 0.6723 | ||||||||||||
|
2012 |
0.7584 | 0.7782 | 0.8290 | 0.7428 | ||||||||||||
|
2013 |
0.7257 | 0.7532 | 0.7828 | 0.7238 | ||||||||||||
|
2014 |
0.8264 | 0.7533 | 0.8264 | 0.7180 | ||||||||||||
|
|
|
|||||||||||||||
Philips Group
Exchange rate per month in EUR
2014 - 2015
|
|
|
|||||||
| highest rate | lowest rate | |||||||
|
|
|
|||||||
|
August, 2014 |
0.7605 | 0.7443 | ||||||
|
September, 2014 |
0.7919 | 0.7613 | ||||||
|
October, 2014 |
0.7989 | 0.7805 | ||||||
|
November, 2014 |
0.8068 | 0.7966 | ||||||
|
December, 2014 |
0.8264 | 0.7997 | ||||||
|
January, 2015 |
0.8866 | 0.8323 | ||||||
|
|
|
|||||||
Unless otherwise stated, for the convenience of the reader, the translations of euros into US dollars appearing in this section have been made based on the closing rate on December 31, 2014 (USD 1 = EUR 0.8227). This rate is not materially different from the Noon Buying Rate on such date (USD 1 = EUR 0.8264).
The following table sets out the exchange rate for US dollars into euros applicable for translation of Philips’ financial statements for the periods specified.
Annual Report 2014 261
Table of Contents
Investor Relations 17.1
Philips Group
Exchange rate (used for translating Philips’ financial
statements) EUR per USD
2010 - 2014
|
|
|
|||||||||||||||
| period end | average | high | low | |||||||||||||
|
|
|
|||||||||||||||
|
2010 |
0.7485 | 0.7540 | 0.8188 | 0.7036 | ||||||||||||
|
2011 |
0.7728 | 0.7192 | 0.7728 | 0.6721 | ||||||||||||
|
2012 |
0.7582 | 0.7776 | 0.8166 | 0.7500 | ||||||||||||
|
2013 |
0.7255 | 0.7527 | 0.7805 | 0.7255 | ||||||||||||
|
2014 |
0.8227 | 0.7527 | 0.8227 | 0.7201 | ||||||||||||
|
|
|
|||||||||||||||
Market capitalization
Philips’ market capitalization was EUR 22.1 billion at year-end 2014. On December 31, 2014, the closing price for Philips’ shares in Amsterdam was EUR 24.15 and the number of common shares outstanding (after deduction of treasury shares) amounted to 914,389 thousand.
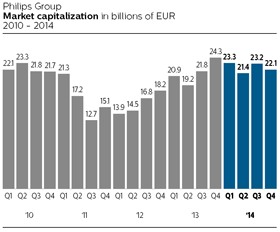
Share capital structure
During 2014, Philips’ issued share capital decreased by approximately 3 million common shares to a level of 935 million common shares. The main reasons for this are the cancellation of 21,837,910 Philips shares acquired pursuant to the EUR 1.5 billion share repurchase program and the issuance of 18,811,534 shares related to the elective dividend. The number of basic shares outstanding increased slightly from 913 million at the end of December 2013 to 914 million at the end of 2014. As of December 31, 2014, the shares held in treasury amounted to 20 million shares , of which 17 million are held by Philips to cover long-term incentive and employee stock purchase plans.
The Dutch Act on Financial Supervision imposes an obligation on persons holding certain interests to disclose (inter alia) percentage holdings in the capital and/or voting rights in the Company when such holdings reach, exceed or fall below 3, 5, 10, 15, 20, 25, 30, 40, 50, 60, 75 and 95 percent (as a result of an acquisition or disposal by a person, or as a result of a change in the company’s total number of voting rights or capital issued). Certain cash-settled derivatives are also taken into account when calculating the capital interest. The statutory obligation to disclose capital interest does not only relate to gross long positions, but also to gross short positions. Required disclosures must be made to the Netherlands Authority for the Financial Markets (AFM) without delay. The AFM then notifies such disclosures to the Company and includes them in a register which is published on the AFM’s website. Furthermore, an obligation to disclose (net) short positions is set out in the EU Regulation on Short Selling
On January 3, 2014 the Company received notification from the AFM that it had received disclosure under the Dutch Act on Financial Supervision of a substantial holding of 3.08% by Norges Bank. On May 9, 2014 the Company received notification from the AFM that it had received disclosure under such Act of a substantial holding of 3.02% by Harris Associates L.P. On February 3, 2015 the Company received notification from the AFM that it had received disclosure under such Act of a substantial holding of 3% by State Street Corporation.
Based on a survey in December 2014 and information provided by several large custodians, the following shareholder portfolio information is included in the graphs Shareholders by region and Shareholders by style.
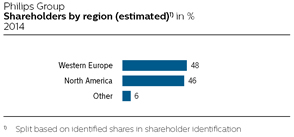
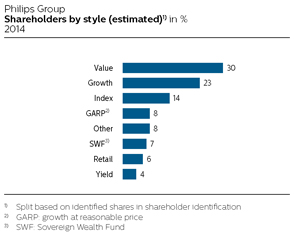
Share repurchase programs
Share repurchases for capital reduction purposes
On September 17, 2013, Philips announced a new EUR 1.5 billion share repurchase program. This program started on October 21, 2013 and is to be completed over two to three
262 Annual Report 2014
Table of Contents
Investor Relations 17.2
years. The shares repurchased under this program will be held by Philips as treasury shares until they are cancelled. Philips has entered into a subsequent discretionary management agreement with a bank to make the repurchase within the limits of relevant laws and regulations (in particular EC Regulation 2273/2003) and Philips’ articles of association.
By the end of 2014, Philips had completed 41% of the EUR 1.5 billion share repurchase program.
Philips Group
Impact of share repurchases on share count in thousands of shares
2010 - 2014
|
|
|
|||||||||||||||||||
| 2010 | 2011 | 2012 | 2013 | 2014 | ||||||||||||||||
|
|
|
|||||||||||||||||||
|
Shares issued |
986,079 | 1,008,975 | 957,133 | 937,846 | 934,820 | |||||||||||||||
|
Shares in treasury |
39,573 | 82,880 | 42,542 | 24,508 | 20,431 | |||||||||||||||
|
Shares outstanding |
946,506 | 926,095 | 914,591 | 913,338 | 914,389 | |||||||||||||||
|
Shares repurchased |
15 | 47,508 | 46,871 | 27,811 | 28,538 | |||||||||||||||
|
Shares cancelled |
— | — | 82,365 | 37,779 | 21,838 | |||||||||||||||
|
|
|
|||||||||||||||||||
Share repurchases related to Long-Term Incentive (LTI) and employee stock purchase programs
Philips initiated LTI repurchases in 2014 to cover Philips’ outstanding obligations resulting from past and present long-term incentive and employee stock purchase programs dating back to 2004. The shares repurchased for coverage purpose will be held by Philips as treasury shares until they are distributed to participants. Philips entered into subsequent discretionary management agreements with a bank to make the repurchases within the limits of relevant laws and regulations (in particular EC Regulation 2273/2003) and Philips’ articles of association.
In 2014, Philips repurchased a total of 7.3 million shares for LTI coverage. During 2015, Philips may continue with additional repurchases, the size of which will depend on the movement of the Philips stock price.
Further details on the share repurchase programs can be found on the Investor Relations website. For more information see chapter 11, Corporate governance, of this report.
Philips Group
Total number of shares purchased
2014
|
|
|
|||||||||||||||
|
total number of shares
purchased |
average price paid per share
in EUR |
total number of shares
purchased as part of publicly announced programs |
maximum EUR amount of
shares that may yet be purchased under share repurchases for capital reduction purposes |
|||||||||||||
|
|
|
|||||||||||||||
|
January, 2014 |
2,038,149 | 26.88 | 2,038,149 | 1,352,223,907 | ||||||||||||
|
February, 2014 |
2,898,000 | 25.72 | 2,898,000 | 1,312,569,419 | ||||||||||||
|
March, 2014 |
2,140,331 | 24.91 | 2,140,331 | 1,284,211,321 | ||||||||||||
|
April, 2014 |
5,516,424 | 24.72 | 5,516,421 | 1,208,271,127 | ||||||||||||
|
May, 2014 |
2,689,922 | 23.14 | 2,689,922 | 1,159,447,057 | ||||||||||||
|
June, 2014 |
2,530,624 | 23.16 | 2,530,624 | 1,104,993,623 | ||||||||||||
|
July, 2014 |
916,200 | 23.44 | 916,200 | 1,087,625,571 | ||||||||||||
|
August, 2014 |
1,963,941 | 22.72 | 1,963,941 | 1,052,561,499 | ||||||||||||
|
September, 2014 |
1,941,333 | 23.82 | 1,941,333 | 1,016,227,505 | ||||||||||||
|
October, 2014 |
2,599,990 | 22.66 | 2,599,990 | 967,004,052 | ||||||||||||
|
November, 2014 |
1,338,007 | 22.73 | 1,338,000 | 936,595,413 | ||||||||||||
|
December, 2014 |
1,965,000 | 23.47 | 1,965,000 | 890,472,326 | ||||||||||||
|
|
|
|||||||||||||||
A total of 20,430,544 shares were held in treasury by the Company at December 31, 2014 (2013: 24,508,022 shares). As of that date, a total of 41 million rights to acquire shares (under long-term incentive plans) were outstanding (2013: 44 million).
Annual Report 2014 263
Table of Contents
Investor Relations 17.3
Philips’ existing long-term debt is rated A3 (with stable outlook) 2) by Moody’s and A- (with negative outlook) 1) by Standard & Poor’s. As part of the capital allocation policy, it is Philips’ ambition to manage its financial ratios to be in line with an A3/A- rating. There is no assurance that Philips will be able to achieve this goal. Ratings are subject to change at any time. The Company’s outstanding long-term debt and credit facilities do not contain financial covenants or cross acceleration provisions that are based on adverse changes in ratings or on material adverse change.
Philips Group
Credit rating summary
2014
|
|
|
|||||||||||
| long-term | short-term | outlook | ||||||||||
|
|
|
|||||||||||
|
Standard and Poor’s |
A- | A-2 | Negative | 1) | ||||||||
|
Moody’s |
A3 | P-2 | Stable | 2) | ||||||||
|
|
|
|||||||||||
| 1) |
On October 2, 2014, Standard and Poor’s changed the outlook from stable to negative |
| 2) |
On February 6, 2014, Moody’s changed the outlook from negative to stable |
264 Annual Report 2014
Table of Contents
Investor Relations 17.4
17.4 Performance in relation to market indices
The common shares of the Company are listed on the stock market of Euronext Amsterdam. The New York Registry Shares of the Company, representing common shares of the Company, are listed on the New York Stock Exchange. The principal market for the common shares is Euronext Amsterdam. For the New York Registry Shares it is the New York Stock Exchange.
The following table shows the high and low closing sales prices of the common shares on the stock market of Euronext Amsterdam as reported in the Official Price List and the high and low closing sales prices of the New York Registry Shares on the New York Stock Exchange:
Philips Group
High and low closing sales price of common shares
2010 - 2015
|
|
|
|||||||||||||||||||
| Euronext Amsterdam (EUR) | New York Stock Exchange (USD) | |||||||||||||||||||
|
|
|
|
|
|||||||||||||||||
| high | low | high | low | |||||||||||||||||
|
|
|
|||||||||||||||||||
|
2010 |
26.94 | 20.34 | 35.90 | 26.84 | ||||||||||||||||
|
2011 |
1st quarter | 25.34 | 21.73 | 33.81 | 29.81 | |||||||||||||||
| 2nd quarter | 22.84 | 16.33 | 32.44 | 23.36 | ||||||||||||||||
| 3rd quarter | 17.84 | 12.23 | 25.74 | 16.87 | ||||||||||||||||
| 4th quarter | 16.28 | 12.77 | 22.54 | 17.22 | ||||||||||||||||
|
2012 |
1st quarter | 16.56 | 14.48 | 21.51 | 18.34 | |||||||||||||||
| 2nd quarter | 15.57 | 13.76 | 20.26 | 17.32 | ||||||||||||||||
| 3rd quarter | 19.49 | 15.51 | 24.89 | 19.11 | ||||||||||||||||
| 4th quarter | 20.33 | 18.27 | 26.81 | 23.52 | ||||||||||||||||
|
2013 |
1st quarter | 23.67 | 20.26 | 31.72 | 26.60 | |||||||||||||||
| 2nd quarter | 23.48 | 20.36 | 30.65 | 26.75 | ||||||||||||||||
| 3rd quarter | 25.32 | 20.89 | 33.60 | 27.28 | ||||||||||||||||
| 4th quarter | 26.78 | 23.17 | 36.97 | 31.36 | ||||||||||||||||
|
2014 |
1st quarter | 28.10 | 23.88 | 38.36 | 33.13 | |||||||||||||||
| 2nd quarter | 25.86 | 22.22 | 35.95 | 30.35 | ||||||||||||||||
| 3rd quarter | 25.27 | 22.11 | 32.39 | 29.80 | ||||||||||||||||
| 4th quarter | 24.68 | 20.98 | 31.02 | 26.36 | ||||||||||||||||
|
August, 2014 |
23.46 | 22.11 | 31.04 | 29.80 | ||||||||||||||||
|
September, 2014 |
25.27 | 23.12 | 32.08 | 30.14 | ||||||||||||||||
|
October, 2014 |
24.68 | 20.98 | 31.02 | 26.36 | ||||||||||||||||
|
November, 2014 |
24.26 | 22.05 | 30.05 | 27.61 | ||||||||||||||||
|
December, 2014 |
24.37 | 22.52 | 30.12 | 28.04 | ||||||||||||||||
|
January, 2015 |
26.80 | 23.16 | 30.31 | 27.54 | ||||||||||||||||
|
|
|
|||||||||||||||||||
Annual Report 2014 265
Table of Contents
Investor Relations 17.4
Euronext Amsterdam
Philips Group
Share price development in Amsterdam in EUR
2013 - 2014
|
|
||||||||||||||||||||||||||||||||||||||||||||||||
| PHIA | Jan | Feb | Mar | Apr | May | Jun | Jul | Aug | Sep | Oct | Nov | Dec | ||||||||||||||||||||||||||||||||||||
|
2014 |
||||||||||||||||||||||||||||||||||||||||||||||||
|
High |
28.10 | 26.47 | 25.86 | 25.86 | 23.64 | 24.22 | 23.82 | 23.46 | 25.27 | 24.68 | 24.26 | 24.37 | ||||||||||||||||||||||||||||||||||||
|
Low |
25.52 | 25.09 | 23.88 | 22.98 | 22.43 | 22.22 | 23.08 | 22.11 | 23.12 | 20.98 | 22.05 | 22.52 | ||||||||||||||||||||||||||||||||||||
|
Average |
27.17 | 25.79 | 24.82 | 24.66 | 23.21 | 23.13 | 23.37 | 22.82 | 23.89 | 22.51 | 22.91 | 23.78 | ||||||||||||||||||||||||||||||||||||
|
Average daily volume 1) |
6.23 | 5.55 | 6.52 | 6.94 | 5.66 | 5.38 | 5.03 | 4.07 | 5.94 | 7.75 | 5.74 | 5.74 | ||||||||||||||||||||||||||||||||||||
|
2013 |
||||||||||||||||||||||||||||||||||||||||||||||||
|
High |
23.13 | 23.31 | 23.67 | 23.48 | 22.90 | 21.81 | 24.41 | 24.58 | 25.32 | 26.08 | 26.50 | 26.78 | ||||||||||||||||||||||||||||||||||||
|
Low |
20.26 | 21.23 | 21.56 | 20.54 | 20.45 | 20.36 | 20.89 | 22.90 | 23.83 | 23.17 | 25.70 | 24.64 | ||||||||||||||||||||||||||||||||||||
|
Average |
21.34 | 22.26 | 22.93 | 22.15 | 21.97 | 21.29 | 22.81 | 24.00 | 24.54 | 24.68 | 26.14 | 25.81 | ||||||||||||||||||||||||||||||||||||
|
Average daily volume 1) |
5.50 | 6.11 | 6.09 | 6.57 | 6.17 | 5.90 | 5.33 | 3.81 | 6.32 | 5.41 | 3.90 | 4.99 | ||||||||||||||||||||||||||||||||||||
| 1) |
In millions of shares |
New York Stock Exchange
Philips Group
Share price development in New York in USD
2013 - 2014
|
|
||||||||||||||||||||||||||||||||||||||||||||||||
| PHG | Jan | Feb | Mar | Apr | May | Jun | Jul | Aug | Sep | Oct | Nov | Dec | ||||||||||||||||||||||||||||||||||||
|
2014 |
||||||||||||||||||||||||||||||||||||||||||||||||
|
High |
38.36 | 36.15 | 35.37 | 35.95 | 32.32 | 32.75 | 32.39 | 31.04 | 32.08 | 31.02 | 30.05 | 30.12 | ||||||||||||||||||||||||||||||||||||
|
Low |
34.61 | 34.04 | 33.13 | 31.75 | 31.08 | 30.35 | 30.80 | 29.80 | 30.14 | 26.36 | 27.61 | 28.04 | ||||||||||||||||||||||||||||||||||||
|
Average |
36.86 | 35.11 | 34.26 | 34.05 | 31.78 | 31.44 | 31.68 | 30.38 | 30.80 | 28.52 | 28.50 | 29.24 | ||||||||||||||||||||||||||||||||||||
|
Average daily volume 1) |
0.70 | 0.56 | 0.49 | 0.57 | 0.48 | 0.69 | 0.93 | 0.55 | 0.77 | 0.78 | 0.60 | 0.57 | ||||||||||||||||||||||||||||||||||||
|
2013 |
||||||||||||||||||||||||||||||||||||||||||||||||
|
High |
31.16 | 31.72 | 30.72 | 30.65 | 29.21 | 29.19 | 32.47 | 32.45 | 33.60 | 35.69 | 35.76 | 36.97 | ||||||||||||||||||||||||||||||||||||
|
Low |
26.60 | 27.82 | 28.23 | 26.88 | 26.75 | 26.94 | 27.28 | 30.62 | 31.57 | 31.36 | 34.81 | 33.92 | ||||||||||||||||||||||||||||||||||||
|
Average |
28.41 | 29.68 | 29.71 | 28.84 | 28.37 | 28.12 | 29.91 | 31.92 | 32.86 | 33.63 | 35.22 | 35.48 | ||||||||||||||||||||||||||||||||||||
|
Average daily volume 1) |
0.85 | 0.77 | 0.82 | 0.77 | 0.80 | 0.93 | 0.86 | 0.44 | 0.66 | 0.66 | 0.39 | 0.39 | ||||||||||||||||||||||||||||||||||||
|
|
|
|||||||||||||||||||||||||||||||||||||||||||||||
| 1) |
In millions of shares |
Philips Group
Share information
|
|
||||
|
Share listings |
Amsterdam, New York | |||
|
|
|
|||
|
Ticker code |
PHIA, PHG | |||
|
No. of shares issued at Dec. 31, 2014 |
935 million | |||
|
No. of shares outstanding issued at Dec. 31, 2014 |
914 million | |||
|
Market capitalization at year-end 2014 |
EUR 22.1 billion | |||
|
Industry classification |
||||
|
MSCI: Capital Goods |
20105010 | |||
|
ICB: Diversified Industrials |
2727 | |||
|
Members of indices |
||||
|
AEX, NYSE, DJSI, and others |
||||
|
|
|
|||
266 Annual Report 2014
Table of Contents
Investor Relations 17.4

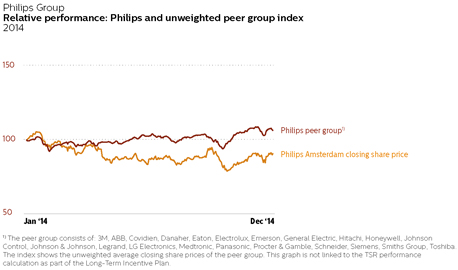
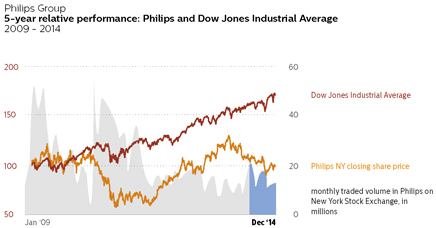
Annual Report 2014 267
Table of Contents
Investor Relations 17.5
| Financial calendar | ||
|
|
||
|
Annual General Meeting of Shareholders |
||
|
|
||
|
Record date Annual General Meeting of Shareholders |
April 9, 2015 | |
|
Annual General Meeting of Shareholders |
May 7, 2015 | |
|
Quarterly reports 2015 |
||
|
|
||
|
First quarter results 2015 |
April 28, 2015 | |
|
Second quarter results 2015 |
July 27, 2015 | |
|
Third quarter results 2015 |
October 26, 2015 | |
|
Fourth quarter results 2015 |
January 26, 2016 1) | |
|
Capital Markets Days 2015 |
||
|
|
||
|
Capital Markets Day - HealthTech |
September 15, 2015 1) | |
|
Capital Markets Day - Lighting Solutions |
To be decided | |
|
|
||
| 1) |
Subject to final confirmation |
Shareholder services
Holders of shares listed on Euronext Amsterdam
Philips offers on it’s Annual Report website a dynamic print manager that facilitates the creation and download of a customized PDF. Non-US shareholders and other non-US interested parties can make inquiries about the Annual Report 2014 to:
Royal Philips
Annual Report Office
Philips Center, HBT 12
P.O. Box 77900
1070 MX Amsterdam, The Netherlands
E-mail: annual.report@philips.com
Communications concerning share transfers, lost certificates, dividends and change of address should be directed to:
ABN AMRO Bank N.V.
Department Equity Capital Markets/Corporate Broking
HQ7050
Gustav Mahlerlaan 10, 1082 PP Amsterdam
The Netherlands
Telephone: +31-20-34 42000
Fax: +31-20-62 88481
E-mail: corporate.broking@nl.abnamro.com
Holders of New York Registry shares
Philips offers on it’s Annual Report website a dynamic print manager that facilitates the creation and download of a customized PDF. Holders of New York Registry shares and other interested parties in the US can make inquiries about the Annual Report 2014 to:
Citibank Shareholder Service
P.O. Box 43077 Providence, Rhode Island 02940-3077
Telephone: 1-877-CITI-ADR (toll-free)
Telephone: 1-781-575-4555 (outside of US)
Fax: 1-201-324-3284
Website: www.citi.com/dr
E-mail: citibank@shareholders-online.com
Communications concerning share transfers, lost certificates, dividends and change of address should be directed to Citibank. The Annual Report on Form 20-F is filed electronically with the US Securities and Exchange Commission.
International direct investment program
Philips offers a dividend reinvestment and direct stock purchase plan designed for the US market. This program provides existing shareholders and interested investors with an economical and convenient way to purchase and sell Philips New York Registry shares and to reinvest cash dividends. Philips does not administer or sponsor the program and assumes no obligation or liability for the operation of the plan. For further information on this program and for enrollment forms, contact:
Citibank Shareholder Service
Telephone: 1-877-248-4237 (1-877-CITI-ADR)
Monday through Friday 8:30 AM EST
through 6:00 PM EST
Website www.citi.com/dr
E-mail: citibank@shareholders-online.com
or by writing to:
Citibank Shareholder Service
International Direct Investment Program
P.O. Box 2502, Jersey City, NJ 07303-2502
2015 Annual General Meeting of Shareholders
The Agenda and the explanatory notes to the Agenda for the Annual General Meeting of Shareholders on May 7, 2015, are published on the Company’s website.
For the 2015 Annual General Meeting of Shareholders, a record date of April 9, 2015 will apply. Those persons who on April 9, 2015, hold shares in the Company and are registered as such in one of the registers designated by the Board of Management for the Annual General Meeting of Shareholders, will be entitled to participate in and vote at the meeting.
Investor relations activities
From time to time the Company engages in communications with investors via road shows, one-on-one meetings, group meetings, broker conferences and capital markets days. The purpose of these meetings is to inform the market of the results, strategy and decisions made, as well as to receive feedback from shareholders. Also, the Company engages in bilateral communications with investors. These communications take place either at the initiative of the Company or at the initiative of investors. During these communications the Company is generally represented by its Investor Relations department. However, on a limited number of occasions the Investor Relations department is
268 Annual Report 2014
Table of Contents
Investor Relations 17.6
accompanied by one or more members of the Board of Management. The subject matter of the bilateral communications ranges from individual queries from investors to more elaborate discussions following disclosures that the Company has made, such as its annual and quarterly reports. The Company is strict in its compliance with applicable rules and regulations on fair and non-selective disclosure and equal treatment of shareholders.
More information on the activities of Investor Relations can be found in chapter 11, Corporate governance, of this report.
Analysts’ coverage
Philips is covered by approximately 35 analysts who frequently issue reports on the company.
How to reach us
Investor Relations contact
Royal Philips
Philips Center, HBT 14
P.O. Box 77900
1070 MX Amsterdam, The Netherlands
Telephone: +31-20-59 77222
Website: www.philips.com/investor
E-mail: investor.relations@philips.com
Robin Jansen
Head of Investor Relations
Telephone: +31-20-59 77222
Vanessa Bruinsma-Kleijkers
Investor Relations Manager
Telephone: +31-20-59 77447
Leandro Mazzoni
Investor Relations Manager
Telephone: +31-20-59 77055
The registered office of Royal Philips is
High Tech Campus 5
5656 AE Eindhoven, The Netherlands
Switch board, telephone: +31-40-27 91111
Sustainability contact
Philips Group Sustainability
High Tech Campus 5 (room 2.56)
5656 AE Eindhoven, The Netherlands
Telephone: +31-40-27 83651
Fax: +31-40-27 86161
Website: www.philips.com/sustainability
E-mail: philips.sustainability@philips.com
Group Communications contact
Royal Philips
Philips Center, HBT 19
P.O. Box 77900
1070 MX Amsterdam, The Netherlands
E-mail: corporate.communications@philips.com
For media contacts please refer to:
www.newscenter.philips.com/main/standard/news/contacts
Annual Report 2014 269
Table of Contents
Investor Relations 17.7
Dutch Taxation
The statements below are only a general summary of certain material Dutch tax consequences for holders of common shares that are non-residents of the Netherlands based on present Dutch tax laws and the Tax Convention of December 18, 1992, as amended by the protocol that entered into force on December 28, 2004, between the United States of America and the Kingdom of the Netherlands (the US Tax Treaty) and are not to be read as extending by implication to matters not specifically referred to herein. As to individual tax consequences, investors in the common shares should consult their own professional tax advisor.
With respect to a holder of common shares that is an individual who receives income or derives capital gains from the common shares and this income received or capital gains derived are attributable to past, present or future employment activities of such holder, the income of which is taxable in the Netherlands, the Dutch tax position is not discussed in this summary.
Dividend withholding tax
In general, a distribution to shareholders by a company resident in the Netherlands (such as the Company) is subject to a withholding tax imposed by the Netherlands at a rate of 15%. Share dividends paid out of the Company’s paid-in share premium recognized for Dutch tax purposes are not subject to the above mentioned withholding tax. Share dividends paid out of the Company’s retained earnings are subject to dividend withholding tax on the nominal value of the shares issued. Pursuant to the provisions of the US Tax Treaty, a reduced rate may be applicable in respect of dividends paid by the Company to a beneficial owner holding directly 10% or more of the voting power of the Company, if such owner is a company resident of the United States (as defined in the US Tax Treaty) and entitled to the benefits of the US Tax Treaty.
Pursuant to Dutch anti-dividend stripping legislation, a holder of common shares who is the recipient of dividends will generally not be considered the beneficial owner of the dividends if (i) as a consequence of a combination of transactions, a person other than the recipient wholly or partly benefits from the dividends; (ii) whereby such other person retains, directly or indirectly, an interest similar to that in the common shares on which the dividends were paid; and (iii) that other person is entitled to a credit, reduction or refund of dividend withholding tax that is less than that of the recipient.
Dividends paid to qualifying exempt US pension trusts and qualifying exempt US organizations are under certain conditions exempt from Dutch withholding tax under the US Tax Treaty. Qualifying exempt US pension trusts normally remain subject to withholding at the rate of 15% and are required to file for a refund of the tax withheld. Only if certain conditions are fulfilled, such pension trusts may be eligible for relief at source upon payment of the dividend. However, for qualifying exempt US organizations no relief at source upon payment of the dividend is available; such exempt US organizations should apply for a refund of the 15% withholding tax withheld. Further, under certain circumstances, certain exempt organisations (e.g pension funds) may be eligible for a refund of Dutch withholding tax upon their request pursuant to Dutch tax law.
The Company may, with respect to certain dividends received from qualifying non-Dutch subsidiaries, credit taxes withheld from those dividends against the Dutch withholding tax imposed on certain qualifying dividends that are redistributed by the Company, up to a maximum of the lesser of:
| • |
3% of the amount of qualifying dividends redistributed by the Company; and |
| • |
3% of the gross amount of certain qualifying dividends received by the Company. |
The reduction is applied to the Dutch dividend withholding tax that the Company must pay to the Dutch tax authorities and not to the Dutch dividend withholding tax that the Company must withhold.
Income and capital gains
Income and capital gains derived from the common shares by a non-resident individual or non-resident corporate shareholder are generally not subject to Dutch income or corporation tax, unless (i) such income and gains are attributable to a (deemed) permanent establishment or (deemed) permanent representative in the Netherlands of the shareholder; or (ii) the shareholder is entitled to a share in the profits of an enterprise or (in case of a non-resident corporate shareholder only) a co-entitlement to the net worth of an enterprise, that is effectively managed in the Netherlands (other than by way of securities) and to which enterprise the common shares are attributable; or (iii) such income and capital gains are derived from a direct, indirect or deemed substantial participation in the share capital of a company (such substantial participation not being a business asset), and, in the case of a non-resident corporate shareholder only, it being held with the primary aim or one of the primary aims to avoid the levy of income tax or dividend withholding tax from another person; or (iv) in case of a non-resident corporate shareholder, such shareholder is a resident of Aruba, Curacao or Saint Martin with a permanent establishment or permanent representative in Bonaire, Eustatius or Saba to which the common shares are attributable, while the profits of such shareholder are taxable in the Netherlands pursuant to article 17(3)(c) of the Dutch Corporate Income Tax Act 1969; or (v) in case of a non-resident individual, (a) such individual derives income or capital gains from the common shares that are taxable as benefits from ‘miscellaneous activities’ in the Netherlands ( resultaat uit overige werkzaamheden , as
270 Annual Report 2014
Table of Contents
Investor Relations 17.7
defined in the Dutch Income Tax Act 2001), which includes the performance of activities with respect to the ordinary shares that exceed regular portfolio management; or (b) such individual has elected to be treated as a Dutch resident. In this respect, it is noted that as per 1 January 2015, the election regime will be replaced by a mandatory qualification as a ‘qualifying foreign tax payer’ on the basis of certain objective criteria.
In general, a holder of common shares has a substantial participation if he holds either directly or indirectly and either independently or jointly with his partner (as defined in the Dutch Income Tax Act 2001), the ownership of, or certain other rights over, at least 5% of the total issued share capital or total issued particular class of shares of the Company or rights to acquire shares, whether or not already issued, that represent at any time 5% or more of the total issued capital (or the total issued particular class of shares) or the ownership of certain profit participating certificates that relate to 5% or more of the annual profit or to 5% or more of the liquidation proceeds. A shareholder will also have a substantial participation in the Company if one or more of certain relatives of the shareholder hold a substantial participation in the Company. A deemed substantial participation amongst others exists if (part of) a substantial participation has been disposed of, or is deemed to have been disposed of, on a non-recognition basis.
Estate and gift taxes
No estate, inheritance or gift taxes are imposed by the Netherlands on the transfer or deemed transfer of common shares by way of gift by or on the death of a shareholder if, at the time of the death of the shareholder or the gift of the common shares (as the case may be), such shareholder is not a (deemed) resident of the Netherlands.
Inheritance or gift taxes (as the case may be) are due, however, if such shareholder:
| • |
has Dutch nationality and has been a resident of the Netherlands at any time during the ten years preceding the time of the death or gift; or |
| • |
has no Dutch nationality but has been a resident of the Netherlands at any time during the twelve months preceding the time of the gift (for Netherlands gift taxes only) |
United States Federal Taxation
This section describes the material United States federal income tax consequences to a US holder (as defined below) of owning common shares. It applies only if the common shares are held as capital assets for tax purposes. This section does not apply to a member of a special class of holders subject to special rules, including:
| • |
a dealer in securities, |
| • |
a trader in securities that elects to use a mark-to-market method of accounting for securities holdings, |
| • |
a tax-exempt organization, |
| • |
a life insurance company, |
| • |
a person liable for alternative minimum tax, |
| • |
a person that actually or constructively owns 10% or more of our voting stock, |
| • |
a person that holds common shares as part of a straddle or a hedging or conversion transaction, |
| • |
a person that purchases or sells common shares as part of a wash sale for tax purposes, or |
| • |
a person whose functional currency is not the US dollar. |
This section is based on the Internal Revenue Code of 1986, as amended, its legislative history, existing and proposed regulations, published rulings and court decisions, all as currently in effect, as well as on the US Tax Treaty. These laws and regulations are subject to change, possibly on a retroactive basis.
If a partnership holds the common shares, the United States federal income tax treatment of a partner will generally depend on the status of the partner and the tax treatment of the partnership. A partner in a partnership holding the common shares should consult its tax advisor with regard to the United States federal income tax treatment of an investment in the common shares.
A US holder is defined as a beneficial owner of common shares that is:
| • |
a citizen or resident of the United States, |
| • |
a domestic corporation, |
| • |
an estate whose income is subject to United States federal income tax regardless of its source, or |
| • |
a trust if a United States court can exercise primary supervision over the trust’s administration and one or more United States persons are authorized to control all substantial decisions of the trust. |
A US holder should consult its own tax advisor regarding the United States federal, state and local and other tax consequences of owning and disposing of common shares in its particular circumstances.
This discussion addresses only United States federal income taxation.
Taxation of Dividends
Under the United States federal income tax laws, the gross amount of any dividend paid out of our current or accumulated earnings and profits (as determined for United States federal income tax purposes) is subject to United States federal income taxation. For a non-corporate US holder, dividends paid that constitute qualified dividend income will be taxable at a maximum tax rate of 20% provided that the non-corporate US holder holds the common shares for more than 60 days during the 121-day period beginning 60 days before the ex-dividend date and meets other holding period
Annual Report 2014 271
Table of Contents
Investor Relations 17.7
requirements. Dividends paid with respect to the common shares generally will be qualified dividend income 1) . A US holder must include any Dutch tax withheld from the dividend payment in this gross amount even though it does not in fact receive it. The dividend is taxable to a US holder when it receives the dividend, actually or constructively. The dividend will not be eligible for the dividends-received deduction generally allowed to United States corporations in respect of dividends received from other United States corporations. The amount of the dividend distribution that a US holder must include in its income will be the US dollar value of the euro payments made, determined at the spot euro/US dollar rate on the date the dividend distribution is includible in its income, regardless of whether the payment is in fact converted into US dollars. Generally, any gain or loss resulting from currency exchange fluctuations during the period from the date a US holder includes the dividend payment in income to the date a US holder converts the payment into US dollars will be treated as ordinary income or loss and will not be eligible for the special tax rate applicable to qualified dividend income. The gain or loss generally will be income or loss from sources within the United States for foreign tax credit limitation purposes. Distributions in excess of current and accumulated earnings and profits, as determined for United States federal income tax purposes, will be treated as a non-taxable return of capital to the extent of a US holder’s basis in the common shares and thereafter as capital gain.
Subject to certain limitations, the Dutch tax withheld in accordance with the US Tax Treaty and paid over to the Netherlands will be creditable or deductible against a US holder’s United States federal income tax liability. Special rules apply in determining the foreign tax credit limitation with respect to dividends that are subject to the maximum 20% tax rate. To the extent a refund of the tax withheld is available under Dutch law, or under the US Tax Treaty, the amount of tax withheld that is refundable will not be eligible for credit against United States federal income tax liability. Dividends will be income from sources outside the United States, and depending on a holder’s circumstances, will generally be either “passive” or “general” income for purposes of computing the foreign tax credit allowable to the holder.
Taxation of Capital Gains
A US holder that sells or otherwise disposes of its common shares will recognize capital gain or loss for United States federal income tax purposes equal to the difference between the US dollar value of the amount that it realizes and its tax basis, determined in US dollars, in its common shares. Capital gain of a non-corporate US holder is generally taxed at a maximum tax rate of 20% where the holder has a holding period greater than one year 2) . The gain or loss will generally be income or loss from sources within the United States for foreign tax credit limitation purposes.
PFIC Rules
We do not believe that the common shares will be treated as stock of a passive foreign investment company, or PFIC, for United States federal income tax purposes, but this conclusion is a factual determination that is made annually and thus is subject to change. If we are treated as a PFIC, unless a US holder elects to be taxed annually on a mark-to-market basis with respect to the common shares, gain realized on the sale or other disposition of the common shares would in general not be treated as capital gain. Instead a US holder would be treated as if it had realized such gain and certain “excess distributions” ratably over the holding period for the common shares and would be taxed at the highest tax rate in effect for each such year to which the gain was allocated, in addition to which an interest charge in respect of the tax attributable to each such year would apply. Any dividends received by a US holder will not be eligible for the special tax rates applicable to qualified dividend income if we are treated as a PFIC with respect to such US holder either in the taxable year of the distribution or the preceding taxable year, but instead will be taxable at rates applicable to ordinary income and subject to the excess distribution regime described above.
| 1) | In addition, a US holder that is an individual or estate, or a trust that does not fall into a special class of trusts that is exempt from such tax, is subject to a 3.8% tax on the lesser of (1) the US holder’s “net investment income” for the relevant taxable year and (2) the excess of the US holder’s modified adjusted gross income for the taxable year over a certain threshold (the “Medicare tax”). A US holder’s net investment income generally includes its dividend income. |
| 2) | In addition, the gain or loss is generally included in a US holder’s net investment income, which may be subject to a 3.8% tax as described in the discussion of the Medicare tax under the heading – “Taxation of Dividends”. |
272 Annual Report 2014
Table of Contents
Investor Relations 17.8
Fees and Charges Payable by a Holder of New York Registry Shares
Citibank, N.A. as the US registrar, transfer agent, paying agent and shareholder servicing agent (“Agent”) under Philips’ New York Registry Share program (the “Program”), collects fees for delivery and surrender of New York Registry Shares directly from investors depositing ordinary shares or surrendering New York Registry Shares for the purpose of withdrawal or from intermediaries acting for them. The Agent collects fees for making distributions to investors by deducting those fees from the amounts distributed or by selling a portion of the distributable property to pay the fees.
The charges of the Agent payable by investors are as follows:
The New York Transfer Agent charges shareholders a fee of up to USD 5.00 per 100 shares for the exchange of New York Registry shares for ordinary shares and vice versa.
Fees and Payments made by the Agent to Philips
The Agent has agreed to reimburse certain expenses of Philips related to the Program and incurred by Philips in connection with the Program. In the year ended December 31, 2014 the Agent reimbursed to Philips, or paid amounts on Philips behalf to third parties, a total sum of EUR 702,018.
The table below sets forth the types of expenses that the Agent has agreed to reimburse and the amounts reimbursed in the year ended December 31, 2014:
Category of Expense Reimbursed to Philips in EUR
amount reimbursed in the year ended December 31, 2014
|
Program related expenses such as legal fees and New York Stock Exchange listing fees |
73,511 | |||
|
A portion of the issuance and cancellation fees actually received by the Agent from holders of New York Registry Shares, net of Program-related expenses already reimbursed by the Agent to Philips. |
628,507 | 1) | ||
|
|
|
|||
|
Expense reimbursed |
702,018 | |||
|
|
|
| 1) |
Translated at USD/EUR exchange rate of actual date(s) of reimbursement(s) during 2014 |
The Agent has also agreed to waive certain fees for standard costs associated with the administration of the program.
The table below sets forth those expenses that the Agent paid directly to third parties in the year ended December 31, 2014.
Category of Expense paid directly to third parties in EUR
| amount in the year ended December 31, 2014 | ||||
|
Reimbursement of Proxy Process expenses |
6,940 | |||
|
Reimbursement of Legal Fee expenses |
— | |||
|
NYSE Listing Fee |
66,570 | |||
|
Fullfillment |
— | |||
|
|
|
|||
|
Expense paid directly to third parties |
73,511 | |||
|
|
|
|||
Under certain circumstances, including removal of the Agent or termination of the Program by Philips, Philips is required to repay the Agent certain amounts reimbursed and/or expenses paid to or on behalf of Philips.
Annual Report 2014 273
Table of Contents
Definitions and abbreviations 18
18 Definitions and abbreviations
BMC
Business Market Combination - As a diversified technology group, Philips has a wide portfolio of categories/business innovation units which are grouped in business groups based primarily on technology or customer needs. Philips has physical market presence in over 100 countries, which are grouped into 17 market clusters. Our primary operating modus is the Business Market matrix comprising Business Groups and Markets. These Business Market Combinations (BMCs) drive business performance on a granular level at which plans are agreed between global businesses and local market teams.
Brominated flame retardants (BFR)
Brominated flame retardants are a group of chemicals that have an inhibitory effect on the ignition of combustible organic materials. Of the commercialized chemical flame retardants, the brominated variety are most widely used.
CO 2 -equivalent
CO 2 -equivalent or carbon dioxide equivalent is a quantity that describes, for a given mixture and amount of greenhouse gas, the amount of CO 2 that would have the same global warming potential (GWP), when measured over a specified timescale (generally 100 years).
Cash flow before financing activities
The cash flow before financing activities is the sum of net cash flow from operating activities and net cash flow from investing activities.
Chlorofluorocarbon (CFC)
A chlorofluorocarbon is an organic compound that contains carbon, chlorine and fluorine, produced as a volatile derivative of methane and ethane. CFCs were originally developed as refrigerants during the 1930s.
Circular economy
A circular economy aims to decouple economic growth from the use of natural resources and ecosystems by using those resources more effectively. By definition it is a driver for innovation in the areas of material-, component- and product reuse, as well as new business models such as solutions and services. In a Circular Economy, the more effective use of materials enables to create more value, both by cost savings and by developing new markets or growing existing ones.
Comparable sales
Comparable sales exclude the effect of currency movements and acquisitions and divestments (changes in consolidation). Philips believes that comparable sales information enhances understanding of sales performance.
Continuing net income
This equals recurring net income from continuing operations, or net income excluding discontinued operations and excluding material non-recurring items.
Dividend yield
The dividend yield is the annual dividend payment divided by Philips’ market capitalization. All references to dividend yield are as of December 31 of the previous year.
EBITA
Earnings before interest, tax and amortization (EBITA) represents income from continuing operations excluding results attributable to non- controlling interest holders, results relating to investments in associates, income taxes, financial income and expenses, amortization and impairment on intangible assets (excluding software and capitalized development expenses). Philips believes that EBITA information makes the underlying performance of its businesses more transparent by factoring out the amortization of these intangible assets, which arises when acquisitions are consolidated. In our Annual Report on form 20-F this definition is referred to as Adjusted IFO.
EBITA per common share
EBITA divided by the weighted average number of shares outstanding (basic). The same principle is used for the definition of net income per common share, replacing EBITA.
Electronic Industry Citizenship Coalition (EICC)
The Electronic Industry Citizenship Coalition was established in 2004 to promote a common code of conduct for the electronics and information and communications technology (ICT) industry. EICC now includes more than 40 global companies and their suppliers.
Employee Engagement Index (EEI)
The Employee Engagement Index (EEI) is the single measure of the overall level of employee engagement at Philips. It is a combination of perceptions and attitudes related to employee satisfaction, commitment and advocacy.
Energy-using Products (EuP)
An energy-using product is a product that uses, generates, transfers or measures energy (electricity, gas, fossil fuel). Examples are boilers, computers, televisions, transformers, industrial fans, industrial furnaces etc.
Free cash flow
Free cash flow is the net cash flow from operating activities minus net capital expenditures.
Full-time equivalent employee (FTE)
Full-time equivalent is a way to measure a worker’s involvement in a project. An FTE of 1.0 means that the person is equivalent to a full-time worker, while an FTE of 0.5 signals that the worker is only half-time.
Global Reporting Initiative (GRI)
The Global Reporting Initiative (GRI) is a network-based organization that pioneered the world’s most widely used sustainability reporting framework. GRI is committed to the framework’s continuous improvement and application worldwide. GRI’s core goals include the mainstreaming of disclosure on environmental, social and governance performance.
Green Innovation
Green Innovation comprise all R&D activities directly contributing to the development of Green Products or Green Technologies.
Green Products
Green Products offer a significant environmental improvement in one or more Green Focal Areas: Energy efficiency, Packaging, Hazardous substances, Weight, Recycling and disposal and Lifetime reliability. The life cycle approach is used to determine a product’s overall environmental improvement. It calculates the environmental impact of a product over its total life cycle (raw materials, manufacturing, product use and disposal). Green Products need to prove leadership in at least one Green Focal Area compared to industry standards, which is defined by a sector specific peer group. This is done either by outperforming reference products (which can be a competitor or predecessor product in the particular product family) by at least 10%, outperforming product specific eco-requirements or by being awarded with a recognized eco-performance label. Because of different product portfolios, sectors have specified additional criteria for Green Products, including product specific minimum requirements where relevant.
Growth geographies
Growth geographies are the developing geographies comprising of Asia Pacific (excluding Japan, South Korea, Australia and New Zealand), Latin America, Central & Eastern Europe, the Middle East (excluding Israel) and Africa.
Hydrochlorofluorocarbon (HCFC)
Hydrochlorofluorocarbon is a fluorocarbon that is replacing chlorofluorocarbon as a refrigerant and propellant in aerosol cans.
Income from continuing operations
Net income from continuing operations, or net income excluding discontinued operations.
Initiatief Duurzame Handel (IDH)
IDH is the Dutch Sustainable Trade Initiative. It brings together government, frontrunner companies, civil society organizations and labor unions to accelerate and up-scale sustainable trade in mainstream commodity markets from the emerging countries to Western Europe.
274 Annual Report 2014
Table of Contents
Definitions and abbreviations 18
International Standardization Organization (ISO)
The International Standardization Organization (ISO) is the world’s largest developer and publisher of International Standards. ISO is a network of the national standards institutes of more than 160 countries, one member per country, with a Central Secretariat in Geneva, Switzerland, that coordinates the system. ISO is a non-governmental organization that forms a bridge between the public and private sectors.
Light-Emitting Diode (LED)
Light-Emitting Diode (LED), in electronics, is a semiconductor device that emits infrared or visible light when charged with an electric current. Visible LEDs are used in many electronic devices as indicator lamps, in automobiles as rear-window and brake lights, and on billboards and signs as alphanumeric displays or even full-color posters. Infrared LEDs are employed in autofocus cameras and television remote controls and also as light sources in fiber-optic telecommunication systems.
Lives improved by Philips
To calculate how many lives we are improving, market intelligence and statistical data on the number of people touched by the products contributing to the social or ecological dimension over the lifetime of a product are multiplied by the number of those products delivered in a year. After elimination of double counts – multiple different product touches per individual are only counted once – the number of lives improved by our innovative solutions is calculated. In 2012 we established our baseline at 1.7 billion a year.
Mature geographies
Mature geographies are the highly developed markets comprising of Western Europe, North America, Japan, South Korea, Israel, Australia and New Zealand.
Net debt : group equity ratio
The % distribution of net debt over group equity plus net debt.
Non-Governmental Organization (NGO)
A non-governmental organization (NGO) is any non-profit, voluntary citizens’ group which is organized at a local, national or international level.
OEM
Original Equipment Manufacturer.
Operational carbon footprint
A carbon footprint is the total set of greenhouse gas emissions caused by an organization, event, product or person; usually expressed in kilotonnes CO 2 -equivalent. The Philips operational carbon footprint is calculated on a half-year basis and includes industrial sites (manufacturing and assembly sites), non-industrial sites (offices, warehouses, IT centers and R&D facilities), business travel (lease and rental cars and airplane travel) and logistics (air, sea and road transport).
Perfluorinated compounds (PFC)
A perfluorinated compound (PFC) is an organofluorine compound with all hydrogens replaced by fluorine on a carbon chain—but the molecule also contains at least one different atom or functional group. PFCs have unique properties to make materials stain, oil, and water resistant, and are widely used in diverse applications. PFCs persist in the environment as persistent organic pollutants, but unlike PCBs, they are not known to degrade by any natural processes due to the strength of the carbon–fluorine bond.
Polyvinyl chloride (PVC)
Polyvinyl chloride, better known as PVC or vinyl, is an inexpensive plastic so versatile it has become completely pervasive in modern society. The list of products made from polyvinyl chloride is exhaustive, ranging from phonograph records to drainage and potable piping, water bottles, cling film, credit cards and toys. More uses include window frames, rain gutters, wall paneling, doors, wallpapers, flooring, garden furniture, binders and even pens.
Productivity
Philips uses Productivity internally and as mentioned in this Annual Report as a non-financial indicator of efficiency that relates the added value, being income from operations adjusted for certain items such as restructuring and acquisition-related charges etc. plus salaries and wages (including pension costs and other social security and similar charges), depreciation of property, plant and equipment, and amortization of intangibles, to the average number of employees over the past 12 months.
Regulation on Hazardous Substances (RoHS)
The RoHS Directive prohibits all new electrical and electronic equipment placed on the market in the European Economic Area from containing lead, mercury, cadmium, hexavalent chromium, poly-brominated biphenyls (PBB) or polybrominated diphenyl ethers (PBDE), except in certain specific applications, in concentrations greater than the values decided by the European Commission. These values have been established as 0.01% by weight per homogeneous material for cadmium and 0.1% for the other five substances.
Return on equity (ROE)
This ratio measures income from continuing operations as a percentage of average shareholders’ equity. ROE rates Philips’ overall profitability by evaluating how much profit the company generates with the money shareholders have invested.
Return on invested capital (ROIC)
Return on Invested Capital consists of income from continuing operations excluding results attributable to non-controlling interest holders, results relating to investments in associates and financial income and expenses, divided by the average net operating capital at year end and the preceding four quarter ends. Philips believes that ROIC information makes the underlying performance of its businesses more transparent as it relates returns to the operating capital in use.
SF 6
SF 6 (Sulfur hexafluoride) is used in the electrical industry as a gaseous dielectric medium.
Turnover rate of net operating capital
Sales divided by average net operating capital (calculated on the quarterly balance sheet positions).
Voluntary turnover
Voluntary turnover covers all employees who resigned of their own volition.
Waste Electrical and Electronic Equipment (WEEE)
The Waste Electrical and Electronic Equipment Directive (WEEE Directive) is the European Community directive on waste electrical and electronic equipment which became European Law in February 2003, setting collection, recycling and recovery targets for all types of electrical goods. The directive imposes the responsibility for the disposal of waste electrical and electronic equipment on the manufacturers of such equipment.
Weighted Average Statutory Tax Rate (WASTR)
The reconciliation of the effective tax rate is based on the applicable statutory tax rate, which is a weighted average of all applicable jurisdictions. This weighted average statutory tax rate (WASTR) is the aggregation of the result before tax multiplied by the applicable statutory tax rate without adjustment for losses, divided by the group result before tax.
Annual Report 2014 275
Table of Contents
Exhibits 19
|
|
||
| Exhibit 1 | English translation of the Articles of Association of the Company. | |
| Exhibit 2 (b) (1) | Indenture between Koninklijke Philips N.V. and Deutsche Bank Trust Company Americas, Trustee, dated as of March 11, 2008, as supplemented by the First Supplemental Indenture (Incorporated by reference to Exhibits 4.1 and 4.2 of Registration Statement on Form F-3 No. 333-179889). The total amount of long-term debt securities of the Company and its subsidiaries authorized under any one other instrument does not exceed 10% of the total assets of Philips and its subsidiaries on a consolidated basis. Philips agrees to furnish copies of any or all such instruments to the Securities and Exchange Commission upon request. | |
| Exhibit 4 | Employment contracts of the members of the Board of Management (incorporated by reference to Exhibit 4 of the Company’s Annual Report on Form 20-F for the fiscal year ended December 31, 2011, File No. 001-05146-01). | |
| Exhibit 4 (a) | Employment contract between the Company and F.A. van Houten (incorporated by reference to Exhibit 4 (a) of the Company’s Annual Report on Form 20-F for the fiscal year ended December 31, 2011, File No. 001-05146-01). | |
| Exhibit 4 (b) | Employment contract between the Company and R.H. Wirahadiraksa (incorporated by reference to Exhibit 4 (b) of the Company’s Annual Report on Form 20-F for the fiscal year ended December 31, 2011, File No. 001-05146-01). | |
| Exhibit 4 (c) | Employment contract between the Company and P.A.J.Nota (incorporated by reference to Exhibit 4 (d) of the Company’s Annual Report on Form 20-F for the fiscal year ended December 31, 2011, File No. 001-05146-01) | |
| Exhibit 7 | Ratio of earnings to fixed charges | |
| Exhibit 8 | List of Subsidiaries. | |
| Exhibit 12 (a) | Certification of F.A. van Houten filed pursuant to 17 CFR 240. 13a-14(a). | |
| Exhibit 12 (b) | Certification of R.H. Wirahadiraksa filed pursuant to 17 CFR 240. 13a-14(a). | |
| Exhibit 13 (a) | Certification of F.A. van Houten furnished pursuant to 17 CFR 240. 13a-14(b). | |
| Exhibit 13 (b) | Certification of R.H. Wirahadiraksa furnished pursuant to 17 CFR 240. 13a-14(b). | |
| Exhibit 15 (a) | Consent of independent registered public accounting firm. | |
| Exhibit 15 (b) | Description of industry terms. | |
|
|
||
276 Annual Report 2014
Table of Contents
Exhibits 19.1
The registrant hereby certifies that it meets all of the requirements for filing on Form 20-F and that it has duly caused and authorized the undersigned to sign this Annual Report on its behalf.
KONINKLIJKE PHILIPS N.V.
(Registrant)
| /s/ F.A. van Houten | /s/ R.H. Wirahadiraksa | |
| F.A. van Houten | R.H. Wirahadiraksa | |
| (CEO, Chairman of the Board of Management and the Executive Committee) | (Executive Vice-President, Chief Financial Officer, member of the Board of Management and the Executive Committee) |
Date: February 24, 2015
Annual Report 2014 277
Table of Contents
Exhibits 19.2
19.3 Exhibits
|
|
||
| Exhibit 1 | English translation of the Articles of Association of the Company. | |
| Exhibit 2 (b) (1) | Indenture between Koninklijke Philips N.V. and Deutsche Bank Trust Company Americas, Trustee, dated as of March 11, 2008, as supplemented by the First Supplemental Indenture (Incorporated by reference to Exhibits 4.1 and 4.2 of Registration Statement on Form F-3 No. 333-179889). The total amount of long-term debt securities of the Company and its subsidiaries authorized under any one other instrument does not exceed 10% of the total assets of Philips and its subsidiaries on a consolidated basis. Philips agrees to furnish copies of any or all such instruments to the Securities and Exchange Commission upon request. | |
| Exhibit 4 | Employment contracts of the members of the Board of Management (incorporated by reference to Exhibit 4 of the Company’s Annual Report on Form 20-F for the fiscal year ended December 31, 2011, File No. 001-05146-01). | |
| Exhibit 4 (a) | Employment contract between the Company and F.A. van Houten. (incorporated by reference to Exhibit 4 (a) of the Company’s Annual Report on Form 20-F for the fiscal year ended December 31, 2011, File No. 001-05146-01). | |
| Exhibit 4 (b) | Employment contract between the Company and R.H. Wirahadiraksa. (incorporated by reference to Exhibit 4 (b) of the Company’s Annual Report on Form 20-F for the fiscal year ended December 31, 2011, File No. 001-05146-01). | |
| Exhibit 4 (c) | Employment contract between the Company and P.A.J.Nota (incorporated by reference to Exhibit 4 (d) of the Company’s Annual Report on Form 20-F for the fiscal year ended December 31, 2011, File No. 001-05146-01) | |
| Exhibit 7 | Ratio of earnings to fixed charges | |
| Exhibit 8 | List of Subsidiaries. | |
| Exhibit 12 (a) | Certification of F.A. van Houten filed pursuant to 17 CFR 240. 13a-14(a). | |
| Exhibit 12 (b) | Certification of R.H. Wirahadiraksa filed pursuant to 17 CFR 240. 13a-14(a). | |
| Exhibit 13 (a) | Certification of F.A. van Houten furnished pursuant to 17 CFR 240. 13a-14(b). | |
| Exhibit 13 (b) | Certification of R.H. Wirahadiraksa furnished pursuant to 17 CFR 240. 13a-14(b). | |
| Exhibit 15 (a) | Consent of independent registered public accounting firm. | |
| Exhibit 15 (b) | Description of industry terms. | |
|
|
||
278 Annual Report 2014