POLARIS INC.
10-Ks and 10-Qs
|
|
|
|
|
|
|
|
|
|
|
|
|
|
|
|
|
|
|
|
|
|
|
|
|
|
|
|
|
|
|
|
|
|
|
|
|
|
|
|
|
|
|
|
|
|
|
|
|
|
|
|
|
|
|
|
|
UNITED STATES
|
||
|
SECURITIES AND EXCHANGE COMMISSION
|
||
|
Washington, D.C. 20549
|
||
|
FORM 10-K
|
||
|
ANNUAL REPORT PURSUANT TO SECTION 13 OR 15(d)
|
||
|
OF THE SECURITIES EXCHANGE ACT OF 1934
|
||
|
For the fiscal year ended December 31, 2018
|
||
|
Commission file number 001-11411
|
||
POLARIS INDUSTRIES INC.
(Exact name of registrant as specified in its charter)
|
Minnesota
|
41-1790959
|
|
|
(State or other jurisdiction of
incorporation or organization)
|
(I.R.S. Employer
Identification No.)
|
|
|
2100 Highway 55, Medina MN
|
55340
|
|
|
(Address of principal executive offices)
|
(Zip Code)
|
|
|
(763) 542-0500
(Registrant’s telephone number, including area code)
Securities registered pursuant to Section 12(b) of the Act:
|
||
|
Title of Class
|
Name of Each Exchange on Which Registered
|
|
|
Common Stock, $.01 par value
|
New York Stock Exchange
|
|
|
Securities registered pursuant to Section 12(g) of the Act:
None
|
||
Indicate by check mark if the registrant is a well-known seasoned issuer, as defined in Rule 405 of the Securities Act. Yes
x
No
¨
Indicate by check mark if the registrant is not required to file reports pursuant to Section 13 or Section 15(d) of the Exchange Act. Yes
¨
No
x
Indicate by check mark whether the registrant (1) has filed all reports required to be filed by Section 13 or 15(d) of the Securities Exchange Act of 1934 during the preceding 12 months (or for such shorter period that the registrant was required to file such reports), and (2) has been subject to such filing requirements for the past 90 days. Yes
x
No
¨
Indicate by check mark whether the registrant has submitted electronically every Interactive Data File required to be submitted pursuant to Rule 405 of Regulation S-T (§ 232.405 of this chapter) during the preceding 12 months (or for such shorter period that the registrant was required to submit such files). Yes
x
No
¨
Indicate by check mark if disclosure of delinquent filers pursuant to Item 405 of Regulation S-K (§ 229.405 of this chapter) is not contained herein, and will not be contained, to the best of registrant’s knowledge, in definitive proxy or information statements incorporated by reference in Part III of this Form 10-K or any amendment to this Form 10-K.
x
Indicate by check mark whether the registrant is a large accelerated filer, an accelerated filer, a non-accelerated filer, a smaller reporting company, or an emerging growth company. See the definitions of “large accelerated filer,” “accelerated filer,” “smaller reporting company” and “emerging growth company” in Rule 12b-2 of the Exchange Act. (Check one):
Large accelerated filer
x
Accelerated filer
¨
Non-accelerated filer
¨
Smaller reporting company
¨
Emerging growth company
¨
If an emerging growth company, indicate by check mark if the registrant has elected not to use the extended transition period for complying with any new or revised financial accounting standards provided pursuant to Section 13(a) of the Exchange Act.
¨
Indicate by check mark whether the registrant is a shell company (as defined in Rule 12b-2 of the Exchange Act). Yes
¨
No
x
The aggregate market value of the registrant’s common stock held by non-affiliates of the registrant was approximately
$7,601,247,000
as of June 29, 2018, based upon the last sales price per share of the registrant’s Common Stock, as reported on the New York Stock Exchange on such date.
As of
February 7, 2019
, 60,960,672 shares of Common Stock, $.01 par value, of the registrant were outstanding.
|
DOCUMENTS INCORPORATED BY REFERENCE:
|
||
Portions of the definitive Proxy Statement for the registrant’s Annual Meeting of Shareholders to be held on April 25, 2019 to be filed with the Securities and Exchange Commission within 120 days after the end of the fiscal year covered by this report (the “
2019
Proxy Statement”), are incorporated by reference into Part III of this Form 10-K.
1
|
POLARIS INDUSTRIES INC.
2018 FORM 10-K ANNUAL REPORT
TABLE OF CONTENTS
|
||
|
Page
|
||
|
PART I
|
||
|
Item 1.
|
||
|
Item 1A.
|
||
|
Item 1B.
|
||
|
Item 2.
|
||
|
Item 3.
|
||
|
Item 4.
|
||
|
PART II
|
||
|
Item 5.
|
||
|
Item 6.
|
||
|
Item 7.
|
||
|
Item 7A.
|
||
|
Item 8.
|
||
|
Item 9.
|
||
|
Item 9A.
|
||
|
Item 9B.
|
||
|
PART III
|
||
|
Item 10.
|
||
|
Item 11.
|
||
|
Item 12.
|
||
|
Item 13.
|
||
|
Item 14.
|
||
|
PART IV
|
||
|
Item 15.
|
||
|
Item 16.
|
||
2
PART I
Item 1. Business
Polaris Industries Inc., a Minnesota corporation, was formed in 1994 and is the successor to Polaris Industries Partners LP. The terms “Polaris,” the “Company,” “we,” “us,” and “our” as used herein refer to the business and operations of Polaris Industries Inc., its subsidiaries and its predecessors, which began doing business in 1954. We design, engineer and manufacture powersports vehicles which include, Off-Road Vehicles (ORV), including All-Terrain Vehicles (ATV) and side-by-side vehicles for recreational and utility use, Snowmobiles, Motorcycles, Global Adjacent Markets vehicles, including Commercial, Government and Defense vehicles, and Boats. Polaris products, together with related Parts, Garments and Accessories (PG&A), as well as aftermarket accessories and apparel, are sold through dealers, distributors and retail stores principally located in the United States, Canada, Western Europe, Australia and Mexico.
Industry
Off-Road Vehicles.
ORVs are four-wheel vehicles designed for off-road use and traversing rough terrain, dunes, swamps and marshland. The vehicles can be multi-passenger or single passenger, are used for recreation in such sports as fishing and hunting and for trail and dune riding, and for utility purposes on farms, ranches, and construction sites. The off-road vehicle industry is comprised of ATVs and side-by-side vehicles. The North American ATV industry decreased mid single-digits percent in 2018 with approximately 260,000 ATVs sold. Internationally, ATVs are also sold primarily in Western European countries by similar manufacturers as in North America. We estimate that during 2018 world-wide industry sales were down low single-digits percent from 2017 levels with approximately 370,000 ATVs sold worldwide. We estimate that worldwide side-by-side vehicle market sales increased mid single-digits percent during 2018 over 2017 levels with just over a half million side-by-side vehicles sold. The side-by-side market has increased consistently over the past several years primarily due to continued innovation by manufacturers. We estimate that total worldwide off-road vehicle industry sales for 2018, which include core ATVs and side-by-side vehicles, were up low singe-digits percent from 2017 levels with approximately 900,000 units sold.
Snowmobiles.
Snowmobiles have been manufactured under the Polaris name since 1954. We estimate that during the season ended March 31, 2018, world-wide industry sales of snowmobiles increased mid-single digits percent from the previous season levels with approximately 125,000 units sold worldwide.
Motorcycles.
Motorcycles are utilized as a mode of transportation as well as for recreational purposes. The industry is comprised of four segments: cruisers, touring, sport bikes and standard motorcycles. We entered the motorcycle market in 1998. We estimate that the combined 900cc and above cruiser and touring market segments (including the moto-roadster Slingshot
®
) decreased low double-digits percent in 2018 compared to 2017 levels with an estimated 190,000 heavyweight cruiser, touring, and mid-size motorcycles sold in the North American market. We estimate that during 2018, worldwide combined 900cc and above cruiser and touring market segments (including Slingshot) sales decreased mid single-digits percent from 2017 levels, with an estimated 300,000 units sold worldwide.
Global Adjacent Markets.
These vehicles are designed to support people mobility as well as various commercial work applications, and include products in the light-duty hauling, people mover, industrial and urban/suburban commuting sub-sectors, as well as tactical defense vehicles. We estimate the worldwide target market for Polaris’ Adjacent Markets vehicles was over $6.0 billion in 2018, which includes light duty hauling, people movers, industrial, rental, urban/suburban commuting and related quadricycles.
Aftermarket
. Aftermarket parts, garments and accessories are sold through a highly fragmented industry, which includes dealers, aftermarket e-commerce, big box retailers, distributors and specialty 4x4 retailers. We estimate the target market for Jeep and truck aftermarket accessories was approximately $10.0 billion in 2018, and the target market for Powersports aftermarket parts, garments and accessories to be approximately $2.0 billion in 2018.
Boats.
Our boats are designed to compete in key segments of the recreational marine industry, including pontoon, deck, bowrider, cruiser and fishing boats. Inclusive of the segments in which we compete, we estimate total worldwide 2018 powerboats market sales were approximately $8.0 billion, with pontoon and fishing boats being two of the largest and fastest growing segments therein.
Market and Industry Data
We have obtained the market and industry data presented in this year’s Annual Report from a combination of internal surveys, third party information and estimates by management. There are limited sources that report on our markets and industries. As such, much of the market and industry data presented in this year’s Annual Report is based on internally-
3
generated management estimates, including estimates based on extrapolations from third party surveys of the industries in which we compete. While we believe internal surveys, third party information and our estimates are reliable, we have not verified them, nor have they been verified by any independent sources and we have no assurance that the information contained in third party websites is current, up-to date, or accurate. While we are not aware of any misstatements regarding the market and industry data presented in this Annual Report, whether any such future-looking data will be accurate involves risks and uncertainties and are subject to change based on various factors, including those factors discussed under the Forward-Looking Statements and in our Risk Factors.
Products
Off-Road Vehicles.
In 2018, we continued to be the North American market share leader in Off-Road Vehicles. Our Off-Road Vehicle lineup includes the
RZR
®
sport side-by-side, the
RANGER
®
utility side-by-side, the GENERAL
™
crossover side-by-side, the Sportsman
®
ATV and the Polaris ACE
®
. The full line (excluding military vehicles) spans 56 models, including two-, four- and six-wheel drive general purpose and recreational vehicles. 2019 model year suggested retail prices range from approximately $2,300 to $31,000 in the United States.
Our lineup continues to expand through the introduction of electric ORVs and gas and diesel commercial focused ORVs. In many of our segments, we offer youth, value, mid-size, premium and extreme-performance vehicles, which come in both single passenger and multi-passenger seating arrangements. Key 2018 ORV product introductions included the all-new
RANGER CREW
®
XP 1000 EPS High Lifter Edition, the
RZR
XP
®
Turbo S, the
RZR
®
RS1
™
, and the
RANGER
®
150 EFI.
We produce or supply a variety of replacement parts and Polaris Engineered Accessories
®
for our ORVs. ORV accessories include winches, bumper/brushguards, plows, racks, wheels and tires, pull-behinds, cab systems, lighting and audio systems, cargo box accessories, tracks and oil. We also market a full line of recreational apparel related to our ORVs, including helmets, jackets, gloves, pants and hats.
Snowmobiles.
For the season ended ended March 31, 2018, we hold the number two market share position for North America. We produce a full line of snowmobiles consisting of 29 models, ranging from youth models to utility and economy models to performance and competition models. The 2019 model year suggested retail prices range from approximately $3,000 to $15,200 in the United States. Polaris snowmobiles are sold principally in the United States, Canada, Russia and Northern Europe. Key 2018 snowmobile product introductions included the all-new Polaris INDY EVO
™
and the 850 Patriot
™
engine. We also manufacture a snow bike conversion kit system under the Timbersled brand. The 2019 model year suggested retail prices on the Timbersled systems range from approximately $2,000 to $6,200.
We produce or supply a variety of replacement parts and Polaris Engineered Accessories
®
for our snowmobiles and snow bike conversion kits. Snowmobile accessories include covers, traction products, reverse kits, electric starters, tracks, bags, windshields, oil and lubricants. We also market a full line of recreational apparel for our snowmobiles, including helmets, goggles, jackets, gloves, boots, bibs, pants and hats. Apparel is designed to our specifications, purchased from independent vendors and sold by us through our dealers, distributors, and online.
Motorcycles.
As of the end of 2018, we hold the number two position in North American market share for the 900cc+ category. Our Motorcycles lineup includes Indian Motorcycles and Slingshot, a 3-wheel open air roadster. Our 2019 model year line of motorcycles for Indian and Slingshot consists of 21 models with suggested retail prices ranging from approximately $9,500 to $31,000 in the United States. In 2018, Indian Motorcycles debuted its much anticipated flat track inspired street bike, FTR
™
1200.
We produce or supply a variety of replacement parts and accessories for our motorcycles. Motorcycle accessories include saddle bags, handlebars, backrests, exhausts, windshields, seats, oil and various chrome accessories. We also market a full line of recreational apparel for our motorcycles, including helmets, jackets, leathers and hats. Apparel is designed to our specifications, purchased from independent vendors and sold by us through our dealers and distributors, and online under our brand names.
Global Adjacent Markets.
Our brands include GEM, Goupil, Aixam and Taylor-Dunn, offering low emission vehicles, light duty hauling, passenger vehicles and industrial vehicles. Across these brands we offer 69 models with suggested retail prices ranging from approximately $6,100 to $79,500. Global Adjacent Markets also includes all business-to-business (B2B) applications of ORV, Snowmobiles, and Motorcycles outside of our traditional dealer channels. In addition, we offer ATVs and side-by-side vehicles with features specifically designed for ultra-light tactical military applications. These vehicles provide versatile mobility for up to nine passengers, and include DAGOR
™
, Sportsman MV
4
and
MRZR
®
.
Our standard line of military and government vehicles consists of six models at suggested United States retail prices ranging from approximately $11,000 to $196,000.
Aftermarket
. Our aftermarket portfolio of brands include Transamerican Auto Parts (“TAP”), which is a vertically integrated manufacturer, distributor, retailer and installer of off-road Jeep and truck accessories. Industry-leading brands owned by TAP include Pro Comp, Smittybilt, Rubicon Express, Poison Spyder, Trail Master, LRG and G2 Axle & Gear.
Other brands within our aftermarket portfolio include Kolpin, Pro Armor, Klim, 509, and Trail Tech. Aftermarket brands in our off-road category include Kolpin, a lifestyle brand specializing in purpose-built and universal-fit accessories for UTVs and outdoor enthusiasts, and Pro Armor
®
, a lineup that specializes in accessories for performance side-by-side vehicles and ATVs. Aftermarket brands in our snowmobile category include Klim, which specializes in premium technical riding gear for the snowmobile, motorcycle and off-road industries, and 509, which is an aftermarket leader in snowmobile apparel, helmets and goggles.
Boats.
Our brands include Bennington, Godfrey, Hurricane, Rinker, Larson, and Striper with a full offering of pontoon, deck, bowrider, cruiser and fishing boats. These brands are strategically positioned with over 300 base models across a range of price points. We also offer custom layouts and features and work with numerous engine OEMs enabling customers to build exactly what they want. Suggested retail prices range from approximately $13,000 to $400,000. In 2018, Polaris Boats, including the Bennington and Godfrey brands, was the market share leader in pontoon boats and our Hurricane brand was the market share leader in deck boats.
Significant
Acquisitions
Boats.
On July 2, 2018, pursuant to the Agreement and Plan of Merger dated May 29, 2018, we completed the acquisition of Boat Holdings, LLC, a privately held Delaware limited liability company, headquartered in Elkhart, Indiana which manufactures boats (“Boat Holdings”).
The transaction was structured as an acquisition of 100% of the outstanding equity interests in Boat Holdings for aggregate consideration of
$806.7 million
, net of cash acquired, subject to customary adjustments based on, among other things, the amount of cash, debt and working capital in the business of Boat Holdings at the closing date. A portion of the aggregate consideration equal to $100.0 million will be paid in the form of a series of deferred annual payments over 12 years following the closing date.
We funded the purchase price for the acquisition by amending, extending, and up-sizing our credit facility and with the proceeds of the issuance of 4.23% Senior Notes, Series 2018, due July 3, 2028.
Transamerican Auto Parts.
On October 11, 2016, we entered into a definitive agreement with TAP Automotive Holdings, LLC (“Transamerican Auto Parts” or “TAP”), to acquire the outstanding equity interests in Transamerican Auto Parts, a privately held, vertically integrated manufacturer, distributor, retailer and installer of off-road Jeep
®
and truck accessories, for an aggregate consideration of $668.3 million, net of cash acquired. The transaction closed on November 10, 2016. We funded the purchase price with borrowings under our existing credit facilities.
Manufacturing and Distribution Operations
Our products are primarily assembled at our 19 global manufacturing facilities. We are vertically integrated in several key components of our manufacturing process, including plastic injection molding, welding, clutch assembly and painting. Fuel tanks, tracks, tires, seats and instruments, and certain other component parts are purchased from third-party vendors. Raw materials or standard parts are readily available from multiple sources for the components manufactured by us. Polaris Boats has a long-term supply contract with an engine manufacturer, which requires a certain share of total engine purchases, and include favorable pricing, as well as various growth and volume incentives.
We do not anticipate any significant difficulties in obtaining substitute supply arrangements for other raw materials or components that we generally obtain from limited sources (however our costs could increase if we are required to switch suppliers).
Contract carriers ship our products from our manufacturing and distribution facilities to our customers. We maintain several leased wholegoods distribution centers where final set-up and up-fitting is completed for certain models before shipment to customers.
Our corporate headquarters facility is in Medina, Minnesota, and we maintain 30 other sales and administrative facilities across the world. Our products are distributed to our dealers, distributors and customers through a network of 33 distribution centers, including third-party providers.
5
Production Scheduling
We produce and deliver our products throughout the year based on dealer, distributor and customer orders. Side-by-side orders are placed in approximately two-week intervals for the high volume dealers driven by retail sales trends at the individual dealership. Smaller dealers utilize a similar process, but on a less frequent ordering cycle. Side-by-side retail sales activity at the dealer level drives orders which are incorporated into each product’s production scheduling. International distributor ORV orders are taken throughout the year. Orders for each year’s production of snowmobiles are placed by the dealers and distributors in the spring.
We utilize our Retail Flow Management (RFM) ordering system for motorcycle, side-by-side and ATV dealers. The RFM system allows dealers to order daily, create a segment stocking order, and eventually reduce order fulfillment times to what we expect will be less than three weeks.
For snowmobiles, we offer a pre-order SnowCheck program in the spring for our customers that assists us in production planning. This program allows our customers to order a true factory-customized snowmobile by selecting various options, including chassis, track, suspension, colors and accessories. Manufacture of snowmobiles commences in late winter of the previous season and continues through late autumn or early winter of the current season. We manufacture ORVs, motorcycles and people mobility vehicles year round.
For boats, through the use of offseason incentive programs, we adhere to level production throughout the year, minimizing disruption to the workforce and vendor network.
Sales and Marketing
Our products are sold through a network of approximately 2,250 independent dealers in North America, and approximately 1,400 independent international dealers through 31 subsidiaries and approximately 85 independent distributors in over 120 countries outside of North America. A majority of our dealers and distributors are multi-line and also carry competitor products, however few carry our full line of products and, while relatively consistent, the actual number of dealers can vary from time to time.
ORV/Snowmobiles
. We sell our ORVs directly to a network of over 1,450 dealers. Many of our ORV dealers and distributors are also authorized snowmobile dealers, and are located in the snowbelt regions of the United States and Canada. We sell our snowmobiles to a network of approximately 650 dealers.
Motorcycles
. Indian motorcycles and Slingshot are distributed directly through independently owned dealers and distributors, except in Australia where we have four Company-owned retail stores. Indian motorcycles are sold through a network of approximately 200 North American dealers, and Slingshot currently has approximately 400 North American dealers.
Global Adjacent Markets
. Within Global Adjacent Markets, our vehicles each have their own distribution networks through which their respective vehicles are distributed. GEM has approximately 200 dealers. Goupil and Aixam sell directly to customers in France, through subsidiaries in certain Western European countries and through several dealers and distributors for markets outside such countries. Taylor-Dunn has approximately 200 United States dealers and approximately 50 international dealers.
In addition, we sell Polaris vehicles directly to military and government agencies and other national accounts and supply a highly differentiated side-by-side vehicle to Bobcat Company. We have a partnership with Ariens Company (“Ariens”), a manufacturer of outdoor power equipment. Through the partnership, we leverage each other’s dealer networks, share certain technologies and research and development, and supply Ariens with a highly differentiated work vehicle to sell through its dealer network.
Aftermarket.
TAP sells through its retail stores, call center and e-commerce sites, while also supporting numerous independent accessory retailers/installers through their wholesale distribution network. TAP conducts business through a three-pronged sales, service, and manufacturing paradigm. TAP has 93 brick-and-mortar 4 Wheel Parts retail centers, staffed with experienced product and installation specialists. TAP’s omni-channel retail strategy includes a significant e-commerce business with 4WheelParts.com and 4WD.com. The TAP e-commerce network facilitates consumer sales, service and support, including “pick-up-in-store.”
Kolpin Outdoors, Pro Armor and Trail Tech are marketed through Apex Product Group, a unified sales and customer service company, which makes it easier and more efficient for dealers to purchase those brands. Klim and 509 each have their own dealer/distributor networks.
6
Boats
. In a highly fragmented industry, our extensive, experienced and loyal network of over 500 active dealers is a competitive advantage, helping to generate steady demand. Concentrated primarily in North America, this dealer network is organized into distinct sales territories supported by experienced sales reps and leadership.
Dealer agreements
. Dealers and distributors sell our products under contractual arrangements pursuant to which the dealer or distributor is authorized to market specified products and is required to carry certain replacement parts and perform certain warranty and other services. Changes in dealers and distributors take place from time to time. We believe a sufficient number of qualified dealers and distributors exist in all geographic areas.
Floor plan financing.
Polaris Acceptance provides floor plan financing to our dealers in the United States under our current partnership agreement with Wells Fargo. Wells Fargo acquired the business in 2016. We have a 50 percent equity interest in Polaris Acceptance, and do not guarantee the outstanding indebtedness of Polaris Acceptance. As part of the agreement, Polaris sells portions of its receivable portfolio to a securitization facility (“Securitization Facility”), from time to time on an ongoing basis. The partnership agreement is effective through February 2022. See Notes 6 and 10 of Notes to Consolidated Financial Statements for a discussion of this financial services arrangement.
We have arrangements with Polaris Acceptance (United States), Wells Fargo affiliates (Australia, Canada, France, Germany, the United Kingdom, China and New Zealand), and TCF Financial Corporation (“TCF”) to provide floor plan financing for our dealers. A majority of our North American sales of snowmobiles, ORVs, motorcycles, boats, and related PG&A are financed under arrangements whereby we are paid within a few days of shipment of our product. We participate in the cost of dealer financing and have agreed to repurchase products from the finance companies under certain circumstances and subject to certain limitations. We have not historically been required to repurchase a significant number of units; however, there can be no assurance that this will continue to be the case. See Note 10 of Notes to Consolidated Financial Statements for a discussion of these financial services arrangements.
Customer financing.
We do not offer consumer financing directly to the end users of our products. Instead, we have agreements in place with various third party financing companies, to provide financing services to those end consumers.
A wholly-owned subsidiary of Polaris has a multi-year agreement with Sheffield Financial (“Sheffield”) pursuant to which Sheffield agreed to make available closed-end installment consumer and commercial credit to customers of our dealers for Polaris products. The current installment credit agreement under which Sheffield provides installment credit lending for ORVs, snowmobiles and certain other Polaris products expires in December 2020.
A wholly-owned subsidiary of Polaris entered into a multi-year agreement with Evergreen Bank Group in September 2016. The agreement established Performance Finance as a division of Evergreen Bank Group, and is exclusively focused on the financing of Polaris motorcycles. The current installment credit agreement under which Performance Finance provides installment credit lending for motorcycles expires in December 2021.
A wholly-owned subsidiary of Polaris has a multi-year contract with Synchrony Bank, under which Synchrony Bank makes available closed-end installment consumer and commercial credit to customers of our dealers for both Polaris and non-Polaris products. The current installment credit agreement under which Synchrony Bank provides installment credit lending for Polaris products expires in December 2020.
Marketing.
Our marketing activities are designed primarily to promote and communicate directly with consumers to assist the selling and marketing efforts of our dealers and distributors. We make available and advertise discount or rebate programs, retail financing or other incentives for our dealers and distributors to remain price competitive in order to accelerate retail sales to consumers. We advertise our products directly to consumers using print advertising in the industry press and in user group publications and on the internet, social media, billboards, television and radio. We also provide media advertising and partially underwrite dealer and distributor media advertising to a degree and on terms which vary by product and from year to year. We produce promotional films for our products, which are available to dealers for use in the showroom or at special promotions. We also provide product brochures, posters, dealer signs and miscellaneous other promotional items for use by dealers.
We spent
$491.8 million
,
$471.8 million
and
$342.2 million
for sales and marketing activities in
2018
,
2017
and
2016
, respectively.
Engineering, Research and Development, and New Product Introduction
We have approximately 1,100 employees who are engaged in the development and testing of existing products and research and development of new products and improved production techniques, located primarily in our Roseau and Wyoming, Minnesota facilities and in Burgdorf, Switzerland.
7
We utilize internal combustion engine testing facilities to design engine configurations for our products. We utilize specialized facilities for matching engine, exhaust system and clutch performance parameters in our products to achieve desired fuel consumption, power output, noise level and other objectives. Our engineering department is equipped to make small quantities of new product prototypes for testing and for the planning of manufacturing procedures. In addition, we maintain numerous facilities where each of the products is extensively tested under actual use conditions. We utilize our Wyoming, Minnesota facility for engineering, design and development personnel for our line of engines and powertrains, ORVs, motorcycles, and certain Global Adjacent Market vehicles, and our Roseau, Minnesota facility for our snowmobile and certain ATV research and development. We utilize our Elkhart, Indiana facility for engineering, design and development for our boats research and development. We also own Swissauto Powersports Ltd., an engineering company that develops high performance and high efficiency engines and innovative vehicles.
Intellectual Property
We rely on a combination of patents, trademarks, copyrights, trade secrets, and nondisclosure and non-competition agreements to establish and protect our intellectual property and proprietary technology. We have filed and obtained numerous patents in the United States and abroad, and regularly file patent applications worldwide in our continuing effort to establish and protect our proprietary technology. Additionally, we have numerous registered trademarks, trade names and logos in the United States, Canada and other international countries.
Competition
The off-road vehicle, snowmobile, motorcycle, boat, people mobility and work utility solutions, and aftermarket industries in the United States, Canada and other global markets are highly competitive. As a powersports original equipment manufacturer (OEM), our competition primarily comes from North American and Asian manufacturers. As a boat OEM, our competition primarily comes from North American and European manufacturers. For our aftermarket business, our competition is highly fragmented across the retail and online channels. Competition in such markets is based upon a number of factors, including price, quality, reliability, styling, product features and warranties. At the dealer level, competition is based on a number of factors, including sales and marketing support programs (such as financing and cooperative advertising). Certain of our competitors are more diversified, benefit from different laws and regulatory schemes outside the US, and have financial and marketing resources that are substantially greater than those of Polaris.
We believe that our products are competitively priced and our sales and marketing support programs for dealers are comparable to those provided by our competitors. Our products compete with many other recreational products for the discretionary spending of consumers, and to a lesser extent, with other vehicles designed for utility applications.
Product Safety & Regulatory Affairs
Product safety regulations.
Federal, state and local governments around the world have promulgated and/or are considering promulgating laws and regulations relating to the safety of our products. For example, in the United States, the Consumer Product Safety Commission (CPSC) has federal oversight over product safety issues related to snowmobiles, snow-bikes and off-road vehicles. The National Highway Transportation Safety Administration (NHTSA) has federal oversight over product safety issues related to motorcycles (including Slingshot) and on-road people mobility vehicles (including GEM). The U.S. Coast Guard (part of the U.S. Department of Homeland Security) is the federal agency responsible for maritime safety, security and environmental stewardship in U.S. ports and waterways.
In August 2008, the Consumer Product Safety Improvement Act (“Act”) was passed which, among other things, required ATV manufacturers and distributors to comply with previously voluntary American National Standards Institute (ANSI) safety standards developed by the Specialty Vehicle Institute of America (SVIA). The Act also requires CPSC to update the mandatory standard (if it deems doing so to be appropriate) based on updates to the voluntary ANSI/SVIA standards, which has occurred. The Act also includes a provision that requires the CPSC to complete an ATV rulemaking process it started in August 2006 regarding the need for safety standards or increased safety standards for ATVs. This process has not yet resulted in the issuance of a final rule. We believe that our products comply with all applicable CPSC, ANSI and/or SVIA safety standards, as well as all other applicable safety standards in the U.S. or internationally. In addition, we have had an action plan on file with the CPSC since 1998 regarding safety related issues.
In October 2009, the CPSC published an advance notice of proposed rulemaking regarding ROV safety under the Consumer Product Safety Act. In December 2014, the CPSC published a Notice of Proposed Rulemaking that includes proposed mandatory safety standards for ROVs in the areas of lateral stability, steering and handling, and occupant retention. Polaris, by itself and through ROHVA, has expressed concerns about the proposed mandatory standards,
8
whether they would actually reduce ROV incident rates, whether the proposed tests are repeatable and appropriate for ROVs, and the unintended safety consequences that could result from them. As a result of those concerns, revisions to the voluntary ANSI/ROHVA standard were proposed. In 2015, CPSC staff expressed support for the proposed 2016 revisions to the ANSI standard, and subsequently recommended that the CPSC terminate its rule-making process. We are unable to predict the outcome of the CPSC rule-making process or the ultimate impact of any resulting rules on our business and operating results.
We are a member of the Recreational Off-Highway Vehicle Association (ROHVA), which was established to promote the safe and responsible use of side-by-side vehicles also known as Recreational Off-Highway Vehicles (ROVs), a category that includes our RANGER, Polaris GENERAL, RZR, and Polaris ACE vehicles. Since early 2008, ROHVA has been engaged in a comprehensive process for developing through ANSI and updating voluntary standards for equipment, configuration and performance requirements of ROVs. Comments on the draft standards have been actively solicited from the CPSC and other stakeholders as part of the ANSI process. The standard, which addresses stability, occupant retention and other safety performance criteria, was approved and published by ANSI in March 2010, and then revised in 2011, 2014 and 2016. We believe that our products comply with all applicable ROHVA/ANSI safety standards, as well as all other applicable safety standards in the U.S. or internationally.
We are a member of the International Snowmobile Manufacturers Association (ISMA), a trade association formed among other reasons to promote safety in the manufacture and use of snowmobiles. ISMA members include all of the major snowmobile manufacturers. The ISMA members are also members of the Snowmobile Safety and Certification Committee, which promulgated voluntary sound and safety standards for snowmobiles that have been adopted as regulations in some states of the United States and in Canada. These standards require testing and evaluation by an independent testing laboratory. We believe that our snow products comply with all applicable U.S. and international safety standards.
Motorcycles and certain people mobility vehicles are subject to certain U.S. and foreign vehicle safety and equipment standards, including those standards administered by the NHTSA. Our products and their operators are also subject to various international state and local vehicle equipment and safety standards. Our products are occasionally classified differently in various international jurisdictions. For example, our Slingshot vehicle is classified as a motorcycle under U.S. federal law, but may be classified differently in other jurisdictions. We believe our motorcycles (including Slingshot), people mobility vehicles, and all other of our on-road products comply with all applicable U.S and international safety and equipment standards pursuant to each product’s classification.
Our maritime products are subject to marine safety regulations for vessels developed and enforced by the U.S. Coast Guard and its foreign equivalents. We believe that our marine products comply with all applicable U.S. and international safety, design, construction and equipment standards. We are committed to improving recreational boating safety, we maintain strong leadership roles in many international maritime organizations, and we have supported and continue to support a variety of government and nongovernment boating safety efforts in partnership with government agencies and marine industry associations.
Product use regulations.
Federal, state and local laws and regulations around the world have been promulgated, and at various times, ordinances or legislation is introduced, relating to the use or manner of use of our products. Some government entities have adopted, or are considering adopting, laws that restrict the use of ORVs and snowmobiles to specified hours and locations. For example, the U.S. federal government also has legislative and executive authority to restrict the use of ORVs, snowmobiles and other products in national parks and on federal lands. In several instances, this restriction has been a ban on the recreational use of these products in these areas.
Environmental regulations.
Federal, state and local governments around the world have adopted and/or are considering adopting laws relating to the reduction or elimination of certain substances and materials in consumer products and the reduction of vehicle greenhouse gas emissions. These regulations are an important component of global environmental and climate protection, and therefore form a key regulatory framework in the design of our products.
For example, in the United States, the federal Environmental Protection Agency (EPA) and the California Air Resources Board (CARB) have both adopted regulations in these areas which are applicable to certain of our products. Canada’s emission regulations for motorcycles, ORVs and snowmobiles are similar to those in the United States. The Europe Union currently regulates emissions from our motorcycles and certain of our ATV-based products for which we obtain whole vehicle type approvals. In 2014, the EU finalized the details of new regulations that made these European emission requirements more stringent beginning in 2016. We executed the first motorcycle and ATV-based product certifications under these strict EU emissions standards in 2016. Emissions from certain other Polaris ORV and
9
snowmobile engines in vehicles sold in the EU subsequently may be covered by the non-road mobile machinery directive currently being finalized there. We are developing compliance solutions for these future EU emissions regulations. We are also currently developing and obtaining engine and emission technologies to meet the requirements of future anticipated international emission standards.
We believe that our products comply with all applicable U.S. and international environmental standards and related regulations, including but not limited to all applicable emissions and product substance and materials laws. We are unable to predict the ultimate impact of any proposed new environmental regulations on our business. Risks may also emerge in connection with the adherence to these environmental regulatory requirements - particularly in the case of regulatory vagueness that may be interpreted differently by Polaris and the agencies responsible for the respective regulations.
Employees
Due to the seasonality of our business and certain changes in production cycles, total employment levels vary throughout the year. Despite such variations in employment levels, employee turnover has not been high. During
2018
, on a worldwide basis, we employed an average of approximately 12,000 full-time persons, a nine percent increase from
2017
, driven by the acquisition of Boat Holdings. Approximately 4,700 of our employees are salaried. We consider our relations with our employees to be excellent.
Available Information
Our Internet website is http://www.polaris.com. We make available free of charge, on or through our website, our annual, quarterly and current reports, and any amendments to those reports, as soon as reasonably practicable after electronically filing such reports with the Securities and Exchange Commission. We also make available through our website our corporate governance materials, including our Corporate Governance Guidelines, the charters of the Audit Committee, Compensation Committee, Corporate Governance and Nominating Committee and Technology Committee of our Board of Directors, our Code of Business Conduct and Ethics, and our Corporate Stewardship Report. Any shareholder or other interested party wishing to receive a copy of these corporate governance materials should write to Polaris Industries Inc., 2100 Highway 55, Medina, Minnesota 55340, Attention: Investor Relations. Information contained on our website is not part of this report.
Forward-Looking Statements
This
2018
Annual Report contains not only historical information, but also “forward-looking statements” intended to qualify for the safe harbor provisions of the Private Securities Litigation Reform Act of 1995. These “forward-looking statements” can generally be identified as such because the context of the statement will include words such as we or our management “believes,” “anticipates,” “expects,” “estimates” or words of similar import. Similarly, statements that describe our future plans, objectives or goals, such as future sales, shipments, net income, and net income per share, operational initiatives, tariffs, currency fluctuations, interest rates, and commodity costs, are forward-looking statements that involve certain risks and uncertainties that could cause actual results to differ materially from those forward-looking statements, are also forward-looking. Forward-looking statements may also be made from time to time in oral presentations, including telephone conferences and/or webcasts open to the public.
Potential risks and uncertainties include such factors as the Company’s ability to successfully implement its manufacturing operations expansion initiatives, product offerings, promotional activities and pricing strategies by competitors; economic conditions that impact consumer spending; acquisition integration costs; product recalls, warranty expenses; impact of changes in Polaris stock price on incentive compensation plan costs; foreign currency exchange rate fluctuations; environmental and product safety regulatory activity; effects of weather; commodity costs; freight and tariff costs; changes to international trade agreements; uninsured product liability claims; uncertainty in the retail and wholesale credit markets; performance of affiliate partners; changes in tax policy; relationships with dealers and suppliers; and the general overall economic and political environment. The risks and uncertainties discussed in this report are not exclusive and other factors that we may consider immaterial or do not anticipate may emerge as significant risks and uncertainties.
Any forward-looking statements made in this report or otherwise speak only as of the date of such statement, and we undertake no obligation to update such statements to reflect actual results or changes in factors or assumptions affecting such forward-looking statements. We advise you, however, to consult any further disclosures made on related subjects in future quarterly reports on Form 10-Q and current reports on Form 8-K that are filed with or furnished to the Securities and Exchange Commission.
10
Executive Officers of the Registrant
Set forth below are the names of our executive officers as of
February 14, 2019
, their ages, titles, the year first appointed as an executive officer, and employment for the past five years:
|
Name
|
Age
|
Title
|
||
|
Scott W. Wine
|
51
|
Chairman of the Board of Directors and Chief Executive Officer
|
||
|
Michael T. Speetzen
|
49
|
Executive Vice President—Finance and Chief Financial Officer
|
||
|
Kenneth J. Pucel
|
52
|
Executive Vice President—Global Operations, Engineering and Lean
|
||
|
Lucy Clark Dougherty
|
49
|
Senior Vice President—General Counsel, Compliance Officer and Secretary
|
||
|
Robert P. Mack
|
49
|
Senior Vice President—Corporate Development and Strategy, and President—Adjacent Markets
|
||
|
James P. Williams
|
56
|
Senior Vice President—Chief Human Resources Officer
|
||
|
Michael D. Dougherty
|
51
|
President—International
|
||
|
Stephen L. Eastman
|
54
|
President—Aftermarket/Parts, Garments and Accessories
|
||
|
Christopher S. Musso
|
44
|
President—Off-Road Vehicles
|
||
Executive officers of the Company are elected at the discretion of the Board of Directors with no fixed terms. There are no family relationships between or among any of the executive officers or directors of the Company.
Mr. Wine joined Polaris Industries Inc. as Chief Executive Officer on September 1, 2008, and was named Chairman of the Board of Directors in January 2013.
Mr. Speetzen has been Executive Vice President—Finance and Chief Financial Officer of the Company since August 2015.
Prior to joining Polaris, Mr. Speetzen was Senior Vice President and Chief Financial Officer of Xylem, Inc., a provider of fluid technology and equipment solutions for water issues, since 2011, when the company was formed from the spinoff of the water businesses of ITT Corporation.
Mr. Pucel joined Polaris in December 2014 as Executive Vice President—Global Operations, Engineering and Lean. Prior to joining Polaris, Mr. Pucel was with Boston Scientific Corporation (BSC), a global provider of medical solutions, where Mr. Pucel held the position of Executive Vice President of Global Operations, Quality and Technology and was a member of BSC’s Executive Committee from 2004 to 2014.
Ms. Clark Dougherty joined Polaris in January 2018 as Senior Vice President—General Counsel, Compliance Officer and Secretary. Prior to joining Polaris, Ms. Clark Dougherty was deputy general counsel at General Motors for Global Markets, Autonomous Vehicles and Transportation as a Service since June 2017. Prior to that role, Ms. Clark Dougherty held several positions at General Motors, including Deputy General Counsel—Commercial, Product Safety, and Regulatory; Chief Legal Advisor—Global Vehicle Safety, and Vice President and General Counsel—General Motors North America from 2010 to June 2017.
Mr. Mack joined Polaris in April 2016 as Senior Vice President—Corporate Development and Strategy, and President—Adjacent Markets. Prior to joining Polaris, Mr. Mack was Vice President, Corporate Development for Ingersoll Rand plc, a diversified industrial company. In that role since July 2010, he had global responsibility for the company’s acquisition and divestiture activities.
Mr. Williams was appointed Senior Vice President—Chief Human Resources Officer in September 2015. Prior to this Mr. Williams was Vice President—Human Resources since April 2011.
Mr. Dougherty has been President—International since September 2015. Prior to his current role, he was Vice President—Asia Pacific and Latin America since August 2011.
Mr. Eastman has been President—Aftermarket/Parts, Garments and Accessories since September 2015. Prior to his current role, he was Vice President—Parts, Garments and Accessories since February 2012.
Mr. Musso joined Polaris in November 2017 as President—Off-Road Vehicles. Prior to joining Polaris, Mr. Musso was a senior partner and leader of McKinsey & Company’s Americas Product Development group, where he focused on helping clients pursue growth through enhancing their product development and innovation strategies from 2005 to October 2017.
11
Item 1A. Risk Factors
The following are significant factors known to us that could materially adversely affect our business, financial condition, cash flows, or operating results, as well as adversely affect the value of an investment in our common stock.
A significant adverse determination in any material litigation claim against us could adversely affect our operating results or financial condition.
The manufacture, sale and usage of our products expose us to significant risks associated with product liability claims. If our products are defective or used incorrectly by our customers, bodily injury, property damage or other injury, including death, may result and this could give rise to product liability or economic loss claims against us or adversely affect our brand image or reputation. Any losses that we may suffer from any such claims, and the effect that any such liability may have upon the reputation and marketability of our products, may have a negative impact on our business and operating results.
Because of the high cost of product liability insurance premiums and the historically insignificant amount of product liability claims paid by us, we were self-insured from 1985 to 1996 and from 2002 to 2012. From 1996 to 2002, and beginning again in 2012, we purchased excess insurance coverage for catastrophic product liability claims for incidents occurring subsequent to the policy date that exceeded our self-insured retention levels. The estimated costs resulting from any losses are charged to expense when it is probable a loss has been incurred and the amount of the loss is reasonably determinable.
We had a product liability reserve accrued on our balance sheet of
$52.8 million
at
December 31, 2018
for the probable payment of pending claims related to product liability litigation associated with our products. We believe such accrual is adequate. We do not believe the outcome of any pending product liability litigation will have a material adverse effect on our operations. However, no assurance can be given that our historical claims record, which has not resulted in any material adverse effects on our financial statements, will not change or that material product liability claims against us will not be made in the future. Adverse determination of material product liability claims made against us would have a material adverse effect on our financial condition.
Significant product repair and/or replacement costs due to product warranty claims or product recalls could have a material adverse impact on our results of operations.
We provide limited warranties for our vehicles. We may also provide longer warranties related to certain promotional programs, as well as longer warranties in certain geographical markets as determined by local regulations and market conditions. We also provide a limited emission warranty for certain emission-related parts in our ORVs, snowmobiles, and motorcycles as required by the EPA and CARB. Although we employ quality control procedures, sometimes a product is distributed that needs repair or replacement. Our standard warranties require us or our dealers to repair or replace defective products during such warranty periods at no cost to the consumer.
Historically, product recalls have been administered through our dealers and distributors. The repair and replacement costs we could incur in connection with a recall could adversely affect our business. For example, in 2018 we voluntarily initiated product campaigns, including service bulletins, safety-related recalls, and emissions actions. In addition, product recalls could harm our reputation and cause us to lose customers, particularly if recalls cause consumers to question the safety or reliability of our products.
Our business may be sensitive to economic conditions, including those that impact consumer spending.
Our results of operations may be sensitive to changes in overall economic conditions, primarily in North America and Europe, that impact consumer spending, including discretionary spending. Weakening of, and fluctuations in, economic conditions affecting disposable consumer income such as employment levels, business conditions, changes in housing market conditions, capital markets, tax rates, savings rates, interest rates, fuel and energy costs, the impacts of natural disasters and acts of terrorism and other matters, including the availability of consumer credit, could reduce overall consumer spending or reduce consumer spending on powersports and aftermarket products. A general reduction in consumer spending or a reduction in consumer spending on powersports, boats and aftermarket products could adversely affect our sales growth and profitability. Overall demand for products sold in the Jeep and truck aftermarket is dependent upon many factors including the total number of vehicle miles driven in the United States, the total number of registered vehicles in the United States, the age and quality of these registered vehicles and the level of unemployment in the United States. Adverse changes in these factors could lead to a decreased level of demand for our products, which could negatively impact our business, results of operations, financial condition and cash flows.
12
In addition, we have financial services partnership arrangements with subsidiaries of Wells Fargo Bank, N.A. and TCF Financial Corporation that require us to repurchase products financed and repossessed by the partnership, subject to certain limitations. For calendar year
2018
, our maximum aggregate repurchase obligation was approximately
$366.6 million
. If adverse changes to economic conditions result in increased defaults on the loans made by this financial services partnership, our repurchase obligation under the partnership arrangement could adversely affect our liquidity and harm our business.
Termination or interruption of informal supply arrangements could have a material adverse effect on our business or results of operations.
We have informal supply arrangements with many of our suppliers. In the event of a termination of the supply arrangement, there can be no assurance that alternate supply arrangements will be made on satisfactory terms. If we need to enter into supply arrangements on unsatisfactory terms, or if there are any delays to our supply arrangements, it could adversely affect our business and operating results.
Increases in the cost of raw material, commodity and transportation costs and shortages of certain raw materials could negatively impact our business.
The primary commodities used in manufacturing our products are aluminum, steel, petroleum-based resins and certain rare earth metals used in our charging systems, as well as diesel fuel to transport the products. Our profitability is affected by significant fluctuations in the prices of the raw materials and commodities we use in our products. Additionally, the current political landscape has introduced significant uncertainty with respect to future trade regulations and existing international trade agreements. The U.S. has initiated tariffs on certain foreign goods, including raw materials, commodities, and products manufactured outside the United States that are used in our manufacturing processes, which has increased our cost of sales. In response, certain foreign governments have imposed tariffs on certain U.S. goods, and are considering imposing additional tariffs on other U.S. goods, including goods that we sell internationally. The tariffs imposed to date, the possibility of additional retaliatory trade actions stemming from these tariffs, and the potential negative outcome of the U.S. Government’s section 232 investigation regarding automobiles and automobile parts could continue to increase our cost of sales, both directly and as a result of price increases implemented by domestic suppliers, which we may not be able to pass on to our customers. The impact from these tariffs could also result in decreased demand for our products or restructuring actions that could impact our work force and/or our investments in research and development or other growth initiatives. All of these could materially and adversely affect our results of operations and financial condition.
Fluctuations in foreign currency exchange rates could result in declines in our reported sales and net earnings.
The changing relationships of the United States dollar to the Canadian dollar, Australian dollar, the Euro, the Swiss franc, the Mexican peso, and certain other foreign currencies have from time to time had a negative impact on our results of operations. Fluctuations in the value of the United States dollar relative to these foreign currencies can adversely affect the price of our products in foreign markets, the costs we incur to import certain components for our products, and the translation of our foreign balance sheets. While we actively manage our exposure to fluctuating foreign currency exchange rates by entering into foreign exchange hedging contracts from time to time, these contracts hedge foreign currency denominated transactions, and any change in the fair value of the contracts would be offset by changes in the underlying value of the transactions being hedged.
We face intense competition in all product lines, including from some competitors that have greater financial and marketing resources. Failure to compete effectively against competitors could negatively impact our business and operating results.
The markets we operate in are highly competitive. Competition in such markets is based upon a number of factors, including price, quality, reliability, styling, product features and warranties. At the dealer level, competition is based on a number of factors, including sales and marketing support programs (such as financing and cooperative advertising). Certain of our competitors are more diversified and have financial and marketing resources that are substantially greater than ours, which allow these competitors to invest more heavily in intellectual property, product development and advertising. If we are not able to compete with new or enhanced products or models of our competitors, our future business performance may be materially and adversely affected. Internationally, our products typically face more competition where certain foreign competitors manufacture and market products in their respective countries. This allows those competitors to sell products at lower prices, which could adversely affect our competitiveness. In addition, our products compete with many other recreational products for the discretionary spending of consumers and, to a lesser
13
extent, with other vehicles designed for utility applications. A failure to effectively compete with these other competitors could have a material adverse effect on our performance.
We manufacture our products at, and distribute our products from, several locations in North America and internationally. Any disruption at any of these facilities or manufacturing delays could adversely affect our business and operating results.
We manufacture most of our products at 19 locations, including North American and international facilities. We also have several locations that serve as wholegoods and PG&A distribution centers, warehouses and office facilities. In addition, we have agreements with other third-party manufacturers to manufacture products on our behalf. These facilities may be affected by natural or man-made disasters and other external events, including operational and logistical manufacturing execution. In the event that one of our manufacturing facilities was affected by a disaster or other event, we could be forced to shift production to one of our other manufacturing facilities. Although we maintain insurance for damage to our property and disruption of our business from casualties, such insurance may not be sufficient to cover all of our potential losses. Any disruption in our manufacturing capacity could have an adverse impact on our ability to produce sufficient inventory of our products or may require us to incur additional expenses in order to produce sufficient inventory, and therefore, may adversely affect our net sales and operating results. Any disruption or delay at our manufacturing facilities could impair our ability to meet the demands of our customers, and our customers may cancel orders or purchase products from our competitors, which could adversely affect our business and operating results.
If we are unable to continue to enhance existing products and develop and market new or enhanced products that respond to customer needs and preferences, we may experience a decrease in demand for our products and our business could suffer.
One of our growth strategies is to develop innovative, customer-valued products to generate revenue growth. Our sales from new products in the past have represented a significant component of our sales and are expected to continue to represent a significant component of our future sales. We may not be able to compete as effectively with our competitors, and ultimately satisfy the needs and preferences of our customers, unless we can continue to enhance existing products and develop new innovative products in the global markets in which we compete. Product development requires significant financial, technological and other resources. While we expended
$259.7 million
,
$238.3 million
and
$185.1 million
for research and development efforts in
2018
,
2017
and
2016
, respectively, there can be no assurance that this level of investment in research and development will be sufficient to maintain our competitive advantage in product innovation, which could cause our business to suffer. Product improvements and new product introductions also require significant planning, design, development, and testing at the technological, product, and manufacturing process levels and we may not be able to timely develop product improvements or new products. Our competitors’ new products may beat our products to market and be more attractive with more features and/or less expensive than our products.
Our continued success is dependent on positive perceptions of our Polaris brands which, if impaired, could adversely affect our sales.
We believe that our Polaris brands are one of the reasons our customers choose our products. To be successful, we must preserve our reputation. Reputational value is based in large part on perceptions, and broad access to social media makes it easy for anyone to provide public feedback that can influence perceptions of our company. It may be difficult to control negative publicity, regardless of whether it is accurate. While reputations may take decades to build, any negative incidents can quickly erode trust and confidence, particularly if they result in negative mainstream and social media publicity, governmental investigations, or litigation. Negative incidents, such as quality and safety concerns or incidents related to our products, could lead to tangible adverse effects on our business, including lost sales or employee retention and recruiting difficulties. In addition, vendors and others with whom we choose to do business may affect our reputation.
We depend on suppliers, financing sources and other strategic partners who may be sensitive to economic conditions that could affect their businesses in a manner that adversely affects their relationship with us.
We source component parts and raw materials through numerous suppliers and have relationships with a limited number of product financing sources for our dealers and consumers. Our sales growth and profitability could be adversely affected if deterioration of economic or business conditions results in a weakening of the financial condition of a material number of our suppliers or financing sources, or if uncertainty about the economy or the demand for our products causes these business partners to voluntarily or involuntarily reduce or terminate their relationship with us.
14
We intend to grow our business through potential acquisitions, non-consolidating investments, alliances and new joint ventures and partnerships, which could be risky and could harm our business.
One of our growth strategies is to drive growth in our businesses and accelerate opportunities to expand our global presence through targeted acquisitions, non-consolidating investments, alliances, and new joint ventures and partnerships that add value while considering our existing brands and product portfolio. The benefits of an acquisition, non-consolidating investment, new joint venture or partnership may take more time than expected to develop or integrate into our operations, and we cannot guarantee that acquisitions, non-consolidating investments, alliances, joint ventures or partnerships will ultimately produce any benefits.
There can be no assurance that acquisitions will be consummated or that, if consummated, they will be successful. Acquisitions pose risks with respect to our ability to project and evaluate market demand, potential synergies and cost savings, make correct accounting estimates and achieve anticipated business goals and objectives. As we continue to grow, in part, through acquisitions, our success depends on our ability to anticipate and effectively manage these risks. If acquired businesses do not achieve forecasted results or otherwise fail to meet projections, it could affect our results of operations.
Acquisitions present a number of integration risks. For example, the acquisition may: disrupt operations in core, adjacent or acquired businesses; require more time than anticipated to be fully integrated into our operations and systems; create more costs than projected; divert management attention; create the potential of losing customer, supplier or other critical business relationships; and pose difficulties retaining employees. The inability to successfully integrate new businesses may result in higher production costs, lost sales or otherwise negatively affect earnings and financial results.
Our business, properties and products are subject to extensive United States federal and state and international safety, environmental and other government regulation and any failure to comply with these regulations could harm our reputation, expose us to damages and otherwise adversely affect our business. In addition, changes to regulations may require us to incur expenses or modify product offerings in order to maintain compliance with the actions of regulators and could decrease the demand for our products.
Our business, properties, and products are subject to numerous international, federal, state, and other governmental laws, rules, and regulations relating to, among other things: climate change; emissions to air; discharges to water; restrictions placed on water usage and water availability; product and associated packaging; use of certain chemicals; import and export compliance, including country of origin certification requirements; worker and product user health and safety; energy efficiency; product life-cycles; outdoor noise laws; and the generation, use, handling, labeling, collection, management, storage, transportation, treatment, and disposal of hazardous substances, wastes, and other regulated materials. Although we believe that we are in substantial compliance with currently applicable laws, rules, and regulations, we are unable to predict the ultimate impact of adopted or future laws, rules, and regulations on our business, properties, or products. Any of these laws, rules, or regulations may cause us to incur significant expenses to achieve or maintain compliance, require us to modify our products, adversely affect the price of or demand for some of our products, and ultimately affect the way we conduct our operations. Failure to comply with any of these laws, rules, or regulations could result in harm to our reputation and/or could lead to fines and other penalties, including restrictions on the importation of our products into, and the sale of our products in, one or more jurisdictions until compliance is achieved.
Failure to establish and maintain the appropriate level of dealers and distributor relationships or weak economic conditions impacting those relationships may negatively impact our business and operating results.
We distribute our products through numerous dealers and distributors and rely on them to retail our products to the end customers. Our sales growth and profitability could be adversely affected if deterioration of economic or business conditions results in a weakening of the financial condition of a material number of our dealers and distributors. Additionally, weak demand for, or quality issues with, our products may cause dealers and distributors to voluntarily or involuntarily reduce or terminate their relationship with us. Further, if we fail to establish and maintain an appropriate level of dealers and distributors for each of our products, we may not obtain adequate market coverage for the desired level of retail sales of our products.
Retail credit market deterioration and volatility may restrict the ability of our retail customers to finance the purchase of our products and adversely affect our income from financial services.
We have arrangements with each of Performance Finance, Sheffield Financial and Synchrony Bank to make retail financing available to consumers who purchase our products in the United States. During
2018
, consumers financed
15
approximately
35 percent
of the vehicles we sold in the United States through these installment retail credit programs. Furthermore, some customers use financing from lenders who do not partner with us, such as local banks and credit unions. There can be no assurance that retail financing will continue to be available in the same amounts and under the same terms that had been previously available to our customers. If retail financing is not available to customers on satisfactory terms, it is possible that our sales and profitability could be adversely affected. Our income from financial services is also affected by changes in interest rates.
(
Our reliance upon patents, trademark laws, and contractual provisions to protect our proprietary rights may not be sufficient to protect our intellectual property from others who may sell similar products and may lead to costly litigation.
We hold patents and trademarks relating to various aspects of our products, such as our patented “on demand” all-wheel drive, and believe that proprietary technical know-how is important to our business. Proprietary rights relating to our products are protected from unauthorized use by third parties only to the extent that they are covered by valid and enforceable patents or trademarks or are maintained in confidence as trade secrets. We cannot be certain that we will be issued any patents from any pending or future patent applications owned by or licensed to us or that the claims allowed under any issued patents will be sufficiently broad to protect our technology. In the absence of enforceable patent or trademark protection, we may be vulnerable to competitors who attempt to copy our products, gain access to our trade secrets and know-how or diminish our brand through unauthorized use of our trademarks, all of which could adversely affect our business. Others may initiate litigation to challenge the validity of our patents, or allege that we infringe their patents, or they may use their resources to design comparable products that do not infringe our patents. We may incur substantial costs if our competitors initiate litigation to challenge the validity of our patents, or allege that we infringe their patents, or if we initiate proceedings to protect our proprietary rights. If the outcome of any such litigation is unfavorable to us, our business, operating results, and financial condition could be adversely affected. Regardless of whether litigation relating to our intellectual property rights is successful, the litigation could significantly increase our costs and divert management’s attention from operation of our business, which could adversely affect our results of operations and financial condition. We also cannot be certain that our products or technologies have not infringed or will not infringe the proprietary rights of others. Any such infringement could cause third parties, including our competitors, to bring claims against us, resulting in significant costs, possible damages and substantial uncertainty.
Our international operations require significant management attention and financial resources, expose us to difficulties presented by international economic, political, legal, accounting, and business factors, and may not be successful or produce desired levels of sales and profitability.
Approximately
13 percent
of our total sales during
2018
were generated outside of North America, and we intend to continue to expand our international operations as one part of our long-term strategic objectives. To support that strategy, we must increase our presence outside of North America, including adding employees and continuing to invest in business infrastructure and operations. These investments might not produce the returns we expect, which could adversely affect our profitability. International operations and sales also are inherently subject to various risks. These risks include:
|
•
|
political and economic instability;
|
|
•
|
increased costs of customizing products for foreign countries;
|
|
•
|
the imposition of additional U.S. and foreign governmental controls or regulations, including the United States Foreign Corrupt Practices Act;
|
|
•
|
withdrawal from or revision to international trade agreements;
|
|
•
|
the imposition or increases in import and export licensing and other compliance requirements, customs duties and tariffs, import and export quotas and other trade restrictions, license obligations, and other non-tariff barriers to trade;
|
|
•
|
the imposition of U.S. and/or international sanctions against a country, company, person, or entity with whom we do business that would restrict or prohibit our business with the sanctioned country, company, person, or entity;
|
|
•
|
international pricing pressures;
|
|
•
|
laws and business practices favoring local companies;
|
|
•
|
adverse currency exchange rate fluctuations;
|
|
•
|
longer payment cycles and difficulties in enforcing agreements and collecting receivables through certain foreign legal systems;
|
|
•
|
higher tax rates and potentially adverse tax consequences
|
|
•
|
fluctuations in our operating performance based on our geographic mix of sales;
|
16
|
•
|
transportation delays and interruptions;
|
|
•
|
national and international conflicts, including foreign policy changes or terrorist acts;
|
|
•
|
difficulties in protecting, enforcing or defending intellectual property rights; and
|
|
•
|
multiple, changing, and often inconsistent enforcement of laws, rules, and regulations, including rules relating to environmental, health, and safety matters.
|
The realization of any of these risks or unfavorable changes in the political, regulatory and business climate in any of the jurisdictions where we operate could have a material adverse effect on our total sales, financial condition, profitability, or cash flows.
Changing weather conditions may reduce demand and negatively impact net sales and production of certain of our products.
Lack of snowfall in any year in any particular geographic region may adversely affect snowmobile retail sales and related PG&A sales in that region. Additionally, to the extent that unfavorable weather conditions are exacerbated by global climate change or other factors, our sales may be affected to a greater degree than we have previously experienced. There is no assurance that weather conditions or natural disasters could not have a material effect on our sales, production capability or component supply continuity for any of our products.
An impairment in the carrying value of goodwill and trade names could negatively impact our consolidated results of operations and net worth.
Goodwill and indefinite-lived intangible assets, such as our trade names, are recorded at fair value at the time of acquisition and are not amortized, but are reviewed for impairment at least annually or more frequently if impairment indicators arise. Our determination of whether goodwill impairment has occurred is based on a comparison of each of our reporting units’ fair market value with its carrying value. Significant and unanticipated changes in circumstances, such as significant and long-term adverse changes in business climate, unanticipated competition, and/or changes in technology or markets, could require a provision for impairment in a future period that could negatively impact our reported earnings and reduce our consolidated net worth and shareholders’ equity.
We have a significant amount of debt outstanding and must comply with restrictive covenants in our debt agreements.
Our credit agreement and other debt agreements contain financial and restrictive covenants that may limit our ability to, among other things, borrow additional funds or take advantage of business opportunities. While we are currently in compliance with the financial covenants, increases in our debt or decreases in our earnings could cause us to fail to comply with these financial covenants. Failing to comply with such covenants could result in an event of default that, if not cured or waived, could result in the acceleration of all our indebtedness or otherwise have a material adverse effect on our financial position, results of operation and debt service capability.
Our level of debt and the financial and restrictive covenants contained in our credit agreement could have important consequences on our financial position and results of operations, including increasing our vulnerability to increases in interest rates because debt under our credit agreement bears interest at variable rates.
Additional tax expense or tax exposure could impact our financial performance.
We are subject to income taxes and other business taxes in various jurisdictions in which we operate. Our tax liabilities are dependent upon the earnings generated in these different jurisdictions. Our provision for income taxes and cash tax liability could be adversely affected by numerous factors, including income before taxes being lower than anticipated in jurisdictions with lower statutory tax rates and higher than anticipated in jurisdictions with higher statutory tax rates, changes in the valuation of deferred tax assets and liabilities and changes in tax laws and regulations in various jurisdictions. We are also subject to the continuous examination of our income tax returns by various tax authorities. The results of audits and examinations of previously filed tax returns and continuing assessments of our tax exposures may have an adverse effect on the Company’s provision for income taxes and cash tax liability.
Our operations are dependent upon attracting and retaining skilled employees, including skilled labor. Our future success depends on our continuing ability to identify, hire, develop, motivate, retain and promote skilled personnel for all areas of our organization.
Our success depends on attracting and retaining qualified personnel. Our ability to sustain and grow our business requires us to hire, retain and develop a highly skilled and diverse management team and workforce. Failure to ensure that we have the leadership capacity with the necessary skill set and experience could impede our ability to deliver our
17
growth objectives and execute our strategic plan. In addition, any unplanned turnover or inability to attract and retain key employees, including managers, could have a negative effect on our business, financial condition and/or results of operations.
We may be subject to information technology system failures, network disruptions and breaches in data security that could adversely affect our business.
We use many information technology systems, some of which are managed by third parties, to operate our business. Those systems process sensitive information, including proprietary business information, customer data and personal information. Acquisitions in recent years have expanded the scope and complexity of our information technology systems, and increased the amount of sensitive information that they process. Our systems have been, and could be in the future vulnerable to breach, damage, disruption, or breakdown, as a result of malicious intrusion, random attack, or misconduct or error by individuals with permitted access to our systems. Such disruptions or breaches of our information technology systems could adversely affect our business by resulting in, among other things, disruption to our business operations, compromise or loss of the information processed by those systems, damage to our reputation, and litigation or regulatory proceedings. While we invest in layers of data and information technology protection, and continually monitor cybersecurity threats, there can be no assurance that our efforts will prevent disruptions or breaches of our systems. To our knowledge, we have not experienced any material disruptions or breaches of our information technology systems, but we could experience material disruptions or breaches in the future.
Item 1B. Unresolved Staff Comments
Not Applicable.
18
Item 2. Properties
The following sets forth the Company’s principal and materially important facilities as of
December 31, 2018
:
|
Location
|
Facility Type/Use
|
Owned or Leased
|
Square
Footage |
|||
|
Medina, Minnesota
|
Headquarters
|
Owned
|
130,000
|
|||
|
Roseau, Minnesota
|
Wholegoods manufacturing and R&D
|
Owned
|
733,000
|
|||
|
Huntsville, Alabama
|
Wholegoods manufacturing
|
Owned
|
725,000
|
|||
|
Monterrey, Mexico
|
Wholegoods manufacturing
|
Owned
|
440,000
|
|||
|
Elkhart, Indiana
|
Wholegoods manufacturing
|
Owned
|
822,000
|
|||
|
Syracuse, Indiana
|
Wholegoods manufacturing
|
Owned
|
265,000
|
|||
|
Opole, Poland
|
Wholegoods manufacturing
|
Leased
|
300,000
|
|||
|
Osceola, Wisconsin
|
Component parts & engine manufacturing
|
Owned
|
286,000
|
|||
|
Spirit Lake, Iowa
|
Wholegoods manufacturing
|
Owned
|
273,000
|
|||
|
Chanas, France
|
Wholegoods manufacturing
|
Owned
|
196,000
|
|||
|
Shanghai, China
|
Wholegoods manufacturing
|
Leased
|
158,000
|
|||
|
Anaheim, California
|
Wholegoods manufacturing
|
Leased
|
151,000
|
|||
|
Bourran, France
|
Wholegoods manufacturing and R&D
|
Leased
|
100,000
|
|||
|
Aix-les-Bains, France
|
Wholegoods manufacturing and R&D
|
Owned
|
98,000
|
|||
|
Spearfish, South Dakota
|
Component parts manufacturing
|
Owned
|
51,000
|
|||
|
Monticello, Minnesota
|
Component parts manufacturing
|
Owned
|
109,000
|
|||
|
Wyoming, Minnesota
|
Research and development facility
|
Owned
|
272,000
|
|||
|
Burgdorf, Switzerland
|
Research and development facility
|
Leased
|
17,000
|
|||
|
Wilmington, Ohio
|
Distribution center
|
Owned
|
429,000
|
|||
|
Vermillion, South Dakota
|
Distribution center
|
Primarily owned
|
643,000
|
|||
|
Carlisle, Pennslyvania
|
Distribution center
|
Leased
|
205,000
|
|||
|
Coppell, Texas
|
Distribution center
|
Leased
|
165,000
|
|||
|
Jacksonville, Florida
|
Distribution center
|
Leased
|
144,000
|
|||
|
Columbiana, Ohio
|
Distribution center
|
Owned
|
102,000
|
|||
|
Compton, California
|
Distribution center and office facility
|
Leased
|
254,000
|
|||
|
Rigby, Idaho
|
Distribution center and office facility
|
Owned
|
55,000
|
|||
|
Shakopee, Minnesota
|
Wholegoods distribution
|
Leased
|
870,000
|
|||
|
Plymouth, Minnesota
|
Office facility
|
Primarily owned
|
175,000
|
|||
|
Winnipeg, Canada
|
Office facility
|
Leased
|
15,000
|
|||
|
Rolle, Switzerland
|
Office facility
|
Leased
|
8,000
|
|||
Including the material properties listed above and those properties not listed, we have over six million square feet of global manufacturing and research and development space. Additionally, we have approximately five million square feet of global warehouse and distribution center space. In the United States and Canada, we lease 93 retail stores with approximately two million square feet of space, and in Australia, we own four retail stores. We also have international office facilities in Western Europe, Australia, Brazil, India, China and Mexico.
We own substantially all tooling and machinery (including heavy presses, conventional and computer-controlled welding facilities for steel and aluminum, assembly lines and paint lines) used in the manufacture of our products. We make ongoing capital investments in our facilities. These investments have increased production capacity for our products. We believe our current manufacturing and distribution facilities are adequate in size and suitable for our present manufacturing and distribution needs.
19
Item 3. Legal Proceedings
We are involved in a number of legal proceedings incidental to our business, none of which is expected to have a material effect on the financial results of our business.
Class action lawsuits
. As of the date hereof, we are party to two putative class actions pending against Polaris in the U.S., both of which were previously reported in the Company’s 10-Q quarterly report for the period ended October 31, 2018.
One putative class action is pending in the United States District Court for the District of Minnesota and arises out of allegations that certain Polaris products suffer from unresolved fire hazards allegedly resulting in economic loss, and is the result of the consolidation of the three putative class actions we reported in our April 26, 2018 quarterly report and that were filed between April 5-10, 2018: In re Polaris Marketing, Sales Practices, and Product Liability Litigation (D. Minn.), June 15, 2018.
The second putative class action is also pending in the United States District Court for the District of Minnesota and alleges excessive heat hazards on certain other Polaris products and seeks damages for alleged personal injury and economic loss: Riley Johannessohn, Daniel Badilla, James Kelley, Kevin Wonders, William Bates and James Pinion, individually and on behalf of all others similarly situated v. Polaris Industries (D. Minn.), October 4, 2016.
With respect to both class action lawsuits, the Company is unable to provide any reasonable evaluation of the likelihood that a loss will be incurred or any reasonable estimate of the range of possible loss.
Shareholder derivative lawsuit.
On January 22, 2019, a shareholder of the Company filed a purported derivative complaint in the Hennepin County District Court for the State of Minnesota naming ten current officers and directors of the Company as defendants. The complaint alleges that defendants made materially false or misleading public statements about the Company’s business, operations, forecasts, and compliance policies relating to certain of its Off-Road Vehicle products and product recalls. The complaint also alleges that several of the officer defendants benefited from improper insider sales of Polaris stock. The complaint asserts claims for breach of fiduciary duties, unjust enrichment, and other related claims. For relief, the complaint seeks damages in an unspecified amount, corporate governance changes, disgorgement and restitution of benefits and compensation paid, and an award of attorneys’ fees and expenses.
Item 4. Mine Safety Disclosures
Not applicable.
20
PART II
Item 5. Market for Registrant’s Common Equity, Related Stockholder Matters and Issuer Purchases of Equity Securities
Shares of common stock of Polaris Industries Inc. trade on the New York Stock Exchange under the symbol PII. On
February 7, 2019
, shareholders of record of the Company’s common stock were 1,930 and the last reported sale price for shares of our common stock on the New York Stock Exchange was $83.87 per share.
STOCK PERFORMANCE GRAPH
The graph below compares the five-year cumulative total return to shareholders (stock price appreciation plus reinvested dividends) for the Company’s common stock with the comparable cumulative return of two indexes: S&P Midcap 400 Index and Morningstar’s Recreational Vehicles Industry Group Index. The graph assumes the investment of $100 at the close on December 31, 2013 in common stock of the Company and in each of the indexes, and the reinvestment of all dividends. Points on the graph represent the performance as of the last business day of each of the years indicated.Assumes $100 Invested at the close on December 31, 2013
Assumes Dividend Reinvestment
Fiscal Year Ended
December 31, 2018
|
2013
|
2014
|
2015
|
2016
|
2017
|
2018
|
||||||||||||||||||
|
Polaris Industries Inc.
|
$
|
100.00
|
|
$
|
105.27
|
|
$
|
60.79
|
|
$
|
59.74
|
|
$
|
92.12
|
|
$
|
58.25
|
|
|||||
|
S&P Midcap 400 Index
|
100.00
|
|
109.77
|
|
107.38
|
|
129.65
|
|
150.71
|
|
134.01
|
|
|||||||||||
|
Recreational Vehicles Industry Group Index—Morningstar Group
|
100.00
|
|
99.47
|
|
72.42
|
|
100.86
|
|
128.05
|
|
68.45
|
|
|||||||||||
Comparison of 5-Year Cumulative Total Return Among Polaris Industries Inc., S&P Midcap 400 Index and Morningstar’s Recreational Vehicles Group Index
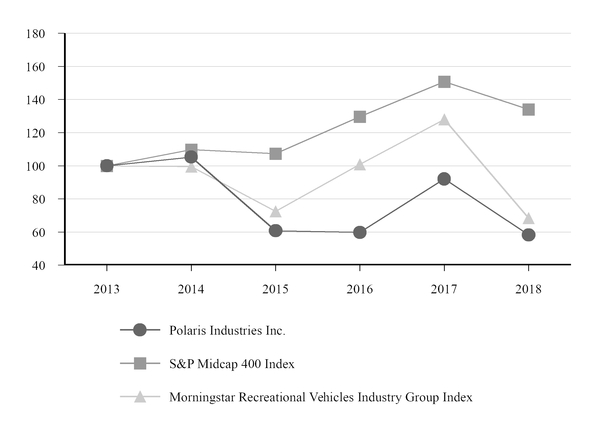
21
The table below sets forth the information with respect to purchases made by or on behalf of Polaris of its own stock during the fourth quarter of the fiscal year ended
December 31, 2018
.
|
Issuer Purchases of Equity Securities
|
|||||||||||
|
Period
|
Total Number of
Shares Purchased |
Average Price Paid
per Share |
Total Number of Shares Purchased as Part of Publicly Announced Program
|
Maximum Number of Shares That May Yet Be Purchased Under the Program(1)
|
|||||||
|
October 1–31, 2018
|
601,000
|
|
$
|
87.65
|
|
601,000
|
|
3,765,000
|
|||
|
November 1–30, 2018
|
513,000
|
|
95.33
|
|
513,000
|
|
3,252,000
|
||||
|
December 1–31, 2018
|
1,000
|
|
96.94
|
|
1,000
|
|
3,251,000
|
||||
|
Total
|
1,115,000
|
|
$
|
91.19
|
|
1,115,000
|
|
3,251,000
|
|||
|
(1)
|
The Board of Directors has authorized the cumulative repurchase of up to an aggregate of
90.5 million
shares of the Company’s common stock (the “Program”), including the most recent authorization that added 7.5 million shares announced on January 28, 2016. Of that total,
87.2 million
shares have been repurchased cumulatively from 1996 through
December 31, 2018
. This Program does not have an expiration date.
|
22
Item 6. Selected Financial Data
The following table presents our selected financial data. The table should be read in conjunction with Item 7,
Management’s Discussion and Analysis of Financial Condition and Results of Operations
, and Item 8,
Financial Statements and Supplementary Data
, of this Annual Report on Form 10-K. We have completed various acquisitions that affect the comparability of the selected financial data shown below. The results of operations for acquisitions are included in our consolidated financial results for the period subsequent to their acquisition date. Significant acquisitions within the five-year period shown below include the acquisition of the TAP Automotive Holdings, LLC in November 2016 and Boat Holdings in July 2018.
Selected Financial Data
|
For the Years Ended December 31,
|
|||||||||||||||
|
(Dollars in millions, except per-share data)
|
2018
|
2017
|
2016
|
2015
|
2014
|
||||||||||
|
Statement of Operations Data
|
|||||||||||||||
|
Sales Data:
|
|||||||||||||||
|
Total sales
|
$
|
6,078.5
|
|
$
|
5,428.5
|
|
$
|
4,516.6
|
|
$
|
4,719.3
|
|
$
|
4,479.6
|
|
|
Percent change from prior year
|
12
|
%
|
20
|
%
|
(4
|
)%
|
5
|
%
|
19
|
%
|
|||||
|
Gross Profit Data:
|
|||||||||||||||
|
Total gross profit
|
$
|
1,501.2
|
|
$
|
1,324.7
|
|
$
|
1,105.6
|
|
$
|
1,339.0
|
|
$
|
1,319.2
|
|
|
Percent of sales
|
24.7
|
%
|
24.4
|
%
|
24.5
|
%
|
28.4
|
%
|
29.4
|
%
|
|||||
|
Operating Expense Data:
|
|||||||||||||||
|
Total operating expenses
|
$
|
1,101.2
|
|
$
|
1,041.3
|
|
$
|
833.8
|
|
$
|
692.2
|
|
$
|
666.2
|
|
|
Percent of sales
|
18.1
|
%
|
19.2
|
%
|
18.5
|
%
|
14.7
|
%
|
14.9
|
%
|
|||||
|
Operating Income Data:
|
|||||||||||||||
|
Total operating income
|
$
|
487.4
|
|
$
|
359.7
|
|
$
|
350.3
|
|
$
|
716.1
|
|
$
|
714.7
|
|
|
Percent of sales
|
8.0
|
%
|
6.6
|
%
|
7.8
|
%
|
15.2
|
%
|
16.0
|
%
|
|||||
|
Net Income Data:
|
|||||||||||||||
|
Net income
|
$
|
335.3
|
|
$
|
172.5
|
|
$
|
212.9
|
|
$
|
455.4
|
|
$
|
454.0
|
|
|
Percent of sales
|
5.5
|
%
|
3.2
|
%
|
4.7
|
%
|
9.6
|
%
|
10.1
|
%
|
|||||
|
Diluted net income per share
|
$
|
5.24
|
|
$
|
2.69
|
|
$
|
3.27
|
|
$
|
6.75
|
|
$
|
6.65
|
|
|
Cash Flow Data:
|
|||||||||||||||
|
Cash flow provided by continuing operations
|
$
|
477.1
|
|
$
|
585.4
|
|
$
|
589.6
|
|
$
|
440.2
|
|
$
|
529.3
|
|
|
Purchase of property and equipment
|
225.4
|
|
184.4
|
|
209.1
|
|
249.5
|
|
205.1
|
|
|||||
|
Repurchase and retirement of common stock
|
348.7
|
|
90.5
|
|
245.8
|
|
293.6
|
|
81.8
|
|
|||||
|
Cash dividends to shareholders
|
149.0
|
|
145.4
|
|
140.3
|
|
139.3
|
|
126.9
|
|
|||||
|
Cash dividends per share
|
$
|
2.40
|
|
$
|
2.32
|
|
$
|
2.20
|
|
$
|
2.12
|
|
$
|
1.92
|
|
|
Balance Sheet Data (at end of year):
|
|||||||||||||||
|
Cash and cash equivalents
|
$
|
161.2
|
|
$
|
138.3
|
|
$
|
127.3
|
|
$
|
155.3
|
|
$
|
137.6
|
|
|
Current assets
|
1,485.7
|
|
1,253.5
|
|
1,191.0
|
|
1,152.9
|
|
1,096.6
|
|
|||||
|
Total assets
|
4,124.9
|
|
3,089.6
|
|
3,099.6
|
|
2,385.7
|
|
2,074.9
|
|
|||||
|
Current liabilities
|
1,197.4
|
|
1,130.3
|
|
959.8
|
|
826.8
|
|
850.8
|
|
|||||
|
Long-term debt and capital lease obligations
|
1,896.0
|
|
865.3
|
|
1,138.1
|
|
456.4
|
|
223.6
|
|
|||||
|
Shareholders’ equity
|
867.0
|
|
931.7
|
|
867.0
|
|
981.5
|
|
861.3
|
|
|||||
23
Item 7. Management’s Discussion and Analysis of Financial Condition and Results of Operations
The following discussion pertains to the results of operations and financial position of the Company for each of the three years ended
December 31, 2018
,
2017
, and
2016
and should be read in conjunction with the Consolidated Financial Statements and the Notes thereto included elsewhere in this report.
Overview
2018 was a record year, with sales of
$6.1 billion
, a
12 percent
increase from 2017, primarily due to strong Off-Road Vehicles (ORV) sales and the 2018 acquisition of Boat Holdings, LLC (“Boat Holdings”). Our unit retail sales to customers in North America, excluding Boats, increased four percent in 2018. Our annual sales to North American customers increased 12 percent and our annual sales to customers outside of North America increased 11 percent in 2018.
Full year net income of
$335.3 million
was a
94 percent
increase from 2017, with diluted earnings per share increasing
95 percent
to
$5.24
per share. The significant increase was driven by higher volume in 2018 and the negative impact of $52.4 million of Victory Motorcycles® wind-down costs and a $55.8 million non-cash write-down of deferred tax assets related to U.S. tax reform in the 2017 comparative period, as well as the positive impact of a $13 million gain on the sale of the Company's investment in Brammo Inc. recorded in 2018.
During the third quarter of 2018, the Company completed the acquisition of Boat Holdings, headquartered in Elkhart, Indiana. Boat Holdings added $279.7 million of sales in 2018.
On
January 31, 2019
, we announced that our Board of Directors approved a two percent increase in the regular quarterly cash dividend to
$0.61
per share for the first quarter of 2019, representing the 24th consecutive year of increased dividends to shareholders effective with the 2019 first quarter dividend.
Results of Operations
Sales:
Sales were
$6,078.5 million
in
2018
, a
12
percent increase from
$5,428.5 million
in
2017
. Sales for the year ended December 31, 2018 include $279.7 million of net sales related to Boat Holdings. The following table is an analysis of the year over year percentage change in total Company sales for
2018
,
2017
, and
2016
:
|
Percent change in total Company sales compared to the prior year
|
|||||
|
2018
|
2017
|
||||
|
Volume
|
4
|
%
|
4
|
%
|
|
|
Product mix and price
|
3
|
|
1
|
|
|
|
Acquisitions
|
5
|
|
15
|
|
|
|
Currency
|
—
|
|
—
|
|
|
|
12
|
%
|
20
|
%
|
||
The volume increase in 2018 was primarily the result of increased ORV shipments, while the volume increase in 2017 is primarily the result of increased ORV, snowmobile, and Indian Motorcycle shipments, partially offset by decreased Victory motorcycle volumes due to the wind down of the brand. 2017 Victory Motorcycles sales decreased by approximately $164.0 million from 2016.
Product mix and price contributed a three percent increase in 2018, primarily due to higher average selling prices for ORVs. Product mix and price contributed a one percent increase in 2017, primarily due to increased sales volumes of higher priced ORVs, offset by increased sales of lower priced mid-size motorcycles, and increased promotions.
Acquisitions contributed a five percent increase for 2018, primarily due to the Boat Holdings acquisition in July 2018. Acquisitions contributed a 15 percent increase for 2017 primarily due to the TAP acquisition in November 2016.
The impact from currency rates on our Canadian and other foreign subsidiaries’ sales, when translated to U.S. dollars, was flat in 2018 and 2017, compared to the respective prior years.
Until July 2018, the Company reported under four segments, however, as a result of the Boat Holdings acquisition, the Company established a fifth reporting segment, Boats, which includes the results of Boat Holdings. The comparative
24
2017 and 2016 results were not required to be reclassified as the new reporting segment structure did not impact historical segments. Our sales by reporting segment, which includes the respective PG&A, were as follows:
|
For the Years Ended December 31,
|
||||||||||||||||||||||||||
|
($ in millions)
|
2018
|
Percent of
Sales |
2017
|
Percent of
Sales |
Percent
Change 2018 vs. 2017 |
2016
|
Percent of
Sales |
Percent
Change 2017 vs. 2016 |
||||||||||||||||||
|
ORV/Snowmobiles
|
$
|
3,919.4
|
|
64
|
%
|
$
|
3,570.8
|
|
66
|
%
|
10
|
%
|
$
|
3,283.9
|
|
73
|
%
|
9
|
%
|
|||||||
|
Motorcycles
|
545.6
|
|
9
|
%
|
576.0
|
|
11
|
%
|
(5
|
)%
|
699.2
|
|
15
|
%
|
(18
|
)%
|
||||||||||
|
Global Adjacent Markets
|
444.6
|
|
7
|
%
|
396.8
|
|
7
|
%
|
12
|
%
|
341.9
|
|
8
|
%
|
16
|
%
|
||||||||||
|
Aftermarket
|
889.2
|
|
15
|
%
|
884.9
|
|
16
|
%
|
0
|
%
|
191.6
|
|
4
|
%
|
362
|
%
|
||||||||||
|
Boats
|
279.7
|
|
5
|
%
|
—
|
|
—
|
%
|
NM
|
|
—
|
|
—
|
%
|
—
|
%
|
||||||||||
|
Total Sales
|
$
|
6,078.5
|
|
100
|
%
|
$
|
5,428.5
|
|
100
|
%
|
12
|
%
|
$
|
4,516.6
|
|
100
|
%
|
20
|
%
|
|||||||
|
NM = not meaningful
|
||||||||||||||||||||||||||
ORV/Snowmobiles
Off-Road Vehicles
ORV sales, inclusive of PG&A, of $3,578.0 million in 2018, which includes ATV, Polaris GENERAL
, RANGER
,
and
RZR
vehicles, increased 11 percent compared to 2017. This increase was driven by RZR and RANGER shipments. Polaris’ North American ORV unit retail sales to consumers increased low-single digits percent for 2018 compared to 2017, with ATV unit retail sales approximately flat and side-by-side vehicles unit retail sales increasing mid-single digits percent over the prior year. North American dealer inventories of ORVs increased seven percent from 2017. ORV sales outside of North America increased approximately 3 percent in 2018 compared to 2017. For 2018, the average ORV per unit sales price increased approximately five percent compared to 2017’s per unit sales price.
ORV sales, inclusive of PG&A, of $3,225.3 million in 2017, increased eight percent from 2016. This increase reflects increased ORV shipments, driven by RZR and RANGER shipments. Polaris’ North American ORV unit retail sales to consumers increased low-single digits percent for 2017 compared to 2016, with ATV unit retail sales approximately flat and side-by-side vehicles unit retail sales increasing low-single digits percent over the prior year. North American dealer inventories of ORVs decreased six percent from 2016. ORV sales outside of North America increased approximately 11 percent in 2017 compared to 2016. For 2017, the average ORV per unit sales price increased approximately four percent compared to 2016’s per unit sales price.
Snowmobiles
Snowmobiles sales, inclusive of PG&A sales, decreased one percent to $341.4 million for 2018 compared to 2017. Retail sales to consumers for the 2018-2019 season-to-date period through December 31, 2018, increased low thirties percent. Sales of snowmobiles to customers outside of North America, principally within the Scandinavian region and Russia, increased approximately 58 percent in 2018 as compared to 2017. North American dealer inventories of snowmobiles decreased mid-teens percent from 2017. The average unit sales price in 2018 increased two percent over 2017’s per unit sales price.
Snowmobiles sales, inclusive of PG&A sales, increased 12 percent to $345.5 million for 2017 compared to 2016. Retail sales to consumers for the 2017-2018 season-to-date period through December 31, 2017, decreased low double-digits percent. Sales of snowmobiles to customers outside of North America, principally within the Scandinavian region and Russia, increased approximately four percent in 2017 as compared to 2016. The average unit sales price in 2017 was flat with 2016’s per unit sales price.
Motorcycles
Sales of Motorcycles, inclusive of PG&A sales, decreased five percent to $545.6 million for 2018 compared to 2017. The decrease in 2018 sales was primarily due to decreased sales of Slingshot, partially offset by an increase in sales of Indian motorcycles of approximately four percent. The Company estimates North American industry retail sales, 900cc and above (including Slingshot), decreased low-double digits percent in 2018 compared to 2017. Over the same period, Polaris North American unit retail sales to consumers decreased approximately four percent, driven by decreased retail sales of Slingshot, partially offset by increased retail sales for Indian motorcycles of one percent. North American Polaris motorcycle dealer inventory increased low single-digit percent in 2018 versus 2017 levels. Sales of motorcycles to customers outside of North America increased approximately 14 percent in 2018 compared to 2017, due primarily to an
25
increase in Indian motorcycle shipments. Excluding Victory, the average per unit sales price for the Motorcycles segment in 2018 decreased four percent compared to 2017 due to a shift in sales mix towards more mid-sized motorcycles.
Sales of Motorcycles, inclusive of PG&A sales, decreased 18 percent to $576.0 million for 2017 compared to 2016. The decrease in 2017 sales is due to the January 2017 decision to wind down Victory motorcycles, as well as decreased shipments of Slingshot, offset by an increase in Indian motorcycle shipments of approximately 20 percent. North American industry retail sales, 900cc and above (including Slingshot), decreased high-single digits percent in 2017 compared to 2016. Over the same period, Polaris North American unit retail sales to consumers increased approximately four percent, driven primarily by strong retail sales for Indian motorcycles of 15 percent, while Slingshot retail sales decreased in the high teens percent. North American Polaris motorcycle dealer inventory increased high teens percent in 2017 versus 2016 levels primarily due to stocking at appropriate RFM levels. Sales of motorcycles to customers outside of North America decreased approximately two percent in 2017 compared to 2016, due to Victory. Excluding Victory, sales of motorcycles to customers outside North America increased approximately 20 percent in 2017. Excluding Victory, the average per unit sales price for the Motorcycles segment in 2017 decreased two percent compared to 2016 due to higher sales growth of our lower priced mid-sized motorcycles outpacing the growth of our heavyweight motorcycles.
Global Adjacent Markets
Global Adjacent Markets sales, inclusive of PG&A sales, increased 12 percent to $444.6 million for 2018 compared to 2017. The increase in sales was primarily due to increased sales in our Aixam, Goupil and government businesses. Sales to customers outside of North America increased approximately 14 percent in 2018 compared to 2017.
Global Adjacent Markets sales, inclusive of PG&A sales, increased 16 percent to $396.8 million for 2017 compared to 2016. The increase in sales is primarily due to increased sales in our Aixam, Goupil and government businesses. Sales to customers outside of North America increased approximately 24 percent in 2017 compared to 2016.
Aftermarket
Aftermarket sales, which includes Transamerican Auto Parts (TAP), along with our other aftermarket brands of Klim, Kolpin, ProArmor, Trail Tech and 509, of $889.2 million for 2018 were approximately flat compared to 2017, due to soft wholesale sales and lower e-commence demand. TAP opened nine new 4-Wheel Parts retail stores in 2018, bringing the total store count to 93.
Aftermarket sales increased significantly to $884.9 million for 2017 compared to 2016. The increase in sales was primarily due to the acquisition of TAP in November 2016, which drove $685.1 million of the increase. TAP opened eight new 4-Wheel Parts retail stores in 2017, bringing the total store count to 84.
Boats
Boat sales relate to the Boat Holdings acquisition which closed on July 2, 2018, were $279.7 million in 2018.
Sales by Geography
Sales by geographic region were as follows:
|
For the Years Ended December 31,
|
||||||||||||||||||||||||||
|
($ in millions)
|
2018
|
Percent of Total Sales
|
2017
|
Percent of Total Sales
|
Percent Change 2018 vs. 2017
|
2016
|
Percent of Total Sales
|
Percent Change 2017 vs. 2016
|
||||||||||||||||||
|
United States
|
$
|
4,883.8
|
|
80
|
%
|
$
|
4,327.6
|
|
80
|
%
|
13
|
%
|
$
|
3,557.2
|
|
79
|
%
|
22
|
%
|
|||||||
|
Canada
|
390.2
|
|
7
|
%
|
375.6
|
|
7
|
%
|
4
|
%
|
307.1
|
|
7
|
%
|
22
|
%
|
||||||||||
|
Other foreign countries
|
804.5
|
|
13
|
%
|
725.3
|
|
13
|
%
|
11
|
%
|
652.3
|
|
14
|
%
|
11
|
%
|
||||||||||
|
Total sales
|
$
|
6,078.5
|
|
100
|
%
|
$
|
5,428.5
|
|
100
|
%
|
12
|
%
|
$
|
4,516.6
|
|
100
|
%
|
20
|
%
|
|||||||
Significant regional trends were as follows:
United States:
Sales in the United States for 2018 increased 13 percent compared to 2017, primarily resulting from the acquisition of Boat Holdings in July 2018 and increased ORV shipments, while sales in the United States for 2017 increased 22 percent compared to 2016, primarily resulting from the acquisition of TAP in November 2016 and increased ORV shipments, partially offset by the wind down of Victory motorcycles. The United States represented 80 percent, 80 percent and 79 percent of total company sales in 2018, 2017 and 2016, respectively.
26
Canada:
Canadian sales for 2018 increased 4 percent compared to 2017, driven by increased ORV shipments, while Canadian sales for 2017 increased 22 percent compared to 2016, driven by the acquisition of TAP and increased ORV shipments, partially offset by the Victory wind down. Currency rate movement had an immaterial impact on sales for 2018 compared to 2017 and a favorable three percent impact on sales for 2017 compared to 2016. Sales in Canada represented seven percent of total company sales in 2018, 2017 and 2016.
Other Foreign Countries:
Sales in other foreign countries, primarily in Europe, increased 11 percent in 2018 compared to 2017. This increase was primarily driven by higher sales of snowmobiles and Indian motorcycles. Currency rate movements had a favorable two percent impact on sales for 2018 compared to 2017.
Sales in other foreign countries, primarily in Europe, increased 11 percent in 2017 compared to 2016. Sales of ORVs, snowmobiles, and Global Adjacent Markets vehicles increased, partially offset by decreased sales of motorcycles due to the Victory wind down. Currency rate movements had a favorable one percentage point impact on sales for 2017 compared to 2016.
Cost of Sales:
The following table reflects our cost of sales in dollars and as a percentage of sales:
|
For the Years Ended December 31,
|
||||||||||||||||||||||||||
|
($ in millions)
|
2018
|
Percent of Total Cost of Sales
|
2017
|
Percent of Total Cost of Sales
|
Change 2018 vs. 2017
|
2016
|
Percent of
Total Cost of Sales |
Change 2017 vs. 2016
|
||||||||||||||||||
|
Purchased materials and services
|
$
|
3,978.1
|
|
87
|
%
|
$
|
3,526.0
|
|
86
|
%
|
13
|
%
|
$
|
2,840.8
|
|
83
|
%
|
24
|
%
|
|||||||
|
Labor and benefits
|
358.5
|
|
8
|
%
|
292.6
|
|
7
|
%
|
23
|
%
|
250.7
|
|
7
|
%
|
17
|
%
|
||||||||||
|
Depreciation and amortization
|
135.7
|
|
3
|
%
|
139.5
|
|
3
|
%
|
(3
|
)%
|
124.5
|
|
4
|
%
|
12
|
%
|
||||||||||
|
Warranty costs
|
105.0
|
|
2
|
%
|
145.7
|
|
4
|
%
|
(28
|
)%
|
195.0
|
|
6
|
%
|
(25
|
)%
|
||||||||||
|
Total cost of sales
|
$
|
4,577.3
|
|
100
|
%
|
$
|
4,103.8
|
|
100
|
%
|
12
|
%
|
$
|
3,411.0
|
|
100
|
%
|
20
|
%
|
|||||||
|
Percentage of sales
|
75.3
|
%
|
75.6
|
%
|
-29 basis
|
|
75.5
|
%
|
+8 basis
|
|
||||||||||||||||
|
points
|
|
points
|
|
|||||||||||||||||||||||
For 2018, cost of sales increased 12 percent to $4,577.3 million compared to $4,103.8 million in 2017. The increase in cost of sales in 2018 is primarily attributed to the acquisition of Boat Holdings in July 2018, which added $233.4 million of cost of sales, as well as increased purchased materials and services related to higher sales volumes, tariff costs, and higher logistics and commodity costs, partially offset by lower Victory motorcycles wind down costs.
For 2017, cost of sales increased 20 percent to $4,103.8 million compared to $3,411.0 million in 2016. The increase in cost of sales in 2017 is primarily attributed to the acquisition of TAP in November 2016, Victory motorcycles wind down costs, and manufacturing network realignment costs, partially offset by lower warranty costs.
27
Gross Profit:
The following table reflects our gross profit in dollars and as a percentage of sales:
|
For the Years Ended December 31,
|
||||||||||||||||||||||||||
|
($ in millions)
|
2018
|
Percent of Sales
|
2017
|
Percent of Sales
|
Change
2018 vs.
2017
|
2016
|
Percent of Sales
|
Change
2017 vs.
2016
|
||||||||||||||||||
|
ORV/Snowmobiles
|
$
|
1,113.9
|
|
28.4
|
%
|
$
|
1,054.6
|
|
29.5
|
%
|
6
|
%
|
$
|
907.6
|
|
27.6
|
%
|
16
|
%
|
|||||||
|
Motorcycles
|
63.0
|
|
11.6
|
%
|
16.7
|
|
2.9
|
%
|
277
|
%
|
87.5
|
|
12.5
|
%
|
(81
|
)%
|
||||||||||
|
Global Adjacent Markets
|
116.6
|
|
26.2
|
%
|
94.9
|
|
23.9
|
%
|
23
|
%
|
95.1
|
|
27.8
|
%
|
0
|
%
|
||||||||||
|
Aftermarket
|
234.4
|
|
26.4
|
%
|
225.5
|
|
25.5
|
%
|
4
|
%
|
46.3
|
|
24.2
|
%
|
387
|
%
|
||||||||||
|
Boats
|
46.3
|
|
16.5
|
%
|
—
|
|
—
|
%
|
NM
|
|
—
|
|
—
|
%
|
—
|
%
|
||||||||||
|
Corporate
|
(73.0
|
)
|
(67.0
|
)
|
9
|
%
|
(30.9
|
)
|
117
|
%
|
||||||||||||||||
|
Total gross profit dollars
|
$
|
1,501.2
|
|
$
|
1,324.7
|
|
13
|
%
|
$
|
1,105.6
|
|
20
|
%
|
|||||||||||||
|
Percentage of sales
|
24.7
|
%
|
24.4
|
%
|
+29 basis points
|
|
24.5
|
%
|
-8 basis points
|
|
||||||||||||||||
|
NM = not meaningful
|
||||||||||||||||||||||||||
Consolidated
. Consolidated gross profit, as a percentage of sales, increased in 2018 due to lower Victory Motorcycle wind down costs, favorable foreign exchange, and lower warranty expense, partially offset by increased tariff, logistics, and commodity costs. Foreign currencies had a positive impact to gross profit of approximately $19.9 million for 2018, when compared to the prior year period.
Consolidated gross profit, as a percentage of sales, was approximately flat in 2017 due to increased volumes and mix and gross VIP cost savings, offset by Victory wind down costs and promotional costs. 2017 gross profit includes the negative impact of $57.8 million of Victory Motorcycle wind down costs, $13.0 million of realignment costs, and $13.0 million of inventory step-up accounting adjustments related to the TAP acquisition. Foreign currencies had a negative impact to gross profit of approximately $7.4 million for 2017, when compared to the prior year period.
ORV/Snowmobiles
. Gross profit, as a percentage of sales, decreased from 2017 to 2018, primarily due to unfavorable product mix, higher commodity costs and freight pressures, partially offset by lower warranty expense. Gross profit, as a percentage of sales, increased from 2016 to 2017, primarily due to increased volumes, product mix, and lower warranty costs, partially offset by higher promotions.
Motorcycles
. Gross profit, as a percentage of sales, increased from 2017 to 2018, primarily due to lower costs associated with the wind down of Victory Motorcycles, partially offset by negative mix. Gross profit, as a percentage of sales, decreased from 2016 to 2017, primarily due to $57.8 million of costs incurred related to the wind down of Victory motorcycles, including increased promotions and inventory charges, and lower Slingshot volume.
Global Adjacent Markets
. Gross profit, as a percentage of sales, increased from 2017 to 2018, primarily due to sales mix and less manufacturing network realignment costs. Gross profit, as a percentage of sales, decreased from 2016 to 2017, primarily due to costs incurred for manufacturing network realignment of $13.0 million.
Aftermarket.
Gross profit, as a percentage of sales, increased from 2017 to 2018, primarily due to the negative impact of $13.0 million of inventory step-up adjustments related to the TAP acquisition in the prior year comparable period. Gross profit, as a percentage of sales, increased from 2016 to 2017, primarily due to the acquisition of TAP. 2017 gross profit includes the negative impact of $13.0 million of inventory step-up accounting adjustments related to the TAP acquisition.
Boats.
Segment gross profit, which relates to the Boat Holdings acquisition which closed on July 2, 2018, was $46.3 million in 2018, which includes the negative impact of $3.1 million of inventory step-up adjustments.
28
Operating Expenses:
The following table reflects our operating expenses in dollars and as a percentage of sales:
|
For the Years Ended December 31,
|
|||||||||||||||||
|
($ in millions)
|
2018
|
2017
|
Change
2018 vs. 2017 |
2016
|
Change
2017 vs. 2016 |
||||||||||||
|
Selling and marketing
|
$
|
491.8
|
|
$
|
471.8
|
|
4
|
%
|
$
|
342.2
|
|
38
|
%
|
||||
|
Research and development
|
259.7
|
|
238.3
|
|
9
|
%
|
185.1
|
|
29
|
%
|
|||||||
|
General and administrative
|
349.7
|
|
331.2
|
|
6
|
%
|
306.5
|
|
8
|
%
|
|||||||
|
Total operating expenses
|
$
|
1,101.2
|
|
$
|
1,041.3
|
|
6
|
%
|
$
|
833.8
|
|
25
|
%
|
||||
|
Percentage of sales
|
18.1
|
%
|
19.2
|
%
|
-107 basis points
|
|
18.5
|
%
|
+72 basis points
|
|
|||||||
Operating expenses for 2018, in absolute dollars, increased primarily due to the Boat Holdings acquisition, which closed on July 2, 2018, and investments in strategic projects. Operating expenses, as a percentage of sales, decreased primarily due to realized efficiencies in selling, marketing, and general and administrative spend along with the addition of Boat Holdings, which inherently has a lower operating expense to sales ratio.
Operating expenses for 2017, as a percentage of sales and in absolute dollars, increased primarily due to the TAP acquisition, increased variable compensation expenses, increased research and development expenses and increased selling and marketing costs related to new products, partially offset by decreased legal related expenses. 2017 operating expenses included $10.1 million of Victory Motorcycles wind down costs, $14.0 million of TAP integration expenses, and $9.1 million of corporate restructuring and realignment expenses.
Income from Financial Services:
The following table reflects our income from financial services:
|
For the Years Ended December 31,
|
|||||||||||||||||
|
($ in millions)
|
2018
|
2017
|
Change
2018 vs. 2017 |
2016
|
Change
2017 vs. 2016 |
||||||||||||
|
Income from Polaris Acceptance joint venture
|
$
|
30.4
|
|
$
|
27.3
|
|
11
|
%
|
$
|
31.1
|
|
(12
|
)%
|
||||
|
Income from retail credit agreements
|
46.3
|
|
37.5
|
|
23
|
%
|
41.8
|
|
(10
|
)%
|
|||||||
|
Income from other financial services activities
|
10.7
|
|
11.5
|
|
(7
|
)%
|
5.6
|
|
105
|
%
|
|||||||
|
Total income from financial services
|
$
|
87.4
|
|
$
|
76.3
|
|
15
|
%
|
$
|
78.5
|
|
(3
|
)%
|
||||
|
Percentage of sales
|
1.4
|
%
|
1.4
|
%
|
+3 basis points
|
|
1.7
|
%
|
-33 basis points
|
|
|||||||
Income from financial services increased 15 percent to $87.4 million in 2018 compared to $76.3 million in 2017. The increase in 2018 was primarily due to improved retail financing penetration rates and higher income from Polaris Acceptance due to higher dealer inventory levels.
Income from financial services decreased three percent to $76.3 million in 2017 compared to $78.5 million in 2016. The decrease in 2017 was primarily due to a four percent decrease in retail credit contract volume and decreased income generated from the wholesale portfolio due to lower ORV dealer inventory levels, partially offset by higher income from the sale of extended service contracts.
29
Remainder of the Income Statement:
|
For the Years Ended December 31,
|
|||||||||||||||||
|
($ in millions except per share data)
|
2018
|
2017
|
Change
2018 vs. 2017 |
2016
|
Change
2017 vs. 2016 |
||||||||||||
|
Interest expense
|
$
|
57.0
|
|
$
|
32.2
|
|
77
|
%
|
$
|
16.3
|
|
97
|
%
|
||||
|
Equity in loss of other affiliates
|
$
|
29.3
|
|
$
|
6.8
|
|
333
|
%
|
$
|
6.9
|
|
(2
|
)%
|
||||
|
Other (income) expense, net
|
$
|
(28.1
|
)
|
$
|
2.0
|
|
NM
|
|
$
|
13.8
|
|
(86
|
)%
|
||||
|
Income before income taxes
|
$
|
429.2
|
|
$
|
318.8
|
|
35
|
%
|
$
|
313.3
|
|
2
|
%
|
||||
|
Provision for income taxes
|
$
|
94.0
|
|
$
|
146.3
|
|
(36
|
)%
|
$
|
100.3
|
|
46
|
%
|
||||
|
Percentage of income before income taxes
|
21.9%
|
45.9%
|
32.0%
|
||||||||||||||
|
Net income
|
$
|
335.3
|
|
$
|
172.5
|
|
94
|
%
|
$
|
212.9
|
|
(19
|
)%
|
||||
|
Diluted net income per share
|
$
|
5.24
|
|
$
|
2.69
|
|
95
|
%
|
$
|
3.27
|
|
(18
|
)%
|
||||
|
Weighted average diluted shares outstanding
|
63.9
|
|
64.2
|
|
0
|
%
|
65.2
|
|
(2
|
)%
|
|||||||
|
NM = not meaningful
|
|||||||||||||||||
Interest Expense.
The increase in 2018 compared to 2017, was primarily due to increased debt levels to finance the Boat Holdings acquisition. The increase in 2017 compared to 2016 is primarily due to increased debt levels to finance the TAP acquisition.
Equity in loss of other affiliates.
As a result of the decision by the Eicher-Polaris Private Limited (EPPL) Board of Directors to shut down the operations of the EPPL joint venture, we impaired our investment in EPPL and incurred additional wind-down related costs in 2018. The impairment and wind-down costs resulted in a year-to-date increase in Equity in loss of other affiliates.
Other (income) expense,net.
The change in Other (income) expense, net primarily relates to foreign currency exchange rate movements and the corresponding effects on foreign currency transactions, currency hedging positions and balance sheet positions related to our foreign subsidiaries from period to period. 2018 includes a $13.5 million gain on the Company’s investment in Brammo Inc., while 2017 includes impairment of a cost method investment recorded due to the wind down of Victory Motorcycles.
Provision for income taxes.
The income tax rate for 2018 was 21.9% as compared with 45.9% and 32.0% in 2017 and 2016, respectively. The lower income tax rate for 2018, compared with 2017 was primarily due to the reduction in the federal statutory rate to 21 percent effective during 2018 and a non-cash $55.8 million write-down of deferred tax assets as a result of the passing of the U.S. tax reform bill in the fourth quarter of 2017, offset by a decrease in excess tax benefits related to share based compensation as compared to 2017.
The higher income tax rate for 2017, compared with 2016 was primarily due to a non-cash $55.8 million write-down of deferred tax assets as a result of the passing of the U.S. tax reform bill in the fourth quarter of 2017, offset by favorable changes related to share-based payment accounting and the related excess tax benefits now recognized as a reduction to income tax expense in accordance with ASU No. 2016-09.
Weighted average shares outstanding.
The change in the weighted average diluted shares outstanding from 2017 to 2018 and 2016 to 2017 is primarily due to share repurchases under our stock repurchase program.
Liquidity and Capital Resources
Our primary source of funds has been cash provided by operating and financing activities. Our primary uses of funds have been for acquisitions, repurchase and retirement of common stock, capital investment, new product development and cash dividends to shareholders.
30
The following table summarizes the cash flows from operating, investing and financing activities for the years ended
December 31, 2018
,
2017
and
2016
:
|
($ in millions)
|
For the Years Ended December 31,
|
||||||||||||||||||
|
2018
|
2017
|
Change
2018 vs. 2017 |
2016
|
Change
2017 vs. 2016 |
|||||||||||||||
|
Total cash provided by (used for):
|
|||||||||||||||||||
|
Operating activities
|
$
|
477.1
|
|
$
|
585.4
|
|
$
|
(108.3
|
)
|
$
|
589.6
|
|
$
|
(4.2
|
)
|
||||
|
Investing activities
|
(959.5
|
)
|
(151.1
|
)
|
(808.4
|
)
|
(909.3
|
)
|
758.2
|
|
|||||||||
|
Financing activities
|
523.4
|
|
(427.7
|
)
|
951.1
|
|
314.5
|
|
(742.2
|
)
|
|||||||||
|
Impact of currency exchange rates on cash balances
|
(9.5
|
)
|
9.8
|
|
(19.3
|
)
|
(5.0
|
)
|
14.8
|
|
|||||||||
|
Increase (decrease) in cash and cash equivalents
|
$
|
31.5
|
|
$
|
16.4
|
|
$
|
15.1
|
|
$
|
(10.2
|
)
|
$
|
26.6
|
|
||||
Operating Activities:
Net cash provided by operating activities totaled $477.1 million and $585.4 million in 2018 and 2017, respectively. The $108.3 million decrease is primarily due to higher factory inventory and the timing of accounts payable and accrued expense payments.
Net cash provided by operating activities totaled $585.4 million and $589.6 million in 2017 and 2016, respectively. The $4.2 million decrease is primarily due to timing of accounts payable and accrued expense payments, partially offset by higher factory inventory.
Investing Activities:
Net cash used for investing activities was $959.5 million in 2018 compared to $151.1 million in 2017. The primary uses of cash in 2018 were capital expenditures and the acquisition of Boat Holdings.
Net cash used for investing activities was $151.1 million in 2017 compared to $909.3 million in 2016. The primary uses of cash in 2017 were capital expenditures. In 2017, our capital expenditures returned to normalized levels, following significant capital spending in 2016 related to the completion of our Huntsville manufacturing facility. Cash used for investing was significantly higher in 2016 compared to 2017 due to the acquisition of TAP and Taylor-Dunn.
Financing Activities:
Net cash provided by financing activities was
$523.4 million
in
2018
compared to net cash used for financing activities of
$427.7 million
in
2017
. The increase is primarily related to the Boat Holdings acquisition. We paid cash dividends of
$149.0 million
and
$145.4 million
in
2018
and
2017
, respectively. Total common stock repurchased in
2018
and
2017
totaled
$348.7 million
and
$90.5 million
, respectively. In
2018
, we had net borrowings under our capital lease arrangements and debt arrangements of
$973.7 million
, compared to net repayments of
$234.5 million
in
2017
. Proceeds from the issuance of stock under employee plans were
$47.4 million
and
$42.7 million
in
2018
and
2017
, respectively.
Net cash used for financing activities was
$427.7 million
in
2017
compared to net cash provided by financing activities of $314.5 million in 2016. We paid cash dividends of
$145.4 million
and $140.3 million in
2017
and 2016, respectively. Total common stock repurchased in
2017
and 2016 totaled
$90.5 million
and $245.8 million, respectively. In
2017
, we had net repayments under our capital lease arrangements and debt arrangements of
$234.5 million
, compared to net borrowings of $679.4 million in 2016. Proceeds from the issuance of stock under employee plans were
$42.7 million
and $17.7 million in
2017
and 2016, respectively.
The seasonality of production and shipments cause working capital requirements to fluctuate during the year. We are party to an unsecured $700.0 million variable interest rate bank lending agreement that expires in July 2023, under which we have unsecured borrowings. At
December 31, 2018
, there were borrowings of
$187.6 million
outstanding under this arrangement. We are also party to a $1,180.0 million term loan facility, of which
$1,150.0 million
is outstanding as of
December 31, 2018
. Interest is charged at rates based on LIBOR or “prime.”
In December 2010, the Company entered into a Master Note Purchase Agreement to issue $25.0 million of unsecured senior notes due May 2018 and $75.0 million of unsecured senior notes due May 2021 (collectively, the “Senior Notes”). The Senior Notes were issued in May 2011. In December 2013, the Company entered into a First Supplement to Master Note Purchase Agreement, under which the Company issued $100.0 million of unsecured senior notes due December
31
2020. In July 2018, the Company entered into a Master Note Purchase Agreement to issue $350.0 million of unsecured senior notes due July 2028. At
December 31, 2018
and
2017
, outstanding borrowings under the amended Master Note Purchase Agreement totaled
$525.0 million
and
$200.0 million
, respectively.
As a component of the Boat Holdings merger agreement, Polaris has committed to make a series of deferred payments to the former owners following the closing date of of the merger through July 2030. The original discounted payable was for
$76.7 million
, all of which is outstanding as of December 31, 2018. The outstanding balance is included in Notes payable and other.
At
December 31, 2018
and
2017
, we were in compliance with all debt covenants. Our debt to total capital ratio was
69 percent
and
49 percent
at
December 31, 2018
and
2017
, respectively.
The following table summarizes our significant future contractual obligations at
December 31, 2018
:
|
(In millions):
|
Total
|
<1 Year
|
1-3 Years
|
4-5 Years
|
>5 Years
|
||||||||||||||
|
Senior notes
|
$
|
525.0
|
|
$
|
—
|
|
$
|
175.0
|
|
$
|
—
|
|
350.0
|
|
|||||
|
Borrowings under our credit facility
|
187.6
|
|
—
|
|
—
|
|
187.6
|
|
—
|
|
|||||||||
|
Term loan facility
|
1,150.0
|
|
59.0
|
|
118.0
|
|
973.0
|
|
—
|
|
|||||||||
|
Notes payable and other
|
87.6
|
|
6.2
|
|
13.1
|
|
14.0
|
|
$
|
54.3
|
|
||||||||
|
Interest expense
|
308.9
|
|
70.4
|
|
135.5
|
|
103.0
|
|
—
|
|
|||||||||
|
Capital leases
|
20.7
|
|
2.1
|
|
4.1
|
|
3.9
|
|
10.6
|
|
|||||||||
|
Operating leases
|
127.8
|
|
39.0
|
|
51.1
|
|
24.4
|
|
13.3
|
|
|||||||||
|
Total
|
$
|
2,407.6
|
|
$
|
176.7
|
|
$
|
496.8
|
|
$
|
1,305.9
|
|
$
|
428.2
|
|
||||
In the table above, we assumed our
December 31, 2018
, outstanding borrowings under the Senior Notes will be paid at their respective due dates. Interest expense has not been estimated beyond year five. Additionally, at
December 31, 2018
, we had letters of credit outstanding of
$18.7 million
related to purchase obligations for raw materials. Not included in the above table are unrecognized tax benefits of
$28.6 million
, including interest, as the timing of payment is uncertain.
Our Board of Directors has authorized the cumulative repurchase of up to
90.5 million
shares of our common stock through an authorized stock repurchase program. Of that total, approximately
87.2 million
shares have been repurchased cumulatively from 1996 through
December 31, 2018
. We repurchased a total of
3.2 million
shares of our common stock for
$348.7 million
during
2018
, which increased earnings per share by 11 cents. We have authorization from our Board of Directors to repurchase up to an additional
3.3 million
shares of our common stock as of
December 31, 2018
. The repurchase of any or all such shares authorized remaining for repurchase will be governed by applicable SEC rules.
We have arrangements with certain finance companies (including Polaris Acceptance and TCF) to provide secured floor plan financing for our dealers. These arrangements provide liquidity by financing dealer purchases of our products without the use of our working capital. A majority of the worldwide sales of snowmobiles, ORVs, motorcycles, boats and related PG&A are financed under similar arrangements whereby we receive payment within a few days of shipment of the product. The amount financed by worldwide dealers under these arrangements related to snowmobiles, ORVs, motorcycles, boats and related PG&A as of
December 31, 2018
and
2017
, was approximately
$1,643.8 million
and
$1,422.2 million
, respectively. We participate in the cost of dealer financing up to certain limits.
We have agreed to repurchase products repossessed by Polaris Acceptance up to an annual maximum of 15 percent of the aggregate month-end outstanding Polaris Acceptance receivables and Securitized Receivables during the prior calendar year. For calendar year
2018
, the potential 15 percent aggregate repurchase obligation was approximately
$165.0 million
. Our financial exposure under this agreement is limited to the difference between the amounts unpaid by the dealer with respect to the repossessed product plus costs of repossession and the amount received on the resale of the repossessed product. No material losses have been incurred under these agreements. However, an adverse change in retail sales could cause this situation to change and thereby require us to repurchase repossessed units subject to the annual limitation referred to above.
On March 1, 2016, Wells Fargo Bank, N.A. (“Wells Fargo”) announced that it completed the purchase of the North American portion of GE Capital’s Commercial Distribution Finance (GECDF) business, including GECDF’s ownership interests in Polaris Acceptance, and adopted the tradename Wells Fargo Commercial Distribution Finance (WFCDF).
Polaris Acceptance, a joint venture between Polaris and Wells Fargo, provides floor plan financing to our dealers in the United States. Our subsidiary has a 50 percent equity interest in Polaris Acceptance. As part of the agreement, Polaris
32
sells portions of its receivable portfolio (“Securitized Receivables”) to a securitization facility (“Securitization Facility”) from time to time on an ongoing basis. The sale of receivables from Polaris Acceptance to the Securitization Facility is accounted for in Polaris Acceptance’s financial statements as a “true-sale” under ASC Topic 860. Polaris Acceptance is not responsible for any continuing servicing costs or obligations with respect to the Securitized Receivables. The remaining portion of the receivable portfolio is recorded on Polaris Acceptance’s books, and is funded through a loan from an affiliate of WFCDF and through equity contributions from both partners.
We have not guaranteed the outstanding indebtedness of Polaris Acceptance. In addition, we and Wells Fargo share equally a variable equity cash investment based on the sum of the portfolio balance in Polaris Acceptance. Our total investment in Polaris Acceptance at
December 31, 2018
was
$92.1 million
. Substantially all of our U.S. sales are financed through Polaris Acceptance whereby Polaris receives payment within a few days of shipment of the product. The partnership agreement provides that all income and losses of Polaris Acceptance are shared 50 percent by our wholly owned subsidiary and 50 percent by Wells Fargo’s subsidiary. Our exposure to losses associated with respect to the Polaris Acceptance is limited to our equity in Polaris Acceptance. We have agreed to repurchase products repossessed by Polaris Acceptance up to an annual maximum of 15 percent of the aggregate average month-end balances outstanding during the prior calendar year with respect to receivables retained by Polaris Acceptance and the Securitized Receivables. For calendar year
2019
, the potential 15 percent aggregate repurchase obligation is approximately
$180.6 million
. Our financial exposure under this arrangement is limited to the difference between the amount paid to the finance company for repurchases and the amount received on the resale of the repossessed product. No material losses have been incurred under this agreement. The partnership agreement is effective through February 2022.
Our investment in Polaris Acceptance is accounted for under the equity method and is recorded as investment in finance affiliate in the accompanying consolidated balance sheets. Our allocable share of the income of Polaris Acceptance has been included as a component of income from financial services in the accompanying consolidated statements of income. At
December 31, 2018
, Polaris Acceptance’s wholesale portfolio receivables from dealers in the United States (including the Securitized Receivables) was
$1,226.4 million
, a
three
percent increase from
$1,193.0 million
at
December 31, 2017
. Credit losses in the Polaris Acceptance portfolio have been modest, averaging less than one percent of the portfolio.
TCF finances a portion of Polaris’ United States sales of boats whereby Polaris receives payment within a few days of shipment of the product. Polaris has agreed to repurchase products repossessed by TCF up to a maximum of
100
percent of the aggregate outstanding TCF receivables balance. At
December 31, 2018
, the potential aggregate repurchase obligation was approximately
$201.6 million
. Polaris’ financial exposure under this arrangement is limited to the difference between the amounts unpaid by the dealer with respect to the repossessed product plus costs of repossession and the amount received on the resale of the repossessed product. No material losses have been incurred under this agreement during the periods presented.
We have agreements with Performance Finance, Sheffield Financial and Synchrony Bank, under which these financial institutions provide financing to end consumers of our products. The income generated from these agreements has been included as a component of income from financial services in the accompanying consolidated statements of income. At
December 31, 2018
, the agreements in place were as follows:
|
Financial institution
|
Agreement expiration date
|
|
Performance Finance
|
December 2021
|
|
Sheffield Financial
|
December 2020
|
|
Synchrony Bank
|
December 2020
|
During
2018
, consumers financed
35 percent
of our vehicles sold in the United States through the Performance Finance, Sheffield Financial and Synchrony Bank installment retail credit arrangements. The volume of installment credit contracts written in calendar year
2018
with these institutions was
$1,326.0 million
, a
23 percent
increase from
2017
.
We administer and provide extended service contracts to consumers and certain insurance contracts to dealers and consumers through various third-party suppliers. We finance our self-insured risks related to extended service contracts, but do not retain any insurance or financial risk under any of the other arrangements. The service fee income generated from these arrangements has been included as a component of income from financial services in the accompanying consolidated statements of income.
33
The balance of restricted cash as of
December 31, 2018
,
2017
, and
2016
was
$32.0 million
,
$23.3 million
, and
$17.8 million
, respectively. Restricted cash represents cash equivalents held in trust, as well as amounts held on deposit with regulatory agencies in the various jurisdictions in which our insurance entity does business.
We believe that existing cash balances, cash flow to be generated from operating activities and available borrowing capacity under the line of credit arrangement will be sufficient to fund operations, new product development, cash dividends, share repurchases, acquisitions and capital requirements for the foreseeable future. At this time, we are not aware of any factors that would have a material adverse impact on cash flow.
Critical Accounting Policies
The significant accounting policies that management believes are the most critical to aid in fully understanding and evaluating our reported financial results include the following: revenue recognition, sales promotions and incentives, dealer holdback programs, share-based employee compensation, product warranties, product liability, and goodwill and indefinite-lived intangibles.
Revenue recognition.
Revenue is recognized when obligations under the terms of a contract with our customer are satisfied which generally occurs with the transfer of control of the wholegood vehicles, parts, garments or accessories, and, for services, upon completion of the service or over the term of the agreement in proportion to the costs expected to be incurred in satisfying the obligations under the contract. The amount of consideration the Company receives and revenue it recognizes varies with changes in marketing incentives and rebates it offers to its dealers and their customers. Historically, product returns, whether in the normal course of business or resulting from repurchases made under the floorplan financing program, have not been material. However, we have agreed to repurchase products repossessed by the finance companies up to certain limits. Our financial exposure is limited to the difference between the amount paid to the finance companies and the amount received on the resale of the repossessed product. No material losses have been incurred under these agreements. We have not historically recorded any significant sales return allowances because we have not been required to repurchase a significant number of units. However, an adverse change in retail sales could cause this situation to change.
Sales promotions and incentives.
We provide for estimated sales promotion and incentive expenses, which are recognized as a component of sales in measuring the amount of consideration the Company expects to receive in exchange for transferring goods or providing services. Examples of sales promotion and incentive programs include dealer and consumer rebates, volume incentives, retail financing programs and sales associate incentives. Sales promotion and incentive expenses are estimated based on current programs and historical rates for each product line. We record these amounts as a liability in the consolidated balance sheet until they are ultimately paid. At
December 31, 2018
and
2017
, accrued sales promotions and incentives were
$167.6 million
and
$162.3 million
, respectively. Actual results may differ from these estimates if market conditions dictate the need to enhance or reduce sales promotion and incentive programs or if the customer usage rate varies from historical trends. Adjustments to sales promotions and incentives accruals are made from time to time as actual usage becomes known in order to properly estimate the amounts necessary to generate consumer demand based on market conditions as of the balance sheet date. Historically, actual sales promotion and incentive expenses have been within our expectations and differences have not been material.
Dealer holdback programs.
Dealer holdback represents a portion of the invoiced sales price that is expected to be subsequently returned to the dealer or distributor as a sales incentive upon the ultimate retail sale of the product. Holdback amounts reduce the ultimate net price of the products purchased by our dealers or distributors and, therefore, reduce the amount of sales we recognize at the time of shipment. The portion of the invoiced sales price estimated as the holdback is recognized as “dealer holdback” liability on our balance sheet until paid or forfeited. The minimal holdback adjustments in the estimated holdback liability due to forfeitures are recognized in net sales. Payments are made to dealers or distributors at various times during the year subject to previously established criteria. Polaris recorded accrued liabilities of
$125.0 million
and
$114.2 million
for dealer holdback programs in the consolidated balance sheets as of
December 31, 2018
and
2017
, respectively.
Share-based employee compensation.
We recognize in the financial statements the grant-date fair value of stock options and other equity-based compensation issued to employees. Determining the appropriate fair-value model and calculating the fair value of share-based awards at the date of grant requires judgment. We utilize the Black-Scholes option pricing model to estimate the fair value of employee stock options, and the Monte Carlo model to estimate the fair value of employee performance restricted stock units that include a market condition. These pricing models also require the use of
34
input assumptions, including expected volatility, expected life, expected dividend rate, and expected risk-free rate of return. We utilize historical volatility as we believe this is reflective of market conditions. The expected life of the awards is based on historical exercise patterns. The risk-free interest rate assumption is based on observed interest rates appropriate for the terms of awards. The dividend yield assumption is based on our history of dividend payouts. We develop an estimate of the number of share-based awards that will be forfeited due to employee turnover. Changes in the estimated forfeiture rate can have a significant effect on reported share-based compensation, as the effect of adjusting the rate for all expense amortization is recognized in the period the forfeiture estimate is changed. If the actual forfeiture rate is higher or lower than the estimated forfeiture rate, then an adjustment is made to increase or decrease the estimated forfeiture rate, which will result in a decrease or increase to the expense recognized in the financial statements. If forfeiture adjustments are made, they would affect our gross margin and operating expenses. We estimate the likelihood and the rate of achievement for performance share-based awards, specifically long-term compensation grants of performance-based restricted stock unit awards. Changes in the estimated rate of achievement can have a significant effect on reported share-based compensation expenses as the effect of a change in the estimated achievement level is recognized in the period that the likelihood factor changes. If adjustments in the estimated rate of achievement are made, they would be reflected in our gross margin and operating expenses. At the end of
2018
, if all long-term incentive program performance based awards were expected to achieve the maximum payout, we would have recorded an additional
$43.1 million
of expense in
2018
. Fluctuations in our stock price can have a significant effect on reported share-based compensation expenses for liability-based awards. The impact from fluctuations in our stock price is recognized in the period of the change, and is reflected in our gross margin and operating expenses. At
December 31, 2018
, the accrual for liability-based awards outstanding was
$7.3 million
, and is included in accrued compensation in the consolidated balance sheets.
Product warranties.
We provide a limited warranty for our vehicles and boats for a period of
six
months to
ten
years, depending on the product. We provide longer warranties in certain geographical markets as determined by local regulations and market conditions and may provide longer warranties related to certain promotional programs. Our standard warranties require us or our dealers to repair or replace defective products during such warranty periods at no cost to the consumers. The warranty reserve is established at the time of sale to the dealer or distributor based on management’s best estimate using historical rates and trends. We record these amounts as a liability in the consolidated balance sheet until they are ultimately paid. At
December 31, 2018
and
2017
, the accrued warranty liability was
$121.8 million
and
$123.8 million
, respectively. Adjustments to the warranty reserve are made from time to time based on actual claims experience in order to properly estimate the amounts necessary to settle future and existing claims on products sold as of the balance sheet date. Factors that could have an impact on the warranty accrual in any given period include the following: improved manufacturing quality, shifts in product mix, changes in warranty coverage periods, snowfall and its impact on snowmobile usage, product recalls and any significant changes in sales volume. While management believes that the warranty reserve is adequate and that the judgment applied is appropriate, such amounts estimated to be due and payable could differ materially from what will ultimately transpire in the future.
Product liability.
We are subject to product liability claims in the normal course of business. We carry excess insurance coverage for catastrophic product liability claims. We self-insure product liability claims up to the purchased catastrophic insurance coverage. The estimated costs resulting from any uninsured losses are charged to operating expenses when it is probable a loss has been incurred and the amount of the loss is reasonably determinable. We utilize historical trends and actuarial analysis tools, along with an analysis of current claims, to assist in determining the appropriate loss reserve levels. At
December 31, 2018
and
2017
, we had accruals of
$52.8 million
and
$37.7 million
, respectively, for the probable payment of pending claims related to continuing operations product liability litigation associated with our products. These accruals are included in other accrued expenses in the consolidated balance sheets. While management believes the product liability reserves are adequate, adverse determination of material product liability claims made against us could have a material adverse effect on our financial condition.
Goodwill.
Goodwill represents the excess of the cost of acquired businesses over the net of the fair value of identifiable tangible net assets and identifiable intangible assets purchased and liabilities assumed. Goodwill is tested at least annually for impairment and is tested for impairment more frequently if events or changes in circumstances indicate that the asset might be impaired. The impairment test is performed using a two-step process. In the first step, the fair value of each reporting unit is compared with the carrying amount of the reporting unit, including goodwill. If the estimated fair value is less than the carrying amount of the reporting unit there is an indication that goodwill impairment exists and a second step must be completed in order to determine the amount of the goodwill impairment, if any, that should be recorded. In the second step, an impairment loss is recognized for any excess of the carrying amount of the reporting
35
unit's goodwill over the implied fair value of that goodwill. The implied fair value of goodwill is determined by allocating the fair value of the reporting unit in a manner similar to a purchase price allocation.
The fair value of each reporting unit is determined using a discounted cash flow analysis and market approach.
In developing our discounted cash flow analysis, assumptions about future revenues and expenses, capital expenditures and changes in working capital are based on our annual operating plan and long-term business plan for each of our reporting units. These plans take into consideration numerous factors including historical experience, anticipated future economic conditions, changes in raw material prices and growth expectations for the industries and end markets we participate in. These assumptions are determined over a five year long-term planning period. The five year growth rates for revenues and operating profits vary for each reporting unit being evaluated. Revenues and operating profit beyond five years are projected to grow at a perpetual growth rate consistent with industry expectations. Discount rate assumptions for each reporting unit take into consideration our assessment of risks inherent in the future cash flows of the respective reporting unit and our weighted-average cost of capital.
In estimating fair value using the market approach, we identify a group of comparable publicly traded companies for each reporting unit that are similar in terms of size and product offering. These groups of comparable companies are used to develop multiples based on total market-based invested capital as a multiple of earnings before interest, taxes, depreciation and amortization ("EBITDA"). We determine our estimated values by applying these comparable EBITDA multiples to the operating results of our reporting units. The ultimate fair value of each reporting unit is determined considering the results of both valuation methods.
We complete our annual goodwill impairment evaluation as of the first day of the fourth quarter.
Identifiable intangible assets.
Our primary identifiable intangible assets include: dealer/customer relationships, brand/trade names, developed technology, and non-compete agreements. Identifiable intangibles with finite lives are amortized and those identifiable intangibles with indefinite lives are not amortized. Identifiable intangible assets that are subject to amortization are evaluated for impairment whenever events or changes in circumstances indicate that the carrying amount may not be recoverable. Identifiable intangible assets not subject to amortization are tested for impairment annually or more frequently if events warrant. We complete our annual impairment test as of the first day of the fourth quarter each year for those identifiable assets not subject to amortization.
The impairment test consists of a comparison of the fair value of the trade name with its carrying value. Fair value is measured using the relief-from-royalty method. This method assumes the trade name has value to the extent that the owner is relieved of the obligation to pay royalties for the benefits received from them. This method requires us to estimate the future revenue for the related brands, the appropriate royalty rate and the weighted average cost of capital.
New Accounting Pronouncements
See Item 8 of Part II, “Financial Statements and Supplementary Data—Note 1—Organization and Significant Accounting Policies
—New accounting pronouncements
.”
Item 7A. Quantitative and Qualitative Disclosures about Market Risk
Inflation, Foreign Exchange Rates, Equity Prices and Interest Rates
The changing relationships of the U.S. dollar to the Mexican peso, the Canadian dollar, the Australian dollar, the Euro, the Swiss franc and other foreign currencies have had a material impact from time to time. We actively manage our exposure to fluctuating foreign currency exchange rates by entering into foreign exchange hedging contracts.
Mexican Peso:
With increased production at our Monterrey, Mexico facility, our costs in the Mexican peso have continued to increase. We also market and sell to customers in Mexico through a wholly owned subsidiary. Fluctuations in the peso to U.S. dollar exchange rate primarily impacts sales, cost of sales, and net income.
Canadian Dollar:
We operate in Canada through a wholly owned subsidiary. The relationship of the U.S. dollar in relation to the Canadian dollar impacts both sales and net income.
Other currencies:
We operate in various countries, principally in Europe and Australia, through wholly owned subsidiaries and also sell to certain distributors in other countries. We also purchase components from certain suppliers
36
directly for our U.S. operations in transactions denominated in Euros and other foreign currencies. The relationship of the U.S. dollar in relation to these other currencies impacts each of sales, cost of sales and net income.
At
December 31, 2018
, we had the following open foreign currency hedging contracts:
|
Foreign Currency
|
Foreign currency hedging contracts
|
|||||||
|
Currency Position
|
Notional amounts (in thousands of U.S. dollars)
|
Average exchange rate of open contracts
|
||||||
|
Canadian Dollar
|
Long
|
$
|
55,133
|
|
$0.77 to 1 CAD
|
|||
|
Mexican Peso
|
Short
|
19,222
|
|
21 Peso to $1
|
||||
The assets and liabilities in all our foreign entities are translated at the foreign exchange rate in effect at the balance sheet date. Translation gains and losses are reflected as a component of accumulated other comprehensive loss, net in the shareholders’ equity section of the accompanying consolidated balance sheets. Revenues and expenses in all of our foreign entities are translated at the average foreign exchange rate in effect for each month of the year. Certain assets and liabilities related to intercompany positions reported on our consolidated balance sheet that are denominated in a currency other than the entity’s functional currency are translated at the foreign exchange rates at the balance sheet date and the associated gains and losses are included in net income. In 2018, after consideration of the existing foreign currency hedging contracts, foreign currencies had a slightly favorable impact on net income compared to 2017. We expect currencies to have a negative impact on net income in 2019 compared to 2018.
We are subject to market risk from fluctuating market prices of certain purchased commodities and raw materials, including steel, aluminum, petroleum-based resins, certain rare earth metals and diesel fuel. In addition, we are a purchaser of components and parts containing various commodities, including steel, aluminum, rubber and others, which are integrated into the Company’s end products. While such materials are typically available from numerous suppliers, commodity raw materials are subject to price fluctuations. We generally buy these commodities and components based upon market prices that are established with the vendor as part of the purchase process and from time to time will enter into derivative contracts to hedge a portion of the exposure to commodity risk. At
December 31, 2018
, we did not have any outstanding commodity derivative contracts in place. Based on our current outlook for commodity prices, the total impact of commodities is expected to have a negative impact on our gross margins for
2019
when compared to
2018
.
We are a party to a credit agreement with various lenders consisting of a
$700 million
revolving loan facility and a
$1,180.0 million
term loan facility. Interest accrues on the revolving loan at variable rates based on LIBOR or “prime” plus the applicable add-on percentage as defined. At
December 31, 2018
, we had an outstanding balance of
$187.6 million
on the revolving loan, and an outstanding balance of
$1,150.0 million
on the term loan. Assuming no additional borrowings or payments on the debt, a one-percent fluctuation in interest rates would have had an approximate
$11.0 million
impact to interest expense in
2018
.
37
INDEX TO FINANCIAL STATEMENTS
|
Page
|
|
38
Item 8. Financial Statements and Supplementary Data
Management’s Report on Internal Control over Financial Reporting
Management is responsible for establishing and maintaining an adequate system of internal control over financial reporting of the Company. This system is designed to provide reasonable assurance regarding the reliability of financial reporting and the preparation of financial statements for external purposes in accordance with United States generally accepted accounting principles.
Our internal control over financial reporting includes those policies and procedures that (1) pertain to the maintenance of records that, in reasonable detail, accurately and fairly reflect the transactions and dispositions of the assets of the Company; (2) provide reasonable assurance that transactions are recorded as necessary to permit preparation of financial statements in accordance with generally accepted accounting principles, and that receipts and expenditures of the Company are being made only in accordance with authorizations of management and directors of the Company; and (3) provide reasonable assurance regarding prevention or timely detection of unauthorized acquisition, use, or disposition of the Company’s assets that could have a material effect on the financial statements.
Because of its inherent limitations, internal control over financial reporting may not prevent or detect misstatements. Also, projections of any evaluation of effectiveness to future periods are subject to the risk that controls may become inadequate because of changes in conditions, or that the degree of compliance with the policies or procedures may deteriorate.
Management conducted an evaluation of the effectiveness of the system of internal control over financial reporting as of
December 31, 2018
. In making this evaluation, management used the criteria set forth by the Committee of Sponsoring Organizations of the Treadway Commission (COSO) in Internal Control—2013 Integrated Framework. Based on management’s evaluation and those criteria, management concluded that the Company’s system of internal control over financial reporting was effective as of
December 31, 2018
.
Management has excluded from its assessment the internal control over financial reporting at Polaris Boats, LLC (formerly known as Boat Holdings, LLC), which was acquired on July 2, 2018, and other 2018 acquisitions, whose collective financial statements constitute three percent of total assets, five percent of revenues and three percent of operating income of the consolidated financial statement amounts as of and for the year ended December 31, 2018.
Management’s internal control over financial reporting as of
December 31, 2018
has been audited by Ernst & Young LLP, an independent registered public accounting firm, as stated in their report appearing on the following page, in which they expressed an unqualified opinion thereon.
|
/
S
/ S
COTT
W. W
INE
|
|
Scott W. Wine
|
|
Chairman and Chief Executive Officer
|
|
/
S
/ M
ICHAEL
T. S
PEETZEN
|
|
Michael T. Speetzen
|
|
Executive Vice President—Finance and
|
|
Chief Financial Officer
|
February 14, 2019
Further discussion of our internal controls and procedures is included in Item 9A of this report, under the caption “Controls and Procedures.”
39
Report of Independent Registered Public Accounting Firm
The Shareholders and Board of Directors of
Polaris Industries Inc.
Opinion on Internal Control over Financial Reporting
We have audited Polaris Industries Inc.’s internal control over financial reporting as of December 31, 2018, based on criteria established in Internal Control-Integrated Framework issued by the Committee of Sponsoring Organizations of the Treadway Commission (2013 framework) (the COSO criteria). In our opinion, Polaris Industries Inc. (the Company) maintained, in all material respects, effective internal control over financial reporting as of December 31, 2018, based on the COSO criteria.
As indicated in the accompanying Management’s Report on Internal Control over Financial Reporting, management’s assessment of and conclusion on the effectiveness of internal control over financial reporting did not include the internal controls of Polaris Boats, LLC (formerly known as Boat Holdings, LLC) and other 2018 acquisitions, which are included in the 2018 consolidated financial statements of the Company and constituted three percent of total assets as of December 31, 2018 and five percent and three percent of revenues and operating income, respectively, for the year then ended. Our audit of internal control over financial reporting of the Company also did not include an evaluation of the internal control over financial reporting of Polaris Boats, LLC and the other 2018 acquisitions.
We also have audited, in accordance with the standards of the Public Company Accounting Oversight Board (United States) (PCAOB), the consolidated balance sheets of Polaris Industries Inc. as of December 31, 2018 and 2017, and the related consolidated statements of income, comprehensive income, shareholders’ equity, and cash flows for each of the three years in the period ended December 31, 2018, and the related notes and the financial statement schedule listed in the Index at Item 15(a), and our report dated
February 14, 2019
expressed an unqualified opinion thereon.
Basis for Opinion
The Company’s management is responsible for maintaining effective internal control over financial reporting, and for its assessment of the effectiveness of internal control over financial reporting included in the accompanying Management’s Report on Internal Control over Financial Reporting. Our responsibility is to express an opinion on the Company’s internal control over financial reporting based on our audit. We are a public accounting firm registered with the PCAOB and are required to be independent with respect to the Company in accordance with the U.S. federal securities laws and the applicable rules and regulations of the Securities and Exchange Commission and the PCAOB.
We conducted our audit in accordance with the standards of the PCAOB. Those standards require that we plan and perform the audit to obtain reasonable assurance about whether effective internal control over financial reporting was maintained in all material respects.
Our audit included obtaining an understanding of internal control over financial reporting, assessing the risk that a material weakness exists, testing and evaluating the design and operating effectiveness of internal control based on the assessed risk, and performing such other procedures as we considered necessary in the circumstances. We believe that our audit provides a reasonable basis for our opinion.
Definition and Limitations of Internal Control Over Financial Reporting
A company’s internal control over financial reporting is a process designed to provide reasonable assurance regarding the reliability of financial reporting and the preparation of financial statements for external purposes in accordance with generally accepted accounting principles. A company’s internal control over financial reporting includes those policies and procedures that (1) pertain to the maintenance of records that, in reasonable detail, accurately and fairly reflect the transactions and dispositions of the assets of the company; (2) provide reasonable assurance that transactions are recorded as necessary to permit preparation of financial statements in accordance with generally accepted accounting principles, and that receipts and expenditures of the company are being made only in accordance with authorizations of management and directors of the company; and (3) provide reasonable assurance regarding prevention or timely detection of unauthorized acquisition, use, or disposition of the company’s assets that could have a material effect on the financial statements.
Because of its inherent limitations, internal control over financial reporting may not prevent or detect misstatements. Also, projections of any evaluation of effectiveness to future periods are subject to the risk that controls may become inadequate because of changes in conditions, or that the degree of compliance with the policies or procedures may deteriorate.
/s/ Ernst & Young LLP
Minneapolis, Minnesota
February 14, 2019
40
Report of Independent Registered Public Accounting Firm
The Shareholders and Board of Directors of
Polaris Industries Inc.
Opinion on the Financial Statements
We have audited the accompanying consolidated balance sheets of Polaris Industries Inc. (the Company) as of December 31, 2018 and 2017, and the related consolidated statements of income, comprehensive income, shareholders’ equity, and cash flows for each of the three years in the period ended December 31, 2018, and the related notes and the financial statement schedule listed in the Index at Item 15(a) (collectively referred to as the “consolidated financial statements”). In our opinion, the consolidated financial statements present fairly, in all material respects, the financial position of the Company at December 31, 2018 and 2017, and the results of its operations and its cash flows for each of the three years in the period ended December 31, 2018, in conformity with U.S. generally accepted accounting principles.
We also have audited, in accordance with the standards of the Public Company Accounting Oversight Board (United States) (PCAOB), the Company’s internal control over financial reporting as of December 31, 2018, based on criteria established in Internal Control-Integrated Framework, issued by the Committee of Sponsoring Organizations of the Treadway Commission (2013 framework) and our report dated
February 14, 2019
expressed an unqualified opinion thereon.
Basis for Opinion
These financial statements are the responsibility of the Company’s management. Our responsibility is to express an opinion on the Company’s financial statements based on our audits. We are a public accounting firm registered with the PCAOB and are required to be independent with respect to the Company in accordance with the U.S. federal securities laws and the applicable rules and regulations of the Securities and Exchange Commission and the PCAOB.
We conducted our audits in accordance with the standards of the PCAOB. Those standards require that we plan and perform the audit to obtain reasonable assurance about whether the financial statements are free of material misstatement, whether due to error or fraud. Our audits included performing procedures to asses the risks of material misstatement of the financial statements whether due to error or fraud, and performing procedures that respond to those risks. Such procedures included examining, on a test basis, evidence regarding the amounts and disclosures in the financial statements. Our audits also included evaluating the accounting principles used and significant estimates made by management, as well as evaluating the overall presentation of the financial statements. We believe that our audits provide a reasonable basis for our opinion.
/s/ Ernst & Young LLP
We have served as the Company’s auditor since 2002.
Minneapolis, Minnesota
February 14, 2019
41
|
POLARIS INDUSTRIES INC.
CONSOLIDATED BALANCE SHEETS
(In thousands, except per share data)
|
|||||||
|
Assets
|
December 31, 2018
|
December 31, 2017
|
|||||
|
Current Assets:
|
|||||||
|
Cash and cash equivalents
|
$
|
161,164
|
|
$
|
138,345
|
|
|
|
Trade receivables, net
|
197,082
|
|
200,144
|
|
|||
|
Inventories, net
|
969,511
|
|
783,961
|
|
|||
|
Prepaid expenses and other
|
121,472
|
|
101,453
|
|
|||
|
Income taxes receivable
|
36,474
|
|
29,601
|
|
|||
|
Total current assets
|
1,485,703
|
|
1,253,504
|
|
|||
|
Property and equipment:
|
|||||||
|
Land, buildings and improvements
|
462,224
|
|
410,604
|
|
|||
|
Equipment and tooling
|
1,245,312
|
|
1,137,183
|
|
|||
|
1,707,536
|
|
1,547,787
|
|
||||
|
Less: accumulated depreciation
|
(864,414
|
)
|
(800,598
|
)
|
|||
|
Property and equipment, net
|
843,122
|
|
747,189
|
|
|||
|
Investment in finance affiliate
|
92,059
|
|
88,764
|
|
|||
|
Deferred tax assets
|
87,474
|
|
115,511
|
|
|||
|
Goodwill and other intangible assets, net
|
1,517,594
|
|
780,586
|
|
|||
|
Other long-term assets
|
98,963
|
|
104,039
|
|
|||
|
Total assets
|
$
|
4,124,915
|
|
$
|
3,089,593
|
|
|
|
Liabilities and Shareholders’ Equity
|
|||||||
|
Current liabilities:
|
|||||||
|
Current portion of debt, capital lease obligations, and notes payable
|
$
|
66,543
|
|
$
|
47,746
|
|
|
|
Accounts payable
|
346,294
|
|
317,377
|
|
|||
|
Accrued expenses:
|
|||||||
|
Compensation
|
167,857
|
|
168,014
|
|
|||
|
Warranties
|
121,824
|
|
123,840
|
|
|||
|
Sales promotions and incentives
|
167,621
|
|
162,298
|
|
|||
|
Dealer holdback
|
125,003
|
|
114,196
|
|
|||
|
Other
|
197,687
|
|
186,103
|
|
|||
|
Income taxes payable
|
4,545
|
|
10,737
|
|
|||
|
Total current liabilities
|
1,197,374
|
|
1,130,311
|
|
|||
|
Long-term income taxes payable
|
28,602
|
|
20,114
|
|
|||
|
Capital lease obligations
|
16,140
|
|
18,351
|
|
|||
|
Long-term debt
|
1,879,887
|
|
846,915
|
|
|||
|
Deferred tax liabilities
|
6,490
|
|
10,128
|
|
|||
|
Other long-term liabilities
|
122,570
|
|
120,398
|
|
|||
|
Total liabilities
|
$
|
3,251,063
|
|
$
|
2,146,217
|
|
|
|
Deferred compensation
|
6,837
|
|
11,717
|
|
|||
|
Shareholders’ equity:
|
|||||||
|
Preferred stock $0.01 par value, 20,000 shares authorized, no shares issued and outstanding
|
—
|
|
—
|
|
|||
|
Common stock $0.01 par value, 160,000 shares authorized, 60,890 and 63,075 shares issued and outstanding, respectively
|
$
|
609
|
|
$
|
631
|
|
|
|
Additional paid-in capital
|
807,986
|
|
733,894
|
|
|||
|
Retained earnings
|
121,393
|
|
242,763
|
|
|||
|
Accumulated other comprehensive loss, net
|
(62,973
|
)
|
(45,629
|
)
|
|||
|
Total shareholders’ equity
|
867,015
|
|
931,659
|
|
|||
|
Total liabilities and shareholders’ equity
|
$
|
4,124,915
|
|
$
|
3,089,593
|
|
|
The accompanying footnotes are an integral part of these consolidated statements.
42
|
POLARIS INDUSTRIES INC.
CONSOLIDATED STATEMENTS OF INCOME
(In thousands, except per share data)
|
|||||||||||
|
For the Years Ended December 31,
|
|||||||||||
|
2018
|
2017
|
2016
|
|||||||||
|
Sales
|
$
|
6,078,540
|
|
$
|
5,428,477
|
|
$
|
4,516,629
|
|
||
|
Cost of sales
|
4,577,340
|
|
4,103,826
|
|
3,411,006
|
|
|||||
|
Gross profit
|
1,501,200
|
|
1,324,651
|
|
1,105,623
|
|
|||||
|
Operating expenses:
|
|||||||||||
|
Selling and marketing
|
491,773
|
|
471,805
|
|
342,235
|
|
|||||
|
Research and development
|
259,682
|
|
238,299
|
|
185,126
|
|
|||||
|
General and administrative
|
349,763
|
|
331,196
|
|
306,442
|
|
|||||
|
Total operating expenses
|
1,101,218
|
|
1,041,300
|
|
833,803
|
|
|||||
|
Income from financial services
|
87,430
|
|
76,306
|
|
78,458
|
|
|||||
|
Operating income
|
487,412
|
|
359,657
|
|
350,278
|
|
|||||
|
Non-operating expense:
|
|||||||||||
|
Interest expense
|
56,967
|
|
32,155
|
|
16,319
|
|
|||||
|
Equity in loss of other affiliates
|
29,252
|
|
6,760
|
|
6,873
|
|
|||||
|
Other (income) expense, net
|
(28,056
|
)
|
1,951
|
|
13,835
|
|
|||||
|
Income before income taxes
|
429,249
|
|
318,791
|
|
313,251
|
|
|||||
|
Provision for income taxes
|
93,992
|
|
146,299
|
|
100,303
|
|
|||||
|
Net income
|
$
|
335,257
|
|
$
|
172,492
|
|
$
|
212,948
|
|
||
|
Net income per share:
|
|||||||||||
|
Basic
|
$
|
5.36
|
|
$
|
2.74
|
|
$
|
3.31
|
|
||
|
Diluted
|
$
|
5.24
|
|
$
|
2.69
|
|
$
|
3.27
|
|
||
|
Weighted average shares outstanding:
|
|||||||||||
|
Basic
|
62,513
|
|
62,916
|
|
64,296
|
|
|||||
|
Diluted
|
63,949
|
|
64,180
|
|
65,158
|
|
|||||
The accompanying footnotes are an integral part of these consolidated statements.
43
POLARIS INDUSTRIES INC.
CONSOLIDATED STATEMENTS OF COMPREHENSIVE INCOME
(In thousands)
|
For the Years Ended December 31,
|
|||||||||||
|
2018
|
2017
|
2016
|
|||||||||
|
Net income
|
$
|
335,257
|
|
$
|
172,492
|
|
$
|
212,948
|
|
||
|
Other comprehensive income (loss), net of tax:
|
|||||||||||
|
Foreign currency translation adjustments
|
(18,062
|
)
|
41,691
|
|
(19,773
|
)
|
|||||
|
Unrealized gain (loss) on derivative instruments
|
457
|
|
(330
|
)
|
(1,572
|
)
|
|||||
|
Retirement benefit plan activity
|
261
|
|
(3,153
|
)
|
—
|
|
|||||
|
Comprehensive income
|
$
|
317,913
|
|
$
|
210,700
|
|
$
|
191,603
|
|
||
The accompanying footnotes are an integral part of these consolidated statements.
44
|
POLARIS INDUSTRIES INC.
CONSOLIDATED STATEMENTS OF SHAREHOLDERS’ EQUITY
(In thousands, except per share data)
|
||||||||||||||||||||||
|
Number
of Shares |
Common
Stock |
Additional
Paid- In Capital |
Retained
Earnings |
Accumulated Other
Comprehensive Income (loss) |
Total
|
|||||||||||||||||
|
Balance, December 31, 2015
|
65,309
|
|
$
|
653
|
|
$
|
596,143
|
|
$
|
447,173
|
|
$
|
(62,492
|
)
|
$
|
981,477
|
|
|||||
|
Employee stock compensation
|
303
|
|
3
|
|
57,924
|
|
—
|
|
—
|
|
57,927
|
|
||||||||||
|
Deferred compensation
|
—
|
|
—
|
|
1,379
|
|
(462
|
)
|
—
|
|
917
|
|
||||||||||
|
Proceeds from stock issuances under employee plans
|
405
|
|
4
|
|
17,686
|
|
—
|
|
—
|
|
17,690
|
|
||||||||||
|
Tax effect of exercise of stock options
|
—
|
|
—
|
|
3,578
|
|
—
|
|
—
|
|
3,578
|
|
||||||||||
|
Cash dividends declared ($2.20 per share)
|
—
|
|
—
|
|
—
|
|
(140,336
|
)
|
—
|
|
(140,336
|
)
|
||||||||||
|
Repurchase and retirement of common shares
|
(2,908
|
)
|
(29
|
)
|
(26,548
|
)
|
(219,239
|
)
|
—
|
|
(245,816
|
)
|
||||||||||
|
Net income
|
—
|
|
—
|
|
—
|
|
212,948
|
|
—
|
|
212,948
|
|
||||||||||
|
Other comprehensive gain (loss)
|
—
|
|
—
|
|
—
|
|
—
|
|
(21,345
|
)
|
(21,345
|
)
|
||||||||||
|
Balance, December 31, 2016
|
63,109
|
|
631
|
|
650,162
|
|
300,084
|
|
(83,837
|
)
|
867,040
|
|
||||||||||
|
Employee stock compensation
|
60
|
|
1
|
|
50,053
|
|
—
|
|
—
|
|
50,054
|
|
||||||||||
|
Deferred compensation
|
—
|
|
—
|
|
1,536
|
|
(4,525
|
)
|
—
|
|
(2,989
|
)
|
||||||||||
|
Proceeds from stock issuances under employee plans
|
934
|
|
9
|
|
42,729
|
|
—
|
|
—
|
|
42,738
|
|
||||||||||
|
Cash dividends declared ($2.32 per share)
|
—
|
|
—
|
|
—
|
|
(145,423
|
)
|
—
|
|
(145,423
|
)
|
||||||||||
|
Repurchase and retirement of common shares
|
(1,028
|
)
|
(10
|
)
|
(10,586
|
)
|
(79,865
|
)
|
—
|
|
(90,461
|
)
|
||||||||||
|
Net income
|
—
|
|
—
|
|
—
|
|
172,492
|
|
—
|
|
172,492
|
|
||||||||||
|
Other comprehensive gain (loss)
|
—
|
|
—
|
|
—
|
|
—
|
|
38,208
|
|
38,208
|
|
||||||||||
|
Balance, December 31, 2017
|
63,075
|
|
631
|
|
733,894
|
|
242,763
|
|
(45,629
|
)
|
931,659
|
|
||||||||||
|
Employee stock compensation
|
245
|
|
2
|
|
63,964
|
|
—
|
|
—
|
|
63,966
|
|
||||||||||
|
Deferred compensation
|
—
|
|
—
|
|
111
|
|
4,769
|
|
—
|
|
4,880
|
|
||||||||||
|
Proceeds from stock issuances under employee plans
|
754
|
|
8
|
|
47,084
|
|
—
|
|
—
|
|
47,092
|
|
||||||||||
|
Cash dividends declared ($2.40 per share)
|
—
|
|
—
|
|
—
|
|
(149,032
|
)
|
—
|
|
(149,032
|
)
|
||||||||||
|
Repurchase and retirement of common shares
|
(3,184
|
)
|
(32
|
)
|
(37,066
|
)
|
(311,565
|
)
|
—
|
|
(348,663
|
)
|
||||||||||
|
Other activity
|
—
|
|
—
|
|
(1
|
)
|
(799
|
)
|
—
|
|
(800
|
)
|
||||||||||
|
Net income
|
—
|
|
—
|
|
—
|
|
335,257
|
|
—
|
|
335,257
|
|
||||||||||
|
Other comprehensive gain (loss)
|
—
|
|
—
|
|
—
|
|
—
|
|
(17,344
|
)
|
(17,344
|
)
|
||||||||||
|
Balance, December 31, 2018
|
60,890
|
|
$
|
609
|
|
$
|
807,986
|
|
$
|
121,393
|
|
$
|
(62,973
|
)
|
$
|
867,015
|
|
|||||
The accompanying footnotes are an integral part of these consolidated statements.
45
|
POLARIS INDUSTRIES INC.
CONSOLIDATED STATEMENTS OF CASH FLOWS
(In thousands)
|
|||||||||||
|
For the Years Ended December 31,
|
|||||||||||
|
2018
|
2017
|
2016
|
|||||||||
|
Operating Activities:
|
|||||||||||
|
Net income
|
$
|
335,257
|
|
$
|
172,492
|
|
$
|
212,948
|
|
||
|
Adjustments to reconcile net income to net cash provided by operating activities:
|
|||||||||||
|
Depreciation and amortization
|
211,036
|
|
191,108
|
|
167,512
|
|
|||||
|
Noncash compensation
|
63,966
|
|
50,054
|
|
57,927
|
|
|||||
|
Noncash income from financial services
|
(30,130
|
)
|
(27,027
|
)
|
(30,116
|
)
|
|||||
|
Deferred income taxes
|
23,440
|
|
73,614
|
|
(26,056
|
)
|
|||||
|
Excess tax benefits from share-based compensation
|
—
|
|
—
|
|
(3,578
|
)
|
|||||
|
Impairment charges
|
24,263
|
|
25,395
|
|
—
|
|
|||||
|
Other, net
|
(8,489
|
)
|
3,401
|
|
13,462
|
|
|||||
|
Changes in operating assets and liabilities:
|
|||||||||||
|
Trade receivables
|
20,686
|
|
(17,064
|
)
|
2,030
|
|
|||||
|
Inventories
|
(149,701
|
)
|
(26,958
|
)
|
111,999
|
|
|||||
|
Accounts payable
|
(984
|
)
|
39,516
|
|
(62,693
|
)
|
|||||
|
Accrued expenses
|
7,170
|
|
94,557
|
|
145,261
|
|
|||||
|
Income taxes payable/receivable
|
(4,490
|
)
|
23,410
|
|
(1,997
|
)
|
|||||
|
Prepaid expenses and other, net
|
(14,912
|
)
|
(17,090
|
)
|
2,929
|
|
|||||
|
Net cash provided by operating activities
|
477,112
|
|
585,408
|
|
589,628
|
|
|||||
|
Investing Activities:
|
|||||||||||
|
Purchase of property and equipment
|
(225,414
|
)
|
(184,388
|
)
|
(209,137
|
)
|
|||||
|
Investment in finance affiliate
|
(12,289
|
)
|
(25,230
|
)
|
(8,641
|
)
|
|||||
|
Distributions from finance affiliate
|
39,125
|
|
57,502
|
|
43,820
|
|
|||||
|
Investment in other affiliates
|
(1,113
|
)
|
(625
|
)
|
(11,595
|
)
|
|||||
|
Acquisition and disposal of businesses, net of cash acquired
|
(759,801
|
)
|
1,645
|
|
(723,705
|
)
|
|||||
|
Net cash used for investing activities
|
(959,492
|
)
|
(151,096
|
)
|
(909,258
|
)
|
|||||
|
Financing Activities:
|
|||||||||||
|
Borrowings under debt arrangements / capital lease obligations
|
3,553,237
|
|
2,186,939
|
|
3,232,137
|
|
|||||
|
Repayments under debt arrangements / capital lease obligations
|
(2,579,495
|
)
|
(2,421,473
|
)
|
(2,552,760
|
)
|
|||||
|
Repurchase and retirement of common shares
|
(348,663
|
)
|
(90,461
|
)
|
(245,816
|
)
|
|||||
|
Cash dividends to shareholders
|
(149,032
|
)
|
(145,423
|
)
|
(140,336
|
)
|
|||||
|
Proceeds from stock issuances under employee plans
|
47,371
|
|
42,738
|
|
17,690
|
|
|||||
|
Excess tax benefits from share-based compensation
|
—
|
|
—
|
|
3,578
|
|
|||||
|
Net cash provided by (used for) financing activities
|
523,418
|
|
(427,680
|
)
|
314,493
|
|
|||||
|
Impact of currency exchange rates on cash balances
|
(9,530
|
)
|
9,816
|
|
(5,042
|
)
|
|||||
|
Net increase (decrease) in cash, cash equivalents and restricted cash
|
31,508
|
|
16,448
|
|
(10,179
|
)
|
|||||
|
Cash, cash equivalents and restricted cash at beginning of period
|
161,618
|
|
145,170
|
|
155,349
|
|
|||||
|
Cash, cash equivalents and restricted cash at end of period
|
$
|
193,126
|
|
$
|
161,618
|
|
$
|
145,170
|
|
||
|
Supplemental Cash Flow Information:
|
|||||||||||
|
Interest paid on debt borrowings
|
$
|
51,014
|
|
$
|
30,884
|
|
$
|
15,833
|
|
||
|
Income taxes paid
|
$
|
73,999
|
|
$
|
46,308
|
|
$
|
126,799
|
|
||
|
The following presents cash, cash equivalents and restricted cash by category within the consolidated balance sheets:
|
|||||||||||
|
Cash and cash equivalents
|
$
|
161,164
|
|
$
|
138,345
|
|
$
|
127,325
|
|
||
|
Other long-term assets
|
31,962
|
|
23,273
|
|
17,845
|
|
|||||
|
Total
|
$
|
193,126
|
|
$
|
161,618
|
|
$
|
145,170
|
|
||
The accompanying footnotes are an integral part of these consolidated statements.
46
POLARIS INDUSTRIES INC.
NOTES TO CONSOLIDATED FINANCIAL STATEMENTS
Note 1.
Organization and Significant Accounting Policies
Polaris Industries Inc. (“Polaris” or the “Company”), a Minnesota corporation, and its subsidiaries are engaged in the design, engineering, manufacturing and marketing of innovative, high-quality, high-performance Off-Road Vehicles (ORV), Snowmobiles, Motorcycles, Global Adjacent Markets vehicles, and Boats. Polaris products, together with related parts, garments and accessories, as well as aftermarket accessories and apparel, are sold worldwide through a network of independent dealers and distributors, retail stores and its subsidiaries. The primary markets for the Company’s products are the United States, Canada, Western Europe, Australia and Mexico.
Basis of presentation.
The accompanying consolidated financial statements include the accounts of Polaris and its wholly-owned subsidiaries. All intercompany transactions and balances have been eliminated in consolidation. Income from financial services is reported as a component of operating income to better reflect income from ongoing operations, of which financial services has a significant impact.
The Company evaluates consolidation of entities under Accounting Standards Codification (ASC) Topic 810. This Topic requires management to evaluate whether an entity or interest is a variable interest entity and whether the company is the primary beneficiary. Polaris used the guidelines to analyze the Company’s relationships, including its relationship with Polaris Acceptance, and concluded that there were no variable interest entities requiring consolidation by the Company.
Use of estimates.
The preparation of financial statements in conformity with accounting principles generally accepted in the United States requires management to make estimates and assumptions that affect the reported amounts of assets and liabilities and disclosure of contingent assets and liabilities at the date of the financial statements and the reported amounts of revenues and expenses during the reporting period. Ultimate results could differ from those estimates.
Fair value measurements.
Fair value is the exchange price that would be received for an asset or paid to transfer a liability (an exit price) in the principal or most advantageous market for the asset or liability in an orderly transaction between market participants on the measurement date. Assets and liabilities measured at fair value are classified using the following hierarchy, which is based upon the transparency of inputs to the valuation as of the measurement date:
Level 1
— Quoted prices in active markets for identical assets or liabilities.
Level 2
— Observable inputs other than Level 1 prices such as quoted prices for similar assets or liabilities; quoted prices in markets that are not active; or other inputs that are observable or can be corroborated by observable market data for substantially the full term of the assets or liabilities.
Level 3
— Unobservable inputs that are supported by little or no market activity and that are significant to the fair value of the assets or liabilities.
In making fair value measurements, observable market data must be used when available. When inputs used to measure fair value fall within different levels of the hierarchy, the level within which the fair value measurement is categorized is based on the lowest level input that is significant to the fair value measurement. The Company utilizes the market approach to measure fair value for its non-qualified deferred compensation assets and liabilities, and the income approach for the foreign currency contracts and commodity contracts. The market approach uses prices and other relevant information generated by market transactions involving identical or comparable assets or liabilities, and for the income approach the Company uses significant other observable inputs to value its derivative instruments used to hedge interest rate volatility, foreign currency and commodity transactions.
47
Assets and liabilities measured at fair value on a recurring basis are summarized below (in thousands):
|
|
Fair Value Measurements as of December 31, 2018
|
||||||||||||||
|
Asset (Liability)
|
Total
|
Level 1
|
Level 2
|
Level 3
|
|||||||||||
|
Non-qualified deferred compensation assets
|
$
|
48,545
|
|
$
|
48,545
|
|
$
|
—
|
|
$
|
—
|
|
|||
|
Foreign exchange contracts, net
|
3,128
|
|
—
|
|
3,128
|
|
—
|
|
|||||||
|
Total assets at fair value
|
$
|
51,673
|
|
$
|
48,545
|
|
$
|
3,128
|
|
$
|
—
|
|
|||
|
Non-qualified deferred compensation liabilities
|
$
|
(48,545
|
)
|
$
|
(48,545
|
)
|
$
|
—
|
|
$
|
—
|
|
|||
|
Interest rate contracts, net
|
(2,665
|
)
|
—
|
|
(2,665
|
)
|
—
|
|
|||||||
|
Total liabilities at fair value
|
$
|
(51,210
|
)
|
$
|
(48,545
|
)
|
$
|
(2,665
|
)
|
$
|
—
|
|
|||
|
|
Fair Value Measurements as of December 31, 2017
|
||||||||||||||
|
Asset (Liability)
|
Total
|
Level 1
|
Level 2
|
Level 3
|
|||||||||||
|
Non-qualified deferred compensation assets
|
$
|
54,244
|
|
$
|
54,244
|
|
$
|
—
|
|
$
|
—
|
|
|||
|
Total assets at fair value
|
$
|
54,244
|
|
$
|
54,244
|
|
$
|
—
|
|
$
|
—
|
|
|||
|
Non-qualified deferred compensation liabilities
|
$
|
(54,244
|
)
|
$
|
(54,244
|
)
|
$
|
—
|
|
$
|
—
|
|
|||
|
Foreign exchange contracts, net
|
(426
|
)
|
—
|
|
(426
|
)
|
—
|
|
|||||||
|
Total liabilities at fair value
|
$
|
(54,670
|
)
|
$
|
(54,244
|
)
|
$
|
(426
|
)
|
$
|
—
|
|
|||
Fair value of other financial instruments.
The carrying values of the Company’s short-term financial instruments, including cash and cash equivalents, trade receivables and short-term debt, including current maturities of long-term debt, capital lease obligations and notes payable, approximate their fair values. At
December 31, 2018
and
December 31, 2017
, the fair value of the Company’s long-term debt, capital lease obligations and notes payable was approximately
$2,013,684,000
and
$922,123,000
, respectively, and was determined using Level 2 inputs, including quoted market prices or discounted cash flows based on quoted market rates for similar types of debt. The carrying value of long-term debt, capital lease obligations and notes payable including current maturities was
$1,962,570,000
and
$913,012,000
as of
December 31, 2018
and
December 31, 2017
, respectively.
Polaris measures certain assets and liabilities at fair value on a nonrecurring basis. Assets acquired and liabilities assumed as part of acquisitions are measured at fair value. Refer to Notes 3 and 7 for additional information. Polaris will impair or write off an investment and recognize a loss when events or circumstances indicate there is impairment in the investment that is other-than-temporary. The amount of loss is determined by measuring the investment at fair value. Refer to Note 11 for additional information.
Cash equivalents.
Polaris considers all highly liquid investments purchased with an original maturity of
90
days or less to be cash equivalents. Cash equivalents are stated at cost, which approximates fair value. Such investments consist principally of money market mutual funds.
Restricted cash and cash equivalents.
The Company classifies amounts of cash and cash equivalents that are restricted in terms of their use and withdrawal separately within other long-term assets on the consolidated balance sheets.
Allowance for doubtful accounts.
Polaris’ financial exposure to collection of accounts receivable is limited due to its agreements with certain finance companies. For receivables not serviced through these finance companies, the Company provides a reserve for doubtful accounts based on historical rates and trends. This reserve is adjusted periodically as information about specific accounts becomes available.
48
Inventories.
Inventory costs include material, labor, and manufacturing overhead costs, including depreciation expense associated with the manufacture and distribution of the Company’s products. Inventories are stated at the lower of cost (first-in, first-out method) or net realizable value. The major components of inventories are as follows (in thousands):
|
December 31, 2018
|
December 31, 2017
|
||||||
|
Raw materials and purchased components
|
$
|
233,258
|
|
$
|
194,108
|
|
|
|
Service parts, garments and accessories
|
342,593
|
|
307,684
|
|
|||
|
Finished goods
|
442,003
|
|
329,288
|
|
|||
|
Less: reserves
|
(48,343
|
)
|
(47,119
|
)
|
|||
|
Inventories
|
$
|
969,511
|
|
$
|
783,961
|
|
|
Investment in finance affiliate.
The caption investment in finance affiliate in the consolidated balance sheets represents Polaris’
fifty
percent equity interest in Polaris Acceptance, a partnership agreement between Wells Fargo Commercial Distribution Finance Corporation and one of Polaris’ wholly-owned subsidiaries. Polaris Acceptance provides floor plan financing to Polaris dealers in the United States. Polaris’ investment in Polaris Acceptance is accounted for under the equity method, and is recorded as investment in finance affiliate in the consolidated balance sheets. Polaris’ allocable share of the income of Polaris Acceptance has been included as a component of income from financial services in the consolidated statements of income. Refer to Note 10 for additional information regarding Polaris’ investment in Polaris Acceptance.
Investment in other affiliates.
Polaris’ investment in other affiliates is included within Other long-term assets in the consolidated balance sheets, and represents the Company’s investment in nonmarketable securities of strategic companies. For each investment, Polaris assesses the level of influence in determining whether to account for the investment under the cost method or equity method. For equity method investments, Polaris’ proportionate share of income or losses is recorded in the consolidated statements of income. Polaris will write down or write off an investment and recognize a loss if and when events or circumstances indicate there is impairment in the investment that is other-than-temporary. Refer to Note 11 for additional information regarding Polaris’ investment in other affiliates.
Property and equipment.
Property and equipment is stated at cost. Depreciation is provided using the straight-line method over the estimated useful life of the respective assets, ranging from
10
-
40
years for buildings and improvements and from
1
-
7
years for equipment and tooling. Depreciation of assets recorded under capital leases is included with depreciation expense. Fully depreciated tooling is eliminated from the accounting records annually.
Goodwill and other intangible assets.
Goodwill represents the excess of the cost of acquired businesses over the net of the fair value of identifiable tangible net assets and identifiable intangible assets purchased and liabilities assumed. Goodwill is tested at least annually for impairment and is tested for impairment more frequently if events or changes in circumstances indicate that the asset might be impaired. The impairment test is performed using a two-step process. In the first step, the fair value of each reporting unit is compared with the carrying amount of the reporting unit, including goodwill. The fair value of each reporting unit is determined using a discounted cash flow analysis and market approach. If the estimated fair value is less than the carrying amount of the reporting unit there is an indication that goodwill impairment exists and a second step must be completed in order to determine the amount of the goodwill impairment, if any, that should be recorded. In the second step, an impairment loss is recognized for any excess of the carrying amount of the reporting unit's goodwill over the implied fair value of that goodwill. The implied fair value of goodwill is determined by allocating the fair value of the reporting unit in a manner similar to a purchase price allocation.
The Company completes its annual goodwill impairment evaluation as of the first day of the fourth quarter.
The Company’s primary identifiable intangible assets include: dealer/customer relationships, brand/trade names, developed technology, and non-compete agreements. Identifiable intangibles with finite lives are amortized and those identifiable intangibles with indefinite lives are not amortized. Identifiable intangible assets that are subject to amortization are evaluated for impairment whenever events or changes in circumstances indicate that the carrying amount may not be recoverable. Identifiable intangible assets not subject to amortization are tested for impairment annually or more frequently if events warrant. The impairment test consists of a comparison of the fair value of the trade name with its carrying value. The Company completes its annual impairment test as of the first day of the fourth quarter each year for those identifiable assets not subject to amortization.
Refer to Note 7 for additional information regarding goodwill and other intangible assets.
49
Revenue recognition.
Revenue is recognized when obligations under the terms of a contract with the Company’s customer are satisfied which generally occurs with the transfer of control of the wholegood vehicles, parts, garments or accessories, and, for services, upon completion of the service or over the term of the agreement in proportion to the costs expected to be incurred in satisfying the obligations under the contract. The amount of consideration the Company receives and revenue it recognizes varies with changes in marketing incentives and rebates it offers to its dealers and their customers. Historically, product returns, whether in the normal course of business or resulting from repurchases made under the floorplan financing program, have not been material. However, the Company has agreed to repurchase products repossessed by the finance companies up to certain limits. The Company’s financial exposure is limited to the difference between the amount paid to the finance companies and the amount received on the resale of the repossessed product. No material losses have been incurred under these agreements. The Company has not historically recorded any significant sales return allowances because the Company has not been required to repurchase a significant number of units. However, an adverse change in retail sales could cause this situation to change. Refer to Note 2 for additional information regarding revenue.
Sales promotions and incentives.
Polaris provides for estimated sales promotion and incentive expenses, which are recognized as a component of sales in measuring the amount of consideration the Company expects to receive in exchange for transferring goods or providing services. Examples of sales promotion and incentive programs include dealer and consumer rebates, volume incentives, retail financing programs and sales associate incentives. Sales promotion and incentive expenses are estimated based on current programs and historical rates for each product line. The Company records these amounts as a liability in the consolidated balance sheet until they are ultimately paid. Actual results may differ from these estimates if market conditions dictate the need to enhance or reduce sales promotion and incentive programs or if the customer usage rate varies from historical trends. Adjustments to sales promotions and incentives accruals are made from time to time as actual usage becomes known in order to properly estimate the amounts necessary to generate consumer demand based on market conditions as of the balance sheet date. Historically, sales promotion and incentive expenses have been within the Company’s expectations and differences have not been material.
Dealer holdback programs.
Dealer holdback represents a portion of the invoiced sales price that is expected to be subsequently returned to the dealer or distributor as a sales incentive upon the ultimate retail sale of the product. Holdback amounts reduce the ultimate net price of the products purchased by Polaris’ dealers or distributors and, therefore, reduce the amount of sales Polaris recognizes at the time of shipment. The portion of the invoiced sales price estimated as the holdback is recognized as “dealer holdback” liability on the Company’s balance sheet until paid or forfeited. The minimal holdback adjustments in the estimated holdback liability due to forfeitures are recognized in net sales. Payments are made to dealers or distributors at various times during the year subject to previously established criteria.
Shipping and handling costs.
Polaris records shipping and handling costs as a component of cost of sales at the time the product is shipped.
Research and development expenses.
Polaris records research and development expenses in the period in which they are incurred as a component of operating expenses.
Advertising expenses.
Polaris records advertising expenses as a component of selling and marketing expenses in the period in which they are incurred. In the years ended
December 31, 2018
,
2017
and
2016
, Polaris incurred
$65,001,000
,
$75,307,000
and
$85,199,000
, respectively.
Product warranties - Limited warranties.
Polaris provides a limited warranty for its vehicles and boats for a period of
six
months to
ten
years, depending on the product. Polaris provides longer warranties in certain geographical markets as determined by local regulations and market conditions and may also provide longer warranties related to certain promotional programs. Polaris’ standard warranties require the Company or its dealers to repair or replace defective products during such warranty periods at no cost to the consumer. The warranty reserve is established at the time of sale to the dealer or distributor based on management’s best estimate using historical rates and trends. The Company records these amounts as a liability in the consolidated balance sheet until they are ultimately paid. Adjustments to the warranty reserve are made from time to time based on actual claims experience in order to properly estimate the amounts necessary to settle future and existing claims on products sold as of the balance sheet date. Factors that could have an impact on the warranty accrual in any given period include the following: improved manufacturing quality, shifts in product mix, changes in warranty coverage periods, snowfall and its impact on snowmobile usage, product recalls and any significant changes in sales volume.
50
The activity in the limited warranty reserve during the periods presented was as follows (in thousands):
|
For the Years Ended December 31,
|
|||||||||||
|
2018
|
2017
|
2016
|
|||||||||
|
Balance at beginning of year
|
$
|
123,840
|
|
$
|
119,274
|
|
$
|
56,474
|
|
||
|
Additions to reserve through acquisitions
|
19,468
|
|
—
|
|
147
|
|
|||||
|
Additions charged to expense
|
105,015
|
|
145,705
|
|
194,996
|
|
|||||
|
Less: warranty claims paid
|
(126,499
|
)
|
(141,139
|
)
|
(132,343
|
)
|
|||||
|
Balance at end of year
|
$
|
121,824
|
|
$
|
123,840
|
|
$
|
119,274
|
|
||
During 2016, the Company incurred significant additions to the warranty reserve, primarily associated with recall activity for certain RZR vehicles. In April 2016, the Company issued a voluntary recall for certain RZR 900 and 1000 off-road vehicles manufactured since model year 2013 due to reports of thermal-related incidents, including fire, and in September 2016, the Company issued a voluntary recall for certain RZR XP Turbo off-road vehicles due to similar thermal-related incidents.
Share-based employee compensation.
The Company recognizes in the financial statements the grant-date fair value of stock options and other equity-based compensation issued to employees. Determining the appropriate fair-value model and calculating the fair value of share-based awards at the date of grant requires judgment. The Company utilizes the Black-Scholes option pricing model to estimate the fair value of employee stock options, and the Monte Carlo model to estimate the fair value of employee performance restricted stock units that include a market condition. These pricing models also require the use of input assumptions, including expected volatility, expected life, expected dividend rate, and expected risk-free rate of return. The Company utilizes historical volatility as the Company believes this is reflective of market conditions. The expected life of the awards is based on historical exercise patterns. The risk-free interest rate assumption is based on observed interest rates appropriate for the terms of awards. The dividend yield assumption is based on the Company’s history of dividend payouts. The Company develops an estimate of the number of share-based awards that will be forfeited due to employee turnover. Changes in the estimated forfeiture rate can have a significant effect on reported share-based compensation, as the effect of adjusting the rate for all expense amortization is recognized in the period the forfeiture estimate is changed. If the actual forfeiture rate is higher or lower than the estimated forfeiture rate, then an adjustment is made to increase or decrease the estimated forfeiture rate, which will result in a decrease or increase to the expense recognized in the financial statements. If forfeiture adjustments are made, they would affect gross margin and operating expenses. The Company estimates the likelihood and the rate of achievement for performance share-based awards, specifically long-term compensation grants of performance-based restricted stock unit awards. Changes in the estimated rate of achievement can have a significant effect on reported share-based compensation expenses as the effect of a change in the estimated achievement level is recognized in the period that the likelihood factor changes. If adjustments in the estimated rate of achievement are made, they would be reflected in gross margin and operating expenses. Fluctuations in the Company’s stock price can have a significant effect on reported share-based compensation expenses for liability-based awards. The impact from fluctuations in the Company’s stock price is recognized in the period of the change, and is reflected in gross margin and operating expenses. Refer to Note 4 for additional information regarding share-based compensation.
The Company estimates the likelihood and the rate of achievement for performance share-based awards. Changes in the estimated rate of achievement and fluctuation in the market based stock price can have a significant effect on reported share-based compensation expenses as the effect of a change in the estimated achievement level and fluctuation in the market based stock price is recognized in the period that the likelihood factor and stock price changes. If adjustments in the estimated rate of achievement and fluctuation in the market based stock price are made, they would be reflected in gross margin and operating expenses.
Derivative instruments and hedging activities.
Changes in the fair value of a derivative are recognized in earnings unless the derivative qualifies as a hedge. To qualify as a hedge, the Company must formally document, designate and assess the effectiveness of transactions that receive hedge accounting. Polaris does not use any financial contracts for trading purposes.
Polaris enters into foreign exchange contracts to manage currency exposures from certain of its purchase commitments denominated in foreign currencies and transfers of funds from time to time from its foreign subsidiaries. These contracts meet the criteria for cash flow hedges. Gains and losses on the Canadian dollar and Australian dollar contracts at
51
settlement are recorded in non-operating other expense, net in the consolidated income statements, and gains and losses on the Japanese yen and Mexican peso contracts at settlement are recorded in cost of sales in the consolidated income statements. The contracts are recorded in other current assets or other current liabilities on the consolidated balance sheets. Unrealized gains and losses are recorded as a component of accumulated other comprehensive loss, net.
Polaris enters into interest rate swaps in order to maintain a balanced risk of fixed and floating interest rates associated with the Company’s long-term debt. These contracts meet the criteria for cash flow hedges. The contracts are recorded in other current assets or other current liabilities on the consolidated balance sheets. Unrealized gains and losses are recorded as a component of accumulated other comprehensive loss, net.
Polaris enters into commodity hedging contracts in order to manage fluctuating market prices of certain purchased commodities and raw materials that are integrated into the Company’s end products. The Company did not enter into any such derivative contracts during
2018
or
2017
.
Refer to Note 13 for additional information regarding derivative instruments and hedging activities.
Foreign currency translation.
The functional currency for each of the Polaris foreign subsidiaries is their respective local currencies. The assets and liabilities in all Polaris foreign entities are translated at the foreign exchange rate in effect at the balance sheet date. Translation gains and losses are reflected as a component of accumulated other comprehensive loss in the shareholders’ equity section of the accompanying consolidated balance sheets. Revenues and expenses in all of Polaris’ foreign entities are translated at the average foreign exchange rate in effect for each month of the quarter. Transaction gains and losses including intercompany transactions denominated in a currency other than the functional currency of the entity involved are included in other (income) expense, net in the consolidated statements of income.
Comprehensive income.
Components of comprehensive income include net income, foreign currency translation adjustments, unrealized gains or losses on derivative instruments, and retirement benefit plan activity. The Company discloses comprehensive income in separate consolidated statements of comprehensive income.
New accounting pronouncements.
Share-based payment accounting.
Effective January 1, 2017, the Company adopted Accounting Standards Update (ASU) No. 2016-09,
Improvements to Employee Share-Based Payment Accounting
. As a result of the adoption, the Company recognized a tax benefit of
$14,643,000
of excess tax benefits related to share-based payments in its provision for income taxes for year ended December 31, 2017. These items were historically recorded in additional paid-in capital. In addition, for each period presented, cash flows related to excess tax benefits are now classified as an operating activity along with other income tax related cash flows. The Company elected to apply the change in presentation of excess tax benefits in the statements of cash flows on a prospective basis. The Company’s compensation expense each period continues to reflect estimated forfeitures.
Revenue from contracts with customers.
Effective January 1, 2018, the Company adopted ASU No. 2014-09,
Revenue from Contracts with Customers
, ASU 2016-08,
Revenue from Contracts with Customers (Topic 606): Principal versus Agent Considerations (Reporting Revenue Gross versus Net)
, and ASU 2016-12,
Revenue from Contracts with Customers (Topic 606): Narrow-Scope Improvements and Practical Expedients
using the modified retrospective approach. The adoption of these ASUs did not have a material impact on the Company’s consolidated financial position, results of operations, equity or cash flows as of the adoption date or for the year ended December 31, 2018. The Company has included the disclosures required by ASU 2014-09 in Note 2.
Statement of cash flows.
Effective January 1, 2018, the Company adopted ASU No. 2016-18,
Statement of Cash Flows (Topic 230): Restricted Cash
, which requires that restricted cash be included with cash and cash equivalents when reconciling the beginning-of-period and end-of-period total amounts shown on the statement of cash flows. Prior periods were retrospectively adjusted to conform to the current period’s presentation. As a result of the adoption of ASU 2016-18, the Company recorded an increase of $5,428,000 and $17,845,000 in net cash provided by operating activities for the years ended December 31, 2017 and 2016, respectively, related to reclassifying the changes in restricted cash balance from operating activities to the cash and cash equivalent balances within the Consolidated Statements of Cash Flows.
Income Taxes.
The Tax Cuts and Jobs Act (the “Act”) was enacted on December 22, 2017. The Act reduced the U.S. federal corporate tax rate from 35% to 21%, required companies to pay a one-time transition tax on earnings of certain foreign subsidiaries that were previously tax deferred and created new taxes on certain foreign-sourced earnings.
52
The Company has applied the guidance in ASU 2018-05,
Income Taxes (Topic 740): Amendments to SEC Paragraphs Pursuant to SEC Staff Accounting Bulletin No. 118,
when accounting for the enactment-date effects of the Act. During the fourth quarter of 2018, the Company elected the period cost method related to the Global Intangible Low-Taxed Income (GILTI) and completed its accounting for the tax effects of the Act which resulted in an immaterial change to the provisional amounts.
Leases.
In February 2016, the FASB issued ASU No. 2016-02,
Leases (Topic 842)
and in July 2018, ASU No. 2018-10, Codification Improvements to Topic 842,
Leases
, and ASU 2018-11,
Leases
(Topic 842) - Targeted Improvements (collectively, “the new lease standard” or “ASC 842”). The new standard requires lessees to record assets and liabilities on the balance sheet for all leases with terms longer than 12 months. Leases will be classified as either finance or operating, with the classification affecting the pattern of expense recognition in the income statement. The Company plans to adopt the standard as of January 1, 2019 using the alternative transition method provided under ASC 842, which allows the Company to initially apply the new lease standard at the adoption date and recognize a cumulative-effect adjustment to the opening balance of retained earnings in the period of adoption. The Company will elect the package of practical expedients permitted under the transition guidance within the new standard, which among other things, allows the Company to carry forward the historical lease classification. The Company will not elect the hindsight practical expedient permitted under the transition guidance within the new lease standard.
The Company will make an accounting policy election to keep leases with an initial term of 12 months or less off of the balance sheet. The Company will also elect the practical expedient to not separate non-lease components from the lease components to which they relate, and instead account for each separate lease and non-lease component associated with that lease component as a single lease component for all underlying asset classes. Accordingly, all costs associated with a lease contract are accounted for as lease cost.
The Company estimates adoption of the new standard will result in the recognition of additional net lease assets and lease liabilities of approximately
$110,000,000
to
$120,000,000
, as of January 1, 2019. The Company does not believe the adoption of ASC 842 will have a material impact on the Company’s consolidated results of operations, equity or cash flows as of the adoption date. Under the alternative method of adoption, comparative information will not be restated, but will continue to be reported under the standards in effect for those periods.
Derivatives and hedging.
In August 2017, the FASB issued ASU No. 2017-12,
Derivatives and Hedging (Topic 815): Targeted Improvements to Accounting for Hedging Activities
. This ASU better aligns accounting rules with a company’s risk management activities; better reflects economic results of hedging in financial statements; and simplifies hedge accounting treatment. The standard is effective for fiscal years and interim periods beginning after December 15, 2018 and is effective for the Company’s fiscal year beginning January 1, 2019, with early adoption permitted. The adoption of the ASU is not expected to have a material impact on the Company’s consolidated financial position, results of operations, equity or cash flows.
Non-employee share-based payments.
In June 2018, the FASB issued ASU No. 2018-07,
Compensation - Stock Compensation (Topic 718): Improvements to Non-employee Share-based Payment Accounting
. The amendments of this ASU apply to all share-based payment transactions to non-employees, in which a grantor acquires goods or services to be used or consumed in a grantor’s own operations, accounted for under ASC 505-50, Equity-Based Payments to Non-Employees. Under the amendments of ASU 2018-07, most of the guidance on compensation to nonemployees is aligned with the requirements for shared based payments granted to employees in Topic 718. The adoption of the ASU is not expected to have a material impact on the Company’s consolidated financial position, results of operations, equity or cash flows.
There are no other new accounting pronouncements that are expected to have a significant impact on Polaris’ consolidated financial statements.
53
Note 2. Revenue Recognition
The following tables disaggregate the Company’s revenue by major product type and geography (in thousands):
|
For the Year Ended December 31, 2018
|
|||||||||||||||||||||||
|
ORV / Snowmobiles
|
Motorcycles
|
Global Adj. Markets
|
Aftermarket
|
Boats
|
Consolidated
|
||||||||||||||||||
|
Revenue by product type
|
|||||||||||||||||||||||
|
Wholegoods
|
$
|
3,237,463
|
|
$
|
465,269
|
|
$
|
366,103
|
|
—
|
|
$
|
279,656
|
|
$
|
4,348,491
|
|
||||||
|
PG&A
|
681,954
|
|
80,377
|
|
78,541
|
|
$
|
889,177
|
|
—
|
|
1,730,049
|
|
||||||||||
|
Total revenue
|
$
|
3,919,417
|
|
$
|
545,646
|
|
$
|
444,644
|
|
$
|
889,177
|
|
$
|
279,656
|
|
$
|
6,078,540
|
|
|||||
|
Revenue by geography
|
|||||||||||||||||||||||
|
United States
|
$
|
3,178,104
|
|
$
|
371,483
|
|
$
|
212,653
|
|
$
|
847,293
|
|
$
|
274,274
|
|
$
|
4,883,807
|
|
|||||
|
Canada
|
293,269
|
|
31,150
|
|
18,539
|
|
41,884
|
|
5,382
|
|
390,224
|
|
|||||||||||
|
EMEA
|
306,890
|
|
87,977
|
|
208,032
|
|
—
|
|
—
|
|
602,899
|
|
|||||||||||
|
APLA
|
141,154
|
|
55,036
|
|
5,420
|
|
—
|
|
—
|
|
201,610
|
|
|||||||||||
|
Total revenue
|
$
|
3,919,417
|
|
$
|
545,646
|
|
$
|
444,644
|
|
$
|
889,177
|
|
$
|
279,656
|
|
$
|
6,078,540
|
|
|||||
Revenue is recognized when obligations under the terms of a contract with the Company’s customer are satisfied which generally occurs with the transfer of control of the wholegood vehicles, parts, garments or accessories, and upon completion of the service or over the term of the agreement in proportion to the costs expected to be incurred in satisfying the obligations under the contract, for services. Revenue is measured as the amount of consideration the Company expects to receive in exchange for transferring goods or providing services. Sales, value add, and other taxes the Company collects concurrent with revenue-producing activities are excluded from revenue. Incidental items that are immaterial in the context of the contract are recognized as expense. The expected costs associated with the Company’s limited warranties and field service bulletin actions continue to be recognized as expense when the products are sold. The Company recognizes revenue for vehicle service contracts that extend mechanical and maintenance beyond the Company’s limited warranties over the life of the contract. Revenue from goods and services transferred to customers at a point in time accounts for the majority of the Company’s revenue. Revenue from products or services transferred over time is discussed in the deferred revenue section.
ORV/Snowmobiles, Motorcycles and Global Adjacent Markets segments
Wholegood vehicles and parts, garments and accessories.
For the majority of wholegood vehicles, parts, garments and accessories (PG&A), the Company transfers control and recognizes a sale when it ships the product from its manufacturing facility, distribution center, or vehicle holding center to its customer (primarily dealers and distributors). The amount of consideration the Company receives and revenue it recognizes varies with changes in marketing incentives and rebates it offers to its dealers and their customers. Sales returns are not material. The Company adjusts its estimate of revenue at the earlier of when the most likely amount of consideration it expects to receive changes or when the consideration becomes fixed.
Depending on the terms of the arrangement, the Company may also defer the recognition of a portion of the consideration received because it has to satisfy a future obligation (e.g., free extended service contracts). The Company uses an observable price to determine the stand-alone selling price for separate performance obligations. The Company has elected to recognize the cost for freight and shipping when control over vehicles, parts, garments or accessories has transferred to the customer as an expense in cost of sales.
Extended Service Contracts.
The Company sells separately-priced service contracts that extend mechanical and maintenance coverages beyond its base limited warranty agreements to vehicle owners. The separately priced service contracts range from 12 months to 84 months. The Company primarily receives payment at the inception of the contract and recognizes revenue over the term of the agreement in proportion to the costs expected to be incurred in satisfying the obligations under the contract.
Aftermarket segment
The Company’s Aftermarket products are sold through dealer, distributor, retail, and e-commerce channels. The Company transfers control and recognizes a sale when products are shipped or delivered to its customer. The amount of consideration the Company receives and revenue it recognizes varies with changes in marketing incentives and rebates
54
rights it offers to its customers and their customers. When the Company gives its customers the right to return eligible parts and accessories, it estimates the expected returns based on an analysis of historical experience. The Company adjusts its estimate of revenue at the earlier of when the most likely amount of consideration it expects to receive changes or when the consideration becomes fixed.
Service revenue.
The Company offers installation services for parts that it sells. Service revenues are recognized upon completion of the service.
Depending on the terms of the arrangement, the Company may also defer the recognition of a portion of the consideration received because it has to satisfy a future obligation (e.g., extended service contracts). The Company uses an observable price to determine the stand-alone selling price for separate performance obligations. The Company has elected to recognize the cost for freight and shipping when control over parts, garments or accessories has transferred to the customer as an expense in cost of sales.
Boats segment
Boats.
For the majority of boats, the Company transfers control and recognizes a sale when it ships the product from its manufacturing facility or distribution center to its customer (primarily dealers). The amount of consideration the Company receives and revenue it recognizes varies with changes in marketing incentives and rebates it offers to its dealers and their customers. Sales returns are not material. The Company adjusts its estimate of revenue at the earlier of when the most likely amount of consideration it expects to receive changes or when the consideration becomes fixed. The Company has elected to recognize the cost for freight and shipping when control over boats has transferred to the customer as an expense in cost of sales.
Deferred revenue
In 2016, Polaris began financing its self-insured risks related to extended service contracts (“ESCs”). The premiums for ESCs are primarily recognized in income in proportion to the costs expected to be incurred over the contract period. Warranty costs are recognized as incurred.
The Company expects to recognize approximately
$25,777,000
of the unearned amount over the next 12 months and
$34,138,000
thereafter. The activity in the deferred revenue reserve during the periods presented was as follows (in thousands):
|
For the Years Ended December 31,
|
|||||||||||
|
2018
|
2017
|
2016
|
|||||||||
|
Balance at beginning of year
|
$
|
45,760
|
|
$
|
26,157
|
|
|
||||
|
Additions to deferred revenue through acquisitions
|
—
|
|
—
|
|
$
|
7,944
|
|
||||
|
New contracts sold
|
35,610
|
|
31,617
|
|
20,569
|
|
|||||
|
Less: reductions for revenue recognized
|
(21,455
|
)
|
(12,014
|
)
|
(2,356
|
)
|
|||||
|
Balance at end of year
(1)
|
$
|
59,915
|
|
$
|
45,760
|
|
$
|
26,157
|
|
||
(1) The unamortized ESC premiums (deferred revenue) recorded in other current liabilities totaled
$25,777,000
and
$18,607,000
at December 31, 2018 and 2017, respectively, while the amount recorded in other long-term liabilities totaled
$34,138,000
and
$27,153,000
at December 31, 2018, 2017, and 2016, respectively.
Note 3. Acquisitions
2018 Acquisitions.
Boat Holdings, LLC
On July 2, 2018, pursuant to the Agreement and Plan of Merger dated May 29, 2018, the Company completed the acquisition of Boat Holdings, LLC, a privately held Delaware limited liability company, headquartered in Elkhart, Indiana which manufactures boats (“Boat Holdings”).
The transaction was structured as an acquisition of
100%
of the outstanding equity interests in Boat Holdings for aggregate consideration of
$806,658,000
, net of cash acquired, subject to customary adjustments based on, among other things, the amount of cash, debt and working capital in the business of Boat Holdings at the closing date. A portion of the aggregate consideration equal to
$100,000,000
will be paid in the form of a series of deferred annual payments over
12
years following the closing date.
55
The Company funded the purchase price for the acquisition by amending, extending, and up-sizing the Credit Facility and with the proceeds of the issuance of
4.23%
Senior Notes, Series 2018, due July 3, 2028, described in Note 6.
The consolidated statement of income for the year ended December 31, 2018 includes
$279,656,000
of net sales and
$46,252,000
of gross profit related to Boats.
The following table summarizes the preliminary fair values assigned to the Boat Holdings net assets acquired and the determination of net assets (in thousands):
|
Cash and cash equivalents
|
$
|
16,534
|
|
|
Trade receivables
|
17,528
|
|
|
|
Inventory
|
39,990
|
|
|
|
Other current assets
|
4,522
|
|
|
|
Property, plant and equipment
|
35,299
|
|
|
|
Customer relationships
|
341,080
|
|
|
|
Trademarks / trade names
|
210,680
|
|
|
|
Non-compete agreements
|
2,630
|
|
|
|
Goodwill
|
211,757
|
|
|
|
Accounts payable
|
(30,064
|
)
|
|
|
Other liabilities assumed
|
(26,764
|
)
|
|
|
Total fair value of net assets acquired
|
823,192
|
|
|
|
Less cash acquired
|
(16,534
|
)
|
|
|
Total consideration for acquisition, less cash acquired
|
$
|
806,658
|
|
On the acquisition date, amortizable intangible assets had a weighted-average useful life of approximately
19
years. The customer relationships were valued based on the Discounted Cash Flow Method and are amortized over
15
-
20
years, depending on the customer class. The trademarks and trade names were valued on the Relief from Royalty Method and have indefinite remaining useful lives. Goodwill is deductible for tax purposes.
The following unaudited pro forma information represents the Company’s results of operations as if the fiscal 2018 acquisition of Boat Holdings had occurred at the beginning of fiscal 2017 (in thousands, except per share data):
|
For the Years Ended December 31,
|
|||||||
|
2018
|
2017
|
||||||
|
Net sales
|
$
|
6,429,700
|
|
$
|
5,980,741
|
|
|
|
Net income
|
360,690
|
|
182,749
|
|
|||
|
Basic earnings per share
|
$
|
5.77
|
|
$
|
2.90
|
|
|
|
Diluted earnings per common share
|
$
|
5.64
|
|
$
|
2.85
|
|
|
The results for the years ended
December 31, 2018
and
2017
have been adjusted to include the pro forma impact of amortization of intangible assets and the depreciation of property, plant, and equipment, based on purchase price allocations; the pro forma impact of additional interest expense relating to the acquisition; the pro forma impact of transaction related costs incurred by the Company directly attributable to the transaction; and the pro forma tax effect of both income before taxes and the pro forma adjustments. These performance results may not be indicative of the actual results that would have occurred under the ownership and management of the Company.
The results for the year ended
December 31, 2018
have been adjusted to exclude the impact of approximately
$9,646,000
of acquisition-related expenses and purchase accounting adjustments (pre-tax) incurred by the Company that are directly attributable to the transaction.
The pro forma financial information has been prepared for comparative purposes only and includes certain adjustments, as noted above. The adjustments are estimates based on currently available information and actual amounts may differ materially from these estimates. They do not reflect the effect of costs or synergies that would have been expected to result from the integration of the Boat Holdings acquisition.
56
2017 Acquisitions.
The Company did not complete any acquisitions in 2017.
2016 Acquisitions.
Taylor-Dunn Manufacturing Company
In March 2016, the Company acquired Taylor-Dunn Manufacturing Company (“Taylor-Dunn”), a leading provider of industrial vehicles serving a broad range of commercial, manufacturing, warehouse and ground-support customers. Taylor-Dunn is based in Anaheim, California, and is included in the Global Adjacent Markets reporting segment. Pro forma financial results for the Taylor-Dunn acquisition are not presented as the acquisition was not material to the consolidated financial statements.
Transamerican Auto Parts
On October 11, 2016, the Company entered into a definitive agreement with TAP Automotive Holdings, LLC
(“Transamerican Auto Parts” or “TAP”), to acquire the outstanding equity interests in Transamerican Auto Parts, a privately held, vertically integrated manufacturer, distributor, retailer and installer of off-road Jeep and truck accessories, for an aggregate consideration of
$668,348,000
, net of cash acquired. TAP’s products and services for customers in the off-road four-wheel-drive market correspond closely to the Company’s ORV business. The transaction closed on November 10, 2016. The Company funded the purchase price with borrowings under its existing credit facilities.
The following table summarizes the final fair values assigned to the TAP net assets acquired and the determination of net assets (in thousands):
|
Cash and cash equivalents
|
$
|
3,017
|
|
|
Trade receivables
|
18,214
|
|
|
|
Inventory
|
145,094
|
|
|
|
Property, plant and equipment
|
33,402
|
|
|
|
Customer relationships
|
87,000
|
|
|
|
Trademarks / trade names
|
175,500
|
|
|
|
Goodwill
|
266,126
|
|
|
|
Other assets
|
17,687
|
|
|
|
Deferred revenue
|
(7,944
|
)
|
|
|
Other liabilities assumed
|
(66,731
|
)
|
|
|
Total fair value of net assets acquired
|
671,365
|
|
|
|
Less cash acquired
|
(3,017
|
)
|
|
|
Total consideration for acquisition, less cash acquired
|
$
|
668,348
|
|
On the acquisition date, amortizable intangible assets had a weighted-average useful life of approximately
9
years. The customer relationships were valued based on the Discounted Cash Flow Method and are amortized over
5
-
10 years
, depending on the customer class. The trademarks and trade names were valued on the Relief from Royalty Method and have indefinite remaining useful lives. Goodwill is deductible for tax purposes.
The following unaudited pro forma information represents the Company’s results of operations as if the fiscal 2016 acquisition of TAP had occurred at the beginning of fiscal 2015 (in thousands, except per share data). These performance results may not be indicative of the actual results that would have occurred under the ownership and management of the Company.
|
For the Year Ended December 31, 2016
|
|||
|
Net sales
|
$
|
5,161,688
|
|
|
Net income
|
240,400
|
|
|
|
Basic earnings per share
|
$
|
3.74
|
|
|
Diluted earnings per common share
|
$
|
3.69
|
|
The unaudited pro forma net income for the year ended December 31, 2016 excludes the impact of transaction costs incurred by TAP and approximately
$13,000,000
of non-recurring transaction related costs incurred by the Company. The pro forma condensed consolidated financial information has been prepared for comparative purposes only and
57
includes certain adjustments, as noted above. The adjustments are estimates based on currently available information and actual amounts may differ materially from these estimates. They do not reflect the effect of costs or synergies that would have been expected to result from the integration of the TAP acquisition. The pro forma information does not purport to be indicative of the results of operations that actually would have resulted had the TAP acquisition occurred on January 1, 2015. The Company’s 2016 consolidated statements of income include
$108,699,000
of net sales and
$19,842,000
of gross profit related to TAP.
Note 4. Share-Based Compensation
Share-based plans.
The Company grants long-term equity-based incentives and rewards for the benefit of its employees and directors under the shareholder approved Polaris Industries Inc. 2007 Omnibus Incentive Plan (as amended) (the “Omnibus Plan”), which were previously provided under several separate incentive and compensatory plans. Upon approval by the shareholders of the Omnibus Plan in April 2007, the Polaris Industries Inc. 1995 Stock Option Plan (“Option Plan”), the 1999 Broad Based Stock Option Plan, the Restricted Stock Plan and the 2003 Non-Employee Director Stock Option Plan (“Director Stock Option Plan” and collectively the “Prior Plans”) were frozen and no further grants or awards have since been or will be made under such plans. A maximum of
21,000,000
shares of common stock are available for issuance under the Omnibus Plan, together with additional shares canceled or forfeited under the Prior Plans.
Stock option awards granted to date under the Omnibus Plan generally vest
one
to
four
years from the award date and expire after ten years. In addition, since 2007, the Company has granted a total of
181,000
deferred stock units to its non-employee directors under the Omnibus Plan (
12,000
,
11,000
and
11,000
in
2018
,
2017
and
2016
, respectively), which will be converted into common stock when the director’s board service ends or upon a change in control. Restricted units and performance-based restricted units (collectively restricted stock) awarded under the Omnibus Plan generally vests after a one to four year period. The final number of shares issued under performance-based awards are dependent on achievement of certain performance measures.
The Option Plan, which is frozen, was used to issue incentive and nonqualified stock options to certain employees. Options granted to date generally vest
three
years from the award date and expire after
ten
years.
Under the Polaris Industries Inc. Deferred Compensation Plan for Directors (“Director Plan”) and the Omnibus Plan, members of the Board of Directors who are not Polaris officers or employees may annually elect to receive common stock equivalents in lieu of director fees, which will be converted into common stock when board service ends. A maximum of
500,000
shares of common stock has been authorized under the Director Plan of which
73,000
equivalents have been earned and
427,000
shares have been issued to retired directors as of
December 31, 2018
. Authorized shares under the Director Plan were exhausted in 2017. Since 2017, the Company has granted a total of
21,000
common stock equivalents to its non-employee directors under the Omnibus Plan (
10,000
in
2018
and
11,000
in
2017
), which will be converted into common stock when their board service ends. As of
December 31, 2018
and
2017
, Polaris’ liability under the plans for the common stock equivalents totaled
$7,253,000
and
$10,526,000
, respectively.
Polaris maintains a long term incentive program under which awards are issued to provide incentives for certain employees to attain and maintain the highest standards of performance and to attract and retain employees of outstanding competence and ability with no cash payments required from the recipient. Long term incentive program awards are granted in restricted stock units and stock options and therefore treated as equity awards.
Share-based compensation expense.
The amount of compensation cost for share-based awards to be recognized during a period is based on the portion of the awards that are ultimately expected to vest. The Company estimates forfeitures at the time of grant and revises those estimates in subsequent periods if actual forfeitures differ from those estimates. The Company analyzes historical data to estimate pre-vesting forfeitures and records share compensation expense for those awards expected to vest.
58
Total share-based compensation expenses were as follows (in thousands):
|
For the Years Ended December 31,
|
|||||||||||
|
2018
|
2017
|
2016
|
|||||||||
|
Option awards
|
$
|
23,393
|
|
$
|
18,423
|
|
$
|
23,876
|
|
||
|
Other share-based awards
|
28,513
|
|
28,844
|
|
23,368
|
|
|||||
|
Total share-based compensation before tax
|
51,906
|
|
47,267
|
|
47,244
|
|
|||||
|
Tax benefit
|
12,354
|
|
17,555
|
|
17,546
|
|
|||||
|
Total share-based compensation expense included in net income
|
$
|
39,552
|
|
$
|
29,712
|
|
$
|
29,698
|
|
||
These share-based compensation expenses are reflected in cost of sales and operating expenses in the accompanying consolidated statements of income. For purposes of determining the estimated fair value of awards on the date of grant under ASC Topic 718, Polaris has used the Black-Scholes model for stock options, and the Monte Carlo simulation model for employee performance restricted stock units that include a market condition. Assumptions utilized in the model are evaluated and revised, as necessary, to reflect market conditions and experience.
At
December 31, 2018
, there was
$96,087,000
of total unrecognized share-based compensation expense related to unvested share-based equity awards. Unrecognized share-based compensation expense is expected to be recognized over a weighted-average period of
1.35
years. Included in unrecognized share-based compensation is approximately
$23,631,000
related to stock options and
$72,456,000
for restricted stock.
General stock option and restricted stock information.
The following summarizes stock option activity and the weighted average exercise price for the following plans for the each of the three years ended
December 31, 2018
,
2017
and
2016
:
|
Omnibus Plan
(Active) |
Option Plan
(Frozen) |
||||||||||||
|
Shares
Outstanding
|
Weighted
Average Exercise Price |
Outstanding
Shares |
Weighted
Average Exercise Price |
||||||||||
|
Balance as of December 31, 2015
|
4,105,539
|
|
$
|
84.61
|
|
18,950
|
|
$
|
23.37
|
|
|||
|
Granted
|
1,326,430
|
|
78.72
|
|
—
|
|
—
|
|
|||||
|
Exercised
|
(348,206
|
)
|
40.51
|
|
(18,950
|
)
|
23.37
|
|
|||||
|
Forfeited
|
(366,702
|
)
|
108.90
|
|
—
|
|
—
|
|
|||||
|
Balance as of December 31, 2016
|
4,717,061
|
|
$
|
84.32
|
|
—
|
|
—
|
|
||||
|
Granted
|
1,267,812
|
|
88.22
|
|
—
|
|
—
|
|
|||||
|
Exercised
|
(898,417
|
)
|
44.18
|
|
—
|
|
—
|
|
|||||
|
Forfeited
|
(192,505
|
)
|
108.15
|
|
—
|
|
—
|
|
|||||
|
Balance as of December 31, 2017
|
4,893,951
|
|
$
|
91.78
|
|
—
|
|
—
|
|
||||
|
Granted
|
806,698
|
|
115.43
|
|
—
|
|
—
|
|
|||||
|
Exercised
|
(724,124
|
)
|
61.49
|
|
—
|
|
—
|
|
|||||
|
Forfeited
|
(400,599
|
)
|
105.70
|
|
—
|
|
—
|
|
|||||
|
Balance as of December 31, 2018
|
4,575,926
|
|
$
|
99.53
|
|
—
|
|
—
|
|
||||
|
Vested or expected to vest as of December 31, 2018
|
4,575,926
|
|
$
|
99.53
|
|
—
|
|
—
|
|
||||
|
Options exercisable as of December 31, 2018
|
1,909,271
|
|
$
|
99.47
|
|
—
|
|
—
|
|
||||
The weighted average remaining contractual life of options outstanding and of options outstanding and exercisable as of
December 31, 2018
was
6.65
years and
4.76
years, respectively.
59
The following assumptions were used to estimate the weighted average fair value of options of
$26.50
,
$18.45
and
$16.81
granted during the years ended
December 31, 2018
,
2017
and
2016
, respectively:
|
For the Years Ended December 31,
|
||||||||
|
2018
|
2017
|
2016
|
||||||
|
Weighted-average volatility
|
30
|
%
|
29
|
%
|
32
|
%
|
||
|
Expected dividend yield
|
2.1
|
%
|
2.6
|
%
|
2.8
|
%
|
||
|
Expected term (in years)
|
4.4
|
|
4.7
|
|
4.5
|
|
||
|
Weighted average risk free interest rate
|
2.6
|
%
|
1.9
|
%
|
1.4
|
%
|
||
The total intrinsic value of options exercised during the year ended
December 31, 2018
was
$42,511,000
. The total intrinsic value of options outstanding and of options outstanding and exercisable at
December 31, 2018
, was
$10,899,000
and
$8,494,000
, respectively. The total intrinsic values are based on the Company’s closing stock price on the last trading day of the applicable year for in-the-money options.
The grant date fair values of the total shareholder return (TSR) performance share awards were estimated using a Monte Carlo simulation model utilizing the following weighted-average assumptions:
|
For the Years Ended December 31,
|
|||||||
|
2018
|
2017
|
2016
|
|||||
|
Weighted-average volatility
|
33
|
%
|
31
|
%
|
—
|
||
|
Expected term (in years)
|
3.0
|
|
3.0
|
|
—
|
||
|
Weighted average risk free interest rate
|
2.3
|
%
|
1.5
|
%
|
—
|
||
The Company used its historical stock prices as the basis for the Company’s volatility assumption. The assumed risk-free interest rates were based on U.S. Treasury rates in effect at the time of grant. The expected term was based on the vesting period. The weighted-average fair value used to record compensation expense for TSR performance share awards granted during fiscal 2018 and 2017 was
$106.43
and
$82.14
per award, respectively. There were no TSR performance share awards granted in fiscal 2016.
The following table summarizes restricted stock activity for the year ended
December 31, 2018
:
|
Shares
Outstanding |
Weighted
Average Grant Price |
|||||
|
Balance as of December 31, 2017
|
1,620,625
|
|
$
|
93.03
|
|
|
|
Granted
|
582,488
|
|
114.42
|
|
||
|
Vested
|
(158,031
|
)
|
101.95
|
|
||
|
Canceled/Forfeited
|
(403,885
|
)
|
123.80
|
|
||
|
Balance as of December 31, 2018
|
1,641,197
|
|
$
|
92.19
|
|
|
|
Expected to vest as of December 31, 2018
|
1,282,659
|
|
$
|
98.28
|
|
|
The shares granted above include 244,000 performance restricted stock unit awards. These performance grants are the number of shares that would be earned at the target level of performance. The number of shares of Polaris common stock that could actually be delivered at the end of the three-year performance period for performance restricted stock units may be anywhere from 0% to 200% of target for each performance share, depending on the performance of the Company during such performance period.
The total intrinsic value of restricted stock expected to vest as of
December 31, 2018
was
$98,354,000
. The total intrinsic value is based on the Company’s closing stock price on the last trading day of the year. The weighted average fair values at the grant dates of grants awarded under the Omnibus Plan for the years ended
December 31, 2018
,
2017
and
2016
were
$114.42
,
$85.97
and
$77.53
, respectively.
Note 5. Employee Savings Plans
Employee Stock Ownership Plan (ESOP).
Polaris sponsors a qualified non-leveraged ESOP under which a maximum of
7,200,000
shares of common stock can be awarded. The shares are allocated to eligible participants’ accounts based on total cash compensation earned during the calendar year. An employee’s ESOP account vests equally after
two
and
three
years of service and requires no cash payments from the recipient. Participants may instruct Polaris to pay respective
60
dividends directly to the participant in cash or reinvest the dividends into the participants’ ESOP accounts. Employees who meet eligibility requirements can participate in the ESOP. Total expense related to the ESOP was
$10,037,000
,
$8,241,000
and
$7,849,000
, in
2018
,
2017
and
2016
, respectively. As of
December 31, 2018
there were
3,315,000
shares held in the plan.
Defined contribution plans.
Polaris sponsors a 401(k) defined contribution retirement plan covering substantially all U.S. employees. The Company matches
100 percent
of employee contributions up to a maximum of five percent of eligible compensation. All contributions vest immediately. The cost of the defined contribution retirement plan was
$24,458,000
,
$22,101,000
, and
$15,456,000
, in
2018
,
2017
and
2016
, respectively.
Supplemental Executive Retirement Plan (SERP).
Polaris sponsors a SERP that provides executive officers of the Company an alternative to defer portions of their salary, cash incentive compensation, and Polaris matching contributions. The deferrals and contributions are held in a rabbi trust and are in funds to match the liabilities of the plan. The assets are recorded as trading assets. The assets of the rabbi trust are included in other long-term assets on the consolidated balance sheets and the SERP liability is included in other long-term liabilities on the consolidated balance sheets. The asset and liability balances are both
$48,545,000
and
$54,244,000
at
December 31, 2018
, and
2017
, respectively.
Executive officers of the Company have the opportunity to defer certain restricted stock units. After a holding period, the executive officer has the option to diversify the vested award into other funds available under the SERP. The deferrals are held in a rabbi trust and are invested in funds to match the liabilities of the SERP. The awards are redeemable in Polaris stock or in cash based upon the occurrence of events not solely within the control of Polaris; therefore, awards probable of vesting, for which the executive has not yet made an election to defer, or awards that have been deferred but have not yet vested and are probable of vesting or have been diversified into other funds, are reported as deferred compensation in the temporary equity section of the consolidated balance sheets. The awards recorded in temporary equity are recognized at fair value as though the reporting date is also the redemption date, with any difference from stock-based compensation recorded in retained earnings. At
December 31, 2018
,
89,168
shares are recorded at a fair value of
$6,837,000
in temporary equity, which includes
$7,346,000
of compensation cost and
$(509,000)
of cumulative fair value adjustment recorded through retained earnings.
Note 6. Financing Agreement
The carrying value of debt, capital lease obligations, and notes payable and the average related interest rates were as follows (in thousands):
|
Average interest rate at December 31, 2018
|
Maturity
|
December 31, 2018
|
December 31, 2017
|
||||||||
|
Revolving loan facility
|
2.88%
|
July 2023
|
$
|
187,631
|
|
$
|
3,000
|
|
|||
|
Term loan facility
|
3.76%
|
July 2023
|
1,150,000
|
|
680,000
|
|
|||||
|
Senior notes—fixed rate
|
3.81%
|
May 2018
|
—
|
|
25,000
|
|
|||||
|
Senior notes—fixed rate
|
4.60%
|
May 2021
|
75,000
|
|
75,000
|
|
|||||
|
Senior notes—fixed rate
|
3.13%
|
December 2020
|
100,000
|
|
100,000
|
|
|||||
|
Senior notes—fixed rate
|
4.23%
|
July 2028
|
350,000
|
|
—
|
|
|||||
|
Capital lease obligations
|
5.28%
|
Various through 2029
|
17,587
|
|
19,889
|
|
|||||
|
Notes payable and other
|
4.23%
|
Various through 2030
|
87,608
|
|
12,384
|
|
|||||
|
Debt issuance costs
|
(5,256
|
)
|
(2,261
|
)
|
|||||||
|
Total debt, capital lease obligations, and notes payable
|
$
|
1,962,570
|
|
$
|
913,012
|
|
|||||
|
Less: current maturities
|
66,543
|
|
47,746
|
|
|||||||
|
Total long-term debt, capital lease obligations, and notes payable
|
$
|
1,896,027
|
|
$
|
865,266
|
|
|||||
Bank financing.
In August 2011, Polaris entered into a
$350,000,000
unsecured revolving loan facility. In March 2015, Polaris amended the loan facility to increase the facility to
$500,000,000
and to provide more beneficial covenant and interest rate terms. The amended terms also extended the expiration date to March 2020. Interest is charged at rates based
61
on a LIBOR or “prime” base rate. In May 2016, Polaris amended the revolving loan facility to increase the facility to
$600,000,000
and extend the expiration date to May 2021. The amended terms also established a
$500,000,000
term loan facility. In November 2016, Polaris amended the revolving loan facility to increase the term loan facility to
$750,000,000
.
In July 2018, Polaris amended the revolving loan facility to increase the facility to
$700,000,000
and increase the term loan facility to
$1,180,000,000
, of which
$1,150,000,000
was outstanding as of
December 31, 2018
. The expiration date of the facility was extended to July 2023, and interest will continue to be charged at rates based on a LIBOR or “prime” base rate. Under the facility, the Company is required to make principal payments totaling
$59,000,000
over the next 12 months, which are classified as current maturities.
In December 2010, the Company entered into a Master Note Purchase Agreement to issue
$25,000,000
of unsecured senior notes due
May 2018
and
$75,000,000
of unsecured senior notes due
May 2021
(collectively, the “Senior Notes”). The Senior Notes were issued in May 2011. In December 2013, the Company entered into a First Supplement to Master Note Purchase Agreement, under which the Company issued
$100,000,000
of unsecured senior notes due
December 2020
. In July 2018, the Company entered into a Master Note Purchase Agreement to issue $350,000,000 of unsecured senior notes due July 2028.
The unsecured loan facility and the amended Master Note Purchase Agreement contain covenants that require Polaris to maintain certain financial ratios, including minimum interest coverage and maximum leverage ratios. Polaris was in compliance with all such covenants as of
December 31, 2018
.
Debt issuance costs are recognized as a reduction in the carrying value of the related long-term debt in the consolidated balance sheets and are being amortized to interest expense in the consolidated statements of income over the expected remaining terms of the related debt.
A property lease agreement for a manufacturing facility which Polaris began occupying in Opole, Poland commenced in February 2014. The Poland property lease is accounted for as a capital lease.
As a component of the Boat Holdings merger agreement, Polaris has committed to make a series of deferred payments to the former owners following the closing date of the merger through July 2030. The original discounted payable was for
$76,733,000
, all of which was outstanding as of
December 31, 2018
. The outstanding balance is included in long-term debt and current portion of long-term debt in the consolidated balance sheets.
The Company has a mortgage note payable agreement for land, on which Polaris built the Huntsville, Alabama manufacturing facility in 2016. The original mortgage note payable was for
$14,500,000
, of which
$10,875,000
was outstanding as of
December 31, 2018
. The outstanding balance is included in notes payable and other. The payment of principal and interest for the note payable is forgivable if the Company satisfies certain job commitments over the term of the note. The Company has met the required commitments to date. Forgivable loans related to other Company facilities are included within long-term debt and current portion of long-term debt in the consolidated balance sheets.
The following summarizes activity under Polaris’ credit arrangements (dollars in thousands):
|
2018
|
2017
|
2016
|
|||||||||
|
Total borrowings at December 31
|
$
|
1,862,631
|
|
$
|
883,000
|
|
$
|
1,112,142
|
|
||
|
Average outstanding borrowings during year
|
$
|
1,474,485
|
|
$
|
1,133,641
|
|
$
|
638,614
|
|
||
|
Maximum outstanding borrowings during year
|
$
|
1,999,731
|
|
$
|
1,319,105
|
|
$
|
1,234,337
|
|
||
|
Interest rate at December 31
|
3.64
|
%
|
2.91
|
%
|
2.25
|
%
|
|||||
Letters of credit.
At
December 31, 2018
, Polaris had open letters of credit totaling
$18,718,000
. The amounts are primarily related to inventory purchases and are reduced as the purchases are received.
Dealer financing programs.
Certain finance companies, including Polaris Acceptance, an affiliate, and TCF Financial Corporation (see Note 10), provide floor plan financing to dealers on the purchase of Polaris products. The amount financed by worldwide dealers under these arrangements at
December 31, 2018
, was approximately
$1,643,771,000
. Polaris has agreed to repurchase products repossessed by the finance companies up to an annual maximum of no more than
15 percent
of the average month end balances outstanding during the prior calendar year for Polaris Acceptance, and
100 percent
of the balances outstanding for TCF Financial Corporation. Polaris’ financial exposure under these arrangements is limited to the difference between the amount paid to the finance companies for repurchases and the amount received on the resale of the repossessed product. No material losses have been incurred under these agreements
62
during the periods presented. As a part of its marketing program, Polaris contributes to the cost of dealer financing up to certain limits and subject to certain conditions. Such expenditures are included as an offset to sales in the accompanying consolidated statements of income.
Note 7. Goodwill and Other Intangible Assets
ASC Topic 350 prohibits the amortization of goodwill and intangible assets with indefinite useful lives. Topic 350 requires that these assets be reviewed for impairment at least annually. The Company periodically evaluates the remaining useful lives of indefinite-lived intangible assets to ensure they continue to be indefinite-lived. An impairment charge for goodwill is recognized only when the estimated fair value of a reporting unit, including goodwill, is less than its carrying amount. An impairment charge for an indefinite-lived intangible asset is recognized when its fair value is less than its carrying amount.
During the fourth quarter of 2018, the Company voluntarily changed the date of the annual impairment test from December 31 to October 1. This voluntary change is preferable under the circumstances as it provides the Company with additional time to complete its annual goodwill and indefinite-lived intangible asset impairment testing in advance of its year-end reporting and results in better alignment with the timing of the Company’s long-range planning and forecasting process. The voluntary change in accounting principle related to the annual testing date will not delay, accelerate or avoid an impairment charge. This change is not applied retrospectively as it is impracticable to do so because retrospective application would require application of significant estimates and assumptions with the use of hindsight. Accordingly, the change will be applied prospectively.
The Company performed the annual impairment test as of October 1, 2018 and December 31, 2017. The results of the impairment test indicated that no goodwill or indefinite-lived intangible asset impairment existed as of the test date. The Company has had no historical impairments of goodwill. In accordance with Topic 350, the Company will continue to complete an impairment analysis on an annual basis or more frequently if an event or circumstance that would more likely than not reduce the fair value of a reporting unit below its carrying amount occurs. In 2017, the Company recorded impairments of certain developed technology intangible assets, primarily related to the wind down of Victory Motorcycles. See Note 15 for additional discussion of the wind down activities.
Goodwill and other intangible assets, net of accumulated amortization, for the periods ended
December 31, 2018
and
2017
are as follows (in thousands):
|
2018
|
2017
|
||||||
|
Goodwill
|
$
|
647,077
|
|
$
|
433,374
|
|
|
|
Other intangible assets, net
|
870,517
|
|
347,212
|
|
|||
|
Total goodwill and other intangible assets, net
|
$
|
1,517,594
|
|
$
|
780,586
|
|
|
Additions to goodwill and other intangible assets in 2018 primarily relate to the acquisition of Boat Holdings in July 2018. The aggregate purchase price was allocated on a preliminary basis to the assets acquired and liabilities assumed based on their estimated fair values at the date of acquisition. Boat Holding’s financial results are included in the Company’s consolidated results from the date of acquisition. As of December 31, 2018, the purchase price allocation remains preliminary. The pro forma financial results and the preliminary purchase price allocation are included in Note 3. There were no material additions to goodwill and other intangible assets in 2017.
The changes in the carrying amount of goodwill for the years ended
December 31, 2018
and
2017
are as follows (in thousands):
|
2018
|
2017
|
||||||
|
Balance as of beginning of year
|
$
|
433,374
|
|
$
|
421,563
|
|
|
|
Goodwill from businesses acquired
|
218,191
|
|
1,563
|
|
|||
|
Currency translation effect on foreign goodwill balances
|
(4,488
|
)
|
10,248
|
|
|||
|
Balance as of end of year
|
$
|
647,077
|
|
$
|
433,374
|
|
|
63
For other intangible assets, the changes in the net carrying amount for the years ended
December 31, 2018
and
2017
are as follows (in thousands):
|
2018
|
2017
|
||||||||||||||
|
Gross
Amount |
Accumulated
Amortization |
Gross
Amount |
Accumulated
Amortization |
||||||||||||
|
Other intangible assets, beginning
|
$
|
423,846
|
|
$
|
(76,634
|
)
|
$
|
420,546
|
|
$
|
(49,130
|
)
|
|||
|
Intangible assets acquired during the period
|
557,390
|
|
—
|
|
(461
|
)
|
—
|
|
|||||||
|
Intangible assets disposed of during the period
|
(13,659
|
)
|
13,659
|
|
—
|
|
—
|
|
|||||||
|
Amortization expense
|
—
|
|
(32,927
|
)
|
—
|
|
(25,855
|
)
|
|||||||
|
Impairment
|
—
|
|
—
|
|
(3,657
|
)
|
1,987
|
|
|||||||
|
Currency translation effect on foreign balances
|
(2,924
|
)
|
1,766
|
|
7,418
|
|
(3,636
|
)
|
|||||||
|
Other intangible assets, ending
|
$
|
964,653
|
|
$
|
(94,136
|
)
|
$
|
423,846
|
|
$
|
(76,634
|
)
|
|||
The components of other intangible assets were as follows (in thousands):
|
December 31, 2018
|
Estimated Life
(Years) |
Gross Carrying
Amount |
Accumulated
Amortization |
Net
|
|||||||||
|
Non-compete agreements
|
4
|
$
|
2,630
|
|
$
|
(329
|
)
|
$
|
2,301
|
|
|||
|
Dealer/customer related
|
5-20
|
506,401
|
|
(85,614
|
)
|
420,787
|
|
||||||
|
Developed technology
|
5-7
|
13,323
|
|
(8,193
|
)
|
5,130
|
|
||||||
|
Total amortizable
|
522,354
|
|
(94,136
|
)
|
428,218
|
|
|||||||
|
Non-amortizable—brand/trade names
|
442,299
|
|
—
|
|
442,299
|
|
|||||||
|
Total other intangible assets, net
|
$
|
964,653
|
|
$
|
(94,136
|
)
|
$
|
870,517
|
|
||||
|
December 31, 2017
|
Estimated Life
(Years) |
Gross Carrying
Amount |
Accumulated
Amortization |
Net
|
|||||||||
|
Non-compete agreements
|
5
|
$
|
540
|
|
$
|
(540
|
)
|
$
|
—
|
|
|||
|
Dealer/customer related
|
5-10
|
169,694
|
|
(60,638
|
)
|
109,056
|
|
||||||
|
Developed technology
|
5-7
|
22,903
|
|
(15,456
|
)
|
7,447
|
|
||||||
|
Total amortizable
|
193,137
|
|
(76,634
|
)
|
116,503
|
|
|||||||
|
Non-amortizable—brand/trade names
|
230,709
|
|
—
|
|
230,709
|
|
|||||||
|
Total other intangible assets, net
|
$
|
423,846
|
|
$
|
(76,634
|
)
|
$
|
347,212
|
|
||||
Amortization expense for intangible assets
for the year ended December 31, 2018
and
2017
was
$32,927,000
and
$25,855,000
, respectively. Estimated amortization expense for
2019
through
2023
is as follows:
2019
,
$40,955,000
;
2020
,
$35,831,000
;
2021
,
$33,036,000
;
2022
,
$28,069,000
;
2023
,
$25,539,000
; and after
2023
,
$264,788,000
. The preceding expected amortization expense is an estimate and actual amounts could differ due to additional intangible asset acquisitions, changes in foreign currency rates or impairment of intangible assets.
64
Note 8. Income Taxes
The Tax Cuts and Jobs Act (the “Act”) was enacted on December 22, 2017. The Act reduced the U.S. federal corporate tax rate from 35% to 21%, required companies to pay a one-time transition tax on earnings of certain foreign subsidiaries that were previously tax deferred and created new taxes on certain foreign-sourced earnings.
At December 31, 2017, the Company had not completed its accounting for the tax effects of enactment of the Act; however, in certain cases, as described below, the Company made a reasonable estimate of the effects on its existing deferred tax balances and the one-time transition tax. In other cases, the Company had not been able to make a reasonable estimate and accounted for those items based on existing accounting under ASC 740,
Income Taxes
. For the items for which the Company was able to determine a reasonable estimate, it recognized a provisional amount of
$55,400,000
, which was included as a component of income tax expense from continuing operations in 2017.
Provisional amounts
Deferred tax assets and liabilities.
The Company remeasured certain deferred tax assets and liabilities based on the rates at which they are expected to reverse in the future. The provisional amount recorded related to the remeasurement of the Company’s deferred tax balance was an increase to tax expense of
$55,800,000
in 2017.
Foreign tax effects
. The one-time transition tax is based on the Company’s total post-1986 earnings and profits (E&P) which were previously deferred from U.S. income taxes. The Company recorded a provisional amount for its one-time transition tax liability for all of its foreign subsidiaries, resulting in a decrease in income tax expense of
$368,000
in 2017. No additional income taxes had been provided for any remaining undistributed foreign earnings not subject to the transition tax and any additional outside basis difference inherent in these entities as these amounts continue to be indefinitely reinvested in foreign operations.
The Company has applied the guidance in ASU 2018-05,
Income Taxes (Topic 740): Amendments to SEC Paragraphs Pursuant to SEC Staff Accounting Bulletin No. 118
, when accounting for the enactment-date effects of the Act. During the fourth quarter of 2018, the Company elected the period cost method related to the Global Intangible Low-Taxed Income (GILTI) and completed its accounting for the tax effects of the Act which resulted in an immaterial change to the provisional amounts described above.
Polaris’ income from continuing operations before income taxes was generated from its United States and foreign operations as follows (in thousands):
|
For the Years Ended December 31,
|
|||||||||||
|
2018
|
2017
|
2016
|
|||||||||
|
United States
|
$
|
344,728
|
|
$
|
264,207
|
|
$
|
262,403
|
|
||
|
Foreign
|
84,521
|
|
54,584
|
|
50,848
|
|
|||||
|
Income from continuing operations before income taxes
|
$
|
429,249
|
|
$
|
318,791
|
|
$
|
313,251
|
|
||
Components of Polaris’ provision for income taxes for continuing operations are as follows (in thousands):
|
For the Years Ended December 31,
|
|||||||||||
|
2018
|
2017
|
2016
|
|||||||||
|
Current:
|
|||||||||||
|
Federal
|
$
|
39,051
|
|
$
|
41,134
|
|
$
|
103,717
|
|
||
|
State
|
3,759
|
|
7,264
|
|
4,780
|
|
|||||
|
Foreign
|
27,539
|
|
22,267
|
|
17,367
|
|
|||||
|
Deferred
|
23,643
|
|
75,634
|
|
(25,561
|
)
|
|||||
|
Total provision for income taxes for continuing operations
|
$
|
93,992
|
|
$
|
146,299
|
|
$
|
100,303
|
|
||
65
Reconciliation of the Federal statutory income tax rate to the effective tax rate is as follows:
|
For the Years Ended December 31,
|
||||||||
|
2018
|
2017
|
2016
|
||||||
|
Federal statutory rate
|
21.0
|
%
|
35.0
|
%
|
35.0
|
%
|
||
|
State income taxes, net of federal benefit
|
1.9
|
|
1.4
|
|
1.4
|
|
||
|
Domestic manufacturing deduction
|
(1.4
|
)
|
(0.5
|
)
|
(2.1
|
)
|
||
|
Research and development tax credit
|
(3.1
|
)
|
(5.6
|
)
|
(4.3
|
)
|
||
|
Stock based compensation
|
(1.4
|
)
|
(4.4
|
)
|
—
|
|
||
|
Valuation allowance
|
0.2
|
|
1.2
|
|
—
|
|
||
|
Tax Reform impact
|
0.4
|
|
17.4
|
|
—
|
|
||
|
Non-deductible expenses
|
—
|
|
2.0
|
|
2.4
|
|
||
|
Foreign tax rate differential
|
1.3
|
|
(0.3
|
)
|
(1.6
|
)
|
||
|
Other permanent differences
|
3.0
|
|
(0.3
|
)
|
1.2
|
|
||
|
Effective income tax rate for continuing operations
|
21.9
|
%
|
45.9
|
%
|
32.0
|
%
|
||
The income tax rate for
2018
was
21.9%
as compared with
45.9%
and
32.0%
in
2017
and
2016
, respectively. The lower income tax rate for
2018
, compared with
2017
was primarily due to the reduction in the federal statutory rate to 21 percent effective during 2018 and a non-cash
$55,800,000
write-down of deferred tax assets as a result of the passing of the U.S. tax reform bill in the fourth quarter of 2017, offset by a decrease in excess tax benefits related to share based compensation as compared to 2017. In addition, the Company filed amended returns to claim an increase in the Domestic Manufacturing Deduction as well as other claims for additional credits related to qualified research expenditures incurred in prior years.
The higher income tax rate for 2017, compared with 2016 was primarily due to a non-cash
$55,800,000
write-down of deferred tax assets as a result of the passing of the U.S. tax reform bill in the fourth quarter of 2017, offset by favorable changes related to share-based payment accounting and the related excess tax benefits now recognized as a reduction to income tax expense in accordance with ASU No. 2016-09.
Undistributed earnings relating to certain non-U.S. subsidiaries of approximately
$186,679,000
and
$189,015,000
at
December 31, 2018
and
2017
, respectively, are considered to be permanently reinvested. As explained above, due to the transition tax provisions included in the Act, such earnings were deemed to be repatriated as of December 31, 2017. While these earnings would no longer be subject to incremental U.S. tax, if the Company were to actually distribute these earnings, they could be subject to additional foreign income taxes and/or withholding taxes payable to non-U.S. countries. Determination of the unrecognized deferred foreign income tax liability related to these undistributed earnings is not practicable due to the complexities associated with this hypothetical calculation.
Polaris utilizes the liability method of accounting for income taxes whereby deferred taxes are determined based on the estimated future tax effects of differences between the financial statement and tax bases of assets and liabilities given the provisions of enacted tax laws. The net deferred income taxes consist of the following (in thousands):
|
December 31,
|
|||||||
|
2018
|
2017
|
||||||
|
Deferred income taxes:
|
|||||||
|
Inventories
|
$
|
11,171
|
|
$
|
11,072
|
|
|
|
Accrued expenses
|
105,218
|
|
102,318
|
|
|||
|
Cost in excess of net assets of businesses acquired
|
(22,916
|
)
|
(15,171
|
)
|
|||
|
Property and equipment
|
(72,252
|
)
|
(52,757
|
)
|
|||
|
Employee compensation and benefits
|
56,286
|
|
55,350
|
|
|||
|
Net operating loss and other loss carryforwards
|
13,847
|
|
13,628
|
|
|||
|
Valuation allowance
|
(10,370
|
)
|
(9,057
|
)
|
|||
|
Total net deferred income tax asset
|
$
|
80,984
|
|
$
|
105,383
|
|
|
66
At
December 31, 2018
, the Company had available unused international and acquired federal net operating loss carryforwards of
$28,091,000
. The net operating loss carryforwards will expire at various dates from
2019
to
2030
, with certain jurisdictions having indefinite carryforward terms.
Polaris classified liabilities related to unrecognized tax benefits as long-term income taxes payable in the accompanying consolidated balance sheets in accordance with ASC Topic 740. Polaris recognizes potential interest and penalties related to income tax positions as a component of the provision for income taxes on the consolidated statements of income. Reserves related to potential interest are recorded as a component of long-term income taxes payable. The federal benefit of state taxes and interest related to the reserves is recorded as a component of deferred taxes. The entire balance of unrecognized tax benefits at
December 31, 2018
, if recognized, would affect the Company’s effective tax rate. The Company does not anticipate that total unrecognized tax benefits will materially change in the next twelve months. Tax years
2013
through
2018
remain open to examination by certain tax jurisdictions to which the Company is subject. A reconciliation of the beginning and ending amounts of unrecognized tax benefits is as follows (in thousands):
|
For the Years Ended December 31,
|
|||||||
|
2018
|
2017
|
||||||
|
Balance at January 1,
|
$
|
19,096
|
|
$
|
25,001
|
|
|
|
Gross increases for tax positions of prior years
|
6,586
|
|
1,935
|
|
|||
|
Gross increases for tax positions of current year
|
2,522
|
|
2,397
|
|
|||
|
Decreases due to settlements and other prior year tax positions
|
(2,550
|
)
|
(10,338
|
)
|
|||
|
Currency translation effect on foreign balances
|
(143
|
)
|
101
|
|
|||
|
Balance at December 31,
|
25,511
|
|
19,096
|
|
|||
|
Reserves related to potential interest at December 31,
|
3,090
|
|
1,018
|
|
|||
|
Unrecognized tax benefits at December 31,
|
$
|
28,601
|
|
$
|
20,114
|
|
|
Note 9. Shareholders’ Equity
Stock repurchase program.
The Polaris Board of Directors has authorized the cumulative repurchase of up to
90,460,000
shares of the Company’s common stock. As of
December 31, 2018
,
3,251,000
shares remain available for repurchases under the Board’s authorization. The Company has made the following share repurchases (in thousands):
|
For the Years Ended December 31,
|
|||||||||||
|
|
2018
|
2017
|
2016
|
||||||||
|
Total number of shares repurchased and retired
|
3,184
|
|
1,028
|
|
2,908
|
|
|||||
|
Total investment
|
$
|
348,663
|
|
$
|
90,461
|
|
$
|
245,816
|
|
||
Stock purchase plan.
Polaris maintains an employee stock purchase plan (“Purchase Plan”). A total of
3,000,000
shares of common stock are reserved for this plan. The Purchase Plan permits eligible employees to purchase common stock monthly at
95 percent
of the average of the beginning and end of month stock prices. As of
December 31, 2018
, approximately
1,388,000
shares had been purchased under the Purchase Plan.
Dividends.
Quarterly and total year cash dividends declared per common share
for the year ended December 31, 2018
,
2017
, and
2016
were as follows:
|
For the Years Ended December 31,
|
|||||||||||
|
|
2018
|
2017
|
2016
|
||||||||
|
Quarterly dividend declared and paid per common share
|
$
|
0.60
|
|
$
|
0.58
|
|
$
|
0.55
|
|
||
|
Total dividends declared and paid per common share
|
$
|
2.40
|
|
$
|
2.32
|
|
$
|
2.20
|
|
||
On
January 31, 2019
, the Polaris Board of Directors declared a regular cash dividend of
$0.61
per share payable on
March 15, 2019
to holders of record of such shares at the close of business on
March 1, 2019
.
Net income per share.
Basic earnings per share is computed by dividing net income available to common shareholders by the weighted average number of common shares outstanding during each period, including shares earned under The Deferred Compensation Plan for Directors (“Director Plan”), the ESOP and deferred stock units under the 2007 Omnibus Incentive Plan (“Omnibus Plan”). Diluted earnings per share is computed under the treasury stock method and is
67
calculated to compute the dilutive effect of outstanding stock options issued under the Option Plan and certain shares issued under the Omnibus Plan. A reconciliation of these amounts is as follows (in thousands):
|
For the Years Ended December 31,
|
||||||
|
2018
|
2017
|
2016
|
||||
|
Weighted average number of common shares outstanding
|
62,236
|
62,668
|
64,033
|
|
||
|
Director Plan and deferred stock units
|
177
|
157
|
162
|
|
||
|
ESOP
|
100
|
91
|
101
|
|
||
|
Common shares outstanding—basic
|
62,513
|
62,916
|
64,296
|
|
||
|
Dilutive effect of restricted stock awards
|
679
|
384
|
150
|
|
||
|
Dilutive effect of stock option awards
|
757
|
880
|
712
|
|
||
|
Common and potential common shares outstanding—diluted
|
63,949
|
64,180
|
65,158
|
|
||
During
2018
,
2017
and
2016
, the number of options that were not included in the computation of diluted income per share because the option price was greater than the market price, and therefore, the effect would have been anti-dilutive, were
1,723,000
,
2,768,000
and
2,463,000
, respectively.
Accumulated other comprehensive loss.
Changes in the accumulated other comprehensive loss balance is as follows (in thousands):
|
Foreign
Currency Items |
Cash Flow
Hedging Derivatives |
Retirement Benefit Plan Activity
|
Accumulated Other
Comprehensive Loss |
||||||||||||
|
Balance as of December 31, 2017
|
$
|
(42,442
|
)
|
$
|
(34
|
)
|
(3,153
|
)
|
$
|
(45,629
|
)
|
||||
|
Reclassification to the income statement
|
—
|
|
(9,906
|
)
|
261
|
|
(9,645
|
)
|
|||||||
|
Change in fair value
|
(18,062
|
)
|
10,363
|
|
—
|
|
(7,699
|
)
|
|||||||
|
Balance as of December 31, 2018
|
$
|
(60,504
|
)
|
$
|
423
|
|
$
|
(2,892
|
)
|
$
|
(62,973
|
)
|
|||
The table below provides data about the amount of gains and losses, net of tax, reclassified from accumulated other comprehensive loss into the income statement for cash flow derivatives designated as hedging instruments and for actuarial losses related to retirement benefit plans the years ended
December 31, 2018
and
2017
(in thousands):
|
Derivatives in Cash Flow Hedging Relationships and Retirement Benefit Plan Activity
|
Location of Gain (Loss) Reclassified from Accumulated OCI into Income
|
For the Years Ended December 31,
|
|||||||
|
2018
|
2017
|
||||||||
|
Foreign currency contracts
|
Other expense, net
|
$
|
9,378
|
|
$
|
1,410
|
|
||
|
Foreign currency contracts
|
Cost of sales
|
686
|
|
155
|
|
||||
|
Interest rate contracts
|
Interest expense
|
(158
|
)
|
—
|
|
||||
|
Retirement benefit plan activity
|
Operating expenses
|
(261
|
)
|
—
|
|
||||
|
Total
|
$
|
9,645
|
|
$
|
1,565
|
|
|||
The net amount of the existing gains or losses at
December 31, 2018
that is expected to be reclassified into the income statement within the next 12 months is expected to not be material. See Note 13 for further information regarding Polaris’ derivative activities.
Note 10. Financial Services Arrangements
Polaris Acceptance, a joint venture between Polaris and Wells Fargo Commercial Distribution Finance Corporation, a direct subsidiary of Wells Fargo Bank, N.A. (“Wells Fargo”), which is supported by a partnership agreement between their respective wholly owned subsidiaries, finances substantially all of Polaris’ United States sales of snowmobiles, ORVs, motorcycles, and related PG&A, whereby Polaris receives payment within a few days of shipment of the product.
Polaris’ subsidiary has a
50 percent
equity interest in Polaris Acceptance. Polaris Acceptance sells a majority of its receivable portfolio to a securitization facility (the “Securitization Facility”) arranged by Wells Fargo. The sale of receivables from Polaris Acceptance to the Securitization Facility is accounted for in Polaris Acceptance’s financial statements as a “true-sale” under Accounting Standards Codification Topic 860. Polaris’ allocable share of the income of
68
Polaris Acceptance has been included as a component of income from financial services in the accompanying consolidated statements of income. The partnership agreement is effective through February 2022.
Polaris’ total investment in Polaris Acceptance of
$92,059,000
at
December 31, 2018
is accounted for under the equity method, and is recorded in investment in finance affiliate in the accompanying consolidated balance sheets. At
December 31, 2018
, the outstanding amount of net receivables financed for dealers under this arrangement was
$1,226,353,000
, which included
$573,669,000
in the Polaris Acceptance portfolio and
$652,684,000
of receivables within the Securitization Facility (“Securitized Receivables”).
Polaris has agreed to repurchase products repossessed by Polaris Acceptance up to an annual maximum of
15 percent
of the aggregate average month-end outstanding Polaris Acceptance receivables and Securitized Receivables during the prior calendar year. For calendar year
2018
, the potential
15 percent
aggregate repurchase obligation was approximately
$164,969,000
. Polaris’ financial exposure under this arrangement is limited to the difference between the amounts unpaid by the dealer with respect to the repossessed product plus costs of repossession and the amount received on the resale of the repossessed product. No material losses have been incurred under this agreement during the periods presented.
Summarized financial information for Polaris Acceptance reflecting the effects of the Securitization Facility is presented as follows (in thousands):
|
For the Years Ended December 31,
|
|||||||||||
|
2018
|
2017
|
2016
|
|||||||||
|
Revenues
|
$
|
72,093
|
|
$
|
61,645
|
|
$
|
66,414
|
|
||
|
Interest and operating expenses
|
11,832
|
|
7,590
|
|
6,182
|
|
|||||
|
Net income
|
$
|
60,261
|
|
$
|
54,055
|
|
$
|
60,232
|
|
||
|
As of December 31,
|
|||||||
|
2018
|
2017
|
||||||
|
Finance receivables, net
|
$
|
573,669
|
|
$
|
518,199
|
|
|
|
Other assets
|
102
|
|
96
|
|
|||
|
Total Assets
|
$
|
573,771
|
|
$
|
518,295
|
|
|
|
Notes payable
|
$
|
386,438
|
|
$
|
337,050
|
|
|
|
Other liabilities
|
3,215
|
|
3,717
|
|
|||
|
Partners’ capital
|
184,118
|
|
177,528
|
|
|||
|
Total Liabilities and Partners’ Capital
|
$
|
573,771
|
|
$
|
518,295
|
|
|
A subsidiary of TCF Financial Corporation (“TCF”) finances a portion of Polaris’ United States sales of boats whereby Polaris receives payment within a few days of shipment of the product. Polaris has agreed to repurchase products repossessed by TCF up to a maximum of
100 percent
of the aggregate outstanding TCF receivables balance. At December 31,
2018
, the potential aggregate repurchase obligation was approximately
$201,600,000
. Polaris’ financial exposure under this arrangement is limited to the difference between the amounts unpaid by the dealer with respect to the repossessed product plus costs of repossession and the amount received on the resale of the repossessed product. No material losses have been incurred under this agreement during the periods presented.
Polaris has agreements with Performance Finance, Sheffield Financial and Synchrony Bank, under which these financial institutions provide financing to end consumers of Polaris products. Polaris’ income generated from these agreements has been included as a component of income from financial services in the accompanying consolidated statements of income.
Polaris also administers and provides extended service contracts to consumers and certain insurance contracts to dealers and consumers through various third-party suppliers. Polaris finances its self-insured risks related to extended service contracts, but does not retain any insurance or financial risk under any of the other arrangements. Polaris’ service fee income generated from these arrangements has been included as a component of income from financial services in the accompanying consolidated statements of income.
Note 11. Investment in Other Affiliates
The Company has certain investments in nonmarketable securities of strategic companies. The Company had
$6,133,000
and
$19,435,000
of such investments as of
December 31, 2018
and
2017
, respectively, and are recorded as a component
69
of other long-term assets in the accompanying consolidated balance sheets. As of December 31, 2017, the Company’s investment in Eicher-Polaris Private Limited (EPPL) represented the majority of these investments.
EPPL is a joint venture established in 2012 with Eicher Motors Limited (“Eicher”). Polaris and Eicher each control
50 percent
of the joint venture, which is intended to design, develop and manufacture a full range of new vehicles for India and other emerging markets. The investment in EPPL is accounted for under the equity method, with Polaris’ proportionate share of income or loss recorded within the consolidated financial statements on a
one
month lag due to financial information not being available timely.
During the first quarter of 2018, the Board of Directors of EPPL approved a shut down of the operations of the EPPL joint venture. As a result of the expected closure, the Company fully impaired its investment in EPPL by recognizing an impairment charge of
$18,733,000
within Equity in loss of other affiliates in the consolidated statement of income. The Company has recognized
$27,048,000
of costs, including impairment, associated with the wind-down of EPPL for the year ended December 31, 2018. As of
December 31, 2018
and
2017
, the carrying value of the Company’s investment in EPPL was
$0
and
$18,616,000
, respectively.
Polaris will impair or write off an investment and recognize a loss if and when events or circumstances indicate there is impairment in the investment that is other-than-temporary. When necessary, Polaris evaluates investments in nonmarketable securities for impairment, utilizing level 3 fair value inputs. As a result of the Victory
®
Motorcycles wind down, the Company recognized an impairment of substantially all of its cost-method investment in Brammo, Inc. in the first quarter of 2017. The impairment was recorded within other expense, net in the consolidated statements of income, and reduced the Brammo investment. See Note 15 for additional discussion related to charges incurred related to the Victory Motorcycles wind down.
In October 2017, an agreement was signed to sell the assets of Brammo, Inc. to a third party. The sale was completed in the fourth quarter of 2017, and as a result of the sale, Polaris recorded a gain, which is included in Other expense (income), net on the 2017 consolidated statements of income. During the first quarter of 2018, Polaris received additional distributions from Brammo and recognized a gain of
$13,478,000
, which is included in Other expense (income) on the consolidated statements of income.
Note 12. Commitments and Contingencies
Product liability.
Polaris is subject to product liability claims in the normal course of business. The Company carries excess insurance coverage for catastrophic product liability claims. Polaris self-insures product liability claims before the policy date and up to the purchased catastrophic insurance coverage after the policy date. The estimated costs resulting from any losses are charged to operating expenses when it is probable a loss has been incurred and the amount of the loss is reasonably estimable. The Company utilizes historical trends and actuarial analysis tools, along with an analysis of current claims, to assist in determining the appropriate loss reserve levels. At
December 31, 2018
, the Company had an accrual of
$52,801,000
for the probable payment of pending claims related to continuing product liability litigation associated with Polaris products. This accrual is included as a component of other accrued expenses in the accompanying consolidated balance sheets.
Litigation.
Polaris is also a defendant in lawsuits and subject to other claims arising in the normal course of business, including matters related to intellectual property, commercial matters, product liability claims, and putative class action lawsuits. As of
December 31, 2018
, the Company is party to two putative class actions pending against Polaris in the United States, alleging that certain Polaris products caused personal injury, economic losses, and other damages resulting from unresolved fire hazards and excessive heat hazards. The Company is unable to provide an evaluation of the likelihood that a loss will be incurred or an estimate of the range of possible loss.
In the opinion of management, it is unlikely that any legal proceedings pending against or involving Polaris will have a material adverse effect on Polaris’ financial position, results of operations, or cash flows. However, in many of these matters, it is inherently difficult to determine whether a loss is probable or reasonably possible or to estimate the size or range of the possible loss given the variety and potential outcomes of actual and potential claims, the uncertainty of future rulings, the behavior or incentives of adverse parties, and other factors outside of the control of the Company. Accordingly, the Company’s loss reserve may change from time to time, and actual losses could exceed the amounts accrued by an amount that could be material to the Company’s consolidated financial position, results of operations, or cash flows in any particular reporting period.
70
Regulatory
. In the normal course of business, the Company’s products are subject to extensive laws and regulations relating to safety, environmental and other regulations promulgated by the United States federal government and individual states, as well as international regulatory authorities. Failure to comply with applicable regulations could result in fines, penalties or other costs.
Leases.
Polaris leases buildings and equipment under non-cancelable operating leases. Total rent expense under all operating lease agreements was
$38,179,000
,
$36,537,000
and
$22,534,000
for
2018
,
2017
and
2016
, respectively.
A property lease agreement signed in 2013 for a manufacturing facility which Polaris began occupying in Opole, Poland commenced in February 2014. The Poland property lease is accounted for as a capital lease.
Future minimum annual lease payments under capital and operating leases with noncancelable terms in excess of one year as of
December 31, 2018
, are as follows (in thousands):
|
Capital
Leases |
Operating
Leases |
||||||
|
2019
|
$
|
2,072
|
|
$
|
39,047
|
|
|
|
2020
|
2,053
|
|
29,788
|
|
|||
|
2021
|
2,020
|
|
21,294
|
|
|||
|
2022
|
1,962
|
|
14,352
|
|
|||
|
2023
|
1,942
|
|
10,072
|
|
|||
|
Thereafter
|
10,648
|
|
13,294
|
|
|||
|
Total future minimum lease obligation
|
$
|
20,697
|
|
$
|
127,847
|
|
|
Note 13. Derivative Instruments and Hedging Activities
The Company is exposed to certain risks relating to its ongoing business operations. From time to time, the primary risks managed by using derivative instruments are foreign currency risk, interest rate risk and commodity price fluctuations. Derivative contracts on various currencies are entered into in order to manage foreign currency exposures associated with certain product sourcing activities and intercompany cash flows. Interest rate swaps are occasionally entered into in order to maintain a balanced risk of fixed and floating interest rates associated with the Company’s long-term debt. Commodity hedging contracts are occasionally entered into in order to manage fluctuating market prices of certain purchased commodities and raw materials that are integrated into the Company’s end products.
The Company’s foreign currency management objective is to mitigate the potential impact of currency fluctuations on the value of its U.S. dollar cash flows and to reduce the variability of certain cash flows at the subsidiary level. The Company actively manages certain forecasted foreign currency exposures and uses a centralized currency management operation to take advantage of potential opportunities to naturally offset foreign currency exposures against each other. The decision of whether and when to execute derivative instruments, along with the duration of the instrument, can vary from period to period depending on market conditions, the relative costs of the instruments and capacity to hedge. The duration is linked to the timing of the underlying exposure, with the connection between the two being regularly monitored. Polaris does not use any financial contracts for trading purposes.
At
December 31, 2018
and
2017
, Polaris had the following open foreign currency contracts (in thousands):
|
December 31, 2018
|
December 31, 2017
|
|||||||||||||||
|
Foreign Currency
|
Notional Amounts
(in U.S. dollars)
|
Net Unrealized
Gain (Loss)
|
Notional Amounts
(in U.S. dollars)
|
Net Unrealized
Gain (Loss)
|
||||||||||||
|
Australian Dollar
|
—
|
|
—
|
|
$
|
24,250
|
|
$
|
(134
|
)
|
||||||
|
Canadian Dollar
|
$
|
55,133
|
|
$
|
2,564
|
|
94,292
|
|
(159
|
)
|
||||||
|
Mexican Peso
|
19,222
|
|
564
|
|
9,999
|
|
(133
|
)
|
||||||||
|
Total
|
$
|
74,355
|
|
$
|
3,128
|
|
$
|
128,541
|
|
$
|
(426
|
)
|
||||
These contracts, with maturities through
March 2020
, met the criteria for cash flow hedges, and are recorded in other current assets or other current liabilities on the consolidated balance sheet. The unrealized gains or losses, after tax, are recorded as a component of accumulated other comprehensive loss in shareholders’ equity.
71
During 2018 the Company entered into interest rate swap transactions to hedge the variable interest rate payments for the Term Loan Facility. In connection with this transaction, the Company pays interest based upon a fixed rate and receives variable rate interest payments based on the one-month LIBOR.
At
December 31, 2018
and
2017
, Polaris had the following open interest rate swap contracts (in thousands):
|
December 31, 2018
|
December 31, 2017
|
|||||||||||||||||
|
Effective Date
|
Maturity Date
|
Notional
Amounts
|
Net Unrealized
Gain (Loss)
|
Notional
Amounts
|
Net Unrealized
Gain (Loss)
|
|||||||||||||
|
May 2, 2018
|
May 4, 2021
|
$
|
25,000
|
|
$
|
397
|
|
$
|
—
|
|
$
|
—
|
|
|||||
|
September 28, 2018
|
September 30, 2019
|
250,000
|
|
(163
|
)
|
—
|
|
—
|
|
|||||||||
|
September 30, 2019
|
September 30, 2023
|
150,000
|
|
(2,899
|
)
|
—
|
|
—
|
|
|||||||||
|
Total
|
$
|
425,000
|
|
$
|
(2,665
|
)
|
$
|
—
|
|
$
|
—
|
|
||||||
These contracts, with maturities through September 2023, met the criteria for cash flow hedges, and are recorded in other current assets or other current liabilities on the consolidated balance sheet. Assets and liabilities are offset in the consolidated balance sheet if the right of offset exists. The unrealized gains or losses, after tax, are recorded as a component of accumulated other comprehensive loss in shareholders’ equity.
Polaris occasionally enters into derivative contracts to hedge a portion of the exposure related to diesel fuel and aluminum. As of
December 31, 2018
, and
2017
, there were no outstanding commodity derivative contracts in place.
The table below summarizes the carrying values of derivative instruments as of
December 31, 2018
and
2017
(in thousands):
|
|
Carrying Values of Derivative Instruments as of December 31, 2018
|
||||||||||
|
|
Fair Value—
Assets
|
Fair Value—
(Liabilities)
|
Derivative Net
Carrying Value
|
||||||||
|
Derivatives designated as hedging instruments
|
|||||||||||
|
Foreign exchange contracts
(1)
|
$
|
3,128
|
|
$
|
—
|
|
$
|
3,128
|
|
||
|
Interest rate contracts
(1)
|
—
|
|
(2,665
|
)
|
(2,665
|
)
|
|||||
|
Total derivatives designated as hedging instruments
|
$
|
3,128
|
|
$
|
(2,665
|
)
|
$
|
463
|
|
||
|
|
Carrying Values of Derivative Instruments as of December 31, 2017
|
||||||||||
|
|
Fair Value—
Assets
|
Fair Value—
(Liabilities)
|
Derivative Net
Carrying Value
|
||||||||
|
Derivatives designated as hedging instruments
|
|||||||||||
|
Foreign exchange contracts
(1)
|
$
|
621
|
|
$
|
(1,047
|
)
|
$
|
(426
|
)
|
||
|
Total derivatives designated as hedging instruments
|
$
|
621
|
|
$
|
(1,047
|
)
|
$
|
(426
|
)
|
||
|
(1)
|
Assets are included in prepaid expenses and other and liabilities are included in other accrued expenses on the accompanying consolidated balance sheets.
|
Gains and losses on the derivative representing either hedge ineffectiveness or hedge components excluded from the assessment of effectiveness are recognized in the current income statement.
The amount of gains (losses), net of tax, related to the effective portion of derivative instruments designated as cash flow hedges included in accumulated other comprehensive loss for the years ended
December 31, 2018
and
2017
was
$457,000
and
(330,000)
, respectively.
See Note 9 for information about the amount of gains and losses, net of tax, reclassified from accumulated other comprehensive income loss into the income statement for derivative instruments designated as hedging instruments. The ineffective portion of foreign currency contracts was not material for the years ended
December 31, 2018
and
2017
.
Note 14. Segment Reporting
The Company’s reportable segments are based on the Company’s method of internal reporting, which generally segregates the operating segments by product line, inclusive of wholegoods and PG&A. The internal reporting of these operating segments is defined based, in part, on the reporting and review process used by the Company’s Chief
72
Executive Officer. The Company has
six
operating segments: 1) ORV, 2) Snowmobiles, 3) Motorcycles, 4) Global Adjacent Markets, 5) Aftermarket, and 6) Boats, and
five
reportable segments: 1) ORV/Snowmobiles, 2) Motorcycles, 3) Global Adjacent Markets, 4) Aftermarket, and 5) Boats.
Through June 30, 2018, the Company reported under four segments for segment reporting. However, during the third quarter ended September 30, 2018, as a result of the Boat Holdings acquisition, the Company established a new reporting segment, Boats, which includes only the results of Boat Holdings since the acquisition on July 2, 2018.
The ORV/Snowmobiles segment includes the aggregated results of the ORV and Snowmobiles operating segments. The Motorcycles, Global Adjacent Markets, Aftermarket, and Boats segments include the results for those respective operating segments. The Corporate amounts include costs that are not allocated to individual segments, which include incentive-based compensation and other unallocated manufacturing costs. Additionally, given the commonality of customers, manufacturing and asset management, the Company does not maintain separate balance sheets for each segment. Accordingly, the segment information presented below is limited to sales and gross profit data (in thousands):
|
For the Years Ended December 31,
|
|||||||||||
|
2018
|
2017
|
2016
|
|||||||||
|
Sales
|
|||||||||||
|
ORV/Snowmobiles
|
$
|
3,919,417
|
|
$
|
3,570,753
|
|
$
|
3,283,890
|
|
||
|
Motorcycles
|
545,646
|
|
576,068
|
|
699,171
|
|
|||||
|
Global Adjacent Markets
|
444,644
|
|
396,764
|
|
341,937
|
|
|||||
|
Aftermarket
|
889,177
|
|
884,892
|
|
191,631
|
|
|||||
|
Boats
|
279,656
|
|
—
|
|
—
|
|
|||||
|
Total sales
|
6,078,540
|
|
5,428,477
|
|
4,516,629
|
|
|||||
|
Gross profit
|
|||||||||||
|
ORV/Snowmobiles
|
1,113,908
|
|
1,054,557
|
|
907,597
|
|
|||||
|
Motorcycles
|
63,045
|
|
16,697
|
|
87,538
|
|
|||||
|
Global Adjacent Markets
|
116,583
|
|
94,920
|
|
95,149
|
|
|||||
|
Aftermarket
|
234,365
|
|
225,498
|
|
46,289
|
|
|||||
|
Boats
|
46,252
|
|
—
|
|
—
|
|
|||||
|
Corporate
|
(72,953
|
)
|
(67,021
|
)
|
(30,950
|
)
|
|||||
|
Total gross profit
|
$
|
1,501,200
|
|
$
|
1,324,651
|
|
$
|
1,105,623
|
|
||
Note 15. Victory Motorcycles Wind Down
In January 2017, the Company’s Board of Directors approved a strategic plan to wind down the Victory Motorcycles brand. The Company began wind down activities during the first quarter of 2017. As a result of the activities, the Company recognized total pretax charges of
$5,063,000
and
$59,792,000
for the years ended December 31, 2018 and 2017, respectively, that are within the scope of ASC 420,
Exit or Disposal Cost Obligations
(ASC 420). These totals exclude the positive pretax impact of
$2,680,000
and the negative pretax impact of
$21,184,000
incurred for other wind-down activities for the years ended December 31, 2018 and 2017, respectively, as well as the pretax impact of a
$3,570,000
gain in 2017 resulting from the sale of a cost method investment that was previously impaired. The total impact of wind down activities in 2018 was
$2,383,000
, inclusive of promotional activity. The total impact of wind down activities in 2017 was
$77,406,000
, inclusive of promotional activity and a gain resulting from the sale of Brammo. Substantially all costs related to wind-down activities were recognized by the end of 2018.
As a result of the wind down activities, the Company has incurred expenses within the scope of ASC 420 consisting of dealer termination, supplier termination, dealer litigation, employee separation, asset impairment charges, including the impairment of a cost method investment, inventory write-down charges and other costs. The wind down expenses have been included as components of cost of sales, selling and administrative expenses, general and administrative expenses or other expense (income), net, in the consolidated statements of income. Charges related to the wind down plan for the years ended December 31, 2018 and 2017 within the scope of ASC 420 were as follows (in thousands):
73
|
For the years ended December 31,
|
|||||||
|
2018
|
2017
|
||||||
|
Contract termination charges
|
$
|
3,433
|
|
$
|
21,632
|
|
|
|
Asset impairment charges
|
—
|
|
18,760
|
|
|||
|
Inventory charges
|
—
|
|
10,169
|
|
|||
|
Other costs
|
1,630
|
|
9,231
|
|
|||
|
Total
|
$
|
5,063
|
|
$
|
59,792
|
|
|
Total reserves related to the Victory Motorcycles wind down activities were
$2,697,000
and
$5,645,000
as of December 31, 2018 and 2017, respectively. These reserves are included in other accrued expenses and inventory in the consolidated balance sheets. Changes to the reserves during the years ended December 31, 2018 and 2017 were as follows (in thousands):
|
Contract termination charges
|
Inventory charges
|
Other costs
|
Total
|
||||||||||||
|
Reserves balance as of January 1, 2017
|
—
|
|
—
|
|
—
|
|
—
|
|
|||||||
|
Expenses
|
$
|
21,632
|
|
$
|
10,169
|
|
$
|
9,231
|
|
$
|
41,032
|
|
|||
|
Cash payments / scrapped inventory
|
(18,445
|
)
|
(9,392
|
)
|
(7,550
|
)
|
(35,387
|
)
|
|||||||
|
Reserves balance as of December 31, 2017
|
$
|
3,187
|
|
$
|
777
|
|
$
|
1,681
|
|
$
|
5,645
|
|
|||
|
Expenses
|
3,433
|
|
—
|
|
1,630
|
|
5,063
|
|
|||||||
|
Cash payments / scrapped inventory
|
(5,155
|
)
|
(399
|
)
|
(2,457
|
)
|
(8,011
|
)
|
|||||||
|
Reserves balance as of December 31, 2018
|
$
|
1,465
|
|
$
|
378
|
|
$
|
854
|
|
$
|
2,697
|
|
|||
Note 16. Quarterly Financial Data (unaudited)
|
Sales
|
Gross profit
|
Net income
|
Diluted net income per share
|
||||||||||||
|
(In thousands, except per share data)
|
|||||||||||||||
|
2018
|
|||||||||||||||
|
First Quarter
|
$
|
1,297,473
|
|
$
|
323,481
|
|
$
|
55,714
|
|
$
|
0.85
|
|
|||
|
Second Quarter
|
1,502,532
|
|
385,176
|
|
92,540
|
|
1.43
|
|
|||||||
|
Third Quarter
|
1,651,415
|
|
401,270
|
|
95,529
|
|
1.50
|
|
|||||||
|
Fourth Quarter
|
1,627,120
|
|
391,273
|
|
91,474
|
|
1.47
|
|
|||||||
|
Year
|
$
|
6,078,540
|
|
$
|
1,501,200
|
|
$
|
335,257
|
|
$
|
5.24
|
|
|||
|
|
|
|
|
||||||||||||
|
2017
|
|||||||||||||||
|
First Quarter
|
$
|
1,153,782
|
|
$
|
242,491
|
|
$
|
(2,911
|
)
|
$
|
(0.05
|
)
|
|||
|
Second Quarter
|
1,364,920
|
|
350,386
|
|
62,041
|
|
0.97
|
|
|||||||
|
Third Quarter
|
1,478,726
|
|
363,962
|
|
81,888
|
|
1.28
|
|
|||||||
|
Fourth Quarter
|
1,431,049
|
|
367,812
|
|
31,474
|
|
0.49
|
|
|||||||
|
Year
|
$
|
5,428,477
|
|
$
|
1,324,651
|
|
$
|
172,492
|
|
$
|
2.69
|
|
|||
Item 9. Changes in and Disagreements with Accountants on Accounting and Financial Disclosure
Not applicable.
Item 9A. Controls and Procedures
The Company carried out an evaluation, under the supervision and with the participation of the Company’s management, including the Company’s Chief Executive Officer and its Executive Vice President—Finance and Chief Financial Officer, of the effectiveness of the design and operation of the Company’s disclosure controls and procedures (as defined in Rule 13a-15(e) of the Securities Exchange Act of 1934, as amended) as of the end of the period covered by this report.
74
Based upon that evaluation, the Company’s Chief Executive Officer along with the Company’s Executive Vice President—Finance and Chief Financial Officer concluded that, as of the end of the period covered by this Annual Report on Form 10-K, the Company’s disclosure controls and procedures were effective to ensure that information required to be disclosed by the Company in reports that it files or submits under the Securities Exchange Act of 1934, as amended, is (1) recorded, processed, summarized and reported within the time periods specified in SEC rules and forms, and (2) accumulated and communicated to the Company’s management including its Chief Executive Officer and Executive Vice President—Finance and Chief Financial Officer, in a manner that allows timely decisions regarding required disclosure. No changes have occurred during the period covered by this report or since the evaluation date that would have a material effect on the disclosure controls and procedures.
The Company’s internal control report is included in this report after Item 8, under the caption “Management’s Report on Company’s Internal Control over Financial Reporting.”
Item 9B. Other Information
Not applicable.
PART III
Item 10. Directors, Executive Officers and Corporate Governance
The sections entitled “Proposal 1 – Election of Directors—Information Concerning Nominees and Directors,” “Corporate Governance—Committees of the Board and Meetings—Audit Committee,” “Corporate Governance—Code of Business Conduct and Ethics” and “Section 16(a) Beneficial Ownership Reporting Compliance” in the Polaris definitive Proxy Statement to be filed on or about March 11, 2019 (the “
2019
Proxy Statement”), are incorporated herein by reference. See also Item 1 “Executive Officers of the Registrant” in Part I hereof.
Item 11. Executive Compensation
The sections entitled “Corporate Governance—Compensation Committee Interlocks and Insider Participation,” “Compensation Discussion and Analysis,” “Compensation Committee Report,” “Executive Compensation,” “Pay Ratio Disclosure,” “Potential Payments Upon Termination or Change-In-Control” and “Director Compensation” in the Company’s
2019
Proxy Statement are incorporated herein by reference.
Item 12. Security Ownership of Certain Beneficial Owners and Management and Related Stockholder Matters
The sections entitled “Security Ownership of Certain Beneficial Owners and Management” and “Equity Compensation Plan Information” in the Company’s
2019
Proxy Statement are incorporated herein by reference.
Item 13. Certain Relationships and Related Transactions, and Director Independence
The sections entitled “Corporate Governance—Corporate Governance Guidelines and Independence” and “Corporate Governance—Certain Relationships and Related Transactions” in the Company’s
2019
Proxy Statement are incorporated herein by reference.
Item 14. Principal Accounting Fees and Services
The section entitled “Fees Paid to Independent Registered Public Accounting Firm” in the Company’s
2019
Proxy Statement is incorporated herein by reference.
75
PART IV
Item 15. Exhibits, Financial Statement Schedules
(a) The following documents are filed as part of this report:
(1) Financial Statements
The financial statements listed in the Index to Financial Statements on page 38 are included in Part II of this Form 10-K.
(2) Financial Statement Schedules
Schedule II—Valuation and Qualifying Accounts is included on page 78 of this report.
All other supplemental financial statement schedules have been omitted because they are not applicable or are not required or the information required to be set forth therein is included in the Consolidated Financial Statements or Notes thereto.
(3) Exhibits
The Exhibits to this report are listed in the Exhibit Index to Annual Report on Form 10-K on pages 79 to 82.
A copy of any of these Exhibits will be furnished at a reasonable cost to any person who was a shareholder of the Company as of
February 14, 2019
, upon receipt from any such person of a written request for any such exhibit. Such request should be sent to Polaris Industries Inc., 2100 Highway 55, Medina, Minnesota 55340, Attention: Investor Relations.
(b) Exhibits
Included in Item 15(a)(3) above.
(c) Financial Statement Schedules
Included in Item 15(a)(2) above.
Item 16. Form 10-K Summary
None.
76
SIGNATURES
Pursuant to the requirements of Section 13 or 15(d) of the Securities Exchange Act of 1934, the registrant has duly caused this report to be signed on its behalf by the undersigned, thereunto duly authorized, in the City of Minneapolis, State of Minnesota on
February 14, 2019
.
|
POLARIS INDUSTRIES INC.
|
||
|
By:
|
/
S
/ S
COTT
W. W
INE
|
|
|
Scott W. Wine
|
||
|
Chairman and Chief Executive Officer
|
||
Pursuant to the requirements of the Securities Exchange Act of 1934, this report has been signed below by the following persons on behalf of the registrant in the capacities and on the dates indicated.
|
Signature
|
Title
|
Date
|
|
|
/
S
/ S
COTT
W. W
INE
|
Chairman and Chief Executive Officer
(Principal Executive Officer)
|
February 14, 2019
|
|
|
Scott W. Wine
|
|||
|
/
S
/ M
ICHAEL
T. S
PEETZEN
|
Executive Vice President — Finance and Chief Financial Officer (Principal Financial and Accounting Officer)
|
February 14, 2019
|
|
|
Michael T. Speetzen
|
|||
|
*
|
Director
|
February 14, 2019
|
|
|
George W. Bilicic
|
|||
|
*
|
Director
|
February 14, 2019
|
|
|
Annette K. Clayton
|
|||
|
*
|
Director
|
February 14, 2019
|
|
|
Kevin M. Farr
|
|||
|
*
|
Director
|
February 14, 2019
|
|
|
Gary E. Hendrickson
|
|||
|
*
|
Director
|
February 14, 2019
|
|
|
Gwenne A. Henricks
|
|||
|
*
|
Director
|
February 14, 2019
|
|
|
Bernd F. Kessler
|
|||
|
*
|
Director
|
February 14, 2019
|
|
|
Lawrence D. Kingsley
|
|||
|
*
|
Lead Director
|
February 14, 2019
|
|
|
John P. Wiehoff
|
|||
|
*By:
|
/s/ S
COTT
W. W
INE
|
February 14, 2019
|
|
|
(Scott W. Wine Attorney-in-Fact)
|
|||
|
*
|
Scott W. Wine, pursuant to Powers of Attorney executed by each of the officers and directors listed above whose name is marked by an “*” and filed as an exhibit hereto, by signing his name hereto does hereby sign and execute this report of Polaris Industries Inc. on behalf of each of such officers and directors in the capacities in which the names of each appear above.
|
77
POLARIS INDUSTRIES INC.
SCHEDULE II—VALUATION AND QUALIFYING ACCOUNTS
|
Allowance for Doubtful Accounts
|
Balance at
Beginning of Period |
Additions
Charged to Costs and Expenses |
Additions
Through Acquisition |
Other Changes
Add (Deduct)(1) |
Balance at
End of Period |
||||||||||||||
|
(In thousands)
|
|||||||||||||||||||
|
2016: Deducted from asset accounts—Allowance for doubtful accounts receivable
|
$
|
8,644
|
|
$
|
7,085
|
|
$
|
4,644
|
|
$
|
(934
|
)
|
$
|
19,439
|
|
||||
|
2017: Deducted from asset accounts—Allowance for doubtful accounts receivable
|
$
|
19,439
|
|
$
|
(965
|
)
|
$
|
—
|
|
$
|
(7,560
|
)
|
$
|
10,914
|
|
||||
|
2018: Deducted from asset accounts—Allowance for doubtful accounts receivable
|
$
|
10,914
|
|
$
|
1,058
|
|
$
|
60
|
|
$
|
(2,581
|
)
|
$
|
9,451
|
|
||||
|
(1)
|
Uncollectible accounts receivable written off, net of recoveries.
|
|
Inventory Reserve
|
Balance at
Beginning of Period |
Additions
Charged to Costs and Expenses |
Additions
Through Acquisition |
Other Changes
Add (Deduct)(2) |
Balance at
End of Period |
||||||||||||||
|
(In thousands)
|
|||||||||||||||||||
|
2016: Deducted from asset accounts—Allowance for obsolete inventory
|
$
|
36,269
|
|
$
|
19,770
|
|
$
|
5,165
|
|
$
|
(16,029
|
)
|
$
|
45,175
|
|
||||
|
2017: Deducted from asset accounts—Allowance for obsolete inventory
|
$
|
45,175
|
|
$
|
36,150
|
|
$
|
—
|
|
$
|
(34,206
|
)
|
$
|
47,119
|
|
||||
|
2018: Deducted from asset accounts—Allowance for obsolete inventory
|
$
|
47,119
|
|
$
|
11,565
|
|
$
|
1,947
|
|
$
|
(12,288
|
)
|
$
|
48,343
|
|
||||
|
(2)
|
Inventory disposals, net of recoveries.
|
78
|
POLARIS INDUSTRIES INC.
EXHIBIT INDEX TO ANNUAL REPORT ON
FORM 10-K
For Fiscal Year Ended December 31, 2018
|
|
|
Exhibit Number
|
Description
|
|
Purchase Agreement, dated as of October 11, 2016, by and among TAP Automotive Holdings, LLC, the members of TAP Automotive Holdings, LLC set forth in an annex to the Purchase Agreement, Polaris Industries Inc., a Delaware corporation, and ORIX Funds Corp., solely in its capacity as the seller’s representative (
excluding schedules and exhibits, which the Company agrees to furnish supplementally to the Securities and Exchange Commission upon request)
, incorporated by reference to Exhibit 2.1 to the Company’s Current Report on Form 8-K filed October 12, 2016.
|
|
|
Merger Agreement, dated as of May 29, 2018, by and among Polaris Industries Inc., Polaris Sales Inc., Beam Merger Sub, LLC, Boat Holdings, LLC and the Holder Representative thereunder (
excluding schedules and exhibits, which the Company agrees to furnish supplementally to the Securities and Exchange Commission upon request
), incorporated by reference to Exhibit 2.1 to the Company’s Current Report on Form 8-K filed May 30, 2018.
|
|
|
Restated Articles of Incorporation of Polaris Industries Inc. (the “Company”), effective April 28, 2017, incorporated by reference to Exhibit 3.b to the Company’s Current Report on Form 8-K filed on May 2, 2017.
|
|
|
Bylaws of Polaris Industries Inc., as amended and restated on February 27, 2018, incorporated by reference to Exhibit 3.2 to the Company’s Current Report on Form 8-K filed February 27, 2018.
|
|
|
Specimen Stock Certificate of the Company, incorporated by reference to Exhibit 4 to the Company’s Registration Statement on Form S-4/A, filed November 21, 1994 (No. 033-55769).
|
|
|
Master Note Purchase Agreement by and among Polaris Industries Inc. and the purchasers party thereto, dated December 13, 2010, incorporated by reference to Exhibit 4.1 to the Company’s Current Report on Form 8-K filed December 15, 2010.
|
|
|
First Amendment to Master Note Purchase Agreement effective as of August 18, 2011, incorporated by reference to Exhibit 4.c to the Company’s Quarterly Report on Form 10-Q for the quarter ended September 30, 2011.
|
|
|
First Supplement to Master Note Purchase Agreement effective as of December 19, 2013, incorporated by reference to Exhibit 4.1 to the Company’s Current Report on Form 8-K, filed December 20, 2013.
|
|
|
Second Amendment to Master Note Purchase Agreement, as Supplemented by the First Supplement to the Master Note Amendment effective as of December 28, 2016, incorporated by reference to Exhibit 4.f to the Company’ Annual Report on Form 10-K for the year ended December 31, 2016.
|
|
|
Third Amendment to Master Note Purchase Agreement, as Supplemented by the First Supplement to the Master Note Amendment, effective as of July 31, 2018, incorporated by reference to Exhibit 4.f to the Company’s Quarterly Report on Form 10-Q for the quarter ended September 30, 2018.
|
|
|
Master Note Purchase Agreement by and among Polaris Industries Inc. and the purchasers party thereto, dated July 2, 2018, incorporated by reference to Exhibit 4.1 to the Company’s Current Report on Form 8-K filed July 2, 2018.
|
|
|
Polaris Industries Inc. Supplemental Retirement/Savings Plan, as amended and restated effective July 23, 2014, incorporated by reference to Exhibit 10.a to the Company’s Quarterly Report on Form 10-Q for the quarter ended September 30, 2014.*
|
|
|
Amendment to the Polaris Industries Inc. Supplemental Retirement/Savings Plan effective January 1, 2018 incorporated by reference to Exhibit 10.b to the Company’s Annual Report on Form 10-K for the year ended December 31, 2017.*
|
|
|
Amendment to the Polaris Industries Inc. Deferred Compensation Plan for Directors, as amended and restated, incorporated by reference to Exhibit 10.1 to the Company’s Current Report on Form 8-K filed on May 12, 2009, subsequently amended on July 25, 2012, incorporated by reference to Exhibit 10.a to the Company’s Quarterly Report on Form 10-Q for the quarter ended September 30, 2012.*
|
|
79
|
POLARIS INDUSTRIES INC.
EXHIBIT INDEX TO ANNUAL REPORT ON
FORM 10-K
For Fiscal Year Ended December 31, 2018 (cont.)
|
|
|
Polaris Industries Inc. Senior Executive Annual Incentive Plan, as amended and restated effective February 27, 2018 incorporated by reference to Exhibit 10.a to the Company’s Quarterly Report on Form 10-Q for the quarter ended March 31, 2018.
|
|
|
Polaris Industries Inc. 2007 Omnibus Incentive Plan (As Amended and Restated April 30, 2015), incorporated by reference to Annex A to the Company’s Proxy Statement for the 2015 Annual Meeting of Shareholders filed March 13, 2015.*
|
|
|
Form of Nonqualified Stock Option Agreement (Single Trigger) made under the Polaris Industries Inc. 2007 Omnibus Incentive Plan (As Amended and Restated April 28, 2011), incorporated by reference to Exhibit 10.2 to the Company’s Current Report on Form 8-K filed on May 3, 2011.*
|
|
|
Form of Nonqualified Stock Option Agreement (Double Trigger) made under the Polaris Industries Inc. 2007 Omnibus Incentive Plan (As Amended and Restated April 28, 2011), incorporated by reference to Exhibit 10.3 to the Company’s Current Report on Form 8-K filed on May 3, 2011.*
|
|
|
Form of Deferred Stock Award Agreement for shares of deferred stock granted to non-employee directors in 2007 under the Polaris Industries Inc. 2007 Omnibus Incentive Plan, incorporated by reference to Exhibit 10.t to the Company’s Annual Report on Form 10-K for the year ended December 31, 2007.*
|
|
|
Form of the Deferred Stock Unit Award Agreement for units of deferred stock granted to non-employee directors under the Company’s Amended and Restated 2007 Omnibus Incentive Plan, incorporated by reference to Exhibit 10.1 to the Company’s Current Report on Form 8-K filed May 3, 2016.*
|
|
|
Form of Performance Restricted Stock Unit Award Agreement under the Polaris Industries Inc. 2007 Omnibus Incentive Plan, incorporated by reference to Exhibit 10.y to the Company’s Annual Report on Form 10-K for the year ended December 31, 2011.*
|
|
|
Form of Nonqualified Stock Option Agreement entered into with Kenneth J. Pucel, incorporated by reference to Exhibit 10.gg to the Company’s Annual Report on Form 10-K for the year ended December 31, 2014 .*
|
|
|
Form of Performance Restricted Stock Unit Award Agreement entered into with Kenneth J. Pucel, incorporated by reference to Exhibit 10.hh to the Company’s Annual Report on Form 10-K for the year ended December 31, 2014.*
|
|
|
Form of Restricted Stock Unit Award Agreement made under the Polaris Industries Inc. 2007 Omnibus Incentive Plan (As Amended and Restated April 30, 2015), incorporated by reference to Exhibit 10.1 to the Company’s Current Report on Form 8-K as filed July 13, 2015.*
|
|
|
Form of Restricted Stock Unit Award Agreement entered into with Christopher Musso, incorporated by reference to Exhibit 10.s to the Company’s Annual Report on Form 10-K for the year ended December 31, 2017.*
|
|
|
Form of Performance Restricted Stock Unit Award Agreement made under the Polaris Industries Inc. 2007 Omnibus Incentive Plan (As Amended and Restated April 30, 2015), incorporated by reference to Exhibit 10.2 to the Company’s Current Report on Form 8-K as filed July 13, 2015.*
|
|
|
Form of Nonqualified Stock Option Award Agreement made under the Polaris Industries Inc. 2007 Omnibus Incentive Plan (As Amended and Restated April 30, 2015), incorporated by reference to Exhibit 10.3 to the Company’s Current Report on Form 8-K as filed July 13, 2015.*
|
|
|
Employment Offer Letter dated July 28, 2008 by and between the Company and Scott W. Wine, incorporated by reference to Exhibit 10.a to the Company’s Current Report on Form 8-K filed August 4, 2008.*
|
|
|
Employment Offer Letter dated September 28, 2017 by and between the Company and Christopher Musso, incorporated by reference to Exhibit 10.y to the Company’s Annual Report on Form 10-K for the year ended December 31, 2017.*
|
|
|
Employment Offer Letter dated September 15, 2014 by and between the Company and Kenneth J. Pucel, incorporated by reference to Exhibit 10.w to the Company’s Annual Report on Form 10-K for the year ended December 31, 2014.*
|
|
80
|
POLARIS INDUSTRIES INC.
EXHIBIT INDEX TO ANNUAL REPORT ON
FORM 10-K
For Fiscal Year Ended December 31, 2018 (cont.)
|
|
|
Employment Offer Letter dated July 10, 2015 by and between the Company and Michael T. Speetzen, incorporated by reference to Exhibit 10.d to the Company’s Quarterly Report on Form 10-Q for the quarter ended September 30, 2015.*
|
|
|
Employment Offer letter dated December 27, 2017 by and between the Company and Lucy Clark Dougherty.*
|
|
|
Severance, Proprietary Information and Noncompetition Agreement entered into with Scott W. Wine, incorporated by reference to Exhibit 10.b to the Company’s Current Report on Form 8-K filed August 4, 2008.*
|
|
|
Severance Agreement dated November 6, 2017 entered into with Christopher Musso, incorporated by reference to Exhibit 10.ff to the Company’s Annual Report on Form 10-K for the year ended December 31, 2018.*
|
|
|
Severance Agreement entered into with Kenneth J. Pucel, incorporated by reference to Exhibit 10.ii to the Company’s Annual Report on Form 10-K for the year ended December 31, 2014.*
|
|
|
Severance Agreement dated July 31, 2015 entered into with Michael T. Speetzen, incorporated by reference to Exhibit 10.ff to the Company’s Annual Report on Form 10-K for the year ended December 31, 2015.*
|
|
|
Severance Agreement dated January 29, 2018 entered into with Lucy Clark Dougherty.*
|
|
|
Amended and Restated Joint Venture Agreement dated as of February 28, 2011, by and between the Company and GE Commercial Distribution Finance Corporation, incorporated by reference to Exhibit 10.1 to the Company’s Current Report on Form 8-K filed March 1, 2011.
|
|
|
Amended and Restated Manufacturer’s Repurchase Agreement dated as of February 28, 2011, by and among the Company, Polaris Industries Inc., a Delaware Corporation, Polaris Sales Inc., and Polaris Acceptance, incorporated by reference to Exhibit 10.2 to the Company’s Current Report on Form 8-K filed March 1, 2011.
|
|
|
First Amendment dated December 7, 2015 to the Amended and Restated Joint Venture Agreement dated as of February 28, 2011, by and between the Company and GE Commercial Distribution Finance LLC f/k/a GE Commercial Distribution Corporation, incorporated by reference to Exhibit 10.nn to the Company’s Annual Report on Form 10-K for the year ended December 31, 2015.
|
|
|
Second Amendment dated December 7, 2015 to the Second Amended and Restated Partnership Agreement, by and between Polaris Acceptance Inc. and CDF Joint Ventures, Inc. dated as of June 1, 2014, incorporated by reference to Exhibit 10.oo to the Company’s Annual Report on Form 10-K for the year ended December 31, 2015.
|
|
|
Third Amended and Restated Credit Agreement dated November 9, 2016 by and among Polaris Industries Inc., Polaris Sales Inc., any other Domestic Borrower (as defined therein) that thereafter becomes a party thereto, Polaris Sales Europe Sárl, any other Foreign Borrower (as defined therein) that hereafter becomes a party thereto, the Lenders named therein, U.S. Bank National Association, as Administrative Agent, Left Lead Arranger and Lead Book Runner, Merrill Lynch, Pierce, Fenner & Smith Incorporated, Wells Fargo Securities, LLC, and The Bank of Tokyo-Mitsubishi UFJ, Ltd., as Joint Lead Arrangers, Joint Book Runners and Syndication Agents, and Bank of the West, Fifth Third Bank, JP Morgan Chase Bank, N.A., PNC Bank, National Association and BMO Harris Bank N.A., as Documentation Agents, incorporated by reference to Exhibit 10.1 to the Company’s Current Report on Form 8-K, filed November 10, 2016.
|
|
|
Fourth Amended and Restated Credit Agreement, dated July 2, 2018 by and among Polaris Industries Inc., Polaris Sales Europe Sàrl, any other Foreign Borrower (as defined therein) that hereafter becomes a party thereto, the Lenders named therein, U.S. Bank National Association, as Administrative Agent, Left Lead Arranger and Lead Book Runner, Merrill Lynch, Pierce, Fenner & Smith Incorporated, Wells Fargo Securities, LLC, and MUFG Bank, Ltd., as Joint Lead Arrangers, Joint Book Runners and Syndication Agents, and Bank of the West, Fifth Third Bank, JP Morgan Chase Bank N.A., PNC Bank, National Association and BMO Harris Bank N/A., as Documentation Agents, incorporated by reference to Exhibit 10.1 to the Company’s Current Report on Form 8-K filed July 2, 2018.
|
|
|
Subsidiaries of Registrant.
|
|
81
|
POLARIS INDUSTRIES INC.
EXHIBIT INDEX TO ANNUAL REPORT ON
FORM 10-K
For Fiscal Year Ended December 31, 2018 (cont.)
|
|
|
Consent of Ernst & Young LLP.
|
|
|
Power of Attorney.
|
|
|
Certification of Chief Executive Officer required by Exchange Act Rule 13a-14(a).
|
|
|
Certification of Chief Financial Officer required by Exchange Act Rule 13a-14(a).
|
|
|
Certification furnished pursuant to 18 U.S.C. 1350, as adopted pursuant to Section 906 of the Sarbanes-Oxley Act of 2002.
|
|
|
Certification furnished pursuant to 18 U.S.C. 1350, as adopted pursuant to Section 906 of the Sarbanes-Oxley Act of 2002.
|
|
|
101
|
The following financial information from Polaris Industries Inc.’s Annual Report on Form 10-K for the year ended December 31, 2018, filed with the SEC on February 14, 2019, formatted in Extensible Business Reporting Language (XBRL): (i) the Consolidated Balance Sheets as of December 31, 2018 and 2017, (ii) the Consolidated Statements of Income for the years ended December 31, 2018, 2017 and 2016 (iii) the Consolidated Statements of Comprehensive Income for the years ended December 31, 2018, 2017 and 2016, (iv) the Consolidated Statements of Shareholders’ Equity for the years ended December 31, 2018, 2017 and 2016, (v) the Consolidated Statements of Cash Flows for the years ended December 31, 2018, 2017 and 2016, and (vi) Notes to Consolidated Financial Statements
|
* Management contract or compensatory plan.
82
TABLE OF CONTENTS
Part IItem 1. BusinessItem 1A. Risk FactorsItem 1B. Unresolved Staff CommentsItem 2. PropertiesItem 3. Legal ProceedingsItem 4. Mine Safety DisclosuresPart IIItem 5. Market For Registrant S Common Equity, Related Stockholder Matters and Issuer Purchases Of Equity SecuritiesItem 6. Selected Financial DataItem 7. Management S Discussion and Analysis Of Financial Condition and Results Of OperationsItem 7A. Quantitative and Qualitative Disclosures About Market RiskItem 8. Financial Statements and Supplementary DataNote 1. Organization and Significant Accounting PoliciesNote 2. Revenue RecognitionNote 3. AcquisitionsNote 4. Share-based CompensationNote 5. Employee Savings PlansNote 6. Financing AgreementNote 7. Goodwill and Other Intangible AssetsNote 8. Income TaxesNote 9. Shareholders EquityNote 10. Financial Services ArrangementsNote 11. Investment in Other AffiliatesNote 12. Commitments and ContingenciesNote 13. Derivative Instruments and Hedging ActivitiesNote 14. Segment ReportingNote 15. Victory Motorcycles Wind DownNote 16. Quarterly Financial Data (unaudited)Item 9. Changes in and Disagreements with Accountants on Accounting and Financial DisclosureItem 9A. Controls and ProceduresItem 9B. Other InformationPart IIIItem 10. Directors, Executive Officers and Corporate GovernanceItem 11. Executive CompensationItem 12. Security Ownership Of Certain Beneficial Owners and Management and Related Stockholder MattersItem 13. Certain Relationships and Related Transactions, and Director IndependenceItem 14. Principal Accounting Fees and ServicesPart IVItem 15. Exhibits, Financial Statement SchedulesItem 16. Form 10-k Summary