PREMIER, INC.
10-Ks and 10-Qs
|
|
|
|
|
|
|
|
|
|
|
|
|
|
|
|
|
|
|
|
|
|
|
|
|
|
|
|
|
|
|
|
|
|
|
|
|
|
|
|
|
UNITED STATES
SECURITIES AND EXCHANGE COMMISSION
Washington, D.C. 20549
FORM 10-K
ANNUAL REPORT PURSUANT TO SECTION 13 OR 15(d) OF THE SECURITIES EXCHANGE ACT OF 1934
For The Fiscal
Year Ended June 30, 2018
Commission File Number 001-36092
Premier, Inc.
(Exact name of registrant as specified in its charter)
|
Delaware
|
|
35-2477140
|
|
(State or other jurisdiction of
incorporation or organization)
|
|
(I.R.S. Employer
Identification No.)
|
|
13034 Ballantyne Corporate Place
Charlotte, North Carolina
|
|
28277
|
|
(Address of principal executive offices)
|
|
(Zip Code)
|
Registrant's telephone number, including area code: (704) 357-0022
_____________________________________________________________________
Securities Registered Pursuant to Section 12(b) of the Act:
|
Title of Each Class
|
Name of Each Exchange on Which Registered
|
|
|
Class A Common Stock, $0.01 Par Value
|
NASDAQ Global Select Market
|
|
Securities Registered Pursuant to Section 12(g) of the Act: None
Indicate by check mark if the Registrant is a well-known seasoned issuer, as defined in Rule 405 of the Securities Act. Yes
x
No
o
Indicate by check mark if the Registrant is not required to file reports pursuant to Section 13 or Section 15(d) of the Act. Yes
o
No
x
Indicate by check mark whether the Registrant (1) has filed all reports required to be filed by Section 13 or 15(d) of the Securities Exchange Act of 1934 during the preceding 12 months (or for such shorter period that the Registrant was required to file such reports), and (2) has been subject to such filing requirements for the past 90 days. Yes
x
No
o
Indicate by check mark whether the Registrant has submitted electronically every Interactive Data File required to be submitted pursuant to Rule 405 of Regulation S-T (§ 232.405 of this chapter) during the preceding 12 months (or for such shorter period that the Registrant was required to submit such files). Yes
x
No
o
Indicate by check mark if disclosure of delinquent filers pursuant to Item 405 of Regulation S-K (§ 229.405 of this chapter) is not contained herein, and will not be contained, to the best of Registrant's knowledge, in definitive proxy or information statements incorporated by reference in Part III of this Form 10-K or any amendment to this Form 10-K.
x
Indicate by check mark whether the registrant is a large accelerated filer, an accelerated filer, a non-accelerated filer, smaller reporting company, or an emerging growth company. See the definitions of "large accelerated filer," "accelerated filer," "smaller reporting company," and "emerging growth company" in Rule 12b-2 of the Exchange Act.
|
Large accelerated filer
|
x
|
|
Accelerated filer
|
o
|
Non-accelerated filer
|
o
|
|
|
Smaller reporting company
|
o
|
Emerging growth company
|
o
|
||||
If an emerging growth company, indicate by check mark if the registrant has elected not to use the extended transition period for complying with any new or revised financial accounting standards provided pursuant to Section 13(a) of the Exchange Act.
o
Indicate by check mark whether the Registrant is a shell company (as defined in Rule 12b-2 of the Exchange Act). Yes
o
No
x
The aggregate market value of the Class A common stock held by non-affiliates of the Registrant as of the last business day of the Registrant's most recently completed second fiscal quarter was approximately
$1,518.1 million
. For purposes of the foregoing calculation only, executive officers and directors of the registrant have been deemed to be affiliates.
As of
August 17, 2018
, there were
53,271,621
shares of the Registrant's Class A common stock, par value $
0.01
per share, outstanding and
79,519,233
shares of the Registrant's Class B common stock, par value
$0.000001
per share, outstanding.
1
DOCUMENTS INCORPORATED BY REFERENCE
The Registrant's definitive proxy statement for its
2018
Annual Meeting of Stockholders to be held on or about December 7, 2018 is incorporated by reference into Part III hereof to the extent described herein.
2
PREMIER, INC
FORM 10-K
TABLE OF CONTENTS
|
Page
|
||
|
ITEM 1.
|
||
|
ITEM 1A.
|
||
|
ITEM 1B.
|
||
|
ITEM 2.
|
||
|
ITEM 3.
|
||
|
ITEM 4.
|
||
|
PART II
|
||
|
ITEM 5.
|
||
|
ITEM 6.
|
||
|
ITEM 7.
|
||
|
ITEM 7A.
|
||
|
ITEM 8.
|
||
|
ITEM 9.
|
||
|
ITEM 9A.
|
||
|
ITEM 9B.
|
||
|
PART III
|
||
|
ITEM 10.
|
||
|
ITEM 11.
|
||
|
ITEM 12.
|
||
|
ITEM 13.
|
||
|
ITEM 14.
|
||
|
PART IV
|
||
|
ITEM 15.
|
||
|
ITEM 16.
|
FORM 10-K SUMMARY
|
|
3
EXPLANATORY NOTE
This report represents the annual report for
the fiscal year ended June 30, 2018
for Premier, Inc. (this "Annual Report"). On October 1, 2013, Premier, Inc. completed the initial public offering ("IPO") of its Class A common stock (the "Class A common stock"). Premier, Inc. is a holding company that was incorporated as a Delaware corporation on May 14, 2013 which, prior to the IPO, had no substantial assets and conducted no substantial activity except in connection with the IPO. Premier, Inc.'s primary asset is a controlling equity interest in Premier Services, LLC, a Delaware limited liability company ("Premier GP"). Premier GP is the sole general partner of Premier Healthcare Alliance, L.P. ("Premier LP"), a California limited partnership. Premier, Inc. conducts substantially all of its business operations through Premier LP and its other consolidated subsidiaries. Unless the context suggests otherwise, references in this Annual Report to "Premier," the "Company," "we," "us" and "our" refer to Premier, Inc. and its consolidated subsidiaries.
Throughout this Annual Report, references to (1) "members" refer collectively to our past, present and future customers and (2) "member owners" refer collectively to our past, present and future members, who have owned, or who currently own, limited partnership interests in Premier LP, and beneficially own shares of Premier, Inc. Class B common stock, (the "Class B common stock"), and Class B common units of Premier LP (the "Class B common units"), provided, that, in the context of discussions of the group purchasing organization ("GPO") participation agreements throughout this Annual Report, the term "member owner" also includes any related entity or affiliate of a member owner that is approved by Premier LP to be the signatory of such GPO participation agreement in lieu of the member owner.
4
CAUTIONARY NOTE REGARDING FORWARD-LOOKING STATEMENTS
Statements made in this Annual Report that are not statements of historical or current facts, such as those under the heading "Management's Discussion and Analysis of Financial Condition and Results of Operations," are "forward-looking statements" within the meaning of the Private Securities Litigation Reform Act of 1995. Forward-looking statements may involve known and unknown risks, uncertainties and other factors that may cause our actual results, performance or achievements to be materially different from historical results or from any future results or projections expressed or implied by such forward-looking statements. In addition to statements that explicitly describe such risks and uncertainties, readers are urged to consider statements in conditional or future tenses or that include terms such as "believes," "belief," "expects," "estimates," "intends," "anticipates" or "plans" to be uncertain and forward-looking. Forward-looking statements may include comments as to our beliefs and expectations regarding future events and trends affecting our business and are necessarily subject to uncertainties, many of which are outside our control. Factors that could cause actual results to differ materially from those indicated in any forward-looking statement include, but are not limited to:
|
•
|
competition which could limit our ability to maintain or expand market share within our industry;
|
|
•
|
consolidation in the healthcare industry;
|
|
•
|
potential delays recognizing or increasing revenue if the sales cycle or implementation period takes longer than expected;
|
|
•
|
the terminability of member participation in our GPO programs with limited or no notice, or the failure of a significant number of members to renew their GPO participation agreements;
|
|
•
|
the rate at which the markets for our SaaS informatics products and services develop;
|
|
•
|
the dependency of our members on payments from third-party payers;
|
|
•
|
our reliance on administrative fees that we receive from GPO suppliers;
|
|
•
|
our ability to maintain third-party provider and strategic alliances or enter into new alliances;
|
|
•
|
our ability to timely offer new and innovative products and services;
|
|
•
|
the portion of revenues we receive from our largest members;
|
|
•
|
risks and expenses related to future acquisition opportunities and integration of acquisitions;
|
|
•
|
financial and operational risks associated with investments in or loans to businesses that we do not control, particularly early stage companies;
|
|
•
|
potential litigation;
|
|
•
|
our reliance on Internet infrastructure, bandwidth providers, data center providers and other third parties and our own systems for providing services to our users;
|
|
•
|
data loss or corruption due to failures or errors in our systems and service disruptions at our data centers, or breaches or failures of our security measures;
|
|
•
|
the financial, operational and reputational consequences of cyber-attacks or other data security breaches that disrupt our operations or result in the dissemination of proprietary or confidential information about us or our members or other third parties;
|
|
•
|
our ability to use, disclose, de-identify or license data and to integrate third-party technologies;
|
|
•
|
our use of "open source" software;
|
|
•
|
changes in pharmaceutical industry pricing benchmarks;
|
|
•
|
our inability to grow our integrated pharmacy business or maintain current patients due to increases in the safety risk profiles of prescription drugs or the withdrawal of prescription drugs from the market, or our inability to maintain and expand our existing base of drugs in our integrated pharmacy operations;
|
|
•
|
our dependency on contract manufacturing facilities located in various parts of the world;
|
|
•
|
our ability to attract, hire, integrate and retain key personnel;
|
5
|
•
|
adequate protection of our intellectual property and potential claims against our use of the intellectual property of third parties;
|
|
•
|
potential sales and use tax liability in certain jurisdictions;
|
|
•
|
changes in tax laws that materially impact our tax rate, income tax expense, cash flows or tax receivable agreement ("TRA") liabilities;
|
|
•
|
our indebtedness and our ability to obtain additional financing on favorable terms, including our ability to renew or replace our existing long-term credit facility at maturity;
|
|
•
|
fluctuation of our quarterly cash flows, revenues and results of operations;
|
|
•
|
changes and uncertainty in the political, economic or regulatory environment affecting healthcare organizations, including with respect to the status of the Patient Protection and Affordable Care Act, as amended by the Healthcare and Education Reconciliation Act of 2010, collectively referred to as the "ACA";
|
|
•
|
our compliance with complex international, federal and state laws governing financial relationships among healthcare providers and the submission of false or fraudulent healthcare claims;
|
|
•
|
interpretation and enforcement of current or future antitrust laws and regulations;
|
|
•
|
compliance with complex federal and state privacy, security and breach notification laws;
|
|
•
|
compliance with current or future laws, rules or regulations adopted by the Food & Drug Administration ("FDA") applicable to our software applications that may be considered medical devices;
|
|
•
|
compliance with, and potential changes to, extensive federal, state and local laws, regulations and procedures governing our integrated pharmacy operations;
|
|
•
|
risks inherent in the filling, packaging and distribution of pharmaceuticals, including the counseling required to be provided by our pharmacists for dispensing of products;
|
|
•
|
our holding company structure and dependence on distributions from Premier Healthcare Alliance, L.P. ("Premier LP");
|
|
•
|
different interests among our member owners or between us and our member owners;
|
|
•
|
the ability of our member owners to exercise significant control over us, including through the election of all of our directors;
|
|
•
|
exemption from certain corporate governance requirements due to our status as a "controlled company" within the meaning of the NASDAQ rules;
|
|
•
|
the terms of agreements between us and our member owners;
|
|
•
|
payments made under the TRAs to Premier LP's limited partners and our ability to realize the expected tax benefits related to the acquisition of Class B common units from Premier LP's limited partners;
|
|
•
|
changes to Premier LP's allocation methods or examinations or changes in interpretation of applicable tax laws and regulations by various taxing authorities that may increase a tax-exempt limited partner's risk that some allocated income is unrelated business taxable income;
|
|
•
|
provisions in our certificate of incorporation and bylaws and the Amended and Restated Limited Partnership Agreement of Premier LP (as amended, the "LP Agreement") and provisions of Delaware law that discourage or prevent strategic transactions, including a takeover of us;
|
|
•
|
failure to maintain an effective system of internal controls over financial reporting or an inability to remediate any weaknesses identified and the related costs of remediation;
|
|
•
|
the number of shares of Class A common stock that will be eligible for sale or exchange in the near future and the dilutive effect of such issuances;
|
|
•
|
our lack of current plans to pay cash dividends on our Class A common stock;
|
|
•
|
the timing and number of shares of Class A common stock re-purchased by the Company pursuant to our current or any future Class A common stock repurchase program;
|
6
|
•
|
possible future issuances of common stock, preferred stock, limited partnership units or debt securities and the dilutive effect of such issuances; and
|
|
•
|
the risk factors discussed under the heading "Risk Factors" in Item 1A herein.
|
More information on potential factors that could affect our financial results is included from time to time in the "Cautionary Note Regarding Forward-Looking Statements," "Risk Factors" and "Management's Discussion and Analysis of Financial Condition and Results of Operations" or similarly captioned sections of this Annual Report and our other periodic and current filings made from time to time with the Securities and Exchange Commission ("SEC"), which are available on our website at http://investors.premierinc.com/. You should not place undue reliance on any of our forward-looking statements which speak only as of the date they are made. We undertake no obligation to publicly update or revise any forward-looking statements, whether as a result of new information, future events or otherwise. Furthermore, we cannot guarantee future results, events, levels of activity, performance or achievements.
Market Data and Industry Forecasts and Projections
We use market data and industry forecasts and projections throughout this Annual Report and in particular, under Item 1. Business. We have obtained the market data from certain publicly available sources of information, including industry publications. We believe the data others have compiled are reliable, but we have not independently verified the accuracy of this information. While we are not aware of any misstatements regarding the industry data presented herein, forecasts and projections involve risks and uncertainties and are subject to change based on various factors, including those discussed under Item 1A. Risk Factors of this Annual Report. You should not place undue reliance on any such market data or industry forecasts and projections. We undertake no obligation to publicly update or revise any such market data or industry forecasts and projections, whether as a result of new information, future events or otherwise.
Trademarks, Trade Names and Service Marks
This Annual Report includes trademarks, trade names and service marks that we either own or license, such as "Acro Pharmaceutical Services," "ASCEND," "Aperek," "CECity," "Essensa," "Healthcare Insights," "Innovatix," "Meddius," "MEMdata," "Premier," "PremierConnect," "PremierPro," "QUEST," "SYMMEDrx," "S2S Global," and "TheraDoc," which are protected under applicable intellectual property laws. Solely for convenience, trademarks, trade names and service marks referred to in this Annual Report may appear without the ®,
TM
or
SM
symbols, but such references are not intended to indicate, in any way, that we will not assert, to the fullest extent under applicable law, our rights or the right of the applicable licensor to these trademarks, trade names and service marks. This Annual Report also may contain trademarks, trade names and service marks of other parties, and we do not intend our use or display of other parties' trademarks, trade names or service marks to imply, and such use or display should not be construed to imply, a relationship with, or endorsement or sponsorship of us by, these other parties.
7
The following discussion should be read in conjunction with our audited consolidated financial statements and accompanying notes thereto included elsewhere in this Annual Report on Form 10-K. The following discussion includes certain forward-looking statements. For a discussion of important factors which could cause actual results to differ materially from the results referred to in the historical information and the forward-looking statements presented herein, see "Item 1A. Risk Factors" and "Cautionary Note Regarding Forward-Looking Statements" contained in this Annual Report.
Our Company
Premier, Inc., incorporated in Delaware on May 14, 2013, is owned by hospitals, health systems and other healthcare organizations (such owners of Premier are referred to herein as "member owners") located in the United States, and by public stockholders. Together with our subsidiaries and affiliates, we are a leading healthcare improvement company, uniting an alliance of more than
4,000
U.S. hospitals and health systems and approximately
165,000
other providers and organizations to transform healthcare, as of
June 30, 2018
. With integrated data and analytics, collaboratives, supply chain solutions, and consulting and other services, Premier enables better care and outcomes at a lower cost. We believe that we play a critical role in the rapidly evolving healthcare industry, collaborating with members to co-develop long-term innovations that reinvent and improve the way care is delivered to patients nationwide. We deliver value through a comprehensive technology-enabled platform that offers critical supply chain services, clinical, financial, operational and population health software-as-a-service ("SaaS") informatics products, consulting services and performance improvement collaborative programs.
As of
June 30, 2018
, we were controlled by
163
U.S. hospitals, health systems and other healthcare organizations, which represented approximately
1,400
owned, leased and managed acute care facilities and other non-acute care organizations, through their ownership of Class B common stock. As of
June 30, 2018
, the Class A common stock and Class B common stock represented approximately
40%
and
60%
, respectively, of our combined Class A and Class B common stock. All of our Class B common stock is held beneficially by our member owners and all of our Class A common stock is held by public investors, which may include member owners that have received shares of our Class A common stock in connection with previous quarterly exchanges pursuant to an exchange agreement (the "Exchange Agreement") entered into by the member owners in connection with the completion of our initial public offering on October 1, 2013 (see
Note 1 - Organization and Basis of Presentation
to the accompanying audited consolidated financial statements for more information).
As a member-owned healthcare alliance, our mission, products and services, and long-term strategy have been developed in partnership with our member hospitals, health systems and other healthcare organizations. We believe that this partnership-driven business model creates a relationship between our members and us that is characterized by aligned incentives and mutually beneficial collaboration. This relationship affords us access to critical proprietary data and encourages member participation in the development and introduction of new Premier products and services. Our interaction with our members provides us additional insights into the latest challenges confronting the industry we serve and innovative best practices that we can share broadly within the healthcare industry, including throughout our membership. This model has enabled us to develop size and scale, data and analytics assets, expertise and customer engagement required to accelerate innovation, provide differentiated solutions and facilitate growth.
We seek to address challenges facing healthcare providers through our comprehensive suite of solutions that we believe:
|
•
|
improve the efficiency and effectiveness of the healthcare supply chain;
|
|
•
|
deliver improvement in cost, quality and safety;
|
|
•
|
innovate and enable success in emerging healthcare delivery and payment models to manage the health of populations; and
|
|
•
|
utilize data and analytics to drive increased connectivity, and clinical, financial and operational improvement.
|
Our business model and solutions are designed to provide our members with access to scale efficiencies while focusing on optimization of information resources and cost containment, derive intelligence from our anonymized data provided by our members in our data warehouse, mitigate the risk of innovation and disseminate best practices that will help our member organizations succeed in their transformation to higher quality and more cost-effective healthcare.
We deliver our integrated platform of solutions that address the areas of total cost management, quality and safety improvement and population health management and manage our business through
two
reportable business segments: Supply Chain Services and Performance Services. The Supply Chain Services segment includes our GPO, integrated pharmacy offerings and direct
8
sourcing activities. The Performance Services segment includes our SaaS informatics products, collaboratives, consulting services, government services and insurance management services businesses.
Industry Overview
According to data from the Centers for Medicare & Medicaid Services, or CMS, healthcare expenditures are a large component of the U.S. economy and are expected to grow by an average of
5.5%
per year for the period 2017-2026, reaching
19.7%
of gross domestic product, or GDP, by 2026. According to data from the 2016 American Hospital Association's Annual Survey, published in the 2018 edition of the AHA Hospital Statistics™, there were approximately
4,800
U.S. community hospitals with approximately
780,300
staffed beds in the United States. Of these acute care facilities, approximately
3,200
were part of either multi-hospital or diversified single hospital systems, meaning they were owned, leased, sponsored or contract managed by a central organization. Based upon 2017 reporting from the United States Department of Labor and healthcare industry sources, in addition to U.S. hospitals, there were approximately
645,000
alternate site facilities and providers across the continuum of care in the United States. These alternate site facilities include primary/ambulatory care and post-acute care providers. Increasingly, these alternate site facilities are being acquired by, integrated into or aligned with acute care facilities, further developing and enhancing integrated delivery networks.
Healthcare Supply Chain Services Industry
According to CMS data, total spending on hospital services in the United States is projected to be approximately
$1.2 trillion
, or approximately
32%
of total healthcare expenditures, in 2018. Expenses associated with the hospital supply chain, such as supplies and operational and capital expenditures, typically represent between
20%
and
30%
of a hospital's budget according to Booz & Company. With continued reimbursement rate pressure across government and managed care payers, a transitioning payment model from fee-for-service to value-based payment, and national health expenditures representing a significant portion of the economy, healthcare providers are examining all sources of cost savings, with supply chain spending a key area of focus. We believe opportunities to drive cost out of the healthcare supply chain include improved pricing for medical supplies and pharmaceuticals, appropriate resource utilization and increased operational efficiency.
From origination at the supplier to final consumption by the provider or patient, healthcare products pass through an extensive supply chain incorporating manufacturers, distributors, GPOs, pharmacy benefit managers, and retail, long-term care and integrated pharmacies, among others. In response to the national focus on health spending and managing healthcare costs, supply chain participants are seeking more convenient and cost-efficient ways to deliver products to patients and providers. We believe that improvements to the healthcare supply chain to bring it on par with other industries that have more sophisticated supply chain management can drive out significant inefficiencies and cost.
Healthcare Performance Services Industry
Legislative reform, unsustainable cost trends, and the need for improved quality and outcomes have generated greater focus among healthcare providers on cost management, quality and safety, and population health management. In 2015, the Department of Health and Human Services (HHS) announced its goals for aligning future Medicare payments with quality and value, including setting goals to shift up to 50% of Medicare fee-for-service payments to alternative payment models (APMs), such as accountable care organizations (ACOs) or bundled payment arrangements by the end of 2018. This movement was advanced further with the bipartisan enactment of the Medicare Access and CHIP Reauthorization Act, which created incentives for physicians to move to APMs. Even with the possibility of the ACA's repeal, replacement or modification, this movement has continued, although at a slower pace more recently. Over the long-term, health systems will need to continually monitor performance and manage costs, while demonstrating high levels of quality and implementing new care delivery models
We expect information technology to continue to play a key enabling role in workflow efficiency and cost reduction, performance improvement and care delivery transformation across the healthcare industry. In particular, the trends toward value-based payment models and population-based healthcare require more sophisticated business intelligence, expanded data sets and technology solutions. To achieve higher-quality outcomes and control total cost of care, providers exhibit a strong and continuing need for more comprehensive data and analytic capabilities to help them understand their current performance, identify opportunities for improvement and manage population health risk. We expect demand for data management and data analytics products to complement the focus on electronic health record adoption. Similarly, the advisory services business is growing rapidly in the areas of business model strategy and redesign, process improvement, labor productivity, non-labor cost management, clinical integration and change management.
9
Our Membership
Our current membership base includes many of the country's most progressive and forward-thinking healthcare organizations. The participation of these organizations in our membership provides us additional insights into the latest challenges confronting the industry we serve and innovative best practices that we can share broadly throughout our membership. We continually seek to add new members that are at the forefront of innovation in the healthcare industry. At
June 30, 2018
, our members included more than
4,000
U.S. hospitals and health systems and approximately
165,000
other providers and organizations. Approximately
400
individuals, representing approximately
140
of our U.S. hospital members, sit on
25
of our strategic and sourcing committees, and as part of these committees, use their industry expertise to advise on ways to improve the development, quality and value of our products and services. In addition,
ten
senior executives from our U.S. hospital member owner systems currently serve on our Board of Directors. Other than GNYHA Services, Inc. ("GNYHA") and its member organizations, which accounted for
7%
,
7%
and
9%
of our net revenue in
the fiscal years ended June 30, 2018, 2017 and 2016
, respectively, no individual member or member owner systems accounted for more than
5%
of our net revenue in such periods. Total GPO purchasing volume by all members participating in our GPO was approximately
$60 billion
and
$56 billion
for the calendar years
2017
and
2016
, respectively.
The following table sets forth certain information with respect to retention rates for members participating in our GPO in the Supply Chain Services segment and renewal rates for our SaaS informatics products subscriptions in the Performance Services segment for the fiscal years shown:
|
Year Ended June 30,
|
||||
|
2018
|
2017
|
2016
|
3 Year Average
|
|
|
GPO retention rate
(a)
|
98%
|
99%
|
97%
|
98%
|
|
SaaS institutional renewal rate
(b)
|
97%
|
95%
|
92%
|
95%
|
|
(a)
|
The GPO retention rate is calculated based upon the aggregate purchasing volume among all members participating in our GPO for such fiscal year less the annualized GPO purchasing volume for departed members for such fiscal year, divided by the aggregate purchasing volume among all members participating in our GPO for such fiscal year.
|
|
(b)
|
The SaaS institutional renewal rate is calculated based upon the total number of members that have SaaS revenue in a given period that also have revenue in the corresponding prior year period divided by the total number of members that have SaaS revenue in the same period of the prior year.
|
Our Business Segments
We deliver our integrated platform of solutions that address the areas of total cost management, quality and safety improvement and population health management and manage our business through two business segments: Supply Chain Services and Performance Services, as addressed in
Note 21 - Segments
to the audited consolidated financial statements of this Annual Report. We have no significant foreign operations or revenues.
Supply Chain Services
Our Supply Chain Services segment assists our members in managing their non-labor expense and capital spend through a combination of products, services and technologies, including one of the largest national healthcare GPOs in the United States serving acute and alternate sites, integrated pharmacy offerings and direct sourcing activities. Membership in our GPO also provides access to certain SaaS informatics products related to the supply chain and the opportunity to participate in our ASCEND
®
collaborative. Our Supply Chain Services segment consists of the following products and solutions:
Group Purchasing.
Our national portfolio of approximately
2,400
contracts with approximately
1,300
suppliers provides our members with access to a wide range of products and services, including medical and surgical products, pharmaceuticals, laboratory supplies, capital equipment, information technology, facilities and construction, food and nutritional products and purchased services (such as clinical engineering and document shredding services). We use our members' aggregate purchasing power to negotiate pricing discounts and improved contract terms with suppliers. Contracted suppliers pay us administrative fees based on the purchase volume of goods and services sold to our healthcare provider members under the contracts we have negotiated. We also partner with other organizations, including regional GPOs, to extend our network base to their members.
Our contract portfolio is designed to offer our healthcare provider members a flexible solution comprised of multi-sourced supplier contracts, as well as pre-commitment and/or single-sourced contracts that offer higher discounts. Our multi-sourced contracts offer pricing tiers based on purchasing volume and/or commitment and multiple suppliers for many products and services. Our pre-commitment contracts require that a certain amount of our members commit in advance to a specified amount or percentage of purchasing volume before we enter into a contract with a particular supplier. Our single-source contracts are entered into with a specified supplier, and through this exclusive relationship, allow us to contract for products that meet our
10
members' specifications. In the case of pre-commitment contracts, we provide the particular supplier with a list of members that have pre-committed to a specified amount or percentage of purchasing volume and the supplier directly handles the tracking and monitoring of fulfillment of such purchasing volume. In the case of single and multi-sourced contracts, we negotiate and execute the contracts with suppliers on behalf of our members and make such contracts available to our members to access. The utilization of such single and multi-sourced contracts is determined by the particular member with assistance from our field force. Since there are no specific fulfillment requirements needed in our single and multi-source contracts in order to obtain certain pricing levels, each particular member and supplier agree on the appropriate pricing tier based on expected purchasing volume with tracking and ongoing validation of such purchasing volume provided by the supplier. The flexibility provided by our expansive contract portfolio allows us to effectively address the varying needs of our members and the significant number of factors that influence and dictate these needs, including overall size, service mix, and the degree of integration between hospitals in a health system.
We continually innovate our GPO programs and supply chain platforms while targeting multiple markets, including acute care and alternate site settings. More specifically, our Premier Alternate Site Program, one of the largest in the United States covers over 80 classes of trade with approximately
165,000
members as of
June 30, 2018
, and includes the following:
Premier Continuum of Care.
Key classes of trade include long-term care and senior living, ambulatory care, first responders and emergency medical services, home health, imaging centers and surgery centers. Our Premier Alternate Site GPO members have access to nearly all of our GPO supplier contracts, including medical and surgical products, pharmaceuticals, laboratory supplies, facilities and construction, capital equipment, information technology, food and nutritional products and purchased services, as well as additional GPO supplier contracts accessed through our consolidated subsidiaries, Innovatix, LLC ("Innovatix") and Essensa Ventures, LLC ("Essensa").
Premier Business and Industry.
Key classes of trade include non-healthcare entities, such as education (
e.g.,
K-12 schools, colleges and universities, and early childhood education), hospitality, recreation (
e.g.,
stadiums, parks and fairgrounds) and employee food programs. Our Premier Business and Industry members have access to nearly all of our GPO supplier contracts including food service, facilities products and services, information technology and administrative services.
Integrated Pharmacy.
Through our integrated pharmacy business, we provide a complete service offering for our members to improve access to medication and to better manage patient therapy for chronically-ill patients with specialty drug needs and genetic disorders. Our integrated pharmacy business delivers traditional pharmacy dispensing services (
i.e
., retail and mail order), as well as “integrated pharmacy” services, which fully integrate the administrative coordination, patient care management, and data management reporting functions that ultimately service the needs of patients, providers, payers, and pharmaceutical manufacturers. The business serves as a scaled solution for our members and to provide an integrated pharmacy “care hub” to meet the unique integrated pharmacy needs of health systems across the continuum of care. We provide robust clinical management programs that are targeted toward those disease states where best-in-class care pathways and interventions by clinically-trained pharmacists are essential for patient adherence and compliance. Our “care hub” capabilities enable members to more effectively care for complex patient populations, improve clinical quality and safety, and harness otherwise unavailable clinical data.
Direct Sourcing.
Our direct sourcing business, SVS, LLC d/b/a S2S Global ("S2S Global"), was established to help our members access a diverse product portfolio and to provide transparency to manufacturing costs and competitive pricing to our members. Through our consolidated subsidiary, S2S Global, we facilitate the development of product specifications with our members, source or contract manufacture the products to member specifications and sell products directly to our members or suppliers. By engaging with our members at the beginning of the sourcing process to define product specifications and then sourcing, or contract manufacturing, products to meet the exact needs of our members, we eliminate the need for unnecessary product features and specifications that may typically be included by suppliers and result in higher prices for our members without providing incremental value. Therefore, our direct sourcing activities benefit our members by providing them with an expanding portfolio of medical products through more efficient means, and with greater cost transparency, than if such products were purchased from other third-party suppliers. We market our direct sourcing activities under two distinct brands: PremierPro™, which is designated for our members, and Prime Plus™, which is designated for our other customers, primarily regional distributors with private-label product programs.
Managed Services.
Our managed services line of business is a fee for service model created to perform supply chain related services for members, including contract negotiation and administration, claims data and rebate processing and evaluation of current pharmacy formulary and utilization services provided in partnership with a national pharmacy benefit manager.
11
SaaS Informatics Products.
Members of our GPO have access to certain components of our PremierConnect Supply Chain offering and its associated applications and the ability to purchase additional elements that are discussed in more detail below under "Our Business Segments - Performance Services".
ASCEND
®
Collaborative.
Our ASCEND
®
Collaborative has developed a process to aggregate purchasing data for our members, enabling such members to determine whether to negotiate committed group purchases within the collaborative. Through our ASCEND
®
Collaborative, members receive group purchasing programs, tiers and prices specifically negotiated for them, as well as benchmarking metrics to assist them in identifying additional supply chain and operations cost savings opportunities and knowledge sharing with other member participants and industry experts. As of
June 30, 2018
, approximately
1,000
U.S. hospital members, which represent approximately
121,000
hospital beds, participated in our ASCEND
®
Collaborative. These hospital member participants have identified approximately
$397.0 million
in additional savings as compared to their U.S. hospital peers not participating in ASCEND
®
since its inception in 2009. For calendar year
2017
, these member participants had approximately
$19.4 billion
in annual supply chain purchasing spend.
Performance Services
Our offerings in the performance services sector of the healthcare industry are primarily information technology analytics and workflow automation and consulting services. We believe we are one of the largest informatics and consulting services businesses in the United States focused on healthcare providers, professional associations, pharmaceutical companies and device manufacturers. Our SaaS informatics products utilize our comprehensive data set to provide actionable intelligence to our members, enabling them to benchmark, analyze and identify areas of improvement across three main categories: cost management, quality and safety, and population health management. This segment also includes our technology-enabled performance improvement collaboratives, through which we convene members, design programs and facilitate, foster and advance the exchange of clinical, financial and operational data among our members to measure patient outcomes and determine best practices that drive clinical, financial and operational improvements. Our Performance Services segment includes our PremierConnect
®
technology offerings, consulting services, collaboratives, government services and insurance management services, as follows:
PremierConnect
®
:
We seek to deliver our healthcare cloud applications using an innovative technology foundation that leverages the most recent advances in cloud computing and data management. Our platform allows us to deliver applications that are highly flexible and extendable across healthcare delivery systems. We leverage advanced data science in our informatics applications to help members make smarter cost and quality decisions. We also provide complete packaged integrations and connectors for our cloud-based solutions to operate in conjunction with legacy healthcare IT systems, which substantially reduces time, complexity and cost associated with integrations for our members.
PremierConnect is designed to deliver specific functionalities to our members to address existing cost and quality imperatives, help them manage a value-based care reimbursement model and support their regulatory reporting framework. We also provide members optimized web-based communities and research capabilities to capture utilization best practices and clinical surveillance improvement. Our service models allow members to consistently use our resources to inform vital decisions. PremierConnect solutions are organized into five areas: Quality & Regulatory reporting, Clinical Surveillance & Safety, Supply Chain & ERP, Operations and integrated Enterprise Analytics.
PremierConnect Quality & Regulatory.
The PremierConnect Quality & Regulatory domain enables health systems and providers to identify and target high-value quality improvement areas that drive greater clinical effectiveness and efficiency across the continuum of care. This solution provides clinical benchmarking, population analyses and predictive analytics to help hospitals and physician practices be successful in the transition to value-based care.
PremierConnect Clinical Surveillance & Safety.
The PremierConnect Clinical Surveillance & Safety domain enables health systems and providers to improve patient safety, including ongoing infection prevention, antimicrobial stewardship, reduction of hospital-acquired conditions and real-time clinical surveillance used to drive faster, more informed decisions.
PremierConnect Supply Chain & ERP.
The PremierConnect Supply Chain & ERP domain enables health systems and providers to lower supply chain costs through leading supply chain management analytics, evidence-based purchasing, and innovative enterprise resource planning ("ERP") workflow that drives efficiency and effectiveness throughout the entire procurement life cycle. This healthcare-only ERP solution also extends into accounts payable, general ledger and financial reporting.
PremierConnect Operations.
The PremierConnect Operations domain enables health systems and providers to optimize labor management with integrated financial reporting and budgeting across the continuum of care. These applications integrate benchmarking and productivity data from acute, outpatient and ambulatory settings.
12
PremierConnect Enterprise Analytics.
The PremierConnect Enterprise Analytics domain enables health systems and providers to leverage integrated analytics across all of Premier's subject matter expertise. This solution includes integrating a member's custom data into a hosted and integrated data warehouse and analytics platform. This solution provides data acquisition, management and governance capabilities for health systems and extends this capability to research, life sciences and value-based care programs.
Consulting Services:
Our consulting services, provided through Premier Performance Partners, seek to drive change and improvement in cost reduction, quality of care and patient safety, and prepare our members to succeed in a population health environment. We use an income statement method to address every area affecting the member's bottom line, finding opportunities in both revenue enhancement and expense management. Premier Performance Partners offers expertise and capabilities in the following areas: care coordination and physician engagement, clinical, financial and operational performance, facilities and capital asset management, organizational transformation, physician preference items (PPI), reform readiness assessment, clinical integration and population health operations and analytics, purchased services assessment, revenue cycle management and recovery audit contractor (RAC) readiness, service line improvement, strategic and business planning and supply chain transformation.
We provide a data-driven approach and expertise to deliver targeted results in reducing costs, increasing margin and improving quality. Using various specialists and consultants, we provide wrap-around services for our major SaaS informatics products and our GPO to enhance the member value from these programs. For example, our clinical performance partners provide U.S. hospitals with access to performance improvement and operational specialists. Using our informatics tools and applications, these clinical performance partners mine data for improvement opportunities and then lead or assist with improvement projects in such areas as resource and operational assessments, process improvement, performance improvement monitoring, strategic planning and knowledge transfer for organizational change. U.S. hospitals contract for clinical, financial and/or operational performance partner support for a given number of days per month, with contracts typically lasting from less than a year to five years in duration.
Performance Improvement Collaboratives:
QUEST
®
Collaborative.
Through our QUEST
®
Collaborative (QUEST
®
), we work with our members to identify improvement opportunities and best practices and engage them to participate in performance improvement exercises using identified best practices, to collaborate to define performance goals and to use healthy competition to drive performance improvement. QUEST
®
builds on the past success of our partnership with CMS in the Premier Hospital Quality Incentive Demonstration, a value-based purchase program through which CMS awarded bonus payments to U.S. hospitals for high quality in several clinical areas and reported quality data on its website. The Quest collaborative currently targets improvements in the following domains: evidence-based care, cost and efficiency of care, patient and family engagement, safety, mortality and appropriate U.S. hospital use and community health. Historically, there were approximately
350
participating U.S. hospitals in the QUEST
®
3.0 Collaborative, which sunset on December 31, 2016. In January 2017, we launched the QUEST
®
2020 collaborative, which was expanded to include additional focus areas, and which will continue to operate for the next three years. As of
June 30, 2018
, there were approximately
220
U.S. hospitals that have signed up for the QUEST
®
2020 collaborative and that are working together to utilize our SaaS informatics products to develop highly standardized quality, safety and cost metrics. QUEST
®
seeks to develop next-generation quality, safety and cost metrics with a consistency and standardization we do not believe exists elsewhere today. We believe that our members who participate in QUEST
®
are better prepared to deal with evolving and uncertain healthcare reform requirements and, by improving in the domains referenced above, can earn Medicare incentives, avoid Medicare penalties and better manage reimbursement cuts.
Bundled Payment Collaborative.
Our Bundled Payment Collaborative assists our members in their participation in the CMS Bundled Payments for Care Improvement Initiative, an initiative by which organizations enter into payment arrangements that include financial and performance accountability for episodes of care. Our Bundled Payment Collaborative offers ongoing analysis of our members' Medicare Part A and Medicare Part B data, dashboards for managing bundled payment programs and gainsharing, in addition to providing knowledge, expertise, and best practices from experts and members. As of
June 30, 2018
, we had over
106
U.S. hospitals participating in our Bundled Payment Collaborative.
The Population Health Management Collaboratives.
Our Population Health Management Collaborative, or PHM Collaborative (the successor to our PACT
TM
-Partnership for Care Transformation collaborative), is focused on helping members develop and implement effective models of care and payment for connected groups of providers who take responsibility for improving the health status, efficiency and experience of care (quality and satisfaction) for a defined population (
i.e.,
accountable care organizations) and how to align this care redesign with new value based payment arrangements. Our PHM Collaborative provides members with the opportunity to share value based care and payment
13
developmental strategies, programs, and other best practices. The PHM Collaborative provides valuable assistance and access to over 30 PHM subject matter experts to members in developing the tools necessary to manage the health of a population and to exchange knowledge with each other and with industry and government experts. As of
June 30, 2018
, we had over
500
U.S. hospitals in
41
states, participating in our PHM Collaborative.
Hospital Improvement Innovation Network (formerly Partnership for Patients Collaborative).
In September 2016, CMS awarded us a Partnership for Patients ("PfP") Hospital Improvement Innovation Network ("HIIN") contract to continue our prior Hospital Engagement Network efforts. The PfP initiative is a public-private collaborative working to improve the quality, safety and affordability of healthcare. Physicians, nurses, hospitals, employers, patients and their advocates, and the federal and state governments have joined together to form PfP to decrease preventable hospital-acquired conditions and readmissions. Our HIIN serves as a live learning lab for hospitals and utilizes HIIN partners to accelerate improvement efforts throughout multiple healthcare areas. As of
June 30, 2018
, we had approximately
500
U.S. hospitals participating in our HIIN collaborative.
Data Alliance Collaborative.
A group of the nation's leading health systems have launched the Data Alliance Collaborative to ensure that healthcare providers have the technology and analytics in place to improve quality and lower costs. These forward-thinking providers are working together with Premier to disrupt the way healthcare information technology is developed. Data Alliance Collaborative members are using integrated data (
e.g.
, clinical, claims, labor, supply chain, administrative, financial, patient experience, genomics, etc.) to develop new insights and answer the complex questions driven by the transformation to population-based care. They are innovating collaboratively to meet their current needs and are creating the conceptual and technical foundation that enables them to respond nimbly to an uncertain future. As of
June 30, 2018
, our Data Alliance Collaborative included
12
integrated data networks encompassing over
300
U.S. hospitals.
Insurance Services:
We provide insurance programs and services to assist U.S. hospital and healthcare system members with liability and benefits insurance services, along with risk management services. We design insurance programs and services for our members to improve their quality, patient safety and financial performance while lowering costs. We provide management services for American Excess Insurance Exchange, Risk Retention Group, a reciprocal risk retention group that provides excess hospital, professional, umbrella and general liability insurance to certain U.S. hospital and healthcare system members. We also negotiate the purchase of other insurance products from commercial insurance carriers on behalf of our members.
Pricing and Contracts
We generate revenue from our Supply Chain Services segment through fees received from suppliers based on the total dollar volume of supplies purchased by our members in connection with our GPO programs and through product sales in connection with our integrated pharmacy and direct sourcing activities. Our Performance Services segment has three main sources of revenue: (i) three to five-year subscription agreements to our SaaS informatics products, (ii) annual subscriptions to our performance improvement collaboratives and (iii) professional fees for our consulting services.
Supply Chain Services
Pursuant to the terms of GPO participation agreements entered into by the member owners (see
Note 1 - Organization and Basis of Presentation
to the accompanying audited consolidated financial statements for more information), each of the member owners generally receives revenue share from Premier LP equal to
30%
of all gross administrative fees collected by Premier LP based upon purchasing by such member owner's owned, leased, managed and affiliated facilities through our GPO supplier contracts. In addition, our two largest regional GPO member owners, which represented an aggregate of approximately
14%
of our gross administrative fees revenue for the year ended June 30, 2018, each remit gross administrative fees collected by such member owner based upon purchasing by such member owner's owned, leased, managed and affiliated facilities through the member owner's own GPO supplier contracts, in accordance with such member owner's Premier GPO participation agreement, and receive revenue share from Premier LP equal to 30% of such gross administrative fees remitted to us. Subject to certain termination rights, these GPO participation agreements have five-year renewable terms, although our two largest regional GPO member owners have entered into agreements with seven-year renewable terms. GPO participation agreements automatically extend for successive five-year or seven-year periods (corresponding to the length of their initial terms) unless the member owner notifies Premier LP, prior to the fourth anniversary (in the case of five-year agreements executed at the time of our IPO), or sixth anniversary (in the case of seven-year agreements executed at the time of our IPO), of the commencement of the then-current term, that such member owner does not want the GPO participation agreement to automatically renew upon the expiration of the then-current term. As of the date of this Annual Report, approximately
96%
of our fiscal 2018 net administrative fees revenue associated with existing members is covered by GPO participation agreements that have been renewed or extended at the same or similar economics, or initially had terms longer than five years. We continue to work with the few remaining member owners with initial five-year terms that have not yet renewed or extended their GPO participation agreements to achieve renewal or extension of those agreements at the same or similar economics on or before September 30, 2018.
14
The terms and conditions of certain GPO participation agreements vary as a result of provisions in our pre-IPO arrangements with member owners that conflict with the provisions of our standard GPO participation agreements and which by the express terms of the GPO participation agreement are incorporated by reference and deemed controlling and will continue to remain in effect. In limited circumstances, Premier LP and certain member owners entered into GPO participation agreements at the time of the IPO with certain terms and conditions that vary from the standard form. The agreements were approved by the member agreement review committee of our Board of Directors, based upon regulatory constraints, pending merger and acquisition activity or other exigent circumstances affecting those member owners. Certain non-owner members operate under contractual relationships that provide for a specific revenue share that differs from the
30%
revenue share that we generally provide to our member owners under the current GPO participation agreements.
In our integrated pharmacy, we earn revenue from product sales and other services. Revenues are earned through traditional pharmacy dispensing services (
i.e.
, retail and mail order), as well as “specialty pharmacy” services, including 340B drug pricing program dispensing services, administrative coordination, patient care management and data management reporting functions. Our integrated pharmacy contracts generally range from one to three years in length, and, except for exclusive networks, there are generally no guaranteed sales associated with a payer network contract.
In our direct sourcing activities, we earn revenue from product sales. Products are sold to our members through direct shipment and distributor and wholesale channels. Products are also sold to regional medical-surgical distributors and other non-healthcare industries (
i.e.,
foodservice). We have contracts with our members that buy products through our direct shipment option. These contracts do not usually provide a guaranteed purchase or volume commitment requirement.
Performance Services
Performance Services revenue consists of SaaS informatics products subscriptions, certain perpetual and term licenses, performance improvement collaborative and other service subscriptions, professional fees for consulting and government services, and insurance services management fees and commissions from group-sponsored insurance programs.
SaaS informatics products subscriptions include the right to use our proprietary hosted technology on a SaaS basis, training and member support to deliver improvements in cost management, quality and safety, population health management and provider analytics. Pricing varies by subscription and size of the subscriber. Informatics subscriptions are generally three- to five-year agreements with automatic renewal clauses and annual price escalators that typically do not allow for early termination. These agreements do not allow for physical possession of the software. Subscription fees are typically billed on a monthly basis and revenue is recognized as a single deliverable on a straight-line basis over the remaining contractual period following implementation. Implementation involves the completion of data preparation services that are unique to each member's data set and, in certain cases, the installation of member site-specific software, in order to access and transfer member data into our hosted SaaS informatics products. Implementation is generally
60
to
300
days following contract execution before the SaaS informatics products can be fully utilized by the member.
Performance improvement collaborative and other service subscription revenue to support our offerings in cost management, quality and safety and population health management is recognized over the service period, which is generally one year.
Professional fees for consulting services are sold under contracts, the terms of which vary based on the nature of the engagement. Fees are billed as stipulated in the contract, and revenue is recognized on a proportional performance method as services are performed and deliverables are provided. In situations where the contracts have significant contract performance guarantees or member acceptance provisions, revenue recognition occurs when the fees are fixed and determinable and all contingencies, including any refund rights, have been satisfied. Fees are based either on time and materials or the savings that are delivered.
Sales
We conduct sales through our embedded field force, our dedicated national sales team and our Premier Performance Partners consultants, collectively comprised of approximately
600
employees as of
June 30, 2018
.
Our field force works closely with our U.S. hospital members and other members to target new opportunities by developing strategic and operational plans to drive cost management and quality and safety improvement initiatives. As of
June 30, 2018
, our field force was deployed to
six
geographic regions and several strategic/affinity members across the United States. This field force works at our member sites to identify and recommend best practices for both supply chain and clinical integration cost savings opportunities. The regionally deployed field force is augmented by a national team of subject matter specialists who focus on key areas such as lab, surgery, cardiology, orthopedics, imaging, pharmacy, information technology and construction. Our field force assists our members in growing and supporting their alternate site membership.
15
Our sales team provides national sales coverage for establishing initial member relationships and works with our field force to increase sales to existing members. Our regional sales teams are aligned with the
six
regions in our field force model.
Our Premier Performance Partners team identifies and targets consulting engagements and wrap-around services for our major SaaS informatics products and our GPO to enhance the member value from these programs.
Intellectual Property
We offer our members a range of products to which we have appropriate intellectual property rights, including online services, best practices content, databases, electronic tools, web-based applications, performance metrics, business methodologies, proprietary algorithms, software products and consulting services deliverables. We own and control a variety of trade secrets, confidential information, trademarks, trade names, copyrights, domain names and other intellectual property rights that, in the aggregate, are of material importance to our business.
We protect our intellectual property by relying on federal, state and common law rights, as well as contractual arrangements. We are licensed to use certain technology and other intellectual property rights owned and controlled by others, and, similarly, other companies are licensed to use certain technology and other intellectual property rights owned and controlled by us.
Research and Development
Our research and development, or R&D, expenditures primarily consist of our strategic investment in internally-developed software to develop new and enhance existing SaaS informatics products offerings and new product development in the areas of cost management, quality and safety and value based care. We expensed
$1.4 million
,
$3.1 million
and
$2.9 million
for R&D activities for fiscal years
2018
,
2017
and
2016
, respectively, and capitalized software development costs of
$74.9 million
,
$66.6 million
and
$61.0 million
for fiscal years
2018
,
2017
and
2016
, respectively. From time to time, we may experience fluctuations in our research and development expenditures, including capitalized software development costs, across reportable periods due to the timing of our software development life cycles, with new product features and functionality, new technologies and upgrades to our service offerings.
Information Technology and Cybersecurity Risk Management
We rely on digital technology to conduct our business operations and engage with our members and business partners. The technology we, our members, and business partners use grows more complex over time as do threats to our business operations from cyber intrusions, denial of service attacks, manipulation and other cyber misconduct. Through a risk management approach that continually assesses and improves our Information Technology (IT) and cybersecurity risk deterrence capabilities, our Information Security and Risk Management groups have formed a functional collaboration to provide leadership and oversight when managing IT and cybersecurity risks.
Through a combination of Governance, Risk and Compliance (GRC) resources, we have significantly improved our capability to (i) proactively monitor IT controls to better ensure compliance with legal and regulatory requirements, (ii) assess adherence by third parties we partner with to secure that the appropriate risk management standards are met, (iii) better ensure essential business functions remain available during a business disruption, and (iv) monitor and continually develop and update response plans to address potential weaknesses and IT or cyber incidents should they occur. Our GRC resources are designed to prioritize IT and cybersecurity risks areas, identify solutions that minimize such risks, pursue optimal outcomes and maintain compliance with contractual obligations. We also maintain an operational security function that has a real time 24x7x365 response capability that triages incident management and triggers impact mitigation protocols. These capabilities allow us to apply best practices and reduce exposure in the case of a security incident. For more information regarding the risks associated with these matters, see “Item 1A. Risk Factors-We could suffer a loss of revenue and increased costs, exposure to significant liability, reputational harm, and other serious negative consequences if we sustain cyber-attacks or other data security breaches that disrupt our operations or result in the dissemination of proprietary or confidential information about us or our members or other third parties.”
Competition
The markets for our products and services in both our Supply Chain Services segment and Performance Services segment are fragmented, intensely competitive and characterized by rapidly evolving technology and product standards, user needs and the frequent introduction of new products and services. We have experienced and expect to continue to experience intense competition from a number of companies.
The primary competitors to our Supply Chain Services segment are other large GPOs such as HealthTrust Purchasing Group (a subsidiary of HCA Holdings, Inc.), Managed Health Care Associates, Inc. and Vizient, Inc. In addition, we compete against certain healthcare provider-owned GPOs and on-line retailers in this segment. Our integrated pharmacy competes with Accredo (owned by Express Scripts Holding Co.), BriovaRx, CVS Caremark Specialty Pharmacy (owned by CVS Health Corporation), Diplomat
16
Pharmacy, Walgreens Specialty Pharmacy and many smaller local specialty pharmacies. Finally, our direct sourcing activities compete primarily with private label offerings/programs, product manufacturers and distributors, such as Cardinal Health, Inc., McKesson Corporation, Medline Industries, Inc. and Owens & Minor, Inc.
The competitors in our Performance Services segment range from smaller niche companies to large, well-financed and technologically-sophisticated entities. Our primary competitors in this segment include (i) information technology providers such as Allscripts Healthcare Solutions, Inc., Cerner Corporation, Epic Systems Corporation, Health Catalyst, LLC, IBM Corporation, Infor, Inc., McKesson Corporation and Oracle Corporation, and (ii) consulting and outsourcing firms such as Deloitte & Touche LLP, Evolent Health, Inc., Healthagen, LLC (a subsidiary of Aetna, Inc.), Huron Consulting, Inc., Navigant Consulting, Inc., Optum, Inc. (a subsidiary of UnitedHealth Group, Inc.) and Vizient, Inc.
With respect to our products and services across both segments, we compete on the basis of several factors, including breadth, depth and quality of product and service offerings, ability to deliver clinical, financial and operational performance improvements through the use of products and services, quality and reliability of services, ease of use and convenience, brand recognition and the ability to integrate services with existing technology. With respect to our products and services across both of our business segments, we also compete on the basis of price.
Government Regulation
General
The healthcare industry is highly regulated by federal and state authorities and is subject to changing political, economic and regulatory influences. Factors such as changes in reimbursement policies for healthcare expenses, consolidation in the healthcare industry, regulation, litigation and general economic conditions affect the purchasing practices, operations and the financial health of healthcare organizations. In particular, changes in laws and regulations affecting the healthcare industry, such as increased regulation of the purchase and sale of medical products, or restrictions on permissible discounts and other financial arrangements, could require us to make unplanned modifications of our products and services, result in delays or cancellations of orders or reduce funds and demand for our products and services.
We are subject to numerous risks arising from governmental oversight and regulation. You should carefully review the following discussion and the risks discussed under “Item 1A. Risk Factors” for a more detailed discussion.
Affordable Care Act (ACA)
The ACA is a sweeping regulatory measure designed to expand access to affordable health insurance, control healthcare spending and improve healthcare quality. The law includes provisions to tie Medicare provider reimbursement to healthcare quality and incentives, mandatory compliance programs, enhanced transparency disclosure requirements, increased funding and initiatives to address fraud and abuse and incentives to state Medicaid programs to promote community-based care as an alternative to institutional long-term care services. In addition, the law provides for the establishment of a national voluntary pilot program to bundle Medicare payments for hospital and post-acute services, which could lead to changes in the delivery of healthcare services. Likewise, many states have adopted or are considering changes in healthcare policies in part due to state budgetary shortfalls. Ongoing uncertainty regarding implementation of certain aspects of the ACA makes it difficult to predict the impact the ACA or state law proposals may have on our business. The Trump administration and Republican majorities in both houses of Congress have attempted, and may in the future attempt, to repeal, replace, modify or delay implementation of the ACA through both legislative and regulatory action. For example, on December 22, 2017, President Trump signed into law the Tax Cuts and Jobs Act ("TCJA"), which eliminates the individual insurance mandate beginning in 2019. On January 20, 2017, President Trump issued his first executive order titled “Minimizing the Economic Burden of the Patient Protection And Affordable Care Act Pending Repeal,” that directs federal regulators to begin dismantling the ACA through regulatory and policy-making processes and procedures, “to the maximum extent permitted by law.” In June 2017, the House of Representatives passed legislation to repeal and replace the ACA, however in July 2017, the Senate rejected legislation to repeal and replace the ACA. Any future changes may ultimately impact the provisions of the ACA or other laws or regulations that either currently affect, or may in the future affect, our business.
Civil and Criminal Fraud and Abuse Laws
We are subject to federal and state laws and regulations designed to protect patients, governmental healthcare programs and private health plans from fraudulent and abusive activities. These laws include anti-kickback restrictions and laws prohibiting the submission of false or fraudulent claims. These laws are complex and broadly-worded, and their application to our specific products, services and relationships may not be clear and may be applied to our business in ways that we do not anticipate. Federal and state regulatory and law enforcement authorities have over time increased enforcement activities with respect to Medicare and Medicaid fraud and abuse regulations and other reimbursement laws and rules. These laws and regulations include:
17
Anti-Kickback Laws.
The federal Anti-Kickback Statute prohibits the knowing and willful offer, payment, solicitation or receipt of remuneration, directly or indirectly, in return for the referral of patients or arranging for the referral of patients, or in return for the recommendation, arrangement, purchase, lease or order of items or services that are covered, in whole or in part, by a federal healthcare program such as Medicare or Medicaid. The definition of "remuneration" has been broadly interpreted to include anything of value such as gifts, discounts, rebates, waiver of payments or providing anything at less than its fair market value. Many states have adopted similar prohibitions against kickbacks and other practices that are intended to influence the purchase, lease or ordering of healthcare items and services regardless of whether the item or service is covered under a governmental health program or private health plan. Certain statutory and regulatory safe harbors exist that protect specified business arrangements from prosecution under the Anti-Kickback Statute if all elements of an applicable safe harbor are met, however these safe harbors are narrow and often difficult to comply with. Congress has appropriated an increasing amount of funds in recent years to support enforcement activities aimed at reducing healthcare fraud and abuse.
The U.S. Department of Health and Human Services, or HHS, created certain safe harbor regulations which, if fully complied with, assure parties to a particular arrangement covered by a safe harbor that they will not be prosecuted under the Anti-Kickback Statute. We attempt to structure our group purchasing services, pricing discount arrangements with suppliers, and revenue share arrangements with applicable members to meet the terms of the safe harbor for GPOs set forth at 42 C.F.R. § 1001.952(j) and the discount safe harbor set forth at 42 C.F.R. § 1001.952(h). Although full compliance with the provisions of a safe harbor ensures against prosecution under the Anti-Kickback Statute, failure of a transaction or arrangement to fit within a safe harbor does not necessarily mean that the transaction or arrangement is illegal or that prosecution under the Anti-Kickback Statute will be pursued. From time to time, HHS, through its Office of Inspector General, makes formal and informal inquiries, conducts investigations and audits the business practices of GPOs, including our GPO, the result of which could be new rules, regulations or in some cases, a formal enforcement action.
To help ensure regulatory compliance with HHS rules and regulations, our members that report their costs to Medicare are required under the terms of the Premier Group Purchasing Policy to appropriately reflect all elements of value received in connection with our IPO on their cost reports. We are required to furnish applicable reports to such members setting forth the amount of such value, to assist their compliance with such cost reporting requirements. There can be no assurance that the HHS Office of Inspector General or the U.S. Department of Justice, or DOJ, will concur that these actions satisfy their applicable rules and regulations.
False Claims Act.
Our business in general, and our integrated pharmacy in particular, is also subject to numerous federal and state laws that forbid the submission or "causing the submission" of false or fraudulent information or the failure to disclose information in connection with the submission and payment of claims for reimbursement to Medicare, Medicaid or other governmental healthcare programs or private health plans. In particular, the False Claims Act, or FCA, prohibits a person from knowingly presenting or causing to be presented a false or fraudulent claim for payment or approval by an officer, employee or agent of the United States. In addition, the FCA prohibits a person from knowingly making, using, or causing to be made or used a false record or statement material to such a claim. Violations of the FCA may result in treble damages, significant monetary penalties, and other collateral consequences including, potentially, exclusion from participation in federally funded healthcare programs. A claim that includes items or services resulting from a violation of the Anti-Kickback Statute constitutes a false or fraudulent claim for purposes of the FCA.
Privacy and Security Laws.
The Health Insurance Portability and Accountability Act of 1996, or HIPAA, contains substantial restrictions and requirements with respect to the use and disclosure of certain individually identifiable health information, referred to as "protected health information." The HIPAA Privacy Rule prohibits a covered entity or a business associate (essentially, a third party engaged to assist a covered entity with enumerated operational and/or compliance functions) from using or disclosing protected health information unless the use or disclosure is validly authorized by the individual or is specifically required or permitted under the HIPAA Privacy Rule and only if certain complex requirements are met. In addition to following these complex requirements, covered entities and business associates must also meet additional compliance obligations set forth in the HIPAA Privacy Rule. In addition, the HIPAA Security Rule establishes administrative, organizational, physical and technical safeguards to protect the privacy, integrity and availability of electronic protected health information maintained or transmitted by covered entities and business associates. The HIPAA Security Rule requirements are intended to mandate that covered entities and business associates regularly re-assess the adequacy of their safeguards in light of changing and evolving security risks. Finally, the HIPAA Breach Notification Rule requires that covered entities and business associates, under certain circumstances, notify patients/beneficiaries, media outlets and HHS when there has been an improper use or disclosure of protected health information.
Our integrated pharmacy, our self-funded health benefit plan and our healthcare provider members (provided that these members engage in HIPAA-defined standard electronic transactions with health plans, which will be all or the vast majority) are directly regulated by HIPAA as "covered entities." From time to time, as part of our integrated pharmacy business, certain of our affiliates act as business associates of retail and other pharmacies in connection with co-branding initiatives. As such, we are subject to HIPAA and other risks discussed herein associated with being a business associate. Additionally, because most of our U.S. hospital members disclose protected health information to us so that we may use that information to provide certain data analytics,
18
benchmarking, consulting or other operational and compliance services to these members, we are a "business associate" of those members. In these cases, in order to provide members with services that involve the use or disclosure of protected health information, HIPAA requires us to enter into "business associate agreements" with our covered entity members. Such agreements must, among other things, provide adequate written assurances:
|
(i)
|
as to how we will use and disclose the protected health information within certain allowable parameters established by HIPAA,
|
|
(ii)
|
that we will implement reasonable and appropriate administrative, organizational, physical and technical safeguards to protect such information from impermissible use or disclosure,
|
|
(iii)
|
that we will enter into similar agreements with our agents and subcontractors that have access to the information,
|
|
(iv)
|
that we will report breaches of unsecured protected health information, security incidents and other inappropriate uses or disclosures of the information, and
|
|
(v)
|
that we will assist the covered entity with certain of its duties under HIPAA.
|
With the enactment of the Health Information Technology for Economic and Clinical Health, or HITECH Act, the privacy and security requirements of HIPAA were modified and expanded. The HITECH Act applies certain of the HIPAA privacy and security requirements directly to business associates of covered entities. Prior to this change, business associates had contractual obligations to covered entities but were not subject to direct enforcement by the federal government. In 2013, HHS released final rules implementing the HITECH Act changes to HIPAA. These amendments expanded the protection of protected health information by, among other things, imposing additional requirements on business associates, further restricting the disclosure of protected health information in certain cases when the disclosure is part of a remunerated transaction, and modifying the HIPAA Breach Notification Rule, which has been in effect since September 2009, to create a rebuttable presumption that an improper use or disclosure of protected health information under certain circumstances requires notice to affected patients/beneficiaries, media outlets and HHS.
Transaction Requirements.
HIPAA also mandates format, data content and provider identifier standards that must be used in certain electronic transactions, such as claims, payment advice and eligibility inquiries. Although our systems are fully capable of transmitting transactions that comply with these requirements, some payers and healthcare clearinghouses with which we conduct business may interpret HIPAA transaction requirements differently than we do or may require us to use legacy formats or include legacy identifiers as they make the transition to full compliance. In cases where payers or healthcare clearinghouses require conformity with their interpretations or require us to accommodate legacy transactions or identifiers as a condition of successful transactions, we attempt to comply with their requirements, but may be subject to enforcement actions as a result. In 2009, CMS published a final rule adopting updated standard code sets for diagnoses and procedures known as ICD-10 code sets and changing the formats to be used for electronic transactions subject to the ICD-10 code sets, known as Version 5010. All healthcare providers are required to comply with Version 5010 and use the ICD-10 code sets.
Other Federal and State Laws.
In addition to our obligations under HIPAA there are other federal laws that impose specific privacy and security obligations, above and beyond HIPAA, for certain types of health information and impose additional sanctions and penalties. These rules are not preempted by HIPAA. Most states have enacted patient and/or beneficiary confidentiality laws that protect against the disclosure of confidential medical information, and many states have adopted or are considering adopting further legislation in this area, including privacy safeguards, security standards, data security breach notification requirements, and special rules for so-called "sensitive" health information, such as mental health, genetic testing results, or Human Immunodeficiency Virus, or HIV, status. These state laws, if more stringent than HIPAA requirements, are not preempted by the federal requirements, and we are required to comply with them as well.
We are unable to predict what changes to HIPAA or other federal or state laws or regulations might be made in the future or how those changes could affect our business or the associated costs of compliance.
Antitrust Laws
The Sherman Antitrust Act and related federal and state antitrust laws are complex laws that prohibit contracts in restraint of trade or other activities that are designed to or that have the effect of reducing competition in the market. The federal antitrust laws promote fair competition in business and are intended to create a level playing field so that both small and large companies are able to compete in the market. In their 1996 Statements of Antitrust Enforcement Policy in Health Care, or the Healthcare Statements, the DOJ and the Federal Trade Commission, or FTC, set forth guidelines specifically designed to help GPOs gauge whether a particular purchasing arrangement may raise antitrust concerns and established an antitrust safety zone for joint purchasing arrangements among healthcare providers. Under this antitrust safety zone, the DOJ and FTC will not challenge, except in extraordinary circumstances, joint purchasing arrangements among healthcare providers that meet two basic conditions: (i) the purchases made by the healthcare providers account for less than
35%
of the total sales of the purchased product or service in the
19
relevant market; and (ii) the cost of the products and services purchased jointly account for less than
20%
of the total revenues from all products and services sold by each competing participant in the joint purchasing arrangement.
We have attempted to structure our contracts and pricing arrangements in accordance with the Healthcare Statements and believe that our GPO supplier contracts and pricing discount arrangements should not be found to violate the antitrust laws. No assurance can be given that enforcement authorities will agree with this assessment. In addition, private parties also may bring suit for alleged violations under the U.S. antitrust laws. From time to time, the group purchasing industry comes under review by Congress and other governmental bodies with respect to antitrust laws, the scope of which includes, among other things, the relationships between GPOs and their members, distributors, manufacturers and other suppliers, as well as the services performed and payments received in connection with GPO programs.
Congress, the DOJ, the FTC, the U.S. Senate or another state or federal entity could at any time open a new investigation of the group purchasing industry, or develop new rules, regulations or laws governing the industry, that could adversely impact our ability to negotiate pricing arrangements with suppliers, increase reporting and documentation requirements, or otherwise require us to modify our arrangements in a manner that adversely impacts our business. We may also face private or government lawsuits alleging violations arising from the concerns articulated by these governmental factors or alleging violations based solely on concerns of individual private parties.
Governmental Audits
Because we act as a GPO for healthcare providers that participate in governmental programs, our group purchasing services have in the past and may again in the future be subject to periodic surveys and audits by governmental entities or contractors for compliance with Medicare and Medicaid standards and requirements. We will continue to respond to these government reviews and audits but cannot predict what the outcome of any future audits may be or whether the results of any audits could significantly or negatively impact our business, our financial condition or results of operations.
Corporate Compliance Department
We execute and maintain a compliance and ethics program that is designed to assist the Company and its employees conduct operations and activities ethically with the highest level of integrity and in compliance with applicable laws and regulations and, if violations occur, to promote early detection and prompt resolution. These objectives are achieved through education, monitoring, disciplinary action and other remedial measures we believe to be appropriate. We provide all of our employees with education that has been developed to communicate our standards of conduct, compliance policies and procedures as well as policies for monitoring, reporting and responding to compliance issues. We also provide all of our employees with a third party toll-free number and Internet website address in order to report any compliance or privacy concerns. In addition, our Chief Ethics & Compliance Officer individually, and along with the Audit and Compliance Committee of the Board of Directors, helps oversee compliance and ethics matters across our business operations.
Employees
As of
June 30, 2018
, we employed approximately
2,200
persons, approximately
41%
of whom are based in our headquarters in Charlotte, North Carolina. None of our employees are working under a collective bargaining arrangement.
Available Information
We file or furnish, as applicable, annual, quarterly and current reports, proxy statements and other information with the SEC. You may read and copy the documents that we file with or furnish to the SEC at the SEC's Public Reference Room at 100 F Street, NE, Washington, DC 20549. You may obtain further information about the operation of the SEC's Public Reference Room by calling the SEC at 1-800-SEC-0330. You may also inspect these reports and other information without charge at a website maintained by the SEC. The address of this site is
https://www.sec.gov.
In addition, our website address is
www.premierinc.com.
We make available through our website the documents identified above, free of charge, promptly after we electronically file such material with, or furnish it to, the SEC.
We also provide information about our company through: Twitter (https://twitter.com/premierha), Facebook (https://www.facebook.com/premierhealthcarealliance), LinkedIn (https://www.linkedin.com/company/6766), YouTube (https://www.youtube.com/user/premieralliance), Instagram (https://instagram.com/premierha), and Premier's blog (
http://www.actionforbetterhealthcare.com
).
Except as specifically indicated otherwise, the information available on our website, the SEC's website and the social media outlets identified above, is not and shall not be deemed a part of this Annual Report.
20
Our business, operations, and financial position are subject to various risks. Before making an investment in our Class A common stock or other securities we may have outstanding from time to time, you should carefully consider the following risks, as well as the other information contained in this Annual Report. Any of the risks described below could materially harm our business, financial condition, results of operations and prospects, and as a result, an investment in our Class A common stock or other securities we may have outstanding from time to time could decline, and you may lose part or all of the value of your investment. This section does not describe all risks that are or may become applicable to us, our industry, or our business, and it is intended only as a summary of certain material risk factors. Some statements in this Annual Report, including such statements in the following risk factors, constitute forward-looking statements. See the section entitled “Cautionary Note Regarding Forward-Looking Statements” for a discussion of such statements and their limitations. More detailed information concerning other risks or uncertainties we face, as well as the risk factors described below, is contained in other sections of this Annual Report.
Risks Related to Our Business
We face intense competition, which could limit our ability to maintain or expand market share within our industry and harm our business and operating results.
The market for products and services in each of our operating segments is fragmented, intensely competitive and characterized by rapidly evolving technology and product standards, dynamic user needs and the frequent introduction of new products and services. We face intense competition from a number of companies, including the companies listed under “Item 1 - Business - Competition.” The primary competitors for our Supply Chain Services segment are other national and regional GPOs, including in certain cases GPOs owned by healthcare providers. Our integrated pharmacy competes both with large national pharmacies and smaller local specialty pharmacies. Our direct sourcing activities compete primarily with private label offerings and programs, product manufacturers and distributors. The competitors in our Performance Services segment range from smaller niche companies to large, well-financed and technologically-sophisticated entities, and includes information technology providers and consulting and outsourcing firms.
With respect to our products and services in both segments, we compete on the basis of several factors, including breadth, depth and quality of our product and service offerings, ability to deliver clinical, financial and operational performance improvement through the use of products and services, quality and reliability of services, ease of use and convenience, brand recognition and the ability to integrate services with existing technology. Some of our competitors have larger scale, benefit from greater name recognition, and have substantially greater financial, technical and marketing resources. Other of our competitors have proprietary technology that differentiates their product and service offerings from our offerings. As a result of these competitive advantages, our competitors and potential competitors may be able to respond more quickly to market forces, undertake more extensive marketing campaigns for their brands, products and services and make more attractive offers to our members and potential new members.
We also compete on the basis of price in both of our segments. We may be subject to pricing pressures as a result of, among other things, competition within the industry, consolidation of healthcare industry participants, practices of managed care organizations, changes in laws and regulations applicable to our business operations, government action affecting reimbursement and financial stress experienced by our members. If our pricing experiences significant downward pressure, our business will be less profitable and our results of operations will be adversely affected. In this competitive environment, we cannot be certain that we will be able to retain our current members or expand our member base. If we do not retain current members or expand our member base, our business, financial condition and results of operations will be harmed. Moreover, we expect that competition will continue to increase as a result of consolidation in both the healthcare information technology and healthcare services industries. If one or more of our competitors or potential competitors were to merge or partner with another of our competitors, or if new competitors were to enter the healthcare space, the change in the competitive landscape could also adversely affect our ability to compete effectively and could harm our business, financial condition and results of operations.
Consolidation in the healthcare industry could have a material adverse effect on our business, financial condition and results of operations.
Many healthcare industry participants are consolidating to create larger and more integrated healthcare delivery systems with greater market power. We expect regulatory and economic conditions to force additional consolidation in the healthcare industry in the future. As consolidation accelerates, the economies of scale of our members' organizations may grow. If a member experiences sizable growth following consolidation, it may determine that it no longer needs to rely on us and may reduce its demand for our products and services. Some of these large and growing healthcare systems may choose to contract directly with suppliers for certain supply categories, and some suppliers may seek to contract directly with the healthcare providers rather than with GPOs such as ours. In connection with any consolidation, our members may move their business to another GPO, particularly when the acquiring hospital or hospital system is a member of a competing GPO. In addition, as healthcare providers consolidate to create
21
larger and more integrated healthcare delivery systems with greater market power, these providers may try to use their market power to negotiate fee reductions for our products and services across both of our business segments. Finally, consolidation may also result in the acquisition or future development by our members of products and services that compete with our products and services. Any of these potential results of consolidation could have a material adverse effect on our business, financial condition and results of operations.
We may experience significant delays in recognizing revenue or increasing revenue if the sales cycle or implementation period with potential new members takes longer than anticipated.
A key element of our strategy is to market the various products and services in our Supply Chain Services and Performance Services segments directly to healthcare providers, such as health systems and acute care hospitals, and to increase the number of our products and services utilized by existing members. The evaluation and purchasing process is often lengthy and involves significant technical evaluation and commitment of personnel by these organizations. Further, the evaluation process depends on a number of factors, many of which we may not be able to control, including potential new members' internal approval processes, budgetary constraints for technology spending, member concerns about implementing new procurement methods and strategies and other timing effects. In addition, the contract or software implementation process for new products or services can take six months or more and, accordingly, delay our ability to recognize revenue from the sale of such products or services. If we experience an extended or delayed implementation cycle in connection with the sale of additional products and services to existing or new members, it could have a material adverse effect on our business, financial condition and results of operations. In addition, changes in accounting standards that impact revenue recognition, such as
Revenue from Contracts with Customers (Topic 606),
could adversely impact our ability to recognize revenue consistent with our historical practices and could have a material adverse effect on our business, financial condition and results of operations.
We are nearing completion of our assessment and are still in the process of quantifying the impact of the new the accounting standard,
Revenue from Contracts with Customers (Topic 606),
on our consolidated financial statements. Based on this assessment through the date of this Annual Report, we believe that the impact on our consolidated financial statements could be material. However, due to the inherent complexity of our revenue recognition across our lines of business, we continue to evaluate all potential impacts of the new standard and are concurrently refining our business processes, systems and internal controls necessary to support our accounting, reporting and disclosure requirements. Accordingly, a significant amount of work remains as we finalize our implementation, and any preliminary assessment is subject to change. We may experience a material adverse impact on our ability to recognize revenue consistent with our historical practices which could have a material adverse effect on our business, financial condition and results of operations.
Member participation in our GPO programs may be terminated with limited or no notice and without significant termination payments. If our members reduce activity levels or terminate or elect not to renew their contracts, our revenue and results of operations may decrease materially.
We entered into new GPO participation agreements with all of our member owners existing immediately prior to the completion of our IPO on October 1, 2013. These GPO participation agreements are generally for an initial five-year term, although our two largest regional GPO member owners have entered into agreements with seven-year terms. These GPO participation agreements are generally terminable at any time by either party, upon one year's prior written notice, in addition to being terminable for cause. In addition, our GPO participation agreements automatically extend for successive five-year or seven-year periods (corresponding to the length of their initial terms) unless the member owner notifies Premier LP, prior to the fourth anniversary (in the case of five-year agreements), or sixth anniversary (in the case of seven-year agreements), of the then-current term, that such member owner does not want the GPO participation agreement to automatically renew upon the expiration of the then-current term. As of the date of this Annual Report, approximately
96%
of our fiscal 2018 net administrative fees revenue associated with existing members is covered by GPO participation agreements that have been renewed or extended at the same or similar economics, or initially had terms longer than five years. We continue to work with the few remaining member owners that have not yet renewed or extended their GPO participation agreements to renew or extend their GPO participation agreements at the same or similar economics on or before September 30, 2018. There can be no assurance that the members with initial five-year terms that have not renewed or extended their initial agreements, or the members with initial seven-year terms, will ultimately extend or renew their GPO participation agreements. Failure of these members to extend or renew their GPO participation agreements may have a material adverse impact on our revenue and results of operations.
Our success in retaining member participation in our GPO programs depends upon our reputation, strong relationships with such members and our ability to deliver consistent, reliable and high quality products and services; a failure in any of these areas may result in the loss of members. In addition, members may seek to reduce, cancel or elect not to renew their contracts due to factors that are beyond our control and are unrelated to our performance, including their business or financial condition, changes in their strategies or business plans, their acquisition, or economic conditions in general. When contracts are reduced, canceled or not renewed for any reason, we lose the anticipated future revenue associated with such contracts and, consequently, our revenue and results of operations may decrease materially.
22
We derive a significant portion of our revenues from our largest members, some of which are also GPOs that serve our members.
Our top five members, all of which are participants in our group purchasing programs, comprised approximately
14%
of our consolidated net revenues for
the year ended June 30, 2018
, while our two largest regional GPO member owners represented approximately
14%
of our gross administrative fee revenues for
the year ended June 30, 2018
. Additionally, our largest member, GNYHA and its member organizations, comprised approximately
7%
of our consolidated net revenues for the same period. The sudden loss of any significant member or a number of smaller members that are participants in our group purchasing programs could materially and adversely affect our operating results. In addition, certain of our significant members are themselves GPOs with their own respective direct contracting relationships, including relationships with some of our other members. The sudden loss of any of these members may also result in increased competition for our Supply Chain Services segment and could materially and adversely affect our operating results.
The markets for our SaaS informatics products and services may develop more slowly than we expect, which could adversely affect our revenue and our ability to maintain or increase our profitability.
Our success will depend on the willingness of existing and potential new members to increase their use of our SaaS informatics products. Many companies have invested substantial resources to integrate established enterprise software into their businesses and therefore may be reluctant or unwilling to switch to our products and services. Furthermore, some companies may have concerns regarding the risks associated with the security and reliability of the technology delivery model associated with these services. If companies do not perceive the benefits of our products and services, then the market for these products and services may not expand as much or develop as quickly as we expect, which would significantly adversely affect our business, financial condition and results of operations.
Our members are highly dependent on payments from third-party healthcare payers, including Medicare, Medicaid and other government-sponsored programs, and reductions or changes in third-party reimbursement could adversely affect these members and consequently our business.
Our members derive a substantial portion of their revenue from third-party private and governmental payers, including Medicare, Medicaid and other government sponsored programs. Our sales and profitability depend, in part, on the extent to which coverage of and reimbursement for our products and services our members purchase or otherwise obtain through us is available to our members from governmental health programs, private health insurers, managed care plans and other third-party payers. These third-party payers are increasingly using their enhanced bargaining power to secure discounted reimbursement rates and may impose other requirements that adversely impact our members' ability to obtain adequate reimbursement for our products and services. If third-party payers do not approve our products and services for reimbursement or fail to reimburse for them adequately, our members may suffer adverse financial consequences which, in turn, may reduce the demand for and ability to purchase our products or services.
In addition, government actions could limit government spending generally for the Medicare and Medicaid programs, limit payments to healthcare providers and increase emphasis on competitive bidding programs that could have an adverse impact on our members and, in turn, on our business, financial condition and results of operations.
We rely on the administrative fees we receive from our GPO suppliers, and the failure to maintain contracts with these GPO suppliers could have a generally negative effect on our relationships with our members and could adversely affect our business, financial condition and results of operations.
Historically, we have derived a substantial amount of our revenue from the administrative fees that we receive from our GPO suppliers. We maintain contractual relationships with these suppliers which provide products and services to our members at reduced costs and which pay us administrative fees based on the dollars spent by our members for such products and services. Our contracts with these GPO suppliers generally may be terminated upon 90 days' notice. A termination of any relationship or agreement with a GPO supplier would result in the loss of administrative fees pursuant to our arrangement with that supplier, which could adversely affect our business, financial condition and results of operations. In addition, if we lose a relationship with a GPO supplier we may not be able to negotiate similar arrangements for our members with other suppliers on the same terms and conditions or at all, which could damage our reputation with our members and adversely impact our ability to maintain our member agreements or expand our membership base and could have a material adverse effect on our business, financial condition and results of operations.
In addition, CMS, which administers the Medicare and federal aspects of state Medicaid programs, has issued complex rules requiring pharmaceutical manufacturers to calculate and report drug pricing for multiple purposes, including the limiting of reimbursement for certain drugs. These rules generally exclude from the pricing calculation administrative fees paid by drug manufacturers to GPOs to the extent that such fees meet CMS's “bona fide service fee” definition. There can be no assurance that
23
CMS will continue to allow exclusion of GPO administrative fees from the pricing calculation, which could negatively affect the willingness of pharmaceutical manufacturers to pay administrative fees to us.
If we are unable to maintain our relationships with third-party providers or maintain or enter into new strategic alliances, we may be unable to grow our current base business.
Our business strategy includes entering into and maintaining strategic alliances and affiliations with leading service providers and other GPOs. These companies may pursue relationships with our competitors, develop or acquire products and services that compete with our products and services, experience financial difficulties, be acquired by one of our competitors or other third party or exit the healthcare industry, any of which may adversely affect our relationship with them. In addition, in many cases, these companies may terminate their relationships with us for any reason with limited or no notice. If existing relationships with third-party providers or strategic alliances are adversely impacted or are terminated or we are unable to enter into relationships with leading healthcare service providers and other GPOs, we may be unable to maintain or increase our industry presence or effectively execute our business strategy.
If we are not able to timely offer new and innovative products and services, we may not remain competitive and our revenue and results of operations may suffer.
Our success depends on providing products and services within our Supply Chain Services and Performance Services segments that healthcare providers use to improve clinical, financial and operational performance. Information technology providers and other competitors are incorporating enhanced analytical tools and functionality and otherwise developing products and services that may become viewed as more efficient or appealing to our members. If we cannot adapt to rapidly evolving industry standards, technology and member needs, including changing regulations and provider reimbursement policies, we may be unable to anticipate changes in our current and potential new members' requirements that could make our existing technology, products or service offerings obsolete. We must continue to invest significant resources in research and development in order to enhance our existing products and services, maintain or improve our product category rankings and introduce new high quality products and services that members and potential new members will want. If our enhanced existing or new products and services are not responsive to the needs of our members or potential new members, are not appropriately timed with market opportunity or are not effectively brought to market we may lose existing members and be unable to obtain new members and our results of operations may suffer.
Our acquisition activities could result in operating difficulties, dilution, unrecoverable costs and other negative consequences, any of which may adversely impact our financial condition and results of operations.
Our business strategy includes growth through acquisitions of additional businesses and assets. Future acquisitions may not be completed on preferred terms, and acquired assets or businesses may not be successfully integrated into our operations or provide anticipated financial benefits. Any acquisitions we complete will involve risks commonly encountered in acquisitions of businesses. Such risks include, among other things:
|
•
|
failing to integrate the operations and personnel of the acquired businesses in an efficient, timely manner;
|
|
•
|
failure of a selling party to produce all material information during the pre-acquisition due diligence process, or to meet their obligations under post-acquisition agreements;
|
|
•
|
potential liabilities of an acquired company, some of which may not become known until after the acquisition;
|
|
•
|
an acquired company's lack of compliance with laws and governmental rules and regulations, and the related costs and expenses necessary to bring such company into compliance;
|
|
•
|
an acquired company's general information technology controls or their legacy third-party providers may not be sufficient to prevent unauthorized access or transactions, cyber-attacks or other data security breaches;
|
|
•
|
managing the potential disruption to our ongoing business;
|
|
•
|
distracting management focus from our existing core businesses;
|
|
•
|
encountering difficulties in identifying and acquiring products, technologies, or businesses that will help us execute our business strategy;
|
|
•
|
entering new markets in which we have little to no experience;
|
|
•
|
impairing relationships with employees, members, and strategic partners;
|
|
•
|
failing to implement or remediate controls, procedures and policies appropriate for a public company at acquired companies lacking such financial, disclosure or other controls, procedures and policies, potentially resulting in a material weakness in our internal controls over financial reporting;
|
|
•
|
the amortization of purchased intangible assets;
|
|
•
|
incurring expenses associated with an impairment of all or a portion of goodwill and other intangible assets due to the failure of certain acquisitions to realize expected benefits; and
|
24
|
•
|
diluting the share value and voting power of existing stockholders.
|
Anticipated benefits of our previous and future acquisitions may not materialize. Future acquisitions or dispositions of under-performing businesses could result in the incurrence of debt, contingent liabilities or amortization expenses or write-offs of goodwill and other intangible assets, any of which could harm our results of operations and financial condition. In addition, expenses associated with potential acquisitions, including, among others, due diligence costs, legal, accounting, technology and financial advisory fees, travel and internal resources utilization, can be significant. These expenses may be incurred regardless of whether any potential acquisition is completed. In instances where acquisitions are not ultimately completed, these expenses typically cannot be recovered or offset by the anticipated financial benefits of a successful acquisition. As we pursue our business strategy and evaluate opportunities, these expenses may adversely impact our results of operations and earnings per share.
Our business and growth strategy also includes non-controlling investments in or loans to other businesses. In the event the companies we invest in or provide loans to do not perform as well as expected, we could experience the loss of some or all of the value of our investment or loan, which loss could adversely impact our financial condition and results of operations.
Although we conduct accounting, financial, legal and business due diligence prior to making investments, we cannot guarantee that we will discover all material issues that may affect a particular target business, or that factors outside the control of the target business and outside of our control will not later arise. To the extent we invest in or lend money to a financially underperforming or unstable company or an entity in its development stage that does not successfully mature, we may lose the value of our investment or loan. Occasionally, current and future investments are, and will be, made on a non-controlling basis, in which case we have limited ability to influence the financial or business operations of the companies in which we invest. If our investment or loan loses value, we may be required to write down or write off our investment or loan, or recognize impairment or other charges that could adversely impact our financial condition or results of operations and our stock price. Even though these charges may be non-cash items and not have a material impact on our liquidity, the fact that we report charges of this nature could contribute to negative market perceptions about us and our business strategy and our Class A common stock.
We are subject to litigation from time to time, which could have a material adverse effect on our business, financial condition and results of operations.
We participate in businesses that are subject to substantial litigation. We are from time to time involved in litigation, which may include claims relating to commercial, product liability, torts, personal injury, employment, antitrust, intellectual property or other regulatory matters. Additionally, if current or future government regulations are interpreted or enforced in a manner adverse to us or our business, specifically those with respect to antitrust or healthcare laws, we may be subject to enforcement actions, penalties, damages and other material limitations on our business. Furthermore, as a public company, we may become subject to stockholder derivative or other litigation.
From time to time, we have been named as a defendant in antitrust lawsuits brought by suppliers or purchasers of medical products. Typically, these lawsuits have alleged the existence of a conspiracy among manufacturers of competing products and operators of GPOs, including us, to deny the plaintiff access to a market for its products or to limit the plaintiff’s choice of products to buy. No assurance can be given that we will not be subjected to similar actions in the future or that such matters will be resolved in a manner satisfactory to us or which will not harm our business, financial condition or results of operations.
We may become subject to additional litigation in the future. These claims may result in significant defense costs or may compel us to pay significant fines, judgments or settlements, which, if uninsured, could have a material adverse effect on our business, financial condition, results of operations and cash flows. In addition, certain litigation matters could adversely impact our commercial reputation, which is critical for attracting and retaining suppliers and member participation in our GPO programs. Further, stockholder litigation may result in adverse investor perception of our company, negatively impact our stock price and increase our cost of capital.
We rely on Internet infrastructure, bandwidth providers, data center providers and other third parties and our own systems for providing services to our users, and any failure or interruption in the services provided by these third parties or our own systems could expose us to litigation and negatively impact our relationships with users, adversely affecting our brand, our business and our financial performance.
Our ability to deliver our Performance Services segment products is dependent on the development and maintenance of the infrastructure of the Internet and other telecommunications services by third parties. This includes maintenance of a reliable network backbone with the necessary speed, data capacity and security for providing reliable Internet access and services and reliable telephone, Wi-Fi, facsimile and pager systems. We have experienced and expect that we will experience in the future interruptions and delays in these services and availability from time to time. We rely on internal systems as well as third-party suppliers, including bandwidth and telecommunications equipment providers, to provide our services. We are also currently in the process of migrating some of our data center operations to third-party data-hosting facilities. We do not maintain redundant systems or facilities for
25
some of these services. In the event of a catastrophic event with respect to one or more of these systems or facilities, we may experience an extended period of system unavailability, which could negatively impact our relationship with users. To operate without interruption, both we and our service providers must guard against:
|
•
|
damage from fire, power loss, and other natural disasters;
|
|
•
|
communications failures;
|
|
•
|
software and hardware errors, failures, and crashes;
|
|
•
|
security breaches and computer viruses and similar disruptive problems; and
|
|
•
|
other potential interruptions.
|
Any disruption in the network access, telecommunications or co-location services provided by our third-party providers or any failure of or by these third-party providers or our own systems to handle current or higher volume of use could significantly harm our business. We exercise limited control over these third-party suppliers, which increases our vulnerability to problems with services they provide. Any errors, failures, interruptions or delays experienced in connection with these third-party technologies and information services or our own systems could negatively impact our relationships with users and adversely affect our business and financial performance and could expose us to third-party liabilities, some of which may not be adequately insured.
Data loss or corruption due to failures or errors in our systems and service disruptions at our data centers may adversely affect our reputation and relationships with existing members, which could have a negative impact on our business, financial condition and results of operations.
Because of the large amount of data that we collect and manage, it is possible that hardware failures or errors in our systems could result in data loss or corruption or cause the information that we collect to be incomplete or contain inaccuracies that our members regard as significant. Complex software such as ours may contain errors or failures that are not detected until after the software is introduced or updates and new versions are released. Despite testing by us, from time to time we have discovered defects or errors in our software, and such defects or errors may be discovered in the future. Any defects or errors could expose us to risk of liability to members and the government and could cause delays in the introduction of new products and services, result in increased costs and diversion of development resources, require design modifications, decrease market acceptance or member satisfaction with our products and services or cause harm to our reputation.
Furthermore, our members might use our software together with products from other companies. As a result, when problems occur, it might be difficult to identify the source of the problem. Even when our software does not cause these problems, the existence of these errors might cause us to incur significant costs, divert the attention of our technical personnel from our product development efforts, impact our reputation and lead to significant member relations problems.
Moreover, our internal data centers and service provider locations store and transmit critical member data that is essential to our business. While these locations are chosen for their stability, failover capabilities and system controls, we do not directly control the continued or uninterrupted availability of every location. In addition to the services we provide from our offices, we have migrated the majority of our data center operations to a third-party data-hosting facility. Data center facilities are vulnerable to damage or interruption from natural disasters, fires, power loss, telecommunications failures, acts of terrorism, acts of war, and similar events. They are also subject to break-ins, sabotage, intentional acts of vandalism, cyber-attacks and similar misconduct. Despite precautions taken at these facilities, the occurrence of a natural disaster or an act of terrorism, a decision to close the facilities without adequate notice or other unanticipated problems could result in lengthy interruptions in our service. These service interruption events could impair our ability to deliver services or deliverables or cause us to fail to achieve service levels required in agreements with our members, which could negatively affect our ability to retain existing members and attract new members.
If our security measures are breached or fail and unauthorized access to a member's data is obtained, or our members fail to obtain proper permission for the use and disclosure of information, our services may be perceived as not being secure, members may curtail or stop using our services and we may incur significant liabilities.
Our services involve the web-based storage and transmission of members' proprietary information, personal information of employees and protected health information of patients. From time to time we may detect vulnerabilities in our systems, which, even if not resulting in a security breach, may reduce member confidence and require substantial resources to address. If our security measures are breached or fail as a result of third-party action, employee error, malfeasance, insufficiency, defective design or otherwise, someone may be able to obtain unauthorized access to member or patient data. As a result, our reputation could be damaged, our business may suffer and we could face damages for contract breach, penalties and fines for violation of applicable laws or regulations and significant costs for notification to affected individuals, remediation and efforts to prevent future occurrences.
26
We rely upon our members as users of our system for key activities to promote security of the system and the data within it. On occasion, our members have failed to perform these activities. Failure of members to perform these activities may result in claims against us that could expose us to significant expense and harm our reputation. In addition, our members may authorize or enable third parties to access their data or the data of their patients on our systems. Because we do not control such access, we cannot ensure the complete propriety of that access or integrity or security of such data in our systems. Any breach of our security could have a material adverse effect on our business, financial condition and results of operations.
Additionally, we require our members to provide necessary notices and to obtain necessary permissions and waivers for use and disclosure of the information that we receive. If our members do not obtain necessary permissions and waivers, then our use and disclosure of information that we receive from them or on their behalf may be limited or prohibited by state or federal privacy laws or other laws. Any such failure to obtain proper permissions and waivers could impair our functions, processes and databases that reflect, contain or are based upon such data and may prevent use of such data. Moreover, we may be subject to claims or liability for use or disclosure of information by reason of our lack of a valid notice, permission or waiver. These claims or liabilities could subject us to unexpected costs and adversely affect our business, financial condition and results of operations.
We could suffer a loss of revenue and increased costs, exposure to significant liability, reputational harm, and other serious negative consequences if we sustain cyber-attacks or other data security breaches that disrupt our operations or result in the dissemination of proprietary or confidential information about us or our members or other third parties.
We manage and store proprietary information and sensitive or confidential data relating to our operations. We may be subject to cyber-attacks on and breaches of the information technology systems we use for these purposes. Experienced computer programmers and hackers may be able to penetrate our network security and misappropriate or compromise our confidential information or that of third parties, create system disruptions, or cause shutdowns. Computer programmers and hackers also may be able to develop and deploy viruses, worms, malware, ransomware and other malicious software programs that attack our systems or products or otherwise exploit any security vulnerabilities of our systems or products. In addition, sophisticated hardware and operating system software and applications that we produce or procure from third parties may contain defects in design or manufacture, including “bugs” and other problems that could unexpectedly interfere with the operation of our systems.
We expend significant capital to protect against the threat of security breaches, including cyber-attacks, viruses, worms, malware, ransomware and other malicious software programs. Substantial additional expenditures may be required before or after a cyber-attack or breach mitigate in advance or to alleviate any problems caused by cyber-attacks and breaches, including unauthorized access to or theft of patient data and protected health information stored in our information systems and the introduction of computer viruses, worms, malware, ransomware and other malicious software programs to our systems. Our remediation efforts may not be successful and could result in interruptions, delays or cessation of service and loss of existing or potential members.
While we provide our employees training and regular reminders on important measures they can take to prevent breaches, we often identify attempts to gain unauthorized access to our systems. Given the rapidly evolving nature and proliferation of cyber threats, there can be no assurance our training and network security measures or other controls will detect, prevent or remediate security or data breaches in a timely manner or otherwise prevent unauthorized access to, damage to, or interruption of our systems and operations. For example, it has been widely reported that many well-organized international interests, in certain cases with the backing of sovereign governments, are targeting the theft of patient information through the use of advance persistent threats. Similarly, in recent years, several hospitals have reported being the victim of ransomware attacks in which they lost access to their systems, including clinical systems, during the course of the attacks. We are likely to face attempted attacks in the future. Accordingly, we may be vulnerable to losses associated with the improper functioning, security breach or unavailability of our information systems as well as any systems used in acquired operations.
In addition, breaches of our security measures and the unapproved use or disclosure of proprietary information or sensitive or confidential data about us or our members or other third parties could expose us, our members or other affected third parties to a risk of loss or misuse of this information, result in litigation, governmental inquiry and potential liability for us, damage our brand and reputation or otherwise harm our business. Furthermore, we are exposed to additional risks because we rely in certain capacities on third-party data management providers whose possible security problems and security vulnerabilities are beyond our control.
To date, we are not aware of having experienced a material cyber breach or attack. However, given the increasing cyber security threats in the healthcare industry, there can be no assurance we will not experience business interruptions; data loss, ransom, misappropriation or corruption; theft or misuse of proprietary or patient information; or litigation and investigation related to any of those, any of which could have a material adverse effect on our financial position and results of operations and harm our business reputation.
27
Any restrictions on our use of, or ability to license, data or our failure to license data and integrate third-party technologies, could have a material adverse effect on our business, financial condition and results of operations.
We depend upon licenses from third parties, most of which are non-exclusive, for some of the technology and data used in our applications, and for some of the technology platforms upon which these applications are built and operate. We also obtain a portion of the data that we use from government entities and public records and from our members for specific member engagements. We cannot assure you that our licenses for information will allow us to use that information for all potential or contemplated applications and products. In addition, if our members revoke their consent for us to maintain, use, de-identify and share their data, our data assets could be degraded.
In the future, data providers could withdraw their data from us or restrict our usage due to competitive reasons or because of new legislation or judicial interpretations restricting use of the data currently used in our products and services. In addition, data providers could fail to adhere to our quality control standards in the future, causing us to incur additional expense to appropriately utilize the data. If a substantial number of data providers were to withdraw or restrict their data, or if they fail to adhere to our quality control standards, and if we are unable to identify and contract with suitable alternative data suppliers and integrate these data sources into our service offerings, our ability to provide products and services to our members would be materially and adversely impacted, resulting in a material adverse effect on our business, financial condition and results of operations.
We also integrate into our proprietary applications and use third-party software to maintain and enhance, among other things, content generation and delivery, and to support our technology infrastructure. Some of this software is proprietary and some is open source. Our use of third-party technologies exposes us to increased risks, including, but not limited to, risks associated with the integration of new technology into our solutions, the diversion of our resources from development of our own proprietary technology and our inability to generate revenue from licensed technology sufficient to offset associated acquisition and maintenance costs. These technologies may not be available to us in the future on commercially reasonable terms or at all and could be difficult to replace once integrated into our own proprietary applications. Our inability to obtain, maintain or comply with any of these licenses could delay development until equivalent technology can be identified, licensed and integrated, which would harm our business, financial condition and results of operations.
Most of our third-party licenses are non-exclusive and our competitors may obtain the right to use any of the technology covered by these licenses to compete directly with us. Our use of third-party technologies exposes us to increased risks, including, but not limited to, risks associated with the integration of new technology into our solutions, the diversion of our resources from development of our own proprietary technology and our inability to generate revenue from licensed technology sufficient to offset associated acquisition and maintenance costs. In addition, if our data suppliers choose to discontinue support of the licensed technology in the future, we might not be able to modify or adapt our own solutions.
Our use of “open source” software could adversely affect our ability to sell our products and subject us to possible litigation.
The products or technologies acquired, licensed or developed by us may incorporate so-called “open source” software, and we may incorporate open source software into other products in the future. There is little or no legal precedent governing the interpretation of many of the terms of certain of these licenses, and therefore the potential impact of these terms on our business is unknown and may result in unanticipated obligations or litigation regarding our products and technologies. For example, we may be subjected to certain conditions, including requirements that we offer our products that use particular open source software at no cost to the user, that we make available the source code for modifications or derivative works we create based upon, incorporating or using the open source software, and/or that we license such modifications or derivative works under the terms of the particular open source license. In addition, if we combine our proprietary software with open source software in a certain manner, under some open source licenses we could be required to release the source code of our proprietary software, which could substantially help our competitors develop products that are similar to or better than ours. If an author or other party that distributes such open source software were to allege that we had not complied with the conditions of one or more of these licenses, we could be required to incur significant legal costs defending ourselves against such allegations and could be subject to significant damages.
Changes in pharmaceutical industry pricing benchmarks could materially impact our financial performance.
Contracts in the prescription drug industry, including our contracts within our integrated pharmacy business, generally use “average wholesale price,” or AWP, which is published by a third party, as a benchmark to establish pricing for prescription drugs. Various federal and state government agencies and prosecutors, as well as legislators and private litigants, have challenged the use of AWP for prescription drug reimbursement, as well as the manner by which AWP is calculated. Thus, some publishers have ceased providing AWP information, and the uncertainty related to continued AWP industry pricing benchmarks and the lack of reliable alternate pricing sources could have a material adverse effect on our business, financial condition and results of operations in future periods.
28
Our net revenues and profitability may be negatively impacted and our ability to grow our specialty pharmacy operations could be limited if we do not maintain and expand our existing base of drugs, if we lose patients, if manufacturers limit or cease doing business with us, or as a result of increased competition or cuts in governmental programs, payer coverage or reimbursement rates.
Our specialty pharmacy business faces intense competition, both in terms of access to drugs and prescription volume. We dispense significant volumes of brand-name and generic drugs from our specialty pharmacies. Our specialty pharmacy business focuses on complex and high-cost medications that serve a relatively small patient population. Accordingly, our future growth relies, in part, on maintaining and expanding our base of drugs or penetration in certain disease states. Sales volumes at our specialty pharmacy could also be negatively impacted due to increases in the safety/risk profiles or manufacturing issues of specific drugs, product withdrawals by manufacturers or transitions to over-the-counter products. Additionally, negative press regarding drugs with higher safety risk profiles may result in reduced global consumer demand for such drugs. In cases where there are no acceptable prescription drug equivalents or alternatives for these prescription drugs, our prescription volumes may decline. Any loss of patient base or reduction in demand for any reason for the medications we currently dispense could have a material adverse effect on our business, financial condition and results of operations.
The financial success of our specialty pharmacy business also depends, in part, on the extent to which we have payer coverage (e.g., from governmental health programs, private health insurers, managed care plans and other third-party payers) that allows us to be reimbursed for the specialty drugs that we dispense to our patients. If third-party payers do not approve our specialty drugs for reimbursement or fail to reimburse for them adequately, we may experience reduced demand for such drugs. Some payers charge certain direct and indirect remuneration fees ("DIR fees"), often calculated and charged several months after adjudication of a claim, which may adversely impact our profitability. DIR fees is a term used by CMS to address price concessions that ultimately impact the prescription drug costs of Medicare Part D plans, but are not captured at the point of sale. In addition, industry trends may result in health plans contracting with a single provider for specialty pharmacy services and manufacturers limiting their business with regional providers of these services. If we are unable to obtain managed care contracts in the areas in which we provide specialty pharmacy services or are unable to obtain specialty pharmacy products at reasonable costs or at all, our business, financial condition and results of operations could be adversely affected.
Our direct sourcing activities depend on contract manufacturing facilities located in various parts of the world, and any physical, financial, regulatory, environmental, labor or operational disruption or product quality issues could result in a reduction in sales volumes and the incurrence of substantial expenditures.
As part of our direct sourcing activities, we contract with manufacturing facilities in various parts of the world, including facilities in China, Malaysia, Turkey and Thailand. Operations at these manufacturing facilities could be curtailed or partially or completely shut down as the result of a number of circumstances, most of which are outside of our control, such as unscheduled maintenance, an earthquake, hurricane, flood, tsunami or other natural disaster or significant labor strikes, work stoppages or political unrest. Any significant curtailment of production at these facilities, or production issue resulting in a substandard product, could result in litigation or governmental inquiry or materially reduced revenues and cash flows in our direct sourcing activities. In addition our business practices in international markets are subject to the requirements of the U.S. Foreign Corrupt Practices Act of 1977, as amended, any violation of which could subject us to significant fines, criminal sanctions and other penalties. We expect all of our contracted manufacturing facilities, to comply with all applicable laws, including labor, safety and environmental laws, and to otherwise meet our standards of conduct. Our ability to find manufacturing facilities that uphold these standards is a challenge, especially with respect to facilities located outside the United States. We also are subject to the risk that one or more of these manufacturing facilities will engage in business practices in violation of our standards or applicable laws, which could damage our reputation and adversely impact our business and results of operations.
A substantial portion of the manufacturing for our direct sourcing activities is conducted in China. As a result, our business, financial condition, results of operations and prospects are affected significantly by economic, political and legal developments in China as well as trade disputes between China and the United States. The Chinese economy differs from the economies of most developed countries in many respects, including the degree of government involvement, the level of development, the growth rate, the control of foreign exchange, access to financing and the allocation of resources. Additionally, the facilities in China with which we contract are particularly susceptible to labor shortages, labor disputes and interruptions, and rising labor costs as a result of minimum wage laws, scheduling and overtime requirements.
If we lose key personnel or if we are unable to attract, hire, integrate and retain key personnel, our business would be harmed.
Our future success depends in part on our ability to attract, hire, integrate and retain key personnel, including our executive officers and other highly skilled technical, managerial, editorial, sales, marketing and customer service professionals. Competition for such personnel is intense. We have from time to time in the past experienced, and we expect to continue to experience in the future, difficulty in hiring and retaining highly skilled employees with appropriate qualifications. Many of the companies with which we compete for experienced personnel have greater resources than we have. We cannot be certain of our ability to identify, hire and
29
retain adequately qualified personnel, if we lose key personnel unexpectedly. In addition, to the extent we lose an executive officer or senior manager, we may incur increased expenses in connection with the hiring, promotion or replacement of these individuals and the transition of leadership and critical knowledge. Failure to identify, hire and retain necessary key personnel could have a material adverse effect on our business, financial condition and results of operations.
Failure to protect our intellectual property and claims against our use of the intellectual property of third parties could cause us to incur unanticipated expense and prevent us from providing our products and services, which could adversely affect our business, financial condition and results of operations.
Our success depends in part upon our ability to protect our core technology and intellectual property. To accomplish this, we rely on a combination of intellectual property rights, including trade secrets, copyrights and trademarks, as well as customary contractual and confidentiality protections and internal policies applicable to employees, contractors, members and business partners. These protections may not be adequate, however, and we cannot assure you that they will prevent misappropriation of our intellectual property. In addition, parties that gain access to our intellectual property might fail to comply with the terms of our agreements and policies and we may not be able to enforce our rights adequately against these parties. The disclosure to, or independent development by, a competitor of any trade secret, know-how or other technology not protected by a patent could materially and adversely affect any competitive advantage we may have over such competitor. The process of enforcing our intellectual property rights through legal proceedings would likely be burdensome and expensive and our ultimate success cannot be assured. Our failure to adequately protect our intellectual property and proprietary rights could adversely affect our business, financial condition and results of operations.
In addition, we could be subject to claims of intellectual property infringement, misappropriation or other intellectual property violations as our applications' functionalities overlap with competitive products, and third parties may claim that we do not own or have rights to use all intellectual property used in the conduct of our business. We could incur substantial costs and diversion of management resources defending any such claims. Furthermore, a party making a claim against us could secure a judgment awarding substantial damages as well as injunctive or other equitable relief that could effectively block our ability to provide products or services. Such claims also might require indemnification of our members at significant expense.
A number of our contracts with our members contain indemnity provisions whereby we indemnify them against certain losses that may arise from third-party claims that are brought in connection with the use of our products.
Our exposure to risks associated with the protection and use of intellectual property may be increased as a result of acquisitions, as we have limited visibility into the development process of acquired entities or businesses with respect to their technology or the care taken by acquired entities or businesses to safeguard against infringement risks. In addition, third parties may make infringement and similar or related claims after we have acquired technology that had not been asserted prior to our acquisition thereof.
If we are required to collect sales and use taxes on the products and services we sell in certain jurisdictions or online, we may be subject to tax liability for past sales, future sales may decrease and our financial condition may be materially and adversely affected.
Sales tax is currently not imposed on the administrative fees we collect in connection with our GPO programs. If sales tax were imposed in the future on such fees, the profitability of our GPO programs may be materially and adversely affected.
Rules and regulations applicable to sales and use tax vary significantly by tax jurisdiction. In addition, the applicability of these rules given the nature of our products and services is subject to change.
We may lose sales or incur significant costs should various tax jurisdictions be successful in imposing sales and use taxes on a broader range of products and services than those currently so taxed, including products and services sold online. A successful assertion by one or more taxing authorities that we should collect sales or other taxes on the sale of our solutions could result in substantial tax liabilities for past and future sales, decrease our ability to compete and otherwise harm our business.
If one or more taxing authorities determines that taxes should have, but have not, been paid with respect to our products and services, including products and services sold online, we may be liable for past taxes in addition to taxes going forward. Liability for past taxes may also include very substantial interest and penalty charges. If we are required to collect and pay back taxes (and the associated interest and penalties) and if our members fail or refuse to reimburse us for all or a portion of these amounts, we will have incurred unplanned costs that may be substantial. Moreover, imposition of such taxes on our services going forward will effectively increase the cost of such services to our members and may adversely affect our ability to retain existing members or to gain new members in the areas in which such taxes are imposed.
30
Changes in tax laws could materially impact our effective tax rate, income tax expense, cash flows, TRA liabilities and profitability.
Continued economic and political conditions in the United States could result in changes in U.S. tax laws beyond those enacted in connection with the TCJA on December 22, 2017. Further changes to U.S. tax laws could impact how U.S. corporations are taxed. Although we cannot predict whether or in what form such changes will pass, if enacted into law, they could have a material impact on our effective tax rate, TRA liabilities, income tax expense, results of operations, cash flows, and profitability.
We may need to obtain additional financing which may not be available or may be on unfavorable terms and result in dilution to, or a diminution of the rights of, our stockholders and cause a decrease in the price of our Class A common stock.
We may need to raise additional funds in order to, among other things:
|
•
|
finance unanticipated working capital requirements;
|
|
•
|
develop or enhance our technological infrastructure and our existing products and services;
|
|
•
|
fund strategic relationships;
|
|
•
|
respond to competitive pressures; and
|
|
•
|
acquire complementary businesses, assets, technologies, products or services.
|
Additional financing may not be available on terms favorable to us, or at all. If adequate funds are not available or are not available on acceptable terms, our ability to fund our expansion strategy, take advantage of unanticipated opportunities, develop or enhance technology or services or otherwise respond to competitive pressures would be significantly limited. If we raise additional funds by issuing equity or convertible debt securities, our then-existing stockholders may be diluted and holders of these newly issued securities may have rights, preferences or privileges senior to those of our then-existing stockholders. The issuance of these securities may cause downward pressures on the trading price of our Class A common stock.
If we cannot refinance or replace our existing credit facility at maturity, it would have a material adverse effect on our ability to fund our ongoing cash requirements. Our indebtedness could adversely affect our business and our liquidity position.
We have a
five-year
$750 million
unsecured revolving credit facility, which includes an accordion feature granting us the ability to increase the size of the facility by an additional
$250 million
on terms and conditions mutually acceptable to the parties. As of
June 30, 2018
, we had
$100.0 million
outstanding under this credit facility. Our current credit facility matures on June 24, 2019 and any outstanding indebtedness would be payable on or before that date. We expect to commence negotiations to refinance or replace our current credit facility during the first half of fiscal 2019. However, any refinanced or replacement credit facility may not be available on terms favorable to us, or at all. If we are not able to refinance or replace our existing credit facility or do so on acceptable terms, it would have a material adverse effect on our ability to fund our primary cash requirements, including ongoing business operations, capital expenditures, discretionary cash settlements of Class B common unit exchanges under the Exchange Agreement, repurchases of Class A common stock under our current and future, if any, stock repurchase programs and acquisitions and related business investments.
Our indebtedness may increase from time to time in the future for various reasons, including fluctuations in operating results, capital expenditures and potential acquisitions. Any indebtedness we incur and restrictive covenants contained in the agreements related thereto could:
|
•
|
make it difficult for us to satisfy our obligations, including making interest payments on our other debt obligations;
|
|
•
|
limit our ability to obtain additional financing to operate our business;
|
|
•
|
require us to dedicate a substantial portion of our cash flow to payments on our debt, reducing our ability to use our cash flow to fund capital expenditures and working capital and other general operational requirements;
|
|
•
|
limit our flexibility to execute our business strategy and plan for and react to changes in our business and the healthcare industry;
|
|
•
|
place us at a competitive disadvantage relative to some of our competitors that have less debt than us;
|
|
•
|
limit our ability to pursue acquisitions; and
|
|
•
|
increase our vulnerability to general adverse economic and industry conditions, including changes in interest rates or a downturn in our business or the economy.
|
The occurrence of any one of these events could cause an increase in our cost of capital and thus have a material adverse effect on our cost of capital, business, financial condition and results of operations or cause a significant decrease in our liquidity and impair our ability to pay amounts due on our indebtedness.
31
Our existing unsecured revolving credit facility contains, among other things, restrictive covenants that will limit our and our subsidiaries' ability to finance future operations or capital needs or to engage in other business activities. The credit facility restricts, among other things, our ability and the ability of our subsidiaries to incur additional indebtedness or issue guarantees, create liens on our assets, make distributions on or redeem equity interests, make investments, transfer or sell properties or other assets, and engage in mergers, consolidations or acquisitions. Furthermore, the credit facility includes cross-default provisions and requires us to meet specified financial ratios and tests. We expect any refinanced or replacement credit facility to contain substantially similar restrictive and financial covenants. In addition, any debt securities we may issue in the future may have similar or more restrictive financial or operational covenants that may limit our ability to execute our business strategies or operate our Company.
Our quarterly revenues and results of operations have fluctuated in the past and may continue to fluctuate in the future.
Fluctuations in our quarterly results of operations may be due to a number of factors, some of which are not within our control, including:
|
•
|
our ability to offer new and innovative products and services;
|
|
•
|
regulatory changes, including changes in healthcare laws;
|
|
•
|
unforeseen legal expenses, including litigation and settlement costs;
|
|
•
|
the purchasing and budgeting cycles of our members;
|
|
•
|
the lengthy sales cycles for our products and services, which may cause significant delays in generating revenues or an inability to generate revenues;
|
|
•
|
pricing pressures with respect to our future sales;
|
|
•
|
the timing and success of new product and service offerings by us or by our competitors;
|
|
•
|
member decisions regarding renewal or termination of their contracts, especially those involving our larger member relationships;
|
|
•
|
the amount and timing of costs related to the maintenance and expansion of our business, operations and infrastructure;
|
|
•
|
the amount and timing of costs related to the development, adaptation, acquisition, or integration of acquired technologies or businesses;
|
|
•
|
the financial condition of our current and potential new members; and
|
|
•
|
general economic and market conditions and conditions specific to the healthcare industry.
|
Our quarterly results of operations may vary significantly in the future and period-to-period comparisons of our results of operations may not be meaningful. You should not rely on the results of one quarter as an indication of future performance. If our quarterly results of operations fall below the expectations of securities analysts or investors, the price of the Class A common stock could decline substantially. In addition, any adverse impacts on the Class A common stock may harm the overall reputation of our organization, cause us to lose members and impact our ability to raise additional capital in the future.
Risks Related to Healthcare Regulation
The healthcare industry is highly regulated. Any material changes in the political, economic or regulatory environment that affect the GPO business or the purchasing practices and operations of healthcare organizations, or that lead to consolidation in the healthcare industry, could reduce the funds available to providers to purchase our products and services or otherwise require us to modify our services.
Our business, financial condition and results of operations depend upon conditions affecting the healthcare industry generally and hospitals and health systems particularly, as well as our ability to increase the number of programs and services that we sell to our members and other customers. The life sciences and healthcare industry is highly regulated by federal and state authorities and is subject to changing political, economic and regulatory influences. Factors such as changes in reimbursement policies for healthcare expenses, consolidation in the healthcare industry, regulation, litigation and general economic conditions affect the purchasing practices, operations and the financial health of healthcare organizations. In particular, changes in regulations affecting the healthcare industry, such as increased regulation of the purchase and sale of medical products, tariffs, new quality measurement and payment models, modification or elimination of applicable regulatory safe harbors, or restrictions on permissible discounts and other financial arrangements, could require us to make unplanned modifications of our products and services, result in delays or cancellations of orders or reduce funds and demand for our products and services.
In March 2010, President Obama signed into law the ACA. The ACA is a sweeping measure designed to expand access to affordable health insurance, control healthcare spending and improve healthcare quality. In addition, many states have adopted or are considering changes in healthcare laws or policies in part due to state budgetary shortfalls. The ACA set the industry moving in a clear direction on access to health insurance, payment, quality and cost management. The 2016 election of Donald Trump with
32
unified Republican control of government has caused a significant re-direction of government policy and resulting uncertainty. In January 2017, President Trump signed an executive order waiving various enforcement provisions under the ACA. While efforts to repeal and replace the ACA failed to pass the Senate in 2017, continued regulatory changes impact the direction of the law, which impact both our member healthcare providers and our business. This uncertainty as to the law's future, or the possible amendment or replacement of the law in the future, could adversely affect our business. Moreover, the Trump administration continues to advance new reforms related to value-based payment, the physician payment system, 340B, drug pricing, tariffs and the structure of healthcare regulation, which are apart from changes to the ACA. Taken together, this environment has created significant uncertainty on the overall outlook for the ACA, directions in state laws that also impact healthcare providers, as well as new regulatory challenges. Taken together, this environment is creating risks for healthcare providers and our business that could adversely affect our business and financial performance.
If we fail to comply with complex federal and state laws governing financial relationships among healthcare providers and submission of false or fraudulent claims to government healthcare programs, we may be subject to civil and criminal penalties or loss of eligibility to participate in government healthcare programs.
Anti-Kickback Regulations
We are subject to federal and state laws and regulations designed to protect patients, government healthcare programs and private health plans from fraudulent and abusive activities. These laws include anti-kickback restrictions and laws prohibiting the submission of false or fraudulent claims. These laws are complex, and their application to our specific products, services and relationships may not be clear and may be applied to our business in ways that we do not anticipate. Federal and state regulatory and law enforcement authorities have over time increased enforcement activities with respect to Medicare and Medicaid fraud and abuse regulations and other reimbursement laws and rules. From time to time, we and others in the healthcare industry have received inquiries or requests to produce documents in connection with such activities. We could be required to expend significant time and resources to comply with these requests, and the attention of our management team could be diverted to these efforts. Furthermore, if we are found to be in violation of any federal or state fraud and abuse laws, we could be subject to civil and criminal penalties and we could be excluded from participating in federal and state healthcare programs such as Medicare and Medicaid. The occurrence of any of these events could significantly harm our business, financial performance and financial condition.
Provisions in Title XI of the Social Security Act, commonly referred to as the federal Anti-Kickback Statute, prohibit the knowing and willful offer, payment, solicitation or receipt of remuneration, directly or indirectly, in return for the referral of patients or arranging for the referral of patients, or in return for the recommendation, arrangement, purchase, lease or order of items or services that are covered, in whole or in part, by a federal healthcare program such as Medicare or Medicaid. The definition of “remuneration” has been broadly interpreted to include anything of value such as gifts, discounts, rebates, waiver of payments or providing anything at less than its fair market value. Many states have adopted similar prohibitions against kickbacks and other practices that are intended to influence the purchase, lease or ordering of healthcare items and services regardless of whether the item or service is covered under a governmental health program or private health plan. Although certain statutory and regulatory safe harbors exist, these safe harbors are narrow and often difficult to comply with. Congress has appropriated an increasing amount of funds in recent years to support enforcement activities aimed at reducing healthcare fraud and abuse. We cannot assure you that our arrangements will be protected by such safe harbors or that such increased enforcement activities will not directly or indirectly have an adverse effect on our business, financial condition or results of operations. Any determination by a state or federal agency that any of our activities violate any of these laws could subject us to civil or criminal penalties, could require us to change or terminate some portions of our operations or business or could disqualify us from providing services to healthcare providers doing business with government programs and, thus, could have a material adverse effect on our business, financial condition and results of operations.
CMS has provided specific guidance on the proper treatment on Medicare cost reports of revenue distributions received from GPOs, including us. To assist our members that report their costs to Medicare to comply with these guidelines, such members are required under the terms of the Premier Group Purchasing Policy to appropriately reflect all elements of value received in connection with our IPO on their cost reports. We furnish applicable reports to such members setting forth the amount of such value, to assist their compliance with such cost reporting requirements. Any determination by a state or federal agency that the provision of such elements of value violate any of these laws could subject us to civil or criminal penalties, could require us to change or terminate some portions of our operations or business, or could disqualify us from providing services to healthcare providers doing business with government programs, and, thus could have a material adverse effect on our business, financial condition and results of operations.
We periodically receive and respond to questions from government agencies on various matters, and we responded to an informal request in July 2014 from the HHS Office of Inspector General to analyze and discuss how the GPO Participation Agreements comply with the discount safe harbor to the Anti-Kickback Statute. We have had no further correspondence or interaction, oral or written, with the HHS Office of Inspector General regarding Anti-Kickback Statute compliance since that time. There is no safe harbor to the Anti-Kickback Statute that is applicable in its entirety across all of the agreements with our members, and no assurance can be given that the HHS Office of Inspector General or other regulators or enforcement authorities will agree with our assessment.
33
Any determination by a state or federal agency that the terms, agreements and related communications with members, or our relationships with our members violates the Anti-Kickback Statute or any other federal or state laws could subject us to civil or criminal penalties, could require us to change or terminate some portions of our operations or business and could disqualify us from providing services to healthcare providers doing business with government programs and, thus, result in a material adverse effect on our business, financial condition and results of operations.
False Claims Regulations
Our business is also subject to numerous federal and state laws that forbid the submission or “causing the submission” of false or fraudulent information or the failure to disclose information in connection with the submission and payment of claims for reimbursement to Medicare, Medicaid, other federal healthcare programs or private health plans. In particular, the False Claims Act, or FCA, prohibits a person from knowingly presenting or causing to be presented a false or fraudulent claim for payment or approval by an officer, employee or agent of the United States. In addition, the FCA prohibits a person from knowingly making, using, or causing to be made or used a false record or statement material to such a claim. Violations of the FCA may result in treble damages, significant monetary penalties and other collateral consequences, potentially including exclusion from participation in federally funded healthcare programs. The minimum and maximum per claim monetary damages for FCA violations occurring on or after November 2, 2015 and assessed after January 29, 2018 are from
$11,181
to
$22,363
per claim, respectively, and will be periodically readjusted for inflation. If enforcement authorities find that we have violated the FCA, it could have a material adverse effect on our business, financial condition and results of operations. Pursuant to the 2010 healthcare reform legislation, a claim that includes items or services resulting from a violation of the Anti-Kickback Statute constitutes a false or fraudulent claim for purposes of the FCA.
These laws and regulations may change rapidly and it is frequently unclear how they apply to our business. Errors in claims submitted by our specialty pharmacies and pharmacy benefits management businesses, as well as errors created by our products or consulting services that relate to entry, formatting, preparation or transmission of claim or cost report information by our members may be determined or alleged to be in violation of these laws and regulations. Any failure of our businesses or our products or services to comply with these laws and regulations, or the assertion that any of our relationships with suppliers or members violated the Anti-Kickback Statute and therefore caused the submission of false or fraudulent claims, could (i) result in substantial civil or criminal liability, (ii) adversely affect demand for our services, (iii) invalidate all or portions of some of our member contracts, (iv) require us to change or terminate some portions of our business, (v) require us to refund portions of our services fees, (vi) cause us to be disqualified from serving members doing business with government payers, and (vii) have a material adverse effect on our business, financial condition and results of operations.
If current or future antitrust laws and regulations are interpreted or enforced in a manner adverse to us or our business, we may be subject to enforcement actions, penalties and other material limitations on our business.
We are subject to federal and state laws and regulations designed to protect competition which, if enforced in a manner adverse to us or our business, could have a material adverse effect on our business, financial condition and results of operations. Over the last decade or so, the group purchasing industry has been the subject of multiple reviews and inquiries by the U.S. Senate and its members with respect to antitrust laws. Additionally, the U.S. General Accounting Office, or GAO, has published several reports examining GPO pricing, contracting practices, activities and fees. We and several other operators of GPOs have responded to GAO inquiries in connection with the development of such reports. No assurance can be given regarding any further inquiries or actions arising or resulting from these examinations and reports, or any related impact on our business, financial condition or results of operations.
Congress, the DOJ, the Federal Trade Commission, or FTC, the U.S. Senate or another state or federal entity could at any time open a new investigation of the group purchasing industry, or develop new rules, regulations or laws governing the industry, that could adversely impact our ability to negotiate pricing arrangements with suppliers, increase reporting and documentation requirements, or otherwise require us to modify our arrangements in a manner that adversely impacts our business, financial condition and results of operations. We may also face private or government lawsuits alleging violations arising from the concerns articulated by these governmental factors or alleging violations based solely on concerns of individual private parties.
If we are found to be in violation of the antitrust laws we could be subject to civil and criminal penalties or damages. The occurrence of any of these events could significantly harm our business, financial condition and results of operations.
Complex international, federal and state, as well as international, privacy, security and breach notification laws may increase the costs of operation and expose us to civil and criminal government sanctions and third-party civil litigation.
We must comply with extensive federal and state requirements regarding the use, retention, security and re-disclosure of patient/beneficiary healthcare information. The Health Insurance Portability and Accountability Act of 1996, as amended, and the regulations that have been issued under it, which we refer to collectively as HIPAA, contain substantial restrictions and complex
34
requirements with respect to the use and disclosure of certain individually identifiable health information, referred to as “protected health information.” The HIPAA Privacy Rule prohibits a covered entity or a business associate (essentially, a third party engaged to assist a covered entity with enumerated operational and/or compliance functions) from using or disclosing protected health information unless the use or disclosure is validly authorized by the individual or is specifically required or permitted under the HIPAA Privacy Rule and only if certain complex requirements are met. The HIPAA Security Rule establishes administrative, organization, physical and technical safeguards to protect the privacy, integrity and availability of electronic protected health information maintained or transmitted by covered entities and business associates. The HIPAA Breach Notification Rule requires that covered entities and business associates, under certain circumstances, notify patients/beneficiaries and HHS when there has been an improper use or disclosure of protected health information.
Our specialty pharmacy business, our self-funded health benefit plan, and our healthcare provider members (provided that these members engage in HIPAA-defined standard electronic transactions with health plans, which will be all or the vast majority) are directly regulated by HIPAA as “covered entities.” From time to time, as part of our integrated pharmacy business, certain of our affiliates act as business associates of retail and other pharmacies in connection with co-branding initiatives. As such, we are subject to HIPAA and other risks discussed herein associated with being a business associate. Additionally, because most of our U.S. hospital members disclose protected health information to us so that we may use that information to provide certain data analytics, benchmarking, consulting or other operational and compliance services to these members, we are a “business associate” of those members and are required to protect such health information under HIPAA. With the enactment of the HITECH Act of 2009 and Omnibus Rule in March 2013, the privacy and security requirements of HIPAA were modified and expanded, including further restrictions on the disclosure of protected health information by business associates of covered entities in certain cases when the disclosure is part of a remunerated transaction, and modifying the HIPAA Breach Notification Rule, which has been in effect since September 2009, to create a rebuttable presumption that any acquisition, access, use or disclosure of protected health information not permitted under the Privacy Rule requires notice to affected patients/beneficiaries and HHS.
Any failure or perceived failure of our products or services to meet HIPAA standards and related regulatory requirements could expose us to certain notification, penalty and/or enforcement risks, damage our reputation and adversely affect demand for our products and services and force us to expend significant capital, research and development and other resources to modify our products or services to address the privacy and security requirements of our members and HIPAA.
In addition to our obligations under HIPAA there are other federal laws that include specific privacy and security obligations, above and beyond HIPAA, for certain types of health information and impose additional sanctions and penalties. These rules are not preempted by HIPAA. All 50 states, the District of Columbia, Guam, Puerto Rico and the Virgin Islands have enacted legislation requiring notice to individuals of security breaches of information involving protected health information, which is not uniformly defined amongst the breach notification laws. Organizations must review each state's definitions, mandates and notification requirements and timelines to appropriately prepare and notify affected individuals and government agencies, including the attorney general, in compliance with such state laws. Further, most states have enacted patient and/or beneficiary confidentiality laws that protect against the disclosure of confidential medical information, and many states have adopted or are considering adopting further legislation in this area, including privacy safeguards, security standards and special rules for so-called “sensitive” health information, such as mental health, genetic testing results or HIV status and biometric data. These state laws, if more stringent than HIPAA requirements, are not preempted by the federal requirements, and we are required to comply with them as well.
The recent implementation of the General Data Protection Regulation ("GDPR") on May 25, 2018, a regulation in European Union ("EU") law on data protection and privacy for all individuals within the EU and the European Economic Area ("EEA"), can affect our obligations on the receipt, storage and use of protected health information attributed to individuals residing in the EU and EEA. GDPR applies to all enterprises, regardless of location, that are doing business in the EU, or that collect and analyze data tied to EU and EEA residents in connection with goods/services offered to such individuals. Some of our products and solutions are accessible internationally and such services collect protected health information attributed to EU and EEA individuals when they engage in the use of our products and solutions. GDPR requires stringent technical and security controls surrounding the storage, use and disclosure of protected health information, including the right to revoke consent to use, maintain, share or identify the individual through their protected health information. GDPR is a regulation, not a directive; therefore it does not require national governments to pass any enabling legislation and is directly binding and applicable. Sanctions under GDPR for violations of certain provisions range from a warning in writing to
€20 million
or up to 4% of the annual worldwide turnover of the preceding financial year for that organization, whichever is greater.
We are unable to predict what changes to HIPAA or other federal or state laws or regulations might be made in the future or how those changes could affect the demand for our products and services, our business or the associated costs of compliance.
Failure to comply with any of the federal and state standards regarding patient privacy, identity theft prevention and detection and data security may subject us to penalties, including civil monetary penalties and, in some circumstances, criminal penalties. In addition, such failure may materially injure our reputation and adversely affect our ability to retain members and attract new members and, accordingly, adversely affect our financial performance.
35
If we become subject to regulation by the Food and Drug Administration because the functionality in one or more of our software applications causes the software to be regulated as a medical device, our financial results may be adversely impacted due to increased operating costs or delayed commercialization of regulated software products.
The Food and Drug Administration ("FDA") has the authority to regulate products that meet the definition of a medical device under the Food, Drug and Cosmetic Act. To the extent that functionality in one or more of our current or future software products causes the software to be regulated as a medical device under existing or future FDA regulations, we could be required to:
|
•
|
register our company and list our FDA-regulated products with the FDA;
|
|
•
|
obtain pre-market clearance from the FDA based on demonstration of substantial equivalence to a legally marketed device before marketing our regulated products;
|
|
•
|
obtain FDA approval by demonstrating the safety and effectiveness of the regulated products prior to marketing;
|
|
•
|
submit to inspections by the FDA; and
|
|
•
|
comply with various FDA regulations, including the agency’s quality system regulation, medical device reporting regulations, requirements for medical device modifications, increased rigor of the secure development life cycle in the development of medical devices and the interoperability of medical devices and electronic health records, requirements for clinical investigations, corrections and removal reporting regulations, and post-market surveillance regulations.
|
The FDA can impose extensive requirements governing pre- and post-market activities, such as clinical investigations involving the use of a regulated product, as well as conditions relating to clearance or approval, labeling and manufacturing of a regulated product. In addition, the FDA can impose extensive requirements governing development controls and quality assurance processes. Any application of FDA regulations to our business could adversely affect our financial results by increasing our operating costs, slowing our time to market for regulated software products, and making it uneconomical to offer some software products.
Our integrated pharmacy operations are subject to governmental regulations, procedures and requirements; and noncompliance therewith or a significant regulatory change could adversely affect our business, results of our operations or financial condition.
In addition to the other laws and regulations we face, our integrated pharmacy business is subject to numerous federal, state and local laws and regulations. Changes in these regulations may require extensive system and operating changes that may be difficult to implement. The regulations to which our integrated pharmacy operations are subject include, but are not limited to, federal, state and local registration and regulation of pharmacies; supply chain security; dispensing and sale of controlled substances; regulations regarding e-prescriptions and electronic medical records, applicable Medicare and Medicaid regulations, including the Medicare Part D program; HIPAA; regulations governing aspects of healthcare plan arrangements; regulations relating to the protection of the environment and health and safety matters, including those governing exposure to and the management and disposal of hazardous substances; regulations enforced by the U. S. Federal Trade Commission, the U. S. Department of Health and Human Services and the Drug Enforcement Administration, as well as state boards of pharmacy and other state regulatory authorities, governing the sale, advertisement and promotion of products we sell; anti-kickback laws; false claims laws and federal and state laws and regulations governing the practice of the profession of pharmacy. Untimely compliance or noncompliance with applicable regulations could result in the imposition of civil and criminal penalties that could adversely affect the continued operation of our business, including: (i) suspension or disgorgement of payments from government programs; (ii) loss of required government certifications; (iii) loss of authorizations to participate in or exclusion from government reimbursement programs, such as the Medicare and Medicaid programs; (iv) loss of licenses; or (v) significant fines or monetary penalties.
Certain risks are inherent in providing pharmacy services; our insurance may not be adequate to cover any claims against us.
Pharmacies are exposed to risks inherent in the packaging and distribution of pharmaceuticals and other healthcare products, such as with respect to improper filling or labeling of prescriptions, adequacy of warnings, unintentional distribution of counterfeit, defective, expired or contaminated drugs, product tampering or recalls, and changes to shipping regulations or costs. Errors in the dispensing and packaging of pharmaceuticals could lead to serious injury or death. In addition, federal and state laws that require our pharmacists to offer counseling, without additional charge, to their customers about medication, dosage, delivery systems, common side effects and other information the pharmacists deem significant can impact our business. Our pharmacists may also have a duty to warn customers regarding any potential negative effects of a prescription drug if the warning could reduce, negate or help manage these effects. Product liability or personal injury claims may be asserted against us with respect to any of the products or pharmaceuticals we sell or services we provide. Should a product or other liability issue arise, the coverage limits under our insurance programs and the indemnification amounts available to us may not be adequate to protect us against claims. We also may not be able to maintain this insurance on acceptable terms in the future. Damage to our reputation in the event of a
36
product liability or personal injury issue, material financial judgment against us, or a product recall could have a material adverse effect on our business operations, financial condition and results of operations.
Risks Related to Our Structure
Premier, Inc. is a holding company with no material business operations of its own, and it depends on distributions from Premier LP to pay taxes, make payments under the TRAs, make share repurchases of, and pay any cash dividends, if declared, on our Class A common stock.
Premier, Inc. is a holding company with no material operations of its own, and it currently has no independent ability to generate revenue. Consequently, Premier, Inc.'s ability to obtain operating funds currently depends upon distributions from Premier LP to Premier GP and then from Premier GP to Premier, Inc. In accordance with the LP Agreement, subject to applicable laws and regulations and the terms of Premier LP's financing agreements, Premier GP causes Premier LP to make quarterly distributions to Premier GP and to the holders of Class B common units to facilitate the payment of taxes, as may be required. Premier GP distributes any amounts it receives from Premier LP to Premier, Inc., and Premier, Inc. uses such amounts to (i) pay applicable taxes, (ii) meet its obligations under the TRAs and (iii) meet its obligations to the member owners under the Exchange Agreement if such member owners elect to exchange their Class B common units for shares of our Class A common stock and we elect to pay some or all of the consideration to such member owners in cash.
In addition, pursuant to the GPO participation agreements, Premier LP generally is contractually required to pay each member owner a
30%
revenue share, and pay other designated revenue shares to some members, of all gross administrative fees collected by Premier LP based upon purchasing by such member owner's owned, leased, managed and affiliated facilities through our GPO participation agreements and contracts.
To the extent that Premier, Inc. needs funds and Premier LP is restricted from making distributions under applicable law or regulation or under the terms of our unsecured revolving credit facility or is otherwise unable to provide such funds, Premier, Inc.'s liquidity and financial condition could be materially and adversely affected. In addition, our ability to purchase Class A common shares under our current or any future share repurchase program is dependent on Premier LP’s ability to make distributions to Premier, Inc. Furthermore, the declaration and payment of future dividends by us, if any, will be at the discretion of our Board of Directors and will depend on, among other things, financial results and cash flows from Premier LP's operations, our strategic plans and such other factors as our Board of Directors considers relevant. In addition, Premier LP is generally prohibited under Delaware law from making a distribution to a partner to the extent that, at the time of the distribution, after giving effect to the distribution, liabilities of the limited partnership (with certain exceptions) exceed the fair value of its assets.
Different interests among our member owners or between our member owners and us, including with respect to related party transactions, could prevent us from achieving our business goals.
A majority of our Board of Directors is comprised of directors and executive officers of our member owners. Certain of our member owners could have business interests that may conflict with those of the other member owners, which may make it difficult for us to pursue strategic initiatives that require consensus among our member owners.
In addition, our relationship with our member owners, who are both our members and who, in the aggregate, own a significant percentage of our common stock and the units of Premier LP, could create conflicts of interest among the member owners, or between the member owners and us, in a number of areas relating to our past and ongoing relationships. For example, certain of our products and services compete (or may compete in the future) with various products and services of our member owners. In addition, conflicts of interest may arise among the member owners based on certain allocations of net profits that the member owners may receive in proportion to their relative participation in our products and services. Except as set forth in the TRAs, the GPO participation agreements and the LP Agreement, there are not any formal dispute resolution procedures in place to resolve conflicts between us and a member owner or between member owners. If we are unable to resolve any actual or potential conflicts between us and a member owner, or if we are forced to resolve one or more conflicts on terms that are less favorable to us than if we were negotiating with an unaffiliated party, we may experience a material adverse effect on our business operations, financial condition and results of operations.
Our member owners are able to exercise significant control over us, including through the election of all of our directors.
A majority of the members of our Board of Directors are employees of member owners. In addition, our member owners beneficially own, in the aggregate,
100%
of our outstanding shares of Class B common stock, giving them control of approximately
60%
of the combined voting power of our Class A common stock and Class B common stock as of
June 30, 2018
. Our member owners also own, from time to time, shares of our Class A common stock, thereby further increasing their aggregate voting power. Pursuant to the terms of a voting trust agreement (the "Voting Trust Agreement"), the trustee will vote all of the member owners' Class B common stock as a block in the manner determined by the plurality of the votes received by the trustee from the member owners for the election of directors to serve on our Board of Directors, and by a majority of the votes received by the trustee from the
37
member owners for all other matters. As a result, our member owners have the ability to elect all of the members of our Board of Directors and thereby control our management and affairs. In addition, our member owners will be able to determine the outcome of or significantly influence substantially all matters requiring action by our stockholders, including amendments to our certificate of incorporation and bylaws, any proposed merger, consolidation or sale of all or substantially all of our assets and other corporate transactions even if such actions are not favored by our other stockholders. This concentration of ownership may also prevent a change in the composition of our Board of Directors or a change in control of our company that could deprive other stockholders of an opportunity to receive a premium for their Class A common stock as part of a sale of our company and might ultimately affect the market price of our Class A common stock.
In addition, at
June 30, 2018
our member owners owned
100%
of our outstanding Class B common units, representing approximately
60%
of the outstanding partnership units of Premier LP. Because they hold their economic ownership interest in our business through Premier LP, rather than through Premier, Inc., due to the fact that shares of Class B common stock are not entitled to any economic rights, these member owners may have conflicting interests with holders of shares of our Class A common stock. For example, many of our member owners are not-for-profit organizations which, as a result of their tax-exempt status, could influence their decisions regarding whether and when to dispose of assets, whether and when to incur new, or refinance existing, indebtedness, and whether and when Premier should terminate the TRAs and accelerate its obligations thereunder. In addition, the structuring of future transactions may be influenced by these member owners' tax or other considerations even where no similar benefit would accrue to us or our stockholders.
Our member owners are able to exercise a greater degree of influence in the operation of our business and that of Premier LP and the management of our affairs and those of Premier LP than is typically available to stockholders of a publicly-traded company. Even if our member owners own a minority economic interest in Premier LP, they may be able to continue to exert significant influence over us and Premier LP through their ownership of our Class B common stock and the Voting Trust Agreement among the member owners and the trustee of Premier Trust.
We are exempt from certain corporate governance requirements because we are a “controlled company” within the meaning of NASDAQ rules. As a result, our stockholders do not have the protections afforded by these corporate governance requirements, which may make our Class A common stock less attractive to investors.
Our member owners, acting as a group pursuant to the terms of the Voting Trust Agreement, own more than
50%
of the total voting power of our outstanding common stock and we are a “controlled company” under NASDAQ corporate governance standards. As a controlled company, we are not required by NASDAQ for continued listing of Class A common stock to (i) have a majority of independent directors, (ii) maintain an independent compensation committee or (iii) maintain an independent nominating function. We are taking advantage of all of these exemptions from NASDAQ listing requirements. Accordingly, our stockholders do not have the same protection afforded to stockholders of companies that are subject to all of the NASDAQ corporate governance requirements and the ability of our independent directors to influence our business policies and affairs may be reduced. As a result, our status as a “controlled company” could preclude certain institutional investors from investing in our Class A common stock, make our Class A common stock less attractive to other investors and thus adversely impact or harm our Class A common stock price.
The agreements between us and our member owners were made in the context of an affiliated relationship and may contain different terms than comparable agreements with unaffiliated third parties.
The contractual agreements that we have with each of our member owners were negotiated in the context of an affiliated relationship in which representatives of our member owners and their affiliates comprised a significant portion of our Board of Directors. As a result, the financial and other terms of these agreements, including covenants and other contractual obligations on our part and on the part of our member owners and termination and default provisions, may be less favorable to us than terms that we might have obtained in negotiations with unaffiliated third parties in similar circumstances. These potentially different terms could have a material adverse effect on our business, financial condition and results of operations.
Any payments made under the TRAs with our member owners will reduce the amount of overall cash flow that would otherwise be available to us. In addition, we may not be able to realize all or a portion of the tax benefits that are expected to result from the acquisition of Class B common units from the limited partners.
As a result of Premier, Inc.'s acquisition of Class B common units of Premier LP from the member owners in connection with our IPO, and any subsequent exchanges of Class B common units with us for shares of Class A common stock, we expect to become entitled to special tax benefits attributable to tax basis adjustments involving amounts generally equal to the difference between our purchase price for the acquired Class B common units (or, in the case of an exchange, the value of the shares of Class A common stock issued by us) and our share of the historic tax basis in Premier LP's tangible and intangible assets that is attributable to the acquired Class B common units. Pursuant to an agreement with each of our member owners in connection with our IPO, we must pay to the member owners
85%
of the amount, if any, by which our tax payments to various tax authorities are reduced as a result
38
of these special tax benefits. We are also obligated to make certain other payments on the occurrence of certain events that would terminate the agreement with respect to certain member owners. The tax basis adjustments, as well as the amount and timing of any payments under the TRAs, will vary depending upon a number of factors, including the timing of any exchanges between us and the member owners, the amount and timing of our income and the amount and timing of the amortization and depreciation deductions and other tax benefits attributable to the tax basis adjustments.
Assuming that Premier is able to timely realize anticipated tax benefits of tax basis adjustments from our IPO and subsequent exchanges, the future aggregate amount of payments to be made by the Company to the member owners is approximately
$255.1 million
as of
June 30, 2018
. Pursuant to the TRAs, payments are due to member owners to the extent that the Company recognizes the tax benefits attributable to the initial purchase of Class B common units from the member owners in conjunction with the IPO and subsequent quarterly exchanges between the Company and its member owners.
The TRAs provide that, in the event we exercise our right to early termination or in the event of a change in control or a material breach by us of our obligations, the agreements will terminate and the Company will be required to make a lump-sum payment equal to the present value of all forecasted future payments that would have otherwise been made under the TRAs. These payments could be substantial and could exceed the actual tax benefits that we eventually receive as a result of acquiring Class B common units from the member owners. In the event that we do not have available capital on hand or access to adequate funds to make these payments, our financial condition would be materially adversely impacted.
Additionally, our ability to realize our
15%
share of the total tax savings that we are entitled to retain under the TRAs depends on a number of assumptions. If our actual taxable income were insufficient or there were adverse changes in applicable law or regulations, we may be unable to realize all or a portion of these expected benefits and our cash flows and stockholders' equity could be negatively affected.
Changes to Premier LP's allocation methods or examinations or changes in interpretation of applicable tax laws and regulations by various tax authorities may increase a tax-exempt limited partner's risk that some allocated income is unrelated business taxable income.
The LP Agreement provides for the allocation of retained income to the limited partners of Premier LP, in part, according to the number of units owned rather than relative participation of the limited partners. A member owner that is a tax-exempt limited partner of Premier LP whose relative Class B common unit ownership is high compared to its relative participation may conclude, based on an analysis of its own facts and circumstances, that it has more federal unrelated business taxable income ("UBTI"), or the state equivalent thereof, subject to tax than it had reported in the past, or may be at increased risk that the Internal Revenue Service, or IRS, or a state taxing authority will seek to increase the amount of income reported by the tax-exempt limited partner as UBTI. Further, the LP Agreement provides for the allocation of distributed income to be adjusted based on facts and circumstances as are determined appropriate by Premier GP. Such adjustments may also increase the amount of income reported by certain tax-exempt limited partners as UBTI. In addition, Premier LP's activities are subject to examination by various taxing authorities in the normal course, and such examinations could result in interpretations of applicable tax laws that would cause tax-exempt limited partners to recognize additional amounts of UBTI. Further, the TCJA enacted law changes to UBTI, whereby UBTI losses of one activity cannot offset UBTI income of another activity. The reporting of UBTI from Premier LP thus cannot offset any UBTI reported by the limited partners of Premier LP. Any increase in UBTI may cause a limited partner to leave Premier LP, which could have an adverse effect on our business, financial condition and results of operations.
Our certificate of incorporation and bylaws and the LP Agreement and provisions of Delaware law may discourage or prevent strategic transactions, including a takeover of our company, even if such a transaction would be beneficial to our stockholders.
Provisions contained in our certificate of incorporation and bylaws and the LP Agreement and provisions of the Delaware General Corporation Law, or DGCL, could delay or prevent a third party from entering into a strategic transaction with us, even if such a transaction would benefit our stockholders. For example, our certificate of incorporation and bylaws:
|
•
|
divide our Board of Directors into three classes with staggered three-year terms, which may delay or prevent a change of our management or a change in control;
|
|
•
|
authorize our Board of Directors to issue “blank check” preferred stock in order to increase the aggregate number of outstanding shares of capital stock and thereby make a takeover more difficult and expensive;
|
|
•
|
do not permit cumulative voting in the election of directors, which would otherwise allow less than a majority of stockholders to elect director candidates;
|
|
•
|
do not permit stockholders to take action by written consent other than during the period in which we qualify as a “controlled company” within the meaning of NASDAQ rules;
|
|
•
|
provide that special meetings of the stockholders may be called only by or at the direction of the Board of Directors, the chair of our Board or the chief executive officer;
|
39
|
•
|
require advance notice to be given by stockholders of any stockholder proposals or director nominees;
|
|
•
|
require a super-majority vote of the stockholders to amend our certificate of incorporation; and
|
|
•
|
allow our Board of Directors to make, alter or repeal our bylaws but only allow stockholders to amend our bylaws upon the approval of 66
2
/
3
% or more of the voting power of all of the outstanding shares of our capital stock entitled to vote.
|
In addition, we are subject to the provisions of Section 203 of the DGCL which limits, subject to certain exceptions, the right of a corporation to engage in a business combination with a holder of
15%
or more of the corporation's outstanding voting securities, or certain affiliated persons.
The Exchange Agreement contains rights of first refusal in favor of the other member owners and Premier LP in the event that a member owner desires to exchange its Class B common units for shares of our Class A common stock, cash or a combination of both. In addition, the TRAs contain a change of control provision which, if triggered, would require us to make a one-time cash payment to the member owners equal to the present value of the payments that are forecasted to be made under the TRAs based on certain assumptions.
These restrictions and provisions could keep us from pursuing relationships with strategic partners and from raising additional capital, which could impede our ability to expand our business and strengthen our competitive position. These restrictions could also limit stockholder value by impeding a sale of Premier, Inc. or Premier LP and discouraging potential takeover attempts that might otherwise be financially beneficial to stockholders.
Risks Related to Our Class A Common Stock
If we fail to maintain an effective system of integrated internal controls, we may not be able to report our financial results accurately, we may determine that our prior financial statements are not reliable, or we may be required to expend significant financial and personnel resources to remediate any weaknesses, any of which could have a material adverse effect on our business, financial condition and results of operations.
Ensuring that we have adequate internal financial and accounting controls and procedures in place so that we can produce accurate financial statements on a timely basis is a costly and time-consuming effort that will need to be evaluated frequently. Section 404 of the Sarbanes-Oxley Act requires public companies to conduct an annual review and evaluation of their internal controls and attestations of the effectiveness of internal controls by independent auditors. Maintaining effective internal controls has been and will continue to be costly and may divert management's attention.
In connection with the preparation of our 2017 Form 10-K, we identified a material weakness in our internal control over financial reporting related to the income tax accounting for complex, non-routine or infrequent transactions. During fiscal 2018, we implemented a remediation plan to address this material weakness that consisted of augmenting our accounting resources, training, and implementing a more formal review and documentation process around the income tax accounting for complex, non-routine or infrequent transactions that may arise from time to time. In addition to the costs associated with identifying the weakness and amending previously reported financial statement, our remediation plan required us to expend significant financial and personnel resources to remediate the weaknesses.
Our future evaluation of our internal controls over financial reporting may identify material weaknesses that may cause us to (i) be unable to report our financial information on a timely basis or (ii) determine that our previously issued financial statements should no longer be relied upon because of a material error in such financial statements, and thereby result in adverse regulatory consequences, including sanctions by the SEC, violations of NASDAQ listing rules or stockholder litigation. There also could be a negative reaction in the financial markets due to a loss of investor confidence in us and the reliability of our financial statements. Confidence in the reliability of our financial statements also could suffer if we or our independent registered public accounting firm were to report a material weakness in our internal controls over financial reporting. The occurrence of any of these events could materially adversely affect our business, financial condition and results of operations and could also lead to a decline in the price of our Class A common stock.
The substantial number of shares of Class A common stock that will be eligible for sale upon exchange of Class B common units by our member owners in the near future could cause the market price for our Class A common stock to decline or make it difficult for us to raise financing through the sale of equity securities in the future.
We cannot predict the effect, if any, that market sales of shares of Class A common stock or the availability of shares of Class A common stock for sale by our member owners will have on the market price of our Class A common stock from time to time. At
June 30, 2018
, we had
52,761,177
shares of our Class A common stock outstanding. Sales of substantial amounts of shares of our Class A common stock in the public market, or the perception that those sales will occur, could cause the market price of our
40
Class A common stock to decline or make future offerings of our equity securities more difficult. If we are unable to sell equity securities at times and prices that we deem appropriate, we may be unable to fund our future growth.
At
June 30, 2018
, there were
80,335,701
Class B common units of Premier LP outstanding. In connection with the IPO, Premier, Inc., Premier LP and the member owners entered into an Exchange Agreement. Under this agreement, subject to certain restrictions, commencing on October 31, 2014, and during each year thereafter, each member owner has the cumulative right to exchange up to one-seventh of the Premier LP Class B common units initially allocated to such member owner (or subsequently purchased by such member owner pursuant to the related right of first refusal set forth in the Exchange Agreement), for shares of our Class A common stock, cash or a combination of both, the form of consideration to be at the discretion of the Audit and Compliance Committee of our Board of Directors, subject to certain restrictions. This exchange right can generally be exercised on a quarterly basis (subject to rights of first refusal in favor of the other holders of Class B common units and Premier LP). In November 2014, we filed a registration statement with the SEC that registered under the Securities Act the resale of shares of Class A common stock received under the Exchange Agreement and, accordingly, any Class A common shares exchanged for Class B common units would generally be freely tradeable. On October 31, 2018, the fifth tranche of Class B common units, representing
15,217,987
units, will become eligible for exchange. Including Class B common units already eligible for exchange as of the date of this Annual Report, a cumulative amount of
48,973,436
Class B common units are expected to be eligible for exchange on October 31, 2018. Exchange of a substantial amounts of these Class B common units for shares of our Class A common stock and/or the subsequent sale of such Class A common stock, or the perception that such exchanges and/or sales will occur, could cause the market price of our Class A common stock to decline or make future offerings of our equity securities more difficult.
We do not have current plans to pay any cash dividends on our Class A common stock in the foreseeable future.
Although we continually evaluate the best use of capital to deliver shareholder return, we have not historically and do not have current plans to pay any dividends on our Class A common stock. Payments of future dividends, if any, will be at the discretion of our Board of Directors after taking into account various factors, including our business, operating results and financial condition, current and anticipated cash needs, plans for expansion and any legal or contractual limitations on our ability to pay dividends. As a result, capital appreciation in the price of our Class A common stock, if any, may be your only source of gain on an investment in our Class A common stock.
Our future issuance of common stock, preferred stock, limited partnership units or debt securities could have a dilutive effect on our common stockholders and adversely affect the market value of our Class A common stock.
In the future, we could issue a significant number of shares of Class A common stock or Class B common stock, which could dilute our existing stockholders significantly and have a material adverse effect on the market price for the shares of our Class A common stock. Furthermore, the future issuance of shares of preferred stock with voting rights may adversely affect the voting power of our common stockholders, either by diluting the voting power of our common stock if the preferred stock votes together with the common stock as a single class or by giving the holders of any such preferred stock the right to block an action on which they have a separate class vote even if the action were approved by the holders of our common stock. The future issuance of shares of preferred stock with dividend or conversion rights, liquidation preferences or other economic terms favorable to the holders of preferred stock could adversely affect the market price for our Class A common stock by making an investment in the Class A common stock less attractive.
Moreover, Premier LP may issue additional limited partnership units to third parties without the consent of Class A common stockholders, which would reduce Premier, Inc.'s ownership percentage in Premier LP and have a dilutive effect on the amount of distributions made to Premier, Inc. by Premier LP. Any newly admitted Premier LP limited partners will receive Class B common units in Premier LP and an equal amount of shares of our Class B common stock. Any such issuances could materially and adversely affect the market price of our Class A common stock.
In addition to potential equity issuances described above, we also may issue debt securities that would rank senior to shares of our Class A common stock.
Upon our liquidation, holders of our preferred shares, if any, and debt securities and instruments will receive a distribution of our available assets before holders of shares of our Class A common stock. We are not required to offer any such additional debt or equity securities to existing stockholders on a preemptive basis. Therefore, additional issuances of our Class A common stock, directly or through convertible or exchangeable securities (including Class B common units), warrants or options, will dilute the holders of shares of our existing Class A common stock and such issuances, or the anticipation of such issuances, may reduce the market price of shares of our Class A common stock. Any preferred shares, if issued, would likely have a preference on distribution payments, periodically or upon liquidation, which could limit our ability to make distributions to holders of shares of our Class A common stock. Because our decision to issue debt or equity securities or otherwise incur debt in the future will depend on market conditions and other factors beyond our control, we cannot predict or estimate the amount, timing or nature of our future capital raising efforts.
41
None.
We occupy our Charlotte, North Carolina headquarters under a long-term lease which expires in 2026 and includes options for us, at our discretion, to renew the lease for up to 15 years in total beyond that date.
As of
June 30, 2018
, we also occupy and lease smaller facilities in the following locations: El Segundo, California; San Diego, California; Washington, D.C.; Plantation, Florida; McHenry, Illinois; Overland Park, Kansas; New York, New York; Raleigh, North Carolina; Homestead, Pennsylvania; Sharon Hill, Pennsylvania; Memphis, Tennessee; College Station, Texas; Salt Lake City, Utah; and Charlottesville, Virginia. We believe that our headquarters, as well as our smaller leased facilities, are suitable for our use and are, in all material respects, adequate for our present needs.
We generally conduct the operations of our Supply Chain Services segment and our Performance Services segment across our property locations. See
Note 20 - Commitments and Contingencies
to the accompanying audited consolidated financial statements for more information about our operating leases.
We participate in businesses that are subject to substantial litigation. We are periodically involved in litigation, arising in the ordinary course of business or otherwise, which from time to time may include claims relating to commercial, product liability, tort or personal injury, employment, antitrust, intellectual property or other matters. If current or future government regulations are interpreted or enforced in a manner adverse to us or our business, specifically those with respect to antitrust or healthcare laws, we may be subject to enforcement actions, penalties, damages and material limitations on our business.
From time to time we have been named as a defendant in antitrust lawsuits brought by suppliers or purchasers of medical products. Typically, these lawsuits have alleged the existence of a conspiracy among manufacturers of competing products and operators of GPOs, including us, to deny the plaintiff access to a market for its products or limit the plaintiff’s choice of products to buy. We believe that we have at all times conducted our business affairs in an ethical and legally compliant manner and have successfully resolved all such actions. No assurance can be given that we will not be subjected to similar actions in the future or that such matters will be resolved in a manner satisfactory to us or which will not harm our business, financial condition or results of operations.
Additional information relating to certain legal proceedings in which we are involved is included in
Note 20 - Commitments and Contingencies
, to the accompanying consolidated financial statements, which is incorporated herein by reference.
Not Applicable.
42
Our Class A common stock is publicly traded on the NASDAQ Global Select Market ("NASDAQ") under the ticker symbol "PINC." Our Class B common stock is not publicly traded. The following table sets forth, for the periods indicated, the high and low prices of our Class A common stock on the NASDAQ.
|
Price Range of Common Stock
|
||||||
|
High
|
Low
|
|||||
|
Fiscal Year Ended June 30, 2018
|
||||||
|
Fourth Quarter
|
$
|
37.25
|
|
$
|
28.81
|
|
|
Third Quarter
|
$
|
35.10
|
|
$
|
29.07
|
|
|
Second Quarter
|
$
|
35.06
|
|
$
|
27.16
|
|
|
First Quarter
|
$
|
36.50
|
|
$
|
30.87
|
|
|
Fiscal Year Ended June 30, 2017
|
||||||
|
Fourth Quarter
|
$
|
36.28
|
|
$
|
31.42
|
|
|
Third Quarter
|
$
|
32.86
|
|
$
|
29.15
|
|
|
Second Quarter
|
$
|
32.79
|
|
$
|
28.27
|
|
|
First Quarter
|
$
|
34.35
|
|
$
|
30.61
|
|
Holders
Based on the records of our Class A common stock transfer agent, as of
August 17, 2018
, there were
53,271,621
shares of our Class A common stock issued and outstanding, held by
32
holders of record. Because a substantial portion of our Class A common stock is held by brokers and other institutions on behalf of shareholders, we are unable to estimate the total number of beneficial owners currently holding our Class A common stock. As of
August 17, 2018
,
79,519,233
shares of our Class B common stock are issued and outstanding, held by one holder of record, the trustee of the Class B common stock voting trust and beneficially owned by our
163
member owners.
Dividend Policy
We did not pay any dividends during the fiscal years ended
June 30, 2018 and 2017
. Although we continually evaluate the best use of capital to deliver shareholder return, we have not historically and do not have current plans to pay any dividends on our Class A common stock. Furthermore, shares of our Class B common stock are not entitled to any dividend payments. The payment of dividends, if any, is subject to the discretion of our Board of Directors and will depend on many factors, including our results of operations, financial condition and capital requirements, earnings, general business conditions, restrictions imposed by our current and any future financing arrangements, legal restrictions on the payment of dividends and other factors our Board of Directors deems relevant. Our current credit facility includes restrictions on our ability to pay dividends.
Recent Sales of Unregistered Securities
All sales of unregistered securities during
the fiscal year ended June 30, 2018
have been previously reported in filings with the SEC.
Securities Authorized for Issuance Under Equity Compensation Plans
The information required by Item 201(d) of Regulation S-K is provided under Item 12, Security Ownership of Certain Beneficial Owners and Management and Related Stockholder Matters, Equity Compensation Plan Information, incorporated herein by reference.
Purchases of Equity Securities
On October 31, 2017, we announced that our Board of Directors authorized the repurchase of up to
$200.0 million
of our outstanding Class A common stock during fiscal 2018 as part of a balanced capital deployment strategy. During the third quarter of fiscal 2018, the Company completed its 2018 stock repurchase program and no purchases were made during any month of the fourth quarter
43
of fiscal 2018. During fiscal 2018, we purchased an aggregate of approximately
6.4 million
shares of Class A common stock at an average price of
$31.16
per share for a total purchase price of
$200.0 million
under our fiscal 2018 stock repurchase program. In addition, during the year ended
June 30, 2018
,
zero
shares of Class B common units were exchanged for cash in connection with quarterly member owner exchanges under the Exchange Agreement.
On May 7, 2018, we announced that our Board of Directors authorized the repurchase of up to
$250.0 million
of our outstanding Class A common stock during fiscal 2019 as a continuation of our balanced capital deployment strategy. Subject to certain terms and conditions, including compliance with federal and state securities and other laws, the repurchases may be made from time to time in open market transactions, privately negotiated transactions, or other transactions, at our discretion, including trades under a plan established in accordance with Rule 10b5-1 under the Securities Exchange Act of 1934, as amended (the "Exchange Act"). There can be no assurance, however, regarding the duration of the program or the timing or number of shares of Class A common stock purchased under the program. The Company will provide additional details regarding the repurchase program in future filings with the SEC.
Company Stock Performance
The performance graph below shows a 57-month comparison of the total cumulative return, assuming reinvestment of all dividends, had $100 been invested at the close of business on September 26, 2013 (our first trading day), in each of:
|
•
|
our Class A common stock;
|
|
•
|
the NASDAQ Composite stock index (“NASDAQ Composite index”); and
|
|
•
|
a customized peer group of twelve companies selected by us (the “Peer Group”).
|
We have used the Peer Group, a group selected in good faith and used by our compensation committee for fiscal 2018 benchmarking purposes, for peer comparison purposes because we believe this group provides an accurate representation of our peers. Our compensation committee reviewed and selected the companies in our fiscal 2018 Peer Group in April 2017. The Peer Group consists of the following twelve companies: Advisory Board Company, Allscripts Healthcare Solutions Inc., athenahealth, Inc., Cerner Corp, HMS Holdings Corp, Huron Consulting Group Inc., IHS Markit, Ltd., Magellan Health Inc., Navigant Consulting Inc., Owens & Minor Inc., Patterson Companies Inc. and Quality Systems Inc.
As the companies in our Peer Group change, our compensation committee will continue to review and reconfigure our Peer Group as applicable.
The information contained in the performance graph below shall not be deemed “soliciting material” or to be “filed” with the SEC nor shall such information be deemed incorporated by reference into any future filing under the Securities Act or the Exchange Act except to the extent we specifically incorporate it by reference into such filing.
44
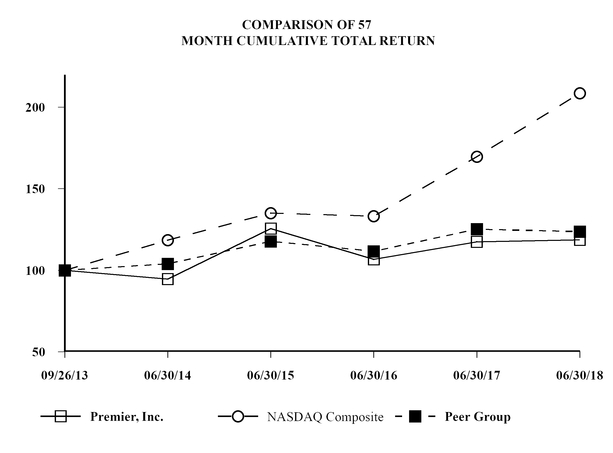
|
Value of Investment as of Stated Date:
|
||||||||||||||||||
|
Company/Index Name
|
9/26/2013
|
6/30/2014
|
6/30/2015
|
6/30/2016
|
6/30/2017
|
6/30/2018
|
||||||||||||
|
Premier, Inc. Class A Common Stock
|
$
|
100.00
|
|
$
|
94.62
|
|
$
|
125.48
|
|
$
|
106.69
|
|
$
|
117.46
|
|
$
|
118.69
|
|
|
NASDAQ Composite index
|
$
|
100.00
|
|
$
|
118.49
|
|
$
|
135.09
|
|
$
|
133.18
|
|
$
|
169.67
|
|
$
|
208.54
|
|
|
Peer Group
(a)
|
$
|
100.00
|
|
$
|
103.97
|
|
$
|
117.74
|
|
$
|
111.67
|
|
$
|
125.21
|
|
$
|
123.73
|
|
|
(a)
|
Assumes $100 invested on September 26, 2013 for stocks and September 30, 2013 for index, including reinvestment of dividends. As noted above, we have not paid any cash dividends during the period covered by the graph.
|
|
(b)
|
Includes the performance of (i) IHS Markit, Ltd beginning on July 13, 2016 and (ii) Advisory Board Company through November 17, 2017, its last trading day on NASDAQ.
|
We will neither make nor endorse any predictions as to future stock performance or whether the trends depicted in the graph above will continue or change in the future. The stock price performance included in this graph is not necessarily indicative of future stock price performance.
As of
June 30, 2018
, we, through our wholly-owned subsidiary, Premier GP, held a controlling general partner interest of approximately
40%
in, and, as a result, consolidated the financial statements of, Premier LP. The limited partners' ownership of Premier LP of approximately
60%
at
June 30, 2018
is reflected as redeemable limited partners' capital in the Company's Consolidated Balance Sheets, and the limited partners' proportionate share of income in Premier LP is reflected within net income attributable to non-controlling interest in Premier LP in our Consolidated Statements of Income and within comprehensive income attributable to non-controlling interest in the Consolidated Statements of Comprehensive Income.
We derived the selected historical consolidated financial data presented in the following tables from the audited consolidated financial statements and related notes of Premier, Inc. and solely with respect to 2014, Premier Healthcare Solutions, Inc. ("PHSI"). Please read Management's Discussion and Analysis of Financial Condition and Results of Operations, and our audited consolidated
45
financial statements and notes thereto contained elsewhere herein and in previous annual reports on Form 10-K filed with the SEC for additional information regarding the financial data presented below, including matters that might cause this data not to be indicative of our future financial position or results of operations.
|
Year ended June 30,
|
|||||||||||||||
|
Consolidated Statements of Income Data:
|
2018
|
2017
(1)
|
2016
(2)
|
2015
(3)
|
2014
(4, 5)
|
||||||||||
|
Net revenue:
|
|||||||||||||||
|
Net administrative fees
(6)
|
$
|
643,839
|
|
$
|
557,468
|
|
$
|
498,394
|
|
$
|
457,020
|
|
$
|
464,837
|
|
|
Other services and support
|
372,133
|
|
363,087
|
|
337,554
|
|
270,748
|
|
233,186
|
|
|||||
|
Services
|
1,015,972
|
|
920,555
|
|
835,948
|
|
727,768
|
|
698,023
|
|
|||||
|
Products
|
645,284
|
|
534,118
|
|
326,646
|
|
279,261
|
|
212,526
|
|
|||||
|
Net revenue
|
1,661,256
|
|
1,454,673
|
|
1,162,594
|
|
1,007,029
|
|
910,549
|
|
|||||
|
Cost of revenue
|
798,291
|
|
680,048
|
|
457,056
|
|
396,910
|
|
307,625
|
|
|||||
|
Gross profit
|
862,965
|
|
774,625
|
|
705,538
|
|
610,119
|
|
602,924
|
|
|||||
|
Other operating income
(7)
:
|
|||||||||||||||
|
Remeasurement of tax receivable agreement liabilities
|
177,174
|
|
5,447
|
|
4,818
|
|
—
|
|
—
|
|
|||||
|
Other operating income
|
177,174
|
|
5,447
|
|
4,818
|
|
|||||||||
|
Operating expenses:
|
|||||||||||||||
|
Selling, general and administrative
|
443,639
|
|
410,918
|
|
408,429
|
|
332,004
|
|
294,421
|
|
|||||
|
Research and development
|
1,423
|
|
3,107
|
|
2,925
|
|
2,937
|
|
3,389
|
|
|||||
|
Amortization of purchased intangible assets
|
55,447
|
|
48,327
|
|
33,054
|
|
9,136
|
|
3,062
|
|
|||||
|
Operating expenses
|
500,509
|
|
462,352
|
|
444,408
|
|
344,077
|
|
300,872
|
|
|||||
|
Operating income
|
539,630
|
|
317,720
|
|
265,948
|
|
266,042
|
|
302,052
|
|
|||||
|
Other income (expense), net
(8)
|
(22,826
|
)
|
213,571
|
|
18,934
|
|
5,085
|
|
58,274
|
|
|||||
|
Income before income taxes
|
516,804
|
|
531,291
|
|
284,882
|
|
271,127
|
|
360,326
|
|
|||||
|
Income tax expense
|
259,234
|
|
81,814
|
|
49,721
|
|
36,342
|
|
27,709
|
|
|||||
|
Net income
|
257,570
|
|
449,477
|
|
235,161
|
|
234,785
|
|
332,617
|
|
|||||
|
Net (income) loss attributable to non-controlling interest in S2S Global
(9)
|
—
|
|
—
|
|
—
|
|
(1,836
|
)
|
(949
|
)
|
|||||
|
Net income attributable to non-controlling interest in Premier LP
(10)
|
(224,269
|
)
|
(336,052
|
)
|
(193,547
|
)
|
(194,206
|
)
|
(303,336
|
)
|
|||||
|
Net income attributable to non-controlling interest
|
(224,269
|
)
|
(336,052
|
)
|
(193,547
|
)
|
(196,042
|
)
|
(304,285
|
)
|
|||||
|
Adjustment of redeemable limited partners' capital to redemption amount
|
157,581
|
|
(37,176
|
)
|
776,750
|
|
(904,035
|
)
|
(2,741,588
|
)
|
|||||
|
Net income (loss) attributable to stockholders
|
$
|
190,882
|
|
$
|
76,249
|
|
$
|
818,364
|
|
$
|
(865,292
|
)
|
$
|
(2,713,256
|
)
|
|
Weighted average shares outstanding:
|
|||||||||||||||
|
Basic
|
53,518
|
|
49,654
|
|
42,368
|
|
35,681
|
|
25,633
|
|
|||||
|
Diluted
|
137,340
|
|
50,374
|
|
145,308
|
|
35,681
|
|
25,633
|
|
|||||
|
Earnings (loss) per share attributable to stockholders:
|
|||||||||||||||
|
Basic
|
$
|
3.57
|
|
$
|
1.54
|
|
$
|
19.32
|
|
$
|
(24.25
|
)
|
$
|
(105.85
|
)
|
|
Diluted
(11)
|
$
|
1.36
|
|
$
|
1.51
|
|
$
|
0.97
|
|
$
|
(24.25
|
)
|
$
|
(105.85
|
)
|
46
|
June 30,
|
|||||||||||||||
|
Consolidated Balance Sheets Data:
|
2018
|
2017
|
2016
|
2015
|
2014
|
||||||||||
|
Cash, cash equivalents and marketable securities, current
|
$
|
152,386
|
|
$
|
156,735
|
|
$
|
266,576
|
|
$
|
387,189
|
|
$
|
291,606
|
|
|
Working capital (deficit)
(12)
|
$
|
(20,264
|
)
|
$
|
(162,775
|
)
|
$
|
136,827
|
|
$
|
275,533
|
|
$
|
188,527
|
|
|
Property and equipment, net
|
$
|
206,693
|
|
$
|
187,365
|
|
$
|
174,080
|
|
$
|
147,625
|
|
$
|
134,551
|
|
|
Total assets
|
$
|
2,312,216
|
|
$
|
2,507,836
|
|
$
|
1,855,383
|
|
$
|
1,530,191
|
|
$
|
1,246,656
|
|
|
Deferred revenue
(13)
|
$
|
39,785
|
|
$
|
44,443
|
|
$
|
54,498
|
|
$
|
39,824
|
|
$
|
15,694
|
|
|
Total liabilities
|
$
|
818,870
|
|
$
|
1,031,506
|
|
$
|
669,614
|
|
$
|
568,461
|
|
$
|
472,293
|
|
|
Redeemable limited partners' capital
(14)
|
$
|
2,920,410
|
|
$
|
3,138,583
|
|
$
|
3,137,230
|
|
$
|
4,079,832
|
|
$
|
3,244,674
|
|
|
Class A common stock
|
$
|
575
|
|
$
|
519
|
|
$
|
460
|
|
$
|
377
|
|
$
|
324
|
|
|
Treasury stock, at cost
(15)
|
$
|
(150,058
|
)
|
$
|
—
|
|
$
|
—
|
|
$
|
—
|
|
$
|
—
|
|
|
Additional paid-in capital
|
$
|
—
|
|
$
|
—
|
|
$
|
—
|
|
$
|
—
|
|
$
|
—
|
|
|
Accumulated deficit
|
$
|
(1,277,581
|
)
|
$
|
(1,662,772
|
)
|
$
|
(1,951,878
|
)
|
$
|
(3,118,474
|
)
|
$
|
(2,469,873
|
)
|
|
Total stockholders' deficit
|
$
|
(1,427,064
|
)
|
$
|
(1,662,253
|
)
|
$
|
(1,951,461
|
)
|
$
|
(3,118,102
|
)
|
$
|
(2,470,311
|
)
|
|
(1)
|
Amounts include the results of operations of (i) Acro Pharmaceutical Services LLC and Community Pharmacy Services, LLC (collectively, "Acro Pharmaceuticals") from August 23, 2016, the date of acquisition of all of the membership interests of Acro Pharmaceuticals, and (ii) Innovatix and Essensa from December 2, 2016, the date of acquisition of all the membership interests of Innovatix and Essensa. Prior to December 2, 2016, we held 50% of the membership interests in Innovatix, and reported equity in net income of Innovatix within other income (expense), net in the Consolidated Statements of Income. See
Note 3 - Business Acquisitions
to the audited consolidated financial statements of this Annual Report for further information related to acquisitions completed during the year ended June 30, 2017.
|
|
(2)
|
Amounts include the results of operations of InFlowHealth, LLC ("InFlow"), CECity.com, Inc. ("CECity") and Healthcare Insights, LLC ("HCI"), from October 1, 2015, August 20, 2015 and July 31, 2015, respectively, the dates of acquisition of all the membership interests of InFlow, all the outstanding shares of CECity, and all the membership interests of HCI, respectively. See
Note 3 - Business Acquisitions
to the audited consolidated financial statements of this Annual Report for further information related to acquisitions completed during the year ended June 30, 2016.
|
|
(3)
|
Amounts include the results of operations of TheraDoc, Inc. ("TheraDoc") and Aperek, Inc. ("Aperek"), from September 1, 2014 and August 29, 2014, respectively, the dates of acquisition of all the outstanding shares of common stock of TheraDoc and Aperek, respectively. Further, on February 2, 2015, we purchased the remaining
40%
of the outstanding limited liability company membership interests of S2S Global, our direct sourcing business. See
Note 3 - Business Acquisitions
to the audited consolidated financial statements of this Annual Report for further information related to acquisitions completed during the year ended June 30, 2015.
|
|
(4)
|
Amounts include the results of operations of MEMdata, LLC ("MEMdata"), Meddius, L.L.C. ("Meddius") and SYMMEDRx, LLC ("SYMMEDRx"), from April 7, 2014, October 31, 2013 and July 19, 2013, respectively, the dates of acquisition of all the outstanding shares of common stock of MEMdata, Meddius and SYMMEDRx.
|
|
(5)
|
Immediately following the completion of the IPO on October 1, 2013, PHSI, a corporation through which we historically conducted the majority of our business, became our consolidated subsidiary and is considered our predecessor for accounting purposes. Accordingly, PHSI's consolidated financial statements are our historical financial statements, for periods prior to October 1, 2013. The historical consolidated financial statements of PHSI are reflected herein based on PHSI's historical ownership interests of Premier LP and its consolidated subsidiaries.
|
|
(6)
|
We are contractually required under the GPO participation agreements to pay most member owners revenue shares from Premier LP generally equal to
30%
of all gross administrative fees collected by Premier LP based upon purchasing by such member owner's owned, leased, managed and affiliated facilities through our GPO supplier contracts. Certain non-owner members operate under contractual relationships that provide for a specific revenue share that differs from the
30%
revenue share that we provide to our member owners under the GPO participation agreements.
|
|
(7)
|
Other operating income includes the adjustment to TRA liabilities. Changes in estimated TRA liabilities that are the result of a change in tax accounting method, including the impacts of the TCJA, are recorded as a component of other operating income in the Consolidated Statements of Income. Changes in estimated TRA liabilities that are related to new basis changes as a result of the exchange of Class B common units for a like number of shares of Class A common stock or as a result of departed
|
47
member owners are recorded as an increase or decrease to additional paid-in capital in the Consolidated Statements of Stockholders' Deficit.
|
(8)
|
Other income (expense), net, consists primarily of a one-time gain of
$205.1 million
related to the remeasurement of our historical 50% equity method investment in Innovatix to fair value upon acquisition of Innovatix and Essensa on December 2, 2016 which occurred during the year ended June 30, 2017. In addition, other income (expense), net includes equity in net income of unconsolidated affiliates that is generated from our equity method investments. Our equity method investments primarily consist of our 49% ownership in FFF Enterprises, Inc. ("FFF"), and prior to the acquisition of Innovatix and Essensa, included our 50% ownership interest in Innovatix. Other income (expense), net, also includes net changes in the fair values of the FFF put and call rights (see Note 5 - Fair Value Measurements), interest income and expense, realized and unrealized gains or losses on deferred compensation plan assets, gains or losses on the disposal of assets, and realized gains and losses on our marketable securities.
|
|
(9)
|
Premier Supply Chain Improvement, Inc. ("PSCI") owns a
100%
voting and economic interest in S2S Global as a result of its February 2, 2015 purchase of the remaining 40% non-controlling interest in S2S Global. Prior to February 2, 2015, PSCI owned a
60%
voting and economic interest in S2S Global. Net (income) loss attributable to non-controlling interest in S2S Global represents the portion of net (income) loss attributable to the non-controlling equity holders of S2S Global prior to the February 2, 2015 purchase.
|
|
(10)
|
Net income attributable to non-controlling interest in Premier LP represents the portion of net income attributable to the limited partners of Premier LP, which was
60%
at
June 30, 2018
, and may change each period as member ownership changes.
|
|
(11)
|
The Company corrected prior period information within the current period financial statements related to a specific component used in calculating the tax effect on Premier, Inc. net income for purposes of diluted earnings (loss) per share. Diluted earnings per share for fiscal 2016 was previously stated at $1.33 per share and has been corrected to $0.97 per share. The Company believes the correction is immaterial and the amount had no impact on the Company’s overall financial condition, results of operations or cash flows.
|
|
(12)
|
Working capital represents the excess (deficit) of total current assets less total current liabilities. At
June 30, 2018
, working capital includes the
$100.3 million
current portion of long-term debt which is recorded within current liabilities.
|
|
(13)
|
Deferred revenue is primarily related to deferred subscription fees and deferred consulting fees in our Performance Services segment and consists of unrecognized revenue related to advanced member invoicing or member payments received prior to fulfillment of our revenue recognition criteria.
|
|
(14)
|
Redeemable limited partners' capital represents the member owners' ownership of Premier LP through their ownership of Class B common units. We are required to repurchase a limited partner's interest in Premier LP upon such limited partner's withdrawal from Premier LP, or such limited partner's failure to comply with the applicable purchase commitments under the historical limited partnership agreement of Premier LP. Redeemable limited partners' capital is classified as temporary equity in the mezzanine section of the accompanying Consolidated Balance Sheets as the withdrawal is at the option of each limited partner and the conditions of the repurchase are not solely within our control. We record redeemable limited partners' capital at the greater of the book value or redemption amount per the LP Agreement at the reporting date, with the corresponding offset to additional paid-in-capital and accumulated deficit.
|
|
(15)
|
Pursuant to our previously announced 2018 stock repurchase program, we purchased approximately
6.4 million
shares of Class A common stock at an average price of
$31.16
per share for a total purchase price of
$200.0 million
during fiscal 2018.
|
The following discussion should be read in conjunction with our audited consolidated financial statements and the notes thereto included elsewhere in this Annual Report. This discussion is designed to provide the reader with information that will assist in understanding our consolidated financial statements, the changes in certain key items in those financial statements from year to year, and the primary factors that accounted for those changes, as well as how certain accounting principles affect our consolidated financial statements. In addition, the following discussion includes certain forward-looking statements. For a discussion of important factors, including the continuing development of our business and other factors which could cause actual results to differ materially from the results referred to in the forward-looking statements, see "Item 1A. Risk Factors" and "Cautionary Note Regarding Forward-Looking Statements" contained in this Annual Report.
Business Overview
Our Business
Premier, Inc. ("Premier", the "Company", "we", or "our") is a leading healthcare performance improvement company, uniting an alliance of more than
4,000
U.S. hospitals and health systems and approximately
165,000
other providers and organizations to transform healthcare. We partner with hospitals, health systems, physicians and other healthcare providers with the common goal of improving and innovating in the clinical, financial and operational areas of their businesses to meet the demands of a rapidly evolving healthcare industry. We deliver value through a comprehensive technology-enabled platform that offers critical supply chai
48
n services, clinical, financial, operational and population health software-as-a-service ("SaaS") informatics products, consulting services and performance improvement collaborative programs.
As of
June 30, 2018
, we were controlled by
163
U.S. hospitals, health systems and other healthcare organizations, which represented approximately
1,400
owned, leased and managed acute care facilities and other non-acute care organizations, through their ownership of Class B common stock. As of
June 30, 2018
, the Class A common stock and Class B common stock represented approximately
40%
and
60%
, respectively, of our combined Class A and Class B common stock. All of our Class B common stock was held beneficially by our member owners and all of our Class A common stock was held by public investors, which may include member owners that have received shares of our Class A common stock in connection with previous quarterly exchanges pursuant to the Exchange Agreement .
We generated net revenue, net income and Adjusted EBITDA (a financial measure not determined in accordance with generally accepted accounting principles ("Non-GAAP")) for the periods presented as follows (in thousands):
|
Year Ended June 30,
|
|||||||||
|
2018
|
2017
|
2016
|
|||||||
|
Net revenue
|
$
|
1,661,256
|
|
$
|
1,454,673
|
|
$
|
1,162,594
|
|
|
Net income
|
$
|
257,570
|
|
$
|
449,477
|
|
$
|
235,161
|
|
|
Non-GAAP Adjusted EBTIDA
|
$
|
543,049
|
|
$
|
501,591
|
|
$
|
440,975
|
|
See “Our Use of Non-GAAP Financial Measures” and “Results of Operations” below for a discussion of our use of Non-GAAP Adjusted EBITDA and a reconciliation of net income to Non-GAAP Adjusted EBITDA.
Our Business Segments
Our business model and solutions are designed to provide our members access to scale efficiencies while focusing on optimization of information resources and cost containment, provide actionable intelligence derived from anonymized data in our data warehouse provided by our members, mitigate the risk of innovation and disseminate best practices that will help our member organizations succeed in their transformation to higher quality and more cost-effective healthcare. We deliver our integrated platform of solutions that address the areas of total cost management, quality and safety improvement and population health management through two business segments: Supply Chain Services and Performance Services.
Our Supply Chain Services segment includes one of the largest healthcare group purchasing organization programs ("GPO") in the United States, serving acute, non-acute, non-healthcare and alternate sites, and includes integrated pharmacy and direct sourcing activities. Supply Chain Services net revenue grew from
$1,101.3 million
for
the year ended June 30, 2017
to
$1,300.6 million
for
the year ended June 30, 2018
, representing net revenue growth of
18%
, and accounted for
78%
of our overall net revenue. Supply Chain Services net revenue grew from
$829.4 million
for
the year ended June 30, 2016
to
$1,101.3 million
for
the year ended June 30, 2017
, representing net revenue growth of
33%
, and accounted for
76%
of our overall net revenue. We generate revenue in our Supply Chain Services segment from administrative fees received from suppliers based on the total dollar volume of supplies purchased by our members and through product sales in connection with our integrated pharmacy and direct sourcing activities.
Our Performance Services segment includes one of the largest informatics and consulting services businesses in the United States focused on healthcare providers. Performance Services net revenue grew from
$353.4 million
for
the year ended June 30, 2017
to
$360.7 million
for
the year ended June 30, 2018
, representing revenue growth of
2%
, and accounted for
22%
of our overall net revenue. Performance Services net revenue increased from
$333.2 million
for
the year ended June 30, 2016
to
$353.4 million
for
the year ended June 30, 2017
, representing net revenue growth of
6%
, and accounted for
24%
of our overall net revenue. Our SaaS informatics products utilize our comprehensive data set to provide actionable intelligence to our members, enabling them to benchmark, analyze and identify areas of improvement across three main categories: cost management, quality and safety and population health management. The Performance Services segment also includes our technology-enabled performance improvement collaboratives, consulting services, government services and insurance management services.
Acquisitions
Acquisition of Innovatix and Essensa
Prior to December 2, 2016, we, through our consolidated subsidiary, PSCI, held 50% of the membership interests in Innovatix. On December 2, 2016, we, through PSCI, acquired the remaining 50% ownership interests of Innovatix and 100% of the ownership interest in Essensa. The purchase price, after adjustments pursuant to the purchase agreement, was
$336.0 million
. The acquisition was funded with borrowings under our credit facility dated June 24, 2014, as amended on June 4, 2015 (the "Credit Facility"). We
49
also paid the sellers
$21.1 million
during
the fiscal year ended June 30, 2018
in connection with an earn-out opportunity provided at the time of the acquisition. Innovatix and Essensa are GPOs focused on serving alternate site healthcare providers and other non-healthcare organizations throughout the United States. We report Innovatix and Essensa as part of our Supply Chain Services segment. See
Note 3 - Business Acquisitions
for more information.
Acquisition of Acro Pharmaceuticals
On August 23, 2016, we, through our consolidated subsidiary, NS3 Health, LLC, acquired 100% of the membership interests of Acro Pharmaceuticals. The aggregate purchase price, after adjustments pursuant to the purchase agreement, was
$62.9 million
. The acquisition was funded with available cash on hand. Acro Pharmaceuticals is a specialty pharmacy business that provides customized healthcare management solutions to members. We report Acro Pharmaceuticals as part of our Supply Chain Services segment. See
Note 3 - Business Acquisitions
for more information.
Acquisition of InFlow
On October 1, 2015, we acquired all of the limited liability company membership interests of InFlow, a SaaS-based software developer specializing in improving the operational, financial and strategic performance of physician practices, for
$6.1 million
in cash. The acquisition provides selling members an earn-out opportunity of up to
$26.9 million
based on InFlow's future annual contractual subscription revenues through December 31, 2019. At June 30, 2018 and 2017, the fair value of the earn-out liability was zero and $0.2 million, respectively (see Note 5 - Fair Value Measurements). The selling members also received restricted stock units of Premier with an aggregate equity grant value of
$2.1 million
which vest over a three-year period with restrictions tied to continued employment. We utilized available funds on hand to complete the acquisition. Assets acquired and liabilities assumed were recorded at their fair values as of October 1, 2015, with the remaining unallocated purchase price recorded as goodwill. We report InFlow as part of our Performance Services segment. See
Note 3 - Business Acquisitions
for more information.
Acquisition of CECity
On August 20, 2015, we acquired
100%
of the outstanding shares of capital stock of CECity, a cloud-based healthcare solutions provider specializing in performance management and improvement, pay-for-value reporting and professional education, for
$398.3 million
in cash. We funded the acquisition with
$250.0 million
of cash and
$150.0 million
of borrowings under our Credit Facility. Assets acquired and liabilities assumed were recorded at their fair values as of August 20, 2015, with the remaining unallocated purchase price recorded as goodwill. We report CECity as part of our Performance Services segment. See
Note 3 - Business Acquisitions
for more information
Acquisition of HCI
On July 31, 2015, we acquired all of the limited liability company membership interests of HCI, a financial management software developer that provides hospitals and healthcare systems with budgeting, forecasting, labor productivity and cost analytic capabilities, for
$64.3 million
in cash. We utilized available funds on hand to complete the acquisition. Assets acquired and liabilities assumed were recorded at their fair values as of July 31, 2015, with the remaining unallocated purchase price recorded as goodwill. We report HCI as part of our Performance Services segment. See
Note 3 - Business Acquisitions
for more information.
Market and Industry Trends and Outlook
We expect that certain trends and economic or industry-wide factors will continue to affect our business, both in the short-term and long-term. We have based our expectations described below on assumptions made by us and on information currently available to us. To the extent our underlying assumptions about, or interpretation of, available information prove to be incorrect our actual results may vary materially from our expected results. See "Cautionary Note Regarding Forward-Looking Statements" and "Risk Factors."
Trends in the U.S. healthcare market affect our revenues and costs in the Supply Chain Services and Performance Services segments. The trends we see affecting our current healthcare business include the impact of the implementation of current or future healthcare legislation, particularly the uncertainty regarding the status of the ACA, its repeal, replacement or other modification, the enactment of new regulatory and reporting requirements, expansion and contraction of insurance coverage and associated costs that may impact subscriber elections, intense cost pressure, payment reform, provider consolidation, shift in care to the alternate site market and increased data availability and transparency. To meet the demands of this environment, there will be increased focus on scale and cost containment and healthcare providers will need to measure and report on and bear financial risk for outcomes. We believe these trends will result in increased demand for our Supply Chain Services and Performance Services solutions in the areas of cost management, quality and safety, and population health management, however, there are uncertainties and risks that may affect the actual impact of these anticipated trends or related assumptions on our business. See "Cautionary Note Regarding Forward-Looking Statements" for more information.
50
Critical Accounting Policies and Estimates
Below is a discussion of our critical accounting policies and estimates. These and other significant accounting policies are set forth under
Note 2 - Significant Accounting Policies
in the accompanying financial statements.
Business Combinations
We account for business acquisitions using the acquisition method. All of the assets acquired, liabilities assumed, contractual contingencies and contingent consideration are recognized at their fair value on the acquisition date. Any excess of the purchase price over the estimated fair values of the net assets acquired is recorded as goodwill. Acquisition-related costs are recorded as expenses in the consolidated financial statements.
Several valuation methods may be used to determine the fair value of assets acquired and liabilities assumed. For intangible assets, we typically use the income method. This method starts with a forecast of all of the expected future net cash flows for each asset. These cash flows are then adjusted to present value by applying an appropriate discount rate that reflects the risk factors associated with the cash flow streams. Some of the more significant estimates and assumptions inherent in the income method or other methods include the amount and timing of projected future cash flows, the discount rate selected to measure the risks inherent in the future cash flows and the assessment of the asset's life cycle and the competitive trends impacting the asset, including consideration of any technical, legal, regulatory or economic barriers to entry. Determining the useful life of an intangible asset also requires judgment as different types of intangible assets will have different useful lives and certain assets may even be considered to have indefinite useful lives.
Goodwill
Goodwill represents costs in excess of fair values assigned to the underlying net assets of acquired businesses. Goodwill is not amortized. The Company performs its annual goodwill impairment testing on the first day of the last fiscal quarter of its fiscal year unless impairment indicators are present which could require an interim impairment test.
Under accounting rules, the Company may elect to perform a qualitative assessment to determine if an impairment is more likely than not to have occurred. This qualitative assessment requires an evaluation of any excess of fair value over the carrying value for a reporting unit and significant judgment regarding potential changes in valuation inputs, including a review of the Company's most recent long-range projections, analysis of operating results versus the prior year, changes in market values, changes in discount rates and changes in terminal growth rate assumptions. If it is determined that an impairment is more likely than not to exist, then we are required to perform a quantitative assessment to determine whether or not goodwill is impaired and to measure the amount of goodwill impairment, if any.
Goodwill impairment is determined using a two-step process. The first step involves a comparison of the estimated fair value of each of our reporting units to its carrying amount, including goodwill. In performing the first step, we determine the fair value of a reporting unit using a discounted cash flow analysis that is corroborated by a market-based approach. Determining fair value requires the exercise of significant judgment, including judgment about appropriate discount rates, perpetual growth rates and the amount and timing of expected future cash flows. The cash flows employed in the discounted cash flow analyses are based on the most recent budget and long-term forecast. The discount rates used in the discounted cash flow analyses are intended to reflect the risks inherent in the future cash flows of the respective reporting units. If the estimated fair value of a reporting unit exceeds its carrying amount, goodwill of the reporting unit is not impaired and the second step of the impairment test is not necessary.
If the carrying amount of a reporting unit exceeds its estimated fair value, then the second step of the goodwill impairment test must be performed. The second step of the goodwill impairment test compares the implied fair value of the reporting unit's goodwill with its goodwill carrying amount to measure the amount of impairment, if any. The implied fair value of goodwill is determined in the same manner as the amount of goodwill recognized in a business combination. In other words, the estimated fair value of the reporting unit is allocated to all of the assets and liabilities of that unit (including any unrecognized intangible assets) as if the reporting unit had been acquired in a business combination and the fair value of the reporting unit was the purchase price paid. If the carrying amount of the reporting unit's goodwill exceeds the implied fair value of that goodwill, an impairment charge is recognized in an amount equal to that excess.
The Company's most recent annual impairment testing, which consisted of a quantitative assessment, did not result in any goodwill impairment charges during the fourth quarter of
the year ended June 30, 2018
.
TRAs
The Company records tax receivable agreements ("TRA") liabilities based on
85%
of the estimated amount of tax savings the Company expects to receive, generally over a
15
-year period, in connection with the additional tax benefits created in conjunction with the IPO. Tax payments under the TRA will be made to the member owners as the Company realizes tax benefits attributable
51
to the initial purchase of Class B common units from the member owners made concurrently with the IPO and any subsequent exchanges of Class B common units into Class A common stock or cash between the Company and the member owners. Determining the estimated amount of tax savings the Company expects to receive requires judgment as deductibility of goodwill amortization expense is not assured and the estimate of tax savings is dependent upon the actual realization of the tax benefit and the tax rates in effect at that time.
Changes in estimated TRA liabilities that are the result of a change in tax accounting method are recorded in
remeasurement of tax receivable agreement liabilities or in
selling, general and administrative expense in the Consolidated Statements of Income. Changes in estimated TRA liabilities that are related to new basis changes as a result of the exchange of Class B common units for a like number of shares of Class A common stock or as a result of departed member owners are recorded as an increase or decrease to additional paid-in capital in the Consolidated Statements of Stockholders' Deficit.
Revenue Recognition
Net Revenue
Net revenue consists of (i) service revenue which includes net administrative fees revenue and other services and support revenue and (ii) product revenue. Net administrative fees revenue consists of net GPO administrative fees in the Supply Chain Services segment. Other services and support revenue consists primarily of fees generated by the Performance Services segment in connection with the Company's SaaS informatics products subscriptions, consulting services and performance improvement collaborative subscriptions. Product revenue consists of integrated pharmacy and direct sourcing product sales, which are included in the Supply Chain Services segment. The Company recognizes revenue when (i) there is persuasive evidence of an arrangement, (ii) the fee is fixed or determinable, (iii) services have been rendered and payment has been contractually earned, and (iv) collectibility is reasonably assured.
Net Administrative Fees Revenue
Net administrative fees revenue is generated through administrative fees received from suppliers based on the total dollar volume of supplies purchased by the Company's members in connection with its GPO programs.
The Company, through its GPO programs, aggregates member purchasing power to negotiate pricing discounts and improve contract terms with suppliers. Contracted suppliers pay the Company administrative fees which generally represent
1%
to
3%
of the purchase price of goods and services sold to members under the contracts the Company has negotiated. Administrative fees are recognized as revenue in the period in which the respective supplier reports member purchasing data, usually a month or a quarter in arrears of actual member purchase activity. The supplier report proves that the delivery of product or service has occurred, the administrative fees are fixed and determinable based on reported purchasing volume, and collectibility is reasonably assured. Member and supplier contracts substantiate persuasive evidence of an arrangement. The Company does not take title to the underlying equipment or products purchased by members through its GPO supplier contracts.
The Company pays a revenue share equal to a percentage of gross administrative fees that the Company collects based upon purchasing by such members and their owned, leased, managed or affiliated facilities through its GPO supplier contracts. Revenue share is recognized according to the members' contractual agreements with the Company as the related administrative fees revenue is recognized. Considering GAAP relating to principal/agent considerations under revenue recognition principles, revenue share is recorded as a reduction to gross administrative fees revenue to arrive at a net administrative fees revenue amount, which amount is included in service revenue in the accompanying Consolidated Statements of Income.
Other Services and Support Revenue
Performance Services revenue consists of SaaS informatics products subscriptions, certain perpetual and term licenses, performance improvement collaborative and other service subscriptions, professional fees for consulting services, and insurance services management fees and commissions from group-sponsored insurance programs.
SaaS informatics subscriptions include the right to use the Company's proprietary hosted technology on a SaaS basis, training and member support to deliver improvements in cost management, quality and safety, population health management and provider analytics. Pricing varies by application and size of healthcare system. Informatics subscriptions are generally
three
to
five
year agreements with automatic renewal clauses and annual price escalators that typically do not allow for early termination. These agreements do not allow for physical possession of the software. Subscription fees are typically billed on a monthly basis and revenue is recognized as a single deliverable on a straight-line basis over the remaining contractual period following implementation. Implementation involves the completion of data preparation services that are unique to each member's data set and, in certain cases, the installation of member site-specific software, in order to access and transfer member data into the Company's hosted SaaS informatics products. Implementation is generally
60
to
300 days
following contract execution before the SaaS informatics products can be fully utilized by the member.
52
The Company sells certain perpetual and term licenses that include mandatory post-contract customer support in the form of maintenance and support services. Pricing varies by application and size of healthcare system. Fees for the initial period include the license fees, implementation fees and the initial bundled maintenance and support services fees. The fees for the initial period are recognized straight-line over the remaining initial period following implementation. Subsequent renewal maintenance and support services fees are recognized on a straight-line basis over the contractually stated renewal periods. Implementation services are provided to the customer prior to the use of the software and do not involve significant customization or modification. Implementation is generally
250
to
300 days
following contract execution before the licensed software products can be fully utilized by the member.
Revenue from performance improvement collaboratives and other service subscriptions that support the Company's offerings in cost management, quality and safety and population health management is recognized over the service period, which is generally
one
year.
Professional fees for consulting services sold under contracts vary based on the nature and terms of the engagement. Fees are billed as stipulated in the contract, and revenue is recognized on a proportional performance method as services are performed and deliverables are provided. In situations where the contracts have significant contract performance guarantees or member acceptance provisions, revenue recognition occurs when the fees are fixed and determinable and all contingencies, including any refund rights, have been satisfied.
Insurance services management fees are recognized in the period in which such services are provided. Commissions from group sponsored insurance programs are recognized over the term of the insurance policies, which is generally
one
year.
Certain administrative and/or patient management integrated pharmacy services are provided in situations where prescriptions are sent back to member health systems for dispensing. Additionally, the Company derives revenue from pharmaceutical manufacturers for providing patient education and utilization data. Revenue is recognized as these services are provided.
Product Revenue
Specialty pharmacy revenue is recognized when a product is accepted and is recorded net of the estimated contractual adjustments under agreements with Medicare, Medicaid and other managed care plans. Payments for the products provided under such agreements are based on defined allowable reimbursements rather than on the basis of standard billing rates. The difference between the standard billing rate and allowable reimbursement rate results in contractual adjustments which are recorded as deductions from net revenue.
Direct sourcing revenue is recognized once the title and risk of loss of medical products have been transferred to members.
Multiple Deliverable Arrangements
The Company enters into agreements where the individual deliverables discussed above, such as SaaS subscriptions and consulting services, are bundled into a single service arrangement. These agreements are generally provided over a time period ranging from approximately
three months
to
five years
after the applicable contract execution date. Revenue is allocated to the individual elements within the arrangement based on their relative selling price using vendor specific objective evidence ("VSOE"), third-party evidence ("TPE") or the estimated selling price ("ESP"), provided that the total arrangement consideration is fixed and determinable at the inception of the arrangement. The Company establishes VSOE, TPE, or ESP for each element of a service arrangement based on the price charged for a particular element when it is sold separately in a stand-alone arrangement. All deliverables which are fixed and determinable are recognized according to the revenue recognition methodology described above.
Certain arrangements include performance targets or other contingent fees that are not fixed and determinable at the inception of the arrangement. If the total arrangement consideration is not fixed and determinable at the inception of the arrangement, the Company allocates only that portion of the arrangement that is fixed and determinable to each element. As additional consideration becomes fixed, it is similarly allocated based on VSOE, TPE or ESP to each element in the arrangement and recognized in accordance with each element's revenue recognition policy.
Performance Guarantees
On limited occasions, the Company enters into agreements which provide for guaranteed performance levels to be achieved by the member over the term of the agreement. In situations with significant performance guarantees, the Company defers revenue recognition until the amount is fixed and determinable and all contingencies, including any refund rights, have been satisfied. In the event that guaranteed savings levels are not achieved, the Company may have to perform additional services at no additional charge in order to achieve the guaranteed savings or pay the difference between the savings that were guaranteed and the actual achieved savings.
53
Deferred Revenue
Deferred revenue consists of unrecognized revenue related to advanced member invoicing or member payments received prior to fulfillment of the Company's revenue recognition criteria. Substantially all deferred revenue consists of deferred subscription fees and deferred consulting fees. Subscription fees for company-hosted SaaS applications are deferred until the member's unique data records have been incorporated into the underlying software database, or until member site-specific software has been implemented and the member has access to the software. Deferred consulting fees arise when cash is received from members prior to delivery of service. When the fees are contingent upon meeting a performance target that has not yet been achieved, the consulting fees are deferred until the performance target is met.
Software Development Costs
Costs to develop internal use computer software that are incurred in the preliminary project stage are expensed as incurred. During the development stage, direct consulting costs and payroll and payroll-related costs for employees that are directly associated with each project are capitalized and amortized over the estimated useful life of the software, once it is placed into operation. Capitalized costs are amortized on a straight-line basis over the estimated useful lives of the related software applications of up to five years and amortization is included in depreciation and amortization expense. Replacements and major improvements are capitalized, while maintenance and repairs are expensed as incurred. Some of the more significant estimates and assumptions inherent in this process involve determining the stages of the software development project, the direct costs to capitalize and the estimated useful life of the capitalized software.
Income Taxes
The Company accounts for income taxes under the asset and liability approach. Deferred tax assets or liabilities are determined based on the differences between the financial statement and tax basis of assets and liabilities as measured by the enacted tax rates as well as net operating losses and credit carryforwards, which will be in effect when these differences reverse. The Company provides a valuation allowance against net deferred tax assets when, based upon the available evidence, it is more likely than not that the deferred tax assets will not be realized.
The Company prepares and files tax returns based on interpretations of tax laws and regulations. The Company's tax returns are subject to examination by various taxing authorities in the normal course of business. Such examinations may result in future tax and interest assessments by these taxing authorities.
In determining the Company's tax expense for financial reporting purposes, the Company establishes a reserve for uncertain income tax positions unless it is determined to be "more likely than not" that such tax positions would be sustained upon examination, based on their technical merits. That is, for financial reporting purposes, the Company only recognizes tax benefits taken on the tax return if it believes it is "more likely than not" that such tax positions would be sustained. There is considerable judgment involved in determining whether it is "more likely than not" that positions taken on the tax returns would be sustained.
The Company adjusts its tax reserve estimates periodically because of ongoing examinations by, and settlements with, varying taxing authorities, as well as changes in tax laws, regulations and interpretations. The consolidated tax expense of any given year includes adjustments to prior year income tax reserves and related estimated interest charges that are considered appropriate. The Company's policy is to recognize, when applicable, interest and penalties on uncertain income tax positions as part of income tax expense.
54
New Accounting Standards
New accounting standards that we have recently adopted as well as those that have been recently issued but not yet adopted by the Company are included in
Note 2 - Significant Accounting Policies
in the accompanying financial statements, which is incorporated herein by reference.
Key Components of Our Results of Operations
Net Revenue
Net revenue consists of service revenue, which includes net administrative fees revenue and other services and support revenue, and product revenue. Net administrative fees revenue consists of GPO administrative fees in our Supply Chain Services segment. Other services and support revenue consists primarily of fees generated by our Performance Services segment in connection with our SaaS informatics products subscriptions, license fees, consulting services and performance improvement collaborative subscriptions. Product revenue consists of integrated pharmacy and direct sourcing product sales, which are included in the Supply Chain Services segment. The
following discussion presents our revenue recognition policies under existing guidance; however, it’s important to note that we will adopt the Financial Accounting Standards Board Accounting Standard Update 2014-09,
Revenue from Contracts with Customers (Topic 606)
effective July 1, 2018, which supersedes nearly all revenue recognition guidance. See
Note 2 - Significant Accounting Policies
for more information.
Supply Chain Services
Supply Chain Services revenue consists of GPO net administrative fees (gross administrative fees received from suppliers, reduced by the amount of any revenue share paid to members), specialty pharmacy revenue, direct sourcing revenue and managed service revenue.
The success of our Supply Chain Services revenue streams are influenced by our ability to negotiate favorable contracts with suppliers, the number of members that utilize our GPO supplier contracts and the volume of their purchases, the number of members that utilize our integrated pharmacy, as well as the impact of changes in the defined allowable reimbursement amounts determined by Medicare, Medicaid and other managed care plans and the number of members that purchase products through our direct sourcing activities and the impact of competitive pricing. Our managed services line of business is a fee for service model created to perform supply chain related services for members, including contract negotiation and administration, claims data and rebate processing and evaluation of current pharmacy formulary and utilization services provided in partnership with a national pharmacy benefit management company.
Performance Services
Performance Services revenue consists of SaaS informatics products subscriptions, license fees, performance improvement collaborative and other service subscriptions, professional fees for consulting services, insurance services management fees and commissions from endorsed commercial insurance programs.
Our Performance Services growth will depend upon the expansion of our SaaS informatics products, performance improvement collaboratives and consulting services to new and existing members, impact of applied research initiatives, renewal of existing subscriptions to our SaaS informatics products and expansion into new markets with potential future acquisitions.
Cost of Revenue
Cost of service revenue includes expenses related to employees (including compensation and benefits) and outside consultants who directly provide services related to revenue-generating activities, including consulting services to members and implementation services related to SaaS informatics products. Cost of service revenue also includes expenses related to hosting services, related data center capacity costs, third-party product license expenses and amortization of the cost of internal use software.
Cost of product revenue consists of purchase and shipment costs for specialty pharmaceuticals and direct sourced medical products. Our cost of product revenue is influenced by the cost and availability of specialty pharmaceuticals and the manufacturing and transportation costs associated with direct sourced medical products.
55
Other Operating Income
Other operating income includes the adjustment to TRA liabilities. Changes in estimated TRA liabilities that are the result of a change in tax accounting method, including the impacts of the TCJA, are recorded as a component of other operating income in the Consolidated Statements of Income. Changes in estimated TRA liabilities that are related to new basis changes as a result of the exchange of Class B common units for a like number of shares of Class A common stock or as a result of departed member owners are recorded as an increase or decrease to additional paid-in capital in the Consolidated Statements of Stockholders' Deficit. See "Income Tax Expense" below for additional information.
Operating Expenses
Selling, general and administrative expenses are directly associated with selling and administrative functions and support of revenue-generating activities including expenses to support and maintain our software-related products and services. Selling, general and administrative expenses primarily consist of compensation and benefits related costs, travel-related expenses, business development expenses, including costs for business acquisition opportunities, indirect costs such as insurance, professional fees and other general overhead expenses, and adjustments to TRA liabilities.
Research and development expenses consist of employee-related compensation and benefit expenses and third-party consulting fees of technology professionals, net of capitalized labor, incurred to develop our software-related products and services.
Amortization of purchased intangible assets includes the amortization of all identified intangible assets resulting from acquisitions.
Other Income (Expense), Net
Other income (expense), net, includes equity in net income of unconsolidated affiliates that is generated from our equity method investments. Our equity method investments primarily consist of our 49% ownership in FFF Enterprises, Inc. ("FFF"), and prior to the acquisition of Innovatix and Essensa on December 2, 2016, included our 50% ownership interest in Innovatix. In connection with the acquisition of Innovatix and Essensa, the Company recorded a one-time gain of
$205.1 million
related to the remeasurement of our historical 50% equity method investment in Innovatix to fair value. Other income, net, also includes the change in fair value of our FFF put and call rights (see
Note 5 - Fair Value Measurements
), interest income and expense, realized and unrealized gains or losses on deferred compensation plan assets and gains or losses on the disposal of assets.
Income Tax Expense
Our income tax expense is attributable to the activities of the Premier, Inc., PHSI and PSCI, all of which are subchapter C corporations and are subject to U.S. federal and state income taxes. In contrast, under the provisions of federal and state laws, Premier LP is not subject to federal and state income taxes as the income realized by Premier LP is taxable to its partners. Our overall effective tax rate differs from the U.S. statutory tax rate primarily due to the aforementioned ownership structure as well as other items noted in
Note 18 - Income Taxes
.
Given our ownership and capital structure, various effective tax rates are calculated for specific tax items. For example, the deferred tax benefit related to stock-based compensation expense (see
Note 16 - Stock-Based Compensation
) is calculated based on the effective tax rate of PHSI, the legal entity where the majority of stock-based compensation expense is recorded. Our effective tax rate, as discussed in
Note 18 - Income Taxes
, represents the effective tax rate computed in accordance with GAAP based on total income tax expense (reflected in income tax expense in the Consolidated Statements of Income) of the Premier, Inc., PHSI, and PSCI divided by consolidated pre-tax income.
Non-GAAP Adjusted Fully Distributed Net Income is calculated net of taxes based on our fully distributed tax rate for federal and state income tax for us as a whole as if we were one taxable entity with all of our subsidiaries' activities included. Prior to the enactment of the TCJA, the rate used to compute the Non-GAAP Adjusted Fully Distributed Net Income was
39%
. Effective as of January 1, 2018, we adjusted our fully distributed tax rate to
26%
to determine its Non-GAAP Adjusted Fully Distributed Net Income.
Net Income Attributable to Non-Controlling Interest
As of
June 30, 2018
, we owned an approximate
40%
controlling general partner interest in Premier LP through Premier GP. Net income attributable to non-controlling interest represents the portion of net income attributable to the limited partners of Premier LP, which was reduced from approximately
63%
as of
June 30, 2017
to approximately
60%
as of
June 30, 2018
, as a result of completed quarterly exchanges pursuant to the Exchange Agreement offset by our share repurchase activities during the fiscal year 2018 (see
Note 13 - Redeemable Limited Partners' Capital
).
56
Our Use of Non-GAAP Financial Measures
The other key business metrics we consider are EBITDA, Adjusted EBITDA, Segment Adjusted EBITDA, Adjusted Fully Distributed Net Income, Adjusted Fully Distributed Earnings per Share and Free Cash Flow, which are all Non-GAAP financial measures.
We define EBITDA as net income before interest and investment income, net, income tax expense, depreciation and amortization and amortization of purchased intangible assets. We define Adjusted EBITDA as EBITDA before merger and acquisition related expenses and non-recurring, non-cash or non-operating items and including equity in net income (loss) of unconsolidated affiliates. For all Non-GAAP financial measures, we consider non-recurring items to be income or expenses and other items that have not been earned or incurred within the prior two years and are not expected to recur within the next two years. Such items include certain strategic and financial restructuring expenses. Non-operating items include gains or losses on the disposal of assets and interest and investment income or expense.
We define Segment Adjusted EBITDA as the segment's net revenue less cost of revenue and operating expenses directly attributable to the segment excluding depreciation and amortization, amortization of purchased intangible assets, merger and acquisition related expenses and non-recurring or non-cash items and including equity in net income (loss) of unconsolidated affiliates. Operating expenses directly attributable to the segment include expenses associated with sales and marketing, general and administrative, and product development activities specific to the operation of each segment. General and administrative corporate expenses that are not specific to a particular segment are not included in the calculation of Segment Adjusted EBITDA.
We define Adjusted Fully Distributed Net Income as net income attributable to Premier (i) excluding income tax expense, (ii) excluding the impact of adjustment of redeemable limited partners' capital to redemption amount, (iii) excluding the effect of non-recurring and non-cash items, (iv) assuming the exchange of all the Class B common units for shares of Class A common stock, which results in the elimination of non-controlling interest in Premier LP and (v) reflecting an adjustment for income tax expense on Non-GAAP fully distributed net income before income taxes at our estimated effective income tax rate. We define Adjusted Fully Distributed Earnings per Share as Adjusted Fully Distributed Net Income divided by diluted weighted average shares (see
Note 15 - Earnings (Loss) Per Share
).
We define Free Cash Flow as net cash provided by operating activities less distributions and TRA payments to limited partners and purchases of property and equipment. Free Cash Flow does not represent discretionary cash available for spending as it excludes certain contractual obligations such as debt repayments.
Adjusted EBITDA and Free Cash Flow are supplemental financial measures used by us and by external users of our financial statements and are considered to be indicators of the operational strength and performance of our business. Adjusted EBITDA and Free Cash Flow measures allow us to assess our performance without regard to financing methods and capital structure and without the impact of other matters that we do not consider indicative of the operating performance of our business. More specifically, Segment Adjusted EBITDA is the primary earnings measure we use to evaluate the performance of our business segments.
We use Adjusted EBITDA, Segment Adjusted EBITDA, Adjusted Fully Distributed Net Income and Adjusted Fully Distributed Earnings per Share to facilitate a comparison of our operating performance on a consistent basis from period to period that, when viewed in combination with our results prepared in accordance with GAAP, provides a more complete understanding of factors and trends affecting our business. We believe Adjusted EBITDA and Segment Adjusted EBITDA assist our Board of Directors, management and investors in comparing our operating performance on a consistent basis from period to period because they remove the impact of earnings elements attributable to our asset base (primarily depreciation and amortization) and certain items outside the control of our management team, e.g. taxes, as well as other non-cash (such as impairment of intangible assets, purchase accounting adjustments and stock-based compensation) and non-recurring items (such as strategic and financial restructuring expenses) from our operating results. We believe Adjusted Fully Distributed Net Income and Adjusted Fully Distributed Earnings per Share assist our Board of Directors, management and investors in comparing our net income and earnings per share on a consistent basis from period to period because these measures remove non-cash (such as impairment of intangible assets, purchase accounting adjustments and stock-based compensation) and non-recurring items (such as strategic and financial restructuring expenses), and eliminate the variability of non-controlling interest that results from member owner exchanges of Class B common units for shares of Class A common stock. We believe Free Cash Flow is an important measure because it represents the cash that we generate after payment of tax distributions to limited partners and capital investment to maintain existing products and services and ongoing business operations, as well as development of new and upgraded products and services to support future growth. Our Free Cash Flow allows us to enhance stockholder value through acquisitions, partnerships, joint ventures, investments in related businesses and debt reduction.
Despite the importance of these Non-GAAP financial measures in analyzing our business, determining compliance with certain financial covenants in our Credit Facility, measuring and determining incentive compensation and evaluating our operating performance relative to our competitors, EBITDA, Adjusted EBITDA, Segment Adjusted EBITDA, Adjusted Fully Distributed Net Income, Adjusted Fully Distributed Earnings per Share and Free Cash Flow are not measurements of financial performance
57
under GAAP, may have limitations as analytical tools and should not be considered in isolation from, or as an alternative to, net income, net cash provided by operating activities, or any other measure of our performance derived in accordance with GAAP.
Some of the limitations of the EBITDA, Adjusted EBITDA and Segment Adjusted EBITDA measures include that they do not reflect: our capital expenditures or our future requirements for capital expenditures or contractual commitments; changes in, or cash requirements for, our working capital needs; the interest expense or the cash requirements to service interest or principal payments under our Credit Facility; income tax payments we are required to make; and any cash requirements for replacements of assets being depreciated or amortized. In addition, EBITDA, Adjusted EBITDA, Segment Adjusted EBITDA and Free Cash Flow are not measures of liquidity under GAAP, or otherwise, and are not alternatives to cash flows from operating activities.
Some of the limitations of the Adjusted Fully Distributed Net Income and Adjusted Fully Distributed Earnings per Share measures are that they do not reflect income tax expense or income tax payments we are required to make. In addition, Adjusted Fully Distributed Net Income and Adjusted Fully Distributed Earnings per Share are not measures of profitability under GAAP.
We also urge you to review the reconciliation of these Non-GAAP financial measures included elsewhere in this Annual Report. To properly and prudently evaluate our business, we encourage you to review the consolidated financial statements and related notes included elsewhere in this Annual Report, and to not rely on any single financial measure to evaluate our business. In addition, because the EBITDA, Adjusted EBITDA, Segment Adjusted EBITDA, Adjusted Fully Distributed Net Income, Adjusted Fully Distributed Earnings per Share and Free Cash Flow measures are susceptible to varying calculations, such Non-GAAP financial measures may differ from, and may therefore not be comparable to, similarly titled measures used by other companies.
Non-recurring and non-cash items excluded in our calculation of Adjusted EBITDA, Segment Adjusted EBITDA and Adjusted Fully Distributed Net Income consist of stock-based compensation, acquisition related expenses, remeasurement of TRA liabilities, ERP implementation expenses, acquisition related adjustment - revenue, remeasurement gain attributable to acquisition of Innovatix, LLC, loss on disposal of long-lived assets, loss on FFF put and call rights, impairment on investments and other expense. More information about certain of the more significant items follows below.
Stock-based compensation
In addition to non-cash employee stock-based compensation expense, this item includes non-cash stock purchase plan expense of
$0.4 million
during both of
the years ended June 30, 2018 and 2017
.
Remeasurement of TRA liabilities
The Company records TRA liabilities based on 85% of the estimated amount of tax savings the Company expects to receive, generally over a 15-year period, which are attributable to the initial purchase of Class B common units from the member owners made concurrently with the IPO and subsequent exchanges by member owners of Class B common units into Class A common stock or cash. Tax payments made under the TRA will be made to the member owners as the Company realizes tax benefits. Determining the estimated amount of tax savings the Company expects to receive requires judgment as deductibility of goodwill amortization expense is not assured and the estimate of tax savings is dependent upon the actual realization of the tax benefit and the tax rates in effect at that time.
Changes in estimated TRA liabilities that are the result of a change in tax accounting method, including the impacts of the TCJA, are recorded as a component of other operating income or selling, general and administrative expenses in the Consolidated Statements of Income. Changes in estimated TRA liabilities that are related to new basis changes as a result of the exchange of Class B common units for a like number of shares of Class A common stock or as a result of departed member owners are recorded as an increase to additional paid-in capital in the Consolidated Statements of Stockholders' Deficit.
The adjustment to TRA liabilities for
the year ended June 30, 2018
is primarily attributable to the 14% decrease in the U.S. federal corporate income tax rate, which occurred as a result of the TCJA that was enacted on December 22, 2017 (see
Note 18 - Income Taxes
). The adjustment to TRA liabilities for
the year ended June 30, 2017
is primarily attributable to the increase in income apportioned to California and a 1.5% decrease in the North Carolina state income tax rate. The adjustment to TRA liabilities for
the year ended June 30, 2016
is primarily attributable to the adjustment for a 1% decrease in the North Carolina state income tax rate.
Acquisition related adjustment - revenue
Upon acquiring Innovatix and Essensa, we recorded a net
$17.4 million
purchase accounting adjustment to Adjusted EBITDA during
the year ended June 30, 2017
that reflects the fair value of administrative fees related to member purchases that occurred prior to December 2, 2016, but were reported to us subsequent to that date through
June 30, 2017
. Under our revenue recognition accounting policy, which is in accordance with GAAP, these administrative fees would be ordinarily recorded as revenue when reported to us; however, the acquisition method of accounting requires us to estimate the amount of purchases prior to the acquisition date and to record the fair value of the administrative fees to be received from those purchases as an account receivable (as opposed
58
to recognizing revenue when these transactions are reported to us) and record any corresponding revenue share obligation as a liability. The purchase accounting adjustment amounted to an estimated
$21.2 million
of accounts receivable relating to these administrative fees and an estimated
$3.8 million
for the related revenue share obligation through
June 30, 2017
.
This item also includes non-cash adjustments to deferred revenue of acquired entities of
$0.3 million
,
$0.6 million
and
$5.6 million
for
the years ended June 30, 2018, 2017 and 2016
, respectively. Business combination accounting rules require the Company to record a deferred revenue liability at its fair value only if the acquired deferred revenue represents a legal performance obligation assumed by the acquirer. The fair value is based on direct and indirect incremental costs of providing the services plus a normal profit margin. Generally, this results in a reduction to the purchased deferred revenue balance, which was based on upfront software license update fees and product support contracts assumed in connection with acquisitions. Because these support contracts are typically one year in duration, our GAAP revenues for the one-year period subsequent to the acquisition of a business do not reflect the full amount of support revenues on these assumed support contracts that would have otherwise been recorded by the acquired entity. The Non-GAAP adjustment to software license update fees and product support revenues is intended to include, and thus reflect, the full amount of such revenues (see
Note 21 - Segments
).
Strategic and financial restructuring expenses
This item represents legal, accounting and other expenses directly related to strategic and financial restructuring activities.
Loss on FFF put and call rights
See
Note 5 - Fair Value Measurements
.
Impairment on investments
See
Note 4 - Investments
.
59
Results of Operations for the
Years Ended June 30, 2018, 2017 and 2016
The following table summarizes our results of operations for the fiscal years presented (in thousands, except per share data):
|
Year Ended June 30,
|
|||||||||||||||||
|
2018
|
2017
|
2016
|
|||||||||||||||
|
Amount
|
% of Net Revenue
|
Amount
|
% of Net Revenue
|
Amount
|
% of Net Revenue
|
||||||||||||
|
Net revenue:
|
|||||||||||||||||
|
Net administrative fees
|
$
|
643,839
|
|
39
|
%
|
$
|
557,468
|
|
38
|
%
|
$
|
498,394
|
|
43
|
%
|
||
|
Other services and support
|
372,133
|
|
22
|
%
|
363,087
|
|
25
|
%
|
337,554
|
|
29
|
%
|
|||||
|
Services
|
1,015,972
|
|
61
|
%
|
920,555
|
|
63
|
%
|
835,948
|
|
72
|
%
|
|||||
|
Products
|
645,284
|
|
39
|
%
|
534,118
|
|
37
|
%
|
326,646
|
|
28
|
%
|
|||||
|
Net revenue
|
1,661,256
|
|
100
|
%
|
1,454,673
|
|
100
|
%
|
1,162,594
|
|
100
|
%
|
|||||
|
Cost of revenue:
|
|||||||||||||||||
|
Services
|
187,399
|
|
11
|
%
|
182,775
|
|
13
|
%
|
163,240
|
|
14
|
%
|
|||||
|
Products
|
610,892
|
|
37
|
%
|
497,273
|
|
34
|
%
|
293,816
|
|
25
|
%
|
|||||
|
Cost of revenue
|
798,291
|
|
48
|
%
|
680,048
|
|
47
|
%
|
457,056
|
|
39
|
%
|
|||||
|
Gross profit
|
862,965
|
|
52
|
%
|
774,625
|
|
53
|
%
|
705,538
|
|
61
|
%
|
|||||
|
Other operating income:
|
|||||||||||||||||
|
Remeasurement of tax receivable agreement liabilities
|
177,174
|
|
11
|
%
|
5,447
|
|
—
|
%
|
4,818
|
|
—
|
%
|
|||||
|
Other operating income
|
177,174
|
|
11
|
%
|
5,447
|
|
—
|
%
|
4,818
|
|
—
|
%
|
|||||
|
Operating expenses:
|
|||||||||||||||||
|
Selling, general and administrative
|
443,639
|
|
27
|
%
|
410,918
|
|
29
|
%
|
408,429
|
|
36
|
%
|
|||||
|
Research and development
|
1,423
|
|
—
|
%
|
3,107
|
|
—
|
%
|
2,925
|
|
—
|
%
|
|||||
|
Amortization of purchased intangible assets
|
55,447
|
|
3
|
%
|
48,327
|
|
3
|
%
|
33,054
|
|
3
|
%
|
|||||
|
Operating expenses
|
500,509
|
|
30
|
%
|
462,352
|
|
32
|
%
|
444,408
|
|
39
|
%
|
|||||
|
Operating income
|
539,630
|
|
33
|
%
|
317,720
|
|
22
|
%
|
265,948
|
|
22
|
%
|
|||||
|
Other income (expense), net
|
(22,826
|
)
|
(1
|
)%
|
213,571
|
|
15
|
%
|
18,934
|
|
2
|
%
|
|||||
|
Income before income taxes
|
516,804
|
|
31
|
%
|
531,291
|
|
37
|
%
|
284,882
|
|
24
|
%
|
|||||
|
Income tax expense
|
259,234
|
|
16
|
%
|
81,814
|
|
6
|
%
|
49,721
|
|
4
|
%
|
|||||
|
Net income
|
257,570
|
|
16
|
%
|
449,477
|
|
31
|
%
|
235,161
|
|
20
|
%
|
|||||
|
Net income attributable to non-controlling interest in Premier LP
|
(224,269
|
)
|
(13
|
)%
|
(336,052
|
)
|
(23
|
)%
|
(193,547
|
)
|
(17
|
)%
|
|||||
|
Adjustment of redeemable limited partners' capital to redemption amount
|
157,581
|
|
9
|
%
|
(37,176
|
)
|
(3
|
)%
|
776,750
|
|
67
|
%
|
|||||
|
Net income attributable to stockholders
|
$
|
190,882
|
|
11
|
%
|
$
|
76,249
|
|
5
|
%
|
$
|
818,364
|
|
70
|
%
|
||
|
Weighted average shares outstanding:
|
|||||||||||||||||
|
Basic
|
53,518
|
|
nm
|
|
49,654
|
|
nm
|
|
42,368
|
|
nm
|
|
|||||
|
Diluted
|
137,340
|
|
nm
|
|
50,374
|
|
nm
|
|
145,308
|
|
nm
|
|
|||||
|
Earnings per share attributable to stockholders:
|
|||||||||||||||||
|
Basic
|
$
|
3.57
|
|
nm
|
|
$
|
1.54
|
|
nm
|
|
$
|
19.32
|
|
nm
|
|
||
|
Diluted
(a)
|
$
|
1.36
|
|
nm
|
|
$
|
1.51
|
|
nm
|
|
$
|
0.97
|
|
nm
|
|
||
nm = not meaningful
|
(a)
|
The Company has corrected prior period information within the current period financial statements related to a specific component used in calculating the tax effect on Premier, Inc. net income for purposes of diluted earnings per share. Diluted earnings per share for fiscal 2016 was previously stated at $1.33 per share and has been corrected to $0.97 per share. The Company believes the correction is immaterial and the corrected amount had no impact on the Company’s overall financial condition, results of operations or cash flows.
|
60
The following table provides certain Non-GAAP financial measures for the fiscal years presented (in thousands, except per share data). Refer to "Our Use of Non-GAAP Financial Measures" for further information regarding items excluded in our calculation of Adjusted EBITDA and Segment Adjusted EBITDA.
|
Year Ended June 30,
|
|||||||||||||||||
|
2018
|
2017
|
2016
|
|||||||||||||||
|
Amount
|
% of Net Revenue
|
Amount
|
% of Net Revenue
|
Amount
|
% of Net Revenue
|
||||||||||||
|
Certain Non-GAAP Financial Data:
|
|||||||||||||||||
|
Adjusted EBITDA
|
$
|
543,049
|
|
33
|
%
|
$
|
501,591
|
|
34
|
%
|
$
|
440,975
|
|
38
|
%
|
||
|
Adjusted Fully Distributed Net Income
|
$
|
317,098
|
|
19
|
%
|
$
|
267,299
|
|
18
|
%
|
$
|
233,259
|
|
20
|
%
|
||
|
Adjusted Fully Distributed Earnings Per Share
|
$
|
2.31
|
|
nm
|
|
$
|
1.89
|
|
nm
|
|
$
|
1.61
|
|
nm
|
|
||
The following table provides the reconciliation of net income to Adjusted EBITDA and the reconciliation of income before income taxes to Segment Adjusted EBITDA (in thousands). Refer to "Our Use of Non-GAAP Financial Measures" for further information regarding items excluded in our calculation of Adjusted EBITDA and Segment Adjusted EBITDA.
|
Year Ended June 30,
|
|||||||||
|
2018
|
2017
|
2016
|
|||||||
|
Net income
|
$
|
257,570
|
|
$
|
449,477
|
|
$
|
235,161
|
|
|
Interest and investment loss, net
|
5,300
|
|
4,512
|
|
1,021
|
|
|||
|
Income tax expense
|
259,234
|
|
81,814
|
|
49,721
|
|
|||
|
Depreciation and amortization
|
71,312
|
|
58,884
|
|
51,102
|
|
|||
|
Amortization of purchased intangible assets
|
55,447
|
|
48,327
|
|
33,054
|
|
|||
|
EBITDA
|
648,863
|
|
643,014
|
|
370,059
|
|
|||
|
Stock-based compensation
|
29,799
|
|
26,860
|
|
49,081
|
|
|||
|
Acquisition related expenses
|
8,335
|
|
15,790
|
|
15,804
|
|
|||
|
Strategic and financial restructuring expenses
|
2,512
|
|
31
|
|
268
|
|
|||
|
Remeasurement of tax receivable agreement liabilities
|
(177,174
|
)
|
(5,447
|
)
|
(4,818
|
)
|
|||
|
ERP implementation expenses
|
1,000
|
|
2,028
|
|
4,870
|
|
|||
|
Acquisition related adjustment - revenue
|
300
|
|
18,049
|
|
5,624
|
|
|||
|
Remeasurement gain attributable to acquisition of Innovatix, LLC
|
—
|
|
(205,146
|
)
|
—
|
|
|||
|
Loss on disposal of long-lived assets
|
2,376
|
|
2,422
|
|
—
|
|
|||
|
Loss on FFF put and call rights
|
22,036
|
|
3,935
|
|
—
|
|
|||
|
Impairment on investments
|
5,002
|
|
—
|
|
—
|
|
|||
|
Other expense
|
—
|
|
55
|
|
87
|
|
|||
|
Adjusted EBITDA
|
$
|
543,049
|
|
$
|
501,591
|
|
$
|
440,975
|
|
|
Income before income taxes
|
$
|
516,804
|
|
$
|
531,291
|
|
$
|
284,882
|
|
|
Remeasurement gain attributable to acquisition of Innovatix, LLC
|
—
|
|
(205,146
|
)
|
—
|
|
|||
|
Equity in net income of unconsolidated affiliates
|
(1,174
|
)
|
(14,745
|
)
|
(21,647
|
)
|
|||
|
Interest and investment loss, net
|
5,300
|
|
4,512
|
|
1,021
|
|
|||
|
Loss on disposal of long-lived assets
|
2,376
|
|
2,422
|
|
—
|
|
|||
|
Other expense (income)
|
16,324
|
|
(614
|
)
|
1,692
|
|
|||
|
Operating income
|
539,630
|
|
317,720
|
|
265,948
|
|
|||
|
Depreciation and amortization
|
71,312
|
|
58,884
|
|
51,102
|
|
|||
|
Amortization of purchased intangible assets
|
55,447
|
|
48,327
|
|
33,054
|
|
|||
|
Stock-based compensation
|
29,799
|
|
26,860
|
|
49,081
|
|
|||
61
|
Year Ended June 30,
|
|||||||||
|
2018
|
2017
|
2016
|
|||||||
|
Acquisition related expenses
|
8,335
|
|
15,790
|
|
15,804
|
|
|||
|
Strategic and financial restructuring expenses
|
2,512
|
|
31
|
|
268
|
|
|||
|
Remeasurement of tax receivable agreement liabilities
|
(177,174
|
)
|
(5,447
|
)
|
(4,818
|
)
|
|||
|
ERP implementation expenses
|
1,000
|
|
2,028
|
|
4,870
|
|
|||
|
Acquisition related adjustment - revenue
|
300
|
|
18,049
|
|
5,624
|
|
|||
|
Equity in net income of unconsolidated affiliates
|
1,174
|
|
14,745
|
|
21,647
|
|
|||
|
Impairment on investments
|
5,002
|
|
—
|
|
—
|
|
|||
|
Deferred compensation plan income (expense)
|
3,960
|
|
4,020
|
|
(1,605
|
)
|
|||
|
Other income
|
1,752
|
|
584
|
|
—
|
|
|||
|
Adjusted EBITDA
|
$
|
543,049
|
|
$
|
501,591
|
|
$
|
440,975
|
|
|
Segment Adjusted EBITDA:
|
|||||||||
|
Supply Chain Services
|
$
|
535,380
|
|
$
|
493,763
|
|
$
|
439,013
|
|
|
Performance Services
|
123,429
|
|
121,090
|
|
110,787
|
|
|||
|
Corporate
|
(115,760
|
)
|
(113,262
|
)
|
(108,825
|
)
|
|||
|
Adjusted EBITDA
|
$
|
543,049
|
|
$
|
501,591
|
|
$
|
440,975
|
|
62
The following table provides the reconciliation of net income attributable to stockholders to Non-GAAP Adjusted Fully Distributed Net Income and the reconciliation of the numerator and denominator for earnings per share attributable to stockholders to Non-GAAP Adjusted Fully Distributed Earnings per Share for the periods presented (in thousands). Refer to "Our Use of Non-GAAP Financial Measures" for further information regarding items excluded in our calculation of Non-GAAP Adjusted Fully Distributed Net Income and Non-GAAP Adjusted Fully Distributed Earnings per Share.
|
Year Ended June 30,
|
|||||||||
|
2018
|
2017
|
2016
|
|||||||
|
Net income attributable to stockholders
|
$
|
190,882
|
|
$
|
76,249
|
|
$
|
818,364
|
|
|
Adjustment of redeemable limited partners' capital to redemption amount
|
(157,581
|
)
|
37,176
|
|
(776,750
|
)
|
|||
|
Net income attributable to non-controlling interest in Premier LP
|
224,269
|
|
336,052
|
|
193,547
|
|
|||
|
Income tax expense
|
259,234
|
|
81,814
|
|
49,721
|
|
|||
|
Amortization of purchased intangible assets
|
55,447
|
|
48,327
|
|
33,054
|
|
|||
|
Stock-based compensation
|
29,799
|
|
26,860
|
|
49,081
|
|
|||
|
Acquisition related expenses
|
8,335
|
|
15,790
|
|
15,804
|
|
|||
|
Strategic and financial restructuring expenses
|
2,512
|
|
31
|
|
268
|
|
|||
|
Remeasurement of tax receivable agreement liabilities
|
(177,174
|
)
|
(5,447
|
)
|
(4,818
|
)
|
|||
|
ERP implementation expenses
|
1,000
|
|
2,028
|
|
4,870
|
|
|||
|
Acquisition related adjustment - revenue
|
300
|
|
18,049
|
|
5,624
|
|
|||
|
Remeasurement gain attributable to acquisition of Innovatix, LLC
|
—
|
|
(205,146
|
)
|
—
|
|
|||
|
Loss on disposal of long-lived assets
|
2,376
|
|
2,422
|
|
—
|
|
|||
|
Loss on FFF put and call rights
|
22,036
|
|
3,935
|
|
—
|
|
|||
|
Impairment on investments
|
5,002
|
|
—
|
|
—
|
|
|||
|
Other expense
|
1
|
|
55
|
|
—
|
|
|||
|
Non-GAAP adjusted fully distributed income before income taxes
|
466,438
|
|
438,195
|
|
388,765
|
|
|||
|
Income tax expense on fully distributed income before income taxes
(a)
|
149,340
|
|
170,896
|
|
155,506
|
|
|||
|
Non-GAAP Adjusted Fully Distributed Net Income
|
$
|
317,098
|
|
$
|
267,299
|
|
$
|
233,259
|
|
|
Reconciliation of denominator for earnings (loss) per share attributable to stockholders to Non-GAAP Adjusted Fully Distributed Earnings per Share
|
|||||||||
|
Weighted average:
|
|||||||||
|
Common shares used for basic earnings per share and diluted earnings (loss) per share
|
53,518
|
|
49,654
|
|
42,368
|
|
|||
|
Potentially dilutive shares
|
822
|
|
720
|
|
2,366
|
|
|||
|
Conversion of Class B common units
|
83,000
|
|
90,816
|
|
100,574
|
|
|||
|
Weighted average fully distributed shares outstanding - diluted
|
137,340
|
|
141,190
|
|
145,308
|
|
|||
|
(a)
|
Reflects income tax expense at an estimated effective income tax rate of
32%
of Non-GAAP adjusted fully distributed income before income taxes for
the year ended June 30, 2018
,
39%
of Non-GAAP adjusted fully distributed income before income taxes for
the year ended June 30, 2017
and
40%
of Non-GAAP adjusted fully distributed income before income taxes for
the year ended June 30, 2016
.
|
63
The following table provides the reconciliation of earnings per share attributable to stockholders to Non-GAAP Adjusted Fully Distributed Earnings per Share for the periods presented. Refer to "Our Use of Non-GAAP Financial Measures" for further information regarding items excluded in our calculation of Non-GAAP Adjusted Fully Distributed Earnings per Share.
|
Year Ended June 30,
|
|||||||||
|
2018
|
2017
|
2016
|
|||||||
|
Earnings per share attributable to stockholders
|
$
|
3.57
|
|
$
|
1.54
|
|
$
|
19.32
|
|
|
Adjustment of redeemable limited partners' capital to redemption amount
|
(2.94
|
)
|
0.75
|
|
(18.33
|
)
|
|||
|
Net income attributable to non-controlling interest in Premier LP
|
4.19
|
|
6.77
|
|
4.57
|
|
|||
|
Income tax expense
|
4.84
|
|
1.65
|
|
1.17
|
|
|||
|
Amortization of purchased intangible assets
|
1.04
|
|
0.97
|
|
0.78
|
|
|||
|
Stock-based compensation
|
0.56
|
|
0.54
|
|
1.16
|
|
|||
|
Acquisition related expenses
|
0.16
|
|
0.32
|
|
0.37
|
|
|||
|
Strategic and financial restructuring expenses
|
0.05
|
|
—
|
|
0.01
|
|
|||
|
Remeasurement of tax receivable agreement liabilities
|
(3.31
|
)
|
(0.11
|
)
|
(0.11
|
)
|
|||
|
ERP implementation expenses
|
0.02
|
|
0.04
|
|
0.11
|
|
|||
|
Acquisition related adjustment - revenue
|
0.01
|
|
0.36
|
|
0.13
|
|
|||
|
Remeasurement gain attributable to acquisition of Innovatix, LLC
|
—
|
|
(4.13
|
)
|
—
|
|
|||
|
Loss on disposal of long-lived assets
|
0.04
|
|
0.05
|
|
—
|
|
|||
|
Loss on FFF put and call rights
|
0.41
|
|
0.08
|
|
—
|
|
|||
|
Impairment on investments
|
0.09
|
|
—
|
|
—
|
|
|||
|
Impact of corporation taxes
(a)
|
(2.80
|
)
|
(3.45
|
)
|
(3.67
|
)
|
|||
|
Impact of dilutive shares
(b)
|
(3.62
|
)
|
(3.49
|
)
|
(3.90
|
)
|
|||
|
Non-GAAP Adjusted Fully Distributed Earnings Per Share
|
$
|
2.31
|
|
$
|
1.89
|
|
$
|
1.61
|
|
|
(a)
|
Reflects income tax expense at an estimated effective income tax rate of
32%
of Non-GAAP adjusted fully distributed income before income taxes for
the year ended June 30, 2018
,
39%
of Non-GAAP adjusted fully distributed income before income taxes for
the year ended June 30, 2017
and
40%
of Non-GAAP adjusted fully distributed income before income taxes for
the year ended June 30, 2016
.
|
|
(b)
|
Reflects impact of dilutive shares, primarily attributable to the assumed conversion of all Class B common units for Class A common stock.
|
Consolidated Results
-
Comparison of the Years ended June 30, 2018 to 2017 and June 30, 2017 to 2016
Net Revenue
Net revenue increased
$206.6 million
, or
14%
, to
$1.7 billion
from
the year ended June 30, 2017
to
2018
, and increased
$292.1 million
, or
25%
, to
$1.5 billion
from
the year ended June 30, 2016
to
2017
.
Net administrative fees revenue increased
$86.3 million
, or
15%
, to
$643.8 million
from
the year ended June 30, 2017
to
2018
. The increase in net administrative fees revenue was primarily driven by aggregate contributions from Innovatix and Essensa, which were acquired on December 2, 2016. To a lesser extent, net administrative fees were also favorably impacted by supplier revenue recovery settlements and further contract penetration of new and existing members. Net administrative fees revenue increased
$59.1 million
, or
12%
, to
$557.5 million
from
the year ended June 30, 2016
to
2017
. The increase in net administrative fees revenue was primarily driven by aggregate contributions from Innovatix and Essensa, further contract penetration of existing members and, to a lesser degree, the ongoing positive impact of conversion of new members to our contract portfolio. We experience quarterly fluctuations in net administrative fees revenue due to periodic variability associated with the receipt of supplier member purchasing reports and administrative fee payments at quarter-end; however, we expect our net administrative fees revenue to continue to grow to the extent our existing members increase the utilization of our contracts and additional members convert to our contract portfolio.
Other services and support revenue increased
$9.0 million
, or
2%
, to
$372.1 million
from
the year ended June 30, 2017
to
2018
. The increase was primarily due to growth in cost management SaaS informatics products subscriptions and quality and cost management consulting services. We also experienced increases in applied science services and government services related revenue, offset by a decrease in ambulatory reporting revenue. Other services and support revenue increased
$25.5 million
, or
8%
, to
$363.1 million
from
the year ended June 30, 2016
to
2017
. The increase was primarily due to growth in ambulatory reporting revenue, cost management consulting services and government services revenue.
64
Product revenue increased
$111.2 million
, or
21%
, to
$645.3 million
from
the year ended June 30, 2017
to
2018
. The increase was primarily driven by higher sales of certain limited distribution drugs dispensed to treat Idiopathic Pulmonary Fibrosis, Oncology and Multiple Sclerosis, which is also attributable to contributions from expansion and growth in therapy offerings obtained in conjunction with our acquisition of Acro Pharmaceuticals. These results were partially offset by a slight decrease in the sales of HIV pharmaceuticals. We also experienced increased sales of direct sourcing products. Product revenue increased
$207.5 million
, or
64%
, to
$534.1 million
from
the year ended June 30, 2016
to
2017
. The increase was primarily driven by revenues from our Acro Pharmaceuticals acquisition and increased sales of direct sourcing products, partially offset by decreases in certain drug sales, including Hepatitis C pharmaceuticals. We expect our integrated pharmacy and direct sourcing product revenues to continue to grow to the extent we are able to increase our product offerings, expand our product sales to existing members and as additional members begin to utilize our programs.
Cost of Revenue
Cost of revenue increased
$118.2 million
, or
17%
, from
the year ended June 30, 2017
to
2018
, and increased
$223.0 million
, or
49%
, from
the year ended June 30, 2016
to
2017
.
Cost of services revenue increased
$4.6 million
, or
3%
, to
$187.4 million
from
the year ended June 30, 2017
to
2018
. The increase was primarily driven by higher salaries and benefits expenses resulting from increased staffing to support growth and performance-based engagements as well as increased depreciation expense as a result of increased capitalization of internally-developed software, partially offset by a decrease in consulting costs related to outside resources to support certain projects. Cost of services revenue increased
$19.5 million
, or
12%
, to
$182.8 million
from
the year ended June 30, 2016
to
2017
. The increase was primarily driven by increases in depreciation expense as a result of increased capitalization of internally-developed software, higher salaries and benefits expenses resulting from increased staffing to support our continued growth, and higher consulting costs for certain projects. We expect cost of service revenue to increase to the extent we continue to develop new and enhance existing internally-developed software applications, expand our consulting services and performance improvement collaboratives and expand into new product offerings.
Cost of product revenue increased
$113.6 million
, or
23%
, to
$610.9 million
from
the year ended June 30, 2017
to
2018
. The increase was primarily driven by growth in sales and revenues associated with our integrated pharmacy business and due to higher costs driven by growth in direct sourcing sales. Cost of product revenue increased
$203.5 million
, or
69%
, to
$497.3 million
from
the year ended June 30, 2016
to
2017
. The increase was primarily driven by higher product costs associated with the business operations of Acro Pharmaceuticals and due to higher costs driven by growth in direct sourcing sales. We expect our cost of product revenue to increase to the extent we are able to sell additional integrated pharmacy and direct-sourced medical products to new and existing members and enroll additional members into our integrated pharmacy program. The increased cost of product revenues is expected to reduce our gross profit percentage as a percentage of our consolidated net revenues.
Other Operating Income
Other operating income increased
$171.8 million
, to
$177.2 million
from
the year ended June 30, 2017
to
2018
as a result of the remeasurement of TRA liabilities, which was primarily attributable to the 14% decrease in the U.S. federal corporate income tax rate associated with the TCJA. See "Member-Owner TRA" below for additional information related to our TRA liabilities. Corporate other operating income increased
$0.6 million
, from
the year ended June 30, 2016
to
2017
, remaining relatively flat.
Operating Expenses
Operating expenses increased
$38.2 million
, or
8%
, to
$500.5 million
from
the year ended June 30, 2017
to
2018
, and increased
$17.9 million
, or
4%
, from
the year ended June 30, 2016
to
2017
.
Selling, General and Administrative
Selling, general and administrative expenses increased
$32.7 million
, or
8%
, to
$443.6 million
from
the year ended June 30, 2017
to
2018
. Salaries and benefits expenses increased primarily due to increased staffing mostly associated with acquisitions and to support growth in our Supply Chain Services segment, an increase in depreciation expense resulting from increased internally-developed software capitalization, an increase in stock-based compensation expense largely driven by an increase in equity award grants in addition to anticipated achievement of certain performance targets, along with an increase in severance expense related to the workforce reduction that occurred in February 2018. These results were partially offset by a decrease in costs year over year associated with the acquisitions of Innovatix, Essensa and Acro Pharmaceuticals, which occurred in the prior year. Selling, general and administrative expenses increased
$2.5 million
, or
1%
, to
$410.9 million
from
the year ended June 30, 2016
to
2017
. Salaries and benefits expenses increased primarily due to increased staffing to support growth and acquisitions, offset by a decrease in stock-based compensation primarily related to vesting of certain IPO-related performance based awards during the prior year.
65
Research and Development
Research and development expenses consist of employee-related compensation and benefit expenses and third-party consulting fees for technology professionals, net of capitalized labor, incurred to develop our software-related products and services. Research and development expenses decreased
$1.7 million
, or
54%
, to
$1.4 million
from
the year ended June 30, 2017
to
2018
. Research and development expenses increased
$0.2 million
, or
6%
, to
$3.1 million
from
the year ended June 30, 2016
to
2017
.
Including capitalized labor, total research and development expenditures were
$76.4 million
for
the year ended June 30, 2018
, an increase of
$6.7 million
from
$69.7 million
for
the year ended June 30, 2017
. Total research and development expenditures increased
$5.7 million
during
the year ended June 30, 2017
from
$64.0 million
for
the year ended June 30, 2016
. We experience fluctuations in our research and development expenditures across reportable periods due to the timing of our software development lifecycles, new product features and functionality, new technologies and upgrades to our service offerings.
Amortization of Purchased Intangible Assets
Amortization of purchased intangible assets increased
$7.1 million
, or
15%
, to
$55.4 million
from
the year ended June 30, 2017
to
2018
and increased
$15.3 million
, or
46%
, to
$48.3 million
from
the year ended June 30, 2016
to
2017
. The increases were primarily a result of the additional amortization of purchased intangible assets related to our acquisitions. As we execute on our growth strategy and further deploy capital, we expect further increases in amortization of intangible assets in connection with future potential acquisitions.
Other Income (Expense), Net
Other income (expense), net decreased
$236.4 million
to
$(22.8) million
from
the year ended June 30, 2017
to
2018
primarily due to the one-time
$205.1 million
gain recognized from the remeasurement of the 50% equity method investment in Innovatix to fair value upon acquisition of Innovatix on December 2, 2016 (see
Note 3 - Business Acquisitions
). This gain was partially offset by a reduction in equity in net income of unconsolidated affiliates. As a result of acquiring the remaining 50% of Innovatix, we no longer account for our ownership using the equity method. Other income (expense), net was also impacted by the loss on FFF put and call rights in the current year and partially offset by a moderate increase in equity in net income of FFF, which experienced improved performance in
the year ended June 30, 2018
. Other income, net increased
$194.6 million
to
$213.6 million
from
the year ended June 30, 2016
to
2017
primarily due to the aforementioned one-time
$205.1 million
gain recognized from the remeasurement of the 50% equity method investment in Innovatix to fair value upon acquisition of Innovatix (see
Note 3 - Business Acquisitions
). This gain was partially offset by a reduction in equity in net income of unconsolidated affiliates primarily as a result of acquiring the remaining 50% of Innovatix, which we no longer account for using the equity method.
Income Tax Expense
Income tax expense increased
$177.4 million
, or
217%
, to
$259.2 million
from
the year ended June 30, 2017
to
2018
, and our effective tax rates were
15%
and
50%
, respectively. The increase in the effective tax rate was primarily attributable to the remeasurement of deferred tax balances, of which
$224.9 million
related to the aforementioned decrease in the U.S. federal corporate income tax rate from
35%
to
21%
, pursuant to the TCJA enacted on December 22, 2017. Income tax expense increased
$32.1 million
, or
65%
, to
$81.8 million
from
the year ended June 30, 2016
to
2017
. Our effective tax rates were
17%
and
15%
, respectively. The decrease in the effective tax rate was primarily attributable to the one-time gain related to the remeasurement of the 50% equity method investment in Innovatix to fair value upon acquisition of Innovatix. The Company's effective tax rate differs from income taxes recorded at the combined (or blended) statutory income tax rate primarily due to partnership income not subject to federal, state and local income taxes and valuation allowances against deferred tax assets at PHSI. See
Note 18 - Income Taxes
for more information.
Net Income Attributable to Non-Controlling Interest
Net income attributable to non-controlling interest decreased
$111.8 million
, or
33%
to
$224.3 million
from
the year ended June 30, 2017
to
2018
primarily due to a decrease in Premier LP net income, which was largely driven by the one-time gain of $205.1 million in the prior year associated with the remeasurement of our investment in Innovatix under business combination accounting rules to fair value as a result of acquiring the remaining 50% ownership interest of Innovatix on December 2, 2016, as well as a decrease in non-controlling ownership interest percentage in Premier LP from 63% to 60%. Net income attributable to non-controlling interest increased
$142.6 million
, or
74%
, to
$336.1 million
from
the year ended June 30, 2016
to
2017
primarily due to an increase in Premier LP net income driven by the aforementioned one-time gain of $205.1 million related to our acquisition of the remaining 50% ownership interest in Innovatix on December 2, 2016 along with increased revenues, partially offset by the decrease in non-controlling ownership interest percentage in Premier LP from 68% to 63%.
66
Non-GAAP Adjusted EBITDA
Non-GAAP Adjusted EBITDA increased
$41.5 million
, or
8%
, to
543.0 million
from
the year ended June 30, 2017
to
2018
. The increase was primarily a result of growth in net administrative fees revenue including contributions related to Innovatix and Essensa acquisition, net of a
$10.7 million
reduction in equity in net income of unconsolidated affiliates due to acquiring the remaining 50% of Innovatix as it was historically accounted for as an unconsolidated affiliate through the date of acquisition, along with an increase in product revenue and, to a lesser extent, an increase in other services and support revenue driven by growth in cost management SaaS informatics products subscriptions, quality and cost management consulting services, applied sciences services and government services related revenue. These increases were partially offset by increased service and product costs and selling, general and administrative expenses resulting from higher salaries and benefits expenses as a result of acquisitions and to support growth. Additionally, upon acquiring Innovatix and Essensa in the prior year, we recorded a net
$17.4 million
purchase accounting adjustment to Adjusted EBITDA during the year ended June 30, 2017 that reflects the fair value of administrative fees related to member purchases that occurred prior to December 2, 2016, but were reported to us subsequent to that date through June 30, 2017. Non-GAAP Adjusted EBITDA increased
$60.6 million
, or
14%
, to
$501.6 million
from
the year ended June 30, 2016
to
2017
. The increase was primarily a result of growth in net administrative fees revenue including contributions related to the Innovatix and Essensa acquisition in addition to a Non-GAAP revenue adjustment related to the Innovatix and Essensa acquisition, and increased product revenues. These results were partially offset by increased product costs, selling, general and administrative expenses resulting from higher salaries and benefits expenses related to acquisitions and a reduction in equity in net income of unconsolidated affiliates due to acquiring the remaining 50% of Innovatix.
67
Supply Chain Services
-
Comparison of the Years ended June 30, 2018 to 2017 and June 30, 2017 to 2016
The following table summarizes our results of operations and Non-GAAP Adjusted EBITDA in the Supply Chain Services segment for the fiscal years presented (in thousands):
|
Year Ended June 30,
|
|||||||||
|
Supply Chain Services
|
2018
|
2017
|
2016
|
||||||
|
Net revenue:
|
|||||||||
|
Net administrative fees
|
$
|
643,839
|
|
$
|
557,468
|
|
$
|
498,394
|
|
|
Other services and support
|
11,454
|
|
9,704
|
|
4,385
|
|
|||
|
Services
|
655,293
|
|
567,172
|
|
502,779
|
|
|||
|
Products
|
645,284
|
|
534,118
|
|
326,646
|
|
|||
|
Net revenue
|
1,300,577
|
|
1,101,290
|
|
829,425
|
|
|||
|
Cost of revenue:
|
|||||||||
|
Services
|
4,880
|
|
5,432
|
|
3,123
|
|
|||
|
Products
|
610,892
|
|
497,269
|
|
293,816
|
|
|||
|
Cost of revenue
|
615,772
|
|
502,701
|
|
296,939
|
|
|||
|
Gross profit
|
684,805
|
|
598,589
|
|
532,486
|
|
|||
|
Operating expenses:
|
|||||||||
|
Selling, general and administrative
|
166,725
|
|
155,860
|
|
120,344
|
|
|||
|
Amortization of purchased intangible assets
|
20,115
|
|
12,472
|
|
348
|
|
|||
|
Operating expenses
|
186,840
|
|
168,332
|
|
120,692
|
|
|||
|
Operating income
|
$
|
497,965
|
|
$
|
430,257
|
|
$
|
411,794
|
|
|
Depreciation and amortization
|
1,618
|
|
1,737
|
|
1,053
|
|
|||
|
Amortization of purchased intangible assets
|
20,115
|
|
12,472
|
|
348
|
|
|||
|
Acquisition related expenses
|
8,606
|
|
17,192
|
|
4,466
|
|
|||
|
Acquisition related adjustment - revenue
|
—
|
|
17,440
|
|
—
|
|
|||
|
Equity in net income of unconsolidated affiliates
|
1,904
|
|
14,684
|
|
21,352
|
|
|||
|
Impairment on investments
|
4,002
|
|
—
|
|
—
|
|
|||
|
Other income (expense)
|
1,170
|
|
(19
|
)
|
—
|
|
|||
|
Non-GAAP Segment Adjusted EBITDA
|
$
|
535,380
|
|
$
|
493,763
|
|
$
|
439,013
|
|
Net Revenue
Supply Chain Services segment net revenue increased
$199.3 million
, or
18%
, to
$1.3 billion
from
the year ended June 30, 2017
to
2018
, and increased
$271.9 million
, or
33%
, to
$1.1 billion
from
the year ended June 30, 2016
to
2017
.
Net administrative fees revenue in our Supply Chain Services segment increased
$86.4 million
, or
15%
, to
$643.8 million
from
the year ended June 30, 2017
to
2018
. The increase in net administrative fees revenue was primarily driven by aggregate contributions from Innovatix and Essensa, which were acquired on December 2, 2016. To a lesser extent, net administrative fees were also favorably impacted by supplier revenue recovery settlements and further contract penetration of new and existing members. Net administrative fees revenue in our Supply Chain Services segment increased
$59.1 million
, or
12%
, to
$557.5 million
from
the year ended June 30, 2016
to
2017
. The increase in net administrative fees revenue was primarily driven by contributions from Innovatix and Essensa, further contract penetration of existing members and, to a lesser degree, the ongoing positive impact of conversion of new members to our contract portfolio contributed to the increase. We experience quarterly fluctuations in net administrative fees revenue due to periodic variability associated with the receipt of supplier member purchasing reports and administrative fee payments at quarter-end; however, we expect our net administrative fees revenue to continue to grow to the extent our existing members increase the utilization of our contracts and additional members convert to our contract portfolio.
Product revenue in our Supply Chain Services segment increased
$111.2 million
, or
21%
, to
$645.3 million
from
the year ended June 30, 2017
to
2018
. The increase was primarily driven by higher sales of certain limited distribution drugs dispensed to treat Idiopathic Pulmonary Fibrosis, Oncology and Multiple Sclerosis, which is also attributable to contributions from expansion and
68
growth in therapy offerings obtained in conjunction with our acquisition of Acro Pharmaceuticals. These results were partially offset by a slight decrease in the sales of HIV pharmaceuticals. We also experienced increased sales of direct sourcing products. Product revenue in our Supply Chain Services segment increased
$207.5 million
, or
64%
, to
$534.1 million
from
the year ended June 30, 2016
to
2017
. The increase was primarily driven by revenues from our Acro Pharmaceuticals acquisition and increased sales of direct sourcing products, partially offset by decreases in certain drug sales, including Hepatitis C pharmaceuticals. We expect our integrated pharmacy and direct sourcing product revenues to continue to grow to the extent we are able to increase our product offerings, expand our product sales to existing members and as additional members begin to utilize our programs.
Cost of Revenue
Supply Chain Services segment cost of revenue increased
$113.1 million
, or
22%
, to
$615.8 million
from
the year ended June 30, 2017
to
2018
, and increased
$205.8 million
, or
69%
, to
$502.7 million
from
the year ended June 30, 2016
to
2017
.
Cost of product revenue in our Supply Chain Services segment increased
$113.6 million
, or
23%
, to
$610.9 million
from
the year ended June 30, 2017
to
2018
. The increase was primarily driven by growth in sales and revenues associated with our integrated pharmacy business and due to higher costs driven by growth in direct sourcing sales. Cost of product revenue in our Supply Chain Services segment increased
$203.5 million
, or
69%
, to
$497.3 million
from
the year ended June 30, 2016
to
2017
. The increase was primarily driven by higher product costs associated with the business operations of Acro Pharmaceuticals and due to higher costs driven by growth in direct sourcing sales. We expect our cost of product revenue to increase to the extent we are able to sell additional integrated pharmacy and direct-sourced medical products to new and existing members and enroll additional members into our integrated pharmacy program. The increased cost of product revenues is expected to reduce our gross profit percentage as a percentage of our net revenues.
Operating Expenses
Supply Chain Services segment operating expenses increased
$18.5 million
, or
11%
, to
$186.8 million
from
the year ended June 30, 2017
to
2018
, and increased
$47.6 million
, or
39%
, to
$168.3 million
from
the year ended June 30, 2016
to
2017
.
Selling, general and administrative expenses in our Supply Chain Services segment increased
$10.9 million
, or
7%
, to
$166.7 million
from
the year ended June 30, 2017
to
2018
due to higher salaries and benefits expense primarily associated with the acquisitions of Innovatix and Essensa and to a lesser extent, the acquisition of Acro Pharmaceuticals, partially offset by a decrease in costs year over year associated with the acquisitions of Innovatix, Essensa and Acro Pharmaceuticals, which took place in the prior year. Selling, general and administrative expenses in our Supply Chain Services segment increased
$35.5 million
, or
30%
, to
$155.9 million
from
the year ended June 30, 2016
to
2017
due to higher salaries and benefits expenses primarily associated with the acquisitions of Innovatix, Essensa and Acro Pharmaceuticals and the related increase in staffing and due to higher acquisition costs compared to the prior year in which we completed no acquisitions in Supply Chain Services.
Amortization of purchased intangible assets in our Supply Chain Services segment increased
$7.6 million
to
$20.1 million
from
the year ended June 30, 2017
to
2018
primarily as a result of additional amortization of purchased intangible assets related to our acquisitions. Amortization of purchased intangible assets in our Supply Chain Services segment increased
$12.1 million
to
$12.5 million
from
the year ended June 30, 2016
to
2017
due to intangible assets purchased in the acquisitions of Acro Pharmaceuticals and Innovatix and Essensa.
Segment Adjusted EBITDA
Segment Adjusted EBITDA in the Supply Chain Services segment increased
$41.6 million
, or
8%
, to
$535.4 million
from
the year ended June 30, 2017
to
2018
. The increase was primarily a result of growth in net administrative fees revenue including contributions related to Innovatix and Essensa, net of a
$10.7 million
reduction in equity in net income of unconsolidated affiliates due to acquiring the remaining 50% of Innovatix as it was historically accounted for as an unconsolidated affiliate through the date of acquisition, along with an increase in product revenue. These increases were partially offset by increased product costs and selling, general and administrative expenses resulting from higher salaries and benefits expenses as a result of acquisitions and to support growth. Additionally, upon acquiring Innovatix and Essensa in the prior year, we recorded a net
$17.4 million
purchase accounting adjustment to Adjusted EBITDA during the year ended June 30, 2017 that reflects the fair value of administrative fees related to member purchases that occurred prior to December 2, 2016, but were reported to us subsequent to that date through June 30, 2017. Segment Adjusted EBITDA in the Supply Chain Services segment increased
$54.8 million
, or
12%
, to
$493.8 million
from
the year ended June 30, 2016
to
2017
primarily as a result of growth in net administrative fees revenue including contributions related to the Innovatix and Essensa acquisition in addition to a $17.4 million Non-GAAP revenue adjustment related to the Innovatix and Essensa acquisition and higher product revenues. These increases were partially offset by increased product costs, selling, general and administrative expenses resulting from higher salaries and benefits expenses related to acquisitions and a reduction in equity in net income of unconsolidated affiliates due to acquiring the remaining 50% of Innovatix.
69
Performance Services
-
Comparison of the Years ended June 30, 2018 to 2017 and June 30, 2017 to 2016
The following table summarizes our results of operations and Non-GAAP adjusted EBITDA in the Performance Services segment for the fiscal years presented (in thousands):
|
Year Ended June 30,
|
|||||||||
|
Performance Services
|
2018
|
2017
|
2016
|
||||||
|
Net revenue:
|
|||||||||
|
Other services and support
|
$
|
360,679
|
|
$
|
353,383
|
|
$
|
333,169
|
|
|
Net revenue
|
360,679
|
|
353,383
|
|
333,169
|
|
|||
|
Cost of revenue:
|
|||||||||
|
Services
|
182,519
|
|
177,323
|
|
160,117
|
|
|||
|
Cost of revenue
|
182,519
|
|
177,323
|
|
160,117
|
|
|||
|
Gross profit
|
178,160
|
|
176,060
|
|
173,052
|
|
|||
|
Operating expenses:
|
|||||||||
|
Selling, general and administrative
|
114,088
|
|
101,405
|
|
120,958
|
|
|||
|
Research and development
|
1,418
|
|
2,278
|
|
2,064
|
|
|||
|
Amortization of purchased intangible assets
|
35,331
|
|
35,855
|
|
32,706
|
|
|||
|
Operating expenses
|
150,837
|
|
139,538
|
|
155,728
|
|
|||
|
Operating income
|
$
|
27,323
|
|
$
|
36,522
|
|
$
|
17,324
|
|
|
Depreciation and amortization
|
60,476
|
|
49,444
|
|
43,793
|
|
|||
|
Amortization of purchased intangible assets
|
35,331
|
|
35,855
|
|
32,706
|
|
|||
|
Acquisition related expenses
|
(271
|
)
|
(1,401
|
)
|
11,340
|
|
|||
|
Acquisition related adjustment - revenue
|
300
|
|
609
|
|
5,624
|
|
|||
|
Equity in net income (loss) of unconsolidated affiliates
|
(730
|
)
|
61
|
|
—
|
|
|||
|
Impairment on investments
|
1,000
|
|
—
|
|
—
|
|
|||
|
Non-GAAP Segment Adjusted EBITDA
|
$
|
123,429
|
|
$
|
121,090
|
|
$
|
110,787
|
|
Net Revenue
Other services and support revenue in our Performance Services segment increased
$7.3 million
, or
2%
, to
$360.7 million
from
the year ended June 30, 2017
to
2018
. The increase was primarily due to growth in cost management SaaS informatics products subscriptions and quality and cost management consulting services. We also experienced increases in applied science services and government services related revenue, offset by a decrease in ambulatory reporting revenue. Other services and support revenue in our Performance Services segment increased
$20.2 million
, or
6%
, to
$353.4 million
from
the year ended June 30, 2016
to
2017
. The increase was primarily due to growth in ambulatory reporting revenue, cost management services and government services.
We expect to experience quarterly variability in revenues generated from our Performance Services segment due to the timing of revenue recognition from certain consulting services and performance-based engagements in which our revenue is based on a percentage of identified member savings and recognition occurs upon approval and documentation of the savings. We generally expect our Performance Services net revenue to grow over the long term to the extent we are able to expand our sales to existing members and additional members begin to utilize our products and services.
Cost of Revenue
Cost of services revenue in our Performance Services segment increased
$5.2 million
, or
3%
, to
$182.5 million
from
the year ended June 30, 2017
to
2018
. The increase was primarily driven by higher salaries and benefits expenses resulting from increased staffing to support growth as well as increased depreciation expense as a result of increased capitalization of internally-developed software, partially offset by a decrease in consulting costs related to outside resources to support certain projects. Cost of services revenue in our Performance Services segment increased
$17.2 million
, or
11%
, to
$177.3 million
from
the year ended June 30, 2016
to
2017
. The increase was primarily driven by higher salaries and benefits expense resulting from increased staffing to support our continued growth, increases in depreciation expense related to an increase in capitalized software, and higher consulting costs for certain projects. We expect cost of service revenue to increase to the extent we continue to develop new and enhance existing
70
internally-developed software applications, expand our consulting services and performance improvement collaboratives and expand into new product offerings.
Operating Expenses
Performance Services segment operating expenses increased
$11.3 million
, or
8%
, to
$150.8 million
from
the year ended June 30, 2017
to
2018
, and decreased
$16.2 million
, or
10%
, to
$139.5 million
from
the year ended June 30, 2016
to
2017
.
Selling, general and administrative expenses in our Performance Services segment increased
$12.7 million
, or
13%
, from
the year ended June 30, 2017
to
2018
primarily due to an increase in salaries and benefits expense to support larger engagements, an increase in depreciation expense resulting from increased internally-developed capitalization, along with an increase in severance expense related to the workforce reduction that occurred in February 2018. Selling, general and administrative expenses in our Performance Services segment decreased
$19.6 million
, or
16%
, from
the year ended June 30, 2016
to
2017
primarily due to reduced acquisition costs and a gain recorded in the current year related to changes in the fair value of earn-out liabilities recorded in connection with our acquisition of InFlow.
Amortization of purchased intangible assets in our Performance Services segment decreased
$0.5 million
, or
1%
, from
the year ended June 30, 2017
to
2018
, remaining relatively flat. Amortization of purchased intangible assets in our Performance Services segment increased
$3.1 million
, or
9%
, from
the year ended June 30, 2016
to
2017
, primarily driven by purchased intangible assets related to acquisitions.
Segment Adjusted EBITDA
Segment Adjusted EBITDA in the Performance Services segment increased
$2.3 million
, or
2%
, to
$123.4 million
from
the year ended June 30, 2017
to
2018
primarily as a result of an increase in other services and support revenue driven by growth in cost management SaaS informatics products subscriptions, quality and cost management consulting services and increases in applied sciences services and government services related revenue. These increases were partially offset by increased service costs and selling, general and administrative expenses resulting from higher salaries and benefits expenses to support larger engagements. Segment Adjusted EBITDA in the Performance Services segment increased
$10.3 million
, or
9%
, to
$121.1 million
from
the year ended June 30, 2016
to
2017
primarily as a result of growth in revenue, partially offset by a higher rate of increase in cost of sales due to the timing requirements of various upfront implementation processes relative to the rate of increase in revenue recognition, specifically within our consulting services business.
71
Corporate
-
Comparison of the Years ended June 30, 2018 to 2017 and June 30, 2017 to 2016
The following table summarizes corporate expenses and Non-GAAP Adjusted EBITDA for the fiscal years presented (in thousands):
|
Year Ended June 30,
|
|||||||||
|
Corporate
|
2018
|
2017
|
2016
|
||||||
|
Other operating income:
|
|||||||||
|
Remeasurement of tax receivable agreement liabilities
|
$
|
177,174
|
|
$
|
5,447
|
|
$
|
4,818
|
|
|
Other operating income
|
177,174
|
|
5,447
|
|
4,818
|
|
|||
|
Operating expenses:
|
|||||||||
|
Selling, general and administrative
|
$
|
162,826
|
|
$
|
153,677
|
|
$
|
167,127
|
|
|
Research and development
|
6
|
|
829
|
|
861
|
|
|||
|
Operating expenses
|
$
|
162,832
|
|
$
|
154,506
|
|
$
|
167,988
|
|
|
Operating income (loss)
|
$
|
14,342
|
|
$
|
(149,059
|
)
|
$
|
(163,170
|
)
|
|
Depreciation and amortization
|
9,217
|
|
7,703
|
|
6,256
|
|
|||
|
Stock-based compensation
|
29,799
|
|
26,860
|
|
49,082
|
|
|||
|
Strategic and financial restructuring expenses
|
2,512
|
|
31
|
|
268
|
|
|||
|
Remeasurement of tax receivable agreement liabilities
|
(177,174
|
)
|
(5,447
|
)
|
(4,818
|
)
|
|||
|
ERP implementation expenses
|
1,000
|
|
2,028
|
|
4,869
|
|
|||
|
Deferred compensation plan income (expense)
|
3,960
|
|
4,020
|
|
(1,606
|
)
|
|||
|
Equity in net income of unconsolidated affiliates
|
—
|
|
—
|
|
294
|
|
|||
|
Other income
|
584
|
|
602
|
|
—
|
|
|||
|
Non-GAAP Adjusted EBITDA
|
$
|
(115,760
|
)
|
$
|
(113,262
|
)
|
$
|
(108,825
|
)
|
Other Operating Income
Corporate other operating income of
$177.2 million
for
the year ended June 30, 2018
represents the remeasurement of TRA liabilities driven by the 14% decrease in the U.S. federal corporate income tax rate associated with the TCJA that was enacted on December 22, 2017. See "Member-Owner TRA" below for additional information related to the Company's TRA liabilities. Corporate other operating income increased
$0.6 million
from
the year ended June 30, 2016
to
2017
, remaining relatively flat.
Operating Expenses
Corporate operating expenses increased
$8.3 million
, or
5%
, from
the year ended June 30, 2017
to
2018
, and decreased
$13.5 million
, or
8%
, from
the year ended June 30, 2016
to
2017
.
Corporate selling, general and administrative expenses increased
$9.1 million
, or
6%
, from
the year ended June 30, 2017
to
2018
, driven by an increase in costs associated with technology services as well as increased bonus expense due to higher achievement of company-wide goals. Corporate selling, general and administrative expenses decreased
$13.5 million
, or
8%
, from
the year ended June 30, 2016
to
2017
, driven by a decrease in stock-based compensation expense due to vesting of certain IPO-related awards during the prior year, partially offset by increased salaries and benefits expenses due to staffing to support growth and the current year acquisitions.
Non-GAAP Adjusted EBITDA
Non-GAAP Adjusted EBITDA at the corporate level decreased
$2.5 million
, or
2%
, from
the year ended June 30, 2017
to
2018
and decreased
$4.4 million
, or
4%
, from
the year ended June 30, 2016
to
2017
driven primarily by increased selling, general and administrative expenses resulting from higher incremental corporate infrastructure costs due to growth and acquisitions.
Off-Balance Sheet Arrangements
As of
June 30, 2018
, we did not have any off-balance sheet arrangements.
72
Liquidity and Capital Resources
Our principal source of cash has historically been cash provided by operating activities. From time to time we have used, and expect to use in the future, borrowings under our Credit Facility as a source of liquidity. Our primary cash requirements involve operating expenses, working capital fluctuations, capital expenditures, discretionary cash settlement of Class B common unit exchanges under the Exchange Agreement, repurchases of Class A common stock pursuant to a stock repurchase program, acquisitions and related business investments, and other general corporate activities. Our capital expenditures typically consist of internally-developed software costs, software purchases and computer hardware purchases.
As of
June 30, 2018 and 2017
, we had cash and cash equivalents totaling
$152.4 million
and
$156.7 million
, respectively. As of
June 30, 2018
, there were
$100.0 million
outstanding borrowings under the Credit Facility. During
the year ended June 30, 2018
, the Company utilized borrowings of
$30.0 million
under the Credit Facility to partially fund the
$200.0 million
authorized share repurchase program and other general corporate activities. During
the year ended June 30, 2018
, the Company also repaid
$150.0 million
of borrowings under the Credit Facility.
We expect cash generated from operations and borrowings under our Credit Facility to provide us with adequate liquidity to fund our anticipated working capital requirements, revenue share obligations, tax payments, capital expenditures, discretionary cash settlement of Class B common unit exchanges under the Exchange Agreement, and repurchases of Class A common stock pursuant to our stock repurchase program. Our capital requirements depend on numerous factors, including funding requirements for our product and service development and commercialization efforts, our information technology requirements and the amount of cash generated by our operations. We currently believe that we have adequate capital resources at our disposal to fund currently anticipated capital expenditures, business growth and expansion and current and projected debt service requirements. However, strategic growth initiatives will likely require the use of one or a combination of various forms of capital resources including available cash on hand, cash generated from operations, borrowings under our Credit Facility and other long-term debt and, potentially, proceeds from the issuance of additional equity or debt securities.
Discussion of cash flows for
the Years ended June 30, 2018 and 2017
A summary of net cash flows follows (in thousands):
|
Year Ended June 30,
|
||||||
|
2018
|
2017
|
|||||
|
Net cash provided by (used in):
|
||||||
|
Operating activities
|
$
|
507,706
|
|
$
|
392,247
|
|
|
Investing activities
|
(92,680
|
)
|
(465,053
|
)
|
||
|
Financing activities
|
(419,375
|
)
|
(19,276
|
)
|
||
|
Net decrease in cash and cash equivalents
|
$
|
(4,349
|
)
|
$
|
(92,082
|
)
|
Net cash provided by operating activities increased
$115.5 million
from
the year ended June 30, 2017
to
2018
primarily driven by an increase in net administrative fees as well as decreased working capital needs, partially offset by increased selling, general and administrative expenses in the current year.
Net cash used in investing activities decreased
$372.4 million
from
the year ended June 30, 2017
to
2018
driven by a $382.6 million reduction in cash outflows for business acquisitions compared to the prior year and a $65.7 million reduction in cash outflows for purchases of investments in unconsolidated affiliates compared to the prior year, partially offset by a $48.0 million reduction in cash inflows related to the proceeds from the sale of marketable securities compared to the prior year.
Net cash used in financing activities increased
$400.1 million
from
the year ended June 30, 2017
to
2018
driven by $340.0 million decrease in borrowings, net of payments, under the Credit Facility compared to the prior year and a $200.1 million increase in cash outflows used to repurchase Class A common stock under our 2018 stock repurchase program in the current year, partially offset by $123.3 million of cash outflows used to settle a portion of the exchange of Class B units by member owners in the prior year.
73
Discussion of Non-GAAP Free Cash Flow for
the Years ended June 30, 2018 and 2017
We define Non-GAAP Free Cash Flow as net cash provided by operating activities less distributions and TRA payments to limited partners and purchases of property and equipment. Free cash flow does not represent discretionary cash available for spending as it excludes certain contractual obligations such as debt repayments. A summary of Non-GAAP Free Cash Flow and reconciliation to net cash provided by operating activities for the periods presented follows (in thousands):
|
Year Ended June 30,
|
||||||
|
2018
|
2017
|
|||||
|
Net cash provided by operating activities
|
$
|
507,706
|
|
$
|
392,247
|
|
|
Purchases of property and equipment
|
(92,680
|
)
|
(71,372
|
)
|
||
|
Distributions to limited partners of Premier LP
|
(79,255
|
)
|
(90,434
|
)
|
||
|
Payments to limited partners of Premier LP related to tax receivable agreements
(a)
|
—
|
|
(13,959
|
)
|
||
|
Non-GAAP Free Cash Flow
|
$
|
335,771
|
|
$
|
216,482
|
|
|
(a)
|
The timing of TRA payments has shifted to July due to the change in our federal tax filing deadline, which has been extended one month to April. Although we did not make a TRA payment in fiscal 2018, we did make a
$17.9 million
TRA payment to limited partners in July of fiscal 2019.
|
Non-GAAP Free Cash Flow increased
$119.3 million
from
the year ended June 30, 2017
to
2018
primarily driven by an increase in net administrative fees as well as decreased working capital needs, partially offset by increased selling, general and administrative expenses in the current year. See “Our Use of Non-GAAP Financial Measures” above for additional information regarding our use of Non-GAAP Free Cash Flow.
The Company anticipates that its Non-GAAP Free Cash Flow will benefit as a result of the decrease in the U.S. federal corporate income tax rate associated with the TCJA as distributions to limited partners of Premier LP and payments to limited partners of Premier LP related to tax receivable agreements are expected to decrease in future periods as a result of the decreased federal corporate income tax rate.
Contractual Obligations
At
June 30, 2018
, we had commitments for obligations under notes payable, our noncancelable office space lease agreements and estimated payments due to limited partners under TRAs. Future payments for such commitments as of
June 30, 2018
were as follows (in thousands):
|
Payments Due by Period
|
|||||||||||||||
|
Contractual Obligations
|
Total
|
Less Than 1 Year
|
1-3 Years
|
3-5 Years
|
Greater Than 5 Years
|
||||||||||
|
Tax receivable agreement liabilities
(a)
|
$
|
255,101
|
|
$
|
17,925
|
|
$
|
33,542
|
|
$
|
31,085
|
|
$
|
172,549
|
|
|
Operating lease obligations
(b)
|
87,434
|
|
12,158
|
|
21,999
|
|
21,941
|
|
31,336
|
|
|||||
|
Notes payable
(c)
|
7,212
|
|
250
|
|
5,602
|
|
1,360
|
|
—
|
|
|||||
|
Total contractual obligations
|
$
|
349,747
|
|
$
|
30,333
|
|
$
|
61,143
|
|
$
|
54,386
|
|
$
|
203,885
|
|
|
(a)
|
Estimated payments due to limited partners under TRAs are based on 85% of the estimated amount of tax savings we expect to receive, generally over a 15-year period.
|
|
(b)
|
Future contractual obligations for leases represent future minimum payments under noncancelable operating leases primarily for office space.
|
|
(c)
|
Notes payable are generally non-interest bearings and represent an aggregate principal amount of
$7.2 million
owed to departed member owners, payable over five years from the respective departure dates.
|
74
2014 Credit Facility
Premier LP, along with its consolidated subsidiaries, PSCI and PHSI, as Co-Borrowers, Premier GP and certain domestic subsidiaries of Premier GP, as guarantors, entered into an unsecured Credit Facility, dated as of June 24, 2014, and amended on June 4, 2015. The Credit Facility has a maturity date of June 24, 2019. The Credit Facility provides for borrowings of up to
$750.0 million
with (i) a
$25.0 million
sub-facility for standby letters of credit and (ii) a
$75.0 million
sub-facility for swingline loans. The Credit Facility may be increased from time to time at the Company's request up to an aggregate additional amount of
$250.0 million
, subject to lender approval. The Credit Facility includes an unconditional and irrevocable guaranty of all obligations under the Credit Facility by Premier GP, certain domestic subsidiaries of Premier GP and future guarantors, if any. Premier, Inc. is not a guarantor under the Credit Facility.
At the Company's option, committed loans may be in the form of Eurodollar rate loans ("Eurodollar Loans") or base rate loans ("Base Rate Loans"). Eurodollar Loans bear interest at the Eurodollar rate (defined as the London Interbank Offered Rate, or LIBOR, plus the Applicable Rate (defined as a margin based on the Consolidated Total Leverage Ratio (as defined in the Credit Facility))). Base Rate Loans bear interest at the
Base Rate
(defined as the highest of the
prime rate
announced by the administrative agent, the
federal funds effective rate
plus
0.50%
or the
one-month LIBOR
plus
1.0%
) plus the Applicable Rate. The Applicable Rate ranges from
1.125%
to
1.750%
for Eurodollar Loans and
0.125%
to
0.750%
for Base Rate Loans. At
June 30, 2018
, the interest rate for
three-month Eurodollar
Loans was
3.461%
and the interest rate for Base Rate Loans was
5.125%
. The Co-Borrowers are required to pay a commitment fee ranging from
0.125%
to
0.250%
per annum on the actual daily unused amount of commitments under the Credit Facility. At
June 30, 2018
, the commitment fee was
0.125%
.
The Credit Facility contains customary representations and warranties as well as customary affirmative and negative covenants, including, among others, limitations on liens, indebtedness, fundamental changes, dispositions, restricted payments and investments of which certain covenant calculations use EBITDA, a Non-GAAP financial measure. Under the terms of the Credit Facility, Premier GP is not permitted to allow its consolidated total leverage ratio (as defined in the Credit Facility) to exceed
3.00
to
1.00
for any period of
four
consecutive quarters. In addition, Premier GP must maintain a minimum consolidated interest coverage ratio (as defined in the Credit Facility) of
3.00
to
1.00
at the end of every fiscal quarter. Premier GP was in compliance with all such covenants at
June 30, 2018
.
The Credit Facility also contains customary events of default including, among others, payment defaults, breaches of representations and warranties, covenant defaults, cross-defaults of any indebtedness or guarantees in excess of
$30.0 million
, bankruptcy and other insolvency events, judgment defaults in excess of
$30.0 million
, and the occurrence of a change of control (as defined in the Credit Facility). If any event of default occurs and is continuing, the administrative agent under the Credit Facility may, with the consent, or shall, at the request, of the required lenders, terminate the commitments and declare all of the amounts owed under the Credit Facility to be immediately due and payable. The Company may prepay amounts outstanding under the Credit Facility without premium or penalty provided that Co-Borrowers compensate the lenders for losses and expenses incurred as a result of the prepayment of any Eurodollar Loan, as defined in the Credit Facility.
Proceeds from borrowings under the Credit Facility may generally be used to finance ongoing working capital requirements, including permitted acquisitions, discretionary cash settlements of Class B unit exchanges under the Exchange Agreement, repurchases of Class A common stock pursuant to stock repurchase programs and other general corporate activities. During
the year ended June 30, 2018
, the Company utilized borrowings of
$30.0 million
under the Credit Facility, to partially fund the
$200.0 million
authorized share repurchase program and other general corporate activities. During
the year ended June 30, 2018
, the Company repaid
$150.0 million
of borrowings under the Credit Facility.
Interest expense incurred during
the year ended June 30, 2018
was
$6.6 million
and cash paid for interest during
the year ended June 30, 2018
was
$5.9 million
.
As stated above, the Credit Facility has a maturity date of June 24, 2019. We expect to commence negotiations to refinance or replace our Credit Facility during the first half of fiscal 2019. However, any refinanced or replacement credit facility may not be available on terms favorable to us, or at all. See "Cautionary Note Regarding Forward-Looking Statements" and “Risk Factors-Our indebtedness could adversely affect our business and our liquidity position” for further information.
Member-Owner TRA
The Company entered into TRAs with each of our member owners. Pursuant to the TRAs, we will pay member owners
85%
of the tax savings, if any, in U.S. federal, foreign, state and local income and franchise tax that we actually realize (or are deemed to realize, in the case of payments required to be made upon certain occurrences under such TRAs) in connection with the Section 754 election. The election results in adjustments to the tax basis of the assets of Premier LP upon member owner exchanges of Class B common units of Premier LP for Class A common stock of Premier, Inc., cash or a combination of both. Tax savings are
75
generated as a result of the increases in tax basis resulting from the initial sale of Class B common units, subsequent exchanges (pursuant to the Exchange Agreement) and payments under the TRA.
The Company had TRA liabilities of
$255.1 million
and
$339.7 million
as of
June 30, 2018 and 2017
, respectively. TRA liabilities decreased
$84.6 million
primarily driven by a
$177.2 million
decrease in valuation as a result of the decrease in the U.S. federal corporate income tax rates pursuant to the TCJA. The decrease is partially offset by a
$71.9 million
increase in the TRA liabilities in connection with the quarterly member owner exchanges that occurred during
the year ended June 30, 2018
as well as
$20.9 million
associated with the revaluation and remeasurement of the TRA liabilities due to the change in the allocation and realization of future anticipated payments.
Certain Contractual Arrangements with Our Member Owners
We have entered into several agreements to define and regulate the governance and control relationships among us, Premier LP and the member owners.
Note 1 - Organization and Basis of Presentation
to our audited consolidated financial statements contained herein provides a summary of the material provisions of these agreements. These summaries do not purport to be complete, and they are subject to, and qualified in their entirety by reference to, the complete text of the agreements which are filed as exhibits to this Annual Report. These agreements should be carefully read before making any investment decisions regarding our securities.
Stock Repurchase Program
On October 31, 2017, we announced that our Board of Directors authorized the repurchase of up to
$200.0 million
of our outstanding Class A common stock as part of a balanced capital deployment strategy. We completed the 2018 stock repurchase program during fiscal year 2018 and purchased approximately
6.4 million
shares of Class A common stock at an average price of
$31.16
per share for a total purchase price of
$200.0 million
.
On May 7, 2018, we announced that our Board of Directors approved the repurchase of up to
$250.0 million
of our Class A common stock during fiscal year 2019 as a continuation of our balanced capital deployment strategy. Subject to certain terms and conditions, repurchases may be made from time to time through open market purchases or privately negotiated transactions at our discretion, and in accordance with applicable federal securities laws. We initiated this repurchase program on July 1, 2019. However, there can be no assurance as to the timing or number of shares of Class A common stock, purchased under the program and statements regarding such matters are "forward-looking statements" within the meaning of the Private Securities Litigation Reform Act of 1995. The repurchase authorization may be suspended, delayed or discontinued at any time at the discretion of the Board of Directors. See "Cautionary Note Regarding Forward-Looking Statements."
Costs Associated with Exit or Disposal Activities
In February 2018, as part of our ongoing integration synergies and efforts to realign resources for future growth areas, we implemented certain personnel adjustments, including a workforce reduction. These personnel adjustments impacted approximately 75 positions (approximately 65 of which were related to the workforce reduction), or approximately 3% of total employees. The workforce reduction resulted in pre-tax cash restructuring charges, primarily relating to severance and transition assistance, of approximately
$5.1 million
in
the year ended June 30, 2018
. The majority of employees impacted by these personnel adjustments were from our Performance Services segment.
Interest Rate Risk.
Our exposure to market risk related primarily to the increase or decrease in the amount of any interest expense we must pay with respect to outstanding debt instruments. At
June 30, 2018
, we had
$100.0 million
of outstanding borrowings under the Credit Facility. Committed loans may be in the form of Eurodollar Rate Loans or Base Rate Loans (as defined in the Credit Facility) at our option. Eurodollar Rate Loans bear interest at the Eurodollar Rate (defined as the London Interbank Offer Rate, or LIBOR) plus the Applicable Rate (defined as a margin based on the Consolidated Total Leverage Ratio (as defined in the Credit Facility)). Base Rate Loans bear interest at the Base Rate (defined as the highest of the prime rate announced by the administrative agent, the federal funds effective rate plus 0.50% or the one-month LIBOR plus 1.0%) plus the Applicable Rate. The Applicable Rate ranges from 1.125% to 1.75% for Eurodollar Rate Loans and 0.125% to 0.75% for Base Rate Loans. At
June 30, 2018
, the interest rate for three-month Eurodollar Rate Loans was
3.461%
and the interest rate for Base Rate Loans was
5.125%
. Assuming outstanding balances and the Applicable Rate were to remain the same, a 1% increase or decrease in interest rates would result in an incremental negative or positive cash flow, respectively, of approximately
$1.0 million
over the next 12 months.
We invested our excess cash in a portfolio of individual cash equivalents. We do not currently hold, and we have never held, any derivative financial instruments. We do not expect changes in interest rates to have a material impact on our results of operations
76
or financial position. We plan to ensure the safety and preservation of our invested funds by limiting default, market and investment risks. We plan to mitigate default risk by investing in low-risk securities.
Foreign Currency Risk.
Substantially all of our financial transactions are conducted in U.S. dollars. We do not have significant foreign operations and, accordingly, do not have market risk associated with foreign currencies.
Our consolidated financial statements and related notes are filed together with this Annual Report. See the index to financial statements under Item 15(a) on page 130 for a list of financial statements filed with this report, and under this item.
77
INDEX TO CONSOLIDATED FINANCIAL STATEMENTS
78
Report of Independent Registered Public Accounting Firm
The Board of Directors and Stockholders of Premier, Inc.
Opinion on the Financial Statements
We have audited the accompanying consolidated balance sheets of Premier, Inc. (“the Company”) as of June 30, 2018 and 2017, and the related consolidated statements of income, comprehensive income, stockholders’ deficit, and cash flows for each of the three years in the period ended June 30, 2018. Our audits also included the financial statement schedule listed in the Index at Item 15(a)(2). In our opinion, the consolidated financial statements present fairly, in all material respects, the financial position of the Company at June 30, 2018 and 2017, and the results of its operations and its cash flows for each of the three years in the period ended June 30, 2018, in conformity with U.S. generally accepted accounting principles. Also, in our opinion, the related financial statement schedule, when considered in relation to the basic financial statements taken as a whole, presents fairly in all material respects the information set forth therein.
We also have audited, in accordance with the standards of the Public Company Accounting Oversight Board (United States) (PCAOB), the Company’s internal control over financial reporting as of June 30, 2018, based on criteria established in Internal Control-Integrated Framework issued by the Committee of Sponsoring Organizations of the Treadway Commission (2013 framework) and our report dated August 22, 2018 expressed an unqualified opinion thereon.
Basis for Opinion
These financial statements are the responsibility of the Company’s management. Our responsibility is to express an opinion on the Company’s financial statements based on our audits. We are a public accounting firm registered with the PCAOB and are required to be independent with respect to the Company in accordance with the U.S. federal securities laws and the applicable rules and regulations of the Securities and Exchange Commission and the PCAOB.
We conducted our audits in accordance with the standards of the PCAOB. Those standards require that we plan and perform the audit to obtain reasonable assurance about whether the financial statements are free of material misstatement, whether due to error or fraud. Our audits included performing procedures to assess the risks of material misstatement of the financial statements, whether due to error or fraud, and performing procedures that respond to those risks. Such procedures included examining, on a test basis, evidence regarding the amounts and disclosures in the financial statements. Our audits also included evaluating the accounting principles used and significant estimates made by management, as well as evaluating the overall presentation of the financial statements. We believe that our audits provide a reasonable basis for our opinion.
/s/ Ernst & Young LLP
We have served as the Company’s auditor since 1991.
Charlotte, North Carolina
August 22, 2018
79
Report of Independent Registered Public Accounting Firm
The Board of Directors and Stockholders of Premier, Inc.
Opinion on Internal Control over Financial Reporting
We have audited Premier, Inc.’s internal control over financial reporting as of June 30, 2018, based on criteria established in Internal Control-Integrated Framework issued by the Committee of Sponsoring Organizations of the Treadway Commission (2013 framework) (the COSO criteria). In our opinion, Premier, Inc. (the Company) maintained, in all material respects, effective internal control over financial reporting as of June 30, 2018, based on the COSO criteria.
We also have audited, in accordance with the standards of the Public Company Accounting Oversight Board (United States) (PCAOB), the June 30, 2018 consolidated financial statements of the Company and our report dated August 22, 2018 expressed an unqualified opinion thereon.
Basis for Opinion
The Company’s management is responsible for maintaining effective internal control over financial reporting and for its assessment of the effectiveness of internal control over financial reporting included in the accompanying Management’s Report on Internal Control Over Financial Reporting. Our responsibility is to express an opinion on the Company’s internal control over financial reporting based on our audit. We are a public accounting firm registered with the PCAOB and are required to be independent with respect to the Company in accordance with the U.S. federal securities laws
and the applicable rules and regulations of the Securities and Exchange Commission and the PCAOB.
We conducted our audit in accordance with the standards of the PCAOB. Those standards require that we plan and perform the audit to obtain reasonable assurance about whether effective internal control over financial reporting was maintained in all material respects.
Our audit included obtaining an understanding of internal control over financial reporting, assessing the risk that a material weakness exists, testing and evaluating the design and operating effectiveness of internal control based on the assessed risk, and performing such other procedures as we considered necessary in the circumstances. We believe that our audit provides a reasonable basis for our opinion.
Definition and Limitations of Internal Control Over Financial Reporting
A company’s internal control over financial reporting is a process designed to provide reasonable assurance regarding the reliability of financial reporting and the preparation of financial statements for external purposes in accordance with generally accepted accounting principles. A company’s internal control over financial reporting includes those policies and procedures that (1) pertain to the maintenance of records that, in reasonable detail, accurately and fairly reflect the transactions and dispositions of the assets of the company; (2) provide reasonable assurance that transactions are recorded as necessary to permit preparation of financial statements in accordance with generally accepted accounting principles, and that receipts and expenditures of the company are being made only in accordance with authorizations of management and directors of the company; and (3) provide reasonable assurance regarding prevention or timely detection of unauthorized acquisition, use, or disposition of the company’s assets that could have a material effect on the financial statements.
Because of its inherent limitations, internal control over financial reporting may not prevent or detect misstatements. Also, projections of any evaluation of effectiveness to future periods are subject to the risk that controls may become inadequate because of changes in conditions, or that the degree of compliance with the policies or procedures may deteriorate.
/s/ Ernst & Young LLP
Charlotte, North Carolina
August 22, 2018
80
PREMIER, INC.
(In thousands, except share data)
|
June 30, 2018
|
June 30, 2017
|
|||||
|
Assets
|
||||||
|
Cash and cash equivalents
|
$
|
152,386
|
|
$
|
156,735
|
|
|
Accounts receivable (net of $1,841 and $1,812 allowance for doubtful accounts, respectively)
|
185,874
|
|
159,745
|
|
||
|
Inventory
|
66,139
|
|
50,426
|
|
||
|
Prepaid expenses and other current assets
|
23,325
|
|
35,164
|
|
||
|
Due from related parties
|
894
|
|
6,742
|
|
||
|
Total current assets
|
428,618
|
|
408,812
|
|
||
|
Property and equipment (net of $297,591 and $236,460 accumulated depreciation, respectively)
|
206,693
|
|
187,365
|
|
||
|
Intangible assets (net of $153,635 and $99,198 accumulated amortization, respectively)
|
322,115
|
|
377,962
|
|
||
|
Goodwill
|
906,545
|
|
906,545
|
|
||
|
Deferred income tax assets
|
305,624
|
|
482,484
|
|
||
|
Deferred compensation plan assets
|
44,577
|
|
41,518
|
|
||
|
Investments in unconsolidated affiliates
|
94,053
|
|
92,879
|
|
||
|
Other assets
|
3,991
|
|
10,271
|
|
||
|
Total assets
|
$
|
2,312,216
|
|
$
|
2,507,836
|
|
|
Liabilities, redeemable limited partners' capital and stockholders' deficit
|
||||||
|
Accounts payable
|
$
|
60,130
|
|
$
|
42,815
|
|
|
Accrued expenses
|
64,257
|
|
55,857
|
|
||
|
Revenue share obligations
|
78,999
|
|
72,078
|
|
||
|
Limited partners' distribution payable
|
15,465
|
|
24,951
|
|
||
|
Accrued compensation and benefits
|
64,112
|
|
53,506
|
|
||
|
Deferred revenue
|
39,785
|
|
44,443
|
|
||
|
Current portion of tax receivable agreements
|
17,925
|
|
17,925
|
|
||
|
Current portion of long-term debt
|
100,250
|
|
227,993
|
|
||
|
Other liabilities
|
7,959
|
|
32,019
|
|
||
|
Total current liabilities
|
448,882
|
|
571,587
|
|
||
|
Long-term debt, less current portion
|
6,962
|
|
6,279
|
|
||
|
Tax receivable agreements, less current portion
|
237,176
|
|
321,796
|
|
||
|
Deferred compensation plan obligations
|
44,577
|
|
41,518
|
|
||
|
Deferred tax liabilities
|
17,569
|
|
48,227
|
|
||
|
Other liabilities
|
63,704
|
|
42,099
|
|
||
|
Total liabilities
|
818,870
|
|
1,031,506
|
|
||
|
|
|
|
|
|
||
81
|
June 30, 2018
|
June 30, 2017
|
|||||
|
Redeemable limited partners' capital
|
2,920,410
|
|
3,138,583
|
|
||
|
Stockholders' deficit:
|
||||||
|
Class A common stock, $0.01 par value, 500,000,000 shares authorized; 57,530,733 shares issued and 52,761,177 shares outstanding at June 30, 2018 and 51,943,281 shares issued and outstanding at June 30, 2017
|
575
|
|
519
|
|
||
|
Class B common stock, $0.000001 par value, 600,000,000 shares authorized; 80,335,701 and 87,298,888 shares issued and outstanding at June 30, 2018 and June 30, 2017, respectively
|
—
|
|
—
|
|
||
|
Treasury stock, at cost; 4,769,556 shares
|
(150,058
|
)
|
—
|
|
||
|
Additional paid-in-capital
|
—
|
|
—
|
|
||
|
Accumulated deficit
|
(1,277,581
|
)
|
(1,662,772
|
)
|
||
|
Accumulated other comprehensive income (loss)
|
—
|
|
—
|
|
||
|
Total stockholders' deficit
|
(1,427,064
|
)
|
(1,662,253
|
)
|
||
|
Total liabilities, redeemable limited partners' capital and stockholders' deficit
|
$
|
2,312,216
|
|
$
|
2,507,836
|
|
See accompanying notes to the consolidated financial statements.
82
PREMIER, INC.
(In thousands, except per share data)
|
Year Ended June 30,
|
|||||||||
|
2018
|
2017
|
2016
|
|||||||
|
Net revenue:
|
|||||||||
|
Net administrative fees
|
$
|
643,839
|
|
$
|
557,468
|
|
$
|
498,394
|
|
|
Other services and support
|
372,133
|
|
363,087
|
|
337,554
|
|
|||
|
Services
|
1,015,972
|
|
920,555
|
|
835,948
|
|
|||
|
Products
|
645,284
|
|
534,118
|
|
326,646
|
|
|||
|
Net revenue
|
1,661,256
|
|
1,454,673
|
|
1,162,594
|
|
|||
|
Cost of revenue:
|
|||||||||
|
Services
|
187,399
|
|
182,775
|
|
163,240
|
|
|||
|
Products
|
610,892
|
|
497,273
|
|
293,816
|
|
|||
|
Cost of revenue
|
798,291
|
|
680,048
|
|
457,056
|
|
|||
|
Gross profit
|
862,965
|
|
774,625
|
|
705,538
|
|
|||
|
Other operating income:
|
|||||||||
|
Remeasurement of tax receivable agreement liabilities
|
177,174
|
|
5,447
|
|
4,818
|
|
|||
|
Other operating income
|
177,174
|
|
5,447
|
|
4,818
|
|
|||
|
Operating expenses:
|
|||||||||
|
Selling, general and administrative
|
443,639
|
|
410,918
|
|
408,429
|
|
|||
|
Research and development
|
1,423
|
|
3,107
|
|
2,925
|
|
|||
|
Amortization of purchased intangible assets
|
55,447
|
|
48,327
|
|
33,054
|
|
|||
|
Operating expenses
|
500,509
|
|
462,352
|
|
444,408
|
|
|||
|
Operating income
|
539,630
|
|
317,720
|
|
265,948
|
|
|||
|
Remeasurement gain attributable to acquisition of Innovatix, LLC
|
—
|
|
205,146
|
|
—
|
|
|||
|
Equity in net income of unconsolidated affiliates
|
1,174
|
|
14,745
|
|
21,647
|
|
|||
|
Interest and investment income (loss), net
|
(5,300
|
)
|
(4,512
|
)
|
(1,021
|
)
|
|||
|
Loss on disposal of long-lived assets
|
(2,376
|
)
|
(2,422
|
)
|
—
|
|
|||
|
Other income (expense)
|
(16,324
|
)
|
614
|
|
(1,692
|
)
|
|||
|
Other income (expense), net
|
(22,826
|
)
|
213,571
|
|
18,934
|
|
|||
|
Income before income taxes
|
516,804
|
|
531,291
|
|
284,882
|
|
|||
|
Income tax expense
|
259,234
|
|
81,814
|
|
49,721
|
|
|||
|
Net income
|
257,570
|
|
449,477
|
|
235,161
|
|
|||
|
Net income attributable to non-controlling interest in Premier LP
|
(224,269
|
)
|
(336,052
|
)
|
(193,547
|
)
|
|||
|
Adjustment of redeemable limited partners' capital to redemption amount
|
157,581
|
|
(37,176
|
)
|
776,750
|
|
|||
|
Net income attributable to stockholders
|
$
|
190,882
|
|
$
|
76,249
|
|
$
|
818,364
|
|
|
Weighted average shares outstanding:
|
|||||||||
|
Basic
|
53,518
|
|
49,654
|
|
42,368
|
|
|||
|
Diluted
|
137,340
|
|
50,374
|
|
145,308
|
|
|||
|
Earnings per share attributable to stockholders:
|
|||||||||
|
Basic
|
$
|
3.57
|
|
$
|
1.54
|
|
$
|
19.32
|
|
|
Diluted
|
$
|
1.36
|
|
$
|
1.51
|
|
$
|
0.97
|
|
See accompanying notes to the consolidated financial statements.
83
PREMIER, INC.
Consolidated Statements of Comprehensive Income
(In thousands)
|
Year Ended June 30,
|
|||||||||
|
2018
|
2017
|
2016
|
|||||||
|
Net income
|
$
|
257,570
|
|
$
|
449,477
|
|
$
|
235,161
|
|
|
Net unrealized gain (loss) on marketable securities
|
—
|
|
128
|
|
(110
|
)
|
|||
|
Total comprehensive income
|
257,570
|
|
449,605
|
|
235,051
|
|
|||
|
Less: comprehensive income attributable to non-controlling interest
|
(224,269
|
)
|
(336,137
|
)
|
(193,470
|
)
|
|||
|
Comprehensive income attributable to stockholders
|
$
|
33,301
|
|
$
|
113,468
|
|
$
|
41,581
|
|
See accompanying notes to the consolidated financial statements.
84
PREMIER, INC.
Consolidated Statements of Stockholders' Deficit
(In thousands)
|
|
Class A
Common Stock
|
Class B
Common Stock
|
Treasury Stock
|
Additional Paid-In Capital
|
Accumulated Deficit
|
Accumulated Other Comprehensive Income (Loss)
|
Total Stockholders' Deficit
|
||||||||||||||||||||
|
|
Shares
|
Amount
|
Shares
|
Amount
|
Shares
|
Amount
|
|||||||||||||||||||||
|
Balance at June 30, 2015
|
37,669
|
|
$
|
377
|
|
106,383
|
|
$
|
—
|
|
—
|
|
$
|
—
|
|
$
|
—
|
|
$
|
(3,118,474
|
)
|
$
|
(5
|
)
|
$
|
(3,118,102
|
)
|
|
Redemption of limited partners
|
—
|
|
—
|
|
(2,527
|
)
|
—
|
|
—
|
|
—
|
|
—
|
|
—
|
|
—
|
|
—
|
|
|||||||
|
Exchange of Class B common units for Class A common stock by member owners
|
7,723
|
|
77
|
|
(7,723
|
)
|
—
|
|
—
|
|
—
|
|
267,604
|
|
—
|
|
—
|
|
267,681
|
|
|||||||
|
Increase in additional paid-in capital related to quarterly exchange by member owners and departure of member owners
|
—
|
|
—
|
|
—
|
|
—
|
|
—
|
|
—
|
|
35,431
|
|
—
|
|
—
|
|
35,431
|
|
|||||||
|
Issuance of Class A common stock under equity incentive plan
|
523
|
|
5
|
|
—
|
|
—
|
|
—
|
|
—
|
|
3,552
|
|
—
|
|
—
|
|
3,557
|
|
|||||||
|
Issuance of Class A common stock under employee stock purchase plan
|
81
|
|
1
|
|
—
|
|
—
|
|
—
|
|
—
|
|
2,728
|
|
—
|
|
—
|
|
2,729
|
|
|||||||
|
Stock-based compensation expense
|
—
|
|
—
|
|
—
|
|
—
|
|
—
|
|
—
|
|
48,670
|
|
—
|
|
—
|
|
48,670
|
|
|||||||
|
Repurchase of vested restricted units for employee tax-withholding
|
—
|
|
—
|
|
—
|
|
—
|
|
—
|
|
—
|
|
(7,863
|
)
|
—
|
|
—
|
|
(7,863
|
)
|
|||||||
|
Net income
|
—
|
|
—
|
|
—
|
|
—
|
|
—
|
|
—
|
|
—
|
|
235,161
|
|
—
|
|
235,161
|
|
|||||||
|
Net income attributable to non-controlling interest in Premier LP
|
—
|
|
—
|
|
—
|
|
—
|
|
—
|
|
—
|
|
—
|
|
(193,547
|
)
|
—
|
|
(193,547
|
)
|
|||||||
|
Net unrealized loss on marketable securities
|
—
|
|
—
|
|
—
|
|
—
|
|
—
|
|
—
|
|
—
|
|
—
|
|
(38
|
)
|
(38
|
)
|
|||||||
|
Final remittance of net income attributable to S2S Global before February 1, 2015
|
—
|
|
—
|
|
—
|
|
—
|
|
—
|
|
—
|
|
—
|
|
(1,890
|
)
|
—
|
|
(1,890
|
)
|
|||||||
|
Adjustment to redeemable limited partners' capital to redemption amount
|
—
|
|
—
|
|
—
|
|
—
|
|
—
|
|
—
|
|
(350,122
|
)
|
1,126,872
|
|
—
|
|
776,750
|
|
|||||||
|
Balance at June 30, 2016
|
45,996
|
|
$
|
460
|
|
96,133
|
|
$
|
—
|
|
—
|
|
$
|
—
|
|
$
|
—
|
|
$
|
(1,951,878
|
)
|
$
|
(43
|
)
|
$
|
(1,951,461
|
)
|
|
Exchange of Class B units for Class A common stock by member owners
|
4,851
|
|
48
|
|
(4,851
|
)
|
—
|
|
—
|
|
—
|
|
157,323
|
|
—
|
|
—
|
|
157,371
|
|
|||||||
|
Exchange of Class B units for cash by member owners
|
—
|
|
—
|
|
(3,810
|
)
|
—
|
|
—
|
|
—
|
|
—
|
|
—
|
|
—
|
|
—
|
|
|||||||
|
Redemption of limited partners
|
—
|
|
—
|
|
(173
|
)
|
—
|
|
—
|
|
—
|
|
—
|
|
—
|
|
—
|
|
—
|
|
|||||||
|
Increase in additional paid-in capital related to quarterly exchange by member owners
|
—
|
|
—
|
|
—
|
|
—
|
|
—
|
|
—
|
|
35,141
|
|
—
|
|
—
|
|
35,141
|
|
|||||||
|
Issuance of Class A common stock under equity incentive plan
|
1,021
|
|
10
|
|
—
|
|
—
|
|
—
|
|
—
|
|
9,158
|
|
—
|
|
—
|
|
9,168
|
|
|||||||
|
Issuance of Class A common stock under employee stock purchase plan
|
75
|
|
1
|
|
—
|
|
—
|
|
—
|
|
—
|
|
2,482
|
|
—
|
|
—
|
|
2,483
|
|
|||||||
85
|
|
Class A
Common Stock
|
Class B
Common Stock
|
Treasury Stock
|
Additional Paid-In Capital
|
Accumulated Deficit
|
Accumulated Other Comprehensive Income (Loss)
|
Total Stockholders' Deficit
|
||||||||||||||||||||
|
|
Shares
|
Amount
|
Shares
|
Amount
|
Shares
|
Amount
|
|||||||||||||||||||||
|
Stock-based compensation expense
|
—
|
|
—
|
|
—
|
|
—
|
|
—
|
|
—
|
|
26,470
|
|
—
|
|
—
|
|
26,470
|
|
|||||||
|
Repurchase of vested restricted units for employee tax-withholding
|
—
|
|
—
|
|
—
|
|
—
|
|
—
|
|
—
|
|
(17,717
|
)
|
—
|
|
—
|
|
(17,717
|
)
|
|||||||
|
Net income
|
—
|
|
—
|
|
—
|
|
—
|
|
—
|
|
—
|
|
—
|
|
449,477
|
|
—
|
|
449,477
|
|
|||||||
|
Net income attributable to non-controlling interest in Premier LP
|
—
|
|
—
|
|
—
|
|
—
|
|
—
|
|
—
|
|
—
|
|
(336,052
|
)
|
—
|
|
(336,052
|
)
|
|||||||
|
Net realized loss on marketable securities
|
—
|
|
—
|
|
—
|
|
—
|
|
—
|
|
—
|
|
—
|
|
—
|
|
43
|
|
43
|
|
|||||||
|
Adjustment of redeemable limited partners' capital to redemption amount
|
—
|
|
—
|
|
—
|
|
—
|
|
—
|
|
—
|
|
(212,857
|
)
|
175,681
|
|
—
|
|
(37,176
|
)
|
|||||||
|
Balance at June 30, 2017
|
51,943
|
|
$
|
519
|
|
87,299
|
|
$
|
—
|
|
—
|
|
$
|
—
|
|
$
|
—
|
|
$
|
(1,662,772
|
)
|
$
|
—
|
|
$
|
(1,662,253
|
)
|
|
Exchange of Class B units for Class A common stock by member owners
|
6,531
|
|
49
|
|
(6,531
|
)
|
—
|
|
(1,649
|
)
|
50,071
|
|
166,001
|
|
—
|
|
—
|
|
216,121
|
|
|||||||
|
Redemption of limited partners
|
—
|
|
—
|
|
(432
|
)
|
—
|
|
—
|
|
—
|
|
—
|
|
—
|
|
—
|
|
—
|
|
|||||||
|
Decrease in additional paid-in capital related to quarterly exchange by member owners, including associated TRA revaluation
|
—
|
|
—
|
|
—
|
|
—
|
|
—
|
|
—
|
|
(5,766
|
)
|
—
|
|
—
|
|
(5,766
|
)
|
|||||||
|
Issuance of Class A common stock under equity incentive plan
|
623
|
|
6
|
|
—
|
|
—
|
|
—
|
|
—
|
|
8,013
|
|
—
|
|
—
|
|
8,019
|
|
|||||||
|
Issuance of Class A common stock under employee stock purchase plan
|
82
|
|
1
|
|
—
|
|
—
|
|
—
|
|
—
|
|
2,618
|
|
—
|
|
—
|
|
2,619
|
|
|||||||
|
Treasury stock
|
(6,418
|
)
|
—
|
|
—
|
|
—
|
|
6,418
|
|
(200,129
|
)
|
—
|
|
—
|
|
—
|
|
(200,129
|
)
|
|||||||
|
Stock-based compensation expense
|
—
|
|
—
|
|
—
|
|
—
|
|
—
|
|
—
|
|
29,408
|
|
—
|
|
—
|
|
29,408
|
|
|||||||
|
Repurchase of vested restricted units for employee tax-withholding
|
—
|
|
—
|
|
—
|
|
—
|
|
—
|
|
—
|
|
(5,965
|
)
|
—
|
|
—
|
|
(5,965
|
)
|
|||||||
|
Net income
|
—
|
|
—
|
|
—
|
|
—
|
|
—
|
|
—
|
|
—
|
|
257,570
|
|
—
|
|
257,570
|
|
|||||||
|
Net income attributable to non-controlling interest in Premier LP
|
—
|
|
—
|
|
—
|
|
—
|
|
—
|
|
—
|
|
—
|
|
(224,269
|
)
|
—
|
|
(224,269
|
)
|
|||||||
|
Adjustment of redeemable limited partners' capital to redemption amount
|
—
|
|
—
|
|
—
|
|
—
|
|
—
|
|
—
|
|
(194,309
|
)
|
351,890
|
|
—
|
|
157,581
|
|
|||||||
|
Balance at June 30, 2018
|
52,761
|
|
$
|
575
|
|
80,336
|
|
$
|
—
|
|
4,769
|
|
$
|
(150,058
|
)
|
$
|
—
|
|
$
|
(1,277,581
|
)
|
$
|
—
|
|
$
|
(1,427,064
|
)
|
See accompanying notes to the consolidated financial statements.
86
PREMIER, INC.
(In thousands)
|
Year Ended June 30,
|
|||||||||
|
2018
|
2017
|
2016
|
|||||||
|
Operating activities
|
|||||||||
|
Net income
|
$
|
257,570
|
|
$
|
449,477
|
|
$
|
235,161
|
|
|
Adjustments to reconcile net income to net cash provided by operating activities:
|
|||||||||
|
Depreciation and amortization
|
126,759
|
|
107,211
|
|
84,156
|
|
|||
|
Equity in net income of unconsolidated affiliates
|
(1,174
|
)
|
(14,745
|
)
|
(21,647
|
)
|
|||
|
Deferred income taxes
|
232,990
|
|
60,562
|
|
25,714
|
|
|||
|
Stock-based compensation
|
29,408
|
|
26,470
|
|
48,670
|
|
|||
|
Remeasurement of tax receivable agreement liabilities
|
(177,174
|
)
|
(5,447
|
)
|
(4,818
|
)
|
|||
|
Remeasurement gain attributable to acquisition of Innovatix, LLC
|
—
|
|
(205,146
|
)
|
—
|
|
|||
|
Loss on disposal of long-lived assets
|
2,376
|
|
2,422
|
|
—
|
|
|||
|
Changes in operating assets and liabilities:
|
|||||||||
|
Accounts receivable, prepaid expenses and other current assets
|
(14,291
|
)
|
3,365
|
|
(37,250
|
)
|
|||
|
Other assets
|
(824
|
)
|
6,821
|
|
(9,638
|
)
|
|||
|
Inventories
|
(15,713
|
)
|
(16,349
|
)
|
3,937
|
|
|||
|
Accounts payable, accrued expenses and other current liabilities
|
32,767
|
|
(24,482
|
)
|
50,313
|
|
|||
|
Long-term liabilities
|
6,673
|
|
(901
|
)
|
(4,195
|
)
|
|||
|
Loss on FFF put and call rights
|
22,036
|
|
3,935
|
|
—
|
|
|||
|
Other operating activities
|
6,303
|
|
(946
|
)
|
1,067
|
|
|||
|
Net cash provided by operating activities
|
$
|
507,706
|
|
$
|
392,247
|
|
$
|
371,470
|
|
|
Investing activities
|
|||||||||
|
Purchases of property and equipment
|
$
|
(92,680
|
)
|
$
|
(71,372
|
)
|
$
|
(76,990
|
)
|
|
Purchase of marketable securities
|
—
|
|
—
|
|
(19,211
|
)
|
|||
|
Proceeds from sale of marketable securities
|
—
|
|
48,013
|
|
386,372
|
|
|||
|
Acquisition of Innovatix, LLC and Essensa Ventures, LLC, net of cash acquired
|
—
|
|
(319,717
|
)
|
—
|
|
|||
|
Acquisition of Acro Pharmaceuticals, net of cash acquired
|
—
|
|
(62,892
|
)
|
—
|
|
|||
|
Acquisition of CECity.com, Inc., net of cash acquired
|
—
|
|
—
|
|
(398,261
|
)
|
|||
|
Acquisition of Healthcare Insights, LLC, net of cash acquired
|
—
|
|
—
|
|
(64,274
|
)
|
|||
|
Acquisition of InFlowHealth, LLC
|
—
|
|
—
|
|
(6,088
|
)
|
|||
|
Investment in unconsolidated affiliates
|
—
|
|
(65,660
|
)
|
(3,250
|
)
|
|||
|
Distributions received on equity investments in unconsolidated affiliates
|
—
|
|
6,550
|
|
22,093
|
|
|||
|
Other investing activities
|
—
|
|
25
|
|
(27
|
)
|
|||
|
Net cash used in investing activities
|
$
|
(92,680
|
)
|
$
|
(465,053
|
)
|
$
|
(159,636
|
)
|
|
Financing activities
|
|||||||||
|
Payments made on notes payable
|
$
|
(8,002
|
)
|
$
|
(5,486
|
)
|
$
|
(2,143
|
)
|
|
Proceeds from credit facility
|
30,000
|
|
425,000
|
|
150,000
|
|
|||
|
Payments on credit facility
|
(150,000
|
)
|
(205,000
|
)
|
(150,000
|
)
|
|||
|
Proceeds from exercise of stock options under equity incentive plans
|
8,019
|
|
9,168
|
|
3,552
|
|
|||
|
Proceeds from issuance of Class A common stock under stock purchase plan
|
2,619
|
|
2,483
|
|
2,317
|
|
|||
|
Repurchase of vested restricted units for employee tax-withholding
|
(5,965
|
)
|
(17,717
|
)
|
(7,863
|
)
|
|||
|
Settlement of exchange of Class B units by member owners
|
—
|
|
(123,331
|
)
|
—
|
|
|||
|
Distributions to limited partners of Premier LP
|
(79,255
|
)
|
(90,434
|
)
|
(92,707
|
)
|
|||
|
Payments to limited partners of Premier LP related to tax receivable agreements
|
—
|
|
(13,959
|
)
|
(10,805
|
)
|
|||
|
Repurchase of Class A common stock (held as treasury stock)
|
(200,129
|
)
|
—
|
|
—
|
|
|||
87
|
Year Ended June 30,
|
|||||||||
|
2018
|
2017
|
2016
|
|||||||
|
Earn-out liability payment to GNYHA Holdings
|
(16,662
|
)
|
—
|
|
—
|
|
|||
|
Final remittance of net income attributable to former S2S Global minority shareholder
|
—
|
|
—
|
|
(1,890
|
)
|
|||
|
Net cash used in financing activities
|
$
|
(419,375
|
)
|
$
|
(19,276
|
)
|
$
|
(109,539
|
)
|
|
Net increase (decrease) in cash and cash equivalents
|
(4,349
|
)
|
(92,082
|
)
|
102,295
|
|
|||
|
Cash and cash equivalents at beginning of year
|
156,735
|
|
248,817
|
|
146,522
|
|
|||
|
Cash and cash equivalents at end of year
|
$
|
152,386
|
|
$
|
156,735
|
|
$
|
248,817
|
|
|
Supplemental schedule of non cash investing and financing activities:
|
|||||||||
|
Increase (decrease) in redeemable limited partners' capital for adjustment to fair value, with offsetting decrease (increase) in additional paid-in-capital and accumulated deficit
|
$
|
(157,581
|
)
|
$
|
37,176
|
|
$
|
(776,750
|
)
|
|
Reduction in redeemable limited partners' capital, with offsetting increase in common stock and additional paid-in capital related to quarterly exchange by member owners
|
$
|
216,122
|
|
$
|
157,371
|
|
$
|
267,681
|
|
|
Reduction in redeemable limited partners' capital for limited partners' distribution payable
|
$
|
15,465
|
|
$
|
24,951
|
|
$
|
22,493
|
|
|
Distributions utilized to reduce subscriptions, notes, interest and accounts receivable from member owners
|
$
|
1,972
|
|
$
|
2,049
|
|
$
|
5,407
|
|
|
Net increase in deferred tax assets related to quarterly exchanges by member owners and other adjustments
|
$
|
86,788
|
|
$
|
114,605
|
|
$
|
94,839
|
|
|
Net increase in tax receivable agreement liabilities related to quarterly exchanges by member owners and other adjustments
|
$
|
92,554
|
|
$
|
79,463
|
|
$
|
59,408
|
|
|
Net increase (decrease) in additional paid-in capital related to quarterly exchanges by member owners and other adjustments
|
$
|
(5,766
|
)
|
$
|
35,141
|
|
$
|
35,431
|
|
|
Net increase in investments in unconsolidated affiliates related to deferred taxes attributed to the net fair value of FFF enterprises, Inc. put and call rights, with offsetting increases in deferred tax assets and deferred tax liabilities
|
$
|
—
|
|
$
|
15,460
|
|
$
|
—
|
|
|
Payable to member owners incurred upon repurchase of ownership interest
|
$
|
942
|
|
$
|
416
|
|
$
|
3,556
|
|
See accompanying notes to the consolidated financial statements.
88
PREMIER, INC.
NOTES TO CONSOLIDATED FINANCIAL STATEMENTS
(1) ORGANIZATION AND BASIS OF PRESENTATION
Organization
Premier, Inc. ("Premier" or the "Company") is a publicly-held, for-profit Delaware corporation owned by hospitals, health systems and other healthcare organizations (such owners of Premier are referred to herein as "member owners") located in the United States and by public stockholders. The Company is a holding company with no material business operations of its own. The Company’s primary asset is a controlling equity interest in Premier Services, LLC, a Delaware limited liability company ("Premier GP"). Premier GP is the sole general partner of Premier Healthcare Alliance, L.P. ("Premier LP"), a California limited partnership. The Company conducts substantially all of its business operations through Premier LP and its other consolidated subsidiaries. The Company, together with its subsidiaries and affiliates, is a leading healthcare performance improvement company that unites hospitals, health systems, physicians and other healthcare providers to improve and innovate in the clinical, financial and operational areas of their businesses to meet the demands of a rapidly evolving healthcare industry.
The Company's business model and solutions are designed to provide its members access to scale efficiencies, spread the cost of their development, provide actionable intelligence derived from anonymized data in the Company's data warehouse, mitigate the risk of innovation and disseminate best practices to help the Company's member organizations succeed in their transformation to higher quality and more cost-effective healthcare.
The Company, together with its subsidiaries and affiliates, delivers its integrated platform of solutions through
two
business segments: Supply Chain Services and Performance Services. See
Note 21 - Segments
for further information related to the Company's reportable business segments. The Supply Chain Services segment includes one of the largest healthcare group purchasing organization ("GPO") programs in the United States, and integrated pharmacy and direct sourcing activities. The Performance Services segment includes one of the largest informatics and consulting services businesses in the United States focused on healthcare providers. The Company's software as a service ("SaaS") informatics products utilize the Company's comprehensive data set to provide actionable intelligence to its members, enabling them to benchmark, analyze and identify areas of improvement across the three main categories of cost management, quality and safety, and population health management. The Performance Services segment also includes the Company's technology-enabled performance improvement collaboratives, consulting services, government services and insurance management services.
The Company, through Premier GP, held an approximate
40%
and
37%
sole general partner interest in Premier LP at
June 30, 2018 and 2017
, respectively. In addition to their equity ownership interest in the Company, our member owners held an approximate
60%
and
63%
limited partner interest in Premier LP at
June 30, 2018 and 2017
, respectively. Below is a summary of the principal documents that define and regulate the governance and control relationships among Premier, Premier LP and the member owners.
LP Agreement
Pursuant to the Amended and Restated Limited Partnership Agreement, as amended ("LP Agreement"), Premier GP is the general partner of Premier LP, and controls the day-to-day business affairs and decision-making of Premier LP without the approval of any other partner, subject to certain limited partner approval rights. As the sole member of Premier GP, Premier is responsible for all operational and administrative decisions of Premier LP. In accordance with the LP Agreement, subject to applicable law or regulation and the terms of Premier LP's financing agreements, Premier GP causes Premier LP to make quarterly distributions out of its estimated taxable net income to Premier GP and to the holders of Class B common units as a class in an aggregate amount equal to Premier LP's total taxable income other than net profit attributable to dispositions not in the ordinary course of business for each such quarter multiplied by the effective combined federal, state and local income tax rate then payable by Premier to facilitate payment by each Premier LP partner of taxes, if required, on its share of taxable income of Premier LP. In addition, in accordance with the LP Agreement, Premier GP may cause Premier LP to make additional distributions to Premier GP and to all limited partners holding Class B common units as a class in proportion to their respective number of units, subject to any applicable restrictions under Premier LP's financing agreements or applicable law. Premier GP will distribute any amounts it receives from Premier LP to Premier, which Premier will use to (i) pay applicable taxes, (ii) meet its obligations under the tax receivable agreements ("TRAs") and (iii) meet its obligations to the member owners under the Exchange Agreement (as defined below) if they elect to convert their Class B common units for shares of its Class A common stock and Premier elects to pay some or all of the consideration to such member owners in cash.
In the event that a limited partner of Premier LP holding Class B common units not yet eligible to be exchanged for shares of Premier's Class A common stock pursuant to the terms of the Exchange Agreement (i) ceases to participate in Premier's GPO programs, (ii) ceases to be a limited partner of Premier LP (except as a result of a permitted transfer of its Class B common units),
89
(iii) ceases to be a party to a GPO participation agreement (subject to certain limited exceptions) or (iv) becomes a related entity of, or affiliated with, a competing business of Premier LP, in each case, Premier LP will have the option to redeem all of such limited partner's Class B common units not yet eligible to be exchanged at a purchase price set forth in the LP Agreement. In addition, the limited partner will be required to exchange all Class B common units eligible to be exchanged on the next exchange date following the date of the applicable termination event described above.
Voting Trust Agreement
Pursuant to a voting trust agreement (the "Voting Trust Agreement"), the member owners contributed their Class B common stock into Premier Trust, under which Wells Fargo Delaware Trust Company, N.A., as trustee, acts on behalf of the member owners for purposes of voting their shares of Class B common stock. As a result of the Voting Trust Agreement, the member owners retain beneficial ownership of the Class B common stock, while the trustee is the legal owner of such equity. Pursuant to the Voting Trust Agreement, the trustee must vote all of the member owners' Class B common stock as a block in the manner determined by the plurality of the votes received by the trustee from the member owners for the election of directors to serve on our Board of Directors and by a majority of the votes received by the trustee from the member owners for all other matters.
Exchange Agreement
Pursuant to the terms of an exchange agreement ("the Exchange Agreement"), subject to certain restrictions, commencing on October 31, 2014 and during each year thereafter, each member owner has the cumulative right to exchange up to
one-seventh
of its initial allocation of Class B common units, as well as any additional Class B common units purchased by such member owner pursuant to certain rights of first refusal (discussed below), for shares of Class A common stock (on a
one
-for-one basis subject to customary adjustments for subdivisions or combinations by split, reverse split, distribution, reclassification, recapitalization or otherwise), cash or a combination of both, the form of consideration to be at the discretion of Premier's Audit and Compliance Committee. This exchange right can be exercised on a quarterly basis and is subject to rights of first refusal in favor of the other holders of Class B common units and Premier LP. For each Class B common unit that is exchanged pursuant to the Exchange Agreement, the member owner will also surrender one corresponding share of our Class B common stock, which will automatically be retired.
Registration Rights Agreement
Pursuant to the terms of a registration rights agreement (the "Registration Rights Agreement") Premier filed with the Securities and Exchange Commission (the "SEC") a resale shelf registration statement for resales from time to time of its Class A common stock issued to the member owners in exchange for their Class B common units pursuant to the Exchange Agreement, subject to various restrictions. The registration statement was declared effective by the SEC in November 2014. Subject to certain exceptions, Premier will use reasonable efforts to keep the resale shelf registration statement effective for
seven
years. Pursuant to the Registration Rights Agreement, Premier may, but is not required to, conduct a company-directed underwritten public offering to allow the member owners to resell Class A common stock received by them in exchange for their Class B common units. Premier, as well as the member owners, will be subject to customary prohibitions on sale prior to and for
60
days following any company-directed underwritten public offering. The Registration Rights Agreement also grants the member owners certain "piggyback" registration rights with respect to other registrations of Class A common stock.
TRAs
Pursuant to the terms of the TRAs, for as long as the member owner remains a limited partner, Premier has agreed to pay to the member owners, generally over a
15
-year period (under current law),
85%
of the amount of cash savings, if any, in U.S. federal, foreign, state and local income and franchise tax that Premier actually realizes (or is deemed to realize, in the case of payments required to be made upon certain occurrences under such TRAs) as a result of the increases in tax basis resulting from the initial sale of Class B common units by the member owners in conjunction with the IPO, as well as subsequent exchanges by such member owners pursuant to the Exchange Agreement, and of certain other tax benefits related to Premier entering into the TRAs, including tax benefits attributable to payments under the TRAs.
GPO Participation Agreement
Pursuant to the terms of a GPO participation agreement, each member owner will generally receive cash sharebacks, or revenue share, from Premier LP equal to
30%
of all gross administrative fees collected by Premier LP based upon purchasing by such member owner's acute and alternate site providers and other eligible non-healthcare organizations that are owned, leased or managed by, or affiliated with, each such member owner, or owned, leased, managed and affiliated facilities, through Premier's GPO supplier contracts. In general, our GPO participation agreements automatically extend for successive
five
-year or
seven
-year periods (corresponding to the length of their initial terms) unless the member owner notifies Premier LP, prior to the fourth anniversary (in the case of five-year agreements), or sixth anniversary (in the case of seven-year agreements), of the then-current term, that such member owner desires to terminate the GPO participation agreement effective upon the expiration of the then-current term.
90
The terms and conditions of certain GPO participation agreements vary as a result of provisions in Premier's existing arrangements with member owners that conflict with provisions of the GPO participation agreement and which by the express terms of the GPO participation agreement are incorporated by reference and deemed controlling and will continue to remain in effect. In certain other instances, Premier LP and member owners have entered into GPO participation agreements with certain terms and conditions that vary from the standard form, which were approved by the member agreement review committee of Premier's Board of Directors, based upon regulatory constraints, pending merger and acquisition activity or other circumstances affecting those member owners.
Basis of Presentation and Consolidation
Basis of Presentation
The member owners' interest in Premier LP is reflected as redeemable limited partners' capital in the Company's accompanying Consolidated Balance Sheets, and the limited partners' proportionate share of income in Premier LP is reflected within net income attributable to non-controlling interest in Premier LP in the Company's accompanying Consolidated Statements of Income and within comprehensive income attributable to non-controlling interest in Premier LP in the Company's accompanying Consolidated Statements of Comprehensive Income.
At
June 30, 2018 and 2017
, the member owners owned approximately
60%
and
63%
, respectively, of the Company's combined Class A and Class B common stock through their ownership of Class B common stock. During
the year ended June 30, 2018
, the member owners exchanged
6.5 million
Class B common units and associated Class B common shares for an equal number of Class A common shares pursuant to the Exchange Agreement (see
Note 15 - Earnings (Loss) Per Share
). During
the year ended June 30, 2018
, approximately
6.5 million
Class B common units were contributed to Premier LP, converted to Class A common units and remain outstanding. Correspondingly, approximately
6.5 million
Class B common shares were retired during the same period.
At
June 30, 2018 and 2017
, the public investors, which may include member owners that have received shares of Class A common stock in connection with previous exchanges of their Class B common units and associated Class B common shares for an equal number of Class A common shares, owned approximately
40%
and
37%
of the Company's outstanding common stock through their ownership of Class A common stock.
The Company has corrected prior period information within the current period financial statements related to a specific component used in calculating the tax effect on Premier, Inc. net income for purposes of diluted earnings per share. Diluted earnings per share for fiscal 2016 was previously stated at
$1.33
per share and has been corrected to
$0.97
per share. The Company believes the correction is immaterial and the amount had no impact on the Company's overall financial condition, results of operations or cash flows.
We have reclassified
$5.4 million
and
$4.8 million
from selling, general and administrative expenses to the remeasurement of tax receivable agreement liabilities for
the year ended June 30, 2017
and 2016, respectively, within the Consolidated Statements of Income in order to conform to the current period presentation.
Principles of Consolidation
The accompanying consolidated financial statements have been prepared pursuant to the rules and regulations of the SEC and in accordance with U.S. generally accepted accounting principles ("GAAP") and include the assets, liabilities, revenues and expenses of all majority-owned subsidiaries over which the Company exercised control and when applicable, entities for which the Company had a controlling financial interest or was the primary beneficiary. All intercompany transactions have been eliminated upon consolidation. Accordingly, the consolidated financial statements reflect all adjustments that, in the opinion of management, are necessary for a fair presentation of results of operations and financial condition for the periods shown, including normal recurring adjustments.
Variable Interest Entities
Premier LP is a variable interest entity ("VIE") as the limited partners do not have the ability to exercise a substantive removal right with respect to the general partner. The Company does not hold a majority interest but, through Premier GP, has the exclusive power and authority to manage the business and affairs of Premier LP, to make all decisions with respect to driving the economic performance of Premier LP, and has both an obligation to absorb losses and a right to receive benefits. As such, the Company is the primary beneficiary of the VIE and consolidates the operations of Premier LP under the Variable Interest Model.
91
The assets and liabilities of Premier LP at
June 30, 2018 and 2017
consisted of the following (in thousands):
|
June 30, 2018
|
June 30, 2017
|
|||||
|
Assets
|
||||||
|
Current
|
$
|
393,863
|
|
$
|
385,477
|
|
|
Noncurrent
|
1,577,974
|
|
1,616,539
|
|
||
|
Total assets of Premier LP
|
$
|
1,971,837
|
|
$
|
2,002,016
|
|
|
Liabilities
|
||||||
|
Current
|
$
|
457,172
|
|
$
|
560,582
|
|
|
Noncurrent
|
128,793
|
|
134,635
|
|
||
|
Total liabilities of Premier LP
|
$
|
585,965
|
|
$
|
695,217
|
|
Net income attributable to Premier LP during
the years ended June 30, 2018, 2017 and 2016
was as follows (in thousands):
|
Year Ended June 30,
|
|||||||||
|
2018
|
2017
|
2016
|
|||||||
|
Premier LP net income
|
$
|
371,131
|
|
$
|
522,310
|
|
$
|
275,955
|
|
Premier LP's cash flows for
the years ended June 30, 2018, 2017 and 2016
consisted of the following (in thousands):
|
Year Ended June 30,
|
|||||||||
|
2018
|
2017
|
2016
|
|||||||
|
Net cash provided by (used in):
|
|||||||||
|
Operating activities
|
$
|
534,643
|
|
$
|
439,746
|
|
$
|
393,352
|
|
|
Investing activities
|
(92,680
|
)
|
(465,053
|
)
|
(159,636
|
)
|
|||
|
Financing activities
|
(457,673
|
)
|
(51,290
|
)
|
(150,330
|
)
|
|||
|
Net increase (decrease) in cash and cash equivalents
|
(15,710
|
)
|
(76,597
|
)
|
83,386
|
|
|||
|
Cash and cash equivalents at beginning of year
|
133,451
|
|
210,048
|
|
126,662
|
|
|||
|
Cash and cash equivalents at end of year
|
$
|
117,741
|
|
$
|
133,451
|
|
$
|
210,048
|
|
Use of Estimates in the Preparation of Financial Statements
The preparation of the Company's consolidated financial statements in accordance with GAAP requires management to make estimates and judgments that affect the reported amounts of assets, liabilities, revenues and expenses and related disclosure of contingent assets and liabilities. Significant estimates are evaluated on an ongoing basis, including estimates for allowances for doubtful accounts, useful lives of property and equipment, stock-based compensation, payables under TRAs, deferred tax balances including valuation allowances on deferred tax assets, uncertain tax positions, values of investments not publicly traded, deferred revenue, future cash flows associated with asset impairments, values of put and call rights, values of earn-out liabilities and the allocation of purchase prices. These estimates are based on historical experience and on various other assumptions that are believed to be reasonable under the circumstances, the results of which form the basis for making judgments about the carrying values of assets and liabilities that are not readily apparent from other sources. Actual results may differ from these estimates.
Given the Company's use of estimates referenced above, it is important to highlight that on December 22, 2017, the U.S. government enacted comprehensive tax legislation commonly referred to as the Tax Cuts and Jobs Act ("TCJA"). The TCJA includes significant changes to the U.S. corporate income tax system, specifically reducing the U.S. federal corporate income tax rate from 35% to 21%. As changes under the TCJA are broad and complex, the Company continues to interpret the breadth of its immediate and long-term impacts. The Company notes that concurrent with the enactment of the TCJA, the SEC issued Staff Accounting Bulletin No. 118 ("SAB 118"), which provides guidance on accounting for the tax effects of the TCJA.
SAB 118 provides a measurement period that should not extend beyond one year from the TCJA enactment date for companies to complete the accounting required under the Financial Accounting Standards Board ("FASB") Accounting Standards Codification ("ASC") 740. In accordance with SAB 118, a company must reflect the income tax effects of those aspects of the TCJA for which
92
the accounting under ASC 740 is complete. To the extent that a company's accounting for certain income tax effects of the TCJA is incomplete but it is able to determine a reasonable estimate, it must record a provisional amount on its financial statements. If a company cannot determine a provisional estimate to be included on its financial statements, it should continue to apply ASC 740 on the basis of the provision of the tax laws that were in effect immediately prior to the enactment of the TCJA. With this in mind, the Company has prescribed such provisional relief under SAB 118 by incorporating various estimates regarding timing and determination of temporary difference recognition when calculating components of its deferred tax balances. While the Company is able to provide reasonable estimates of the impacts related to the TCJA, the final impact may differ from these estimates, due to, among other things, changes in interpretations, assumptions, additional guidance that may be released by the Internal Revenue Service and other actions that we may take that are yet to be determined.
(2) SIGNIFICANT ACCOUNTING POLICIES
Business Combinations
We account for acquisitions of a business using the acquisition method. All of the assets acquired, liabilities assumed, contractual contingencies and contingent consideration are generally recognized at their fair value on the acquisition date. Any excess of the purchase price over the estimated fair values of the net assets acquired is recorded as goodwill. Acquisition-related costs are recorded as expenses in the consolidated financial statements.
Several valuation methods may be used to determine the fair value of assets acquired and liabilities assumed. For intangible assets, we typically use the income method. This method starts with a forecast of all of the expected future net cash flows for each asset. These cash flows are then adjusted to present value by applying an appropriate discount rate that reflects the risk factors associated with the cash flow streams. Some of the more significant estimates and assumptions inherent in the income method or other methods include the amount and timing of projected future cash flows, the discount rate selected to measure the risks inherent in the future cash flows and the assessment of the asset's life cycle and the competitive trends impacting the asset, including consideration of any technical, legal, regulatory or economic barriers to entry. Determining the useful life of an intangible asset also requires judgment as different types of intangible assets will have different useful lives and certain assets may even be considered to have indefinite useful lives.
Cash and Cash Equivalents
Cash and cash equivalents include cash and highly liquid investments with remaining maturities of three months or less at the time of acquisition.
Fair Value of Financial Instruments
The fair value of an asset or liability is based on the assumptions that market participants would use in pricing the asset or liability. Valuation techniques consistent with the market approach, income approach and/or cost approach are used to measure fair value. The Company follows a three-tiered fair value hierarchy when determining the inputs to valuation techniques. The fair value hierarchy prioritizes the inputs to valuation techniques into three broad levels in order to maximize the use of observable inputs and minimize the use of unobservable inputs. The levels of the fair value hierarchy are as follows:
Level 1: consists of financial instruments whose values are based on quoted market prices for identical financial instruments in an active market;
Level 2: consists of financial instruments whose values are determined using models or other valuation methodologies that utilize inputs that are observable either directly or indirectly, including (i) quoted prices for similar assets or liabilities in active markets, (ii) quoted prices for identical or similar assets or liabilities in markets that are not active, (iii) pricing models whose inputs are observable for substantially the full term of the financial instrument and (iv) pricing models whose inputs are derived principally from or corroborated by observable market data through correlation or other means for substantially the full term of the financial instrument;
Level 3: consists of financial instruments whose values are determined using pricing models that utilize significant inputs that are primarily unobservable, discounted cash flow methodologies, or similar techniques, as well as instruments for which the determination of fair value requires significant management judgment or estimation.
Accounts Receivable
Financial instruments, other than marketable securities, that subject the Company to potential concentrations of credit risk consist primarily of the Company's receivables. Receivables consist primarily of amounts due from hospital and healthcare system members for services and products. The Company maintains an allowance for doubtful accounts. This allowance is an estimate and is
93
regularly evaluated by the Company for adequacy by taking into consideration factors such as past experience, credit quality of the member base, age of the receivable balances, both individually and in the aggregate, and current economic conditions that may affect a member's ability to pay. Provisions for the allowance for doubtful accounts attributable to bad debt are recorded in selling, general and administrative expenses in the accompanying Consolidated Statements of Income. Accounts deemed uncollectible are written off, net of actual recoveries. If circumstances related to specific customers change, the Company's estimate of the recoverability of receivables could be further adjusted.
Inventory
Inventory consisting of finished goods, primarily medical products and other non-pharmaceutical products, are stated at the lower of cost or net realizable values on an average cost basis. Inventories consisting of pharmaceuticals and pharmaceutical-related products are stated at the lower of cost or net realizable values on a first-in, first-out basis. The Company performs periodic assessments to determine the existence of obsolete, slow-moving and unusable inventory and records necessary provisions to reduce such inventory to net realizable value.
Property and Equipment, Net
Property and equipment are recorded at cost, net of accumulated depreciation. Expenditures for major additions and improvements are capitalized and minor replacements, maintenance and repairs are charged to expense as incurred. When property and equipment are retired or otherwise disposed of, the cost and accumulated depreciation are removed from the accounts and any resulting gain or loss is included in the results of operations for the respective period. Depreciation is calculated over the estimated useful lives (“EUL”) of the related assets using the straight-line method. Capitalized modifications to leased properties are amortized using the straight-line method over the shorter of the lease term or the assets' EUL. See
Note 7 - Property and Equipment, Net
.
Costs associated with internally-developed computer software that are incurred in the preliminary project stage are expensed as incurred. During the development stage, direct consulting costs and payroll and payroll-related costs for employees that are directly associated with each project are capitalized. Internal use capitalized software costs are included in property and equipment, net in the accompanying Consolidated Balance Sheets. Capitalized costs are amortized on a straight-line basis over the estimated useful lives of the related software applications of up to
five years
and amortization is included in cost of revenue or selling, general and administrative expenses in the accompanying Consolidated Statements of Income, based on the software's end use. Replacements and major improvements are capitalized, while maintenance and repairs are expensed as incurred. Some of the more significant estimates and assumptions inherent in this process involve determining the stages of the software development project, the direct costs to capitalize and the estimated useful life of the capitalized software. The Company capitalized costs related to internally-developed software of
$74.9 million
and
$66.6 million
during
the years ended June 30, 2018 and 2017
, respectively.
The Company reviews the carrying value of property and equipment for impairment whenever events and circumstances indicate that the carrying value of an asset or asset group may not be recoverable from the estimated cash flows expected to result from its use and eventual disposition. In cases where the undiscounted cash flows are less than the carrying value, an impairment loss is recognized equal to an amount by which the carrying value exceeds the fair value of the asset or asset group. The factors considered by the Company in performing this assessment include current and projected operating results, trends and prospects, the manner in which the asset or asset group is used, and the effects of obsolescence, demand, competition and other economic factors.
Intangible Assets
Definite-lived intangible assets consist primarily of member relationships, technology, customer relationships, trade names, distribution networks, favorable lease commitments, and non-compete agreements, and are amortized on a straight-line basis over their EUL. See
Note 8 - Intangible Assets, Net
.
The Company reviews the carrying value of definite-lived intangible assets subject to amortization for impairment whenever events and circumstances indicate that the carrying value of the intangible asset subject to amortization may not be recoverable from the estimated cash flows expected to result from its use and eventual disposition. In cases where the undiscounted cash flows are less than the carrying value, an impairment loss is recognized equal to an amount by which the carrying value exceeds the fair value of the intangible asset subject to amortization on the measurement date. The factors considered by the Company in performing this assessment include current and projected operating results, trends and prospects, the manner in which the definite-lived intangible asset is used, and the effects of obsolescence, demand and competition, as well as other economic factors.
Goodwill
Goodwill represents costs in excess of fair values assigned to the underlying net assets of acquired businesses. Goodwill is not amortized. The Company performs its annual goodwill impairment testing on the first day of the last fiscal quarter of its fiscal year unless impairment indicators are present which could require an interim impairment test.
94
Under accounting rules, the Company may elect to perform a qualitative assessment to determine if an impairment is more likely than not to have occurred. This qualitative assessment requires an evaluation of any excess of fair value over the carrying value for a reporting unit and significant judgment regarding potential changes in valuation inputs, including a review of the Company's most recent long-range projections, analysis of operating results versus the prior year, changes in market values, changes in discount rates and changes in terminal growth rate assumptions. If it is determined that an impairment is more likely than not to exist, then we are required to perform a quantitative assessment to determine whether or not goodwill is impaired and to measure the amount of goodwill impairment, if any.
Goodwill impairment is determined using a two-step process. The first step involves a comparison of the estimated fair value of each of our reporting units to its carrying amount, including goodwill. In performing the first step, we determine the fair value of a reporting unit using a discounted cash flow analysis that is corroborated by a market-based approach. Determining fair value requires the exercise of significant judgment, including judgment about appropriate discount rates, perpetual growth rates and the amount and timing of expected future cash flows. The cash flows employed in the discounted cash flow analyses are based on the most recent budget and long-term forecast. The discount rates used in the discounted cash flow analyses are intended to reflect the risks inherent in the future cash flows of the respective reporting units. If the estimated fair value of a reporting unit exceeds its carrying amount, goodwill of the reporting unit is not impaired and the second step of the impairment test is not necessary.
If the carrying amount of a reporting unit exceeds its estimated fair value, then the second step of the goodwill impairment test must be performed. The second step of the goodwill impairment test compares the implied fair value of the reporting unit's goodwill with its goodwill carrying amount to measure the amount of impairment, if any. The implied fair value of goodwill is determined in the same manner as the amount of goodwill recognized in a business combination. In other words, the estimated fair value of the reporting unit is allocated to all of the assets and liabilities of that unit (including any unrecognized intangible assets) as if the reporting unit had been acquired in a business combination and the fair value of the reporting unit was the purchase price paid. If the carrying amount of the reporting unit's goodwill exceeds the implied fair value of that goodwill, an impairment charge is recognized in an amount equal to that excess.
The Company's most recent annual impairment testing only required the first step of the two-step process, which consisted of a quantitative assessment, and did not result in any goodwill impairment charges during the fourth quarter of
the year ended June 30, 2018
.
Deferred Compensation Plan Assets and Related Liabilities
The Company maintains a non-qualified deferred compensation plan for the benefit of eligible employees. This plan is designed to permit employee deferrals in excess of certain tax limits and provides for discretionary employer contributions in excess of the tax limits applicable to the Company's 401(k) plan. The amounts deferred are invested in assets at the direction of the employee. Company assets designated to pay benefits under the plan are held by a rabbi trust and are subject to the general creditors of the Company.
The assets, classified as trading securities, and liabilities of the rabbi trust are recorded at fair value and are accounted for as assets and liabilities of the Company. The assets of the rabbi trust are used to fund the deferred compensation liabilities owed to current and former employees. The deferred compensation plan contains both current and non-current assets. The current portion of the deferred compensation plan assets is comprised of estimated amounts to be paid within one year to departed participants following separation from the Company. The estimated current portion, totaling
$3.6 million
and
$5.7 million
at
June 30, 2018 and 2017
, respectively, is included in prepaid expenses and other current assets in the accompanying Consolidated Balance Sheets. The corresponding current portion of deferred compensation plan liabilities is included in other current liabilities in the accompanying Consolidated Balance Sheets at
June 30, 2018 and 2017
. The non-current portion of the deferred compensation plan assets, totaling
$44.6 million
and
$41.5 million
at
June 30, 2018 and 2017
, respectively, is included in long-term assets in the accompanying Consolidated Balance Sheets. The corresponding non-current portion of deferred compensation plan liabilities is included in long-term liabilities in the accompanying Consolidated Balance Sheets at
June 30, 2018 and 2017
. Realized and unrealized gain (loss) of
$4.0 million
,
$4.0 million
and
$(1.6) million
on plan assets as of
June 30, 2018, 2017 and 2016
, respectively, are included in other income (expense), in the accompanying Consolidated Statements of Income. Deferred compensation income (expense) from the change in the corresponding liability of
$(4.0) million
,
$(4.0) million
and
$1.6 million
, respectively, are included in selling, general and administrative expense in the accompanying Consolidated Statements of Income for
the years ended June 30, 2018, 2017 and 2016
, respectively.
TRAs
The Company records TRA liabilities based on
85%
of the estimated amount of tax savings the Company expects to receive, generally over a
15
-year period, in connection with the additional tax benefits created in conjunction with the IPO. Tax payments under the TRA will be made to the member owners as the Company realizes tax benefits attributable to the initial purchase of Class B common units from the member owners made concurrently with the IPO and any subsequent exchanges of Class B common
95
units into Class A common stock or cash between the Company and the member owners. Determining the estimated amount of tax savings the Company expects to receive requires judgment as deductibility of goodwill amortization expense is not assured and the estimate of tax savings is dependent upon the actual realization of the tax benefit and the tax rates in effect at that time.
Changes in estimated TRA liabilities that are the result of a change in tax accounting method are recorded in
remeasurement of tax receivable agreement liabilities or in
selling, general and administrative expense in the Consolidated Statements of Income. Changes in estimated TRA liabilities that are related to new basis changes as a result of the exchange of Class B common units for a like number of shares of Class A common stock or as a result of departed member owners are recorded as an increase or decrease to additional paid-in capital in the Consolidated Statements of Stockholders' Deficit.
Redeemable Limited Partners' Capital
The LP Agreement includes a provision that provides for redemption of a limited partner's interest upon termination as follows: for Class B common units not yet eligible for exchange, those will be redeemed at a purchase price which is the lower of the limited partner's capital account balance in Premier LP immediately prior to the IPO after considering any IPO proceeds received and the fair market value of the Class A common stock of the Company on the date of the termination with either (a) a
five
-year, unsecured, non-interest bearing term promissory note, (b) a cashier's check or wire transfer of immediately available funds in an amount equal to the present value of the Class B unit redemption amount, or (c) payment on such other terms mutually agreed upon with Premier GP. For Class B common units that are eligible for exchange, the limited partner is also required to exchange all eligible Class B common units on the next exchange date following the date of the termination.
A limited partner cannot redeem all or any part of its interest in Premier LP without the approval of Premier GP, which is controlled by the Board of Directors. Given the limited partners hold the majority of the votes of the Board of Directors, limited partners' capital has a redemption feature that is not solely within the control of the Company. As a result, the Company reflects redeemable limited partners' capital as temporary equity in the mezzanine section of the Consolidated Balance Sheets. In addition, the limited partners have the ability to exchange their Class B common units for cash or Class A common shares on a
one
-for-
one
basis. Accordingly, the Company records redeemable limited partners' capital at the redemption amount, which represents the greater of the book value or redemption amount per the LP Agreement at the reporting date, with the corresponding offset to additional paid-in-capital and accumulated deficit.
Distributions to Limited Partners under the LP Agreement
Premier LP makes quarterly distributions to Premier, Inc. as the general partner and to the limited partners in the form of a legal partnership income distribution governed by the terms of the LP Agreement. The general partner distribution is based on the general partner's ownership in Premier LP. The limited partner distributions are based on the limited partners' ownership in Premier LP and relative participation across Premier service offerings. While the limited partner distributions are partially based on relative participation across Premier service offerings, the actual distribution is not solely based on revenue generated from an individual partner's participation as distributions are based on the net income or loss of the partnership which encompass the operating expenses of the partnership as well as income or loss generated by non-owner members' participation in Premier's service offerings. To the extent Premier LP incurred a net loss, the partners would not receive a quarterly distribution.
Revenue Recognition
Net Revenue
Net revenue consists of (i) service revenue which includes net administrative fees revenue and other services and support revenue and (ii) product revenue. Net administrative fees revenue consists of net GPO administrative fees in the Supply Chain Services segment. Other services and support revenue consists primarily of fees generated by the Performance Services segment in connection with the Company's SaaS informatics products subscriptions, consulting services and performance improvement collaborative subscriptions. Product revenue consists of integrated pharmacy and direct sourcing product sales, which are included in the Supply Chain Services segment. The Company recognizes revenue when (i) there is persuasive evidence of an arrangement, (ii) the fee is fixed or determinable, (iii) services have been rendered and payment has been contractually earned, and (iv) collectibility is reasonably assured.
Net Administrative Fees Revenue
Net administrative fees revenue is generated through administrative fees received from suppliers based on the total dollar volume of supplies purchased by the Company's members in connection with its GPO programs.
The Company, through its GPO programs, aggregates member purchasing power to negotiate pricing discounts and improve contract terms with suppliers. Contracted suppliers pay the Company administrative fees which generally represent
1%
to
3%
of the purchase price of goods and services sold to members under the contracts the Company has negotiated. Administrative fees
96
are recognized as revenue in the period in which the respective supplier reports member purchasing data, usually a month or a quarter in arrears of actual member purchase activity. The supplier report proves that the delivery of product or service has occurred, the administrative fees are fixed and determinable based on reported purchasing volume, and collectibility is reasonably assured. Member and supplier contracts substantiate persuasive evidence of an arrangement. The Company does not take title to the underlying equipment or products purchased by members through its GPO supplier contracts.
The Company pays a revenue share equal to a percentage of gross administrative fees that the Company collects based upon purchasing by such members and their owned, leased, managed or affiliated facilities through its GPO supplier contracts. Revenue share is recognized according to the members' contractual agreements with the Company as the related administrative fees revenue is recognized. Considering GAAP relating to principal/agent considerations under revenue recognition principles, revenue share is recorded as a reduction to gross administrative fees revenue to arrive at a net administrative fees revenue amount, which amount is included in service revenue in the accompanying Consolidated Statements of Income.
Other Services and Support Revenue
Performance Services revenue consists of SaaS informatics products subscriptions, certain perpetual and term licenses, performance improvement collaborative and other service subscriptions, professional fees for consulting services, and insurance services management fees and commissions from group-sponsored insurance programs.
SaaS informatics subscriptions include the right to use the Company's proprietary hosted technology on a SaaS basis, training and member support to deliver improvements in cost management, quality and safety, population health management and provider analytics. Pricing varies by application and size of healthcare system. Informatics subscriptions are generally
three
to
five
year agreements with automatic renewal clauses and annual price escalators that typically do not allow for early termination. These agreements do not allow for physical possession of the software. Subscription fees are typically billed on a monthly basis and revenue is recognized as a single deliverable on a straight-line basis over the remaining contractual period following implementation. Implementation involves the completion of data preparation services that are unique to each member's data set and, in certain cases, the installation of member site-specific software, in order to access and transfer member data into the Company's hosted SaaS informatics products. Implementation is generally
60
to
300 days
following contract execution before the SaaS informatics products can be fully utilized by the member.
The Company sells certain perpetual and term licenses that include mandatory post-contract customer support in the form of maintenance and support services. Pricing varies by application and size of healthcare system. Fees for the initial period include the license fees, implementation fees and the initial bundled maintenance and support services fees. The fees for the initial period are recognized straight-line over the remaining initial period following implementation. Subsequent renewal maintenance and support services fees are recognized on a straight-line basis over the contractually stated renewal periods. Implementation services are provided to the customer prior to the use of the software and do not involve significant customization or modification. Implementation is generally
250
to
300 days
following contract execution before the licensed software products can be fully utilized by the member.
Revenue from performance improvement collaboratives and other service subscriptions that support the Company's offerings in cost management, quality and safety and population health management is recognized over the service period, which is generally
one
year.
Professional fees for consulting services sold under contracts vary based on the nature and terms of the engagement. Fees are billed as stipulated in the contract, and revenue is recognized on a proportional performance method as services are performed and deliverables are provided. In situations where the contracts have significant contract performance guarantees or member acceptance provisions, revenue recognition occurs when the fees are fixed and determinable and all contingencies, including any refund rights, have been satisfied.
Insurance services management fees are recognized in the period in which such services are provided. Commissions from group sponsored insurance programs are recognized over the term of the insurance policies, which is generally
one
year.
Certain administrative and/or patient management integrated pharmacy services are provided in situations where prescriptions are sent back to member health systems for dispensing. Additionally, the Company derives revenue from pharmaceutical manufacturers for providing patient education and utilization data. Revenue is recognized as these services are provided.
Product Revenue
Specialty pharmacy revenue is recognized when a product is accepted and is recorded net of the estimated contractual adjustments under agreements with Medicare, Medicaid and other managed care plans. Payments for the products provided under such agreements are based on defined allowable reimbursements rather than on the basis of standard billing rates. The difference between
97
the standard billing rate and allowable reimbursement rate results in contractual adjustments which are recorded as deductions from net revenue.
Direct sourcing revenue is recognized once the title and risk of loss of medical products have been transferred to members.
Multiple Deliverable Arrangements
The Company enters into agreements where the individual deliverables discussed above, such as SaaS subscriptions and consulting services, are bundled into a single service arrangement. These agreements are generally provided over a time period ranging from approximately
three months
to
five years
after the applicable contract execution date. Revenue is allocated to the individual elements within the arrangement based on their relative selling price using vendor specific objective evidence ("VSOE"), third-party evidence ("TPE") or the estimated selling price ("ESP"), provided that the total arrangement consideration is fixed and determinable at the inception of the arrangement. All deliverables which are fixed and determinable are recognized according to the revenue recognition methodology described above.
Certain arrangements include performance targets or other contingent fees that are not fixed and determinable at the inception of the arrangement. If the total arrangement consideration is not fixed and determinable at the inception of the arrangement, the Company allocates only that portion of the arrangement that is fixed and determinable to each element. As additional consideration becomes fixed, it is similarly allocated based on VSOE, TPE or ESP to each element in the arrangement and recognized in accordance with each element's revenue recognition policy.
Performance Guarantees
On limited occasions, the Company enters into agreements which provide for guaranteed performance levels to be achieved by the member over the term of the agreement. In situations with significant performance guarantees, the Company defers revenue recognition until the amount is fixed and determinable and all contingencies, including any refund rights, have been satisfied. In the event that guaranteed savings levels are not achieved, the Company may have to perform additional services at no additional charge for the member to achieve the guaranteed savings or pay the difference between the savings that were guaranteed and the actual achieved savings.
Deferred Revenue
Deferred revenue consists of unrecognized revenue related to advanced member invoicing or member payments received prior to fulfillment of the Company's revenue recognition criteria. Substantially all deferred revenue consists of deferred subscription fees and deferred consulting fees. Subscription fees for company-hosted SaaS applications are deferred until the member's unique data records have been incorporated into the underlying software database, or until member site-specific software has been implemented and the member has access to the software. Deferred consulting fees arise when cash is received from members prior to delivery of service. When the fees are contingent upon meeting a performance target that has not yet been achieved, the consulting fees are deferred until the performance target is met.
Cost of Revenue and Operating Expenses
Cost of Revenue
Cost of service revenue includes expenses related to employees (including compensation and benefits) and outside consultants who directly provide services related to revenue-generating activities, including consulting services to members and implementation services related to SaaS informatics products. Cost of service revenue also includes expenses related to hosting services, related data center capacity costs, third-party product license expenses and amortization of the cost of internal use software.
Cost of product revenue consists of purchase and shipment costs for integrated pharmaceuticals and direct sourced medical products.
Operating Expenses
Selling, general and administrative expenses consist of expenses directly associated with selling and administrative employees and indirect expenses associated with employees that primarily support revenue generating activities (including compensation and benefits) and travel-related expenses, as well as occupancy and other indirect expenses, insurance expenses, professional fees, and other general overhead expenses.
Research and development expenses consist of employee-related compensation and benefits expenses, and third-party consulting fees of technology professionals, incurred to develop, support and maintain the Company's software-related products and services.
Amortization of purchased intangible assets includes the amortization of all identified definite-lived intangible assets resulting from acquisitions.
98
Advertising Costs
Advertising costs are expensed as incurred. Advertising costs are reflected in selling, general and administrative expenses in the accompanying Consolidated Statements of Income and were
$4.3 million
,
$3.8 million
and
$3.3 million
for
the years ended June 30, 2018, 2017 and 2016
, respectively.
Income Taxes
The Company accounts for income taxes under the asset and liability approach. Deferred tax assets or liabilities are determined based on the differences between the financial statement and tax basis of assets and liabilities as measured by the enacted tax rates as well as net operating losses and credit carryforwards, which will be in effect when these differences reverse. The Company provides a valuation allowance against net deferred tax assets when, based upon the available evidence, it is more likely than not that the deferred tax assets will not be realized.
The Company prepares and files tax returns based on interpretations of tax laws and regulations. The Company's tax returns are subject to examination by various taxing authorities in the normal course of business. Such examinations may result in future tax, interest and penalty assessments by these taxing authorities.
In determining the Company's tax expense for financial reporting purposes, the Company establishes a reserve for uncertain income tax positions unless it is determined to be "more likely than not" that such tax positions would be sustained upon examination, based on their technical merits. That is, for financial reporting purposes, the Company only recognizes tax benefits taken on the tax return if it believes it is "more likely than not" that such tax positions would be sustained. There is considerable judgment involved in determining whether it is "more likely than not" that positions taken on the tax returns would be sustained.
The Company adjusts its tax reserve estimates periodically because of ongoing examinations by, and settlements with, varying taxing authorities, as well as changes in tax laws, regulations and interpretations. The consolidated tax expense of any given year includes adjustments to prior year income tax reserve and related estimated interest charges that are considered appropriate. The Company's policy is to recognize, when applicable, interest and penalties on uncertain income tax positions as part of income tax expense.
Comprehensive Income
Comprehensive income includes all changes in stockholders' deficit during a period from non-owner sources. Net income and other comprehensive income, including unrealized gains and losses on investments, are reported, net of their related tax effect, to arrive at comprehensive income.
Basic and Diluted Earnings (Loss) per Share ("EPS")
Basic EPS is calculated by dividing net income by the number of weighted average common shares outstanding during the period. Diluted EPS assumes the conversion, exercise or issuance of all potential common stock equivalents, unless the effect of such inclusion would result in the reduction of a loss or the increase in income per share. Diluted EPS is computed by dividing net income by the number of weighted average common shares increased by the dilutive effects of potential common shares outstanding during the period. The number of potential common shares outstanding is determined in accordance with the treasury stock method.
Recently Adopted Accounting Standards
In July 2015, the FASB issued Accounting Standards Update ("ASU") 2015-11,
Inventory (Topic 330): Simplifying the Measurement of Inventory
, which requires entities to measure most inventory "at the lower of cost and net realizable value," thereby simplifying the guidance under which an entity must measure inventory at the lower of cost or market. This guidance does not apply to inventories that are measured by using either the last-in, first-out method or the retail inventory method. The Company adopted this standard effective July 1, 2017 using the prospective approach. The implementation of this ASU did not have a material effect on the Company's consolidated financial statements.
In May 2017, the FASB issued ASU 2017-09,
Compensation-Stock Compensation (Topic 718): Scope of Modification Accounting,
which
clarifies when changes to the terms or conditions of a share-based payment award must be accounted for as modifications. The new guidance will reduce diversity in practice and result in fewer changes to the terms of an award being accounted for as modifications. The Company adopted this standard effective October 1, 2017 using the prospective approach. The implementation of this ASU did not have a material effect on the Company's consolidated financial statements.
In August 2016, the FASB issued ASU 2016-15,
Statement of Cash Flows (Topic 230): Classification of Certain Cash Receipts and Cash Payments
, which amends the guidance in ASC 230 on the classification of certain cash receipts and payments in the statement of cash flows. The primary purpose of the ASU is to reduce the diversity in practice that has resulted from the lack of consistent principles on this topic. The ASU amendments add or clarify guidance on eight cash flow issues. The Company adopted
99
this standard effective January 1, 2018 using the retrospective approach. The implementation of this ASU did not impact the classification or presentation of cash flows within the Company's consolidated financial statements.
Recently Issued Accounting Standards Not Yet Adopted
In January 2017, the FASB issued ASU 2017-04,
Intangibles - Goodwill and Other (Topic 350): Simplifying the Test for Goodwill Impairment
, which eliminates Step 2 from the goodwill impairment test. The guidance requires an entity to perform its annual, or interim, goodwill impairment test by comparing the fair value of a reporting unit with its carrying amount. An entity should recognize an impairment charge for the amount by which the carrying amount exceeds the reporting unit’s fair value. In addition, the guidance eliminates the requirement for any reporting unit with a zero or negative carrying amount to perform a qualitative assessment. The standard is effective for fiscal years beginning after December 15, 2019, including interim periods within those fiscal years. The new standard will be effective for the Company for the fiscal year beginning July 1, 2020. Early adoption is permitted for interim and annual goodwill impairment tests performed after January 1, 2017. The Company is currently evaluating the impact of the adoption of the new standard on its consolidated financial statements and related disclosures.
In October 2016, the FASB issued ASU 2016-16,
Income Taxes (Topic 740): Intra-Entity Transfers of Assets Other Than Inventory
, which removes the prohibition in ASC 740 against the immediate recognition of the current and deferred income tax effects of intra-entity transfers of assets other than inventory. The guidance is intended to reduce the complexity of GAAP and diversity in practice related to the tax consequences of certain types of intra-entity asset transfers, particularly those involving intellectual property. The standard is effective for fiscal years beginning after December 15, 2017, including interim periods within those fiscal years. The new standard will be effective for the Company for the fiscal year beginning July 1, 2018. The implementation of this ASU is not expected to have a material effect on the Company's consolidated financial statements.
In February 2016, the FASB issued ASU 2016-02,
Leases (Topic 842)
, which is intended to increase transparency and comparability among organizations of accounting for leasing arrangements. This guidance establishes a right-of-use model that requires a lessee to record a right-of-use asset and a lease liability on the balance sheet for all leases with terms longer than twelve months. Leases will be classified as either finance or operating, with classification affecting the pattern of expense recognition in the income statement. Entities will be required to recognize and measure leases as of the earliest period presented using a modified retrospective approach. The standard is effective for fiscal years beginning after December 15, 2018, including interim periods within those fiscal years. The new standard will be effective for the Company for the fiscal year beginning July 1, 2019. Early adoption is permitted. The Company is currently evaluating the impact of the adoption of the new standard on its consolidated financial statements and related disclosures.
In January 2016, the FASB issued ASU 2016-01,
Financial Instruments-Overall (Subtopic 825-10): Recognition and Measurement of Financial Assets and Financial Liabilities
, which is intended to provide users of financial statements with more useful information on the recognition, measurement, presentation, and disclosure of financial instruments. The standard is effective for fiscal years beginning after December 15, 2017, including interim periods within those fiscal years. The new standard will be effective for the Company for the fiscal year beginning July 1, 2018. The implementation of this ASU is not expected to have a material effect on the Company's consolidated financial statements.
In May 2014, the FASB issued ASU 2014-09,
Revenue from Contracts with Customers (Topic 606)
, which will supersede nearly all existing revenue recognition guidance. The new standard requires revenue to be recognized when promised goods or services are transferred to customers in an amount that reflects the consideration to which the entity expects to be entitled in exchange for those goods or services. The new standard also requires additional disclosures about the nature, amount, timing and uncertainty of revenue and cash flows arising from customer contracts, including significant judgments and changes in judgments and assets recognized from costs incurred to obtain or fulfill a contract. The new standard allows for either full retrospective or modified retrospective adoption.
In August 2015, the FASB issued an amendment in ASU 2015-14,
Revenue from Contracts with Customers (Topic 606): Deferral of the Effective Date
, to defer the effective date of the new standard for all entities by one year. The new standard, as amended, is effective for fiscal years beginning after December 15, 2017, including interim periods within those fiscal years. Early adoption as of the original effective date for public entities is permitted.
In March 2016, the FASB issued another amendment in ASU 2016-08,
Revenue from Contracts with Customers (Topic 606): Principal versus Agent Considerations
, related to a third party providing goods or services to a customer. When another party is involved in providing goods or services to a customer, an entity is required to determine whether the nature of its promise is to provide the specified good or service itself or to arrange for the good or service to be provided by a third party. If the entity provides the specific good or service itself, the entity acts as a principal. If an entity arranges for the good or service to be provided by a third party, the entity acts as an agent. The standard requires the principal to recognize revenue for the gross amount and the agent to recognize revenue for the amount of any fee or commission for which it expects to be entitled in exchange for arranging for the specified good or service to be provided. The new standard is effective with ASU 2014-09.
100
In April 2016, the FASB issued ASU 2016-10,
Revenue from Contracts with Customers (Topic 606): Identifying Performance Obligations and Licensing
, which amends specific aspects of ASU 2014-09, including how to identify performance obligations and guidance related to licensing implementation. This amendment provides guidance on determining whether an entity's promise to grant a license provides a customer with either a right to use the entity's intellectual property or a right to access the entity's intellectual property. The amendment is effective with ASU 2014-09.
In May 2016, the FASB issued ASU 2016-12,
Revenue from Contracts with Customers (Topic 606): Narrow-Scope Improvements and Practical Expedients
, which clarifies specific aspects of ASU 2014-09, clarifying how to identify performance obligations and guidance related to its promise in granting a license of intellectual property. This new standard provides guidance to allow entities to disregard items that are immaterial in the context of the contract, clarify when a promised good or service is separately identifiable and allow an entity to elect to account for the cost of shipping and handling performed after control of a good has been transferred to the customer as a fulfillment cost. The new standard also clarifies how an entity should evaluate the nature of its promise in granting a license of intellectual property to help determine whether it recognizes revenue over time or at a point in time and addresses how entities should consider license renewals and restrictions. The new standard is effective with ASU 2014-09.
In December 2016, the FASB issued ASU 2016-20,
Technical Corrections and Improvements to Topic 606: Revenue from Contracts with Customers
, which clarifies specific aspects of ASU 2014-09, including allowing entities not to make quantitative disclosures about remaining performance obligations in certain cases and requiring entities that use any of the new or previously existing optional exemptions to expand their qualitative disclosures. The new standard also makes twelve other technical corrections and modifications to ASU 2014-09. The new standard is effective with ASU 2014-09.
The new revenue recognition standard related to Topic 606 discussed above, as amended, is effective for the Company for the fiscal year beginning July 1, 2018, and we plan to adopt the standard using the modified retrospective approach. To date, the Company has identified the following preliminary impacts of adopting the new standard on the various revenue streams across its operating segments.
Within the Supply Chain Services segment, the Company expects to recognize administrative fee revenue upon the occurrence of a sale by suppliers to the Company’s members. This differs from the previous treatment in which the Company recognizes revenue in the period that the respective supplier reports member purchasing data, which is typically one to three months in arrears of the actual member purchase activity. This change is expected to result in the Company recognizing revenue sooner in the revenue cycle than under the Company's previous revenue recognition policy and the creation of a contract asset associated with this shift in revenue recognition timing. With regards to product revenue, the Company does not expect a material impact on the timing of revenue recognition. The Company is continuing to assess the impact of the new standard on the financial statements and disclosures.
Within the Performance Services segment, the Company expects to recognize revenue associated with its perpetual and term licenses upon delivery to the customer (point in time) and the associated mandatory post-contract customer support ratably over the period during which the support is provided (over time). The Company expects that this change will result in a shift and acceleration in timing of revenue recognition relative to the previous treatment. Also under the new standard, the Company will be required to capitalize the incremental costs of obtaining a contract, which the Company has preliminarily identified as sales commissions and costs associated with implementing our SaaS informatics tools, and to amortize these costs in a manner that reflects the transfer of services to the customer. These costs are expensed as incurred under the Company's previous policy.
The Company is nearing completion of its assessment and is still in the process of quantifying the impact of the new standard on its consolidated financial statements. Based on this assessment thus far, the Company believes that the impact on its consolidated financial statements could be material. However, due to the inherent complexity of its revenue recognition, the Company continues to evaluate all potential impacts of the new standard and is concurrently refining its business processes, systems and internal controls necessary to support accounting, reporting and disclosure requirements. Accordingly, a significant amount of work remains as the Company finalizes its implementation, and any preliminary assessment is subject to change.
(3) BUSINESS ACQUISITIONS
Acquisition of Innovatix and Essensa
Innovatix, LLC ("Innovatix") and Essensa Ventures, LLC ("Essensa") are GPOs focused on serving alternate site health care providers and other organizations throughout the United States. Prior to December 2, 2016, the Company, through its consolidated subsidiary, Premier Supply Chain Improvement ("PSCI"), held
50%
of the membership interests in Innovatix (see
Note 4 - Investments
). On December 2, 2016, the Company, through PSCI, acquired from GNYHA Holdings, LLC (see
Note 19 - Related Party Transactions
) the remaining
50%
ownership interest of Innovatix and
100%
of the ownership interest in Essensa for
$325.0 million
, of which
$227.5 million
was paid in cash at closing and
$97.5 million
was paid in cash on January 10, 2017. As a result of certain purchase price adjustments provided for in the purchase agreement, the adjusted purchase price was
$336.0 million
.
101
In connection with the acquisition, the Company utilized its credit facility dated June 24, 2014, as amended on June 4, 2015 (the "Credit Facility") to fund the
$325.0 million
purchase price (see
Note 11 - Debt
). The Company also incurred
$5.2 million
and
$6.5 million
of acquisition costs related to this acquisition during
the years ended June 30, 2018 and 2017
, respectively. These acquisition costs were included in selling, general and administrative expenses in the accompanying Consolidated Statements of Income.
The Company has accounted for the Innovatix and Essensa acquisition as a business combination whereby the purchase price was allocated to tangible and intangible assets acquired (see
Note 8 - Intangible Assets, Net
) and liabilities assumed based on their preliminary fair values. The acquisition resulted in the recognition of approximately
$334.7 million
of goodwill attributable to the anticipated profitability of Innovatix and Essensa. The acquisition was considered an asset acquisition for tax purposes, and accordingly, the Company expects the goodwill to be deductible for tax purposes.
The fair values assigned to the net assets acquired and the liabilities assumed as of the acquisition date were as follows (in thousands):
|
Acquisition Date Fair Value
|
|||
|
Cash paid at closing
|
$
|
227,500
|
|
|
Cash paid on January 10, 2017
|
97,500
|
|
|
|
Purchase price
|
325,000
|
|
|
|
Additional cash paid at closing
|
10,984
|
|
|
|
Adjusted purchase price
|
335,984
|
|
|
|
Earn-out liability
|
16,662
|
|
|
|
Receivable from GNYHA Holdings, LLC
|
(3,000
|
)
|
|
|
Total consideration paid
|
349,646
|
|
|
|
Cash acquired
|
(16,267
|
)
|
|
|
Net consideration
|
333,379
|
|
|
|
50% ownership interest in Innovatix
|
218,356
|
|
|
|
Payable to Innovatix and Essensa
|
(5,765
|
)
|
|
|
Enterprise value
|
545,970
|
|
|
|
Accounts receivable
|
21,242
|
|
|
|
Prepaid expenses and other current assets
|
686
|
|
|
|
Fixed assets
|
3,476
|
|
|
|
Intangible assets
|
241,494
|
|
|
|
Total assets acquired
|
266,898
|
|
|
|
Accrued expenses
|
5,264
|
|
|
|
Revenue share obligations
|
7,011
|
|
|
|
Other current liabilities
|
694
|
|
|
|
Total liabilities assumed
|
12,969
|
|
|
|
Deferred tax liability
|
42,636
|
|
|
|
Goodwill
|
$
|
334,677
|
|
The acquisition provided the sellers an earn-out opportunity of up to
$43.0 million
based on Innovatix's and Essensa's Adjusted EBITDA (as defined in the purchase agreement) for the fiscal year ended
June 30, 2017
. The Company and the seller finalized the amount payable pursuant to the earn-out opportunity and the Company paid the seller
$21.1 million
during
the year ended June 30, 2018
(see
Note 5 - Fair Value Measurements
).
Certain executive officers of Innovatix and Essensa executed employment agreements that became effective upon the closing of the acquisition. The purchase agreement provides that in the event that Innovatix's and Essensa's Adjusted EBITDA exceeds agreed upon amounts, certain of those executive officers are entitled to receive a retention bonus payment of up to
$3.0 million
in the aggregate for which the Company will be reimbursed by GNYHA Holdings, LLC, of which
$1.5 million
was paid and reimbursed during
the year ended June 30, 2018
.
102
The Company's
50%
ownership interest in Innovatix prior to the acquisition was accounted for under the equity method and had a carrying value of
$13.3 million
(see
Note 4 - Investments
). In connection with the acquisition, the Company's investment was remeasured under business combination accounting rules to a fair value of
$218.4 million
, resulting in a one-time gain of
$205.1 million
which was recorded as other income.
Pro forma results of operations for the acquisition have not been presented because the effects on revenue and net income were not material to our historic consolidated financial statements. The Company reports Innovatix and Essensa as part of its Supply Chain Services segment.
Acquisition of Acro Pharmaceuticals
Acro Pharmaceutical Services LLC and Community Pharmacy Services, LLC (collectively, "Acro Pharmaceuticals") are specialty pharmacy businesses that provide customized healthcare management solutions to members. On August 23, 2016, the Company, through its consolidated subsidiary, NS3 Health, LLC, acquired
100%
of the membership interests of Acro Pharmaceuticals for
$75.0 million
in cash. As a result of certain purchase price adjustments provided for in the purchase agreement, the adjusted purchase price was
$62.9 million
. The acquisition was funded with available cash on hand.
The Company has accounted for the Acro Pharmaceuticals acquisition as a business combination whereby the purchase price was allocated to tangible and intangible assets acquired and liabilities assumed based on their fair values. The Acro Pharmaceuticals acquisition resulted in the recognition of approximately
$33.9 million
of goodwill (see
Note 9 - Goodwill
) attributable to the anticipated profitability of Acro Pharmaceuticals. The Acro Pharmaceuticals acquisition is considered an asset acquisition for tax purposes and accordingly, the Company expects the goodwill to be deductible for tax purposes.
Pro forma results of operations for the acquisition have not been presented because the effects on revenue and net income were not material to our historic consolidated financial statements. The Company reports Acro Pharmaceuticals as part of its Supply Chain Services segment.
Acquisition of InFlow
InFlowHealth, LLC ("InFlow") is a SaaS-based software developer that specializes in improving the operational, financial and strategic performance of physician practices. InFlow's software allows physicians to identify opportunities for improvement and guide physician practice budgeting and strategic investments by aggregating financial and operational data from physicians in medical groups across the United States. The software is designed to provide actionable insights into among other things, practice capacity, patient volumes, productivity and staffing ratios, revenue cycle performance, patient demographics, referral patterns and overall compensation.
On October 1, 2015, PHSI acquired all of the limited liability company membership interests of InFlow for
$6.1 million
in cash. The Company utilized available funds on hand to complete the acquisition. The acquisition provides selling members an earn-out opportunity of up to
$26.9 million
based on InFlow's future annual contractual subscription revenues above certain thresholds through December 31, 2019. At
June 30, 2018 and 2017
, the fair value of the earn-out liability was
zero
and
$0.2 million
, respectively (see
Note 5 - Fair Value Measurements
). In accordance with GAAP, the contingent consideration is recorded at fair value based on a probability-weighted approach including multiple earnings scenarios, although this value is not indicative of a known amount to be paid. The selling members also received restricted stock units of the Company with an aggregate equity grant value of
$2.1 million
, which vest over a
three
-year period with restrictions tied to continued employment.
The Company accounted for the InFlow acquisition as a business combination whereby the purchase price was allocated to tangible and intangible assets (see
Note 8 - Intangible Assets, Net
) acquired and liabilities assumed based on their fair values. The InFlow acquisition resulted in the recognition of approximately
$5.9 million
of goodwill attributable to the anticipated profitability of InFlow. The InFlow acquisition is considered an asset acquisition for tax purposes and accordingly, the Company expects the goodwill to be deductible for tax purposes. The Company reports InFlow as part of its Performance Services segment.
Acquisition of CECity
CECity.com, Inc. ("CECity") is a cloud-based healthcare solutions provider, specializing in performance management and improvement, pay-for-value reporting and professional education. CECity offers turnkey solutions for clinical data registries, continuing medical education, maintenance of certification, performance improvement, pay-for-value reporting and life-long professional development.
On August 20, 2015, PHSI acquired
100%
of the outstanding shares of capital stock of CECity, a Delaware corporation, for
$398.3 million
. The Company funded the acquisition with
$250.0 million
of cash and
$150.0 million
of borrowings under the Credit Facility (see
Note 11 - Debt
). Approximately
$4.0 million
of pretax acquisition costs related to the CECity acquisition were recorded
103
in selling, general and administrative expenses in the accompanying Consolidated Statements of Income for the year ended June 30, 2016.
The Company accounted for the CECity acquisition as a business combination whereby the purchase price was allocated to tangible and intangible assets (see
Note 8 - Intangible Assets, Net
) acquired and liabilities assumed based on their fair values. The CECity acquisition resulted in the recognition of approximately
$274.0 million
of goodwill which reflects a premium relative to the fair value of the identified assets due to the strategic importance of the transaction to the Company and the CECity business model which does not rely extensively on tangible assets as well as the anticipated profitability of CECity. The CECity acquisition is considered an asset acquisition for tax purposes and accordingly, the Company expects the goodwill to be deductible for tax purposes.
The following table summarizes the fair values assigned to the net assets acquired and the liabilities assumed as of the CECity acquisition date of August 20, 2015 (in thousands):
|
Acquisition Date Fair Value
|
|||
|
Purchase price
|
$
|
400,000
|
|
|
Working capital adjustment
|
(28
|
)
|
|
|
Total purchase price
|
399,972
|
|
|
|
Less: cash acquired
|
(1,708
|
)
|
|
|
Total purchase price, net of cash acquired
|
398,264
|
|
|
|
Accounts receivable
|
3,877
|
|
|
|
Other current assets
|
295
|
|
|
|
Property and equipment
|
605
|
|
|
|
Intangible assets
|
125,400
|
|
|
|
Total assets acquired
|
130,177
|
|
|
|
Other current liabilities
|
5,871
|
|
|
|
Total liabilities assumed
|
5,871
|
|
|
|
Goodwill
|
$
|
273,958
|
|
Pro forma results of operations for this acquisition have not been presented because the effects on revenue and net income were not material to our historic consolidated financial statements. The Company reports CECity as part of its Performance Services segment.
Acquisition of HCI
Healthcare Insights, LLC ("HCI") has two primary businesses exclusively serving the healthcare provider market: (i) financial analytics which include budgeting, forecasting, and labor productivity applications, and (ii) clinical analytics which includes service line analytics and direct costing analytics to support value-based care. On July 31, 2015, PHSI acquired all of the limited liability company membership interests of HCI for
$64.3 million
in cash. The Company utilized available funds on hand to complete the acquisition. The acquisition also provides selling members with an earn-out opportunity of up to
$4.0 million
based on HCI's revenues during the twelve months ending December 31, 2017 as defined in the purchase agreement. The Company finalized the earn-out opportunity, which resulted in zero consideration paid to the seller.
The Company accounted for the HCI acquisition as a business combination whereby the purchase price was allocated to tangible and intangible assets (see
Note 8 - Intangible Assets, Net
) acquired and liabilities assumed based on their fair values. The HCI acquisition resulted in the recognition of approximately
$42.4 million
of goodwill attributable to the anticipated profitability of HCI. The HCI acquisition is considered an asset acquisition for tax purposes and accordingly, the Company expects the goodwill to be deductible for tax purposes. The Company reports HCI as part of its Performance Services segment.
104
(4) INVESTMENTS
Investments in Unconsolidated Affiliates
The Company's investments in unconsolidated affiliates consisted of the following (in thousands):
|
Carrying Value
|
Equity in Net Income (Loss)
|
|||||||||||||||
|
June 30,
|
Year Ended June 30,
|
|||||||||||||||
|
2018
|
2017
|
2018
|
2017
|
2016
|
||||||||||||
|
FFF
|
$
|
91,804
|
|
$
|
85,520
|
|
$
|
6,283
|
|
$
|
4,400
|
|
$
|
—
|
|
|
|
Bloodbuy
|
1,918
|
|
2,066
|
|
(147
|
)
|
(119
|
)
|
(65
|
)
|
||||||
|
PharmaPoint
|
—
|
|
4,232
|
|
(4,232
|
)
|
(340
|
)
|
(379
|
)
|
||||||
|
Innovatix
|
—
|
|
—
|
|
—
|
|
10,743
|
|
21,797
|
|
||||||
|
Other investments
|
331
|
|
1,061
|
|
(730
|
)
|
61
|
|
294
|
|
||||||
|
Total investments
|
$
|
94,053
|
|
$
|
92,879
|
|
$
|
1,174
|
|
$
|
14,745
|
|
$
|
21,647
|
|
|
On July 26, 2016, the Company, through its consolidated subsidiary, PSCI, acquired
49%
of the issued and outstanding stock of FFF Enterprises, Inc. ("FFF") for
$65.7 million
in cash plus consideration in the form of the FFF put and call rights. The Company recorded the initial investment in FFF in the accompanying Consolidated Balance Sheets at
$81.1 million
, of which
$65.7 million
was in cash and
$15.4 million
was consideration in the form of the initial net fair value of the FFF put and call rights (see
Note 5 - Fair Value Measurements
for additional information related to the fair values of the FFF put and call rights). The Company accounts for its investment in FFF using the equity method of accounting and includes the investment as part of the Supply Chain Services segment.
The Company, through its consolidated subsidiary, PSCI, held a
15%
ownership interest in BloodSolutions, LLC ("Bloodbuy") through its ownership of
5.3 million
units of Class B Membership Interests in Bloodbuy at
June 30, 2018 and 2017
. The Company accounts for its investment in Bloodbuy using the equity method of accounting as the Company has rights to appoint a Board member, and includes the investment as part of the Supply Chain Services segment.
The Company, through its consolidated subsidiary, PSCI, held a
28%
ownership interest in PharmaPoint, LLC ("PharmaPoint") through its ownership of
5.0 million
units of Class B Membership Interests in PharmaPoint at
June 30, 2018 and 2017
. During
the year ended June 30, 2018
, the Company determined that it was unlikely to recover its investment in PharmaPoint, and as a result recognized an other-than-temporary impairment of
$4.0 million
, which is included in equity in net income (loss) of unconsolidated affiliates in the accompanying Consolidated Statements of Income. The Company accounts for its investment in PharmaPoint using the equity method of accounting and includes the investment as part of the Supply Chain Services segment.
The Company, through its consolidated subsidiary, PSCI, held
50%
of the membership interests in Innovatix until December 2, 2016, at which time it acquired the remaining
50%
membership interests (see
Note 3 - Business Acquisitions
and
Note 19 - Related Party Transactions
). As a result, the Company recognized a one-time gain of
$205.1 million
during
the year ended June 30, 2017
related to the remeasurement of the then-existing
50%
ownership share to fair value. Prior to the acquisition, the Company accounted for its investment in Innovatix using the equity method of accounting and included the investment as part of the Supply Chain Services segment.
105
(5) FAIR VALUE MEASUREMENTS
Recurring Fair Value Measurements
The following table represents the Company's financial assets and liabilities, which are measured at fair value on a recurring basis (in thousands):
|
Quoted Prices in Active Markets for Identical Assets
(Level 1)
|
Significant Other Observable Inputs
(Level 2)
|
Significant Unobservable Inputs
(Level 3)
|
||||||||||
|
June 30, 2018
|
||||||||||||
|
Cash equivalents
|
$
|
62,684
|
|
$
|
62,684
|
|
$
|
—
|
|
$
|
—
|
|
|
FFF call right
|
610
|
|
—
|
|
—
|
|
610
|
|
||||
|
Deferred compensation plan assets
|
48,215
|
|
48,215
|
|
—
|
|
—
|
|
||||
|
Total assets
|
$
|
111,509
|
|
$
|
110,899
|
|
$
|
—
|
|
$
|
610
|
|
|
FFF put right
|
$
|
42,041
|
|
$
|
—
|
|
$
|
—
|
|
$
|
42,041
|
|
|
Total liabilities
|
$
|
42,041
|
|
$
|
—
|
|
$
|
—
|
|
$
|
42,041
|
|
|
June 30, 2017
|
||||||||||||
|
Cash equivalents
|
$
|
22,218
|
|
$
|
22,218
|
|
$
|
—
|
|
$
|
—
|
|
|
FFF call right
|
4,655
|
|
—
|
|
—
|
|
4,655
|
|
||||
|
Deferred compensation plan assets
|
47,202
|
|
47,202
|
|
—
|
|
—
|
|
||||
|
Total assets
|
$
|
74,075
|
|
$
|
69,420
|
|
$
|
—
|
|
$
|
4,655
|
|
|
Earn-out liabilities
|
$
|
21,310
|
|
$
|
—
|
|
$
|
—
|
|
$
|
21,310
|
|
|
FFF put right
|
24,050
|
|
—
|
|
—
|
|
24,050
|
|
||||
|
Total liabilities
|
$
|
45,360
|
|
$
|
—
|
|
$
|
—
|
|
$
|
45,360
|
|
Cash equivalents were included in cash and cash equivalents in the accompanying Consolidated Balance Sheets (see
Note 4 - Investments
).
Deferred compensation plan assets consisted of highly liquid mutual fund investments, which were classified as Level 1. The current portion of deferred compensation plan assets was included in prepaid expenses and other current assets (
$3.6 million
and
$5.7 million
at
June 30, 2018 and 2017
, respectively) in the accompanying Consolidated Balance Sheets.
Financial Instruments Measured at Fair Value on a Recurring Basis Using Significant Unobservable Inputs (Level 3)
Earn-out liabilities
Earn-out liabilities were incurred in connection with acquisitions of HCI on July 31, 2015, Inflow on October 1, 2015 and Innovatix and Essensa on December 2, 2016 (see
Note 3 - Business Acquisitions
). The earn-out liabilities were classified as Level 3 of the fair value hierarchy and their values were determined based on estimated future earnings and the probability of achieving them. The decrease in the earn-out liabilities is attributable to the
$21.1 million
earn-out payment to GNYHA Holdings that occurred during the current year (see
Note 3 - Business Acquisitions
). Changes in the fair values of the earn-out liabilities were recorded within selling, general and administrative expenses in the accompanying Consolidated Statements of Income.
FFF put and call rights
Pursuant to a shareholders' agreement entered into in connection with the Company's equity investment in FFF on July 26, 2016 (see
Note 4 - Investments
), which shareholders' agreement was amended and restated November 22, 2017, the majority shareholder of FFF holds a put right that provides such shareholder the right to require the Company to purchase (i) up to
50%
of its interest in FFF, which is exercisable beginning on July 26, 2020, the fourth anniversary of the investment closing date and (ii) all or a portion of its remaining interest in FFF on or after December 31, 2020. Any such required purchases are to be made at a per share price equal to FFF's earnings before interest, taxes, depreciation and amortization ("EBITDA") over the twelve calendar months
106
prior to the purchase date multiplied by a market adjusted multiple, adjusted for any outstanding debt and cash and cash equivalents ("Equity Value per Share"). In addition, the amended and restated shareholders' agreement provides the Company with a call right requiring the majority shareholder to sell its remaining interest in FFF to the Company, which is exercisable at any time within the later of
180
calendar days after the date of a Key Man Event (generally defined in the amended and restated shareholders' agreement as the resignation, termination for cause, death or disability of the majority shareholder) or 30 calendar days after December 31, 2020. In the event that the FFF put or call rights are exercised, the purchase price for the additional interest in FFF will be at a per share price equal to the Equity Value per Share.
The fair values of the FFF put and call rights were determined based on the Equity Value per Share calculation using unobservable inputs, which included the estimated FFF put and call rights' expiration dates, the forecast of FFF's EBITDA over the option period, forecasted movements in the overall market and the likelihood of a Key Man Event. Significant changes to the Equity Value per Share resulting from changes in the unobservable inputs could have a significant impact on the fair values of the FFF put and call rights.
The Company recorded the FFF put and call rights within long-term other liabilities and long-term other assets, respectively, within the accompanying Consolidated Balance Sheets. Net changes in the fair values of the FFF put and call rights were recorded within other income (expense) in the accompanying Consolidated Statements of Income.
A reconciliation of the Company's earn-out liabilities and FFF put and call rights is as follows (in thousands):
|
Beginning Balance
|
Purchases (Settlements)
|
Gain (Loss)
|
Ending Balance
|
|||||||||
|
Year ended June 30, 2018
|
||||||||||||
|
FFF call right
|
$
|
4,655
|
|
$
|
—
|
|
$
|
(4,045
|
)
|
$
|
610
|
|
|
Total Level 3 assets
|
$
|
4,655
|
|
$
|
—
|
|
$
|
(4,045
|
)
|
$
|
610
|
|
|
Earn-out liabilities
|
$
|
21,310
|
|
$
|
(21,125
|
)
|
$
|
185
|
|
$
|
—
|
|
|
FFF put right
|
24,050
|
|
—
|
|
(17,991
|
)
|
42,041
|
|
||||
|
Total Level 3 liabilities
|
$
|
45,360
|
|
$
|
(21,125
|
)
|
$
|
(17,806
|
)
|
$
|
42,041
|
|
|
Year ended June 30, 2017
|
||||||||||||
|
FFF call right
|
$
|
—
|
|
$
|
10,361
|
|
$
|
(5,706
|
)
|
$
|
4,655
|
|
|
Total Level 3 assets
|
$
|
—
|
|
$
|
10,361
|
|
$
|
(5,706
|
)
|
$
|
4,655
|
|
|
Earn-out liabilities
|
$
|
4,128
|
|
$
|
16,662
|
|
$
|
(520
|
)
|
$
|
21,310
|
|
|
FFF put right
|
—
|
|
25,821
|
|
1,771
|
|
24,050
|
|
||||
|
Total Level 3 liabilities
|
$
|
4,128
|
|
$
|
42,483
|
|
$
|
1,251
|
|
$
|
45,360
|
|
Non-Recurring Fair Value Measurements
During
the year ended June 30, 2018
, no non-recurring fair value measurements were required relating to the measurement of goodwill and intangible assets for impairment. However, purchase price allocations required significant non-recurring Level 3 inputs. The fair values of the acquired intangible assets resulting from the acquisitions of Acro Pharmaceuticals and Innovatix and Essensa were determined using the income approach (see
Note 3 - Business Acquisitions
).
The Company recognized a one-time gain of
$205.1 million
during
the year ended June 30, 2017
related to the remeasurement of the Company's
50%
equity method investment in Innovatix to fair value upon acquisition of the remaining interest in Innovatix (see
Note 3 - Business Acquisitions
). The fair value of the investment was calculated using a discounted cash flow model.
Financial Instruments For Which Fair Value Only is Disclosed
The fair values of non-interest bearing notes payable, classified as Level 2, were less than their carrying value by approximately
$0.6 million
and
$0.6 million
at
June 30, 2018 and 2017
, respectively, based on assumed market interest rates of
3.6%
and
2.6%
, respectively.
Other Financial Instruments
The fair values of cash, accounts receivable, accounts payable, accrued liabilities and the Company's Credit Facility approximated carrying value due to the short-term nature of these financial instruments.
(6) ACCOUNTS RECEIVABLE, NET
Trade accounts receivable consisted primarily of amounts due from hospital and healthcare system members for services and products. Managed services receivable consisted of amounts receivable related to fees for services provided to members utilizing the Company's integrated pharmacy services to support contract negotiation and administration, claims data, rebate processing and evaluation of pharmacy formulary and utilization.
|
June 30,
|
||||||
|
2018
|
2017
|
|||||
|
Trade accounts receivable
|
$
|
150,426
|
|
$
|
130,126
|
|
|
Managed services receivable
|
35,766
|
|
31,383
|
|
||
|
Other
|
1,523
|
|
48
|
|
||
|
Total accounts receivable
|
187,715
|
|
161,557
|
|
||
|
Allowance for doubtful accounts
|
(1,841
|
)
|
(1,812
|
)
|
||
|
Accounts receivable, net
|
$
|
185,874
|
|
$
|
159,745
|
|
107
(7) PROPERTY AND EQUIPMENT, NET
Property and equipment, net consisted of the following (in thousands):
|
June 30,
|
|||||||
|
Useful life
|
2018
|
2017
|
|||||
|
Capitalized software
|
2-5 years
|
$
|
409,017
|
|
$
|
340,271
|
|
|
Computer hardware
|
3-5 years
|
68,057
|
|
57,320
|
|
||
|
Furniture and other equipment
|
5 years
|
8,284
|
|
8,218
|
|
||
|
Leasehold improvements
|
Lesser of estimated useful life or term of lease
|
18,926
|
|
18,016
|
|
||
|
Total property and equipment
|
504,284
|
|
423,825
|
|
|||
|
Accumulated depreciation and amortization
|
(297,591
|
)
|
(236,460
|
)
|
|||
|
Property and equipment, net
|
$
|
206,693
|
|
$
|
187,365
|
|
|
Depreciation and amortization expense related to property and equipment was
$71.3 million
,
$58.9 million
and
$51.1 million
for
the years ended June 30, 2018, 2017 and 2016
, respectively. Unamortized capitalized software costs were
$157.0 million
and
$161.4 million
at
June 30, 2018 and 2017
, respectively.
The Company did not incur a material loss on disposal of long-lived assets during
the years ended June 30, 2018, 2017 and 2016
.
(8) INTANGIBLE ASSETS, NET
Intangible assets, net consisted of the following (in thousands):
|
June 30,
|
|||||||
|
Useful Life
|
2018
|
2017
|
|||||
|
Member relationships
|
14.7 years
|
$
|
220,100
|
|
$
|
220,100
|
|
|
Technology
|
5.0 years
|
142,317
|
|
143,727
|
|
||
|
Customer relationships
|
8.3 years
|
48,120
|
|
48,120
|
|
||
|
Trade names
|
8.3 years
|
22,710
|
|
22,710
|
|
||
|
Distribution network
|
10.0 years
|
22,400
|
|
22,400
|
|
||
|
Favorable lease commitments
|
10.1 years
|
11,393
|
|
11,393
|
|
||
|
Non-compete agreements
|
5.9 years
|
8,710
|
|
8,710
|
|
||
|
Total intangible assets
|
475,750
|
|
477,160
|
|
|||
|
Accumulated amortization
|
(153,635
|
)
|
(99,198
|
)
|
|||
|
Total intangible assets, net
|
$
|
322,115
|
|
$
|
377,962
|
|
|
Intangible asset amortization totaled
$55.4 million
,
$48.3 million
and
$33.1 million
for
the years ended June 30, 2018, 2017 and 2016
, respectively.
The estimated aggregate amortization expense for each of the next five fiscal years and thereafter is as follows (in thousands):
|
2019
|
$
|
53,941
|
|
|
2020
|
49,077
|
|
|
|
2021
|
27,953
|
|
|
|
2022
|
24,964
|
|
|
|
2023
|
23,890
|
|
|
|
Thereafter
|
139,290
|
|
|
|
Total amortization expense
(a)
|
$
|
319,115
|
|
|
(a)
|
Estimated aggregate amortization expense for the next five fiscal years and thereafter excludes amortization on technology under development, which was classified as technology in the total intangible assets, net table, of
$3.0 million
at
June 30, 2018
.
|
The net carrying value of intangible assets by segment was as follows (in thousands):
|
June 30,
|
||||||
|
2018
|
2017
|
|||||
|
Supply Chain Services
|
$
|
235,485
|
|
$
|
255,601
|
|
|
Performance Services
|
86,630
|
|
122,361
|
|
||
|
Total intangible assets, net
|
$
|
322,115
|
|
$
|
377,962
|
|
108
(9) GOODWILL
Goodwill consisted of the following (in thousands):
|
June 30,
|
||||||
|
2018
|
2017
|
|||||
|
Supply Chain Services
|
$
|
400,348
|
|
$
|
400,348
|
|
|
Performance Services
|
506,197
|
|
506,197
|
|
||
|
Total goodwill
|
$
|
906,545
|
|
$
|
906,545
|
|
(10) OTHER LONG-TERM ASSETS
Other long-term assets consisted of the following (in thousands):
|
June 30,
|
||||||
|
2018
|
2017
|
|||||
|
Deferred loan costs, net
|
$
|
506
|
|
$
|
1,051
|
|
|
FFF call right
|
610
|
|
4,655
|
|
||
|
Other
|
2,875
|
|
4,565
|
|
||
|
Total other long-term assets
|
$
|
3,991
|
|
$
|
10,271
|
|
The Company recorded
$0.5 million
,
$0.5 million
and
$0.5 million
in amortization expense on deferred loan costs during
the years ended June 30, 2018, 2017 and 2016
, respectively. Amortization expense on deferred loan costs was recognized based on the straight-line method, which approximates the effective interest method, and was included in interest and investment income, net in the Consolidated Statements of Income.
Pursuant to a shareholders' agreement entered into in connection with the Company's equity investment in FFF on July 26, 2016,
as amended and restated on November 22, 2017
(see
Note 4 - Investments
), the Company obtained a call right to purchase the remaining interest in FFF from the majority shareholder (see
Note 5 - Fair Value Measurements
).
Long-term debt consisted of the following (in thousands):
|
June 30,
|
||||||||||
|
Commitment Amount
|
Due Date
|
2018
|
2017
|
|||||||
|
Credit Facility
|
$
|
750,000
|
|
June 24, 2019
|
$
|
100,000
|
|
$
|
220,000
|
|
|
Notes payable
|
—
|
|
Various
|
7,212
|
|
14,272
|
|
|||
|
Total debt
|
107,212
|
|
234,272
|
|
||||||
|
Less: current portion
|
(100,250
|
)
|
(227,993
|
)
|
||||||
|
Total long-term debt
|
$
|
6,962
|
|
$
|
6,279
|
|
||||
Credit Facility
Premier LP, along with its consolidated subsidiaries, PSCI and PHSI, as Co-Borrowers, Premier GP and certain domestic subsidiaries of Premier GP, as guarantors, entered into an unsecured Credit Facility, dated as of June 24, 2014, and amended on June 4, 2015. The Credit Facility has a maturity date of June 24, 2019. The Company expects to commence negotiations to refinance or replace the Credit Facility during the first half of fiscal 2019. The Credit Facility provides for borrowings of up to
$750.0 million
with (i) a
$25.0 million
sub-facility for standby letters of credit and (ii) a
$75.0 million
sub-facility for swingline loans. The Credit Facility may be increased from time to time at the Company's request up to an aggregate additional amount of
$250.0 million
, subject to lender approval. The Credit Facility includes an unconditional and irrevocable guaranty of all obligations under the Credit Facility by Premier GP, certain domestic subsidiaries of Premier GP and future guarantors, if any. Premier, Inc. is not a guarantor under the Credit Facility.
At the Company's option, committed loans may be in the form of Eurodollar rate loans ("Eurodollar Loans") or base rate loans ("Base Rate Loans"). Eurodollar Loans bear interest at the Eurodollar rate (defined as the London Interbank Offered Rate, or LIBOR, plus the Applicable Rate (defined as a margin based on the Consolidated Total Leverage Ratio (as defined in the Credit Facility))). Base Rate Loans bear interest at the
Base Rate
(defined as the highest of the
prime rate
announced by the administrative agent, the
federal funds effective rate
plus
0.50%
or the
one-month LIBOR
plus
1.0%
) plus the Applicable Rate. The Applicable Rate ranges from
1.125%
to
1.750%
for Eurodollar Loans and
0.125%
to
0.750%
for Base Rate Loans. At
June 30, 2018
, the interest rate for
three-month Eurodollar
Loans was
3.461%
and the interest rate for Base Rate Loans was
5.125%
. The Co-Borrowers are required to pay a commitment fee ranging from
0.125%
to
0.250%
per annum on the actual daily unused amount of commitments under the Credit Facility. At
June 30, 2018
, the commitment fee was
0.125%
.
109
The Credit Facility contains customary representations and warranties as well as customary affirmative and negative covenants, including, among others, limitations on liens, indebtedness, fundamental changes, dispositions, restricted payments and investments of which certain covenant calculations use EBITDA, a Non-GAAP financial measure. Under the terms of the Credit Facility, Premier GP is not permitted to allow its consolidated total leverage ratio (as defined in the Credit Facility) to exceed
3.00
to
1.00
for any period of
four
consecutive quarters. In addition, Premier GP must maintain a minimum consolidated interest coverage ratio (as defined in the Credit Facility) of
3.00
to
1.00
at the end of every fiscal quarter. Premier GP was in compliance with all such covenants at
June 30, 2018
.
The Credit Facility also contains customary events of default including, among others, payment defaults, breaches of representations and warranties, covenant defaults, cross-defaults of any indebtedness or guarantees in excess of
$30.0 million
, bankruptcy and other insolvency events, judgment defaults in excess of
$30.0 million
, and the occurrence of a change of control (as defined in the Credit Facility). If any event of default occurs and is continuing, the administrative agent under the Credit Facility may, with the consent, or shall, at the request, of the required lenders, terminate the commitments and declare all of the amounts owed under the Credit Facility to be immediately due and payable. The Company may prepay amounts outstanding under the Credit Facility without premium or penalty provided that Co-Borrowers compensate the lenders for losses and expenses incurred as a result of the prepayment of any Eurodollar Loan, as defined in the Credit Facility.
Proceeds from borrowings under the Credit Facility may generally be used to finance ongoing working capital requirements, including permitted acquisitions, discretionary cash settlements of Class B unit exchanges under the Exchange Agreement, repurchases of Class A common stock pursuant to stock repurchase programs and other general corporate activities. During
the year ended June 30, 2018
, the Company utilized borrowings of
$30.0 million
under the Credit Facility, to partially fund the
$200.0 million
authorized share repurchase program and other general corporate activities. During
the year ended June 30, 2018
, the Company repaid
$150.0 million
of borrowings under the Credit Facility.
Interest expense incurred during
the year ended June 30, 2018
was
$6.6 million
and cash paid for interest during
the year ended June 30, 2018
was
$5.9 million
.
Notes Payable
At
June 30, 2018 and 2017
, the Company had
$7.2 million
and
$14.3 million
, respectively, in notes payable consisting primarily of non-interest bearing notes payable outstanding to departed member owners, of which
$0.2 million
and
$8.0 million
, respectively, were included in current portion of long-term debt and
$7.0 million
and
$6.3 million
, respectively, were included in long-term debt, less current portion, in the accompanying Consolidated Balance Sheets. Notes payable generally have stated maturities of
five
years from their date of issuance.
Future minimum principal payments on the notes as of
June 30, 2018
are as follows (in thousands):
|
2019
|
$
|
250
|
|
|
2020
|
2,046
|
|
|
|
2021
|
3,556
|
|
|
|
2022
|
416
|
|
|
|
2023
|
944
|
|
|
|
Thereafter
|
—
|
|
|
|
Total principal payments
|
$
|
7,212
|
|
110
(12) OTHER LONG-TERM LIABILITIES
Other long-term liabilities consisted of the following (in thousands):
|
June 30,
|
||||||
|
2018
|
2017
|
|||||
|
Deferred rent
|
$
|
13,402
|
|
$
|
14,045
|
|
|
Reserve for uncertain tax positions
|
8,261
|
|
3,819
|
|
||
|
Earn-out liability, less current portion
|
—
|
|
185
|
|
||
|
FFF put right
|
42,041
|
|
24,050
|
|
||
|
Total other long-term liabilities
|
$
|
63,704
|
|
$
|
42,099
|
|
Pursuant to an amended and restated shareholders' agreement entered into in connection with the Company's equity investment in FFF (see
Note 4 - Investments
), the majority shareholder of FFF obtained a put right that provides such shareholder the right to sell all or any portion of its interest in FFF to the Company (see
Note 5 - Fair Value Measurements
).
(13) REDEEMABLE LIMITED PARTNERS' CAPITAL
Redeemable limited partners' capital represents the member owners'
60%
ownership of Premier LP through their ownership of Class B common units at
June 30, 2018
. The member owners hold the majority of the votes of the Board of Directors and any redemption or transfer or choice of consideration cannot be assumed to be within the control of the Company. Therefore, redeemable limited partners' capital is recorded at the greater of the book value or redemption amount per the LP Agreement (see
Note 1 - Organization and Basis of Presentation
for more information), and is calculated as the fair value of all Class B common units as if immediately exchangeable into Class A common shares. For
the years ended June 30, 2018, 2017 and 2016
, the Company recorded adjustments to the fair value of redeemable limited partners' capital as an adjustment of redeemable limited partners' capital to redemption amount in the accompanying Consolidated Statements of Income in the amounts of
$(157.6) million
,
$37.2 million
and
$(776.8) million
, respectively.
Redeemable limited partners' capital is classified as temporary equity in the mezzanine section of the accompanying Consolidated Balance Sheets as, pursuant to the LP Agreement, withdrawal is at the option of each member owner and the conditions of the repurchase are not solely within the Company's control.
The table below provides a summary of the changes in the redeemable limited partners' capital from
June 30, 2015
to
June 30, 2018
(in thousands):
|
Receivables From Limited Partners
|
Redeemable Limited Partners' Capital
|
Accumulated Other Comprehensive Income (Loss)
|
Total Redeemable Limited Partners' Capital
|
|||||||||
|
June 30, 2015
|
$
|
(11,633
|
)
|
$
|
4,091,473
|
|
$
|
(8
|
)
|
$
|
4,079,832
|
|
|
Distributions applied to receivables from limited partners
|
5,407
|
|
—
|
|
—
|
|
5,407
|
|
||||
|
Redemption of limited partners
|
—
|
|
(4,281
|
)
|
—
|
|
(4,281
|
)
|
||||
|
Net income attributable to non-controlling interest in Premier LP
|
—
|
|
193,547
|
|
—
|
|
193,547
|
|
||||
|
Distributions to limited partners
|
—
|
|
(92,767
|
)
|
—
|
|
(92,767
|
)
|
||||
|
Net unrealized loss on marketable securities
|
—
|
|
—
|
|
(77
|
)
|
(77
|
)
|
||||
|
Exchange of Class B common units for Class A common stock by member owners
|
—
|
|
(267,681
|
)
|
—
|
|
(267,681
|
)
|
||||
|
Adjustment of redeemable limited partners' capital to redemption amount
|
—
|
|
(776,750
|
)
|
—
|
|
(776,750
|
)
|
||||
|
June 30, 2016
|
$
|
(6,226
|
)
|
$
|
3,143,541
|
|
$
|
(85
|
)
|
$
|
3,137,230
|
|
|
Distributions applied to receivables from limited partners
|
2,049
|
|
—
|
|
—
|
|
2,049
|
|
||||
111
|
Receivables From Limited Partners
|
Redeemable Limited Partners' Capital
|
Accumulated Other Comprehensive Income (Loss)
|
Total Redeemable Limited Partners' Capital
|
|||||||||
|
Redemption of limited partners
|
—
|
|
(416
|
)
|
—
|
|
(416
|
)
|
||||
|
Net income attributable to non-controlling interest in Premier LP
|
—
|
|
336,052
|
|
—
|
|
336,052
|
|
||||
|
Distributions to limited partners
|
—
|
|
(92,892
|
)
|
—
|
|
(92,892
|
)
|
||||
|
Net realized loss on marketable securities
|
—
|
|
—
|
|
85
|
|
85
|
|
||||
|
Exchange of Class B common units for Class A common stock by member owners
|
—
|
|
(157,371
|
)
|
—
|
|
(157,371
|
)
|
||||
|
Exchange of Class B common units for cash by member owners
|
—
|
|
(123,330
|
)
|
—
|
|
(123,330
|
)
|
||||
|
Adjustment of redeemable limited partners' capital to redemption amount
|
—
|
|
37,176
|
|
—
|
|
37,176
|
|
||||
|
June 30, 2017
|
$
|
(4,177
|
)
|
$
|
3,142,760
|
|
$
|
—
|
|
$
|
3,138,583
|
|
|
Distributions applied to receivables from limited partners
|
1,972
|
|
—
|
|
—
|
|
1,972
|
|
||||
|
Redemption of limited partners
|
—
|
|
(942
|
)
|
—
|
|
(942
|
)
|
||||
|
Net income attributable to non-controlling interest in Premier LP
|
—
|
|
224,269
|
|
—
|
|
224,269
|
|
||||
|
Distributions to limited partners
|
—
|
|
(69,770
|
)
|
—
|
|
(69,770
|
)
|
||||
|
Exchange of Class B common units for Class A common stock by member owners
|
—
|
|
(216,121
|
)
|
—
|
|
(216,121
|
)
|
||||
|
Adjustment of redeemable limited partners' capital to redemption amount
|
—
|
|
(157,581
|
)
|
—
|
|
(157,581
|
)
|
||||
|
June 30, 2018
|
$
|
(2,205
|
)
|
$
|
2,922,615
|
|
$
|
—
|
|
$
|
2,920,410
|
|
Receivables from limited partners represent amounts due from limited partners for their required capital in Premier LP. These receivables are either interest bearing notes that were issued to new limited partners or non-interest bearing loans (contribution loans) provided to existing limited partners. These receivables are reflected as a reduction to redeemable limited partners' capital so that amounts due from limited partners for capital are not reflected as redeemable limited partnership capital until paid.
No
interest bearing notes receivable were executed by limited partners of Premier LP during
the years ended June 30, 2018, 2017 and 2016
.
During
the year ended June 30, 2018
,
four
limited partners withdrew from Premier LP. The limited partnership agreement provides for the redemption of former limited partner's Class B common units that are not eligible for exchange in the form of a
five
-year, unsecured, non-interest bearing term promissory note, a cash payment equal to the present value of the redemption amount, or other mutually agreed upon terms. Partnership interest obligations to former limited partners are reflected in notes payable in the accompanying Consolidated Balance Sheets. Under the Exchange Agreement, Class B common units that are eligible for exchange by withdrawing limited partners must be exchanged in the subsequent quarter's exchange process.
Premier LP's distribution policy requires cash distributions as long as taxable income is generated and cash is available to distribute on a quarterly basis prior to the 60
th
day after the end of each calendar quarter. The Company makes quarterly distributions to its limited partners in the form of a legal partnership income distribution governed by the terms of the LP Agreement. These partner distributions are based on the limited partner's ownership in Premier LP and relative participation across Premier service offerings. While these distributions are based on relative participation across Premier service offerings, they are not based directly on revenue generated from an individual partner's participation as the distributions are based on the net income (loss) of the partnership which encompasses the operating expenses of the partnership as well as participation by non-owner members in Premier's service offerings. To the extent Premier LP incurred a net loss, the limited partners would not receive a quarterly distribution. As provided in the LP Agreement, the amount of actual cash distributed may be reduced by the amount of such distributions used by limited partners to offset contribution loans or other amounts payable to the Company.
112
Quarterly distributions made to limited partners during the current fiscal year are as follows (in thousands):
|
Date
|
Distribution
(a)
|
||
|
August 24, 2017
|
$
|
24,951
|
|
|
November 22, 2017
|
$
|
20,752
|
|
|
February 22, 2018
|
$
|
20,396
|
|
|
May 24, 2018
|
$
|
13,157
|
|
|
(a)
|
Distributions are equal to Premier LP's total taxable income from the preceding fiscal quarter-to-date period for each respective distribution date multiplied by the Company's standalone effective combined federal, state and local income tax rate for each respective distribution date. Premier LP expects to make a
$15.5
million quarterly distribution on or before August 23, 2018. The distribution is reflected in limited partners' distribution payable in the accompanying Consolidated Balance Sheets at
June 30, 2018
.
|
Pursuant to the Exchange Agreement (see
Note 1 - Organization and Basis of Presentation
for more information), each limited partner has the cumulative right to exchange up to one-seventh of its initial allocation of Class B common units for shares of Class A common stock, cash or a combination of both, the form of consideration to be at the discretion of the Company's independent Audit and Compliance Committee of the Board of Directors. During
the year ended June 30, 2018
, the Company recorded total reductions of
$216.1 million
to redeemable limited partners' capital to reflect the exchange of approximately
6.5 million
Class B common units and surrender of associated shares of Class B common stock by member owners for a like number of shares of the Company's Class A common stock (see
Note 15 - Earnings (Loss) Per Share
for more information). Quarterly exchanges during the current fiscal year were as follows (in thousands, except Class B common units):
|
Date of Quarterly Exchange
|
Number of Class B Common Units Exchanged
|
Reduction in Redeemable Limited Partners' Capital
|
|||
|
July 31, 2017
|
1,231,410
|
|
$
|
42,976
|
|
|
October 31, 2017
|
3,651,294
|
|
119,289
|
|
|
|
January 31, 2018
|
1,006,435
|
|
32,659
|
|
|
|
April 30, 2018
|
642,566
|
|
21,197
|
|
|
|
6,531,705
|
|
$
|
216,121
|
|
|
(14) STOCKHOLDERS' DEFICIT
As of
June 30, 2018
, there were
57,530,733
shares of the Company's Class A common stock, par value
$0.01
per share, and
80,335,701
shares of the Company's Class B common stock, par value
$0.000001
per share, outstanding.
On October 31, 2017, the Company's Board of Directors authorized the repurchase of up to
$200.0 million
of our outstanding Class A common stock as part of a balanced capital deployment strategy, such repurchases to be made from time to time in private or open market transactions at the Company's discretion in accordance with applicable federal securities laws. The Company completed its stock repurchase program during the fiscal year ended June, 30 2018 and purchased approximately
6.4 million
shares of Class A common stock at an average price of
$31.16
per share for a total purchase price of
$200.0 million
.
Holders of Class A common stock are entitled to (i)
one vote for each share held
of record on all matters submitted to a vote of stockholders, (ii) receive dividends, when and if declared by the Board of Directors out of funds legally available, subject to any statutory or contractual restrictions on the payment of dividends and subject to any restrictions on the payment of dividends imposed by the terms of any outstanding preferred stock or any class of series of stock having a preference over or the right to participate with the Class A common stock with respect to the payment of dividends or other distributions and (iii) receive pro rata, based on the number of shares of Class A common stock held, the remaining assets available for distribution upon the dissolution or liquidation of Premier, after payment in full of all amounts required to be paid to creditors and to the holders of preferred stock having liquidation preferences, if any.
Holders of Class B common stock are entitled to
one vote for each share held
of record on all matters submitted to a vote of stockholders, but are not entitled to receive dividends, other than dividends payable in shares of Premier's common stock, or to receive a distribution upon the dissolution or a liquidation of Premier. Pursuant to the Voting Trust Agreement, the trustee will vote all of the Class B common stock as a block in the manner determined by the plurality of the votes received by the trustee from the member owners for the election of directors to serve on the Board of Directors, and by a majority of the votes received by the trustee from the member owners for all other matters. Class B common stock will not be listed on any stock exchange and, except in connection with any permitted sale or transfer of Class B common units, cannot be sold or transferred.
113
(15) EARNINGS (LOSS) PER SHARE
Basic earnings per share of Premier is computed by dividing net income attributable to stockholders by the weighted average number of shares of common stock outstanding for the period. Net income attributable to stockholders includes the adjustment recorded in the period to reflect redeemable limited partners' capital at the redemption amount, as a result of the exchange benefit obtained by limited partners through the ownership of Class B common units. Except when the effect would be anti-dilutive, the diluted earnings (loss) per share calculation, which is calculated using the treasury stock method, includes the impact of shares that could be issued under the outstanding stock options, non-vested restricted stock units and awards, shares of non-vested performance share awards and the effect of the assumed redemption of Class B common units through the issuance of Class A common shares.
The following table provides a reconciliation of the numerator and denominator used for basic and diluted earnings (loss) per share (in thousands, except per share amounts):
|
Year Ended June 30,
|
|||||||||
|
2018
|
2017
|
2016
|
|||||||
|
Numerator for basic earnings per share:
|
|||||||||
|
Net income attributable to stockholders
|
$
|
190,882
|
|
$
|
76,249
|
|
$
|
818,364
|
|
|
Numerator for diluted earnings per share:
|
|||||||||
|
Net income attributable to stockholders
|
$
|
190,882
|
|
$
|
76,249
|
|
$
|
818,364
|
|
|
Adjustment of redeemable limited partners' capital to redemption amount
|
(157,581
|
)
|
—
|
|
(776,750
|
)
|
|||
|
Net income attributable to non-controlling interest in Premier LP
|
224,269
|
|
—
|
|
193,547
|
|
|||
|
Net income
|
257,570
|
|
76,249
|
|
235,161
|
|
|||
|
Tax effect on Premier, Inc. net income
(a)
|
(70,257
|
)
|
—
|
|
(93,836
|
)
|
|||
|
Adjusted net income
|
$
|
187,313
|
|
$
|
76,249
|
|
$
|
141,325
|
|
|
Denominator for basic earnings per share:
|
|||||||||
|
Weighted average shares
(b)
|
53,518
|
|
49,654
|
|
42,368
|
|
|||
|
Denominator for diluted earnings per share:
|
|||||||||
|
Weighted average shares
(b)
|
53,518
|
|
49,654
|
|
42,368
|
|
|||
|
Effect of dilutive securities:
(c)
|
|||||||||
|
Stock options
|
275
|
|
286
|
|
348
|
|
|||
|
Restricted stock
|
295
|
|
215
|
|
589
|
|
|||
|
Performance share awards
|
252
|
|
219
|
|
1,429
|
|
|||
|
Class B shares outstanding
|
83,000
|
|
—
|
|
100,574
|
|
|||
|
Weighted average shares and assumed conversions
|
137,340
|
|
50,374
|
|
145,308
|
|
|||
|
Basic earnings per share
|
$
|
3.57
|
|
$
|
1.54
|
|
$
|
19.32
|
|
|
Diluted earnings per share
|
$
|
1.36
|
|
$
|
1.51
|
|
$
|
0.97
|
|
|
(a)
|
Represents income tax expense related to Premier, Inc. retaining the portion of net income attributable to income from non-controlling interest in Premier, LP for the purpose of diluted earnings (loss) per share.
|
|
(b)
|
Weighted average number of common shares used for basic earnings per share excludes weighted average shares of non-vested stock options, non-vested restricted stock, non-vested performance share awards and Class B shares outstanding for
the years ended June 30, 2018, 2017 and 2016
.
|
|
(c)
|
For
the year ended June 30, 2018
, the effect of
1.6 million
stock options were excluded from diluted weighted average shares outstanding as they had an anti-dilutive effect. For
the year ended June 30, 2017
, the effect of
90.8 million
Class B common units exchangeable for Class A common shares and
1.3 million
stock options were excluded from diluted weighted average shares outstanding as they had an anti-dilutive effect. For
the year ended June 30, 2016
, the effect of
1.3 million
stock options were excluded from diluted weighted average share outstanding as they had an anti-dilutive effect.
|
114
Pursuant to the terms of the Exchange Agreement, on a quarterly basis, the Company has the option, as determined by the independent Audit and Compliance Committee, to settle the exchange of Class B common units of Premier LP by member owners for cash, an equal number of Class A common shares of Premier, Inc. or a combination of cash and shares of Class A common stock. In connection with the exchange of Class B common units by member owners, regardless of the consideration used to settle the exchange, an equal number of shares of Premier's Class B common stock are surrendered by member owners and retired (see
Note 13 - Redeemable Limited Partners' Capital
). The following table presents certain information regarding the exchange of Class B common units and associated Class B common stock for Premier's Class A common stock and/or cash in connection with the quarterly exchanges pursuant to the terms of the Exchange Agreement, including activity related to the Class A and Class B common units and Class A and Class B common stock through the date of the applicable quarterly exchange:
|
Quarterly Exchange by Member Owners
|
Class B Common Shares Retired Upon Exchange
(a)
|
Class B Common Shares Outstanding After Exchange
(a)
|
Class A Common Shares Outstanding After Exchange
(b)
|
Percentage of Combined Voting Power Class B/Class A Common Stock
|
|||
|
July 31, 2017
|
1,231,410
|
|
86,067,478
|
|
53,212,057
|
|
62%/38%
|
|
October 31, 2017
|
3,651,294
|
|
82,416,184
|
|
57,215,143
|
|
59%/41%
|
|
January 31, 2018
|
1,006,435
|
|
81,169,319
|
|
54,829,086
|
|
60%/40%
|
|
April 30, 2018
|
642,566
|
|
80,335,701
|
|
52,585,392
|
|
60%/40%
|
|
July 31, 2018
(c)
|
816,468
|
|
79,519,233
|
|
53,256,897
|
|
60%/40%
|
|
(a)
|
The number of Class B common shares retired or outstanding are equivalent to the number of Class B common units retired upon exchange or outstanding after the exchange, as applicable.
|
|
(b)
|
The number of Class A common shares outstanding after exchange also includes activity related to the Company's share repurchase program (see Note 14 - Stockholders' Deficit), equity incentive plan (see Note 16 - Stock-Based Compensation) and departed member owners (see Note 13 - Redeemable Limited Partners' Capital).
|
|
(c)
|
As the quarterly exchange occurred on July 31, 2018, the impact of the exchange is not reflected in the consolidated financial statements for
the year ended June 30, 2018
.
|
(16) STOCK-BASED COMPENSATION
Stock-based compensation expense is recognized over the requisite service period, which generally equals the stated vesting period. Pre-tax stock-based compensation expense was
$29.4 million
,
$26.5 million
and
$48.7 million
for
the years ended June 30, 2018, 2017 and 2016
, respectively, with a resulting deferred tax benefit of
$7.3 million
,
$10.1 million
and
$18.5 million
, respectively. The deferred tax benefit was calculated at a rate of
25%
for
the year ended June 30, 2018
and
38%
for
the years ended June 30, 2017 and 2016
, which represents the expected effective income tax rate at the time of the compensation expense deduction primarily at PHSI, and differs from the Company's current effective income tax rate which includes the impact of partnership income not subject to federal and state income taxes. The decrease in the deferred tax benefit is a result of the Tax Cuts and Jobs Act, which was enacted on December 22, 2017 (see
Note 18 - Income Taxes
).
Premier 2013 Equity Incentive Plan
The Premier 2013 Equity Incentive Plan, as amended and restated (and including any further amendments thereto, the "2013 Equity Incentive Plan") provides for grants of up to
11.3 million
shares of Class A common stock, all of which are eligible to be issued as non-qualified stock options, incentive stock options, stock appreciation rights, restricted stock, restricted stock units or performance share awards. As of
June 30, 2018
, there were approximately
3.6 million
shares available for grant under the 2013 Equity Incentive Plan.
115
The following table includes information related to restricted stock, performance share awards and stock options for
the year ended June 30, 2018
:
|
Restricted Stock
|
Performance Share Awards
|
Stock Options
|
|||||||||||||||
|
Number of Awards
|
Weighted Average Fair Value at Grant Date
|
Number of Awards
|
Weighted Average Fair Value at Grant Date
|
Number of Options
|
Weighted Average Exercise Price
|
||||||||||||
|
Outstanding at June 30, 2017
|
576,988
|
|
$
|
32.92
|
|
1,085,872
|
|
$
|
32.79
|
|
3,372,499
|
|
$
|
30.31
|
|
||
|
Granted
|
261,966
|
|
$
|
32.92
|
|
700,733
|
|
$
|
32.62
|
|
560,497
|
|
$
|
32.79
|
|
||
|
Vested/exercised
|
(183,988
|
)
|
$
|
31.89
|
|
(352,867
|
)
|
$
|
31.73
|
|
(284,490
|
)
|
$
|
30.65
|
|
||
|
Forfeited
|
(49,093
|
)
|
$
|
32.71
|
|
(115,691
|
)
|
$
|
32.55
|
|
(149,255
|
)
|
$
|
33.70
|
|
||
|
Outstanding at June 30, 2018
|
605,873
|
|
$
|
33.25
|
|
1,318,047
|
|
$
|
33.00
|
|
3,499,251
|
|
$
|
30.53
|
|
||
|
Stock options outstanding and exercisable at June 30, 2018
|
2,501,734
|
|
$
|
29.56
|
|
||||||||||||
Restricted stock units and restricted stock awards issued and outstanding generally vest over a
three
-year period for employees and a
one
-year period for directors. Performance share awards issued and outstanding generally vest over a
three
year period if performance targets are met. Stock options have a term of
ten
years from the date of grant. Vested stock options will expire either after
twelve
months of an employee's termination with Premier or immediately upon an employee's termination with Premier, depending on the termination circumstances. Stock options generally vest in equal annual installments over
three
years.
Unrecognized stock-based compensation expense at
June 30, 2018
was as follows (in thousands):
|
Unrecognized Stock-Based Compensation Expense
|
Weighted Average Amortization Period
|
|||
|
Restricted stock
|
$
|
8,233
|
|
1.65 years
|
|
Performance share awards
|
17,924
|
|
1.70 years
|
|
|
Stock options
|
6,620
|
|
1.77 years
|
|
|
Total unrecognized stock-based compensation expense
|
$
|
32,777
|
|
1.70 years
|
The aggregate intrinsic value of stock options at
June 30, 2018
was as follows (in thousands):
|
Intrinsic Value of Stock Options
|
|||
|
Outstanding and exercisable
|
$
|
17,091
|
|
|
Expected to vest
|
3,398
|
|
|
|
Total outstanding
|
$
|
20,489
|
|
|
Exercised during the year ended June 30, 2018
|
$
|
1,157
|
|
116
The Company estimated the fair value of each stock option on the date of grant using a Black-Scholes option-pricing model, applying the following assumptions, and amortized expense over each option's vesting period using the straight-line attribution approach:
|
June 30,
|
|||
|
2018
|
2017
|
2016
|
|
|
Expected life
(a)
|
6 years
|
6 years
|
6 years
|
|
Expected dividend
(b)
|
—
|
—
|
—
|
|
Expected volatility
(c)
|
29.4% - 32.3%
|
32.0% - 33.0%
|
32.7% - 33.5%
|
|
Risk-free interest rate
(d)
|
1.9% - 2.9%
|
1.3% - 2.1%
|
1.2% - 1.8%
|
|
Weighted average option grant date fair value
|
$9.48 - $11.42
|
$10.48 - $12.00
|
$11.11 - $12.40
|
|
(a)
|
The
six
-year expected life (estimated period of time outstanding) of stock options granted was estimated using the "Simplified Method" which utilizes the midpoint between the vesting date and the end of the contractual term. This method was utilized for the stock options due to the lack of historical exercise behavior of Premier's employees.
|
|
(b)
|
No dividends are expected to be paid over the contractual term of the stock options granted, resulting in the use of a
zero
expected dividend rate.
|
|
(c)
|
The expected volatility rate is based on the observed historical volatilities of comparable companies.
|
|
(d)
|
The risk-free interest rate was interpolated from the
five
-year and
seven
-year Constant Maturity Treasury rate published by the United States Treasury as of the date of the grant.
|
(17) POST-RETIREMENT BENEFITS
The Company maintains a defined contribution 401(k) retirement savings plan which covers employees who meet certain age and service requirements.
This plan provides for monthly employee contributions of up to
20%
and matching monthly employer contributions of up to
4%
of the participant's compensation, not to exceed certain limits. The Company's 401(k) expense related to such matching of employee contributions
was
$9.7 million
,
$9.2 million
and
$8.5 million
for
the years ended June 30, 2018, 2017 and 2016
, respectively.
The Company also maintains a non-qualified deferred compensation plan for the benefit of eligible employees. This plan is designed to permit employee deferrals in excess of certain tax limits and provides for discretionary employer contributions in excess of certain tax limits
.
(18) INCOME TAXES
The Company's income tax expense is attributable to the activities of the Company, PHSI and PSCI, all of which are subchapter C corporations. Under the provisions of federal and state statutes, Premier LP is not subject to federal and state income taxes. For federal and state income tax purposes, income realized by Premier LP is taxable to its partners. The Company, PHSI and PSCI are subject to U.S. federal and state income taxes.
On December 22, 2017, the U.S. government enacted the TCJA that made broad changes to the U.S. tax code. Most notable to the Company was the reduction in the U.S. federal corporate income tax rate from
35%
to
21%
for the first taxable year beginning on or after January 1, 2018. Due to the timing of the Company's fiscal year, the lower corporate income tax rate will be phased in, resulting in a U.S. statutory federal rate of approximately
28.1%
for our fiscal year ended June 30, 2018, and
21%
for subsequent fiscal years. In accordance with U.S. GAAP, the impact of changes in tax rates and tax laws is recognized as a component of income tax expense from continuing operations in the period of enactment. Accordingly, the Company has remeasured its deferred tax balances as of the enactment date.
Concurrent with the enactment of the TCJA, the SEC issued Staff Accounting Bulletin No. 118 ("SAB 118"), which provides guidance on accounting for the tax effects of the TCJA. SAB 118 provides a measurement period that should not extend beyond one year from the TCJA enactment date for companies to complete the accounting required under the Financial Accounting Standards Board ("FASB") Accounting Standards Codification ("ASC") 740. In accordance with SAB 118, a company must reflect the income tax effects of those aspects of the TCJA for which the accounting under ASC 740 is complete. To the extent that a company's accounting for certain income tax effects of the TCJA is incomplete but it is able to determine a reasonable estimate, it must record a provisional amount on its financial statements. If a company cannot determine a provisional estimate to be included on its financial statements, it should continue to apply ASC 740 on the basis of the provision of the tax laws that were in effect immediately prior to the enactment of the TCJA. With this in mind, the Company has prescribed such provisional relief under
117
SAB 118 by incorporating various estimates regarding timing and determination of temporary difference recognition when calculating components of its deferred tax balances. While the Company is able to provide reasonable estimates of the impacts related to the TCJA, the final impact may differ from these estimates, due to, among other things, changes in interpretations, assumptions, additional guidance that may be released by the Internal Revenue Service and other actions that we may take that are yet to be determined.
In connection with its analysis of the impacts of the TCJA, the Company has recorded a net provisional tax expense of
$210.4 million
in fiscal year 2018 which consists of
$224.9 million
net deferred tax expense associated with the remeasurement of the Company’s deferred tax assets and liabilities offset by
$14.5 million
of deferred tax benefit associated with the release of valuation allowances related to certain U.S. federal tax attributes that are now expected to be fully realized. The Company has not completed its accounting for the income tax effects of the TCJA. Where the Company has been able to make reasonable estimates of the effects for which its analysis is not yet complete, the Company has recorded provisional amounts in accordance with SAB 118.
Significant components of the consolidated expense for income taxes are as follows (in thousands):
|
Year Ended June 30,
|
|||||||||
|
2018
|
2017
|
2016
|
|||||||
|
Current:
|
|||||||||
|
Federal
|
$
|
22,103
|
|
$
|
16,638
|
|
$
|
19,765
|
|
|
State
|
4,141
|
|
4,614
|
|
4,242
|
|
|||
|
Total current expense
|
26,244
|
|
21,252
|
|
24,007
|
|
|||
|
Deferred:
|
|||||||||
|
Federal
|
232,673
|
|
49,392
|
|
15,703
|
|
|||
|
State
|
317
|
|
11,170
|
|
10,011
|
|
|||
|
Total deferred expense
|
232,990
|
|
60,562
|
|
25,714
|
|
|||
|
Provision for income taxes
|
$
|
259,234
|
|
$
|
81,814
|
|
$
|
49,721
|
|
The reconciliation between the Company’s effective tax rate on income from continuing operations and the statutory tax rates of
28.1%
,
35.0%
,
35.0%
for fiscal year ended
June 30, 2018, 2017 and 2016
, respectively, is as follows (in thousands):
|
Year Ended June 30,
|
|||||||||
|
2018
|
2017
|
2016
|
|||||||
|
Computed tax expense
|
$
|
145,015
|
|
$
|
185,952
|
|
$
|
99,709
|
|
|
Partnership income not subject to tax
|
(70,257
|
)
|
(85,142
|
)
|
(85,063
|
)
|
|||
|
State taxes (net of federal benefit)
|
12,901
|
|
9,823
|
|
664
|
|
|||
|
Remeasurement adjustments and other permanent items
|
(53,151
|
)
|
(78,998
|
)
|
1,051
|
|
|||
|
Expense (benefit) on subsidiaries treated separately for income tax purposes
|
(983
|
)
|
18,660
|
|
(7,497
|
)
|
|||
|
Change in valuation allowance
|
(33,106
|
)
|
26,829
|
|
36,279
|
|
|||
|
Deferred tax remeasurement
|
256,787
|
|
9,950
|
|
8,080
|
|
|||
|
Other
|
2,028
|
|
(5,260
|
)
|
(3,502
|
)
|
|||
|
Provision for income taxes
|
$
|
259,234
|
|
$
|
81,814
|
|
$
|
49,721
|
|
|
Effective income tax rate
|
50.2
|
%
|
15.4
|
%
|
17.5
|
%
|
|||
The increase in the effective tax rate from the prior year is primarily attributable to the deferred tax expense associated with the remeasurement of deferred tax balances as a result of the TCJA, partially offset by the deferred tax benefit attributable to the release and remeasurement of valuation allowance and the reduction in the statutory rate from
35.0%
to a blended statutory rate of
28.1%
as a result of the TCJA. The lower effective tax rate in fiscal year 2017 was due to the one-time gain related to the remeasurement of the
50%
equity method investment in Innovatix to fair value upon acquisition of Innovatix and Essensa.
118
Deferred Income Taxes
The tax effects of temporary differences that give rise to significant portions of the deferred tax assets and deferred tax liabilities as of
June 30, 2018 and 2017
are presented below (in thousands):
|
June 30,
|
||||||
|
2018
|
2017
|
|||||
|
Deferred tax asset
|
||||||
|
Partnership basis differences in Premier LP
|
$
|
298,306
|
|
$
|
473,193
|
|
|
Stock compensation
|
18,347
|
|
23,037
|
|
||
|
Accrued expenses
|
32,543
|
|
44,096
|
|
||
|
Net operating losses and credits
|
35,444
|
|
47,629
|
|
||
|
Other
|
12,103
|
|
11,856
|
|
||
|
Total deferred tax assets
|
396,743
|
|
599,811
|
|
||
|
Valuation allowance for deferred tax assets
|
(58,681
|
)
|
(91,787
|
)
|
||
|
Net deferred tax assets
|
338,062
|
|
508,024
|
|
||
|
Deferred tax liability
|
||||||
|
Purchased intangible assets and depreciation
|
(49,855
|
)
|
(71,994
|
)
|
||
|
Other liabilities
|
(152
|
)
|
(1,774
|
)
|
||
|
Net deferred tax asset
|
$
|
288,055
|
|
$
|
434,256
|
|
At
June 30, 2018
, the Company had federal and state net operating loss carryforwards of
$115.4 million
and
$144.9 million
, respectively, primarily attributable to PHSI. The resulting federal and state deferred tax assets are approximately
$24.2 million
and
$5.4 million
, respectively. The federal and state net operating loss carryforwards generated prior to fiscal year 2018 expire between the years ending June 30, 2019 through June 30, 2037, unless utilized. Under the TCJA, the Company’s net operating losses generated in fiscal year 2018 and beyond cannot be carried back to prior tax years but can be carried forward indefinitely. A valuation allowance was established for a portion of federal and state losses as the Company believes it is more likely than not that all or a portion of these losses will not be realized in the near future.
At
June 30, 2018
, the Company had federal research and development credit carryforwards of
$10.2 million
. The federal credit carryforwards expire at various times between the years ended June 30, 2020 through June 30, 2037, unless utilized. A valuation allowance was established as the Company believes it is more likely than not that all or a portion of the federal and state credit carryforwards will not be realized in the near future.
Deferred income taxes reflect the net effects of temporary differences between the carrying amounts of assets and liabilities for financial reporting purposes and the amounts used for income tax purposes. Annually, the Company assesses the future realization of the tax benefit of its existing deferred tax assets and determines whether a valuation allowance is needed. Based on the Company's assessment, we have concluded that it is more likely than not that a portion of the deferred tax assets will not be realized in the future. As a result, the Company recorded a valuation allowance of
$58.7 million
against its deferred tax assets at
June 30, 2018
. The valuation allowance decreased by
$33.1 million
from the
$91.8 million
valuation allowance recorded as of
June 30, 2017
. The decrease is primarily related to
$31.9 million
associated with the aforementioned remeasurement of deferred tax assets and
$14.5 million
associated with the release of valuation allowance as a result of the TCJA, partially offset by a
$13.3 million
increase in valuation allowance associated with current year operations.
As of
June 30, 2018 and 2017
, the Company had net deferred tax assets of
$288.1 million
and
$434.3 million
, respectively. The
June 30, 2018
balance was comprised of
$305.6 million
in deferred tax assets at Premier, Inc. offset by
$17.5 million
in deferred tax liabilities at PHSI and PSCI. The decrease of
$146.2 million
in deferred tax assets was primarily attributable to
$224.9 million
in net reductions to deferred tax assets and liabilities in connection with the remeasurement associated with the previously mentioned decrease in the U.S. federal corporate income tax rate, partially offset by
$76.4 million
of deferred tax assets recorded in connection with the exchanges of Class B common units that occurred during
the year ended June 30, 2018
, pursuant to the Exchange Agreement.
119
Unrecognized Tax Benefits
The Company recognizes income tax benefits for those income tax positions determined more likely than not to be sustained upon examination, based on the technical merits of the positions. The reserve for uncertain income tax positions is included in other liabilities in the Consolidated Balance Sheets. A reconciliation of the beginning and ending gross amounts of the Company's uncertain tax position reserves for
the years ended June 30, 2018, 2017 and 2016
are as follows (in thousands):
|
Year Ended June 30,
|
|||||||||
|
2018
|
2017
|
2016
|
|||||||
|
Beginning of year balance
|
$
|
5,043
|
|
$
|
4,381
|
|
$
|
3,436
|
|
|
Increases in prior period tax positions
|
12,965
|
|
101
|
|
318
|
|
|||
|
Decreases in prior period tax positions
|
(179
|
)
|
(870
|
)
|
(201
|
)
|
|||
|
Reductions on settlements and lapse in statute of limitations
|
(611
|
)
|
(22
|
)
|
(721
|
)
|
|||
|
Increases in current period tax positions
|
1,261
|
|
1,453
|
|
1,549
|
|
|||
|
End of year balance
|
$
|
18,479
|
|
$
|
5,043
|
|
$
|
4,381
|
|
If the Company were to recognize the benefits of these uncertain tax positions, the income tax provision and effective tax rate would be impacted by
$7.4 million
,
$2.8 million
and
$2.8 million
, including interest and penalties and net of the federal and state benefit for income taxes, for
the years ended June 30, 2018, 2017 and 2016
, respectively. The Company recognizes interest and penalties accrued on uncertain income tax positions as part of the income tax provision. The amount of accrued interest and penalties was
$0.9 million
,
$0.3 million
, and
$0.4 million
at
June 30, 2018, 2017 and 2016
, respectively.
The Company has determined that it is reasonably possible that its existing reserve for uncertain income tax positions at
June 30, 2018
will decrease by
$12.2 million
in the next twelve months, primarily related to the closing of ongoing audits.
Federal tax returns for tax years ended June 30, 2013 through 2017 remain open as of
June 30, 2018
. The IRS commenced an examination of PHSI's tax returns for tax years ended June 30, 2013, 2014 and 2016 in the first quarter of fiscal year 2018. The examination of the June 30, 2013 tax return was previously closed without any adjustments. As of June 30, 2018, the IRS has not proposed any adjustments to those returns and is expected to close the examination in the year ended June 30, 2019. Further, the Company is subject to ongoing state and local examinations for various periods. Activity related to these examinations did not have a material impact on the Company’s financial position or results of operations.
The Company made cash tax payments of
$24.9 million
and
$26.1 million
during
the years ended June 30, 2018 and 2017
, respectively.
(19) RELATED PARTY TRANSACTIONS
GNYHA
GNYHA Purchasing Alliance, LLC and its member organizations ("GNYHA PA") owned approximately
8%
of the outstanding partnership interests in Premier LP as of
June 30, 2018
. Although we no longer consider GNYHA a related party under U.S. GAAP, prior period information is included below.
Net administrative fees revenue based on purchases by GNYHA Services, Inc. ("GNYHA") (an affiliate of GNYHA PA) and its member organizations was
$69.9 million
and
$66.8 million
for
the years ended June 30, 2017 and 2016
, respectively. The Company has a contractual requirement under the GPO participation agreement to pay each member owner revenue share from Premier LP equal to
30%
of all gross administrative fees collected by Premier LP based upon purchasing by such member owner's facilities through Premier LP's GPO supplier contracts. As GNYHA also remits to Premier LP all gross administrative fees collected by GNYHA based on purchases by its member organizations through GNYHA's own GPO supplier contracts, it also receives revenue share from Premier LP equal to
30%
of such gross administrative fees remitted to the Company. Approximately
$7.8 million
of revenue share obligations in the accompanying Consolidated Balance Sheets related to revenue share obligations to GNYHA and its member organizations at
June 30, 2017
.
In addition, of the
$25.0 million
limited partners' distribution payable in the accompanying Consolidated Balance Sheets at
June 30, 2017
,
$2.7 million
was payable to GNYHA and its member organizations at
June 30, 2017
. Services and support revenue earned from GNYHA and its member organizations was
$14.2 million
and
$13.2 million
during
the years ended June 30, 2017 and 2016
, respectively. Product revenue earned from, or attributable to services provided to, GNYHA and its member organizations was
$17.2 million
and
$19.0 million
during
the years ended June 30, 2017 and 2016
, respectively. Receivables from GNYHA and its
120
member organizations, included in due from related parties in the accompanying Consolidated Balance Sheets, were
$5.4 million
at
June 30, 2017
.
Innovatix and Essensa
The Company held
50%
of the membership interests in Innovatix until December 2, 2016, at which time it acquired the remaining
50%
of the membership interests from GNYHA Holdings (see
Note 3 - Business Acquisitions
). The Company's share of Innovatix's net income included in equity in net income (loss) of unconsolidated affiliates in the accompanying Consolidated Statements of Income prior to the acquisition was
$10.7 million
and
$21.8 million
for
the years ended June 30, 2017 and 2016
, respectively. The Company maintained a group purchasing agreement with Innovatix under which Innovatix members were permitted to utilize Premier LP's GPO supplier contracts. Gross administrative fees revenue and a corresponding revenue share recorded under the arrangement prior to the acquisition were
$19.9 million
and
$44.3 million
for
the years ended June 30, 2017 and 2016
, respectively.
The Company historically maintained a group purchasing agreement with Essensa, under which Essensa utilized the Company's GPO supplier contracts. On December 2, 2016, the Company acquired
100%
of the membership interests in Essensa from GNYHA Holdings (see
Note 3 - Business Acquisitions
). Net administrative fees revenue recorded from Essensa prior to the acquisition was
$1.2 million
and
$2.8 million
for
the years ended June 30, 2017 and 2016
, respectively.
FFF
The Company's
49%
ownership share of net income of FFF, which was acquired on July 26, 2016, included in equity in net income of unconsolidated affiliates in the accompanying Consolidated Statements of Income was
$6.3 million
and
$4.4 million
for
the years ended June 30, 2018 and 2017
, respectively. The Company maintains group purchasing agreements with FFF and receives administrative fees for purchases made by the Company's members pursuant to those agreements. Net administrative fees revenue recorded from purchases under those agreements was
$7.6 million
and
$4.8 million
during
the years ended June 30, 2018 and 2017
.
AEIX
The Company conducts all operational activities for American Excess Insurance Exchange Risk Retention Group ("AEIX"), a reciprocal risk retention group that provides excess and umbrella healthcare professional and general liability insurance to certain hospital and healthcare system members. The Company is reimbursed by AEIX for actual costs, plus an annual incentive management fee not to exceed
$0.5 million
per calendar year. The Company received cost reimbursement of
$6.0 million
,
$5.1 million
and
$4.3 million
for
the years ended June 30, 2018, 2017 and 2016
, respectively, and annual incentive management fees of
$0.3 million
,
$0.2 million
and
$0.2 million
for
the years ended June 30, 2018, 2017 and 2016
, respectively. As of
June 30, 2018 and 2017
,
$0.9 million
and
$0.6 million
, respectively, in amounts receivable from AEIX are included in due from related parties in the accompanying Consolidated Balance Sheets.
(20) COMMITMENTS AND CONTINGENCIES
Operating Leases
The Company leases office space under operating leases. The office space leases provide for escalating rent payments during the lease terms. The Company recognizes rent expense on a straight-line basis over the lease term. Rent and associated operating expenses totaled
$11.9 million
,
$9.5 million
and
$10.1 million
for
the years ended June 30, 2018, 2017 and 2016
, respectively.
Future minimum lease payments under noncancelable operating leases (with initial lease terms in excess of one year) are as follows (in thousands):
|
2019
|
$
|
12,158
|
|
|
2020
|
11,220
|
|
|
|
2021
|
10,779
|
|
|
|
2022
|
10,945
|
|
|
|
2023
|
10,996
|
|
|
|
Thereafter
|
31,336
|
|
|
|
Total future minimum lease payments
|
$
|
87,434
|
|
121
Other Matters
The Company is not currently involved in any litigation it believes to be significant. The Company is periodically involved in litigation, arising in the ordinary course of business or otherwise, which from time to time may include claims relating to commercial, product liability, tort and personal injury, employment, antitrust, intellectual property, or other regulatory matters. If current or future government regulations, specifically, those with respect to antitrust or healthcare laws, are interpreted or enforced in a manner adverse to the Company or its business, the Company may be subject to enforcement actions, penalties and other material limitations which could have a material adverse effect on the Company's business, financial condition and results of operations.
(21) SEGMENTS
The Company delivers its solutions and manages its business through
two
reportable business segments, the Supply Chain Services segment and the Performance Services segment. The Supply Chain Services segment includes the Company's GPO, integrated pharmacy offerings and direct sourcing activities. The Performance Services segment includes the Company's informatics, collaborative, consulting services, government services and insurance services businesses.
Segment information was as follows (in thousands):
|
Year Ended June 30,
|
|||||||||
|
2018
|
2017
|
2016
|
|||||||
|
Net revenue:
|
|||||||||
|
Supply Chain Services
|
|||||||||
|
Net administrative fees
|
$
|
643,839
|
|
$
|
557,468
|
|
$
|
498,394
|
|
|
Other services and support
|
11,454
|
|
9,704
|
|
4,385
|
|
|||
|
Services
|
655,293
|
|
567,172
|
|
502,779
|
|
|||
|
Products
|
645,284
|
|
534,118
|
|
326,646
|
|
|||
|
Total Supply Chain Services
|
1,300,577
|
|
1,101,290
|
|
829,425
|
|
|||
|
Performance Services
|
360,679
|
|
353,383
|
|
333,169
|
|
|||
|
Net revenue
|
$
|
1,661,256
|
|
$
|
1,454,673
|
|
$
|
1,162,594
|
|
|
Depreciation and amortization expense
(a)
:
|
|||||||||
|
Supply Chain Services
|
$
|
21,734
|
|
$
|
14,209
|
|
$
|
1,401
|
|
|
Performance Services
|
95,808
|
|
85,299
|
|
76,500
|
|
|||
|
Corporate
|
9,217
|
|
7,703
|
|
6,255
|
|
|||
|
Total depreciation and amortization expense
|
$
|
126,759
|
|
$
|
107,211
|
|
$
|
84,156
|
|
|
Capital expenditures:
|
|||||||||
|
Supply Chain Services
|
$
|
1,691
|
|
$
|
483
|
|
$
|
914
|
|
|
Performance Services
|
80,900
|
|
66,686
|
|
62,337
|
|
|||
|
Corporate
|
10,089
|
|
4,203
|
|
13,739
|
|
|||
|
Total capital expenditures
|
$
|
92,680
|
|
$
|
71,372
|
|
$
|
76,990
|
|
|
June 30,
|
|||||||||
|
Total assets:
|
2018
|
2017
|
|||||||
|
Supply Chain Services
|
$
|
991,837
|
|
$
|
1,017,023
|
|
|||
|
Performance Services
|
860,409
|
|
888,862
|
|
|||||
|
Corporate
|
459,970
|
|
601,951
|
|
|||||
|
Total assets
|
$
|
2,312,216
|
|
$
|
2,507,836
|
|
|||
|
(a)
|
Includes amortization of purchased intangible assets.
|
The Company uses Segment Adjusted EBITDA (a financial measure not determined in accordance with generally accepted accounting principles ("Non-GAAP")) as its primary measure of profit or loss to assess segment performance and to determine
122
the allocation of resources. The Company also uses Segment Adjusted EBITDA to facilitate the comparison of the segment operating performance on a consistent basis from period to period. The Company defines Segment Adjusted EBITDA as the segment's net revenue and equity in net income (loss) of unconsolidated affiliates less operating expenses directly attributable to the segment excluding depreciation and amortization, amortization of purchased intangible assets, merger and acquisition related expenses and non-recurring or non-cash items. Operating expenses directly attributable to the segment include expenses associated with sales and marketing, general and administrative and product development activities specific to the operation of each segment. Non-recurring items are income or expenses and other items that have not been earned or incurred within the prior
two
years and are not expected to recur within the next
two
years. General and administrative corporate expenses that are not specific to a particular segment are not included in the calculation of Segment Adjusted EBITDA.
For more information on Segment Adjusted EBITDA and the use of Non-GAAP financial measures, see "Our Use of Non-GAAP Financial Measures" within Item 2 - Management's Discussion and Analysis of Financial Condition and Results of Operations.
A reconciliation of income before income taxes to Segment Adjusted EBITDA is as follows (in thousands):
|
Year Ended June 30,
|
|||||||||
|
2018
|
2017
|
2016
|
|||||||
|
Income before income taxes
|
$
|
516,804
|
|
$
|
531,291
|
|
$
|
284,882
|
|
|
Remeasurement gain attributable to acquisition of Innovatix, LLC
|
—
|
|
(205,146
|
)
|
—
|
|
|||
|
Equity in net income of unconsolidated affiliates
(a)
|
(1,174
|
)
|
(14,745
|
)
|
(21,647
|
)
|
|||
|
Interest and investment loss, net
(b)
|
5,300
|
|
4,512
|
|
1,021
|
|
|||
|
Loss on disposal of long-lived assets
|
2,376
|
|
2,422
|
|
—
|
|
|||
|
Other expense (income)
|
16,324
|
|
(614
|
)
|
1,692
|
|
|||
|
Operating income
|
539,630
|
|
317,720
|
|
265,948
|
|
|||
|
Depreciation and amortization
|
71,312
|
|
58,884
|
|
51,102
|
|
|||
|
Amortization of purchased intangible assets
|
55,447
|
|
48,327
|
|
33,054
|
|
|||
|
Stock-based compensation
(c)
|
29,799
|
|
26,860
|
|
49,081
|
|
|||
|
Acquisition related expenses
|
8,335
|
|
15,790
|
|
15,804
|
|
|||
|
Strategic and financial restructuring expenses
(d)
|
2,512
|
|
31
|
|
268
|
|
|||
|
Remeasurement of tax receivable agreement liabilities
(e)
|
(177,174
|
)
|
(5,447
|
)
|
(4,818
|
)
|
|||
|
ERP implementation expenses
(f)
|
1,000
|
|
2,028
|
|
4,870
|
|
|||
|
Acquisition related adjustment - revenue
(g)
|
300
|
|
18,049
|
|
5,624
|
|
|||
|
Equity in net income of unconsolidated affiliates
(a)
|
1,174
|
|
14,745
|
|
21,647
|
|
|||
|
Impairment on investments
(a)
|
5,002
|
|
—
|
|
—
|
|
|||
|
Deferred compensation plan income (expense)
(h)
|
3,960
|
|
4,020
|
|
(1,605
|
)
|
|||
|
Other income
|
1,752
|
|
584
|
|
—
|
|
|||
|
Adjusted EBITDA
|
$
|
543,049
|
|
$
|
501,591
|
|
$
|
440,975
|
|
|
Segment Adjusted EBITDA:
|
|||||||||
|
Supply Chain Services
|
$
|
535,380
|
|
$
|
493,763
|
|
$
|
439,013
|
|
|
Performance Services
|
123,429
|
|
121,090
|
|
110,787
|
|
|||
|
Corporate
|
(115,760
|
)
|
(113,262
|
)
|
(108,825
|
)
|
|||
|
Adjusted EBITDA
|
$
|
543,049
|
|
$
|
501,591
|
|
$
|
440,975
|
|
|
(a)
|
Refer to
|
|
(b)
|
Represents interest expense, net and realized gains and losses on our marketable securities.
|
|
(c)
|
Represents non-cash employee stock-based compensation expense and stock purchase plan expense of
$0.4 million
during both of
the years ended June 30, 2018 and 2017
.
|
|
(d)
|
Represents legal, accounting and other expenses directly related to strategic and financial restructuring expenses.
|
|
(e)
|
Represents adjustments to TRA liabilities for a
14%
decrease in the U.S. federal corporate income tax rate that occurred during
the year ended June 30, 2018
, which is a result of the TCJA that was enacted on December 22, 2017, an increase in income apportioned to California and a
1.5%
decrease in the North Carolina state income tax rate during
the year ended June 30, 2017
, and an adjustment for a
1%
decrease in North Carolina state income tax rate during the year ended June 30, 2016.
|
123
|
(f)
|
Represents implementation and other costs associated with the implementation of our enterprise resource planning ("ERP") system.
|
|
(g)
|
This item includes non-cash adjustments to deferred revenue of acquired entities of
$0.3 million
,
$0.6 million
and
$5.6 million
for
the years ended June 30, 2018, 2017 and 2016
, respectively. Business combination accounting rules require the Company to record a deferred revenue liability at its fair value only if the acquired deferred revenue represents a legal performance obligation assumed by the acquirer. The fair value is based on direct and indirect incremental costs of providing the services plus a normal profit margin. Generally, this results in a reduction to the purchased deferred revenue balance, which was based on upfront software license update fees and product support contracts assumed in connection with acquisitions. Because these support contracts are typically one year in duration, our GAAP revenues for the one-year period subsequent to the acquisition of a business do not reflect the full amount of support revenues on these assumed support contracts that would have otherwise been recorded by the acquired entity. The Non-GAAP adjustment to software license update fees and product support revenues is intended to include, and thus reflect, the full amount of such revenues.
|
Also, during
the year ended June 30, 2017
we recorded
$17.4 million
of purchase accounting adjustments to Adjusted EBITDA related to our acquisition of Innovatix and Essensa on December 2, 2016. This adjustment reflects the fair value of administrative fees related to member purchases that occurred prior to December 2, 2016, but were reported to us subsequent to that date through
June 30, 2017
. Under our revenue recognition accounting policy, which is in accordance with GAAP, these administrative fees would be ordinarily recorded as revenue when reported to us; however, the acquisition method of accounting requires us to estimate the amount of purchases prior to the acquisition date and to record the fair value of the administrative fees to be received from those purchases as an account receivable (as opposed to recognizing revenue when these transactions are reported to us) and record any corresponding revenue share obligation as a liability. The purchase accounting adjustment amounted to an estimated
$21.2 million
of accounts receivable relating to these administrative fees and an estimated
$3.8 million
for the related revenue share obligation through
June 30, 2017
.
|
(h)
|
Represents realized and unrealized gains and losses and dividend income on deferred compensation plan assets.
|
(22) QUARTERLY FINANCIAL DATA (UNAUDITED)
The Company has corrected prior period information within the current period financial statements related to a specific component used in calculating the tax effect on Premier, Inc. net income for purposes of diluted earnings (loss) per share. Diluted earnings (loss) per share for the first quarter of fiscal 2018 was previously stated at
$0.36
per share and has been corrected to
$0.30
per share; diluted earnings (loss) per share for the second quarter of fiscal 2018 was previously stated at
$(1.66)
per share and has been corrected to
$0.06
per share; and diluted earnings (loss) per share for the second quarter of fiscal 2017 was previously stated at
$1.50
per share and has been corrected to
$1.58
per share. The Company believes the corrections are immaterial and the amounts had no impact on the Company’s overall financial condition, results of operations or cash flows.
124
The following tables present unaudited summarized financial data by quarter for
the years ended June 30, 2018 and 2017
(in thousands, except per share data):
|
First
|
Second
|
Third
|
Fourth
|
|||||||||
|
Quarter
|
Quarter
|
Quarter
|
Quarter
|
|||||||||
|
Fiscal Year 2018
|
||||||||||||
|
Net revenue
|
$
|
390,564
|
|
$
|
411,398
|
|
$
|
425,338
|
|
$
|
433,956
|
|
|
Gross profit
|
199,188
|
|
210,871
|
|
221,790
|
|
231,116
|
|
||||
|
Net income
|
60,616
|
|
19,769
|
|
76,549
|
|
100,636
|
|
||||
|
Net income attributable to non-controlling interest in Premier LP
|
(44,610
|
)
|
(56,485
|
)
|
(53,047
|
)
|
(70,127
|
)
|
||||
|
Adjustment of redeemable limited partners' capital to redemption amount
|
320,424
|
|
317,916
|
|
(127,039
|
)
|
(353,720
|
)
|
||||
|
Net income (loss) attributable to stockholders
|
$
|
336,430
|
|
$
|
281,200
|
|
$
|
(103,537
|
)
|
$
|
(323,211
|
)
|
|
Weighted average shares outstanding:
|
||||||||||||
|
Basic
|
52,909
|
|
55,209
|
|
53,529
|
|
52,412
|
|
||||
|
Diluted
|
140,046
|
|
139,237
|
|
53,529
|
|
52,412
|
|
||||
|
Net income (loss) per share attributable to stockholders:
|
||||||||||||
|
Basic
|
$
|
6.36
|
|
$
|
5.09
|
|
$
|
(1.93
|
)
|
$
|
(6.17
|
)
|
|
Diluted
|
$
|
0.30
|
|
$
|
0.06
|
|
$
|
(1.93
|
)
|
$
|
(6.17
|
)
|
|
Fiscal Year 2017
|
||||||||||||
|
Net revenue
|
$
|
313,272
|
|
$
|
358,500
|
|
$
|
379,803
|
|
$
|
403,098
|
|
|
Gross profit
|
174,769
|
|
182,486
|
|
202,555
|
|
214,815
|
|
||||
|
Net income
|
58,095
|
|
246,184
|
|
71,338
|
|
73,860
|
|
||||
|
Net income attributable to non-controlling interest in Premier LP
|
(49,601
|
)
|
(181,173
|
)
|
(51,433
|
)
|
(53,845
|
)
|
||||
|
Adjustment of redeemable limited partners' capital to redemption amount
|
61,808
|
|
335,264
|
|
(100,506
|
)
|
(333,742
|
)
|
||||
|
Net income (loss) attributable to stockholders
|
$
|
70,302
|
|
$
|
400,275
|
|
$
|
(80,601
|
)
|
$
|
(313,727
|
)
|
|
Weighted average shares outstanding:
|
||||||||||||
|
Basic
|
47,214
|
|
49,445
|
|
50,525
|
|
51,470
|
|
||||
|
Diluted
|
142,962
|
|
141,308
|
|
50,525
|
|
51,470
|
|
||||
|
Net income (loss) per share attributable to stockholders:
|
||||||||||||
|
Basic
|
$
|
1.49
|
|
$
|
8.10
|
|
$
|
(1.60
|
)
|
$
|
(6.10
|
)
|
|
Diluted
|
$
|
0.26
|
|
$
|
1.58
|
|
$
|
(1.60
|
)
|
$
|
(6.10
|
)
|
125
Not applicable.
Evaluation of Disclosure Controls and Procedures
We maintain disclosure controls and procedures (as defined in Rule 13a-15(e) of the Exchange Act) that are designed to ensure that information required to be disclosed in our reports under the Exchange Act is recorded, processed, summarized and reported within the time periods specified in the SEC's rules and forms and that such information is accumulated and communicated to our management, including our chief executive officer and chief financial officer, as appropriate, to allow timely decisions regarding required disclosures. Any controls and procedures, no matter how well designed and operated, can provide only reasonable assurance of achieving the desired control objectives.
As of the end of the period covered by this Annual Report, our chief executive officer and chief financial officer carried out an evaluation of the effectiveness of our disclosure controls and procedures. Based upon this evaluation, our chief executive officer and chief financial officer concluded that our disclosure controls and procedures were effective as of
June 30, 2018
.
Management's Report on Internal Control Over Financial Reporting
Our management is responsible for establishing and maintaining adequate internal control over financial reporting, as such term is defined in Rule 13a-15(f) under the Exchange Act. Internal control over financial reporting is a process designed to provide reasonable assurance regarding the reliability of financial reporting and the preparation of financial statements for external purposes in accordance with generally accepted accounting principles in the United States of America. Internal control over financial reporting includes those policies and procedures that (1) pertain to the maintenance of records that, in reasonable detail, accurately and fairly reflect the transactions and dispositions of the assets of the Company; (2) provide reasonable assurance that transactions are recorded as necessary to permit preparation of financial statements in accordance with GAAP, and that receipts and expenditures of the Company are being made only in accordance with authorizations of management and directors of the Company; and (3) provide reasonable assurance regarding prevention or timely detection of unauthorized acquisition, use, or disposition of the Company's assets that could have a material effect on its financial statements. Because of its inherent limitations, internal control over financial reporting may not prevent or detect misstatements. Also, projections of any evaluation of effectiveness to future periods are subject to the risk that controls may become inadequate because of changes in conditions or that the degree of compliance with the policies or procedures may deteriorate.
Our chief executive officer and chief financial officer conducted an assessment of the effectiveness of our internal control over financial reporting as of
June 30, 2018
. In making this assessment, the chief executive officer and chief financial officer used the criteria set forth in Internal Control-Integrated Framework (2013) issued by the Committee of Sponsoring Organizations of the Treadway Commission, the COSO framework. Based upon this evaluation, our chief executive officer and chief financial officer concluded that, as of
June 30, 2018
, our internal control over financial reporting was effective.
The effectiveness of our internal control over financial reporting as of
June 30, 2018
has been audited by Ernst & Young LLP, an independent registered public accounting firm, as stated in their report which appears herein.
Changes in Internal Control Over Financial Reporting
There have been no changes in our internal control over financial reporting (as defined in Rules 13a-15(f) under the Exchange Act) during the quarter ended
June 30, 2018
, that have materially affected, or are reasonably likely to materially affect our internal control over financial reporting.
None.
126
We expect to file a definitive proxy statement relating to our
2018
Annual Meeting of Stockholders with the SEC pursuant to Regulation 14A, not later than 120 days after the end of our most recent fiscal year. Accordingly, certain information required by Part III of this Annual Report has been omitted under General Instruction G(3) to Form 10-K. Only the information from the definitive proxy statement that specifically addresses disclosure requirements of Items 10-14 below is incorporated by reference.
We will provide information that is responsive to this Item 10 in our definitive proxy statement for our
2018
Annual Meeting of Stockholders or in an amendment to this Annual Report not later than 120 days after the end of the fiscal year covered by this Annual Report, in either case under the captions “Item 1 - Election of Directors,” “Corporate Governance and Board Structure,” “Section 16(a) Beneficial Ownership Reporting Compliance” and "Executive Officers," and possibly elsewhere therein. That information is incorporated in this Item 10 by reference.
Code of Ethics
We maintain a Corporate Code of Conduct for all of our employees and officers, including the principal executive officer, principal financial officer, and principal accounting officer or controller, or persons performing similar functions, and, where applicable, to directors. In addition, the Board of Directors is subject to a separate Board Code of Ethics and Board Conflict of Interest Policy (collectively, the “Board Codes”). The Corporate Code of Conduct, along with the Board Codes, can be found on our Investor Relations website at investors.premierinc.com under "Corporate Governance-Governance Documents." A copy of the Corporate Code of Conduct is available to any stockholder who requests it by writing to Investor Relations, Premier, Inc., 13034 Ballantyne Corporate Place, Charlotte, North Carolina 28277. We will disclose any substantive amendments to, or waivers (for directors or executive officers) from, certain provisions (relating to one or more elements of Item 4.06(b) of Regulation S-K) of the Corporate Code of Conduct and Board Codes on our website promptly following the date of such amendment or waiver.
Our website and information contained on it or incorporated in it are not intended to be incorporated in this Annual Report or other filings with the SEC.
We will provide information that is responsive to this Item 11 in our definitive proxy statement for our
2018
Annual Meeting of Stockholders or in an amendment to this Annual Report not later than 120 days after the end of the fiscal year covered by this Annual Report, in either case under the captions “Executive Compensation” and “Corporate Governance and Board Structure,” and possibly elsewhere therein. That information is incorporated in this Item 11 by reference.
We will provide information that is responsive to this Item 12 in our definitive proxy statement for our
2018
Annual Meeting of Stockholders or in an amendment to this Annual Report not later than 120 days after the end of the fiscal year covered by this Annual Report, in either case under the caption “Security Ownership of Certain Beneficial Owners and Management” and possibly elsewhere therein. That information is incorporated in this Item 12 by reference.
Equity Compensation Plan Information
We have granted equity awards to employees and directors under the Amended and Restated Premier, Inc. 2013 Equity Incentive Plan, as amended and restated, which initially was approved by our stockholders prior to our IPO and was approved most recently by our stockholders in December 2017. The following table sets forth certain information as of
June 30, 2018
concerning the shares of Class A common stock authorized for issuance under this equity incentive plan. No shares of Class B common stock are authorized for issuance under this plan, and we have no equity compensation plans under which shares may be issued that have not been approved by our stockholders.
127
|
Plan Category
|
Number of securities to be issued upon exercise of outstanding options, warrants and rights (a)
|
Weighted-average exercise price of outstanding options, warrants and rights (b)
|
Number of securities remaining available for future issuance under equity compensation plans (excluding securities reflected in column (a)) (c)
|
|
Equity compensation plans approved by security holders:
|
|||
|
Amended and Restated Premier, Inc. 2013 Equity Incentive Plan
|
5,423,171
(1)
|
$30.53
(2)
|
3,595,111
(3)
|
|
Equity compensation plans not approved by security holders
|
n/a
|
n/a
|
n/a
|
|
Total
|
5,423,171
(1)
|
$30.53
(2)
|
3,595,111
(3)
|
(1) Assumes restricted stock unit (RSU), restricted stock (RSA), performance share (PSA) and stock option awards are paid at target, except for August 31, 2015 performance-based restricted stock awards that were granted at the maximum payout level (and are subject to forfeiture). Actual shares awarded may be higher or lower based upon actual performance over the measurement period. For more detailed information, see Note 16 - Stock-Based Compensation to our Consolidated Financial Statements.
(2) This calculation only reflects outstanding stock option awards.
(3) Reflects, as of
June 30, 2018
, shares reserved for future grants of stock options, RSUs, RSAs, PSAs and/or other equity awards. Any shares withheld to satisfy tax withholding obligations or tendered to pay the exercise price of an option shall again be available for grant under the terms of the plan.
We will provide information that is responsive to this Item 13 in our definitive proxy statement for our
2018
Annual Meeting of Stockholders or in an amendment to this Annual Report not later than 120 days after the end of the fiscal year covered by this Annual Report, in either case under the captions “Related Person Transactions,” and “Corporate Governance and Board Structure,” and possibly elsewhere therein. That information is incorporated in this Item 13 by reference.
We will provide information that is responsive to this Item 14 in our definitive proxy statement for our
2018
Annual Meeting of Stockholders or in an amendment to this Annual Report not later than 120 days after the end of the fiscal year covered by this Annual Report, in either case under the caption “Item 2 - Ratification of Appointment of Independent Registered Public Accounting Firm,” and possibly elsewhere therein. That information is incorporated in this Item 14 by reference.
128
Documents as part of this Report:
(a) (1) The following consolidated financial statements are filed herewith in Item 8 of Part II above.
(i) Report of Independent Registered Public Accounting Firm
(ii) Consolidated Balance Sheets
(iii) Consolidated Statements of Income
(iv) Consolidated Statements of Comprehensive Income
(v) Consolidated Statements of Stockholders' Deficit
(vi) Consolidated Statements of Cash Flows
(vii) Notes to Consolidated Financial Statements
(2) Financial Statement Schedule
Schedule II Valuation and Qualifying Accounts
|
Years Ended June 30, 2018, 2017 and 2016
|
||||||||||
|
(in thousands)
|
||||||||||
|
Beginning Balance
|
Additions/(Reductions) to Expense or Other Accounts
|
Deductions
|
Ending Balance
|
|||||||
|
Year ended June 30, 2018
|
||||||||||
|
Allowance for doubtful accounts
|
$
|
1,812
|
|
1,148
|
|
1,119
|
|
$
|
1,841
|
|
|
Deferred tax assets valuation allowance
|
$
|
91,787
|
|
(33,106
|
)
|
—
|
|
$
|
58,681
|
|
|
Year ended June 30, 2017
|
||||||||||
|
Allowance for doubtful accounts
|
$
|
1,981
|
|
781
|
|
950
|
|
$
|
1,812
|
|
|
Deferred tax assets valuation allowance
|
$
|
64,958
|
|
26,829
|
|
—
|
|
$
|
91,787
|
|
|
Year ended June 30, 2016
|
||||||||||
|
Allowance for doubtful accounts
|
$
|
1,153
|
|
1,655
|
|
827
|
|
$
|
1,981
|
|
|
Deferred tax assets valuation allowance
|
$
|
28,679
|
|
36,279
|
|
—
|
|
$
|
64,958
|
|
All other supplemental schedules are omitted because of the absence of conditions under which they are required.
(3) Exhibits
The exhibits listed in the accompanying Exhibit Index at the end of this Item 15 are filed as a part of this report.
(b) Exhibits
See Exhibit Index at the end of this Item 15.
(c) Separate Financial Statements and Schedule
None.
129
EXHIBIT INDEX
|
Exhibit
No.
|
Description
|
|
|
2.1
|
||
|
3.1
|
||
|
3.2
|
||
|
4.1
|
||
|
9.1
|
||
|
10.1
|
||
|
10.1.1
|
||
|
10.1.2
|
||
|
10.2
|
||
|
10.3
|
||
|
10.4
|
||
|
10.5
|
||
|
10.6
|
||
|
10.7
|
||
|
10.8
|
||
|
10.9
|
||
|
10.10
|
||
|
10.11
|
||
|
10.12
|
||
|
10.13
|
||
|
10.14
|
||
|
10.15
|
||
130
|
Exhibit
No.
|
Description
|
|
|
10.16
|
||
|
10.17
|
||
|
10.18
|
||
|
10.19
|
||
|
10.20
|
||
|
10.21
|
||
|
10.22
|
||
|
10.23
|
||
|
10.24
|
||
|
10.25
|
||
|
10.25.1
|
||
|
21
|
||
|
23
|
||
|
24
|
Power of Attorney (included on the signature page hereof)*
|
|
|
31.1
|
||
|
31.2
|
||
|
32.1
|
||
|
32.2
|
||
|
101.INS
|
XBRL Instance Document*
|
|
|
101.SCH
|
XBRL Taxonomy Extension Schema Document*
|
|
|
101.CAL
|
XBRL Taxonomy Extension Calculation Linkbase Document*
|
|
|
101.DEF
|
XBRL Taxonomy Extension Definition Linkbase Document*
|
|
|
101.LAB
|
XBRL Taxonomy Extension Label Linkbase Document*
|
|
|
101.PRE
|
XBRL Taxonomy Extension Presentation Linkbase Document*
|
|
* Filed herewith
131
+ Indicates a management contract or compensatory plan or arrangement
‡ Furnished herewith
(1) Our SEC file number for documents filed with the SEC pursuant to the Securities Exchange Act of 1934, as amended, is 001-36092. The SEC file number for our Registration Statement on Form S-1 is 333-190828.
We have elected not to provide a summary.
132
SIGNATURES
Pursuant to the requirements of Section 13 or 15(d) of the Securities Exchange Act of 1934, the registrant has duly caused this report to be signed on its behalf by the undersigned, thereunto duly authorized.
|
PREMIER, INC.
|
||
|
|
By:
|
/s/ SUSAN D. DEVORE
|
|
|
Name:
|
Susan D. DeVore
|
|
|
Title:
|
President, Chief Executive Officer and Director
|
|
Date:
|
August 22, 2018
|
|
POWER OF ATTORNEY
Each person whose signature appears below hereby severally constitutes and appoints each of Craig S. McKasson and David L. Klatsky his/her true and lawful attorney-in-fact and agent with full power of substitution and re-substitution, for him/her in his/her name, place and stead, in any and all capacities, to sign any and all amendments to this report and to file the same, with all exhibits thereto, and other documents in connection therewith, with the Securities and Exchange Commission, and hereby grants to each such attorney-in-fact and agent, full power and authority to do and perform each and every act and thing requisite and necessary to be done, as fully to all intents and purposes as he/she might or could do in person, hereby ratifying and confirming all that each said attorney-in-fact and agent or his substitute or substitutes may lawfully do or cause to be done by virtue hereof.
Pursuant to the requirements of the Securities Exchange Act of 1934, this report has been signed below by the following persons on behalf of the Registrant and in the capacities and on the dates indicated.
|
Signature
|
|
Capacity
|
|
Date
|
|
/s/ SUSAN D. DEVORE
Susan D. DeVore
|
|
President, Chief Executive Officer and Director (principal executive officer)
|
|
August 22, 2018
|
|
/s/ CRAIG S. MCKASSON
Craig S. McKasson
|
|
Chief Financial Officer and Senior Vice President (principal financial and accounting officer)
|
|
August 22, 2018
|
|
/s/ BARCLAY E. BERDAN
Barclay E. Berdan
|
Director
|
August 22, 2018
|
||
|
/s/ ERIC J. BIEBER, MD
Eric J. Bieber, MD
|
Director
|
August 22, 2018
|
||
|
/s/ STEPHEN R. D'ARCY
Stephen R. D'Arcy |
Director
|
August 22, 2018
|
||
|
/s/ JODY R. DAVIDS
Jody R. Davids
|
Director
|
August 22, 2018
|
||
|
/s/ WILLIAM B. DOWNEY
William B. Downey
|
Director
|
August 22, 2018
|
||
|
/s/ PETER S. FINE
Peter S. Fine
|
Director
|
August 22, 2018
|
||
133
|
/s/ PHILIP A. INCARNATI
Philip A. Incarnati
|
Director
|
August 22, 2018
|
||
|
/s/ DAVID LANGSTAFF
David Langstaff |
Director
|
August 22, 2018
|
||
|
/s/ WILLIAM E. MAYER
William E. Mayer |
Director
|
August 22, 2018
|
||
|
/s/ MARC D. MILLER
Marc D. Miller
|
Director
|
August 22, 2018
|
||
|
/s/ MARVIN R. O'QUINN
Marvin R. O'Quinn
|
Director
|
August 22, 2018
|
||
|
/s/ SCOTT REINER
Scott Reiner
|
Director
|
August 22, 2018
|
||
|
/s/ TERRY D. SHAW
Terry D. Shaw
|
Director
|
August 22, 2018
|
||
|
/s/ RICHARD J. STATUTO
Richard J. Statuto
|
Director
|
August 22, 2018
|
||
|
/s/ ELLEN C. WOLF
Ellen C. Wolf
|
Director
|
August 22, 2018
|
||
134
TABLE OF CONTENTS
Part IItem 1. BusinessNote 1 - Organization and Basis Of PresentationNote 21 - SegmentsItem 1A. Risk FactorsItem 1B. Unresolved Staff CommentsItem 2. PropertiesNote 20 - Commitments and ContingenciesItem 3. Legal ProceedingsItem 4. Mine Safety DisclosuresPart IIItem 5. Market For Registrant's Common Equity, Related Stockholder Matters and Issuer Purchases Of Equity SecuritiesItem 6. Selected Financial DataNote 3 - Business AcquisitionsItem 7. Management's Discussion and Analysis Of Financial Condition and Results Of OperationsNote 2 - Significant Accounting PoliciesNote 5 - Fair Value MeasurementsNote 18 - Income TaxesNote 16 - Stock-based CompensationNote 13 - Redeemable Limited Partners' CapitalNote 15 - Earnings (loss) Per ShareNote 4 - InvestmentsItem 7A. Quantitative and Qualitative Disclosures About Market RiskItem 8. Financial Statements and Supplementary DataNote 7 - Property and Equipment, NetNote 8 - Intangible Assets, NetNote 19 - Related Party TransactionsNote 11 - DebtNote 9 - GoodwillItem 9. Changes in and Disagreements with Accountants on Accounting and Financial DisclosureItem 9A. Controls and ProceduresItem 9B. Other InformationPart IIIItem 10. Directors, Executive Officers and Corporate GovernanceItem 11. Executive CompensationItem 12. Security Ownership Of Certain Beneficial Owners and Management and Related Stockholder MattersItem 13. Certain Relationships and Related Transactions, and Director IndependenceItem 14. Principal Accounting Fees and ServicesPart IVItem 15. Exhibits and Financial Statement SchedulesItem 16. Form 10-k Summary