CHILDRENS PLACE, INC.
10-Ks and 10-Qs
|
|
|
|
|
|
|
|
|
|
|
|
|
|
|
|
|
|
|
|
|
|
|
|
|
|
|
|
|
|
|
|
|
|
|
|
|
|
|
|
|
|
|
|
|
|
|
|
|
|
|
|
|
|
|
|
UNITED STATES
SECURITIES AND EXCHANGE COMMISSION
Washington, D.C. 20549
FORM 10‑K
(Mark One)
|
x
|
ANNUAL REPORT PURSUANT TO SECTION 13 OR 15(d) OF THE SECURITIES EXCHANGE ACT OF 1934
|
|
For the fifty-two weeks ended February 2, 2019
|
|
|
o
|
TRANSITION REPORT PURSUANT TO SECTION 13 OR 15(d) OF THE SECURITIES EXCHANGE ACT OF 1934
|
For the transition period from to
Commission file number 0‑23071
THE CHILDREN'S PLACE, INC.
(Exact name of registrant as specified in its charter)
|
Delaware
|
31‑1241495
|
|
|
(State or other jurisdiction of
|
(I.R.S. employer
|
|
|
incorporation or organization)
|
identification number)
|
|
|
500 Plaza Drive
|
||
|
Secaucus, New Jersey
|
07094
|
|
|
(Address of Principal Executive Offices)
|
(Zip Code)
|
|
(201) 558‑2400
(Registrant's Telephone Number, Including Area Code)
Securities registered pursuant to Section 12(b) of the Act:
Common Stock, $0.10 par value
Name of each exchange on which registered
: Nasdaq Global Select Market
Securities registered pursuant to Section 12(g) of the Act:
None.
___________________________________________
Indicate by check mark if the registrant is a well-known seasoned issuer, as defined in Rule 405 of the Securities Act. Yes
o
No
x
Indicate by check mark if the registrant is not required to file reports pursuant to Section 13 or Section 15(d) of the Act. Yes
o
No
x
Indicate by check mark whether the registrant (1) has filed all reports required to be filed by Section 13 or 15(d) of the Securities Exchange Act of 1934 during the preceding 12 months (or for such shorter period that the registrant was required to file such reports), and (2) has been subject to such filing requirements for the past 90 days. Yes
x
No
o
Indicate by check mark whether the registrant has submitted electronically every Interactive Data File required to be submitted pursuant to Rule 405 of Regulation S-T (Section 232.405 of this chapter) during the preceding 12 months (or for such shorter period that the registrant was required to submit such files). Yes
x
No
o
Indicate by check mark if disclosure of delinquent filers pursuant to Item 405 of Regulation S-K is not contained herein and will not be contained, to the best of the registrant's knowledge, in definitive proxy or information statements incorporated by reference in Part III of this Form 10‑K or any amendment to this Form 10‑K.
o
Indicate by check mark whether the registrant is a large accelerated filer, an accelerated filer, a non-accelerated filer, a smaller reporting company, or an emerging growth company. See the definitions of “large accelerated filer,” ”accelerated filer,” “smaller reporting company”, and "emerging growth company" in Rule 12b‑2 of the Exchange Act. (Check one):
|
Large accelerated filer
|
x
|
Accelerated filer
|
o
|
Non-accelerated filer
|
o
|
Smaller reporting company
|
o
|
Emerging growth company
|
o
|
If an emerging growth company, indicate by check mark if the registrant has elected not to use the extended transition period for complying with any new or revised financial accounting standards provided pursuant to Section 13(a) of the Exchange Act.
o
Indicate by check mark whether the registrant is a shell company (as defined in Rule 12b-2 of the Exchange Act). Yes
o
No
x
The aggregate market value of common stock held by non-affiliates was
$1,977,021,554
at the close of business on August 4, 2018 (the last business day of the registrant's fiscal 2018 second fiscal quarter) based on the closing price of the common stock as reported on the Nasdaq Global Select Market. For purposes of this disclosure, shares of common stock held by persons who hold more than 10% of the outstanding shares of common stock and shares held by executive officers and directors of the registrant have been excluded because such persons may be deemed affiliates. This determination of executive officer or affiliate status is not necessarily a conclusive determination for other purposes.
Indicate the number of shares outstanding of each of the registrant's classes of common stock, as of the latest practicable date: Common Stock, par value $0.10 per share, outstanding at March 19, 2019:
15,735,700
.
Documents Incorporated by Reference: Portions of The Children's Place, Inc. Definitive Proxy Statement for its Annual Meeting of Stockholders to be held on May 8, 2019 are incorporated by reference into Part III.
THE CHILDREN'S PLACE, INC. AND SUBSIDIARIES
ANNUAL REPORT ON FORM 10-K
FOR THE FIFTY-TWO WEEKS ENDED FEBRUARY 2, 2019
TABLE OF CONTENTS
|
PAGE
|
||
|
|
|
|
|
|
||
|
|
||
|
|
||
|
|
|
|
|
|
|
|
|
|
||
|
|
||
|
|
||
|
|
||
|
|
||
|
|
||
|
|
||
|
|
||
|
|
||
|
|
||
SPECIAL NOTE REGARDING FORWARD LOOKING STATEMENTS
The Business section and other parts of this Annual Report on Form 10-K may contain certain forward-looking statements regarding future circumstances. Forward-looking statements provide current expectations of future events based on certain assumptions and include any statement that does not directly relate to any historical or current fact. Forward-looking statements can also be identified by words such as “anticipates,” “believes,” “estimates,” “expects,” “intends,” “plans,” “predicts,” and similar terms. These forward-looking statements are based upon current expectations and assumptions of The Children's Place, Inc. (the “Company”) and are subject to various risks and uncertainties that could cause actual results to differ materially from those contemplated in such forward-looking statements including, but not limited to, those discussed in the subsection entitled “Risk Factors” under Part I, Item 1A of this Annual Report on Form 10-K. Actual results, events, and performance may differ significantly from the results discussed in the forward-looking statements. Readers of this Annual Report on Form 10-K are cautioned not to place undue reliance on these forward-looking statements, which speak only as of the date hereof. The Company undertakes no obligation to release publicly any revisions to these forward-looking statements that may be made to reflect events or circumstances after the date hereof or to reflect the occurrence of unanticipated events. The inclusion of any statement in this Annual Report on Form 10-K does not constitute an admission by the Company or any other person that the events or circumstances described in such statement are material.
The following discussion should be read in conjunction with the Company's audited financial statements and notes thereto included elsewhere in this Annual Report on Form 10‑K.
PART I
ITEM 1.-BUSINESS
As used in this Annual Report on Form 10-K, references to the “Company”, “The Children's Place”, “we”, “us”, “our”, and similar terms refer to The Children's Place, Inc. and its subsidiaries. Our fiscal year ends on the Saturday on or nearest to January 31. Other terms that are commonly used in this Annual Report on Form 10-K are defined as follows:
|
•
|
Fiscal 2018 - The fifty-two weeks ended February 2, 2019
|
|
•
|
Fiscal 2017 - The fifty-three weeks ended February 3, 2018
|
|
•
|
Fiscal 2016 - The fifty-two weeks ended January 28, 2017
|
|
•
|
Fiscal 2019 - Our next fiscal year representing the fifty-two weeks ending February 1, 2020
|
|
•
|
GAAP - Generally Accepted Accounting Principles
|
|
•
|
Comparable Retail Sales — Net sales, in constant currency, from stores that have been open for at least 14 consecutive months and from our e-commerce store, excluding postage and handling fees. Store closures in the current fiscal year will be excluded from Comparable Retail Sales beginning in the fiscal quarter in which the store closes. A store that is closed for a substantial remodel, relocation, or material change in size will be excluded from Comparable Retail Sales for at least 14 months beginning in the fiscal quarter in which the closure occurred. However, stores that temporarily close will be excluded from Comparable Retail Sales until the store is re-opened for a full fiscal month.
|
|
•
|
SEC - U.S. Securities and Exchange Commission
|
|
•
|
FASB- Financial Accounting Standards Board
|
|
•
|
FASB ASC - FASB Accounting Standards Codification, which serves as the source for authoritative U.S. GAAP, except that rules and interpretive releases by the SEC are also sources of authoritative U.S. GAAP for SEC registrants
|
|
•
|
CCPSA - Canada Consumer Product Safety Act
|
|
•
|
CPSA - U.S. Consumer Product Safety Act
|
|
•
|
CPSC - U.S. Consumer Products Safety Commission
|
|
•
|
CPSIA - U.S. Consumer Product Safety Improvement Act of 2008
|
General
The Children's Place, Inc. is the largest pure-play children's specialty apparel retailer in North America. We sell apparel, footwear, accessories, and other items for children. We design, contract to manufacture, sell at retail and wholesale, and license to sell trend right, high quality merchandise at value prices, the substantial majority of which is under the proprietary “The Children's Place”, "Place", and "Baby Place" brand names. Our stores offer a friendly and convenient shopping environment. The Children's Place has differentiated departments and serves the wardrobe needs of girls and boys (sizes 4-18), toddler girls and boys (sizes 6 months-5T) and baby (sizes 0-24 months). Stores are visually merchandised by size segment.
Our
3
merchandise is also available online at
www.childrensplace.com
. Our customers are able to shop online and receive the same merchandise available in our physical stores, in addition to certain merchandise which is exclusive to our e-commerce site.
The Children's Place was founded in 1969. The Company became publicly traded on the Nasdaq Global Select Market in 1997. As of February 2, 2019, we operated 972 stores throughout North America as well as our online store. During Fiscal 2018, we opened no stores and closed 42 stores. During Fiscal 2017, we opened two stores and closed 27 stores. Also, in Fiscal 2018, we continued to expand into international markets through territorial agreements with franchisees, and, in our wholesale business, we continued to add accounts and expand categories and distribution to our customers.
Jane Elfers, our President and Chief Executive Officer, established four key strategic initiatives:
|
1.
|
Superior Product -
Product is our number one priority. We strive to ensure that we have the right product, in the right channels of distribution, at the right time. In addition to apparel, we offer a full line of footwear and accessories so busy moms can quickly and easily put together head-to-toe outfits. Our design, merchandising, sourcing, and planning teams strive to ensure that our product is trend right, while at the same time balancing fashion and fashion basics with more frequent, wear-now deliveries.
|
|
2.
|
Business Transformation through Technology
-
Our business transformation through technology initiative has two key components: digital transformation and inventory management. With respect to digital transformation, our goal is to deliver one to one personalization focusing on driving customer acquisition, improving customer retention, and increasing customer engagement with our brand and to continue to gain market share. The transformation of our digital capabilities has continued during Fiscal 2018 with a new loyalty system that will deliver real-time personalized communication and promotions, the implementation of a new on-site search tool, the enhancement of our email trigger capabilities, and the introduction of dynamic display re-targeting. We plan to continue to develop several new capabilities, including: a new pricing and promotional system that will enable us to deliver personalized offers to our customers, improvements to our e-commerce platform, and buy-online-ship-to-store. With respect to inventory management, we have implemented assortment planning, allocation, replenishment, order planning, and forecasting tools.
|
|
3.
|
Growth through Alternate Channels of Distribution
-
We have channels of distribution, in addition to retail stores and e-commerce, including international and wholesale distribution. We continued our international expansion program during Fiscal 2018 with our franchise partners and added 27 net additional international points of distribution (stores, shop in shops, e-commerce site) bringing our total count to 217 points of distribution operating in 20 countries. During the first quarter of Fiscal 2018, we announced an exclusive license agreement for the Greater China market with Zhejiang Semir Garment Co. Ltd ("Semir"), China's largest specialty children's apparel retailer and during Fiscal 2018, Semir opened its first five stores in China. In our wholesale business, our relationship with Amazon continues to develop with the expansion of our replenishment program.
|
|
4.
|
Fleet Optimization
- We continually evaluate our store fleet as part of our fleet optimization initiative. To improve store productivity, we plan to close approximately 300 stores through fiscal 2020, which includes the 211 stores closed since the announcement of this initiative.
|
Overlaying these four strategic initiatives is talent. Talent ultimately defines our success, and, over the past several years, we have built a best-in-class management team. We believe that our talented team is a significant competitive advantage for our Company.
Underlying these growth initiatives is a commitment to operational excellence. The Company’s commitment to operational excellence includes disciplined expense management and a focus on improving store and e-commerce operations, and combined with our finance, compliance, legal, and human resources areas, forms the strong base necessary to support our long-term growth initiatives.
Segment Reporting
In accordance with FASB ASC 280--
Segment Reporting
, we report segment data based on geography: The Children’s Place U.S. and The Children’s Place International. Each segment includes an e-commerce business located at
www.childrensplace.com
. Included in The Children’s Place U.S. segment are our U.S. and Puerto Rico based stores and revenue from our U.S.-based wholesale business. Included in The Children's Place International segment are our Canadian-based stores, revenue from the Company's Canada wholesale business, as well as revenue from international franchisees. We measure our segment profitability based on operating income, defined as income before interest and taxes. Net sales and direct costs are recorded by each segment. Certain inventory procurement functions such as production and design as well as corporate overhead, including executive management, finance, real estate, human resources, legal, and information technology services are managed by The Children’s Place U.S. segment. Expenses related to these functions, including depreciation and amortization, are allocated to The Children’s Place International segment based primarily on net sales. The assets related to
4
these functions are not allocated. We periodically review these allocations and adjust them based upon changes in business circumstances. Net sales to external customers are derived from merchandise sales, and we have no major customers that account for more than
10%
of our net sales. The following tables show, by segment, our net sales and operating income for the past three fiscal years and total assets as of February 2, 2019 and February 3, 2018:
|
Fiscal Year Ended
|
||||||||||||
|
February 2, 2019
|
February 3, 2018
|
January 28, 2017
|
||||||||||
|
(In thousands)
|
||||||||||||
|
Net sales:
|
||||||||||||
|
The Children's Place U.S.
|
$
|
1,727,907
|
|
$
|
1,650,620
|
|
$
|
1,567,556
|
|
|||
|
The Children's Place International
|
210,177
|
|
219,655
|
|
217,760
|
|
||||||
|
Total net sales
|
$
|
1,938,084
|
|
$
|
1,870,275
|
|
$
|
1,785,316
|
|
|||
|
Fiscal Year Ended
|
||||||||||||
|
February 2, 2019
|
February 3, 2018
|
January 28, 2017
|
||||||||||
|
(In thousands)
|
||||||||||||
|
Operating income:
|
||||||||||||
|
The Children's Place U.S.
|
$
|
86,983
|
|
$
|
132,152
|
|
$
|
113,376
|
|
|||
|
The Children's Place International
|
24,345
|
|
29,358
|
|
34,032
|
|
||||||
|
Total operating income
|
$
|
111,328
|
|
$
|
161,510
|
|
$
|
147,408
|
|
|||
|
Operating income as a percent of net sales:
|
||||||||||||
|
The Children's Place U.S.
|
5.0
|
%
|
8.0
|
%
|
7.2
|
%
|
||||||
|
The Children's Place International
|
11.6
|
%
|
13.4
|
%
|
15.6
|
%
|
||||||
|
Total operating income as a percent of net sales
|
5.7
|
%
|
8.6
|
%
|
8.3
|
%
|
||||||
|
February 2, 2019
|
February 3, 2018
|
|||||||
|
(In thousands)
|
||||||||
|
Total assets:
|
||||||||
|
The Children's Place U.S.
|
$
|
651,728
|
|
$
|
750,670
|
|
||
|
The Children's Place International
|
75,318
|
|
189,558
|
|
||||
|
Total assets
|
$
|
727,046
|
|
$
|
940,228
|
|
||
See Note 12 of the Notes to our Consolidated Financial Statements for further segment financial data.
All foreign net sales are in The Children's Place International segment while certain foreign expenses related to our buying operations are allocated between the two segments.
Key Capabilities
Our objective is to deliver high quality, value priced, trend right assortments for children. Our assortment offers one stop shopping across apparel, footwear, accessories, and other items for children. Our strategies to achieve this objective are as follows:
Merchandising Strategy
Our merchandising strategy is to offer a compelling and coordinated assortment of apparel, footwear, accessories, and other items for children that encourage our customers to purchase head to toe outfitting for their children. We assort our deliveries by season and flow new product to our stores monthly.
5
High Quality and Value Pricing
We believe that offering high quality, value priced, and trend right merchandise under “The Children's Place”, "Place", and "Baby Place" brand names at value prices is our competitive advantage. We design and merchandise our branded apparel, footwear, and accessories to offer a compelling value to our customers.
Brand Image
We focus on strengthening our brand image and customer loyalty by:
|
•
|
Consistently offering high quality and age appropriate products and trend right fashion at value prices in a friendly and convenient shopping environment;
|
|
•
|
Providing coordinated outfits and accessories for our customers' lifestyle needs;
|
|
•
|
Leveraging our customer database to communicate with our customers and personalize promotions to maximize customer satisfaction;
|
|
•
|
Using our MyPLACE Loyalty Rewards Program and private label credit card to drive customer engagement;
|
|
•
|
Providing exclusive assortments in our e-commerce business to further expand the breadth of our offerings and brand recognition;
|
|
•
|
Creating strong merchandising and visual presentations to create a compelling in-store experience; and
|
|
•
|
Emphasizing our great value and fashion in marketing visuals to convey a consistent brand message.
|
Low-Cost Global Sourcing
We design, source, and contract to manufacture the substantial majority of The Children's Place branded products. We believe that this is essential to assuring the consistency and quality of our merchandise, as well as our ability to deliver value to our customers. We have strong relationships with our vendors. Through these relationships and our extensive knowledge of low cost sourcing on a global scale, we are able to offer our customers high-quality products at value prices. We maintain a network of sourcing offices globally in order to manage our vendors efficiently and respond to changing business needs effectively. Our sourcing offices in Hong Kong, China, India, Bangladesh, Vietnam, Indonesia, and Ethiopia, and contract associates in greater Africa, Cambodia, and other countries in which we source products, give us access to a wide range of vendors and allow us to work to maintain and/or reduce our merchandise costs by capitalizing on new sourcing opportunities while maintaining our product quality.
Merchandising Process
The strong collaboration between our experienced, cross-functional teams in design, merchandising, sourcing, and planning have enabled us to build our brand.
Design
The design team gathers information from trends, color services, research, and trade shows.
Merchandising
Each quarter, we develop seasonal merchandising strategies.
Planning and Allocation
The planning and allocation organization works collaboratively with the merchandising, finance, and global sourcing teams to develop seasonal sales and margin plans to support our financial objectives and merchandising strategies. Further, this team plans the flow of inventory to ensure that we are adequately supporting floor sets and key promotional periods. Special attention is paid to our store types, as they differ in capacity and layout.
Production, Quality Assurance, and Responsible Sourcing
During Fiscal 2018, we engaged independent contract vendors located primarily in greater Asia and Africa. We continue to pursue global sourcing opportunities to support our inventory needs and to seek to reduce merchandise costs. We contract for the manufacture of the substantial majority of the products we sell. We do not own or operate any manufacturing facilities.
During Fiscal 2018, we sourced all of our merchandise directly without the use of third party commissioned buying agents. We source from a diversified network of vendors, including approximately 19% of our total merchandise from China,
6
approximately 16% from Bangladesh, and approximately 11% from each of Vietnam, Indonesia, and India. No other country accounted for 10% or more of our production.
In addition to our quality assurance procedures, we conduct a responsible sourcing program that seeks to protect our company and enhance our brand by providing guidance in-line with industry standards to our global vendors in their efforts to provide safe and appropriate working conditions for their employees. These efforts are part of an ongoing process to encourage the continued improvement by our vendors of factory working conditions, and ultimately, the lives of their employees who make our product. Additionally, under our responsible sourcing program, we monitor changes in local laws and other conditions (e.g., worker safety, workers' right of association, and political and social instability) in the countries from which we source in order to identify and assess potential risks to our sourcing capabilities. The components of our program are as follows:
|
•
|
Vendor Code of Conduct
- By formally acknowledging and agreeing to our code of conduct, our vendors affirm their commitment to integrate compliance with local law and industry standards into their manufacturing and sourcing practices. Topics covered by these standards include child labor, involuntary or forced labor, slavery and human trafficking, coercion or harassment, discrimination, health and safety, transparency and integrity, compensation, working hours, freedom of association, environment, unauthorized subcontracting, security practices, and undue influence of independent auditors.
|
|
•
|
Ongoing Auditing Program
- We administer a factory auditing program staffed by our internal quality assurance and responsible sourcing teams and/or professional third party auditors, who visit factory locations to provide insight into general factory working conditions and other production characteristics in all factories that manufacture The Children's Place products. With this information, we can understand factories’ challenges, help the factories identify non-compliance with legal and industry standards, and offer guidance on corrective action plans for the factories to achieve better compliance. All factories that are approved for The Children’s Place production must undergo technical capabilities and responsible sourcing audits prior to any orders being placed and periodically thereafter.
|
|
•
|
Corrective Action Plans
- Following each audit, a corrective action plan outlines any areas of non-compliance identified through the factory audit. Each factory is expected to develop a remediation plan and remediation timeline for any non-compliance found. Through follow-up audits, we assess a factory’s progress in achieving its remediation plan. It is our preference to work with factories to remediate and achieve compliance rather than terminate our relationship; however, where there is serious non-compliance of critical standards, repeated non-compliance, or failure of the factories to invest in continued improvement, we reserve the right to terminate our relationship.
|
|
•
|
Vendor Factory Engagement
- Our responsible sourcing team provides guidance and training to vendors and factories in order to help vendors and factories improve compliance with industry standards and local laws. Our goal is to serve as a resource for vendors and factories as they develop and strengthen their capabilities to better manage the working conditions of their employees.
|
|
•
|
Worker Well Being Programs
- The Company’s global responsible sourcing activities involve the Company’s third party factories who manufacture the Company’s merchandise. These vendors’ workforce is predominantly women who work in factories in underdeveloped countries in greater Asia and Africa. In addition to its auditing activities concerning local laws and ethical business practices, worker health and welfare, working conditions, safety, rights of association, and other practices at factories, in recent times, the Company’s
commitment
to responsible sourcing activities has evolved beyond a compliance-based approach to a more holistic view, focusing not only on compliance but also on worker training and education. In support of our business and societal objectives and those of our vendors to create and sustain a healthy and engaged workforce, below are examples of programs sponsored by the Company:
|
|
•
|
BSR’s HERproject
- This program is designed to positively impact the well-being of women through workplace-based education and training provided by local non-governmental organizations to promote health, gender equality, financial inclusion, and other life-needs. The most recent Company sponsorship involved factories located in the Hawansa Industrial Park in Ethiopia and, at full implementation, will reach over 7,000 women factory workers in 10 factories.
|
|
•
|
ILO’s BetterWork program
- Partnering with over 30 companies and the International Finance Corporation, a member of the World Bank, this program works with global brands, factory owners, governments, unions, and workers to improve working conditions in the garment industry through assessments, training, advocacy, and research. BetterWork’s gender strategy aims to empower women workers, reduce sexual harassment, and close the gender pay gap in the global garment industry. The BetterWork program is sponsored by the Company in over 40 factories in five countries.
|
|
•
|
CARE’s Healthy Food Healthy Workplace program
- This program aims to improve awareness of the health benefits of nutritious foods and good hygiene. The Company has invested in this program in
|
7
Cambodia to support healthy eating choices in order to combat instances of workplace fainting which is a widespread phenomenon in the garment industry in Cambodia.
|
•
|
CCR CSR
- In partnership with global brands like the Company, CCR CSR provides education and training designed to improve the lives of children and parent factory workers. The Company has invested in the Distance Without Separation program in China to provide migrant parents separated from their homes and children to find work with tools to better connect with their children, and ultimately, strengthen parent-child bonds when families are separated due to work commitments. This leads to parent workers feeling more secure about the well-being of their children, enabling them to be more engaged and productive in the workplace.
|
|
•
|
Environmental Stewardship
- In Fiscal 2018, the Company expanded its responsible sourcing activities to include environmental stewardship. We join with companies in the specialty apparel and footwear industry, and other non-profit organizations, to work with suppliers to reduce unnecessary environmental harm from manufacturing activities. This is accomplished by leveraging market power to encourage suppliers to improve production and procurement practices that may be harmful to the environment and to drive improved operational efficiencies and resource consumption. The Company’s environmental impact program in the supply chain focuses on:
|
|
•
|
Chemical Management
- To support more responsible chemical management practices in apparel and footwear production. In Fiscal 2018, the Company became a member of the Apparel & Footwear International RSL Management Group ("AFIRM") whose stated goal is to promote the harmonized management of restricted substances (chemicals) in the apparel and footwear industry. Member brands share best practices to reduce the impact of harmful chemicals in the global supply chain.
|
|
•
|
Wastewater and Effluence
- To support more sustainable wastewater processes at our third-party factories, in Fiscal 2018, the Company became a member of the Sustainable Apparel Coalition (SAC). Under the auspices of SAC, the Company and other brands employ their collective market power to conduct environmental facility assessments at mills, factories, and other facilities and develop corrective action plans against benchmarks aimed at promoting effective water and chemical management practices to mitigate pollution risks.
|
|
•
|
Responsibly Sourced Cotton
- To support cotton procurement practices that foster the payment of living wages and the reduction of pesticide and water use in our global supply chain. In Fiscal 2018, the Company became a member of the Better Cotton Initiative (BCI) whose stated goal is to make global cotton production better for the people who produce it, better for the environment it grows in, and better for the sector’s future.
|
Company Stores
The following section highlights various store information for The Children's Place operated stores as of
February 2, 2019
.
Existing Stores
As of
February 2, 2019
, we operated a total of 972 The Children's Place stores in the United States, Canada, and Puerto Rico, most of which are clustered in and around major metropolitan areas and our store at
www.childrensplace.com.
In addition, our eight international partners operated 217 international points of distribution in 20 countries. We operate 598 stores located in malls, 201 in strip centers, 136 in outlet centers, and 37 in street locations. The following table sets forth the number of stores in the U.S., Puerto Rico, and Canada as of the current and prior fiscal year end:
|
Number of Stores
|
||||||
|
Location
|
February 2, 2019
|
February 3, 2018
|
||||
|
United States
|
842
|
|
878
|
|
||
|
Canada
|
122
|
128
|
||||
|
Puerto Rico
|
8
|
8
|
||||
|
Total Stores
|
972
|
1,014
|
||||
8
Store Concepts
At The Children's Place, our store concepts consist of multiple formats ranging in size from 4,100 to 7,100 square feet, which have evolved over time in response to market trends, and are strategically placed within each market. We try to create an open and brightly lit environment for customers. Our stores typically feature white fixtures to ensure the product is the focal point, using color to brand, and create shop identifiers.
Fleet Optimization
As part of our store fleet optimization initiative, we plan to close approximately 300 stores through fiscal 2020, which includes the 211 stores closed since the announcement of this initiative. Over the past five fiscal years, we have reduced our total store square footage from 5.1 million to 4.5 million. These closures have resulted in improved profitability and operating margin accretion due to sales transfer, low cost of exit, and the elimination of the underperforming locations. In those markets where we have closed stores, we are seeing the neighboring stores along with the e-commerce business become more productive from both a Comparable Retail Sales and profitability perspective. These results further our commitment to continue to execute this optimization program while dramatically slowing down new store openings.
We continuously review the performance of our store fleet. We base our decisions to open, close, or remodel stores on a variety of factors, including lease terms, landlord negotiations, market dynamics, and projected financial performance. When assessing whether to close a store, we also consider remaining lease life and current financial performance.
E-commerce Sales
Our U.S. and International segments each include an e-commerce business located at
www.childrensplace.com
and
digital growth remains one of our top strategic priorities. We are committed to delivering a best in class, end-to-end user experience including product assortment and website operation, fulfillment, and customer service. We are further committed to delivering these experiences to our customers when, where, and how they are looking to access the brand, accounting for cross-channel behavior, growth of mobile devices, and the growing interest in our brand from international consumers. As such, we will continue to make required investments in back-end infrastructure, as well as front-end technology to deliver on this commitment. We believe that the critical investments made in areas such as e-commerce infrastructure and mobile optimization, as well as additional front-end website features have improved our customers' experience.
International Franchises and Wholesale
We continued our international expansion program with our franchise partners and added 27 net additional international points of distribution (stores, shop in shops, e-commerce site) bringing our total count to 217 points of distribution operating in 20 countries. We generate revenues from our franchisees from the sale of products and sales royalties. During the first quarter of Fiscal 2018, we announced an exclusive license agreement with Semir, China's largest specialty children's apparel retailer and during Fiscal 2018, Semir opened its first five stores in China. In our wholesale business, our relationship with Amazon continues to develop with the expansion of our replenishment program.
Store Operations
The Children's Place store operations are organized by geographical region. We have a centralized store operations function within our corporate offices who oversee our operations of both Place and Outlet stores and to whom group, zone, and regional directors report. A regional director oversees a number of district managers residing within each region. Our stores are staffed by store managers and full-time and part-time sales associates, with additional temporary associates hired to support seasonal needs. Our store managers spend a high percentage of their time on the store's selling floor providing direction, motivation, and development to store personnel. To maximize selling productivity, our teams emphasize greeting, replenishment, presentation standards, procedures, and controls. In order to motivate our store management, we offer a quarterly incentive compensation plan that awards bonuses for achieving certain financial goals.
Seasonality
Our business is subject to seasonal influences, with heavier concentrations of sales during the back-to-school and holiday seasons. Our first fiscal quarter results are dependent upon sales during the period leading up to the Easter holiday, third fiscal quarter results are dependent upon back-to-school sales, and our fourth fiscal quarter results are dependent upon sales during the holiday season. The business is also subject to shifts due to unseasonable weather conditions. The following table shows the quarterly distribution, as a percentage of the full year, of net sales and operating income:
9
|
First Quarter
|
Second Quarter
|
Third Quarter
|
Fourth Quarter
|
|||||||||
|
Quarterly net sales as a percentage of full year
|
||||||||||||
|
Fiscal 2018
|
22.5
|
%
|
23.2
|
%
|
27.0
|
%
|
27.3
|
%
|
||||
|
Fiscal 2017
|
23.3
|
%
|
20.0
|
%
|
26.2
|
%
|
30.5
|
%
|
||||
|
Quarterly operating income as a percentage of full year
|
||||||||||||
|
Fiscal 2018
|
20.7
|
%
|
9.0
|
%
|
58.0
|
%
|
12.3
|
%
|
||||
|
Fiscal 2017
|
26.2
|
%
|
2.0
|
%
|
39.7
|
%
|
32.1
|
%
|
||||
For more information regarding the seasonality of our business, refer to Item 7. Management's Discussion and Analysis of Financial Condition and Results of Operations-Quarterly Results and Seasonality.
Marketing
The Children's Place is a well-recognized brand, with a trend right offering and a compelling value proposition. Our direct marketing program utilizes both on and off-line channels.
During Fiscal 2017, we re-launched our customer loyalty program in conjunction with our new private label credit card program. At the end of Fiscal 2018, members of our MyPLACE Rewards loyalty program accounted for approximately 76% of sales. Our private label credit card is issued to our customers for use exclusively at The Children's Place stores and online at
www.childrensplace.com
, and credit is extended to such customers through a third-party financial institution on a non-recourse basis to us. Approximately 23% and 18% of our net sales during Fiscal 2018 and Fiscal 2017, respectively, were transacted using our private label credit card. We promote affinity and loyalty through our marketing programs by utilizing specialized incentive programs.
Distribution
In the United States, we own and operate a 700,000 square foot distribution center in Alabama, which supports both U.S. retail store operations and U.S. e-commerce operations. In Canada, we lease and operate a 95,000 square foot distribution center in Ontario for our Canadian retail store operations. We also use a third-party provider to support our Canadian e-commerce operations. On occasion, we may utilize additional facilities to support seasonal warehousing needs. We also use a third-party provider of warehousing and logistics services in both Malaysia and China to support our international franchise business. During Fiscal 2018, the Company launched ship from store capabilities fleet-wide to meet our e-commerce demand. In Fiscal 2019, the Company expects to utilize a third-party logistics provider to assist with fulfillment of our holiday e-commerce demand.
Competition
The children's apparel, footwear, and accessories retail markets are highly competitive. Our primary competitors are specialty stores and mass merchandisers, including Target Corporation and GapKids, babyGap and Old Navy (each of which is a division of The Gap, Inc.), The Gymboree Corporation (in liquidation under U.S. bankruptcy law in a proceeding filed on January 17, 2019; see Item 7-Management Discussion and Analysis "
Gymboree Bankruptcy and Acquisition"
), Justice (a division of The Ascena Retail Group, Inc.), Carter's, Inc., J.C. Penney Company, Inc., Kohl's Corporation and other department stores, as well as other discount stores such as Walmart Stores, Inc. We also compete with regional retail chains, catalog companies, and e-commerce retailers. One or more of our competitors are present in substantially all of the areas in which we have stores.
Trademarks and Service Marks
“The Children's Place,” “Place,” and “Baby Place", and certain other marks have been registered as trademarks and/or service marks with the United States Patent and Trademark Office and in Canada and other foreign countries. The registration of the trademarks and the service marks may be renewed to extend the original registration period indefinitely, provided the marks are still in use. We intend to continue to use and protect our trademarks and service marks and maintain their registrations. We have also registered our trademarks in other countries where we source our products and where we have established and anticipate establishing franchising operations. We believe our trademarks and service marks have received broad recognition and are of significant value to our business.
10
Government Regulation
We are subject to extensive federal, state, local, provincial, and other foreign laws and regulations affecting our business, including product testing and safety, consumer protection, privacy, truth-in-advertising, accessibility, customs, wage and hour laws and regulations, and zoning and occupancy ordinances that regulate retailers generally and/or govern the promotion and sale of merchandise and the operation of retail stores and e-commerce sites. We also are subject to similar international laws and regulations affecting our business. We believe that we are in material compliance with these laws and regulations.
We are committed to product quality and safety. We focus our efforts to adhere to all applicable laws and regulations affecting our business, including the provisions of the CPSIA, the Federal Hazardous Substances Act, the Flammable Fabrics Act and the Textile Fiber Product Identification Act, the Canada Consumer Product Safety Act, the Canadian Textile Labelling Act, the Canadian Care Labelling Program, and various environmental laws and regulations. Each of our product styles currently covered by the CPSIA and the CCPSA are appropriately tested to meet current standards.
Virtually all of our merchandise is manufactured by third-party factories located outside of the United States. These products are imported and are subject to U.S. and Canadian customs laws, which impose tariffs, anti-dumping and countervailing duties on certain imported products, including textiles, apparel, footwear, and accessories. We currently are not restricted by any such duties in the operation of our business. The U.S. currently imposes a 10% tariff on the importation of certain merchandise produced by the Company in China. This merchandise constitutes a small percentage of our merchandise which is produced in China. There are proposals to increase the tariff rate to 25% on this merchandise and to impose tariffs of 25% on all remaining merchandise that we source from Chinese manufacturers. Approximately 19% of our merchandise was produced in China in Fiscal 2018. These proposals are subject to ongoing negotiations of larger trade matters involving the U.S. and China, and there can be no assurance as to whether these proposals will go into effect and/or whether other steps will be taken which affect the importation of Chinese produced merchandise into the U.S. The imposition of additional tariffs and/or the taking of other steps could have a material adverse effect on our business, financial condition, results of operations, and cash flows.
Employees
As of February 2, 2019, we had approximately 18,700 employees, approximately 1,800 of whom were based at our corporate offices and distribution centers. Approximately 2,100 were full-time store employees and approximately 14,800 were part-time and seasonal store employees. None of our employees are covered by a collective bargaining agreement.
Internet Access to Reports
We are a public company and are subject to the disclosure requirements of the Securities Exchange Act of
1934, as amended (the “Exchange Act”). Accordingly, we file periodic reports, proxy statements, and other information with the SEC. Such reports, proxy statements, and other information may be obtained by visiting the SEC website (
http://www.sec.gov
) that contains reports, proxy, and information statements and other information regarding us and other issuers that file electronically.
Our website address is
www.childrensplace.com
. We make available without charge, through our website, copies of our Proxy Statement, Annual Report on Form 10-K, Quarterly Reports on Form 10-Q, Current Reports on Form 8-K, and amendments to those reports filed or furnished pursuant to Section 13(a) or 15(d) of the Exchange Act as soon as reasonably practicable after such reports are filed with or furnished to the SEC. References in this document to our website are not and should not be considered part of this Annual Report on Form 10-K, and the information on our website is not incorporated by reference into this Annual Report on Form 10-K.
We also make available our corporate governance materials, including our corporate governance guidelines and our code of business conduct, on our website. If we make any substantive amendments to our code of business conduct or grant any waiver, including any implicit waiver, from a provision of the code for the benefit of our Chief Executive Officer and President and our Chief Operating Officer and Chief Financial Officer, we will disclose the nature of such amendment or waiver on that website or in a Current Report on Form 8-K.
11
|
Item 1A.
|
RISK FACTORS
|
Investors in the Company should consider the following risk factors as well as the other information contained herein:
Changes in our Comparable Retail Sales and/or quarterly results of operations could have a material adverse effect on the market price of our common stock.
Numerous factors affect our Comparable Retail Sales and quarterly financial results, including unseasonable weather conditions, merchandise assortment and product acceptance, the retail price of our merchandise, fashion trends, mall traffic, number of visits to our e-commerce site, as well as related conversion, economic conditions in general and the retail sales environment in particular, calendar shifts of holidays or seasonal periods, birth rate fluctuations, timing or extent of promotional events by our Company or by competitors and other competitive factors, including competitor bankruptcies, fluctuations in currency exchange rates, macro-economic conditions, and our success in and the cost of executing our business strategies.
Unseasonable weather, for example, warm weather in the winter or cold weather in the spring over an extended period of time, or the occurrence of frequent or severe storms, may adversely affect our sales and, therefore, our Comparable Retail Sales. The nature of our target customer heightens the effects of unseasonable weather on our sales. Our target customer is a value conscious, lower to middle income mother buying for infants and children primarily based on need rather than based on fashion, trend, or impulse. Therefore, for example, our target customer may not purchase warm weather spring clothing during an extended period of unseasonably cold weather occurring in what otherwise should be warmer weather months.
Our Comparable Retail Sales and quarterly results have fluctuated significantly in the past due to the factors cited above, and we anticipate that they may continue to fluctuate in the future, particularly in the highly competitive retail environment in which we operate, which may result in declines or delays in consumer spending. The investment and analyst community follows Comparable Retail Sales and quarterly results closely and fluctuations in these results, or the failure of our results to meet our publicly announced guidance concerning Comparable Retail Sales, earnings per share, margin, and other financial metrics or our investors’ or analysts’ expectations, may have a significant adverse effect on the price of our common stock.
We may not be able to successfully execute our business strategies.
Our strategic initiatives involve a focus on (i) delivering product of a quality and value that resonates with our customers, (ii) transformation of our business systems, including to augment our digital and omni-channel capabilities, align and upgrade our distribution and logistics operations, and optimize our inventory buys and allocations, (iii) expansion of our channels of distribution and geographical coverage, and (iv) optimization of our North American retail store fleet. In addition, a wholly-owned subsidiary of the Company was named the successful bidder in the bankruptcy auction to acquire certain intellectual property and related assets of Gymboree Group, Inc. and related entities. We plan to use the Gymboree brand to expand our business across our retail stores, e-commerce, international, and wholesale businesses. Our failure to properly execute our plans, delays in executing our plans, increased costs associated with executing on our plans, or failure to identify alternative strategies could have a material adverse effect on our financial position, results of operations, and cash flows.
During Fiscal 2019, we will continue to implement and refine our business systems transformation initiatives designed to increase sales and profitability. Our business transformation through technology initiative has two key components: inventory management and digital transformation. With respect to inventory management, the tools we have implemented are delivering gross margin and inventory productivity benefits, and although there can be no assurances, we expect that additional tools and the refinement of existing tools will continue to do the same. With respect to digital transformation, we are in the process of implementing a personalized customer contact strategy. These initiatives require the execution of complex projects involving significant systems and operational changes, which place considerable demands on our management and our information and other systems. Our ability to successfully implement and capitalize on these projects is dependent on management’s ability to manage these projects effectively and implement and operate them successfully, without adversely affecting the subject and/or other systems, and on our employees’ ability to affect the required operational changes. If we fail to implement these projects effectively, including aligning them with our distribution and logistics operations, we experience significant delay, cost overruns, or unforeseen costs, or the necessary operational changes are not affected properly, we may not realize the return on our investments that we anticipate, we may adversely affect the operation of other systems, and our business, financial position, operating results, and cash flows could be materially adversely affected.
Consumer demand, behavior, taste, and purchasing trends, as well as geopolitical conflicts and economic and political stability may differ in international markets and/or in the distribution channels through which our wholesale customers sell products and, as a result, sales of our products may not be successful or meet our expectations, or the margins on those sales may not be in line with those we currently anticipate. We may also face difficulties integrating foreign business operations and/or wholesaling operations with our current sourcing, distribution, information technology systems, and other operations. Any
12
of these challenges could hinder our success in new markets or new distribution channels. There can be no assurance that we will successfully complete any planned expansion or that any new business will be profitable or meet our expectations.
During Fiscal 2019, we will continue our store fleet optimization program, which is intended to increase the profitability of our existing retail store fleet. Currently, it is planned that this program will close approximately 300 retail stores through fiscal 2020, which includes the 211 retail stores closed between fiscal 2013 and Fiscal 2018. Failure to properly identify or measure underperforming retail stores, failure to achieve anticipated sales transfer rates from closed stores to remaining retail stores and/or e-commerce sales, and failure to properly identify and analyze customer segmentation and spending patterns could have a material adverse effect on our financial position, results of operations, and cash flows. In addition, pursuant to generally accepted accounting principles, we are required to recognize an impairment charge when circumstances indicate that the carrying value of long-lived assets may not be recoverable. If a determination is made that the asset’s carrying value of a long-lived asset is not recoverable over its estimated useful life, the asset is written down to its estimated fair value.
Any of the above risks, individually or in aggregation, could have a material adverse effect on our financial position, results of operations, and cash flows.
A privacy breach, through a cybersecurity incident or otherwise, or failure to comply with privacy laws could materially adversely affect our business.
As part of normal operations, we and our third-party vendors and partners, receive and maintain confidential and personally identifiable information about our customers and employees, and confidential financial, intellectual property, and other information. We regard the protection of our customer, employee, and company information as critical. The regulatory environment surrounding information security and privacy is very demanding, with the frequent imposition of new and changing requirements, such as the California Consumer Privacy Act of 2018, some of which involve significant costs to implement and significant penalties if not followed properly.
Our efforts and technology to secure our computer network and systems may not be sufficient to defend us against all unauthorized attempts to access our information. We have been and may be subject to attempts to gain unauthorized access to our computer network and systems. To date, prior attempts have not had a material adverse effect on us. A cybersecurity breach, whether targeted, random, or inadvertent, and whether at the hands of cyber criminals, hackers, rogue employees, or other persons, may occur and could go undetected for a period of time, resulting in a material disruption of our computer network, a loss of information valuable to our business, including without limitation customer or employee personally identifiable information, and/or theft.
A breach to the computer networks and systems of our third-party vendors and partners, including those that are cloud-based, may also occur. Our third-party vendors and partners have been and may be subject to unauthorized attempts to gain access to their networks and systems, which could lead to a material disruption of our computer network and/or the areas of our business dependent on the support, services, and other products provided by those third-party vendors and partners who may have been adversely affected by such unauthorized attempt. As a result, we may experience a decrease in sales and/or a loss of information valuable to our business, including without limitation customer or employee personally identifiable information, and/or theft. To date, past attempts to gain unauthorized access to the networks and systems of our third-party vendors and partners have not had a material adverse effect on us.
Any cybersecurity incident could result in any of the following:
•
theft, destruction, loss, misappropriation, or release of confidential financial and other data, intellectual property, customer awards or loyalty points, or customer or employee information, including personally identifiable information such as payment card information, email addresses, passwords, social security numbers, home addresses, or health information;
•
operational or business delays resulting from the disruption of our e-commerce site, computer network or the computer networks of our third-party vendors and partners and subsequent material clean-up and mitigation costs and activities;
•
negative publicity resulting in material reputation or brand damage with our investors, customers, vendors, third-party partners, or industry peers;
•
loss of sales, including those generated through our e-commerce website; and
•
governmental penalties, fines and/or enforcement actions, payment and industry penalties and fines, and /or class action and other lawsuits.
13
Our systems and procedures are required to meet the Payment Card Industry ("PCI") data security standards, which require periodic audits by independent third parties to assess compliance. Failure to comply with the security requirements or rectify a security issue may result in substantial fines and the imposition of material restrictions on our ability to accept payment by credit or debit cards. There can be no assurance that we will be able to satisfy PCI security standards or to identify security issues in a timely fashion. In addition, PCI are controlled by a limited number of vendors who have the ability to impose changes in PCI's fee structure and operational requirements on us without negotiation. Such changes in fees and operational requirements may result in our failure to comply with PCI security standards, as well as significant unanticipated expenses.
Any of the above risks, individually or in aggregation, could result in significant costs and/or materially damage our reputation and result in lost sales, governmental and payment card industry fines, and/or class action and other lawsuits, which in turn could have a material adverse effect on our financial position, results of operations, and cash flows. Although we carry cybersecurity insurance, in the event of a cyber-incident, that insurance may not be extensive enough or adequate in scope of coverage or amount to reimburse us for damages we may incur. Further, a significant breach of federal, state, provincial, local, or international privacy laws could have a material adverse effect on our reputation, financial position, results of operations, and cash flows.
Our failure to successfully manage our e-commerce business could have a material adverse impact on our business.
The successful operation of our e-commerce business depends on our ability to maintain the efficient and uninterrupted operation of our online order-taking and our fulfillment operations, and on our ability to provide a shopping experience that will generate orders and return visits to our site, including by updating our e-commerce platform to stay abreast of changing consumer shopping habits such as the significantly increased use of mobile devices and apps to shop online. Risks associated with our e-commerce business include:
•
risks associated with the failure of the computer systems that operate our website include, among others, inadequate system capacity, security breaches, computer viruses, human error, changes in programming, failure of system upgrades, or unintended disruptions occasioned as a result of such upgrades, or migration of these services to new systems;
•
consumer privacy, and information security concerns and regulation;
•
changes in applicable federal and state regulations;
•
disruptions in telephone service or power outages;
•
reliance on third parties for computer hardware and software updates, as well as delivery of merchandise to our customers;
•
increased or unplanned costs associated with order fulfillment and deliveries;
•
rapid technology changes and changes in consumer shopping habits such as the significantly increased use of mobile devices and apps to shop online;
•
credit card fraud;
•
the diversion of sales from our physical stores;
•
natural disasters or adverse weather conditions;
•
negative reviews on social media; and
•
liability for online advertising and content.
Problems in any one or more of these areas could have a material adverse effect on our financial position, results of operations, and cash flows, and could damage our reputation and brand.
14
We have a single U.S. corporate headquarters, a single distribution center serving the U.S., a single distribution center serving Canada, and a single third-party warehouse provider serving the vast majority of shipments for our international franchise partners. Damage to, or a prolonged interruption of operations at, any of these facilities could have a material adverse effect on our business.
Our U.S. corporate headquarters is located in Secaucus, New Jersey. Our U.S. distribution center is located in Fort Payne, Alabama. This facility handles all of our warehousing and store fulfillment activities in the U.S., as well as the fulfillment of a significant majority of our e-commerce orders in the U.S. Our Canadian distribution center is located in Mississauga, Ontario and handles all of our store fulfillment activities in Canada. We also use a third-party provider, also located in Mississauga, to support our Canadian e-commerce operations. These Ontario facilities handle all of our warehousing, and store and e-commerce fulfillment activities in Canada. Our international franchise partners receive the vast majority of shipments of merchandise from our third-party warehouse provider located in greater Asia. On occasion, we may utilize additional facilities to support our seasonal warehousing needs. Damage to, or prolonged interruption of operations at, any of these facilities due to a work stoppage, weather conditions such as a tornado, hurricane or flood, other natural disaster, fire, or other event could have a material adverse effect on our business, financial condition, results of operations, and cash flows.
A material disruption in, failure of, inability to upgrade, or inability to properly implement disaster recovery plans for, our information technology or other business systems could materially adversely affect our business, financial position, results of operations, and cash flows.
We rely heavily on various information and other business systems to manage our complex operations, including our online business, management of our global supply chain, merchandise assortment planning, inventory allocation and replenishment, order management, warehousing, distribution and shipping activities, point-of-sale processing in our stores, including credit and debit card processing, gift cards, our private label credit card, our customer loyalty program, and various other processes and transactions. We continue to evaluate and implement upgrades and changes to our information technology ("IT") and other business systems.
Implementing upgrades and changes to our IT and other business systems carries substantial risk, including failure to operate as designed, failure to properly integrate with, or disruption of, other systems, potential loss of data or information, cost overruns or unforeseen costs, implementation delays, disruption of operations, inability to properly train associates on new processes, inability to properly direct change management, failure to implement appropriate security, disaster recovery or business continuity measures, lower customer satisfaction resulting in lost customers or sales, inability to deliver the optimal level of merchandise to our stores in a timely manner, inventory shortages, inventory levels in excess of customer demand, inability to meet the demands of our international franchise partners or our wholesale and retail customers, and the inability to meet financial, regulatory, and other reporting requirements. There is no assurance that a successfully implemented system will deliver or continue to deliver any anticipated sales or margin improvements or other benefits to us.
Further, disruptions or malfunctions affecting our current or new information or other business systems could cause critical information upon which we rely to be lost, delayed, unreliable, corrupted, insufficient, or inaccessible.
We continue to focus on the implementation of IT disaster recovery and/or implementation of high availability readiness with regard to our e-commerce, finance, reporting, logistics, store operations, merchandising, sourcing, and other key systems in order to protect against the loss or corruption of critical data. There can be no assurance that we will be successful in implementing the appropriate disaster recovery plans or high availability readiness to protect against such loss or corruption. The failure to do so could have a material adverse effect on our financial position, results of operations, and cash flows.
Risks associated with our information technology and other business systems include:
•
risks associated with the failure or disruption of our information technology and other business systems due to inadequate system capacity, security breaches, computer viruses, human error, changes in programming, failure of third-parties to continue to support older systems, system upgrades, or migration of these services to new systems;
•
inadequacy of disaster recovery processes and the failure to align these processes with business continuity plans;
•
natural disasters or adverse weather conditions;
•
disruptions in telephone service or power outages;
•
reliance on third parties for computer hardware and software, cloud-based computing services, updates (patches), as well as delivery of merchandise to our customers;
15
•
rapid technology changes; and
•
consumer privacy and information security concerns and regulation.
Any of these potential issues, individually or in aggregation, could have a material adverse effect on our business, financial position, results of operations, and cash flows.
We also rely on third-party vendors and outsourcing partners to design, program, implement, maintain, and service our existing and planned information systems, including those operated through cloud-based technology. Any failures of these vendors to properly deliver their services in a timely fashion, any determination by those vendors to stop supporting certain systems or components, or any failure of these vendors to protect our competitively sensitive data, or the personal data of our customers or employees, or to prevent the authorized access to, or corruption of, such data, whether in their possession, through our information systems or cloud-based technology utilized by us, could have a material adverse effect on our business, financial position, results of operations, and cash flows.
We depend on our relationships with unaffiliated manufacturers, transportation companies, and independent agents. Our inability to maintain relationships with any of these entities, or the disruption to or failure of any of their businesses, could materially adversely affect our business and results of operations.
We do not own or operate any manufacturing facilities and, therefore, are dependent upon independent third parties for the manufacture of all of our products. The vast majority of our products are currently manufactured to our specifications, pursuant to purchase orders, by independent manufacturers located primarily in greater Asia and Africa. We have no exclusive or long-term contracts with our manufacturers. We compete with other companies for manufacturing facilities, many of which have greater financial resources than we have or pay a higher unit price than we do. If an existing manufacturer of merchandise must be replaced for any reason, we will have to find alternative sources of manufacturing or increase purchases from our other third-party manufacturers, and there is no assurance we will be able to do so or do so on terms that are acceptable to us.
We do not use commissioned buying agents to source any products. Although we believe that we have the in-house capability to more efficiently source all of our purchases, our inability to do so, or our inability to find adequate sources to support our current needs for merchandise and future growth, could have a materially adverse effect on our business, financial position, results of operations, and cash flows.
The failure of our third-party manufacturers, which we do not control, to adhere to local law, and industry standards and practices generally accepted as ethical in the United States, including in the areas of worker safety (e.g., fire safety and building codes), worker rights of association, freedom from harassment and coercion, and social compliance with health and welfare standards, could result in accidents and practices that cause material disruptions or delays in production or delivery and/or material harm to our reputation, either of which could have a materially adverse effect on our business, financial position, results of operations, and cash flows.
Our merchandise is shipped directly from manufacturers through third party logistics providers to our distribution and fulfillment centers, and in turn, to our stores, our e-commerce customers, and our international franchise partners and wholesale customers. Our operating results depend, in material part, on the orderly, timely, and accurate operation of our shipping, receiving, and distribution process, which depends, in material part, on our manufacturers' adherence to shipping schedules and our third-party providers’ effective management of our domestic and international shipping functions, distribution processes, facilities, and capacity.
Furthermore, it is possible that events beyond our control, such as political or social unrest, labor dispute, cybersecurity events affecting our unaffiliated manufacturers, transportation companies or independent agents, a terrorist or similar act, military action, strike, weather conditions, natural disasters, government spending cuts, or other disruption impacting the countries that we source from, could result in delays or disruptions in the production and/or delivery of merchandise to our distribution centers or our stores, international franchise partners and wholesale customers, or the fulfillment of e-commerce orders to our customers, or require us to incur substantial additional costs in air freight to ensure timely delivery. Any such event could have a material adverse effect on our business, financial position, results of operations, and cash flows.
If our agents, manufacturers, or freight operators experience negative financial consequences, our inability to use or find substitute providers to support our manufacturing and distribution needs in a timely manner could have a material adverse effect on our business, financial position, results of operations, and cash flows.
16
Because we purchase our products internationally and from unaffiliated manufacturers, our business is subject to risks associated with international business, the lack of control of independent manufacturers, and reliance on imported products.
Virtually all of our merchandise is purchased from foreign suppliers. As a result, we are subject to various risks of doing business in foreign markets and importing merchandise from abroad, including from less politically or socially stable and/or less developed countries, such as:
•
new tariffs or imposition of duties, taxes, and other charges on or costs of relying on imports;
•
foreign governmental regulations, including, but not limited to, changing requirements in course of dealing with regard to product safety, product testing, environmental matters, employment, taxation, and language preference;
•
the failure of an unaffiliated manufacturer to comply with local laws or industry standards or ethical business practices, including concerning labor, health and safety, and environmental matters;
•
financial, political, or societal instability;
•
the rising cost of doing business in particular countries, including China;
•
fluctuation of the U.S. dollar against foreign currencies;
•
pressure from non-governmental organizations;
•
customer acceptance of foreign produced merchandise;
•
developing countries with less or inadequate infrastructure;
•
new legislation relating to import quotas or other restrictions that may limit the import of our merchandise;
•
changes to, or repeal of, trade agreements, and/or trade legislation;
•
significant delays in the transportation and delivery of cargo due to port security considerations, political unrest, weather conditions, or cyber-security events;
•
disruption of imports by labor disputes and local business practices;
•
regulations under the United States Foreign Corrupt Practices Act; and
•
increased cost of transportation.
In an attempt to mitigate the above risks within any one country, we maintain relationships with many manufacturers in various countries. We cannot predict the effect that this, or the other factors noted above, in any country from which we import products could have on our business. If any of these factors rendered the conduct of business in a particular country undesirable or impractical, or if our current foreign manufacturing sources ceased doing business with us or we cease doing business with them for any reason and we were unable to find alternative sources of supply, we could experience a material adverse effect on our business, financial position, results of operations, and cash flows.
Our vendor guidelines and code of conduct promote compliance with applicable law and industry standards and ethical business practices. We monitor our vendor’s practices; however, we do not control these independent manufacturers, their labor practices, their health and safety practices, the physical condition of their factories, the integrity of their information or other business systems, or from where they buy their raw materials. Any violation of labor, health, environmental, safety (e.g., fire or building codes), or other laws, or any deviation of adherence to industry standards, by any of the independent manufacturers we use or any divergence of an independent manufacturer's labor and other practices from standards generally accepted as ethical in the United States and Canada could materially damage our reputation and could have a material adverse effect on our business, financial position, results of operations, and cash flows.
17
Federal tax legislation has had and will continue to have a material effect on our results of operations, financial condition, and cash flow. Other legislative, regulatory, and other actions which might be taken by the current Presidential administration or U.S. Congress are unpredictable and could have unforeseen consequences having a material adverse effect on our business.
On December 22, 2017, the U.S. government passed the Tax Cuts and Jobs Act (“the Tax Act”). The Tax Act significantly effects U.S. corporate taxation. The major implementation provisions of the Tax Act included a one-time transition tax on earnings and profits of foreign subsidiaries that were previously tax deferred and the revaluation of deferred assets and liabilities. While we have filed our federal tax return, the final tax liability may differ, possibly materially, due to, among other things, changes in interpretations, assumptions the Company made, and further guidance that may be issued. Other provisions of the Tax Act included a reduction in the U.S. corporate tax rate, certain provisions to broaden the U.S. tax base, including the elimination of the tax deductibility of certain executive performance-based compensation, imposition of a minimum tax on income earned by foreign subsidiaries, and an incentive to encourage the repatriation of foreign sourced income. While the Company will continue to analyze the Tax Act, along with guidance as it becomes available, to determine the full federal and state tax effects of the new law on our financial statements and operations, the impact of the Tax Act may differ from our amounts noted above, possibly materially, due to, among other things, changes in interpretations and assumptions the Company makes, guidance that may be issued, and actions the Company may take as a result of the Tax Act. These effects could have a material adverse effect on our business, results of operation, financial condition, and cash flow.
In addition, other legislative, regulatory, and other actions continue to be unpredictable and could have unforeseen consequences having a material adverse effect on our business, financial position, results of operations, and cash flows.
We may experience disruptions at ports used to export or import our products from Asia, Africa, and other regions.
We currently ship the vast majority of our products by ocean. If a disruption occurs in the operation of ports through which our products are exported or imported, we and our vendors may have to ship some or all of our products from Asia, Africa, and other regions by air freight or to or from alternative shipping destinations in the United States or in foreign countries. Shipping by air is significantly more expensive than shipping by ocean and our profitability could be materially reduced. Similarly, shipping to or from alternative destinations could lead to significantly increased costs for our products. A disruption at ports (domestic or abroad) through which our products are exported or imported could have a material adverse effect on our business, financial position, results of operations, and cash flows.
We may suffer material adverse business consequences if we are unable to anticipate, identify, and respond to merchandise trends, marketing and promotional trends, changes in technology, or customer shopping patterns.
The apparel industry is subject to rapidly changing fashion trends and shifting consumer preferences. Our success depends, in material part, on the ability of our design and merchandising teams to anticipate and respond to these changes and our global sourcing team to source from vendors that produce merchandise which has a compelling quality and value proposition for our customers. Our design, manufacturing, and sourcing process generally takes up to one year, during which time fashion trends and consumer preferences may further change. If we miscalculate either the demand for our merchandise or our customers’ tastes or purchasing habits, we may be required to sell a significant amount of unsold inventory at lower margins, or below cost, which could have a material adverse effect on our financial position, results of operation, and cash flows. Further, our failure to develop and implement uses of technology addressing changes in customer buying behaviors and/or successful customer marketing programs, including loyalty and private label credit card programs, could have a material adverse effect on our financial position, results of operation, and cash flows.
Fluctuations in the prices of raw materials, labor, energy, and services could result in increased product and/or delivery costs.
Increases in the price of raw materials, including cotton and other materials used in the production of fabric, clothing, footwear, and accessories, as well as volatility and increases in labor (including increases in minimum wages and wage rates as a result of change in laws or business practices), energy, shipping, distribution, and other costs, could result in significant increases in operating costs, as well as cost increases for our products and their distribution to our distribution centers, retail locations, international franchise partners, and wholesale and retail customers. To the extent we are unable to offset any such increased costs through value engineering or price increases, such increased costs could have a material adverse effect on our business, financial position, results of operations, and cash flows. In addition, a shortage of labor for our retail stores and/or distribution centers could have a material adverse effect on our business, financial position, results of operations, and cash flows.
18
Profitability and our reputation could be materially negatively impacted if we do not adequately forecast the demand for our products and, as a result, create significant levels of excess inventory or insufficient levels of inventory.
If we do not adequately forecast demand for our products and inventory purchases, we could experience materially increased costs and lower selling prices due to a need to dispose of excess inventory. In addition, if we forecast demand for our products that is lower than actual demand, we may experience insufficient levels of inventory, increased costs to fulfill demand from alternative locations of inventory, and reputational damage, which could have a material adverse effect on our business, financial position, results of operations, and cash flows.
Our success depends upon the service and capabilities of our management team. Changes in management or in our organizational structure, particularly in the most senior positions, or inadequate or ineffective management, could have a material adverse effect on our business.
Our business and success is materially dependent on retaining members of our senior leadership team, including our chief executive officer, and other key individuals within the organization, to formulate and execute the Company’s strategic and business plans. Leadership changes can be inherently difficult to manage and may cause material disruption to our business or management team. Senior level management establishes the “tone at the top” by which an environment of ethical values, operating style, and management philosophy is fostered. Changes in senior management could lead to an environment that lacks inspiration and/or a lack of commitment by our employees, which could have a material adverse effect on our business.
The highly concentrated nature of our stock holdings could facilitate the approval by stockholders of proposals which are contrary to positions supported by our Board of Directors or management.
The top holders of our common stock are predominately large multi-national financial institutions. The top ten institutional holders own over 53% of our outstanding shares of common stock. These holdings would permit these institutions to approve proposals submitted to the vote of stockholders, which are contrary to positions supported by our Board of Directors or management.
Product liability costs, related claims, and the cost of compliance with consumer product safety laws such as the CPSIA in the U.S. or the CCPSA in Canada or our inability to comply with such laws could have a material adverse effect on our business and reputation.
We are subject to regulation by the CPSC in the U.S., Health Canada in Canada, and similar state, provincial, and international regulatory authorities. Although we test the products sold in our stores, on our website, and to our international franchise partners and our wholesale customers, concerns about product safety, including, but not limited to, concerns about those manufactured in developing countries, may lead us to recall selected products, either voluntarily, or at the direction of a governmental authority, or may lead to a lack of consumer acceptance or loss of consumer trust. Product safety concerns, recalls, the failure to properly manage recalls, defects or errors could result in governmental fines, rejection of our products by customers, damage to our reputation, lost sales, product liability litigation, and increased costs, any or all of which could harm our business and have a material adverse effect on our financial position, results of operations, and cash flows.
The cost of compliance with current requirements and any future requirements of the CPSC, Health Canada, or other federal, state, provincial, or international regulatory authorities, consumer product safety laws, including initiatives labeled as “green chemistry” and regulatory testing, certification, packaging, labeling, and advertising and reporting requirements, or changes to existing laws could have a material adverse effect on our financial position, results of operations, and cash flows. In addition, any failure to comply with such requirements could result in significant penalties, litigation, or require us to recall products, any or all of which could have a material adverse effect on our business, reputation, and financial position, results of operations, and cash flows.
We face significant competition in the retail industry, which could negatively impact our business.
The children's apparel retail market is highly competitive and we face heightened price and promotional competition. We compete in substantially all of our markets with Target Corporation and GapKids, babyGap and Old Navy (each of which is a division of The Gap, Inc.), The Gymboree Corporation (in liquidation under U.S. bankruptcy law in a proceeding filed on January 17, 2019; see Item 7-Management Discussion and Analysis "
Gymboree Bankruptcy and Acquisition"
), Justice (a division of The Ascena Retail Group, Inc.), Carter's, Inc., J.C. Penney Company, Inc., Kohl's Corporation, and other department stores, as well as other discount stores such as Walmart Stores, Inc. We also compete with a wide variety of specialty stores, other national and regional retail chains, catalog companies, and e-commerce retailers. One or more of our competitors are present in virtually all of the areas in which we have stores. E-commerce only retailers generally do not incur the geographical limitations suffered by traditional brick and mortar stores, giving e-commerce only retailers a competitive advantage to and imposing significant pricing pressure on brick and mortar stores. In addition, while we view our business as a single omni-
19
channel business, our e-commerce store may divert sales from our brick and mortar stores. Many of our competitors are larger than us and have access to significantly greater financial, marketing, and other resources than we have. Increased competition, increased promotional activity, continuing economic pressure on value seeking consumers, and liquidation activities by bankrupt and other struggling retailers, including selling apparel, footwear, and accessory merchandise at substantial discounts, could also materially adversely impact our ability to compete successfully, and could have a material adverse effect on our business, reputation, and financial position, results of operations, and cash flows. We may not be able to continue to compete successfully against existing or future competition.
We may be unable to protect our trademarks and other intellectual property rights.
We believe that our trademarks and service marks are important to our success and our competitive position due to their name recognition with our customers. We devote substantial resources to the establishment and protection of our trademarks and service marks on a worldwide basis, including in the countries from which we source our merchandise and in which we have business operations or plan to have business operations, including through foreign franchise partners. We are not aware of any material claims of infringement or material challenges to our right to use any of our trademarks in the United States or Canada. Nevertheless, the actions we have taken, including to establish and protect our trademarks and service marks, may not be adequate to prevent others from imitating our products or to prevent others from seeking to block sales of our products. Also, others may assert proprietary rights in our intellectual property, or may assert that we are engaging in activities that infringe on their own intellectual property, and we may not be able to successfully resolve these types of claims, any of which could have a negative impact on our business, financial position, results of operations, and cash flows. In addition, the laws of certain foreign countries may not protect our proprietary rights to the same extent as do the laws of the United States, and we may not be successful in obtaining our trademarks in foreign countries where we plan to conduct business.
Because certain of our subsidiaries operate outside of the United States, some of our revenues, product costs, and other expenses are subject to foreign economic and currency risks.
We have store operations in Canada and sourcing operations in various locations in greater Asia, primarily Hong Kong, as well as greater Africa, and we have plans to continue to expand our store operations internationally primarily through franchises.
The currency market has seen significant volatility in the value of the U.S. dollar against other foreign currencies. While our business is primarily conducted in U.S. dollars, we purchase virtually all of our products overseas, and we generate significant revenues in Canada in Canadian dollars. Cost increases caused by currency exchange rate fluctuations could make our products less competitive or have a material adverse effect on our profitability. Currency exchange rate fluctuations could also disrupt the business of the third party manufacturers that produce our products, or franchisees that purchase our products, by making their purchases of raw materials or products more expensive and more difficult to finance.
Changes in currency exchange rates affect the U.S. dollar value of the Canadian dollar denominated prices at which our Canadian business sells product. As a result, fluctuations in exchange rates impact the amount of our reported sales and expenses, which could have a material adverse effect on our financial position, results of operations, and cash flows. Additionally, we have foreign currency denominated receivables and payables that are not hedged against foreign currency fluctuations. When settled, these receivables and payables could result in significant transaction gains or losses.
We depend on generating sufficient cash flows, together with our existing cash balances and availability under our credit facility, to fund our ongoing operations, capital expenditures, debt service requirements, and share repurchase program as well as payment of dividends.
Our ability to fund our ongoing operations, planned capital expenditures, share repurchase programs, payment of dividends, and debt service requirements will depend on our ability to generate cash flows. Our cash flows are dependent on many factors, including:
•
seasonal fluctuations in our net sales and net income, which typically are lowest in the second fiscal quarter;
•
the timing of inventory purchases for upcoming seasons, particularly in the second fiscal quarter as our sales are lowest, and we are purchasing merchandise for the back-to-school season;
•
vendor, other supplier and agent terms and related conditions, which may be less favorable to us as a smaller company in comparison to larger companies; and
•
general business conditions and economic uncertainty or slowdown, including consumer sentiment.
20
Most of these factors are beyond our control. It is difficult to predict the impact that general economic conditions will continue to have on consumer spending and our financial results. However, we believe that they could continue to result in reduced spending by our target customer, which would reduce our revenues and our cash flows from operating activities from those that otherwise would have been generated. In addition, steps that we may take to limit cash outlays, such as delaying the purchase of inventory, may not be successful or could delay the arrival of merchandise for future selling seasons, which could reduce our net sales or profitability. If we are unable to generate sufficient cash flows, we may not be able to fund our ongoing operations, planned capital expenditures, share repurchase programs, payment of dividends, or debt service requirements, and we may be required to seek additional sources of liquidity.
A wide variety of factors can cause a decline in consumer confidence and spending which could have a material adverse effect on the apparel industry and our operating results.
The apparel industry is cyclical in nature and is particularly affected by adverse trends in the general economy. Purchases of apparel and related merchandise are generally discretionary and, therefore, tend to decline during recessionary and weak economic periods and also may decline at other times. This is particularly true with our target customer who is a value conscious, lower to middle income mother buying for infants and children based on need rather than based on fashion, trend, or impulse. High unemployment levels, increases in tax rates, declines in real estate values, availability of credit volatility in the global financial markets, and the overall level of consumer confidence have and could in the future negatively impacted the level of consumer spending for discretionary items. This could adversely affect our business as it is dependent on consumer demand for our products. In North America, we have experienced a decrease in customer traffic, including at shopping malls, and a highly promotional environment. If the current macroeconomic environment stalls or deteriorates, there will likely be a negative effect on our revenues, operating margins, and earnings which could materially adversely affect our financial position, results of operations, and cash flows.
In addition to the economic environment, there are a number of other factors that could contribute to reduced customer traffic and/or reduced levels of consumer confidence and spending, such as actual or potential terrorist acts, including domestic terrorism, natural disasters, severe weather, political disruption, or geopolitical conflicts. These occurrences create significant instability and uncertainty in the United States and elsewhere in the world, causing consumers to defer purchases or to not shop in retail stores in shopping malls, or preventing our suppliers and service providers from providing required products, services, or materials to us. These factors could materially adversely affect our financial position, results of operations, and cash flows.
Our profitability may decline as a result of increasing pressure on margins.
The apparel industry is subject to significant pricing pressure caused by many factors, including intense competition, the highly promotional retail environment, the financial health of competitors, and changes in consumer demand. If these factors cause us to reduce our sales prices and we fail to sufficiently reduce our product costs or operating expenses, our profitability could decline. This could have a material adverse effect on our financial position, results of operations, and cash flows.
Our failure to comply with federal, state or local law, and litigation involving such laws, or changes in such laws, could materially increase our expenses and expose us to legal risks and liability.
If we fail to comply with applicable laws and regulations, particularly wage and hour, accessibility, privacy and information security, product safety, and pricing, advertising and marketing laws, we could be subject to legal and reputational risk, government enforcement action, and class action civil litigation, which could have a material adverse effect on our financial position, results of operations, and cash flows. Changes in regulation and how regulations are enforced, such as taxes, privacy and information security, product safety, trade, consumer credit, pricing, advertising, and marketing, healthcare or environmental protection, among others, could cause our expenses to increase, margins to decrease or tax deductible expenses to decrease. Changes in tax laws, the interpretation of existing laws, or our failure to sustain our reporting positions on examination could materially adversely affect our effective tax rate and/or subject us to significant penalties and interest.
Legislative or regulatory changes that impact our relationship with our workforce, such as minimum wage requirements or overtime regulation and other wage and hour regulations, could increase our expenses and adversely affect our operations. None of our employees are currently represented by a collective bargaining agreement. However, from time to time there have been efforts to organize our employees at various locations. There is no assurance that our employees will not unionize in the future.
Legal and regulatory actions are inherent in our business and could materially adversely affect our results of operations or financial position or harm our businesses or reputation.
We are, and in the future may be, subject to legal and regulatory actions in the ordinary course of our business. Some of these proceedings have been, and in the future may be, brought on behalf of various alleged classes of complainants. The
21
plaintiffs may seek large and/or indeterminate amounts, including treble, punitive, or exemplary damages in these proceedings. Substantial legal liability could have a material adverse effect on our business, financial position, results of operations, and cash flows or cause us material reputational harm, which in turn could materially harm our business prospects.
Our litigation and regulatory enforcement and other matters are subject to many uncertainties, and given their complexity and scope, their outcome cannot be predicted. Our reserves for litigation and regulatory and enforcement matters may prove to be inadequate. Litigation and regulatory and enforcement matters could materially adversely affect our financial position, results of operations, and cash flows. In light of the unpredictability of our litigation and regulatory and enforcement matters, it is also possible that in certain cases an ultimately unfavorable resolution of one or more pending litigation or regulatory and enforcement matters could have a material adverse effect on our financial position, results of operations, and cash flows.
If our landlords should suffer financial difficulty or if we are unable to successfully negotiate acceptable lease terms, it could have a material adverse effect on our business, financial position, results of operations, and cash flows.
If any of our landlords or substantial tenants, such as anchor department stores, should suffer financial difficulty, it could render our landlords unable to fulfill their duties under our lease agreements and/or could render certain malls to experience reduced customer traffic. Such duties include providing a sufficient number of mall co-tenants, common area maintenance, utilities, and payment of real estate taxes. While we have certain remedies under our lease agreements, the loss of business that could result if a shopping center should close or if customer traffic were to significantly decline as a result of lost tenants or improper care of the facilities could have a material adverse effect on our financial position, results of operations, and cash flows.
The leases for a substantial number of our retail stores come up for renewal each year. If we are unable to continue to negotiate acceptable lease and renewal terms, it could have a material adverse effect on our financial position, results of operations, and cash flows.
In addition to the changes effected by the Tax Act, other tax matters could impact our results of operations and financial condition.
We are subject to income taxes in the United States and foreign jurisdictions, including Canada and Hong Kong. Our provision for income taxes and cash tax liability in the future could be adversely affected by numerous factors, including, but not limited to, income before taxes being lower than anticipated in countries with lower statutory tax rates and higher than anticipated in countries with higher statutory tax rates, changes in the valuation of deferred tax assets and liabilities, and changes in tax laws, such as the Tax Act, regulations, accounting principles or interpretations thereof, which could adversely impact our results of operations, financial condition, and cash flows in future periods. In addition, we are subject to the examination of our income tax returns by the Internal Revenue Service, Canada Revenue Agency, and other tax authorities. We regularly assess the likelihood of adverse outcomes resulting from these examinations to determine the adequacy of our provision for income taxes. There can be no assurance that the outcomes from these continuous examinations will not have an adverse effect on our financial position, results of operations, and cash flows.
Legislative actions and new accounting pronouncements could result in us having to increase our administrative expenses to remain compliant and could have other material adverse effects.
In order to comply with the Sarbanes-Oxley Act of 2002, the Dodd-Frank Wall Street Reform, and Consumer Protection Act of 2010, future accounting guidance or disclosure requirements by the SEC, future guidance that may come from the Public Company Accounting Oversight Board ("PCAOB"), or future changes in listing standards by the Nasdaq Global Select Market, we may be required to enhance our internal controls, hire additional personnel, and utilize additional outside legal, accounting and advisory services, all of which could cause our general and administrative expenses to increase materially.
Changes to existing tax or other laws, authoritative guidance and regulations may materially adversely impact our financial statements. The FASB is continuing its convergence efforts with its international counterpart, the International Accounting Standards Board, to converge U.S. and International standards into one uniform set of accounting rules, including the adoption of FASB ASC 606--
Revenue from Contracts with Customers
and FASB ASC 842--
Leases
. The effect of changes in tax and other laws or changing accounting rules on our financial statements could be significant. Changes to our financial position, results of operations, or cash flows could impact our debt covenant ratios or a lender's perception of our financial statements causing an adverse impact on our ability to obtain credit, or could adversely impact investor analyses and perceptions of our business causing the market value of our stock to decrease. In addition, any changes in the current accounting rules, including legislative and other proposals, could increase the expenses we report under U.S. GAAP and have a material adverse effect on our financial position, results of operations, and cash flows.
22
Any disruption in, or changes to, our consumer credit arrangements, including our private label credit card agreement, may adversely affect the ability of our customers to obtain consumer credit.
Credit card operations are subject to numerous federal and state laws that impose disclosure and other requirements upon the origination, servicing, and enforcement of credit accounts and limitations on the maximum amount of finance charges that may be charged by a credit provider. Additionally, during periods of increasing consumer credit delinquencies, financial institutions may reexamine their lending practices and procedures. There can be no assurance that the delinquencies being experienced by providers of consumer credit generally would not cause providers of third party credit offered by us to decrease the availability of, or increase the cost of such credit.
Any of the above risks, individually or in aggregation, could have a material adverse effect on the way we conduct business and could materially negatively impact our financial position, results of operations, and cash flows.
Our share price may be volatile.
Our common stock is quoted on the Nasdaq Global Select Market. Stock markets in general have experienced, and are likely to continue to experience, price and volume fluctuations, which could have a material adverse effect on the market price of our common stock without regard to our operating performance. In addition, we believe that factors such as quarterly fluctuations in our financial results, our Comparable Retail Sales results, other risk factors identified here, announcements or actions by other competitors, the overall economy, legislative, regulatory and other actions resulting from the current Presidential administration or Congress, and the geopolitical environment could individually or in aggregation cause the price of our common stock to fluctuate substantially.
Declarations of quarterly cash dividends, and the establishment of future record and payment dates, are at the discretion of our Board of Directors based on a number of factors, including future financial performance, general business and market conditions, and other investment priorities. Any reduction or discontinuance by us of the payment of quarterly cash dividends could cause the market price of our common stock to decline.
Acts of terrorism, effects of war, natural disasters, other catastrophes or political unrest could have a material adverse effect on our business.
The threat or actual acts of terrorism, including U.S. domestic terrorism, continue to be a risk to the U.S. and global economies. Terrorism and potential military responses, political unrest, natural disasters, pandemics or other health issues have disrupted and could disrupt commerce, and impact our or our franchisees' ability to operate our stores in affected areas, import our products from foreign countries or provide critical functions necessary to the operation of our business. A disruption of commerce, or an inability to recover critical functions from such a disruption, could interfere with the production, shipment, or receipt of our merchandise in a timely manner or increase our costs to do so, which could have a material adverse impact on our financial position, results of operations, and cash flows. In addition, any of the above disruptions could undermine consumer confidence, which could negatively impact consumer spending patterns or customer traffic, and thus have a material adverse impact on our financial position, results of operations, and cash flows.
ITEM 1B.-UNRESOLVED STAFF COMMENTS
None.
ITEM 2.-PROPERTIES
We lease all of our existing store locations in the United States, Puerto Rico, and Canada, with lease terms expiring through 2029. The average unexpired lease term for our stores is approximately 2.4 years in the United States and Puerto Rico and in Canada. Generally, we enter into initial lease terms ranging between 3-10 years at inception and provide for contingent rent based on sales in excess of specific minimums. We anticipate that we will be able to extend those leases which we wish to extend on satisfactory terms as they expire or relocate to more desirable locations.
23
The following table sets forth information with respect to certain of our non-store locations as of February 2, 2019:
|
Location
|
Use
|
Approximate Sq. Footage
|
Current Lease Term Expiration
|
||||
|
Fort Payne, AL (1)
|
Warehouse Distribution Center
|
700,000
|
|
Owned
|
|||
|
Ontario, Canada (2)
|
Warehouse Distribution Center
|
95,000
|
|
4/30/2024
|
|||
|
500 Plaza Drive, Secaucus, NJ (3)
|
Corporate Offices
|
200,000
|
|
5/31/2029
|
|||
|
Hong Kong, China (3)
|
Product Support
|
28,000
|
|
4/30/2021
|
|||
|
(1)
|
Supports The Children's Place U.S. stores, wholesale, and e-commerce business.
|
|
(2)
|
Supports The Children's Place Canadian stores.
|
|
(3)
|
Supports The Children's Place U.S. stores, our e-commerce business, The Children's Place Canadian stores, our international franchisees, and wholesale business.
|
On occasion, we may utilize additional facilities to support seasonal warehousing needs.
ITEM 3.-LEGAL PROCEEDINGS
The Company is a defendant in
Rael v. The Children’s Place, Inc.
, a purported class action, pending in the U.S. District Court, Southern District of California. In the initial complaint filed in February 2016, the plaintiff alleged that the Company falsely advertised discount prices in violation of California’s Unfair Competition Law, False Advertising Law, and Consumer Legal Remedies Act. The plaintiff filed an amended complaint in April 2016, adding allegations of violations of other state consumer protection laws. In August 2016, the plaintiff filed a second amended complaint, adding an additional plaintiff and removing the other state law claims. The plaintiffs’ second amended complaint seeks to represent a class of California purchasers and seeks, among other items, injunctive relief, damages, and attorneys’ fees and costs.
The Company engaged in mediation proceedings with the plaintiffs in December 2016 and April 2017. The parties reached an agreement in principle in April 2017, and signed a definitive settlement agreement in November 2017, to settle the matter on a class basis with all individuals in the U.S. who made a qualifying purchase at The Children’s Place from February 11, 2012 through the date of preliminary approval by the court of the settlement. The settlement is subject to court approval and provides for merchandise vouchers for class members who submit valid claims, as well as payment of legal fees and expenses and claims administration expenses. The court has stayed the matter, pending an appellate court ruling in another lawsuit to which the Company is not a party. The settlement, if ultimately approved by the court, will result in the dismissal of all claims through the date of the court’s preliminary approval of the settlement. However, if the settlement is rejected by the court, the parties will likely return to litigation, and in such event, no assurance can be given as to the ultimate outcome of this matter. In connection with the proposed settlement, the Company recorded a reserve for $5.0 million in its consolidated financial statements in the first quarter of Fiscal 2017.
The Company is also involved in various legal proceedings arising in the normal course of business. In the opinion of management, any ultimate liability arising out of these proceedings will not have a material adverse effect on the Company's financial position, results of operations, or cash flows.
ITEM 4.-MINE SAFETY DISCLOSURES
Not applicable.
24
PART II
ITEM 5.-MARKET FOR REGISTRANT'S COMMON EQUITY AND RELATED STOCKHOLDER MATTERS AND ISSUER PURCHASES OF EQUITY SECURITIES
Our common stock is listed on the Nasdaq Global Select Market, or Nasdaq, under the symbol “PLCE.”
On March 19, 2019, the number of holders of record of our common stock was 39 and the number of beneficial holders of our common stock was approximately 25,500.
The Company's Board of Directors has authorized the following share repurchase programs which were active during Fiscal 2018 and Fiscal 2017: (1) $250 million in December 2015 (the "2015 $250 Million Share Repurchase Program"); (2) $250 million in March 2017 (the "2017 Share Repurchase Program"); and (3) $250 million in March 2018 (the "2018 Share Repurchase Program"). The 2015 $250 Million and the 2017 Share Repurchase Programs have been completed. At
February 2, 2019
, there was approximately $239 million remaining on the 2018 Share Repurchase Program. Under these programs, the Company may repurchase shares in the open market at current market prices at the time of purchase or in privately negotiated transactions. The timing and actual number of shares repurchased under a program will depend on a variety of factors including price, corporate and regulatory requirements, and other market and business conditions. The Company may suspend or discontinue a program at any time, and may thereafter reinstitute purchases, all without prior announcement.
As part of its share repurchase programs, the Company entered into an accelerated share repurchase program with Goldman Sachs & Co. LLC in March 2018 under which it repurchased and retired approximately 1.0 million shares for $125.0 million. The accelerated share repurchase program was completed during the second quarter of Fiscal 2018.
During Fiscal 2018 and Fiscal 2017, we paid cash dividends of $33.0 million and $28.1 million, respectively. The Board of Directors authorized a quarterly cash dividend of $0.56 per share to be paid on April 26, 2019 to shareholders of record on the close of business on April 15, 2019. Future declarations of quarterly dividends, the establishment of future record dates, and the resulting payment dates are subject to approval by the Company’s Board of Directors based on a number of factors, including business and market conditions, the Company’s future financial performance, and other investment priorities.
The following table provides a summary of our cash dividends paid by quarter during Fiscal 2018:
|
Fiscal Year Ended February 2, 2019
|
||||||||||||||||||||
|
First
Quarter
|
Second
Quarter
|
Third
Quarter
|
Fourth
Quarter
|
Fiscal 2018
|
||||||||||||||||
|
Cash dividends declared and paid per common share
|
$
|
0.50
|
|
$
|
0.50
|
|
$
|
0.50
|
|
$
|
0.50
|
|
$
|
2.00
|
|
|||||
|
Cash dividends paid (in thousands)
|
$
|
8,409
|
|
$
|
8,309
|
|
$
|
8,221
|
|
$
|
8,103
|
|
$
|
33,042
|
|
|||||
Pursuant to the Company's practice, including due to restrictions imposed by our insider trading policy during black-out periods, we withhold and retire shares of vesting stock awards and make payments to taxing authorities as required by law to satisfy the withholding tax requirements of award recipients who are employees. Also, we acquire shares of our common stock in conjunction with liabilities owed under a deferred compensation plan, which are held in treasury. The following table summarizes our share repurchases:
|
Fiscal Year Ended
|
||||||||||
|
February 2, 2019
|
February 3, 2018
|
|||||||||
|
Shares
|
Value
|
Shares
|
Value
|
|||||||
|
Share repurchases related to:
|
(In thousands)
|
|||||||||
|
2015 $250 Million Share Repurchase Program
program
(1)
|
—
|
|
—
|
|
974
|
|
112,917
|
|
||
|
2017 Share Repurchase Programs
(2)
|
1,995
|
|
244,338
|
|
37
|
|
5,662
|
|
||
|
2018 Share Repurchase Programs
(3)
|
101
|
|
9,205
|
|
—
|
|
—
|
|
||
|
Shares acquired and held in treasury
|
2
|
|
248
|
|
4
|
|
248
|
|
||
|
(1)
|
Inclusive of 0.3 million shares for approximately $33.1 million withheld to cover taxes in conjunction with the vesting of stock awards
during Fiscal 2017.
|
25
|
(2)
|
Inclusive of 0.3 million shares for approximately $43.3 million withheld to cover taxes in conjunction with the vesting of stock awards
during Fiscal 2018.
|
|
(3)
|
Subsequent to February 2, 2019 and through March 19, 2019, the Company repurchased approximately 0.1 million shares for approximately $9.9 million.
|
The following table provides a month-to-month summary of our share repurchase activity during the 13 weeks ended
February 2, 2019
:
|
Period
|
Total Number of Shares Purchased
|
Average Price Paid per Share
|
Total Number of Shares Purchased as Part of Publicly Announced Plans or Programs
|
Approximate Dollar Value (in thousands) of Shares that May Yet Be Purchased Under the Plans or Programs
|
||||||||
|
11/4/18-12/1/18
(1)
|
57,067
|
|
$133.00
|
|
56,638
|
|
$273,750
|
|
||||
|
12/2/18-1/5/19
(2)
|
189,968
|
94.59
|
|
189,968
|
255,781
|
|||||||
|
1/6/19-2/2/19
|
183,000
|
91.55
|
|
183,000
|
239,027
|
|||||||
|
Total
|
430,035
|
|
$98.39
|
|
429,606
|
|
$239,027
|
|
||||
|
(1)
|
Includes 429 shares acquired as treasury stock as directed by participants in the Company's deferred compensation plan and 338 shares withheld to cover taxes in conjunction with the vesting of a stock award.
|
(2) Includes 268 shares withheld to cover taxes in conjunction with the vesting of a stock award.
Equity Plan Compensation Information
On May 20, 2011, our shareholders approved the 2011 Equity Incentive Plan (the "2011 Equity Plan"). The following table provides information as of
February 2, 2019
, about the shares of our Common Stock that may be issued under our equity compensation plans.
|
COLUMN (A)
|
COLUMN (B)
|
COLUMN (C)
|
||||
|
Plan Category
|
Securities to be issued upon exercise of outstanding options
|
Weighted average exercise price of outstanding options
|
Securities remaining available for future issuances under equity compensation plans (excluding securities reflected in Column (A))
|
|||
|
Equity Compensation Plans
Approved by Security Holders |
N/A
|
N/A
|
756,502
|
|||
|
Equity Compensation Plans Not
Approved by Security Holders |
N/A
|
N/A
|
N/A
|
|||
|
Total
|
N/A
|
N/A
|
756,502
|
|||
26
Performance Graph
The following graph compares the cumulative stockholder return on our common stock with the return on the CRSP Total Return Index for the NASDAQ Stock Market (US Companies) and CRSP Total Return Index for the NASDAQ Retail Trade. The graph assumes that $100 was invested on February 1, 2014 in each of our common stock, the CRSP Total Return Index for the NASDAQ Stock Market (US Companies), and the CRSP Total Return Index for the NASDAQ Retail Trade.
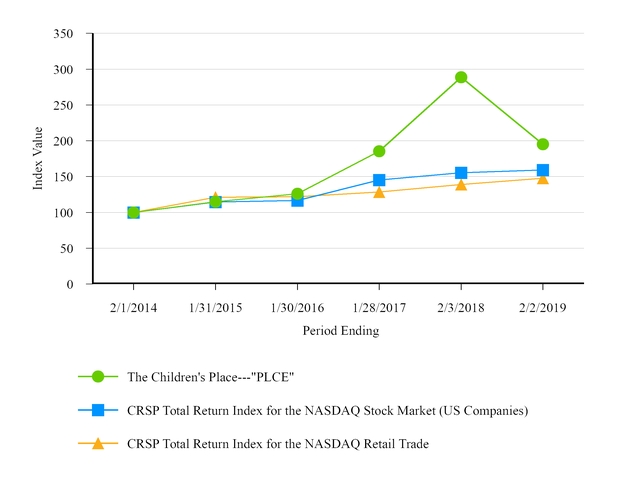
The table below sets forth the closing price of our Common Stock and the closing indices for the CRSP Total Return Index for the NASDAQ Stock Market (US Companies) and CRSP Total Return Index for the NASDAQ Retail Trade on the last day of each of our last five fiscal years.
|
2013
|
2014
|
2015
|
2016
|
2017
|
2018
|
|||||||||||||
|
The Children's Place---"PLCE"
|
52.67
|
|
59.95
|
|
65.10
|
|
94.80
|
|
145.60
|
|
92.13
|
|
||||||
|
CRSP Total Return Index for the NASDAQ Stock Market (US Companies)
|
1,518.35
|
|
1,736.19
|
|
1,763.45
|
|
2,194.73
|
|
2,347.92
|
|
2,409.18
|
|
||||||
|
CRSP Total Return Index for the NASDAQ Retail Trade
|
912.91
|
|
1,111.52
|
|
1,126.74
|
|
1,188.88
|
|
1,282.97
|
|
1,345.42
|
|
||||||
The table below assumes that $100 was invested on February 1, 2014 in each of our common stock, CRSP Total Return Index for the NASDAQ Stock Market (US Companies), and CRSP Total Return Index for the NASDAQ Retail Trade.
27
|
2013
|
2014
|
2015
|
2016
|
2017
|
2018
|
|||||||||||
|
The Children's Place---"PLCE"
|
100.00
|
|
114.97
|
|
126.10
|
|
185.41
|
|
288.71
|
195.06
|
||||||
|
CRSP Total Return Index for the NASDAQ Stock Market (US Companies)
|
100.00
|
|
114.54
|
|
116.59
|
|
145.13
|
|
155.29
|
159.31
|
||||||
|
CRSP Total Return Index for the NASDAQ Retail Trade
|
100.00
|
|
121.12
|
|
121.90
|
|
128.30
|
|
139.09
|
147.55
|
||||||
ITEM 6.-SELECTED FINANCIAL DATA
We are the largest pure-play children's specialty apparel retailer in North America. As of
February 2, 2019
, we operated 972 The Children's Place stores across North America and an online store at
www.childrensplace.com.
The following table sets forth certain historical financial and operating data for the Company. The selected consolidated financial information presented below is derived from our audited consolidated financial statements for each of the five years in the period ended
February 2, 2019
. The information contained in this table should be read in conjunction with Management's Discussion and Analysis of Financial Condition and Results of Operations, and the audited consolidated financial statements and notes thereto included elsewhere herein.
28
|
Fiscal Year Ended
(1)
|
||||||||||||||||||||
|
Statement of Operations Data (in thousands,
except earnings per share and dividends):
|
February 2, 2019
|
February 3, 2018
|
January 28, 2017
|
January 30, 2016
|
January 31, 2015
|
|||||||||||||||
|
Net sales
|
|
$1,938,084
|
|
|
$1,870,275
|
|
|
$1,785,316
|
|
|
$1,725,777
|
|
|
$1,761,324
|
|
|||||
|
Cost of sales
|
1,254,488
|
|
1,158,920
|
|
1,113,723
|
|
1,100,645
|
|
1,139,024
|
|
||||||||||
|
Gross profit
|
683,596
|
|
711,355
|
|
671,593
|
|
625,132
|
|
622,300
|
|
||||||||||
|
Selling, general, and administrative
expenses
|
498,343
|
|
476,486
|
|
454,143
|
|
469,898
|
|
470,686
|
|
||||||||||
|
Depreciation and amortization
|
68,884
|
|
68,159
|
|
65,734
|
|
62,685
|
|
60,494
|
|
||||||||||
|
Asset impairment charges
(2)
|
6,096
|
|
5,190
|
|
4,026
|
|
2,371
|
|
11,145
|
|
||||||||||
|
Other costs (income)
|
(1,055
|
)
|
10
|
|
282
|
|
98
|
|
(68
|
)
|
||||||||||
|
Operating income
|
111,328
|
|
161,510
|
|
147,408
|
|
90,080
|
|
80,043
|
|
||||||||||
|
Interest income (expense), net
|
(2,804
|
)
|
(307
|
)
|
(395
|
)
|
(698
|
)
|
(168
|
)
|
||||||||||
|
Income before provision for income taxes
|
108,524
|
|
161,203
|
|
147,013
|
|
89,382
|
|
79,875
|
|
||||||||||
|
Provision for income taxes
|
7,564
|
|
76,505
|
|
44,677
|
|
31,498
|
|
22,987
|
|
||||||||||
|
Net income
|
100,960
|
|
84,698
|
|
102,336
|
|
57,884
|
|
56,888
|
|
||||||||||
|
Diluted income per common share
|
$
|
6.01
|
|
$
|
4.67
|
|
$
|
5.40
|
|
$
|
2.80
|
|
$
|
2.59
|
|
|||||
|
Cash dividends declared and paid per
common share
(3)
|
$
|
2.00
|
|
$
|
1.60
|
|
$
|
0.80
|
|
$
|
0.60
|
|
$
|
0.53
|
|
|||||
|
Selected Data:
|
||||||||||||||||||||
|
Number of Company operated stores open at end of period
|
972
|
|
1,014
|
|
1,039
|
|
1,069
|
|
1,097
|
|
||||||||||
|
Comparable retail sales increase
|
4.6
|
%
|
5.8
|
%
|
4.9
|
%
|
0.4
|
%
|
0.4
|
%
|
||||||||||
|
Balance Sheet Data (in thousands):
|
||||||||||||||||||||
|
Working capital
(4)
|
$
|
103,996
|
|
$
|
295,980
|
|
$
|
281,966
|
|
$
|
306,286
|
|
$
|
334,812
|
|
|||||
|
Total assets
|
727,046
|
|
940,228
|
|
910,499
|
|
897,948
|
|
958,618
|
|
||||||||||
|
Revolving loan
|
48,861
|
|
21,460
|
|
15,380
|
|
—
|
|
—
|
|
||||||||||
|
Long-term debt
|
—
|
|
—
|
|
—
|
|
—
|
|
—
|
|
||||||||||
|
Stockholders’ equity
|
314,437
|
|
473,699
|
|
496,287
|
|
527,793
|
|
589,118
|
|
||||||||||
____________________________________________
|
(1)
|
The period ended February 3, 2018 was a 53-week year. The remaining periods presented, including the period ended
February 2, 2019
, were 52-week years.
|
|
(2)
|
Asset impairment charges generally relate to the write-down of fixed assets to their fair value related to underperforming stores. In Fiscal 2018, Fiscal 2017, and fiscal 2016, asset impairment charges also included the write-off of obsolete systems of $4.4 million, $2.4 million, and $1.3 million, respectively.
|
|
(3)
|
The Company instituted its quarterly dividend program and paid its first dividend during the first quarter of fiscal 2014.
|
|
(4)
|
Working capital is calculated by subtracting our current liabilities from our current assets.
|
29
ITEM 7.-MANAGEMENT'S DISCUSSION AND ANALYSIS OF FINANCIAL CONDITION
AND RESULTS OF OPERATIONS
The following discussion should be read in conjunction with our audited financial statements and notes thereto included in Part IV, Item 15.-Exhibits and Financial Statement Schedules. This Annual Report on Form 10-K contains forward-looking statements made pursuant to the safe harbor provisions of the Private Securities Litigation Reform Act of 1995, including but not limited to statements relating to the Company’s strategic initiatives. Forward-looking statements typically are identified by use of terms such as “may,” “will,” “should,” “plan,” “project,” “expect,” “anticipate,” “estimate” and similar words, although some forward-looking statements are expressed differently. These forward-looking statements are based upon the Company's current expectations and assumptions and are subject to various risks and uncertainties that could cause actual results and performance to differ materially. Some of these risks and uncertainties are described in the Company's filings with the Securities and Exchange Commission, including in Part I, Item 1A-Risk Factors section of this Annual Report on Form 10-K for the fiscal year ended February 2, 2019. Included among the risks and uncertainties that could cause actual results and performance to differ materially are the risk that the Company will be unsuccessful in gauging fashion trends and changing consumer preferences, the risks resulting from the highly competitive nature of the Company’s business and its dependence on consumer spending patterns, which may be affected by changes in economic conditions, the risk that the Company’s strategic initiatives to increase sales and margin are delayed or do not result in anticipated improvements, the risk of delays, interruptions and disruptions in the Company’s global supply chain, including resulting from foreign sources of supply in less developed countries or more politically unstable countries, the risk that the cost of raw materials or energy prices will increase beyond current expectations or that the Company is unable to offset cost increases through value engineering or price increases, various types of litigation, including class action litigations brought under consumer protection, employment, and privacy and information security laws and regulations, the imposition of regulations affecting the importation of foreign-produced merchandise, including duties and tariffs, and the uncertainty of weather patterns. Readers are cautioned not to place undue reliance on these forward-looking statements, which speak only as of the date they were made. The Company undertakes no obligation to release publicly any revisions to these forward-looking statements that may be made to reflect events or circumstances after the date hereof or to reflect the occurrence of unanticipated events.
As used in this Annual Report on Form 10-K, references to the “Company”, “The Children's Place”, “we”, “us”, “our” and similar terms refer to The Children's Place, Inc. and its subsidiaries. Our fiscal year ends on the Saturday on or nearest to January 31.
Other terms that are commonly used in our management's discussion and analysis of financial condition and results of operations are defined as follows:
|
•
|
Fiscal 2018 - The fifty-two weeks ended February 2, 2019
|
|
•
|
Fiscal 2017 - The fifty-three weeks ended February 3, 2018
|
|
•
|
Fiscal 2016 - The fifty-two weeks ended January 28, 2017
|
|
•
|
Fiscal 2019 - Our next fiscal year representing the fifty-two weeks ending February 1, 2020
|
|
•
|
FASB- Financial Accounting Standards Board
|
|
•
|
FASB ASC - FASB Accounting Standards Codification, which serves as the source for authoritative U.S. GAAP, except that rules and interpretive releases by the SEC are also sources of authoritative U.S. GAAP for SEC registrants
|
|
•
|
GAAP - U.S. Generally Accepted Accounting Principles
|
|
•
|
SEC- The U.S. Securities and Exchange Commission
|
|
•
|
AUR- Average unit retail price
|
|
•
|
Comparable Retail Sales — Net sales, in constant currency, from stores that have been open for at least 14 consecutive months and from our e-commerce store, excluding postage and handling fees. Store closures in the current fiscal year will be excluded from Comparable Retail Sales beginning in the fiscal quarter in which the store closes. A store that is closed for a substantial remodel, relocation, or material change in size will be excluded from Comparable Retail Sales for at least 14 months beginning in the fiscal quarter in which the closure occurred. However, stores that temporarily close will be excluded from Comparable Retail Sales until the store is re-opened for a full fiscal month.
|
|
•
|
Gross Margin - Gross profit expressed as a percentage of net sales
|
|
•
|
SG&A - Selling, general, and administrative expenses
|
30
OVERVIEW
Our Business
We are the largest pure-play children's specialty apparel retailer in North America. We design, contract to manufacture, sell at retail and wholesale, and license to sell trend right, high quality merchandise at value prices, the substantial majority of which is under our proprietary “The Children's Place”, "Place", and "Baby Place" brand names. As of
February 2, 2019
, we operated 972 stores across North America, our e-commerce business at
www.childrensplace.com,
and had 217 international points of distribution open and operated by our eight franchise partners in 20 countries.
Segment Reporting
In accordance with FASB ASC 280--
Segment Reporting
, we report segment data based on geography: The Children’s Place U.S. and The Children’s Place International. Each segment includes an e-commerce business located at
www.childrensplace.com
. Included in The Children’s Place U.S. segment are our U.S. and Puerto Rico based stores and revenue from our U.S.-based wholesale business. Included in The Children's Place International segment are our Canadian-based stores, revenue from the Company's Canada wholesale business, as well as revenue from international franchisees. We measure our segment profitability based on operating income, defined as income before interest and taxes. Net sales and direct costs are recorded by each segment. Certain inventory procurement functions such as production and design as well as corporate overhead, including executive management, finance, real estate, human resources, legal, and information technology services are managed by The Children’s Place U.S. segment. Expenses related to these functions, including depreciation and amortization, are allocated to The Children’s Place International segment based primarily on net sales. The assets related to these functions are not allocated. We periodically review these allocations and adjust them based upon changes in business circumstances. Net sales to external customers are derived from merchandise sales, and we have no major customers that account for more than
10%
of our net sales.
Gymboree Bankruptcy and Pending Acquisition
Our chief mall-based specialty retail competitor, Gymboree Group, Inc., filed for bankruptcy on January 17, 2019 and announced a plan to liquidate and close its approximately 800 Gymboree and Crazy 8 retail stores by April 30, 2019. Prior to that filing, news of Gymboree's impending bankruptcy and liquidation caused us to make the strategic decision to significantly accelerate the liquidation of our seasonal carry-over inventory during the fourth quarter of Fiscal 2018. The complete liquidation of the approximately 800 Gymboree and Crazy 8 retail stores by the announced date of April 30, 2019 is expected to have an adverse impact on our net sales and net income during the first half of Fiscal 2019.
On March 1, 2019, a wholly-owned subsidiary of the Company was named the successful bidder in the bankruptcy auction to acquire certain intellectual property and related assets (the “Gymboree Assets”) of Gymboree Group, Inc. and related entities. The wholly-owned subsidiary of the Company has agreed to pay $76.0 million in cash for the Gymboree Assets, which include the worldwide rights to the names “Gymboree” and “Crazy 8” and other intellectual property, including trademarks, domain names, copyrights, and customer databases. The purchase price will be funded by cash on hand and borrowings under the Company’s revolving credit facility. The acquisition has been approved by the United States Bankruptcy Court for the Eastern District of Virginia and is subject to other standard closing conditions.
Operating Highlights
Fiscal 2018 was the foundational year of our three year plan for accelerated digital investments designed to lay the groundwork for operating margin leverage in future years. In addition, during Fiscal 2018, significant competitive opportunities arose, including involving our chief specialty retail competitor, that led us to make the strategic decision to sacrifice gross margin in the short-term in order to strengthen our long term position, with a focus on long-term market share gains, which culminated in the acquisition of the Gymboree Assets.
Net sales increased by $67.8 million, or 3.6%, to
$1,938.1 million
during
Fiscal 2018
from
$1,870.3 million
during
Fiscal 2017
. The net sales increase was driven primarily by a Comparable Retail Sales increase of 4.6%, as well as the reclassification of certain items due to the adoption of Topic 606 "Revenue from Contracts with Customers", partially offset by an adverse impact due to the calendar shift related to the 53rd week in Fiscal 2017. During
Fiscal 2018
, we opened no stores and closed 42 stores.
Gross profit decreased by $27.8 million, or 3.9%, to
$683.6 million
during
Fiscal 2018
from
$711.4 million
during
Fiscal 2017
. Consolidated gross margin decreased approximately 270 basis points to 35.3% during
Fiscal 2018
from 38.0% during
Fiscal 2017
. The decrease in gross margin resulted primarily from a decline in merchandise margin related to our increased competitiveness and increased penetration of our e-commerce business which operates at a lower gross margin rate due to higher fulfillment costs, partially offset by the leverage of fixed expenses resulting from the increase in Comparable Retail Sales and reclassification of certain items due to the adoption of Topic 606.
31
Selling, general, and administrative expenses increased $21.8 million, or 4.6%, to
$498.3 million
during
Fiscal 2018
from
$476.5 million
during
Fiscal 2017
. As a percentage of net sales, SG&A increased approximately 20 basis points to 25.7% during
Fiscal 2018
from 25.5% during
Fiscal 2017
. The de-leverage was primarily due to the incremental investment in our transformation initiatives and the reclassification of certain items due to the adoption of Topic 606, partially offset by lower incentive compensation expenses.
Provision for income taxes decreased $68.9 million, or 90.1%, to
$7.6 million
in
Fiscal 2018
compared to
$76.5 million
in
Fiscal 2017
. Our effective tax rate was 7.0% and 47.5% during
Fiscal 2018
and
Fiscal 2017
, respectively. The Fiscal 2017 provision for income tax included $51.8 million of transition tax recorded pursuant to the Tax Act. Excluding the impact of the $51.8 million recorded for the Tax Act items, the provision for income taxes in Fiscal 2017 would be $24.7 million, or 15.4%, compared to 7.0% in Fiscal 2018. The lower rate in Fiscal 2018 is primarily attributable to a lower US Federal tax rate due to the reduction in corporate statutory income tax rate under the Tax Act and a favorable mix in income generated in foreign jurisdictions, partially offset by a reserve release during Fiscal 2017 of $4.0 million.
We reported net income of
$101.0 million
during
Fiscal 2018
compared to
$84.7 million
during
Fiscal 2017
, an increase of $16.3 million, due to the factors discussed above. Diluted earnings per share was
$6.01
in
Fiscal 2018
compared to
$4.67
in
Fiscal 2017
. This increase in earnings per diluted share is due to higher net income and lower diluted weighted average number of common shares outstanding of approximately 1.3 million shares, virtually all of which is related to our share repurchase programs.
We continue to make significant progress on our key strategic growth initiatives--superior product, business transformation through technology, alternate channels of distribution, and fleet optimization.
Focus on product remains our top priority and strong product acceptance and our inventory management are anticipated to deliver gross margin and inventory productivity benefits.
Our business transformation through technology initiative has two key components: digital transformation and inventory management. With respect to digital transformation, our goal is to deliver one to one personalization focusing on improving customer acquisition and increasing customer engagement with our brand and to continue to gain market share. The transformation of our digital capabilities has continued during Fiscal 2018 with a new loyalty system that will deliver real-time personalized communication and promotions, the implementation of a new on-site search tool, the enhancement of our email trigger capabilities, and the introduction of dynamic display re-targeting. We plan to continue to develop several new capabilities, including: a new pricing and promotional system that will enable us to deliver personalized offers to our customers, improvements to our e-commerce platform, and buy-online-ship-to-store. With respect to inventory management, we have implemented assortment planning, allocation, replenishment, order planning, and forecasting tools.
With respect to alternate channels of distribution, we continued our international expansion program during Fiscal 2018 with our franchise partners and added 27 net additional international points of distribution (stores, shop in shops, e-commerce site) bringing our total count to 217 points of distribution operating in 20 countries. During the first quarter of Fiscal 2018, we announced an exclusive license agreement with Semir, China's largest specialty children's apparel retailer, and during Fiscal 2018, Semir opened its first five stores in China. In our wholesale business, our relationship with Amazon continues to develop with the expansion of our replenishment program.
We continue to evaluate our store fleet as part of our fleet optimization initiative to improve store productivity and plan to close approximately 300 stores through fiscal 2020, which includes the 211 stores closed since the announcement of this initiative.
During
Fiscal 2018
, we repurchased approximately 2.1 million shares for approximately $253.5 million, inclusive of shares repurchased and surrendered to cover tax withholdings associated with the vesting of equity awards held by management and paid cash dividends of $33.0 million. As of
February 2, 2019
, there was approximately $239 million in aggregate remaining on the 2018 Share Repurchase Program. In March 2019, the Board of Directors authorized the first quarter Fiscal 2019 dividend of $0.56 per share to be paid on April 26, 2019 to shareholders of record on the close of business on April 15, 2019.
We have subsidiaries whose operating results are based in foreign currencies and are thus subject to the fluctuations of the corresponding translation rates into U.S. dollars. The below table summarizes the average translation rates most impacting our operating results:
32
|
Fiscal 2018
|
Fiscal 2017
|
Fiscal 2016
|
||||
|
Average Translation Rates
(1)
|
||||||
|
Canadian Dollar
|
0.7675
|
0.7752
|
0.7595
|
|||
|
Hong Kong Dollar
|
0.1276
|
0.1283
|
0.1289
|
|||
|
China Yuan Renminbi
|
0.1503
|
0.1489
|
0.1499
|
|||
____________________________________________
|
(1)
|
The average translation rates are the average of the monthly translation rates used during each fiscal year to translate the respective income statements. The rates represent the U.S. dollar equivalent of each foreign currency.
|
CRITICAL ACCOUNTING POLICIES
The preparation of consolidated financial statements in conformity with U.S. GAAP requires us to make estimates and assumptions that affect the reported amounts of assets and liabilities and the disclosure of contingent assets and liabilities at the date of the financial statements, as well as the reported revenues and expenses during the reported period. In many cases, there are alternative policies or estimation techniques that could be used. We continuously review the application of our accounting policies and evaluate the appropriateness of the estimates used in preparing our financial statements; however, estimates routinely require adjustment based on changing circumstances and the receipt of new or better information. Consequently, actual results could differ from our estimates.
The accounting policies and estimates discussed below include those that we believe are the most critical to aid in fully understanding and evaluating our financial results. Senior management has discussed the development and selection of our critical accounting policies and estimates with the Audit Committee of our Board of Directors, which has reviewed our related disclosures herein.
Inventory Valuation
- We value inventory at the lower of cost or net realizable value, with cost determined using an average cost method. The estimated market value of inventory is determined based on an analysis of historical sales trends of our individual product categories, the impact of market trends and economic conditions, and a forecast of future demand, as well as plans to sell through inventory. Estimates may differ from actual results due to the quantity, quality, and mix of products in inventory, consumer and retailer preferences, and market conditions. Our historical estimates have not differed materially from actual results and a 10% difference in our reserve as of
February 2, 2019
would have impacted net income by approximately $0.1 million. Our reserve balance at
February 2, 2019
was approximately $1.4 million compared to $2.2 million at
February 3, 2018
.
Reserves for inventory shrinkage, representing the risk of physical loss of inventory, are estimated based on historical experience and are adjusted based upon physical inventory counts. A 0.5% difference in our shrinkage rate as a percentage of cost of goods sold could impact each quarter's net income by approximately $0.7 million.
Stock-Based Compensation
- We account for stock-based compensation according to the provisions of FASB ASC 718--
Compensation-Stock Compensation
.
Time Vesting and Performance-Based Awards
We generally grant time vesting and performance-based stock awards to employees at management levels and above. We also grant time vesting stock awards to our non-employee directors. Time vesting awards are granted in the form of restricted stock units that require each recipient to complete a service period ("Deferred Awards"). Deferred Awards granted to employees generally vest ratably over three years. Deferred Awards granted to non-employee directors generally vest after one year. Performance-based stock awards are granted in the form of restricted stock units which have a performance criteria that must be achieved for the awards to be earned in addition to a service period requirement ("Performance Awards") and each Performance Award has a defined number of shares that an employee can earn (the "Target Shares"). With the approval of the Board's Compensation Committee, the Company may settle vested Deferred Awards and Performance Awards to the employee in shares, in a cash amount equal to the market value of such shares at the time all requirements for delivery of the award have been met, or in part shares and cash. For Performance Awards issued during Fiscal 2016 and Fiscal 2017 (the “2016 and 2017 Performance Awards”), an employee may earn from 0% to 200% of their Target Shares based on the cumulative adjusted earnings per share achieved for the three-year performance period, adjusted operating margin expansion achieved for the three-year performance period, and adjusted return on invested capital ("adjusted ROIC") achieved at the end of the performance period. The 2016 and 2017 Performance Awards cliff vest, if earned, after completion of the applicable three year performance period. The fair value of the 2016 and 2017 Performance Awards granted is based on the closing price of our common stock on the grant date. For Performance Awards issued during Fiscal 2018 (the “2018 Performance Awards”), an employee may earn from 0% to 250% of their Target Shares based on the cumulative adjusted earnings per share achieved for the three-year performance period, adjusted operating margin expansion achieved for the three-year performance period, adjusted ROIC achieved as of the end of the performance period, and the ranking of our adjusted ROIC relative to that of companies in our
33
peer group as of the end of the performance period. The 2018 Performance Awards cliff vest, if earned, after completion of the three-year performance period. The fair value of the 2018 Performance Awards granted is based on the closing price of our common stock on the grant date. Compensation expense is recognized ratably over the related service period reduced for estimated forfeitures of those awards not expected to vest due to employee turnover. While actual forfeitures could vary significantly from those estimated, a 10% change in our estimated forfeiture rate would impact our Fiscal 2018 net income by approximately $0.8 million.
Impairment of Long-Lived Assets
- We periodically review our long-lived assets when events indicate that their carrying value may not be recoverable. Such events include a historical or projected trend of cash flow losses or a future expectation that we will sell or dispose of an asset significantly before the end of its previously estimated useful life. In reviewing for impairment, we group our long-lived assets at the lowest possible level for which identifiable cash flows are largely independent of the cash flows of other assets and liabilities.
We review all stores that have reached comparable sales status, or sooner if circumstances should dictate, on at least an annual basis. We believe waiting two years allows a store to reach a maturity level where a more comprehensive analysis of financial performance can be performed. For each store that shows indications of impairment, we project future cash flows over the remaining life of the lease and compare the total undiscounted cash flows to the net book value of the related long-lived assets. If the undiscounted cash flows are less than the related net book value of the long-lived assets, they are written down to their fair market value. We primarily determine fair market value to be the discounted future cash flows associated with those assets. In evaluating future cash flows, we consider external and internal factors. External factors comprise the local environment in which the store resides, including mall traffic, competition, and their effect on sales trends. Internal factors include our ability to gauge the fashion taste of our customers, control variable costs such as cost of sales and payroll, and in certain cases, our ability to renegotiate lease costs. If external factors should change unfavorably, if actual sales should differ from our projections, or if our ability to control costs is insufficient to sustain the necessary cash flows, future impairment charges could be material. At
February 2, 2019
, the average net book value per store was approximately $0.1 million.
Income Taxes
- We utilize the liability method of accounting for income taxes as set forth in FASB ASC 740--
Income Taxes.
Under the liability method, deferred taxes are determined based on the temporary differences between the financial statement and tax basis of assets and liabilities, as well as for net operating losses and tax credit carryforwards. Deferred tax assets and liabilities are measured using currently enacted tax rates that apply to taxable income in effect for the years in which the basis differences and tax assets are expected to be realized. A valuation allowance is recorded when it is more likely than not that some of the deferred tax assets will not be realized. In determining the need for valuation allowances, we consider projected future taxable income and the availability of tax planning strategies. If, in the future we determine that we would not be able to realize our recorded deferred tax assets, an increase in the valuation allowance would decrease earnings in the period in which such determination is made.
We assess our income tax positions and record tax benefits for all years subject to examination based upon our evaluation of the facts, circumstances, and information available at the reporting date. For those tax positions where it is more likely than not that a tax benefit will be sustained, we have recorded the largest amount of tax benefit with a greater than 50% likelihood of being realized upon ultimate settlement with a taxing authority that has full knowledge of all relevant information. For those income tax positions where it is not more likely than not that a tax benefit will be sustained, no tax benefit has been recognized in the financial statements.
Fair Value Measurement and Financial Instruments-
FASB ASC 820--
Fair Value Measurements and Disclosure
provides a single definition of fair value, together with a framework for measuring it and requires additional disclosure about the use of fair value to measure assets and liabilities.
This topic defines fair value as the price that would be received to sell an asset or paid to transfer a liability in an orderly transaction between market participants at the measurement date and establishes a three-level hierarchy, which encourages an entity to maximize the use of observable inputs and minimize the use of unobservable inputs when measuring fair value. The three levels of the hierarchy are defined as follows:
|
•
|
Level 1 - inputs to the valuation techniques that are quoted prices in active markets for identical assets or liabilities
|
|
•
|
Level 2 - inputs to the valuation techniques that are other than quoted prices but are observable for the assets or liabilities, either directly or indirectly
|
|
•
|
Level 3 - inputs to the valuation techniques that are unobservable for the assets or liabilities
|
Our cash and cash equivalents, short-term investments, accounts receivable, assets of the Company’s Deferred Compensation Plan, accounts payable, and revolving loan are all short-term in nature. As such, their carrying amounts
34
approximate fair value and fall within Level 1 of the fair value hierarchy. The Company stock included in the Deferred Compensation Plan is not subject to fair value measurement.
Our assets measured at fair value on a nonrecurring basis include long-lived assets. We review the carrying amounts of such assets when events indicate that their carrying amounts may not be recoverable. Any resulting asset impairment would require that the asset be recorded at its fair value. The resulting fair value measurements of the assets are considered to fall within Level 3 of the fair value hierarchy.
Our derivative assets and liabilities include foreign exchange forward contracts that are measured at fair value using observable market inputs such as forward rates, our credit risk, and our counterparties’ credit risks. Based on these inputs, our derivative assets and liabilities are classified within Level 2 of the valuation hierarchy.
Insurance and Self-Insurance Liabilities
- Based on our assessment of risk and cost efficiency, we self-insure as well as purchase insurance policies to provide for workers' compensation, general liability and property losses, cyber-security coverage, as well as directors' and officers' liability, vehicle liability, and employee medical benefits. We estimate risks and record a liability based upon historical claim experience, insurance deductibles, severity factors, and other actuarial assumptions. These estimates include inherent uncertainties due to the variability of the factors involved, including type of injury or claim, required services by the providers, healing time, age of claimant, case management costs, location of the claimant, and governmental regulations. While we believe that our risk assessments are appropriate, these uncertainties or a deviation in future claims trends from recent historical patterns could result in our recording additional or reduced expenses, which may be material to our results of operations. Our historical estimates have not differed materially from actual results and a 10% difference in our insurance reserves as of
February 2, 2019
would have impacted net income by approximately $0.4 million.
Recently Issued Accounting Standards
Adopted in Fiscal 2018
In May 2014, the FASB issued guidance relating to revenue recognition from contracts with customers. This guidance requires entities to recognize revenue in a way that depicts the transfer of promised goods or services to customers in an amount that reflects the consideration to which the entity expects to be entitled to in exchange for those goods or services. We adopted this guidance in the first quarter of 2018 using the modified-retrospective method. This adoption did not have a material impact on the Company’s consolidated financial statements. Refer to Note 2, "
Revenues"
, for additional information.
To Be Adopted After Fiscal 2018
In August 2017, the FASB issued guidance relating to the accounting for hedging activities. This guidance aims to better align an entity’s risk management activities and financial reporting for hedging relationships through changes to both the designation and measurement guidance for qualifying hedging relationships and the presentation of hedge results. The amendments in the guidance expand and refine hedge accounting for both non-financial and financial risk components and align the recognition and presentation of the effects of the hedging instrument and the hedged item in the financial statements. The standard is effective for the Company beginning in Fiscal 2019, including interim periods within those fiscal years, and early adoption is permitted. The Company does not expect the adoption of this guidance to have a material impact on its consolidated financial statements.
In February 2016, the FASB issued guidance relating to the accounting for leases. This guidance applies a right of use model that requires a lessee to record, for all leases with a lease term of more than 12 months, an asset representing its right to use the underlying asset for the lease term and a liability to make lease payments. The lease term is the noncancellable period of the lease, and includes both periods covered by an option to extend the lease, if the lessee is reasonably certain to exercise that option, and periods covered by an option to terminate the lease, if the lessee is reasonably certain not to exercise that termination option. The standard is effective for the Company beginning in Fiscal 2019, including interim periods within those fiscal years, and early adoption is permitted.
The Company will adopt this guidance beginning in Fiscal 2019 using a modified retrospective approach with the cumulative effect of adopting the standard recognized as an adjustment to opening retained earnings. The Company expects to apply the related package of practical expedients permitted by the transition guidance in the standard, which allows the Company to carry forward its identification of contracts that are or contain leases, its historical lease classification, and its initial direct costs for existing leases. The Company currently expects to recognize right-of-use assets and lease liabilities totaling between $400 million and $450 million upon adoption. The Company does not expect adoption of the standard to have a material impact on the Company's consolidated results of operations or cash flows.
35
RESULTS OF OPERATIONS
The following table sets forth, for the periods indicated, selected income statement data expressed as a percentage of net sales. We primarily evaluate the results of our operations as a percentage of net sales rather than in terms of absolute dollar increases or decreases by analyzing the year over year change in our business expressed as a percentage of net sales (i.e., “basis points”). For example, gross profit decreased approximately 270 basis points to 35.3% of net sales during Fiscal 2018 from 38.0% during Fiscal 2017. Accordingly, to the extent that our sales have increased at a faster rate than our costs (i.e., “leveraging”), the more efficiently we have utilized the investments we have made in our business. Conversely, if our sales decrease or if our costs grow at a faster pace than our sales (i.e., “de-leveraging”), we have less efficiently utilized the investments we have made in our business.
|
|
Fiscal Year Ended
|
|||||||
|
|
February 2,
2019 |
February 3,
2018 |
January 28,
2017 |
|||||
|
Net sales
|
100.0
|
%
|
100.0
|
%
|
100.0
|
%
|
||
|
Cost of sales (exclusive of depreciation and amortization)
|
64.7
|
|
62.0
|
|
62.4
|
|
||
|
Gross profit
|
35.3
|
|
38.0
|
|
37.6
|
|
||
|
Selling, general, and administrative expenses
|
25.7
|
|
25.5
|
|
25.4
|
|
||
|
Depreciation and amortization
|
3.6
|
|
3.6
|
|
3.7
|
|
||
|
Asset impairment charge
|
0.3
|
|
0.3
|
|
0.2
|
|
||
|
Operating income
|
5.7
|
|
8.6
|
|
8.3
|
|
||
|
Income before provision for income taxes
|
5.6
|
|
8.6
|
|
8.2
|
|
||
|
Provision for income taxes
|
0.4
|
|
4.1
|
|
2.5
|
|
||
|
Net income
|
5.2
|
%
|
4.5
|
%
|
5.7
|
%
|
||
|
Number of stores operated by the Company, end of period
|
972
|
|
1,014
|
|
1,039
|
|
||
The following tables set forth net sales by segment, for the periods indicated:
|
|
Fiscal Year Ended
|
||||||||||
|
|
February 2,
2019 |
February 3,
2018 |
January 28,
2017 |
||||||||
|
(In thousands)
|
|||||||||||
|
Net sales:
|
|
|
|
|
|
|
|||||
|
The Children’s Place U.S.
|
$
|
1,727,907
|
|
$
|
1,650,620
|
|
$
|
1,567,556
|
|
||
|
The Children’s Place International
|
210,177
|
|
219,655
|
|
217,760
|
|
|||||
|
Total net sales
|
$
|
1,938,084
|
|
$
|
1,870,275
|
|
$
|
1,785,316
|
|
||
Fiscal 2018 Compared to Fiscal 2017
Net sales
increased by $67.8 million, or 3.6%, to
$1,938.1 million
during
Fiscal 2018
from
$1,870.3 million
during
Fiscal 2017
. The net sales increase was driven primarily by a Comparable Retail Sales increase of 4.6%, as well as the reclassification of certain items due to the adoption of Topic 606 "Revenue from Contracts with Customers", partially offset by an adverse impact due to the calendar shift related to the 53rd week in Fiscal 2017. During
Fiscal 2018
, we opened no stores and closed 42 stores.
We believe that our e-commerce and brick-and-mortar retail store operations are highly interdependent, with both sharing common customers purchasing from a common pool of product inventory. Accordingly, we believe that consolidated omni-channel reporting presents the most meaningful and appropriate measure of our performance, including Comparative Retail Sales and revenues.
The Children’s Place U.S. net sales increased $77.3 million, or 4.7%, to
$1,727.9 million
during
Fiscal 2018
compared to
$1,650.6 million
during
Fiscal 2017
. Our net sales increase resulted primarily from a U.S. Comparable Retail Sales increase of 5.2% and the adoption of Topic 606, partially offset by an adverse impact due to the calendar shift related to the 53rd week in Fiscal 2017.
The Children’s Place International net sales decreased $9.5 million, or 4.3%, to
$210.2 million
during
Fiscal 2018
compared to
$219.7 million
during
Fiscal 2017
. Our net sales decrease resulted primarily from unfavorable changes in the
36
Canadian exchange rate compared to the U.S. dollar, the impact of operating fewer stores, and flat Canadian Comparable Retail Sales.
Total e-commerce sales, which include postage and handling, increased to approximately 28% of net sales during Fiscal 2018 from approximately 23% during Fiscal 2017.
Gross profit
decreased by $27.8 million, or 3.9%, to
$683.6 million
during
Fiscal 2018
from
$711.4 million
during
Fiscal 2017
. Consolidated gross margin decreased approximately 270 basis points to 35.3% during
Fiscal 2018
from 38.0% during
Fiscal 2017
. The decrease in gross margin resulted primarily from a decline in merchandise margin related to our increased competitiveness and increased penetration of our e-commerce business which operates at a lower gross margin rate, partially offset by the leverage of fixed expenses resulting from the increase in Comparable Retail Sales and reclassification of certain items due to the adoption of Topic 606.
Gross profit as a percentage of net revenues is dependent upon a variety of factors, including changes in the relative sales mix among distribution channels, changes in the mix of products sold, the timing and level of promotional activities, foreign currency exchange rates, and fluctuations in material costs. These factors, among others, may cause gross profit as a percentage of net revenues to fluctuate from period to period.
Selling, general, and administrative expenses
increased $21.8 million, or 4.6%, to
$498.3 million
during
Fiscal 2018
from
$476.5 million
during
Fiscal 2017
. As a percentage of net sales, SG&A increased approximately 20 basis points to 25.7% during
Fiscal 2018
from 25.5% during
Fiscal 2017
. The de-leverage was primarily due to the incremental investment in our transformation initiatives and the reclassification of certain items due to the adoption of Topic 606, partially offset by lower incentive compensation expense.
Asset impairment
charges
were $6.1 million during
Fiscal 2018
, of which
$1.7 million
related to the full impairment of 11 stores, and $4.4 million related to the write-down of information technology systems. Asset impairment charges during Fiscal 2017 were $5.2 million, of which
$2.8 million
related to
21
stores, all of which were fully impaired, and $2.4 million related to the write-down of information technology systems.
Depreciation and amortization
was
$68.9 million
during
Fiscal 2018
compared to
$68.2 million
during
Fiscal 2017
reflecting increased depreciation associated with our ongoing investment in business transformation initiatives.
Other income
was $1.1 million during
Fiscal 2018
related to the settlement of a distribution center lease along with the termination of a sublease.
Operating income
decreased $50.2 million, or 31.1%, to
$111.3 million
during
Fiscal 2018
from
$161.5 million
during
Fiscal 2017
. As a percentage of net sales, operating income decreased approximately 290 basis points to 5.7% during
Fiscal 2018
from 8.6% during
Fiscal 2017
, due to the factors discussed above.
Provision for income taxes
decreased $68.9 million, or 90.1%, to
$7.6 million
in
Fiscal 2018
compared to
$76.5 million
in
Fiscal 2017
. Our effective tax rate was 7.0% and 47.5% during
Fiscal 2018
and
Fiscal 2017
, respectively. The Fiscal 2017 provision for income tax included $51.8 million of transition tax recorded pursuant to the Tax Act. Excluding the impact of the $51.8 million recorded for the Tax Act items, the provision for income taxes in Fiscal 2017 would be $24.7 million, or 15.4%, compared to 7.0% in Fiscal 2018. The lower rate in Fiscal 2018 is primarily attributable to a lower US Federal tax rate due to the reduction in corporate statutory income tax rate under the Tax Act and a favorable mix in income generated in foreign jurisdictions, partially offset by a reserve release during Fiscal 2017 of $4.0 million.
Net income
was
$101.0 million
during
Fiscal 2018
compared to
$84.7 million
during
Fiscal 2017
, an increase of $16.3 million, due to the factors discussed above. Diluted earnings per share was
$6.01
in
Fiscal 2018
compared to
$4.67
in
Fiscal 2017
. This increase in earnings per diluted share is due to higher net income and lower diluted weighted average number of common shares outstanding of approximately 1.3 million shares, virtually all of which is related to our share repurchase programs.
Fiscal 2017 Compared to Fiscal 2016
Net sales
increased by $85.0 million, or 4.8%, to $1,870.3 million during Fiscal 2017 from $1,785.3 million during Fiscal 2016. Our net sales increased by $99.8 million driven primarily by a Comparable Retail Sales increase of 5.8%, as well as a favorable impact of $4.3 million related to changes in the Canadian exchange rate compared to the U.S. dollar, partially offset by a $19.1 million decrease in sales primarily due to operating fewer stores.
The Children’s Place U.S. net sales increased $83.0 million, or 5.3%, to $1,650.6 million during Fiscal 2017 compared to $1,567.6 million during Fiscal 2016. Our net sales increase resulted primarily from a U.S. Comparable Retail Sales increase of 6.5%, partially offset by operating fewer stores.
37
The Children’s Place International net sales increased $1.9 million, or 0.9%, to $219.7 million during Fiscal 2017 compared to $217.8 million during Fiscal 2016. Our net sales increase resulted primarily from a Canadian Comparable Retail Sales increase of 0.6% and favorable changes in the Canadian exchange rate compared to the U.S. dollar, partially offset by a decrease in sales due to operating fewer stores.
Gross profit
increased by $39.8 million, or 5.9%, to $711.4 million during Fiscal 2017 from $671.6 million during Fiscal 2016. Consolidated gross margin increased approximately 40 basis points to 38.0% during Fiscal 2017 from 37.6% during Fiscal 2016. The increase in gross margin resulted primarily from merchandise margin expansion and the leverage of fixed expenses, partially offset by the increased penetration of our e-commerce business, which operates at a lower gross margin rate due to higher fulfillment costs.
Gross profit as a percentage of net revenues is dependent upon a variety of factors, including changes in the relative sales mix among distribution channels, changes in the mix of products sold, the timing and level of promotional activities, foreign currency exchange rates, and fluctuations in material costs. These factors, among others, may cause gross profit as a percentage of net revenues to fluctuate from period to period.
Selling, general, and administrative expenses
increased $22.4 million, or 4.9%, to $476.5 million during Fiscal 2017 from $454.1 million during Fiscal 2016. As a percentage of net sales, SG&A increased approximately 10 basis points to 25.5% during Fiscal 2017 from 25.4% during Fiscal 2016. The comparability of our SG&A was affected by costs related to provisions for legal settlements, costs related to foreign exchange control penalties, sales tax and use tax audit settlements, and costs arising out of the restructuring of certain store and corporate operations totaling approximately $10.4 million during Fiscal 2017. Excluding this impact, our SG&A increased $12.0 million and leveraged 50 basis points. The leverage was primarily due to decreased store expenses, including lower credit card fees, and lower incentive compensation expenses, partially offset by expenses related to the continued investment in our transformation initiatives.
Asset impairment
charges
were $5.2 million during Fiscal 2017, of which $2.8 million related to the full impairment of 21 stores, and $2.4 million related to the write-down of obsolete information technology systems. Asset impairment charges during Fiscal 2016 were $4.0 million, of which $2.7 million related to 28 stores, 11 of which were fully impaired and 17 which were partially impaired, and $1.3 million related to the write-down of some previously capitalized development costs and information technology systems.
Depreciation and amortization
was $68.2 million during Fiscal 2017 compared to $65.7 million during Fiscal 2016 reflecting increased depreciation associated with our ongoing investment in business transformation initiatives.
Operating income
increased $14.1 million, or 9.6%, to $161.5 million during Fiscal 2017 from $147.4 million during Fiscal 2016. As a percentage of net sales, operating income increased approximately 30 basis points to 8.6% during Fiscal 2017 from 8.3% during Fiscal 2016, due to the factors discussed above.
Provision for income taxes
increased $31.8 million, or 71.1%, to $76.5 million in Fiscal 2017 compared to $44.7 million in Fiscal 2016. Our effective tax rate was 47.5% and 30.4% during Fiscal 2017 and Fiscal 2016, respectively. The Fiscal 2017 provision for income tax includes $51.8 million of taxes recorded pursuant to the Tax Act, a $16.6 million benefit for excess stock compensation benefits due to the Company's adoption of ASU 2016-09
--
Improvements to Employee Share Based Payment Accounting
, and the release of a $4.0 million reserve for an uncertain tax position that was resolved during the first quarter of Fiscal 2017. Excluding these items, the provision for income taxes would be $45.3 million, or 28.1%, compared to 30.4% in Fiscal 2016 and is primarily related to lower state income taxes, lower non-deductible expenses, and higher tax credits in Fiscal 2017.
The $51.8 million of tax recorded pursuant to the Tax Act was recorded in the fourth quarter of Fiscal 2017 and consisted of U.S. transition taxes of $37.6 million on deemed repatriation of foreign earnings, payable over eight years, $8.5 million of related foreign and state withholding taxes on our previously undistributed foreign earnings, and $5.7 million from the revaluation of deferred tax assets and liabilities. The deemed repatriation transition tax, related withholding, and the revaluation of deferred tax assets and liabilities represents a provisional amount, which may be subject to adjustment during a measurement period not to exceed one year, based on guidance provided by the SEC. The Company’s effective foreign tax rates for Fiscal 2017 and Fiscal 2016 were 19.9% and 21.2%, respectively.
Net income
was $84.7 million during Fiscal 2017 compared to $102.3 million during Fiscal 2016, a decrease of $17.6 million, due to the factors discussed above. Diluted earnings per share was $4.67 in Fiscal 2017 compared to $5.40 in Fiscal 2016. This decrease in earnings per diluted share is due to lower net income, partially offset by a lower diluted weighted average number of common shares outstanding of approximately 0.8 million shares, virtually all of which is related to our share repurchase programs.
38
LIQUIDITY AND CAPITAL RESOURCES
Liquidity
Our working capital needs follow a seasonal pattern, peaking during the third fiscal quarter based on seasonal inventory purchases. Our primary uses of cash are working capital requirements, which are principally inventory purchases, and the financing of capital projects, including investments in new systems, and the repurchases of our common stock and payment of dividends.
Our working capital decreased $192.0 million to $104.0 million at
February 2, 2019
compared to $296.0 million at
February 3, 2018
, primarily due to the purchase of common stock related to our share repurchase programs, inclusive of an accelerated share repurchase program in which we repurchased and retired approximately 1.0 million shares for $125.0 million. During Fiscal 2018, we repurchased approximately 2.1 million shares for approximately $253.5 million, inclusive of shares repurchased and surrendered to cover tax withholdings associated with the vesting of equity awards held by management and paid cash dividends of approximately $33.0 million. Subsequent to February 2, 2019 and through March 19, 2019, the Company repurchased approximately 0.1 million shares for approximately $9.9 million. During Fiscal 2017, we repurchased approximately 1.0 million shares for approximately $118.6 million under our share repurchase programs, inclusive of shares repurchased and surrendered to cover tax withholdings associated with the vesting of equity awards held by management and paid cash dividends of $28.1 million. Additionally, in March 2019, the Board of Directors authorized a quarterly cash dividend of $0.56 per share to be paid on April 26, 2019 to shareholders of record on the close of business on April 15, 2019.
At
February 2, 2019
, our credit facility provided for borrowings up to the lesser of $250.0 million or our borrowing base, as defined by the credit facility agreement (see “Credit Facility” below). At
February 2, 2019
, we had $48.9 million in outstanding borrowings with our borrowing base at $250.0 million, and $194.1 million available for borrowing. In addition, at
February 2, 2019
, we had $7.0 million of outstanding letters of credit with an additional $43.0 million available for issuing letters of credit.
We expect to be able to meet our working capital and capital expenditure requirements over the next 12 months by using our cash on hand, cash flows from operations, and availability under our credit facility.
Credit Facility
We and certain of our domestic subsidiaries maintain a credit agreement with Wells Fargo Bank, National Association (“Wells Fargo”), Bank of America, N.A., HSBC Business Credit (USA) Inc., and JPMorgan Chase Bank, N.A. as lenders (collectively, the “Lenders”) and Wells Fargo, as Administrative Agent, Collateral Agent and Swing Line Lender (the “Credit Agreement”). The Credit Agreement was amended on September 15, 2015 and the provisions below reflect the amended and extended Credit Agreement.
The Credit Agreement, which expires in September 2020, consists of a
$250 million
asset based revolving credit facility, with a
$50 million
sub-limit for standby and documentary letters of credit and an uncommitted accordion feature that could provide up to
$50 million
of additional availability. Revolving credit loans outstanding under the Credit Agreement bear interest, at our option, at:
|
(i)
|
the prime rate plus a margin of
0.50%
to
0.75%
based on the amount of our average excess availability under the facility; or
|
|
(ii)
|
the London InterBank Offered Rate, or “LIBOR”, for an interest period of
one, two, three, or six
months, as selected by us, plus a margin of
1.25%
to
1.50%
based on the amount of our average excess availability under the facility.
|
We are charged an unused line fee of
0.25%
on the unused portion of the commitments. Letter of credit fees range from
0.625%
to
0.750%
for commercial letters of credit and range from
0.75%
to
1.00%
for standby letters of credit. Letter of credit fees are determined based on the amount of our average excess availability under the facility. The amount available for loans and letters of credit under the Credit Agreement is determined by a borrowing base consisting of certain credit card receivables, certain trade and franchise receivables, certain inventory, and the fair market value of certain real estate, subject to certain reserves.
The outstanding obligations under the Credit Agreement may be accelerated upon the occurrence of certain events, including, among others, non-payment, breach of covenants, the institution of insolvency proceedings, defaults under other material indebtedness, and a change of control, subject, in the case of certain defaults, to the expiration of applicable grace periods. We are not subject to any early termination fees.
The Credit Agreement contains covenants, which include conditions on stock buybacks and the payment of cash dividends or similar payments. Credit extended under the Credit Agreement is secured by a first priority security interest in substantially all of our U.S. assets excluding intellectual property, software, equipment, and fixtures.
39
As of
February 2, 2019
, we have capitalized an aggregate of approximately
$4.3 million
in deferred financing costs related to the Credit Agreement. The unamortized balance of deferred financing costs at
February 2, 2019
and
February 3, 2018
was approximately
$0.4 million
and $0.7 million, respectively. Unamortized deferred financing costs are amortized over the remaining term of the Credit Agreement.
The table below presents the components of our credit facility:
|
|
February 2,
2019 |
February 3,
2018 |
|||||
|
(In millions)
|
|||||||
|
Credit facility maximum
|
$
|
250.0
|
|
$
|
250.0
|
|
|
|
Borrowing base
(1)
|
250.0
|
|
250.0
|
|
|||
|
Outstanding borrowings
|
48.9
|
|
21.5
|
|
|||
|
Letters of credit outstanding—standby
|
7.0
|
|
7.0
|
|
|||
|
Utilization of credit facility at end of period
|
55.9
|
|
28.5
|
|
|||
|
Availability
(2)
|
$
|
194.1
|
|
$
|
221.5
|
|
|
|
Interest rate at end of period
|
6.0
|
%
|
5.0
|
%
|
|||
|
|
Fiscal 2018
|
Fiscal 2017
|
|||||
|
Average end of day loan balance during the period
|
$
|
64.4
|
|
$
|
45.8
|
|
|
|
Highest end of day loan balance during the period
|
156.4
|
|
98.2
|
|
|||
|
Average interest rate
|
4.3
|
%
|
2.9
|
%
|
|||
|
(1)
|
Lower of the credit facility maximum or the total borrowing base collateral.
|
|
(2)
|
The sublimit availability for letters of credit was
$43.0 million
and
$43.0 million
at
February 2, 2019
and
February 3, 2018
, respectively.
|
Cash Flows/Capital Expenditures
During
Fiscal 2018
, cash flows provided by operating activities were
$139.9 million
compared to
$214.4 million
during
Fiscal 2017
. The net decrease of $74.5 million in cash from operating activities resulted primarily from working capital needs. During
Fiscal 2017
, cash flows provided by operating activities were
$214.4 million
compared to
$199.3 million
during
Fiscal 2016
. The net increase of $15.1 million in cash from operating activities resulted primarily from operating performance.
Cash flows used in investing activities were
$56.9 million
during
Fiscal 2018
compared to
$25.1 million
during
Fiscal 2017
. This change was primarily due to a net redemption of short-term investments into cash and cash equivalents during
Fiscal 2018
of $15.0 million compared to a net redemption of short-term investments during
Fiscal 2017
of $34.3 million and increased capital expenditures, primarily related to our business transformation initiatives. Cash flows used in investing activities were
$25.1 million
during
Fiscal 2017
compared to
$44.3 million
during
Fiscal 2016
. This change was due primarily to a $34.3 million net redemption of short-term investments into cash and cash equivalents for working capital needs during Fiscal 2017 compared to a $9.2 million net purchase of short-term investments during Fiscal 2016, partially offset by a $24.0 million increase in capital expenditures.
During
Fiscal 2018
, cash flows used in financing activities were
$259.2 million
compared to
$140.6 million
during
Fiscal 2017
. The increase primarily resulted from an increase in purchases of our common stock, primarily related to our accelerated share repurchase program and shares repurchased to cover tax withholdings associated with the vesting of equity awards. During
Fiscal 2017
, cash flows used in financing activities were
$140.6 million
compared to
$155.0 million
during
Fiscal 2016
. The decrease primarily resulted from a $39.2 million decrease in purchases of our common stock pursuant to our share repurchase programs, partially offset by a $13.3 million increase in cash dividends paid and a $9.3 million increase in borrowings under our revolving credit facility.
For Fiscal 2019, we estimate that total capital expenditures will be approximately $70-80 million, primarily related to our business transformation through technology initiative. Our ability to meet our capital requirements in Fiscal 2019 depends on our ability to generate cash flows from operations and our available borrowings under our credit facility. Cash flow generated from operations depends on our ability to achieve our financial plans. We believe that cash on hand, cash generated from operations, and funds available to us through our credit facility will be sufficient to fund our capital and other cash flow requirements over the next 12 months.
40
Derivative Instruments
We are exposed to gains and losses resulting from fluctuations in foreign currency exchange rates attributable to inventory purchases denominated in a foreign currency. Specifically, our Canadian subsidiary’s functional currency is the Canadian dollar, but purchases inventory from suppliers in US dollars. In order to mitigate the variability of cash flows associated with certain of these forecasted inventory purchases, we enter into foreign exchange forward contracts. These contracts typically mature within 12 months. We do not use forward contracts to engage in currency speculation, and we do not enter into derivative financial instruments for trading purposes.
All derivative instruments are presented at gross fair value on the consolidated balance sheets within either prepaid expenses and other current assets or accrued expenses and other current liabilities. As of
February 2, 2019
, we had foreign exchange forward contracts with an aggregate notional amount of
$17.9 million
and the fair value of the derivative instruments was an asset of
$1.9 million
.
CONTRACTUAL OBLIGATIONS AND COMMERCIAL COMMITMENTS
The following tables summarize our contractual and commercial obligations as of
February 2, 2019
:
|
Payment Due By Period
|
||||||||||||||||||||
|
Contractual Obligations (dollars in thousands)
|
Total
|
1 year or less
|
1-3 years
|
3-5 years
|
More than 5 years
|
|||||||||||||||
|
Operating leases
(1)
|
$
|
487,641
|
|
$
|
143,601
|
|
$
|
203,825
|
|
$
|
89,952
|
|
$
|
50,263
|
|
|||||
|
Total---Contractual Obligations
|
$
|
487,641
|
|
$
|
143,601
|
|
$
|
203,825
|
|
$
|
89,952
|
|
$
|
50,263
|
|
|||||
|
Amounts of Commitment Expiration Per Period
|
||||||||||||||||||||
|
Other Commercial Commitments (dollars in thousands)
|
Total
|
1 year or less
|
1-3 years
|
3-5 years
|
More than 5 years
|
|||||||||||||||
|
Purchase commitments--merchandise
|
122,362
|
|
122,362
|
|
—
|
|
—
|
|
—
|
|
||||||||||
|
Purchase commitments--non-merchandise
|
14,493
|
|
14,493
|
|
—
|
|
—
|
|
—
|
|
||||||||||
|
Standby letters of credit
(2)
|
7,023
|
|
7,023
|
|
—
|
|
—
|
|
—
|
|
||||||||||
|
Total---Other Commercial Commitments
|
$
|
143,878
|
|
$
|
143,878
|
|
$
|
—
|
|
$
|
—
|
|
$
|
—
|
|
|||||
|
Total---Contractual Obligations and Other Commercial Commitments
|
$
|
631,519
|
|
$
|
287,479
|
|
$
|
203,825
|
|
$
|
89,952
|
|
$
|
50,263
|
|
|||||
____________________________________________
|
(1)
|
Certain of our operating leases include common area maintenance and other charges in our monthly rental expense. For other leases which do not include these charges in the minimum lease payments, we incur monthly charges, which are billed and recorded separately. Additionally, our minimum lease obligation does not include contingent rent based upon sales volume.
|
|
(2)
|
Represents letters of credit issued to landlords, banks, and insurance companies.
|
We self-insure and purchase insurance policies to provide for workers' compensation, general liability, and property losses, as well as directors' and officers' liability, vehicle liability, and employee medical benefits, as described in Note 1 of the Notes to our Consolidated Financial Statements. Insurance reserves of approximately $2.5 million are included in other long term liabilities as of
February 2, 2019
. The long-term portion represents the total amount estimated to be paid beyond one year. We are not able to further estimate in which periods the long-term portion will be paid.
As discussed more fully in Note 11 of the Notes to our Consolidated Financial Statements, our long-term liabilities include unrecognized tax benefits of approximately $5.1 million, which includes $0.1 million of accrued interest and penalties, at
February 2, 2019
. We cannot make a reasonable estimate of the amount and period of related future payments for any of this amount.
Off-Balance Sheet Arrangements
None.
41
QUARTERLY RESULTS AND SEASONALITY
Our quarterly results of operations have fluctuated and are expected to continue to fluctuate materially depending on a variety of factors, including overall economic conditions, the timing and number of store closures, net sales contributed by new stores, increases or decreases in Comparable Retail Sales, weather conditions (such as unseasonable temperatures or storms), shifts in timing of certain holidays, and changes in our merchandise mix and pricing strategy, including changes to address competitive factors. The combination and severity of one or more of these factors could result in material fluctuations.
The following table sets forth certain statement of operations data and selected operating data for each of our last four fiscal quarters. Quarterly information for Fiscal 2017 is included in Note 14 of the Notes to our Consolidated Financial Statements. The quarterly statement of operations data and selected operating data set forth below were derived from our audited consolidated financial statements and reflect, in our opinion, all adjustments (consisting only of normal recurring adjustments) necessary to fairly present the results of operations for these fiscal quarters (unaudited):
|
Fiscal Year Ended February 2, 2019
|
||||||||||||||||
|
First
Quarter
|
Second
Quarter
|
Third
Quarter
|
Fourth
Quarter
|
|||||||||||||
|
(In thousands)
|
||||||||||||||||
|
Net sales
|
$
|
436,314
|
|
$
|
448,718
|
|
$
|
522,495
|
|
$
|
530,557
|
|
||||
|
Gross profit
|
160,192
|
|
154,806
|
|
204,366
|
|
164,232
|
|
||||||||
|
Selling, general, and administrative expenses
|
118,471
|
|
124,210
|
|
123,207
|
|
132,455
|
|
||||||||
|
Depreciation and amortization
|
17,406
|
|
16,595
|
|
17,404
|
|
17,479
|
|
||||||||
|
Asset impairment charges
|
1,257
|
|
3,979
|
|
396
|
|
464
|
|
||||||||
|
Operating income
|
23,058
|
|
10,022
|
|
64,605
|
|
13,643
|
|
||||||||
|
Income before provision for income taxes
|
22,761
|
|
9,076
|
|
63,774
|
|
12,913
|
|
||||||||
|
Provision (benefit) for income taxes
|
(8,776
|
)
|
1,590
|
|
13,861
|
|
889
|
|
||||||||
|
Net income
|
31,537
|
|
7,486
|
|
49,913
|
|
12,024
|
|
||||||||
|
Diluted earnings per share
|
$
|
1.78
|
|
$
|
0.45
|
|
$
|
3.03
|
|
$
|
0.74
|
|
||||
|
Diluted weighted average common
shares outstanding
|
17,734
|
|
16,715
|
|
16,496
|
|
16,277
|
|
||||||||
|
Cash dividends declared and paid per common share
|
$
|
0.5000
|
|
$
|
0.5000
|
|
$
|
0.5000
|
|
$
|
0.5000
|
|
||||
ITEM 7A--QUANTITATIVE AND QUALITATIVE DISCLOSURES ABOUT MARKET RISK.
In the normal course of business, our financial position and results of operations are routinely subject to market risk associated with interest rate movements on borrowings and investments and currency rate movements on non-U.S. dollar denominated assets, liabilities, income, and expenses. We utilize cash from operations and short-term borrowings to fund our working capital and investment needs.
Cash and Cash Equivalents
Cash and cash equivalents are normally invested in short-term financial instruments that will be used in operations within 90 days of the balance sheet date. Because of the short-term nature of these instruments, changes in interest rates would not materially affect the fair value of these financial instruments.
Short-term Investments
Short-term investments consist of investments which we expect to convert into cash within one year, including time deposits, which have original maturities greater than 90 days. Because of the short-term nature of these instruments, changes in interest rates would not materially affect the fair value of these financial instruments.
42
Interest Rates
Our credit facility bears interest at a floating rate equal to the prime rate or LIBOR, plus a calculated spread based on our average excess availability. As of
February 2, 2019
, we had
$48.9 million
in borrowings under the credit facility. A 10% change in the prime rate or LIBOR interest rates would not have had a material impact on our interest expense.
Foreign Assets and Liabilities
Assets and liabilities outside the United States are primarily located in Canada and Hong Kong. Our investments in our Canadian and Asian subsidiaries are considered to be long-term. As of
February 2, 2019
, net assets in our Canadian and Hong Kong subsidiaries were $26.4 million and $29.9 million, respectively. A 10% increase or decrease in the Canadian and Hong Kong Dollars would increase or decrease the corresponding net investment by $2.6 million and $3.0 million, respectively. All changes in the net investment of our foreign subsidiaries are recorded in other comprehensive income as unrealized gains or losses.
As of
February 2, 2019
, we had approximately
$69.1 million
of cash and cash equivalents, of which $59.7 of cash and cash equivalents was held in foreign subsidiaries, of which approximately $23.7 million was in our Canadian subsidiaries, $29.7 million was in our Hong Kong subsidiaries, and $6.3 million was in our other foreign subsidiaries.
Foreign Operations
We have exchange rate exposure primarily with respect to certain revenues and expenses denominated in Canadian dollars. As a result, fluctuations in exchange rates impact the amount of our reported sales and expenses. Assuming a 10% change in foreign exchange rates, Fiscal 2018 net sales could have decreased or increased by approximately $18.1 million and total costs and expenses could have decreased or increased by approximately $21.2 million. Additionally, we have foreign currency denominated receivables and payables that when settled, result in transaction gains or losses. At
February 2, 2019
, we had foreign currency denominated receivables and payables, including inter-company balances, of $3.3 million and $6.3 million, respectively.
Our Canadian subsidiary’s functional currency is the Canadian dollar, but purchases inventory from suppliers in U.S. dollars. In order to mitigate the variability of cash flows associated with certain of these forecasted inventory purchases, we enter into foreign exchange forward contracts. As of
February 2, 2019
, we had foreign exchange forward contracts with an aggregate notional amount of $17.9 million and the fair value of the derivative instruments was an asset of $1.9 million. Assuming a 10% change in Canadian foreign exchange rates, the fair value of these instruments could have decreased by or increased by approximately $1.8 million. Any resulting changes in the fair value of the instruments would be partially offset by changes in the underlying balance sheet positions.
We import a vast majority of our merchandise from foreign countries, primarily China, Bangladesh, Vietnam, India, and Indonesia. Consequently, any significant or sudden change in these countries' political, foreign trade, financial, banking, or currency policies and practices, or the occurrence of significant labor unrest, could have a material adverse impact on our financial position, results of operations, and cash flows.
ITEM 8.-FINANCIAL STATEMENTS AND SUPPLEMENTARY DATA
The information required by this Item is incorporated herein by reference to the consolidated financial statements and supplementary data set forth in “Item 15-Exhibits and Financial Statement Schedules” of Part IV of this Annual Report on Form 10-K.
ITEM 9.-CHANGES IN AND DISAGREEMENTS WITH ACCOUNTANTS ON ACCOUNTING AND FINANCIAL DISCLOSURE
Not applicable.
43
Item 9A. CONTROLS AND PROCEDURES.
Evaluation of Disclosure Controls and Procedures
Disclosure controls and procedures are designed only to provide "reasonable assurance" that the controls and procedures will meet their objectives. A control system, no matter how well designed and operated, can provide only reasonable, not absolute, assurance that the objectives of the control system are met. Further, the design of a control system must reflect the fact that there are resource constraints, and the benefits of controls must be considered relative to their costs. Because of the inherent limitations in all control systems, no evaluation of controls can provide absolute assurance that all control issues and instances of fraud, if any, within our company have been detected.
Management, including our Chief Executive Officer and President and our Chief Operating Officer and Chief Financial Officer, evaluated the effectiveness of our disclosure controls and procedures as defined in Rule 13a-15(e) of the Securities Exchange Act of 1934, as amended (the "Exchange Act"), as of
February 2, 2019
. Based on that evaluation, our Chief Executive Officer and President and our Chief Operating Officer and Chief Financial Officer concluded that our disclosure controls and procedures were effective at the reasonable assurance level, as of
February 2, 2019
, to ensure that all information required to be disclosed in the reports that we file or submit under the Exchange Act is recorded, processed, summarized, and reported within the time periods specified in SEC rules and forms and is accumulated and communicated to our management, including our principal executive, principal accounting and principal financial officers, or persons performing similar functions, as appropriate to allow timely decisions regarding required disclosure.
Management's Report on Internal Control Over Financial Reporting
Our management is responsible for establishing and maintaining adequate internal control over financial reporting, as defined in Securities Exchange Act Rule 13a-15(f). Internal control over financial reporting is a process to provide reasonable assurance regarding the reliability of our financial reporting for external purposes in accordance with accounting principles generally accepted in the United States of America. Because of its inherent limitations, internal control over financial reporting is not intended to provide absolute assurance that a misstatement of our financial statements would be prevented or detected.
Under the supervision and with the participation of our management, including our Chief Executive Officer and President and our Chief Operating Officer and Chief Financial Officer, we conducted an evaluation of the design and effectiveness of our internal control over financial reporting based on the criteria set forth in Internal Control-Integrated Framework (2013) issued by the Committee of Sponsoring Organizations of the Treadway Commission (“COSO”). Based on our evaluation under the framework in Internal Control - Integrated Framework, our management concluded that our internal control over financial reporting was effective as of
February 2, 2019
. Our independent registered public accounting firm that audited the consolidated financial statements included in this annual report has issued an attestation report on our internal control over financial reporting, which is included herein.
Changes in Internal Control over Financial Reporting
There have been no changes in our internal control over financial reporting that occurred during our most recently completed fiscal quarter to which this report relates that have materially affected, or are reasonably likely to materially affect, our internal control over financial reporting.
44
Report of Independent Registered Public Accounting Firm
To the Stockholders and Board of Directors of
The Children's Place, Inc.
Secaucus, New Jersey:
Opinion on Internal Control Over Financial Reporting
We have audited The Children’s Place, Inc. and subsidiaries’ internal control over financial reporting as of February 2, 2019, based on criteria established in Internal Control-Integrated Framework issued by the Committee of Sponsoring Organizations of the Treadway Commission (2013 framework) (the COSO criteria). In our opinion, The Children’s Place, Inc. and subsidiaries (the Company) maintained, in all material respects, effective internal control over financial reporting as of February 2, 2019, based on the COSO criteria.
We also have audited, in accordance with the standards of the Public Company Accounting Oversight Board (United States) (PCAOB), the consolidated balance sheet of the Company as of February 2, 2019, the related consolidated statements of operations, comprehensive income, stockholders’ equity and cash flows for the year then ended, and the related notes and our report dated March 21, 2019 expressed unqualified opinion thereon.
Basis for Opinion
The Company’s management is responsible for maintaining effective internal control over financial reporting and for its assessment of the effectiveness of internal control over financial reporting included in the accompanying Management’s Report on Internal Control Over Financial Reporting. Our responsibility is to express an opinion on the Company’s internal control over financial reporting based on our audit. We are a public accounting firm registered with the PCAOB and are required to be independent with respect to the Company in accordance with the U.S. federal securities laws and the applicable rules and regulations of the Securities and Exchange Commission and the PCAOB.
We conducted our audit in accordance with the standards of the PCAOB. Those standards require that we plan and perform the audit to obtain reasonable assurance about whether effective internal control over financial reporting was maintained in all material respects.
Our audit included obtaining an understanding of internal control over financial reporting, assessing the risk that a material weakness exists, testing and evaluating the design and operating effectiveness of internal control based on the assessed risk, and performing such other procedures as we considered necessary in the circumstances. We believe that our audit provides a reasonable basis for our opinion.
Definition and Limitations of Internal Control Over Financial Reporting
A company’s internal control over financial reporting is a process designed to provide reasonable assurance regarding the reliability of financial reporting and the preparation of financial statements for external purposes in accordance with generally accepted accounting principles. A company’s internal control over financial reporting includes those policies and procedures that (1) pertain to the maintenance of records that, in reasonable detail, accurately and fairly reflect the transactions and dispositions of the assets of the company; (2) provide reasonable assurance that transactions are recorded as necessary to permit preparation of financial statements in accordance with generally accepted accounting principles, and that receipts and expenditures of the company are being made only in accordance with authorizations of management and directors of the company; and (3) provide reasonable assurance regarding prevention or timely detection of unauthorized acquisition, use, or disposition of the company’s assets that could have a material effect on the financial statements.
Because of its inherent limitations, internal control over financial reporting may not prevent or detect misstatements. Also, projections of any evaluation of effectiveness to future periods are subject to the risk that controls may become inadequate because of changes in conditions, or that the degree of compliance with the policies or procedures may deteriorate.
/S/ Ernst & Young LLP
Iselin, New Jersey
March 21, 2019
45
ITEM 9B.-OTHER INFORMATION
None.
PART III
ITEM 10.
DIRECTORS, EXECUTIVE OFFICERS AND CORPORATE GOVERNANCE
The information required to be included by Item 10 of Form 10-K will be set forth in the Company's proxy statement for its 2019 annual meeting of stockholders to be filed within 120 days after
February 2, 2019
(the “Proxy Statement”) and is incorporated by reference herein.
ITEM 11.
EXECUTIVE COMPENSATION
The information required to be included by Item 11 of Form 10-K will be set forth in the Proxy Statement and is incorporated by reference herein.
ITEM 12.
SECURITY OWNERSHIP OF CERTAIN BENEFICIAL OWNERS AND MANAGEMENT AND RELATED STOCKHOLDER MATTERS
The information required to be included by Item 12 of Form 10-K will be set forth in the Proxy Statement and is incorporated by reference herein.
ITEM 13.
CERTAIN RELATIONSHIPS AND RELATED TRANSACTIONS, AND DIRECTOR INDEPENDENCE
The information required to be included by Item 13 of Form 10-K will be set forth in the Proxy Statement and is incorporated by reference herein.
ITEM 14.
PRINCIPAL ACCOUNTANT FEES AND SERVICES
The information required to be included by Item 14 of Form 10-K will be set forth in the Proxy Statement and is incorporated by reference herein.
46
PART IV
ITEM 15.-EXHIBITS AND FINANCIAL STATEMENT SCHEDULES
(a)(1) Financial Statements
The following documents are filed as part of this report:
47
Report of Independent Registered Public Accounting Firm
To the Stockholders and Board of Directors of
The Children's Place, Inc.
Secaucus, New Jersey:
Opinion on the Financial Statements
We have audited the accompanying consolidated balance sheet of The Children’s Place, Inc. and subsidiaries
(the “Company”) as of February 2, 2019, the related consolidated statement of operations, comprehensive income, stockholders' equity, and cash flows for the year then ended, and the related notes (collectively referred to as the “consolidated financial statements”). In our opinion, the consolidated financial statements present fairly, in all material respects, the financial position of the Company at February 2, 2019, and the results of its operations and its cash flows for the year then ended, in conformity with U.S. generally accepted accounting principles.
We also have audited, in accordance with the standards of the Public Company Accounting Oversight Board (United States) (PCAOB), the Company's internal control over financial reporting as of February 2, 2019, based on criteria established in Internal Control-Integrated Framework issued by the Committee of Sponsoring Organizations of the Treadway Commission (2013 framework),
and our report dated March 21, 2019, expressed an unqualified opinion thereon.
Basis for Opinion
These financial statements are the responsibility of the Company's management. Our responsibility is to express an opinion on the Company’s financial statements based on our audit. We are a public accounting firm registered with the PCAOB and are required to be independent with respect to the Company in accordance with the U.S. federal securities laws and the applicable rules and regulations of the Securities and Exchange Commission and the PCAOB.
We conducted our audit in accordance with the standards of the PCAOB. Those standards require that we plan and perform the audit to obtain reasonable assurance about whether the financial statements are free of material misstatement, whether due to error or fraud. Our audit included performing procedures to assess the risks of material misstatement of the financial statements, whether due to error or fraud, and performing procedures that respond to those risks. Such procedures included examining, on a test basis, evidence regarding the amounts and disclosures in the financial statements. Our audit also included evaluating the accounting principles used and significant estimates made by management, as well as evaluating the overall presentation of the financial statements. We believe that our audit provide a reasonable basis for our opinion.
/S/ Ernst & Young LLP
We have served as the Company’s auditor since 2018.
Iselin, New Jersey
March 21, 2019
48
Report of Independent Registered Public Accounting Firm
To the Stockholders and Board of Directors of
The Children’s Place, Inc.
Secaucus, New Jersey
Opinion on the Consolidated Financial Statements
We have audited the accompanying consolidated balance sheet of The Children’s Place, Inc. and subsidiaries (the “Company”) and subsidiaries as of February 3, 2018, the related consolidated statements of operations and comprehensive income, changes in stockholders’ equity, and cash flows for each of the two years in the period ended February 3, 2018, and the related notes and financial statement schedule (collectively referred to as the “consolidated financial statements”). In our opinion, the consolidated financial statements present fairly, in all material respects, the financial position of the Company and subsidiaries at February 3, 2018, and the results of their operations and their cash flows for each of the two years in the period ended February 3 2018
,
in conformity with accounting principles generally accepted in the United States of America.
Basis for Opinion
These consolidated financial statements are the responsibility of the Company’s management. Our responsibility is to express an opinion on the Company’s consolidated financial statements based on our audits. We are a public accounting firm registered with the Public Company Accounting Oversight Board (United States) (“PCAOB”) and are required to be independent with respect to the Company in accordance with the U.S. federal securities laws and the applicable rules and regulations of the Securities and Exchange Commission and the PCAOB.
We conducted our audits in accordance with the standards of the PCAOB and in accordance with auditing standards generally accepted in the United States of America. Those standards require that we plan and perform the audit to obtain reasonable assurance about whether the consolidated financial statements are free of material misstatement, whether due to error or fraud. Our audits included performing procedures to assess the risks of material misstatement of the consolidated financial statements, whether due to error or fraud, and performing procedures that respond to those risks. Such procedures included examining, on a test basis, evidence regarding the amounts and disclosures in the consolidated financial statements. Our audits also included evaluating the accounting principles used and significant estimates made by management, as well as evaluating the overall presentation of the consolidated financial statements. We believe that our audits provide a reasonable basis for our opinion.
/S/ BDO USA, LLP
New York, New York
March 22, 2018
49
THE CHILDREN’S PLACE, INC. AND SUBSIDIARIES
CONSOLIDATED BALANCE SHEETS
|
February 2,
2019 |
February 3,
2018 |
||||||
|
(In thousands, except par value)
|
|||||||
|
ASSETS
|
|
|
|
|
|||
|
Current assets:
|
|
|
|
|
|||
|
Cash and cash equivalents
|
$
|
69,136
|
|
$
|
244,519
|
|
|
|
Short-term investments
|
—
|
|
15,000
|
|
|||
|
Accounts receivable
|
35,123
|
|
26,094
|
|
|||
|
Inventories
|
303,466
|
|
324,435
|
|
|||
|
Prepaid expenses and other current assets
|
27,670
|
|
46,456
|
|
|||
|
Total current assets
|
435,395
|
|
656,504
|
|
|||
|
Long-term assets:
|
|
|
|||||
|
Property and equipment, net
|
260,357
|
|
258,537
|
|
|||
|
Deferred income taxes
|
17,750
|
|
12,698
|
|
|||
|
Other assets
|
13,544
|
|
12,489
|
|
|||
|
Total assets
|
$
|
727,046
|
|
$
|
940,228
|
|
|
|
LIABILITIES AND STOCKHOLDERS’ EQUITY
|
|
|
|||||
|
LIABILITIES:
|
|
|
|||||
|
Current liabilities:
|
|
|
|||||
|
Revolving loan
|
$
|
48,861
|
|
$
|
21,460
|
|
|
|
Accounts payable
|
194,786
|
|
210,300
|
|
|||
|
Income taxes payable
|
997
|
|
6,911
|
|
|||
|
Accrued expenses and other current liabilities
|
86,755
|
|
121,853
|
|
|||
|
Total current liabilities
|
331,399
|
|
360,524
|
|
|||
|
Long-term liabilities:
|
|
|
|||||
|
Deferred rent liabilities
|
44,329
|
|
52,425
|
|
|||
|
Other tax liabilities
|
5,080
|
|
4,030
|
|
|||
|
Income taxes payable
|
18,939
|
|
34,598
|
|
|||
|
Other long-term liabilities
|
12,862
|
|
14,952
|
|
|||
|
Total liabilities
|
412,609
|
|
466,529
|
|
|||
|
COMMITMENTS AND CONTINGENCIES (SEE NOTE 9)
|
|
|
|||||
|
STOCKHOLDERS’ EQUITY:
|
|
|
|||||
|
Preferred stock, $1.00 par value, 1,000 shares authorized, 0 shares issued and outstanding
|
—
|
|
—
|
|
|||
|
Common stock, $0.10 par value, 100,000 shares authorized; 15,873 and 17,257 issued; 15,827 and 17,211 outstanding (shares in thousands)
|
1,588
|
|
1,726
|
|
|||
|
Additional paid-in capital
|
146,991
|
|
258,501
|
|
|||
|
Treasury stock, at cost (47 and 46 shares, in thousands)
|
(2,685
|
)
|
(2,436
|
)
|
|||
|
Deferred compensation
|
2,685
|
|
2,436
|
|
|||
|
Accumulated other comprehensive loss
|
(14,934
|
)
|
(12,831
|
)
|
|||
|
Retained earnings
|
180,792
|
|
226,303
|
|
|||
|
Total stockholders’ equity
|
314,437
|
|
473,699
|
|
|||
|
Total liabilities and stockholders’ equity
|
$
|
727,046
|
|
$
|
940,228
|
|
|
See accompanying notes to these consolidated financial statements.
50
THE CHILDREN’S PLACE, INC. AND SUBSIDIARIES
CONSOLIDATED STATEMENTS OF OPERATIONS
|
|
Fiscal Year Ended
|
||||||||||
|
|
February 2,
2019 |
February 3,
2018 |
January 28,
2017 |
||||||||
|
(In thousands, except earnings per share)
|
|||||||||||
|
Net sales
|
$
|
1,938,084
|
|
$
|
1,870,275
|
|
$
|
1,785,316
|
|
||
|
Cost of sales (exclusive of depreciation and amortization)
|
1,254,488
|
|
1,158,920
|
|
1,113,723
|
|
|||||
|
Gross profit
|
683,596
|
|
711,355
|
|
671,593
|
|
|||||
|
Selling, general, and administrative expenses
|
498,343
|
|
476,486
|
|
454,143
|
|
|||||
|
Depreciation and amortization
|
68,884
|
|
68,159
|
|
65,734
|
|
|||||
|
Asset impairment charges
|
6,096
|
|
5,190
|
|
4,026
|
|
|||||
|
Other (income) costs
|
(1,055
|
)
|
10
|
|
282
|
|
|||||
|
Operating income
|
111,328
|
|
161,510
|
|
147,408
|
|
|||||
|
Interest expense
|
(3,534
|
)
|
(2,222
|
)
|
(1,953
|
)
|
|||||
|
Interest income
|
730
|
|
1,915
|
|
1,558
|
|
|||||
|
Income before provision for income taxes
|
108,524
|
|
161,203
|
|
147,013
|
|
|||||
|
Provision for income taxes
|
7,564
|
|
76,505
|
|
44,677
|
|
|||||
|
Net income
|
$
|
100,960
|
|
$
|
84,698
|
|
$
|
102,336
|
|
||
|
Earnings per common share
|
|
|
|
|
|||||||
|
Basic
|
$
|
6.10
|
|
$
|
4.82
|
|
$
|
5.51
|
|
||
|
Diluted
|
$
|
6.01
|
|
$
|
4.67
|
|
$
|
5.40
|
|
||
|
Weighted average common shares outstanding
|
|||||||||||
|
Basic
|
16,542
|
|
17,569
|
|
18,584
|
|
|||||
|
Diluted
|
16,805
|
|
18,151
|
|
18,959
|
|
|||||
See accompanying notes to these consolidated financial statements.
51
THE CHILDREN’S PLACE, INC. AND SUBSIDIARIES
CONSOLIDATED STATEMENTS OF COMPREHENSIVE INCOME
|
|
Fiscal Year Ended
|
||||||||||
|
|
February 2,
2019 |
February 3,
2018 |
January 28,
2017 |
||||||||
|
(In thousands)
|
|||||||||||
|
Net income
|
$
|
100,960
|
|
$
|
84,698
|
|
$
|
102,336
|
|
||
|
Other comprehensive income:
|
|||||||||||
|
Foreign currency translation adjustment
|
(2,178
|
)
|
7,350
|
|
6,161
|
|
|||||
|
Change in fair value of cash flow hedges, net of income taxes
|
75
|
|
160
|
|
983
|
|
|||||
|
Total comprehensive income
|
$
|
98,857
|
|
$
|
92,208
|
|
$
|
109,480
|
|
||
See accompanying notes to these consolidated financial statements.
52
THE CHILDREN’S PLACE, INC. AND SUBSIDIARIES
CONSOLIDATED STATEMENTS OF CHANGES IN STOCKHOLDERS' EQUITY
|
Accumulated
|
||||||||||||||||||||||||||||||||||
|
Additional
|
Other
|
Total
|
||||||||||||||||||||||||||||||||
|
Common Stock
|
Paid-In
|
Deferred
|
Retained
|
Comprehensive
|
Treasury Stock
|
Stockholders'
|
||||||||||||||||||||||||||||
|
(in thousands, except dividends per share)
|
Shares
|
Amount
|
Capital
|
Compensation
|
Earnings
|
Income
|
Shares
|
Value
|
Equity
|
|||||||||||||||||||||||||
|
BALANCE, January 30, 2016
|
19,479
|
|
|
$1,948
|
|
|
$232,182
|
|
|
$1,939
|
|
|
$321,148
|
|
|
($27,485
|
)
|
(39
|
)
|
|
($1,939
|
)
|
|
$527,793
|
|
|||||||||
|
Exercise of stock options
|
15
|
|
2
|
|
436
|
|
438
|
|
||||||||||||||||||||||||||
|
Excess tax benefits from stock-based compensation
|
1,728
|
|
1,728
|
|
||||||||||||||||||||||||||||||
|
Vesting of stock awards
|
217
|
|
22
|
|
(22
|
)
|
—
|
|
||||||||||||||||||||||||||
|
Stock-based compensation
|
28,040
|
|
28,040
|
|
||||||||||||||||||||||||||||||
|
Capitalized stock-based compensation
|
1,402
|
|
1,402
|
|
||||||||||||||||||||||||||||||
|
Purchase and retirement of shares
|
(1,947
|
)
|
(196
|
)
|
(24,622
|
)
|
(132,991
|
)
|
(157,809
|
)
|
||||||||||||||||||||||||
|
Dividends declared ($0.80 per share)
|
(14,785
|
)
|
(14,785
|
)
|
||||||||||||||||||||||||||||||
|
Unvested dividends
|
796
|
|
(796
|
)
|
—
|
|
||||||||||||||||||||||||||||
|
Change in cumulative translation
adjustment
|
6,161
|
|
6,161
|
|
||||||||||||||||||||||||||||||
|
Change in fair value of cash flow hedges, net of income taxes
|
983
|
|
983
|
|
||||||||||||||||||||||||||||||
|
Deferral of common stock into
deferred compensation plan
|
249
|
|
(3
|
)
|
(249
|
)
|
—
|
|
||||||||||||||||||||||||||
|
Net income
|
102,336
|
|
102,336
|
|
||||||||||||||||||||||||||||||
|
BALANCE, January 28, 2017
|
17,764
|
|
$
|
1,776
|
|
$
|
239,940
|
|
$
|
2,188
|
|
$
|
274,912
|
|
$
|
(20,341
|
)
|
(42
|
)
|
|
($2,188
|
)
|
$
|
496,287
|
|
|||||||||
|
Exercise of stock options
|
504
|
|
51
|
|
(51
|
)
|
—
|
|
||||||||||||||||||||||||||
|
Excess tax benefits from stock-based compensation
|
—
|
|
—
|
|
||||||||||||||||||||||||||||||
|
Vesting of stock awards
|
|
|
|
—
|
|
—
|
|
|||||||||||||||||||||||||||
|
Stock-based compensation
|
30,797
|
|
30,797
|
|
||||||||||||||||||||||||||||||
|
Capitalized stock-based compensation
|
1,087
|
|
1,087
|
|
||||||||||||||||||||||||||||||
|
Purchase and retirement of shares
|
(1,011
|
)
|
(101
|
)
|
(14,822
|
)
|
(103,656
|
)
|
(118,579
|
)
|
||||||||||||||||||||||||
|
Dividends declared ($1.60 per share)
|
(28,101
|
)
|
(28,101
|
)
|
||||||||||||||||||||||||||||||
|
Unvested dividends
|
1,550
|
|
(1,550
|
)
|
—
|
|
||||||||||||||||||||||||||||
|
Change in cumulative translation
adjustment
|
7,350
|
|
7,350
|
|
||||||||||||||||||||||||||||||
|
Change in fair value of cash flow hedges, net of income taxes
|
160
|
|
160
|
|
||||||||||||||||||||||||||||||
|
Deferral of common stock into
deferred compensation plan
|
248
|
|
(4
|
)
|
(248
|
)
|
—
|
|
||||||||||||||||||||||||||
|
Net income
|
84,698
|
|
84,698
|
|
||||||||||||||||||||||||||||||
|
BALANCE, February 3, 2018
|
17,257
|
|
$
|
1,726
|
|
$
|
258,501
|
|
$
|
2,436
|
|
$
|
226,303
|
|
$
|
(12,831
|
)
|
(46
|
)
|
|
($2,436
|
)
|
$
|
473,699
|
|
|||||||||
|
Vesting of stock awards
|
711
|
|
71
|
|
(71
|
)
|
—
|
|
||||||||||||||||||||||||||
|
Stock-based compensation
|
27,415
|
|
27,415
|
|
||||||||||||||||||||||||||||||
|
Capitalized stock-based compensation
|
176
|
|
176
|
|
||||||||||||||||||||||||||||||
|
Purchase and retirement of shares
|
(2,095
|
)
|
(209
|
)
|
(140,343
|
)
|
(112,991
|
)
|
(253,543
|
)
|
||||||||||||||||||||||||
|
Dividends declared ($2.00 per share)
|
(33,042
|
)
|
(33,042
|
)
|
||||||||||||||||||||||||||||||
|
Unvested dividends
|
1,313
|
|
(1,313
|
)
|
—
|
|
||||||||||||||||||||||||||||
|
ASC Topic 606 Adjustment
|
875
|
|
875
|
|
||||||||||||||||||||||||||||||
|
Change in cumulative translation
adjustment
|
(2,178
|
)
|
(2,178
|
)
|
||||||||||||||||||||||||||||||
|
Change in fair value of cash flow hedges, net of income taxes
|
75
|
|
75
|
|
||||||||||||||||||||||||||||||
|
Deferral of common stock into
deferred compensation plan
|
249
|
|
(1
|
)
|
(249
|
)
|
—
|
|
||||||||||||||||||||||||||
|
Net income
|
100,960
|
|
100,960
|
|
||||||||||||||||||||||||||||||
|
BALANCE, February 2, 2019
|
15,873
|
|
$
|
1,588
|
|
$
|
146,991
|
|
$
|
2,685
|
|
$
|
180,792
|
|
$
|
(14,934
|
)
|
(47
|
)
|
|
($2,685
|
)
|
$
|
314,437
|
|
|||||||||
See accompanying notes to these consolidated financial statements.
53
THE CHILDREN’S PLACE, INC. AND SUBSIDIARIES
CONSOLIDATED STATEMENTS OF CASH FLOWS
|
|
Fiscal Year Ended
|
||||||||||
|
|
February 2,
2019 |
February 3,
2018 |
January 28,
2017 |
||||||||
|
(In thousands)
|
|||||||||||
|
CASH FLOWS FROM OPERATING ACTIVITIES:
|
|
|
|
|
|||||||
|
Net income
|
$
|
100,960
|
|
$
|
84,698
|
|
$
|
102,336
|
|
||
|
Reconciliation of net income to net cash provided by operating activities:
|
|
|
|||||||||
|
Depreciation and amortization
|
68,884
|
|
68,159
|
|
65,734
|
|
|||||
|
Non-cash stock-based compensation
|
27,415
|
|
30,797
|
|
28,040
|
|
|||||
|
Excess tax benefits from stock-based compensation
|
—
|
|
—
|
|
(1,728
|
)
|
|||||
|
Asset impairment charges
|
6,096
|
|
5,190
|
|
4,026
|
|
|||||
|
Deferred income tax (benefit)
|
(5,568
|
)
|
34,894
|
|
(9,379
|
)
|
|||||
|
Other non-cash charges, net
|
699
|
|
169
|
|
819
|
|
|||||
|
Changes in operating assets and liabilities:
|
|
|
|||||||||
|
Inventories
|
19,380
|
|
(36,434
|
)
|
(16,072
|
)
|
|||||
|
Accounts receivable
|
(9,127
|
)
|
5,386
|
|
(5,056
|
)
|
|||||
|
Prepaid expenses and other assets
|
3,568
|
|
(318
|
)
|
(2,505
|
)
|
|||||
|
Income taxes payable, net of prepayments
|
(7,689
|
)
|
6,865
|
|
25,109
|
|
|||||
|
Accounts payable and other current liabilities
|
(56,893
|
)
|
28,930
|
|
18,989
|
|
|||||
|
Deferred rent and other liabilities
|
(7,811
|
)
|
(13,953
|
)
|
(11,021
|
)
|
|||||
|
Net cash provided by operating activities
|
139,914
|
|
214,383
|
|
199,292
|
|
|||||
|
CASH FLOWS FROM INVESTING ACTIVITIES:
|
|
|
|
|
|
|
|||||
|
Capital expenditures
|
(71,114
|
)
|
(58,657
|
)
|
(34,684
|
)
|
|||||
|
Purchase of short-term investments
|
—
|
|
(15,000
|
)
|
(49,300
|
)
|
|||||
|
Redemption of short-term investments
|
15,000
|
|
49,300
|
|
40,100
|
|
|||||
|
Change in deferred compensation plan
|
(749
|
)
|
(788
|
)
|
(368
|
)
|
|||||
|
Net cash used in investing activities
|
(56,863
|
)
|
(25,145
|
)
|
(44,252
|
)
|
|||||
|
CASH FLOWS FROM FINANCING ACTIVITIES:
|
|
|
|
|
|
|
|||||
|
Borrowings under revolving credit facility
|
861,806
|
|
578,186
|
|
553,415
|
|
|||||
|
Repayments under revolving credit facility
|
(834,404
|
)
|
(572,106
|
)
|
(538,035
|
)
|
|||||
|
Purchase and retirement of common stock, including shares surrendered for tax withholdings and transaction costs
|
(253,543
|
)
|
(118,579
|
)
|
(157,809
|
)
|
|||||
|
Payment of dividends
|
(33,042
|
)
|
(28,101
|
)
|
(14,785
|
)
|
|||||
|
Proceeds from exercise of stock options
|
—
|
|
—
|
|
438
|
|
|||||
|
Excess tax benefits from stock-based compensation
|
—
|
|
—
|
|
1,728
|
|
|||||
|
Net cash used in financing activities
|
(259,183
|
)
|
(140,600
|
)
|
(155,048
|
)
|
|||||
|
Effect of exchange rate changes on cash and cash equivalents
|
749
|
|
2,172
|
|
6,183
|
|
|||||
|
Net increase (decrease) in cash and cash equivalents
|
(175,383
|
)
|
50,810
|
|
6,175
|
|
|||||
|
Cash and cash equivalents, beginning of period
|
244,519
|
|
193,709
|
|
187,534
|
|
|||||
|
Cash and cash equivalents, end of period
|
$
|
69,136
|
|
$
|
244,519
|
|
$
|
193,709
|
|
||
See accompanying notes to these consolidated financial statements.
54
THE CHILDREN’S PLACE, INC. AND SUBSIDIARIES
CONSOLIDATED STATEMENTS OF CASH FLOWS
|
|
Fiscal Year Ended
|
||||||||||
|
|
February 2,
2019 |
February 3,
2018 |
January 28,
2017 |
||||||||
|
(In thousands)
|
|||||||||||
|
OTHER CASH FLOW INFORMATION:
|
|
|
|
|
|||||||
|
Net cash paid during the year for income taxes
|
$
|
19,529
|
|
$
|
37,767
|
|
$
|
31,492
|
|
||
|
Cash paid during the year for interest
|
3,224
|
|
1,949
|
|
1,680
|
|
|||||
|
Increase in accrued capital expenditures
|
3,398
|
|
457
|
|
3,315
|
|
|||||
See accompanying notes to these consolidated financial statements.
55
THE CHILDREN’S PLACE, INC. AND SUBSIDIARIES
NOTES TO CONSOLIDATED FINANCIAL STATEMENTS
|
1.
|
BASIS OF PRESENTATION AND SUMMARY OF SIGNIFICANT ACCOUNTING POLICIES
|
Description of Business
The Children's Place, Inc. and subsidiaries (the “Company”) is the largest pure-play children's specialty apparel retailer in North America. The Company provides apparel, footwear, accessories, and other items for children. The Company designs, contracts to manufacture, sells at retail and wholesale, and licenses to sell trend right, high-quality merchandise at value prices, the substantial majority of which is under our proprietary “The Children's Place”, "Place", and "Baby Place" brand names.
The Company classifies its business into two segments: The Children’s Place U.S. and The Children’s Place International. Included in The Children’s Place U.S. segment are the Company's U.S. and Puerto Rico based stores and revenue from its U.S.-based-wholesale business. Included in The Children's Place International segment are its Canadian-based stores, revenue from the Company's Canada wholesale business, as well as revenue from international franchisees. Each segment includes an e-commerce business located at
www.childrensplace.com.
Certain reclassifications have been made to prior period financial statements to conform to the current period presentation.
Terms that are commonly used in the Company's notes to consolidated financial statements are defined as follows:
|
•
|
Fiscal 2018 - The fifty-two weeks ended February 2, 2019
|
|
•
|
Fiscal 2017 - The fifty-three weeks ended February 3, 2018
|
|
•
|
Fiscal 2016 - The fifty-two weeks ended January 28, 2017
|
|
•
|
Fiscal 2019 - The Company's next fiscal year representing the fifty-two weeks ending February 1, 2020
|
|
•
|
SEC- The U.S. Securities and Exchange Commission
|
|
•
|
GAAP - Generally Accepted Accounting Principles
|
|
•
|
FASB- Financial Accounting Standards Board
|
|
•
|
FASB ASC - FASB Accounting Standards Codification, which serves as the source for authoritative U.S. GAAP, except that rules and interpretive releases by the SEC are also sources of authoritative U.S. GAAP for SEC registrants
|
Fiscal Year
The Company's fiscal year is a 52-week or 53-week period ending on the Saturday on or nearest to January 31. Fiscal 2018 was a 52-week year, Fiscal 2017 was a 53-week year, and Fiscal 2016 was a 52-week year.
Use of Estimates
The preparation of financial statements in conformity with U.S. GAAP requires management to make estimates and assumptions that affect the reported amounts of assets and liabilities, disclosure of contingent assets and liabilities at the date of the financial statements, and amounts of revenues and expenses reported during the period. Actual results could differ from the assumptions used and estimates made by management, which could have a material impact on the Company's financial position or results of operations. Significant estimates inherent in the preparation of the consolidated financial statements include reserves for the realizability of inventory; reserves for litigation and other contingencies; useful lives and impairments of long-lived assets; fair value measurements; accounting for income taxes and related uncertain tax positions; insurance reserves; valuation of stock-based compensation awards and related estimated forfeiture rates, among others.
Consolidation
The consolidated financial statements include the accounts of the Company and its wholly‑owned subsidiaries. Intercompany balances and transactions have been eliminated. As of
February 2, 2019
and
February 3, 2018
, the Company did not have any investments in unconsolidated affiliates. FASB ASC 810--
Consolidation
is considered when determining whether an entity is subject to consolidation.
Cash and Cash Equivalents
The Company considers all highly liquid investments with an original maturity of three months or less to be cash equivalents.
56
THE CHILDREN’S PLACE, INC. AND SUBSIDIARIES
NOTES TO CONSOLIDATED FINANCIAL STATEMENTS (Continued)
Short-term Investments
Short-term investments consist of investments which the Company expects to convert into cash within one year, including time deposits, which have original maturities greater than 90 days. The Company classifies its investments in securities at the time of purchase as held-to-maturity and reevaluates such classifications on a quarterly basis. Held-to-maturity investments consist of securities that the Company has the intent and ability to retain until maturity. These securities are recorded at cost and adjusted for the amortization of premiums and discounts, which approximates fair value. Cash inflows and outflows related to the sale and purchase of investments are classified as investing activities in the Company's consolidated statements of cash flows. All of the Company's short-term investments are U.S. dollar denominated time deposits with banking institutions in Hong Kong that have six month maturity dates from inception.
Revenue Recognition
The Company adopted Accounting Standards Update No. 2014-09 "Revenue from Contracts with Customers” ("Topic 606") as of the beginning of Fiscal 2018 using the modified retrospective transition method.
See Note 2 "Revenues" for further details on the Company's adoption of Topic 606.
Inventories
Inventories, which consist primarily of finished goods, are stated at the lower of cost or net realizable value, with cost determined on an average cost basis. The Company capitalizes certain buying, design, and supply chain costs in inventory and these costs are reflected within cost of sales as the inventories are sold. Inventory shrinkage is estimated in interim periods based upon the historical results of physical inventory counts in the context of current year facts and circumstances.
Cost of Sales (exclusive of depreciation and amortization)
In addition to the cost of inventory sold, the Company includes certain buying, design and distribution expenses, shipping and handling costs on merchandise sold directly to customers, and letter of credit fees in its cost of sales. The Company records all occupancy costs in its cost of sales, except administrative office buildings, which are recorded in selling, general, and administrative expenses. All depreciation is reported on a separate line on the Company's consolidated statements of operations.
Stock-based Compensation
The Company's stock-based compensation plans are administered by the Compensation Committee of the Board of Directors (the “Board”). The Compensation Committee is comprised of independent members of the Board. Effective May 20, 2011, the shareholders approved the 2011 Equity Incentive Plan (the "Equity Plan"). The Equity Plan allows the Compensation Committee to grant multiple forms of stock-based compensation such as stock options, stock appreciation rights, restricted stock awards, deferred stock awards, and performance stock awards.
The Company accounts for its stock-based compensation in accordance with the provisions of FASB ASC 718--
Compensation—Stock Compensation
. These provisions require, among other things: (a) the fair value at grant date of all stock awards be expensed over their respective vesting periods; (b) the amount of cumulative compensation cost recognized at any date must at least be equal to the portion of the grant-date value of the award that is vested at that date and (c) that compensation expense include a forfeiture estimate for those shares not expected to vest. Also, in accordance with these provisions, for those awards with multiple vest dates, the Company recognizes compensation cost on a straight-line basis over the requisite service period for the entire award. The cumulative expense for performance-based awards reflects changes in estimated adjusted earnings per share, adjusted operating margin expansion, and adjusted return on invested capital as they occur.
Earnings per Common Share
The Company reports its earnings per share in accordance with FASB ASC 260--
Earnings Per Share
, which requires the presentation of both basic and diluted earnings per share on the statements of operations. The diluted weighted average common shares include adjustments for the potential effects of outstanding stock options, Deferred Awards, and Performance Awards (as both terms are used in Note 4 to these consolidated financial statements), but only in the periods in which such effect is dilutive under the treasury stock method. Included in our basic and diluted weighted average common shares are those shares due to participants in the deferred compensation plan, which are held in treasury stock. Anti-dilutive stock awards are
57
THE CHILDREN’S PLACE, INC. AND SUBSIDIARIES
NOTES TO CONSOLIDATED FINANCIAL STATEMENTS (Continued)
comprised of stock options and unvested deferred, restricted and performance shares which would have been anti-dilutive in the application of the treasury stock method in accordance with FASB ASC 260--
Earnings Per Share
.
In accordance with this topic, the following table reconciles income and share amounts utilized to calculate basic and diluted net income per common share:
|
|
Fiscal Year Ended
|
|||||||
|
|
February 2,
2019 |
February 3,
2018 |
January 28,
2017 |
|||||
|
(In thousands)
|
||||||||
|
Basic weighted average common shares
|
16,542
|
|
17,569
|
|
18,584
|
|
||
|
Dilutive effect of stock awards
|
263
|
|
582
|
|
375
|
|
||
|
Diluted weighted average common shares
|
16,805
|
|
18,151
|
|
18,959
|
|
||
Accounts Receivable
Accounts receivable consists of credit and debit card receivables, franchisee and wholesale receivables, landlord construction allowance receivables, and other miscellaneous items. Credit and debit card receivables represent credit and debit card sales, inclusive of private label card sales, for which the respective third party service company has yet to remit the cash. The unremitted balance approximates the last few days of related sales for each reporting period. Bad debt associated with these sales is not material. Franchisee and wholesale receivables represent product sales and sale royalties in which cash has not yet been remitted from our partners. Bad debt associated with these sales is not material. Landlord construction allowance receivables represent landlord contributions to our construction costs of building out the related real estate, primarily new and remodeled stores. Total construction costs are capitalized as property and equipment and the landlord construction allowances are recorded as a lease incentive, a component of deferred rent, which is amortized as a reduction of rent expense over the lease term.
Insurance and Self-Insurance Reserves
The Company self-insures and purchases insurance policies to provide for workers' compensation, general liability and property losses, cyber-security coverage, as well as director and officer's liability, vehicle liability, and employee medical benefits. The Company estimates risks and records a liability based on historical claim experience, insurance deductibles, severity factors, and other actuarial assumptions. The Company records the current portions of employee medical benefits, workers compensation, and general liability reserves within accrued expenses and other current liabilities.
Property and Equipment, Net
Property and equipment are stated at cost. Leasehold improvements are depreciated on a straight-line basis over the shorter of the life of the lease or the estimated useful life of the asset. All other property and equipment is depreciated on a straight-line basis based upon their estimated useful lives, with furniture and fixtures and equipment generally ranging from 3-10 years and buildings and improvements generally ranging from 20-25 years. Repairs and maintenance are expensed as incurred.
The Company accounts for internally developed software intended for internal use in accordance with provisions of FASB ASC 350--
Intangibles-Goodwill and Other
. The Company capitalizes development-stage costs such as direct external costs and direct payroll related costs. When development is substantially complete, the Company amortizes the cost of the software on a straight-line basis over the expected life of the software, which is generally 3-10 years. Preliminary project costs and post-implementation costs such as training, maintenance, and support are expensed as incurred.
Impairment of Long-Lived Assets
The Company periodically reviews its long-lived assets when events indicate that their carrying value may not be recoverable. Such events include a historical trend or projected trend of cash flow losses or a future expectation that the Company will sell or dispose of an asset significantly before the end of its previously estimated useful life. In reviewing for impairment the Company groups its long-lived assets at the lowest possible level for which identifiable cash flows are largely independent of the cash flows of other assets and liabilities.
The Company reviews all stores that have reached comparable sales status, or sooner if circumstances should dictate, on at least an annual basis. The Company believes waiting this period of time allows a store to reach a maturity level where a more comprehensive analysis of financial performance can be performed. For each store that shows indications of impairment, the
58
THE CHILDREN’S PLACE, INC. AND SUBSIDIARIES
NOTES TO CONSOLIDATED FINANCIAL STATEMENTS (Continued)
Company projects future cash flows over the remaining life of the lease and compares the total undiscounted cash flows to the net book value of the related long-lived assets. If the undiscounted cash flows are less than the related net book value of the long-lived assets, they are written down to their fair market value. The Company primarily determines fair market value to be the discounted future cash flows associated with those assets. In evaluating future cash flows, the Company considers external and internal factors. External factors comprise the local environment in which the store resides, including mall traffic, competition, and their effect on sales trends. Internal factors include the Company's ability to gauge the fashion taste of its customers, control variable costs such as cost of sales and payroll, and in certain cases, its ability to renegotiate lease costs.
Deferred Financing Costs
The Company capitalizes costs directly associated with acquiring third party financing. Deferred financing costs are included in other assets and are amortized as interest expense over the term of the related indebtedness. At
February 2, 2019
, deferred financing costs, net of accumulated amortization of
$3.9 million
, were approximately
$0.4 million
. At
February 3, 2018
, deferred financing costs, net of accumulated amortization of
$3.6 million
, were approximately
$0.7 million
.
Treasury Stock
Treasury stock is recorded at acquisition cost. Gains and losses on disposition are recorded as increases or decreases to additional paid-in capital with losses in excess of previously recorded gains charged directly to retained earnings. When treasury shares are retired and returned to authorized but unissued status, the carrying value in excess of par is allocated to additional paid-in capital and retained earnings on a pro rata basis.
Advertising and Marketing Costs
The Company expenses the cost of advertising over the period the advertising is run or displayed. Included in selling, general, and administrative expenses for
Fiscal 2018
,
Fiscal 2017
, and
Fiscal 2016
are advertising and other marketing costs of approximately
$34.1 million
,
$29.9 million
, and
$26.4 million
, respectively. Deferred advertising, marketing, and promotional costs, which principally relate to advertisements that have not yet been exhibited or services that have not yet been received, were approximately
$1.4 million
and
$3.9 million
at
February 2, 2019
and
February 3, 2018
, respectively, and were recorded within prepaid expenses and other current assets in the Company's consolidated balance sheets.
Rent Expense and Deferred Rent
The Company leases certain facilities and equipment, including its retail stores. Certain of the Company's lease agreements contain renewal options, rent escalation clauses, and/or landlord incentives. Renewal terms generally reflect market rates at the time of renewal. Rent expense for non-cancellable operating leases with scheduled rent increases and/or landlord incentives is recognized on a straight-line basis over the lease term, including any applicable rent holidays, beginning on the earlier of the lease commencement date or the date the Company takes control of the leased space. The Company records rent expense and the impact of lease incentives for its stores and distribution centers as a component of cost of sales. The unamortized portion of deferred rent is included in deferred rent liabilities within long-term liabilities in the Company's consolidated balance sheets.
Income Taxes
We utilize the liability method of accounting for income taxes as set forth in FASB ASC 740--
Income Taxes
. Under the liability method, deferred taxes are determined based on the temporary differences between the financial statement and tax basis of assets and liabilities, as well as for net operating losses and tax credit carryforwards. Deferred tax assets and liabilities are measured using currently enacted tax rates that apply to taxable income in effect for the years in which the basis differences and tax assets are expected to be realized. A valuation allowance is recorded when it is more likely than not that any of the deferred tax assets will not be realized. In determining the need for valuation allowances we consider projected future taxable income and the availability of tax planning strategies. If in the future we determine that we would not be able to realize our recorded deferred tax assets, an increase in the valuation allowance would decrease earnings in the period in which such determination is made.
We assess our income tax positions and record tax benefits for all years subject to examination based upon our evaluation of the facts, circumstances, and information available at the reporting date. For those tax positions where it is more likely than not that a tax benefit will be sustained, we have recorded the largest amount of tax benefit with a greater than 50% likelihood of being realized upon ultimate settlement with a taxing authority that has full knowledge of all relevant information. For those income tax positions where it is not more likely than not that a tax benefit will be sustained, no tax benefit has been recognized in the financial statements.
59
THE CHILDREN’S PLACE, INC. AND SUBSIDIARIES
NOTES TO CONSOLIDATED FINANCIAL STATEMENTS (Continued)
Accumulated Other Comprehensive Income
Accumulated other comprehensive income primarily consists of cumulative translation adjustments as well as changes in the value of cash flow hedges, net of income taxes.
Foreign Currency Translation and Transactions
The Company has determined that the local currencies of its Canadian and Asian subsidiaries are their functional currencies. In accordance with FASB ASC 830--
Foreign Currency Matters
, the assets and liabilities denominated in foreign currency are translated into U.S. dollars at the current rate of exchange existing at period-end and revenues and expenses are translated at average monthly exchange rates. Related translation adjustments are reported as a separate component of stockholders' equity. The Company also transacts certain business in foreign denominated currencies primarily with its Canadian subsidiary purchasing inventory in U.S. Dollars, and there are inter-company charges between various subsidiaries.
Derivative Instruments
The Company is exposed to gains and losses resulting from fluctuations in foreign currency exchange rates attributable to inventory purchases denominated in a foreign currency. Specifically, its Canadian subsidiary’s functional currency is the Canadian dollar, but purchases inventory from suppliers in U.S. dollars. In order to mitigate the variability of cash flows associated with certain of these forecasted inventory purchases, the Company enters into foreign exchange forward contracts. These contracts typically mature within 12 months. The Company does not use forward contracts to engage in currency speculation, and we do not enter into derivative financial instruments for trading purposes.
For derivative instruments that are designated and qualify as cash flow hedges, the effective portion of the gain or loss on the derivative is reported as a component of other comprehensive income (“OCI”) and reclassified into earnings within cost of sales (exclusive of depreciation and amortization) in the same period or periods during which the hedged transaction affects earnings. Gains and losses on the derivative representing hedge ineffectiveness are recognized in earnings within selling, general, and administrative expenses, consistent with where the Company records realized and unrealized foreign currency gains and losses on transactions in foreign denominated currencies. All derivative instruments are presented at gross fair value on the consolidated balance sheets within either prepaid expenses and other current assets or accrued expenses and other current liabilities based on their position as of the balance sheet date.
Legal Contingencies
The Company reserves for the outcome of litigation and contingencies when it determines an adverse outcome is probable and can estimate losses. Estimates are adjusted as facts and circumstances require. The Company expenses the costs to resolve litigation as incurred, net of amounts, if any, recovered through our insurance coverage.
Fair Value Measurement and Financial Instruments
FASB ASC 820--
Fair Value Measurements and Disclosure
provides a single definition of fair value, together with a framework for measuring it, and requires additional disclosure about the use of fair value to measure assets and liabilities.
This topic defines fair value as the price that would be received to sell an asset or paid to transfer a liability in an orderly transaction between market participants at the measurement date and establishes a three-level hierarchy, which encourages an entity to maximize the use of observable inputs and minimize the use of unobservable inputs when measuring fair value. The three levels of the hierarchy are defined as follows:
|
•
|
Level 1 - inputs to the valuation techniques that are quoted prices in active markets for identical assets or liabilities
|
|
•
|
Level 2 - inputs to the valuation techniques that are other than quoted prices but are observable for the assets or liabilities, either directly or indirectly
|
|
•
|
Level 3 - inputs to the valuation techniques that are unobservable for the assets or liabilities
|
The Company’s cash and cash equivalents, short-term investments, assets of the Company’s Deferred Compensation Plan, accounts receivable, accounts payable, and revolving loan are all short-term in nature. As such, their carrying amounts approximate fair value and fall within Level 1 of the fair value hierarchy. The Company stock included in the Deferred Compensation Plan is not subject to fair value measurement.
60
THE CHILDREN’S PLACE, INC. AND SUBSIDIARIES
NOTES TO CONSOLIDATED FINANCIAL STATEMENTS (Continued)
Our derivative assets and liabilities include foreign exchange forward contracts that are measured at fair value using observable market inputs such as forward rates, our credit risk and our counterparties’ credit risks. Based on these inputs, our derivative assets and liabilities are classified within Level 2 of the valuation hierarchy.
The Company’s assets measured at fair value on a nonrecurring basis include long-lived assets. The Company reviews the carrying amounts of such assets when events indicate that their carrying amounts may not be recoverable. Any resulting asset impairment would require that the asset be recorded at its fair value. The resulting fair value measurements of the assets are considered to be Level 3 inputs. Long-lived assets, primarily comprised of property and equipment, held and used with a carrying amount of
$6.1 million
were written down to their fair value, resulting in an impairment charge of
$6.1 million
, which was included in earnings for Fiscal 2018. For Fiscal 2017, long-lived assets held and used with a carrying amount of
$6.4 million
were written down to their fair value, resulting in an impairment charge of
$5.2 million
, which was included in earnings for Fiscal 2017. For Fiscal 2016, long-lived assets held and used with a carrying amount of
$4.2 million
were written down to their fair value, resulting in an impairment charge of
$4.0 million
, which was included in earnings for Fiscal 2016.
Recently Issued Accounting Updates
Adopted in Fiscal 2018
In May 2014, the FASB issued guidance relating to revenue recognition from contracts with customers. This guidance requires entities to recognize revenue in a way that depicts the transfer of promised goods or services to customers in an amount that reflects the consideration to which the entity expects to be entitled to in exchange for those goods or services. We adopted this guidance in the first quarter of 2018 using the modified-retrospective method. This adoption did not have a material impact on the Company’s consolidated financial statements. Refer to Note 2, "
Revenues"
, for additional information.
To Be Adopted After Fiscal 2018
In August 2017, the FASB issued guidance relating to the accounting for hedging activities. This guidance aims to better align an entity’s risk management activities and financial reporting for hedging relationships through changes to both the designation and measurement guidance for qualifying hedging relationships and the presentation of hedge results. The amendments in the guidance expand and refine hedge accounting for both non-financial and financial risk components and align the recognition and presentation of the effects of the hedging instrument and the hedged item in the financial statements. The standard is effective for the Company beginning in Fiscal 2019, including interim periods within those fiscal years, and early adoption is permitted. The Company does not expect the adoption of this guidance to have a material impact on its consolidated financial statements.
In February 2016, the FASB issued guidance relating to the accounting for leases. This guidance applies a right of use model that requires a lessee to record, for all leases with a lease term of more than 12 months, an asset representing its right to use the underlying asset for the lease term and a liability to make lease payments. The lease term is the noncancellable period of the lease, and includes both periods covered by an option to extend the lease, if the lessee is reasonably certain to exercise that option, and periods covered by an option to terminate the lease, if the lessee is reasonably certain not to exercise that termination option. The standard is effective for the Company beginning in Fiscal 2019, including interim periods within those fiscal years, and early adoption is permitted.
The Company will adopt this guidance beginning in Fiscal 2019 using a modified retrospective approach with the cumulative effect of adopting the standard recognized as an adjustment to opening retained earnings. The Company expects to apply the related package of practical expedients permitted by the transition guidance in the standard, which allows the Company to carry forward its identification of contracts that are or contain leases, its historical lease classification, and its initial direct costs for existing leases. The Company currently expects to recognize right-of-use assets and lease liabilities totaling between $400 million and $450 million upon adoption. The Company does not expect adoption of the standard to have a material impact on the Company's consolidated results of operations or cash flows.
61
THE CHILDREN’S PLACE, INC. AND SUBSIDIARIES
NOTES TO CONSOLIDATED FINANCIAL STATEMENTS (Continued)
2. REVENUES
Adoption of ASC Topic 606, "
Revenue from Contracts with Customers
"
On February 4, 2018, the Company adopted Topic 606 "Revenue from Contracts with Customers" using the modified retrospective method. Results for reporting periods beginning February 4, 2018 are presented under Topic 606, while prior period amounts are not adjusted and continue to be reported in accordance with the Company's historic accounting under Topic 605 "Revenue Recognition". Upon adoption of this guidance, there was no material impact to the Company's consolidated financial statements.
We recorded a net increase to opening retained earnings, net of taxes, of approximately
$0.9 million
as of February 4, 2018 due to the cumulative impact of adopting Topic 606. The impact primarily related to the accounting for gift card breakage of approximately $2.3 million, partially offset by our private label credit card program of approximately $1.1 million, net of taxes of $0.3 million:
|
|
February 3, 2018
|
Adjustments
|
February 4, 2018
|
|||||||
|
(As reported)
|
(As amended)
|
|||||||||
|
(In thousands)
|
||||||||||
|
Retained earnings
|
$
|
226,303
|
|
875
|
|
$
|
227,178
|
|
||
In accordance with the new revenue standard requirements, the disclosure of the impact of adoption on our consolidated balance sheet and income statement were as follows, with the impact primarily related to the accounting for our private label credit card program and gift card breakage:
|
|
For the period ended February 2, 2019
|
|||||||||
|
Balance Sheet
|
As reported
|
Balances without adoption of Topic 606
|
Effect of adoption
Higher/(Lower)
|
|||||||
|
(In thousands)
|
||||||||||
|
Property and equipment, net
|
$
|
260,357
|
|
259,678
|
|
$
|
679
|
|
||
|
Deferred income taxes
|
$
|
17,750
|
|
18,157
|
|
$
|
(407
|
)
|
||
|
Other assets
|
$
|
13,544
|
|
13,080
|
|
$
|
464
|
|
||
|
Accrued expenses and other current liabilities
|
$
|
86,755
|
|
86,268
|
|
$
|
487
|
|
||
|
Other long-term liabilities
|
$
|
12,862
|
|
14,417
|
|
$
|
(1,555
|
)
|
||
|
Retained earnings
|
$
|
180,792
|
|
178,988
|
|
$
|
1,804
|
|
||
|
|
For the 52 weeks ended February 2, 2019
|
|||||||||
|
Income Statement
|
As reported
|
Amounts without adoption of Topic 606
|
Effect of adoption
Higher/(Lower)
|
|||||||
|
(In thousands)
|
||||||||||
|
Net sales
|
$
|
1,938,084
|
|
1,918,171
|
|
$
|
19,913
|
|
||
|
Selling, general, and administrative expenses
|
$
|
498,343
|
|
479,802
|
|
$
|
18,541
|
|
||
|
Depreciation and amortization
|
$
|
68,884
|
|
68,741
|
|
$
|
143
|
|
||
|
Operating income
|
$
|
111,328
|
|
110,099
|
|
$
|
1,229
|
|
||
Revenue Recognition
Revenues are recognized when control of the promised goods or services is transferred to our customers, in an amount that reflects the consideration we expect to be entitled to in exchange for those goods or services.
62
THE CHILDREN’S PLACE, INC. AND SUBSIDIARIES
NOTES TO CONSOLIDATED FINANCIAL STATEMENTS (Continued)
The following table presents our revenues disaggregated by geography:
|
|
Fifty-two Weeks Ended
|
Fifty-three Weeks Ended
|
||||||
|
|
February 2,
2019 |
February 3,
2018 |
||||||
|
Net sales:
|
(In thousands)
|
|||||||
|
South
|
$
|
670,232
|
|
$
|
628,844
|
|
||
|
Northeast
|
460,682
|
|
451,745
|
|
||||
|
West
|
300,225
|
|
288,285
|
|
||||
|
Midwest
|
245,954
|
|
241,848
|
|
||||
|
International and other
|
260,991
|
|
259,553
|
|
||||
|
Total net sales
|
$
|
1,938,084
|
|
$
|
1,870,275
|
|
||
The Company recognizes revenue, including shipping and handling fees billed to customers, upon purchase at the Company's retail stores or when received by the customer if the product was purchased via e-commerce, net of coupon redemptions and anticipated sales returns. The Company deferred approximately
$1.2 million
and
$3.0 million
as of
February 2, 2019
and
February 3, 2018
, respectively, based upon estimated time of delivery, at which point control passes to the customer, and is recorded in accrued expenses and other current liabilities. Sales tax collected from customers is excluded from revenue.
For the sale of goods with a right of return, the Company recognizes revenue for the consideration it expects to be entitled to and calculates an allowance for estimated sales returns based upon the Company's sales return experience. Adjustments to the allowance for estimated sales returns in subsequent periods are generally not material based on historical data, thereby reducing the uncertainty inherent in such estimates. The allowance for estimated sales returns, which is recorded in accrued expenses and other current liabilities, was approximately
$0.9 million
and
$0.8 million
as of
February 2, 2019
and
February 3, 2018
, respectively.
Our private label credit card is issued to our customers for use exclusively at The Children's Place stores and online at
www.childrensplace.com
, and credit is extended to such customers by a third-party financial institution on a non-recourse basis to us. The private label credit card includes multiple performance obligations, including marketing and promoting the program on behalf of the bank and the operation of the loyalty rewards program. Included in the agreement with the third-party financial institution was an upfront bonus paid to the Company. The upfront bonus is recognized as revenue and allocated between brand and reward obligations. As the license of the Company’s brand is the predominant item in the performance obligation, the amount allocated to the brand obligation is recognized on a straight-line basis over the initial term. The amount allocated to the reward obligation is recognized on a point-in-time basis as redemptions under the loyalty program occur.
In measuring revenue and determining the consideration the Company is entitled to as part of a contract with a customer, the Company takes into account the related elements of variable consideration, such as additional bonuses, including profit-sharing, over the life of the program. Similar to the upfront bonus, the usage-based royalties and bonuses are recognized as revenue and allocated between the brand and reward obligations. The amount allocated to the brand obligation is recognized on a straight-line basis over the initial term. The amount allocated to the reward obligation is recognized on a point-in-time basis as redemptions under the loyalty program occur. In addition, the annual profit-sharing amount is estimated and recognized quarterly within an annual period when earned. The additional bonuses are amortized over the contract term based on anticipated progress against future targets and level of risk associated with achieving the targets. The Company deferred approximately
$0.3 million
as of
February 2, 2019
in relation to its private label credit card performance obligations.
The Company has a points-based customer loyalty program, in which customers earn points based on purchases and other promotional activities. These points can be redeemed for coupons to discount future purchases. A contract liability is estimated based on the standalone selling price of benefits earned by customers through the program and the related redemption experience under the program. The value of each point earned is recorded as deferred revenue and is included within accrued expenses and other current liabilities. The total contract liability related to this program was
$2.2 million
and
$4.1 million
as of
February 2, 2019
and
February 3, 2018
, respectively. The following table provides the reconciliation of the contract liability related to this program:
63
THE CHILDREN’S PLACE, INC. AND SUBSIDIARIES
NOTES TO CONSOLIDATED FINANCIAL STATEMENTS (Continued)
|
|
Contract Liability
|
||
|
(In thousands)
|
|||
|
Balance at February 3, 2018
|
$
|
4,138
|
|
|
Loyalty points earned
|
22,305
|
|
|
|
Loyalty points redeemed and expired
|
(24,224
|
)
|
|
|
Balance at February 2, 2019
|
$
|
2,219
|
|
The Company's policy with respect to gift cards is to record revenue as and when the gift cards are redeemed for merchandise. The Company recognizes gift card breakage income in proportion to the pattern of rights exercised by the customer when the Company expects to be entitled to breakage, and the Company determines that it does not have a legal obligation to remit the value of the unredeemed gift card to the relevant jurisdiction as unclaimed or abandoned property. With the adoption of Topic 606, gift card breakage is recorded within net sales during
Fiscal 2018
and within selling, general, and administrative expenses during
Fiscal 2017
prior to adoption of Topic 606. Prior to their redemption, gift cards are recorded as a liability, included within accrued expenses and other current liabilities. The total contract liability related to gift cards issued was
$17.9 million
and
$16.1 million
as of
February 2, 2019
and
February 3, 2018
, respectively. The liability is estimated based on expected breakage that considers historical patterns of redemption. The following table provides the reconciliation of the contract liability related to gift cards:
|
|
Contract Liability
|
||
|
(In thousands)
|
|||
|
Balance at February 3, 2018
|
$
|
16,145
|
|
|
Gift cards sold
|
36,691
|
|
|
|
Gift cards redeemed
|
(31,872
|
)
|
|
|
Gift card breakage
|
(3,097
|
)
|
|
|
Balance at February 2, 2019
|
$
|
17,867
|
|
The Company has an international expansion program through territorial agreements with franchisees. The Company generates revenues from the franchisees from the sale of product and, in certain cases, sales royalties. The Company records net sales and cost of goods sold on the sale of product to franchisees when the franchisee takes ownership of the product. The Company records net sales for royalties when the applicable franchisee sells the product to their customers. Under certain agreements, the Company receives a fee from applicable franchisees for exclusive territorial rights and based on the opening of new stores in such franchisee's licensed territory. The Company records these territorial fees as deferred revenue and amortizes the fee into gross sales over the life of the territorial agreement.
3. STOCKHOLDERS’ EQUITY
Share Repurchase Programs
The Company's Board of Directors has authorized the following share repurchase programs which were active during Fiscal 2018 and Fiscal 2017: (1) $250 million in December 2015 (the "2015 $250 Million Share Repurchase Program"); (2) $250 million in March 2017 (the "2017 Share Repurchase Program"); and (3) $250 million in March 2018 (the "2018 Share Repurchase Program"). The 2015 $250 Million and the 2017 Share Repurchase Programs have been completed. At
February 2, 2019
, there was approximately $239 million remaining on the 2018 Share Repurchase Program. Under these programs, the Company may repurchase shares in the open market at current market prices at the time of purchase or in privately negotiated transactions. The timing and actual number of shares repurchased under a program will depend on a variety of factors including price, corporate and regulatory requirements, and other market and business conditions. The Company may suspend or discontinue a program at any time, and may thereafter reinstitute purchases, all without prior announcement.
As part of its share repurchase programs, the Company entered into an accelerated share repurchase program with Goldman Sachs & Co. LLC in March 2018 under which it repurchased and retired approximately 1.0 million shares for $125.0 million. The accelerated share repurchase program was completed during the second quarter of Fiscal 2018.
64
Pursuant to the Company's practice, including due to restrictions imposed by the Company's insider trading policy during black-out periods, the Company withholds and surrenders shares of vesting stock awards and makes payments to taxing authorities as required by law to satisfy the withholding tax requirements of all recipients. The Company's payment of the withholding taxes in exchange for the surrendered shares constitutes a purchase of its common stock. The Company also acquires shares of its common stock in conjunction with liabilities owed under a deferred compensation plan, which are held in treasury. The following table summarizes the Company's share repurchases:
|
Fiscal Year Ended
|
|||||||||||||||
|
February 2, 2019
|
February 3, 2018
|
January 28, 2017
|
|||||||||||||
|
Shares
|
Value
|
Shares
|
Value
|
Shares
|
Value
|
||||||||||
|
Share repurchases related to:
|
(in thousands)
|
||||||||||||||
|
2015 Share Repurchase Program
|
—
|
|
—
|
|
—
|
|
—
|
|
310
|
|
20,726
|
|
|||
|
2015 $250 Million Share Repurchase Program
program
(1)
|
—
|
|
—
|
|
974
|
|
112,917
|
|
1,637
|
|
137,083
|
|
|||
|
2017 Share Repurchase Programs
(2)
|
1,995
|
|
244,338
|
|
37
|
|
5,662
|
|
—
|
|
—
|
|
|||
|
2018 Share Repurchase Programs
(3)
|
101
|
|
9,205
|
|
—
|
|
—
|
|
—
|
|
—
|
|
|||
|
Shares acquired and held in treasury
|
2
|
|
248
|
|
4
|
|
248
|
|
3
|
|
249
|
|
|||
|
(1)
|
Inclusive of 0.3 million shares for approximately $33.1 million withheld to cover taxes in conjunction with the vesting of stock awards
during Fiscal 2017.
|
|
(2)
|
Inclusive of 0.3 million shares for approximately $43.3 million withheld to cover taxes in conjunction with the vesting of stock awards
during Fiscal 2018.
|
|
(3)
|
Subsequent to February 2, 2019 and through March 19, 2019, the Company repurchased approximately 0.1 million shares for approximately $9.9 million.
|
In accordance with FASB ASC 505--
Equity
, the par value of the shares retired is charged against common stock and the remaining purchase price is allocated between additional paid-in capital and retained earnings. The portion charged against additional paid-in capital is done using a pro-rata allocation based on total shares outstanding. Related to all shares retired for Fiscal 2018, Fiscal 2017, and Fiscal 2016, approximately
$113.0 million
,
$103.7 million
, and
$133.0 million
was charged to retained earnings, respectively.
Dividends
Related to Fiscal 2018 dividends,
$34.4 million
was charged to retained earnings, of which
$33.0 million
related to cash dividends paid and
$1.4 million
related to dividend share equivalents on unvested Deferred Awards and Performance Awards. Related to Fiscal 2017 dividends,
$29.7 million
was charged to retained earnings, of which
$28.1 million
related to cash dividends paid and
$1.6 million
related to dividend share equivalents on unvested Deferred Awards and Performance Awards. The Board of Directors authorized a quarterly cash dividend of $0.56 per share to be paid on April 26, 2019 to shareholders of record on the close of business on April 15, 2019. Future declarations of quarterly dividends, the establishment of future record dates, and the resulting payment dates are subject to approval by the Company’s Board of Directors based on a number of factors, including business and market conditions, the Company’s future financial performance, and other investment priorities.
4. STOCK-BASED COMPENSATION
The Company generally grants time vesting stock awards ("Deferred Awards") and performance-based stock awards ("Performance Awards") to employees at management levels. The Company also grants Deferred Awards to its non-employee directors. Deferred Awards are granted in the form of restricted stock units that require each recipient to complete a service period. Deferred Awards generally vest ratably over three years, except for those granted to non-employee directors, which generally vest over one year. Performance Awards are granted in the form of restricted stock units which have performance criteria that must be achieved for the awards to vest in addition to a service period requirement. With the approval of the Board's Compensation Committee, the Company may settle vested Deferred Awards and Performance Awards to the employee in shares, in a cash amount equal to the market value of such shares at the time all requirements for delivery of the award have been met, or in part shares and cash.
For Performance Awards issued during Fiscal 2016 and Fiscal 2017, an employee may earn from 0% to 200% of their Target Shares based on the achievement of cumulative adjusted earnings per share achieved for the three-year performance period, adjusted operating margin expansion achieved for the three-year performance period, and adjusted return on invested
65
THE CHILDREN’S PLACE, INC. AND SUBSIDIARIES
NOTES TO CONSOLIDATED FINANCIAL STATEMENTS (Continued)
capital achieved at the end of the performance period. For Performance Awards issued during Fiscal 2018 (the “2018 Performance Awards”), an employee may earn from 0% to 250% of their Target Shares based on the cumulative adjusted earnings per share achieved for the three-year performance period, adjusted operating margin expansion achieved for the three-year performance period, adjusted ROIC achieved as of the end of the performance period, and the ranking of our adjusted ROIC relative to that of companies in our peer group as of the end of the performance period. The Performance Awards cliff vest, if earned, after completion of the applicable three year performance period. The fair value of the Performance Awards granted is based on the closing price of our common stock on the grant date. Stock-based compensation expense is recognized ratably over the related service period, reduced for estimated forfeitures of those awards not expected to vest due to employee turnover. Stock-based compensation expense, as it relates to Performance Awards, is also adjusted based on the Company's estimate of the percentage of the aggregate Target Shares expected to be earned.
The following table summarizes the Company’s stock-based compensation expense:
|
|
Fiscal Year Ended
|
||||||||||
|
|
February 2,
2019 |
February 3,
2018 |
January 28,
2017 |
||||||||
|
(In thousands)
|
|||||||||||
|
Deferred Awards
|
$
|
12,849
|
|
$
|
11,891
|
|
$
|
8,906
|
|
||
|
Performance Awards
|
14,566
|
|
18,906
|
|
19,134
|
|
|||||
|
Total stock-based compensation expense
(1)
|
$
|
27,415
|
|
$
|
30,797
|
|
$
|
28,040
|
|
||
(1) A portion of stock-based compensation is included in cost of sales. Approximately
$3.5 million
,
$4.0 million
, and
$3.6 million
in Fiscal 2018, Fiscal 2017, and Fiscal 2016, respectively, were included in cost of sales. All other stock-based compensation is included in selling, general, and administrative expense.
The Company recognized a tax benefit related to stock-based compensation expense of
$7.2 million
,
$8.2 million
, and
$11.1 million
for Fiscal 2018, Fiscal 2017, and Fiscal 2016, respectively.
At
February 2, 2019
, the Company had
756,502
shares available for grant under the Equity Plan.
Changes in the Company’s Unvested Stock Awards during Fiscal 2018, Fiscal 2017, and Fiscal 2016
Deferred Awards
|
Fiscal Year Ended
|
||||||||||||||||||||
|
February 2, 2019
|
February 3, 2018
|
January 28, 2017
|
||||||||||||||||||
|
|
Number of
Shares
|
Weighted
Average
Grant Date
Fair Value
|
Number of
Shares
|
Weighted
Average
Grant Date
Fair Value
|
Number of
Shares
|
Weighted
Average
Grant Date
Fair Value
|
||||||||||||||
|
|
(in thousands)
|
|
|
(in thousands)
|
(in thousands)
|
|
||||||||||||||
|
Unvested Deferred Awards at beginning of year
|
420
|
|
$
|
82.30
|
|
469
|
|
$
|
61.19
|
|
473
|
|
$
|
54.62
|
|
|||||
|
Granted
|
135
|
|
124.21
|
|
212
|
|
110.17
|
|
189
|
|
72.19
|
|
||||||||
|
Vested
|
(197
|
)
|
75.65
|
|
(202
|
)
|
62.30
|
|
(163
|
)
|
54.35
|
|
||||||||
|
Forfeited
|
(59
|
)
|
110.63
|
|
(59
|
)
|
83.25
|
|
(30
|
)
|
63.88
|
|
||||||||
|
Unvested Deferred Awards at end of year
|
299
|
|
$
|
99.98
|
|
420
|
|
$
|
82.30
|
|
469
|
|
$
|
61.19
|
|
|||||
Total unrecognized stock-based compensation expense related to unvested Deferred Awards approximated
$15.8 million
as of
February 2, 2019
, which will be recognized over a weighted average period of approximately
1.8
years.
The fair value of Deferred Awards held by the Company's employees that vested during Fiscal 2018, Fiscal 2017, and Fiscal 2016 was approximately
$25.3 million
,
$23.6 million
, and
$12.2 million
, respectively.
66
THE CHILDREN’S PLACE, INC. AND SUBSIDIARIES
NOTES TO CONSOLIDATED FINANCIAL STATEMENTS (Continued)
Performance Awards
|
Fiscal Year Ended
|
|||||||||||||||||||||
|
February 2, 2019
|
February 3, 2018
|
January 28, 2017
|
|||||||||||||||||||
|
|
Number of
Performance
Shares
(1)
|
Weighted
Average
Grant Date
Fair Value
|
Number of
Performance
Shares
(1)
|
Weighted
Average
Grant Date
Fair Value
|
Number of
Performance
Shares
(1)
|
Weighted
Average
Grant Date
Fair Value
|
|||||||||||||||
|
|
(in thousands)
|
|
(in thousands)
|
|
(in thousands)
|
|
|||||||||||||||
|
Unvested Performance Awards at beginning of year
|
544
|
|
$
|
84.11
|
|
515
|
|
$
|
68.11
|
|
375
|
|
$
|
61.37
|
|
||||||
|
Granted
|
87
|
|
123.02
|
|
172
|
|
113.76
|
|
204
|
|
75.19
|
|
|||||||||
|
Shares earned in excess of target
|
347
|
|
203
|
|
70.09
|
|
203
|
|
50.97
|
|
—
|
|
—
|
|
|||||||
|
Vested shares, including shares earned in excess of target
|
(513
|
)
|
70.09
|
|
(301
|
)
|
50.97
|
|
(54
|
)
|
48.26
|
|
|||||||||
|
Forfeited
|
(113
|
)
|
114.06
|
|
(45
|
)
|
86.80
|
|
(10
|
)
|
67.11
|
|
|||||||||
|
Unvested Performance Awards at end of year
|
352
|
|
$
|
90.66
|
|
544
|
|
$
|
84.11
|
|
515
|
|
$
|
68.11
|
|
||||||
____________________________________________
(1)
For those awards for which the performance period is complete, the number of unvested shares is based on actual shares that will vest upon completion of the service period.
For those awards in which the performance period is not yet complete, the number of unvested shares in the table above is based on the participants earning their Target Shares at 100%; however, the cumulative expense recognized reflects changes in estimated adjusted earnings per share, adjusted operating margin expansion, and adjusted return on invested capital as they occur. Based on the current number of Performance Awards expected to be earned, the total unrecognized stock-based compensation expense related to unvested Performance Awards approximated
$9.6 million
as of
February 2, 2019
, which will be recognized over a weighted average period of approximately
1.2
years.
The fair value of Performance Awards held by the Company's employees that vested during Fiscal 2018, Fiscal 2017, and Fiscal 2016 was approximately
$69.2 million
,
$49.1 million
, and
$4.4 million
, respectively.
Stock Options
No stock options were issued during Fiscal 2018, Fiscal 2017, and Fiscal 2016 and at
February 2, 2019
, there were no stock options outstanding.
67
THE CHILDREN’S PLACE, INC. AND SUBSIDIARIES
NOTES TO CONSOLIDATED FINANCIAL STATEMENTS (Continued)
5. PROPERTY AND EQUIPMENT, NET
Property and equipment consist of the following:
|
|
February 2, 2019
|
February 3, 2018
|
||||||
|
(in thousands)
|
||||||||
|
Property and equipment:
|
|
|
|
|
||||
|
Land and land improvements
|
$
|
3,403
|
|
$
|
3,403
|
|
||
|
Building and improvements
|
35,568
|
|
35,548
|
|
||||
|
Material handling equipment
|
51,934
|
|
50,102
|
|
||||
|
Leasehold improvements
|
301,233
|
|
308,465
|
|
||||
|
Store fixtures and equipment
|
273,430
|
|
262,363
|
|
||||
|
Capitalized software
|
254,064
|
|
237,786
|
|
||||
|
Construction in progress
|
14,823
|
|
9,498
|
|
||||
|
|
934,455
|
|
907,165
|
|
||||
|
Less accumulated depreciation and amortization
|
(674,098
|
)
|
(648,628
|
)
|
||||
|
Property and equipment, net
|
$
|
260,357
|
|
$
|
258,537
|
|
||
During Fiscal 2018, the Company performed impairment testing on
972
stores with a total net book value of
$81.4 million
. During Fiscal 2018, the Company recorded $6.1 million of impairment charges of which
$1.7 million
related to the full impairment of 11 stores, and $4.4 million related to the write-down of information technology systems.
During Fiscal 2017, the Company performed impairment testing on
1,014
stores with a total net book value of
$79.4 million
. During Fiscal 2017, the Company recorded
$2.8 million
of impairment charges primarily related to
21
stores, all of which were fully impaired. Additionally, the Company recorded asset impairment charges of $2.4 million related to the write-down of information technology systems.
During Fiscal 2016, the Company performed impairment testing on
1,039
stores with a total net book value of
$91.4 million
. During Fiscal 2016, the Company recorded $2.7 million of impairment charges primarily related to
28
underperforming stores, of which
11
were fully impaired and
17
were partially impaired. Additionally, the Company recorded asset impairment charges of $1.3 million related to the write-down of some previously capitalized development costs and information technology systems.
6. CREDIT FACILITY
The Company and certain of its domestic subsidiaries maintain a credit agreement with Wells Fargo Bank, National Association (“Wells Fargo”), Bank of America, N.A., HSBC Business Credit (USA) Inc., and JPMorgan Chase Bank, N.A. as lenders (collectively, the “Lenders”) and Wells Fargo, as Administrative Agent, Collateral Agent and Swing Line Lender (the “Credit Agreement”). The Credit Agreement was amended on September 15, 2015 and the provisions below reflect the amended and extended Credit Agreement.
The Credit Agreement, which expires in September 2020, consists of a
$250 million
asset based revolving credit facility, with a
$50 million
sub-limit for standby and documentary letters of credit and an uncommitted accordion feature that could provide up to
$50 million
of additional availability. Revolving credit loans outstanding under the Credit Agreement bear interest, at the Company’s option, at:
|
(i)
|
the prime rate plus a margin of
0.50%
to
0.75%
based on the amount of the Company’s average excess availability under the facility; or
|
|
(ii)
|
the London InterBank Offered Rate, or “LIBOR”, for an interest period of
one, two, three, or six
months, as selected by the Company, plus a margin of
1.25%
to
1.50%
based on the amount of the Company’s average excess availability under the facility.
|
The Company is charged an unused line fee of
0.25%
on the unused portion of the commitments. Letter of credit fees range from
0.625%
to
0.750%
for commercial letters of credit and range from
0.75%
to
1.00%
for standby letters of credit.
68
THE CHILDREN’S PLACE, INC. AND SUBSIDIARIES
NOTES TO CONSOLIDATED FINANCIAL STATEMENTS (Continued)
Letter of credit fees are determined based on the amount of the Company's average excess availability under the facility. The amount available for loans and letters of credit under the Credit Agreement is determined by a borrowing base consisting of certain credit card receivables, certain trade and franchise receivables, certain inventory, and the fair market value of certain real estate, subject to certain reserves.
The outstanding obligations under the Credit Agreement may be accelerated upon the occurrence of certain events, including, among others, non-payment, breach of covenants, the institution of insolvency proceedings, defaults under other material indebtedness and a change of control, subject, in the case of certain defaults, to the expiration of applicable grace periods. The Company is not subject to any early termination fees.
The Credit Agreement contains covenants, which include conditions on stock buybacks and the payment of cash dividends or similar payments. Credit extended under the Credit Agreement is secured by a first priority security interest in substantially all of the Company’s U.S. assets excluding intellectual property, software, equipment, and fixtures.
As of
February 2, 2019
, the Company has capitalized an aggregate of approximately
$4.3 million
in deferred financing costs related to the Credit Agreement. The unamortized balance of deferred financing costs at
February 2, 2019
and
February 3, 2018
was approximately
$0.4 million
and
$0.7 million
, respectively. Unamortized deferred financing costs are amortized over the remaining term of the Credit Agreement.
The table below presents the components of the Company’s credit facility:
|
|
February 2,
2019 |
February 3,
2018 |
|||||
|
(In millions)
|
|||||||
|
Credit facility maximum
|
$
|
250.0
|
|
$
|
250.0
|
|
|
|
Borrowing base
(1)
|
250.0
|
|
250.0
|
|
|||
|
Outstanding borrowings
|
48.9
|
|
21.5
|
|
|||
|
Letters of credit outstanding—standby
|
7.0
|
|
7.0
|
|
|||
|
Utilization of credit facility at end of period
|
55.9
|
|
28.5
|
|
|||
|
Availability
(2)
|
$
|
194.1
|
|
$
|
221.5
|
|
|
|
Interest rate at end of period
|
6.0
|
%
|
5.0
|
%
|
|||
|
|
Fiscal 2018
|
Fiscal 2017
|
|||||
|
Average end of day loan balance during the period
|
$
|
64.4
|
|
$
|
45.8
|
|
|
|
Highest end of day loan balance during the period
|
156.4
|
|
98.2
|
|
|||
|
Average interest rate
|
4.3
|
%
|
2.9
|
%
|
|||
|
(1)
|
Lower of the credit facility maximum or the total borrowing base collateral.
|
|
(2)
|
The sub-limit availability for letters of credit was
$43.0 million
and
$43.0 million
at
February 2, 2019
and
February 3, 2018
, respectively.
|
69
THE CHILDREN’S PLACE, INC. AND SUBSIDIARIES
NOTES TO CONSOLIDATED FINANCIAL STATEMENTS (Continued)
|
7.
|
OTHER CURRENT AND NON-CURRENT ASSETS
|
Prepaid expenses and other current assets are comprised of the following:
|
February 2, 2019
|
February 3, 2018
|
|||||||
|
(In thousands)
|
||||||||
|
Prepaid income taxes
|
$
|
7,223
|
|
$
|
21,069
|
|
||
|
Prepaid property expense
|
6,738
|
|
7,093
|
|
||||
|
Prepaid maintenance contracts
|
5,109
|
|
6,444
|
|
||||
|
Prepaid marketing
|
1,421
|
|
3,892
|
|
||||
|
Other
|
7,179
|
|
7,958
|
|
||||
|
Total prepaid expenses and other current assets
|
$
|
27,670
|
|
$
|
46,456
|
|
||
Other non-current assets are comprised of the following:
|
February 2, 2019
|
February 3, 2018
|
|||||||
|
(In thousands)
|
||||||||
|
Prepaid cloud computing
|
$
|
5,708
|
|
$
|
5,534
|
|
||
|
Prepaid maintenance contracts
|
2,793
|
|
2,352
|
|
||||
|
Security deposits
|
1,944
|
|
1,960
|
|
||||
|
Other
|
3,099
|
|
2,643
|
|
||||
|
Total other assets
|
$
|
13,544
|
|
$
|
12,489
|
|
||
|
8.
|
OTHER CURRENT AND LONG-TERM LIABILITIES
|
Accrued expenses and other current liabilities are comprised of the following:
|
February 2, 2019
|
February 3, 2018
|
|||||||
|
(In thousands)
|
||||||||
|
Customer liabilities
|
17,086
|
|
18,791
|
|
||||
|
Accrued salaries and benefits
|
12,378
|
|
42,073
|
|
||||
|
Accrued professional fees
|
7,091
|
|
6,707
|
|
||||
|
Accrued store expenses
|
7,090
|
|
5,796
|
|
||||
|
Accrued property expenses
|
6,265
|
|
5,171
|
|
||||
|
Accrued capital expenditures
|
6,107
|
|
2,709
|
|
||||
|
Sales taxes and other taxes payable
|
3,330
|
|
5,432
|
|
||||
|
Accrued freight
|
3,217
|
|
4,509
|
|
||||
|
Insurance reserves
|
3,068
|
|
2,814
|
|
||||
|
Accrued marketing
|
2,434
|
|
3,342
|
|
||||
|
Deferred revenue for MyPlace Rewards loyalty program
|
2,220
|
|
4,138
|
|
||||
|
Deferred revenue
|
2,180
|
|
3,803
|
|
||||
|
Other
|
14,289
|
|
16,568
|
|
||||
|
Total accrued expenses and other current liabilities
|
$
|
86,755
|
|
$
|
121,853
|
|
||
70
THE CHILDREN’S PLACE, INC. AND SUBSIDIARIES
NOTES TO CONSOLIDATED FINANCIAL STATEMENTS (Continued)
Other long-term liabilities are comprised of the following:
|
February 2, 2019
|
February 3, 2018
|
|||||||
|
(In thousands)
|
||||||||
|
Deferred revenue
|
$
|
7,030
|
|
$
|
7,444
|
|
||
|
Insurance reserves
|
2,548
|
|
5,308
|
|
||||
|
Other
|
3,284
|
|
2,200
|
|
||||
|
Other long-term liabilities
|
$
|
12,862
|
|
$
|
14,952
|
|
||
|
9.
|
COMMITMENTS AND CONTINGENCIES
|
Operating Lease Commitments
The Company leases all of its stores, corporate offices, and distribution facilities (except the Ft. Payne, Alabama distribution center which the Company owns), and certain office equipment, store fixtures, and automobiles, under operating leases expiring through 2029. The leases require fixed minimum annual rental payments plus, under the terms of certain leases, additional payments for taxes, other expenses, and additional rent based upon sales.
Store, corporate offices, and distribution facilities minimum rent, contingent rent, and sublease income are as follows:
|
Fiscal Year Ended
|
|||||||||
|
February 2, 2019
|
February 3,
2018 |
January 28,
2017 |
|||||||
|
(In thousands)
|
|||||||||
|
Minimum rentals
|
153,017
|
|
154,493
|
|
157,647
|
|
|||
|
Additional rent based upon sales
|
2,042
|
|
1,924
|
|
1,367
|
|
|||
|
Sublease income
|
(1,395
|
)
|
(2,592
|
)
|
(2,275
|
)
|
|||
Future minimum annual lease payments under the Company's operating leases at
February 2, 2019
were as follows:
|
Minimum Operating Lease Payments
|
||||
|
(In thousands)
|
||||
|
2019
|
$
|
143,601
|
|
|
|
2020
|
117,037
|
|
||
|
2021
|
86,788
|
|
||
|
2022
|
57,734
|
|
||
|
2023
|
32,218
|
|
||
|
Thereafter
|
50,263
|
|
||
|
Total minimum lease payments
|
$
|
487,641
|
|
|
Purchase Commitments
As of
February 2, 2019
, the Company has entered into various purchase commitments for merchandise for re-sale of approximately
$122.4 million
and approximately
$14.5 million
for equipment, construction, and other non-merchandise commitments.
Loss Contingency for Foreign Exchange Control Penalties
During the fourth quarter of Fiscal 2016, the Company determined that one of its foreign subsidiaries had not complied with local foreign exchange control funding regulations related to offshore funding of those operations. The Company has taken steps during Fiscal 2017 to report the noncompliance to the foreign jurisdiction at issue under a voluntary disclosure
71
THE CHILDREN’S PLACE, INC. AND SUBSIDIARIES
NOTES TO CONSOLIDATED FINANCIAL STATEMENTS (Continued)
program. The Company has concluded that, based on currently available information, a reasonable estimate of penalties payable by the Company arising from the matter will range between
$2.2 million
and
$2.8 million
. In making its estimates, however, the Company notes that this range is based on currently available information and involves elements of judgment and significant uncertainties, and that actual penalties may exceed the high end of the range. The Company has recorded a provision for potential penalties, arising from this matter, totaling
$2.2 million
in its consolidated financial statements.
10. LEGAL MATTERS
The Company is a defendant in
Rael v. The Children’s Place, Inc.
, a purported class action, pending in the U.S. District Court, Southern District of California. In the initial complaint filed in February 2016, the plaintiff alleged that the Company falsely advertised discount prices in violation of California’s Unfair Competition Law, False Advertising Law, and Consumer Legal Remedies Act. The plaintiff filed an amended complaint in April 2016, adding allegations of violations of other state consumer protection laws. In August 2016, the plaintiff filed a second amended complaint, adding an additional plaintiff and removing the other state law claims. The plaintiffs’ second amended complaint seeks to represent a class of California purchasers and seeks, among other items, injunctive relief, damages, and attorneys’ fees and costs.
The Company engaged in mediation proceedings with the plaintiffs in December 2016 and April 2017. The parties reached an agreement in principle in April 2017, and signed a definitive settlement agreement in November 2017, to settle the matter on a class basis with all individuals in the U.S. who made a qualifying purchase at The Children’s Place from February 11, 2012 through the date of preliminary approval by the court of the settlement. The settlement is subject to court approval and provides for merchandise vouchers for class members who submit valid claims, as well as payment of legal fees and expenses and claims administration expenses. The court has stayed the matter, pending an appellate court ruling in another lawsuit to which the Company is not a party. The settlement, if ultimately approved by the court, will result in the dismissal of all claims through the date of the court’s preliminary approval of the settlement. However, if the settlement is rejected by the court, the parties will likely return to litigation, and in such event, no assurance can be given as to the ultimate outcome of this matter. In connection with the proposed settlement, the Company recorded a reserve for $5.0 million in its consolidated financial statements in the first quarter of Fiscal 2017.
The Company is also involved in various legal proceedings arising in the normal course of business. In the opinion of management, any ultimate liability arising out of these proceedings will not have a material adverse effect on the Company's financial position, results of operations, or cash flows.
|
11.
|
INCOME TAXES
|
The components of income before taxes are as follows:
|
Fiscal Year Ended
|
||||||||||||
|
February 2,
2019 |
February 3,
2018 |
January 28,
2017 |
||||||||||
|
(In thousands)
|
||||||||||||
|
Domestic
|
$
|
49,820
|
|
$
|
100,288
|
|
$
|
90,990
|
|
|||
|
Foreign
|
58,704
|
|
60,915
|
|
56,023
|
|
||||||
|
Total income before provision for income taxes
|
$
|
108,524
|
|
$
|
161,203
|
|
$
|
147,013
|
|
|||
72
THE CHILDREN’S PLACE, INC. AND SUBSIDIARIES
NOTES TO CONSOLIDATED FINANCIAL STATEMENTS (Continued)
The components of the Company's provision for income taxes consisted of the following:
|
Fiscal Year Ended
|
||||||||||||
|
February 2,
2019 |
February 3,
2018 |
January 28,
2017 |
||||||||||
|
(In thousands)
|
||||||||||||
|
Current:
|
||||||||||||
|
Federal
(1)
|
$
|
594
|
|
$
|
31,334
|
|
$
|
34,056
|
|
|||
|
State and local
(1)
|
2,519
|
|
(1,341
|
)
|
8,527
|
|
||||||
|
Foreign
|
10,019
|
|
11,618
|
|
11,473
|
|
||||||
|
13,132
|
|
41,611
|
|
54,056
|
|
|||||||
|
Deferred:
|
||||||||||||
|
Federal
|
(3,418
|
)
|
30,828
|
|
(8,068
|
)
|
||||||
|
State and local
|
(2,324
|
)
|
3,546
|
|
(1,691
|
)
|
||||||
|
Foreign
|
174
|
|
520
|
|
380
|
|
||||||
|
(5,568
|
)
|
34,894
|
|
(9,379
|
)
|
|||||||
|
Total provision for income taxes
|
$
|
7,564
|
|
$
|
76,505
|
|
$
|
44,677
|
|
|||
|
Effective tax rate
|
7.0
|
%
|
47.5
|
%
|
30.4
|
%
|
||||||
(1) The February 2, 2019 and February 3, 2018 federal, state, and local tax provision includes benefits resulting from stock-based compensation arrangements recognized under ASU 2016-09--
Improvements to Employee Share Based Payment Accounting
. The Company adopted ASU 2016-09 prospectively. Accordingly, no adjustments have been made for the benefits recognized for the year ended January 28, 2017. Such benefits were recorded in equity for the year ended January 28, 2017.
A reconciliation between the calculated tax provision on income based on a U.S. federal statutory rate of 21%, 34.3%, and 35% for the years ended February 2, 2019, February 3, 2018, and January 28, 2017, respectively, the effective tax rate is as follows:
|
Fiscal Year Ended
|
||||||||||||
|
February 2,
2019 |
February 3,
2018 |
January 28,
2017 |
||||||||||
|
(In thousands)
|
||||||||||||
|
Calculated income tax provision at U.S. federal statutory rate
|
$
|
22,790
|
|
$
|
55,246
|
|
$
|
51,455
|
|
|||
|
State and local income taxes, net of federal benefit
(1)
|
154
|
|
1,449
|
|
4,443
|
|
||||||
|
Foreign tax rate differential
(2)
|
(3,801
|
)
|
(10,794
|
)
|
(10,116
|
)
|
||||||
|
Non-deductible expenses
|
861
|
|
514
|
|
2,514
|
|
||||||
|
Excess tax benefits related to stock compensation
|
(11,804
|
)
|
(14,665
|
)
|
—
|
|
||||||
|
U.S. transition taxes on deemed repatriation of foreign earnings
|
338
|
|
37,607
|
|
—
|
|
||||||
|
Revaluation of deferred tax assets and liabilities
|
(295
|
)
|
5,646
|
|
—
|
|
||||||
|
Foreign withholding and state tax on unremitted earnings
|
(244
|
)
|
7,483
|
|
—
|
|
||||||
|
Unrecognized tax benefits
|
1,092
|
|
(3,199
|
)
|
(1,673
|
)
|
||||||
|
Change in valuation allowance
|
(62
|
)
|
(28
|
)
|
19
|
|
||||||
|
Global intangible low-taxed income
|
1,033
|
|
—
|
|
—
|
|
||||||
|
Federal tax credits
|
(2,188
|
)
|
(1,857
|
)
|
(2,224
|
)
|
||||||
|
Other
|
(310
|
)
|
(897
|
)
|
259
|
|
||||||
|
Total provision for income taxes
|
$
|
7,564
|
|
$
|
76,505
|
|
$
|
44,677
|
|
|||
(1) The total benefit from Excess tax benefit related to stock compensation for the Fiscal 2018 was $14.9 which includes $11.8 million of federal tax and $3.1 million state tax (net of federal benefit). The total benefit from Excess tax benefit related to stock compensation for the Fiscal 2017 was $16.6 which included federal tax of $14.7 million and $1.9 million of state tax (net of federal benefit).
73
THE CHILDREN’S PLACE, INC. AND SUBSIDIARIES
NOTES TO CONSOLIDATED FINANCIAL STATEMENTS (Continued)
(2) The foreign tax rate differential is due to the Company having a lower foreign effective tax rate as compared to its U.S. federal statutory tax rate of 21% for Fiscal 2018, 34.3% for Fiscal 2017, and 35% for Fiscal 2016. The Company has substantial operations in Hong Kong, which have lower statutory income tax rates as compared to the U.S. The Company's foreign effective tax rates for Fiscal 2018, Fiscal 2017, and Fiscal 2016 were 17.4% 19.9%, and 21.2%, respectively. This rate will fluctuate from year to year in response to changes in the mix of income by country as well as changes in foreign jurisdiction tax laws.
The assessment of the amount of value assigned to our deferred tax assets under the applicable accounting rules is judgmental. We are required to consider all available positive and negative evidence in evaluating the likelihood that we will be able to realize the benefit of our deferred tax assets in the future. Such evidence includes scheduled reversals of deferred tax liabilities, projected future taxable income, tax planning strategies, and the results of recent operations. Since this evaluation requires consideration of events that may occur some years into the future, there is an element of judgment involved. Realization of our deferred tax assets is dependent on generating sufficient taxable income in future periods. We believe that it is more likely than not that future taxable income will be sufficient to allow us to recover substantially all of the value assigned to our deferred tax assets. However, if future events cause us to conclude that it is not more likely than not that we will be able to recover all of the value assigned to our deferred tax assets, we will be required to adjust our valuation allowance accordingly.
The tax effects of temporary differences which give rise to deferred tax assets and liabilities are as follows:
|
February 2,
2019 |
February 3,
2018 |
|||||||
|
(In thousands)
|
||||||||
|
Noncurrent Assets:
|
||||||||
|
Deferred rent
|
$
|
7,491
|
|
$
|
8,755
|
|
||
|
Stock-based compensation
|
9,321
|
|
11,500
|
|
||||
|
Reserves
|
9,859
|
|
12,864
|
|
||||
|
Inventory
|
3,401
|
|
2,506
|
|
||||
|
Property and equipment, net
|
(9,288
|
)
|
(16,911
|
)
|
||||
|
Prepaid expenses
|
(958
|
)
|
(2,613
|
)
|
||||
|
Foreign and state tax on unremitted earnings
|
(1,806
|
)
|
(3,107
|
)
|
||||
|
Hedging transactions
|
(270
|
)
|
(296
|
)
|
||||
|
Net operating loss carryforwards and other tax credits
|
721
|
|
2,284
|
|
||||
|
Valuation allowance
|
(721
|
)
|
(2,284
|
)
|
||||
|
Total deferred tax asset, net
|
$
|
17,750
|
|
$
|
12,698
|
|
||
The Company has foreign net operating loss carryforwards of approximately
$0.3 million
, which do not expire. During Fiscal year 2018, the company liquidated certain foreign holding companies which had net operating carryforwards. While such carryforwards were written off as a result of the liquidation, there was no impact on the consolidated statement of operations as there was a full valuation allowance for the entire carryforward. The Company also has an Alternative Minimum Tax credit ("AMT") in Puerto Rico of approximately
$0.6 million
.
Management considers the scheduled reversal of deferred tax liabilities, projected future taxable income, and tax planning strategies in assessing the need for a valuation allowance. The Company has concluded that it is more likely than not that certain deferred tax assets cannot be used in the foreseeable future, principally the foreign net operating loss carryforwards and the AMT credit in Puerto Rico. Accordingly, a valuation allowance has been established for these tax benefits. However, to the extent that tax benefits related to these are realized in the future, the reduction of the valuation allowance will reduce income tax expense accordingly.
On December 22, 2017, the U.S. government passed the Tax Act. The Tax Act is comprehensive tax legislation that implements complex changes to the U.S. tax code including, but not limited to, the reduction of the corporate tax rate from 35% to 21% and a move from a global tax regime to a modified territorial regime, which requires U.S. companies to pay a mandatory one-time transition tax on historical offshore earnings that have not been repatriated to the U.S. The transition tax is payable over eight years. The first payment was made during the first quarter of Fiscal 2018. In addition, pursuant to IRS
74
THE CHILDREN’S PLACE, INC. AND SUBSIDIARIES
NOTES TO CONSOLIDATED FINANCIAL STATEMENTS (Continued)
guidance, the overpayment from the fiscal year 2017 tax return is required to be applied first toward the transition tax. Within our consolidated balance sheets, the remaining unpaid transition tax of $18.9 million is included in long-term liabilities.
Due to the complexities of the Tax Act, the SEC staff issued SAB 118 that allowed the company to record a provisional amount for any income tax effects of the Tax Act in accordance with ASC 740--
Income Taxes
, to the extent that a reasonable estimate can be made. SAB 118 allows for a measurement period of up to one year after the enactment date of the Tax Act to finalize the recording of the related tax impacts. In Fiscal 2017, we recorded a provisional amount for the one-time transition tax of $37.6 million. In Fiscal 2018, we recorded an additional expense of $0.3 million as we finalized the one-time Federal transition tax which was $37.9 million. The transition tax was based on our total accumulated post-1986 prescribed foreign earnings and profits ("E&P") of $389 million, which was previously considered to be indefinitely reinvested prior to Fiscal 2017. In Fiscal 2017, we also recorded a provisional estimate of $5.7 million related to the revaluation of U.S. deferred tax assets and liabilities due to the lower enacted federal income tax rate, of 21%, that was effective January 1, 2018. A benefit of $0.3 million was recorded in Fiscal 2018, based on the finalization of the 2017 U.S. tax return which was filed in the fourth quarter of Fiscal 2018.
While the Company is no longer permanently reinvested to the extent earnings were subject to the transition tax under the Tax Act, no additional income taxes have been provided on any earnings subsequent to the transition or for any additional outside basis differences inherent in these entities, as these amounts continue to be permanently reinvested in foreign operations. Determining the amount of unrecognized deferred tax liability related to any additional outside basis differences in these entities (i.e., basis differences in excess of that subject to the one-time transition tax) is not practicable. The unremitted foreign earnings earned subsequent to the transition tax which are permanently reinvested are approximately $48.5 million as of February 2, 2019.
The Tax Act also includes provisions to tax global intangible low-taxed income (“GILTI”) and a base erosion and anti-abuse tax (“BEAT”) that imposes tax on certain foreign related-party payments. The Company is subject to the GILTI and BEAT provisions, which are effective January 1, 2018. The Company has included net federal and state expense of $1.4 million to reflect the impact of these new laws in the Fiscal 2018 tax provision.
The ultimate impacts of the Tax Act may differ from the estimate above, possibly materially, due to additional guidance from the U.S. government, updates or changes in the Company’s assumptions, revision of accounting standards for income taxes or related interpretations, and future information that may become available.
Uncertain Tax Benefits
Tax positions are evaluated in a two-step process. The Company first determines whether it is more-likely-than-not that a tax position will be sustained upon examination. If a tax position meets the more-likely-than-not recognition threshold, it is measured to determine the amount of benefit to recognize in the financial statements. The tax position is measured as the largest amount of benefit that is greater than 50% likely to be realized upon ultimate settlement.
75
THE CHILDREN’S PLACE, INC. AND SUBSIDIARIES
NOTES TO CONSOLIDATED FINANCIAL STATEMENTS (Continued)
A reconciliation of the gross amounts of unrecognized tax benefits, excluding accrued interest and penalties, is as follows:
|
February 2,
2019 |
February 3,
2018 |
|||||||
|
(In thousands)
|
||||||||
|
Beginning Balance
|
$
|
3,905
|
|
$
|
6,326
|
|
||
|
Additions for current year tax positions
|
1,209
|
|
1,154
|
|
||||
|
Additions for prior year tax positions
|
101
|
|
252
|
|
||||
|
Reductions for prior year tax positions
|
(118
|
)
|
—
|
|
||||
|
Reductions related to settlements with taxing authorities
|
(48
|
)
|
(3,156
|
)
|
||||
|
Reductions due to a lapse of the applicable statute of limitations
|
(44
|
)
|
(564
|
)
|
||||
|
Impact of foreign currency translation
|
(3
|
)
|
(107
|
)
|
||||
|
Ending Balance
|
$
|
5,002
|
|
$
|
3,905
|
|
||
Approximately
$5.0 million
of unrecognized tax benefits, excluding accrued interest and penalties, at
February 2, 2019
would affect the Company's effective tax rate if recognized. The Company believes it is reasonably possible that there may be a reduction of approximately
$0.4 million
of unrecognized tax benefits in the next 12 months as a result of settlements with taxing authorities and statute of limitations expirations.
The Company accrued interest and penalties related to unrecognized tax benefits as part of the provision for income taxes. At
February 2, 2019
and
February 3, 2018
, accrued interest and penalties included in unrecognized tax benefits were approximately
$0.1 million
and
$0.1 million
, respectively. Interest, penalties, and reversals, thereof, net of taxes, was a benefit of
$0.1 million
in Fiscal 2018, a benefit of
$0.9 million
in Fiscal 2017, and a benefit of
$0.3 million
in Fiscal 2016.
The Company is subject to tax in the United States and foreign jurisdictions, including Canada and Hong Kong. The Company, joined by its domestic subsidiaries, files a consolidated income tax return for federal income tax purposes. The Company is no longer subject to income tax examinations by U.S. federal, state and local, or foreign tax authorities for fiscal tax years 2014 and prior, with the exception of Hong Kong, which is open through fiscal tax year 2013 due to ongoing tax examination.
|
12.
|
SEGMENT INFORMATION
|
In accordance with FASB ASC 280---Segment Reporting, the Company reports segment data based on geography: The Children’s Place U.S. and The Children’s Place International. Each segment includes an e-commerce business located at
www.childrensplace.com
. Included in The Children’s Place U.S. segment are the Company’s U.S. and Puerto Rico-based stores and revenue from the Company's U.S.-based wholesale business. Included in The Children's Place International segment are the Company's Canadian-based stores, revenue from the Company's Canadian wholesale business, and revenue from international franchisees. The Company measures its segment profitability based on operating income, defined as income before interest and taxes. Net sales and direct costs are recorded by each segment. Certain inventory procurement functions such as production and design as well as corporate overhead, including executive management, finance, real estate, human resources, legal, and information technology services are managed by The Children’s Place U.S. segment. Expenses related to these functions, including depreciation and amortization, are allocated to The Children’s Place International segment based primarily on net sales. The assets related to these functions are not allocated. The Company periodically reviews these allocations and adjusts them based upon changes in business circumstances. Net sales from external customers are derived from merchandise sales, and the Company has no major customers that account for more than
10%
of its net sales. As of
February 2, 2019
, The Children’s Place U.S. owned and operated
850
stores and The Children’s Place International owned and operated
122
stores. As of
February 3, 2018
, The Children’s Place U.S. owned and operated
886
stores and The Children’s Place International owned and operated
128
stores.
76
THE CHILDREN’S PLACE, INC. AND SUBSIDIARIES
NOTES TO CONSOLIDATED FINANCIAL STATEMENTS (Continued)
The following tables provide segment level financial information for
Fiscal 2018
,
Fiscal 2017
, and
Fiscal 2016
:
|
|
Fiscal Year Ended
|
||||||||||
|
|
February 2,
2019 |
February 3,
2018 |
January 28,
2017 |
||||||||
|
(In thousands)
|
|||||||||||
|
Net sales:
|
|
|
|
|
|
|
|||||
|
The Children’s Place U.S.
|
$
|
1,727,907
|
|
$
|
1,650,620
|
|
$
|
1,567,556
|
|
||
|
The Children’s Place International
(1)
|
210,177
|
|
219,655
|
|
217,760
|
|
|||||
|
Total net sales
|
$
|
1,938,084
|
|
$
|
1,870,275
|
|
$
|
1,785,316
|
|
||
|
Operating income:
|
|
|
|||||||||
|
The Children’s Place U.S.
|
$
|
86,983
|
|
$
|
132,152
|
|
$
|
113,376
|
|
||
|
The Children’s Place International
|
24,345
|
|
29,358
|
|
34,032
|
|
|||||
|
Total operating income
|
$
|
111,328
|
|
$
|
161,510
|
|
$
|
147,408
|
|
||
|
Operating income as a percent of net sales:
|
|||||||||||
|
The Children’s Place U.S.
|
5.0
|
%
|
8.0
|
%
|
7.2
|
%
|
|||||
|
The Children’s Place International
|
11.6
|
%
|
13.4
|
%
|
15.6
|
%
|
|||||
|
Total operating income
|
5.7
|
%
|
8.6
|
%
|
8.3
|
%
|
|||||
|
Depreciation and amortization:
|
|||||||||||
|
The Children’s Place U.S.
|
$
|
61,487
|
|
$
|
60,732
|
|
$
|
58,626
|
|
||
|
The Children’s Place International
|
7,397
|
|
7,427
|
|
7,108
|
|
|||||
|
Total depreciation and amortization
|
$
|
68,884
|
|
$
|
68,159
|
|
$
|
65,734
|
|
||
|
Capital expenditures:
|
|||||||||||
|
The Children’s Place U.S.
|
$
|
67,476
|
|
$
|
57,360
|
|
$
|
33,447
|
|
||
|
The Children’s Place International
|
3,638
|
|
1,297
|
|
1,237
|
|
|||||
|
Total capital expenditures
|
$
|
71,114
|
|
$
|
58,657
|
|
$
|
34,684
|
|
||
|
(1)
|
Net sales from The Children's Place International are primarily derived from revenues from Canadian operations. Our foreign subsidiaries, primarily in Canada, have operating results based in foreign currencies and are thus subject to the fluctuations of the corresponding translation rates into U.S. dollars.
|
|
February 2,
2019 |
February 3,
2018 |
||||||
|
(In thousands)
|
|||||||
|
Total assets:
|
|
|
|
|
|||
|
The Children’s Place U.S.
|
$
|
651,728
|
|
$
|
750,670
|
|
|
|
The Children’s Place International
|
75,318
|
|
189,558
|
|
|||
|
Total assets
|
$
|
727,046
|
|
$
|
940,228
|
|
|
77
THE CHILDREN’S PLACE, INC. AND SUBSIDIARIES
NOTES TO CONSOLIDATED FINANCIAL STATEMENTS (Continued)
Geographic Information
The Company's long-lived assets are located in the following countries:
|
February 2,
2019 |
February 3,
2018 |
|||||||
|
(In thousands)
|
||||||||
|
Long-lived assets
(1)
:
|
||||||||
|
United States
|
$
|
261,932
|
|
$
|
258,660
|
|
||
|
Canada
|
10,718
|
|
11,119
|
|
||||
|
Asia
|
1,251
|
|
1,247
|
|
||||
|
Total long-lived assets
|
$
|
273,901
|
|
$
|
271,026
|
|
||
____________________________________________
|
(1)
|
The Company's long-lived assets are comprised of net property and equipment and other assets.
|
|
13.
|
DERIVATIVE INSTRUMENTS
|
The Company is exposed to gains and losses resulting from fluctuations in foreign currency exchange rates attributable to inventory purchases denominated in a foreign currency. Specifically, our Canadian subsidiary’s functional currency is the Canadian dollar, but purchases inventory from suppliers in U.S. dollars. In order to mitigate the variability of cash flows associated with certain of these forecasted inventory purchases, we enter into foreign exchange forward contracts. These contracts typically mature within 12 months. We do not use forward contracts to engage in currency speculation, and we do not enter into derivative financial instruments for trading purposes.
The Company accounts for all of its derivatives and hedging activity under FASB ASC 815--
Derivatives and Hedging
.
Under the Company’s risk management policy and in accordance with guidance under the topic, in order to qualify for hedge accounting treatment, a derivative must be considered highly effective at offsetting changes in either the hedged item’s cash flows or fair value. Additionally, the hedge relationship must be documented to include the risk management objective and strategy, the hedging instrument, the hedged item, the risk exposure, and how hedge effectiveness will be assessed prospectively and retrospectively. The Company formally measures effectiveness of its hedging relationships both at the hedge inception and on an ongoing basis. The Company would discontinue hedge accounting under a foreign exchange forward contract prospectively (i) if management determines that the derivative is no longer highly effective in offsetting changes in the cash flows of a hedged item, (ii) when the derivative expires or is terminated, (iii) if the forecasted transaction being hedged by the derivative is no longer probable of occurring, or (iv) if management determines that designation of the derivative as a hedge instrument is no longer appropriate.
All derivative instruments are presented at gross fair value on the Consolidated Balance Sheets within either prepaid expenses and other current assets or accrued expenses and other current liabilities. As of
February 2, 2019
and
February 3, 2018
the Company had foreign exchange forward contracts with an aggregate notional amount of
$17.9 million
and
$30.0 million
, respectively, and the fair value of the derivative instruments was an asset of
$1.9 million
and
$1.6 million
, respectively. As these foreign exchange forward contracts are measured at fair value using observable market inputs such as forward rates, the Company's credit risk, and our counterparties’ credit risks, they are classified within Level 2 of the valuation hierarchy. Cash settlements related to these forward contracts are recorded in cash flows from operating activities within the consolidated statements of cash flows.
For derivative instruments that are designated and qualify as cash flow hedges, the effective portion of the gain or loss on the derivative is reported as a component of other comprehensive income (“OCI”) and reclassified into earnings within cost of sales (exclusive of depreciation and amortization) in the same period or periods during which the hedged transaction affects earnings. Gains and losses on the derivative representing hedge ineffectiveness are recognized in earnings within selling, general, and administrative expenses, consistent with where the Company records realized and unrealized foreign currency gains and losses on transactions in foreign denominated currencies. During Fiscal 2018, approximately
$0.1 million
of the effective portion of the gain on the derivative was reclassified into earnings within cost of sales. As of
February 2, 2019
, the gross value related to hedges of these transactions in OCI was approximately
$1.0 million
. Assuming
February 2, 2019
exchange rates remain constant,
$0.7 million
of gains, net of tax, related to hedges of these transactions are expected to be
78
THE CHILDREN’S PLACE, INC. AND SUBSIDIARIES
NOTES TO CONSOLIDATED FINANCIAL STATEMENTS (Continued)
reclassified from OCI into earnings over the next 12 months. Changes in fair value associated with derivatives that are not designated and qualified as cash flow hedges are recognized in earnings within selling, general, and administrative expenses.
The Company enters into foreign exchange forward contracts with major banks and has risk exposure in the event of nonperformance by either party. However, based on our assessment, the Company believes that obligations under the contracts will be fully satisfied. Accordingly, there was no requirement to post collateral or other security to support the contracts as of
February 2, 2019
.
|
14.
|
QUARTERLY FINANCIAL DATA (UNAUDITED)
|
In the opinion of management, the unaudited consolidated financial statements presented below contain all material adjustments, consisting of normal recurring accruals, necessary to present fairly the Company's financial position and results of operations and have been prepared in a manner consistent with the audited financial statements contained herein. Due to the seasonal nature of the Company's business, the results of operations in any given interim period are not indicative of operating results for a full fiscal year.
The following tables reflect quarterly consolidated statements of income for the periods indicated (unaudited):
|
Fiscal Year Ended February 2, 2019
|
||||||||||||||||
|
First
Quarter
|
Second
Quarter
|
Third
Quarter
|
Fourth
Quarter
|
|||||||||||||
|
(in thousands, except earnings per share)
|
||||||||||||||||
|
Net sales
|
$
|
436,314
|
|
$
|
448,718
|
|
$
|
522,495
|
|
$
|
530,557
|
|
||||
|
Gross profit
|
160,192
|
|
154,806
|
|
204,366
|
|
164,232
|
|
||||||||
|
Selling, general, and administrative expenses
|
118,471
|
|
124,210
|
|
123,207
|
|
132,455
|
|
||||||||
|
Asset impairment charges
|
1,257
|
|
3,979
|
|
396
|
|
464
|
|
||||||||
|
Other (income) costs
|
—
|
|
—
|
|
(1,246
|
)
|
191
|
|
||||||||
|
Depreciation and amortization
|
17,406
|
|
16,595
|
|
17,404
|
|
17,479
|
|
||||||||
|
Operating income
|
23,058
|
|
10,022
|
|
64,605
|
|
13,643
|
|
||||||||
|
Income before income taxes
|
22,761
|
|
9,076
|
|
63,774
|
|
12,913
|
|
||||||||
|
Provision (benefit) for income taxes
|
(8,776
|
)
|
1,590
|
|
13,861
|
|
889
|
|
||||||||
|
Net income
|
31,537
|
|
7,486
|
|
49,913
|
|
12,024
|
|
||||||||
|
Diluted earnings per share
|
$
|
1.78
|
|
$
|
0.45
|
|
$
|
3.03
|
|
$
|
0.74
|
|
||||
|
Diluted weighted average common shares outstanding
|
17,734
|
|
16,715
|
|
16,496
|
|
16,277
|
|
||||||||
|
Cash dividends declared and paid per common share
|
$
|
0.5000
|
|
$
|
0.5000
|
|
$
|
0.5000
|
|
$
|
0.5000
|
|
||||
79
THE CHILDREN’S PLACE, INC. AND SUBSIDIARIES
NOTES TO CONSOLIDATED FINANCIAL STATEMENTS (Continued)
|
Fiscal Year Ended February 3, 2018
|
||||||||||||||||
|
First
Quarter
|
Second
Quarter
|
Third
Quarter
|
Fourth
Quarter
(1)
|
|||||||||||||
|
(in thousands, except earnings per share)
|
||||||||||||||||
|
Net sales
|
$
|
436,676
|
|
$
|
373,601
|
|
$
|
490,026
|
|
$
|
569,972
|
|
||||
|
Gross profit
|
170,591
|
|
128,405
|
|
202,433
|
|
209,926
|
|
||||||||
|
Selling, general, and administrative expenses
|
112,127
|
|
108,227
|
|
118,288
|
|
137,844
|
|
||||||||
|
Asset impairment charges
|
484
|
|
974
|
|
3,203
|
|
529
|
|
||||||||
|
Other costs
|
4
|
|
6
|
|
4
|
|
(4
|
)
|
||||||||
|
Depreciation and amortization
|
15,692
|
|
15,979
|
|
16,789
|
|
19,699
|
|
||||||||
|
Operating income
|
42,284
|
|
3,219
|
|
64,149
|
|
51,858
|
|
||||||||
|
Income before income taxes
|
42,246
|
|
2,928
|
|
64,049
|
|
51,980
|
|
||||||||
|
Provision (benefit) for income taxes
|
6,017
|
|
(11,362
|
)
|
19,972
|
|
61,878
|
|
||||||||
|
Net income (loss)
|
36,229
|
|
14,290
|
|
44,077
|
|
(9,898
|
)
|
||||||||
|
Diluted earnings (loss) per share
|
$
|
1.97
|
|
$
|
0.79
|
|
$
|
2.44
|
|
$
|
(0.57
|
)
|
||||
|
Diluted weighted average common shares outstanding
|
18,401
|
|
18,177
|
|
18,090
|
|
17,359
|
|
||||||||
|
Cash dividends declared and paid per common share
|
$
|
0.4000
|
|
$
|
0.4000
|
|
$
|
0.4000
|
|
$
|
0.4000
|
|
||||
____________________________________________
(1) Significantly impacting the fourth quarter of Fiscal 2017 was a one-time tax charge of approximately $51.8 million as a result of the Tax Act. See Note 11 for further details.
|
15.
|
RETIREMENT AND SAVINGS PLANS
|
401(k) Plan
The Company has adopted The Children's Place 401(k) Savings Plan (the “401(k) Plan”), which qualifies under Section 401(k) of the Internal Revenue Code of 1986, as amended (the “Code”). The 401(k) Plan is a defined contribution plan established to provide retirement benefits for employees. The 401(k) Plan is employee funded up to an elective annual deferral and also provides for Company matching contributions up to a certain percentage amount of the employee's salary.
The 401(k) Plan is available for all U.S. employees who have completed 90 days of service with the Company. Following guidance in IRS Notice 98-52 related to the design-based alternative, or “safe harbor,” 401(k) plan method, the Company modified its 401(k) Plan for Company match contributions for non-highly compensated associates, as defined in the Code. For non-highly compensated associates, the Company matches the first
3%
of the participant's contribution and
50%
of the next
2%
of the participant's contribution and the Company match contribution vests immediately. For highly compensated associates, the Company has the discretion to match the lesser of
50%
of the participant's contribution or
2.5%
of the participant's covered compensation and the Company match contribution vests over
5
years. The Company's matching contributions were approximately
$3.5 million
in Fiscal 2018,
$3.2 million
in Fiscal 2017, and
$1.8 million
in Fiscal 2016.
Deferred Compensation Plan
The Company has a deferred compensation plan (the “Deferred Compensation Plan”), which is a nonqualified, unfunded plan, for eligible senior level employees. Under the plan, participants may elect to defer up to
80%
of his or her base salary and/or up to
100%
of his or her bonus to be earned for the year following the year in which the deferral election is made. The Deferred Compensation Plan also permits members of the Board of Directors to elect to defer payment of all or a portion of their retainer and other fees to be earned for the year following the year in which a deferral election is made. In addition, eligible employees and directors of the Company may also elect to defer payment of any shares of Company stock that is earned with respect to deferred stock awards. The Company may, but is not required to, credit participants with additional Company contribution amounts. Deferred amounts are not subject to forfeiture and are deemed invested among investment funds offered under the Deferred Compensation Plan, as directed by each participant. Payments of deferred amounts (as
80
THE CHILDREN’S PLACE, INC. AND SUBSIDIARIES
NOTES TO CONSOLIDATED FINANCIAL STATEMENTS (Continued)
adjusted for earnings and losses) are payable following separation from service or at a date or dates elected by the participant at the time the deferral is elected. Payments of deferred amounts are generally made in either a lump sum or in annual installments over a period not exceeding 15 years. During fiscal 2010, the Deferred Compensation Plan was amended to allow for cash deferrals made by members of the Board of Directors to be invested in shares of the Company’s common stock. Such elections are irrevocable and will be settled in shares of common stock. All other deferred amounts are payable in the form in which they were made; cash deferrals are payable in cash and stock deferrals are payable in stock. Earlier distributions are not permitted except in the case of an unforeseen hardship.
The Company has established a rabbi trust that serves as an investment to shadow the Deferred Compensation Plan liability; however, the assets of the rabbi trust are general assets of the Company and, as such, would be subject to the claims of creditors in the event of bankruptcy or insolvency. The investments of the rabbi trust consist of mutual funds and Company stock. The Deferred Compensation Plan liability, excluding Company stock, is included in other long-term liabilities and changes in the balance are recognized as compensation expense. The values of the mutual funds are included in other assets and related earnings and losses are recognized as investment income or loss, which is included in selling, general, and administrative expenses. Company stock deferrals are included in the equity section of the Company’s consolidated balance sheet as treasury stock and as a deferred compensation liability. Deferred stock is recorded at fair market value at the time of deferral, and any subsequent changes in fair market value are not recognized.
The Deferred Compensation Plan liability, excluding Company stock, at fair value, was approximately
$1.9 million
and
$1.8 million
at
February 2, 2019
and
February 3, 2018
, respectively. The value of the Deferred Compensation Plan assets was approximately
$1.9 million
and
$1.8 million
at
February 2, 2019
and
February 3, 2018
, respectively. Company stock was
$2.7 million
and
$2.4 million
at
February 2, 2019
and
February 3, 2018
, respectively.
Other Plans
Under statutory requirements, the Company contributes to retirement plans for its Canadian, Puerto Rican, and Asian operations. Contributions under these plans were approximately
$0.8 million
,
$0.9 million
, and
$0.5 million
in Fiscal 2018, Fiscal 2017, and Fiscal 2016, respectively.
|
16.
|
SUBSEQUENT EVENTS
|
On March 1, 2019, a wholly-owned subsidiary of the Company was named the successful bidder in the bankruptcy auction to acquire certain intellectual property and related assets (the “Gymboree Assets”) of Gymboree Group, Inc. and related entities. The wholly-owned subsidiary of the Company has agreed to pay $76.0 million in cash for the Gymboree Assets, which include the worldwide rights to the names “Gymboree” and “Crazy 8” and other intellectual property, including trademarks, domain names, copyrights, and customer databases. The purchase price will be funded by cash on hand and borrowings under the Company’s revolving credit facility. The acquisition has been approved by the United States Bankruptcy Court for the Eastern District of Virginia and is subject to other standard closing conditions.
In March 2019, the Board of Directors authorized the first quarter Fiscal 2019 dividend of $0.56 per share to be paid on April 26, 2019 to shareholders of record on the close of business on April 15, 2019.
Subsequent to February 2, 2019 and through March 19, 2019, the Company repurchased approximately 0.1 million shares for approximately $9.9 million.
81
(a)(3) Exhibits.
|
Exhibit
|
|
Description
|
|
Amended and Restated Certificate of Incorporation of the Company dated May 31, 2016 filed as Exhibit 3.1 to the registrant's Current Report on Form 8-K filed on June 7, 2016 is incorporated by reference herein.
|
||
|
Sixth Amended and Restated By-Laws of the Company filed as Exhibit 3.2 to the registrant's Form 8-K filed on June 7, 2016, is incorporated by reference herein.
|
||
|
4.1
(1)
|
Form of Certificate for Common Stock of the Company filed as an exhibit to the registrant's Registration Statement No. 333‑31535 on Form S-1, is incorporated by reference herein.
|
|
|
4.2
(1)
|
Amended Form of Certificate for Common Stock of the Company filed as Exhibit 4.2 to the registrant's Annual Report on Form 10-K for the period ended January 28, 2017, is incorporated by reference herein.
|
|
|
10.1
(*)
|
Amended and Restated 2005 Equity Incentive Plan of the Company, filed as Exhibit 10.3 to the registrant's Annual Report on Form 10-K for the period ended January 31, 2009, is incorporated by reference herein.
|
|
|
Lease Agreement as of August 12, 2003 between Orlando Corporation and The Children's Place (Canada), LP, together with Indemnity Agreement as of August 12, 2003 between the Company and Orlando Corporation, together with Surrender of Lease as of August 12, 2003 between the Company and Orlando Corporation and Orion Properties Ltd. (Canadian Distribution Center) filed as Exhibit 10.2 to the registrant's Quarterly Report on Form 10‑Q for the period ended November 1, 2003, is incorporated by reference herein.
|
||
|
Lease Agreement between the Company and Turnpike Crossing I, LLC (Dayton New Jersey Distribution Center), dated as of July 14, 2004 filed as Exhibit 10.2 to registrant's Quarterly Report on Form 10‑Q for the period ended July 31, 2004, is incorporated by reference herein.
|
||
|
Form of Indemnity Agreement between the Company and certain members of management and the Board of Directors filed as Exhibit 10.7 to registrant's Quarterly Report on Form 10-Q for the period ended August 2, 2008, is incorporated by reference herein.
|
||
|
Lease Agreement between The Children's Place Services Company, LLC and 500 Plaza Drive Corp. effective as of March 12, 2009 (500 Plaza Drive), Secaucus, New Jersey filed as Exhibit 10.67 to the registrant's Annual Report on Form 10-K for the period ended January 31, 2009, is incorporated by reference herein.
|
||
|
Guaranty between the Company and 500 Plaza Drive Corp. effective as of March 12, 2009 filed as Exhibit 10.68 to the registrant's Annual Report on Form 10-K for the period ended January 31, 2009, is incorporated by reference herein.
|
||
|
The First Lease Modification Agreement, dated as of August 27, 2009, between The Children's Place Services Company, LLC and 500 Plaza Drive Corp. filed as Exhibit 10.3 to the Registrant's Quarterly Report on Form 10-Q for the period ended August 1, 2009, is incorporated by reference herein.
|
||
|
The Company Nonqualified Deferred Compensation Plan effective January 1, 2010 filed as Exhibit 10.82 to the registrant's Annual Report on Form 10-K for the period ended January 30, 2010, is incorporated by reference herein.
|
||
|
10.9
(*)
|
Amended and Restated Employment Agreement, dated as of March 28, 2011, by and between the Company and Jane T. Elfers filed as Exhibit 10.1 to the registrant's Quarterly Report on Form 10-Q for the quarterly period ended April 30, 2011, is incorporated by reference herein.
|
|
|
10.10
(*)
|
Amendment No. 1 as of March 23, 2012 to Amended and Restated Employment Agreement dated as of March 28, 2011, by and between the Company and Jane T. Elfers filed as Exhibit 10.31 to the Registrant's Annual Report on Form 10-K for the period ended January 28, 2012, is incorporated by reference herein.
|
|
|
10.11
(*)
|
Deferred Stock Award Agreement, dated as of January 4, 2010, by and between the Company and Jane T. Elfers filed as Exhibit 10.84 to the registrant's Annual Report on Form 10-K for the period ended January 30, 2010, is incorporated by reference herein.
|
|
|
10.12
(*)
|
Form of Time-Based Restricted Stock Unit Award Agreement under the 2011 Equity Incentive Plan, filed as Exhibit 10.2 to the registrant's Current Report on Form 8-K filed on May 23, 2011, is incorporated by reference herein.
|
|
|
10.13
(*)
|
Form of Performance-Based Restricted Stock Unit Award Agreement under the 2011 Equity Incentive Plan, filed as Exhibit 10.3 to the registrant's Current Report on Form 8-K filed on May 23, 2011, is incorporated by reference herein.
|
|
|
Form of Amended and Restated Change in Control Agreement filed as Exhibit 10.41 to the registrant's Annual Report on Form 10-K for the period ended January 29, 2011, is incorporated by reference herein.
|
||
82
|
Exhibit
|
|
Description
|
|
10.15
(*)
|
Employment Offer Letter, dated as of November 26, 2012, by and between the Company and Michael Scarpa filed as Exhibit 10.40 to the registrant's Annual Report on Form 10-K for the period ended February 2, 2013, is incorporated by reference herein.
|
|
|
10.16
(*)
|
Letter Agreement dated October 3, 2014 between Anurup Pruthi and The Children's Place Services Company, LLC filed as Exhibit 10.22 to the registrant's Annual Report on Form 10-K for the period ended January 31, 2015, is incorporated by reference herein.
|
|
|
Agreement dated May 22, 2015, by and among The Children’s Place, Inc., Macellum SPV II, LP, Barington Companies Equity Partners, L.P., Jonathan Duskin, James A. Mitarotonda, certain of their affiliates listed on Schedule A to the Agreement, and Robert L. Mettler filed as Exhibit 10.1 to the registrant’s Current Report on Form 8-K filed on May 29, 2015, is incorporated herein by reference.
|
||
|
10.18
(*)
|
Form of Performance-Based Restricted Stock Unit Award Agreement under the 2011 Equity Incentive Plan (Senior Vice President & above) filed as Exhibit 10.1 to the registrant’s Quarterly Report on Form 10-Q for the period ended May 2, 2015, is incorporated by reference herein.
|
|
|
10.19
(*)
|
Form of Performance-Based Restricted Stock Unit Award Agreement under the 2011 Equity Incentive Plan (below Senior Vice President) filed as Exhibit 10.2 to the registrant’s Quarterly Report on Form 10-Q for the period ended May 2, 2015, is incorporated by reference herein.
|
|
|
10.20
(*)
|
Form of Time-Based Restricted Stock Unit Award Agreement under the 2011 Equity Incentive Plan (Senior Vice President & above) filed as Exhibit 10.3 to the registrant’s Quarterly Report on Form 10-Q for the period ended May 2, 2015, is incorporated by reference herein.
|
|
|
10.21
(*)
|
Form of Time-Based Restricted Stock Unit Award Agreement under the 2011 Equity Incentive Plan (below Senior Vice President) filed as Exhibit 10.4 to the registrant’s Quarterly Report on Form 10-Q for the period ended May 2, 2015, is incorporated by reference herein.
|
|
|
10.22
(*)
|
The Company Profit Sharing/401(k) Plan Adoption Agreement No.#001 for use with Fidelity Basic Plan Document No. 17 entered into by the Company and Fidelity Management Trust Company on September 11, 2015 as filed as Exhibit 10.28 to the registrant's Annual Report on Form 10-K for the period ended January 30, 2016, is incorporated by reference herein.
|
|
|
Credit Agreement dated July 31, 2008 by and among the Company and The Children's Place Services Company, LLC, as borrowers, The Children's Place (Virginia), LLC, The Children's Place Canada Holdings, Inc., The Childrensplace.com, Inc. and Twin Brook Insurance Company, Inc., as guarantors, Wells Fargo Retail Finance, LLC, as Administrative Agent, Collateral Agent, and Swing Line Lender and as a lender, and Bank of America, N.A., HSBC Bank USA, National Association and JPMorgan Chase Bank, N.A., as lenders, filed as Exhibit 10.8 to registrant's Quarterly Report on Form 10-Q for the period ended August 2, 2008, is incorporated by reference herein.
|
||
|
First Amendment to the Credit Agreement, effective as of March 12, 2009, by and among the Company and The Children's Place Services Company, LLC, as borrowers, The Children's Place (Virginia), LLC, The Children's Place Canada Holdings, Inc., The Childrensplace.com, Inc. and Twin Brook Insurance Company, Inc., as guarantors, Wells Fargo Retail Finance, LLC, as Administrative Agent, Collateral Agent, and Swing Line Lender and as a lender, and Bank of America, N.A., HSBC Bank USA, National Association and JPMorgan Chase Bank, N.A., as lenders, filed as Exhibit 10.65 to the registrant's Annual Report on Form 10-K for the period ended January 31, 2009, is incorporated by reference herein.
|
||
|
Second Amendment to Credit Agreement, dated as of May 4, 2009, by and among the Company and The Children's Place Services Company, LLC, as borrowers, The Children's Place (Virginia), LLC, The Children's Place Canada Holdings, Inc., The Childrensplace.com, Inc. and Twin Brook Insurance Company, Inc., as guarantors, Wells Fargo Retail Finance, LLC, as Administrative Agent, Collateral Agent, and Swing Line Lender and as a lender, and Bank of America, N.A., HSBC Bank USA, National Association and JPMorgan Chase Bank, N.A., as lenders, filed as Exhibit 10.1 to the Registrant's Quarterly Report on Form 10-Q for the period ended May 2, 2009, is incorporated by reference herein.
|
||
|
Third Amendment to Credit Agreement, dated as of July 29, 2009, by and among the Company and The Children's Place Services Company, LLC, as borrowers, The Children's Place (Virginia), LLC, The Children's Place Canada Holdings, Inc., The Childrensplace.com, Inc. and Twin Brook Insurance Company, Inc., as guarantors, Wells Fargo Retail Finance, LLC, as Administrative Agent, Collateral Agent, and Swing Line Lender and as a lender, and Bank of America, N.A., HSBC Bank USA, National Association and JPMorgan Chase Bank, N.A., as lenders, filed as Exhibit 10.2 to the Registrant's Quarterly Report on Form 10-Q for the period ended August 1, 2009, is incorporated by reference herein.
|
||
|
Fourth Amendment to Credit Agreement, dated October 5, 2009, by and among the Company and The Children's Place Services Company, LLC, as borrowers, The Children's Place (Virginia), LLC, The Children's Place Canada Holdings, Inc., The Childrensplace.com Inc. and Twin Brook Insurance Company, Inc., as guarantors, Wells Fargo Retail Finance, LLC, as Administrative Agent, Collateral Agent, and SwingLine Lender and as a lender, and Bank of America, N.A., HSBC Bank USA, National Association and JPMorgan Chase Bank, NA, as lenders, filed as Exhibit 10.1 to the Registrant's Quarterly Report on Form 10-Q for the period ended October 31, 2009, is incorporated by reference herein.
|
||
83
|
Exhibit
|
|
Description
|
|
Fifth Amendment to Credit Agreement, dated August 18, 2010, by and among the Company and The Children's Place Services Company, LLC, as borrowers, The Children's Place (Virginia), LLC, The Children's Place Canada Holdings, Inc., The Childrensplace.com Inc. and Twin Brook Insurance Company, Inc., as guarantors, Wells Fargo Retail Finance, LLC, as Administrative Agent, Collateral Agent, and SwingLine Lender and as a lender, and Bank of America, N.A., HSBC Bank USA, National Association and JPMorgan Chase Bank, NA, as lenders, filed as Exhibit 10.1 to the Registrant's Quarterly Report on Form 10-Q for the period ended October 30, 2010, is incorporated by reference herein.
|
||
|
Sixth Amendment to Credit Agreement, dated March 7, 2011, by and among the Company and The Children's Place Services Company, LLC, as borrowers, The Children's Place (Virginia), LLC, The Children's Place Canada Holdings, Inc., The Childrensplace.com Inc. and Twin Brook Insurance Company, Inc., as guarantors, Wells Fargo Retail Finance, LLC, as Administrative Agent, Collateral Agent, and SwingLine Lender and as a lender, and Bank of America, N.A., HSBC Bank USA, National Association and JPMorgan Chase Bank, NA, as lenders, filed as Exhibit 10.43 to the registrant's Annual Report on Form 10-K for the period ended January 29, 2011, is incorporated by reference herein.
|
||
|
Seventh Amendment to Credit Agreement, dated August 16, 2011, by and among the Company and The Children's Place Services Company, LLC, as borrowers, The Children's Place (Virginia), LLC, The Children's Place Canada Holdings, Inc. and The Childrensplace.com Inc., as guarantors, Wells Fargo Retail Finance, LLC, as Administrative Agent, Collateral Agent, and SwingLine Lender and as a lender, and Bank of America, N.A., HSBC Bank USA, National Association and JPMorgan Chase Bank, NA, as lenders, filed as Exhibit 10.1 to the registrant's Quarterly Report on Form 10-Q for the quarterly period ended July 30, 2011, is incorporated by reference herein.
|
||
|
Eighth Amendment to Credit Agreement, dated January 25, 2012, by and among the Company and The Children's Place Services Company, LLC, as borrowers, The Children's Place (Virginia), LLC, The Children's Place Canada Holdings, Inc. and The Childrensplace.com Inc., as guarantors, Wells Fargo Retail Finance, LLC, as Administrative Agent, Collateral Agent, SwingLine Lender and Lender and as a lender, and Bank of America, N.A., HSBC Bank USA, National Association and JPMorgan Chase Bank, NA, as lenders, filed as Exhibit 10.44 to the registrant’s Annual Report on Form 10-K for the period ended January 28, 2012, is incorporated by reference herein.
|
||
|
Ninth Amendment and Consent Letter to the Credit Agreement, dated May 1, 2012, by and among the Company and The Children's Place Services Company, LLC, as borrowers, The Children's Place (International), LLC, The Children's Place Canada Holdings, Inc., The Childrensplace.com, Inc., TCP IH I, LLC and TCP IH II, LLC, as guarantors, Wells Fargo Bank, National Association (successor by merger to Wells Fargo Retail Finance, LLC), as Administrative Agent and Collateral Agent, SwingLine Lender and as a lender, and Bank of America, N.A., HSBC Bank USA, and JPMorgan Chase Bank, N.A., as lenders, filed as Exhibit 10.2 to the registrant’s Quarterly Report on Form 10-Q for the period ended April 28, 2012.
|
||
|
Tenth Amendment to the Credit Agreement, dated December 20, 2012, by and among the Company and The Children's Place Services Company, LLC, as borrowers, The Children's Place (International), LLC, The Children's Place Canada Holdings, Inc., the childrensplace.com, inc., TCP IH II, LLC, TCP International IP Holdings, LLC and TCP International Product Holdings, LLC, as guarantors, Wells Fargo Bank, National Association (successor by merger to Wells Fargo Retail Finance, LLC), as Administrative Agent and Collateral Agent, SwingLine Lender and as a lender, and Bank of America, N.A., HSBC Bank USA, and JPMorgan Chase Bank, N.A., as lenders, filed as Exhibit 10.42 to the registrant’s Annual Report on Form 10-K for the period ended February 2, 2013.
|
||
|
Eleventh Amendment to the Credit Agreement, dated March 4, 2014, by and among the Company and The Children's Place Services Company, LLC, as borrowers, The Children's Place (International), LLC, The Children's Place Canada Holdings, Inc., the childrensplace.com, inc., TCP IH II, LLC, TCP International IP Holdings, LLC and TCP International Product Holdings, LLC, as guarantors, Wells Fargo Bank, National Association (successor by merger to Wells Fargo Retail Finance, LLC), as Administrative Agent and Collateral Agent, L/C Issuer, SwingLine Lender and as a lender, and Bank of America, N.A., HSBC Bank USA, N.A. and JPMorgan Chase Bank, N.A., as lenders, filed as Exhibit 10.33 to the registrant's Annual Report on Form 10-K for the period ended February 1, 2014, is incorporated by reference herein.
|
||
|
Twelfth Amendment to the Credit Agreement, dated September 15, 2015, by and among the Company and The Children's Place Services Company, LLC, as borrowers, The Children's Place (International), LLC, The Children's Place Canada Holdings, Inc., the childrensplace.com, inc., TCP IH II, LLC, TCP International IP Holdings, LLC and TCP International Product Holdings, LLC, as guarantors, Wells Fargo Bank, National Association (successor by merger to Wells Fargo Retail Finance, LLC), as Administrative Agent and Collateral Agent, L/C Issuer, Swing Line Lender and as a lender and Bank of America, N.A., HSBC Bank USA, N.A. and JPMorgan Chase Bank, N.A., as lenders, filed as Exhibit 10.1 to the registrant’s Quarterly Report on Form 10-Q for the period ended October 31, 2015, is incorporated by reference herein.
|
||
84
|
Exhibit
|
|
Description
|
|
10.36
(*)
|
Agreement and General Release dated as of November 30, 2015, between Brian Ferguson and The Children's Place Services Company, LLC filed as Exhibit 10.2 to the registrant’s Quarterly Report on Form 10-Q for the period ended October 31, 2015, is incorporated by reference herein.
|
|
|
The Children's Place Inc. Third Amended and Restated 2011 Equity Incentive Plan filed as Exhibit 10.1 to the registrant's Current Report on Form 8-K filed on June 7, 2016 is incorporated by reference herein.
|
||
|
10.38
(*)
|
Letter Agreement dated May 16, 2017 between The Children's Place Services Company, LLC and Pamela B. Wallack filed as Exhibit 10.1 to the registrant’s Quarterly Report on Form 10-Q for the period ended April 29, 2017, is incorporated by reference herein.
|
|
|
10.39
(*)
|
Letter Agreement dated May 24, 2017 between The Children's Place Services Company, LLC and John Sullivan filed as Exhibit 10.1 to the registrant’s Quarterly Report on Form 10-Q for the period ended July 29, 2017, is incorporated by reference herein.
|
|
|
10.40
(*)
|
Form of Performance-Based Restricted Stock Unit Award Agreement under the 2011 Equity Incentive Plan (Senior Vice President & above) filed as Exhibit 10.1 to the registrant’s Quarterly Report on Form 10-Q for the period ended May 5, 2018, is incorporated by reference herein.
|
|
|
10.41
(*)
|
Form of Performance-Based Restricted Stock Unit Award Agreement under the 2011 Equity Incentive Plan (below Senior Vice President) filed as Exhibit 10.2 to the registrant’s Quarterly Report on Form 10-Q for the period ended May 5, 2018, is incorporated by reference herein.
|
|
|
Subsidiaries of the Company.
|
||
|
Consent of Independent Registered Public Accounting Firm Ernst & Young, LLP.
|
||
|
Consent of Independent Registered Public Accounting Firm BDO USA, LLP.
|
||
|
Certificate of Principal Executive Officer pursuant to Section 302 of the Sarbanes Oxley Act of 2002.
|
||
|
Certificate of Principal Financial Officer pursuant to Section 302 of the Sarbanes Oxley Act of 2002.
|
||
|
Certification pursuant to 18 U.S.C. Section 1350, as adopted pursuant to Section 906 of the Sarbanes-Oxley Act of 2002.
|
||
|
101.INS*
|
XBRL Instance Document.
|
|
|
101.SCH*
|
XBRL Taxonomy Extension Schema.
|
|
|
101.CAL*
|
XBRL Taxonomy Extension Calculation Linkbase.
|
|
|
101.DEF*
|
XBRL Taxonomy Extension Definition Linkbase.
|
|
|
101.LAB*
|
XBRL Taxonomy Extension Label Linkbase.
|
|
|
101.PRE*
|
XBRL Taxonomy Extension Presentation Linkbase.
|
|
________________________________________
(1)
Exhibit numbers are identical to the exhibit numbers incorporated by reference to such registration statement.
(*)
Compensation Arrangement.
(+)
Filed herewith.
*
Pursuant to Rule 406T of Regulation S-T, these interactive data files are deemed not filed or part of a registration statement or prospectus for purposes of Sections 11 or 12 of the Securities Act of 1933 or Section 18 of the Securities Exchange Act of 1934 and otherwise are not subject to liability.
(b)
Exhibits
. The exhibits required by Item 601 of Regulation S-K are filed herewith or incorporated by reference.
(c)
Financial Statement Schedules and Other Financial Statements
.
Schedule II - Valuation and Qualifying Accounts
All other financial statement schedules are omitted from this Annual Report on Form 10-K, as they are not required or applicable or the required information is included in the financial statements or notes thereto.
85
ITEM 16.-FORM 10-K SUMMARY
Omitted at registrant's option.
86
SIGNATURES
Pursuant to the requirements of Section 13 or 15(d) of the Securities Exchange Act of 1934, the Registrant has duly caused this Report to be signed on its behalf by the undersigned, thereunto duly authorized.
|
|
THE CHILDREN’S PLACE, INC.
|
||
|
|
|
|
|
|
By:
|
/S/ Jane T. Elfers
|
||
|
Jane T. Elfers
|
|||
|
Chief Executive Officer and President
|
|||
|
March 21, 2019
|
|||
87
Pursuant to the requirements of the Securities Exchange Act of 1934, this Report has been signed below by the following persons on behalf of the Registrant and in the capacities and on the dates indicated.
|
Signature
|
Title
|
Date
|
||
|
/S/ Norman Matthews
|
Chairman of the Board
|
March 21, 2019
|
||
|
Norman Matthews
|
||||
|
/S/ Jane T. Elfers
|
Director, Chief Executive Officer and President
|
March 21, 2019
|
||
|
Jane T. Elfers
|
(Principal Executive Officer)
|
|||
|
/S/ Michael Scarpa
|
Chief Operating Officer and Chief Financial Officer
|
March 21, 2019
|
||
|
Michael Scarpa
|
(Principal Financial Officer)
|
|||
|
/S/ Joseph Alutto
|
Director
|
March 21, 2019
|
||
|
Joseph Alutto
|
||||
|
/S/ John E. Bachman
|
Director
|
March 21, 2019
|
||
|
John E. Bachman
|
||||
|
/S/ Marla Malcolm Beck
|
Director
|
March 21, 2019
|
||
|
Marla Malcolm Beck
|
||||
|
/S/ Joseph Gromek
|
Director
|
March 21, 2019
|
||
|
Joseph Gromek
|
||||
|
/S/ Robert Mettler
|
Director
|
March 21, 2019
|
||
|
Robert Mettler
|
||||
|
/S/ Stanley W. Reynolds
|
Director
|
March 21, 2019
|
||
|
Stanley Reynolds
|
||||
|
/S/ Susan Sobbott
|
Director
|
March 21, 2019
|
||
|
Susan Sobbott
|
||||
88
TABLE OF CONTENTS
Part IItem 1. -businessItem 1A. Risk FactorsItem 1B. -unresolved Staff CommentsItem 2. -propertiesItem 3. -legal ProceedingsItem 4. -mine Safety DisclosuresPart IIItem 5. -market For Registrant's Common Equity and Related Stockholder Matters and Issuer Purchases Of Equity SecuritiesItem 6. -selected Financial DataItem 7. -management's Discussion and Analysis Of Financial ConditionItem 7a--quantitative and Qualitative Disclosures About Market RiskItem 8. -financial Statements and Supplementary DataItem 9. -changes in and Disagreements with Accountants on Accounting and Financial DisclosureItem 9A. Controls and ProceduresItem 9B. -other InformationPart IIIItem 10. Directors, Executive Officers and Corporate GovernanceItem 11. Executive CompensationItem 12. Security Ownership Of Certain Beneficial Owners and Management and Related Stockholder MattersItem 13. Certain Relationships and Related Transactions, and Director IndependenceItem 14. Principal Accountant Fees and ServicesPart IVItem 15. -exhibits and Financial Statement SchedulesItem 16. -form 10-k Summary