UNITED STATES
SECURITIES AND EXCHANGE COMMISSION
Washington, D.C. 20549
FORM 10-K
(Mark One)
| ☒ |
ANNUAL REPORT PURSUANT TO SECTION 13 OR 15(d) OF THE SECURITIES EXCHANGE ACT OF 1934
|
For the fiscal year ended June 30, 2021
or
| ☐ |
TRANSITION REPORT PURSUANT TO SECTION 13 OR 15(d) OF THE SECURITIES EXCHANGE ACT OF 1934
|
For the transition period from to
Commission File Number 001-38427
PIEDMONT LITHIUM INC.
(Exact name of Registrant as specified in its Charter)
|
Delaware
|
36-4996461
|
|
|
(State or other jurisdiction of incorporation or organization)
|
(I.R.S. Employer Identification No.)
|
|
32 North Main Street, Suite 100
Belmont, North Carolina
|
28012
|
|
|
(Address of principal executive offices)
|
(Zip Code)
|
Registrant’s telephone number, including area code: (704) 461-8000
Securities registered pursuant to Section 12(b) of the Act:
|
Title of each class
|
Trading
Symbol(s)
|
Name of each exchange on which registered
|
||
|
Common stock, par value $0.0001 per share
|
PLL
|
The Nasdaq Capital Market
|
Securities registered pursuant to Section 12(g) of the Act:
None
Indicate by check mark if the registrant is a well-known seasoned issuer, as defined in Rule 405 of the Securities Act. YES ☒ NO ☐
Indicate by check mark if the registrant is not required to file reports pursuant to Section 13 or Section 15(d) of the Act. YES ☐ NO ☒
Indicate by check mark whether the registrant (1) has filed all reports required to be filed by Section 13 or 15(d) of the Securities Exchange Act of 1934 during the preceding 12 months (or for such shorter period that the registrant was required
to file such reports), and (2) has been subject to such filing requirements for the past 90 days. YES ☒ NO ☐
Indicate by check mark whether the registrant has submitted electronically every Interactive Data File required to be submitted pursuant to Rule 405 of Regulation S-T (§ 232.405 of this chapter) during the preceding 12 months (or for such shorter
period that the registrant was required to submit such files). YES ☒ NO ☐
Indicate by check mark whether the registrant is a large accelerated filer, an accelerated filer, a non-accelerated filer, smaller reporting company, or an emerging growth company. See the definitions of “large accelerated filer,” “accelerated
filer,” “smaller reporting company,” and “emerging growth company” in Rule 12b-2 of the Exchange Act.
|
Large accelerated filer
|
☐
|
Accelerated filer
|
☐
|
|
Non-accelerated filer
|
☒
|
Smaller reporting company
|
☒
|
|
Emerging growth company
|
☒
|
If an emerging growth company, indicate by check mark if the registrant has elected not to use the extended transition period for complying with any new or revised financial accounting standards provided pursuant to Section 13(a) of the Exchange
Act. ☐
Indicate by check mark whether the registrant has filed a report on and attestation to its management’s assessment of the effectiveness of its internal control over financial reporting under Section 404(b) of the Sarbanes-Oxley Act (15 U.S.C.
7262(b)) by the registered public accounting firm that prepared or issued its audit report. ☐
Indicate by check mark whether the registrant is a shell company (as defined in Rule 12b-2 of the Exchange Act). YES ☐ NO ☒
The aggregate market value of the voting and non-voting common equity held by non-affiliates of the Registrant as of December 31, 2020, the last business day of the most recently completed second fiscal quarter of
Registrant’s predecessor, was approximately $339,661,709, based on the closing price on The Nasdaq Capital Market reported for such date. Ordinary shares of the Registrant’s predecessor held by each officer and director and by each person who is
known to own 10% or more of the outstanding common stock have been excluded in that such persons may be deemed to be affiliates of the Registrant. This determination of affiliate status is not necessarily a conclusive determination for other
purposes.
As of September 16, 2021, there were 15,869,395 shares of the Registrant’s common stock outstanding.
DOCUMENTS INCORPORATED BY REFERENCE
None.
|
Page
|
|||
|
PART I
|
|||
|
Item 1.
|
5
|
||
|
Item 1A.
|
18 | ||
|
Item 1B.
|
30
|
||
|
Item 2.
|
30
|
||
|
Item 3.
|
30
|
||
|
Item 4.
|
31 | ||
|
PART II
|
|||
|
Item 5.
|
32 | ||
|
Item 7.
|
32 | ||
|
Item 7A.
|
38 | ||
|
Item 8.
|
39
|
||
|
Item 9.
|
64 | ||
|
Item 9A.
|
64 | ||
|
Item 9B.
|
65 | ||
|
PART III
|
|||
|
Item 10.
|
66 | ||
|
Item 11.
|
69
|
||
|
Item 12.
|
77 | ||
|
Item 13.
|
79
|
||
|
Item 14.
|
80
|
||
|
PART IV
|
|||
|
Item 15.
|
81 | ||
|
Item 16.
|
82 | ||
| 83 | |||
CAUTIONARY NOTE REGARDING FORWARD-LOOKING STATEMENTS
This annual report on Form 10-K contains forward-looking statements that involve risks and uncertainties and includes statistical data, market data and other industry data and forecasts, which we obtained from market
research, publicly available information and independent industry publications and reports that we believe to be reliable sources.
Certain information included or incorporated by reference in this annual report on Form 10-K may be deemed to be “forward-looking statements” within the meaning of applicable securities laws. Such forward-looking
statements concern our anticipated results and progress of our operations in future periods, planned exploration and, if warranted, development of our properties and plans related to our business and other matters that may occur in the future.
These statements relate to analyses and other information that are based on forecasts of future results, estimates of amounts not yet determinable and assumptions of management. All statements contained herein that are not clearly historical in
nature are forward-looking, and the words “anticipate,” “believe,” “expect,” “estimate,” “may,” “might,” “will,” “could,” “can,” “shall,” “should,” “would,” “leading,” “objective,” “intend,” “contemplate,” “design,” “predict,” “potential,” “plan,”
“target” and similar expressions are generally intended to identify forward-looking statements. Forward-looking statements are subject to a variety of known and unknown risks, uncertainties and other factors which could cause actual events or
results to differ from those expressed or implied by the forward-looking statements. Forward-looking statements in this annual report on Form 10-K include, but are not limited to, statements with respect to risks related to:
|
|
• |
our operations being further disrupted and our financial results being adversely affected by public health threats, including the novel coronavirus (“COVID-19”) pandemic;
|
|
|
• |
our limited operating history in the lithium industry;
|
|
|
• |
our status as an exploration stage company, including our ability to identify lithium mineralization and achieve commercial lithium mining;
|
|
|
• |
mining, exploration and mine construction, if warranted, on our properties, including timing and uncertainties related to acquiring and maintaining mining, exploration, environmental and other licenses,
permits, access rights or approvals in Gaston County, North Carolina, the Province of Quebec, Canada and Ghana as well as properties that we may acquire or obtain an equity interest in the future;
|
|
|
• |
completing required permitting, zoning and re-zoning activities required to commence mining and processing operations for the Carolina Lithium Project (as defined below);
|
|
|
• |
our ability to achieve and maintain profitability and to develop positive cash flows from our mining and processing activities;
|
|
|
• |
our estimates of mineral resources and whether mineral resources will ever be developed into mineral reserves;
|
|
|
• |
investment risk and operational costs associated with our exploration activities;
|
|
|
• |
our ability to develop and achieve production on our properties;
|
|
|
• |
our ability to enter into and deliver products under supply agreements;
|
|
|
• |
the pace of adoption and cost of developing electric transportation and storage technologies dependent upon lithium batteries;
|
|
|
• |
our ability to access capital and the financial markets;
|
|
|
• |
recruiting, training and developing employees;
|
|
|
• |
possible defects in title of our properties;
|
|
|
• |
compliance with government regulations;
|
|
|
• |
environmental liabilities and reclamation costs;
|
|
|
• |
estimates of and volatility in lithium prices or demand for lithium;
|
|
|
• |
our common stock price and trading volume volatility;
|
|
|
• |
the development of an active trading market for our common stock;
|
|
|
• |
our status as an emerging growth company; and
|
|
|
• |
our failure to successfully execute our growth strategy, including any delays in our planned future growth.
|
All forward-looking statements reflect our beliefs and assumptions based on information available at the time the assumption was made. These forward-looking statements are not based on historical facts but rather on
management’s expectations regarding future activities, results of operations, performance, future capital and other expenditures, including the amount, nature and sources of funding thereof, competitive advantages, business prospects and
opportunities. By its nature, forward-looking information involves numerous assumptions, inherent risks and uncertainties, both general and specific, known and unknown, that contribute to the possibility that the predictions, forecasts, projections
or other forward-looking statements will not occur. Although we have attempted to identify important factors that could cause actual results to differ materially from those described in forward-looking statements, there may be other factors that
cause results not to be as anticipated, estimated or intended. Should one or more of these risks or uncertainties materialize, or should underlying assumptions prove incorrect, actual results may vary materially from those anticipated, believed,
estimated, or expected. We caution readers not to place undue reliance on any such forward-looking statements, which speak only as of the date made. Except as otherwise required by the securities laws of the United States, we disclaim any
obligation to subsequently revise any forward-looking statements to reflect events or circumstances after the date of such statements or to reflect the occurrence of anticipated or unanticipated events. We qualify all the forward-looking statements
contained in this annual report on Form 10-K by the foregoing cautionary statements.
CAUTIONARY NOTE REGARDING DISCLOSURE OF MINERAL PROPERTIES
Reserves, Resources and Mineralized Material
We are subject to the reporting requirements of the applicable U.S. and Australian securities laws, and as a result we report our mineral reserves and mineral resources according to two different standards. U.S.
reporting requirements currently applicable to us are governed by the Securities Act of 1933, as amended (“Securities Act”), and the Exchange Act of 1934, as amended (“Exchange Act”), including Industry Guide 7 (“Guide 7”) and Regulation S-K, Subpart
1300 (“S-K 1300”). Australian reporting requirements for disclosure of mineral properties are governed by the 2012 Edition of the Australasian Code for Reporting of Exploration Results, Mineral Resources and Ore Reserves (“JORC Code”). Both sets of
reporting standards have similar goals in terms of conveying an appropriate level of confidence in the disclosures being reported but embody different approaches and definitions.
Under Guide 7, mineralization may not be classified as a reserve unless the determination has been made that the mineralization could be economically and legally produced or extracted at the time the reserve
determination is made. We are an exploration stage mining company, and we have no reserves as defined by Guide 7.
Beginning with our annual report on Form 10-K for the fiscal year ended June 30, 2022, we will need to comply with S-K 1300 in lieu of Guide 7. While the guidelines for reporting mineral resources, including
subcategories of measured, indicated and inferred resources, are largely similar for JORC Code and S-K 1300 standards, documentation is ongoing with respect to the S-K 1300 Technical Report Summary to formally categorize our mineral holdings as both
JORC Code and SK 1300 compatible.
The terms “mineral resource,” “measured mineral resource,” “indicated mineral resource” and “inferred mineral resource” are Australian mining terms defined in accordance with the JORC Code. Comparable terms are now
also defined by the U.S. Securities and Exchange Commission (“SEC”) in its newly adopted Modernization of Property Disclosures for Mining Registrants as promogulated in its S-K 1300 standards. While guidelines for reporting mineral resources,
including subcategories of measured, indicated and inferred resources, are largely similar for JORC Code and S-K 1300 standards, information contained herein that describes our mineral deposits may not be comparable to similar information made
public by other U.S. companies subject to reporting and disclosure requirements under the U.S. federal securities laws and the rules and regulations thereunder.
PART I
| Item 1. |
Overview
Piedmont Lithium Inc. is an exploration stage company developing a multi-asset, integrated lithium business contributing to the transition to a net zero carbon world and
the creation of a clean energy economy in North America. Through this endeavor, we are focused on developing and manufacturing battery quality lithium hydroxide for the fast-growing electric vehicle industry. The centerpiece of our
operations, our wholly-owned Carolina Lithium Project (“Carolina Lithium Project”), is located in the renowned Carolina Tin-Spodumene Belt of North Carolina. We are geographically diversified with equity investments in strategic partnerships
that own lithium resource assets in Canada and Ghana. Collectively, these resource assets and the location of these assets in the United States, Canada and Ghana, strategically position us to be a large, low-cost, sustainable producer of
lithium products, serving the North American and European electric vehicle and battery supply chains. The geology, geography and proximity of our resources, planned production operations and customer base, should allow us to deliver a
valuable supply of high-quality, sustainably produced lithium hydroxide from spodumene concentrate, which is preferred by most electric vehicle manufacturers. Our diversified operations should enable us to play a pivotal role in supporting
the move toward decarbonization and the electrification of transportation and energy storage.
Unless the context otherwise indicates, the terms “we,” “us,” “our,” the “Company,” or “Piedmont Lithium” all refer to Piedmont Lithium Inc. and its consolidated subsidiaries at all times on and after the effective
date of the Redomiciliation (as defined below) and refers to Piedmont Lithium Limited (“Piedmont Australia”) and its consolidated subsidiaries at all times prior to the effective date of the Redomiciliation.
Piedmont Lithium Inc. is incorporated in the State of Delaware. We maintain executive offices at 32 North Main Street, Suite 100, Belmont, NC 28012, and our telephone number is (704) 461-8000. Our website address is
www.piedmontlithium.com. Shares of our common stock, par value $0.0001 per share, are traded on the Nasdaq Capital Market (“Nasdaq”) under the symbol “PLL” and our Chess Depository Interests (“CDIs”), each representing 1/100th of a share of our
common stock, are traded on the Australian Securities Exchange (“ASX”), also under the symbol “PLL.”
Unless otherwise indicated, all references to “$” are to United States dollars, all references to “AUD” are to Australian dollars and all references to “CAD” are to Canadian
dollars. Our reporting currency is U.S. dollars.
Our fiscal year ends on June 30 of each calendar year. All references to years 2020, 2021, 2022, 2023 and 2024 in this Form 10-K refer to fiscal years ended June 30, 2020, 2021, 2022, 2023 and 2024, respectively,
unless otherwise stated.
Redomiciliation
Piedmont Lithium Inc. acquired all of the issued and outstanding ordinary shares of Piedmont Australia, our Australian predecessor and a wholly owned subsidiary, pursuant to a Scheme of Arrangement under Australian
law, which was approved by Piedmont Australia’s shareholders on February 26, 2021, and the Federal Court of Australia on May 5, 2021 (collectively referred to as “Redomiciliation”). As part of the Redomiciliation, the Company changed its place of
domicile from Australia to the State of Delaware in the United States, effective May 17, 2021.
Piedmont Australia’s ordinary shares were listed on the ASX, and Piedmont Australia’s American Depositary Shares (“ADSs”), each representing 100 of Piedmont Australia’s ordinary shares, were traded on Nasdaq.
Following the approval of the Redomiciliation, the Company moved its primary listing from the ASX to Nasdaq and retained an ASX listing via CDIs, each representing 1/100th of a share of common stock of Piedmont Lithium Inc.
Pursuant to the Redomiciliation, holders of Piedmont Australia’s ordinary shares received one (1) CDI in Piedmont Lithium Inc. for each ordinary share held in Piedmont Australia on the Redomiciliation record date;
and holders of ADSs in Piedmont Australia, each of which represented 100 Piedmont Australia ordinary shares, received one (1) share of common stock of Piedmont Lithium Inc. for each ADS held in Piedmont Australia on the Redomiciliation record date.
All issued and outstanding shares of our common stock have been retroactively adjusted in these consolidated financial statements to reflect the 100:1 ratio and share consolidation as if these events had occurred
on July 1, 2019.
Our Segment
We have one operating segment which is also our reportable segment. Our chief operating decision maker, who is also our Chief Executive Officer, manages our operations on a consolidated basis for purposes of
allocating resources.
Our Strategy
Our strategy is to become a highly strategic, fully-integrated North American producer of lithium hydroxide using spodumene concentrate sourced from multiple global mineral deposits in which we hold both
economic interests and long-term supply agreements. The centerpiece of our business will be our wholly-owned Carolina Lithium Project in North Carolina. We also hold economic interests and long-term supply agreement rights in an existing
spodumene mine in Canada and pre-production spodumene deposits in Canada and Ghana.
Our strategy involves developing a low cost, highly sustainable, North American source of lithium hydroxide manufactured from both domestic and imported spodumene concentrate, giving North American battery and
electric vehicle manufacturers better continuity of supply while also helping them meet their environmental commitments. A key component of our strategy is to become an “integrated” supplier with access to premier global mineral resources,
spodumene concentrate facilities and lithium hydroxide processing facilities. This approach should allow us to become one of the most sustainable, cost-effective suppliers in the world, and further help potential customers achieve their
important environmental, social and governance (“ESG”) goals required by shareholders and regulatory agencies.
Complementary to our lithium-based strategy is our plan to maximize the utilization of the Carolina Lithium Project’s mineral resources, including marketable byproducts quartz, feldspar and mica. The existence of
these minerals in the Carolina Lithium Project’s ore body creates additional revenue streams while lowering production costs related to our primary extraction and processing of lithium hydroxide. The availability and marketability of quartz,
feldspar, and mica will significantly reduce waste associated with the manufacturing of lithium hydroxide, thereby contributing to our sustainability goals within our ESG strategy.
Our equity investments in Quebec, Canada, which include an existing North American Lithium (“North American Lithium” or “NAL”) mine near Val-d’Or, Canada, position
us for potential future production of spodumene concentrate in the Province of Quebec, while taking advantage of low-cost, zero-carbon hydroelectricity. We believe our equity investment and earn-in agreement in Ghana will provide us
access to hard rock lithium assets including a future long-term supply of spodumene concentrate through our existing spodumene concentrate supply agreement.
Our strategy is to continue to evaluate strategic partnership opportunities with lithium projects globally that are located in favorable jurisdictions, have the potential for scale, low-cost, sustainable
production practices, and are logistically-advantaged relative to our proposed lithium hydroxide manufacturing sites.
Our business plan is subject to market conditions and the ability to define an economically viable project. We intend to implement our business plan by:
|
|
• |
completing additional drilling programs on our properties to expand current mineral resource estimates and increase geological confidence of our mineral resource estimates;
|
|
|
• |
continuing to secure additional properties within the Carolina Tin-Spodumene Belt to undertake additional exploration;
|
|
|
• |
undertaking further technical studies to assess the economic potential of the Carolina Lithium Project and defining a lithium reserve base, including further metallurgical studies and feasibility studies;
|
|
|
• |
undertaking discussions with potential lithium offtake parties for future sale of lithium products;
|
|
|
• |
completing permitting and zoning activities required to commence mining and processing operations for the Carolina Lithium Project;
|
|
|
• |
evaluating the potential restart of operations at North American Lithium in Quebec, Canada;
|
|
|
• |
advancing our earn-in interests allowing for increased equity investment in Ghana;
|
|
|
• |
completing required financing activities;
|
|
|
• |
completing construction for our lithium mining and processing activities, globally;
|
|
|
• |
commencing lithium mining and processing activities to supply electric vehicle and battery storage markets; and
|
|
|
• |
commencing byproduct manufacturing and sales operations for our Carolina Lithium Projects.
|
Ownership Interests
Through our parent entity, Piedmont Lithium Inc., and our wholly-owned subsidiary, Piedmont Lithium Limited, we hold an equity interest of approximately 19% in Sayona Mining
Limited (“Sayona”), an Australian company publicly listed on the ASX and based in Australia, for the purpose of forming a strategic partnership to explore, evaluate, mine, develop and ultimately produce spodumene concentrate in Quebec, Canada.
Through our subsidiary, Piedmont Lithium Quebec Holdings, Inc., we hold a 25% equity interest in Sayona Quebec Inc. (“Sayona Quebec”) for the purpose of furthering our
investment and strategic partnership in Quebec, Canada with Sayona. The remaining 75% equity interest is held by Sayona. Sayona Quebec holds a 100% interest in the existing lithium mining operations of North American Lithium.
Through our subsidiary, Piedmont Lithium Ghana Holdings, Inc., we hold an equity interest of approximately 10% in IronRidge Resources Limited (“IRR”), an Australian company
publicly listed on the Alternative Investment Market of the London Stock Exchange, for the purpose of forming a strategic partnership to explore, evaluate, mine, develop and ultimately produce spodumene concentrate in Ghana. This investment was made
subsequent to the year ended June 30, 2021.We have the right to acquire up to a 50% equity interest in the Ghanaian entities, which are currently wholly-owned subsidiaries of IRR, through expected future staged investments of up to $87 million. See
Note 17 to the consolidated financial statements in this Form 10-K.
Through our subsidiary, Piedmont Lithium Carolinas, Inc., we hold a 33% equity interest in Pronto Minerals, LLC (“Pronto Minerals”), a North Carolina limited liability company, for the purpose of marketing and selling
byproducts, specifically quartz, feldspar and mica, produced by Piedmont Lithium Inc. The remaining 67% equity interest is held by Ion Carbon Minerals, LLC (“Ion”), a North Carolina limited liability company.
Our Lithium Projects
Carolina Lithium Project
Overview
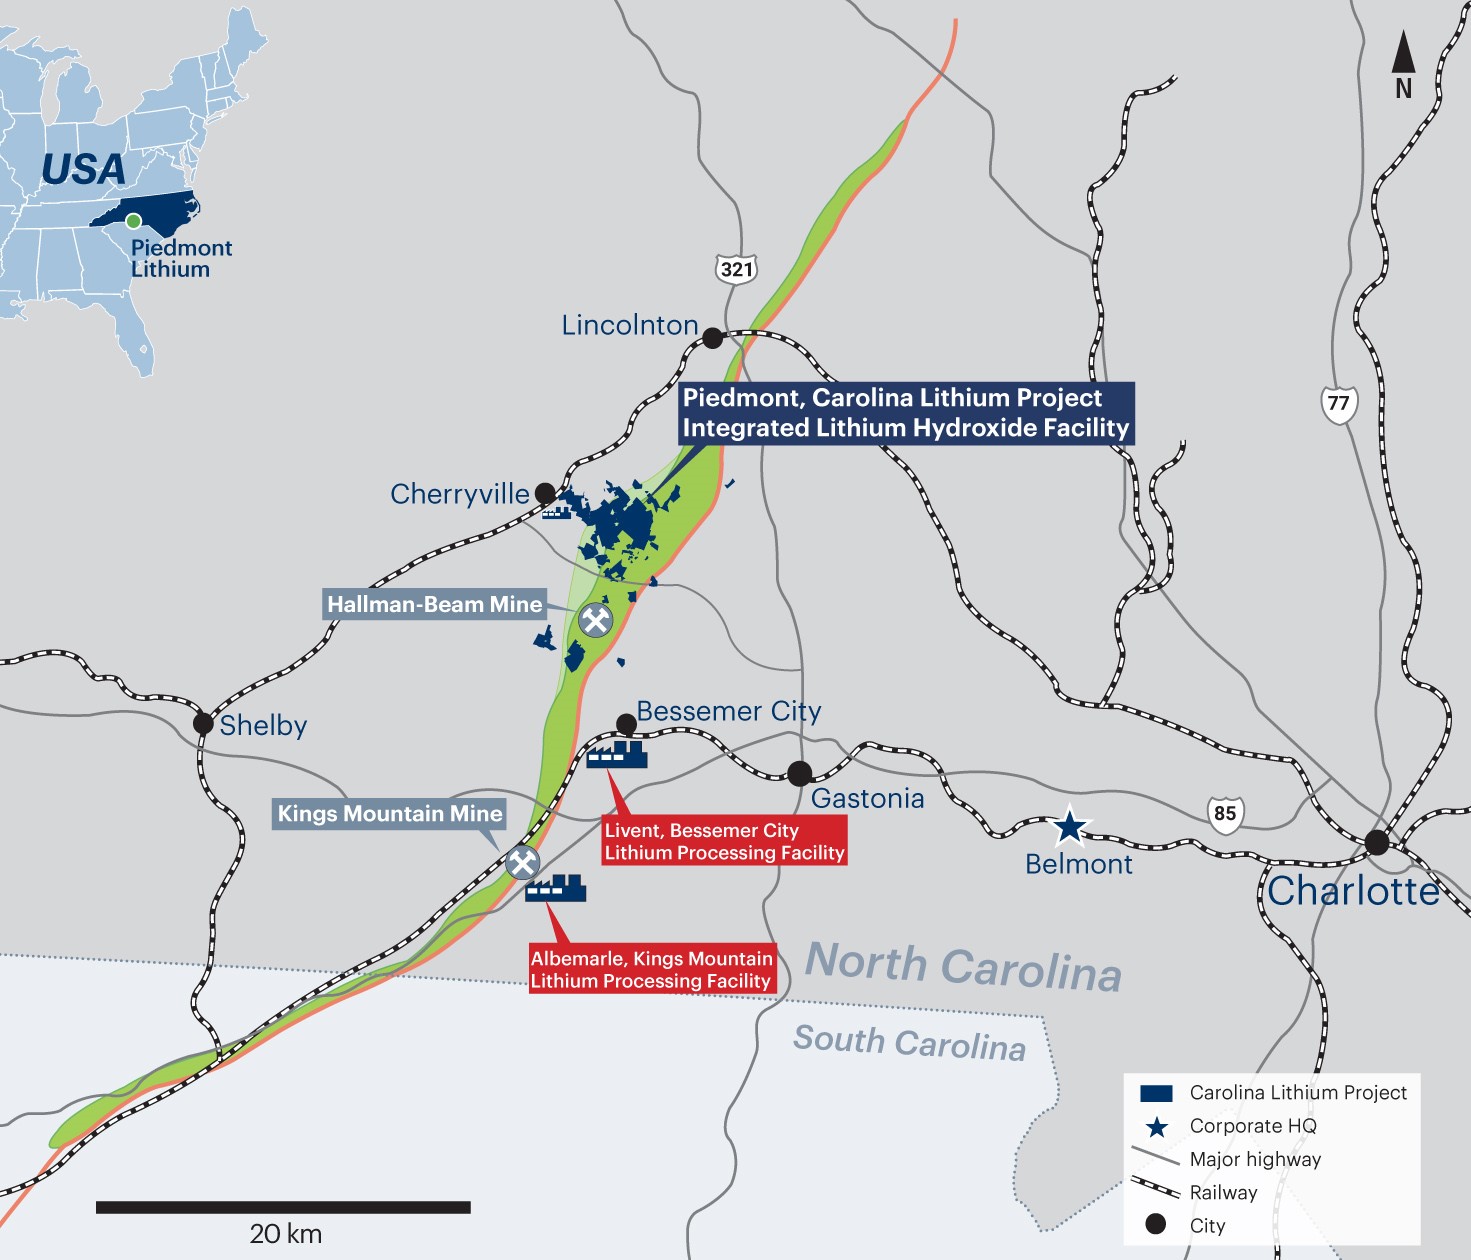
Piedmont Lithium holds a 100% interest in the Carolina Lithium Project located within the Carolina Tin-Spodumene Belt, which historically provided most of the western
world’s lithium between the 1950s and 1980s. The Carolina Tin-Spodumene Belt is located approximately 25 miles west of Charlotte, North Carolina in the United States.
As of June 30, 2021, the Carolina Lithium Project comprised approximately 3,116 acres of surface property and associated mineral rights, of which approximately 1,329 acres were owned, approximately 113 acres were
subject to long-term leases, approximately 79 acres were subject to lease-to-own agreements, and approximately 1,595 acres were subject to exclusive option agreements. These exclusive option agreements, upon exercise, allow us to purchase or, in
some cases, enter into long-term lease agreements for the surface property and associated mineral rights. Our option agreements provide for annual option payments, bonus payments during periods when we conduct drilling, and royalty payments during
periods when we conduct mining. Our option agreements generally provide us with an option to purchase the optioned property at a specified premium over fair market value. Our obligation to make annual option payments and drilling payments will
terminate with respect to a property if we exercise our purchase option. We also own a 61-acre property in Kings Mountain, North Carolina.
We have reported mineral resource estimates as part of our exploration and evaluation activities, which include completion of 582 drill holes totaling 85,592 meters and spanning five drilling campaigns as of June 30,
2021. As of the date of this annual report on Form 10-K, we have completed 599 exploration drill holes totaling 88,185 meters and spanning five drill campaigns.
Since securing the exploration rights and initial land position in 2016, we have focused on proving the potential of mineral resources for the Carolina Lithium Project. As of June 30, 2021, resource drilling has
defined over 100 spodumene-bearing pegmatite bodies within areas of our properties with most of the spodumene-bearing mineralization on our properties occurring within 150 meters of the surface. The Carolina Tin-Spodumene Belt is one of the
premier locations in the world for exploration of lithium pegmatites given its favorable geology and easy access to infrastructure, power, research and development centers for lithium and battery storage, major high-technology population
centers and downstream lithium processing facilities.
Piedmont Lithium Location in the Carolina Tin-Spodumene Belt
Spodumene Concentrate Operation
The integrated Scoping Study update for the Carolina Lithium Project is based on a 20-year project life, with an estimated average annual production of 248,000 metric tons of spodumene concentrate (“SC6”) at
steady-state.
Lithium Hydroxide Conversion Operation
The integrated Scoping Study update for the Carolina Lithium Project assumes a lithium hydroxide conversion plant, also referred to as a chemical plant, will operate for 20 years, with production commencing
approximately 90 days after the start of the spodumene concentrator. The lithium hydroxide chemical plant has an estimated production rate of 30,000 metric tons of lithium hydroxide per year.
Byproducts
Our forecasted production of byproducts is based on the current process design of the concentrator and the demand estimates we have received from potential customers for these minerals. We have assumed that
approximately 252,000 metric tons per year of quartz concentrate, approximately 392,000 metric tons per year of feldspar concentrate, and approximately 70,000 metric tons per year of mica concentrate will be produced at steady-state production on
an annual basis.
Operating and Capital Costs
The integrated Carolina Lithium Project is projected to have an average life of project cash operating cost of approximately $2,943 per metric ton of lithium hydroxide, including royalties and net of byproduct
credits, potentially positioning Piedmont Lithium as one of the industry’s lowest-cost producers. The Scoping Study estimates total development capital costs to construct the integrated Carolina Lithium Project to be approximately $840 million,
which includes land expenses, owner’s costs, and approximately $128 million in contingency.
Quebec Projects
Overview
The Quebec Projects are located in the Abitibi region of Quebec, Canada, and are jointly owned by Piedmont Lithium and Sayona through a strategic partnership in Sayona Quebec. Piedmont Lithium and Sayona have
equity interests of 25% and 75%, respectively, in Sayona Quebec.
Sayona Quebec’s assets are comprised of three projects: (i) the Authier
Project, (ii) the Tansim Project and (iii) North American Lithium, which was acquired by Sayona Quebec in August 2021 subsequent to the year ended June 30, 2021. Sayona Quebec is reviewing the potential consolidation of spodumene resources
for these projects
located in Quebec.
The Authier Project is a feasibility-stage project located approximately 28 miles northwest of the city of Val-d’Or, a major mining center in Quebec. Val-d’Or is located approximately 290 miles northwest of the
city of Montreal. The Authier Project is easily accessible by a rural road network connecting to a national highway a few miles east of the project site.
NAL is an existing spodumene mine and concentrator currently in care and maintenance and is fully permitted with over $400 million previously invested in mining, spodumene concentrate and refining capacity. NAL is
located approximately 20 miles from the Authier Project near Val-d’Or. NAL was operational and ramping toward nameplate production in 2018, when it was placed on care and maintenance due to weak lithium markets and poor capital structure.
The Tansim Project is an exploration stage project located approximately 51 miles southwest of the Authier Project.
Technical studies will contemplate the integration of Sayona Quebec’s
Authier Project with
Sayona Quebec’s
operations at NAL, including restart requirements, technical improvements, and optimization of NAL’s operations in order to fully utilize this competitive set of assets. Through the strategic partnership, Sayona and Sayona Quebec are
prioritizing the manufacturing of lithium products
in Quebec and capitalizing on Quebec’s competitive advantages, which include access to
skilled labor, strong infrastructure, governmental mining support, and zero-carbon, low-cost hydropower.
Technical studies are currently underway for the planned restart of spodumene concentrate operations for NAL. A definitive feasibility study integrating production from NAL and the Authier Project is expected in
the first half of 2022.
Supply Agreement
We entered into a long-term supply agreement with Sayona in January 2021. Under the terms of the supply agreement, Sayona Quebec will supply Piedmont Lithium the greater of 113,000 metric tons per year or 50% of
Sayona Quebec’s planned spodumene concentrate production from the combination of NAL and the Authier Project. Under the agreement, spodumene concentrate is priced on an equivalent cost, insurance and freight, or CIF, China market price basis on a
delivered at price, or DAP, (Incoterms 2020) basis to Cherryville, North Carolina.
Investments
We have invested a total of $16.1 million, net of acquisition costs, as of June 30, 2021, in the Quebec Projects through our equity investments in Sayona and Sayona Quebec. Our total investment of $16.1 million as of
June 30, 2021 was comprised of the following investments:
|
|
• |
between January and June 2021, we made payments totaling $11.1 million to Sayona as part of an agreement to acquire an equity interest of approximately 19% in
Sayona; and
|
|
|
• |
on June 7, 2021, we paid $5.0 million to Sayona for a 25% equity interest in Sayona Quebec. The remaining 75% equity interest in Sayona Quebec is held by Sayona.
|
Subsequent to the year ended June 30, 2021, we made additional equity investments in Sayona and Sayona Quebec as follows:
|
|
• |
on August 20, 2021, we invested AUD 9.8 million ($7.0 million) in equity offerings by Sayona. Our equity interest in Sayona was approximately 19% as of June 30,
2021 and as of the date of this annual report on Form 10-K; and
|
|
|
• |
on August 30, 2021, Sayona Quebec acquired substantially all of the assets of NAL for CAD 97.9 million ($77.8 million). The assets acquired primarily consisted of
an existing mine and related mining assets in the Abitibi region near Val d’Or, Quebec, Canada. We paid CAD 24.5 million ($19.5 million) to Sayona Quebec, representing our 25% equity interest contribution, and Sayona paid CAD 73.4
million ($58.3 million), representing Sayona’s 75% equity interest contribution, which collectively gave Sayona Quebec the ability to fund the purchase of NAL’s assets.
|
See Note 17 to the consolidated financial statements in this Form 10-K.
Ghana Project
On August 31, 2021, subsequent to the year ended June 30, 2021, we invested $15.9 million to acquire an equity interest of approximately 10% in IRR and to form a
strategic partnership with IRR for the production of spodumene concentrate in Ghana. See Note 17 to the consolidated financial statements in this Form 10-K.
Overview
The Ghana Project is a strategic partnership between Piedmont Lithium and IRR through our purchase of an equity interest in IRR, our expected staged investments over a
period of three to four years to acquire a 50% equity interest in IRR’s Ghanaian-based Cape Coast Lithium Portfolio (“IRR Ghana”), and a long-term supply agreement for 50% of IRR Ghana’s planned spodumene concentrate production. The Ghana
Project is an exploration stage project located on the south coast of the Ghana and covering an area of approximately 425 square miles.
The Ewoyaa Project, which is the flagship deposit of the Ghana Project, is located on the south coast of Ghana less than one mile from the Takoradi-Accra National Highway with a relatively short transport distance of approximately 68 miles to
the port of Takoradi. The project site is adjacent to high voltage power and is expected to have a low environmental impact due to reliance on solar and hydroelectric generating capacity to power operations.
Supply Agreement
On July 1, 2021, we entered into a long-term supply agreement with IRR giving Piedmont Lithium 50% of IRR Ghana’s life of mine production of spodumene concentrate. Pricing
for the offtake supply of spodumene concentrate will be at market rates at the time of purchase. Under the agreement, spodumene concentrate is priced on a CIF, China market price basis less ocean freight and insurance on a net back basis to
first on board vessel (Incoterms 2020) at the Port of Takoradi, Ghana.
Investments
On August 31, 2021, subsequent to the year ended June 30, 2021, we paid GBP 11.5 million ($15.9 million) to IRR as part of an agreement:
|
|
• |
to acquire to an equity interest of approximately 10% in IRR;
|
|
|
• |
with the ability to acquire a 22.5% equity interest in IRR Ghana by funding $17.0 million in the Ewoyaa Project for all of the exploration and definitive feasibility study expenses over the next 24 months;
and
|
|
•
|
with the ability to acquire an additional 27.5% of IRR’s operations in Ghana, by solely funding an additional $70.0 million in capital costs for the Ewoyaa Project.
|
Strengths
We believe that we are well-positioned to successfully execute our business strategies primarily due to our following competitive strengths:
|
|
• |
Located in a historical major lithium mining and manufacturing district in the United States
—The integrated Carolina
Lithium Project is located within the Carolina Tin-Spodumene Belt and along trend to the Hallman Beam and Kings Mountain mines, which historically provided much of the western world’s lithium between the 1950s and 1980s. The Carolina
Tin-Spodumene Belt extends over 40 miles in length and reaches a maximum width of approximately one mile.
|
| • | Significant existing infrastructure —We believe the Carolina Lithium Project is well situated in a historical lithium district, with access to road and rail infrastructure, a highly skilled labor force, low-cost and low carbon sources of baseload grid power, research and development centers for lithium and battery storage, and access to major high technology population centers. |
|
|
• |
Diversification of resources
—During 2021, we made investments in and established strategic partnerships with Sayona and IRR. We continue to pursue opportunities to
complement our business through additional acquisitions, joint ventures, strategic alliances, and/or investments.
|
| • |
Acquisition of past-producing assets
—Subsequent to fiscal year 2021 and through our equity investment in Sayona Quebec, we successfully acquired the past producing
mining assets of NAL located in the Abitibi region, near Val d’Or, Quebec, Canada.
|
|
|
• |
Technology selection
—During 2021, we partnered with Metso Outotec on lithium hydroxide conversion technology. We believe that the selection of Metso Outotec’s
innovative alkaline pressure leach technology for the conversion of spodumene concentrate to lithium hydroxide should provide us with a relative advantage in capital and operating costs as well as our environmental profile, including
carbon intensity, compared to other hard rock lithium conversion methods.
|
|
|
• |
Highly experienced management team with a long history of developing and operating mining, energy, and lithium manufacturing projects
—During 2021, we expanded our
management team and increased our core skills with people experienced in the management, operations, sales and marketing of lithium manufacturing operations. Our management team has significant experience in acquiring, developing, and
financing mining and chemical projects. We have increased our corporate capabilities in areas of finance, accounting, legal, and human resources.
|
Marketing, Sales, Contracts and Principal Markets
On September 28, 2020, we entered into a sales agreement with a vehicle manufacturer (“Buyer”) to provide spodumene concentrate to the Buyer. The agreement commits us to sell, at a
fixed maximum price, a number of tons of spodumene concentrate equal to approximately one-third of our estimated average annual production. The agreement has an initial five-year term running from the first delivery date and may be extended by
mutual agreement for a second five-year term. The agreement contemplates a number of areas where the parties must come to a mutual agreement. For example, the agreement is conditional upon the Buyer and our mutual agreement, based on the
development schedules of both parties, to a start date for deliveries and to the parties agreeing in good faith to an allocation of certain material costs.
On July 31, 2020, we entered into a strategic partnership with Ion to form Pronto Minerals for the purpose of marketing and selling byproducts, specifically quartz, feldspar and mica, produced by our Carolina
Lithium Project.
We continue to develop a marketing and sales strategy that includes production from the Carolina Lithium Project, as well as our other lithium projects. Based on historical
and current production in the Carolina Tin-Spodumene Belt and other demand by producers in North Carolina, we anticipate producing battery-grade lithium hydroxide, spodumene concentrate, and certain other byproducts including quartz, feldspar and
mica, all of which may be used by the global electric vehicle, energy storage and construction materials markets.
Specialized Skills and Knowledge
We rely on specialized skills and knowledge to gather, interpret and process geological and geophysical data, successfully permit and then design, build and operate extraction facilities and engage in numerous
additional activities required as part of the mine-to-lithium hydroxide process. We have employed, and expect to continue to employ, a strategy of contracting consultants and other service providers with specialized skills and knowledge to supplement
the skills and knowledge of our permanent staff to undertake our lithium operations effectively.
Competition
We compete with other mineral and chemical processing companies, many of which possess greater financial resources and technical facilities than we do, in connection with the acquisition of suitable exploration
properties and the engagement of qualified personnel. Although we aspire to be a leading lithium hydroxide producer in North America, the lithium mining and chemical industry is fragmented, and we are one of many participants in this sector. Many
of our competitors have been in business longer and have established more strategic partnerships and relationships and have greater financial accessibility than we have.
While we compete with other exploration companies in acquiring suitable properties, we believe there will be readily available purchasers of lithium chemical products or other industrial minerals if they were to be
produced from any of our leased properties. The price of our planned products can be affected by a number of factors beyond our control, including fluctuations in the market prices for lithium, supplies of lithium, demand for lithium as well as
mining activities of others.
If we identify lithium mineralization that is determined to be of economic grade and in sufficient quantity to justify production, additional capital would be required to develop, mine and sell our production.
Government Regulations
Overview
Our exploration activities for the Carolina Lithium Project and our other projects are subject to extensive laws and regulations, which are overseen and enforced by multiple U.S. federal, state, and local
authorities, as well as foreign jurisdictions. These applicable laws govern exploration, development, production, exports, various taxes, labor standards, occupational health and safety, waste disposal, protection and remediation of the
environment, protection of endangered and protected species and other matters. Mineral exploration activities are also subject to applicable U.S. federal and state laws, as well as foreign jurisdictions and regulations that seek to maintain health
and safety standards by regulating the design and use of drilling methods and equipment. Various permits from government bodies are required for drilling operations to be conducted, and we cannot assure you such permits will be received.
Environmental laws and regulations may also, among other things:
|
|
• |
require notice to stakeholders of proposed and ongoing exploration, drilling, environmental studies, mining or production activities;
|
|
|
• |
require the installation of pollution control equipment;
|
|
|
• |
restrict the types, quantities and concentrations of various substances that can be released into the environment in connection with exploration, drilling, mining, lithium hydroxide manufacturing or other
production activities;
|
|
|
• |
limit or prohibit drilling, mining, lithium manufacturing or other production activities on lands located within wetlands, areas inhabited by endangered species and other protected areas, or otherwise
restrict or prohibit activities that could impact the environment, including water resources;
|
|
|
• |
impose substantial liabilities for pollution resulting from current or former operations on or for any preexisting environmental impacts our projects;
|
|
|
• |
require significant reclamation obligations in the future as a result of our mining and chemical operations; and
|
|
|
• |
require preparation of an environmental assessment or an environmental impact statement.
|
Compliance with environmental laws and regulations may impose substantial costs on us, subject us to significant potential liabilities, and have an adverse effect upon our capital expenditures, results of operations
and/or competitive position. Violations and liabilities with respect to these laws and regulations could result in significant administrative, civil, or criminal penalties, remedial clean-ups, natural resource damages, permit modifications and/or
revocations, operational interruptions and/or shutdowns and other liabilities. The costs of remedying such conditions may be significant, and remediation obligations could adversely affect our business, results of operations and financial condition.
Additionally, federal, state and local legislative bodies and agencies frequently revise environmental laws and regulations, and any changes in these regulations, or the interpretations thereof, could require us to expend significant resources to
comply with new laws or regulations or changes to current requirements and could have a material adverse effect on our business operations. As of the date of this annual report on Form 10-K, other than with respect to the permitting activities of the
Carolina Lithium Project, we have not been required to spend material amounts on compliance regarding environmental regulations.
Permits
In November 2019, we were granted a Clean Water Act Section 404 Standard Individual Permit from the U.S. Army Corps of Engineers (“USACE”) for our planned concentrate operations. The USACE completed an Environmental
Assessment of the project in conjunction with other state and federal agencies based on our December 2018 permit application and our responses to agency and public comments.
In 2019, we received a Clean Water Act Section 401 Individual Water Quality Certificate from the North Carolina Department of Environmental Quality’s (“NCDEQ”) Division of Water Resources.
We hold a Synthetic Minor Construction and Operation Permit issued by the NCDEQ’s Division of Air Quality for our property in Kings Mountain, North Carolina. However, we are not pursuing development of this property at
this time.
Our exploration and evaluation activities for the Carolina Lithium Project include drilling, which is authorized under a general permit initially approved in 2017 by the NCDEQ and updated in April 2019, October 2019
and June 2021. We have reclamation obligations under this permit, pursuant to which we will be obligated to reclaim all disturbed drill pads and temporary roads to the approximate original contours and will seed with grass and straw to stabilize any
disturbances. Generally, we are required to affect such reclamation within 14 days following drilling. We have concluded that these reclamation obligations are immaterial.
In addition to the permits that we have been issued to date, we will require other permits before construction or operations of the integrated business including mining, mineral concentration, or chemical manufacturing
may commence. Other permits that are required for the Carolina Lithium Project include, but are not limited to, a state mining permit issued by the North Carolina Division of Energy, Mineral and Land Resources (“DEMLR”), a new air permit issued by
the NCDEQ Division of Air Quality, and rezoning approved by the Gaston County Board of Commissioners.
We may require additional permits for the Carolina Lithium Project including, but not limited to, an NCG01 General Stormwater Permit for stormwater discharges from construction activities issued by DEMLR, an NCG02
General Stormwater Permit for mine dewatering issued by DEMLR, a road abandonment approved by the North Carolina Department of Transportation (“NCDOT”) and Gaston County under North Carolina General Statute 136-63, an Encroachment Permit for an
at-grade rail crossing issued by NCDOT, various driveway permits issued by NCDOT, a Gaston County Watershed Permit approved by Gaston County Planning, various building permits approved by Gaston County Planning, explosives permits approved by the
Bureau of Alcohol, Tobacco, and Firearms, and Hazardous Chemical Permits issued by Gaston County Fire Officials.
Subsequent to fiscal year 2021, we submitted an application for a mining permit for the Carolina Lithium Project to DEMLR on August 31, 2021. We have not yet applied for other additional required permits described
above.
Prior to developing or mining any mineralization that we discover, we will be required to obtain new governmental permits authorizing, among other things, any mining development activities and mining operating
activities. Obtaining and renewing governmental permits is a complex and time-consuming process and involves numerous jurisdictions, public hearings, and possibly costly undertakings. The timeliness and success of permitting efforts are contingent
upon many variables not within our control, including the interpretation of permit approval requirements administered by the applicable permitting authority. We may not be able to obtain or renew permits that are necessary to our planned operations,
or the cost and time required to obtain or renew such permits may exceed our expectations. Any unexpected delays or costs associated with the permitting process could delay the exploration, development and/or operation of our properties. See “Risk
Factors—We will be required to obtain governmental permits in order to conduct development and mining operations, a process which is often costly and time-consuming, and there is no certainty that all necessary permits for our operations will be
granted.”
U.S. Federal Legal Framework
The Carolina Lithium Project will be required to comply with applicable environmental protection laws and regulations and licensing and permitting requirements. The material environmental, health and safety laws and
regulations that we must comply with include, among others, the following U.S. federal laws and regulations:
|
|
• |
National Environmental Protection Act (“NEPA”), which requires careful evaluation of the environmental impacts of mining and lithium manufacturing operations that require federal approvals;
|
|
|
• |
Clean Air Act (“CAA”) and its amendments, which governs air emissions;
|
|
|
• |
Clean Water Act (“CWA”), which governs discharges to and excavations within the waters of the United States;
|
|
|
• |
Resource Conservation and Recovery Act (“RCRA”), which governs the management of solid waste;
|
|
|
• |
Comprehensive Environmental Response, Compensation, and Liability Act (“CERCLA”), which imposes liability where hazardous substances have been released into the environment (commonly known as Superfund); and
|
|
|
• |
Federal Mine Safety and Health Act, which established the primary safety and health standards regarding working conditions of employees engaged in mining, related operations, and preparation and milling of the
minerals extracted, as well as the Occupation Safety and Health Act, which regulates the protection of the health and safety of workers in lithium manufacturing operations and to the extent such protection is not already addressed by the
Federal Mine Safety and Health Act.
|
Our operations may also be subject to state environmental law and regulations, including but not limited to laws and regulations related to the reclamation of mined lands, which may require reclamation permits to be
acquired prior to the commencement of mining operations and may require substantial financial guarantees to cover the cost of future reclamation activities.
Solid and Hazardous Waste
RCRA, and comparable state statutes, affect our operations by imposing regulations on the generation, transportation, treatment, storage, disposal and cleanup of hazardous wastes and on the disposal of non-hazardous
wastes. Under the auspices of the United States Environmental Protection Agency (“EPA”), the individual states administer some or all of the provisions of RCRA, sometimes in conjunction with their own, more stringent requirements.
In addition, CERCLA can impose joint and several liability without regard to fault or legality of conduct on classes of persons who are statutorily responsible for the release of a hazardous substance into the
environment. These persons can include the current and former owners, lessees or operators of a site where a release occurs, and anyone who disposes or arranges for the disposal of a hazardous substance. Under CERCLA, such persons may be subject to
strict, joint and several liability for the entire cost of cleaning up hazardous substances that have been released into the environment and for other costs, including response costs, alternative water supplies, damage to natural resources and for
the costs of certain health studies. Moreover, it is not uncommon for neighboring landowners, workers and other third parties to file claims for personal injury and property damage allegedly caused by hazardous substances released into the indoor or
outdoor environment. Each state also has environmental cleanup laws analogous to CERCLA. Hazardous wastes may have been previously handled, disposed of, or released on or under properties currently or formerly owned or leased by us or on or under
other locations to which we sent waste for disposal. These properties and any materials disposed or released on them may subject us to liability under CERCLA, RCRA and analogous state laws. Under such laws, we could be required to remove or remediate
disposed wastes or property contamination, to contribute to remediation costs, or to perform remedial activities to prevent future environmental harm.
Air Emissions
The federal CAA and comparable state laws restrict the emission of air pollutants from numerous sources through the issuance of permits and the imposition of other requirements. Major sources of air pollutants are
subject to more stringent, federally imposed permitting requirements. Air pollution regulations may require us to obtain pre-approval for the construction or modification of certain projects or facilities expected to produce or significantly increase
air emissions, obtain air permits and comply with stringent permit requirements or utilize specific equipment or technologies to control emissions of certain pollutants. The need to obtain permits has the potential to delay our operations, and we may
be required to incur capital expenditures for air pollution control equipment or other air emissions related obligations. Administrative enforcement actions for failure to comply strictly with air pollution regulations or permits are generally
resolved by payment of monetary fines and correction of any identified deficiencies. Alternatively, regulatory agencies could require us to forego construction, modification or operation of certain air emission sources.
Clean Water Act
The CWA imposes restrictions and strict controls regarding the discharge of wastes, including mineral processing wastes, into waters of the United States, a term broadly defined to include, among other things, certain
wetlands. Permits must be obtained to discharge pollutants into federal waters. The CWA provides for civil, criminal and administrative penalties for unauthorized discharges, both routine and accidental, of pollutants. It imposes substantial
potential liability for the costs of removal or remediation associated with discharges of oil or hazardous substances. State laws governing discharges to water also provide varying civil, criminal and administrative penalties, and impose liabilities
in the case of a discharge of petroleum or its derivatives, or other hazardous substances, into state waters. In addition, the EPA has promulgated regulations that require permits to discharge storm water runoff, including discharges associated with
construction activities. In the event of an unauthorized discharge of wastes, we may be liable for penalties and costs.
Pursuant to these laws and regulations, we may also be required to develop and implement spill prevention, control and countermeasure plans, also referred to as “SPCC plans,” in connection with on-site storage of
significant quantities of oil. Some states also maintain groundwater protection programs that require permits for discharges or operations that may impact groundwater conditions. The CWA also prohibits the discharge of fill materials to regulated
waters including wetlands without a permit from the USACE.
In May 2015, the EPA issued a final rule that attempted to clarify the federal jurisdictional reach over waters of the United States, but the agency repealed this rule in September 2019 and replaced it with the
Navigable Water Protection Rule in April 2020, which narrowed federal jurisdictional reach relative to the 2015 rule. The repeal and replacement of the 2015 rule is currently subject to litigation, and the scope of the jurisdictional reach of the CWA
may, therefore, remain uncertain for several years, with a patchwork of legal guidelines applicable to various states potentially developing. We could incur increased costs and delays with respect to obtaining permits for dredge and fill activities
in wetland areas to the extent they are required.
NEPA
NEPA requires federal agencies to evaluate major agency actions having the potential to significantly impact the environment. The NEPA process involves public input through comments which can alter the nature of a
proposed project either by limiting the scope of the project or requiring resource-specific mitigation. NEPA decisions can be appealed through the court system by process participants. This process may result in delaying the permitting and
development of projects or increase the costs of permitting and developing some facilities.
Endangered Species Act
The federal Endangered Species Act (“ESA”) restricts activities that may affect endangered and threatened species or their habitats. Some of our operations may be located in areas that are designated as habitats for
endangered or threatened species. A critical habitat designation could result in further material restrictions to federal and private land use and could delay or prohibit land access or development. The United States Fish and Wildlife Service
continues its effort to make listing decisions and critical habitat designations where necessary. The ESA has not previously had a significant impact on our operations. However, the designation of previously unprotected species as being endangered or
threatened could cause us to incur additional costs or become subject to operating restrictions in areas where the species are known to exist.
Foreign Legal Framework
Our proposed projects with Sayona and IRR will be required to comply with all environmental laws and regulations in Quebec, Canada and Ghana, respectively.
Human Capital Management
Piedmont Lithium’s core values exhibited by its employees are Care for its people, Humility in the way we operate, Creativity in the way we innovate, Respect for the communities we operate in, and Integrity in how we
conduct business. Our team has a fearless accountability to deliver results, agility to turn ideas into realistic, executable plans, take bold action on what we believe is right and lead by example, and finally empower, develop, and set high
expectations to achieve success.
The operating model and guiding principles for our company is to live our Core Values each day, deliver best-in-class HSE Performance, operate sustainably and in compliance, focus on customers in all we do, empower
our teams and enable “lean decision making,” deliver Operational Excellence that exceeds customer expectations, drive Process Technology Excellence and continuous improvement, and create a culture of learning and development.
Employees
As of June 30, 2021, we had 20 employees. All of our employees are located in the United States and engaged through direct employment agreements. None of our employees are subject to any union or collective bargaining
agreement. We believe that we generally have a good relationship with our employees.
Other Resources
We use third party contractors to perform drilling services as part of our exploration and evaluation activities for the Carolina Lithium Project.
Safety
Health, safety and environment (“HSE”) are the cornerstone of our Company. Our commitment to the health and welfare of every person involved in our projects is built into every aspect of our organization and are
engrained in our Company’s culture. For example, we implement safety programs and develop a risk management process covering all of our project activities to promote a behavior-based safety culture, ensure compliance with applicable environmental
regulations and international standards and raise environmental awareness among our employees and partners. Our HSE vision is to fully integrate health, safety and environment into our business, where our culture is recognized as a model by the
industry and stakeholders, and to create a healthy workplace free of incidents.
Diversity and Inclusion
Diversity and inclusion are embedded in our values and integrated into our strategies. Our Code of Business Conduct and Ethics (“Code of Conduct”) commits us to fair treatment and non-discrimination. The Company’s
policy is to treat each employee and job applicant without regard to race, color, age, sex, religion, national origin, sexual orientation, ancestry, veteran status, or any other category protected by law. We believe we will become better and
achieve growth by intentionally creating a culture through acquiring and retaining a diverse workforce. We recognize it takes unique gifts, talents, varied perspectives, backgrounds and experiences to deliver innovative, high-quality products and
services. In order to provide a diverse and inclusive workplace, we focus our efforts on making diversity a part of our culture.
Compensation and Benefits
Our compensation program is designed to attract and retain talented employees in the industry by offering competitive compensation and benefits. We use a combination of fixed and variable compensation that includes
base salary, incentive bonuses with a pay for performance element and merit increases. As part of our long-term incentive plan for executives and certain key employees, we provide long-term equity awards tied to the value of our stock price, some of
which are performance-based. Additionally, all employees are eligible for an annual discretionary cash bonus and long-term equity bonus, both of which are tied to the Company’s performance and the individual’s performance in the period. We are also
focused on the health and wellness of our employees. As such, we offer eligible employees medical plans, dental and vision coverage, short-term and long-term disability insurance, term life insurance, flexible work schedules, remote work options,
paid time off and a 401(k) plan.
Commitment to Values and Ethics
In connection with our core values, we act in accordance with our Code of Conduct. Our Code of Conduct requires a commitment from employees, officers and directors of Piedmont Lithium to conduct business honestly and
ethically. Our Code of Conduct discusses the responsibility team members have to each other, the Company and its stockholders, our customers, and communities and governments. Piedmont Lithium has a confidential hotline that an employee can call
anonymously in the event he or she has ethical concerns or suspects instances of misconduct.
Implications of Being an Emerging Growth Company
We are an “emerging growth company” under the U.S. Jumpstart Our Business Startups Act of 2012 (“JOBS Act”) and will continue to qualify as an “emerging growth company” until the earliest to occur of:
|
|
• |
the last day of the fiscal year during which we have total annual gross revenues of $1,070,000,000 (as such amount is indexed for inflation every five years by the SEC) or more;
|
|
|
• |
the last day of our fiscal year following the fifth anniversary of the completion of our first sale of common equity securities pursuant to an effective registration statement under the Securities Act, which we
expect to be June 30, 2024;
|
|
|
• |
the date on which we have, during the previous three-year period, issued more than $1,070,000,000 in non-convertible debt; or
|
|
|
• |
the date on which we are deemed to be a “large accelerated filer,” as defined in Rule 12b-2 of the Exchange Act, which would occur if the market value of shares of our common stock that are held by
non-affiliates exceeds $700,000,000 as of the last day of our most recently completed second fiscal quarter.
|
An emerging growth company may take advantage of specified exemptions from various requirements that are otherwise applicable to public companies in the United States. Generally, a company that registers any class
of its securities under Section 12 of the Exchange Act is required to include in the second and all subsequent annual reports filed by it under the Exchange Act, a management report on internal control over financial reporting and, subject to an
exemption available to companies that meet the definition of a “smaller reporting company” in Rule 12b-2 under the Exchange Act, an auditor attestation report on management’s assessment of the company’s internal control over financial reporting.
However, for so long as we continue to qualify as an emerging growth company, we will be exempt from the requirement to include an auditor attestation report in our annual reports filed under the Exchange Act, even if we do not qualify as a
“smaller reporting company.” In addition, Section 103(a)(3) of the Sarbanes-Oxley Act of 2002 (“Sarbanes-Oxley Act”) has been amended by the JOBS Act, to provide that, among other things, auditors of an emerging growth company are exempt from any
rules of the Public Company Accounting Oversight Board requiring mandatory audit firm rotation or a supplement to the auditor’s report in which the auditor would be required to provide additional information about the audit and the consolidated
financial statements of the company.
Pursuant to Section 107(b) of the JOBS Act, an emerging growth company may elect to utilize an extended transition period for complying with new or revised accounting standards for public companies until such standards
apply to private companies. We have elected to utilize this extended transition period. This election is irrevocable.
Available Information
We file electronically with the
SEC
our annual report on Form 10-K, quarterly reports on Form 10-Q, current reports on Form 8-K and amendments to those reports filed or
furnished pursuant to Section 13(a) or 15(d) of the Exchange Act. We make available on our website at www.piedmontlithium.com, under “Investors,” free of charge, copies of these reports as soon as reasonably practicable after filing or furnishing
these reports with the SEC.
| Item 1A. |
You should carefully consider the risks described below, together with all of the other information in this annual report on Form 10-K. If any of the following risks occur, our business, financial condition and
results of operations could be seriously harmed and you could lose all or part of your investment. Further, if we fail to meet the expectations of the public market in any given period, the market price of our common stock could decline. We operate
in a competitive environment that involves significant risks and uncertainties, some of which are outside of our control. If any of these risks actually occurs, our business and financial condition could suffer and the price of our stock could
decline. We caution you that the risks, uncertainties and other factors referred to below and elsewhere in this annual report on Form 10-K may not contain all of the risks, uncertainties and other factors that may affect our future results and
operations. Our future results and operations could also be affected by factors, events or uncertainties that are not presently known to us or that we currently do not consider to present a material risk. It is not possible for our management to
predict all risks.
Business Risks
Our operations may be further disrupted, and our financial results may be adversely affected by the novel coronavirus pandemic.
The calendar year 2019 novel strain of coronavirus causing a contagious respiratory disease known as COVID-19, which was declared a pandemic by the World Health Organization on March 11, 2020, poses a material risk to our business and operations.
If a significant portion of our workforce or the consultants we have engaged to perform certain studies regarding our proposed operations becomes unable to work or travel to our operations due to illness or state or federal government restrictions
(including travel restrictions and “shelter-in-place” and similar orders restricting certain activities that may be issued or extended by authorities), we may be forced to reduce or suspend our exploration and development activities. We continue to
monitor legislative initiatives in the U.S. to provide relief to businesses impacted by COVID-19, such as the U.S. Coronavirus Aid Relief and Economic Security (CARES) Act, to determine their potential impacts or benefits (if any) to our business.
The spread of COVID-19 pandemic, which has caused a broad impact globally, may materially affect us economically. While the potential economic impact brought by COVID-19, and the duration of such impact, may be difficult to assess or predict, the
COVID-19 pandemic and mitigation measures have negatively impacted global economic conditions, which, in turn, could adversely affect our business, results of operations and financial condition. In addition, a recession or market correction resulting
from the spread of COVID-19 and related government orders and restrictions could materially affect our business and the value of our common stock.
The COVID-19 pandemic continues to evolve rapidly. It is not possible at this time to estimate the ultimate impact that the COVID-19 pandemic, the continued spread of COVID-19, and any additional measures taken by governments, health officials or
by us in response to such spread, could have on our business, results of operations and financial condition. The extent to which the COVID-19 outbreak continues to impact our financial condition will depend on future developments that are highly
uncertain and cannot be predicted, including new government actions or restrictions, new information that may emerge concerning the severity, longevity and impact of the COVID-19 pandemic on economic activity.
To the extent the COVID-19 pandemic adversely affects our business and financial results, it may also have the effect of heightening many of the other risks described in this “Risk Factors” section. As of June 30, 2021, these impacts have not had
a significant effect on our financial results or operations. However, these effects could have a material impact on our operations, and we will continue to monitor the COVID-19 situation closely.
Our future performance is difficult to evaluate because we have a limited operating history in the lithium industry.
We began to implement our current business strategy in the lithium industry in 2016. We have not realized any revenues to date from the sale of lithium, and our operating cash flow needs have been financed primarily
through issuances of common stock and not through cash flows derived from our operations. As a result, we have little historical financial and operating information available to help you evaluate our performance.
We are an exploration stage company, and there is no guarantee that our properties will result in the commercial extraction of mineral deposits.
We are engaged in the business of exploring and developing mineral properties with the intention of locating economic deposits of minerals. Our property interests are at the exploration stage. Accordingly, it is unlikely that we will realize
profits in the short term, and we cannot assure you that we will realize profits in the medium to long term. Any profitability in the future from our business will be dependent upon development of an economic deposit of minerals and further
exploration and development of other economic deposits of minerals, each of which is subject to numerous risk factors. Further, we cannot assure you that, even if an economic deposit of minerals is located, any of our property interests can be
commercially mined. The exploration and development of mineral deposits involves a high degree of financial risk over a significant period of time which a combination of careful evaluation, experience and knowledge of management may not eliminate.
While discovery of additional ore-bearing deposits may result in substantial rewards, few properties which are explored are ultimately developed into producing mines. Major expenses may be required to establish reserves by drilling and to construct
mining and processing facilities at a particular site. It is impossible to ensure that our current exploration programs will result in profitable commercial mining operations. The profitability of our operations will be, in part, directly related to
the cost and success of its exploration and development programs which may be affected by a number of factors. Additional expenditures are required to establish reserves which are sufficient to commercially mine and to construct, complete and install
mining and processing facilities in those properties that are actually mined and developed.
In addition, exploration projects like ours have no operating history upon which to base estimates of future operating costs and capital requirements. Exploration project items, such as any future estimates of reserves, metal recoveries or cash
operating costs will to a large extent be based upon the interpretation of geologic data, obtained from a limited number of drill holes and other sampling techniques, and future feasibility studies. Actual operating costs and economic returns of any
and all exploration projects may materially differ from the costs and returns estimated, and accordingly our financial condition, results of operations, and cash flows may be negatively affected.
Because the probability of an individual prospect ever having reserves is not known, our properties may not contain any reserves, and any funds spent on exploration and evaluation may be lost.
We are an exploration stage mining company, and we have no reserves as defined by Guide 7 or S-K 1300. We cannot assure you about the existence of economically extractable mineralization at this time, nor about the quantity or grade of any
mineralization we may have found. Because the probability of an individual prospect ever having reserves is uncertain, our properties may not contain any reserves and any funds spent on evaluation and exploration may be lost. Even if we confirm
reserves on our properties, any quantity or grade of reserves we indicate must be considered as estimates only until such reserves are actually mined. We do not know with certainty that economically recoverable lithium exists on our properties. In
addition, the quantity of any reserves may vary depending on commodity prices. Any material change in the quantity or grade of reserves may affect the economic viability of our properties. Further, our lack of established reserves means that we are
uncertain about our ability to generate revenue from our operations.
We face risks related to mining, exploration and mine construction, if warranted, on our properties.
Our level of profitability, if any, in future years will depend to a great degree on lithium prices and whether our exploration-stage properties can be brought into production. It is impossible to ensure that the current and future exploration
programs and/or feasibility studies on our existing properties will establish reserves. Whether it will be economically feasible to extract lithium depends on a number of factors, including, but not limited to: the particular attributes of the
deposit, such as size, grade and proximity to infrastructure; lithium prices; mining, processing and transportation costs; the willingness of lenders and investors to provide project financing; labor costs and possible labor strikes; and governmental
regulations, including, without limitation, regulations relating to prices, taxes, royalties, land tenure, land use, importing and exporting materials, foreign exchange, environmental protection, employment, worker safety, transportation, and
reclamation and closure obligations. The exact effect of these factors cannot be accurately predicted, but the combination of these factors may result in us receiving an inadequate return on invested capital. In addition, we are subject to the risks
normally encountered in the mining industry, such as:
|
|
• |
the discovery of unusual or unexpected geological formations;
|
|
|
• |
accidental fires, floods, earthquakes or other natural disasters;
|
|
|
• |
unplanned power outages and water shortages;
|
|
|
• |
construction delays and higher than expected capital costs;
|
|
|
• |
controlling water and other similar mining hazards;
|
|
|
• |
operating labor disruptions and labor disputes;
|
|
|
• |
the ability to obtain suitable or adequate machinery, equipment or labor;
|
|
|
• |
our liability for pollution or other hazards; and
|
|
|
• |
other known and unknown risks involved in the conduct of exploration and operation of mines.
|
The nature of these risks is such that liabilities could exceed any applicable insurance policy limits or could be excluded from coverage. There are also risks against which we cannot insure or against which we may
elect not to insure. The potential costs, which could be associated with any liabilities not covered by insurance or in excess of insurance coverage, or compliance with applicable laws and regulations may cause substantial delays and require
significant capital outlays, adversely affecting our future earnings and competitive position and potentially our financial viability.
Our long-term success will depend ultimately on our ability to generate revenues, achieve and maintain profitability, and develop positive cash flows from our mining activities.
Our long-term success, including the recoverability of the carrying values of our assets, our ability to acquire additional lithium projects, and continuing with
exploration, development and commissioning, mining and lithium hydroxide manufacturing activities on our projects, will depend ultimately on our ability to generate revenues, achieve and maintain profitability and to develop positive cash flow
from our operations by establishing ore bodies that contain commercially recoverable lithium and to develop these into profitable mining activities. The economic viability of our future mining activities has many risks and uncertainties
including, but not limited to:
|
|
• |
a significant, prolonged decrease in the market price of lithium;
|
|
|
• |
difficulty in marketing and/or selling lithium;
|
|
|
• |
significantly higher than expected capital costs to construct our mine;
|
|
|
• |
significantly higher than expected extraction costs;
|
|
|
• |
significantly lower than expected lithium extraction;
|
|
|
• |
significant delays, reductions or stoppages of lithium extraction activities; and
|
|
|
• |
the introduction of significantly more stringent regulatory laws and regulations.
|
Our future mining and lithium manufacturing activities may change as a result of any one or more of these risks and uncertainties, and we cannot assure you that any ore body from which we extract mineralized materials will result in achieving and
maintaining profitability and developing positive cash flows.
Our long-term success depends on our ability to enter into and deliver product under supply agreements.
We may encounter difficulty entering into or maintaining supply agreements for our products, may fail to deliver required minimum metric tons required by such agreements or may experience production costs in
excess of the fixed price to be paid to us under such agreements. We have entered into one supply agreement for spodumene concentrate produced at our Carolina Lithium Project, but we have not entered into any other supply agreements. On
September 28, 2020, we entered into a sales agreement with a Buyer to provide spodumene concentrate to Buyer. The agreement commits us to sell, at a fixed maximum price, a number of tons of spodumene concentrate equal to approximately one-third
of our estimated average annual production. The agreement has an initial five-year term running from the first delivery date and may be extended by mutual agreement for a second five-year term. The agreement contemplates a number of areas where
the parties must come to a mutual agreement. For example, the agreement is conditional upon Buyer and our mutual agreement, based on the development schedules of both parties, to a start date for deliveries and to the parties agreeing in good
faith to an allocation of certain material costs. Our business, results of operations and financial condition may be materially and adversely affected if we are unable to enter into similar agreements with other parties, are unable to mutually
agree to matters required by our agreement with Buyer and by such other agreements, are unable to deliver the product required by such agreements or experience costs in excess of the fixed price set forth in such agreements.
We depend on our ability to successfully access the capital and financial markets. Any inability to access the capital or financial markets may limit our ability to fund our ongoing operations,
execute our business plan or pursue investments that we may rely on for future growth.
Until commercial production is achieved from our planned projects, we will continue to incur operating and investing net cash outflows associated with among other things maintaining and acquiring exploration
properties, undertaking ongoing exploration activities and the potential development of our planned Carolina Lithium Project. As a result, we rely on access to capital markets as a source of funding for our capital and operating requirements. We
require additional capital to fund our ongoing operations, explore and define lithium mineralization, conduct our ongoing feasibility study, and establish any future mining or lithium manufacturing operations, which would require substantial funds
for construction and working capital. We cannot assure you that such additional funding will be available to us on satisfactory terms, or at all, or that we will be successful in commencing commercial lithium extraction, or that our sales
projections will be realized.
In order to finance our future ongoing operations, and future capital needs, we may require additional funds through the issuance of additional equity or debt securities. Depending on the type and terms of any
financing we pursue, stockholders’ rights and the value of their investment in our common stock could be reduced. Any additional equity financing will dilute shareholdings, and new or additional debt financing, if available, may involve
restrictions on financing and operating activities. In addition, if we issue secured debt securities, the holders of the debt would have a claim to our assets that would be prior to the rights of stockholders until the debt is paid. Interest on
such debt securities would increase costs and negatively impact operating results. If the issuance of new securities results in diminished rights to holders of our common stock, the market price of our common stock could be negatively impacted.
If we are unable to obtain additional financing, as needed, at competitive rates, our ability to fund our current operations and implement our business plan and strategy will be affected, and we would be required to reduce the scope of our
operations and scale back our exploration, development and mining programs. There is, however, no guarantee that we will be able to secure any additional funding or be able to secure funding which will provide us with sufficient funds to meet our
objectives, which may adversely affect our business and financial position. Certain market disruptions may increase our cost of borrowing or affect our ability to access one or more financial markets. Such market disruptions could result from:
|
|
• |
adverse economic conditions;
|
|
|
• |
adverse general capital market conditions;
|
|
|
• |
poor performance and health of the lithium or mining industries in general;
|
|
|
• |
bankruptcy or financial distress of unrelated lithium companies or marketers;
|
|
|
• |
significant decrease in the demand for lithium; or
|
|
|
• |
adverse regulatory actions that affect our exploration and construction plans or the use of lithium generally.
|
Our ability to manage growth will have an impact on our business, financial condition and results of operations.
Future growth may place strains on our financial, technical, operational and administrative resources and cause us to rely more on project partners and independent contractors, potentially adversely affecting our financial position and results of
operations. Our ability to grow will depend on a number of factors, including:
|
|
• |
our ability to obtain leases or options on properties;
|
|
|
• |
our ability to identify and acquire new exploratory prospects;
|
|
|
• |
our ability to develop existing prospects;
|
|
|
• |
our ability to continue to retain and attract skilled personnel;
|
|
|
• |
our ability to maintain or enter into new relationships with project partners and independent contractors;
|
|
|
• |
the results of our exploration programs;
|
|
|
• |
the market price for lithium;
|
|
|
• |
our ability to successfully complete construction projects including our ability to successfully complete construction projects on time and within budget;
|
|
|
• |
our access to capital; and
|
|
|
• |
our ability to enter into agreements for the sale of lithium.
|
We may not be successful in upgrading our technical, operational and administrative resources or increasing our internal resources sufficiently to provide certain of the services currently provided by third parties, and we may not be able to
maintain or enter into new relationships with project partners and independent contractors on financially attractive terms, if at all. Our inability to achieve or manage growth may materially and adversely affect our business, results of operations
and financial condition.
We may acquire additional businesses or assets, form joint ventures or make investments in other companies that may be unsuccessful and harm our operating results and prospects.
As part of our business strategy, we may pursue additional acquisitions of complementary businesses or assets or seek to enter into joint ventures. We also may pursue strategic alliances, such as the Sayona
Investments and the IRR Investments, in an effort to leverage our existing operations and industry experience, increase our product offerings, expand our distribution and make investments in other companies.
The success of any acquisitions, joint ventures, strategic alliances or investments, including the Sayona Investments and IRR Investments, will depend on our ability to identify, negotiate, complete and, in the case
of acquisitions, integrate those transactions and, if necessary, obtain satisfactory debt or equity financing to fund those transactions. We may not realize the anticipated benefits of any acquisition, joint venture, strategic alliance or
investments. We may not be able to integrate acquisitions successfully into our existing business, maintain the key business relationships of businesses we acquire, or retain key personnel of an acquired business, and we could assume unknown or
contingent liabilities or incur unanticipated expenses. Integration of acquired companies or businesses also may require management resources that otherwise would be available for ongoing development of our existing business. Any acquisitions or
investments made by us also could result in significant write-offs or the incurrence of debt and contingent liabilities, any of which could harm our operating results. In addition, if we choose to issue equity as consideration for any acquisition,
our stockholders may experience dilution.
We are dependent upon key management employees.
The responsibility of overseeing the day-to-day operations and the strategic management of our business depends substantially on our senior management and our key personnel. Loss of such personnel may have an adverse effect on our performance. The
success of our operations will depend upon numerous factors, many of which are beyond our control, including our ability to attract and retain additional key personnel in sales, marketing, technical support and finance. We currently depend upon a
relatively small number of key persons to seek out and form strategic alliances and find and retain additional employees. Certain areas in which we operate are highly competitive regions and competition for qualified personnel is intense. We may be
unable to hire suitable field personnel for our technical team or there may be periods of time where a particular position remains vacant while a suitable replacement is identified and appointed. We may not be successful in attracting and retaining
the personnel required to grow and operate our business profitably.
Our growth will require new personnel, which we will be required to recruit, hire, train and retain.
Members of our management team possess significant experience and have previously carried out or been exposed to exploration and production activities. However, we have limited operating history with respect to lithium projects and our ability to
achieve our objectives depends on the ability of our directors, officers and management to implement current plans and respond to any unforeseen circumstances that require changes to those plans. The execution of our exploration and development plans
will place demands on us and our management. Our ability to recruit and assimilate new personnel will be critical to our performance. We will be required to recruit additional personnel and to train, motivate and manage employees, which may adversely
affect our plans.
Lawsuits may be filed against us and an adverse ruling in any such lawsuit may adversely affect our business, financial condition or liquidity or the market price of our common stock.
In the normal course of our business, we may become involved in, named as a party to, or be the subject of, various legal proceedings, including regulatory proceedings, tax proceedings and legal actions, relating to personal injuries, property
damage, property taxes, land rights, the environment and contract disputes. The outcome of outstanding, pending or future proceedings cannot be predicted with certainty and may be determined adversely to us and as a result, could have a material
adverse effect on our assets, liabilities, business, financial condition or results of operations. Even if we prevail in any such legal proceeding, the proceedings could be costly and time-consuming and may divert the attention of management and key
personnel from our business operations, which could adversely affect our financial condition.
In July 2021, a lawsuit was filed against us in the United States District Court for the Eastern District of New York on behalf of a class of putative plaintiffs claiming violations of the Exchange Act. The complaint
alleged, among other things, that we made false and/or misleading statements and/or failed to make disclosure relating to proper and necessary permits. We intend to vigorously defend against these claims as we believe there are strong defenses
against the claims, although there can be no assurance as to the outcome.
Our mineral properties may be subject to defects in title.
Title to the majority of our lithium properties for the Carolina Lithium Project are derived from option agreements with local landowners in North Carolina, which upon exercise allow us to purchase, or in certain
cases long-term lease, the surface property and the associated mineral rights from the local landowners. Upon exercise, in the case of a purchase, we will pay cash consideration approximating the fair market value of the surface property at the
time of exercise, excluding the value of any minerals, plus a premium, either at a negotiated fixed price or a negotiated percentage premium, excluding the value of any minerals. Upon exercise, in the case of a long-term lease, the Company will pay
annual advanced royalty payments per acre. Some landowners also retain a production royalty payable on production of ore from the property.
The ownership and validity or title of unpatented mining claims and concessions are often uncertain and may be contested. We also may not have, or may not be able to obtain, all necessary rights to develop a
property. Although we have obtained title opinions with respect to certain of our properties and have taken reasonable measures to ensure proper title to our properties, there is no guarantee that title to any of our properties will not be
challenged or impugned. Title insurance is generally not available for mineral properties and our ability to ensure that we have obtained secure claim to individual mineral properties or mining concessions may be severely constrained. Our mineral
properties may be subject to prior unregistered agreements, transfers or claims, and title may be affected by, among other things, undetected defects. We may incur significant costs related to defending the title to our properties. A successful
claim contesting our title to a property may cause us to compensate other persons or perhaps reduce our interest in the affected property or lose our rights to explore and, if warranted, develop that property. This could result in our not being
compensated for our prior expenditures relating to the property. Also, in any such case, the investigation and resolution of title issues would divert our management’s time from ongoing exploration and, if warranted, development programs. Any
impairment or defect in title could negatively affect us.
Our directors may be in a position of conflict of interest.
Some of our directors and officers currently also serve as directors and officers of other companies involved in natural resource exploration, development and production,
and any of our directors may in the future serve in such positions. As at the date of this annual report on Form 10-K, none of our directors or officers serves as an officer or director of a lithium exploration, development or producing company
nor possesses a conflict of interests with our business, other than as follows: (1) pursuant to our agreements related to our Sayona investment, Keith Phillips, our Chief Executive Officer and Director, will be appointed as a board member of
Sayona Quebec, and (2) pursuant to our agreements related to our IRR investment, Patrick Brindle, our Executive Vice President and Chief Development Officer, will be a member of the technical committee of IRR. However, there exists the
possibility that they may in the future be in a position of conflict of interest. Any decision made by such persons involving us will be made in accordance with their duties and obligations to deal fairly and in good faith with us and such other
companies. In addition, any such directors will declare, and refrain from voting on, any matter in which such directors may have a material interest.
Regulatory and Industry Risks
The Carolina Lithium Project will be subject to significant governmental regulations, including the U.S. Federal Mine Safety and Health Act.
Mining activities in the United States are subject to extensive federal, state, local and foreign laws and regulations governing environmental protection, natural resources, prospecting, development, production, post-closure reclamation, taxes,
labor standards and occupational health and safety laws and regulations, including mine safety, toxic substances and other matters. The costs associated with compliance with such laws and regulations are substantial. In addition, changes in such laws
and regulations, or more restrictive interpretations of current laws and regulations by governmental authorities, could result in unanticipated capital expenditures, expenses or restrictions on or suspensions of our operations and delays in the
development of our properties.
We will be required to obtain governmental permits in order to conduct development and mining operations, a process which is often costly and time-consuming, and there is no certainty that all
necessary permits for our operations will be granted.
We are required to obtain and renew governmental permits for our exploration activities and, prior to developing or mining any mineralization that we discover, we will be required to obtain new governmental permits. Obtaining and renewing
governmental permits is a complex and time-consuming process. The timeliness and success of permitting efforts are contingent upon many variables not within our control, including the interpretation of permit approval requirements administered by the
applicable permitting authority. We may not be able to obtain or renew permits that are necessary to our planned operations or the cost and time required to obtain or renew such permits may exceed our expectations. Any unexpected delays or costs
associated with the permitting process could delay the exploration, development or operation of our properties, which in turn could materially adversely affect our future revenues and profitability. In addition, key permits and approvals may be
revoked or suspended or may be changed in a manner that adversely affects our activities.
For example, in addition to the permits that we have been issued to date, we will require other permits before construction or operations of the Carolina Lithium Project including, but not limited to, zoning,
rezoning, mining, mineral concentration, or chemical manufacturing. Other permits that are required include, but are not limited to, a state mining permit issued by the North Carolina DEMLR, a new air permit issued by the NCDEQ Division of Air
Quality and a rezoning approved by the Gaston County Board of Commissioners. Subsequent to the end of the fiscal year on August 30, 2021, the Company submitted an application to DEMLR for a mining permit for the Carolina Lithium Project. We have
not yet applied for other additional required permits.
Private parties, such as environmental activists, frequently attempt to intervene in the permitting process and to persuade regulators to deny necessary permits or seek to overturn permits that have been issued. Obtaining the necessary
governmental permits involves numerous jurisdictions, public hearings and possibly costly undertakings. These third-party actions can materially increase the costs and cause delays in the permitting process and could cause us to not proceed with the
development or operation of a property. In addition, our ability to successfully obtain key permits and approvals to explore for, develop, operate and expand operations will likely depend on our ability to undertake such activities in a manner
consistent with the creation of social and economic benefits in the surrounding communities, which may or may not be required by law. Our ability to obtain permits and approvals and to successfully operate in particular communities may be adversely
affected by real or perceived detrimental events associated with our activities.
Subsequent to the end of the fiscal year, on August 6, 2021 the Board of Commissioners of Gaston County passed a resolution implementing a 60-day temporary moratorium in the approval of
new mining projects within the County while the County undertakes an evaluation of existing county rules and ordinances in the interest of protecting public health and safety. While we have continued in active dialog with Gaston County, we are
unable to predict the duration, scope, result or related costs associated with the commissioners’ review process, nor can we assure you that we will be successful in obtaining required local approvals.
Compliance with environmental regulations and litigation based on environmental regulations could require significant expenditures.
Environmental regulations mandate, among other things, the maintenance of air and water quality standards, land development and land reclamation, and set forth limitations on the generation, transportation, storage and disposal of solid and
hazardous waste. Environmental legislation is evolving in a manner that may require stricter standards and enforcement, increased fines and penalties for non-compliance, more stringent environmental assessments of proposed projects, and a heightened
degree of responsibility for mining companies and their officers, directors and employees. In connection with our current exploration activities or in connection with our prior mining operations, we may incur environmental costs that could have a
material adverse effect on financial condition and results of operations. Any failure to remedy an environmental problem could require us to suspend operations or enter into interim compliance measures pending completion of the required remedy.
Moreover, governmental authorities and private parties may bring lawsuits based upon damage to property and injury to persons resulting from the environmental, health and safety impacts of prior and current operations, including operations
conducted by other mining companies many years ago at sites located on properties that we currently own or formerly owned. These lawsuits could lead to the imposition of substantial fines, remediation costs, penalties and other civil and criminal
sanctions. We cannot assure you that any such law, regulation, enforcement or private claim would not have a material adverse effect on our financial condition, results of operations or cash flows.
Lithium and lithium byproduct prices are subject to unpredictable fluctuations.
We expect to derive revenues, if any, from the extraction and sale of lithium and lithium byproducts. The prices of lithium and lithium byproducts may fluctuate widely and is affected by numerous factors beyond our control, including
international, economic and political trends, expectations of inflation, currency exchange fluctuations, interest rates, global or regional consumptive patterns, speculative activities, increased production due to new extraction developments and
improved extraction and production methods and technological changes in the markets for the end products. The effect of these factors on the prices of lithium and lithium byproducts, and therefore the economic viability of any of our exploration
properties, cannot accurately be predicted.
Additionally, new production of lithium hydroxide or lithium carbonate from current or new competitors in the lithium markets could adversely affect prices. In recent years, new and existing competitors have increased the supply of lithium
hydroxide and lithium carbonate, which has affected its price. Further production increases could negatively affect prices. There is limited information on the status of new lithium hydroxide production capacity expansion projects being developed by
current and potential competitors and, as such, we cannot make accurate projections regarding the capacities of possible new entrants into the market and the dates on which they could become operational. If these potential projects are completed in
the short term, they could adversely affect market lithium prices, thereby resulting in a material adverse effect on the economic feasibility of extracting any mineralization we discover and reducing or eliminating any reserves we identify.
Changes in technology or other developments could result in preferences for substitute products.
Lithium and its derivatives are preferred raw materials for certain industrial applications, such as rechargeable batteries. Many materials and technologies are being researched and developed with the goal of making
batteries lighter, more efficient, faster charging and less expensive. Some of these technologies could be successful and could adversely affect demand for lithium batteries in personal electronics, electric and hybrid vehicles and other
applications. We cannot predict which new technologies may ultimately prove to be commercially viable and on what time horizon. In addition, alternatives to such products may become more economically attractive as global commodity prices shift. Any
of these events could adversely affect demand for and market prices of lithium, thereby resulting in a material adverse effect on the economic feasibility of extracting any mineralization we discover and reducing or eliminating any reserves we
identify.
Moreover, current and next generation high energy density batteries for use in electric vehicles rely on lithium compounds as a critical input. The development and adoption of new battery technologies that rely on inputs other than lithium
compounds or a delay in the development and adoption of next generation high nickel battery technologies that utilize lithium hydroxide could significantly impact our prospects and future revenues. Many materials and technologies are being researched
and developed with the goal of making batteries lighter, more efficient, faster charging and less expensive, and some of these could be less reliant on lithium hydroxide or other lithium compounds. We cannot predict which new technologies may
ultimately prove to be commercially viable and on what time horizon. Commercialized battery technologies that use less lithium compounds could materially and adversely impact our prospects and future revenues.
Our growth depends upon the continued growth in demand for electric vehicles with high performance lithium compounds.
We are one of a few producers of performance lithium compounds that are a critical input in current and next generation high energy density batteries used in electric vehicle applications. Our growth is dependent upon the continued adoption by
consumers of electric vehicles. If the market for electric vehicles does not develop as we expect, or develops more slowly than we expect, our business, prospects, financial condition and results of operations will be affected. The market for
electric vehicles is relatively new, rapidly evolving, and could be affected by numerous external factors, such as:
|
|
• |
government regulations and automakers’ responses to those regulations;
|
|
|
• |
tax and economic incentives;
|
|
|
• |
rates of consumer adoption, which is driven in part by perceptions about electric vehicle features (including range per charge), quality, safety, performance, cost and charging infrastructure;
|
|
|
• |
competition, including from other types of alternative fuel vehicles, plug-in hybrid electric vehicles, and high fuel-economy internal combustion engine vehicles;
|
|
|
• |
volatility in the cost of battery materials, oil and gasoline;
|
|
|
• |
rates of customer adoption of higher performance lithium compounds; and
|
|
|
• |
rates of development and adoption of next generation high nickel battery technologies.
|
Risks Related to an Investment in Our Common Stock
The market price and trading volume of our common stock may be volatile and may be affected by economic conditions beyond our control.
The market price of our common stock may be highly volatile and subject to wide fluctuations. In addition, the trading volume of our common stock may fluctuate and cause significant price variations to occur. If the market price of our common
stock declines significantly, you may be unable to resell your shares of our common stock at or above the purchase price, if at all. We cannot assure you that the market price of our common stock will not fluctuate or significantly decline in the
future.
Some specific factors that could negatively affect the price of our common stock or result in fluctuations in their price and trading volume include:
|
|
• |
actual or expected fluctuations in our prospects or operating results;
|
|
|
• |
changes in the demand for, or market price of, lithium;
|
|
|
• |
additions to or departures of our key personnel;
|
|
|
• |
changes or proposed changes in laws and regulations;
|
|
|
• |
changes in trading volume of our common stock on Nasdaq;
|
|
|
• |
sales or perceived potential sales of our common stock by us, our directors, senior management or our stockholders in the future;
|
|
|
• |
announcement or expectation of additional financing efforts;
|
|
|
• |
conditions in the financial markets or changes in general economic and political conditions and events;
|
|
|
• |
market conditions in the broader stock market, or in our industry in particular;
|
|
|
• |
introduction of new products and services by us or our competitors;
|
|
|
• |
issuance of new or changed securities analysts’ reports or recommendations;
|
|
|
• |
litigation and governmental investigations; and
|
|
|
• |
changes in investor perception of our market positions based on third-party information.
|
In addition, when the market price of a stock is volatile, certain holders of that stock may institute securities class action litigation against the company that issued the stock. If any of our stockholders brought a lawsuit against us, we could
incur substantial costs defending the lawsuit or any future securities class litigation that may be brought against the company.
An active trading market for our common stock may not develop and the trading price for our common stock may fluctuate significantly.
Our common stock is listed on Nasdaq. However, a liquid public market for our common stock may not develop or be sustained, which means you may experience a decrease in the value of your shares of our common stock regardless of our operating
performance. In the past, following periods of volatility in the market price of a company’s securities, stockholders often instituted securities class action litigation against that company. If we were involved in a class action suit, it could
divert the attention of senior management and, if adversely determined, could have a material adverse effect on our results of operations and financial condition.
We are an emerging growth company as defined in the JOBS Act and we may take advantage of certain exemptions from various reporting requirements that are applicable to other
public companies that are not emerging growth companies. For example, we have elected to rely on an exemption from the auditor attestation requirements of Section 404 of the Sarbanes-Oxley Act relating to internal control over financial reporting,
and we will not provide such an attestation from our auditors.
We may avail ourselves of these disclosure exemptions until we are no longer an emerging growth company. We cannot predict whether investors will find our common stock less attractive because of our reliance on some or all of these exemptions. If
investors find our common stock less attractive, it may adversely affect the price of our common stock and there may be a less active trading market for our common stock.
We will cease to be an emerging growth company upon the earliest of:
|
|
• |
the last day of the fiscal year during which we have total annual gross revenues of $1,070,000,000 (as such amount is indexed for inflation every five years by the SEC) or more;
|
|
|
• |
the last day of our fiscal year following the fifth anniversary of the completion of our first sale of common equity securities pursuant to an effective registration statement under the Securities Act;
|
|
|
• |
the date on which we have, during the previous three-year period, issued more than $1,070,000,000 in non-convertible debt; or
|
|
|
• |
the date on which we are deemed to be a “large accelerated filer,” as defined in Rule 12b-2 of the Exchange Act, which would occur if the market value of shares of our common stock that are held by non-affiliates exceeds $700,000,000 as of
the last day of our most recently completed second fiscal quarter.
|
We incur significant costs as a result of operating as a company whose common stock is publicly traded in the United States and whose equity securities are listed on the ASX, and our management is
required to devote substantial time to compliance initiatives.
As a company whose common stock is publicly traded in the United States, we incur significant legal, accounting, insurance and other expenses. In addition, the Sarbanes-Oxley Act, Dodd-Frank Wall Street Reform and
Consumer Protection Act and related rules implemented by the SEC, have imposed various requirements on public companies including requiring establishment and maintenance of effective disclosure and internal controls. Our management and other
personnel need to devote a substantial amount of time to these compliance initiatives, and we may need to add additional personnel and build our internal compliance infrastructure. Moreover, these rules and regulations increase our legal and
financial compliance costs and make some activities more time consuming and costly. These laws and regulations could also make it more difficult and expensive for us to attract and retain qualified persons to serve on our Board of Directors
(“Board”), our Board Committees or as our senior management. Furthermore, if we are unable to satisfy our obligations as a public company in the United States, we could be subject to delisting of our common stock, fines, sanctions and other
regulatory action and potentially civil litigation.
Our common stock is publicly traded on the ASX in the form of CDIs. As a result, we must comply with the ASX Listing Rules. We have policies and procedures that we believe are designed to provide reasonable assurance of our compliance with the ASX
Listing Rules. If, however, we do not follow those procedures and policies, or they are not sufficient to prevent non-compliance, we could be subject to liability, fines and lawsuits. These laws, regulations and standards are subject to varying
interpretations and, as a result, their application in practice may evolve over time as new guidance is provided by regulatory and governing bodies. We intend to invest resources to comply with evolving laws, regulations and standards, and this
investment may result in increased general and administrative expenses and a diversion of management’s time and attention from revenue-generating activities to compliance activities. If, notwithstanding our efforts to comply with new laws,
regulations and standards, we fail to comply, regulatory authorities may initiate legal proceedings against us and our business may be harmed.
Some provisions of Delaware law and our certificate of incorporation and bylaws may deter third parties from acquiring us or limit our stockholders’ ability to obtain a favorable judicial forum for
disputes with us or our directors, officers or employees.
Our certificate of incorporation and bylaws provide for, among other things:
|
|
• |
a staggered board and restrictions on the ability of our stockholders to fill a vacancy on the Board;
|
|
|
• |
the authorization of undesignated preferred stock, the terms of which may be established and shares of which may be issued without stockholder approval;
|
|
|
• |
advance notice requirements for stockholder proposals;
|
|
|
• |
a requirement that, except as otherwise provided for or fixed with respect to actions required or permitted to be taken by holders of preferred stock, no action that is required or permitted to be taken by the stockholders may be effected
by consent of stockholders in lieu of a meeting of stockholders;
|
|
|
• |
permit the Board to establish the number of directors;
|
|
|
• |
a provision that the Board is expressly authorized to adopt, amend or repeal our amended and restated bylaws;
|
|
|
• |
a provision that stockholders can remove directors only for cause and only upon the approval of not less than 66
2
/
3
of all outstanding shares of our voting stock;
|
|
|
• |
a requirement that the approval of not less than 66
2
/
3
of all outstanding shares of our voting stock to adopt, amend or repeal our bylaws and specific provisions of our certificate of incorporation; and
|
|
|
• |
limit the jurisdictions in which certain stockholder litigation may be brought.
|
These anti-takeover defenses could discourage, delay or prevent a transaction involving a change in control of our company. These provisions could also discourage proxy contests and make it more difficult for
stockholders to elect directors of their choosing and cause us to take other corporate actions than desired.
Our amended and restated certificate of incorporation provides that the Court of Chancery of the State of Delaware is the sole and exclusive forum for any complaint asserting any internal corporate claims (including claims in the right of the
Company that are based upon a violation of a duty by current or former director, officer, employee or stockholder in such capacity, or as to which the Delaware General Corporation Law confers jurisdiction upon the Court of Chancery) or a cause of
action arising under the Securities Act. This provision shall not apply to suits brought to enforce a duty or liability created by the Exchange Act. This choice of forum provision may limit a stockholder’s ability to bring a claim in a judicial forum
that it finds favorable for disputes with us or our directors, officers or other employees. If a court were to find the choice of forum provision contained in our amended and restated certificate of incorporation to be inapplicable or unenforceable
in an action, we may incur additional costs associated with resolving such action in other jurisdictions, which could harm our business. For example, under the Securities Act, federal courts have concurrent jurisdiction over all suits brought to
enforce any duty or liability created by the Securities Act, and investors cannot waive compliance with the federal securities laws and the rules and regulations thereunder
.
We do not anticipate paying dividends in the foreseeable future.
We have not declared any dividends during fiscal year 2021 or 2020 and do not anticipate that we will do so in the foreseeable future. We currently intend to retain future earnings, if any, to finance the development
of our business. Dividends, if any, on our outstanding shares of common stock will be declared by and subject to the discretion of the Board on the basis of our earnings, financial requirements and other relevant factors. As a result, a return on
your investment will only occur if our common stock price appreciates. We cannot assure you that our common stock will appreciate in value or even maintain the price at which you purchase shares of our common stock. You may not realize a return on
your investment in our common stock and you may even lose your entire investment in our common stock. Therefore, you should not rely on an investment in our common stock as a source for any future dividend income.
If U.S. securities or industry analysts do not publish research reports about our business, or if they issue an adverse opinion about our business, the market price and trading volume of our common
stock could decline.
The trading market for our common stock will be influenced by the research and reports that U.S. securities or industry analysts publish about us or our business. Securities and industry analysts may discontinue research on us, to the extent such
coverage currently exists, or in other cases, may never publish research on us. If no or too few U.S. securities or industry analysts commence coverage of our Company, the trading price for our common stock would likely be negatively affected. In the
event securities or industry analysts initiate coverage, if one or more of the analysts who cover us downgrade our common stock or publish inaccurate or unfavorable research about our business, the market price of our common stock would likely
decline. If one or more of these analysts cease coverage of us or fail to publish reports on us regularly, demand for our common stock could decrease, which might cause our price and trading volume to decline. In addition, research and reports that
Australian securities or industry analysts publish about us, our business or our common stock may impact the market price of our common stock.
If we fail to maintain proper internal controls, our ability to produce accurate financial statements or comply with applicable regulations could be impaired.
We are subject to the reporting obligations under the U.S. securities laws. The SEC, as required under Section 404 of the Sarbanes-Oxley Act, has adopted rules requiring a public company to include a report of management on the effectiveness of
such company’s internal control over financial reporting in its annual report on Form 10-K. In addition, once we cease to be an “emerging growth company,” as such term is defined in the JOBS Act, an independent registered public accounting firm for a
public company must issue an attestation report on the effectiveness of our internal control over financial reporting.
If we are unable to conclude that we have effective internal controls over financial reporting or our independent auditors are unwilling or unable to provide us with an unqualified report on the effectiveness of our internal controls over
financial reporting as required by the Sarbanes-Oxley Act, investors may lose confidence in our operating results, the price of our common stock could decline and we may be subject to litigation or regulatory enforcement actions. In addition, if we
are unable to meet the requirements of the Sarbanes-Oxley Act, we may not be able to remain listed on Nasdaq.
Unstable market and economic conditions may have serious adverse consequences on our business and financial condition.
Global credit and financial markets have experienced extreme disruptions at various points over the last few decades, characterized by diminished liquidity and credit availability, declines in consumer confidence, declines in economic growth,
increases in unemployment rates and uncertainty about economic stability. If another such disruption in credit and financial markets and deterioration of confidence in economic conditions occurs, our business may be adversely affected. If the equity
and credit markets were to deteriorate significantly in the future, it may make any necessary debt or equity financing more difficult to complete, more costly, and more dilutive. Failure to secure any necessary financing in a timely manner and on
favorable terms could have a material adverse effect on our growth strategy, financial performance and share price and could require us to delay or abandon development or commercialization plans. In addition, there is a risk that one or more of our
service providers, manufacturers or other partners would not survive or be able to meet their commitments to us under such circumstances, which could directly affect our ability to attain our operating goals on schedule and on budget.
Sales of our common stock, or the perception that such sales may occur, could depress the price of our common stock.
Sales of a substantial number of shares of our common stock in the public market, or the perception that such sales may occur, could depress the market price of our common stock. We have filed a registration statement registering under the
Securities Act the shares of our common stock reserved for issuance under our Stock Incentive Plan, including shares issuable upon exercise of outstanding options. These shares can be freely sold in the public market upon issuance, subject to volume
limitations applicable to affiliates. Further, as opportunities present themselves, we may enter into financing or similar arrangements in the future, including the issuance of debt or equity securities. If we issue common stock or securities
convertible into our common stock, our common stockholders would experience additional dilution and, as a result, the price of our common stock may decline.
| Item 1B. |
None.
| Item 2. |
We lease our corporate headquarters in Belmont, North Carolina. Due to our continued growth, we recently signed a new lease for our corporate headquarters, which will remain in Belmont, North Carolina. We expect to
move into our new lease space in early calendar year 2022.
We own and lease properties in Gaston County, North Carolina, as part of the Carolina Lithium Project, for the principal use of current exploration and evaluation activities.
We expect to further our principal use to include mining, development and production of lithium hydroxide and other lithium products and byproducts.
| Item 3. |
As of June 30, 2021, we were not a party to any material legal proceedings.
In July 2021, a lawsuit was filed against us in the United States District Court for the Eastern District of New York on behalf of a class of putative plaintiffs claiming violations of the Exchange Act. The complaint
alleged, among other things, that we made false and/or misleading statements and/or failed to make disclosure relating to proper and necessary permits. We intend to vigorously defend against these claims as we believe there are strong defenses
against the claims, although there can be no assurance as to the outcome.
| Item 4. |
Not applicable because we do not currently operate any mines subject to the U.S. Federal Mine Safety and Health Act of 1977.
PART II
| Item 5. |
Market Information
Our common stock is traded on The Nasdaq Capital Market under the symbol “PLL,” and our CDIs are listed on the ASX also under the symbol “PLL.”
Based on information known to us, as of September 16, 2021, 15,869,395 shares of our common stock were being held in the United States by 135 stockholders of record and 5,768,741 shares of our common stock were being
held in Australia in the form of CDIs by 35 stockholders of record.
Dividends
We have not declared any dividends during fiscal year 2021 or 2020, and we do not anticipate that we will do so in the foreseeable future. We currently intend to retain future earnings, if any, to finance the
development of our business. Dividends, if any, on outstanding shares of our common stock will be declared by and subject to the discretion of the Board on the basis of our earnings, financial requirements and other relevant factors.
| Item 6. |
Not Required.
|
| Item 7. |
The following discussion and analysis of our financial condition and results of operations should be read in conjunction with our financial statements and related notes included elsewhere in
this annual report on Form 10-K. The following discussion contains forward-looking statements that reflect our plans, estimates and beliefs. Our actual results could differ materially from those discussed in the forward-looking statements. Factors
that could cause or contribute to these differences include those discussed below and elsewhere in this annual report on Form 10-K, particularly those in the sections of this annual report on Form 10-K entitled “Risk Factors,” “Cautionary Note
Regarding Forward-Looking Statements,” and “Cautionary Note Regarding Disclosure of Mineral Properties.”
Executive Overview
Piedmont Lithium Inc. is an exploration stage company developing a multi-asset, integrated lithium business contributing to the transition to a net zero carbon world
and the creation of a clean energy economy in North America. Through this endeavor, we are focused on developing and manufacturing battery quality lithium hydroxide for the fast-growing electric vehicle industry. The centerpiece of our
operations, our wholly-owned Carolina Lithium Project, is located in the renowned Carolina Tin-Spodumene Belt of North Carolina. We are geographically diversified with equity investments in strategic partnerships that own lithium resource
assets in Canada and Ghana. Collectively, these resource assets and the location of these assets in the United States, Canada and Ghana, strategically position us to be a large, low-cost, sustainable producer of lithium products, serving
the North American and European electric vehicle and battery supply chains. The geology, geography and proximity of our resources, planned production operations and customer base, should allow us to deliver a valuable supply of
high-quality, sustainably produced lithium hydroxide from spodumene concentrate, which is preferred by most electric vehicle manufacturers. Our diversified operations should enable us to play a pivotal role in supporting the move toward
decarbonization and the electrification of transportation and energy storage.
Redomiciliation
Piedmont Lithium Inc. acquired all of the issued and outstanding ordinary shares of Piedmont Australia, our Australian predecessor and a wholly-owned subsidiary, pursuant to a Scheme of Arrangement under
Australian Law, which was approved by Piedmont Australia’s shareholders on February 26, 2021 and the Federal Court of Australia on May 5, 2021 (collectively referred to as “Redomiciliation”). As part of the Redomiciliation, the Company changed
its place of domicile from Australia to the State of Delaware in the United States, effective May 17, 2021.
Piedmont Australia’s ordinary shares were listed on the ASX, and Piedmont Australia’s ADSs, each representing 100 of Piedmont Australia’s ordinary shares, were traded on Nasdaq. Following the approval of the
Redomiciliation, the Company moved its primary listing from the ASX to Nasdaq and retained an ASX listing via CDIs, each representing 1/100
th
of a share of common stock of Piedmont Lithium Inc.
Pursuant to the Redomiciliation, holders of Piedmont Australia’s ordinary shares received one (1) CDI in Piedmont Lithium Inc. for each ordinary share held in Piedmont
Australia on the Redomiciliation record date; and holders of ADSs in Piedmont Australia, each of which represented 100 ordinary shares of Piedmont Australia, received one (1) share of common stock in the Company of Piedmont Lithium Inc. for
each ADS held in Piedmont Australia on the Redomiciliation record date.
All issued and outstanding shares of the Company’s common stock have been retroactively adjusted in these consolidated financial statements to reflect the 100:1 ratio and share consolidation as if it had occurred on July 1, 2019.
2021 and 2020 Highlights
|
•
|
During the second half of 2021, we entered into a strategic partnership with Sayona for the planned future production of spodumene concentrate in Quebec, Canada.
As part of our strategic partnership, we acquired an equity interest of approximately 19% in Sayona and an equity interest of 25% in Sayona Quebec. In August 2021, subsequent to the year ended June 30, 2021, we made an additional
investment in Sayona Quebec, which facilitated Sayona Quebec’s acquisition of substantially all of the assets of NAL. NAL’s assets include an existing spodumene mine and spodumene concentrator plant located near Val-d’Or, Quebec,
which are currently in care and maintenance. Additionally, we entered into a long-term supply agreement whereby Sayona Quebec will supply the greater of 50% or 113,000 metric tons of spodumene concentrate per year produced from Sayona
Quebec’s combined operations in NAL and the Authier Project to Piedmont Lithium.
|
| • |
In June 2021, we entered into a strategic partnership with IRR for the planned future production of spodumene concentrate in Ghana. In August 2021, subsequent to
the year ended June 30, 2021 and as part of our strategic partnership, we (i) acquired an equity interest of approximately 10% in IRR, (ii) entered into a long-term supply agreement whereby IRR will sell 50% of spodumene concentrate
produced in Ghana to Piedmont Lithium, and (iii) have the ability to acquire an equity interest of 50% in IRR’s lithium-based portfolio in Ghana through expected future staged investments totaling $87 million.
|
|
•
|
In June 2021, we completed a Scoping Study update for a fully-integrated lithium hydroxide manufacturing operation to be located in Gaston County, North Carolina. The study highlighted a potential 20-year
operation producing 30,000 metric tons per year of lithium hydroxide, an estimated after-tax net present value of approximately $1.9 billion, and an estimated 31% after-tax internal rate of return. The study featured lithium conversion
using Metso Outotec’s alkaline pressure leach technology. We are currently undertaking a definitive feasibility study of the proposed, fully-integrated Carolina Lithium Project.
|
|
•
|
In May 2021, we completed our planned Redomiciliation from Australia to the United States, which included changing our primary listing to the Nasdaq from the ASX and making the ASX our secondary listing. As
part of the Redomiciliation, our corporate headquarters is now located in Belmont, North Carolina.
|
| • |
In April and May 2021, we increased our lithium mineral resources estimate by 40% and our byproducts mineral resources estimate by 40%, respectively, for our Carolina Lithium Project.
|
|
•
|
In April 2021, we partnered with Metso Outotec on lithium hydroxide conversion technology, specifically the use of alkaline pressure leaching for the conversion of spodumene concentrate
to lithium hydroxide.
|
|
•
|
In March 2021, we completed a U.S. public stock offering totaling $122.5 million in gross cash proceeds.
|
| • |
In March 2021, we published the results of a life cycle analysis of our Carolina Lithium Project, which was performed by industry-leading Minviro Group. The results of our life cycle analysis demonstrated
industry-leading land and water footprints as well as a highly-competitive carbon footprint compared to incumbent producers in South America and China.
|
|
•
|
In October 2020, we completed a U.S. public stock offering totaling $57.5 million in gross cash proceeds.
|
|
•
|
In September 2020, we entered into an agreement with a vehicle manufacturer to supply spodumene concentrate from the Carolina Lithium Project.
|
COVID-19 Impact
COVID-19 was declared a pandemic by the World Health Organization on March 11, 2020. In response, we implemented generally accepted protocols to protect the health and safety of our employees, contractors, and
communities during this pandemic, including allowing our employees to work remotely. In 2021, our contractors had difficulties in maintaining drilling crews at full capacity and at high utilization rates due to negative impacts from COVID-19;
however, we were able to remain on schedule for purposes of our testing and evaluation activities. Our business was not materially impacted by the negative impacts from COVID-19.
Outlook
The demand for electric vehicles continues to grow as many jurisdictions around the world have legislated to shift new car fleets away from internal combustion engines. These electric vehicles will use batteries,
and the expectation is that nearly all of these batteries will be lithium-based batteries. Our strategy is to develop resources and processing capabilities that support the opportunity to meet the demands of our customers across the electric vehicle
supply chain. Many of the car manufacturers have committed significant capital to expand their electric vehicle portfolios and have targets to electrify their fleets by as much as 100% by 2035.
The outlook for global sales of new electric vehicles (units in millions) and the global penetration rate of new electric vehicles sold compared to total new vehicles sold are presented in the table below:
|
2021
|
2022
|
2023
|
2024
|
2025
|
2026
|
2027
|
2028
|
2029
|
2030
|
||||||||||||
|
Sales of new electric vehicles
|
4.9
|
6.4
|
8.7
|
11.2
|
14.6
|
17.4
|
20.6
|
24.3
|
28.9
|
34.0
|
|||||||||||
|
Penetration rate
|
6%
|
7%
|
9%
|
|
11%
|
15%
|
17%
|
20%
|
23%
|
27%
|
31%
|
|
Source: Rho Motion Electric Vehicle Battery Outlook as of June 30, 2021.
Note: Periods in the table above are calendar year periods.
Components of our Results of Operations
Exploration and Evaluation Expenses
Exploration and evaluation expenses include drilling and sampling costs, technical and engineering studies, permitting costs and overhead costs associated with the exploration and evaluation of the
Carolina Lithium
Project, such as maintaining our exploration headquarters and other fees for professional services and legal compliance. Expenditures on exploration and evaluation
incurred by us are expensed as incurred up and until the completion of a definitive feasibility study, other than costs directly associated with acquiring the exploration properties
, which
are capitalized.
Costs associated with the acquisition and maintenance of exploration rights are capitalized, rather than expensed.
General and Administrative Expenses
General and administrative expenses include overhead costs, such as employee compensation and benefits for corporate management and office staff including accounting, legal, human resources and other support
personnel, professional fees, insurance, and costs associated with maintaining our corporate headquarters.
Other Income (Expense)
Other income (expense) primarily consists of interest expense, interest income, and foreign exchange gains. Interest expense consists of interest incurred in the financing of surface properties purchased for
exploration and evaluation as well as interest incurred for lease liabilities.
Interest income primarily consists of interest earned on our cash and cash equivalents. Foreign exchange gains consist of gains
earned on foreign bank accounts denominated in Australian dollars.
Loss from Equity Investments in Unconsolidated Affiliates
We apply the equity method of accounting for investments when we have significant influence but not controlling interest in the investee. The Company’s proportionate share of the net loss resulting from these
investments is reported as “Loss from equity investments in unconsolidated affiliates, net of tax” in our consolidated statements of operations. The Company’s equity investments in unconsolidated affiliates are reported at cost and adjusted each
period, on a one quarter lag, for the Company’s share of the investee’s loss and dividends paid, if any.
Results of Operations
We operate as one reportable segment. The following table summarizes our results of operations:
|
Consolidated Statements of Operations
|
Years Ended June 30,
|
|||||||||||||||
|
2021
|
2020
|
$ |
|
%
|
||||||||||||
|
Exploration and evaluation expenses
|
$
|
10,874,502
|
$
|
3,125,784
|
7,748,718
|
247.9
|
%
|
|||||||||
|
General and administrative expenses
|
8,861,454
|
3,440,160
|
5,421,294
|
157.6
|
%
|
|||||||||||
|
Other income (expense)
|
(193,266
|
)
|
686,793
|
(880,059
|
)
|
(128.6
|
%)
|
|||||||||
|
Loss from equity investments in
unconsolidated affiliates, net of tax
|
(64,626
|
)
|
—
|
(64,626
|
)
|
*
|
||||||||||
|
Net loss
|
$
|
(19,993,848
|
)
|
$
|
(5,879,152
|
)
|
(14,114,696
|
)
|
(240.1
|
%)
|
||||||
* Not meaningful.
2021 Compared to 2020
Exploration and Evaluation Expenses
Exploration and evaluation expenses increased $7.8 million, or 247.9%, to $10.9 million, in 2021 compared to $3.1 million in 2020. The increase in exploration and
evaluation expenses was primarily due to increased drilling, engineering, and metallurgical testing activities associated with the Carolina Lithium Project in North Carolina in 2021. Contract labor costs associated with drilling activities
was a primary driver of exploration and evaluation expenses.
General and Administrative Expenses
General and administrative expenses increased $5.4 million, or 157.6%, to $8.9 million in 2021 compared to $3.4 million in 2020. The increase in general and administrative expenses was primarily due to
increased professional fees as the Company became subject to U.S. public company requirements as part of the Redomiciliation. Included in the increase in professional fees were $1.4 million of costs directly associated with the
Redomiciliation. Compensation expenses also contributed to higher general and administrative expenses due to the hiring of key management personnel and support staff at the Company’s headquarters in Belmont, North Carolina in 2021.
Other Income (Expense)
Other income (expense) decreased $0.9 million, or 128.6%, to $(0.2) million in 2021 compared to $0.7 million in 2020. The decrease in other income (expense) was due to a gains in foreign exchange totaling
$0.6 million as the U.S. dollar outperformed the Australian dollar in 2021 compared to 2020, a decrease in interest income, and an increase in interest expense.
Loss from Equity Investments in Unconsolidated Affiliates
Loss from equity investments in unconsolidated affiliates, net, was $0.1 million in 2021 compared to zero in 2020. The loss was generated from our investment in Sayona. The Company did not have equity investments in
unconsolidated affiliates in 2020.
Liquidity and Capital Resources
Sources and Uses of Cash
As of June 30, 2021, $136.8 million, or 95.9%, of our cash balances were held in the United States. The remaining $5.9 million, or 4.1%, of our cash balances were held in Australia. Cash balances in Australia can
be repatriated to the United States with inconsequential tax consequences.
We are an exploration stage company
and
,
since our inception, we have not generated revenues. We incurred losses of $19.9 million and
$5.9 million in 2021 and 2020, respectively, and have accumulated losses of $71.3 million and $
51.6 million
as of June 30, 2021 and 2020, respectively. We have relied
on equity financing to fund our operating and investing activities and to fund our long-term debt payments.
Our predominant source of cash is from financing activities. In 2021 and 2020, we raised cash through issuances of our common stock for the primary purpose of funding working capital associated with exploration
and evaluation expenses and general and administrative expenses, purchasing of exploration and evaluation assets, capital expenditures, and investments supporting our strategy of becoming a producer of lithium hydroxide. We had working capital of
$137.8 million and $17.0 million as of June 30, 2021 and 2020, respectively, resulting in an increase in working capital of $120.9 million mostly attributable to an increase in cash of $123.8 million. In addition to cash purchases of exploration
and evaluation assets, specifically surface properties and their associated mineral rights, in North Carolina, we entered into noncash seller financed purchases of exploration and evaluation assets in North Carolina totaling $0.7 million and $2.7
million in 2021 and 2020, respectively.
In March 2020, the CARES Act was signed into U.S. law to provide economic relief to individuals and businesses facing economic hardship as a result of the COVID-19 pandemic. The CARES Act did not have a material
impact on our consolidated financial condition or results of operations as of and for the years ended June 30, 2021 and 2020.
The following table is a condensed schedule of cash flows provided as part of the discussion of liquidity and capital resources:
|
|
Years Ended June 30,
|
|||||||
|
|
2021
|
2020
|
||||||
|
Net cash used in operating activities
|
$
|
(16,257,254
|
)
|
$
|
(6,332,301
|
)
|
||
|
Net cash used in investing activities
|
(34,565,793
|
)
|
(3,452,254
|
)
|
||||
|
Net cash provided by financing activities
|
174,617,607
|
24,718,553
|
||||||
|
Net increase in cash and cash equivalents
|
$
|
123,794,560
|
$
|
14,933,998
|
||||
Cash Flows from Operating Activities
Operating activities used $16.3 million and $6.3 million in 2021 and 2020, respectively, resulting in an increase in cash used in operating activities of $10.0 million during 2021. The increase in cash used in
operating activities was primarily due to an increase in net loss of $14.1 million, adjusted for noncash items, partially offset by an increase from changes in operating assets and liabilities in 2021 compared to 2020.
Cash Flows from Investing Activities
Investing activities used $34.6 million and $3.5 million in 2021 and 2020, respectively, resulting in an increase in cash used in investing activities of $31.1 million during 2021. The increase in cash used in
investing activities was mainly due to our equity investments in Sayona and Sayona Quebec totaling $16.4 million, including transaction costs, and an increase in cash purchases of exploration and evaluation assets for the Carolina Lithium Project
of $15.4 million in 2021 compared to 2020.
Cash Flows from Financing Activities
Financing activities provided $174.6 million and $24.7 million in 2021 and 2020, respectively, resulting in an increase in cash provided by financing activities of $149.9 million during 2021. The increase in cash
provided by financing activities was mainly due to an increase in net issuances of our common stock of $149.9 million in 2021 compared to 2020. In 2021, we raised $175.0 million in cash through issuances of our common stock, net of issuance
costs.
Liquidity Outlook
As of June 30, 2021, we had available cash balances totaling $142.7 million. Currently, we do not maintain a credit facility or have debt from financial institutions. Since inception, we have predominately relied on equity financing to
fund our operations, land acquisitions, capital expenditures and equity investments.
Our cash forecast for 2022:
|
•
|
does not include funding of cash expenditures for: (i) additional acquisition costs of exploration and evaluation assets not already under contract as of June 30, 2021, (ii) construction costs for a mine,
concentrator plant or chemical plant on any of our properties, either owned or currently under seller financed contracts in North Carolina, or through our investments in Canada or Ghana; or (iii) additional equity investments in new
strategic ventures or to increase our ownership within our current investments;
|
|
•
|
does not include cash from equity and/or debt financings; and
|
|
•
|
does not include cash from generating revenues from operations. We do not expect to begin development or production on any of our properties related to the
Carolina Lithium Project or to receive distributions from our investments in lithium projects in Canada or Ghana in 2022.
|
We believe our current cash balances are sufficient to fund cash requirements and debt payments for the next 12 months.
Additionally, we believe our current cash balances are sufficient to fund our cash forecast for fiscal year 2022, which includes discretionary and non-discretionary expenditures, as discussed above. In the event costs were to exceed our forecast,
we will reduce or eliminate current and/or forecasted discretionary spending. If further reductions are required, we will reduce certain non-discretionary expenditures.
We will incur significant cash expenditures for the construction of the proposed mine, concentrator plant and chemical plant at our proposed Carolina Lithium Project in North
Carolina. We currently expect construction of the Carolina Lithium Project to cost approximately $840 million. Additionally, we will incur significant cash expenditures for construction costs associated with our equity investments in lithium
projects in Canada and Ghana with Sayona and IRR, respectively. We will require equity and/or debt financings in order to fund future planned construction costs for these projects.
On August 31, 2021, we submitted a draft loan application to the Loan Programs Office of the U.S. Department of Energy for potential funding of construction costs for our proposed Carolina Lithium Project’s
concentrator plant and chemical plant. We cannot be certain that our loan application will be approved or will have terms acceptable to us.
Hist
orically, we have been successful in raising cash through equity financing and obtaining land through seller financed debt; however, no assurances can be given that additional financing will be available
in amounts sufficient to meet our needs or on terms that are acceptable to us. If we issue additional shares of our common stock, it would result in dilution to our existing shareholders. Stock price volatility, uncertain economic conditions,
negative impacts from the COVID-19 pandemic, commodity price volatility for spodumene and lithium hydroxide, and other risks (see Risk Factors in this Form 10-K) could significantly impact our ability to raise funds through equity and debt
financings.
Contractual Obligations and Other Commitments
The following table summarizes our contractual obligations as of June 30, 2021 that we believe will affect cash over the next five years and thereafter:
|
Total
|
Less than
1 year
|
1–3 years
|
3-5 years
|
Thereafter
|
||||||||||||||||
|
Contractual obligations
|
||||||||||||||||||||
|
Loans and borrowings
|
$
|
2,311,546
|
$
|
1,085,142
|
$
|
1,186,469
|
$
|
39,935
|
$
|
—
|
||||||||||
|
Lease liabilities
|
140,435
|
140,435
|
—
|
—
|
—
|
|||||||||||||||
|
$
|
2,451,981
|
$
|
1,225,577
|
$
|
1,186,469
|
$
|
39,935
|
$
|
—
|
|||||||||||
Off-Balance Sheet Arrangements
We do not have any off-balance sheet arrangements t
hat have or are reasonably likely to have a current or future effect on our financial condition, changes in financial condition, revenues or expenses,
results of operations, liquidity, capital expenditures or capital resources that is material to investors.
Critical Accounting Polices and Estimates
Our management’s discussion and analysis of our financial condition and results of operations is based on our consolidated financial statements, which have been prepared in accordance with generally accepted
accounting principles in the United States (“GAAP”). The preparation of these consolidated financial statements requires us to make estimates and assumptions that affect the reported amounts of assets and liabilities and the disclosure of
contingent assets and liabilities as of the date of the consolidated financial statements, as well as the reported expenses incurred during the reporting periods. Our estimates are based on our historical experience and on various other factors
that we believe are reasonable under the circumstances, the results of which form the basis for making judgments about the carrying value of assets and liabilities that are not readily apparent from other sources. Actual results may differ from
these estimates under different assumptions or conditions. We believe that the accounting policies discussed below are critical to understanding our historical and future performance, as these policies relate to the more significant areas
involving management’s judgments and estimate
s.
While our significant accounting policies are described in the notes to our consolidated financial statements included elsewhere in this annual report on Form 10-K, we believe that the following critical accounting
policy is the most important to understanding and evaluating our reported financial results.
Stock-based Compensation
Equity-settled, share-based payments are provided to officers, employees, consultants and other advisors. These share-based payments are measured at the fair value of the equity instrument at the grant date. Fair
value of share options is determined using the Black-Scholes option pricing model, taking into account the terms and conditions upon which the instruments were granted, and are disclosed in Note 11 to the audited consolidated financial statements
appearing elsewhere in this annual report on Form 10-K. We record stock-based compensation expense within both exploration and evaluation expenses and general and administrative expenses in the Statements of Operations. Costs are allocated among
those receiving the benefit based upon job function. There are certain employees who serve both functions, and therefore, their stock-based compensation expense is split between both financial statement lines in the consolidated statements of
operations.
Estimating fair value for share-based payment transactions requires determination of the most appropriate valuation model, which depends on the terms and conditions of the grant. This estimate also requires determination of the most appropriate
inputs to the valuation model including the expected life of the share option, volatility, dividend yield and risk-free interest rate and making assumptions about them.
Changes to these inputs would impact the consequent valuation for each equity instrument valued in this manner, and consequently, the value of each grant would vary in a different manner depending on the change to the respective inputs.
The fair value determined at the grant date is expensed on a straight-line basis over the vesting period, based on our estimate of equity instruments that will eventually vest. At each reporting date, we revise our estimate of the number of equity
instruments expected to vest. The impact of the revision of the original estimates, if any, is recognized in profit or loss over the remaining vesting period, with a corresponding adjustment to the share-based payments reserve.
| Item 7A. |
Interest Rate Risk
Our exposure to the risk of changes in market interest rates relates primarily to our cash and short-term deposits with a floating interest rate. These financial assets do not expose us to material cash flow interest
rate risk. All other financial assets and liabilities, in the form of payables, lease liabilities, and long-term debt, are non-interest bearing. As of June 30, 2021 and 2020, we had $142.7 million and $18.9 million, respectively, of cash and
short-term deposits. We currently do not engage in any hedging or derivative transactions to manage interest rate risk.
Foreign Currency Risk
We currently do not enter into hedging or derivative transactions to manage foreign currency risk as our exposure to foreign currency risk is not material.
Commodity Price Risk
We are exposed to commodity price risk because commodity prices affect the economic feasibility of mining on our properties, the value of such properties and the potential timing of construction for our concentrator plant and chemical plant in
North Carolina. These commodity prices can be volatile and are influenced by factors beyond our control. We currently do not enter into hedging or derivative transactions to manage commodity price risk.
| Item 8. |
PIEDMONT LITHIUM INC.
TABLE OF CONTENTS
|
Page
|
|
|
FINANCIAL INFORMATION
|
|
|
40
|
|
|
41
|
|
|
42
|
|
|
43
|
|
|
44
|
|
|
45
|
|
|
46
|
To the Shareholders and the Board of Directors of Piedmont Lithium Inc.
Opinion on the Financial Statements
We have audited the accompanying consolidated balance sheets of Piedmont Lithium Inc. and subsidiaries (the “Company”) as of June 30, 2021 and 2020, the related consolidated statements of operations,
comprehensive income, changes in equity, and cash flows, for each of the two years in the period ended June 30, 2021, and the related notes (collectively referred to as the “financial statements”). In our opinion, the financial statements
present fairly, in all material respects, the financial position of the Company as of June 30, 2021 and 2020, and the results of its operations and its cash flows for each of the two years in the period ended June 30, 2021, in conformity with
accounting principles generally accepted in the United States of America.
Basis for Opinion
These financial statements are the responsibility of the Company’s management. Our responsibility is to express an opinion on the Company’s financial statements based on our audits. We are a public accounting
firm registered with the Public Company Accounting Oversight Board (United States) (PCAOB) and are required to be independent with respect to the Company in accordance with the U.S. federal securities laws and the applicable rules and
regulations of the Securities and Exchange Commission and the PCAOB.
We conducted our audits in accordance with the standards of the PCAOB. Those standards require that we plan and perform the audit to obtain reasonable assurance about whether the financial statements are free of
material misstatement, whether due to error or fraud. The Company is not required to have, nor were we engaged to perform, an audit of its internal control over financial reporting. As part of our audits, we are required to obtain an
understanding of internal control over financial reporting but not for the purpose of expressing an opinion on the effectiveness of the Company’s internal control over financial reporting. Accordingly, we express no such opinion.
Our audits included performing procedures to assess the risks of material misstatement of the financial statements, whether due to error or fraud, and performing procedures that respond to those risks. Such
procedures included examining, on a test basis, evidence regarding the amounts and disclosures in the financial statements. Our audits also included evaluating the accounting principles used and significant estimates made by management, as well
as evaluating the overall presentation of the financial statements. We believe that our audits provide a reasonable basis for our opinion.
/s/ DELOITTE & TOUCHE LLP
Charlotte, North Carolina
September 24, 2021
September 24, 2021
PIEDMONT LITHIUM INC.
|
|
June 30,
|
|||||||
|
|
2021
|
2020
|
||||||
|
Assets
|
||||||||
|
Current assets:
|
||||||||
|
Cash and cash equivalents
|
$
|
142,651,648
|
$
|
18,857,088
|
||||
|
Other current assets
|
1,251,322
|
58,980
|
||||||
|
Total current assets
|
143,902,970
|
18,916,068
|
||||||
|
Exploration and evaluation assets
|
26,597,803
|
7,720,957
|
||||||
|
Property, plant and equipment, net
|
725,863
|
717,417
|
||||||
|
Operating lease right-of-use assets
|
139,797
|
268,610
|
||||||
|
Other assets
|
222,698
|
29,906
|
||||||
|
Equity investments in unconsolidated affiliates
|
16,262,498
|
—
|
||||||
|
Total assets
|
$
|
187,851,629
|
$
|
27,652,958
|
||||
|
Liabilities and stockholders’ equity
|
||||||||
|
Trade and other payables
|
$
|
4,959,031
|
$
|
1,232,528
|
||||
|
Current portion of long-term debt
|
1,085,142
|
577,576
|
||||||
|
Operating lease liabilities
|
140,435
|
135,947
|
||||||
|
Other current liabilities
|
29,906
|
—
|
||||||
|
Total current liabilities
|
6,214,514
|
1,946,051
|
||||||
|
Long-term debt, net of current portion
|
1,226,404
|
1,740,042
|
||||||
|
Operating lease liabilities, net of current portion
|
—
|
133,663
|
||||||
|
Other liabilities
|
—
|
29,906
|
||||||
|
Total liabilities
|
7,440,918
|
3,849,662
|
||||||
|
Commitments and contingencies (Note 15)
|
||||||||
|
Stockholders’ equity:
|
||||||||
|
Common stock; $0.0001 par value, 100,000,000 shares authorized; 15,764,533 and 10,356,762 shares issued and outstanding at June 30, 2021 and 2020, respectively
|
1,550
|
1,025
|
||||||
|
Additional paid-in capital
|
252,571,659
|
76,187,975
|
||||||
|
Accumulated deficit
|
(71,334,645
|
)
|
(51,589,139
|
)
|
||||
|
Accumulated other comprehensive loss
|
(827,853
|
)
|
(796,565
|
)
|
||||
|
Total stockholders’ equity
|
180,410,711
|
23,803,296
|
||||||
|
Total liabilities and stockholders’ equity
|
$
|
187,851,629
|
$
|
27,652,958
|
||||
The accompanying notes are an integral part of these financial statements
PIEDMONT LITHIUM INC.
|
|
Years Ended June 30,
|
|||||||
|
|
2021
|
2020
|
||||||
|
Operating expenses:
|
||||||||
|
Exploration and evaluation expenses
|
$
|
10,874,502
|
$
|
3,125,784
|
||||
|
General and administrative expenses
|
8,861,454
|
3,440,161
|
||||||
|
Loss from operations
|
(19,735,956
|
)
|
(6,565,945
|
)
|
||||
|
Other income (expense):
|
||||||||
|
Interest (expense) income, net
|
(267,886
|
)
|
53,961
|
|||||
|
Gain from foreign currency exchange
|
74,620
|
632,832
|
||||||
|
Loss before income taxes (benefit)
|
(19,929,222
|
)
|
(5,879,152
|
)
|
||||
|
Income tax expense (benefit)
|
—
|
—
|
||||||
|
Loss from equity investments in unconsolidated affiliates, net of tax
|
(64,626
|
)
|
—
|
|||||
|
Net loss
|
$
|
(19,993,848
|
)
|
$
|
(5,879,152
|
)
|
||
|
Basic and diluted loss per weighted-average share
|
$
|
(1.48
|
)
|
$
|
(0.71
|
)
|
||
|
Basic and diluted weighted-average number of shares outstanding
|
13,551,150
|
8,283,567
|
||||||
The accompanying notes are an integral part of these financial statements
PIEDMONT LITHIUM INC.
|
|
Years Ended June 30,
|
|||||||
|
|
2021
|
2020
|
||||||
|
Net loss
|
$
|
(19,993,848
|
)
|
$
|
(5,879,152
|
)
|
||
|
Other comprehensive loss, net of tax:
|
||||||||
|
Foreign currency translation adjustments
|
—
|
(499,399
|
)
|
|||||
|
Equity investment loss
|
(31,288
|
)
|
—
|
|||||
|
Other comprehensive loss, net of tax
|
(31,288
|
)
|
(499,399
|
)
|
||||
|
Comprehensive loss
|
$
|
(20,025,136
|
)
|
$
|
(6,378,551
|
)
|
||
The accompanying notes are an integral part of these financial statements
PIEDMONT LITHIUM INC.
|
|
Year Ended June 30,
|
|||||||
|
|
2021
|
2020
|
||||||
|
Cash flows from operating activities:
|
||||||||
|
Net loss
|
$
|
(19,993,848
|
)
|
$
|
(5,879,152
|
)
|
||
|
Adjustments to reconcile net loss to net cash provided by (used in) operating activities:
|
||||||||
|
Depreciation
|
11,589
|
13,249
|
||||||
|
Share-based compensation
|
1,319,372
|
470,939
|
||||||
|
Noncash lease expense
|
143,734
|
122,759
|
||||||
|
Loss on equity investments in unconsolidated affiliates
|
64,626
|
—
|
||||||
|
Changes in operating assets and liabilities:
|
||||||||
|
Other assets
|
(1,385,134
|
)
|
(29,736
|
)
|
||||
|
Operating lease liabilities
|
(144,096
|
)
|
(118,555
|
)
|
||||
|
Trade and other payables
|
3,726,503
|
(1,079,811
|
)
|
|||||
|
Other current liabilities
|
—
|
168,006
|
||||||
|
Net cash used in operating activities
|
(16,257,254
|
)
|
(6,332,301
|
)
|
||||
|
Cash flows from investing activities:
|
||||||||
|
Purchase of exploration and evaluation assets
|
(18,187,346
|
)
|
(2,747,783
|
)
|
||||
|
Capital expenditures
|
(20,035
|
)
|
(704,471
|
)
|
||||
|
Equity investments in unconsolidated affiliates
|
(16,358,412
|
)
|
—
|
|||||
|
Net cash used in investing activities
|
(34,565,793
|
)
|
(3,452,254
|
)
|
||||
|
Cash flows from financing activities:
|
||||||||
|
Proceeds from issuance of common stock, net of issuance costs
|
174,964,132
|
25,108,987
|
||||||
|
Proceeds from exercise of stock options
|
349,047
|
—
|
||||||
|
Principal payments on long-term debt
|
(695,572
|
)
|
(390,434
|
)
|
||||
|
Net cash provided by financing activities
|
174,617,607
|
24,718,553
|
||||||
|
Net increase in cash
|
123,794,560
|
14,933,998
|
||||||
|
Cash and cash equivalents at beginning of period
|
18,857,088
|
4,432,150
|
||||||
|
Effect of exchange rate changes on cash
|
—
|
(509,060
|
)
|
|||||
|
Cash and cash equivalents at end of period
|
$
|
142,651,648
|
$
|
18,857,088
|
||||
|
Supplemental disclosure of cash flow information:
|
||||||||
|
Cash paid for interest
|
$
|
289,125
|
$
|
157,271
|
||||
|
Noncash acquisitions of exploration and evaluation assets financed by seller
|
|
689,500
|
|
2,708,052
|
||||
The accompanying notes are an integral part of these financial statements
PIEDMONT LITHIUM INC.
|
|
Accumulated
|
|||||||||||||||||||||||
|
|
Additional
|
Other
|
Total
|
|||||||||||||||||||||
|
|
Common Stock
|
Paid-In
|
Accumulated
|
Comprehensive
|
Stockholders’
|
|||||||||||||||||||
|
|
Shares
|
Amount
|
Capital
|
Deficit
|
Loss
|
Equity
|
||||||||||||||||||
|
Balance at June 30, 2019
|
6,707,363
|
$
|
671
|
$
|
51,140,336
|
$
|
(46,245,126
|
)
|
$
|
(297,166
|
)
|
$
|
4,598,715
|
|||||||||||
|
Issuance of common stock, net
|
3,535,000
|
354
|
25,108,634
|
—
|
—
|
25,108,988
|
||||||||||||||||||
|
Stock-based compensation expense
|
— | — |
470,939
|
— | — |
470,939
|
||||||||||||||||||
|
Expiration of stock options
|
—
|
—
|
(531,934
|
)
|
531,934
|
—
|
—
|
|||||||||||||||||
|
Exercise of stock options
|
89,399
|
—
|
—
|
—
|
—
|
|||||||||||||||||||
|
Conversion of performance rights
|
25,000
|
—
|
—
|
—
|
—
|
—
|
||||||||||||||||||
|
Impact of ASC 842 adoption
|
—
|
—
|
—
|
3,205
|
—
|
3,205
|
||||||||||||||||||
|
Foreign currency translation adjustments
|
—
|
—
|
—
|
—
|
(499,399
|
)
|
(499,399
|
)
|
||||||||||||||||
|
Net loss
|
—
|
—
|
—
|
(5,879,152
|
)
|
—
|
(5,879,152
|
)
|
||||||||||||||||
|
Balance at June 30, 2020
|
10,356,762
|
1,025
|
76,187,975
|
(51,589,139
|
)
|
(796,565
|
)
|
|
23,803,296
|
|||||||||||||||
|
Issuance of common stock, net
|
5,250,000
|
525
|
174,963,607
|
—
|
—
|
174,964,132
|
||||||||||||||||||
|
Stock-based compensation expense
|
—
|
—
|
1,319,372
|
—
|
—
|
1,319,372
|
||||||||||||||||||
|
Expiration of stock options
|
—
|
—
|
(248,342
|
)
|
248,342
|
—
|
—
|
|||||||||||||||||
|
Exercise of stock options
|
22,500
|
—
|
349,047
|
—
|
—
|
349,047
|
||||||||||||||||||
|
Exercise of stock options (cashless)
|
130,271
|
—
|
—
|
—
|
—
|
—
|
||||||||||||||||||
|
Conversion of performance rights
|
5,000
|
—
|
—
|
—
|
—
|
—
|
||||||||||||||||||
|
Equity investment loss in other comprehensive loss
|
—
|
—
|
—
|
—
|
(31,288
|
)
|
(31,288
|
)
|
||||||||||||||||
|
Net loss
|
—
|
—
|
—
|
(19,993,848
|
)
|
—
|
(19,993,848
|
)
|
||||||||||||||||
|
Balance at June 30, 2021
|
15,764,533
|
$
|
1,550
|
$
|
252,571,659
|
$
|
(71,334,645
|
)
|
$
|
(827,853
|
)
|
$
|
180,410,711
|
|||||||||||
The accompanying notes are an integral part of these financial statements
PIEDMONT LITHIUM INC.
| 1. |
BASIS OF PRESENTATION AND REDOMICILIATION
|
Piedmont Lithium Inc. (“we,” “our,” “us,” “Company,” or “Piedmont Lithium”) is an exploration stage company centered on developing a multi-asset, integrated lithium
business that enables the transition to a net zero carbon world and the creation of a clean energy economy in North America. Through this endeavor, we are focused on developing and manufacturing battery quality lithium hydroxide for the
fast-growing electric vehicle industry. The centerpiece of our operations, our wholly-owned Carolina Lithium Project (“Carolina Lithium Project”), is located in the renowned Carolina Tin-Spodumene Belt of North Carolina. We are geographically
diversified with equity investments in strategic partnerships that own lithium resource assets in Canada and Ghana. Collectively, these resource assets and the location of these assets in the United States, Canada and Ghana, strategically
position us to be a large, low-cost, sustainable producer of lithium products and byproducts, including quartz, feldspar and mica, serving the North American and European electric vehicle and battery supply chains. The geology, geography and
proximity of our resources, planned production operations and customer base, should allow us to deliver a valuable continuous supply of high-quality, sustainably produced lithium hydroxide from spodumene concentrate, which is preferred by
most electric vehicle manufacturers. Our diversified operations should enable us to play a pivotal role in supporting the move toward decarbonization and the electrification of transportation and energy storage in the United States of
America.
Redomiciliation
Piedmont Lithium Inc. acquired all of the issued and outstanding ordinary shares of Piedmont Australia, our Australian predecessor and a wholly owned subsidiary, pursuant to a Scheme of Arrangement under
Australian law, which was approved by Piedmont Australia’s shareholders on February 26, 2021, and the Federal Court of Australia on May 5, 2021 (collectively referred to as “Redomiciliation”). As part of the Redomiciliation, the Company changed
its place of domicile from Australia to the State of Delaware in the United States, effective on May 17, 2021.
Piedmont Australia’s ordinary shares were listed on the ASX, and Piedmont Australia’s American Depositary Shares (“ADSs”), each representing 100 of Piedmont Australia’s ordinary shares, were traded on Nasdaq.
Following the approval of the Redomiciliation, the Company moved its primary listing from the ASX to Nasdaq and retained an ASX listing via CDIs, each representing 1/100th of a share of common stock of Piedmont Lithium Inc.
Pursuant to the Redomiciliation, holders of Piedmont Australia’s ordinary shares received one (1) CDI in Piedmont Lithium Inc. for each ordinary share held in Piedmont Australia on the Redomiciliation record date;
and holders of ADSs in Piedmont Australia received one (1) share of common stock of Piedmont Lithium Inc. for each ADS held in Piedmont Australia on the Redomiciliation record date with each ADS representing 100 Piedmont Australia ordinary
shares.
All issued and outstanding shares of our common stock have been retroactively adjusted in these consolidated financial statements to reflect the 100:1 ratio and share consolidation as if these events had
occurred on July 1, 2019. Shares of the Company’s common stock issued in connection with the Redomiciliation trade on Nasdaq under the symbol “PLL.”
Basis of Presentation
Our consolidated financial statements have been prepared in U.S dollars and in accordance with generally accepted accounting principles in the United States (“GAAP”). Unless otherwise indicated, all references to
“$” are to United States dollars, and all references to “AUD” are to Australian dollars. Our reporting currency is U.S. dollars.
The Company consolidates all entities in which it maintains a controlling financial interest. All intercompany balances and transactions have been eliminated in consolidation.
Prior to the Redomiciliation, Piedmont Australia reported its consolidated financial statements in accordance with International Financial Reporting Standards (“IFRS”). Following the Redomiciliation, the Company
transitioned to GAAP and applied GAAP retrospectively for all prior periods presented. In the opinion of management, all necessary adjustments (consisting of normal recurring adjustments, intercompany adjustments, reclassifications and
non-recurring adjustments) have been recorded to present fairly our financial position as of June 30, 2020 and 2021, and the results of operations, and cash flows for the years ended June 30, 2021 and 2020.
Our fiscal year ends on June 30 of each calendar year. All references to years 2020, 2021, 2022, 2023 and 2024 in this Form 10-K refer to fiscal years ended June 30, 2020, 2021, 2022, 2023 and 2024, respectively,
unless otherwise stated.
Risk and Uncertainties
The Company is subject to a number of risks similar to those of other companies of similar size in its industry, including but not limited to, the success of its exploration activities, need for additional capital (or financing) to fund operating
losses, competition from substitute products and services from larger companies, protection of proprietary technology, patent litigation, dependence on key individuals, and risks associated with changes in information technology.
The Company has an accumulated deficit as of June 30, 2021 and June 30, 2020, of $71.3 million and $51.6 million, respectively. The Company has incurred net losses and utilized cash in operations since inception,
and expects to incur future additional losses, as well. The Company has cash available on hand and believes that this cash will be sufficient to fund operations and meet its obligations as they come due within one year from the date these
consolidated financial statements are issued. In the event the Company does not achieve revenue anticipated in its current operating plan, management has the ability and commitment to reduce operating expenses as necessary. Until commercial
production is achieved from the Company’s planned operations, the Company will continue to incur operating and investing net cash outflows associated with, among other things maintaining and acquiring exploration properties and undertaking
ongoing exploration activities. As the Company is still over a year away from beginning operations and generating revenue, the Company’s long-term success is dependent upon its ability to successfully raise additional capital or financing. The
Company’s long-term success is also dependent upon its ability to obtain certain permits and approvals, develop its planned mine, concentrator plant and chemical plant, earn revenues, and achieve profitability.
The Company’s consolidated financial statements have been prepared on a going-concern basis, which contemplates the realization of assets and the satisfaction of liabilities in the normal course of business.
| 2. |
SUMMARY OF SIGNIFICANT ACCOUNTING POLICIES
|
Use of Estimates
The preparation of the consolidated financial statements in conformity with GAAP requires management to make estimates and assumptions that affect the reported amounts of assets and liabilities and disclosure of
contingent assets and liabilities at the date of the consolidated financial statements and the reported amounts of revenues and expenses during the reporting period. The Company regularly evaluates estimates and assumptions related to the fair
value of stock-based compensation, recoverability of long-lived assets, recognition of tax losses, depreciation, depletion, and amortization.
The Company bases its estimates and assumptions on current facts, historical experience and various other factors that it believes to be reasonable under the circumstances, the results of which form the basis for making judgments about the
carrying values of assets and liabilities and the accrual of costs and expenses that are not readily apparent from other sources. The actual results experienced by the Company may differ materially and adversely from the Company’s estimates. To the
extent there are material differences between the estimates and the actual results, future results of operations will be affected.
Cash and Cash Equivalents
The Company considers all highly liquid instruments with a maturity of three months or less at the time of issuance to be cash equivalents. The Company maintains cash deposits with high credit quality financial institutions. The deposits with
these financial institutions may exceed the federally insured limits; however, these deposits typically are redeemable upon demand. The Company has not experienced any losses because of these deposits and does not expect to incur any losses in the
future.
Property, Plant and Equipment
Long-lived assets, such as property, equipment and mineral properties, are evaluated for impairment whenever events or changes in circumstances indicate that the carrying amount of the asset may not be recoverable in
accordance with Accounting Standards Codification (“ASC”) 360,
“
Property, Plant, and Equipment
.” Circumstances which could trigger a review include, but are not
limited to: significant decreases in the market price of the asset; significant adverse changes in the business climate or legal factors; accumulation of costs significantly in excess of the amount originally expected for the acquisition or
construction of the asset; current period cashflow or operating losses combined with a history of losses or a forecast of continuing losses associated with the use of the asset; and current expectation that the asset will more likely than not be
sold or disposed significantly before the end of its estimated useful life.
Recoverability of assets is measured by a comparison of the carrying amount of an asset to estimated undiscounted future cash flows expected to be generated by an asset. If the carrying amount of an asset exceeds its
estimated future undiscounted cash flows, an impairment charge is recognized at the amount by which the carrying amount exceeds the estimated fair value of the asset. The estimated fair value is determined using a discounted cash flow analysis. Any
impairment in value is recognized as an expense in the period when the impairment occurs. The Company did not recognize any impairment charges associated with long-lived assets for the years ended June 30, 2021 and 2020.
Depreciation is computed on a straight-line basis using the following estimated useful lives of the assets:
|
Assets
|
Years
|
||
|
Office equipment
|
3 —7
|
||
|
Plant equipment
|
3 —15
|
||
|
Vehicles
|
3 —7
|
See Note 4 to the consolidated financial statements in this Form 10-K.
Asset Retirement Obligations
The Company follows the provisions of ASC Topic 410
, “Asset Retirement and Environmental Obligations
,”
which establishes standards
for the initial measurement and subsequent accounting for obligations associated with the sale, abandonment or other disposal of long-lived tangible assets arising from the acquisition, construction or development and for normal operations of
such assets. The Company records the fair value of a liability for an asset retirement obligation as an asset and liability when there is a legal obligation associated with the retirement of a tangible long-lived asset and the liability can be
reasonably estimated. The legal obligation to perform the asset retirement activity is unconditional, even though uncertainty may exist about the timing and/or method of settlement that may be beyond the entity’s control. As of June 30, 2021, and
2020, we did not record a provision for asset retirement obligation as no such condition had been met.
Exploration and Evaluation
We incur costs in resource exploration, evaluation and development during the different phases of our resource development projects. Exploration costs incurred before the declaration of proven and probable resources, which primarily include
exploration, drilling, engineering, metallurgical test-work, and compensation for employees directly engaged in exploration activities, are generally expensed as incurred. We have also expensed as incurred engineering costs attributable to the
evaluation of land for our future chemical and concentrator plants. After proven and probable resources are declared, exploration, evaluation and development costs necessary to bring the property to commercial capacity or increase the capacity or
useful life are capitalized.
The Company has not established proven and probable reserves, as defined by the Financial Accounting Standards Board (“FASB”), through the completion of a final or “bankable” feasibility study for any of its exploration projects. Unproved property
consists of costs to acquire unproved reserves, undeveloped lease lands and option payments made to landowners under the Company’s option agreements with local landowners which are considered part of the acquisition costs. Such capitalized costs are
transferred to proved property when related proved reserves are determined and are depleted on a unit-of-production basis.
For significant projects, interest is capitalized as part of the historical cost of developing and constructing assets when such costs are material to the consolidated financial statements. Interest is capitalized until the asset is ready for
service. Any costs to maintain the production capacity in a property under production are expensed as incurred. For the years ended June 30, 2021 and 2020, the Company did not (i) incur costs to maintain production capacity as there were no
properties under production or (ii) capitalize interest costs associated with developing and constructing assets.
The Company assesses its resource development assets for impairment whenever events or circumstances indicate that the carrying value of the assets may not be recoverable. The Company did not record impairment expense during the years ended June
30, 2021 or 2020.
Foreign Currencies
The consolidated financial statements are presented in United States dollars which is the Company’s reporting currency.
Effective June 30, 2020, the Company adopted the U.S. dollar as its functional currency. The change in functional currency of the Company was due to the increased exposure to the U.S. dollar, as a result of the Company’s future operating, and
capital costs are expected to be in U.S. dollars.
Prior to June 30, 2020, the functional currency of each of the Company’s consolidated entities was measured using the currency of the primary economic environment in which that entity operated. The change in
functional currency was applied prospectively with effect from June 30, 2020 in accordance with GAAP. To give effect to the change in functional currency, the assets and liabilities of entities with an Australian dollar (AUD) functional currency on
June 30, 2020 were converted into U.S. dollars at a fixed exchange rate of $1:AUD 1.457 and the stockholders’ equity and accumulated deficit were converted at applicable historical rates.
The financial results and position of foreign operations whose functional currency was different from the Company’s reporting currency were translated as follows:
|
|
• |
assets and liabilities were translated at year-end exchange rates prevailing at that reporting date;
|
|
|
• |
income and expenses were translated at average exchange rates for the period; and
|
|
|
• |
equity transactions including retained earnings/accumulated deficit were translated at the exchange rates prevailing at the date of the transaction.
|
Gains and losses arising from translations or settlements of foreign currency denominated transactions or balances were included in the determination of income. “Other comprehensive loss, net of tax,” in the
consolidated statements of comprehensive loss, included foreign currency translation adjustments for the year ended June 30, 2020 due to the change in functional currency. Gains and losses resulting from foreign currency transactions are presented
in “Gain from foreign currency exchange” in the consolidated statements of operations.
Loss per Share
The Company computes loss per share in accordance with ASC Topic 260,
“
Earnings per Share
.”
Basic net loss per common share is computed by dividing net loss by the weighted-average number of shares of common shares outstanding during the period. Diluted net loss per share of common stock is computed by giving effect to all potential
dilutive shares of common stock, including options, restricted stock units (“RSUs”) and performance awards. Basic and diluted net loss per share of common stock were the same for all periods presented as the impact of all potentially dilutive
securities outstanding was anti-dilutive.
Revenue Recognition
The Company is in an exploration stage and has no revenues. Specific evaluations described in ASC 606,
“
Revenue from Contracts with
Customers
”
will be performed once the Company begins earning revenues. In accordance with ASC Topic 606, revenue will be measured as the amount of consideration received in exchange for transferring
goods or providing services, and will be recognized when performance obligations are satisfied under the terms of contracts with customers. A performance obligation will be deemed to be satisfied when control of the product is transferred to the
customer.
Stock-based Compensation
The Company records stock-based compensation in accordance with ASC 718,
“
Stock Compensation
.”
Equity-settled stock-based payments are provided to directors, officers, employees, consultants and other advisors. These stock-based payments are measured at the fair value of the equity instrument at the grant date in accordance with ASC 718. Fair
value is determined using the Black Scholes valuation model. The Company has applied a graded (tranche-by-tranche) attribution method and records share-based compensation expense on an accelerated basis over the vesting period of the share award.
Forfeitures are accounted for in the period incurred.
On July 1, 2019, we early adopted Accounting Standards Update (“ASU”) 2018-07,
“
Compensation—Stock Compensation
”
and account for non-employee stock-based awards in accordance with the measurement and recognition criteria of ASC 718 and recognizes the fair value of such awards over the service period.
The Company used the modified retrospective method of adoption. There was no cumulative effect of adoption on July 1, 2019.
Fair Value of Financial Instruments
Fair value is the exchange price that would be received for an asset or paid to transfer a liability (exit price) in the principal or most advantageous market for the asset or liability in an orderly transaction
between market participants on the measurement date.
The Company follows FASB ASC Topic 820,
“
Fair Value Measurement and Disclosure
,”
which
establishes a three-level valuation hierarchy for disclosure of fair value measurements. The valuation hierarchy categorizes assets and liabilities measured at fair value into one of three different levels depending on the observability of the
inputs employed in the measurement. The three levels are defined as follows:
|
Level 1:
|
Quoted prices (unadjusted) for identical assets or liabilities in active markets.
|
|
|
Level 2:
|
Inputs other than quoted prices included within Level 1 that are either directly or indirectly observable for the asset or liability, including quoted prices for similar assets or liabilities in active
markets, quoted prices for identical or similar assets or liabilities in inactive markets, inputs other than quoted prices that are observable for the asset or liability and inputs that are derived from observable market data by
correlation or other means.
|
|
|
Level 3:
|
Inputs for the asset or liability that are not based on observable market data (unobservable inputs).
|
The level within which the financial asset or liability is classified is determined based on the lowest level of significant input to the fair value measurement.
Measurement of Fair Value
The Company’s material financial instruments consist primarily of cash and cash equivalents, trade and other payables, and long-term debt as follows:
|
|
• |
Long-term debt—As of June 30, 2021 and 2020, the Company had $2.3 million and $2.3 million, respectively, of principal debt outstanding associated with seller financed loans. The carrying value of the
Company’s long-term debt approximates its estimated fair value as recently negotiated loans in 2021 have a stated interest rates of 10%, consistent with the stated interest rates of all other seller financed loans.
|
|
|
• |
Other financial instruments—The carrying amounts of cash and cash equivalents and trade and other payables approximate fair value due to their short-term nature.
|
Income Taxes
The Company accounts for income taxes using the asset and liability method. Under the asset and liability method, deferred tax assets and liabilities are recognized for the estimated future tax consequences
attributable to differences between the financial statement carrying amounts of existing assets and liabilities and their respective tax bases. In addition, deferred tax assets are also recorded with respect to net operating losses and other tax
attribute carryforwards. Deferred tax assets and liabilities are measured using enacted tax rates in effect for the year in which those temporary differences are expected to be recovered or settled. Valuation allowances are established when
realization of the benefit of deferred tax assets is not deemed to be more likely than not. The effect on deferred tax assets and liabilities of a change in tax rates is recognized in income in the period that includes the enactment date.
The Company intends to continue maintaining a full valuation allowance on its deferred tax assets until there is sufficient evidence to support reversal of all or a portion of the allowances. In establishing the full
valuation allowance position, we considered all available evidence, including all potential sources of taxable income, future reversals of taxable temporary differences, projections of taxable income, and income from tax planning strategies, as well
as any other available and relevant information. Existing valuation allowances are re-examined each period. If it were determined that it is more likely than not that a deferred tax asset will be realized, the appropriate amount of the valuation
allowance, if any, would be released in the period this determination is made.
We only recognize a tax benefit after concluding that it is more likely than not that the benefit will be sustained upon audit by the respective taxing authority based solely on the technical merits of the
associated tax position. Once the recognition threshold is met, we recognize a tax benefit measured as the largest amount of the tax benefit that, in our judgment, is greater than 50% likely to be realized. Interest and penalties related to
income tax liabilities are included in “Income tax expense” in our consolidated statements of operations.
Equity Investments in Unconsolidated Affiliates
We apply the equity method of accounting for investments when we have significant influence, but not controlling interest in the investee. Judgment regarding the level of influence over each equity method investment
includes key factors such as ownership interest, representation on the board of directors, participation in policy-making decisions and material intercompany transactions. The Company’s proportionate share of the net income (loss) resulting from
these investments is reported as “Loss from equity investments in unconsolidated affiliates, net of tax” in our consolidated statements of operations. The carrying value of our equity method investments is reported as “Equity investments in
unconsolidated affiliates” in our consolidated balance sheets. The Company’s equity method investments are reported at cost and adjusted each period for the Company’s share of the investee’s income (loss) and dividends paid, if any. The Company’s
share of the investee’s income or loss is recorded on a one quarter lag for all equity method investments. The Company classifies distributions received from equity method investments using the cumulative earnings approach on the consolidated
statements of cash flows. The Company assesses investments for impairment whenever events or changes in circumstances indicate that the carrying value of an investment may not be recoverable. If the decline in value is considered to be other than
temporary, the investment is written down to its estimated fair value, which establishes a new cost basis in the investment. The Company did not record any such impairment charges for all periods presented. See Note 5 to the consolidated financial
statements in this Form 10-K.
Leases
Effective January 1, 2019, the Company began accounting for leases in accordance with ASC Topic 842,
“
Lease
s
”
(“ASC 842”), which requires lessees to recognize lease liabilities and right-of-use assets (“ROU”) on the balance sheet for contracts that provide lessees with the right to control the use of identified assets. As part of this
adoption, the Company made certain accounting policy elections which are detailed in the recently adopted accounting pronouncements sub-section in Note 2 to the consolidated financial statements in this Form 10-K. The Company evaluates whether its
contractual arrangements contain leases at the inception of such arrangements. Specifically, management considers whether the Company can control the underlying asset and has the right to obtain substantially all of the economic benefits or outputs
from the asset.
ROU lease assets represent the Company’s right to use an underlying asset for the lease term, and lease liabilities represent the obligation to make lease payments. Both the ROU lease asset and liability are recognized as of the lease commencement
date based on the present value of the lease payments over the lease term. The Company’s leases do not provide an implicit borrowing rate that can readily be determined. Therefore, the Company applies a discount rate based on the incremental
borrowing rate, which is determined using the Company’s synthetic credit rating and other information available as of the lease commencement date. ROU lease assets also include any lease payments made before their contractual due dates and exclude
any lease incentives.
The Company’s lease agreements may include options to extend the lease term or to terminate the lease early. The Company includes options to extend or terminate leases upon determination of the ROU lease asset and
liability when it is reasonably certain the Company will exercise these options. Operating lease expense attributable to lease payments is recognized on a straight-line basis over the lease term and is included in “Exploration and evaluation
expenses” in the consolidated statements of operations.
The Company evaluates ROU assets for impairment consistent under the impairment of long-lived assets policy.
The Company had no finance leases as of June 30, 2021 and 2020.
Recently Issued and Adopted Accounting Pronouncements
The Company is an emerging growth company, as defined in the Jumpstart Our Business Startups Act of 2012 (“JOBS Act”). Under the JOBS Act, emerging growth companies can delay adopting new or revised accounting
standards issued subsequent to the enactment of the JOBS Act until those standards apply to private companies. The Company has elected to use this extended transition period for complying with new or revised accounting standards that have
different effective dates for public and private companies until the earlier of the date that it (i) is no longer an emerging growth company or (ii) affirmatively and irrevocably opts out of the extended transition period provided in the JOBS
Act. As a result, the consolidated financial statements may not be comparable to companies that comply with the new or revised accounting pronouncements as of public company effective dates.
The JOBS Act does not preclude an emerging growth company from early adopting new or revised accounting standards. As described below, the Company has early adopted certain accounting pronouncements before the due
date for emerging growth companies. The Company expects to use the extended transition period for any other new or revised accounting standards during the period for which the Company remains an emerging growth company.
Newly Adopted Accounting Pronouncements
Effective July 1, 2019, we early adopted ASC 842. This update requires a lessee to recognize in the statement of financial position a right-of-use asset representing its right to use the underlying asset for the
lease term and a liability for future lease payments. Similar to past guidance, the update continues to differentiate between finance leases and operating leases; however, this distinction now primarily relates to differences in the manner of
expense recognition over time. Additionally, lessors will be required to classify leases as sales-type, finance or operating, with classification affecting the pattern of income recognition. Classification for both lessees and lessors is now based
on an assessment of whether a lease contract is economically similar to the purchase of a non-financial asset from the perspective of control. The update also requires quantitative and qualitative disclosures to enable users to understand the
amount, timing, and judgments related to leases and the related cash flows. We applied the provisions of ASC 842 to our lease contracts as of July 1, 2019, using the modified retrospective method of adoption. As of July 1, 2019, we recorded, as a
result of the adoption of this guidance, operating lease right-of-use assets of $391,549 and operating lease liabilities of $388,344.
We have applied the following practical expedients and policy elections under ASC 842:
|
|
• |
we elected to utilize the package of transition practical expedients, which permitted us: (i) to not reassess whether any expired or existing contracts are or contain a lease, (ii) to not reassess our
historical lease classifications for existing leases, and (iii) to not reassess initial direct costs for existing leases;
|
|
|
• |
for contracts in which we are a lessee, we have elected for each of our asset classes to account for each lease component and its associated non-lease components as a single lease component;
|
|
|
• |
a practical expedient to use hindsight in assessing the lease term and impairment; and
|
|
|
• |
we elected to utilize the short-term lease exemption for lease contracts with a term of 12 months or less; furthermore, these contracts are excluded from the measurement of our right-of-use assets and lease
liabilities and are recognized in earnings on a straight-line basis over their lease term.
|
See Note 8
to the consolidated financial statements in this Form 10-K.
Effective July 1, 2019, we early adopted FASB ASU 2017-11, “
Earnings Per Share (Topic 260)
.”
The amendments in the update change the
classification of certain equity-linked financial instruments (or embedded features) with down round features. The amendments also clarify existing disclosure requirements for equity-classified instruments. For free standing equity-classified
financial instruments, the amendments require entities that present earnings per share (“EPS”) in accordance with ASU 2017-11, to recognize the effect of the down round feature when it is triggered. That effect is treated as a dividend and as a
reduction of income available to common shareholders in basic EPS. Convertible instruments with embedded conversion options that have down round features would be subject to the specialized guidance for contingent beneficial conversion features (in
Subtopic ASU 470-20,
“
Debt—Debt with Conversion and Other Options
),” including related EPS guidance (in Topic 260). For public business entities, the amendments in
Part I of this update are effective for fiscal years, and interim periods within those fiscal years, beginning after December 15, 2018. The adoption of ASU 2017-11 did not have a material impact on the Company’s consolidated financial statements.
Effective July 1, 2019, we early adopted ASU 2018-07,
“
Compensation—Stock Compensation (Topic 718
)
.”
This update is intended to reduce cost and complexity and to improve financial reporting for stock-based payments issued to non-employees, such as service providers, consultants, external legal counsel, and suppliers. The ASU expands the scope of
Topic 718,
“
Compensation—Stock Compensation
,”
which currently only includes stock-based payments issued to employees, to
also include stock-based payments issued to non-employees for goods and services. Consequently, the accounting for stock-based payments to non-employees and employees will be substantially aligned. This standard will be effective for financial
statements issued by public companies for the annual and interim periods beginning after December 15, 2018. Early adoption of the standard is permitted. The standard will be applied in a retrospective approach for each period presented. We did not
record an adjustment as of July 1, 2019, as our adoption of ASU 2016-13 did not have a material impact on the Company’s consolidated financial statements.
Effective July 1, 2019, we early adopted ASU 2016-13,
“Lease
s
”
Financial Instruments—Credit Losses
(Topic 326
):
Measurement of Credit Losses on Financial Instruments
.”
The update amends the impairment model to
utilize a current expected credit loss (“CECL”) model to estimate its lifetime expected credit loss and record an allowance that, when deducted from the amortized cost basis of the financial asset, presents the net amount expected to be collected
on the financial asset. The CECL model is expected to result in more timely recognition of credit losses. ASU 2016-13 also requires new disclosures for financial assets measured at amortized cost, loans and available-for-sale debt securities. This
guidance is effective for fiscal years beginning after December 15, 2022, including interim periods within those fiscal years, for smaller reporting companies. Entities will apply the standard’s provisions as a cumulative-effect adjustment to
retained earnings as of the beginning of the first reporting period in which the guidance is adopted. We did not record an adjustment as of July 1, 2019, as our adoption of ASU 2016-13 did not have a material impact on the Company’s consolidated
financial statements.
Effective July 1, 2020, we early adopted ASU 2019-12,
“
Income Taxes (Topic 740): Simplifying the Accounting for Income Taxes,”
which
simplifies the accounting for income taxes by removing certain exceptions to the general principles in ASC Topic 740. The amendments also improve consistent application of and simplify GAAP for other areas of ASC Topic 740 by clarifying and
amending existing guidance. This guidance is effective for fiscal years, and interim periods within those fiscal years, beginning after December 15, 2020. The adoption of ASU 2019-12 did not have a material impact on the Company’s consolidated
financial statements.
Recently Issued Accounting Pronouncements Not Yet Adopted
In April 2021, the FASB issued ASU 2021-04, which included Topic 260,
“
Earnings Per Share
”
and Topic 718,
“
Compensation
—
Stock Compensation
.”
This guidance clarifies and reduces diversity in an issuer’s accounting for modifications or exchanges of freestanding equity-classified written call options due to a lack of explicit guidance in the FASB Codification. The ASU 2021-04 is effective
for all entities for fiscal years beginning after December 15, 2021. Early adoption is permitted. The Company is currently evaluating the impact of adopting ASU 2021-04 on its consolidated financial statements.
Any other recently issued accounting pronouncements were neither relevant, nor expected to have a material impact on the Company’s consolidated financial statements.
| 3. |
EXPLORATION AND EVALUATION ASSETS
|
The Company owns or has entered into exclusive option agreements or land acquisition agreements with landowners in North Carolina, United States, which upon exercise, allow the Company to purchase, or in some cases
lease, surface properties and the associated mineral rights from private landowners. For those properties under option, no liability is recorded until the Company is certain of exercising the option.
During the years ended June 30, 2021 and 2020, the Company made land acquisition payments and land option payments to landowners. These payments, including legal fees and other direct costs to enter into these
contract agreements, have been capitalized as acquisition costs and recorded in exploration and evaluation assets in the consolidated balance sheets.
Capitalized acquisition cost activity for exploration and evaluation assets is presented in the following table:
|
June 30,
|
||||||||
|
2021
|
2020
|
|||||||
|
Beginning balance
|
$
|
7,720,957
|
$
|
2,265,121
|
||||
|
Land acquisitions through cash payments
|
17,898,705
|
2,747,784
|
||||||
|
Land acquisitions through seller financed loans
|
978,141
|
2,708,052
|
||||||
|
Ending balance
|
$
|
26,597,803
|
$
|
7,720,957
|
||||
| 4. |
PROPERTY, PLANT AND EQUIPMENT
|
Property, plant and equipment consisted of the following:
|
June 30,
|
|||||||||
|
2021
|
2020
|
||||||||
|
Land
|
$
|
688,829
|
$
|
688,829
|
|||||
|
Office Equipment
|
72,104
|
52,068
|
|||||||
|
Property, plant, and equipment, gross
|
760,932
|
740,897
|
|||||||
|
Accumulated depreciation and amortization
|
(35,069
|
)
|
(23,480
|
)
|
|||||
|
Property, plant, and equipment, net
|
$
|
725,863
|
$
|
717,417
|
|||||
Depreciation expense for the years ended June 30, 2021 and 2020, was $11,589 and $13,249, respectively, and is included in “General and administrative expenses” in the consolidated statements of operations.
| 5. |
EQUITY INVESTMENTS IN UNCONSOLIDATED AFFILIATES
|
During the second half of 2021, the Company entered into agreements with Sayona Mining Limited (“Sayona”), a pre-revenue emerging lithium mining company, to
|
|
(i)
|
acquire 442,441,606 ordinary shares in Sayona for $4.9 million;
|
|
|
(ii)
|
acquire an 8% convertible note in Sayona for $6.2 million, which was subsequently converted into equity resulting in the Company acquiring 557,941,415 ordinary shares of Sayona; and
|
|
|
(iii)
|
enter into a supply agreement with Sayona Quebec Inc, (“Sayona Quebec”) to purchase the greater of 60,000 metric tons per year or 50% of Sayona Quebec’s spodumene
concentrate production at market prices on a life-of-mine basis; or, if Sayona Quebec successfully acquired NAL, a right to purchase the greater of 113,000 metric tons per year or 50% of Sayona Quebec’s spodumene concentrate production
at market prices on a life-of-mine basis from the combined assets of the Authier Project and NAL.
|
The Company was granted one seat on the board of directors of Sayona, which the Company has not exercised as of June 30, 2021. The Company had an equity interest of
approximately 19% in Sayona as of June 30, 2021.
Management determined that the factors listed above, provide the Company with significant influence over Sayona over its operating and financial interests, but not a controlling financial interest, as
defined in ASC Topic 323
,
“
Investments
—
Equity Method and Joint Ventures
.”
Accordingly, management recorded this investment interest under the equity method in
accordance with ASC 323.
In June 2021, the Company acquired a 25% equity interest in Sayona Quebec for $5.0 million. Management determined that Sayona Quebec met the criteria under ASC Topic 323 to be considered an equity method
investment.
The following summarizes the carrying amount of our equity method investments:
|
|
June 30, 2021 | |||
|
Entities
|
||||
|
Sayona Mining Limited
(1)
|
$
|
11,194,905
|
||
|
Sayona Quebec Inc.
|
5,067,593
|
|||
|
Total
|
$
|
16,262,498
|
||
|
|
(1) |
The carrying amount of the equity method investment for Sayona Mining Limited includes a loss of $64,626 from equity investments in unconsolidated affiliates, net of tax.
|
The following summarizes our share of loss from equity investments in unconsolidated affiliates, net of tax, as reflected in the consolidated statements of operations:
|
June 30, 2021
|
||||
|
Entities
|
||||
|
Sayona Mining Limited
|
$
|
64,626
|
||
|
Sayona Quebec Inc.
|
—
|
|||
|
Total
|
$
|
64,626
|
||
The summarized financial information presented below reflects the aggregated financial information of the Company’s equity method investees as of and for the period ended March 31, 2021. The amounts recorded are
consistent with the Company’s recognition of the results of its equity investments in unconsolidated affiliates on a one quarter lag. The summarized financial information is presented only for the periods when the Company owned its investment.
|
2021
|
||||
|
From inception through March 31,
|
||||
|
Other income
|
$
|
74,379
|
||
|
Net loss from operations
|
(324,754
|
)
|
||
|
Other comprehensive loss
|
(157,224
|
)
|
||
|
Comprehensive loss
|
(481,979
|
)
|
||
|
As of March 31,
|
||||
|
Current assets
|
9,710,517
|
|||
|
Non-current assets
|
17,718,789
|
|||
|
Current liabilities
|
4,746,137
|
|||
|
Non-current liabilities
|
24,285
|
|||
| 6. |
TRADE AND OTHER PAYABLES
|
Trade and other payables consisted of the following:
|
|
June 30,
|
|||||||
|
|
2021
|
2020
|
||||||
|
Trade accounts payable
|
$
|
2,561,834
|
$
|
791,264
|
||||
|
Accrued expenses
|
2,397,197
|
441,264
|
||||||
|
Total
|
$
|
4,959,031
|
$
|
1,232,528
|
||||
| 7. |
LONG-TERM DEBT
|
The Company has entered into long-term debt agreements to purchase surface properties and the associated mineral rights from private landowners that form part of exploration and evaluation assets. These purchases
were fully or partly financed by the seller of each of the surface properties. The long-term debt is repayable in monthly installments ranging from approximately $2,000 to $20,000 per month on terms ranging from 2 to 5 years. Payments include an
implied or stated interest rate of 10% and are secured by the respective surface property. The Company paid $271,264 and $107,569 as interest on these loans for the year ended June 30, 2021 and 2020, respectively. The outstanding balances of these
long-term liabilities totaled approximately $2.3 million as of June 30, 2021.
Scheduled payments for the principal portion of the Company’s outstanding long-term debt are as follows:
|
June 30, 2021
|
||||
|
2022
|
$
|
1,085,142
|
||
|
2023
|
641,955
|
|||
|
2024
|
544,514
|
|||
|
2025
|
39,935
|
|||
|
Total
|
$
|
2,311,546
|
||
| 8. |
LEASES
|
The Company has entered into operating leases for its offices. The Company did not enter into or have finance leases during the years ended June 30, 2021 or 2020. The leases do not include options to renew or extend the lease term after expiration, and this fact has been considered in the measurement of our lease liabilities. The Company also has a sublease arrangement for one of its leased offices.
Lease presentation in the Company’s consolidated balance sheets, components of lease costs and other lease information are presented in the following table:
|
As of and for the Years
Ended June 30,
|
||||||||
|
2021
|
2020
|
|||||||
|
Assets
|
||||||||
|
Right-of-use assets - operating lease
|
$ |
139,797
|
$ |
268,610
|
||||
|
Liabilities
|
||||||||
|
Current
|
140,435
|
135,947
|
||||||
|
Non-current
|
—
|
133,663
|
||||||
|
Operating lease liabilities
|
140,435
|
269,610
|
||||||
|
Statements of Operations
|
||||||||
|
Operating lease cost
|
|
165,456
|
|
156,456
|
||||
|
Short-term lease cost
|
78,583
|
32,673
|
||||||
|
Sublease income
(1)
|
120,752
|
29,906
|
||||||
|
Other Information
|
||||||||
|
Right-of-use assets obtained in exchange for new operating lease liabilities
|
14,921
|
391,549
|
||||||
|
Cash paid for amounts included in the measurement of lease liabilities:
|
||||||||
|
Operating cash flows from operating leases
|
|
165,817
|
|
152,251
|
||||
|
Weighted-average remaining lease term (in months)
|
|
11.05
|
|
22.96
|
||||
|
Weighted-average discount rate
|
10.00
|
%
|
10.00
|
%
|
||||
|
|
(1) |
In March 2020, the Company entered into an agreement to sublease one of its offices in the United States. The sublease is classified as an operating lease. The Company has assessed that as a result of
entering into the sublease, the Company continues to retain significant risks and rewards associated with the use of the office space and as such continues to recognize the right-of-use asset and lease liability recorded in relation to
this lease.
|
Maturities of lease payments under non-cancellable leases are as follows:
|
June 30, 2021
|
||||
|
2022
|
$
|
147,506
|
||
|
Total future minimum lease payments
|
147,506
|
|||
|
Interest included within lease payments
|
(7,071
|
)
|
||
|
Total operating lease liabilities
|
$
|
140,435
|
||
| 9. |
LOSS PER SHARE
|
Basic and diluted loss per share are as follows:
|
|
Years Ended June 30,
|
|||||||
|
|
2021
|
2020
|
||||||
|
Net loss
|
$
|
(19,993,848
|
)
|
$
|
(5,879,152
|
)
|
||
|
Weighted average shares:
|
||||||||
|
Weighted average common shares outstanding, basic
(1)
|
13,551,150
|
8,283,567
|
||||||
|
Diluted effect of incremental shares related to incentive options and performance rights
|
—
|
—
|
||||||
|
Weighted average number of common shares used in calculating basic and dilutive earnings per share
(2)
|
13,551,150
|
8,283,567
|
||||||
|
|
||||||||
|
Basic and diluted loss per weighted average share
|
$
|
(1.48
|
)
|
$
|
(0.71
|
)
|
||
|
|
(1) |
As of June 30, 2021, 392,504 incentive options, 60,000 performance rights and 36,745 restricted stock units, collectively, represented 489,249 potential common shares and were considered anti-dilutive
as they would decrease the loss per share. As of June 30, 2020, 536,250 incentive options and 50,000 performance rights, which together represent 586,250 potential common shares, were considered anti-dilutive as they would decrease
the loss per share.
|
|
|
(2) |
The weighted average number of common shares used in calculating basic and dilutive earnings per share has been adjusted to reflect the impact of the exchange ratio caused by the Redomiciliation.
|
| 10. |
EQUITY
|
Pursuant to the Redomiciliation and in connection with the Redomiciliation, holders of Piedmont Australia ordinary shares received one (1) CDI in the Company for each ordinary share held in Piedmont Australia with
each CDI representing 1/100
th
of a share of common stock in the Company (subject to adjustment as applicable due to the rounding up of fractional shares); and holders of ADS in Piedmont Australia received one (1) share of common stock in
the Company for each ADS held in Piedmont Australia with each ADS representing 100 Piedmont Australia ordinary shares.
On the effective date of the Redomiciliation, the number of ordinary outstanding shares was reduced from 1,574,597,320 to 15,764,533 shares of common stock. All share and per share amounts in these consolidated
financial statements and related notes for periods prior to the Redomiciliation have been retroactively adjusted to reflect the effect of the exchange ratio.
The Company is authorized to issue up to 100,000,000 shares of common stock, par value $0.0001 per share, and 10,000,000 shares of preferred stock, par value $0.0001 per share. The Company has no outstanding shares of
preferred stock.
The following is a summary of our capital stock activity:
|
|
Number of
Shares
|
Weighted-Average Issue Price
|
|||||
|
Balance at June 30, 2019
|
6,707,363
|
||||||
|
Australia share placement (July 2019)
(1)
|
1,450,000
|
AUD 14.50
(2)
|
|||||
|
U.S. public offering (June 2020)
(1)
|
2,065,000
|
$6.30
|
|||||
|
Exercise of incentive options
|
109,399
|
—
|
|||||
|
Conversion of performance rights
|
25,000
|
—
|
|||||
|
Balance at June 30, 2020
|
10,356,762
|
||||||
|
Australia share placement (August 2020)
(1)
|
1,200,000
|
AUD 9.00
(2)
|
|||||
|
U.S. public offering (October 2020)
(1)
|
2,300,000
|
$25.00
|
|||||
|
U.S. public offering (March 2021)
(1)
|
1,750,000
|
$70.00
|
|||||
|
Exercise of incentive options (cashless)
(3)
|
130,271
|
—
|
|||||
|
Exercise of incentive options
(4)
|
22,500
|
— | |||||
|
Conversion of performance rights
|
5,000
|
—
|
|||||
|
Balance at June 30, 2021
|
15,764,533
|
||||||
|
|
(1) |
Share issuance costs associated with Australia share placements and US public offerings totaled $12,819,429 and $2,326,270, during the years ended June 30, 2021 and 2020, respectively, and were accounted
for as a reduction in the proceeds from share issuances in the consolidated balance sheets.
|
|
|
(2) |
The weighted average issue price in Australian dollars (AUD) were on share issuances that were initiated in Australia and translated into U.S. dollars at historical rates.
|
|
|
(3) |
130,271 stock options were exercised through cashless exercises during the year ended June 30, 2021.
|
|
|
(4) |
22,500 stock options consisting of 5,000, 2,500, 15,000 incentive options with weighted average issue prices of AUD 35.00, AUD 16.00 and $12.38, respectively, were
exercised during the year ended June 30, 2021.
|
| 11. |
EQUITY-BASED COMPENSATION
|
Prior to the Redomiciliation, Piedmont Australia granted share-based awards to its employees, officers, non-employee directors, and other service providers as part of remuneration and incentive arrangements. The
principal awards issued under PLL’s stock-based compensation plans included incentive stock options and performance rights. All awards granted under the plans consisted of Piedmont Australia ordinary shares. Effective with the Redomiciliation,
outstanding PLL share-based awards were converted to share-based awards of the Company.
Stock-based compensation expense is reported within “Exploration and evaluation expenses” and “General and administrative expenses” in the consolidated statements of operations in accordance with the Company’s policy.
The Company includes the expense related to stock-based payment arrangements in the same financial statement line item as cash compensation paid to the same employees.
Stock-based compensation expense related to all stock-based incentive plans is included in our consolidated statements of operations as follows:
|
Years Ended June 30,
|
||||||||
|
2021
|
2020
|
|||||||
|
Exploration and evaluation expenses
|
$
|
495,031
|
$
|
171,151
|
||||
|
General and administrative expenses
|
824,341
|
299,788
|
||||||
|
Total stock-based compensation expense
(1)
|
$
|
1,319,372
|
$
|
470,938
|
||||
|
|
(1) |
For the years ended June 30, 2021 and 2020, the Company did not reflect a tax benefit in the consolidated statements of operations associated with stock-based compensation expense because the Company had a
full tax valuation allowance during these periods. As such, the table above does not reflect the tax impacts of stock-based compensation expense.
|
Stock Incentive Plans
On March 31, 2021, the Company’s Board of Directors adopted, in connection with the planned Redomiciliation, the Piedmont Lithium Inc. Stock Incentive Plan (“Incentive Plan”). A total of 3,000,000 shares of common stock are reserved for issuance
under the Incentive Plan, subject to customary adjustments arising from stock splits and other similar changes that affect the number or kind of common stock outstanding. The Incentive Plan authorized the grant of stock options, stock appreciation
rights, restricted stock units and restricted stock, any of which may be performance-based. The Company’s Compensation Committee determines the exercise price for stock options and the base price of stock appreciation rights, which may not be less
than the fair market value of the Company’s common stock on the date of grant. Generally, stock options or stock appreciation rights vest after three years of service and expire at the end of ten years. Performance share awards vest if the Company
achieves certain pre-established performance targets that are based on specified performance criteria over a performance period of not less than three years.
Incentive Option Awards
A summary of the Company’s stock option activity for the years ended June 30, 2021 and 2020 is presented in the following table:
|
|
Shares
|
Weighted-
Average
Exercise Price
(per share)
|
Weighted-Average
Remaining
Contractual Term
(in years)
|
Aggregate
Intrinsic Value
|
||||||||||||
|
Outstanding at June 30, 2019
|
846,500
|
$
|
13.77
|
1.1
|
$
|
64.39
|
||||||||||
|
Granted
|
259,500
|
16.15
|
— |
62.01
|
||||||||||||
|
Exercised or Settled
|
(315,000
|
)
|
7.71
|
— |
70.45
|
|||||||||||
|
Expired
|
(254,750
|
)
|
17.13
|
— |
61.03
|
|||||||||||
|
Outstanding at June 30, 2020
|
536,250
|
|
16.88
|
1.6
|
|
61.28
|
||||||||||
|
Granted
|
135,004
|
35.14
|
— |
43.02
|
||||||||||||
|
Exercised or Settled
|
(15,000
|
)
|
12.38
|
— |
65.78
|
|||||||||||
|
Expired
|
(263,750
|
)
|
15.97
|
— |
62.19
|
|||||||||||
|
Outstanding at June 30, 2021
|
392,504
|
|
21.16
|
4.1
|
|
57.00
|
||||||||||
|
Vested at June 30, 2021
|
261,500
|
|
14.08
|
1.4
|
|
64.08
|
||||||||||
The per-share weighted average grant date fair value of stock options granted during the years ended June 30, 2021, and 2020 was $15.26 and $1.20, respectively. The Company has unvested remaining stock compensation
expense of $2,895,186 to be recognized through the fourth quarter of 2024. The intrinsic value of stock options exercised was $185,700 and $0 during the years ended June 30, 2021 and 2020, respectively.
The following assumptions were used to estimate the fair value of options granted during the years ended June 30, 2021 and 2020:
|
Years Ended June 30,
|
||||||
|
2021
|
2020
|
|||||
|
Assumptions:
|
||||||
|
Expected life of options (in years)
|
5.3 - 6.3
|
2.7 - 2.8
|
||||
|
Risk-free interest rate
|
0.9% - 1.2%
|
|
0.3% - 0.5%
|
|
||
|
Assumed volatility
|
50.0%
|
|
70.0%
|
|
||
|
Expected dividend rate
|
0.0%
|
|
0.0%
|
|
||
Restricted Stock Unit Awards
Restricted stock units were granted to employees and non-employee directors on May 19, 2021 based on the market price of the Company’s common stock on the grant date and recognized in compensation expense over the vesting period, subject to the
passage of time and the employee’s continued employment during such period. In some instances, such as death, awards may vest concurrently with or following an employee’s termination.
A summary of the Company’s restricted stock unit activity for the year ended June 30, 2021 is presented in the following table:
|
Shares
|
Weighted-
Average Grant-
Date Fair Value
|
|||||||
|
Unvested at June 30, 2020
|
—
|
$
|
—
|
|||||
|
Granted
|
36,745
|
64.08
|
||||||
|
Vested
|
—
|
—
|
||||||
|
Forfeited
|
—
|
—
|
||||||
|
Unvested at June 30, 2021
|
36,745
|
$
|
64.08
|
|||||
Performance Rights Awards
The fair value of performance rights granted is estimated at the date of grant based on the underlying share price (being the seven-day volume weighted average share price prior to issuance). Performance rights are
subject to milestones and the performance conditions must be satisfied in order for the performance rights to vest. Upon vesting of performance rights, common stock is automatically issued for no consideration. Each performance right
automatically converts into one share of common stock upon vesting of the performance rights. The performance right will expire if a performance condition of a performance right is not achieved by the expiry date. The performance rights
outstanding as of June 30, 2021 had the following performance conditions and expiry dates:
|
|
• |
30,000 Performance Rights subject to the “Integrated Feasibility Study Milestone,” expiring December 31, 2021; and
|
|
|
• |
30,000 Performance Rights subject to the “Construction Milestone,” expiring December 31, 2022.
|
A summary of the Company’s performance stock unit activity for the year ended June 30, 2021 is presented in the following table (underlying shares in thousands):
|
Shares
|
Weighted-
Average Grant-
Date Fair Value
|
|||||||
|
Unvested at June 30, 2020
|
50,000
|
$
|
5.20
|
|||||
|
Granted
|
10,000
|
6.50
|
||||||
|
Vested
|
—
|
—
|
||||||
|
Forfeited
|
—
|
—
|
||||||
|
Unvested at June 30, 2021
|
60,000
|
$
|
5.42
|
|||||
| 12. |
EMPLOYEE BENEFIT PLAN
|
Employees of the Company may participate in the Piedmont Lithium 401(k) Plan (the “401(k) Plan”), a defined contribution plan which qualifies under Section 401(k) of the Internal Revenue Code. The 401(k) Plan was
effective June 24, 2018. Participating employees may contribute up to 100% of their pre-tax earnings, up to the statutory limit. The Company incurred matching contribution expense of $146,721 and $28,731 for the years ended June 30, 2021 and
2020, respectively.
| 13. |
INCOME TAXES
|
Loss before income taxes and equity in net loss of unconsolidated investments, and current and deferred income tax expense (benefit) are composed of the following:
|
Years Ended June 30,
|
||||||||
|
2021
|
2020
|
|||||||
|
Loss before income taxes and equity in
net loss of unconsolidated investments:
|
||||||||
|
Domestic
|
$ |
(17,601,419
|
)
|
$ |
(5,424,724
|
)
|
||
|
Foreign
|
(2,392,429
|
)
|
(454,427
|
)
|
||||
|
Total
|
$ |
(19,993,848
|
)
|
$ |
(5,879,151
|
)
|
||
The reconciliation of the U.S. federal statutory tax rate to the Company’s effective income tax rate is as follows:
|
Years Ended June 30,
|
||||||||
|
2021
|
2020
|
|||||||
|
Pre-tax loss before equity in net income (loss) of unconsolidated affiliates
|
$
|
(19,993,848
|
)
|
$
|
(5,879,151
|
)
|
||
|
Benefit at statutory rate (21%)
|
(4,198,708
|
)
|
(1,234,622
|
)
|
||||
|
Foreign rate differential
|
(22,160
|
)
|
(13,801
|
)
|
||||
|
Non-deductible transaction costs
|
299,965
|
—
|
||||||
|
Permanent items
|
141,223
|
63,229
|
||||||
|
State taxes
|
(985,983
|
)
|
(338,078
|
)
|
||||
|
Change in valuation allowance
|
4,765,663
|
1,523,272
|
||||||
|
Income tax expense/(benefit)
|
$ |
—
|
$ |
—
|
||||
Deferred income tax assets and liabilities recorded in the consolidated balance sheets as of June 30, 2021 and 2020 consisted of the following:
|
|
Years Ended June 30,
|
|||||||
|
|
2021
|
2020
|
||||||
|
Deferred tax assets
|
||||||||
|
Accrued expenditures
|
$
|
285,808
|
$
|
72,006
|
||||
|
Exploration and evaluation expenditures
|
6,305,141
|
3,811,288
|
||||||
|
Share based compensation
|
730,339
|
441,169
|
||||||
|
Tax carryforwards
|
6,039,013
|
4,266,906
|
||||||
|
Other deferred tax assets
|
39,476
|
76,581
|
||||||
|
Gross deferred tax assets
|
13,399,777
|
8,667,950
|
||||||
|
Valuation allowance
|
(13,354,675
|
)
|
(8,589,012
|
)
|
||||
|
Deferred tax assets
|
45,102
|
78,938
|
||||||
|
Deferred tax liabilities
|
||||||||
|
Other deferred tax liabilities
|
|
(45,102
|
)
|
|
(78,938
|
)
|
||
|
Deferred tax liabilities
|
|
(45,102
|
)
|
|
(78,938
|
)
|
||
|
Net deferred tax asset (liability)
|
$ |
—
|
$ |
—
|
||||
Changes in the balance of our deferred tax asset valuation allowance were as follows:
|
June 30,
|
||||||||
|
2021
|
2020
|
|||||||
|
Beginning balance
|
$
|
8,589,012
|
$
|
7,065,740
|
||||
|
Additions
|
4,765,663
|
1,523,272
|
||||||
|
Deductions
|
—
|
—
|
||||||
|
Ending balance
|
$
|
13,354,675
|
$
|
8,589,012
|
||||
Total net operating losses available as of June 30, 2021 and 2020 were as follows:
|
June 30,
|
|||||||||||
|
|
2021
|
2020
|
Begin to expire
|
||||||||
|
U.S. - Federal
|
$ |
2,933,123
|
$ |
1,504,314
|
2037 — Indefinite
|
||||||
|
U.S. - State
|
468,309
|
196,094
|
2032
|
||||||||
|
Australia - Federal
|
2,458,482
|
2,377,520
|
Indefinite
|
||||||||
|
Australia - Capital
|
214,872
|
214,872
|
Indefinite
|
||||||||
|
Total
|
$ |
6,074,775
|
$ |
4,292,799
|
|||||||
As of June 30, 2021 and 2020, the Company did not have any unrecognized tax benefits. Interest and penalties related to income tax matters are classified as a component of income tax expense. The Company does not
anticipate any significant changes to unrecognized tax benefits over the next 12 months.
The Company files income tax returns in the U.S. federal jurisdiction, various state jurisdictions, and in various international jurisdictions. The Company’s tax filings remain subject to audits by applicable tax
authorities for a certain length of time following the tax year to which those filings relate. Tax years 2018 and forward generally remain open for examination for federal and state tax purposes. Tax years 2017 and forward generally remain open for
examination for foreign tax purposes.
| 14. |
SEGMENT REPORTING
|
The Company applies ASC Topic 280,
“
Segment Reporting
,”
in determining reportable segments
for its financial statement disclosure. The Company has a single reportable operating segment which operates as a single business platform. In reaching this conclusion, management considered the definition of the Chief Operating Decision Maker
(“CODM”), how the business is defined by the CODM, the nature of the information provided to the CODM and how that information is used to make operating decisions, and how resources and performance are accessed. The Company’s CODM is the Chief
Executive Officer. The results of the operations provided to and analyzed by the CODM are at the consolidated level and accordingly, key resource decisions and assessment of performance are performed at the consolidated level. The Company has a
single, common management team. The Company’s cash flows are reported and reviewed at the consolidated level only with no distinct cash flows at an individual business level.
| 15. |
COMMITMENTS AND CONTINGENCIES
|
Real Estate Office Leases
The Company is obligated under various non-cancellable lease agreements providing for office space that expire at various dates through 2022. See Note 8 to the consolidated financial statements in this Form 10-K.
Legal Proceedings
The Company is involved from time to time in various claims, proceedings, and litigation. The Company establishes reserves for specific legal proceedings when it determines that the likelihood of an unfavorable outcome is probable, and the amount
of loss can be reasonably estimated.
In July 2021, a lawsuit was filed against us in the United States District Court for the Eastern District of New York on behalf of a class of putative plaintiffs claiming violations of the Exchange Act. The complaint alleged, among other things,
that we made false and/or misleading statements and/or failed to make disclosure relating to proper and necessary permits. We intend to vigorously defend against these claims as we believe there are strong defenses against the claims, although there
can be no assurance as to the outcome.
Management has not identified any other legal matters where it believes an unfavorable outcome is reasonably possible and/or for which an estimate of possible losses can be made. Management does not believe that the
resolution of these matters would have a material impact on the consolidated financial statements.
| 16. |
RELATED PARTIES
|
Ledger Holdings Pty Ltd, a company associated with a non-executive director of the Company, was paid $91,667 and $90,734 in the years ended June 30, 2021 and 2020, respectively, for services related to business
development activities. These fees and associated payments were included in the non-executive director’s remuneration.
| 17. |
SUBSEQUENT EVENTS
|
On August 30, 2021, Sayona Quebec acquired substantially all of the assets of North American Lithium Inc. for CAD 97.9 million ($77.8 million). The assets acquired primarily consisted of an existing mine and
related mining assets in the Abitibi region near Val d’Or, Quebec, Canada. The Company paid CAD 24.5 million ($19.5 million) to Sayona Quebec, representing its 25% equity interest contribution, and Sayona paid CAD 73.4 million ($58.3 million),
representing Sayona’s 75% equity interest contribution, which collectively gave Sayona Quebec the ability to fund the purchase of North American Lithium Inc.’s assets.
On August 20, 2021, the Company invested AUD 9.8 million ($7.0 million) in equity offerings by Sayona. The Company’s equity interest in Sayona, including the additional
shares acquired, was approximately 19% on August 20, 2021.
On July 1, 2021, the Company entered into a definitive agreement to establish a strategic partnership with IronRidge Resources (“IRR”) through the future purchase of an equity interest in IRR, planned staged
project investments to acquire a 50% equity interest in IRR’s Ghana-based lithium portfolio (“IRR Ghana”), and a long-term supply agreement for 50% of IRR Ghana’s planned spodumene concentrate production. On August 31, 2021, the Company paid
$15.9 million to acquire an equity interest of approximately 10% in IRR.
***
| Item 9. |
None.
| Item 9A. |
Disclosure Controls and Procedures
Our management, with the participation of our Chief Executive Officer (our Principal Executive Officer) and Chief Financial Officer (our Principal Financial Officer and Principal Accounting Officer), evaluated the
effectiveness of our disclosure controls and procedures as of June 30, 2021. “Disclosure controls and procedures,” as defined in Rules 13a-15(e) and 15d-15(e) under the Exchange Act, are designed to ensure that information required to be disclosed
by a company in the reports that it files or submits under the Exchange Act is (i) recorded, processed, summarized and reported within the time periods specified in the SEC’s rules and forms and (ii) accumulated and communicated to the company’s
management, including its principal executive officer and principal financial officer, as appropriate to allow timely decisions regarding required disclosure. Based on the evaluation of our disclosure controls and procedures, our Chief Executive
Officer and Chief Financial Officer have concluded that our disclosure controls and procedures were effective as of June 30, 2021. Any controls and procedures, no matter how well designed and operated, can provide only reasonable assurance of
achieving the desired control objectives.
Management’s Report on Internal Control over Financial Reporting
Our management, including our Chief Executive Officer and Chief Financial Officer, is responsible for establishing and maintaining adequate internal control over financial reporting, as defined under Exchange Act
Rules 13a-15(f) and 15d-15(f). Our internal control over financial reporting is a process designed to provide reasonable assurance regarding the reliability of financial reporting and the preparation of financial statements in accordance with GAAP.
Internal control over financial reporting includes those policies and procedures that: (1) pertain to the maintenance of records that, in reasonable detail, accurately and fairly reflect the transactions and dispositions of our assets; (2) provide
reasonable assurance that transactions are recorded as necessary to permit preparation of financial statements in accordance with GAAP, and that our receipts and expenditures are being made only in accordance with authorizations of our management
and directors; and (3) provide reasonable assurance regarding prevention or timely detection of unauthorized acquisition, use, or disposition of our assets that could have a material effect on the financial statements.
Because of its inherent limitations, internal control over financial reporting may not prevent or detect misstatements on a timely basis. Also, projections of any evaluation of effectiveness to future periods are
subject to the risk that controls may become inadequate because of changes in conditions, or that the degree of compliance with the policies or procedures may deteriorate.
Our Chief Executive Officer and Chief Financial Officer assessed the effectiveness of our internal control over financial reporting as of the end of the period covered by this annual report on Form 10-K based on the
criteria established in Internal Control—Integrated Framework (2013) issued by the Committee of Sponsoring Organizations of the Treadway Commission. Management’s assessment included an evaluation of the design of our internal control over financial
reporting and testing of the operational effectiveness of our internal control over financial reporting. Based on that assessment, our Chief Executive Officer and Chief Financial Officer concluded that as of June 30, 2021, our internal control over
financial reporting was effective.
Attestation Report of the Registered Public Accounting Firm
This annual report on Form 10-K does not include an attestation report of our Company’s registered public accounting firm, because we qualify as an emerging growth company under Section 3(a) of the Exchange Act and
we are exempted from such attestation requirement.
Changes in Internal Control over Financial Reporting
During the fiscal quarter ended June 30, 2021, there were no changes in our internal control over financial reporting that have materially affected, or are reasonably likely to materially affect, our internal control
over financial reporting.
| Item 9B. |
Appointment of President and Chief Executive Officer
Effective September 22, 2021, we entered into an executive employment agreement (“Phillips Agreement”) with Keith Phillips, pursuant to which Mr. Phillips was appointed as President and Chief Executive Officer of the
Company.
Prior to the execution of the Phillips Agreement, Mr. Phillips was party to an employment agreement (“Prior Phillips Agreement”) with Piedmont Lithium Carolinas, Inc. (“Piedmont Carolinas”) and Piedmont Australia,
pursuant to which Mr. Phillips served as President and Chief Executive Officer. The Phillips Agreement was entered into in connection with the Redomiciliation to supersede the Prior Phillips Agreement.
Under the terms of the Phillips Agreement, Mr. Phillips will receive an annual base salary of $500,000. The Phillips Agreement also provides that Mr. Phillips will be
eligible beginning in calendar year 2021 for a discretionary annual performance bonus with a target bonus amount equal to 75% of base salary, with the ability to earn a maximum amount of up to 200% of the target bonus amount based upon
performance criteria determined by the Board or the Compensation Committee of the Board.
Upon his termination of employment, Mr. Phillips will receive any accrued but unpaid base salary and other accrued and unpaid compensation, including any accrued but unpaid vacation. If the termination is due to a
Covered Termination (as defined in the Phillips Agreement), under certain circumstances, Mr. Phillips will be entitled to receive certain additional severance benefits.
The foregoing description of the Phillips Agreement does not purport to be complete and is subject to, and qualified in its entirety by, the full text of the Phillips Agreement, a copy of which is attached hereto as
Exhibit 10.2 and incorporated herein by reference.
Appointment of Executive Vice President and Chief Development Officer
Effective September 22, 2021, we entered into an executive employment agreement (the “Brindle Agreement”) with Patrick Brindle, pursuant to which Mr. Brindle was appointed as Executive Vice President and Chief
Development Officer of the Company.
Prior to the execution of the Brindle Agreement, Mr. Brindle was party to an employment agreement (“Prior Brindle Agreement”) with Piedmont Carolinas and Piedmont Australia, pursuant to which Mr. Brindle served as
Executive Vice President and Chief Development Officer of Piedmont Carolinas. The Brindle Agreement was entered into in connection with the Redomiciliation to supersede the Prior Brindle Agreement.
Under the terms of the Brindle Agreement, Mr. Brindle will receive an annual base salary of $350,000. The Brindle Agreement also provides that Mr. Brindle will be eligible
beginning in calendar year 2021 for a discretionary annual performance bonus with a target bonus amount equal to 50% of base salary, with the ability to earn a maximum amount of up to 200% of the target bonus amount based upon performance
criteria determined by the Board or the Compensation Committee of the Board.
Upon his termination of employment, Mr. Brindle will receive any accrued but unpaid base salary and other accrued and unpaid compensation, including any accrued but unpaid vacation. If the termination is due to a
Covered Termination (as defined in the Brindle Agreement), under certain circumstances, Mr. Brindle will be entitled to receive certain additional severance benefits.
The foregoing description of the Brindle Agreement does not purport to be complete and is subject to, and qualified in its entirety by, the full text of the Brindle Agreement, a copy of which is attached hereto as
Exhibit 10.5 and incorporated herein by reference.
Appointment of Executive Vice President and Chief Legal Officer and Secretary
Effective September 22, 2021, we entered into an executive employment agreement (the “Czachor Agreement”) with Bruce Czachor, pursuant to which Mr. Czachor was appointed as Executive Vice President and Chief Legal
Officer of the Company.
Prior to the execution of the Czachor Agreement, Mr. Czachor was party to an employment agreement (“Prior Czachor Agreement”) with Piedmont Carolinas and Piedmont Australia, pursuant to which Mr. Czachor served as
Vice President, General Counsel and Secretary. The Czachor Agreement was entered into in connection with the Redomiciliation to supersede the Prior Czachor Agreement.
Under the terms of the Czachor Agreement, Mr. Czachor will receive an annual base salary of $350,000. The Czachor Agreement also provides that Mr. Czachor will be eligible
beginning in calendar year 2021 for a discretionary annual performance bonus with a target bonus amount equal to 50% of base salary, with the ability to earn a maximum amount of up to 200% of the target bonus amount based upon performance
criteria determined by the Board or the Compensation Committee of the Board.
Upon his termination of employment, Mr. Czachor will receive any accrued but unpaid base salary and other accrued and unpaid compensation, including any accrued but unpaid vacation. If the termination is due to a
Covered Termination (as defined in the Czachor Agreement), under certain circumstances, Mr. Czachor will be entitled to receive certain additional severance benefits.
The foregoing description of the Czachor Agreement does not purport to be complete and is subject to, and qualified in its entirety by, the full text of the Czachor Agreement, a copy of which is attached hereto as
Exhibit 10.4 and incorporated herein by reference.
PART III
See the section “Directors and Senior Management” in Item 11, which information is incorporated by reference herein, for a list of our directors and senior management.
Family Relationships
There are no family relationships between any members of our executive management and our directors.
Arrangements for Election of Directors and Members of Management
There are no contracts or other arrangements pursuant to which directors have been or must be selected.
Board Practices
The Board currently consists of six members. In addition, under our Certificate of Incorporation, one-third of the Board retires by rotation at each annual general meeting and is eligible to offer themselves for
re-election at that meeting. A director appointed or elected to fill a vacancy on the Board also holds office until the next annual general meeting.
We believe that each of our directors has relevant industry experience. The membership of the Board is directed by the following requirements:
|
|
• |
our Certificate of Incorporation specifies that the number of directors shall be determined from time to time by the Board, which currently has set the number of directors at six;
|
|
|
• |
a majority of the Board must be independent within the meaning of the Nasdaq listing standards and each of our committees is to be comprised of independent directors;
|
|
|
• |
the Chair of the Board should be an independent director who satisfies the criteria for independence recommended by the ASX Corporate Governance Principles and Recommendations; and
|
|
|
• |
the Board should collectively have the appropriate level of personal qualities, skills, experience and time commitment to properly fulfill its responsibilities or have ready access to such skills where they are
not available.
|
The Board has determined that five of our six directors (Mr. Jeffrey Armstrong, Mr. Jorge Beristain, Mr. Claude Demby, Mr. Todd Hannigan and Ms. Susan Jones) qualify as independent directors within the meaning of the
Nasdaq listing standards.
Service Contracts
Other than as disclosed under “Item 11. Executive Compensation—Employment Agreements,” we do not have any service contracts with directors which provide for benefits upon termination of employment.
Board Committees
Audit Committee
The Board has established an Audit Committee. Assignments to, and chairs of, the Audit committee will be selected by the Board. The Audit Committee operates under a charter approved by the Board and reports on its
activities to the Board. The charter is available on our website at piedmontlithium.com. The Audit Committee monitors the integrity of our consolidated financial statements, the independence and qualifications of our independent auditors, the
performance of our accounting staff and independent auditors, our compliance with legal and regulatory requirements and the effectiveness of our internal controls. The Audit Committee is also responsible for selecting, retaining (subject to
stockholder approval), evaluating, setting the compensation of and, if appropriate, recommending the termination of our independent auditors. The Audit Committee is established in accordance with Section 10A(m) of the Exchange Act.
The Audit Committee currently consists of Mr. Jorge Beristain, Mr. Claude Demby and Mr. Todd Hannigan, with Mr. Beristain serving as chair. Each of Mr. Beristain, Mr. Demby and Mr. Hannigan is independent under the
Nasdaq listing standards for audit committee members and the heightened independence requirement for audit committee members required by Rule 10A-3 under the Exchange Act. Mr. Beristain is also an audit committee financial expert.
The Audit Committee is governed by a written charter approved by the Board. The charter is available on our website at www.piedmontlithium.com.
Compensation Committee
The purpose of the Compensation Committee is to assist the Board in discharging its responsibilities relating to compensation of the Company’s executive officers and directors. Among its specific duties and
responsibilities, the Compensation Committee will:
|
•
|
oversee the Company’s overall compensation philosophy, policies and programs, and assess whether the Company’s compensation philosophy establishes appropriate incentives for management and employees;
|
|
•
|
review and approve corporate goals and objectives relevant to the compensation of the Chief Executive Officer, evaluate the Chief Executive Officer’s performance in light of those goals and objectives, approve the grant of equity
awards to the Chief Executive Officer, and recommend to the Board the Chief Executive Officer’s compensation level based on this evaluation;
|
|
•
|
oversee the evaluation of other executive officers and approve the grant of equity awards to other executive officers, and set the compensation of other executive officers based upon the recommendation of the Chief Executive Officer;
|
|
•
|
administer and make recommendations to the Board with respect to the Company’s incentive compensation and equity-based compensation plans that are subject to the Board’s approval;
|
|
•
|
review and approve the design of other benefit plans pertaining to executive officers;
|
|
•
|
approve, amend or modify the terms of other compensation and benefit plans as appropriate;
|
|
•
|
review and recommend to the Board employment and severance arrangements for executive officers, including employment agreements and change-in-control provisions, plans or agreements;
|
|
•
|
review and discuss with management the Company’s Compensation Discussion and Analysis (“CD&A”) and related disclosures to the extent that the rules and regulations of the SEC require they be included in the Company’s annual report
and proxy statement, recommend to the Board, based on its review and discussions, whether the CD&A should be included in the annual report and proxy statement, and oversee preparation of the Committee report to the extent required by
the rules and regulations of the SEC for inclusion in the Company’s annual report and proxy statement;
|
|
•
|
periodically review the form and amount of compensation paid to directors for their service on the Board and its committees and recommend changes in compensation to the Board as appropriate;
|
|
•
|
oversee succession planning for positions held by executive officers, and review succession planning and management development at least annually with the Board, including recommendations and evaluations of potential successors to fill
such positions;
|
|
•
|
oversee the assessment of the risks related to the Company’s compensation policies and programs applicable to officers and employees, and review the results of this assessment;
|
|
•
|
at least annually, assess whether the work of compensation consultants involved in determining or recommending executive or director compensation has raised any conflict of interest that is required to be disclosed in the Company’s
annual report and proxy statement; and
|
|
•
|
annually evaluate the performance of the Compensation Committee and the adequacy of the Compensation Committee’s charter and recommend changes to the Board as appropriate.
|
The Compensation Committee met three times during fiscal year 2021. The members of the Compensation Committee are Mr. Jeffrey Armstrong, Mr. Todd Hannigan and Ms. Susan Jones, with Mr. Armstrong serving as Chair. The
Compensation Committee is governed by a written charter approved by the Board. The charter is available on our website at www.piedmontlithium.com.
Nominating and Corporate Governance Committee
The purpose, duties and responsibilities of the Nominating and Corporate Governance Committee are to identify individuals qualified to become members of the Board (consistent with criteria approved by the Board);
recommend to the Board the Company’s director candidates for election at the annual meeting of stockholders; and perform a leadership role in shaping the Company’s corporate governance. Among its specific duties and responsibilities, the Nominating
and Corporate Governance Committee will:
|
|
• |
develop and recommend to the Board criteria for identifying and evaluating director candidates and periodically review these criteria and recommend changes to the Board as appropriate;
|
|
|
• |
annually evaluate the composition of the Board to assess whether the skills, experience, characteristics and other criteria established by the Board are currently represented on the Board as a whole and with
respect to each individual director, and to assess the criteria that may be needed in the future;
|
|
|
• |
identify, review the qualifications of, and recruit director candidates for election to the Board;
|
|
|
• |
assess the qualifications, contributions and independence of incumbent directors in determining whether to recommend them for reelection to the Board;
|
|
|
• |
discuss succession planning for the Board and key leadership roles on the Board and its committees;
|
|
|
• |
establish procedures for the consideration of director candidates recommended for the Nominating and Corporate Governance Committee’s consideration by the Company’s stockholders;
|
|
|
• |
recommend to the Board the Company’s director candidates for election or reelection to the Board at each annual meeting of stockholders;
|
|
|
• |
recommend to the Board director candidates to be elected by the Board as necessary to fill vacancies and newly created directorships;
|
|
|
• |
develop and recommend to the Board a set of corporate governance principles, and annually review these principles and recommend changes to the Board as appropriate;
|
|
|
• |
periodically review the Board’s leadership structure and recommend changes to the Board as appropriate;
|
|
|
• |
make recommendations to the Board concerning the size, structure, composition and functioning of the Board and its committees;
|
|
|
• |
oversee the orientation process for new directors and ongoing education for directors;
|
|
|
• |
oversee the evaluation of the Board and its committees; and
|
|
|
• |
annually evaluate the performance of the Nominating and Corporate Governance Committee and the adequacy of the Nominating and Corporate Governance Committee’s charter and recommend changes to the Board as
appropriate.
|
The members of the Nominating and Corporate Governance Committee are Mr. Jorge Beristain, Mr. Claude Demby and Ms. Susan Jones, with Mr. Demby serving as Chair.
The Board has determined that no member of the Nominating and Corporate Governance Committee has any material relationship with the Company that might interfere with the member’s exercise of his or her independent
judgment.
The Nominating and Corporate Governance Committee is governed by a written charter approved by the Board. The charter is available on our website at www.piedmontlithium.com.
Code of Ethics
We have adopted the Code of Conduct, which applies to our executive officers, including our Chief Executive Officer and Chief Financial Officer, senior management and all
other employees. The Code of Conduct is publicly available under the “Corporate” section of our website at www.piedmontlithium.com. Written copies are available upon request. If we make any substantive amendment to the Code of Conduct or grant
any waivers, including any implicit waiver, from a provision of the Code of Conduct, we will disclose the nature of such amendment or waiver on our website.
The names, ages and current positions of our executive officers, as of the date of this annual report on Form 10-K, are provided below.
|
Name
|
Age
|
Current Position
|
||
|
Keith Phillips
|
61
|
President and Chief Executive Officer
|
||
|
Patrick Brindle
|
44
|
Executive Vice President and Chief Development Officer
|
||
|
Bruce Czachor
|
60
|
Executive Vice President and Chief Legal Officer and Secretary
|
||
|
David Klanecky
|
51
|
Executive Vice President and Chief Operating Officer
|
||
|
Michael White
|
49
|
Executive Vice President and Chief Financial Officer
|
Directors and Senior Management
The following discussion sets forth information regarding our current directors and executive officers as of the date of this annual report on Form 10-K. Such directors are entitled to submit for re-election. The
Board and our senior management team are leaders in their fields. They bring a significant amount of experience and expertise to our Company, and we believe that they will guide us successfully moving forward.
Keith Phillips (61 years of age) – President and Chief Executive Officer
Mr. Phillips joined Piedmont Lithium on July 10, 2017, after a 30-year career on Wall Street during which he worked on strategic and financing transactions representing over $100 billion in aggregate value. Mr.
Phillips was most recently a Senior Advisor with merchant banker Maxit Capital, after leading the mining investment banking teams for Merrill Lynch, Bear Stearns, JPMorgan and Dahlman Rose.
Mr. Phillips has worked with numerous mining companies, including many established global leaders, and has developed particular expertise in advising exploration and development-stage companies in achieving their
strategic objectives, with a particular focus on obtaining relevance in the United States capital markets. Mr. Phillips received his Master of Business Administration from The University of Chicago and a Bachelor of Commerce from Laurentian
University in Canada.
Mr. Phillips was appointed a Director of the Company on May 18, 2021. During the three-year period to the end of the financial year, Mr. Phillips has not held any other directorships in listed companies other than our
predecessor company Piedmont Australia.
Jeffrey Armstrong (56 years of age) – Chairman of the Board and Chairman of the Compensation Committee
Mr. Armstrong resides in Charlotte, North Carolina, where he is actively engaged in the community and has extensive relationships with major corporations and entrepreneurs alike. He currently serves as Chief Executive
Officer and Managing Partner of North Inlet Advisors, LLC, a firm providing strategic and financial advice to companies on capital formation, mergers, acquisitions, divestitures, restructurings, and other corporate transactions. Prior to North Inlet
Advisors, LLC, Mr. Armstrong served for nearly a decade as a senior leader in what is now Wells Fargo’s Investment Bank, where his leadership roles included Head of Corporate Finance, Mergers and Acquisitions, Private Equity Coverage and Leveraged
Capital groups. Mr. Armstrong also worked as an investment banker for Citigroup from 1994 to 1999, and for Morgan Stanley from 1987 to 1994. Mr. Armstrong graduated from the University of Virginia with a B.S. in finance and marketing from the
McIntire School of Commerce and an MBA from the Darden School of Business.
Mr. Armstrong was appointed a Director of the Company on May 18, 2021. During the three-year period to the end of the financial year, Mr. Armstrong has not held any other directorships in listed companies other than
our predecessor company Piedmont Australia.
Jorge Beristain (52 years of age) – Non-Executive Director and Chairman of the Audit Committee
Mr. Beristain is the Chief Financial Officer of Central Steel & Wire Co, a wholly owned subsidiary of Ryerson Holding Corporation (NYSE: RYI) (“RYI”). Central Steel and Wire is a leading metals distributor and
fabricator with service centers in Chicago, Cincinnati and Greensboro. RYI is North America’s second largest service center with over 100 locations in the U.S., Canada and Mexico, supplying carbon and stainless steel, aluminum, red metals and
semi-fabricated products to the machinery, transport, consumer durables, food processing, construction and energy sectors. Previously, Mr. Beristain was Managing Director and Head of Deutsche Bank’s Americas Metals & Mining equity research, where
he was consistently ranked by institutional investors as one of the top analysts in the United States. During his over 20-year career on Wall Street, Mr. Beristain has lived and worked in the United States, Latin America and Canada and has visited
hundreds of industrial companies worldwide. He is a proven strategic thinker with extensive international experience in the valuation of mining projects and metals operations and downstream metal uses. Mr. Beristain holds a Bachelor of Commerce
degree from the University of Alberta and is a Chartered Financial Analyst.
Mr. Beristain was appointed a Director on May 18, 2021. During the three-year period to the end of the financial year, Mr. Beristain has not held any other directorships in listed companies other than our predecessor
company Piedmont Australia.
Claude Demby (56 years of age) – Non-Executive Director and Chairman of the Nominating and Corporate Governance Committee
Mr. Demby, currently President of Cree LED, a Smart Global Holdings, Inc. company, brings exceptional governance experience through his current service as Chair of the Governance and Nominating Committee and Director
on the board of Brown Capital Management Mutual Fund Trust and prior service as Director on the board of the Federal Reserve Bank of Richmond - Charlotte branch, including Chairman from 2012 to 2017. He currently serves on the board of Eos, an energy
storage company. He has a strong record of community service through his founding and running of Valour Academy Schools, Inc., in Raleigh, NC, and serving as an advisory board member of Duke Raleigh Hospital.
Mr. Demby has extensive executive and operational leadership experience, having served as CEO and Director of the Noël Group, a global manufacturer of synthetic foam materials, and President and COO of L&L
Products, a global manufacturer of NVH and structural devices for the automotive and aerospace sectors. Mr. Demby began his career in engineering roles with Procter & Gamble and GE Plastics. Mr. Demby received an MBA from Rensselaer Polytechnic
Institute and a Bachelor of Chemical Engineering from the University of Delaware.
Mr. Demby was appointed a Director on June 1, 2021.
Todd Hannigan (48 years of age) – Non-Executive Director
Mr. Hannigan has over 25 years of global experience in natural resources as company founder, chief executive officer, private capital investor and non-executive director. In these lead roles, Mr. Hannigan has helped
build a range of valuable companies in the private and public markets. Mr. Hannigan is currently Executive Chairman of Hyperion Metals Limited which is developing zero carbon, critical mineral and metal supply chains in the United States.
Mr. Hannigan holds a Bachelor of Engineering (Mining) from The University of Queensland and a MBA from INSEAD.
Mr. Hannigan was appointed a Director on February 8, 2021.
Susan Jones (52 years of age) – Non-Executive Director
Ms. Jones spent 15 years of her career at Nutrien Ltd., a multibillion-dollar global mining and agricultural enterprise. Her most recent role prior to retirement in 2019 was serving as Executive Vice President and CEO
– Potash, the world’s largest underground soft-rock miner. Ms. Jones has a wealth of board experience, having advised the boards of both Agrium and Nutrien, both NYSE publicly traded companies, as an executive, and currently serving on the board of
TC Energy, a $50 billion market cap NYSE company, and Arc Resources. She has also served on the Boards of Gibson Energy and Canpotex.
Ms. Jones brings valuable legal experience combined with operating responsibilities over the course of her career with roles ranging from Executive Vice President and Senior Vice President,
Phosphate Business Unit, Chief Legal Officer, Business Development and Strategy, Managing Director of European Operations, and several other critical leadership positions. Ms. Jones received her Bachelor of Laws Degree from the University of
Ottawa (Canada) and a Bachelor of Arts Degree in Political Science and Hispanic Studies from the University of Victoria (Canada). She also earned a Leadership Diploma from the University of Oxford and holds a Director Certificate from Harvard
University.
Ms. Jones was appointed a Director on June 1, 2021.
Patrick Brindle (44 years of age) – Executive Vice President and Chief Development Officer
Mr. Brindle joined the Company in January 2018 as Vice President and Project Manager. Prior to joining Piedmont Lithium, Mr. Brindle was Vice President of Engineering for DRA Taggart, a subsidiary of DRA Global, an engineering firm specialized
in project delivery of mining and mineral processing projects globally. Over his career, Mr. Brindle has held various management and senior engineering roles including multi-year expatriate assignments and has completed EPC projects in diverse
jurisdictions including the United States, Canada, China, Mongolia, Brazil, Russia and others. Mr. Brindle has a BS in Environmental Science and a BS in Civil Engineering from Virginia Tech.
Bruce Czachor (60 years of age) – Executive Vice President and Chief Legal Officer and Secretary
Bruce Czachor joined the Company in December 2018 on a part-time basis as our Vice President and General Counsel, and served as legal consultant for most of 2020 before rejoining as our Vice President and General
Counsel in December 2020, and was named recently as our Executive Vice President and Chief Legal Officer and Secretary. Mr. Czachor has over 34 years of experience in general corporate matters, corporate governance, capital markets, bank finance,
mergers and acquisitions, joint ventures, licensing agreements and commercial transactions, and was a partner at Shearman & Sterling and Orrick, Herrington & Sutcliffe. Over his career, Mr. Czachor has represented a wide variety of
businesses, ranging from Fortune 500 companies to start-ups, and he has extensive experience in the mining, energy and cleantech industries. Mr. Czachor has a JD from New York Law School and a BA in Political Science from Binghamton University. He
is admitted to practice in New York, New Jersey and California.
David Klanecky (51 years of age) – Executive Vice President and Chief Operating Officer
Mr. Klanecky has spent most of his career in senior operational, research & development, commercial and strategic leadership roles. From 2013 to 2021, he served in increasingly senior management roles within
Albemarle Corporation, the world’s leading lithium producer, including as Vice President of Strategy and Corporate Development and most recently serving as Vice President of Lithium Operations – APAC/EU, with global responsibility for Albemarle’s
manufacturing/operations, process technology and product management within the global lithium business. Mr. Klanecky also served as interim CEO of the MARBL joint venture between Albemarle and Mineral Resources Ltd, which includes the Kemerton
and Wodgina assets in Australia.
Before joining Albemarle, Mr. Klanecky had an impressive twenty-year career with The Dow Chemical Company that spanned the globe including expat assignments in Spain, Switzerland, and China across a number of
innovative industries. In his last role with Dow, Mr. Klanecky launched the Dow Energy Materials Business, focused on Lithium-Ion Battery Materials offerings to cell manufacturers and Auto OEMs, where he served as the Global Business Director for
this business unit prior to joining Albemarle in 2013.
Mr. Klanecky has a Chemical Engineering degree from the University of Nebraska and an Executive MBA from Arizona State/Thunderbird School of Global Management. He joined Piedmont Lithium in April 2021 and will be
based in the Company’s headquarters in Belmont, North Carolina.
Michael White (49 years of age) – Executive Vice President and Chief Financial Officer
Mr. White served as Vice President, Chief Accounting Officer and Corporate Controller of ChampionX Corporation, formerly Apergy Corporation, a multibillion-dollar manufacturing, chemicals and services public company,
with responsibilities for leading the company’s global accounting and financial reporting. In this role, Mr. White led enterprise-wide transformation of the global controllership function, created sustainable financial reporting with key
performance metrics for operational leadership, and provided financial leadership related to mergers and acquisition activities, including a successful IPO. Prior to ChampionX, Mr. White held the position of Senior Vice President, Chief Accounting
Officer and Corporate Controller for Aegion Corporation, a global manufacturing and services public company serving the industrial, oil and gas and water industries. Mr. White has held senior financial leadership positions throughout his 25-year
career with companies primarily in the energy and technology sectors, including roles as Chief Financial Officer of Baker Energy and as a manager in the assurance practice with Ernst & Young.
Summary Compensation Table
We are an emerging growth company under the Jobs Act and, as such, are allowed to take advantage of certain exemptions from reporting obligations otherwise applicable to U.S. public companies.
The following table presents information regarding the compensation of our named executive officers (“NEOs”) for services rendered during fiscal years 2021 and 2020, which differ from our current executive officers:
|
Name and Principal Position
|
Year
|
Salary
($)
|
Stock Awards
($)
|
Option Awards
($) |
Non-Equity
Incentive Plan
Compensation
($)
|
All Other
Compensation
($)
|
Total
(1)
($) |
|||||||||||||
|
Keith Phillips
|
2021
|
281,250
|
327,640
|
523,266
|
172,500
|
63,511
|
1,368,167
|
|||||||||||||
|
President and Chief Executive Officer
|
2020
|
250,000
|
81,228
|
74,266
|
100,000
|
41,954
|
547,448
|
|||||||||||||
|
Patrick Brindle
|
2021
|
227,500
|
137,580
|
219,766
|
70,900
|
68,312
|
724,058
|
|||||||||||||
|
Executive Vice President and Chief Development Officer
|
2020
|
210,000
|
73,106
|
60,341
|
50,000
|
8,400
|
401,847
|
|||||||||||||
|
Lamont Leatherman
|
2021
|
215,000
|
65,640
|
104,644
|
50,000
|
20,437
|
455,621
|
|||||||||||||
|
Vice President and Chief Geologist
|
2020
|
210,000
|
81,228
|
74,266
|
—
|
—
|
365,494
|
|
(1)
|
These figures include Company 401(k) contributions, all insurances and HRA reimbursements.
|
Narrative Disclosure to the Summary Compensation Table
The following is a brief description of the compensation arrangements we have with each of our NEOs and other components of their compensation during fiscal year 2021.
Overview
Our compensation policy for our NEOs has been developed by the Board, taking into account our size, the size of our management team, the nature and stage of development of our current operations, market conditions and comparable salary levels for
companies of a similar size and operating in similar sectors.
In addition to considering the above general factors, the Board has also placed emphasis on the following specific issues in determining the compensation policy for our NEOs:
|
|
• |
we are currently focused on identifying and acquiring suitable resource projects and undertaking exploration, appraisal and development activities;
|
|
|
• |
risks associated with small cap resource companies whilst exploring and developing projects; and
|
| • |
other than profit which may be generated from asset sales, we do not expect to be undertaking profitable operations until sometime after the commencement of commercial production on any of our projects.
|
Executive Compensation
Our senior executives are integral to executing the Company’s strategic plan, driving performance that rewards all of our stakeholders, fostering our culture and achieving other Company business objectives. Our current executive compensation
program is designed to support these objectives and built on the following principles:
|
|
• |
Alignment with stockholder interests
—Executives should be compensated through pay elements (base salaries and short- and long-term equity incentives) designed to create stockholder value.
|
|
|
• |
Individual performance and contribution to the Company
—Our program must provide sufficient flexibility to allow for the recognition of individual differences in performance.
|
|
|
• |
Proper balance of risk to reward
—Decisions about compensation should be guided by best-practice governance standards and rigorous processes that encourage prudent decision-making.
|
|
|
• |
Commitment to culture
—Our program must recognize the importance of building culture and teamwork as a significant long-term goal of the Company.
|
Elements of Pay: Total Direct Compensation
Our executive compensation program focuses on following principal elements of pay:
|
Pay Element
|
How It’s Paid
|
Purpose
|
|||
|
Base Salary
|
Cash
(Fixed) |
Provide a competitive base salary rate relative to similar positions in the market and enable the Company to attract and retain critical executive talent.
|
|||
|
Annual Incentives
|
Cash
(Variable) |
Reward executives for delivering on annual strategic objectives that drive our business strategy and contribute to the creation of stockholder value.
|
|||
|
Long-Term Incentives
|
Equity
(Variable) |
Provide incentives for executives to execute on longer-term goals that drive the creation of stockholder value and support the Company’s leadership retention strategy.
|
Base Salary
Our objective is to provide base salaries that are competitive within our industry and reasonable as compared to our peers. We also consider the executive’s abilities, experience, tenure and individual performance.
Base salaries are reviewed annually by the Board. The process consists of a review of Company and individual performances, relevant comparative compensation externally and internally and, where appropriate, external
advice on policies and practices. The Compensation Committee may recommend adjustments as appropriate. Base salaries are set forth in “Summary Compensation Table.”
Performance Based Compensation—Short-Term Incentives
Some executives are entitled to an annual cash bonus upon achieving various key performance indicators (“KPIs”) as set by the Board. Having regard to the current size, nature and opportunities of the Company, the Board has determined that these
KPIs will include measures such as successful completion of the acquisition of new projects, exploration activities (e.g., completion of exploration programs within budgeted timeframes and costs), development activities (e.g., completion of scoping
and/or feasibility studies), corporate activities (e.g., recruitment of key personnel) and business development activities (e.g., project acquisitions and capital raisings). Prior to the end of each financial year, the Board assesses performance
against these criteria.
For fiscal year 2021, the KPI areas of focus included: (a) completion of successful exploration activities; (b) completion of successful development activities; and (c) completion of successful corporate activities. Specific KPIs are set and
weighted individually for each NEO and are designed to drive successful business outcomes. For fiscal year 2021, the Chief Executive Officer’s KPI areas of focus were weighted as follows: (a) 30% weighted to completion of successful exploration
activities; (b) 30% weighted to completion of successful development activities; and (c) 40% weighted to completion of successful corporate activities.
Annual cash bonuses are set forth in “Summary Compensation Table.”
Performance Based Compensation—Long-Term Incentives
On May 19, 2021, the Board approved long-term equity incentive awards to the NEOs and other employees under the Piedmont Lithium Inc. Stock Incentive Plan. This award
underpins our employment and engagement strategy and is specifically designed to: (1) promote the long-term growth and profitability of the Company; (2) attract and retain high-performing talent; and (3) to provide participants with incentives that
are closely linked to the interests of all stakeholders of the Company. The Compensation Committee granted the equity awards using a mix of stock options and restricted stock units.
Stock options
provide meaningful incentives for management to execute on the longer-term financial and strategic growth goals that
drive shareholder value creation. That is because they only provide value to the NEOs if the price of the Company’s stock appreciates over time. Specifically, the value of the award depends on the price of the Company’s common stock in the future
as compared to the exercise price of the options granted. The exercise price of the stock options under this award was $61.31, which was above the closing price of the Company’s common stock on the date of the grant, May 19, 2021. There can be no
assurance that any value will be realized. Stock options vest in 33% increments on each of December 31, 2021, December 31, 2022 and December 31, 2023. These stock options are also contingent upon the continued employment of the NEO through each
vesting date.
Restricted stock
units
are intended to provide the NEOs with the economic equivalent of a
direct ownership interest in the Company during the vesting period and provide the Company with significant retention security regardless of post-grant share price volatility. The current restricted stock units vest in 33% increments on each of
December 31, 2021, December 31, 2022 and December 31, 2023.
More information about the equity grants is set forth in “Outstanding Equity Awards at Fiscal Year-End.”
Employment Agreements
The key provisions of the employment agreements are set out below for each of our NEOs. None of these employment agreements have termination dates.
Mr. Phillips, President and Chief Executive Officer, entered into an at-will employment agreement with us on September 22, 2021, which may be terminated for any reason at
any time. This agreement was entered into in connection with the Redomiciliation to supersede Mr. Phillips’ prior agreement with Piedmont Carolinas and Piedmont Australia, pursuant to which he served as President and Chief Executive Officer.
The agreement provides Mr. Phillips with a base salary of $500,000 per annum and a discretionary annual bonus with a target bonus amount equal to 75% of base salary, with the ability to earn a maximum amount of up to
200% of the target bonus amount based upon performance criteria determined by the Board or the Compensation Committee of the Board. The employment agreement also provides that it is currently contemplated that Mr. Phillips will receive an annual
equity-based compensation award having a fair value equal to approximately 125% of base salary. In the event of a termination of employment by the Company without cause or by Mr. Phillips for good reason, not in connection with a change in
control, Mr. Phillips is entitled to (i) a lump sum severance payment equal to 24 months of base salary, (ii) 24 months of company-paid COBRA coverage and (iii) full vesting of unvested equity awards (with performance-based awards vesting at the
target level of performance). The agreement provides that in the event of a termination of employment by the Company without cause or by Mr. Phillips for good reason within three months prior to or 12 months following a change in control, Mr.
Phillips will be entitled to (i) cash severance equal to 2.5 times base salary plus target bonus, (ii) a pro-rata bonus for the year of termination based on actual performance, (iii) payment of the annual bonus earned for the prior year, to the
extent unpaid at the time of termination, (iv) 30 months of Company-paid COBRA coverage and (v) full vesting of unvested equity awards (with performance-based awards vesting at the target level of performance).
Mr. Brindle, Executive Vice President and Chief Development Officer, entered into an at-will employment agreement with us on September 22, 2021, which may be terminated
for any reason at any time. The agreement was entered into in connection with the Redomiciliation to supersede Mr. Brindle’s prior agreement with Piedmont Carolinas and Piedmont Australia, pursuant to which he served as Executive Vice President
and Chief Development Officer of Piedmont Carolinas. The agreement provides Mr. Brindle with a base salary of $350,000 per annum and a discretionary annual bonus with a target bonus amount equal to 50% of base salary, with the ability to earn a
maximum amount of up to 200% of the target bonus amount based upon performance criteria determined by the Board or the Compensation Committee of the Board. The employment agreement also provides that it is currently contemplated that Mr.
Brindle will receive an annual equity-based compensation award having a fair value equal to approximately 75% of base salary. In the event of a termination of employment by the Company without cause or by Mr. Brindle for good reason, not in
connection with a change in control, Mr. Brindle is entitled to (i) a lump sum severance payment equal to 12 months of base salary, (ii) 12 months of company-paid COBRA coverage and (iii) full vesting of unvested equity awards (with
performance-based awards vesting at the target level of performance). The agreement provides that in the event of a termination of employment by the Company without cause or by Mr. Brindle for good reason within 3 months prior to or 24 months
following a change in control, Mr. Brindle will be entitled to (i) cash severance equal to 100% of base salary plus target bonus, (ii) a pro-rata bonus for the year of termination based on actual performance, (iii) payment of the annual bonus
earned for the prior year, to the extent unpaid at the time of termination, (iv) 24 months of Company-paid COBRA coverage, and (v) full vesting of unvested equity awards (with performance-based awards vesting at the target level of
performance).
Mr. Leatherman, Vice President and Chief Geologist, entered into an employment agreement with us on January 1, 2021, which may be terminated by either party at any time
for any or no reason upon at least two months prior written notice of termination to the other, or payment in lieu thereof. Mr. Leatherman receives a fixed compensation component of $210,000 per annum and a discretionary target bonus amount of
up to $50,000 per annum.
Outstanding Equity Awards at Fiscal Year-End
The following table summarizes equity awards held by our NEOs as of June 30, 2021. Equity based awards for our executive officers consist of options outstanding to purchase shares of our common stock and performance
rights outstanding that provide the holder the ability to convert each right to a fully paid share of our common stock if vesting conditions are met.
|
Option Awards
|
Stock Awards
|
|||||||||||||||||||
|
Name
|
Number of securities underlying unexercised options
exercisable
(#)
|
Number of securities
underlying
unexercised
options
unexercisable
(#)
|
Option
exercise
price
($)
|
Option
expiration
date
|
Number of shares or
units of
stock that
have not
vested
(#)
|
Market
value of
shares of
units of
stock that
have not
vested
($)
|
||||||||||||||
|
Keith Phillips
|
60,000
|
—
|
12.38
|
12/31/2022
|
||||||||||||||||
|
15,000
|
81,228
|
|||||||||||||||||||
|
30,000
|
—
|
18.57
|
6/10/2022
|
|||||||||||||||||
|
5,344
|
327,640
|
|||||||||||||||||||
|
10,786
|
65.00
|
5/19/2031
|
||||||||||||||||||
|
Patrick Brindle
|
15,000
|
—
|
12.38
|
12/31/2022
|
||||||||||||||||
|
15,000
|
73,106
|
|||||||||||||||||||
|
4,530
|
65.00
|
5/19/2031
|
||||||||||||||||||
|
2,244
|
137,580
|
|||||||||||||||||||
|
Lamont Leatherman
|
30,000
|
—
|
12.38
|
12/31/2022
|
||||||||||||||||
|
15,000
|
81,228
|
|||||||||||||||||||
|
2,157
|
65.00
|
5/19/2031
|
||||||||||||||||||
|
1,069
|
65,540
|
|||||||||||||||||||
Non-Executive Director Compensation
The Board’s policy is to compensate Non-Executive Directors at market rates for comparable companies for time, commitment and responsibilities. Given the size, nature and risks of the Company, stock options have been
used to attract and retain Non-Executive Directors, where deemed appropriate. The Board determines payments to the Non-Executive Directors and reviews their compensation annually, based on market practice, duties and accountability. Independent
external advice is sought when appropriate.
We prohibit Non-Executive Directors from entering into arrangements to limit their exposure to equity awards granted as part of their compensation package.
Fees for the Chairman are presently $75,000 per annum ($30,000 in fiscal year 2021). Fees for other Non-Executive Directors are presently set at $50,000 per annum. These fees cover main board activities only.
Non-Executive Directors may receive additional compensation for other services provided to the Company, including but not limited to, membership of committees.
Mr. Phillips did not receive additional compensation for his service as a Director.
|
Name
|
Fees Earned or Paid in Cash
($)
|
Stock Awards
($)
|
Option
Awards
($)
|
All Other Compensation
($)
|
Total
($)
|
||||||||||||
|
Ian Middlemas
(1)
|
12,771 |
—
|
—
|
—
|
12,771
|
||||||||||||
|
Anastasios Arima
(2)
|
88,333 |
—
|
—
|
12,177 |
100,510
|
||||||||||||
|
Jorge Beristain
|
40,000 |
—
|
—
|
—
|
40,000
|
||||||||||||
|
Levi Mochkin
(3)
|
36,928 |
—
|
—
|
3,508 |
40,436
|
||||||||||||
|
Jeffrey Armstrong
|
30,000
|
105,000
|
—
|
—
|
135,000
|
||||||||||||
|
Todd Hannigan
(4)
|
16,617
|
70,000
|
—
|
—
|
86,617
|
||||||||||||
|
Claude Demby
(5)
|
7,875
|
—
|
—
|
—
|
7,875
|
||||||||||||
|
Susan Jones
(6)
|
7,000
|
—
|
—
|
—
|
7,000
|
||||||||||||
| (1) |
Mr. Middlemas retired from the Board on December 9, 2020.
|
| (2) |
Mr. Arima received $12,177 as other compensation consisting of $4,041 for 401(k) Plan employer contributions and $8,136 for employer paid insurance premiums. Mr. Arima
retired from the Board on June 1, 2021.
|
| (3) |
Mr. Mochkin received $3,508 as other compensation consisting of employer contributions related to superannuation in Australia. Mr. Mochkin retired from the Board on
June 1, 2021.
|
| (4) |
Mr. Hannigan joined the Board as a Non-Executive Director on February 8, 2021.
|
| (5) |
Mr. Demby was appointed to the Board as a Non-Executive Director and Chair of the Nominating and Corporate Governance Committee on June 1, 2021.
|
| (6) |
Ms. Jones was appointed to the Board as a Non-Executive Director on June 1, 2021.
|
|
Item 12.
|
Security Ownership of Certain Beneficial Owners and Management and Related Stockholder Matters.
|
Major Stockholders
Based upon filings made with the SEC and the ASX and information we received from our transfer agent, we are not aware of any beneficial owner of more than 5% of shares of our common stock.
Record Holders
As of September 16, 2021, we had 15,869,395 shares of our common stock outstanding. Based on information known to us as of September 16, 2021, 10,100,654 of shares of our
common stock were being held in the United States by 135 holders of record and 5,768,741 shares of our common stock were being held in Australia in the form of CDIs by 35 holders of record. A large number of shares of our common stock are held
by nominee companies so we cannot be certain of the identity of those beneficial owners.
Piedmont Lithium is not controlled by another corporation, by any foreign government or by any natural or legal persons except as set forth herein, and here are no arrangements known to Piedmont Lithium which would
result in a change in control of Piedmont Lithium at a subsequent date.
The following table lists as of September 16, 2021, the number of shares of our common stock beneficially owned by each of our directors, our chief executive officer and
other members of our senior management as a group. Beneficial ownership is calculated based on 15,869,395 shares outstanding as of September 16, 2021 and amounts representing less than 1% are denoted with an asterisk (*).
|
Shares Beneficially Owned
(1)
|
||||||||
|
Number
|
Percent
|
|||||||
|
Officers and Directors:
|
||||||||
|
Keith Phillips
(2)
|
171,715
|
1.1
|
%
|
|||||
|
Patrick Brindle
(3)
|
40,386
|
*
|
||||||
|
Lamont Leatherman
(4)
|
51,095
|
*
|
||||||
|
Jeffrey Armstrong
|
20,000
|
*
|
||||||
|
Jorge Beristain
|
30,460
|
*
|
||||||
|
Susan Jones
|
4,000
|
*
|
||||||
|
Claude Demby
|
—
|
*
|
||||||
|
Todd Hannigan
|
356,279
|
2.2
|
%
|
|||||
|
Officers and directors as a group (14 persons)
|
707,553
|
4.5
|
%
|
|||||
| (1) |
Beneficial ownership is determined according to the rules of the SEC and generally means that a person has beneficial ownership of a security if he, she or it possesses sole or shared voting or investment
power of that security, including options and performance rights that are currently exercisable or exercisable within 60 days of September 16, 2021. Shares of our common stock subject to options and performance rights currently exercisable
or exercisable within 60 days of September 16, 2021 are deemed to be outstanding for computing the percentage ownership of the person holding these options and/or performance rights and the percentage ownership of any group of which the
holder is a member but are not deemed outstanding for computing the percentage of any other person.
|
| (2) |
Includes options to purchase 90,000 shares (60,000 exercisable for $12.38 each on or before December 31, 2022 and 30,000 exercisable for $18.57 each on or before July 10, 2022).
|
| (3) |
Includes options to purchase 15,000 shares (exercisable for $12.38 each on or before December 31, 2022).
|
| (4) |
Includes options to purchase 30,000 shares (exercisable for $12.38 each on or before December 31, 2022).
|
Equity Compensation Plan Information
The table below sets forth information with respect to compensation plans under which equity securities of the Company are authorized for issuance as of June 30, 2021.
|
|
(a)
Number of securities
to be issued upon
exercise of
outstanding options,
warrants and rights
(1)
|
(b)
Weighted-average
exercise price of
outstanding options,
warrants and rights
(2)
|
(c)
Number of securities
remaining available
for future issuance
under equity
compensation plans
(excluding securities
reflected in
column (a))
|
|||||||||
| Plan category |
(#)
|
($)
|
(#)
|
|||||||||
|
Equity compensation plans approved by security holders
|
495,833
|
16.75
|
2,504,167
|
|||||||||
|
Equity compensation plans not approved by security holders
|
—
|
—
|
—
|
|||||||||
|
Total
|
495,833
|
16.75
|
2,504,167
|
|||||||||
|
|
(1) |
This number reflect the stock options and restricted stock units granted under the Piedmont Lithium Inc. Stock Incentive plan.
|
|
|
(2) |
Taking into account all outstanding awards included in this table, the weighted-average exercise price of such stock options is $16.75 and the weighted-average term-to-expiration is 4.136 years.
|
Related-Party Transactions
Other than as disclosed below, since the start of fiscal year 2019, other than employment and “Compensation,” matters described under “Item 11. Executive Compensation,” there have been no transactions or loans
between us and:
|
|
• |
enterprises that directly or indirectly through one or more intermediaries, control or are controlled by, or are under common control with, us;
|
|
|
• |
associates, meaning unconsolidated enterprises in which we have a significant influence or which have significant influence over us;
|
|
|
• |
individuals owning, directly or indirectly, an interest in the voting power of us that gives them significant influence over our us, and close members of any such individual’s family;
|
|
|
• |
key management personnel, that is, those persons having authority and responsibility for planning, directing and controlling the activities of ours, including directors and senior management of us and close
members of such individuals’ families; and
|
|
|
• |
enterprises in which a substantial interest in the voting power is owned, directly or indirectly, by any person described in (c) or (d) or over which such a person is able to exercise significant influence,
including enterprises owned by directors or major stockholders of us and enterprises that have a member of key management in common with us.
|
Ledger, a company associated with Mr. Levi Mochkin, was paid $91,667 and $90,734 during fiscal years 2021 and 2020, respectively, for the provision of services in relation to business development activities (such fees have been included in Mr.
Mochkin’s compensation as disclosed above).
Transactions between related parties are on normal commercial terms and the conditions no more favorable than those available to other non-related parties.
Deloitte & Touche LLP served as our independent registered public accounting firm for fiscal year 2021, beginning June 9, 2021. Deloitte Touche Tohmatsu served as our independent registered public
accounting firm for fiscal year 2020 and for fiscal year 2021 until June 9, 2021. The following table presents fees for professional services rendered by Deloitte & Touche LLP for fiscal year 2021 and by Deloitte Touche Tohmatsu for
fiscal years 2021 and 2020.
|
Fiscal 2021
|
Fiscal 2020
|
||||||||||||
|
Deloitte & Touche LLP
|
Deloitte Touche
Tohmatsu
|
Deloitte Touche
Tohmatsu
|
|||||||||||
|
Audit Fees
(1)
|
$
|
100,000
|
$
|
426,627
|
$
|
222,738
|
|||||||
|
Audited-Related Fees
|
—
|
—
|
—
|
||||||||||
|
Tax Fees
|
—
|
—
|
—
|
||||||||||
|
All Other Fees
|
—
|
—
|
—
|
||||||||||
|
(1)
|
Total fees billed by Deloitte &
Touche
LLP for professional services for the
audit of our consolidated financial statements for the years ended June 30, 2021 and 2020.
|
Pre-Approval Policies and Procedures
Our Audit Committee has adopted policies and procedures for the pre-approval of audit and non-audit services rendered by our independent registered public accounting firm. Pre-approval of an audit or non-audit service may be given as a
general pre-approval, as part of the Audit Committee’s approval of the scope of the engagement of our independent registered public accounting firm, or on an individual basis. Any proposed services exceeding general pre-approved levels also
requires specific pre-approval by our Audit Committee. All of the fees described above were pre-approved by the Board prior to our listing on Nasdaq and by the Audit Committee after our listing on Nasdaq.
PART IV
| Item 15. |
|
|
(a) |
The following documents are filed as a part of this report:
|
|
|
(1) |
Financial Statements
|
See Index to Consolidated Financial Statements at Part II Item 8 “Financial Statements and Supplementary Data.”
|
|
(2) |
Financial Statement Schedules
|
The financial statement schedules are omitted as they are either not applicable or the information required is presented in the financial statements and notes thereto under Part II Item 8. “Financial Statements and
Supplementary Data.”
|
|
(3) |
Exhibits:
|
Exhibit Index
|
Exhibit
Number
|
Description
|
|
Amended and Restated Certificate of Incorporation of Piedmont Lithium Inc. (filed with the SEC as Exhibit 3.1 to the Company’s Current Report on Form 8-K12B filed on May 18, 2021)
|
|
|
Amended and Restated Bylaws of Piedmont Lithium Inc. (filed with the SEC as Exhibit 3.2 to the Company’s Current Report on Form 8-K12B filed on May 18, 2021)
|
|
|
Description of Securities
|
|
|
Piedmont Lithium Inc. 2021 Stock Incentive Plan (filed with the SEC as Exhibit 10.1 to the Company’s Current Report on Form 8-K filed on May 18, 2021)
|
|
|
Executive Employment Agreement, dated as of September 22, 2021, by and between Keith Phillips, Piedmont Lithium Inc. and Piedmont Lithium Carolinas, Inc.
|
|
|
Executive Employment Agreement, dated as of June 4, 2021, by and between Michael White and Piedmont Lithium Inc. (filed with the SEC as Exhibit 10.1 to the Company’s Current Report on Form 8-K filed on June
4, 2021)
|
|
|
Executive Employment Agreement, dated as of September 22, 2021, by and between Bruce Czachor and Piedmont Lithium Inc. and Piedmont Lithium Carolinas, Inc.
|
|
|
10.5*
|
Executive Employment Agreement, dated as of September 22, 2021, by and between Patrick Brindle and Piedmont Lithium Inc. and Piedmont Lithium Carolinas, Inc.
|
|
List of Subsidiaries of Piedmont Lithium Inc.
|
|
|
Consent of Independent Registered Public Accounting Firm
|
|
|
Certification of Principal Executive Officer Pursuant to Section 302 of the Sarbanes-Oxley Act of 2002
|
|
|
Certification of Principal Financial Officer Pursuant to Section 302 of the Sarbanes-Oxley Act of 2002
|
|
|
Certification of Principal Executive Officer Pursuant to Section 906 of the Sarbanes-Oxley Act of 2002
|
|
|
Certification of Principal Financial Officer Pursuant to Section 906 of the Sarbanes-Oxley Act of 2002
|
|
|
101.INS
|
XBRL Instance Document - - embedded within the Inline XBRL document
|
|
101.SCH
|
XBRL Taxonomy Extension Schema Document
|
|
101.CAL
|
XBRL Taxonomy Extension Calculation Linkbase Document
|
|
101.DEF
|
XBRL Taxonomy Extension Definition Linkbase Document
|
|
101.LAB
|
XBRL Taxonomy Extension Label Linkbase Document
|
|
101.PRE
|
XBRL Taxonomy Extension Presentation Linkbase Document
|
| * |
Filed herewith.
|
| + |
Indicates management contract or compensatory plan.
|
| Item 16. |
None.
Pursuant to the requirements of Section 13 or 15(d) of the Securities Exchange Act of 1934, as amended, the Registrant has duly caused this report to be signed on its behalf by the undersigned, thereunto duly authorized.
|
Piedmont Lithium Inc.
|
||
|
Date: September 24, 2021
|
By:
|
/s/ Keith Phillips |
|
Keith Phillips
|
||
|
President and Chief Executive Officer
(Principal Executive Officer)
|
||
POWER OF ATTORNEY
KNOW ALL PERSONS BY THESE PRESENTS, that each person whose signature appears below hereby constitutes and appoints Keith Phillips, Patrick Brindle and Bruce Czachor, and each of them, the true and lawful
attorneys-in-fact and agents of the undersigned, with full power of substitution and resubstitution, for and in the name, place and stead of the undersigned, to sign in any and all capacities (including, without limitation, the capacities listed
below), this annual report on Form 10-K, any and all amendments thereto, and to file the same, with all exhibits thereto, and all other documents in connection therewith, with the Securities and Exchange Commission, and hereby grants to such
attorneys-in-fact and agents, and each of them, full power and authority to do and perform each and every act and anything necessary to be done to enable the Registrant to comply with the provisions of the Securities Exchange Act, as amended, and
all the requirements of the Securities and Exchange Commission, as fully to all intents and purposes as the undersigned might or could do in person, hereby ratifying and confirming all that said attorneys-in-fact and agents, or any of them, or
their or his or her substitute, or substitutes, may lawfully do or cause to be done by virtue hereof.
Pursuant to the requirements of the Securities Exchange Act of 1934, as amended, this Report has been signed below by the following persons on behalf of the Registrant in the capacities and on the dates indicated.
|
Name
|
Title
|
Date
|
||
| /s/ Keith Phillips |
President and Chief Executive Officer and Director
|
September 24, 2021 | ||
|
Keith Phillips
|
(Principal Executive Officer)
|
|||
|
/s/ Michael White
|
Chief Financial Officer
|
September 24, 2021 | ||
|
Michael White
|
(Principal Financial Officer and
Principal Accounting Officer)
|
|||
|
/s/ Jeffrey Armstrong
|
Chairman and Director
|
September 24, 2021 | ||
|
Jeffrey Armstrong
|
||||
|
/s/ Jorge Beristain
|
Director
|
September 24, 2021 | ||
|
Jorge Beristain
|
||||
|
/s/ Claude Demby
|
Director
|
September 24, 2021 | ||
|
Claude Demby
|
||||
|
/s/ Todd Hannigan
|
Director
|
September 24, 2021 | ||
|
Todd Hannigan
|
||||
|
/s/ Susan Jones
|
Director
|
September 24, 2021 | ||
|
Susan Jones
|
83
TABLE OF CONTENTS
Part IItem 1. BusinessItem 1A. Risk FactorsItem 1B. Unresolved Staff CommentsItem 2. PropertiesItem 3. Legal ProceedingsItem 4. Mine Safety DisclosuresPart IIItem 5. Market For Registrant S Common Equity, Related Stockholder Matters and Issuer Purchases Of Equity SecuritiesItem 6. Not RequiredItem 7. Management S Discussion and Analysis Of Financial Condition and Results Of OperationsItem 7A. Quantitative and Qualitative Disclosures About Market RiskItem 8. Financial Statements and Supplementary DataItem 9. Changes in and Disagreements with Accountants on Accounting and Financial DisclosureItem 9A. Controls and ProceduresItem 9B. Other InformationPart IIIItem 10. Directors, Executive Officers and Corporate GovernanceItem 11. Executive CompensationItem 12. Security Ownership Of Certain Beneficial Owners and Management and Related Stockholder MattersItem 13. Certain Relationships and Related Transactions, and Director IndependenceItem 14. Principal Accounting Fees and ServicesPart IVItem 15. Exhibits, Financial Statement SchedulesItem 16. Form 10-k Summary