PLANET FITNESS, INC.
10-Ks and 10-Qs
|
|
|
|
|
|
|
|
|
|
|
|
|
|
|
|
|
|
|
|
|
|
|
|
|
|
|
|
|
|
|
|
|
|
|
|
|
|
UNITED STATES
SECURITIES AND EXCHANGE COMMISSION
Washington, D.C. 20549
FORM 10-K
(Mark One)
|
x
|
ANNUAL REPORT PURSUANT TO SECTION 13 OR 15(d) OF THE SECURITIES EXCHANGE ACT OF 1934
|
For the fiscal year ended
December 31, 2018
OR
|
o
|
TRANSITION REPORT PURSUANT TO SECTION 13 OR 15(d) OF THE SECURITIES EXCHANGE ACT OF 1934 FOR THE TRANSITION PERIOD FROM TO
|
Commission File Number
001-37534
PLANET FITNESS, INC.
(Exact name of Registrant as specified in its Charter)
|
Delaware
|
38-3942097
|
|
(State or Other Jurisdiction of
Incorporation or Organization)
|
(I.R.S. Employer
Identification No.)
|
4 Liberty Lane West, Hampton, NH 03842
(Address of Principal Executive Offices and Zip Code)
(603) 750-0001
(Registrant’s Telephone Number, Including Area Code)
Securities registered pursuant to Section 12(b) of the Act: Class A common stock, par value $.0001 per share; Traded on the New York Stock Exchange
Securities registered pursuant to Section 12(g) of the Act:
None
Indicate by check mark if the Registrant is a well-known seasoned issuer, as defined in Rule 405 of the Securities Act. YES
x
NO
o
Indicate by check mark if the Registrant is not required to file reports pursuant to Section 13 or 15(d) of the Act. YES
o
NO
x
Indicate by check mark whether the Registrant: (1) has filed all reports required to be filed by Section 13 or 15(d) of the Securities Exchange Act of 1934 during the preceding 12 months (or for such shorter period that the Registrant was required to file such reports), and (2) has been subject to such filing requirements for the past 90 days. YES
x
NO
o
Indicate by check mark whether the Registrant has submitted electronically every Interactive Data File required to be submitted pursuant to Rule 405 of Regulation S-T (§232.405 of this chapter) during the preceding 12 months (or for such shorter period that the Registrant was required to submit such files). YES
x
NO
o
Indicate by check mark if disclosure of delinquent filers pursuant to Item 405 of Regulation S-K (§229.405) is not contained herein, and will not be contained, to the best of Registrant’s knowledge, in definitive proxy or information statements incorporated by reference in Part III of this Form 10-K or any amendment to this Form 10-K.
o
Indicate by check mark whether the Registrant is a large accelerated filer, an accelerated filer, a non-accelerated filer a smaller reporting company or an emerging growth company. See the definitions of the "large accelerated filer," "accelerated filer," "non-accelerated filer," "smaller reporting company" and “emerging growth company” in Rule 12b-2 of the Exchange Act:
|
Large accelerated filer
|
|
x
|
|
Accelerated filer
|
|
o
|
|
Non-accelerated filer
|
|
o
|
|
Small reporting company
|
|
o
|
|
|
|
|
|
Emerging Growth Company
|
|
o
|
If an emerging growth company, indicate by check mark if the Registrant has elected not to use the extended transition period for complying with any new or revised financial accounting standards provided pursuant to Section 13(a) of the Exchange Act. ☐
Indicate by check mark whether the Registrant is a shell company (as defined in Rule 12b-2 of the Exchange Act). YES ☐ NO ☒
The aggregate market value of the Registrant’s Class A common stock held by non-affiliates, computed by reference to the last reported sale price of the Class A common stock as reported on the New York Stock Exchange on
June 30, 2018
was approximately $3.9 billion.
The number of outstanding shares of the registrant’s Class A common stock, par value $0.0001 per share, and Class B common stock, par value $0.0001 per share, as of
February 22, 2019
was 83,600,812 shares and 9,441,730 shares, respectively.
DOCUMENTS INCORPORATED BY REFERENCE
Portions of the Definitive Proxy Statement for the registrant’s 2018 Annual Meeting of Stockholders to be held April 29, 2019, to be filed with the Securities and Exchange Commission pursuant to Regulation 14A, are incorporated by reference into Part III, Items 10-14 of this Annual Report on Form 10-K.
1
Table of Contents
|
|
|
Page
|
|
PART I
|
|
|
|
Item 1.
|
||
|
Item 1A.
|
||
|
Item 1B.
|
||
|
Item 2.
|
||
|
Item 3.
|
||
|
Item 4.
|
||
|
|
|
|
|
PART II
|
|
|
|
Item 5.
|
||
|
Item 6.
|
||
|
Item 7.
|
||
|
Item 7A.
|
||
|
Item 8.
|
||
|
Item 9.
|
||
|
Item 9A.
|
||
|
Item 9B.
|
||
|
|
|
|
|
PART III
|
|
|
|
Item 10.
|
||
|
Item 11.
|
||
|
Item 12.
|
||
|
Item 13.
|
||
|
Item 14.
|
||
|
|
|
|
|
PART IV
|
|
|
|
Item 15.
|
||
|
Item 16.
|
||
2
CAUTIONARY NOTE REGARDING FORWARD-LOOKING STATEMENTS
This Annual Report on Form 10-K contains forward-looking statements within the meaning of Section 27A of the Securities Act of 1933, as amended (the “Securities Act”), and Section 21E of the Securities Exchange Act of 1934, as amended (the “Exchange Act”). Such forward-looking statements reflect, among other things, our current expectations and anticipated results of operations, all of which are subject to known and unknown risks, uncertainties and other factors that may cause our actual results, performance or achievements, market trends, or industry results to differ materially from those expressed or implied by such forward-looking statements. Therefore, any statements contained herein that are not statements of historical fact may be forward-looking statements and should be evaluated as such. Without limiting the foregoing, the words “anticipates,” “believes,” “estimates,” “expects,” “intends,” “may,” “plans,” “projects,” “should,” “targets,” “will” and the negative thereof and similar words and expressions are intended to identify forward-looking statements. These forward-looking statements are subject to a number of risks, uncertainties and assumptions, including those described in “Item 1A. – Risk Factors,” of this report. Unless legally required, we assume no obligation to update any such forward-looking information to reflect actual results or changes in the factors affecting such forward-looking information.
3
PART I
Item 1. Business.
Planet Fitness, Inc. is a Delaware corporation formed on March 16, 2015. Planet Fitness, Inc. Class A common stock trades on the New York Stock Exchange under the symbol “PLNT.”
Our Company
Fitness for everyone
We are one of the largest and fastest-growing franchisors and operators of fitness centers in the United States by number of members and locations, with a highly recognized national brand. Our mission is to enhance people’s lives by providing a high-quality fitness experience in a welcoming, non-intimidating environment, which we call the Judgement Free Zone, where anyone—and we mean anyone—can feel they belong. Our bright, clean stores are typically 20,000 square feet, with a large selection of high-quality, purple and yellow Planet Fitness-branded cardio, circuit- and weight-training equipment and friendly staff trainers who offer unlimited free fitness instruction to all our members in small groups through our PE@PF program. We offer this differentiated fitness experience at only $10 per month for our standard membership. This attractive value proposition is designed to appeal to a broad population, including occasional gym users and the approximately 80% of the U.S. and Canadian populations over age 14 who are not gym members, particularly those who find the traditional fitness club setting intimidating and expensive. We and our franchisees fiercely protect Planet Fitness’ community atmosphere—a place where you do not need to be fit before joining and where progress toward achieving your fitness goals (big or small) is supported and applauded by our staff and fellow members.
Our judgement-free approach to fitness and attractive value proposition have enabled us to grow our revenues to $
572.9
million in
2018
and to become an industry leader with $
2.8
billion in system-wide sales during
2018
(which we define as monthly dues and annual fees billed by us and our franchisees), and approximately
12.5
million members and
1,742
stores in all 50 states, the District of Columbia, Puerto Rico, Canada, the Dominican Republic, Panama and Mexico as of
December 31, 2018
. System-wide sales for
2018
include $
2.6
billion attributable to franchisee-owned stores, from which we generate royalty revenue, and $
137.9
million attributable to our corporate-owned stores. Of our
1,742
stores,
1,666
are franchised and
76
are corporate-owned. Our stores are successful in a wide range of geographies and demographics. According to internal and third-party analysis, we believe we have the opportunity to grow our store count to over 4,000 stores in the U.S. alone. Under signed area development agreements (“ADAs”) as of
December 31, 2018
, our franchisees have committed to open more than 1,000 additional stores.
In
2018
, our corporate-owned stores had segment EBITDA margin of
40.9%
and had average unit volumes (“AUVs”) of approximately $
2.0
million with four-wall EBITDA margins (an assessment of store-level profitability which includes local and national advertising expense) of approximately
46%
, or approximately
39%
after applying the current 7% royalty rate, which includes 1.59% royalty as a result of the elimination of certain rebates and commissions that were previously paid by all stores and deducted as an expense in arriving at four wall EBITDA. We believe this to be comparable to a franchise store under our current franchise agreement. Based on a historical survey of franchisees, we believe that, on average, our franchise stores achieve four-wall EBITDA margins in line with these corporate-owned store EBITDA margins. Our strong member value proposition has also driven growth throughout a variety of economic cycles and conditions. For a reconciliation of segment EBITDA margin to four-wall EBITDA margin for corporate-owned stores, see “Management’s Discussion and Analysis of Results of Operations and Financial Condition.”
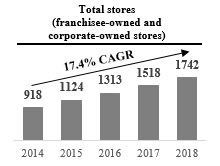
Our significant growth is reflected in:
|
•
|
1,742
stores as of
December 31, 2018
, compared to 918 as of December 31, 2014, reflecting a compound annual growth rate (“CAGR”) of 17.4%;
|
|
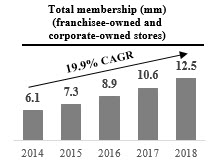
•
|
12.5
million members as of
December 31, 2018
, compared to 6.1 million as of December 31, 2014, reflecting a CAGR of 19.9%;
|
|
•
|
2018
system-wide sales of $
2.8
billion, reflecting a CAGR of 23.4%, or increase of $1.6 billion, since 2014
|
|
•
|
2018
total revenue of $
572.9
million, reflecting a CAGR of 19.6%, or increase of $293.1 million, since 2014, of which 0.4% is attributable to revenues from corporate-owned stores acquired from franchisees since January 1, 2014;
|
|
•
|
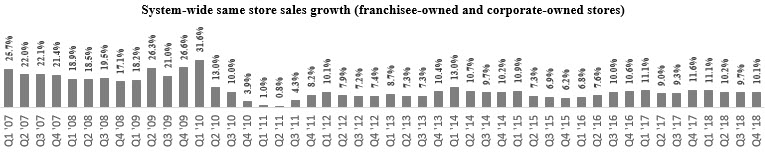
48 consecutive quarters of system-wide same store sales growth (which we define as year-over-year growth solely of monthly dues from stores that have been open and for which membership dues have been billed for longer than 12 months);
|
|
•
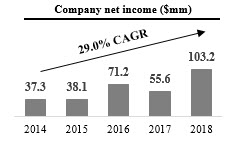
|
2018
net income of $
103.2
million, reflecting a CAGR of 29.0%, or increase of $65.9 million, since 2014. Our historical results, prior to our initial public offering, benefit from insignificant income taxes due to our status as a pass-through entity for U.S. federal income tax purposes, and we anticipate future results will not be comparable to periods prior to our IPO as our income attributable to Planet Fitness, Inc. is now subject to U.S. federal and state taxes;
|
|
•
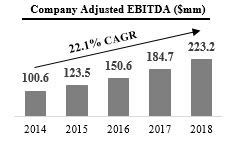
|
2018
Adjusted EBITDA of $
223.2
million, reflecting a CAGR of 22.1%, or increase of $122.7 million, since 2014; and
|
|
•
|
2018
Adjusted net income of $
119.5
million compared to $
82.3
million in
2017
, an increase of
45.3%
.
|
4

For a discussion of Adjusted EBITDA and Adjusted net income and a reconciliation of Adjusted EBITDA and Adjusted net income to net income, see “Management’s Discussion and Analysis of Financial Condition and Results of Operations.” For a discussion of same store sales, see “Management’s Discussion and Analysis of Financial Condition and Results of Operations—How we assess the performance of our business.”
Planet Fitness – Home of the Judgement Free Zone
We bring fitness to a large, previously underserved segment of the population. Our differentiated member experience is driven by three key elements:
|
•
|
Welcoming, non-intimidating environment
: We believe every member should feel accepted and respected when they walk into a Planet Fitness. Our stores provide a Judgement Free Zone where members of all fitness levels can enjoy a non-intimidating environment. Our “come as you are” approach has fostered a strong sense of community among our members, allowing them not only to feel comfortable as they work toward their fitness goals but also to encourage others to do the same. By outfitting our gyms with more cardiovascular and light strength equipment, and not offering heavy free weights, we reinforce our Judgement Free Zone philosophy by discouraging what we call “Lunk” behavior, such as dropping weights and grunting, that can be intimidating to new and occasional gym users. In addition, to help maintain our welcoming, judgement-free environment, each store is required to have a purple and yellow branded “Lunk” alarm on the wall that staff occasionally rings as a light-hearted reminder of our policies.
|
|
•
|
Distinct store experience
: Our bright, clean, large-format stores offer our members a selection of high-quality, purple and yellow Planet Fitness-branded cardio, circuit- and weight-training equipment that is commonly used by first-time and occasional gym users. Because our stores are typically 20,000 square feet and we do not offer non-essential amenities such as group exercise classes, pools, day care centers and juice bars, we have more space for the equipment our members do use. We believe our tailored use of space is, at least in part, why we have not needed to impose time limits on our cardio machines.
|
|
•
|
Exceptional value for members
: Both our standard and PF Black Card memberships are priced significantly below the industry median of $61 per month and still provide our members with a high-quality fitness experience. In the U.S., for only $10 per month, our standard membership includes unlimited access to one Planet Fitness location and unlimited free
|
5
fitness instruction to all members in small groups through our PE@PF program. And, for approximately $21.99 per month, our PF Black Card members have access to all of our stores system-wide and can bring a guest on each visit, which provides an additional opportunity to attract new members. Our PF Black Card members also have access to exclusive areas in our stores that provide amenities such as water massage beds, massage chairs, tanning equipment and more
.
Our differentiated approach to fitness has allowed us to create an attractive franchise model that is both profitable and scalable. We recognize that our success depends on a shared passion with our franchisees for providing a distinctive store experience based on a judgement-free environment and an exceptional value for our members. We seek to enhance the attractiveness of our streamlined, easy-to-operate franchise model by providing franchisees with extensive operational support relating to site selection and development, marketing and training. We also take a highly collaborative, teamwork approach to our relationship with franchisees, as captured by our motto “One Team, One Planet.” We believe the strength of our brand and the attractiveness of our franchise model are evidenced by the fact that over 90% of our new stores in
2018
were opened by our existing franchisee base.
Our competitive strengths
We attribute our success to the following strengths:
|
•
|
Market leader with differentiated member experience, nationally recognized brand and scale advantage
.
We believe we are the largest operator of fitness centers in the U.S. by number of members, with approximately
12.5
million members as of
December 31, 2018
. Our franchisee-owned and corporate-owned stores generated $
2.8
billion in system-wide sales during
2018
. Through our differentiated member experience, nationally recognized brand and scale advantage, we will continue to deliver a compelling value proposition to our members and our franchisees and, we believe, grow our store and total membership base.
|
|
•
|
Differentiated member experience
. We seek to provide our members with a high-quality fitness experience in a non-intimidating, judgement-free environment at an exceptional value. We have a dedicated Brand Excellence team that seeks to ensure that all our franchise stores uphold our brand standards and deliver a consistent Planet Fitness member experience in every store.
|
|
•
|
Nationally recognized brand
. We have developed a highly relatable and recognizable brand that emphasizes our focus on providing our members with a judgement-free environment. We do so through fun and memorable marketing campaigns and in-store signage that highlights the judgement people face in their everyday lives and how at Planet Fitness, they can be free to be themselves. As a result, we have among the highest aided and unaided brand awareness scores in the U.S. fitness industry, according to our Brand Health research, a third-party consumer study that we have executed bi-annually. Our brand strength also helps our franchisees attract members, with new stores in
2018
signing up an average of more than 1,300 members even before opening their doors.
|
|
•
|
Scale advantage
. Our scale provides several competitive advantages, including enhanced purchasing power with our fitness equipment and other suppliers and the ability to attract high-quality franchisee partners. In addition, we estimate that our large U.S. national advertising fund, funded by franchisees and us, together with our requirement that franchisees generally spend 7% of their monthly membership dues on local advertising, have enabled us and our franchisees to spend over $650 million since 2011 on marketing to drive consumer brand awareness and preference.
|
|
•
|
Exceptional value proposition that appeals to a broad member demographic
. We offer a high-quality and consistent fitness experience throughout our entire store base at low monthly membership dues. Combined with our non-intimidating and welcoming environment, we are able to attract a broad member demographic based on age, household income, gender and ethnicity. Our member base is over 50% female and our members come from both high- and low-income households. Our broad appeal and ability to attract occasional and first-time gym users enable us to continue to target a large segment of the population in a variety of markets and geographies across North America, including Puerto Rico, the Dominican Republic, Panama, and Mexico.
|
|
•
|
Strong store-level economics
. Our store model is designed to generate attractive four-wall EBITDA margins, strong free cash flow and high returns on invested capital for both our corporate-owned and franchise stores. Average four-wall EBITDA margins for our corporate-owned stores have increased significantly since 2014, driven by higher average members per store as well as a higher percentage of PF Black Card members, which leverage our relatively fixed costs. In
2018
, our corporate-owned stores had segment EBITDA margin of
40.9%
and had AUVs of approximately $
2.0
million with four-wall EBITDA margins of approximately
46%
, or approximately
39%
after applying the current 7% royalty rate, which includes 1.59% royalty as a result of the elimination of certain rebates and commissions that were previously paid by all stores and deducted as an expense in arriving at four-wall EBITDA. We believe this to be comparable to a franchise store under our current franchise agreement. Based on a historical survey of franchisees, we believe that our franchise
|
6
stores achieve four-wall EBITDA margins in line with these corporate-owned store EBITDA margins. We believe that our strong store-level economics are important to our ability to attract and retain successful franchisees and grow our store base.
|
•
|
Highly attractive franchise system built for growth
. Our easy-to-operate model, strong store-level economics and brand strength have enabled us to attract a team of professional, successful franchisees from a variety of industries. We believe that our franchise model enables us to scale more rapidly than a company-owned model. Our streamlined model features relatively fixed labor costs, minimal inventory, automatic billing and limited cash transactions. Our franchisees enjoy recurring monthly member dues, regardless of member use, weather or other factors. Based on historical survey data and management estimates, we believe our franchisees can earn, in their second year of operations, on average, a cash-on-cash return on initial investment greater than 25% after royalties and advertising, which is in line with our corporate-owned stores. The attractiveness of our franchise model is further evidenced by the fact that our franchisees re-invest their capital with us, with over 90% of our new stores in
2018
opened by our existing franchisee base, as well as 48 consecutive quarters of same store sales growth, including system-wide same store sales growth of
10.2%
in
2018
. We view our franchisees as strategic partners in expanding the Planet Fitness store base and brand.
|
|
•
|
Predictable and recurring revenue streams with high cash flow conversion
. Our business model provides us with predictable and recurring revenue streams. In
2018
, approximately 90% of both our corporate-owned store and franchise revenues consisted of recurring revenue streams, which include royalties, vendor commissions, monthly dues and annual fees. In addition, our franchisees are obligated to purchase fitness equipment from us or our required vendor for their new stores and to replace this equipment every five to seven years. As a result, these “equip” and “re-equip” requirements create a predictable and growing revenue stream as our franchisees open new stores under their ADAs. By re-investing in stores, we and our franchisees strive to maintain and enhance our member experience. Our predictable and recurring revenue streams, combined with our attractive margins and minimal capital requirements, result in high cash flow conversion and increased capacity to invest in future growth initiatives.
|
|
•
|
Proven, experienced management team driving a strong culture
. Our strategic vision and unique culture have been developed and fostered by our senior management team under the stewardship of Chief Executive Officer, Chris Rondeau. Mr. Rondeau has been with Planet Fitness for over 25 years and helped develop the Planet Fitness business model and brand elements that give us our distinct personality and spirited culture. Dorvin Lively, our President and Chief Financial Officer, brings valuable expertise from over 35 years of corporate finance experience with companies such as RadioShack and Ace Hardware, and from the initial public offering of Maidenform Brands. We have assembled a management team that shares our passion for “fitness for everyone” and has extensive experience across a broad range of disciplines, including retail, franchising, finance, consumer marketing, digital strategies, brand development and information technology. We believe our senior management team is a key driver of our success and has positioned us well to execute our long-term growth strategy.
|
Our growth strategies
We believe there are significant opportunities to grow our brand awareness, increase our revenues and profitability and deliver shareholder value by executing on the following strategies:
|
•
|
Continue to grow our store base across a broad range of markets.
We have grown our store count over the last five years, expanding from 918 stores as of December 31, 2014 to
1,742
stores as of
December 31, 2018
. As of
December 31, 2018
, our franchisees have signed ADAs to open more than 1,000 additional stores, including more than 500 over the next three years. Because our stores are successful across a wide range of geographies and demographics with varying population densities, we believe that our high level of brand awareness and low per capita penetration in certain markets create a significant opportunity to open new Planet Fitness stores. Based on our internal and third-party analysis, we believe we have the potential to grow our store base to over 4,000 stores in the U.S. alone.
|
|
•
|
Drive revenue growth and system-wide same store sales
. Because we provide a high-quality, affordable, non-intimidating fitness experience that is designed for first-time and occasional gym users, we have achieved positive system-wide same store sales growth in each of the past 48 quarters. We expect to continue to grow system-wide same store sales primarily by:
|
|
•
|
Attracting new members to existing Planet Fitness stores.
As the population in the markets where we operate continue to focus on health and wellness, we believe we are well-positioned to capture a disproportionate share of these populations given our appeal to first-time and occasional gym users. In addition, because our stores offer a large, focused selection of equipment geared toward first-time and occasional gym users, we are able to service higher member volumes without sacrificing the member experience. We have also continued to evolve our offerings to appeal to our target member base,
|
7
including the introduction of TRX
®
and other functional training modalities (e.g., medicine balls, stability balls, kettlebells, etc.) within designated areas, as well as dedicated fitness programming to accompany this new equipment. We have also continued to enhance the PE@PF Program, our proprietary small group training program.
|
•
|
Increasing mix of PF Black Card memberships by enhancing value and member experience
. We expect to drive sales by continuing to convert our existing members with standard membership dues at $10 per month to our premium PF Black Card membership with dues at approximately $21.99 per month as well as attracting new members to join at the PF Black Card level. We encourage this upgrade by continuing to enhance the value of our PF Black Card benefits through additional in-store amenities, such as hydro-massage beds, and affinity partnerships for discounts and promotions. Since 2014, our PF Black Card members as a percentage of total membership has increased from 55% as of December 31, 2014 to 60% as of December 31,
2018
, and our average monthly dues per member have increased from $15.58 to $16.52 over the same period.
|
We may also explore other future revenue opportunities, such as optimizing member pricing and fees, offering new merchandise and services inside and outside our stores, and securing affinity and other corporate partnerships.
|
•
|
Increase brand awareness to drive growth.
We plan to continue to increase our strong brand awareness by leveraging significant marketing expenditures by our franchisees and us, which we believe will result in increasing membership in new and existing stores and continue to attract high-quality franchisee partners. Under our current franchise agreement, franchisees are required to contribute 2% of their monthly membership dues to our National Advertising Fund (“NAF”), from which we spent $
42.6
million in
2018
alone to support our national marketing campaigns, our social media platforms and the development of local advertising materials. Under our current franchise agreement, franchisees are also required to spend 7% of their monthly membership dues on local advertising. We expect both our NAF and local advertising spending to grow as our membership grows.
|
|
•
|
Continue to expand royalties from increases in average royalty rate and new franchisees.
During 2017, we increased our current royalty rate to 7% and at the same time, for new franchisees and existing franchisees on our current royalty rate structure, we eliminated certain commissions that were paid to us by franchisees and rebates that were earned by us through franchisee purchases from third-party vendors. The eliminated commissions and rebates equate to approximately 1.59% of an average franchisee’s monthly dues and annual fees based on system-wide averages. The current royalty rate of 7% includes this 1.59%. We also offered existing franchisees the opportunity to eliminate such commissions and rebates in exchange for a royalty rate increase of 1.59%. As of
December 31, 2018
, approximately 86% of our franchisee owned stores increased their royalty rates and are no longer subject to such commissions and rebates.
|
While our current franchise agreement stipulates monthly royalty rates of 7% of monthly dues and annual membership fees, only 16% of our stores are paying royalties at the current franchise agreement rate, primarily due to lower rates in historical agreements. As new franchisees enter our system and, generally, as current franchisees open new stores or renew their existing franchise agreements at the current royalty rate, our average system-wide royalty rate will increase. In
2018
, our average royalty rate was 5.61% compared to 2.95% in 2014. In addition to rising average royalty rates, total royalty revenue will continue to grow as we expand our franchise store base and increase franchise same store sales.
|
•
|
Grow sales from fitness equipment and related services.
Our franchisees are contractually obligated to purchase fitness equipment from us, and in international markets, from our required vendors. Due to our scale and negotiating power, we believe we offer competitive pricing for high-quality, purple and yellow Planet Fitness-branded fitness equipment. We expect our equipment sales to grow as our U.S. franchisees open new stores and replace used equipment. In international markets, we earn a commission on the sale of equipment by our required vendors to franchisee-owned stores. Additionally, all franchisees are required to replace their existing equipment with new equipment every five to seven years. As the number of franchise stores continues to increase and existing franchise stores continue to mature, we anticipate incremental growth in revenue related to the sale of equipment to U.S. franchisees and commissions on the sale of equipment to international franchisees. In addition, we believe that regularly refreshing equipment helps our franchise stores maintain a consistent, high-quality fitness experience and is one of the contributing factors that drives new member growth.
|
Our industry
Due to our unique positioning to a broader demographic, we believe Planet Fitness has an addressable market that is significantly larger than the traditional health club industry. We view our addressable market as approximately 255 million people, representing the U.S. population over 14 years of age. We compete broadly for consumer discretionary spending related to leisure, sports, entertainment and other non-fitness activities in addition to the traditional health club market.
8
According to the International Health, Racquet & Sportsclub Association (“IHRSA”), the U.S. health club industry generated approximately $30.0 billion in revenue in 2017. The industry is highly fragmented, with 38,500 clubs across the U.S. serving approximately 60.9 million members, according to IHRSA. In 2017, the U.S. health club industry grew by 5.3% in number of units and 6.3% in number of members compared to Planet Fitness, which grew by 15.6% and 19.9%, respectively. IHRSA data is not yet available for 2018, but Planet Fitness grew its number of stores by 14.8% and its number of members by 17.4% in 2018. Over the next five years, industry sources project that U.S. health club industry revenues will grow at an annualized rate of approximately 1.5%, primarily attributed to an increase in discretionary spending coupled with continued consumer awareness and public initiatives on the health benefits of exercise. We believe we are well-positioned to capitalize on these trends, and our impressive growth reinforces our distinct approach to fitness and broad demographic appeal.
Our brand philosophy
We are a brand built on passion and the belief that anyone can achieve their personal wellness goals in a non-intimidating, judgement-free environment. We have become a nationally recognized consumer brand that stands for the welcoming environment, value and quality we provide our members.
The Judgement Free Zone
. Planet Fitness is the home of the Judgement Free Zone. It is a place where people of all fitness levels can feel comfortable working out at their own pace, feel supported in their efforts and not feel intimidated by pushy salespeople or other members who may ruin
their fitness experience. Our philosophy is simple: Planet Fitness is an environment where members can relax, go at their own pace and be themselves without ever having to worry about being judged. Behaviors such as grunting, dropping weights or judging others are not allowed in our stores.
All This for Only That
. Planet Fitness monthly membership dues typically range from only $10 to $21.99 in the U.S. We pride ourselves on providing a high-quality experience at an exceptional value, not an “economy” fitness experience.
No Lunks
. Lunks are people who intimidate others at the gym. To help maintain our judgement-free environment, each store has a purple and yellow branded “Lunk” alarm on the wall that our staff occasionally rings as a light-hearted, gentle reminder of our policies.
You Belong
. We do a lot of little things to make members feel like part of our community—like saying hello and goodbye to everyone who enters our stores, providing Tootsie Rolls at the front desk so that our staff has another opportunity to engage with members, and other membership appreciation gestures such as providing free pizza and bagels to our members once a month as a way to build community and reinforce that fitness can be fun.
Planet of Triumphs
. All of our members are working toward their goals—from a single push-up to making it to Planet Fitness twice in a week to losing hundreds of pounds. No matter what size the goal, we believe that all of these accomplishments deserve to be celebrated. Planet of Triumphs (www.PlanetofTriumphs.com) is an elevating, inspiring, Judgement Free social community of real members where all stories are welcome. Planet of Triumphs provides an online platform for members to recognize their triumphs (big and small), share their stories and encourage others, while spotlighting our unique brand belief that everyone belongs.
Membership
We make it simple for members to join, whether online or in-store—no pushy sales tactics, no pressure and no complicated rate structures. Our corporate-owned stores provide incentive compensation for store staff to successfully drive key business metrics in the service, personnel and financial categories, and we encourage our franchisees to follow our lead. Our regional managers review our corporate stores multiple times per month for quality control, including generally one visit per month during which they evaluate store cleanliness based upon internally established criteria. Our members generally pay the following amounts (or an equivalent amount in the store’s local currency):
|
•
|
monthly membership dues of only $10 for our standard membership, or approximately $21.99 for PF Black Card members;
|
|
•
|
current standard annual fees of approximately $39; and
|
|
•
|
enrollment fees of approximately $0 to $59.
|
Belonging to a Planet Fitness store has perks whether members select the standard membership or the premium PF Black Card membership. Every member gets to take part can take advantage of free pizza and bagels once a month and gets free, unlimited fitness instruction included in their monthly membership fee. Our PF Black Card members also have the right to reciprocal use of all Planet Fitness stores, can bring a friend with them each time they work out, and have access to massage beds and chairs and tanning, among other benefits. PF Black Card benefits extend beyond our store as well, with exclusive specials and discount offers
9
from third-party retail partners. While some of our memberships require a cancellation fee, we offer, and require our franchisees to offer, a non-committal membership option.
As of
December 31, 2018
, we had approximately
12.5
million members. We utilize electronic funds transfer (“EFT”) as our primary method of collecting monthly dues and annual membership fees. Over 85% of membership fee payments to our corporate-owned and franchise stores are collected via Automated Clearing House (“ACH”) direct debit. We believe there are certain advantages to receiving a higher concentration of ACH payments, as compared to credit cards payments, including less frequent expiration of billing information and reduced exposure to subjective chargeback or dispute claims and fees. Due to our scale and negotiating power, we believe that our third party payment processors offer a competitive bundle of transaction pricing and support services to our franchisees while facilitating revenue collection by us.
Our stores
We had
1,742
stores system-wide as of
December 31, 2018
, of which
1,666
were franchised and
76
were corporate-owned, located in 50 states, the District of Columbia, Puerto Rico, Canada, the Dominican Republic, Panama and Mexico. The map below shows our franchisee-owned stores by location, and the accompanying table shows our corporate-owned stores by location. Under signed ADAs, as of
December 31, 2018
, franchisees have committed to open more than 1,000 additional stores.
|
Franchisee-owned store count by location
|

Our format
Many traditional gyms include expensive add-ons such as pools, group exercise rooms, daycare facilities and juice bars that require additional maintenance expense and staffing. We have removed these unnecessary and expense-adding facilities and services and replaced them with additional cardio and strength equipment, which we believe allows us to serve more members without imposing time limits on equipment use. We believe our streamlined offerings appeal to the core needs of most gym users, especially first-time or occasional gym users.
Our stores are designed and outfitted to match our brand philosophy, with bright, bold purple and yellow color schemes and purple and yellow Planet Fitness-branded equipment and amenities. Our typical store is 20,000 square feet in single or multi-level retail space. Our stores generally include at least 75 to 100 pieces of co-branded cardio equipment, free weights, strength machines, a 30-minute circuit workout area, a small retail area and a drink cooler. For our PF Black Card members, our stores also generally feature a PF Black Card spa area with total body enhancement machines, massage beds or chairs and tanning.
10
Store model
Our store model is designed to generate attractive four-wall EBITDA margins, strong free cash flow and high returns on invested capital for both our corporate-owned and franchise stores. Based on a historical survey of franchisees and management estimates, we believe that our franchise stores achieve store-level profitability in line with our corporate-owned store base. The stores included in this survey represent those stores that voluntarily disclosed such information in response to our request, and we believe this information reflects a representative sample of franchisees based on the franchisee groups and geographic areas represented by these stores. Our average four-wall EBITDA margins for our corporate-owned stores have increased significantly since 2012, driven by higher average members per store as well as a higher percentage of PF Black Card members, which leverages our fixed costs. In
2018
, our corporate-owned stores had segment EBITDA margin of
40.9%
and had AUVs of approximately $
2.0
million with four-wall EBITDA margins of approximately
46%
, or approximately
39%
after applying the current 7% royalty rate, which includes 1.59% royalty as a result of the elimination of certain rebates and commissions that were previously paid by all stores and deducted as an expense in arriving at four wall EBITDA. We believe this to be comparable to a franchise store, under our current franchise agreement. Based on survey data and management analysis, franchisees have historically earned, and we believe can continue to earn, in their second year of operations, on average, a cash-on-cash return on unlevered (i.e., not debt-financed) initial investment greater than 25% after royalties and advertising, which is in line with our corporate-owned stores. A franchisee’s initial investment includes fitness equipment purchased from us (or from our required vendors in the case of our franchisees in international markets) as well as costs for non-fitness equipment and leasehold improvements. The attractiveness of our franchise model is further evidenced by the fact that over 90% of our new stores in
2018
were opened by our existing franchisee base. We believe that our strong store-level economics are important to our ability to attract and retain successful franchisees and grow our store base.
Fitness equipment
We provide our members with high-quality, Planet Fitness-branded fitness equipment from leading suppliers. In order to maintain a consistent experience across our store base, we stipulate specific pieces and quantities of cardio and strength-training equipment and work with franchisees to review and approve layouts and placement. Due to our scale, we are able to negotiate competitive pricing and secure extended warranties from our suppliers. As a result, we believe we offer equipment at more attractive pricing than franchisees could otherwise secure on their own.
Leases
We lease all but one of our corporate-owned stores and our corporate headquarters. Our store leases typically have initial terms of 10 years with two five-year renewal options, exercisable in our discretion. In October, 2016, we executed a lease for our current corporate headquarters at 4 Liberty Lane West, Hampton, New Hampshire, for an initial term of 15 years with one five-year renewal option, exercisable at our discretion. Our corporate headquarters serves as our base of operations for substantially all of our executive management and employees who provide our primary corporate support functions, including finance, legal, marketing, technology, real estate, development and human resources.
Franchisees own or directly lease from a third-party each Planet Fitness franchise location. We have not historically owned or entered into leases for Planet Fitness franchise stores and generally do not guarantee franchisees’ lease agreements, although we have done so in a few isolated instances.
Franchising
Franchising strategy
We rely heavily on our franchising strategy to develop new Planet Fitness stores, leveraging the ownership of entrepreneurs with specific local market expertise. As of
December 31, 2018
, there were
1,666
franchised Planet Fitness stores operated by approximately
150
franchisee groups. The majority of our existing franchise operators are multi-unit operators. As of
December 31, 2018
, 96% of all franchise stores were owned and operated by a franchisee group that owns at least three stores. However, while our largest franchisee owns 119 stores, only 24% of our franchisee groups own more than ten stores. When considering a potential franchisee, we generally evaluate the potential franchisee’s prior experience in franchising or other multi-unit businesses, history in managing profit and loss operations, financial history and available capital and financing. We generally do not permit franchisees to borrow more than 80% of the initial investment for their Planet Fitness business.
11
Area development agreements
An ADA specifies the number of Planet Fitness stores to be developed by the franchisee in a designated geographic area, and requires the franchisee to meet certain scheduled deadlines for the development and opening of each Planet Fitness store authorized by the ADA. If the franchisee meets those obligations and otherwise complies with the terms of the ADA, we agree not to, during the term of the ADA, operate or franchise new Planet Fitness stores in the designated geographic area. The franchisee must sign a separate franchise agreement with us for each Planet Fitness store developed under an ADA and that franchise agreement governs the franchisee’s right to own and operate the Planet Fitness store.
Franchise agreements
For each franchised Planet Fitness store, we enter into a franchise agreement covering standard terms and conditions. Planet Fitness franchisees are not granted an exclusive area or territory under the franchise agreement. The franchise agreement requires that the franchisee operate the Planet Fitness store at a specific location and in compliance with our standard methods of operation, including providing the services, using the vendors and selling the merchandise that we require. The typical franchise agreement has a 10-year term. Additionally, franchisees must purchase equipment from us (or our required vendors in the case of our franchisees located in international markets) and replace the fitness equipment in their stores every five to seven years and periodically refurbish and remodel their stores.
We currently require each franchisee to designate a responsible owner and an approved operator for each Planet Fitness store that will have primary management authority for that store. We require these franchisees to complete our initial and ongoing training programs, including minimum periods of classroom and on-the-job training.
Site selection and approval
Our stores are generally located in free-standing retail buildings or neighborhood shopping centers, and we consider locations in both high- and low-density markets. We seek out locations with (i) high visibility and accessibility, (ii) favorable traffic counts and patterns, (iii) availability of signage, (iv) ample parking or access to public transportation and (v) our targeted demographics. We use third-party site analytics tools that provide us with extensive demographic data and analysis that we use to review new and existing sites and markets for our corporate-owned stores and franchisees. We assess population density and drive time, current tenant mix, layout, potential competition and impact on existing Planet Fitness stores and comparative data based upon existing stores—all the way down to optimal ceiling heights and HVAC requirements. Our real estate team meets regularly to review sites for future development and follows a detailed review process to ensure each site aligns with our strategic growth objectives and critical success factors.
We help franchisees select sites and develop facilities in these stores that conform to the physical specifications for a Planet Fitness store. As part of our process to support our franchisees growth in local markets under their ADAs, we also assist them in finding real estate locations for new stores. One way we do this is by having regional real estate professionals work directly with franchisees and their real estate brokers, landlords and developers. Each franchisee is responsible for selecting a site, but must obtain site approval from us. We primarily learn of new sites in two ways. First, we have a formal site-approval submission process for landlords and franchisees. Each site submitted to us is reviewed by a subcommittee of our real estate team for brand qualifications. Second, we proactively review real estate portfolios for appropriate sites that we may consider for corporate-owned stores or franchisee development, depending upon location.
We are also involved in real estate organizations such as the International Council of Shopping Centers (ICSC), a trade organization for the international shopping center industry. Our membership in ICSC allows us to gather data, meet prospective landlords and further enhance our reputation as a desired tenant for shopping centers.
Design and construction
Once we have approved a franchisee’s site selection, we assist in the design and layout of the store and track the franchisee’s progress from lease signing to grand opening. Franchisees are offered the assistance of our franchise support team to track key milestones, coordinate with vendors and make equipment purchases. Certain Planet Fitness brand elements are required to be incorporated into every new store, and we strive for a consistent appearance across all of our stores, emphasizing clean, attractive facilities, including full-size locker rooms, and modern equipment. Franchisees must abide by our standards related to fixtures, finishes and design elements, including distinctive touches such as our “Lunk” alarm. We believe these elements are critical to ensure brand consistency and member experience system-wide.
In 2018 and 2017, based on a sample of U.S. franchisee data, we believe construction of franchise stores averaged approximately 14 weeks. We sampled construction costs to build new stores from across a wide range of U.S. geographies, 56 and 49 new stores, in 2018 and 2017, respectively. Based upon these samples, franchisees’ unlevered (i.e., not debt-financed) investment to open a new store ranged from approximately $1.4 million to $3.2 million and $1.5 million to $3.2 million, based upon our samples in
12
2018 and 2017, respectively. These amounts include fitness equipment purchased from us as well as costs for non-fitness equipment and leasehold improvements and is based in part upon data we received from four general contractors that oversaw the construction of the stores in the sample set. Additionally, these amounts include an estimate of other costs that are typically paid by the franchisee and not managed by the general contractor. These amounts can vary significantly depending on a number of factors, including landlord allowances for tenant improvements and construction costs from different geographies and does not necessarily represent the total construction costs on a cash basis.
Franchisee support
We live and breathe the motto
One Team, One Planet
in our daily interactions with franchisees. Our franchise model is streamlined and easy-to-operate, with efficient staffing and minimal inventory, and is supported by an active, engaged franchise operations system. We provide our franchisees with operational support, marketing materials and training resources. Our strong and long-lasting partnership with our franchisees is reflected in the fact that over 90% of our new stores in
2018
were opened by our existing franchisee base.
Training
. We continue to update and expand, Planet Fitness University, a comprehensive training resource to help franchisees operate successful stores. Courses are delivered online, and content focuses on customer service, operational policies, brand standards, cleanliness, security awareness, crisis management and vendor product information. The core online curriculum is offered in both English and Spanish to support our Spanish-speaking team members. We regularly add and improve the content available on Planet Fitness University as a no-cost service to help enhance training programs for franchisees. Additional training opportunities offered to our franchisees include new owner orientation, operations training and workshops held at Planet Fitness headquarters, in stores and through regularly held webinars.
Operational support and communication
. We believe spending quality time with our franchisees in person is an important opportunity to further strengthen our relationships and share best practices. We have dedicated operations and marketing teams providing ongoing support to franchisees. We are hands on—we often attend franchisees’ presales and grand openings, and we host franchisee meetings each year, known as “PF Huddles.” We also communicate regularly with our entire franchisee base to keep them informed, and we host a franchise conference approximately every 18 months that is geared towards franchisees and their operations teams.
We regularly communicate with the franchisee advisory groups described below and send a weekly email communication to all franchisees with timely “news you can use” information related to operations, marketing, financing and equipment. Every month, a franchisee newsletter is sent to all franchisees, which includes a personal letter from our Chief Executive Officer, important updates on the business and benchmarking reports.
Franchisee relations
. Because our ability to execute our strategy is dependent upon the strength of our relationships with our franchisees, we maintain an ongoing dialogue and strong relationship with two franchise advisory groups, the Franchise Advisory Council (“FAC”) and the Planet Fitness Independent Franchise Association (“PFIFA”). The FAC includes seven franchisees elected by the franchisee base and numerous committees consisting of approximately 40 franchisees. The FAC and its committees provide feedback and input on major brand initiatives,
new product and service introductions, technology initiatives, marketing programs and advertising campaigns. FAC leaders have regular dialogue with our executive team and work closely with us to advise on major initiatives impacting the brand. Our strong culture of working together is the driving force behind all we do. In 2014, in cooperation with us, our franchisees also organized PFIFA.
Compliance with brand standards—Franchise Business Coach
We have a dedicated field support team of franchise business coaches focused on ensuring that our franchise stores adhere to brand standards and providing ongoing assistance, training and coaching to all franchisees. We generally perform a site visit and operations review on each franchise store within 30 to 60 days of opening, and each franchise ownership group is visited at least once per year in multiple locations, for a business review with their franchise business coach thereafter.
We perform store reviews based on a wide range of criteria ranging from cleanliness to brand compliance, layout requirements and operational standards. We record the results of each visit and automatically send a report to the appropriate franchisee. Results are also available to the franchisee through our systems, which provide access to regional and international benchmarking data, allowing franchisees to compare overall results among their peers as well as results based upon each criterion. Stores that do not receive a passing score are automatically flagged for follow-up by our team, are provided with an action plan for the franchisee to complete and will generally be reevaluated within 30 to 60 days to ensure all identified issues have been addressed. The system also enables franchisees to perform, track and benchmark self-assessments and online member surveys.
13
We also use mystery shoppers to perform anonymous reviews of franchise stores. We generally select franchise stores for review randomly but also target underperforming stores and stores that have not performed well on previous visits from their franchise business coach.
Marketing
Marketing strategy
Our marketing strategy is anchored by our key brand differentiators—the Judgement Free Zone, our exceptional value and our high-quality experience. We are well known for our memorable and creative advertising, which not only drives membership sales, but also showcases our brand philosophy, humor and innovation in the industry. We see Planet Fitness as a community gathering place, and the heart of our marketing strategy is to create a welcoming community for our members.
Marketing spending
National advertising
. We support our franchisees both at a national and local level. We manage the U.S. NAF and Canadian advertising fund for franchisees and corporate-owned stores, with the goals of generating national awareness through national advertising and media partnerships, developing and maintaining creative assets to support local sale periods throughout the year, and building and supporting the Planet Fitness community via digital, social media and public relations. Our current U.S. and Canadian franchise agreement requires franchisees to contribute 2% of their monthly EFT to the NAF and Canadian advertising fund, respectively. Since the U.S. NAF was founded in September 2011, it has enabled us to spend
approximately $185.8 million to increase national brand awareness, including $44.8 million in
2018
, $2.2 million of which is from our corporate-owned stores and included in store-operations expense on the consolidated statements of operations. We believe this is a powerful marketing tool as it allows us to increase brand awareness in new and existing markets.
Local marketing
. Our current franchise agreement requires franchisees to spend 7% of their monthly EFT on local marketing to support branding efforts and promotional sale periods throughout the year. In situations where multiple ownership groups exist in a geographic area, we have the ability to require franchisees to form or join regional marketing cooperatives to maximize the impact of their marketing spending. Our corporate-owned stores contribute to, and participate in, regional marketing cooperatives with franchisees where practical. All franchise stores are supported by our dedicated franchisee marketing team, which provides guidance, tracking, measurement and advice on best practices. Franchisees spend their marketing dollars in a variety of ways to promote business at their stores on a local level. These methods typically include media vehicles that are effective on a local level, including direct mail, outdoor (including billboards), television, radio and digital advertisements and local partnerships and sponsorships.
Media partnerships
Given our scale and marketing resources through our national advertising fund, we have aligned ourselves with high-profile media partners who have helped to extend the global reach of our brand. For the past four years, we have been the presenting sponsor of “Dick Clark’s New Year’s Rockin’ Eve with Ryan Seacrest.” This has allowed us to showcase the Planet Fitness brand and our judgement-free philosophy to over a billion TV viewers annually at a key time of year when health and wellness is top of mind for consumers.
Judgement Free Generation
The Judgement Free Generation is Planet Fitness’ philanthropic initiative designed to combat the judgement and bullying faced by today’s youth by creating a culture of kindness and encouragement. With our Judgement Free Zone principle as a solid foundation, The Judgement Free Generation aims to empower a generation to grow up contributing to a more judgement free planet— a place where everyone feels accepted and like they belong.
We have partnered with Boys & Girls Clubs of America, PACER National Bullying Prevention Center and STOMP Out Bullying, to make a meaningful impact on the lives of today's youth. Together with our franchisees and vendors, Planet Fitness has donated approximately $4.5 million to support anti-bullying, pro-kindness initiatives.
Competition
In a broad sense, because many of our members are first-time or occasional gym users, we believe we compete with both fitness and non-fitness consumer discretionary spending alternatives for members’ and prospective members’ time and discretionary resources.
To a great extent, we also compete with other industry participants, including:
14
|
•
|
other fitness centers;
|
|
•
|
recreational facilities established by non-profit organizations such as YMCAs and by businesses for their employees;
|
|
•
|
private studios and other boutique fitness offerings;
|
|
•
|
racquet, tennis and other athletic clubs;
|
|
•
|
amenity and condominium/apartment clubs;
|
|
•
|
country clubs;
|
|
•
|
online personal training and fitness coaching;
|
|
•
|
the home-use fitness equipment industry;
|
|
•
|
local tanning salons; and
|
|
•
|
businesses offering similar services
.
|
The health club industry is highly competitive and fragmented, and the number, size and strength of competitors vary by region. Some of our competitors have name recognition in their respective countries or an established presence in local markets, and some are established in markets in which we have existing stores or intend to locate new stores. These risks are more significant internationally, where we have a limited number of stores and limited brand recognition.
We compete primarily based upon the membership value proposition we are able to offer due to our significant economies of scale, high-quality fitness experience, judgement-free atmosphere and superior customer service, all at an attractive value, which we believe differentiates us from our competitors.
Our competition continues to increase as we continue to expand into new markets and add stores in existing markets. See also “Risk Factors—Risks related to our business and industry—The high level of competition in the health and fitness industry could materially and adversely affect our business.”
Suppliers
Franchisees are required to purchase fitness equipment from us (or our required vendors in the case of franchisees located in international markets) and are required to purchase various other items from vendors that we approve. We sell equipment purchased from third-party equipment manufacturers to franchise stores in the U.S. We also have one approved supplier of tanning beds, one approved supplier of massage beds and chairs, and various approved suppliers of non-fitness equipment and miscellaneous items. These vendors arrange for delivery of products and services directly to franchise stores. From time to time, we re-evaluate our supply relationships to ensure we obtain competitive pricing and high-quality equipment and other items.
Employees
As of
December 31, 2018
, we employed 1,052 employees at our corporate-owned stores and 250 employees at our corporate headquarters located at 4 Liberty Lane West, Hampton, New Hampshire. None of our employees are represented by labor unions, and we believe we have an excellent relationship with our employees.
Planet Fitness franchises are independently owned and operated businesses. As such, employees of our franchisees are not employees of the Company.
Information technology and systems
All stores use a computerized, third-party hosted store management system to process new in-store memberships, bill members, update member information, check-in members, process point of sale transactions as well as track and analyze sales, membership statistics, cross-store utilization, member tenure, amenity usage, billing performance and demographic profiles by member. Our websites are hosted by third parties, and we also rely on third-party vendors for related functions such as our system for processing and integrating new online memberships, updating member information and making online payments. We believe these systems are scalable to support our growth plans.
Our back-office computer systems are comprised of a variety of technologies designed to assist in the management and analysis of our revenues, costs and key operational metrics as well as support the daily operations of our headquarters. These include third-party hosted systems that support our real estate and construction processes, a third-party hosted financial system, a third-party hosted data warehouse and business intelligence system to consolidate multiple data sources for reporting, advanced analysis, and
15
financial analysis and forecasting, a third-party hosted payroll system, on premise telephony systems and a third-party hosted call center software solution to manage and track member-related requests.
We also provide our franchisees access to a web-based, third-party hosted custom franchise management system to receive informational notices, operational resources and updates, training materials and other franchisee communications. In
2018
we continued our multi-phased project that we started in 2015 to replace our existing franchise management system and consolidate several back-office systems, onto a third-party hosted platform to drive greater cross-system integration and efficiency and provide a scalable platform to support our growth plans. We expect to continue investing resources in 2019 through smaller, focused projects for our franchise management system to support the changing needs of our business.
In 2018, we engaged with a third-party software development vendor to develop a new, custom digital platform, which, through the exchange of data and introduction of digital products and services, facilitates digital experiences across any digital channel, including mobile, online, and in-store media. This platform is hosted by third parties and we rely on third-party vendors to maintain the platform and develop new digital capabilities. This solution will increasingly enable our ability to provide differentiated and unique experiences to our customers, allow for various partnership types and is aligned with our ongoing business strategy.
We recognize the value of enhancing and extending the uses of information technology in virtually every area of our business. Our information technology strategy is aligned to support our business strategy and operating plans. We maintain an ongoing comprehensive multi-year program to replace or upgrade key systems, enhance security and optimize their performance.
Intellectual property
We own many registered trademarks and service marks in the U.S. and in other countries, including “Planet Fitness,” “Judgement Free Zone,” “PE@PF,” “No Lunks,” “PF Black Card,” “No Gymtimidation,” “You Belong,” “Judgement Free Generation” and various other marks. We believe the Planet Fitness name and the many distinctive marks associated with it are of significant value and are very important to our business. Accordingly, as a general policy, we pursue registration of our marks in select international jurisdictions, monitor the use of our marks in the U.S. and internationally and challenge any unauthorized use of the marks.
We license the use of our marks to franchisees, third-party vendors and others through franchise agreements, vendor agreements and licensing agreements. These agreements typically restrict third parties’ activities with respect to use of the marks and impose brand standards requirements. We require licensees to inform us of any potential infringement of the marks.
We register some of our copyrighted material and otherwise rely on common law protection of our copyrighted works. Such copyrighted materials are not material to our business.
We also license some intellectual property from third parties for use in our stores but such licenses are not material to our business.
Government regulation
We and our franchisees are subject to various federal, international, state, provincial and local laws and regulations affecting our business.
We are subject to the FTC Franchise Rule promulgated by the FTC that regulates the offer and sale of franchises in the U.S. and its territories (including Puerto Rico) and requires us to provide to all prospective franchisees certain mandatory disclosure in a franchise disclosure document (“FDD”). In addition, we are subject to state franchise registration and disclosure laws in approximately 14 states that regulate the offer and sale of franchises by requiring us, unless otherwise exempt, to register our franchise offering in those states prior to our making any offer or sale of a franchise in those states and to provide a FDD to prospective franchisees in accordance with such laws.
We are subject to franchise registration and disclosure laws in six provinces in Canada that regulate the offer and sale of franchises by requiring us, unless otherwise exempt, to register our franchise offering in those provinces in a prescribed format to prospective franchisees in accordance with such laws, and that regulate certain aspects of the franchise relationship. We are also subject to franchise relationship laws in approximately 20 states that regulate many aspects of the franchise relationship including, depending upon the state, renewals and terminations of franchise agreements, franchise transfers, the applicable law and venue in which franchise disputes may be resolved, discrimination, and franchisees’ rights to associate, among others. In addition, we and our franchisees may also be subject to laws in other foreign countries where we or they do business.
We and our franchisees are also subject to the U.S. Fair Labor Standards Act of 1938, as amended, similar state laws in certain jurisdictions, and various other U.S. and international laws governing such matters as minimum-wage requirements, overtime and other working conditions. Based on our experience with hiring employees and operating stores, we believe a significant number
16
of our and our franchisees’ employees are paid at rates related to the U.S. federal or state minimum wage, and past increases in the U.S. federal and/or state minimum wage have increased labor costs, as would future increases.
Our and our franchisees’ operations and properties are subject to extensive U.S. federal and state, as well as international, provincial and local laws and regulations, including those relating to environmental, building and zoning requirements. Our and our franchisees’ development of properties depends to a significant extent on the selection and acquisition of suitable sites, which are subject to zoning, land use, environmental, traffic and other regulations and requirements.
We and our franchisees are responsible at each of our respective locations for compliance with U.S. state laws, Canadian provincial laws and other international local laws that regulate the relationship between health clubs and their members. Nearly all states and provinces have consumer protection regulations that limit the collection of monthly membership dues prior to opening, require certain disclosures of pricing information, mandate the maximum length of contracts and “cooling off” periods for members (after the purchase of a membership), set escrow and bond requirements for health clubs, govern member rights in the event of a member relocation or disability, provide for specific member rights when a health club closes or relocates, or preclude automatic membership renewals.
We and our franchisees primarily accept payments for our memberships through EFTs from members’ bank accounts, and, therefore, we and our franchisees are subject to federal, state and international laws legislation and certification requirements, including the Electronic Funds Transfer Act. Some states and provinces have passed or have considered legislation requiring gyms and health clubs to offer a prepaid membership option at all times and/or limit the duration for which memberships can auto-renew through EFT payments, if at all. Our business relies heavily on the fact that our memberships continue on a month-to-month basis after the completion of any initial term requirements, and compliance with these laws, regulations, and similar requirements may be onerous and expensive, and variances and inconsistencies from jurisdiction to jurisdiction may further increase the cost of compliance and doing business. States that have such health club statutes provide harsh penalties for violations, including membership contracts being void or voidable.
Additionally, the collection, maintenance, use, disclosure and disposal of personally identifiable data by our, or our franchisees’, businesses are regulated at the federal, state and international levels as well as by certain financial industry groups, such as the Payment Card Industry, Security Standards Council, the National Automated Clearing House Association (“NACHA”) and the Canadian Payments Association. Federal, state, international and financial industry groups may also consider from time to time new privacy and security requirements that may apply to our businesses and may impose further restrictions on our collection, disclosure, use, and disposal of personally identifiable information that are housed in one or more of our databases. These security requirements and further restrictions, including the General Data Protection Regulation (GDPR) and the California Consumer Privacy Act (CCPA), grant protections and causes of action related to consumer data privacy and the methods in which it is collected, stored, used, and disposed by us, our franchisees, and applicable third parties.
Many of the states and provinces where we and our franchisees operate stores have health and safety regulations that apply to health clubs and other facilities that offer indoor tanning services. In addition, U.S. federal law imposes a 10% excise tax on indoor tanning services. Under the rule promulgated by the IRS imposing the tax, a portion of the cost of memberships that include access to our tanning services are subject to the tax.
Our organizational structure
Planet Fitness, Inc. is a holding company, and its principal asset is an equity interest in the membership units (“Holdings Units”) in Pla-Fit Holdings, LLC (“Pla-Fit Holdings”).
We are the sole managing member of Pla-Fit Holdings. We operate and control all of the business and affairs of Pla-Fit Holdings, and we hold 100% of the voting interest in Pla-Fit Holdings. As a result, we consolidate Pla-Fit Holdings’ financial results and report a non-controlling interest related to the Holdings Units not owned by us. See Note 1 to the consolidated financial statements included in Part II, Item 8 for more information.
Available information
Our website address is www.planetfitness.com, and our investor relations website is located at http://investor.planetfitness.com. Information on our website is not incorporated by reference herein. Copies of our annual reports on Form 10-K, quarterly reports on Form 10-Q, current reports on Form 8-K and our Proxy Statements for our annual meetings of shareholders, and any amendments to those reports, as well as Section 16 reports filed by our insiders, are available free of charge on our website as soon as reasonably practicable after we file the reports with, or furnish the reports to, the Securities and Exchange Commission (the “SEC”).The SEC maintains an Internet site (http://www.sec.gov) containing reports, proxy and information statements, and other information regarding issuers that file electronically with the SEC.
17
Item 1A. Risk Factors.
We could be adversely impacted by various risks and uncertainties. If any of these risks actually occurs, our business, financial condition, operating results, cash flow and prospects may be materially and adversely affected. As a result, the trading price of our Class A common stock could decline.
Risks related to our business and industry
Our financial results are affected by the operating and financial results of, and our relationships with, our franchisees.
A substantial portion of our revenues come from royalties, which are generally based on a percentage of monthly membership dues and annual fees at our franchise stores or, in certain cases, a sliding scale based on monthly membership dues, other fees and commissions generated from activities associated with our franchisees, and equipment sales to our franchisees. As a result, our financial results are largely dependent upon the operational and financial results of our franchisees. As of
December 31, 2018
, we had approximately
150
franchisee groups operating
1,742
stores. Negative economic conditions, including recession, inflation, increased unemployment levels and the effect of decreased consumer confidence or changes in consumer behavior, could materially harm our franchisees’ financial condition, which would cause our royalty and other revenues to decline and materially and adversely affect our results of operations and financial condition as a result. In addition, if our franchisees fail to renew their franchise agreements, these revenues may decrease, which in turn could materially and adversely affect our results of operations and financial condition.
Our franchisees could take actions that harm our business.
Our franchisees are contractually obligated to operate their stores in accordance with the operational, safety and health standards set forth in our agreements with them. However, franchisees are independent third parties, and their actions are outside of our control. In addition, we cannot be certain that our franchisees will have the business acumen or financial resources necessary to operate successful franchises in their approved locations, and certain state franchise laws may limit our ability to terminate or modify these franchise agreements. The franchisees own, operate and oversee the daily operations of their stores. As a result, the ultimate success and quality of any franchise store rests with the franchisee. If franchisees do not successfully operate stores in a manner consistent with required standards and comply with local laws and regulations, franchise fees and royalties paid to us may be adversely affected, and our brand image and reputation could be harmed, which in turn could materially and adversely affect our results of operations and financial condition.
Although we believe we generally maintain positive working relationships with our franchisees, disputes with franchisees could damage our brand image and reputation and our relationships with our franchisees generally.
Our success depends substantially on the value of our brand.
Our success is dependent in large part upon our ability to maintain and enhance the value of our brand, our store members’ connection to our brand and a positive relationship with our franchisees. Brand value can be severely damaged even by isolated incidents, particularly if the incidents receive considerable negative publicity or result in litigation. Some of these incidents may relate to our policies, the way we manage our relationships with our franchisees, our growth strategies, our development efforts or the ordinary course of our, or our franchisees’, businesses. Other incidents that could be damaging to our brand may arise from events that are or may be beyond our ability to control, such as:
|
•
|
actions taken (or not taken) by one or more franchisees or their employees relating to health, safety, welfare or otherwise;
|
|
•
|
data security breaches or fraudulent activities associated with our and our franchisees’ electronic payment systems;
|
|
•
|
litigation and legal claims;
|
|
•
|
third-party misappropriation, dilution or infringement or other violation of our intellectual property;
|
|
•
|
regulatory, investigative or other actions relating to our and our franchisees’ provision of indoor tanning services;
|
|
•
|
illegal activity targeted at us or others; and
|
|
•
|
conduct by individuals affiliated with us which could violate ethical standards or otherwise harm the reputation of our brand.
|
Consumer demand for our stores and our brand’s value could diminish significantly if any such incidents or other matters erode consumer confidence in us or our stores, which would likely result in fewer memberships sold or renewed and, ultimately, lower royalty revenue, which in turn could materially and adversely affect our results of operations and financial condition.
18
If we fail to successfully implement our growth strategy, which includes new store development by existing and new franchisees, our ability to increase our revenues and operating profits could be adversely affected.
Our growth strategy relies in large part upon new store development by existing and new franchisees. Our franchisees face many challenges in opening new stores, including:
|
•
|
availability and cost of financing;
|
|
•
|
selection and availability of suitable store locations;
|
|
•
|
competition for store sites;
|
|
•
|
negotiation of acceptable lease and financing terms;
|
|
•
|
securing required domestic or foreign governmental permits and approvals;
|
|
•
|
health and fitness trends in new geographic regions and acceptance of our offerings;
|
|
•
|
employment, training and retention of qualified personnel;
|
|
•
|
ability to open new stores during the timeframes we and our franchisees expect; and
|
|
•
|
general economic and business conditions.
|
In particular, because the majority of our new store development is funded by franchisee investment, our growth strategy is dependent on our franchisees’ (or prospective franchisees’) ability to access funds to finance such development. If our franchisees (or prospective franchisees) are not able to obtain financing at commercially reasonable rates, or at all, they may be unwilling or unable to invest in the development of new stores, and our future growth could be adversely affected.
Our growth strategy also relies on our ability to identify, recruit and enter into agreements with a sufficient number of franchisees. In addition, our ability and the ability of our franchisees to successfully open and operate new stores in new or existing markets may be adversely affected by a lack of awareness or acceptance of our brand, as well as a lack of existing marketing efforts and operational execution in these new markets. To the extent that we are unable to implement effective marketing and promotional programs and foster recognition and affinity for our brand in new domestic and international markets, our and our franchisees’ new stores may not perform as expected and our growth may be significantly delayed or impaired. In addition, franchisees of new stores may have difficulty securing adequate financing, particularly in new markets, where there may be a lack of adequate history and brand familiarity. New stores may not be successful or our average store membership sales may not increase at historical rates, which could materially and adversely affect our business, results of operations and financial condition.
To the extent our franchisees are unable to open new stores as we anticipate, we will not realize the revenue growth that we hope or expect. Our failure to add a significant number of new stores would adversely affect our ability to increase our revenues and operating income and could materially and adversely affect our business, results of operations and financial condition.
Economic, political and other risks associated with our international operations could adversely affect our profitability and international growth prospects.
We currently have stores operating in certain other countries around the world, including Canada, the Dominican Republic, Panama and Mexico. Our international operations are subject to a number of risks inherent to operating in foreign countries, and any expansion of our international operations will increase the impact of these risks. These risks include, among others:
|
•
|
inadequate brand infrastructure within foreign countries to support our international activities;
|
|
•
|
inconsistent regulation or sudden policy changes by foreign agencies or governments;
|
|
•
|
the collection of royalties from foreign franchisees;
|
|
•
|
difficulty of enforcing contractual obligations of foreign franchisees;
|
|
•
|
increased costs in maintaining international franchise and marketing efforts;
|
|
•
|
problems entering international markets with different cultural bases and consumer preferences;
|
|
•
|
political and economic instability of foreign markets;
|
|
•
|
compliance with laws and regulations applicable to international operations, such as the Foreign Corrupt Practices Act and regulations promulgated by the Office of Foreign Asset Control;
|
|
•
|
fluctuations in foreign currency exchange rates; and
|
|
•
|
operating in new, developing or other markets in which there are significant uncertainties regarding the interpretation, application and enforceability of laws and regulations relating to contract and intellectual property rights.
|
19
As a result, those new stores may be less successful than stores in our existing markets. Further, effectively managing growth can be challenging, particularly as we continue to expand into new international markets where we must balance the need for flexibility and a degree of autonomy for local management against the need for consistency with our mission and standards.
Our planned growth could place strains on our management, employees, information systems and internal controls, which may adversely impact our business.
Over the past several years, we have experienced growth in our business activities and operations, including a significant increase in the number of system-wide stores. Our past expansion has placed, and our planned future expansion may place, significant demands on our administrative, operational, financial and other resources. Any failure to manage growth effectively could seriously harm our business. To be successful, we will need to continue to implement management information systems and improve our operating, administrative, financial and accounting systems and controls. We will also need to train new employees and maintain close coordination among our executive, accounting, finance, legal, human resources, risk management, marketing, technology, sales and operations functions. These processes are time-consuming and expensive, increase management responsibilities and divert management attention, and we may not realize a return on our investment in these processes. In addition, we believe the culture we foster at our and our franchisees’ stores is an important contributor to our success. However, as we expand we may have difficulty maintaining our culture or adapting it sufficiently to meet the needs of our operations. These risks may be heightened as our growth accelerates. In
2018
, our franchisees opened 226 stores, compared to 206 stores in
2017
, 195 stores in
2016
, and 206 stores in
2015
. Our failure to successfully execute on our planned expansion of stores could materially and adversely affect our results of operations and financial condition.
The high level of competition in the health and fitness industry could materially and adversely affect our business.
We compete with the following industry participants: other health and fitness clubs; physical fitness and recreational facilities established by non-profit organizations and businesses for their employees; private studios and other boutique fitness offerings; racquet, tennis and other athletic clubs; amenity and condominium/apartment clubs; country clubs; online personal training and fitness coaching; the home-use fitness equipment industry; local tanning salons; businesses offering similar services; and other businesses that rely on consumer discretionary spending. We may not be able to compete effectively in the markets in which we operate. Competitors may attempt to copy our business model, or portions thereof, which could erode our market share and brand recognition and impair our growth rate and profitability. Competitors, including companies that are larger and have greater resources than us, may compete with us to attract members in our markets. Non-profit organizations in our markets may be able to obtain land and construct stores at a lower cost and collect membership dues and fees without paying taxes, thereby allowing them to charge lower prices. Luxury fitness companies may attempt to enter our market by lowering prices or creating lower price brand alternatives. Furthermore, due to the increased number of low-cost health and fitness club alternatives, we may face increased competition if we increase our price or if discretionary spending declines. This competition may limit our ability to attract and retain existing members and our ability to attract new members, which in each case could materially and adversely affect our results of operations and financial condition.
Changes in the industry could place strains on our management, employees, information systems and internal controls, which may adversely impact our business.
Changes in the industry affecting gym memberships and payment for gym memberships may place significant demands on our administrative, operational, financial and other resources or require us to obtain different or additional resources. Any failure to manage such changes effectively could adversely affect our business. To be successful, we will need to continue to implement management information systems and improve our operating, administrative, financial and accounting systems and controls in order to adapt quickly to such changes. These changes may be time-consuming and expensive, increase management responsibilities and divert management attention, and we may not realize a return on our investment in these changes.
We and our franchisees rely heavily on information systems, and any material failure, interruption or weakness may prevent us from effectively operating our business and damage our reputation.
We and our franchisees increasingly rely on information systems, including point-of-sale processing systems in our stores and other information systems managed by third parties, to interact with our franchisees and members and collect, maintain and store member information, billing information and other personally identifiable information, including for the operation of stores, collection of cash, legal and regulatory compliance, management of our supply chain, accounting, staffing, payment of obligations, ACH transactions, credit and debit card transactions and other processes and procedures. Furthermore, in 2015, we migrated our point-of-sale system from a proprietary, third-party hosted system to a commercially available, third-party hosted system. Although the migration is complete, in the future there may be unforeseen issues, bugs, data inconsistencies, outages, changes in business processes, and other interruptions that could adversely impact our business. In 2017, we also engaged a new third-party point-of-sale provider partner for stores in the Dominican Republic, Panama and Mexico. If we need to move to different third-party systems, our operations, including EFT drafting, could be interrupted. Our ability to efficiently and effectively manage our
20
franchisee and corporate-owned stores depends significantly on the reliability and capacity of these systems, and any potential failure of these third parties to provide quality uninterrupted service is beyond our control. In 2018, we engaged with a new third-party software development company to develop a digital platform, which through data, facilitates digital experiences across digital channels, including mobile, online, and in-club media. If we need to move to a different partner to develop and maintain this platform, or if the partner's ability to provide its services is reduced, our operations could be interrupted. Additionally, this platform is built on commercial cloud computing platforms and depends on the internet, internet providers, and cloud computing providers to deliver ongoing services, the interruption of which could disrupt our operations.
Our and our franchisees’ operations depend upon our ability, and the ability of our franchisees and third-party service providers (as well as their third-party service providers), to protect our computer equipment and systems against damage from physical theft, fire,
power loss, telecommunications failure or other catastrophic events, as well as from internal and external security breaches, viruses, denial-of-service attacks and other disruptions. The failure of these systems to operate effectively, stemming from maintenance problems, upgrading or transitioning to new platforms, expanding our systems as we grow, a breach in security or other unanticipated problems could result in interruptions to or delays in our business and member service and reduce efficiency in our operations. In addition, the implementation of technology changes and upgrades to maintain current and integrate new systems may also cause service interruptions, operational delays due to the learning curve associated with using a new system, transaction processing errors and system conversion delays and may cause us to fail to comply with applicable laws. If our information systems, or those of our franchisees and third-party service providers (as well as their third-party service providers), fail and our or our partners’ third-party back-up or disaster recovery plans are not adequate to address such failures, our revenues and profits could be reduced and the reputation of our brand and our business could be materially and adversely affected.
If we fail to properly maintain the confidentiality and integrity of our data, including member credit card, debit card and bank account information, our reputation and business could be materially and adversely affected.
In the ordinary course of business, we and our franchisees collect, transmit and store member and employee data, including credit and debit card numbers, bank account information, driver’s license numbers, dates of birth and other highly sensitive personally identifiable information, in information systems that we maintain and in those maintained by franchisees and third parties with whom we contract to provide services. Some of this data is sensitive and could be an attractive target of a criminal attack by malicious third parties with a wide range of motives and expertise, including lone wolves, organized criminal groups, “hacktivists,” disgruntled current or former employees, and others. The integrity and protection of member and employee data is critical to us.
Despite the security measures we have in place to comply with applicable laws and rules, our facilities and systems, and those of our franchisees and third-party service providers (as well as their third-party service providers), may be vulnerable to security breaches, acts of cyber terrorism or sabotage, vandalism or theft, computer viruses, loss or corruption of data, programming or human errors or other similar events. Furthermore, the size and complexity of our information systems, and those of our franchisees and our third-party vendors (as well as their third-party service providers), make such systems potentially vulnerable to security breaches from inadvertent or intentional actions by our employees, franchisees or vendors, or from attacks by malicious third parties. Because such attacks are increasing in sophistication and change frequently in nature, we, our franchisees and our third-party service providers may be unable to anticipate these attacks or implement adequate preventative measures, and any compromise of our systems, or those of our franchisees and third-party vendors (as well as their third-party service providers), may not be discovered and remediated promptly. Changes in consumer behavior following a security breach or perceived security breach, act of cyber terrorism or sabotage, vandalism or theft, computer viruses, loss or corruption of data or programming or human error or other similar event affecting a competitor, large retailer or financial institution may materially and adversely affect our business.
Additionally, the handling of personally identifiable information by our, or our franchisees’, businesses are regulated at the federal, state and international levels as well as by certain industry groups, such as the Payment Card Industry Security Standards Council, NACHA, Canadian Payments Association and individual credit card issuers. Federal, state, international and industry groups may also consider and implement from time to time new privacy and security requirements that apply to our businesses. Compliance with contractual obligations and evolving privacy and security laws, requirements and regulations may result in cost increases due to necessary systems changes, new limitations or constraints on our business models and the development of new administrative processes. They also may impose further restrictions on our handling of personally identifiable information that are housed in one or more of our, or our franchisees’ databases, or those of our third-party service providers. Noncompliance with privacy laws or industry group requirements or a security breach or perceived non-compliance or security breach involving the misappropriation, loss or other unauthorized disclosure of personal, sensitive or confidential information, whether by us or by one of our franchisees or vendors, could have material adverse effects on our and our franchisees’ business, operations, brand, reputation and financial condition, including decreased revenue, material fines and penalties, litigation, increased financial processing fees, compensatory, statutory, punitive or other damages, adverse actions against our licenses to do business and injunctive relief by court or consent order. Despite our efforts, the handling of personally identifiable information may not be in compliance with applicable law, or this information could be disclosed or lost due to a hacking event or unauthorized access to our information system, or through publication or improper disclosure, any of which could affect the value of our brand. We maintain and we require our franchisees
21
to maintain cyber risk insurance, but in the event of a significant data security breach, this insurance may not cover all of the losses that we would be likely to suffer.
The occurrence of cyber incidents, or a deficiency in cybersecurity, could negatively impact our business by causing a disruption to our operations, a compromise or corruption of confidential information, and/or damage to our employee and business relationships and reputation, all of which could harm our brand and our business.
We could be subject to a cyber incident or other adverse event that threatens the confidentiality, integrity or availability of information resources, including intentional attacks or unintentional events where parties gain unauthorized access to systems to disrupt operations, corrupt data or steal confidential information about customers, franchisees, vendors and employees. A number of retailers and other companies have recently experienced serious cyber incidents and breaches of their information technology systems. As our reliance on technology has increased, so have the risks posed to our systems, both internal and those we have outsourced. The three primary risks that could directly result from the occurrence of a cyber incident include operational interruption, damage to the relationship with members and private data exposure, which each in turn could create additional risks and exposure. We maintain insurance coverage to address cyber incidents, and have also implemented processes, procedures and controls to help mitigate these risks; however, these measures do not guarantee that our reputation and financial results will not be adversely affected by such an incident.
Because our franchisees accept electronic forms of payment from its customers, our business requires the collection and retention of customer data, including credit and debit card numbers and other personally identifiable information in various information systems that we and our franchisees maintain and in those maintained by third parties with whom we and our franchisees contract to provide credit card processing. We also maintain important internal company data, such as personally identifiable information about our employees and franchisees and information relating to our operations. Our use of personally identifiable information is regulated by foreign, federal and state laws, as well as by certain third-party agreements. As privacy and information security laws and regulations and contractual obligations with third parties evolve, we may incur additional costs to ensure that we remain in compliance with those laws and regulations and contractual obligations. If our security and information systems are compromised or if our employees or franchisees fail to comply with these laws, regulations, or contract terms, and this information is obtained by unauthorized persons or used inappropriately, it could adversely affect our reputation and could disrupt our operations and result in costly litigation, judgments, or penalties arising from violations of federal and state laws and payment card industry regulations.
Under certain laws, regulations and contractual obligations, a cyber incident could also require us to notify customers, employees or other groups of the incident or could result in adverse publicity, loss of sales and profits, or an increase in fees payable to third parties. We could also incur penalties or remediation and other costs that could adversely affect the operation of its business and results of operations.
Changes in legislation or requirements related to electronic fund transfer, or our failure to comply with existing or future regulations, may materially and adversely impact our business.
We primarily accept payments for our memberships through electronic fund transfers from members’ bank accounts and, therefore, we are subject to federal, state and international legislation and certification requirements governing EFT, including the Electronic Funds Transfer Act. Some states have passed or have considered legislation requiring gyms and health clubs to offer a prepaid membership option at all times and/or limit the duration for which gym memberships can auto-renew through EFT payments, if at all. Our business relies heavily on the fact that our memberships continue on a month-to-month basis after the completion of any initial term requirements, and compliance with these laws and regulations and similar requirements may be onerous and expensive. In addition, variances and inconsistencies from jurisdiction to jurisdiction may further increase the cost of compliance and doing business. States that have such health club statutes provide harsh penalties for violations, including membership contracts being void or voidable. Our failure to comply fully with these rules or requirements may subject us to fines, higher transaction fees, penalties, damages and civil liability and may result in the loss of our ability to accept EFT payments, which would have a material adverse effect on our business, results of operations and financial condition. In addition, any such costs, which may arise in the future as a result of changes to the legislation and regulations or in their interpretation, could individually or in the aggregate cause us to change or limit our business practice, which may make our business model less attractive to our franchisees and our and their members.
We are subject to a number of risks related to ACH, credit card and debit card payments we accept.
We and our franchisees accept payments through ACH, credit card and debit card transactions. For ACH, credit card and debit card payments, we and our franchisees pay interchange and other fees, which may increase over time. An increase in those fees would require us to either increase the prices we charge for our memberships, which could cause us to lose members or suffer an increase in our operating expenses, either of which could harm our operating results.
If we or any of our processing vendors have problems with our billing software, or the billing software malfunctions, it could have an adverse effect on our member satisfaction and could cause one or more of the major credit card companies to disallow our
22
continued use of their payment products. In addition, if our billing software fails to work properly and, as a result, we and our franchisees do not automatically charge our members’ credit cards, debit cards or bank accounts on a timely basis or at all, we could lose membership revenue and associated royalty revenue, which would harm our operating results.
If we fail to adequately control fraudulent ACH, credit card and debit card transactions, we may face civil liability, diminished public perception of our security measures and significantly higher ACH, credit card and debit card related costs, each of which could adversely affect our business, financial condition and results of operations. The termination of our ability to process payments through ACH transactions or on any major credit or debit card would significantly impair our ability to operate our business.
As consumer behavior shifts to use more modern forms of payment, there may be an increased reluctance to use ACH or credit cards for membership dues and point of sale transactions which could result in decreased revenues as consumers choose to give their business to competition with more convenient forms of payment. We may need to expand our information systems to support newer and emerging forms of payment methods, which may be time-consuming and expensive, and may not realize a return on our investment.
Our and our franchisees’ stores may be unable to attract and retain members, which would materially and adversely affect our business, results of operations and financial condition.
Our target market is average people seeking regular exercise and people who are new to fitness. The success of our business depends on our and our franchisees’ ability to attract and retain members. Our and our franchisees’ marketing efforts may not be successful in attracting members to stores, and membership levels may materially decline over time, especially at stores in operation for an extended period of time. Members may cancel their memberships at any time after giving proper advance written notice, subject to an initial minimum term applicable to certain memberships. We may also cancel or suspend memberships if a member fails to provide payment for an extended period of time. In addition, we experience attrition and must continually engage existing members and attract new members in order to maintain membership levels. A portion of our member base does not regularly use our stores and may be more likely to cancel their membership. Some of the factors that could lead to a decline in membership levels include changing desires and behaviors of consumers or their perception of our brand, changes in discretionary spending trends and general economic conditions, market maturity or saturation, a decline in our ability to deliver quality service at a competitive price, an increase in monthly membership dues due to inflation, direct and indirect competition in our industry, and a decline in the public’s interest in health and fitness, among other factors. In order to increase membership levels, we may from time to time offer promotions or lower monthly dues or annual fees. If we and our franchisees are not successful in optimizing price or in adding new memberships in new and existing stores, growth in monthly membership dues or annual fees may suffer. Any decrease in our average dues or fees or higher membership costs may adversely impact our results of operations and financial condition.
If we and our franchisees are unable to identify and secure suitable sites for new franchise stores, our revenue growth rate and profits may be negatively impacted.
To successfully expand our business, we and our franchisees must identify and secure sites for new franchise stores and, to a lesser extent, new corporate-owned stores that meet our established criteria. In addition to finding sites with the right demographic and other measures we employ in our selection process, we also need to evaluate the penetration of our competitors in the market. We face significant competition for sites that meet our criteria, and as a result we may lose those sites, our competitors could copy our format or we could be forced to pay significantly higher prices for those sites. If we and our franchisees are unable to identify and secure sites for new stores, our revenue growth rate and profits may be negatively impacted. Additionally, if our or our franchisees’ analysis of the suitability of a store site is incorrect, we or our franchisees may not be able to recover the capital investment in developing and building the new store.
As we increase our number of stores, we and our franchisees may also open stores in higher-cost geographies, which could entail greater lease payments and construction costs, among others. The higher level of invested capital at these stores may require higher operating margins and higher net income per store to produce the level of return we or our franchisees and potential franchisees expect. Failure to provide this level of return could adversely affect our results of operations and financial condition.
Opening new stores in close proximity may negatively impact our existing stores’ revenues and profitability.
We and our franchisees currently operate stores in 50 states, the District of Columbia, Puerto Rico, Canada, the Dominican Republic, Panama and Mexico, and we and our franchisees plan to open many new stores in the future, some of which will be in existing markets and may be located in close proximity to stores already in those markets. Opening new stores in close proximity to existing stores may attract some memberships away from those existing stores, which may lead to diminished revenues and profitability for us and our franchisees rather than increased market share. In addition, as a result of new stores opening in existing markets and because older stores will represent an increasing proportion of our store base over time, our same store sales increases may be lower in future periods than they have been historically.
23
We are subject to a variety of additional risks associated with our franchisees.
Our franchise business model subjects us to a number of risks, any one of which may impact our royalty revenues collected from our franchisees, may harm the goodwill associated with our brand, and may materially and adversely impact our business and results of operations.
Bankruptcy of franchisees.
A franchisee bankruptcy could have a substantial negative impact on our ability to collect payments due under such franchisee’s franchise agreement(s). In a franchisee bankruptcy, the bankruptcy trustee may reject its franchise agreement(s), ADA(s) and/or franchisee lease/sublease pursuant to Section 365 under the U.S. bankruptcy code, in which case there would be no further royalty payments from such franchisee, and we may not ultimately recover those payments in a bankruptcy proceeding of such franchisee in connection with a damage claim resulting from such rejection.
Franchisee changes in control.
Our franchises are operated by independent business owners. Although we have the right to approve franchise owners, and any transferee owners, it can be difficult to predict in advance whether a particular franchise owner will be successful. If an individual franchise owner is unable to successfully establish, manage and operate the store, the performance and quality of service of the store could be adversely affected, which could reduce memberships and negatively affect our royalty revenues and brand image. Although our agreements prohibit “changes in control” of a franchisee without our prior consent as the franchisor, a franchise owner may desire to transfer a store to a transferee franchisee. In addition, in the event of the death or disability of a franchisee (if a natural person) or a principal of a franchisee entity, the executors and representatives of the franchisee are required to transfer the relevant franchise agreements to a successor franchisee approved by the franchisor. In any transfer situation, the transferee may not be able to perform the former franchisee’s obligations under such franchise agreements and successfully operate the store. In such a case the performance and quality of service of the store could be adversely affected, which could also reduce memberships and negatively affect our royalty revenues and brand image.
Franchisee insurance.
Our franchise agreements require each franchisee to maintain certain insurance types and levels. Losses arising from certain extraordinary hazards, however, may not be covered, and insurance may not be available (or may be available only at prohibitively expensive rates) with respect to many other risks, or franchisees may fail to procure the required insurance. Moreover, any loss incurred could exceed policy limits and policy payments made to franchisees may not be made on a timely basis. Any such loss or delay in payment could have a material adverse effect on a franchisee’s ability to satisfy its obligations under its franchise agreement or other contractual obligations, which could cause a franchisee to terminate its franchise agreement and, in turn, negatively affect our operating and financial results.
Some of our franchisees are operating entities.
Franchisees may be natural persons or legal entities. Our franchisees that are operating companies (as opposed to limited purpose entities) are subject to business, credit, financial and other risks, which may be unrelated to the operation of their stores. These unrelated risks could materially and adversely affect a franchisee that is an operating company and its ability to service its members and maintain store operations while making royalty payments, which in turn may materially and adversely affect our business and operating results.
Franchise agreement termination; nonrenewal.
Each franchise agreement is subject to termination by us as the franchisor in the event of a default, generally after expiration of applicable cure periods, although under certain circumstances a franchise agreement may be terminated by us upon notice without an opportunity to cure. The default provisions under the franchise agreements are drafted broadly and include, among other things, any failure to meet operating standards and actions that may threaten the licensed intellectual property. Moreover, a franchisee may have a right to terminate its franchise agreement in certain circumstances.
In addition, each franchise agreement has an expiration date. Upon the expiration of a franchise agreement, we or the franchisee may, or may not, elect to renew the franchise agreement. If the franchise agreement is renewed, the franchisee will receive a “successor” franchise agreement for an additional term. Such option, however, is contingent on the franchisee’s execution of the then-current form of franchise agreement (which may include increased royalty revenues, advertising fees and other fees and costs), the satisfaction of certain conditions (including re-equipment and remodeling of the store and other requirements) and the payment of a successor fee. If a franchisee is unable or unwilling to satisfy any of the foregoing conditions, the expiring franchise agreement will terminate upon expiration of its term.
Franchisee litigation; effects of regulatory efforts.
We and our franchisees are subject to a variety of litigation risks, including, but not limited to, member claims, personal injury claims, vicarious liability claims, litigation with or involving our relationship with franchisees, litigation alleging that the franchisees are our employees or that we are the co-employer of our franchisees’ employees, employee allegations against the franchisee or us of improper termination and discrimination, landlord/tenant disputes and intellectual property claims, among others. Each of these claims may increase costs, reduce the execution of new franchise agreements and affect the scope and terms of insurance or indemnifications we and our franchisees may have. In addition, we and our franchisees are subject to various regulatory efforts to enforce employment laws, such as efforts to categorize franchisors as the co-employers of their franchisees’ employees; legislation to categorize individual franchised businesses as large employers for the purposes of various employment benefits; and other legislation or regulations that may have a disproportionate impact on franchisors and/or franchised businesses. These changes may impose greater costs and regulatory burdens on franchising and negatively affect our ability to sell new franchises.
24
Franchise agreements and franchisee relationships.
Our franchisees develop and operate their stores under terms set forth in our ADAs and franchise agreements, respectively. These agreements give rise to long-term relationships that involve a complex set of mutual
obligations and mutual cooperation. We have a standard set of agreements that we typically use with our franchisees, but various franchisees have negotiated specific terms in these agreements. Furthermore, we may from time to time negotiate terms of our franchise agreements with individual franchisees or groups of franchisees (e.g., a franchisee association). We seek to have positive relationships with our franchisees, based in part on our common understanding of our mutual rights and obligations under our
agreements, to enable both the franchisees’ business and our business to be successful. However, we and our franchisees may not always maintain a positive relationship or always interpret our agreements in the same way. Our failure to have positive relationships with our franchisees could individually or in the aggregate cause us to change or limit our business practices, which may make our business model less attractive to our franchisees or our members.
While our franchisee revenues are not concentrated among one or a small number of parties, the success of our business does depend in large part on our ability to maintain contractual relationships with franchisees in profitable stores. A typical franchise agreement has a ten-year term. Our largest franchisee group accounts for 6.8% of our total stores and another large franchisee group accounts for 4.5% of our total stores. If we fail to maintain or renew our contractual relationships on acceptable terms, or if one or more of these large franchisees were to become insolvent or otherwise were unwilling to pay amounts due to us, our business, reputation, financial condition and results of operations could be materially and adversely affected.
Franchisee turnover.
There can be no guarantee of the retention of any, including the top performing, franchisees in the future, or that we will maintain the ability to attract, retain, and motivate sufficient numbers of franchisees of the same caliber. The quality of existing franchisee operations may be diminished by factors beyond our control, including franchisees’ failure or inability to hire or retain qualified managers and other personnel. Training of managers and other personnel may be inadequate. These and other such negative factors could adversely affect our business.
Our dependence on a limited number of suppliers for equipment and certain products and services could result in disruptions to our business and could adversely affect our revenues and gross profit.
Equipment and certain products and services used in our stores, including our exercise equipment and point-of-sale software and hardware, are sourced from third-party suppliers. In addition, we rely on third-party suppliers to manage and maintain our websites and online join processes, and in
2018
over 32% of our new members joined online through our websites. Although we believe that adequate substitutes are currently available, we depend on these third-party suppliers to operate our business efficiently and consistently meet our business requirements. The ability of these third-party suppliers to successfully provide reliable and high-quality services is subject to technical and operational uncertainties that are beyond our control, including, for our overseas suppliers, vessel availability and port delays or congestion. Any disruption to our suppliers’ operations could impact our supply chain and our ability to service our existing stores and open new stores on time or at all and thereby generate revenue. If we lose such suppliers or our suppliers encounter financial hardships unrelated to the demand for our equipment or other products or services, we may not be able to identify or enter into agreements with alternative suppliers on a timely basis on acceptable terms, if at all. Transitioning to new suppliers would be time-consuming and expensive and may result in interruptions in our operations. If we should encounter delays or difficulties in securing the quantity of equipment we or our franchisees require to open new and refurbish existing stores, our suppliers encounter difficulties meeting our and our franchisees’ demands for products or services, our websites experience delays or become impaired due to errors in the third-party technology or there is a deficiency, lack or poor quality of products or services provided, or there is damage to the value of one or more of our vendors’ brands, our ability to serve our members and grow our brand would be interrupted. If any of these events occurs, it could have a material adverse effect on our business and operating results.
Our franchisees may incur rising costs related to construction of new stores and maintenance of existing stores, which could adversely affect the attractiveness of our franchise model, and in turn our business, results of operations and financial condition.
Our stores require significant upfront and ongoing investment, including periodic remodeling and equipment replacement. If our franchisees’ costs are greater than expected, franchisees may need to outperform their operational plan to achieve their targeted return. In addition, increased costs may result in lower profits to the franchisees, which may cause them to terminate their franchise agreement or make it harder for us to attract new franchisees, which in turn could materially and adversely affect our business, results of operations and financial condition.
In addition, if a franchisee is unwilling or unable to acquire the necessary financing to invest in the maintenance and upkeep of its stores, including periodic remodeling and replacement of equipment, the quality of its stores could deteriorate, which may have a negative impact on our brand image and our ability to attract and maintain members, which in turn may have a negative impact on our revenues.
25
We and our franchisees could be subject to claims related to health and safety risks to members that arise while at both our corporate-owned and franchise stores.
Use of our and our franchisees’ stores poses some potential health and safety risks to members or guests through physical exertion and use of our services and facilities, including exercise and tanning equipment. Claims might be asserted against us and our franchisees for injuries suffered by or death of members or guests while exercising and using the facilities at a store. We may not be able to successfully defend such claims. We also may not be able to maintain our general liability insurance on acceptable terms in the future or maintain a level of insurance that would provide adequate coverage against potential claims. Depending upon the outcome, these matters may have a material adverse effect on our results of operations, financial condition and cash flows.
If we cannot retain our key employees and hire additional highly qualified employees, we may not be able to successfully manage our businesses and pursue our strategic objectives.
We are highly dependent on the services of our senior management team and other key employees at our corporate headquarters and our corporate-owned stores, and on our and our franchisees’ ability to recruit, retain and motivate key employees. Competition for such employees can be intense, and the inability to attract and retain the additional qualified employees required to expand our activities, or the loss of current key employees, could adversely affect our and our franchisees’ operating efficiency and financial condition.
Our intellectual property rights, including trademarks and trade names, may be infringed, misappropriated or challenged by others.
Our brand and related intellectual property are important to our continued success. We seek to protect our trademarks, trade names, copyrights and other intellectual property by exercising our rights under applicable state, provincial, federal and international laws. Policing unauthorized use and other violations of our intellectual property rights is difficult, and the steps we take may not prevent misappropriation, infringement or other violations of our intellectual property. If we were to fail to successfully protect our intellectual property rights for any reason, or if any third party misappropriates, dilutes or infringes our intellectual property, the value of our brands may be harmed, which could have an adverse effect on our business, results of operations and financial condition. Any damage to our reputation could cause membership levels to decline or make it more difficult to attract new members.
We may also from time to time be required to initiate litigation to enforce our trademarks, service marks and other intellectual property. Third parties may also assert that we have infringed, misappropriated or otherwise violated their intellectual property rights, which could lead to litigation against us. Litigation is inherently uncertain and could divert the attention of management, result in substantial costs and diversion of resources and negatively affect our membership sales and profitability regardless of whether we are able to successfully enforce or defend our rights.
Use of email marketing and social media may adversely impact our reputation or subject us to fines or other penalties.
There has been a substantial increase in the use of email and social media platforms, including blogs, social media websites and other forms of internet-based communication, which allow access to a broad audience of consumers and other interested persons. Negative commentary about us may be posted on social media platforms or similar devices at any time and may harm our reputation or business. Consumers value readily available information about health clubs and often act on such information without further investigation and without regard to its accuracy. The harm may be immediate without affording us an opportunity for redress or correction. In addition, social media platforms provide users with access to such a broad audience that collective action against our stores, such as boycotts, can be more easily organized. If such actions were organized, we could suffer reputational damage as well as physical damage to our stores. Social media platforms may be used to attack us, our information security systems and our reputation, including through use of spam, spyware, ransomware, phishing and social engineering, viruses, worms, malware, distributed denial of service attacks, password attacks, “Man in the Middle” attacks, cybersquatting, impersonation of employees or officers, abuse of comments and message boards, fake reviews, doxing and swatting.
We also use email and social medial platforms as marketing tools. For example, we maintain social media accounts and may occasionally email members to inform them of certain offers or promotions. As laws and regulations, including Federal Trade Commission enforcement, rapidly evolve to govern the use of these platforms and devices, the failure by us, our employees, our franchisees or third parties acting at our direction to abide by applicable laws and regulations in the use of these platforms and devices could adversely impact our and our franchisees’ business, financial condition and results of operations or subject us to fines or other penalties.
If we fail to obtain and retain high-profile strategic partnership arrangements, or if the reputation of any of our partners is impaired, our business may suffer.
A principal component of our marketing program has been to partner with high-profile marketing partners, such as our sponsorship of ABC’s “Dick Clark’s New Year’s Rockin’ Eve with Ryan Seacrest 2019,” to help us extend the reach of our brand. Although we have partnered with several well-known partners in this manner, we may not be able to attract and partner with new marketing
26
partners in the future. In addition, if the actions of our partners were to damage their reputation, our partnerships may be less attractive to our current or prospective members. Any of these failures by us or our partners could adversely affect our business and revenues.
We are subject to risks associated with leasing property subject to long-term non-cancelable leases.
All but one of our corporate-owned stores are located on leased premises. The leases for our stores generally have initial terms of 10 years and typically provide for two renewal options in five-year increments as well as for rent escalations.
Generally, our leases are net leases that require us to pay our share of the costs of real estate taxes, utilities, building operating expenses, insurance and other charges in addition to rent. We generally cannot terminate these leases before the end of the initial lease term. Additional sites that we lease are likely to be subject to similar long-term, non-terminable leases. If we close a store, we nonetheless may be obligated to perform our monetary obligations under the applicable lease, including, among other things, payment of the base rent for the balance of the lease term. In addition, if we fail to negotiate renewals, either on commercially acceptable terms or at all, as each of our leases expire we could be forced to close stores in desirable locations. We depend on cash flows from operations to pay our lease expenses and to fulfill our other cash needs. If our business does not generate sufficient cash flow from operating activities, and sufficient funds are not otherwise available to us from borrowings under our securitized financing facility or other sources, we may not be able to service our lease expenses or fund our other liquidity and capital needs, which would materially affect our business.
Our business is subject to various laws and regulations and changes in such laws and regulations, or failure to comply with existing or future laws and regulations, could adversely affect our business.
We are subject to the FTC Franchise Rule, which is a trade regulation imposed on franchising promulgated by the Federal Trade Commission (the “FTC”) that regulates the offer and sale of franchises in the United States and that requires us to provide to all prospective franchisees certain mandatory disclosure in FDD. In addition, we are subject to state franchise registration and disclosure laws in approximately 14 states that regulate the offer and sale of franchises by requiring us, unless otherwise exempt, to register our franchise offering in those states prior to our making any offer or sale of a franchise in those states and to provide a FDD to prospective franchisees in accordance with such laws. We are subject to franchise registration and disclosure laws in six provinces in Canada that regulate the offer and sale of franchises by requiring us, unless otherwise exempt, to to register our franchise offering in a prescribed format to prospective franchisees in accordance with such laws, and that regulate certain aspects of the franchise relationship. We are subject to similar franchise sales laws in Mexico, and may become subject to similar laws in other countries in which we may offer franchises in the future.
Failure to comply with such laws may result in a franchisee’s right to rescind its franchise agreement and damages, and may result in investigations or actions from federal or state franchise authorities, civil fines or penalties, and stop orders, among other remedies. We are also subject to franchise relationship laws in approximately 20 states that regulate many aspects of the franchise relationship including, depending upon the state, renewals and terminations of franchise agreements, franchise transfers, the applicable law and venue in which franchise disputes may be resolved, discrimination and franchisees’ right to associate, among others. Our failure to comply with such franchise relationship laws could result in fines, damages and our inability to enforce franchise agreements where we have violated such laws. Although we believe that our FDDs, franchise sales practices and franchise activities comply with such franchise sales laws and franchise relationship laws, our non-compliance could result in liability to franchisees and regulatory authorities (as described above), inability to enforce our franchise agreements and a reduction in our anticipated royalty revenue, which in turn may materially and adversely affect our business and results of operations.
We and our franchisees are also subject to the Fair Labor Standards Act of 1938, as amended, and various other laws in the United States, Canada, the Dominican Republic, Panama and Mexico governing such matters as minimum-wage requirements, overtime and other working conditions. Based upon our experience with hiring employees and operating corporate-owned stores, we believe a significant number of our and our franchisees’ employees are paid at rates related to the U.S. federal or state minimum wage, and past increases in the U.S. federal and/or state minimum wage have increased labor costs, as would future increases. Any increases in labor costs might result in our and our franchisees inadequately staffing stores. Such increases in labor costs and other changes in labor laws could affect store performance and quality of service, decrease royalty revenues and adversely affect our brand.
Our and our franchisees’ operations and properties are subject to extensive U.S., Canadian, Dominican, Panamanian and Mexican, federal, international, state, provincial and local laws and regulations, including those relating to environmental, building and zoning requirements. Our and our franchisees’ development of properties depends to a significant extent on the selection and acquisition of suitable sites, which are subject to zoning, land use, environmental, traffic and other regulations and requirements. Failure to comply with these legal requirements could result in, among other things, revocation of required licenses, administrative enforcement actions, fines and civil and criminal liability, which could adversely affect our business.
We and our franchisees are responsible at stores we each operate for compliance with state, provincial and local laws that regulate the relationship between stores and their members. Many states and provinces have consumer protection regulations that may
27
limit the collection of membership dues or fees prior to opening, require certain disclosures of pricing information, mandate the maximum length of contracts and “cooling off” periods for members (after the purchase of a membership), set escrow and bond requirements for stores, govern member rights in the event of a member relocation or disability, provide for specific member rights when a store closes or relocates, or preclude automatic membership renewals. Our or our franchisees’ failure to comply fully with these rules or requirements may subject us or our franchisees to fines, penalties, damages, and civil liability, or result in membership contracts being void or voidable. In addition, states or provinces may update these laws and regulations. Any additional costs which may arise in the future as a result of changes to the legislation and regulations or in their interpretation could individually or in the aggregate cause us to change or limit our business practices, which may make our business model less attractive to our franchisees or our members.
If we are unable to anticipate and satisfy consumer preferences and shifting views of health and fitness, our business may be adversely affected.
Our success depends on our ability to anticipate and satisfy consumer preferences relating to health and fitness. Our business is and all of our services are subject to changing consumer preferences that cannot be predicted with certainty. Developments or shifts in research or public opinion on the types of health and fitness services we provide could negatively impact the business or consumers’ preferences for health and fitness services could shift rapidly to different types of health and fitness centers; and we may be unable to anticipate and respond to shifts in consumer preferences. It is also possible that competitors could introduce new products and services that negatively impact consumer preference for our business model. Failure to predict and respond to changes in public opinion, public research and consumer preferences could adversely impact our business.
Regulatory restrictions placed on indoor tanning services and negative opinions about the health effects of indoor tanning services could harm our reputation and our business.
Although our business model does not place an emphasis on indoor tanning, the vast majority of our corporate-owned and franchise stores offer indoor tanning services. We offer tanning services as one of many amenities available to our PF Black Card members. Many states and provinces where we and our franchisees operate have health and safety regulations that apply to health clubs and other facilities that offer indoor tanning services. In addition to regulations imposed on the indoor tanning industry, medical opinions and opinions of commentators in the general public regarding negative health effects of indoor tanning services could adversely impact the value of our PF Black Card memberships and our future revenues and profitability. Although the tanning industry is regulated by U.S. federal and state, and international government agencies, negative publicity regarding the potentially harmful health effects of the tanning services we offer at our stores could lead to additional legislation or further regulation of the industry. The potential increase in cost of complying with these regulations could have a negative impact on our profit margins.
The continuation of our tanning services is dependent upon the public’s sustained belief that the benefits of utilizing tanning services outweigh the risks of exposure to ultraviolet light. Any significant change in public perception of tanning equipment or any investigative or regulatory action by a government agency or other regulatory authority could impact the appeal of indoor tanning services to our PF Black Card members, and could in turn have an adverse effect on our and our franchisees’ reputation, business, results of operations and financial condition as well as our ability to profit from sales of tanning equipment to our franchisees.
In addition, from time to time, government agencies and other regulatory authorities have shown an interest in taking investigative or regulatory action with respect to tanning services. For example, we reached a settlement with the New York Office of the Attorney General (“OAG”) in November 2015 in connection with allegations that in the spring of 2013, seven of the approximately 80 independently owned and operated Planet Fitness franchise locations in New York at the time had violated certain state laws related to tanning advertising, signage, paperwork and eyewear. Upon being alerted to these alleged violations, we re-emphasized to all franchisees that they are contractually required to operate their businesses in compliance with all applicable laws and regulations. The OAG’s investigation was part of a larger initiative with respect to tanning salons and other providers of tanning services and the settlement did not have a material adverse effect on us. However, similar future initiatives could influence public perception of the tanning services we offer and of the benefits of our PF Black Card membership.
Risks related to our indebtedness
We and certain of our subsidiaries are subject to various restrictions, and substantially all of the assets of certain subsidiaries are security, under the terms of a securitization transaction that was completed on August 1, 2018.
On August 1, 2018, Planet Fitness Master Issuer LLC (the “Master Issuer”), our limited-purpose, bankruptcy-remote, indirect subsidiary, entered into a base indenture and a related supplemental indenture (collectively, the “Indenture”) under which the Master Issuer issued $575 million in aggregate principal amount of Series 2018-1 4.262% Fixed Rate Senior Secured Notes, Class A-2-I (the “Class A-2-I Notes”) and $625 million in aggregate principal amount of Series 2018-1 4.666% Fixed Rate Senior Secured Notes, Class A-2-II (the “Class A-2-II Notes” and together with the Class A-2-I Notes, the “Class A-2 Notes”) in an offering exempt from registration under the Securities Act of 1933, as amended. In connection with the issuance of the Class A-2
28
Notes, the Master Issuer also entered into a revolving financing facility that allows for the issuance of up to $75 million in Series 2018-1 Variable Funding Senior Notes, Class A-1 (the “Variable Funding Notes”), and certain letters of credit. The Class A-2 Notes and the Variable Funding Notes are referred to collectively as the “Notes.”
The Notes were issued in a securitization transaction pursuant to which substantially all of our revenue-generating assets in the United States are held by the Master Issuer and certain other limited-purpose, bankruptcy remote, wholly-owned direct and indirect subsidiaries of the Master Issuer that act as guarantors of the Notes and that have pledged substantially all of their assets to secure the Notes.
The Notes are subject to a series of covenants and restrictions customary for transactions of this type, including (i) that the Master Issuer maintains specified reserve accounts to be used to make required payments in respect of the Notes, (ii) provisions relating to optional and mandatory prepayments and the related payment of specified amounts, including specified make-whole payments in the case of the Class A-2 Notes under certain circumstances, (iii) certain indemnification payments in the event, among other things, the transfers of the assets pledged as collateral for the Notes are in stated ways defective or ineffective and (iv) covenants relating to recordkeeping, access to information and similar matters. The Notes are also subject to customary rapid amortization events provided for in the Indenture, including events tied to failure to maintain a stated debt service coverage ratio, the sum of system-wide sales being below certain levels on certain measurement dates, certain manager termination events (including in certain cases a change of control of Planet Fitness Holdings, LLC), an event of default and the failure to repay or refinance the Notes on the applicable anticipated repayment date. The Notes are also subject to certain customary events of default, including events relating to non-payment of required interest, principal or other amounts due on or with respect to the Notes, failure to comply with covenants within certain time frames, certain bankruptcy events, breaches of specified representations and warranties, failure of security interests to be effective and certain judgments.
In the event that a rapid amortization event occurs under the Indenture (including, without limitation, upon an event of default under the Indenture or the failure to repay the securitized debt at the end of the applicable term), the funds available to us would be reduced or eliminated, which would in turn reduce our ability to operate or grow our business. If our subsidiaries are not able to generate sufficient cash flow to service their debt obligations, they may need to refinance or restructure debt, sell assets, reduce or delay capital investments, or seek to raise additional capital. If our subsidiaries are unable to implement one or more of these alternatives, they may not be able to meet debt payment and other obligations.
We have a significant amount of debt outstanding. Such indebtedness, along with the other contractual commitments of its subsidiaries, could adversely affect our business, financial condition and results of operations, as well as the ability of certain of our subsidiaries to meet debt payment obligations.
Under the Indenture, Master Issuer has $1.2 billion of outstanding debt. Additionally, Master Issuer has the ability to borrow amounts from time to time on a revolving basis, up to an aggregate principal amount of $75 million pursuant to the Variable Funding Notes.
This level of debt could have significant consequences on our future operations, including:
|
•
|
resulting in an event of default if our subsidiaries fail to comply with the financial and other restrictive covenants contained in debt agreements, which event of default could result in all of our subsidiaries’ debt becoming immediately due and payable;
|
|
•
|
reducing the availability of our cash flow to fund working capital, capital expenditures, acquisitions and other general corporate purposes, and limiting our ability to obtain additional financing for these purposes;
|
|
•
|
limiting the Company’s flexibility in planning for, or reacting to, and increasing its vulnerability to, changes in our business, the industry in which it operates and the general economy;
|
|
•
|
placing us at a competitive disadvantage compared to its competitors that are less leveraged; and
|
|
•
|
subjecting us to the risk of increased sensitivity to interest rate increases on indebtedness with respect to the Variable Funding Notes.
|
The ability to meet payment and other obligations under the debt instruments of our subsidiaries depends on our ability to generate significant cash flow in the future. This, to some extent, is subject to general economic, financial, competitive, legislative and regulatory factors, as well as other factors that are beyond our control. Our business may not generate cash flow from operations, and that future borrowings may not be available to us under existing or any future credit facilities or otherwise, in an amount sufficient to enable its subsidiaries to meet our debt payment obligations and to fund other liquidity needs. If our subsidiaries are not able to generate sufficient cash flow to service our debt obligations, we may need to refinance or restructure debt, sell assets, reduce or delay capital investments, or seek to raise additional capital. If our subsidiaries are unable to implement one or more of these alternatives, they may not be able to meet debt payment and other obligations.
In addition, we may incur additional indebtedness in the future. If new debt or other liabilities are added to our current consolidated debt levels, the related risks that it now faces could intensify.
29
The securitization imposes certain restrictions on our activities or the activities of our subsidiaries.
The Indenture and the management agreement entered into between certain of our subsidiaries and the Indenture trustee (the “Management Agreement”) contain various covenants that limit our and its subsidiaries’ ability to engage in specified types of transactions. For example, the Indenture and the Management Agreement contain covenants that, among other things, restrict, subject to certain exceptions, the ability of certain subsidiaries to:
|
•
|
incur or guarantee additional indebtedness;
|
|
•
|
sell certain assets;
|
|
•
|
create or incur liens on certain assets to secure indebtedness; or
|
|
•
|
consolidate, merge, sell or otherwise dispose of all or substantially all of our assets.
|
As a result of these restrictions, we may not have adequate resources or flexibility to continue to manage the business and provide for growth of the Planet Fitness system, including product development and marketing for the Planet Fitness brand, which could have a material adverse effect on our future growth prospects, financial condition, results of operations and liquidity.
We will require a significant amount of cash to service our indebtedness. The ability to generate cash or refinance our indebtedness as it becomes due depends on many factors, some of which are beyond our control.
Our ability to make scheduled payments on, or to refinance our respective obligations under, our indebtedness and to fund planned capital expenditures and other corporate expenses will depend on our subsidiaries’ and our franchisees' future operating performance and on economic, financial, competitive, legislative, regulatory and other factors. Many of these factors are beyond our control. We can provide no assurance that our business will generate sufficient cash flow from operations, that currently anticipated cost savings and operating improvements will be realized or that future borrowings will be available to us in an amount sufficient to enable us to satisfy our respective obligations under our indebtedness or to fund our other needs. In order for us to satisfy our obligations under our indebtedness and fund planned capital expenditures, we must continue to execute our business strategy. If we are unable to do so, we may need to reduce or delay our planned capital expenditures or refinance all or a portion of our indebtedness on or before maturity. Significant delays in our planned capital expenditures may materially and adversely affect our future revenue prospects. In addition, we can provide no assurance that we will be able to refinance any of our indebtedness on commercially reasonable terms or at all.
Risks related to our organizational structure
We will be required to pay certain of our existing and previous owners for certain tax benefits we may claim, and we expect that the payments we will be required to make will be substantial.
Future and certain past exchanges of Holdings Units for shares of our Class A common stock (or cash) are expected to produce and have produced favorable tax attributes for us. We are a party to two tax receivable agreements. Under the first of those agreements, we are generally required to pay to certain existing and previous equity owners of Pla-Fit Holdings, LLC (the “TRA Holders”) 85% of the applicable cash savings, if any, in U.S. federal and state income tax that we are deemed to realize as a result of certain tax attributes of their Holdings Units sold to us (or exchanged in a taxable sale) and that are created as a result of (i) the sales of their Holdings Units for shares of our Class A common stock and (ii) tax benefits attributable to payments made under the tax receivable agreement (including imputed interest). Under the second tax receivable agreement, we are generally required to pay to TSG AIV II-A L.P and TSG PF Co-Investors A L.P. (the “Direct TSG Investors”) 85% of the amount of cash savings, if any, that we are deemed to realize as a result of the tax attributes of the Holdings Units that we held in respect of the Direct TSG Investors’ prior interest in us, which resulted from the Direct TSG Investors’ purchase of interests in our 2012 acquisition (the “2012 Acquisition”) by investment funds affiliated with TSG Consumer Partners, LLC (“TSG”), and certain other tax benefits. Under both agreements, we generally retain the benefit of the remaining 15% of the applicable tax savings.
The payment obligations under the tax receivable agreements are obligations of Planet Fitness, Inc., and we expect that the payments we will be required to make under the tax receivable agreements will be substantial. In December 2017, tax legislation was enacted that, among other things, reduced the federal corporate income tax rate to 21% effective January 1, 2018. Assuming no further material changes in the relevant tax law and that we earn sufficient taxable income to realize all tax benefits that are subject to the tax receivable agreements, we expect that the reduction in tax payments for us associated with all past and future exchanges and sales of Holdings Units as described above would aggregate to approximately $684.8 million over the remaining term of the tax receivable agreements based on a price of $53.62 per share of our Class A common stock (the closing price per share of our Class A common stock on the New York Stock Exchange (“NYSE”) on December 31, 2018) and assuming all future sales had occurred on such date. Under such scenario, we would be required to pay the other parties to the tax receivable agreements 85% of such amount, or $582.1 million, over the applicable period under the tax receivable agreements. The actual amounts may materially differ from these hypothetical amounts, as potential future reductions in tax payments for us, and tax receivable agreement payments by us, will be calculated using the market value of our Class A common stock at the time of the sale and the prevailing tax rates applicable to us over the life of the tax receivable agreements and will be dependent on us generating sufficient future taxable
30
income to realize the benefit. Payments under the tax receivable agreements are not conditioned on the TRA Holders’ ownership of our shares.
The actual increase in tax basis, as well as the amount and timing of any payments under these agreements, will vary depending upon a number of factors, including the timing of sales by the TRA Holders, the price of our Class A common stock at the time of the sales, whether such sales are taxable, the amount and timing of the taxable income we generate in the future, the tax rate then applicable and the portion of our payments under the tax receivable agreements constituting imputed interest. Payments under the tax receivable agreements are expected to give rise to certain additional tax benefits attributable to either further increases in basis or in the form of deductions for imputed interest (generally calculated using one-year LIBOR), depending on the tax receivable agreements and the circumstances. Any such benefits are covered by the tax receivable agreements and will increase the amounts due thereunder. The tax receivable agreements provide for interest, at a rate equal to one-year LIBOR, accrued from the due date (without extensions) of the corresponding tax return to the date of payment specified by the tax receivable agreements. In addition, under certain circumstances where we are unable to make timely payments under the tax receivable agreements, the tax receivable agreements provide for interest to accrue on unpaid payments, at a rate equal to one-year LIBOR plus 500 basis points.
Payments under the tax receivable agreements will be based on the tax reporting positions that we determine. Although we are not aware of any issue that would cause the IRS to challenge a tax basis increase or other tax attributes subject to the tax receivable agreements, we will not be reimbursed for any payments previously made under the tax receivable agreements if such basis increases or other benefits are subsequently disallowed. As a result, in certain circumstances, payments could be made under the tax receivable agreements in excess of the benefits that we are deemed to realize in respect of the attributes to which the tax receivable agreements relate.
Our ability to pay taxes and expenses, including payments under the tax receivable agreements, may be limited by our structure.
Our principal asset is our ownership of Holdings Units in Pla-Fit Holdings. As such, we have no independent means of generating revenue. Pla-Fit Holdings is treated as a partnership for U.S. federal income tax purposes and, as such, is generally not subject to U.S. federal income tax. Instead, taxable income is allocated to holders of its Holdings Units, including us. Accordingly, we incur income taxes on our allocable share of any taxable income of Pla-Fit Holdings, and also incur expenses related to our operations. Pursuant to the limited liability company agreement of Pla-Fit Holdings that was amended and restated in connection with our initial public offering, as amended on July 1, 2017 (the “LLC Agreement”), Pla-Fit Holdings makes cash distributions to the owners of Holdings Units for purposes of funding their tax obligations in respect of the income of Pla-Fit Holdings that is allocated to them, to the extent other distributions from Pla-Fit Holdings have been insufficient. In addition to tax expenses, we also incur expenses related to our operations, including payment obligations under the tax receivable agreements, which are significant. We have caused Pla-Fit Holdings to make distributions in an amount sufficient to allow us to pay our taxes and operating expenses, including ordinary course payments due under the tax receivable agreements. However, its ability to make such distributions in the future will be subject to various limitations and restrictions, including contractual restrictions under our Indenture and Variable Funding Notes. If, as a consequence of these various limitations and restrictions, we do not have sufficient funds to pay tax or other liabilities or to fund our operations (including as a result of an acceleration of our obligations under the tax receivable agreements), we may have to borrow funds and thus our liquidity and financial condition could be materially and adversely affected. To the extent that we are unable to make payments under the tax receivable agreements for any reason, such payments will be deferred and will accrue interest at a rate equal to one-year LIBOR plus 500 basis points until paid.
In certain cases, payments under the tax receivable agreements to our TRA Holders may be accelerated and/or significantly exceed the actual benefits we realize in respect of the tax attributes subject to the tax receivable agreements.
The tax receivable agreements provide that (i) in the event that we materially breach such tax receivable agreements, (ii) if, at any time, we elect an early termination of the tax receivable agreements, or (iii) upon certain mergers, asset sales, other forms of business combinations or other changes of control, our (or our successor’s) obligations under the tax receivable agreements (with respect to all Holdings Units, whether or not they have been sold before or after such transaction) would accelerate and become payable in a lump sum amount equal to the present value of the anticipated future tax benefits calculated based on certain assumptions, including that we would have sufficient taxable income to fully utilize the deductions arising from the tax deductions, tax basis and other tax attributes subject to the tax receivable agreements.
As a result of the foregoing, (i) we could be required to make payments under the tax receivable agreements that are greater than or less than the specified percentage of the actual tax savings we realize in respect of the tax attributes subject to the agreements and (ii) we may be required to make an immediate lump sum payment equal to the present value of the anticipated tax savings, which payment may be made years in advance of the actual realization of such future benefits, if any such benefits are ever realized. In these situations, our obligations under the tax receivable agreements could have a substantial negative impact on our liquidity and could have the effect of delaying, deferring or preventing certain mergers, asset sales, other forms of business combinations or other changes of control. We may not be able to finance our obligations under the tax receivable agreements in a manner that does not adversely affect our working capital and growth requirements. For example, if we had elected to terminate the tax
31
receivable agreements as of
December 31, 2018
, based on a share price of $53.62 per share of our Class A common stock (based on the closing price of our Class A common stock on the NYSE as of December 31, 2018) and a discount rate equal to 4.0%, we estimate that we would have been required to pay $425.2 million in the aggregate under the tax receivable agreements.
In certain circumstances, Pla-Fit Holdings will be required to make distributions to us and the Continuing LLC Owners, and the distributions that Pla-Fit Holdings will be required to make may be substantial.
Funds used by Pla-Fit Holdings to satisfy its tax distribution obligations will not be available for reinvestment in our business. Moreover, the tax distributions that Pla-Fit Holdings will be required to make may be substantial and will likely exceed (as a percentage of Pla-Fit Holdings’ net income) the overall effective tax rate applicable to a similarly situated corporate taxpayer, particularly as a result of H.R. 1, originally known as the Tax Cuts and Jobs Act (the "2017 Tax Act").
As a result of potential differences in the amount of net taxable income allocable to us and to the owners of Holdings Units other than Planet Fitness, Inc. (the “Continuing LLC Owners”), as well as the use of an assumed tax rate in calculating Pla-Fit Holdings’ distribution obligations, we may receive distributions significantly in excess of our tax liabilities and obligations to make payments under the tax receivable agreements. To the extent we do not distribute such cash balances as dividends on our Class A common stock and instead, for example, hold such cash balances or lend them to Pla-Fit Holdings, the Continuing LLC Owners would benefit from any value attributable to such accumulated cash balances as a result of their ownership of Class A common stock following an exchange of their Holdings Units.
We will not be reimbursed for any payments made to the TRA Holders or the Direct TSG Investors under the tax receivable agreements in the event that any tax benefits are disallowed.
If the IRS or a state or local taxing authority challenges the tax basis adjustments and/or deductions that give rise to payments under the tax receivable agreements and the tax basis adjustments and/or deductions are subsequently disallowed, the recipients of payments under the agreements will not reimburse us for any payments we previously made to them. Any such disallowance would be taken into account in determining future payments under the tax receivable agreements and would, therefore, reduce the amount of any such future payments. Nevertheless, if the claimed tax benefits from the tax basis adjustments and/or deductions are disallowed, our payments under the tax receivable agreements could exceed our actual tax savings, and we may not be able to recoup payments under the tax receivable agreements that were calculated on the assumption that the disallowed tax savings were available.
Unanticipated changes in effective tax rates or adverse outcomes resulting from examination of our income or other tax returns could adversely affect our financial condition and results of operations.
We are subject to income taxes in the United States and Canada, and our domestic and foreign tax liabilities will be subject to the allocation of expenses in differing jurisdictions. Our future effective tax rates could be subject to volatility or adversely affected by a number of factors, including:
|
•
|
changes in the valuation of our deferred tax assets and liabilities;
|
|
•
|
expected timing and amount of the release of any tax valuation allowances;
|
|
•
|
tax effects of stock-based compensation;
|
|
•
|
costs related to intercompany restructurings;
|
|
•
|
changes in tax laws, regulations or interpretations thereof;
|
|
•
|
lower than anticipated future earnings in jurisdictions where we have lower statutory tax rates; or
|
|
•
|
higher than anticipated future earnings in jurisdictions where we have higher statutory tax rates.
|
In addition, we may be subject to audits of our income, sales and other transaction taxes by U.S. federal and state and foreign authorities. Outcomes from these audits could have an adverse effect on our financial condition and results of operations.
The 2017 Tax Act contains significant changes to corporate taxation, including reduction of the corporate tax rate from a top marginal rate of 35% to a flat rate of 21%, limitation of the tax deduction for interest expense, one time taxation of offshore earnings at reduced rates regardless of whether they are repatriated, and immediate deductions for certain new investments instead of deductions for depreciation expense over time. Notwithstanding the reduction in the corporate income tax rate, the overall impact of the federal tax law remains uncertain. In addition, how various states will respond to the 2017 Tax Act continues to be uncertain.
32
Risks related to our Class A common stock
Provisions of our corporate governance documents could make an acquisition of our Company more difficult and may prevent attempts by our stockholders to replace or remove our current management, even if beneficial to our stockholders.
Our certificate of incorporation and bylaws and the Delaware General Corporation Law (the “DGCL”) contain provisions that could make it more difficult for a third party to acquire us, even if doing so might be beneficial to our stockholders. These provisions include:
|
•
|
the division of our board of directors into three classes and the election of each class for three-year terms;
|
|
•
|
advance notice requirements for stockholder proposals and director nominations;
|
|
•
|
the ability of the board of directors to fill a vacancy created by the expansion of the board of directors;
|
|
•
|
the ability of our board of directors to issue new series of, and designate the terms of, preferred stock, without stockholder approval, which could be used to, among other things, institute a rights plan that would have the effect of significantly diluting the stock ownership of a potential hostile acquirer, likely preventing acquisitions that have not been approved by our board of directors;
|
|
•
|
limitations on the ability of stockholders to call special meetings and to take action by written consent; and
|
|
•
|
the required approval of holders of at least 75% of the voting power of the outstanding shares of our capital stock to adopt, amend or repeal certain provisions of our certificate of incorporation and bylaws or remove directors for cause.
|
In addition, Section 203 of the DGCL may affect the ability of an “interested stockholder” to engage in certain business combinations, for a period of three years following the time that the stockholder becomes an “interested stockholder.” While we have elected in our certificate of incorporation not to be subject to Section 203 of the DGCL, our certificate of incorporation contains provisions that have the same effect as Section 203 of the DGCL, except that they provide that investment funds affiliated with TSG will not be deemed to be an “interested stockholder,” and accordingly will not be subject to such restrictions.
Because our board of directors is responsible for appointing the members of our management team, these provisions could in turn affect any attempt to replace current members of our management team. As a result, you may lose your ability to sell your stock for a price in excess of the prevailing market price due to these protective measures, and efforts by stockholders to change the direction or management of the Company may be unsuccessful.
Our organizational structure, including the tax receivable agreements, confers certain benefits upon the TRA Holders and the Continuing LLC Owners that do not benefit Class A common stockholders to the same extent as it will benefit the TRA Holders and the Continuing LLC Owners.
Our organizational structure, including the tax receivable agreements, confers certain benefits upon the TRA Holders and the Continuing LLC Owners that do not benefit the holders of our Class A common stock to the same extent. The tax receivable agreement with the Direct TSG Investors also confers benefits upon the Direct TSG Investors that are not shared with other holders of Class A common stock. Although we retain 15% of the amount of tax benefits conferred under the tax receivable agreements, this and other aspects of our organizational structure may adversely impact the future trading market for the Class A common stock.
If our internal control over financial reporting or our disclosure controls and procedures are not effective, we may not be able to accurately report our financial results, prevent fraud or file our periodic reports in a timely manner, which may cause investors to lose confidence in our reported financial information and may lead to a decline in our stock price.
Pursuant to Section 404 of the Sarbanes-Oxley Act of 2002, as amended, our management is required to report on, and our independent registered public accounting firm is required to attest to, the effectiveness of our internal control over financial reporting. This assessment includes disclosure of any material weakness identified by our management in our internal control over financial reporting. In addition, we are required to comply with the SEC’s rules implementing Section 302 of the Sarbanes-Oxley Act, which requires management to certify financial and other information in our quarterly and annual reports, and we are required to disclose significant changes made in our internal controls and procedures on a quarterly basis.
If we identify a material weakness in our internal control over financial reporting, we may not be able to remediate the material weaknesses identified in a timely manner or maintain all of the controls necessary to remain in compliance with our reporting obligations. If we are unable to assert that our internal control over financial reporting is effective, or if our independent registered public accounting firm is unable to express an unqualified opinion as to the effectiveness of our internal control over financial reporting in future periods, investors may lose confidence in the accuracy and completeness of our financial reports, the market price of our Class A common stock could be negatively affected, and we could become subject to investigations by the NYSE, on
33
which our securities are listed, the SEC or other regulatory authorities, which could require additional financial and management resources.
Our certificate of incorporation designates courts in the State of Delaware as the sole and exclusive forum for certain types of actions and proceedings that may be initiated by our stockholders, which could limit our stockholders’ ability to obtain a favorable judicial forum for disputes with us or our directors, officers or employees.
Our certificate of incorporation provides that, subject to limited exceptions, the Court of Chancery of the State of Delaware will be the sole and exclusive forum for:
|
•
|
any derivative action or proceeding brought on our behalf;
|
|
•
|
any action asserting a claim of breach of a fiduciary duty owed by any of our directors, officers or other employees to us or our stockholders;
|
|
•
|
any action asserting a claim against us arising pursuant to any provision of the DGCL, our certificate of incorporation or our bylaws;
|
|
•
|
any action to interpret, apply, enforce or determine the validity of our certificate of incorporation or bylaws; or
|
|
•
|
any other action asserting a claim against us that is governed by the internal affairs doctrine (each, a “Covered Proceeding”).
|
In addition, our certificate of incorporation provides that if any action, the subject matter of which is a Covered Proceeding is filed in a court other than the specified Delaware courts without the approval of our board of directors (each, a “Foreign Action”), the claiming party will be deemed to have consented to (i) the personal jurisdiction of the specified Delaware courts in connection with any action brought in any such courts to enforce the exclusive forum provision described above and (ii) having service of process made upon such claiming party in any such enforcement action by service upon such claiming party’s counsel in the Foreign Action as agent for such claiming party.
Any person or entity purchasing or otherwise acquiring any interest in shares of our capital stock shall be deemed to have notice of and to have consented to these provisions. These provisions may limit a stockholder’s ability to bring a claim in a judicial forum that it finds favorable for disputes with us or our directors, officers or other employees, which may discourage such lawsuits against us and our directors, officers and employees. Alternatively, if a court were to find these provisions of our certificate of incorporation inapplicable to, or unenforceable in respect of, one or more of the specified types of actions or proceedings, we may incur additional costs associated with resolving such matters in other jurisdictions, which could adversely affect our business and financial condition.
Our stock price could be extremely volatile, and, as a result, stockholders may not be able to resell shares at or above their purchase price.
Since our initial public offering (the “IPO”) through December 31, 2018, the price of our Class A common stock, as reported by the NYSE, has ranged from a low of $13.23 on February 11, 2016 to a high of $58.50 on December 4, 2018. In addition, in recent years the stock market in general has been highly volatile. As a result, the market price and trading volume of our Class A common stock is likely to be similarly volatile, and investors in our Class A common stock may experience a decrease, which could be substantial, in the value of their stock, including decreases unrelated to our results of operations or prospects, and could lose part or all of their investment. The price of our Class A common stock could be subject to wide fluctuations in response to a number of factors, including those described elsewhere in this report and others such as:
|
•
|
variations in our operating performance and the performance of our competitors;
|
|
•
|
actual or anticipated fluctuations in our quarterly or annual operating results;
|
|
•
|
publication of research reports by securities analysts about us or our competitors or our industry;
|
|
•
|
the public’s reaction to our press releases, our other public announcements and our filings with the SEC;
|
|
•
|
our failure or the failure of our competitors to meet analysts’ projections or guidance that we or our competitors may give to the market;
|
|
•
|
additions and departures of key personnel;
|
|
•
|
strategic decisions by us or our competitors, such as acquisitions, divestitures, spin-offs, joint ventures, strategic investments or changes in business strategy;
|
|
•
|
the passage of legislation or other regulatory developments affecting us or our industry;
|
|
•
|
speculation in the press or investment community;
|
|
•
|
changes in accounting principles;
|
34
|
•
|
terrorist acts, acts of war or periods of widespread civil unrest;
|
|
•
|
natural disasters and other calamities;
|
|
•
|
breach or improper handling of data or cybersecurity events; and
|
|
•
|
changes in general market and economic conditions.
|
In the past, securities class action litigation has often been initiated against companies following periods of volatility in their stock price. This type of litigation could result in substantial costs and divert our management’s attention and resources, and could also require us to make substantial payments to satisfy judgments or to settle litigation.
Because we do not currently pay any cash dividends on our Class A common stock, you may not receive any return on investment unless you sell your Class A common stock for a price greater than that which you paid for it.
We may retain future earnings, if any, for future operations, expansion and debt repayment and do not currently pay any cash dividends on our Class A common stock. Any decision to declare and pay dividends in the future will be made at the discretion of our board of directors and will depend on, among other things, our results of operations, financial condition, cash requirements, contractual restrictions and other factors that our board of directors may deem relevant. In addition, our ability to pay dividends may be limited by covenants of any existing and future outstanding indebtedness we or our subsidiaries incur, including our securitized financing facility. As a result, you may not receive any return on an investment in our Class A common stock unless you sell our Class A common stock for a price greater than that which you paid for it.
Financial forecasting may differ materially from actual results.
Due to the inherent difficulty of predicting future events and results, our forecasted financial and operational results may differ materially from actual results. Discrepancies between forecasted and actual results could cause a decline in the price of our stock.
Item 1B. Unresolved Staff Comments.
None.
Item 2. Properties.
Our corporate headquarters is located in Hampton, New Hampshire and consists of approximately 68,700 sq. ft. of leased office space. It is the base of operations for our executive management and nearly all of the employees who provide our primary corporate and franchisee support functions.
Corporate-Owned Stores
We lease all but one of our corporate-owned stores. Our store leases typically have initial terms of ten years with two five-year renewal options, exercisable in our discretion. The following table lists all of our corporate-owned store counts by state/province as of
December 31, 2018
:
|
State/Province
|
Store Count
|
|
New York
|
24
|
|
Pennsylvania
|
17
|
|
New Hampshire
|
15
|
|
Colorado
|
5
|
|
New Jersey
|
3
|
|
California
|
3
|
|
Massachusetts
|
3
|
|
Delaware
|
3
|
|
Ontario
|
2
|
|
Vermont
|
1
|
Franchisee Stores
35
Franchisees own or directly lease from a third-party each Planet Fitness franchise location. We have not historically owned or entered into leases for Planet Fitness franchise stores and generally do not guarantee franchisees’ lease agreements, although we have done so in a few isolated instances. As of
December 31, 2018
, we had
1,666
franchisee-owned stores in 50 states, the District of Columbia, Puerto Rico, Canada, the Dominican Republic, Panama and Mexico.
Item 3. Legal Proceedings.
We are involved in various claims and legal actions that arise in the ordinary course of business. We do not believe that the ultimate resolution of these actions will have a material adverse effect on our financial position, results of operations, liquidity and capital resources.
Item 4. Mine Safety Disclosures.
None.
36
PART II
Item 5. Market for Registrant’s Common Equity, Related Stockholder Matters and Issuer Purchases of Equity Securities.
Market Information for Class A Common Stock
Shares of our Class A common stock trade on the NYSE under the symbol “PLNT.”
Holders of Record
As of February 27, 2019, there were 3 stockholders of record of our Class A common stock. A substantially greater number of holders of our Class A common stock are held in “street name” and held of record by banks, brokers and other financial institutions. As of February 27, 2019 there were 13 stockholders of record of our Class B common stock. All shares of Class B common stock are owned by current or former directors and management of the Company, and there is no public market for these shares.
Dividend Policy
We do not currently pay cash dividends on our Class A common stock. The declaration, amount and payment of any future dividends on shares of our Class A common stock will be at the sole discretion of our board of directors, which may take into account general economic conditions, our financial condition and results of operations, our available cash and current and anticipated cash needs, capital requirements, contractual, legal, tax and regulatory restrictions, the implications of the payment of dividends by us to our stockholders or by our subsidiaries to us, and any other factors that our board of directors may deem relevant
37
Performance Graph
The following graph and table depict the total return to shareholders from August 6, 2015 (the date our Class A common stock began trading on the NYSE) through December 31, 2018, relative to the performance of the S&P 500 Index and the Russell 2000. We include a comparison against the Russell 2000 because there is no published industry or line-of-business index for our industry and we do not have a readily definable peer group that is publicly traded. The graph and table assume $100 invested at the closing price of $16.00 on August 6, 2015.
The performance graph and table are not intended to be indicative of future performance. The performance graph and table shall not be deemed “soliciting material” or to be “filed” with the SEC for purposes of Section 18 of the Securities Exchange Act of 1934, as amended (the Exchange Act”), or otherwise subject to the liabilities under that Section, and shall not be deemed to be incorporated by reference into any of the Company’s filings under the Securities Act of 1933 or the Exchange Act.
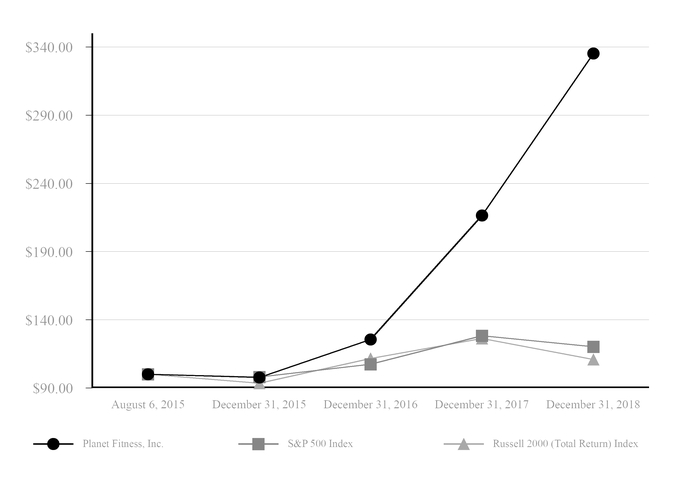
|
|
August 6, 2015
|
December 31, 2015
|
December 31, 2016
|
December 31, 2017
|
December 31, 2018
|
||||||||||||||
|
Planet Fitness, Inc.
|
$
|
100.00
|
|
$
|
97.69
|
|
$
|
125.63
|
|
$
|
216.44
|
|
$
|
335.13
|
|
||||
|
S&P 500 Index
|
100.00
|
|
98.10
|
|
107.45
|
|
128.32
|
|
120.32
|
|
|||||||||
|
Russell 2000 (Total Return) Index
|
100.00
|
|
93.42
|
|
111.62
|
|
126.29
|
|
110.91
|
|
|||||||||
Unregistered Sales of Equity Securities
There were no unregistered sales of equity securities during the year ended
December 31, 2018
.
In connection with our IPO, we and the Continuing LLC Owners entered into an exchange agreement under which they (or certain permitted transferees) have the right, from time to time and subject to the terms of the exchange agreement, to exchange their Holdings Units, together with a corresponding number of shares of Class B common stock, for shares of our Class A common stock on a one-for-one basis, subject to customary conversion rate adjustments for stock splits, stock dividends, reclassifications and other similar transactions. As a Continuing LLC Owner exchanges Holdings Units for shares of Class A common stock, the
38
number of Holdings Units held by Planet Fitness, Inc. is correspondingly increased as it acquires the exchanged Holdings Units, and a corresponding number of shares of Class B common stock are cancelled.
Issuer Purchases of Equity Securities
The following table provides information regarding purchases of shares of our Class A common stock by us and our “affiliated purchasers” (as defined in Rule 10b-18(a)(3) under the Exchange Act) during the three months ended
December 31, 2018
.
|
Issuer Purchases of Equity Securities
|
||||||||||||
|
Period
|
Total Number of Shares Purchased
|
Average Price Paid Per Share
|
Total Number of Shares Purchased as Part of Publicly Announced Plans or Programs
(1,2)
|
Approximate Dollar Value of Shares that May Yet be Purchased Under the Plans or Programs
(1,2)
|
||||||||
|
10/01/18 - 10/30/18
|
—
|
|
—
|
|
—
|
|
$457,910,178
|
|||||
|
11/01/18 - 11/30/18
|
4,607,410
|
|
$
|
52.09
|
|
4,607,410
|
|
$157,910,178
|
||||
|
12/01/18 - 12/31/18
|
—
|
|
$
|
—
|
|
—
|
|
$157,910,178
|
||||
|
Total
|
4,607,410
|
|
$
|
52.09
|
|
4,607,410
|
|
$157,910,178
|
||||
(1)
On August 3, 2018, our board of directors approved an increase to the total amount of the previously announced share repurchase program from $100,000,000 to $500,000,000. Purchases may be effected through one or more open market transactions, privately negotiated transactions, transactions structured through investment banking institutions, or a combination of the foregoing.
(2)
On November 13, 2018, the Company entered into a $300 million accelerated share repurchase ("ASR") agreement (the “ASR Agreement”) with Citibank, N.A. (the “Bank”). Pursuant to the terms of the ASR Agreement, on November 14, 2018, the Company paid Citibank $300 million in cash and received 4,607,410 shares of the Company’s Class A common stock. At final settlement, the Bank may be required to deliver additional shares to the Company, or, under certain circumstances, the Company may be required to deliver shares of its Class A common stock or may elect to make a cash payment to the Bank, based generally on the average of the daily volume-weighted average prices of the Company’s Class A common stock during the term of the ASR Agreement. The ASR Agreement contains provisions customary for agreements of this type, including provisions for adjustments to the transaction terms, the circumstances generally under which the ASR Agreement may be accelerated, extended or terminated early by the Bank and various acknowledgments, representations and warranties made by the parties to one another. Final settlement of the ASR Agreement is expected to be completed during the second quarter of 2019, although the settlement may be accelerated at the Bank's option.
Item 6. Selected Financial Data.
The following tables set forth our selected historical consolidated financial and other data for the periods indicated. The selected historical consolidated financial data as of
December 31, 2018
and
2017
, and for the years ended
December 31, 2018
,
2017
and
2016
, have been derived from our audited consolidated financial statements included elsewhere in this report.
The selected historical consolidated financial data set forth below as of
December 31,
2016
,
2015
and
2014
and for the years ended
December 31,
2015
and
2014
have been derived from our audited consolidated financial statements not included in this report.
Subsequent to the IPO and the related recapitalization transactions, the Company is a holding company whose principal asset is a controlling equity interest in Pla-Fit Holdings. As the sole managing member of Pla-Fit Holdings, the Company operates and controls all of the business and affairs of Pla-Fit Holdings, and, through Pla-Fit Holdings, conducts its business. As a result, the Company consolidates Pla-Fit Holdings’ financial results and reports a non-controlling interest related to the Holdings Units not owned by the Company. Such consolidation has been reflected for all periods presented. Our selected historical consolidated financial data does not reflect what our financial position, results of operations and cash flows would have been had we been a separate, stand-alone public company during those periods.
Our selected historical consolidated financial data may not be indicative of our future results of operations or future cash flows.
You should read the information set forth below in conjunction with our historical consolidated financial statements and the notes to those statements, “Item 1A. – Risk Factors,” and “Item 7. – Management’s Discussion and Analysis of Financial Condition and Results of Operations” included elsewhere in this Form 10-K.
39
|
|
Years ended December 31,
|
|||||||||||||||||||
|
(in thousands, except per share data)
|
2018
|
2017
|
2016
|
2015
|
2014
|
|||||||||||||||
|
Consolidated statement of operations data:
|
|
|
|
|
|
|||||||||||||||
|
Revenue:
|
|
|
|
|
|
|||||||||||||||
|
Franchise revenue
|
$
|
175,314
|
|
$
|
131,983
|
|
$
|
97,374
|
|
$
|
71,762
|
|
$
|
58,001
|
|
|||||
|
Commission income
|
6,632
|
|
18,172
|
|
19,114
|
|
16,323
|
|
13,805
|
|
||||||||||
|
National advertising revenue
|
42,194
|
|
—
|
|
—
|
|
—
|
|
—
|
|
||||||||||
|
Franchise segment
|
224,140
|
|
150,155
|
|
116,488
|
|
88,085
|
|
71,806
|
|
||||||||||
|
Corporate-owned stores segment
|
138,599
|
|
112,114
|
|
104,721
|
|
98,390
|
|
85,041
|
|
||||||||||
|
Equipment segment
|
210,159
|
|
167,673
|
|
157,032
|
|
144,062
|
|
122,930
|
|
||||||||||
|
Total revenue
|
572,898
|
|
429,942
|
|
378,241
|
|
330,537
|
|
279,777
|
|
||||||||||
|
Operating costs and expenses:
|
||||||||||||||||||||
|
Cost of revenue
|
162,646
|
|
129,266
|
|
122,317
|
|
113,492
|
|
100,306
|
|
||||||||||
|
Store operations
|
75,005
|
|
60,657
|
|
60,121
|
|
57,485
|
|
49,476
|
|
||||||||||
|
Selling, general and administrative
|
72,446
|
|
60,369
|
|
50,008
|
|
55,573
|
|
35,121
|
|
||||||||||
|
National advertising expenses
|
42,619
|
|
—
|
|
—
|
|
—
|
|
—
|
|
||||||||||
|
Depreciation and amortization
|
35,260
|
|
31,761
|
|
31,502
|
|
32,158
|
|
32,341
|
|
||||||||||
|
Other loss (gain)
|
878
|
|
353
|
|
(1,369
|
)
|
(273
|
)
|
994
|
|
||||||||||
|
Total operating costs and expenses
|
388,854
|
|
282,406
|
|
262,579
|
|
258,435
|
|
218,238
|
|
||||||||||
|
Income from operations
|
184,044
|
|
147,536
|
|
115,662
|
|
72,102
|
|
61,539
|
|
||||||||||
|
Other income (expense), net:
|
||||||||||||||||||||
|
Interest expense, net
(1)
|
(46,065
|
)
|
(35,283
|
)
|
(27,125
|
)
|
(24,549
|
)
|
(21,800
|
)
|
||||||||||
|
Other income (expense), net
(2)
|
(6,175
|
)
|
316,928
|
|
1,371
|
|
(275
|
)
|
(1,261
|
)
|
||||||||||
|
Total other income (expense), net
|
(52,240
|
)
|
281,645
|
|
(25,754
|
)
|
(24,824
|
)
|
(23,061
|
)
|
||||||||||
|
Income before income taxes
|
131,804
|
|
429,181
|
|
89,908
|
|
47,278
|
|
38,478
|
|
||||||||||
|
Provision for income taxes
(3)
|
28,642
|
|
373,580
|
|
18,661
|
|
9,148
|
|
1,183
|
|
||||||||||
|
Net income
|
103,162
|
|
55,601
|
|
71,247
|
|
38,130
|
|
37,295
|
|
||||||||||
|
Less net income attributable to non-controlling interests
|
15,141
|
|
22,455
|
|
49,747
|
|
19,612
|
|
487
|
|
||||||||||
|
Net income attributable to Planet Fitness, Inc.
|
$
|
88,021
|
|
$
|
33,146
|
|
$
|
21,500
|
|
$
|
18,518
|
|
$
|
36,808
|
|
|||||
|
Net income per share of Class A common stock:
|
||||||||||||||||||||
|
Basic
|
$
|
1.01
|
|
$
|
0.42
|
|
$
|
0.50
|
|
$
|
0.11
|
|
||||||||
|
Diluted
|
$
|
1.00
|
|
$
|
0.42
|
|
$
|
0.50
|
|
$
|
0.11
|
|
||||||||
|
Cash dividends declared per Class A common share
|
$
|
—
|
|
$
|
—
|
|
$
|
2.78
|
|
$
|
—
|
|
||||||||
|
Consolidated statement of cash flows data:
|
||||||||||||||||||||
|
Net cash provided by operating activities
|
$
|
184,399
|
|
$
|
131,021
|
|
$
|
108,817
|
|
$
|
81,663
|
|
$
|
79,405
|
|
|||||
|
Net cash used in investing activities
|
(86,416
|
)
|
(37,042
|
)
|
(14,694
|
)
|
(19,161
|
)
|
(54,362
|
)
|
||||||||||
|
Net cash used in financing activities
|
109,920
|
|
(21,703
|
)
|
(85,183
|
)
|
(74,240
|
)
|
(12,952
|
)
|
||||||||||
|
Consolidated balance sheet data:
|
||||||||||||||||||||
|
Cash and cash equivalents
|
$
|
289,431
|
|
$
|
113,080
|
|
$
|
40,393
|
|
$
|
31,430
|
|
$
|
43,291
|
|
|||||
|
Property and equipment, net
|
114,367
|
|
83,327
|
|
61,238
|
|
56,139
|
|
49,579
|
|
||||||||||
|
Total assets
|
1,353,416
|
|
1,092,465
|
|
1,001,442
|
|
699,177
|
|
601,982
|
|
||||||||||
|
Total debt and capital lease obligations,
excluding deferred financing costs
|
1,197,133
|
|
709,470
|
|
716,654
|
|
492,320
|
|
387,496
|
|
||||||||||
|
Total (deficit) equity
|
(382,789
|
)
|
(136,937
|
)
|
(214,755
|
)
|
(1,080
|
)
|
151,749
|
|
||||||||||
|
(1)
|
Interest expense in 2018, 2016 and 2014 included $4.6 million, $0.6 million and $4.7 million, respectively, for the loss on extinguishment of debt.
|
|
(2)
|
Other income (expense) in the year ended December 31, 2017 includes a gain of $316,813, related to the remeasurement of the Company’s tax benefit arrangement liabilities pursuant to the 2017 Tax Act.
|
|
(3)
|
Provision for income taxes in the year ended December 31, 2017 includes $334,022, related to the remeasurement of our deferred tax assets pursuant to the 2017 Tax Act.
|
40
ITEM 7. Management’s Discussion and Analysis of Financial Condition and Results of Operations
Unless the context requires otherwise, references in this report to the “Company,” “we,” “us” and “our” refer to Planet Fitness, Inc. and its consolidated subsidiaries.
Overview
We are one of the largest and fastest-growing franchisors and operators of fitness centers in the United States by number of members and locations, with a highly recognized national brand. Our mission is to enhance people’s lives by providing a high-quality fitness experience in a welcoming, non-intimidating environment, which we call the Judgement Free Zone, where anyone—and we mean anyone—can feel they belong. Our bright, clean stores are typically 20,000 square feet, with a large selection of high-quality, purple and yellow Planet Fitness-branded cardio, circuit- and weight-training equipment and friendly staff trainers who offer unlimited free fitness instruction to all our members in small groups through our PE@PF program. We offer this differentiated fitness experience at only $10 per month for our standard membership. This exceptional value proposition is designed to appeal to a broad population, including occasional gym users and the approximately 80% of the U.S. and Canadian populations over age 14 who are not gym members, particularly those who find the traditional fitness club setting intimidating and expensive. We and our franchisees fiercely protect Planet Fitness’ community atmosphere—a place where you do not need to be fit before joining and where progress toward achieving your fitness goals (big or small) is supported and applauded by our staff and fellow members.
As of
December 31, 2018
, we had approximately
12.5
million members and
1,742
stores in 50 states, the District of Columbia, Puerto Rico, Canada, the Dominican Republic, Panama and Mexico. Of our
1,742
stores,
1,666
are franchised and
76
are corporate-owned.
As of
December 31, 2018
, we had commitments to open more than
1,000
new stores under existing ADAs.
Composition of Revenues, Expenses and Cash Flows
Revenues
We generate revenue from three primary sources:
|
•
|
Franchise segment revenue:
Franchise segment revenue relates to services we provide to support our franchisees and includes royalty revenue, franchise fees, placement revenue, other fees and commission income associated with our franchisee-owned stores. Franchise segment revenue does not include the sale of tangible products by us to our franchisees. Our franchise segment revenue comprised 39%, 35% and 31% of our total revenue for the years ended
December 31, 2018
,
2017
and
2016
, respectively.
|
|
•
|
Corporate-owned store segment revenue
: Includes monthly membership dues, enrollment fees, annual fees and prepaid fees paid by our members as well as retail sales. This source of revenue comprised 24%, 26%, and 28% of our total revenue for the years ended
December 31, 2018
,
2017
and
2016
, respectively. As of
December 31, 2018
, 95% of our members paid their monthly dues by EFT, while the remainder prepaid annually in advance.
|
|
•
|
Equipment segment revenue
: Includes equipment revenue for new U.S. franchisee-owned stores as well as replacement equipment for U.S. existing franchisee-owned stores. Franchisee-owned stores are required to replace their equipment every five to seven years. This source of revenue comprised 37%, 39% and 41% of our total revenue for the years ended
December 31, 2018
,
2017
and
2016
, respectively.
|
See
Item 7: Critical Accounting Policies and Use of Estimates
for further discussion on our revenue streams and revenue recognition policies.
Expenses
We primarily incur the following expenses:
|
•
|
Cost of revenue
: Primarily includes the direct costs associated with equipment sales to new and existing franchisee-owned stores in the U.S. as well as direct costs related to our point-of-sale system. Cost of revenue also includes the cost of retail sales at our corporate-owned stores, which is immaterial. Our cost of revenue changes primarily based on equipment sales volume.
|
|
•
|
Store operations
: Includes the direct costs associated with our corporate-owned stores, primarily rent, utilities, payroll, marketing, maintenance and supplies. The components of store operations remain relatively stable for each store and change primarily based on the number of corporate-owned stores. Our statements of operations do not include, and we are not responsible for, any costs associated with operating franchisee-owned stores.
|
|
•
|
Selling, general and administrative expenses
: Consists of costs associated with administrative and franchisee support functions related to our existing business as well as growth and development activities, including costs to support
|
41
equipment placement and assembly services. These costs primarily consist of payroll, IT-related, marketing, legal and accounting expenses.
Cash flows
We generate a significant portion of our cash flows from monthly membership dues, royalties and various fees and commissions related to transactions involving our franchisee-owned stores. We oversee the membership billing process, as well as the collection of our royalties and certain other fees, through our third-party hosted system-wide point-of-sale system. We collect monthly dues from our corporate-owned store members on or around the 17
th
of each month, while annual fees are collected on or around the 1
st
day of the second month following the month in which the membership agreement was signed. Through our point-of-sale system, we oversee the processing of membership billings for franchisee-owned stores. Our royalties and certain other fees are deducted on or around the 17
th
of each month from these membership billings by the processor prior to the net billings being remitted to the franchisees. Our franchisees are responsible for maintaining the membership billing records and collection of member dues for their respective stores through the point-of-sale system. Our royalties are based on monthly and annual membership billings for the franchisee-owned stores without regard to the collections of those billings by our franchisees. The amount and timing of the collection of royalties and membership dues and fees at corporate-owned stores is, therefore, generally fairly predictable.
As new corporate-owned stores open, or existing stores generate positive same store sales, future corporate-owned store revenues are expected to grow. Our corporate-owned stores also generate strong operating margins and cash flows, as a significant portion of our costs are fixed or semi-fixed such as rent and labor.
Equipment sales to new and existing franchisee-owned stores also generate significant cash flows. Franchisees either pay in advance or provide evidence of a committed financing arrangement.
Recent Transactions
On November 13, 2018, we entered into a $300 million accelerated share repurchase agreement (the “ASR Agreement”) with Citibank, N.A. (the “Bank”). We will acquire shares under the ASR Agreement as part of our $500 million share repurchase authorization (the “Share Repurchase Authorization”). On November 14, 2018, we paid the Bank $300 million in cash and received approximately 4.6 million shares of our Class A common stock. At final settlement, the Bank may be required to deliver additional shares to us, or, under certain circumstances, we may be required to deliver shares of our Class A common stock or may elect to make a cash payment to the Bank, based generally on the average of the daily volume-weighted average prices of our Class A common stock during the term of the ASR Agreement. The ASR Agreement contains provisions customary for agreements of this type, including provisions for adjustments to the transaction terms, the circumstances generally under which the ASR Agreement may be accelerated, extended or terminated early by the Bank and various acknowledgments, representations and warranties made by the parties to one another. Final settlement of the ASR Agreement is expected to be completed during the second quarter of 2019, although the settlement may be accelerated at the Bank’s option. Following the ASR there is approximately $157.9 million remaining on the Share Repurchase Authorization.
On August 10, 2018, we purchased from one of our franchisees certain assets associated with four franchisee-owned stores in Colorado for a cash payment of $17,249. We financed the purchase through cash on hand. The acquired stores are included in the Corporate-owned stores segment.
On August 1, 2018, Planet Fitness Master Issuer LLC, our limited-purpose, bankruptcy remote, indirect subsidiary(the “Master Issuer”), completed a refinancing transaction, pursuant to which it issued $575 million in aggregate principal amount of Series 2018-1 4.262% Fixed Rate Senior Secured Notes, Class A-2-I (the “Class A-2-I Notes”) and $625 million in aggregate principal amount of Series 2018-1 4.666% Fixed Rate Senior Secured Notes, Class A-2-II (the “Class A-2-II Notes” and together with the Class A-2-I Notes, the “Class A-2 Notes”) in an offering exempt from registration under the Securities Act of 1933, as amended. In connection with the issuance of the Class A-2 Notes, the Master Issuer also entered into the previously announced revolving financing facility that allows for the issuance of up to $75 million in Series 2018-1 Variable Funding Senior Notes, Class A-1 (the “Variable Funding Notes”), and certain letters of credit, all of which is currently undrawn. The Class A-2 Notes and the Variable Funding Notes are referred to collectively as the “Notes.” The Class A-2 Notes were issued in a securitization transaction pursuant to which substantially all of our revenue-generating assets in the United States are held by the Master Issuer and certain other limited-purpose, bankruptcy remote, wholly-owned direct and indirect subsidiaries of the Master Issuer that act as Guarantors of the Notes and that have pledged substantially all of their assets to secure the Notes.
On January 1, 2018, we purchased from one of our franchisees certain assets associated with six franchisee-owned stores in New York for a cash payment of $28,503. We financed the purchase through cash on hand. The acquired stores are included in the Corporate-owned stores segment.
On May 26, 2017, we executed the third amendment to our senior secured credit agreement to reduce the applicable interest rate margin for term loan borrowings by 50 basis points, with an additional 25 basis point reduction in applicable interest rate possible
42
in the future so long as the Total Net Leverage Ratio (as defined in the credit agreement) is less than 3.50 to 1.00. The amendment to the credit agreement also reduced the interest rate margin for revolving loan borrowings by 25 basis points.
On May 8, 2017, we completed a secondary offering (the “May Secondary Offering”) pursuant to which the Direct TSG Investors and the participating Continuing LLC Owners sold an aggregate of 16,085,510 shares of Class A common stock at a price of $20.28 per share. We did not receive any proceeds from the sale of shares of our Class A common stock offered in the September Secondary Offering.
On March 14, 2017, we completed a secondary offering (the “March Secondary Offering”) pursuant to which the Direct TSG Investors and the participating Continuing LLC Owners sold an aggregate of 15,000,000 shares of Class A common stock at a price of $20.44 per share. We did not receive any proceeds from the sale of shares of our Class A common stock offered in the September Secondary Offering.
On November 22, 2016, we completed a secondary offering (the “November Secondary Offering”) pursuant to which the Direct TSG Investors and the participating Continuing LLC Owners sold an aggregate of 15,000,000 shares of Class A common stock at a price of $23.22 per share. We did not receive any proceeds from the sale of shares of our Class A common stock offered in the November Secondary Offering.
On November 10, 2016, we declared a special cash dividend of $2.78 per share which was paid on December 5, 2016 to the Class A common stock holders of record as of November 22, 2016. The dividend, which together with other dividend equivalent payments (including payments of $2.78 per unit to Continuing LLC Owners), resulted in an aggregate cash payment of $271.0 million.
On November 10, 2016, we executed the second amendment to our senior secured credit agreement to a) decrease the interest rate spread on our term loan by 25 basis points, b) increase the aggregate principal amount of the term loans by $230.0 million to $718.5 million, and c) increase the aggregate revolving commitments by $35.0 million to $75.0 million.
On September 28, 2016, we completed a secondary offering (the “September Secondary Offering”) pursuant to which the Direct TSG Investors and participating Continuing LLC Owners sold an aggregate of 8,000,000 shares of Class A common stock at a price of $19.62 per share. We did not receive any proceeds from the sale of shares of our Class A common stock offered in the September Secondary Offering.
On June 28, 2016, we completed a secondary offering (the “June Secondary Offering”) pursuant to which the Direct TSG Investors and participating Continuing LLC Owners sold an aggregate of 11,500,000 shares of Class A common stock at a price of $16.50 per share. We did not receive any proceeds from the sale of shares of our Class A common stock offered in the June Secondary Offering.
Seasonality
Our results are subject to seasonality fluctuations in that member joins are typically higher in January as compared to other months of the year. In addition, our quarterly results may fluctuate significantly because of several factors, including the timing of store openings, timing of price increases for enrollment fees and monthly membership dues and general economic conditions.
See Note 20 to our consolidated financial statements included elsewhere in this Form 10-K for our total revenues, income from operations and net income for each of the quarters during the years ended
December 31, 2018
and
2017
.
Our Segments
We operate and manage our business in three business segments: Franchise, Corporate-owned stores and Equipment. Our Franchise segment includes operations related to our franchising business in the United States, Puerto Rico, Canada, the Dominican Republic, Panama and Mexico. Our Corporate-owned stores segment includes operations with respect to all corporate-owned stores throughout the United States and Canada. The Equipment segment includes the sale of equipment to franchisee-owned stores in the U.S. We evaluate the performance of our segments and allocate resources to them based on revenue and earnings before interest, taxes, depreciation and amortization, referred to as Segment EBITDA. Revenue and Segment EBITDA for all operating segments include only transactions with unaffiliated customers and do not include intersegment transactions. The tables below summarize the financial information for our segments for the years ended
December 31, 2018
,
2017
and
2016
. “Corporate and other,” as it relates to Segment EBITDA, primarily includes corporate overhead costs, such as payroll and related benefit costs and professional services that are not directly attributable to any individual segment.
43
|
|
Year Ended December 31,
|
||||||||||
|
|
2018
|
2017
|
2016
|
||||||||
|
(in thousands)
|
|
|
|
||||||||
|
Revenue
|
|
|
|
||||||||
|
Franchise segment
|
$
|
224,140
|
|
$
|
150,155
|
|
$
|
116,488
|
|
||
|
Corporate-owned stores segment
|
138,599
|
|
112,114
|
|
104,721
|
|
|||||
|
Equipment segment
|
210,159
|
|
167,673
|
|
157,032
|
|
|||||
|
Total revenue
|
$
|
572,898
|
|
$
|
429,942
|
|
$
|
378,241
|
|
||
|
Segment EBITDA
|
|
|
|
||||||||
|
Franchise segment
|
$
|
152,571
|
|
$
|
126,459
|
|
$
|
97,256
|
|
||
|
Corporate-owned stores segment
|
56,704
|
|
46,855
|
|
40,847
|
|
|||||
|
Equipment segment
|
47,607
|
|
38,539
|
|
36,439
|
|
|||||
|
Corporate and other
(2)
|
(43,753
|
)
|
284,372
|
|
(26,007
|
)
|
|||||
|
Total Segment EBITDA
(1)
|
$
|
213,129
|
|
$
|
496,225
|
|
$
|
148,535
|
|
||
|
(1)
|
Total Segment EBITDA is equal to EBITDA, which is a metric that is not presented in accordance with GAAP. Refer to “—Non-GAAP Financial Measures” for a definition of EBITDA and a reconciliation to net income, the most directly comparable GAAP measure.
|
|
(2)
|
In the year ended December 31, 2017, includes a gain of $316,813 related to the
remeasurement of the Company’s tax benefit arrangement liabilities pursuant to the 2017 Tax Act.
|
A reconciliation of income from operations to Segment EBITDA is set forth below:
|
(in thousands)
|
Franchise
|
Corporate-owned
stores
|
Equipment
|
Corporate and
other
|
Total
|
||||||||||||||
|
Year Ended December 31, 2018
|
|
|
|
|
|
||||||||||||||
|
Income (loss) from operations
|
$
|
144,731
|
|
$
|
36,996
|
|
$
|
42,580
|
|
$
|
(40,263
|
)
|
$
|
184,044
|
|
||||
|
Depreciation and amortization
|
7,859
|
|
20,427
|
|
5,027
|
|
1,947
|
|
35,260
|
|
|||||||||
|
Other income (expense)
|
(19
|
)
|
(719
|
)
|
—
|
|
(5,437
|
)
|
(6,175
|
)
|
|||||||||
|
Segment EBITDA
(1)
|
$
|
152,571
|
|
$
|
56,704
|
|
$
|
47,607
|
|
$
|
(43,753
|
)
|
$
|
213,129
|
|
||||
|
Year Ended December 31, 2017
|
|
|
|
|
|
||||||||||||||
|
Income (loss) from operations
|
$
|
118,035
|
|
$
|
30,702
|
|
$
|
32,401
|
|
$
|
(33,602
|
)
|
$
|
147,536
|
|
||||
|
Depreciation and amortization
|
8,449
|
|
15,715
|
|
6,031
|
|
1,566
|
|
31,761
|
|
|||||||||
|
Other income (expense)
(2)
|
(25
|
)
|
438
|
|
107
|
|
316,408
|
|
316,928
|
|
|||||||||
|
Segment EBITDA
(1)
|
$
|
126,459
|
|
$
|
46,855
|
|
$
|
38,539
|
|
$
|
284,372
|
|
$
|
496,225
|
|
||||
|
Year Ended December 31, 2016
|
|
|
|
|
|
||||||||||||||
|
Income (loss) from operations
|
$
|
88,756
|
|
$
|
24,829
|
|
$
|
28,482
|
|
$
|
(26,405
|
)
|
$
|
115,662
|
|
||||
|
Depreciation and amortization
|
8,538
|
|
15,882
|
|
6,203
|
|
879
|
|
31,502
|
|
|||||||||
|
Other income (expense)
|
(38
|
)
|
136
|
|
1,754
|
|
(481
|
)
|
1,371
|
|
|||||||||
|
Segment EBITDA
(1)
|
$
|
97,256
|
|
$
|
40,847
|
|
$
|
36,439
|
|
$
|
(26,007
|
)
|
$
|
148,535
|
|
||||
|
(1)
|
Total Segment EBITDA is equal to EBITDA, which is a metric that is not presented in accordance with GAAP. Refer to “—Non-GAAP Financial Measures” for a definition of EBITDA and a reconciliation to net income, the most directly comparable GAAP measure.
|
|
(2)
|
Includes a gain of $316,813 in the Corporate and other segment related to the
remeasurement of the Company’s tax benefit arrangement liabilities pursuant to the 2017 Tax Act.
|
44
How We Assess the Performance of Our Business
In assessing the performance of our business, we consider a variety of performance and financial measures. The key measures for determining how our business is performing include total monthly dues and annual fees from members (which we refer to as system-wide sales), the number of new store openings, same store sales for both corporate-owned and franchisee-owned stores, average royalty fee percentages for franchisee-owned stores, monthly PF Black Card membership penetration percentage, EBITDA, Adjusted EBITDA, Segment EBITDA, four-wall EBITDA, Adjusted net income, and Adjusted net income per share, diluted. See “—Non-GAAP Financial Measures” below for our definition of EBITDA, Adjusted EBITDA, four-wall EBITDA, Adjusted net income, and Adjusted net income per share, diluted and why we present EBITDA, Adjusted EBITDA, four-wall EBITDA, Adjusted net income, and Adjusted net income per share, diluted, and for a reconciliation of our EBITDA, Adjusted EBITDA, and Adjusted net income to net income, the most directly comparable financial measure calculated and presented in accordance with GAAP, and a reconciliation of adjusted net income per share, diluted to net income per share, diluted, the most directly comparable financial measure calculated in accordance with GAAP.
Total monthly dues and annual fees from members (system-wide sales)
We review the total amount of dues we collect from our members on a monthly basis, which allows us to assess changes in the performance of our corporate-owned and franchisee-owned stores from period to period, any competitive pressures, local or regional membership traffic patterns and general market conditions that might impact our store performance. We collect monthly dues on or around the 17
th
of every month. We collect annual fees once per year from each member based upon when the member signed his or her membership agreement. System-wide sales were $
2.8
billion, $
2.3
billion and $
1.9
billion, during the years ended
December 31, 2018
,
2017
and
2016
, respectively.
Number of new store openings
The number of new store openings reflects stores opened during a particular reporting period for both corporate-owned and franchisee-owned stores. Opening new stores is an important part of our growth strategy and we expect the majority of our future new stores will be franchisee-owned. Before we obtain the certificate of occupancy or report any revenue for new corporate-owned stores, we incur pre-opening costs, such as rent expense, labor expense and other operating expenses. Some of our stores open with an initial start-up period of higher than normal marketing and operating expenses, particularly as a percentage of monthly revenue. New stores may not be profitable and their revenue may not follow historical patterns. The following table shows the growth in our corporate-owned and franchisee-owned store base for the years ended
December 31, 2018
,
2017
and
2016
:
|
|
Year Ended December 31,
|
|||||||
|
|
2018
|
2017
|
2016
|
|||||
|
Franchisee-owned stores:
|
|
|
|
|||||
|
Stores operated at beginning of period
|
1,456
|
|
1,255
|
|
1,066
|
|
||
|
New stores opened
|
226
|
|
206
|
|
195
|
|
||
|
Stores debranded, sold or consolidated
(1)
|
(16
|
)
|
(5
|
)
|
(6
|
)
|
||
|
Stores operated at end of period
|
1,666
|
|
1,456
|
|
1,255
|
|
||
|
Corporate-owned stores:
|
||||||||
|
Stores operated at beginning of period
|
62
|
|
58
|
|
58
|
|
||
|
New stores opened
|
4
|
|
4
|
|
—
|
|
||
|
Stores acquired from franchisees
|
10
|
|
—
|
|
—
|
|
||
|
Stores operated at end of period
|
76
|
|
62
|
|
58
|
|
||
|
Total stores:
|
||||||||
|
Stores operated at beginning of period
|
1,518
|
|
1,313
|
|
1,124
|
|
||
|
New stores opened
|
230
|
|
210
|
|
195
|
|
||
|
Stores debranded, sold or consolidated
(1)
|
(6
|
)
|
(5
|
)
|
(6
|
)
|
||
|
Stores operated at end of period
|
1,742
|
|
1,518
|
|
1,313
|
|
||
|
(1)
|
The term “debranded” refers to a franchisee-owned store whose right to use the Planet Fitness brand and marks has been terminated in accordance with the franchise agreement. We retain the right to prevent debranded stores from continuing to operate as fitness centers. The term “consolidated” refers to the combination of a franchisee’s store with another store located in close proximity with our prior approval. This often coincides with an enlargement, re-equipment and/or refurbishment of the remaining store.
|
45
Same store sales
Same store sales refers to year-over-year sales comparisons for the same store sales base of both corporate-owned and franchisee-owned stores. We define the same store sales base to include those stores that have been open and for which monthly membership dues have been billed for longer than 12 months. We measure same store sales based solely upon monthly dues billed to members of our corporate-owned and franchisee-owned stores.
Several factors affect our same store sales in any given period, including the following:
|
•
|
the number of stores that have been in operation for more than 12 months;
|
|
•
|
the percentage mix of PF Black Card and standard memberships in any period;
|
|
•
|
growth in total memberships per store;
|
|
•
|
consumer recognition of our brand and our ability to respond to changing consumer preferences;
|
|
•
|
overall economic trends, particularly those related to consumer spending;
|
|
•
|
our and our franchisees’ ability to operate stores effectively and efficiently to meet consumer expectations;
|
|
•
|
marketing and promotional efforts;
|
|
•
|
local competition;
|
|
•
|
trade area dynamics; and
|
|
•
|
opening of new stores in the vicinity of existing locations.
|
Consistent with common industry practice, we present same store sales as compared to the same period in the prior year for all stores that have been open and for which monthly membership dues have been billed for longer than 12 months, beginning with the thirteenth month and thereafter, as applicable. Same store sales of our international stores are calculated on a constant currency basis, meaning that we translate the current year’s same store sales of our international stores at the same exchange rates used in the prior year. Since opening new stores will be a significant component of our revenue growth, same store sales is only one measure of how we evaluate our performance.
Stores acquired from or sold to franchisees are removed from the franchisee-owned or corporate-owned same store sales base, as applicable, upon the ownership change and for the twelve months following the date of the ownership change. These stores are included in the corporate-owned or franchisee-owned same store sales base, as applicable, following the twelfth month after the acquisition or sale. These stores remain in the system-wide same store sales base in all periods.
The following table shows our same store sales for the years ended
December 31, 2018
,
2017
and
2016
:
|
|
Year Ended December 31,
|
|||||||
|
|
2018
|
2017
|
2016
|
|||||
|
Same store sales growth:
|
|
|
|
|
|
|
||
|
Franchisee-owned stores
|
10.4
|
%
|
10.5
|
%
|
9.0
|
%
|
||
|
Corporate-owned stores
|
6.5
|
%
|
4.9
|
%
|
4.9
|
%
|
||
|
System-wide stores
|
10.2
|
%
|
10.2
|
%
|
8.8
|
%
|
||
|
Number of stores in same store sales base:
|
||||||||
|
Franchisee-owned stores
|
1,390
|
|
1,213
|
|
1,027
|
|
||
|
Corporate-owned stores
|
62
|
|
58
|
|
58
|
|
||
|
Total stores
|
1,462
|
|
1,271
|
|
1,085
|
|
||
Net member growth per store
Net member growth per store refers to the change in total members in relation to total stores over time. We capture all membership changes daily through our point-of-sale system. We monitor a combination of membership growth, average members per store, average monthly EFT, transfers from or to an individual store location and daily cash collected for enrollment fees related to new members. We seek to make it simple for members to join, whether online or in-store, and, while some memberships require a cancellation fee, we offer, and require our franchisees to offer, a non-committal membership option. This approach to memberships is part of our commitment to appeal to new and occasional gym users. As a result, we do not measure membership attrition as an operating metric in assessing our performance. We primarily attribute our membership growth to the growth of our franchisee-owned store base.
46
Average royalty fee percentages for the franchisee-owned stores
The average royalty fee percentage represents royalties collected by us from our franchisees as a percentage of the monthly membership dues and annual fees that are billed by the franchisees to their member base. We have varying royalty fee structures with our franchisee base, ranging from a tiered monthly fee to a royalty of 7.0% of total monthly EFT and annual membership fees across our franchisee base. Our royalty fee in the U.S. and Canada has increased over time to a current rate of 7.0% for new franchisees.
PF Black Card penetration percentage
Our PF Black Card penetration percentage represents the number of our members that have opted to enroll in our PF Black Card membership program as a percentage of our total active membership base. PF Black Card members pay higher monthly membership dues than our standard membership and receive additional benefits for these additional fees. These benefits include access to all of our stores system-wide and access to exclusive areas in our stores that provide amenities such as water massage beds, massage chairs, tanning equipment and more. We view PF Black Card penetration percentage as a critical metric in assessing the performance and growth of our business.
Non-GAAP Financial Measures
We refer to EBITDA, Adjusted EBITDA and four-wall EBITDA as we use these measures to evaluate our operating performance and we believe these measures are useful to investors in evaluating our performance. EBITDA, Adjusted EBITDA and four-wall EBITDA as presented in this Form 10-K are supplemental measures of our performance that are neither required by, nor presented in accordance with GAAP. EBITDA, Adjusted EBITDA, and four-wall EBITDA should not be considered as substitutes for GAAP metrics such as net income or any other performance measures derived in accordance with GAAP. Also, in the future we may incur expenses or charges such as those added back to calculate Adjusted EBITDA. Our presentation of EBITDA, Adjusted EBITDA, and four-wall EBITDA should not be construed as an inference that our future results will be unaffected by unusual or nonrecurring items. We have also disclosed Segment EBITDA as an important financial metric utilized by the Company to evaluate performance and allocate resources to segments in accordance with ASC 280, Segment Reporting. As part of such disclosure in “Our Segments” within Management’s Discussion and Analysis of Financial Condition and Results of Operations, the Company has provided a reconciliation from income from operations to Total Segment EBITDA, which is equal to the Non-GAAP financial metric EBITDA.
We define EBITDA as net income before interest, taxes, depreciation and amortization. We believe that EBITDA, which eliminates the impact of certain expenses that we do not believe reflect our underlying business performance, provides useful information to investors to assess the performance of our segments as well as the business as a whole. Our Board of Directors also uses EBITDA as a key metric to assess the performance of management. We define Adjusted EBITDA as net income before interest, taxes, depreciation and amortization, adjusted for the impact of certain additional non-cash and other items that we do not consider in our evaluation of ongoing performance of the Company’s core operations. These items include certain purchase accounting adjustments, management fees, certain IT system upgrade costs, transaction fees, stock offering-related costs, IPO-related compensation expense, severance expense, pre-opening costs and certain other charges and gains. We believe that Adjusted EBITDA is an appropriate measure of operating performance in addition to EBITDA because it eliminates the impact of other items that we believe reduce the comparability of our underlying core business performance from period to period and is therefore useful to our investors in comparing the core performance of our business from period to period. Four-wall EBITDA is an assessment of store-level profitability for stores included in the same-store-sales base, which adjusts for certain administrative and other items that we do not consider in our evaluation of store-level performance.
47
A reconciliation of net income to EBITDA and Adjusted EBITDA is set forth below for the years ended
December 31, 2018
,
2017
and
2016
:
|
|
Year Ended December 31,
|
||||||||||
|
|
2018
|
2017
|
2016
|
||||||||
|
(in thousands)
|
|
|
|
|
|||||||
|
Net income
|
$
|
103,162
|
|
$
|
55,601
|
|
$
|
71,247
|
|
||
|
Interest income
|
(4,681
|
)
|
(54
|
)
|
(21
|
)
|
|||||
|
Interest expense
(1)
|
50,746
|
|
35,337
|
|
27,146
|
|
|||||
|
Provision for income taxes
(2)
|
28,642
|
|
373,580
|
|
18,661
|
|
|||||
|
Depreciation and amortization
|
35,260
|
|
31,761
|
|
31,502
|
|
|||||
|
EBITDA
|
213,129
|
|
496,225
|
|
148,535
|
|
|||||
|
Purchase accounting adjustments-revenue
(3)
|
1,019
|
|
1,532
|
|
487
|
|
|||||
|
Purchase accounting adjustments-rent
(4)
|
732
|
|
725
|
|
861
|
|
|||||
|
Loss on reacquired franchise rights
(5)
|
360
|
|
—
|
|
—
|
|
|||||
|
Transaction fees
(6)
|
307
|
|
1,030
|
|
3,001
|
|
|||||
|
Stock offering-related costs
(7)
|
—
|
|
977
|
|
2,604
|
|
|||||
|
Severance costs
(8)
|
352
|
|
—
|
|
423
|
|
|||||
|
Pre-opening costs
(9)
|
1,461
|
|
1,017
|
|
—
|
|
|||||
|
Early lease termination costs
(10)
|
—
|
|
719
|
|
—
|
|
|||||
|
Equipment discount
(11)
|
—
|
|
(107
|
)
|
(1,754
|
)
|
|||||
|
Indemnification receivable
(12)
|
342
|
|
—
|
|
(2,772
|
)
|
|||||
|
Tax benefit arrangement remeasurement
(13)
|
4,765
|
|
(317,354
|
)
|
72
|
|
|||||
|
Other
(14)
|
733
|
|
(32
|
)
|
(840
|
)
|
|||||
|
Adjusted EBITDA
|
$
|
223,200
|
|
$
|
184,732
|
|
$
|
150,617
|
|
||
|
(1)
|
Includes $4.6 million and $0.6 million of loss on extinguishment of debt in the years ended December 31, 2018 and 2016, respectively.
|
|
(2)
|
Includes $334.0 million in the year ended December 31, 2017 related to the remeasurement of our deferred tax assets pursuant to the 2017 Tax Act.
|
|
(3)
|
Represents the impact of revenue-related purchase accounting adjustments associated with the 2012 Acquisition. At the time of the 2012 Acquisition, the Company maintained a deferred revenue account, which consisted of deferred area development agreement fees, deferred franchise fees, and deferred enrollment fees that the Company billed and collected up front but recognizes for GAAP purposes at a later date. In connection with the 2012 Acquisition, it was determined that the carrying amount of deferred revenue was greater than the fair value assessed in accordance with ASC 805—Business Combinations, which resulted in a write-down of the carrying value of the deferred revenue balance upon application of acquisition push-down accounting under ASC 805. For the years ended
December 31, 2018
,
2017
and
2016
, these amounts represent the additional revenue that would have been recognized in those years if the write-down to deferred revenue had not occurred in connection with the application of acquisition pushdown accounting.
|
|
(4)
|
Represents the impact of rent related purchase accounting adjustments. In accordance with guidance in ASC 805 – Business Combinations, in connection with the 2012 Acquisition, the Company’s deferred rent liability was required to be written off as of the acquisition date and rent is being recorded on a straight-line basis from the acquisition date through the end of the lease term. This resulted in higher overall rent expense each period than would have otherwise been recorded had the deferred rent liability not been written off as a result of the acquisition push down accounting applied in accordance with ASC 805. Adjustments of $0.4 million, $0.4 million and $0.5 million in the years ended
December 31, 2018
,
2017
and
2016
, respectively, reflect the difference between the higher rent expense recorded in accordance with GAAP since the acquisition and the rent expense that would have been recorded had the 2012 Acquisition not occurred. Adjustments of $0.4 million, $0.3 million and $0.4 million for the years ended
December 31, 2018
,
2017
and
2016
, respectively, are due to the amortization of favorable and unfavorable lease intangible assets. All of the rent related purchase accounting adjustments are adjustments to rent expense which is included in store operations on our consolidated statements of operations.
|
|
(5)
|
Represents the impact of a non-cash loss recorded in accordance with ASC 805 - Business Combinations related to our acquisition of six franchisee-owned stores on January 1, 2018 and our acquisition of four franchisee-owned stores on August 10, 2018. The loss recorded under GAAP represents the difference between the fair value of the reacquired franchise rights and the contractual terms of the reacquired franchise rights and is included in other (gain) loss on our consolidated statements of operations.
|
48
|
(6)
|
Represents transaction fees and expenses that could not be capitalized related to the issuance of our Series 2018-1 Senior Notes in the year ended December 31, 2018, and related to the amendment of our credit facility in the years ended December 31,
2017
and
2016
.
|
|
(7)
|
Represents legal, accounting and other costs incurred in connection with offerings of the Company’s Class A common stock.
|
|
(8)
|
Represents severance expense recorded in connection with an equity award modification.
|
|
(9)
|
Represents costs associated with new corporate-owned stores incurred prior to the store opening, including payroll-related costs, rent and occupancy expenses, marketing and other store operating supply expenses.
|
|
(10)
|
Represents charges and expenses incurred in connection with the early termination of the lease for our previous headquarters.
|
|
(11)
|
Represents a gain recorded in connection with the write-off of a previously accrued deferred equipment discount that was not utilized. This amount was originally recognized through purchase accounting in connection with the acquisition of eight franchisee-owned stores on March 31, 2014.
|
|
(12)
|
Represents a receivable recorded in connection with a contractual obligation of the Company’s co-founders to indemnify the Company with respect to pre-IPO tax liabilities pursuant to the 2012 Acquisition.
|
|
(13)
|
Represents gains and losses related to the adjustment of our tax benefit arrangements primarily due to changes in our effective tax rate. In the year ended December 31, 2017, this amount includes a gain of $316.8 million related to the remeasurement of the Company’s tax benefit arrangement liabilities pursuant to the 2017 Tax Act.
|
|
(14)
|
Represents certain other charges and gains that we do not believe reflect our underlying business performance. In 2018 this amount includes expense of $0.6 million related to the write off of certain assets that were being tested for potential use across the system. In 2016, the net gain primarily related to proceeds received from an insurance settlement.
|
Adjusted net income assumes all net income is attributable to Planet Fitness, Inc., which assumes the full exchange of all outstanding Holdings Units for shares of Class A common stock of Planet Fitness, Inc., adjusted for certain non-recurring items that we do not believe directly reflect our core operations. Adjusted net income per share, diluted is calculated by dividing Adjusted net income by the total weighted-average shares of Class A common stock outstanding assuming the full exchange of all outstanding Holdings Units and corresponding Class B common stock as of the beginning of each period presented. Adjusted net income and Adjusted net income per share, diluted are supplemental measures of operating performance that do not represent and should not be considered alternatives to net income and earnings per share, as determined by GAAP. We believe Adjusted net income and Adjusted net income per share, diluted supplement GAAP measures and enable us to more effectively evaluate our performance period-over-period. A reconciliation of Adjusted net income to net income, the most directly comparable GAAP measure, and the computation of Adjusted net income per share, diluted are set forth below.
49
|
|
Year Ended December 31,
|
||||||||||
|
(in thousands, except per share data)
|
2018
|
2017
|
2016
|
||||||||
|
Net income
|
$
|
103,162
|
|
$
|
55,601
|
|
$
|
71,247
|
|
||
|
Provision for income taxes, as reported
(1)
|
28,642
|
|
373,580
|
|
18,661
|
|
|||||
|
Purchase accounting adjustments-revenue
(2)
|
1,019
|
|
1,532
|
|
487
|
|
|||||
|
Purchase accounting adjustments-rent
(3)
|
732
|
|
725
|
|
861
|
|
|||||
|
Loss on reacquired franchise rights
(4)
|
360
|
|
—
|
|
—
|
|
|||||
|
Transaction fees
(5)
|
307
|
|
1,030
|
|
3,001
|
|
|||||
|
Loss on extinguishment of debt
(6)
|
4,570
|
|
—
|
|
606
|
|
|||||
|
Stock offering-related costs
(7)
|
—
|
|
977
|
|
2,604
|
|
|||||
|
Severance costs
(8)
|
352
|
|
—
|
|
423
|
|
|||||
|
Pre-opening costs
(9)
|
1,461
|
|
1,017
|
|
—
|
|
|||||
|
Early lease termination costs
(10)
|
—
|
|
1,143
|
|
—
|
|
|||||
|
Equipment discount
(11)
|
—
|
|
(107
|
)
|
(1,754
|
)
|
|||||
|
Indemnification receivable
(12)
|
342
|
|
—
|
|
(2,772
|
)
|
|||||
|
Tax benefit arrangement remeasurement
(13)
|
4,765
|
|
(317,354
|
)
|
72
|
|
|||||
|
Other
(14)
|
733
|
|
(32
|
)
|
(522
|
)
|
|||||
|
Purchase accounting amortization
(15)
|
15,716
|
|
17,876
|
|
19,371
|
|
|||||
|
Adjusted income before income taxes
|
$
|
162,161
|
|
$
|
135,988
|
|
$
|
112,285
|
|
||
|
Adjusted income taxes
(16)
|
42,648
|
|
53,715
|
|
44,353
|
|
|||||
|
Adjusted net income
|
$
|
119,513
|
|
$
|
82,273
|
|
$
|
67,932
|
|
||
|
Adjusted net income per share, diluted
|
$
|
1.22
|
|
$
|
0.84
|
|
$
|
0.69
|
|
||
|
Adjusted weighted-average shares outstanding, diluted
(17)
|
97,950
|
|
98,455
|
|
98,611
|
|
|||||
|
(1)
|
Includes $334.0 million in the year ended December 31, 2017 related to the remeasurement of our deferred tax assets pursuant to the 2017 Tax Act.
|
|
(2)
|
Represents the impact of revenue-related purchase accounting adjustments associated with the 2012 Acquisition. At the time of the 2012 Acquisition, the Company maintained a deferred revenue account, which consisted of deferred area development agreement fees, deferred franchise fees, and deferred enrollment fees that the Company billed and collected up front but recognizes for GAAP purposes at a later date. In connection with the 2012 Acquisition, it was determined that the carrying amount of deferred revenue was greater than the fair value assessed in accordance with ASC 805—Business Combinations, which resulted in a write-down of the carrying value of the deferred revenue balance upon application of acquisition push-down accounting under ASC 805. For the years ended
December 31, 2018
,
2017
and
2016
, these amounts represent the additional revenue that would have been recognized in those years if the write-down to deferred revenue had not occurred in connection with the application of acquisition pushdown accounting.
|
|
(3)
|
Represents the impact of rent related purchase accounting adjustments. In accordance with guidance in ASC 805 – Business Combinations, in connection with the 2012 Acquisition, the Company’s deferred rent liability was required to be written off as of the acquisition date and rent is being recorded on a straight-line basis from the acquisition date through the end of the lease term. This resulted in higher overall rent expense each period than would have otherwise been recorded had the deferred rent liability not been written off as a result of the acquisition push down accounting applied in accordance with ASC 805. Adjustments of $0.4 million, $0.4 million and $0.5 million in the years ended
December 31, 2018
,
2017
and
2016
, respectively, reflect the difference between the higher rent expense recorded in accordance with GAAP since the acquisition and the rent expense that would have been recorded had the 2012 Acquisition not occurred. Adjustments of $0.4 million, $0.3 million and $0.4 million for the years ended
December 31, 2018
,
2017
and
2016
, respectively, are due to the amortization of favorable and unfavorable lease intangible assets. All of the rent related purchase accounting adjustments are adjustments to rent expense which is included in store operations on our consolidated statements of operations.
|
|
(4)
|
Represents the impact of a non-cash loss recorded in accordance with ASC 805 - Business Combinations related to our acquisition of six franchisee-owned stores on January 1, 2018 and our acquisition of four franchisee-owned stores on August 10, 2018. The loss recorded under GAAP represents the difference between the fair value of the reacquired franchise rights and the contractual terms of the reacquired franchise rights and is included in other (gain) loss on our consolidated statements of operations.
|
|
(5)
|
Represents transaction fees and expenses that could not be capitalized related to the issuance of our Series 2018-1 Senior Notes in the year ended December 31, 2018, and related to the amendment of our credit facility in the years ended December 31,
2017
and
2016
.
|
50
|
(6)
|
Represents a loss on extinguishment of debt related to the write-off of deferred financing costs associated with the Term Loan B which the Company repaid in August 2018, and a loss on extinguishment of debt associated with the amendment of our credit facility in 2016.
|
|
(7)
|
Represents legal, accounting and other costs incurred in connection with offerings of the Company’s Class A common stock.
|
|
(8)
|
Represents severance expense recorded in connection with an equity award modification.
|
|
(9)
|
Represents costs associated with new corporate-owned stores incurred prior to the store opening, including payroll-related costs, rent and occupancy expenses, marketing and other store operating supply expenses.
|
|
(10)
|
Represents charges and expenses incurred in connection with the early termination of the lease for our previous headquarters.
|
|
(11)
|
Represents a gain recorded in connection with the write-off of a previously accrued deferred equipment discount that was not utilized. This amount was originally recognized through purchase accounting in connection with the acquisition of eight franchisee-owned stores on March 31, 2014.
|
|
(12)
|
Represents a receivable recorded in connection with a contractual obligation of the Company’s co-founders to indemnify the Company with respect to pre-IPO tax liabilities pursuant to the 2012 Acquisition.
|
|
(13)
|
Represents gains and losses related to the adjustment of our tax benefit arrangements primarily due to changes in our effective tax rate. In the year ended December 31, 2017, includes a gain of $316.8 million related to the remeasurement of the Company’s tax benefit arrangement liabilities pursuant to the 2017 Tax Act.
|
|
(14)
|
Represents certain other charges and gains that we do not believe reflect our underlying business performance. In 2018 this amount includes expense of $0.6 million related to the write off of certain assets that were being tested for potential use across the system. In 2016, the net gain primarily related to proceeds received from an insurance settlement.
|
|
(15)
|
Includes $12.4 million, $15.7 million and $16.9 million of amortization of intangible assets, other than favorable leases, for the years ended
December 31, 2018
,
2017
and
2016
, respectively recorded in connection with the 2012 Acquisition, and $3.3 million, $2.1 million and $2.5 million of amortization of intangible assets for the years ended
December 31, 2018
,
2017
and
2016
, respectively, created in connection with historical acquisitions of franchisee-owned stores. The adjustment represents the amount of actual non-cash amortization expense recorded, in accordance with GAAP, in each period.
|
|
(16)
|
Represents corporate income taxes at an assumed effective tax rate of 26.3%, 39.5% and 39.4% for the years ended December 31, 2017, 2016 and 2015, respectively, applied to adjusted income before income taxes.
|
|
(17)
|
Assumes the full exchange of all outstanding Holdings Units and corresponding shares of Class B common stock for shares of Class A common stock of Planet Fitness, Inc.
|
A reconciliation of net income per share, diluted, to Adjusted net income per share, diluted, is set forth below for the years ended
December 31, 2018
,
2017
and
2016
:
|
|
Year Ended December 31, 2018
|
|||||||||
|
(in thousands, except per share amounts)
|
Net income
|
Weighted Average Shares
|
Net income per share, diluted
|
|||||||
|
Net income attributable to Planet Fitness, Inc.
(1)
|
$
|
88,021
|
|
87,675
|
|
$
|
1.00
|
|
||
|
Assumed exchange of shares
(2)
|
15,141
|
|
10,275
|
|
||||||
|
Net Income
|
103,162
|
|
||||||||
|
Adjustments to arrive at adjusted income before income taxes
(3)
|
58,999
|
|
||||||||
|
Adjusted income before income taxes
|
162,161
|
|
||||||||
|
Adjusted income taxes
(4)
|
42,648
|
|
||||||||
|
Adjusted Net Income
|
$
|
119,513
|
|
97,950
|
|
$
|
1.22
|
|
||
|
(1)
|
Represents net income attributable to Planet Fitness, Inc. for the year ended
December 31, 2018
and the associated weighted average shares of Class A common stock outstanding (see Note 14 to our consolidated financial statements included elsewhere in this Form 10-K).
|
|
(2)
|
Assumes the full exchange of all outstanding Holdings Units and corresponding shares of Class B common stock for shares of Class A common stock of Planet Fitness, Inc. Also assumes the addition of net income attributable to non-controlling interests corresponding with the assumed exchange of Holdings Units and shares of Class B common stock for shares of Class A common stock.
|
|
(3)
|
Represents the total impact of all adjustments identified in the adjusted net income table above to arrive at adjusted income before income taxes.
|
|
(4)
|
Represents corporate income taxes at an assumed effective tax rate of 26.3% applied to adjusted income before income taxes.
|
51
|
|
Year Ended December 31, 2017
|
|||||||||
|
(in thousands, except per share amounts)
|
Net income
|
Weighted Average Shares
|
Net income per share, diluted
|
|||||||
|
Net income attributable to Planet Fitness, Inc.
(1)
|
$
|
33,146
|
|
78,972
|
|
$
|
0.42
|
|
||
|
Assumed exchange of shares
(2)
|
22,455
|
|
19,483
|
|
||||||
|
Net Income
|
55,601
|
|
||||||||
|
Adjustments to arrive at adjusted income before income taxes
(3)
|
80,387
|
|
||||||||
|
Adjusted income before income taxes
|
135,988
|
|
||||||||
|
Adjusted income taxes
(4)
|
53,715
|
|
||||||||
|
Adjusted Net Income
|
$
|
82,273
|
|
98,455
|
|
$
|
0.84
|
|
||
|
(1)
|
Represents net income attributable to Planet Fitness, Inc. for the year ended
December 31, 2017
and the associated weighted average shares of Class A common stock outstanding (see Note 14 to our consolidated financial statements included elsewhere in this Form 10-K).
|
|
(2)
|
Assumes the full exchange of all outstanding Holdings Units and corresponding shares of Class B common stock for shares of Class A common stock of Planet Fitness, Inc. Also assumes the addition of net income attributable to non-controlling interests corresponding with the assumed exchange of Holdings Units and shares of Class B common stock for shares of Class A common stock.
|
|
(3)
|
Represents the total impact of all adjustments identified in the adjusted net income table above to arrive at adjusted income before income taxes.
|
|
(4)
|
Represents corporate income taxes at an assumed effective tax rate of 39.5% applied to adjusted income before income taxes.
|
|
|
Year Ended December 31, 2016
|
|||||||||
|
(in thousands, except per share amounts)
|
Net income
|
Weighted Average Shares
|
Net income per share, diluted
|
|||||||
|
Net income attributable to Planet Fitness, Inc.
(1)
|
$
|
21,500
|
|
43,305
|
|
$
|
0.50
|
|
||
|
Assumed exchange of shares
(2)
|
49,747
|
|
55,306
|
|
||||||
|
Net Income
|
71,247
|
|
||||||||
|
Adjustments to arrive at adjusted income before income taxes
(3)
|
41,038
|
|
||||||||
|
Adjusted income before income taxes
|
112,285
|
|
||||||||
|
Adjusted income taxes
(4)
|
44,353
|
|
||||||||
|
Adjusted Net Income
|
$
|
67,932
|
|
98,611
|
|
$
|
0.69
|
|
||
|
(1)
|
Represents net income attributable to Planet Fitness, Inc. for the year ended
December 31, 2016
, and the associated weighted average shares of Class A common stock outstanding (see Note 14 to our consolidated financial statements included elsewhere in this form 10-K).
|
|
(2)
|
Assumes the full exchange of all outstanding Holdings Units and corresponding shares of Class B common stock for shares of Class A common stock of Planet Fitness, Inc. Also assumes the addition of net income attributable to non-controlling interests corresponding with the assumed exchange of Holdings Units and shares of Class B common stock for shares of Class A common stock.
|
|
(3)
|
Represents the total impact of all adjustments identified in the adjusted net income table above to arrive at adjusted income before income taxes.
|
|
(4)
|
Represents corporate income taxes at an assumed effective tax rate of 39.5% applied to adjusted income before income taxes.
|
52
The following table reconciles corporate-owned stores segment EBITDA to four-wall EBITDA for the year ended
December 31, 2018
:
|
|
Year Ended December 31, 2018
|
|||||||||
|
(in thousands)
|
Revenue
|
EBITDA
|
EBITDA Margin
|
|||||||
|
Corporate-owned stores segment
|
$
|
138,599
|
|
$
|
56,704
|
|
40.9
|
%
|
||
|
New stores
(1)
|
(2,268
|
)
|
1,491
|
|
||||||
|
Selling, general and administrative
(2)
|
—
|
|
4,298
|
|
||||||
|
Impact of eliminations
(3)
|
—
|
|
(592
|
)
|
||||||
|
Purchase accounting adjustments
(4)
|
—
|
|
1,092
|
|
||||||
|
Four-wall EBITDA
|
$
|
136,331
|
|
$
|
62,993
|
|
46.2
|
%
|
||
|
Royalty adjustment
(5)
|
—
|
|
(9,480
|
)
|
||||||
|
Royalty adjusted four-wall EBITDA
|
$
|
136,331
|
|
$
|
53,513
|
|
39.3
|
%
|
||
|
(1)
|
Includes the impact of stores open less than 13 months and those which have not yet opened.
|
|
(2)
|
Reflects administrative costs attributable to the corporate-owned stores segment but not directly related to store operations.
|
|
(3)
|
Reflects intercompany charges for royalties and other fees which are eliminated in consolidation.
|
|
(4)
|
Represents the impact of certain purchase accounting adjustments associated with the 2012 Acquisition and our historical acquisitions of franchisee-owned stores. These are primarily related to fair value adjustments to deferred rent.
|
|
(5)
|
Includes the effect of royalties paid by the franchisee at a rate of 7.0% per our current franchisee agreement.
|
53
Results of Operations
The following table sets forth our consolidated statements of operations as a percentage of total revenue for the years ended
December 31, 2018
,
2017
and
2016
:
|
|
Year ended December 31,
|
|||||||
|
|
2018
|
2017
|
2016
|
|||||
|
Revenue:
|
||||||||
|
Franchise revenue
|
30.6
|
%
|
30.7
|
%
|
25.7
|
%
|
||
|
Commission income
|
1.2
|
%
|
4.2
|
%
|
5.1
|
%
|
||
|
National advertising fund revenue
|
7.3
|
%
|
—
|
%
|
—
|
%
|
||
|
Franchise segment
|
39.1
|
%
|
34.9
|
%
|
30.8
|
%
|
||
|
Corporate-owned stores
|
24.2
|
%
|
26.1
|
%
|
27.7
|
%
|
||
|
Equipment
|
36.7
|
%
|
39.0
|
%
|
41.5
|
%
|
||
|
Total revenue
|
100.0
|
%
|
100.0
|
%
|
100.0
|
%
|
||
|
Operating costs and expenses:
|
||||||||
|
Cost of revenue
|
28.4
|
%
|
30.1
|
%
|
32.3
|
%
|
||
|
Store operations
|
13.1
|
%
|
14.1
|
%
|
15.9
|
%
|
||
|
Selling, general and administrative
|
12.6
|
%
|
14.0
|
%
|
13.2
|
%
|
||
|
National advertising fund expense
|
7.4
|
%
|
—
|
%
|
—
|
%
|
||
|
Depreciation and amortization
|
6.2
|
%
|
7.4
|
%
|
8.3
|
%
|
||
|
Other loss (gain)
|
0.2
|
%
|
0.1
|
%
|
(0.4
|
)%
|
||
|
Total operating costs and expenses
|
67.9
|
%
|
65.7
|
%
|
69.3
|
%
|
||
|
Income from operations
|
32.1
|
%
|
34.3
|
%
|
30.7
|
%
|
||
|
Other income (expense), net:
|
||||||||
|
Interest income
|
0.8
|
%
|
—
|
%
|
—
|
%
|
||
|
Interest expense
|
(8.9
|
)%
|
(8.2
|
)%
|
(7.2
|
)%
|
||
|
Other income (expense), net
|
(1.1
|
)%
|
73.7
|
%
|
0.4
|
%
|
||
|
Total other income (expense), net
|
(9.2
|
)%
|
65.5
|
%
|
(6.8
|
)%
|
||
|
Income before income taxes
|
22.9
|
%
|
99.8
|
%
|
23.9
|
%
|
||
|
Provision for income taxes
|
5.0
|
%
|
86.9
|
%
|
4.9
|
%
|
||
|
Net income
|
17.9
|
%
|
12.9
|
%
|
19.0
|
%
|
||
|
Less net income attributable to non-controlling interests
|
2.6
|
%
|
5.2
|
%
|
13.2
|
%
|
||
|
Net income attributable to Planet Fitness, Inc.
|
15.3
|
%
|
7.7
|
%
|
5.8
|
%
|
||
54
The following table sets forth a comparison of our consolidated statements of operations for the years ended
December 31, 2018
,
2017
and
2016
:
|
|
Year Ended December 31,
|
||||||||||
|
|
2018
|
2017
|
2016
|
||||||||
|
(in thousands)
|
|||||||||||
|
Revenue:
|
|||||||||||
|
Franchise revenue
|
$
|
175,314
|
|
$
|
131,983
|
|
$
|
97,374
|
|
||
|
Commission income
|
6,632
|
|
18,172
|
|
19,114
|
|
|||||
|
National advertising fund revenue
|
42,194
|
|
—
|
|
—
|
|
|||||
|
Franchise segment
|
224,140
|
|
150,155
|
|
116,488
|
|
|||||
|
Corporate-owned stores
|
138,599
|
|
112,114
|
|
104,721
|
|
|||||
|
Equipment
|
210,159
|
|
167,673
|
|
157,032
|
|
|||||
|
Total revenue
|
572,898
|
|
429,942
|
|
378,241
|
|
|||||
|
Operating costs and expenses:
|
|||||||||||
|
Cost of revenue
|
162,646
|
|
129,266
|
|
122,317
|
|
|||||
|
Store operations
|
75,005
|
|
60,657
|
|
60,121
|
|
|||||
|
Selling, general and administrative
|
72,446
|
|
60,369
|
|
50,008
|
|
|||||
|
National advertising fund expense
|
42,619
|
|
—
|
|
—
|
|
|||||
|
Depreciation and amortization
|
35,260
|
|
31,761
|
|
31,502
|
|
|||||
|
Other loss (gain)
|
878
|
|
353
|
|
(1,369
|
)
|
|||||
|
Total operating costs and expenses
|
388,854
|
|
282,406
|
|
262,579
|
|
|||||
|
Income from operations
|
184,044
|
|
147,536
|
|
115,662
|
|
|||||
|
Other income (expense), net:
|
|||||||||||
|
Interest income
|
4,681
|
|
54
|
|
21
|
|
|||||
|
Interest expense
|
(50,746
|
)
|
(35,337
|
)
|
(27,146
|
)
|
|||||
|
Other income (expense), net
|
(6,175
|
)
|
316,928
|
|
1,371
|
|
|||||
|
Total other income (expense), net
|
(52,240
|
)
|
281,645
|
|
(25,754
|
)
|
|||||
|
Income before income taxes
|
131,804
|
|
429,181
|
|
89,908
|
|
|||||
|
Provision for income taxes
|
28,642
|
|
373,580
|
|
18,661
|
|
|||||
|
Net income
|
103,162
|
|
55,601
|
|
71,247
|
|
|||||
|
Less net income attributable to non-controlling interests
|
15,141
|
|
22,455
|
|
49,747
|
|
|||||
|
Net income attributable to Planet Fitness, Inc.
|
$
|
88,021
|
|
$
|
33,146
|
|
$
|
21,500
|
|
||
Comparison of the years ended
December 31, 2018
and
December 31, 2017
Revenue
Total revenues were $
572.9
million in
2018
, compared to $
429.9
million in
2017
, an
increase
of $
143.0
million, or
33.3%
.
Franchise segment revenue was $
224.1
million in the year ended
December 31, 2018
compared to $
150.2
million in the year ended
December 31, 2017
, an
increase
of $
74.0
million, or
49.3%
.
Franchise revenue was $
175.3
million in the year ended
December 31, 2018
compared to $
132.0
million in the year ended
December 31, 2017
, an
increase
of $
43.3
million or
32.8%
. Included in franchise revenue is royalty revenue of $
147.2
million, franchise and other fees of $
16.6
million, and placement revenue of $
11.5
million for the year ended
December 31, 2018
, compared to royalty revenue of $
93.6
million, franchise and other fees of $
27.0
million, and placement revenue of $
11.4
million for the year ended
December 31, 2017
. The $
53.5
million
increase
in royalty revenue was primarily driven by $24.6 million due to higher royalty rates on monthly dues and $8.4 million due to higher royalty rates on annual fees, primarily as a result of the franchise agreements that were amended to increase royalty rates by 1.59% in exchange for a corresponding decrease in franchise and other fees as well as reduced commission income (the "Rebate to Royalty Amendment"). Additionally, $10.1 million was attributable to royalties from new stores in 2018, as well as those that opened in 2017 that were not included in the same store sales base, and $10.4 million attributable to a same store sales increase of
10.4%
in franchisee-owned stores. The $
10.4
million
decrease
in franchise and other fees includes a $9.9 million decrease driven by the Rebate to Royalty Amendment and a $2.7 million decrease due to lower franchise fee revenue primarily associated with the adoption of ASC 606, partially offset by higher web join income
55
of $2.2 million as a result of a higher web join acquisition rate and a higher number of franchisee-owned stores in the year ended
December 31, 2018
as compared to the year ended
December 31, 2017
.
Commission income, which is included in our franchise segment, was $
6.6
million in the year ended
December 31, 2018
compared to $
18.2
million in the year ended
December 31, 2017
, a
decrease
of $
11.5
million or
63.5%
. The decrease was primarily attributable to the Rebate to Royalty Amendment mentioned above.
National advertising fund revenue was $
42.2
million in the year ended
December 31, 2018
, compared to zero in the year ended
December 31, 2017
, as a result of the adoption of the new revenue recognition standard ASC 606. This revenue is offset by national advertising fund expenses below. See Note 10 in the notes to the consolidated financial statements.
Revenue from our corporate-owned stores segment was $
138.6
million in the year ended
December 31, 2018
, compared to $
112.1
million in the year ended
December 31, 2017
, an
increase
of $
26.5
million, or
23.6%
. Of the $
26.5
million increase, $18.5 million was due to higher revenue from corporate-owned stores newly opened or acquired since January 1, 2017, $6.1 million was from higher same store sales from corporate-owned stores which increased
6.5%
in the year ended
December 31, 2018
, and $1.8 million was attributable to higher revenue from annual fees.
Equipment segment revenue was $
210.2
million in the year ended
December 31, 2018
, compared to $
167.7
million in the year ended
December 31, 2017
, an
increase
of $
42.5
million, or
25.3%
. The $
42.5
million
increase
was driven by higher replacement equipment sales to existing franchisee-owned stores and also higher equipment sales to new franchisee-owned stores related to 32 additional new equipment sales in the year ended
December 31, 2018
, as compared to the year ended
December 31, 2017
.
Cost of revenue
Cost of revenue was $
162.6
million in the year ended
December 31, 2018
compared to $
129.3
million in the year ended
December 31, 2017
, an
increase
of $
33.4
million, or
25.8%
. Cost of revenue primarily relates to our equipment segment. The
increase
was primarily due to higher replacement equipment sales to existing franchisee-owned stores and higher equipment sales to new franchisee-owned stores related to 32 additional new equipment sales in the year ended
December 31, 2018
, as compared to the year ended
December 31, 2017
. The
increase
in costs is consistent with the
increase
in equipment revenue.
Store operations
Store operation expenses, which relates to our corporate-owned stores segment, were $
75.0
million in the year ended
December 31, 2018
compared to $
60.7
million in the year ended
December 31, 2017
, an
increase
of $
14.3
million, or
23.7%
. The increase was primarily attributable to the acquisition of six franchisee-owned stores on January 1, 2018, the acquisition of four franchisee-owned stores on August 10, 2018, and the opening of eight new corporate-owned stores since January 1, 2017.
Selling, general and administrative
Selling, general and administrative expenses were $
72.4
million in the year ended
December 31, 2018
compared to $
60.4
million in the year ended
December 31, 2017
, an
increase
of $
12.1
million, or
20.0%
. The $
12.1
million
increase
was primarily due to additional expenses incurred during the year ended
December 31, 2018
to support our growing operations, including additional headcount and equity-based compensation. Partially offsetting this increase was $1.0 million of lower costs incurred in connection with secondary offerings in the year ended
December 31, 2018
as compared to the year ended
December 31, 2017
. With respect to our growing franchisee operations, we anticipate that our selling, general and administrative expenses will continue to increase as our franchisee-owned store count grows.
National advertising fund expense
National advertising fund expense was $
42.6
million in the year ended
December 31, 2018
, compared to zero in the year ended
December 31, 2017
, as a result of the adoption of the new revenue recognition standard ASC 606. This expense is primarily offset by national advertising fund revenues. See Note 10 in the notes to the consolidated financial statements.
Depreciation and amortization
Depreciation and amortization expense consists of the depreciation of property and equipment, including leasehold and building improvements and equipment. Amortization expense consists of amortization related to our intangible assets, including customer relationships and non-compete agreements.
Depreciation and amortization expense was $
35.3
million in the year ended
December 31, 2018
compared to $
31.8
million in the year ended
December 31, 2017
, an
increase
of $
3.5
million, or
11.0%
. The increase was primarily attributable to the acquisition and opening of corporate-owned stores since January 1, 2017.
Other loss
Other loss was $
0.9
million in the year ended
December 31, 2018
compared to $
0.4
million in the year ended
December 31, 2017
. Of the $
0.9
million loss in the year ended
December 31, 2018
, $0.6 million was primarily attributable to the write off of certain
56
assets that were being tested for possible use across the system. The $
0.4
million loss in the year ended
December 31, 2017
was primarily attributable to losses incurred with the early termination of the lease on our previous headquarters, partially offset by a gain on the sale of fixed assets.
Interest income
Interest income was $
4.7
million in the year ended
December 31, 2018
compared to $
0.1
million in the year ended
December 31, 2017
. The
increase
was due to the increase in the Company's cash balance in connection with the issuance of the Class A-2 Notes as well as cash generated from operations.
Interest expense
Interest expense primarily consists of interest on long-term debt as well as the amortization of deferred financing costs.
Interest expense was $
50.7
million in the year ended
December 31, 2018
compared to $
35.3
million in the year ended
December 31, 2017
, an
increase
of $
15.4
million, or
43.6%
. The
increase
in interest expense was primarily a result of higher interest expense related to the issuance of $1.2 billion of Class A-2 Notes. Additionally, we recorded $4.6 million of losses on extinguishment of debt recorded in connection with the repayment of our Term Loan B which was repaid in August 2018, compared to $1.0 million of losses on the extinguishment of debt related to the write-off of deferred financing costs in connection with the refinancing of our term loan in the year ended
December 31, 2017
.
Other income (expense)
Other expense was $
6.2
million in the year ended
December 31, 2018
compared to income of $
316.9
million in the year ended
December 31, 2017
, a
decrease
of $
323.1
million. In 2018, other expense included $4.7 million of expense attributable to the remeasurement of our tax benefit arrangements due to changes in our effective tax rate. In 2017, other income included a gain of $316.8 million related to the remeasurement of our tax benefit arrangements in connection with changes in the tax rate due to the 2017 Tax Act. Other income (expense) also includes realized gains (losses) on derivative activities as well as the effects of foreign currency gains and losses.
Provision for income taxes
Income tax expense was $
28.6
million for the year ended
December 31, 2018
compared to $
373.6
million for the year ended
December 31, 2017
, a
decrease
of $
344.9
million. Of the $344.9 million decrease $334.0 is attributable to the remeasurement of our deferred tax assets in 2017 in connection with changes in the tax rate due to the 2017 Tax Act. This was partially offset by our increased income before taxes and increased pro-rata share of income from Pla-Fit Holdings for the year ended
December 31, 2018
as compared to the year ended
December 31, 2017
as a result of the exchanges by Continuing LLC Owners of Holdings Units for shares of Class A common stock.
Segment results
Franchise
Franchise segment EBITDA was $
152.6
million in the year ended
December 31, 2018
compared to $
126.5
million in the year ended
December 31, 2017
, an increase of $
26.1
million, or
20.6%
. This increase was primarily the result of growth in our franchise segment revenue of $
74.0
million, including a $
53.5
million
increase
in royalty revenue primarily driven by $24.6 million due to higher royalty rates on monthly dues and $8.4 million due to higher royalties on annual fees, primarily as a result of the Rebate to Royalty Amendment. Additionally, $10.1 million was attributable to royalties from new stores in 2018, as well as those that opened in 2017 that were not included in the same store sales base, and $10.4 million attributable to a same store sales increase of
10.4%
in franchisee-owned stores. We also had higher web join income of $2.2 million as a result of a higher web join acquisition rate and a higher number of franchisee-owned stores in the year ended
December 31, 2018
as compared to the year ended
December 31, 2017
. In connection with the adoption of ASC 606, franchise segment revenue also included $
42.2
million of NAF revenue in the year ended
December 31, 2018
compared to zero in the year ended
December 31, 2017
(see Note 10). Partially offsetting these revenue increases was a $
10.4
million
decrease
in franchise and other fees and an $
11.5
million
decrease
in commission income, both primarily driven by the Rebate to Royalty Amendment. Franchise segment EBITDA also includes $
42.6
million of NAF expense in the year ended
December 31, 2018
in connection with the adoption of ASC 606 compared to zero in the year ended
December 31, 2017
(see Note 10). Additionally we had $5.3 million of higher compensation and operational expenses in the year ended
December 31, 2018
as compared to the year ended
December 31, 2017
. Depreciation and amortization was $
7.9
million in the year ended
December 31, 2018
and $
8.4
million in the year ended
December 31, 2017
.
Corporate-owned stores
Corporate-owned stores segment EBITDA was $
56.7
million in the year ended
December 31, 2018
compared to $
46.9
million in the year ended
December 31, 2017
, an increase of $
9.8
million, or
21.0%
. Of the increase, $6.7 million was attributable to the stores acquired and opened since January 1, 2017. An additional $5.0 million was related to stores included in our same store sales
57
base in the year ended
December 31, 2018
as compared to the year ended
December 31, 2017
. Offsetting these increases was $1.2 million of higher foreign currency losses which were a loss of $0.7 million in the year ended
December 31, 2018
as compared to a gain of $0.4 million the year ended
December 31, 2017
. Depreciation and amortization was $
20.4
million for the year ended
December 31, 2018
, compared to $
15.7
million for the year ended
December 31, 2017
. The increase in depreciation and amortization was primarily attributable the acquisition and opening of corporate-owned stores since January 1, 2017.
Equipment
Equipment segment EBITDA was $
47.6
million in the year ended
December 31, 2018
compared to $
38.5
million in the year ended
December 31, 2017
, an increase of $
9.1
million, or
23.5%
. The increase was the result of higher replacement equipment sales to existing franchisee-owned stores, and higher equipment sales to new franchisee-owned stores related to 32 additional new equipment sales in the year ended
December 31, 2018
compared to the year ended
December 31, 2017
. Depreciation and amortization was $
5.0
million for the year ended
December 31, 2018
and $
6.0
million for the year ended
December 31, 2017
.
Comparison of the years ended December 31, 2017 and December 31, 2016
Revenue
Total revenues were $429.9 million in 2017, compared to $378.2 million in 2016, an increase of $51.7 million, or 13.7%.
Franchise segment revenue was $150.2 million in the year ended December 31, 2017 compared to $116.5 million in the year ended December 31, 2016, an increase of $33.7 million, or 28.9%.
Franchise revenue was $132.0 million in the year ended December 31, 2017 compared to $97.4 million in the year ended December 31, 2016, an increase of $34.6 million or 35.5%. Included in franchise revenue is royalty revenue of $93.6 million, franchise and other fees of $27.0 million, and placement revenue of $11.4 million for the year ended December 31, 2017, compared to royalty revenue of $64.6 million, franchise and other fees of $22.3 million, and placement revenue of $10.5 million for the year ended December 31, 2016. Of the $29.1 million increase in royalty revenue, $8.5 million was attributable to royalties from new stores opened in 2017 as well as stores that opened in 2016 that were not included in the same store sales base, and $14.5 million attributable to a same store sales increase of 10.5% in franchisee-owned stores, and $6.1 million was attributable to higher revenue from annual fees. The $4.7 million increase in franchise and other fees was attributable to higher ADA and franchise fees of $1.9 million in the year ended December 31, 2017 compared to 2016. Additionally we had higher web join income of $2.0 million and transaction fee income of $0.8 million, both a result of a higher number of franchisee-owned stores in the year ended December 31, 2017 as compared to the year ended December 31, 2016.
Commission income, which is included in our franchise segment, was $18.2 million in the year ended December 31, 2017 compared to $19.1 million in the year ended December 31, 2016, a decrease of $0.9 million or 4.9%. The decrease primarily reflects the elimination of certain rebates and commissions that were historically paid to us in the year ended December 31, 2017 as compared to the year ended December 31, 2016.
Revenue from our corporate-owned stores segment was $112.1 million in the year ended December 31, 2017, compared to $104.7 million in the year ended December 31, 2016, an increase of $7.4 million, or 7.1%. Of the $7.4 million increase, $4.4 million was attributable to same store sales from corporate-owned stores which increased 4.9% in the year ended December 31, 2017, and $3.6 million was attributable to higher revenue from annual fees.
Equipment segment revenue was $167.7 million in the year ended December 31, 2017, compared to $157.0 million in the year ended December 31, 2016, an increase of $10.6 million, or 6.8%. The $10.6 million increase was driven by an increase in replacement equipment sales to existing franchisee-owned stores, partially offset by lower equipment sales to new franchisee-owned stores related to 10 fewer new equipment sales in the year ended December 31, 2017, as compared to the year ended December 31, 2016.
Cost of revenue
Cost of revenue was $129.3 million in the year ended December 31, 2017 compared to $122.3 million in the year ended December 31, 2016, an increase of $6.9 million, or 5.7%. Cost of revenue primarily relates to our equipment segment. The increase was primarily due to the impact of more existing franchisee-owned stores purchasing replacement equipment in the year ended December 31, 2017, as compared to the year ended December 31, 2016, partially offset by a decrease in the number of equipment sales to new franchisee-owned stores. The increase in costs is consistent with the increase in equipment revenue.
Store operations
Store operation expenses, which relates to our corporate-owned stores segment, were $60.7 million in the year ended December 31, 2017 compared to $60.1 million in the year ended December 31, 2016, an increase of $0.5 million, or 0.9%.
Selling, general and administrative
58
Selling, general and administrative expenses were $60.4 million in the year ended December 31, 2017 compared to $50.0 million in the year ended December 31, 2016, an increase of $10.4 million, or 20.7%. The $10.4 million increase was primarily due to additional expenses incurred during the year ended December 31, 2017 to support our growing operations, including additional headcount, infrastructure, and public company expenses. Partially offsetting this increase was $1.7 million of lower costs incurred in connection with secondary offerings in the year ended December 31, 2017 as compared to the year ended December 31, 2016. With respect to our growing franchisee operations, we anticipate that our selling, general and administrative expenses will continue to increase as our franchisee-owned store count grows.
Depreciation and amortization
Depreciation and amortization expense consists of the depreciation of property and equipment, including leasehold and building improvements and equipment. Amortization expense consists of amortization related to our intangible assets, including customer relationships and non-compete agreements.
Depreciation and amortization expense was $31.8 million in the year ended December 31, 2017 compared to $31.5 million in the year ended December 31, 2016, an increase of $0.3 million, or 0.8%.
Other loss (gain)
Other loss (gain) was a loss of $0.4 million in the year ended December 31, 2017 compared to a gain of $1.4 million in the year ended December 31, 2016. The $0.4 million loss in the year ended December 31, 2017 was primarily attributable to losses incurred with the early termination of the lease on our previous headquarters, partially offset by a gain on the sale of fixed assets. The $1.4 million gain in the year ended December 31, 2016 was primarily attributable to insurance proceeds received during 2016, in addition to a gain on the sale of fixed assets.
Interest expense, net
Interest expense primarily consists of interest on long-term debt as well as the amortization of deferred financing costs.
Interest expense, net was $35.3 million in the year ended December 31, 2017 compared to $27.1 million in the year ended December 31, 2016, an increase of $8.2 million, or 30.1%. The increase in interest expense, net was primarily a result of the additional $230.0 million in borrowings under our senior secured credit facility which occurred on November 10, 2016. In addition we recorded $1.0 million and $0.6 million of expense on the extinguishment of debt related to the write-off of deferred financing costs in connection with the refinancings of our term loan in the years ended December 31, 2017 and 2016, respectively.
Other income (expense)
Other income was $316.9 million in the year ended December 31, 2017 compared to income of $1.4 million in the year ended December 31, 2016, an increase of $315.6 million. In 2017, other income included a gain of $317.4 million primarily related to the remeasurement of our tax benefit arrangements in connection with changes in the tax rate due to the 2017 Tax Act, partially offset by $1.0 million of third party fees recorded in connection with the May 2017 amendment of our credit facility. In 2016, other income included a $2.8 million gain related to the recording of a receivable in connection with a contractual obligation of the Company’s co-founders to indemnify the Company with respect to pre-IPO tax liabilities pursuant to the 2012 Acquisition, and a $1.8 million gain recorded in connection with the write-off of a previously accrued equipment discount that is no longer expected to be utilized which was originally recognized through purchase accounting in connection with the acquisition of eight franchisee-owned stores on March 31, 2014, partially offset by $3.0 million of third party fees recorded in connection with the November amendment of our credit facility. Other income (expense) also includes realized gains (losses) on derivative activities as well as the effects of foreign currency gains and losses.
Provision for income taxes
Income tax expense was $373.6 million for the year ended December 31, 2017 compared to $18.7 million for the year ended December 31, 2016, an increase of $354.9 million. Prior to the recapitalization transactions, Pla-Fit Holdings was treated as a pass through entity for U.S. federal income tax purposes as well as in most states. As a result, entity level taxes were not significant and the provision for income taxes primarily consisted of tax expense related to the state of New Hampshire and Canada as well as certain other local taxes.
Subsequent to the recapitalization transactions, Planet Fitness, Inc. is subject to U.S. federal income taxes, in addition to state and local taxes, with respect to our allocable share of any net taxable income of Pla-Fit Holdings. Our then-current tax rate of 39.5% for the years ended December 31 2017 and 2016, was calculated using the U.S. federal income tax rate and the statutory rates applied to income apportioned to each state and local jurisdiction. This tax rate has been applied to the portion of income before taxes that represents the economic interest in Pla-Fit Holdings held by Planet Fitness, Inc. following the recapitalization transactions and IPO. The provision for income taxes also reflects an effective state tax rate of 2.1% and 2.0% for the year ended December 31, 2017 and the year ended December 31, 2016, respectively, applied to non-controlling interests, excluding income from variable interest entities, related to Pla-Fit Holdings.
59
On December 22, 2017, the 2017 Tax Act was enacted, making significant changes to the Internal Revenue Code. Changes include, but are not limited to, a corporate tax rate decrease from 35% to 21% beginning on January 1, 2018, the transition of U.S international taxation from a worldwide tax system to a modified territorial system, and a one-time transition tax on the mandatory deemed repatriation of cumulative foreign earnings as of December 31, 2017. We have calculated our best estimate of the impact of the 2017 Tax Act in our year end income tax provision in accordance with our understanding of the law and available guidance and as a result have recorded $334.0 million as additional income tax expense in the fourth quarter of 2017, the period in which the legislation was enacted, primarily related to the remeasurement of certain deferred tax assets and liabilities. The 2017 Tax Act also caused a remeasurement of our tax benefit arrangements.
Of the $354.9 million increase in the provision for income taxes $334.0 is attributable to the remeasurement of our deferred tax assets in connection with changes in the tax rate due to the 2017 Tax Act, as well as the increased economic interest in Pla-Fit Holdings held by Planet Fitness, Inc. in the year ended December 31, 2017 compared to the year ended December 31, 2016 as a result of the exchanges by Continuing LLC Owners of shares of Class B common stock for shares of Class A common stock. Additionally, during the year ended December 31, 2016, the Company recognized $2.8 million within tax expense related to the establishment of a reserve for an uncertain tax position including interest of $0.5 million. This amount relates to a potential liability associated with a 2012 state filing position currently under audit by the taxing authorities. We also recorded a receivable related to this potential liability in connection with a contractual obligation of the Company’s co-founders to indemnify the Company with respect to pre-IPO tax liabilities pursuant to the 2012 Acquisition.
Segment results
Franchise
Segment EBITDA for the franchise segment was $126.5 million in the year ended December 31, 2017 compared to $97.3 million in the year ended December 31, 2016, an increase of $29.2 million, or 30.0%. This increase was primarily the result of growth in our franchise segment revenue of $33.7 million, including $14.5 million attributable to a same store sales increase of 10.5% from franchisee-owned stores, $8.5 million due to higher royalties received from additional franchisee-owned stores not included in the same store sales base, $6.1 million attributable to higher revenue from annual fees, and $4.7 million attributable to higher franchise and other fees. Partially offsetting the increased franchise segment revenue was higher compensation and marketing expenses in the year ended December 31, 2017 as compared to the year ended December 31, 2016. Depreciation and amortization was $8.5 million in the year ended December 31, 2017 and the year ended December 31, 2016.
Corporate-owned stores
Segment EBITDA for the corporate-owned stores segment was $46.9 million in the year ended December 31, 2017 compared to $40.8 million in the year ended December 31, 2016, an increase of $6.0 million, or 14.7%. Of the increase, $4.4 million was attributable to same store sales from corporate-owned stores which increased 4.9% and $ 3.6 million was attributable to higher revenue on annual fees. These increases were partially offset by $1.4 million of net negative EBITDA incurred in connection with the opening of four new corporate owned stores in the fourth quarter of 2017. Depreciation and amortization was $15.7 million for the year ended December 31, 2017, compared to $15.9 million for the year ended December 31, 2016.
Equipment
Segment EBITDA for the equipment segment was $38.5 million in the year ended December 31, 2017 compared to $36.4 million in the year ended December 31, 2016, an increase of $2.1 million, or 5.8%, primarily as a result of higher replacement equipment sales to existing franchisee-owned stores, partially offset by a decrease in the number of equipment sales to new franchisee-owned stores in the year ended December 31, 2017 compared to the year ended December 31, 2016. Depreciation and amortization was $6.0 million for the year ended December 31, 2017 and $6.2 million for the year ended December 31, 2016.
Liquidity and Capital Resources
As of
December 31, 2018
, we had $
289.4
million of cash and cash equivalents. In addition, as of
December 31, 2018
, we had borrowing capacity of $75.0 million under our Variable Funding Note.
We require cash principally to fund day-to-day operations, to finance capital investments, to service our outstanding debt and obligations under our tax benefit arrangements and to address our working capital needs. Based on our current level of operations and anticipated growth, we believe that with our available cash balance, the cash generated from our operations, and amounts available under our variable funding note will be adequate to meet our anticipated debt service requirements and obligations under our tax benefit arrangements, capital expenditures, payments of tax distributions and working capital needs for at least the next twelve months. We believe that we will be able to meet these obligations even if we experience no growth in sales or profits. Our ability to continue to fund these items and continue to reduce debt could be adversely affected by the occurrence of any of the events described under “Risk Factors.” However, our business may not generate sufficient cash flows from operations, and future borrowings may not be available under our Variable Funding Note or otherwise to enable us to service our indebtedness, including
60
our Class A-2 Notes, or to make anticipated capital expenditures. Our future operating performance and our ability to service, extend or refinance the securitized financing facility will be subject to future economic conditions and to financial, business and other factors, many of which are beyond our control.
The following table presents summary cash flow information for the years ended
December 31, 2018
and
2017
:
|
|
Year Ended December 31,
|
||||||
|
(in thousands)
|
2018
|
2017
|
|||||
|
Net cash provided by (used in):
|
|||||||
|
Operating activities
|
$
|
184,399
|
|
$
|
131,021
|
|
|
|
Investing activities
|
(86,416
|
)
|
(37,042
|
)
|
|||
|
Financing activities
|
109,920
|
|
(21,703
|
)
|
|||
|
Effect of foreign exchange rates on cash
|
(844
|
)
|
411
|
|
|||
|
Net increase in cash
|
$
|
207,059
|
|
$
|
72,687
|
|
|
Operating activities
For the year ended
December 31, 2018
, net cash provided by operating activities was $
184.4
million compared to $
131.0
million in the year ended
December 31, 2017
, an
increase
of $
53.4
million. Of the
increase
, $
33.0
million was due to higher net income after adjustments to reconcile net income to net cash provided by operating activities, and $
20.3
million was due to lower cash used for working capital in accounts receivable, other assets and other current assets, accounts payable and accrued expenses and deferred revenue, partially offset by higher cash paid pursuant to tax benefit arrangements in the year ended
December 31, 2018
, compared to the year ended
December 31, 2017
.
Investing activities
Cash flow used in investing activities related to the following capital expenditures for the years ended
December 31, 2018
and
2017
:
|
|
Year Ended December 31,
|
||||||
|
(in thousands)
|
2018
|
2017
|
|||||
|
New corporate-owned stores
|
$
|
10,368
|
|
$
|
7,633
|
|
|
|
Existing corporate-owned stores
|
16,792
|
|
22,510
|
|
|||
|
Information systems
|
9,103
|
|
1,416
|
|
|||
|
Acquisition of building and land
|
4,538
|
|
—
|
|
|||
|
Corporate and all other
|
59
|
|
6,163
|
|
|||
|
Total capital expenditures
|
$
|
40,860
|
|
$
|
37,722
|
|
|
For the year ended
December 31, 2018
, net cash used in investing activities was $
86.4
million compared to $
37.0
million in the year ended
December 31, 2017
, an
increase
of $
49.4
million. This
increase
in the year ended
December 31, 2018
compared to the year ended
December 31, 2017
was primarily due to the acquisition of stores from franchisees, higher capital expenditures related to information systems, the acquisition of a building and land, and higher capital expenditures on new corporate-owned stores, partially offset by lower capital expenditures on existing corporate-owned stores and lower corporate costs which were primarily related to the relocation of our corporate headquarters in the prior year.
Financing activities
For the year ended
December 31, 2018
, net cash provided by financing activities was $
109.9
million compared to net cash used in financing activities of $
21.7
million in the year ended
December 31, 2017
, an
increase
of $
131.6
million. In the year ended
December 31, 2018
we had net proceeds from the issuance and repayments of long-term debt of $460.4 million, $342.4 million of cash used to repurchase and retire 5.4 million shares of our Class A common stock, and distributions to members of Pla-Fit Holdings of $8.3 million. In the year ended
December 31, 2017
, we had repayments of long-term debt of $7.2 million and distributions to members of Pla-Fit Holdings of $11.4 million.
61
The following table presents summary cash flow information for the years ended December 31, 2017 and 2016:
|
|
Year Ended December 31,
|
||||||
|
(in thousands)
|
2017
|
2016
|
|||||
|
Net cash (used in) provided by:
|
|
|
|
|
|||
|
Operating activities
|
$
|
131,021
|
|
$
|
108,817
|
|
|
|
Investing activities
|
(37,042
|
)
|
(14,694
|
)
|
|||
|
Financing activities
|
(21,703
|
)
|
(85,183
|
)
|
|||
|
Effect of foreign exchange rates on cash
|
411
|
|
23
|
|
|||
|
Net increase (decrease) in cash
|
$
|
72,687
|
|
$
|
8,963
|
|
|
Operating activities
For the year ended December 31, 2017, net cash provided by operating activities was $131.0 million compared to $108.8 million in the year ended December 31, 2016, an increase of $23.9 million, and was primarily due to net income after adjustments to reconcile net income to net cash provided by operating activities of $149.9 million in the year ended December 31, 2017, compared to $126.0 million in the year ended December 31, 2016.
Investing activities
Cash flow used in investing activities related to the following capital expenditures for the years ended December 31, 2017 and 2016:
|
|
Year Ended December 31,
|
||||||
|
(in thousands)
|
2017
|
2016
|
|||||
|
New corporate-owned stores and corporate-owned stores not yet opened
|
$
|
7,633
|
|
$
|
—
|
|
|
|
Existing corporate-owned stores
|
22,510
|
|
14,070
|
|
|||
|
Information systems
|
1,416
|
|
884
|
|
|||
|
Corporate and all other
|
6,163
|
|
423
|
|
|||
|
Total capital expenditures
|
$
|
37,722
|
|
$
|
15,377
|
|
|
For the year ended December 31, 2017, net cash used in investing activities was $37.0 million compared to $14.7 million in the year ended December 31, 2016, an increase of $22.3 million. This increase was primarily due to higher capital expenditures related to new corporate-owned stores, existing corporate owned stores, and the relocation of our corporate headquarters in the year ended December 31, 2017 compared to the year ended December 31, 2016.
Financing activities
For the year ended December 31, 2017, net cash used in financing activities was $21.7 million compared to $85.2 million in the year ended December 31, 2016, a decrease of $63.5 million. Primary cash outflows in the year ended December 31, 2017 included repayments of long-term debt of $7.2 million and distributions to members of Pla-Fit Holdings of $11.4 million. In the year ended December 31, 2016, we had proceeds from the issuance of long-term debt of $230.0 million, offset by the payment of a cash dividend to shareholders of our Class A common stock of $169.3 million, dividend equivalent payments to Continuing LLC Owners of $101.7 million, other distributions to members of Pla-Fit Holdings of $31.8 million, repayments of long-term debt of $5.6 million and payment of deferred financing and other debt-related costs of $5.2 million.
On November 10, 2016, we amended our credit agreement governing our senior secured credit facility to provide for an increase of $230.0 million in term loan borrowings for a total of $718.5 million, decrease our interest rate spread on our term loan by 25 basis points, and increase our revolving credit facility to $75.0 million. The full incremental borrowing of $230.0 million and approximately $41.0 million of cash on hand was used to pay a cash dividend of $169.3 million to shareholders of our Class A common stock and make cash dividend equivalent payments of $101.7 million to Continuing LLC Owners.
Securitized Financing Facility
On August 1, 2018, the Master Issuer, a limited-purpose, bankruptcy remote, wholly-owned indirect subsidiary of Pla-Fit Holdings, LLC, entered into the Indenture under which the Master Issuer may issue multiple series of notes. On the same date, the Master Issuer issued the Class A-2-I Notes with an initial principal amount of $575 million and the Class A-2-II Notes, with an initial principal amount of $625 million. In connection with the issuance of the Class A-2 Notes, the Master Issuer also entered into the Variable Funding Notes that allow for the issuance of up to $75 million, and certain letters of credit, all of which is currently undrawn. The Class A-2 Notes were issued in a securitization transaction pursuant to which most of the Company’s domestic
62
revenue-generating assets, consisting principally of franchise-related agreements, certain corporate-owned store assets, equipment supply agreements and intellectual property and license agreements for the use of intellectual property, were assigned to the Master Issuer and certain other limited-purpose, bankruptcy remote, wholly-owned indirect subsidiaries of the Company that act as guarantors of the Series 2018-1 Senior Notes and that have pledged substantially all of their assets to secure the Series 2018-1 Senior Notes.
Interest and principal payments on the Class A-2 Notes are payable on a quarterly basis. The requirement to make such quarterly principal payments on the Class A-2 Notes is subject to certain financial conditions set forth in the Indenture. The legal final maturity date of the Class A-2 Notes is in September 2048, but it is anticipated that, unless earlier prepaid to the extent permitted under the Indenture, the Class A-2 Notes will be repaid by the Anticipated Repayment Dates. If the Master Issuer has not repaid or refinanced the Class A-2 Notes prior to the respective Anticipated Repayment Dates, additional interest will accrue pursuant to the Indenture.
The Variable Funding Notes will accrue interest at a variable interest rate based on (i) the prime rate, (ii) overnight federal funds rates, (iii) the London interbank offered rate for U.S. Dollars, or (iv) with respect to advances made by conduit investors, the weighted average cost of, or related to, the issuance of commercial paper allocated to fund or maintain such advances, in each case plus any applicable margin and as specified in the Variable Funding Note agreement. There is a commitment fee on the unused portion of the Variable Funding Notes of 0.5% based on utilization. It is anticipated that the principal and interest on the Variable Funding Notes will be repaid in full on or prior to September 2023, subject to two additional one-year extensions. Following the anticipated repayment date (and any extensions thereof) additional interest will accrue on the Variable Funding Notes equal to 5.0% per year.
In connection with the issuance of the Series 2018-1 Senior Notes, the Company incurred debt issuance costs of $27.1 million. The debt issuance costs are being amortized to “Interest expense” through the Anticipated Repayment Dates of the Class A-2 Notes utilizing the effective interest rate method.
The Series 2018-1 Senior Notes are subject to covenants and restrictions customary for transactions of this type, including (i) that the Master Issuer maintains specified reserve accounts to be used to make required payments in respect of the Series 2018-1 Senior Notes, (ii) provisions relating to optional and mandatory prepayments and the related payment of specified amounts, including specified make-whole payments in the case of the Class A-2 Notes under certain circumstances, (iii) certain indemnification payments in the event, among other things, the assets pledged as collateral for the Series 2018-1 Senior Notes are in stated ways defective or ineffective, and (iv) covenants relating to recordkeeping, access to information and similar matters. The Series 2018-1 Senior Notes are also subject to customary rapid amortization events provided for in the Indenture, including events tied to failure to maintain stated debt service coverage ratios, certain manager termination events, an event of default, and the failure to repay or refinance the Class A-2 Notes on the applicable scheduled Anticipated Repayment Dates. The Series 2018-1 Senior Notes are also subject to certain customary events of default, including events relating to non-payment of required interest, principal, or other amounts due on or with respect to the Series 2018-1 Senior Notes, failure to comply with covenants within certain time frames, certain bankruptcy events, breaches of specified representations and warranties, failure of security interests to be effective, and certain judgments.
In accordance with the Indenture, certain cash accounts have been established with the Trustee for the benefit of the trustee and the noteholders, and are restricted in their use. The Company holds restricted cash which primarily represents cash collections held by the Trustee, interest, principal, and commitment fee reserves held by the Trustee related to the Company’s Series 2018-1 Senior Notes. As of December 31, 2018, the Company had restricted cash held by the Trustee of $
30.7
million.
The proceeds from the issuance of the Class A-2 Notes were used to repay all amounts outstanding on the Term Loan B under the Company’s prior credit facility. As a result, the Company recorded a loss on early extinguishment of debt of $4.6 million within interest expense on the consolidated statement of operations, primarily consisting of the write-off of deferred costs related to the prior credit facility.
Share Repurchase Program
On August 3, 2018, our board of directors approved an increase to the total amount of the share repurchase program to $500 million.
On November 13, 2018, the Company entered into a $300 million accelerated share repurchase agreement (the “ASR Agreement”) with Citibank, N.A. (“the Bank”). Pursuant to the terms of the ASR Agreement, on November 14, 2018, the Company paid the Bank $300 million in cash and received 4,607,410 shares of the Company’s Class A common stock. At final settlement, the Bank may be required to deliver additional shares to the Company, or, under certain circumstances, the Company may be required to deliver shares of its Class A common stock or may elect to make a cash payment to the Bank, based generally on the average of the daily volume-weighted average prices of the Company’s Class A common stock during the term of the ASR Agreement. The ASR Agreement contains provisions customary for agreements of this type, including provisions for adjustments to the transaction terms, the circumstances generally under which the ASR Agreement may be accelerated, extended or terminated early by the Bank
63
and various acknowledgments, representations and warranties made by the parties to one another. Final settlement of the ASR Agreement is expected to be completed during the second quarter of 2019, although the settlement may be accelerated at the Bank's option.
Additionally, prior to the ASR Agreement, during the year ended December 31, 2018, the Company repurchased and retired 824,312 shares of Class A common stock for a total cost of $42.1 million.
The timing of the purchases and the amount of stock repurchased is subject to the Company’s discretion and depends on market and business conditions, the Company’s general working capital needs, stock price, applicable legal requirements and other factors. Our ability to repurchase shares at any particular time is also subject to the terms of the Indenture governing the Series 2018-1 Senior Notes and the terms of the ASR Agreement. Purchases may be effected through one or more open market transactions, privately negotiated transactions, transactions structured through investment banking institutions, or a combination of the foregoing. Planet Fitness is not obligated under the program to acquire any particular amount of stock and can suspend or terminate the program at any time.
Contractual Obligations and Commitments
The following table presents contractual obligations and commercial commitments as of
December 31, 2018
.
|
|
Payments due during the years ending December 31,
|
||||||||||||||||||
|
(in thousands)
|
Total
|
2019
|
2020-2021
|
2022-2023
|
Thereafter
|
||||||||||||||
|
Long-term debt
(1)
|
$
|
1,197,000
|
|
12,000
|
|
24,000
|
|
568,813
|
|
592,187
|
|
||||||||
|
Interest on long-term debt
|
280,019
|
|
53,334
|
|
105,057
|
|
73,656
|
|
47,972
|
|
|||||||||
|
Obligations under tax benefit arrangements
(2)
|
429,233
|
|
24,765
|
|
50,446
|
|
52,457
|
|
301,565
|
|
|||||||||
|
Operating leases
|
113,602
|
|
15,911
|
|
28,673
|
|
23,694
|
|
45,324
|
|
|||||||||
|
Advertising commitments
(3)
|
17,848
|
|
16,885
|
|
963
|
|
—
|
|
—
|
|
|||||||||
|
Purchase obligations
(4)
|
18,189
|
|
18,189
|
|
—
|
|
—
|
|
—
|
|
|||||||||
|
Total Contractual Obligations
|
$
|
2,055,891
|
|
$
|
141,084
|
|
$
|
209,139
|
|
$
|
718,620
|
|
$
|
987,048
|
|
||||
|
(1)
|
Long-term debt payments include scheduled principal payments only.
|
|
(2)
|
Timing of payments under tax benefit arrangements is estimated.
|
|
(3)
|
As of
December 31, 2018
, we had advertising purchase commitments of approximately $
17.8
million, including commitments for the NAF.
|
|
(4)
|
Purchase obligations consists of $
18.2
million for open purchase orders primarily related to equipment to be sold to franchisees. For the majority of our equipment purchase obligations, our policy is to require the franchisee to provide us with either a deposit or proof of a committed financing arrangement.
|
Off-Balance Sheet Arrangements
As of
December 31, 2018
, our off-balance sheet arrangements consisted of operating leases and certain guarantees. In a limited number of cases, we have guaranteed certain leases and debt agreements of entities previously related through common ownership. These guarantees relate to leases for operating space, equipment and other operating costs of franchises operated by those entities. Our maximum total commitment under these agreements is approximately $
0.7
million and would only require payment upon default by the primary obligor. The estimated fair value of these guarantees at
December 31, 2018
was not material, and no accrual has been recorded for our potential obligation under these arrangements. See Note 16 to our consolidated financial statements included elsewhere in this Form 10-K for more information regarding these operating leases and guarantees.
Critical Accounting Policies and Use of Estimates
Our discussion and analysis of operating results and financial condition are based upon our consolidated financial statements included elsewhere in this Form 10-K. The preparation of our financial statements in accordance with GAAP requires us to make estimates and assumptions that affect the reported amounts of assets, liabilities, revenue, expenses and related disclosures of contingent assets and liabilities. We base our estimates on past experience and other assumptions that we believe are reasonable under the circumstances, and we evaluate these estimates on an ongoing basis. Actual results may differ from those estimates.
Our critical accounting policies are those that materially affect our consolidated financial statements including those that involve difficult, subjective or complex judgments by management. A thorough understanding of these critical accounting policies is essential when reviewing our consolidated financial statements. We believe that the critical accounting policies listed below are those that are most important to the portrayal of our results of operations or involve the most difficult management decisions related to the use of significant estimates and assumptions as described above.
64
Revenue
The below discussions of franchise, equipment and corporate-owned stores revenue recognition policies are the policies that went into effect beginning on January 1, 2018 with the adoption of ASC 606. For periods prior to January 1, 2018 we applied the policies under ASC 605. See Note 2 in
Item 8: Financial Statements
for a discussion of the policies in place under ASC 605.
Franchise revenue
Franchise revenues consist primarily of royalties, NAF contributions, initial and renewal franchise fees and upfront fees from area development agreements ("ADAs"), transfer fees, equipment placement revenue, other fees and commission income.
The Company's primary performance obligation under the franchise license is granting certain rights to use the Company's intellectual property, and all other services the Company provides under the ADA and franchise agreement are highly interrelated, not distinct within the contract, and therefore accounted for as a single performance obligation, which is satisfied by granting certain rights to use our intellectual property over the term of each franchise agreement.
Royalties, including franchisee contributions to national advertising funds, are generally calculated as a percentage of franchise monthly dues and annual fees over the term of the franchise agreement. Under our franchise agreements, advertising contributions paid by franchisees must be spent on advertising, marketing and related activities. Initial and renewal franchise fees are payable by the franchisee upon signing a new or successor franchise agreement, and transfer fees are paid to the Company when one franchisee transfers a franchise agreement to a different franchisee. Our franchise royalties, as well as our NAF contributions, represent sales-based royalties that are related entirely to our performance obligation under the franchise agreement and are recognized as franchise sales occur.
Additionally, under ASC 606, initial and renewal franchise fees, as well as transfer fees, are recognized as revenue on a straight-line basis over the term of the respective franchise agreement. Under the Previous Standards, initial franchise fees were recognized as revenue when the related franchisees signed a lease and completed the Company's new franchisee training. Renewal franchise fees and transfer fees were recognized as revenue upon execution of a new franchise agreement. Our performance obligation under ADAs generally consists of an obligation to grant geographic exclusive area development rights. These development rights are not distinct from franchise agreements, so upfront fees paid by franchisees for exclusive development rights are deferred and apportioned to each franchise agreement signed by the franchisee. The pro-rata amount apportioned to each franchise agreement is accounted for identically to the initial franchise fee.
The Company is generally responsible for assembly and placement of equipment it sells to U.S. based franchisee-owned stores. Placement revenue is recognized upon completion and acceptance of the services at the franchise location.
The Company recognizes commission income from certain of its franchisees’ use of certain preferred vendor arrangements. Commissions are recognized when amounts have been earned and collectability from the vendor is reasonably assured.
Online member join fees are paid to the Company by franchisees for processing new membership transactions when a new member signs up for a membership to a franchisee-owned store through the Company’s website. These fees are recognized as revenue as each transaction occurs.
Billing transaction fees are paid to the Company by certain of its franchisees for the processing of franchisee membership dues and annual fees through the Company’s third-party hosted point-of-sale system and are recognized as revenue as they are earned.
Equipment revenue
The Company sells and delivers equipment purchased from third-party equipment manufacturers to U.S. based franchisee-owned stores. Revenue is recognized upon transfer of control of ordered items, generally upon delivery to the customer, which is when the customer obtains physical possession of the goods, legal title is transferred, the customer has all risks and rewards of ownership and an obligation to pay for the goods is created. Franchisees are charged for all freight costs incurred for the delivery of equipment. Freight revenue is recorded within equipment revenue and freight costs are recorded within cost of revenue. In most instances, the Company recognizes equipment revenue on a gross basis as management has determined the Company to be the principal in these transactions. Management determined the Company to be the principal in the transaction because the Company controls the equipment prior to delivery to the final customer as evidenced by its pricing discretion over the goods, inventory transfer of title and risk of loss while the inventory is in transit, and having the primary responsibility to fulfill the customer order and direct the third-party vendor.
65
Corporate-owned stores revenue
The following revenues are generated from stores owned and operated by the Company.
Membership dues are earned and recognized over the membership term on a straight-line basis.
Enrollment fee revenue
Enrollment fees are charged to new members at the commencement of their membership. The Company recognizes enrollment fees ratably over the estimated duration of the membership life, which is generally two years.
Annual membership fee revenue
Annual membership fees are annual fees charged to members in addition to and in order to maintain low monthly membership dues. The Company recognizes annual membership fees ratably over the 12-month membership period.
Retail sales
The Company sells Planet Fitness branded apparel, food, beverages, and other accessories. The revenue for these items is recognized at the point of sale.
Leases
We currently lease our corporate headquarters and all but one of our corporate-owned stores. At the inception of each lease, we determine its appropriate classification as an operating or capital lease. The majority of our leases are operating leases. For operating leases that include rent escalations, we record the base rent expense on a straight-line basis over the term of the lease and the difference between the base cash rentals paid and the straight-line rent expense is recorded as deferred rent.
We expend cash for leasehold improvements and to build out and equip our leased premises. We may also expend cash for structural additions that we make to leased premises. Generally, a portion of the leasehold improvements and building costs are reimbursed to us by our landlords as construction contributions pursuant to agreed-upon terms in our leases. If obtained, landlord construction contributions usually take the form of up-front cash, full or partial credits against our future minimum or percentage rents otherwise payable by us, or a combination thereof. When contractually due to us, we classify tenant improvement allowances within property and equipment and deferred rent on the consolidated balance sheets and depreciate the tenant improvement allowance on a straight-line basis over the lease term.
Business combinations
We account for business combinations using the purchase method of accounting which results in the assets acquired and liabilities assumed being recorded at fair value.
The valuation methodologies used are based on the nature of the asset or liability. The significant assets and liabilities measured at fair value include property and equipment, intangible assets, deferred revenue and favorable and unfavorable leases. For the 2012 Acquisition, intangible assets consisted of trade and brand names, member relationships, franchisee relationships related to both our franchise and equipment segments, non-compete agreements, order backlog and favorable and unfavorable leases. For other acquisitions, which consist of acquisitions of stores from franchisees, intangible assets generally consist of member relationships, re-acquired franchise rights, and favorable and unfavorable leases.
The fair value of trade and brand names is estimated using the relief from royalty method, an income approach to valuation, which includes projecting future system-wide sales and other estimates. Membership relationships and franchisee relationships are valued based on an estimate of future revenues and costs related to the respective contracts over the remaining expected lives. Our valuation includes assumptions related to the projected attrition and renewal rates on those existing franchise and membership arrangements being valued. Re-acquired franchise rights are valued using an excess earnings approach. The valuation of re-acquired franchise rights is determined using an estimation of future royalty income and related expenses associated with existing franchise contracts at the acquisition date. For re-acquired franchise rights with terms that are either favorable or unfavorable (from our perspective) to the terms included in our current franchise agreements, a gain or charge is recorded at the time of the acquisition to the extent of the favorability or unfavorability, respectively. Favorable and unfavorable operating leases are recorded based on differences between contractual rents under the respective lease agreements and prevailing market rents at the lease acquisition date. Deferred revenue is valued based on our estimated costs to fulfill the obligations assumed, plus a normal profit margin. No deferred revenue amounts are recognized for enrollment fees in our business combinations as there is no remaining obligation.
We consider our trade and brand name intangible assets to have an indefinite useful life, and, therefore, these assets are not amortized but rather are tested for impairment annually as discussed below. Amortization of re-acquired franchise rights and franchisee relationships is recorded over the respective franchise terms using the straight-line method which we believe approximates the period during which we expect to receive the related benefits. Member relationships are amortized on an
66
accelerated basis based on expected attrition. Favorable and unfavorable operating leases are amortized into rental expense over the lease term of the respective leases using the straight-line method.
Impairment of long-lived assets, including goodwill and intangible assets
We assess potential impairments to our long-lived assets, which include property and equipment and amortizable intangible assets, whenever events or circumstances indicate that the carrying amount of an asset may not be recoverable. Recoverability of an asset is measured by a comparison of the carrying amount of an asset group to the estimated undiscounted future cash flows expected to be generated by the asset. If the carrying amount of the asset group exceeds its estimated undiscounted future cash flows, an impairment charge is recognized as the amount by which the carrying amount of the asset exceeds the fair value of the asset. Store-level assets are grouped by store and assessed on a store by store basis for the purpose of the impairment assessment. There were no impairment charges recorded during the years ended
December 31, 2018
,
2017
and
2016
.
Goodwill has been assigned to our reporting units for purposes of impairment testing. Our reporting units are Franchise, Corporate-owned stores and Equipment, which are the same as our reportable segments. The goodwill impairment test consists of a comparison of each reporting unit’s fair value to its carrying value. The fair value of a reporting unit is an estimate of the amount for which the unit as a whole could be sold in a current transaction between willing parties. If the carrying value of a reporting unit exceeds its fair value, goodwill is written down to its implied fair value. Fair value of a reporting unit is estimated based on a combination of comparative market multiples and discounted cash flow valuation approaches. We are also permitted to make a qualitative assessment of whether it is more likely than not that the fair value of a reporting unit is less than its carrying value prior to applying the quantitative assessment. If based on our qualitative assessment it is not more likely than not that the carrying value of the reporting unit is less than its fair value, then a quantitative assessment is not required. In
2018
, the qualitative assessment was utilized to assess goodwill for impairment in each of our reporting units.
We evaluate the remaining useful lives of our trade and brand name intangible assets to determine whether current events and circumstances continue to support an indefinite useful life. In addition, all of our indefinite lived intangible assets are tested for impairment annually. The trade and brand name intangible asset impairment test consists of a comparison of the fair value to the carrying value, with any excess of carrying value over fair value being recognized as an impairment loss. We are also permitted to make a qualitative assessment of whether it is more likely than not an indefinite lived intangible asset’s fair value is less than its carrying value prior to applying the quantitative assessment. If based on our qualitative assessment it is not more likely than not that the carrying value of the asset is less than its fair value, then a quantitative assessment is not required. The qualitative assessment was utilized to assess our indefinite lived intangible assets for impairment in
2018
.
Currently, we have selected the last day of our year as the date on which to perform our annual impairment tests for goodwill and indefinite lived intangible assets. We also test for impairment whenever events or circumstances indicate that the fair value of such indefinite lived intangibles has been impaired. No impairment of goodwill or indefinite lived intangible assets was recorded during the years ended
December 31, 2018
,
2017
and
2016
.
Equity-based compensation
We have equity-based compensation plans under which we receive services from our employees as consideration for equity instruments of the Company, including stock options, restricted stock units, and an employee stock purchase plan. The compensation expense is determined based on the fair value of the award as of the grant date. Compensation expense is recognized over the vesting period, which is the period over which all of the specified vesting conditions are satisfied. For awards with graded vesting, the fair value of each tranche is recognized over its respective vesting period.
Income taxes
Planet Fitness, Inc. is the sole managing member of Pla-Fit Holdings, which is treated as a partnership for U.S. federal and most applicable state and local income tax purposes. As a partnership, Pla-Fit Holdings is not subject to U.S. federal and certain state and local income taxes. Any taxable income or loss generated by Pla-Fit Holdings is passed through to and included in the taxable income or loss of its members, including Planet Fitness, Inc., on a pro rata basis. Planet Fitness, Inc. is subject to U.S. federal income taxes, in addition to state and local income taxes with respect to the Company's allocable share of any taxable income of Pla-Fit Holdings. The Company is also subject to taxes in foreign jurisdictions.
Deferred income taxes are recognized for the expected future tax consequences attributable to temporary differences between the carrying amount of the existing tax assets and liabilities and their respective tax basis. Deferred tax assets and liabilities are measured using enacted tax rates expected to be applied in the years in which temporary differences are expected to be recovered or settled. The principal items giving rise to temporary differences are the use of accelerated depreciation and certain basis differences resulting from acquisitions and the recapitalization transactions. Valuation allowances are established when necessary to reduce deferred tax assets to the amount expected to be realized.
67
We recognize the effects of income tax positions only if those positions are more likely than not of being sustained. Recognized income tax positions are measured at the largest amount that is greater than 50% likely of being realized. Changes in recognition or measurement are reflected in the period in which the change in judgment occurs.
Pla-Fit Holdings is liable for certain state and local taxes and is subject to tax withholding in foreign jurisdictions. Pursuant to the LLC Agreement, Pla-Fit Holdings makes pro rata tax distributions to the holders of Holdings Units in an amount sufficient to fund all or part of their tax obligations with respect to the taxable income of Pla-Fit Holdings that is allocated to them. See “Certain Relationships and Related Transactions, and Director Independence—Recapitalization transactions in connection with our IPO—Pla-Fit Holdings amended and restated limited liability company agreement.”
Tax Benefit Arrangements
Our acquisition of Holdings Units in connection with the IPO and future and certain past exchanges of Holdings Units for shares of our Class A common stock (or cash at the option of the Company) are expected to produce and have produced favorable tax attributes. In connection with the IPO, we entered into two tax receivable agreements. Under the first of those agreements, we are generally required to pay to the TRA Holders 85% of the applicable tax savings, if any, in U.S. federal and state income tax that we are deemed to realize as a result of certain tax attributes of their Holdings Units sold to us (or exchanged in a taxable sale) and that are created as a result of (i) the sales of their Holdings Units for shares of Class A common stock and (ii) tax benefits attributable to payments made under the tax receivable agreement (including imputed interest). Under the second tax receivable agreement, we are generally required to pay to the Direct TSG Investors 85% of the amount of tax savings, if any, that we are deemed to realize as a result of the tax attributes of the Holdings Units held in respect of the Direct TSG Investors’ interest in the Company, which resulted from the Direct TSG Investors’ purchase of interests in Pla-Fit Holdings in 2012, and certain other tax benefits. Under both agreements, we generally retain the benefit of the remaining 15% of the applicable tax savings. Also, pursuant to the exchange agreement described under “Certain Relationships and Related Transactions, and Director Independence—Recapitalization transactions in connection with our IPO—Exchange agreement,” to the extent an exchange results in Pla-Fit Holdings incurring a current tax liability relating to the New Hampshire business profits tax, the TRA Holders have agreed that they will contribute to Pla-Fit Holdings an amount sufficient to pay such tax liability (up to 3.5% of the value received upon exchange). If and when we subsequently realize a related tax benefit, Pla-Fit Holdings will distribute the amount of any such tax benefit to the relevant Continuing LLC Owner in respect of its contribution. Due to changes in New Hampshire tax law, the Company no longer expects to incur any such liability under the New Hampshire business profits tax.
Based on current projections, we anticipate having sufficient taxable income to utilize these tax attributes and receive corresponding tax deductions in future periods. Accordingly, we have recorded a liability of $
429.2
million, payable to the Direct TSG Investors and the TRA Holders under the tax benefit obligations, representing approximately 85% of the calculated tax savings based on the original basis adjustments we anticipate being able to utilize in future years. Changes in the projected liability resulting from these tax benefit arrangements may occur based on changes in anticipated future taxable income, changes in applicable tax rates or other changes in tax attributes that may occur and impact the expected future tax benefits to be received by the Company. Changes in the projected liability under these tax benefit arrangements will be recorded as a component of other income (expense) each period. The projection of future taxable income involves significant judgment. Actual taxable income may differ from our estimates, which could significantly impact the liability under the tax benefit arrangements and our consolidated results of operations.
We expect to receive additional increases in our share of the tax basis of Pla-Fit Holdings assets when the TRA Holders exchange Holdings Units (together with the corresponding shares of Class B common stock) for Class A common stock. If we acquire Holdings Units from the TRA Holders, we expect both the original basis adjustments and the anticipated basis adjustments will increase, resulting in additional future tax deductions and therefore reducing the amount of future income tax we would otherwise be required to pay. These potential future increases in tax basis will result in additional deferred tax assets and additional liabilities under the tax benefit arrangements, representing approximately 85% of the projected tax savings for the expected use of these tax attributes. Such amounts will be recorded at the time of these future exchanges based on our projections of taxable income and other factors that may exist at the time of such exchanges.
ITEM 7A. Quantitative and Qualitative Disclosure about Market Risk
Interest rate risk
The securitized financing facility includes the Series 2018-1 Senior Notes which are comprised of fixed interest rate notes and the Variable Funding Notes which allow for the issuance up to $75.0 million of Variable Funding Notes. The issuance of the fixed-rate Class A-2 Notes has reduced the Company's exposure to interest rate increases that could adversely affect its earnings and cash flows. However, the Company is exposed to interest rate increases on borrowings under the Variable Funding Notes.
68
Foreign exchange risk
We are exposed to fluctuations in exchange rates between the U.S. dollar and foreign currencies, primarily the Canadian dollar, which is the functional currency of our Canadian entities. Our sales, costs and expenses of our Canadian subsidiaries, when translated into U.S. dollars, can fluctuate due to exchange rate movement. As of
December 31, 2018
, a 10% increase or decrease in the exchange rates of the U.S. dollar and currencies would increase or decrease net income by a negligible amount.
Inflation risk
Although we do not believe that inflation has had a material effect on our income from continuing operations, we have a substantial number of hourly employees in our corporate-owned stores that are paid wage rates at or based on the applicable federal or state minimum wage. Any increases in these minimum wages will subsequently increase our labor costs. We may or may not be able to offset cost increases in the future.
69
Item 8. Financial Statements and Supplementary Data.
Report of Independent Registered Public Accounting Firm
To the Stockholders and Board of Directors
Planet Fitness, Inc.:
Opinion on the Consolidated Financial Statements
We have audited the accompanying consolidated balance sheets of Planet Fitness, Inc. and subsidiaries (the “Company”) as of
December 31, 2018
and
2017
, the related consolidated statements of operations, comprehensive income, cash flows and changes in equity for each of the years in the three‑year period ended
December 31, 2018
, and the related notes and financial statement Schedule II-Valuation and Qualifying Accounts (collectively, the “consolidated financial statements”). In our opinion, the consolidated financial statements present fairly, in all material respects, the financial position of the Company as of
December 31, 2018
and
2017
, and the results of its operations and its cash flows for each of the years in the three‑year period ended
December 31, 2018
, in conformity with U.S. generally accepted accounting principles.
We also have audited, in accordance with the standards of the Public Company Accounting Oversight Board (United States) (“PCAOB”), the Company’s internal control over financial reporting as of
December 31, 2018
, based on criteria established in
Internal Control – Integrated Framework (2013)
issued by the Committee of Sponsoring Organizations of the Treadway Commission, and our report dated March 1, 2019 expressed an unqualified opinion on the effectiveness of the Company’s internal control over financial reporting.
Change in Accounting Principle
As discussed in Note 2 to the consolidated financial statements, in 2018 the Company changed its method of accounting for revenue from contracts with customers due to the adoption of the new revenue standard.
Basis for Opinion
These consolidated financial statements are the responsibility of the Company’s management. Our responsibility is to express an opinion on these consolidated financial statements based on our audits. We are a public accounting firm registered with the PCAOB and are required to be independent with respect to the Company in accordance with the U.S. federal securities laws and the applicable rules and regulations of the Securities and Exchange Commission and the PCAOB.
We conducted our audits in accordance with the standards of the PCAOB. Those standards require that we plan and perform the audit to obtain reasonable assurance about whether the consolidated financial statements are free of material misstatement, whether due to error or fraud. Our audits included performing procedures to assess the risks of material misstatement of the consolidated financial statements, whether due to error or fraud, and performing procedures that respond to those risks. Such procedures included examining, on a test basis, evidence regarding the amounts and disclosures in the consolidated financial statements. Our audits also included evaluating the accounting principles used and significant estimates made by management, as well as evaluating the overall presentation of the consolidated financial statements. We believe that our audits provide a reasonable basis for our opinion.
/s/ KPMG LLP
We have served as the Company’s auditor since 2012.
Boston, Massachusetts
March 1, 2019
70
Planet Fitness, Inc. and subsidiaries
Consolidated balance sheets
(Amounts in thousands, except per share amounts)
|
|
December 31,
|
December 31,
|
|||||
|
|
2018
|
2017
|
|||||
|
Assets
|
|||||||
|
Current assets:
|
|||||||
|
Cash and cash equivalents
|
$
|
289,431
|
|
$
|
113,080
|
|
|
|
Restricted cash
|
30,708
|
|
—
|
|
|||
|
Accounts receivable, net of allowance for bad debts of $84 and $32 at
December 31, 2018 and 2017, respectively |
38,960
|
|
37,272
|
|
|||
|
Due from related parties
|
—
|
|
3,020
|
|
|||
|
Inventory
|
5,122
|
|
2,692
|
|
|||
|
Restricted assets – NAF (note 4)
|
—
|
|
499
|
|
|||
|
Prepaid expenses
|
4,947
|
|
3,929
|
|
|||
|
Other receivables
|
12,548
|
|
9,562
|
|
|||
|
Income tax receivable
|
6,824
|
|
6,947
|
|
|||
|
Total current assets
|
388,540
|
|
177,001
|
|
|||
|
Property and equipment, net
|
114,367
|
|
83,327
|
|
|||
|
Intangible assets, net
|
234,330
|
|
235,657
|
|
|||
|
Goodwill
|
199,513
|
|
176,981
|
|
|||
|
Deferred income taxes
|
414,841
|
|
407,782
|
|
|||
|
Other assets, net
|
1,825
|
|
11,717
|
|
|||
|
Total assets
|
$
|
1,353,416
|
|
$
|
1,092,465
|
|
|
|
Liabilities and stockholders' deficit
|
|||||||
|
Current liabilities:
|
|||||||
|
Current maturities of long-term debt
|
$
|
12,000
|
|
$
|
7,185
|
|
|
|
Accounts payable
|
30,428
|
|
28,648
|
|
|||
|
Accrued expenses
|
32,384
|
|
18,590
|
|
|||
|
Equipment deposits
|
7,908
|
|
6,498
|
|
|||
|
Restricted liabilities - NAF (note 4)
|
—
|
|
490
|
|
|||
|
Deferred revenue, current
|
23,488
|
|
19,083
|
|
|||
|
Payable pursuant to tax benefit arrangements, current
|
24,765
|
|
31,062
|
|
|||
|
Other current liabilities
|
430
|
|
474
|
|
|||
|
Total current liabilities
|
131,403
|
|
112,030
|
|
|||
|
Long-term debt, net of current maturities
|
1,160,127
|
|
696,576
|
|
|||
|
Deferred rent, net of current portion
|
10,083
|
|
6,127
|
|
|||
|
Deferred revenue, net of current portion
|
26,374
|
|
8,440
|
|
|||
|
Deferred tax liabilities
|
2,303
|
|
1,629
|
|
|||
|
Payable pursuant to tax benefit arrangements, net of current portion
|
404,468
|
|
400,298
|
|
|||
|
Other liabilities
|
1,447
|
|
4,302
|
|
|||
|
Total noncurrent liabilities
|
1,604,802
|
|
1,117,372
|
|
|||
|
Commitments and contingencies (note 16)
|
|
|
|||||
|
Stockholders' equity:
|
|||||||
|
Class A common stock, $.0001 par value - 300,000 shares authorized, 83,584 and 87,188
shares issued and outstanding as of December 31, 2018 and 2017, respectively |
9
|
|
9
|
|
|||
|
Class B common stock, $.0001 par value - 100,000 shares authorized, 9,448 and 11,193
shares issued and outstanding as of December 31, 2018 and 2017, respectively |
1
|
|
1
|
|
|||
|
Accumulated other comprehensive gain (loss)
|
94
|
|
(648
|
)
|
|||
|
Additional paid in capital
|
19,732
|
|
12,118
|
|
|||
|
Accumulated deficit
|
(394,410
|
)
|
(130,966
|
)
|
|||
|
Total stockholders' deficit attributable to Planet Fitness, Inc.
|
(374,574
|
)
|
(119,486
|
)
|
|||
|
Non-controlling interests
|
(8,215
|
)
|
(17,451
|
)
|
|||
|
Total stockholders' deficit
|
(382,789
|
)
|
(136,937
|
)
|
|||
|
Total liabilities and stockholders' deficit
|
$
|
1,353,416
|
|
$
|
1,092,465
|
|
|
See accompanying notes to consolidated financial statements.
71
Planet Fitness, Inc. and subsidiaries
Consolidated statements of operations
(Amounts in thousands, except per share amounts)
|
|
For the Year Ended
December 31,
|
||||||||||
|
|
2018
|
2017
|
2016
|
||||||||
|
Revenue:
|
|||||||||||
|
Franchise
|
$
|
175,314
|
|
$
|
131,983
|
|
$
|
97,374
|
|
||
|
Commission income
|
6,632
|
|
18,172
|
|
19,114
|
|
|||||
|
National advertising fund revenue
|
42,194
|
|
—
|
|
—
|
|
|||||
|
Corporate-owned stores
|
138,599
|
|
112,114
|
|
104,721
|
|
|||||
|
Equipment
|
210,159
|
|
167,673
|
|
157,032
|
|
|||||
|
Total revenue
|
572,898
|
|
429,942
|
|
378,241
|
|
|||||
|
Operating costs and expenses:
|
|||||||||||
|
Cost of revenue
|
162,646
|
|
129,266
|
|
122,317
|
|
|||||
|
Store operations
|
75,005
|
|
60,657
|
|
60,121
|
|
|||||
|
Selling, general and administrative
|
72,446
|
|
60,369
|
|
50,008
|
|
|||||
|
National advertising fund expense
|
42,619
|
|
—
|
|
—
|
|
|||||
|
Depreciation and amortization
|
35,260
|
|
31,761
|
|
31,502
|
|
|||||
|
Other (gain) loss
|
878
|
|
353
|
|
(1,369
|
)
|
|||||
|
Total operating costs and expenses
|
388,854
|
|
282,406
|
|
262,579
|
|
|||||
|
Income from operations
|
184,044
|
|
147,536
|
|
115,662
|
|
|||||
|
Other income (expense), net:
|
|||||||||||
|
Interest income
|
4,681
|
|
54
|
|
21
|
|
|||||
|
Interest expense
|
(50,746
|
)
|
(35,337
|
)
|
(27,146
|
)
|
|||||
|
Other income (expense), net
|
(6,175
|
)
|
316,928
|
|
1,371
|
|
|||||
|
Total other income (expense), net
|
(52,240
|
)
|
281,645
|
|
(25,754
|
)
|
|||||
|
Income before income taxes
|
131,804
|
|
429,181
|
|
89,908
|
|
|||||
|
Provision for income taxes
|
28,642
|
|
373,580
|
|
18,661
|
|
|||||
|
Net income
|
103,162
|
|
55,601
|
|
71,247
|
|
|||||
|
Less net income attributable to non-controlling interests
|
15,141
|
|
22,455
|
|
49,747
|
|
|||||
|
Net income attributable to Planet Fitness, Inc.
|
$
|
88,021
|
|
$
|
33,146
|
|
$
|
21,500
|
|
||
|
Net income per share of Class A common stock:
|
|||||||||||
|
Basic
|
$
|
1.01
|
|
$
|
0.42
|
|
$
|
0.50
|
|
||
|
Diluted
|
$
|
1.00
|
|
$
|
0.42
|
|
$
|
0.50
|
|
||
|
Weighted-average shares of Class A common stock outstanding:
|
|||||||||||
|
Basic
|
87,235
|
|
78,910
|
|
43,300
|
|
|||||
|
Diluted
|
87,675
|
|
78,972
|
|
43,305
|
|
|||||
See accompanying notes to consolidated financial statements.
72
Planet Fitness, Inc. and subsidiaries
Consolidated statements of comprehensive income
(Amounts in thousands)
|
|
For the Year Ended
December 31,
|
||||||||||
|
|
2018
|
2017
|
2016
|
||||||||
|
Net income including non-controlling interests
|
$
|
103,162
|
|
$
|
55,601
|
|
$
|
71,247
|
|
||
|
Other comprehensive (loss) income, net:
|
|||||||||||
|
Unrealized gain (loss) on interest rate caps, net of tax
|
989
|
|
1,143
|
|
(78
|
)
|
|||||
|
Foreign currency translation adjustments
|
(200
|
)
|
26
|
|
(72
|
)
|
|||||
|
Total other comprehensive income (loss), net
|
789
|
|
1,169
|
|
(150
|
)
|
|||||
|
Total comprehensive income including non-controlling interests
|
103,951
|
|
56,770
|
|
71,097
|
|
|||||
|
Less: total comprehensive income attributable to non-controlling interests
|
15,189
|
|
22,707
|
|
49,560
|
|
|||||
|
Total comprehensive income attributable to Planet Fitness, Inc.
|
$
|
88,762
|
|
$
|
34,063
|
|
$
|
21,537
|
|
||
See accompanying notes to consolidated financial statements.
73
Planet Fitness, Inc. and subsidiaries
Consolidated statements of cash flows
(Amounts in thousands)
|
|
For the Year Ended December 31,
|
||||||||||
|
|
2018
|
2017
|
2016
|
||||||||
|
Cash flows from operating activities:
|
|||||||||||
|
Net income
|
$
|
103,162
|
|
$
|
55,601
|
|
$
|
71,247
|
|
||
|
Adjustments to reconcile net income to net cash provided by operating activities:
|
|||||||||||
|
Depreciation and amortization
|
35,260
|
|
31,761
|
|
31,502
|
|
|||||
|
Amortization of deferred financing costs
|
3,400
|
|
1,935
|
|
1,544
|
|
|||||
|
Amortization of favorable leases and asset retirement obligations
|
375
|
|
334
|
|
392
|
|
|||||
|
Amortization and settlement of interest rate caps
|
1,170
|
|
1,755
|
|
797
|
|
|||||
|
Deferred tax expense
|
23,933
|
|
372,422
|
|
15,606
|
|
|||||
|
Loss (gain) on re-measurement of tax benefit arrangement
|
4,765
|
|
(317,354
|
)
|
72
|
|
|||||
|
Provision for bad debts
|
19
|
|
(19
|
)
|
59
|
|
|||||
|
Loss (gain) on disposal of property and equipment
|
462
|
|
(159
|
)
|
(514
|
)
|
|||||
|
Loss on extinguishment of debt
|
4,570
|
|
79
|
|
606
|
|
|||||
|
Third party debt refinancing expense
|
—
|
|
1,021
|
|
3,001
|
|
|||||
|
Loss on reacquired franchise rights
|
360
|
|
—
|
|
—
|
|
|||||
|
Equity-based compensation
|
5,479
|
|
2,531
|
|
1,728
|
|
|||||
|
Changes in operating assets and liabilities:
|
|||||||||||
|
Accounts receivable
|
(1,923
|
)
|
(10,481
|
)
|
(7,754
|
)
|
|||||
|
Due from related parties
|
3,598
|
|
(604
|
)
|
1,897
|
|
|||||
|
Inventory
|
(2,430
|
)
|
(890
|
)
|
2,755
|
|
|||||
|
Other assets and other current assets
|
5,778
|
|
(2,981
|
)
|
(7,944
|
)
|
|||||
|
Accounts payable and accrued expenses
|
14,506
|
|
4,210
|
|
7,428
|
|
|||||
|
Other liabilities and other current liabilities
|
(2,835
|
)
|
(470
|
)
|
2,747
|
|
|||||
|
Income taxes
|
194
|
|
(3,027
|
)
|
(5,993
|
)
|
|||||
|
Payments pursuant to tax benefit arrangements
|
(30,493
|
)
|
(11,446
|
)
|
(6,922
|
)
|
|||||
|
Equipment deposits
|
1,410
|
|
4,328
|
|
(3,417
|
)
|
|||||
|
Deferred revenue
|
9,640
|
|
1,276
|
|
(652
|
)
|
|||||
|
Deferred rent
|
3,999
|
|
1,199
|
|
632
|
|
|||||
|
Net cash provided by operating activities
|
184,399
|
|
131,021
|
|
108,817
|
|
|||||
|
Cash flows from investing activities:
|
|||||||||||
|
Additions to property and equipment
|
(40,860
|
)
|
(37,722
|
)
|
(15,377
|
)
|
|||||
|
Acquisitions of franchises
|
(45,752
|
)
|
—
|
|
—
|
|
|||||
|
Proceeds from sale of property and equipment
|
196
|
|
680
|
|
683
|
|
|||||
|
Net cash used in investing activities
|
(86,416
|
)
|
(37,042
|
)
|
(14,694
|
)
|
|||||
|
Cash flows from financing activities:
|
|||||||||||
|
Proceeds from issuance of long-term debt
|
1,200,000
|
|
—
|
|
230,000
|
|
|||||
|
Proceeds from issuance of Class A common stock
|
1,209
|
|
480
|
|
136
|
|
|||||
|
Principal payments on capital lease obligations
|
(47
|
)
|
(22
|
)
|
(46
|
)
|
|||||
|
Repayment of long-term debt
|
(712,469
|
)
|
(7,185
|
)
|
(5,621
|
)
|
|||||
|
Payment of deferred financing and other debt-related costs
|
(27,133
|
)
|
(1,278
|
)
|
(5,220
|
)
|
|||||
|
Premiums paid for interest rate caps
|
—
|
|
(366
|
)
|
—
|
|
|||||
|
Repurchase and retirement of Class A common stock
|
(342,383
|
)
|
—
|
|
—
|
|
|||||
|
Repurchase and retirement of Class B common stock
|
—
|
|
—
|
|
(1,583
|
)
|
|||||
|
Dividend paid to holders of Class A common stock
|
—
|
|
—
|
|
(169,282
|
)
|
|||||
|
Dividend equivalent paid to members of Pla-Fit Holdings
|
(957
|
)
|
(1,974
|
)
|
(101,729
|
)
|
|||||
|
Distributions to members of Pla-Fit Holdings
|
(8,300
|
)
|
(11,358
|
)
|
(31,838
|
)
|
|||||
|
Net cash provided by (used in) financing activities
|
109,920
|
|
(21,703
|
)
|
(85,183
|
)
|
|||||
|
Effects of exchange rate changes on cash and cash equivalents
|
(844
|
)
|
411
|
|
23
|
|
|||||
|
Net increase in cash, cash equivalents and restricted cash
|
207,059
|
|
72,687
|
|
8,963
|
|
|||||
|
Cash, cash equivalents and restricted cash, beginning of period
|
113,080
|
|
40,393
|
|
31,430
|
|
|||||
|
Cash, cash equivalents and restricted cash, end of period
|
$
|
320,139
|
|
$
|
113,080
|
|
$
|
40,393
|
|
||
|
Supplemental cash flow information:
|
|||||||||||
|
Net cash paid for income taxes
|
$
|
5,016
|
|
$
|
3,722
|
|
$
|
7,040
|
|
||
|
Cash paid for interest
|
$
|
38,624
|
|
$
|
31,418
|
|
$
|
24,302
|
|
||
|
Non-cash investing activities:
|
|||||||||||
|
Non-cash additions to property and equipment
|
$
|
5,451
|
|
$
|
861
|
|
$
|
2,203
|
|
||
|
Non-cash financing activities:
|
|||||||||||
|
Non-cash dividend equivalent payments
|
$
|
—
|
|
$
|
—
|
|
$
|
3,899
|
|
||
See accompanying notes to consolidated financial statements.
74
Planet Fitness, Inc. and subsidiaries
Consolidated statement of changes in equity
(Amounts in thousands)
|
|
Class A
common stock
|
Class B
common stock
|
Accumulated
other comprehensive income (loss) |
Additional
paid-in capital |
Accumulated
deficit
|
Non-controlling
interests
|
Total equity (deficit)
|
||||||||||||||||||||||||||
|
Shares
|
Amount
|
Shares
|
Amount
|
||||||||||||||||||||||||||||||
|
Balance at January 1, 2016
|
36,598
|
|
4
|
|
62,112
|
|
6
|
|
(1,710
|
)
|
352
|
|
(14,032
|
)
|
14,300
|
|
(1,080
|
)
|
|||||||||||||||
|
Net income
|
—
|
|
—
|
|
—
|
|
—
|
|
—
|
|
—
|
|
21,500
|
|
49,747
|
|
71,247
|
|
|||||||||||||||
|
Equity-based compensation expense
|
—
|
|
—
|
|
—
|
|
—
|
|
—
|
|
1,749
|
|
(21
|
)
|
—
|
|
1,728
|
|
|||||||||||||||
|
Repurchase and retirement of Class B common stock
|
—
|
|
—
|
|
(222
|
)
|
—
|
|
—
|
|
(441
|
)
|
(1,142
|
)
|
—
|
|
(1,583
|
)
|
|||||||||||||||
|
Exchanges of Class B common stock
|
24,705
|
|
2
|
|
(24,705
|
)
|
(2
|
)
|
499
|
|
10,976
|
|
—
|
|
(11,475
|
)
|
—
|
|
|||||||||||||||
|
Tax benefit arrangement liability and deferred taxes arising from secondary offerings and other exchanges
|
—
|
|
—
|
|
—
|
|
—
|
|
—
|
|
21,695
|
|
—
|
|
—
|
|
21,695
|
|
|||||||||||||||
|
Exercise of stock options and vesting of restricted share units
|
11
|
|
—
|
|
—
|
|
—
|
|
—
|
|
136
|
|
—
|
|
—
|
|
136
|
|
|||||||||||||||
|
Dividend paid to holders of Class A common stock
|
—
|
|
—
|
|
—
|
|
—
|
|
—
|
|
—
|
|
(169,282
|
)
|
—
|
|
(169,282
|
)
|
|||||||||||||||
|
Dividend equivalents paid or payable
|
—
|
|
—
|
|
—
|
|
—
|
|
—
|
|
—
|
|
(1,085
|
)
|
(104,543
|
)
|
(105,628
|
)
|
|||||||||||||||
|
Distributions paid to members of Pla-Fit Holdings
|
—
|
|
—
|
|
—
|
|
—
|
|
—
|
|
—
|
|
—
|
|
(31,838
|
)
|
(31,838
|
)
|
|||||||||||||||
|
Other comprehensive loss
|
—
|
|
—
|
|
—
|
|
—
|
|
37
|
|
—
|
|
—
|
|
(187
|
)
|
(150
|
)
|
|||||||||||||||
|
Balance at December 31, 2016
|
61,314
|
|
$
|
6
|
|
37,185
|
|
$
|
4
|
|
$
|
(1,174
|
)
|
$
|
34,467
|
|
$
|
(164,062
|
)
|
$
|
(83,996
|
)
|
$
|
(214,755
|
)
|
||||||||
|
Net income
|
—
|
|
—
|
|
—
|
|
—
|
|
—
|
|
—
|
|
33,146
|
|
22,455
|
|
55,601
|
|
|||||||||||||||
|
Equity-based compensation expense
|
—
|
|
—
|
|
—
|
|
—
|
|
—
|
|
2,565
|
|
(34
|
)
|
—
|
|
2,531
|
|
|||||||||||||||
|
Repurchase and retirement of Class B common stock
|
—
|
|
—
|
|
(150
|
)
|
—
|
|
—
|
|
—
|
|
—
|
|
—
|
|
—
|
|
|||||||||||||||
|
Exchanges of Class B common stock
|
25,842
|
|
3
|
|
(25,842
|
)
|
(3
|
)
|
(391
|
)
|
(54,042
|
)
|
—
|
|
54,433
|
|
—
|
|
|||||||||||||||
|
Tax benefit arrangement liability and deferred taxes arising from secondary offerings and other exchanges
|
—
|
|
—
|
|
—
|
|
—
|
|
—
|
|
28,648
|
|
—
|
|
—
|
|
28,648
|
|
|||||||||||||||
|
Exercise of stock options and vesting of restricted share units
|
32
|
|
—
|
|
—
|
|
—
|
|
—
|
|
480
|
|
—
|
|
—
|
|
480
|
|
|||||||||||||||
|
Dividend paid to holders of Class A common stock
|
—
|
|
—
|
|
—
|
|
—
|
|
—
|
|
—
|
|
32
|
|
417
|
|
449
|
|
|||||||||||||||
|
Dividend equivalents paid or payable
|
—
|
|
—
|
|
—
|
|
—
|
|
—
|
|
—
|
|
(48
|
)
|
(11,012
|
)
|
(11,060
|
)
|
|||||||||||||||
|
Distributions paid to members of Pla-Fit Holdings
|
—
|
|
—
|
|
—
|
|
—
|
|
917
|
|
—
|
|
—
|
|
252
|
|
1,169
|
|
|||||||||||||||
|
Balance at December 31, 2017
|
87,188
|
|
$
|
9
|
|
11,193
|
|
$
|
1
|
|
$
|
(648
|
)
|
$
|
12,118
|
|
$
|
(130,966
|
)
|
$
|
(17,451
|
)
|
$
|
(136,937
|
)
|
||||||||
|
Net income
|
—
|
|
—
|
|
—
|
|
—
|
|
—
|
|
—
|
|
88,021
|
|
15,141
|
|
103,162
|
|
|||||||||||||||
|
Equity-based compensation expense
|
—
|
|
—
|
|
—
|
|
—
|
|
—
|
|
5,482
|
|
(3
|
)
|
—
|
|
5,479
|
|
|||||||||||||||
|
Retirement of Class B common stock
|
—
|
|
—
|
|
(9
|
)
|
—
|
|
—
|
|
—
|
|
—
|
|
—
|
|
—
|
|
|||||||||||||||
|
Exchanges of Class B common stock
|
1,736
|
|
—
|
|
(1,736
|
)
|
—
|
|
1
|
|
(3,067
|
)
|
—
|
|
3,066
|
|
—
|
|
|||||||||||||||
|
Repurchase and retirement of Class A common stock
|
(5,431
|
)
|
—
|
|
—
|
|
—
|
|
719
|
|
(342,383
|
)
|
(719
|
)
|
(342,383
|
)
|
|||||||||||||||||
|
Tax benefit arrangement liability and deferred taxes arising from secondary offerings and other exchanges
|
—
|
|
—
|
|
—
|
|
—
|
|
—
|
|
3,271
|
|
—
|
|
—
|
|
3,271
|
|
|||||||||||||||
|
Exercise of stock options and vesting of restricted share units
|
91
|
|
—
|
|
—
|
|
—
|
|
—
|
|
1,209
|
|
—
|
|
—
|
|
1,209
|
|
|||||||||||||||
|
Forfeiture of dividend equivalents
|
—
|
|
—
|
|
—
|
|
—
|
|
—
|
|
—
|
|
113
|
|
—
|
|
113
|
|
|||||||||||||||
|
Distributions paid to members of Pla-Fit Holdings
|
—
|
|
—
|
|
—
|
|
—
|
|
—
|
|
—
|
|
—
|
|
(8,300
|
)
|
(8,300
|
)
|
|||||||||||||||
|
Cumulative effect adjustment (Note 10)
|
—
|
|
—
|
|
—
|
|
—
|
|
—
|
|
—
|
|
(9,192
|
)
|
—
|
|
(9,192
|
)
|
|||||||||||||||
|
Other comprehensive loss
|
—
|
|
—
|
|
—
|
|
—
|
|
741
|
|
—
|
|
—
|
|
48
|
|
789
|
|
|||||||||||||||
|
Balance at December 31, 2018
|
83,584
|
|
$
|
9
|
|
9,448
|
|
$
|
1
|
|
$
|
94
|
|
$
|
19,732
|
|
$
|
(394,410
|
)
|
$
|
(8,215
|
)
|
$
|
(382,789
|
)
|
||||||||
See accompanying notes to consolidated financial statements
75
Planet Fitness, Inc. and subsidiaries
Notes to Consolidated financial statements
(Amounts in thousands, except share and per share amounts)
(1) Business organization
Planet Fitness, Inc. (the “Company”), through its subsidiaries, is a franchisor and operator of fitness centers, with approximately
12.5 million
members and
1,742
owned and franchised locations (referred to as stores) in all
50
states, the District of Columbia, Puerto Rico, Canada, the Dominican Republic, Panama and Mexico as of
December 31, 2018
.
The Company serves as the reporting entity for its various subsidiaries that operate
three
distinct lines of business:
|
•
|
Licensing and selling franchises under the Planet Fitness trade name;
|
|
•
|
Owning and operating fitness centers under the Planet Fitness trade name; and
|
|
•
|
Selling fitness-related equipment to franchisee-owned stores.
|
In 2012 investment funds affiliated with TSG Consumer Partners, LLC (“TSG”), purchased interests in Pla-Fit Holdings.
The Company was formed as a Delaware corporation on
March 16, 2015
for the purpose of facilitating an initial public offering (the “IPO”) and related transactions in order to carry on the business of Pla-Fit Holdings, LLC and its subsidiaries (“Pla-Fit Holdings”). As of August 5, 2015, in connection with the recapitalization transactions, the Company became the sole managing member and holder of
100%
of the voting power of Pla-Fit Holdings. Pla-Fit Holdings owns
100%
of Planet Intermediate, LLC which has no operations but is the
100%
owner of Planet Fitness Holdings, LLC, a franchisor and operator of fitness centers. With respect to the Company, Pla-Fit Holdings and Planet Intermediate, LLC, each entity owns nothing other than the respective entity below it in the corporate structure and each entity has no other material operations.
The Company is a holding company whose principal asset is a controlling equity interest in Pla-Fit Holdings. As the sole managing member of Pla-Fit Holdings, the Company operates and controls all of the business and affairs of Pla-Fit Holdings, and through Pla-Fit Holdings, conducts its business. As a result, the Company consolidates Pla-Fit Holdings’ financial results and reports a non-controlling interest related to the portion of Holdings Units not owned by the Company.
The recapitalization transactions are considered transactions between entities under common control. As a result, the financial statements for periods prior to the IPO and the recapitalization transactions are the financial statements of Pla-Fit Holdings as the predecessor to the Company for accounting and reporting purposes. Unless otherwise specified, “the Company” refers to both Planet Fitness, Inc. and Pla-Fit Holdings throughout the remainder of these notes.
Secondary offerings
In June 2016, the Company completed a secondary offering (“June Secondary Offering”) of
11,500,000
shares of its Class A common stock at a price of
$16.50
per share. All of the shares sold in the June Secondary Offering were offered by certain Continuing LLC Owners and TSG AIV II-A L.P and TSG PF Co-Investors A L.P. (“Direct TSG Investors”). The Company did not receive any proceeds from the sale of shares of Class A common stock offered by the Direct TSG Investors and the participating Continuing LLC Owners. The shares sold in the June Secondary Offering consisted of (i)
3,608,840
existing shares of Class A common stock held by the Direct TSG Investors and (ii)
7,891,160
newly-issued shares of Class A common stock issued in connection with the exercise of the exchange right by the Continuing LLC Owners that participated in the June Secondary Offering. Simultaneously, and in connection with the exchange,
7,891,160
shares of Class B common stock were surrendered by the Continuing LLC Owners that participated in the June Secondary Offering and canceled. Additionally, in connection with the exchange, Planet Fitness, Inc. received
7,891,160
Holdings Units, increasing its total ownership interest in Pla-Fit Holdings.
In September 2016, the Company completed a secondary offering (“September Secondary Offering”) of
8,000,000
shares of its Class A common stock at a price of
$19.62
per share. All of the shares sold in the September Secondary Offering were offered by the Direct TSG Investors and participating Continuing LLC Owners. The Company did not receive any proceeds from the sale of shares of Class A common stock offered by the Direct TSG Investors and the Continuing LLC Owners that participating in the September Secondary Offering. The shares sold in the September Secondary Offering consisted of (i)
2,593,981
existing shares of Class A common stock held by the Direct TSG Investors and (ii)
5,406,019
newly-issued shares of Class A common stock issued in connection with the exercise of the exchange right by the Continuing LLC Owners that participated in the September Secondary offering. Simultaneously, and in connection with the exchange,
5,406,019
shares of Class B common stock were surrendered by the Continuing LLC Owners that participated in the September Secondary Offering and canceled. Additionally, in connection with the exchange, Planet Fitness, Inc. received
5,406,019
Holdings Units, increasing its total ownership interest in Pla-Fit Holdings.
In November 2016, the Company completed a secondary offering (“November Secondary Offering”) of
15,000,000
shares of its Class A common stock at a price of
$23.22
per share. All of the shares sold in the November Secondary Offering were offered by the Direct TSG Investors and participating Continuing LLC Owners. The Company did not receive any proceeds from the sale of
76
Planet Fitness, Inc. and subsidiaries
Notes to Consolidated financial statements
(Amounts in thousands, except share and per share amounts)
shares of Class A common stock offered by the Direct TSG Investors and the Continuing LLC Owners that participating in the September Secondary Offering. The shares sold in the November Secondary Offering consisted of (i)
4,863,715
existing shares of Class A common stock held by the Direct TSG Investors and (ii)
10,136,285
newly-issued shares of Class A common stock issued in connection with the exercise of the exchange right by the Continuing LLC Owners that participated in the November Secondary offering. Simultaneously, and in connection with the exchange,
10,136,285
shares of Class B common stock were surrendered by the Continuing LLC Owners that participated in the November Secondary Offering and canceled. Additionally, in connection with the exchange, Planet Fitness, Inc. received
10,136,285
Holdings Units, increasing its total ownership interest in Pla-Fit Holdings.
In March 2017, the Company completed a secondary offering (“March Secondary Offering”) of
15,000,000
shares of its Class A common stock at a price of
$20.44
per share. All of the shares sold in the March Secondary Offering were offered by certain existing holders of Holdings Units and the Direct TSG Investors. The Company did not receive any proceeds from the sale of shares of Class A common stock offered by the Direct TSG Investors and the participating holders of Holdings Units. The shares sold in the March Secondary Offering consisted of (i)
4,790,758
existing shares of Class A common stock held by the Direct TSG Investors and (ii)
10,209,242
newly-issued shares of Class A common stock issued in connection with the exercise of the exchange right by the holders of Holdings Units that participated in the March Secondary Offering. Simultaneously, and in connection with the exchange,
10,209,242
shares of Class B common stock were surrendered by the holders of Holdings Units that participated in the March Secondary Offering and canceled. Additionally, in connection with the exchange, Planet Fitness, Inc. received
10,209,242
Holdings Units, increasing its total ownership interest in Pla-Fit Holdings.
In May 2017, the Company completed a secondary offering (“May Secondary Offering”) of
16,085,510
shares of its Class A common stock at a price of
$20.28
per share. All of the shares sold in the May Secondary Offering were offered by certain existing holders of Holdings Units and the Direct TSG Investors. The Company did not receive any proceeds from the sale of shares of Class A common stock offered by the Direct TSG Investors and the participating holders of Holdings Units. The shares sold in the May Secondary Offering consisted of (i)
5,215,691
existing shares of Class A common stock held by the Direct TSG Investors and (ii)
10,869,819
newly-issued shares of Class A common stock issued in connection with the exercise of the exchange right by the holders of Holdings Units that participated in the May Secondary Offering. Simultaneously, and in connection with the exchange,
10,869,819
shares of Class B common stock were surrendered by the holders of Holdings Units that participated in the May Secondary Offering and canceled. Additionally, in connection with the exchange, Planet Fitness, Inc. received
10,869,819
Holdings Units, increasing its total ownership interest in Pla-Fit Holdings.
In addition to the secondary offering transactions described above, during the years ended
December 31, 2018
and
2017
, certain Continuing LLC Owners have exercised their exchange rights and exchanged
1,736,020
and
4,762,943
Holdings Units, respectively, for
1,736,020
and
4,762,943
newly-issued shares of Class A common stock, respectively. Simultaneously, and in connection with these exchanges,
1,736,020
and
4,762,943
shares of Class B common stock were surrendered by the Continuing LLC Owners that exercised their exchange rights and canceled during the years ended
December 31, 2018
and
2017
, respectively. Additionally, in connection with these exchanges, Planet Fitness, Inc. received
1,736,020
and
4,762,943
Holdings Units during the years ended
December 31, 2018
and
2017
, respectively, increasing its total ownership interest in Pla-Fit Holdings.
As of
December 31, 2018
, the Company held
100%
of the voting interest, and approximately
89.8%
of the economic interest in Pla-Fit Holdings and the Continuing LLC Owners held the remaining
10.2%
economic interest in Pla-Fit Holdings. As future exchanges of Holdings Units occur, the economic interest in Pla-Fit Holdings held by Planet Fitness, Inc. will increase.
(2) Summary of significant accounting policies
(a) Basis of presentation and consolidation
The accompanying consolidated financial statements have been prepared in accordance with accounting principles generally accepted in the United States of America (“U.S. GAAP”) and pursuant to the rules and regulations of the Securities and Exchange Commission (the “SEC”). All significant intercompany balances and transactions have been eliminated in consolidation.
As discussed in Note 1, Planet Fitness, Inc. consolidates Pla-Fit Holdings. The Company also consolidates entities in which it has a controlling financial interest, the usual condition of which is ownership of a majority voting interest. The Company also considers for consolidation certain interests where the controlling financial interest may be achieved through arrangements that do not involve voting interests. Such an entity, known as a variable interest entity (“VIE”), is required to be consolidated by its primary beneficiary. The primary beneficiary of a VIE is considered to possess the power to direct the activities of the VIE that most significantly impact its economic performance and has the obligation to absorb losses or the rights to receive benefits from the VIE that are significant to it. The principal entities in which the Company possesses a variable interest include franchise entities and certain
77
Planet Fitness, Inc. and subsidiaries
Notes to Consolidated financial statements
(Amounts in thousands, except share and per share amounts)
other entities. The Company is not deemed to be the primary beneficiary for Planet Fitness franchise entities. Therefore, these entities are not consolidated.
The results of the Company have been consolidated with Matthew Michael Realty LLC (“MMR”), PF Melville LLC (“PF Melville”), and Planet Fitness NAF, LLC (the “NAF”) based on the determination that the Company is the primary beneficiary with respect to these VIEs. MMR and PF Melville are real estate holding companies that derive a majority of their financial support from the Company through lease agreements for corporate stores. See Note 3 for further information related to the Company’s VIEs. The NAF is an advertising fund on behalf of which the Company collects
2%
of gross monthly membership fees from franchisees, in accordance with the provisions of the franchise agreements, and uses the amounts received to increase sales and further enhance the public reputation of the Planet Fitness brand. See Note 4 for further information related to the NAF.
(b) Use of estimates
The preparation of financial statements in conformity with U.S. GAAP requires management to make estimates and assumptions that affect the amounts reported in the consolidated financial statements and accompanying notes. Although these estimates are based on management’s knowledge of current events and actions it may undertake in the future, they may ultimately differ from actual results. Significant areas where estimates and judgments are relied upon by management in the preparation of the consolidated financial statements include revenue recognition, valuation of equity-based compensation awards, the evaluation of the recoverability of goodwill and long-lived assets, including intangible assets, income taxes, including deferred tax assets and liabilities and reserves for unrecognized tax benefits, and the liability for the Company’s tax benefit arrangements.
(c) Concentrations
Cash and cash equivalents are financial instruments, which potentially subject the Company to a concentration of credit risk. The Company invests its excess cash in several major financial institutions, which are insured by the Federal Deposit Insurance Corporation (FDIC) up to
$250,000
. The Company maintains balances in excess of these limits, but does not believe that such deposits with its banks are subject to any unusual risk.
The credit risk associated with trade receivables is mitigated due to the large number of customers, generally our franchisees, and their broad dispersion over many different geographic areas. We do not have any concentrations with respect to our revenues.
The Company purchases equipment, both for corporate-owned stores and for sales to franchisee-owned stores from various equipment vendors. For the year ended
December 31, 2018
purchases from
two
equipment vendors comprised
76%
and
13%
, respectively, of total equipment purchases. For the year ended
December 31, 2017
purchases from
one
equipment vendor comprised
91%
of total equipment purchases and for the year ended
December 31, 2016
purchases from
two
equipment vendors comprised
83%
and
13%
, respectively, of total equipment purchases.
The Company, including the NAF, uses
one
primary vendor for advertising services. For the year ended
December 31, 2018
, purchases from this vendor comprised
65%
of total advertising purchases. For the year ended
December 31, 2017
purchases from
one
vendor comprised
63%
of total advertising purchases and for the year ended
December 31, 2016
purchases from
two
vendors comprised
25%
and
16%
of total advertising purchases, respectively. (see Note 4 for further discussion of the NAF).
(d) Cash, cash equivalents and restricted cash
The Company considers all highly liquid investments purchased with an original maturity of 90 days or less to be cash equivalents. Cash held within the NAF is recorded as a restricted asset (see Note 4).
In accordance with the Company’s securitized financing facility, certain cash accounts have been established in the name of Citibank, N.A. (the “Trustee”). The Company holds restricted cash which primarily represents cash collections held by the Trustee, which includes interest, principal, and commitment fee reserves. As of
December 31, 2018
, the Company had restricted cash held by the Trustee of $
30,708
. Restricted cash has been combined with cash and cash equivalents when reconciling the beginning and end of period balances in the consolidated statements of cash flows.
(e) Revenue recognition
Revenue from Contracts with Customers
We transitioned to FASB Accounting Standards Codification (“ASC”) Topic 606,
Revenue From Contracts with Customers
(“ASC 606”), from ASC Topic 605,
Revenue Recognition
and ASC Subtopic 952-605,
Franchisors - Revenue Recognition
(together, the “Previous Standards”) on January 1, 2018 using the modified retrospective transition method. Our Financial Statements reflect the application of ASC 606 guidance beginning in 2018, while our consolidated financial statements for prior periods were prepared
78
Planet Fitness, Inc. and subsidiaries
Notes to Consolidated financial statements
(Amounts in thousands, except share and per share amounts)
under the guidance of Previous Standards. The
$9,192
cumulative effect of our transition to ASC 606 is reflected as an adjustment to January 1, 2018 stockholders' deficit (see Note 10).
Our transition to ASC 606 represents a change in accounting principle. ASC 606 eliminates industry-specific guidance and provides a single revenue recognition model for recognizing revenue from contracts with customers. The core principle of ASC 606 is that a reporting entity should recognize revenue to depict the transfer of promised goods or services to customers in an amount that reflects the consideration to which the reporting entity expects to be entitled in exchange for those goods or services.
Revenue Recognition Significant Accounting Policies under ASC 606
The Company's revenues are comprised of franchise revenue, equipment revenue, and corporate-owned stores revenue.
Franchise revenue
Franchise revenues consist primarily of royalties, NAF contributions, initial and successor franchise fees and upfront fees from area development agreements ("ADAs"), transfer fees, equipment placement revenue, other fees and commission income.
The Company's primary performance obligation under the franchise license is granting certain rights to use the Company's intellectual property, and all other services the Company provides under the ADA and franchise agreement are highly interrelated, not distinct within the contract, and therefore accounted for under ASC 606 as a single performance obligation, which is satisfied by granting certain rights to use our intellectual property over the term of each franchise agreement.
Royalties, including franchisee contributions to national advertising funds, are calculated as a percentage of franchise monthly dues and annual fees over the term of the franchise agreement. Under our franchise agreements, advertising contributions paid by franchisees must be spent on advertising, marketing and related activities. Initial and successor franchise fees are payable by the franchisee upon signing a new franchise agreement or successor franchise agreement, and transfer fees are paid to the Company when one franchisee transfers a franchise agreement to a different franchisee. Our franchise royalties, as well as our NAF contributions, represent sales-based royalties that are related entirely to our performance obligation under the franchise agreement and are recognized as franchise sales occur.
Additionally, under ASC 606, initial and successor franchise fees, as well as transfer fees, are recognized as revenue on a straight-line basis over the term of the respective franchise agreement. Under the Previous Standards, initial franchise fees were recognized as revenue when the related franchisees signed a lease and completed the Company's new franchisee training. Successor franchise fees and transfer fees were recognized as revenue upon execution of a new franchise agreement. Our ADAs generally consist of an obligation to grant geographic exclusive area development rights. These development rights are not distinct from franchise agreements, so upfront fees paid by franchisees for exclusive development rights are deferred and apportioned to each franchise agreement signed by the franchisee. The pro-rata amount apportioned to each franchise agreement is accounted for identically to the initial franchise fee.
The Company is generally responsible for assembly and placement of equipment it sells to U.S. based franchisee-owned stores. Placement revenue is recognized upon completion and acceptance of the services at the franchise location.
The Company recognizes commission income from certain of its franchisees’ use of certain preferred vendor arrangements. Commissions are recognized when amounts have been earned and collectability from the vendor is reasonably assured.
Online member join fees are paid to the Company by franchisees for processing new membership transactions when a new member signs up for a membership to a franchisee-owned store through the Company’s website. These fees are recognized as revenue as each transaction occurs.
79
Planet Fitness, Inc. and subsidiaries
Notes to Consolidated financial statements
(Amounts in thousands, except share and per share amounts)
Billing transaction fees are paid to the Company by certain of its franchisees for the processing of franchisee membership dues and annual fees through the Company’s third-party hosted point-of-sale system and are recognized as revenue as they are earned.
Equipment revenue
The Company sells and delivers equipment purchased from third-party equipment manufacturers to U.S. based franchisee-owned stores. Revenue is recognized upon transfer of control of ordered items, generally upon delivery to the customer, which is when the customer obtains physical possession of the goods, legal title is transferred, the customer has all risks and rewards of ownership and an obligation to pay for the goods is created. Franchisees are charged for all freight costs incurred for the delivery of equipment. Freight revenue is recorded within equipment revenue and freight costs are recorded within cost of revenue. In most instances, the Company recognizes equipment revenue on a gross basis as management has determined the Company to be the principal in these transactions. Management determined the Company to be the principal in the transaction because the Company controls the equipment prior to delivery to the final customer as evidenced by its pricing discretion over the goods, inventory transfer of title and risk of loss while the inventory is in transit, and having the primary responsibility to fulfill the customer order and direct the third-party vendor.
Corporate-owned stores revenue
The following revenues are generated from stores owned and operated by the Company.
Membership dues revenue
Customers are offered multiple membership choices varying in length. Membership dues are earned and recognized over the membership term on a straight-line basis.
Enrollment fee revenue
Enrollment fees are charged to new members at the commencement of their membership. The Company recognizes enrollment fees ratably over the estimated duration of the membership life, which is generally two years.
Annual membership fee revenue
Annual membership fees are annual fees charged to members in addition to and in order to maintain low monthly membership dues. The Company recognizes annual membership fees ratably over the 12-month membership period.
Retail sales
The Company sells Planet Fitness branded apparel, food, beverages, and other accessories. The revenue for these items is recognized at the point of sale.
Sales tax
All revenue amounts are recorded net of applicable sales tax.
Revenue Recognition Significant Accounting Policies under Previous Standards, prior to January 1, 2018 if different than under ASC 606
Franchise revenue
The following revenues are generated as a result of transactions with or related to the Company’s franchisees.
Area development fees
ADA fees collected in advance are deferred until the Company provides substantially all required obligations pursuant to the ADA. As the efforts and total cost relating to initial services are affected significantly by the number of stores opened in an area, the respective ADA is treated as a divisible contract. As each new site is accepted under an ADA, a franchisee signs a franchise operating agreement for the respective franchise location. As each store opened under an ADA typically has performance obligations associated with it, the Company recognizes ADA revenue as each individual franchise location is developed in proportion to the total number of stores to be developed under the ADA. These obligations are typically completed once the store is opened or the franchisee executes the individual property lease. ADAs generally have an initial term equal to the number of years over which the franchisee is required to open franchise stores, which is typically
5
to
10 years
. There is no right of refund for an executed ADA. Upon default, as defined in the agreement, the Company may reacquire the rights pursuant to an ADA, and all remaining deferred revenue is recognized at that time.
80
Planet Fitness, Inc. and subsidiaries
Notes to Consolidated financial statements
(Amounts in thousands, except share and per share amounts)
Franchise fees and performance fees
Nonrefundable franchise fees are typically deferred until the franchisee executes a lease and receives initial training for the location, which is the point at which the Company has determined it has provided all of its material obligations required to recognize revenue. These amounts are included in deferred revenue on our consolidated balance sheets.
The individual franchise agreements typically have a
10
-year initial term, but provide the franchisee with an opportunity to enter into successive renewals subject to certain conditions.
Transfer fees
The Company’s current franchise agreement provides that upon the transfer of a Planet Fitness store to a different franchisee, the Company is entitled to a transfer fee in the amount of the greater of
$25
, or
$10
per store being transferred, if more than one, in addition to reimbursement of out-of-pocket expenses, including external legal and administrative costs incurred in connection with the transfer. Transfer-related fees and expenses are due, payable, and recognized at the time the transfer is effectuated.
Royalties
Royalties, which represent recurring fees paid by franchisees based on the franchisee-owned stores’ monthly and annual membership billings, are recognized on a monthly basis over the term of the franchise agreement. As specified under certain franchise agreements, the Company recognizes additional royalty fees as the franchisee-owned stores attain contractual monthly membership billing threshold amounts.
Equipment revenue
Equipment revenue is recognized upon the equipment being delivered to and assembled at each store and accepted by the franchisee. Franchisees are charged for all freight costs incurred for the delivery of equipment. Freight revenue is recorded within equipment revenue and freight costs are recorded within cost of revenue. The Company recognizes revenue on a gross basis in these transactions as management has determined the Company to be the principal in these transactions. Management determined the Company to be the principal because the Company is the primary obligor in these transactions, the Company has latitude in establishing prices for the equipment sales to franchisees, the Company has supplier selection discretion and is involved in determination of product specifications, and the Company bears all credit risk associated with obligations to the equipment manufacturers.
Equipment deposits are recognized as a liability on the accompanying consolidated balance sheets until delivery, assembly (if required), and acceptance by the franchisee.
(f) Deferred revenue
Subsequent to the adoption of ASC 606 franchise deferred revenue results from initial and successor franchise fees and ADA fees paid by franchisees, as well as transfer fees, which are generally recognized on a straight-line basis over the term of the underlying franchise agreement and under the Previous Standard franchise deferred revenue represents cash received from franchisees for ADAs and franchise fees for which revenue recognition criteria has not yet been met. Deferred revenue is also recognized in our corporate-owned stores segment for cash received from members for enrollment fees, membership dues and annual fees for the portion not yet earned based on the membership period under both ASC 606 and the Previous Standard.
(g) Cost of revenue
Cost of revenue consists primarily of direct costs associated with equipment sales (including freight costs) and the cost of retail merchandise sold in corporate-owned stores. Costs related to retail merchandise sales were immaterial in all periods presented. Rebates from equipment vendors where the Company has recognized the related equipment revenue and costs are recorded as a reduction to the cost of revenue.
(h) Store operations
Store operations consists of the direct costs related to operating corporate-owned stores, including our store management and staff, rent expense, utilities, supplies, maintenance, and local advertising.
(i) Selling, general and administrative
Selling, general and administrative expenses consist of costs associated with administrative and franchisee support functions related to our existing business as well as growth and development activities. These costs primarily consist of payroll, IT related, marketing, legal and accounting expenses. These expenses include costs related to placement services of
$5,397
,
$4,601
, and
$3,970
, for the years ended
December 31, 2018
,
2017
and
2016
, respectively.
81
Planet Fitness, Inc. and subsidiaries
Notes to Consolidated financial statements
(Amounts in thousands, except share and per share amounts)
(j) Accounts receivable
Accounts receivable is primarily comprised of amounts owed to the Company resulting from equipment, placement, and commission revenue. The Company evaluates its accounts receivable on an ongoing basis and may establish an allowance for doubtful accounts based on collections and current credit conditions. Accounts are written off as uncollectible when it is determined that further collection efforts will be unsuccessful. Historically, the Company has not had a significant amount of write-offs.
(k) Leases and asset retirement obligations
The Company recognizes rent expense related to leased office and operating space on a straight-line basis over the term of the lease. The difference between rent expense and rent paid, if any, as a result of escalation provisions and lease incentives, such as tenant improvements provided by lessors, and is recorded as deferred rent in the Company’s consolidated balance sheets.
In accordance with ASC Topic 410,
Asset Retirement and Environmental Obligations
, the Company establishes assets and liabilities for the present value of estimated future costs to return certain leased facilities to their original condition. Such assets are depreciated on a straight-line basis over the lease period into operating expense, and the recorded liabilities are accreted to the future value of the estimated restoration costs.
(l) Property and equipment
Property and equipment is recorded at cost and depreciated using the straight-line method over its related estimated useful life. Leasehold improvements are amortized over the shorter of the lease term or the estimated useful life of the related asset, whichever is shorter. Upon sale or retirement, the asset cost and related accumulated depreciation are removed from the respective accounts, and any related gain or loss is reflected in the consolidated statements of operations. Ordinary maintenance and repair costs are expensed as incurred. The estimated useful lives of the Company’s fixed assets by class of asset are as follows:
|
|
Years
|
|
Buildings and building improvements
|
20–40
|
|
Information technology and systems
|
3-5
|
|
Furniture and fixtures
|
5
|
|
Leasehold improvements
|
Useful life or term of lease
whichever is shorter |
|
Fitness equipment
|
5–7
|
|
Vehicles
|
5
|
(m) Advertising expenses
The Company expenses advertising costs as incurred. Advertising expenses, net of amounts reimbursed by franchisees, are included within store operations and selling, general and administrative expenses and totaled
$12,101
,
$9,906
, and
$8,270
for the years ended
December 31, 2018
,
2017
and
2016
, respectively. See Note 4 for discussion of the national advertising fund.
(n) Goodwill, long-lived assets, and other intangible assets
Goodwill and other intangible assets that arise from acquisitions are recorded in accordance with ASC Topic 350,
Intangibles—Goodwill and Other
. In accordance with this guidance, specifically identified intangible assets must be recorded as a separate asset from goodwill if either of the following two criteria is met: (1) the intangible asset acquired arises from contractual or other legal rights; or (2) the intangible asset is separable. Intangibles are typically trade and brand names, customer relationships, noncompete agreements, reacquired franchise rights, and favorable or unfavorable leases. Transactions are evaluated to determine whether any gain or loss on reacquired franchise rights, based on their fair value, should be recognized separately from identified intangibles. Goodwill is the excess of the purchase price over the fair value of identifiable net assets acquired in a business combination.
Goodwill and indefinite-lived intangible assets are not amortized, but are reviewed annually for impairment or more frequently if impairment indicators arise. Separable intangible assets that are not deemed to have an indefinite life are amortized over their estimated useful lives on either a straight-line or accelerated basis as deemed appropriate, and are reviewed for impairment when events or circumstances suggest that the assets may not be recoverable.
The Company performs its annual test for impairment of goodwill and indefinite lived intangible assets on December 31 of each year. For goodwill, the first step of the impairment test is to determine whether the carrying amount of a reporting unit exceeds
82
Planet Fitness, Inc. and subsidiaries
Notes to Consolidated financial statements
(Amounts in thousands, except share and per share amounts)
the fair value of the reporting unit. If the carrying amount of the reporting unit exceeds the reporting unit’s fair value, the Company would be required to perform a second step of the impairment test as this is an indication that the reporting unit’s goodwill may be impaired. The second step compares the implied fair value of the reporting unit’s goodwill with the carrying amount of that goodwill. Any impairment loss would be recognized in an amount equal to the excess of the carrying value of the goodwill over the implied fair value of the goodwill. The Company is also permitted to make a qualitative assessment of whether it is more likely than not that a reporting unit’s fair value is less than its carrying amount before applying the two-step goodwill impairment test. If the Company concludes it is not more likely than not that the fair value of a reporting unit is less than its carrying amount, it need not perform the two-step impairment test.
For indefinite lived intangible assets, the impairment assessment consists of comparing the carrying value of the asset to its estimated fair value. To the extent that the carrying value exceeds the fair value of the asset, an impairment is recorded to reduce the carrying value to its fair value. The Company is also permitted to make a qualitative assessment of whether it is more likely than not an indefinite lived intangible asset’s fair value is less than its carrying value prior to applying the quantitative assessment. If based on the Company’s qualitative assessment it is not more likely than not that the carrying value of the asset is less than its fair value, then a quantitative assessment is not required.
The Company determined that no impairment charges were required during any periods presented.
The Company applies the provisions of ASC Topic 360,
Property, Plant and Equipment
, which requires that long-lived assets, including amortizable intangible assets, be reviewed for impairment whenever events or changes in circumstances indicate that the carrying amount of an asset may not be recoverable. If circumstances require a long-lived asset or asset group to be tested for impairment, then assets are required to be grouped and evaluated at the lowest level for which there are identifiable cash flows that are largely independent of the cash flows of other groups of assets. Recoverability of assets to be held and used is measured by a comparison of the carrying amount of an asset or asset group to the undiscounted future net cash flows expected to be generated by the asset or asset group. If such assets are considered to be impaired, the impairment to be recognized is measured by the amount by which the carrying amount of the assets exceeds the fair value of the assets. Assets to be disposed of are reported at the lower of the carrying amount or fair value less costs to sell. There were no events or changes in circumstances that required the Company to test for impairment during any of the periods presented.
(o) Income taxes
The Company accounts for income taxes using the asset and liability method. Deferred income taxes are recognized for the expected future tax consequences attributable to temporary differences between the carrying amount of the existing tax assets and liabilities and their respective tax basis. Deferred tax assets and liabilities are measured using enacted tax rates expected to be applied in the years in which temporary differences are expected to be recovered or settled. The principal items giving rise to temporary differences are the use of accelerated depreciation and certain basis differences resulting from acquisitions and the recapitalization transactions. Valuation allowances are established when necessary to reduce deferred tax assets to the amount expected to be realized.
Planet Fitness, Inc. is the sole managing member of Pla-Fit Holdings, which is treated as a partnership for U.S. federal and most applicable state and local income tax purposes. As a partnership, Pla-Fit Holdings is not subject to U.S. federal and certain state and local income taxes. Any taxable income or loss generated by Pla-Fit Holdings is passed through to and included in the taxable income or loss of its members, including Planet Fitness, Inc. following the recapitalization transactions, on a pro rata basis. Planet Fitness, Inc. is subject to U.S. federal income taxes, in addition to state and local income taxes with respect to our allocable share of any taxable income of Pla-Fit Holdings. The Company is also subject to taxes in foreign jurisdictions.
The Company recognizes the effect of income tax positions only if those positions are more likely than not to be sustained.
Recognized income tax positions are measured at the largest amount that is greater than 50% likely of being realized.
Changes in recognition or measurement are reflected in the period in which the change in judgment occurs (see Note 15).
(p) Tax benefit arrangements
The Company’s acquisition of Holdings Units in connection with the IPO and future and certain past exchanges of Holdings Units for shares of the Company’s Class A common stock (or cash at the option of the Company) are expected to produce and have produced favorable tax attributes. In connection with the IPO, the Company entered into
two
tax receivable agreements. Under the first of those agreements, the Company generally is required to pay to certain existing and previous equity owners of Pla-Fit Holdings, LLC who are unaffiliated with TSG (the “TRA Holders”)
85%
of the applicable tax savings, if any, in U.S. federal and state income tax that the Company is deemed to realize as a result of certain tax attributes of their Holdings Units sold to the Company (or exchanged in a taxable sale) and that are created as a result of (i) the sales of their Holdings Units for shares of Class A common stock and (ii) tax benefits attributable to payments made under the tax receivable agreement (including imputed interest). Under the second tax receivable agreement, the Company generally is required to pay to the Direct TSG Investors
85%
of the
83
Planet Fitness, Inc. and subsidiaries
Notes to Consolidated financial statements
(Amounts in thousands, except share and per share amounts)
amount of tax savings, if any, that the Company is deemed to realize as a result of the tax attributes of the Holdings Units held in respect of the Direct TSG Investors’ interest in the Company, which resulted from the Direct TSG Investors’ purchase of interests in Pla-Fit Holdings in 2012, and certain other tax benefits. Under both agreements, the Company generally retains the benefit of the remaining
15%
of the applicable tax savings. Also, pursuant to the exchange agreement, to the extent an exchange results in Pla-Fit Holdings, LLC incurring a current tax liability relating to the New Hampshire business profits tax, the TRA Holders have agreed that they will contribute to Pla-Fit Holdings, LLC an amount sufficient to pay such tax liability (up to
3.5%
of the value received upon exchange). If and when the Company subsequently realizes a related tax benefit, Pla-Fit Holdings, LLC will distribute the amount of any such tax benefit to the relevant Continuing LLC Owner in respect of its contribution. Due to changes in New Hampshire tax law, the Company no longer expects to incur any such liability under the New Hampshire business profits tax.
Based on current projections, the Company anticipates having sufficient taxable income to utilize these tax attributes and receive corresponding tax deductions in future periods. Accordingly, as of
December 31, 2018
the Company has recorded a liability of
$429,233
payable to the TRA Holders under the tax benefit obligations, representing approximately
85%
of the calculated tax savings based on the original basis adjustments the Company anticipates being able to utilize in future years. Changes in the projected liability resulting from these tax benefit arrangements may occur based on changes in anticipated future taxable income, changes in applicable tax rates or other changes in tax attributes that may occur and impact the expected future tax benefits to be received by the Company. Changes in the projected liability under these tax benefit arrangements will be recorded as a component of other income (expense) each period. The projection of future taxable income involves significant judgment. Actual taxable income may differ from estimates, which could significantly impact the liability under the tax benefit arrangements and the Company’s consolidated results of operations.
(q) Fair value
ASC 820,
Fair Value Measurements and Disclosures
, establishes a three-level valuation hierarchy for disclosure of fair value measurements. The valuation hierarchy is based upon the transparency of inputs to the valuation of an asset or liability as of the measurement date. Categorization within the valuation hierarchy is based upon the lowest level of input that is significant to the fair value measurement. The three levels are defined as follows:
Level 1—Inputs to the valuation methodology are quoted prices (unadjusted) for identical assets or liabilities in active markets.
Level 2—Inputs to the valuation methodology include quoted prices for similar assets and liabilities in active markets, and inputs that are observable for the asset or liability, either directly or indirectly, for substantially the full term of the financial instrument.
Level 3—Inputs to the valuation methodology are unobservable and significant to the fair value measurement.
The table below presents information about the Company’s assets and liabilities that are measured at fair value on a recurring basis as of
December 31, 2018
and
December 31, 2017
:
|
Total fair value at
December 31, 2018
|
Quoted prices
in active markets
markets (Level 1)
|
Significant
other observable
inputs (Level 2)
|
Significant
unobservable
inputs (Level 3)
|
||||||||||||
|
Interest rate caps
|
$
|
—
|
|
$
|
—
|
|
$
|
—
|
|
$
|
—
|
|
|||
|
|
Total fair value at
December 31, 2017
|
Quoted prices
in active markets
markets (Level 1)
|
Significant
other observable
inputs (Level 2)
|
Significant
unobservable
inputs (Level 3)
|
|||||||||||
|
Interest rate caps
|
$
|
340
|
|
$
|
—
|
|
$
|
340
|
|
$
|
—
|
|
|||
The carrying value and estimated fair value of long-term debt as of
December 31, 2018
and
December 31, 2017
were as follows:
|
December 31, 2018
|
December 31, 2017
|
|||||||||||||||
|
Carrying value
|
Estimated fair value
(1)
|
Carrying value
|
Estimated fair value
(2)
|
|||||||||||||
|
Long-term debt
|
$
|
1,197,000
|
|
$
|
1,188,985
|
|
$
|
709,470
|
|
$
|
709,470
|
|
||||
(1) The estimated fair value of our long-term debt is estimated primarily based on current bid prices for our long-term debt. Judgment is required to develop these estimates. As such, the fair value of our long-term debt is classified within Level 2, as defined under U.S. GAAP.
(2) The carrying value of the Term Loan B debt approximated fair value as of
December 31, 2017
as it was variable rate debt.
84
Planet Fitness, Inc. and subsidiaries
Notes to Consolidated financial statements
(Amounts in thousands, except share and per share amounts)
(r) Financial instruments
The carrying values of cash and cash equivalents, restricted cash, accounts receivable and accounts payable approximate fair value because of the short-term nature of these instruments.
(s) Derivative instruments and hedging activities
The Company recognizes all derivative instruments as either assets or liabilities in the balance sheet at their respective fair values. For derivatives designated in hedging relationships, changes in the fair value are either offset through earnings against the change in fair value of the hedged item attributable to the risk being hedged or recognized in accumulated other comprehensive income, to the extent the derivative is effective at offsetting the changes in cash flows being hedged until the hedged item affects earnings.
The Company only enters into derivative contracts that it intends to designate as a hedge of a forecasted transaction or the variability of cash flows to be received or paid related to a recognized asset or liability (cash flow hedge). For all hedging relationships, the Company formally documents the hedging relationship and its risk-management objective and strategy for undertaking the hedge, the hedging instrument, the hedged transaction, the nature of the risk being hedged, how the hedging instrument’s effectiveness in offsetting the hedged risk will be assessed prospectively and retrospectively, and a description of the method used to measure ineffectiveness. The Company also formally assesses, both at the inception of the hedging relationship and on an ongoing basis, whether the derivatives that are used in hedging relationships are highly effective in offsetting changes in cash flows of hedged transactions. For derivative instruments that are designated and qualify as part of a cash flow hedging relationship, the effective portion of the gain or loss on the derivative is reported as a component of other comprehensive income and reclassified into earnings in the same period or periods during which the hedged transaction affects earnings. Gains and losses on the derivative representing either hedge ineffectiveness or hedge components excluded from the assessment of effectiveness are recognized in current earnings. See Note 9 for further information.
(t) Equity-based compensation
The Company has an equity-based compensation plan under which it receives services from employees and directors as consideration for equity instruments of the Company. The compensation expense is determined based on the fair value of the award as of the grant date. Compensation expense is recognized over the vesting period, which is the period over which all of the specified vesting conditions are satisfied. For awards with graded vesting, the fair value of each tranche is recognized over its respective vesting period. The Company accounts for forfeitures as they occur by reversing compensation cost for unvested awards when the award is forfeited. See Note 13 for further information.
(u) Guarantees
The Company, as a guarantor, is required to recognize, at inception of the guaranty, a liability for the fair value of the obligation undertaken in issuing the guarantee. See Notes 3 and 16 for further discussion of such obligations guaranteed.
(v) Contingencies
The Company records estimated future losses related to contingencies when such amounts are probable and estimable. The Company includes estimated legal fees related to such contingencies as part of the accrual for estimated future losses.
(w) Reclassifications
Certain amounts have been reclassified to conform to current year presentation.
(x) Recent accounting pronouncements
The FASB issued Accounting Standards Update (ASU) No. 2014-9,
Revenue from Contracts with Customers,
in September 2014. This guidance requires that an entity recognize revenue to depict the transfer of a promised good or service to its customers in an amount that reflects consideration to which the entity expects to be entitled in exchange for such transfer. This guidance also specifies accounting for certain costs incurred by an entity to obtain or fulfill a contract with a customer and provides for enhancements to revenue specific disclosures intended to allow users of the financial statements to clearly understand the nature, amount, timing and uncertainty of revenue and cash flows arising from an entity’s contracts with its customers. This guidance is effective for annual periods, and interim periods within those annual periods, beginning after December 15, 2017 for public companies. The Company adopted this new guidance in fiscal year 2018 utilizing the modified retrospective method. See above for revenue recognition policies and Note 10.
85
Planet Fitness, Inc. and subsidiaries
Notes to Consolidated financial statements
(Amounts in thousands, except share and per share amounts)
In February 2016, the FASB established Topic 842,
Leases
, by issuing ASU No. 2016-02,
Leases
, in February 2016. Topic 842 was subsequently amended by ASU No. 2018-01,
Land Easement Practical Expedient
for Transition to Topic 842; ASU No. 2018-10,
Codification Improvements
to Topic 842, Leases; and ASU No. 2018-11,
Targeted Improvements
. This guidance is intended to increase transparency and comparability among organizations by recognizing lease assets and lease liabilities on the balance sheet and disclosing key information about leasing arrangements. The new guidance requires lessees to recognize the assets and liabilities on the balance sheet for the rights and obligations created by leases with lease terms of more than 12 months, amends various other aspects of accounting for leases by lessees and lessors, and requires enhanced disclosures. Leases will be classified as finance or operating, with the classification affecting the pattern and classification of expense recognition within the income statement.
The new guidance is effective for fiscal years beginning after December 15, 2018 and requires a modified retrospective transition approach with application in all comparative periods presented (the “comparative method”), or alternatively, as of the effective date as the date of initial application without restating comparative period financial statements (the “effective date method”). The Company expects to adopt the new standard on January 1, 2019 and use the effective date as our date of initial application. Consequently, financial information will not be updated and the disclosures required under the new standard will not be provided for dates and periods before January 1, 2019. The new guidance also provides several practical expedients and policies that companies may elect upon transition. The Company has elected the package of practical expedients under which we will not reassess the classification of our existing leases, reevaluate whether any expired or existing contracts are or contain leases or reassess initial direct costs under the new guidance. The Company does not expect to elect the practical expedient pertaining to land easements, as it is not applicable to its leases. Additionally, the Company elected to use the practical expedient that permits a reassessment of lease terms for existing leases using hindsight.
The new standard also provides practical expedients for an entity’s ongoing accounting. The Company currently expects to elect the short-term lease recognition exemption. This means, for those leases that qualify, we will not recognize ROU assets or lease liabilities, and this includes not recognizing ROU assets or lease liabilities for existing short-term leases of those assets in transition. We also currently expect to elect the practical expedient to not separate lease and non-lease components.
The Company performed an analysis of the impact of the new lease guidance and are in the process of completing the final phase of a comprehensive plan for our implementation of the new guidance. The project plan includes analyzing the impact of the new guidance on our current lease contracts, reviewing the completeness of our existing lease portfolio, comparing our accounting policies under current accounting guidance to the new accounting guidance and identifying potential differences from applying the requirements of the new guidance to our lease contracts. Upon transition to the new guidance on January 1, 2019, the Company currently expects to recognize between
$125 million
and
$135 million
of operating lease liabilities. Additionally, the Company expects to record right-of-use assets in a corresponding amount, net of amounts reclassified from other assets and liabilities, as specified by the new lease guidance.
The FASB issued ASU No. 2016-15,
Classification of Certain Cash Receipts and Cash Payments
, in August 2016. This guidance is intended to reduce diversity in practice of the classification of certain cash receipts and cash payments. This guidance will be effective for fiscal years beginning after December 15, 2017, including interim periods within that year. The Company has adopted the guidance as of January 1, 2018 on a prospective basis, noting no material impact on its consolidated financial statements.
The FASB issued ASU No. 2017-4,
Simplifying the Test for Goodwill Impairment
, in January 2017. This guidance eliminates the requirement to calculate the implied fair value, essentially eliminating step two from the goodwill impairment test. The new standard requires goodwill impairment to be based upon the results of step one of the impairment test, which is defined as the excess of the carrying value of a reporting unit over its fair value. The impairment charge will be limited to the amount of goodwill allocated to that reporting unit. This guidance will be effective for fiscal years beginning after December 15, 2019, including interim periods within that year. This new guidance is not expected to have a material impact on the Company’s consolidated financial statements.
The FASB issued ASU No. 2017-12,
Targeted Improvements to Accounting for Hedging Activities
, in August 2017. The guidance simplifies the application of hedge accounting in certain situations and amends the hedge accounting model to enable entities to better portray the economics of their risk management activities in the financial statements. This guidance will be effective for fiscal years beginning after December 15, 2018, including interim periods within that year. The Company does not expect the adoption of this guidance to have an impact on its consolidated financial statements.
The FASB issued ASU No. 2018-15,
Intangibles - Goodwill and Other - Internal-Use Software (Subtopic 350-40): Customer's Accounting for Implementation Costs Incurred in a Cloud Computing Arrangement That Is a Service Contract
, in August 2018. The guidance helps align the requirements for capitalizing implementation costs incurred in a hosting arrangement that is a service
86
Planet Fitness, Inc. and subsidiaries
Notes to Consolidated financial statements
(Amounts in thousands, except share and per share amounts)
contract with the requirements for capitalizing implementation costs incurred to develop or obtain internal-use software (and hosting arrangements that include an internal-use software license). This guidance will be effective for fiscal years beginning after December 15, 2019, including interim periods within that year, but allows for early adoption. The Company is currently evaluating the impact of this guidance on its consolidated financial statements.
(3) Variable interest entities
The carrying values of VIEs included in the consolidated financial statements as of
December 31, 2018
and
December 31, 2017
are as follows:
|
|
December 31, 2018
|
December 31, 2017
|
|||||||||||||
|
|
Assets
|
Liabilities
|
Assets
|
Liabilities
|
|||||||||||
|
PF Melville
|
$
|
4,787
|
|
$
|
—
|
|
$
|
4,420
|
|
$
|
—
|
|
|||
|
MMR
|
$
|
3,563
|
|
—
|
|
$
|
3,360
|
|
—
|
|
|||||
|
Total
|
$
|
8,350
|
|
$
|
—
|
|
$
|
7,780
|
|
$
|
—
|
|
|||
The Company also has variable interests in certain franchisees through the guarantee of certain lease agreements. The Company’s maximum obligation, as a result of its guarantees of leases, is approximately
$732
and
$979
as of
December 31, 2018
and
2017
, respectively.
The amount of the Company’s maximum obligation represents a loss that the Company could incur from the variability in credit exposure without consideration of possible recoveries through insurance or other means. In addition, the amount bears no relation to the ultimate settlement anticipated to be incurred from the Company’s involvement with these entities, which is estimated at
$0
.
(4) National advertising fund
On July 26, 2011, the Company established the NAF for the creation and development of marketing, advertising, and related programs and materials for all Planet Fitness stores located in the United States and Puerto Rico. On behalf of the NAF, the Company collects
2%
of gross monthly membership billings from franchisees, in accordance with the provisions of the franchise agreements, which subsequent to the adoption of ASC 606 is reflected on January 1, 2018, is reflected as NAF revenue on the consolidated statements of operations (see Note 2 and Note 10). The Company also contributes
2%
of monthly membership billings from stores owned by the Company to the NAF, which is reflected in store operations expense in the consolidated statements of operations. The use of amounts received by the NAF is restricted to advertising, product development, public relations, merchandising, and administrative expenses and programs to increase sales and further enhance the public reputation of the Planet Fitness brand. The Company consolidates and reports all assets and liabilities held by the NAF within the consolidated financial statements. Amounts received or receivable by NAF are reported as restricted assets and restricted liabilities within current assets and current liabilities on the consolidated balance sheets. Beginning in 2018 with the adoption of ASC 606, the Company records all revenues of the NAF within franchise revenue and all expenses of the NAF within the operating expenses on the consolidated statement of operations (see Note 2 and Note 10). The Company provides administrative services to the NAF and charges the NAF a fee for providing those services. These services include accounting, information technology, data processing, product development, legal and administrative support, and other operating expenses, which amounted
$2,472
,
$2,150
and
$1,700
for the years ended
December 31, 2018
,
2017
and
2016
, respectively. For the year ended December 31, 2018, subsequent to the adoption of ASC 606, the fees paid to the Company by the NAF are reflected as expense in the NAF expense line, and reflected as a corresponding reduction in general and administrative expenses in the consolidated statements of operations (see Note 2 and Note 10). For the years ended December 31,
2017
and
2016
the fees paid to the Company by the NAF are included in the consolidated statements of operations as a reduction in general and administrative expense, where the expense incurred by the Company was initially recorded.
87
Planet Fitness, Inc. and subsidiaries
Notes to Consolidated financial statements
(Amounts in thousands, except share and per share amounts)
(5) Acquisition
Colorado Acquisition
On August 10, 2018, the Company purchased from one of its franchisees certain assets associated with
four
franchisee-owned stores in Colorado for a cash payment of
$17,249
. As a result of the transaction, the Company incurred a loss on unfavorable reacquired franchise rights of
$10
, which has been reflected in other operating costs in the statement of operations. The loss incurred reduced the net purchase price to
$17,239
. The Company financed the purchase through cash on hand. The acquired stores are included in the Corporate-owned stores segment.
The purchase consideration was allocated as follows:
|
Amount
|
||
|
Fixed assets
|
3,873
|
|
|
Reacquired franchise rights
|
4,610
|
|
|
Customer relationships
|
140
|
|
|
Favorable leases, net
|
80
|
|
|
Other assets
|
143
|
|
|
Goodwill
|
8,476
|
|
|
Liabilities assumed, including deferred revenues
|
(83
|
)
|
|
17,239
|
|
|
The goodwill created through the purchase is attributable to the assumed future value of the cash flows from the stores acquired. The goodwill is amortizable and deductible for tax purposes over 15 years.
The acquisition was not material to the results of operations of the Company.
Long Island Acquisition
On January 1, 2018, the Company purchased from one of its franchisees certain assets associated with
six
franchisee-owned stores in New York for a cash payment of
$28,503
. As a result of the transaction, the Company incurred a loss on unfavorable reacquired franchise rights of
$350
, which has been reflected in other operating costs in the statement of operations. The loss incurred reduced the net purchase price to
$28,153
. The Company financed the purchase through cash on hand. The acquired stores are included in the Corporate-owned stores segment.
The purchase consideration was allocated as follows:
|
Amount
|
|||
|
Fixed assets
|
$
|
4,672
|
|
|
Reacquired franchise rights
|
7,640
|
|
|
|
Customer relationships
|
1,150
|
|
|
|
Favorable leases, net
|
520
|
|
|
|
Reacquired area development rights
|
150
|
|
|
|
Other assets
|
275
|
|
|
|
Goodwill
|
14,056
|
|
|
|
Liabilities assumed, including deferred revenues
|
(310
|
)
|
|
|
$
|
28,153
|
|
|
The goodwill created through the purchase is attributable to the assumed future value of the cash flows from the stores acquired. The goodwill is amortizable and deductible for tax purposes over 15 years.
The acquisition was not material to the results of operations of the Company.
(6) Property and equipment
Property and equipment as of
December 31, 2018
and
2017
consists of the following:
88
Planet Fitness, Inc. and subsidiaries
Notes to Consolidated financial statements
(Amounts in thousands, except share and per share amounts)
|
|
December 31, 2018
|
December 31, 2017
|
|||||
|
Land
|
$
|
1,341
|
|
$
|
910
|
|
|
|
Equipment
|
40,895
|
|
32,403
|
|
|||
|
Leasehold improvements
|
76,832
|
|
60,181
|
|
|||
|
Buildings and improvements
|
8,632
|
|
5,107
|
|
|||
|
Furniture & fixtures
|
13,827
|
|
9,790
|
|
|||
|
Information technology and systems assets
|
17,238
|
|
6,449
|
|
|||
|
Other
|
1,593
|
|
1,474
|
|
|||
|
Construction in progress
|
7,095
|
|
3,241
|
|
|||
|
|
167,453
|
|
119,555
|
|
|||
|
Accumulated Depreciation
|
(53,086
|
)
|
(36,228
|
)
|
|||
|
Total
|
$
|
114,367
|
|
$
|
83,327
|
|
|
The Company recorded depreciation expense of
$19,540
,
$13,886
, and
$12,131
for the years ended
December 31, 2018
,
2017
and
2016
, respectively.
(7) Goodwill and intangible assets
A summary of goodwill and intangible assets at
December 31, 2018
and
2017
is as follows:
|
December 31, 2018
|
Weighted
average
amortization
period (years)
|
Gross
carrying
amount
|
Accumulated
amortization
|
Net carrying
Amount
|
|||||||||
|
Customer relationships
|
11.0
|
$
|
173,063
|
|
(99,439
|
)
|
$
|
73,624
|
|
||||
|
Noncompete agreements
|
5.0
|
14,500
|
|
(14,500
|
)
|
—
|
|
||||||
|
Favorable leases
|
8.0
|
4,017
|
|
(2,345
|
)
|
1,672
|
|
||||||
|
Order backlog
|
0.4
|
3,400
|
|
(3,400
|
)
|
—
|
|
||||||
|
Reacquired franchise rights
|
7.0
|
21,349
|
|
(8,615
|
)
|
12,734
|
|
||||||
|
|
216,329
|
|
(128,299
|
)
|
88,030
|
|
|||||||
|
Indefinite-lived intangible:
|
|||||||||||||
|
Trade and brand names
|
N/A
|
146,300
|
|
—
|
|
146,300
|
|
||||||
|
Total intangible assets
|
$
|
362,629
|
|
$
|
(128,299
|
)
|
$
|
234,330
|
|
||||
|
Goodwill
|
$
|
199,513
|
|
$
|
—
|
|
$
|
199,513
|
|
||||
|
December 31, 2017
|
Weighted
average
amortization
period (years)
|
Gross
carrying
amount
|
Accumulated
amortization
|
Net carrying
Amount
|
|||||||||
|
Customer relationships
|
11.1
|
$
|
171,782
|
|
(86,501
|
)
|
$
|
85,281
|
|
||||
|
Noncompete agreements
|
5.0
|
14,500
|
|
(14,500
|
)
|
—
|
|
||||||
|
Favorable leases
|
7.5
|
2,935
|
|
(1,972
|
)
|
963
|
|
||||||
|
Order backlog
|
0.4
|
3,400
|
|
(3,400
|
)
|
—
|
|
||||||
|
Reacquired franchise rights
|
5.8
|
8,950
|
|
(5,837
|
)
|
3,113
|
|
||||||
|
|
201,567
|
|
(112,210
|
)
|
89,357
|
|
|||||||
|
Indefinite-lived intangible:
|
|||||||||||||
|
Trade and brand names
|
N/A
|
146,300
|
|
—
|
|
146,300
|
|
||||||
|
Total intangible assets
|
$
|
347,867
|
|
$
|
(112,210
|
)
|
$
|
235,657
|
|
||||
|
Goodwill
|
$
|
176,981
|
|
$
|
—
|
|
$
|
176,981
|
|
||||
A rollforward of goodwill during the years ended
December 31, 2018
or
2017
is as follows:
89
Planet Fitness, Inc. and subsidiaries
Notes to Consolidated financial statements
(Amounts in thousands, except share and per share amounts)
|
Franchise
|
Corporate-owned stores
|
Equipment
|
Total
|
||||||||
|
As of December 31, 2016
|
16,938
|
|
67,377
|
|
92,666
|
|
176,981
|
|
|||
|
Additions
|
—
|
|
—
|
|
—
|
|
—
|
|
|||
|
As of December 31, 2017
|
16,938
|
|
67,377
|
|
92,666
|
|
176,981
|
|
|||
|
Acquisition of franchisee-owned stores
|
—
|
|
22,532
|
|
—
|
|
22,532
|
|
|||
|
As of December 31, 2018
|
16,938
|
|
89,909
|
|
92,666
|
|
199,513
|
|
|||
Amortization expense related to the intangible assets totaled
$16,089
,
$18,205
, and
$19,757
for the years ended
December 31, 2018
,
2017
and
2016
, respectively. Included within these total amortization expense amounts are
$369
,
$330
, and
$386
related to amortization of favorable and unfavorable leases for the years ended
December 31, 2018
,
2017
and
2016
, respectively. Amortization of favorable and unfavorable leases is recorded within store operations as a component of rent expense in the consolidated statements of operations. The anticipated annual amortization expense to be recognized in future years as of
December 31, 2018
is as follows:
|
|
Amount
|
||
|
2019
|
$
|
16,153
|
|
|
2020
|
14,302
|
|
|
|
2021
|
14,276
|
|
|
|
2022
|
14,467
|
|
|
|
2023
|
14,316
|
|
|
|
Thereafter
|
14,516
|
|
|
|
Total
|
$
|
88,030
|
|
(8) Long-term debt
Long-term debt as of
December 31, 2018
and
2017
consists of the following:
|
|
December 31, 2018
|
December 31, 2017
|
|||||
|
Class A-2-I notes
|
$
|
573,563
|
|
$
|
—
|
|
|
|
Class A-2-II notes
|
623,437
|
|
—
|
|
|||
|
Term loan B, repaid August 2018
|
—
|
|
709,470
|
|
|||
|
Total debt, excluding deferred financing costs
|
1,197,000
|
|
709,470
|
|
|||
|
Deferred financing costs, net of accumulated amortization
|
(24,873
|
)
|
(5,709
|
)
|
|||
|
Total debt
|
1,172,127
|
|
703,761
|
|
|||
|
Current portion of long-term debt and Variable Funding Note
|
12,000
|
|
7,185
|
|
|||
|
Long-term debt, net of current portion
|
$
|
1,160,127
|
|
$
|
696,576
|
|
|
On August 1, 2018, Planet Fitness Master Issuer LLC (the “Master Issuer”), a limited-purpose, bankruptcy remote, wholly-owned indirect subsidiary of Pla-Fit Holdings, LLC, entered into a base indenture and a related supplemental indenture (collectively, the “Indenture”) under which the Master Issuer may issue multiple series of notes. On the same date, the Master Issuer issued Series 2018-1
4.262%
Fixed Rate Senior Secured Notes, Class A-2-I (the “Class A-2-I Notes”) with an initial principal amount of
$575,000
and Series 2018-1
4.666%
Fixed Rate Senior Secured Notes, Class A-2-II (the “Class A-2-II Notes” and, together with the Class A-2-I Notes, the “Class A-2 Notes”) with an initial principal amount of
$625,000
. In connection with the issuance of the Class A-2 Notes, the Master Issuer also entered into a revolving financing facility that allows for the issuance of up to
$75,000
in Series 2018-1 Variable Funding Senior Notes, Class A-1 (the “Variable Funding Notes” and together with the Class A-2 Notes, the “Series 2018-1 Senior Notes”), and certain letters of credit, all of which is currently undrawn. The Class A-2 Notes were issued in a securitization transaction pursuant to which most of the Company’s domestic revenue-generating assets, consisting principally of franchise-related agreements, certain corporate-owned store assets, equipment supply agreements and intellectual property and license agreements for the use of intellectual property, were assigned to the Master Issuer and certain other limited-
90
Planet Fitness, Inc. and subsidiaries
Notes to Consolidated financial statements
(Amounts in thousands, except share and per share amounts)
purpose, bankruptcy remote, wholly-owned indirect subsidiaries of the Company that act as guarantors of the Series 2018-1 Senior Notes and that have pledged substantially all of their assets to secure the Series 2018-1 Senior Notes.
Interest and principal payments on the Class A-2 Notes are payable on a quarterly basis. The requirement to make such quarterly principal payments on the Class A-2 Notes is subject to certain financial conditions set forth in the Indenture. The legal final maturity date of the Class A-2 Notes is in September 2048, but it is anticipated that, unless earlier prepaid to the extent permitted under the Indenture, the Class A-2-I Notes will be repaid in September 2022 and the Class A-2-II Notes will be repaid in September 2025 (together, the "Anticipated Repayment Dates"). If the Master Issuer has not repaid or refinanced the Class A-2 Notes prior to the respective Anticipated Repayment Dates, additional interest will accrue pursuant to the Indenture.
The Variable Funding Notes will accrue interest at a variable interest rate based on (i) the prime rate, (ii) overnight federal funds rates, (iii) the London interbank offered rate for U.S. Dollars, or (iv) with respect to advances made by conduit investors, the weighted average cost of, or related to, the issuance of commercial paper allocated to fund or maintain such advances, in each case plus any applicable margin and as specified in the Variable Funding Note agreement. There is a commitment fee on the unused portion of the Variable Funding Notes of
0.5%
based on utilization. It is anticipated that the principal and interest on the Variable Funding Notes will be repaid in full on or prior to September 2023, subject to
two
additional
one
-year extensions. Following the anticipated repayment date (and any extensions thereof) additional interest will accrue on the Variable Funding Notes equal to
5.0%
per year.
In connection with the issuance of the Series 2018-1 Senior Notes, the Company incurred debt issuance costs of $
27,133
. The debt issuance costs are being amortized to “Interest expense” through the Anticipated Repayment Dates of the Class A-2 Notes utilizing the effective interest rate method.
The Series 2018-1 Senior Notes are subject to covenants and restrictions customary for transactions of this type, including (i) that the Master Issuer maintains specified reserve accounts to be used to make required payments in respect of the Series 2018-1 Senior Notes, (ii) provisions relating to optional and mandatory prepayments and the related payment of specified amounts, including specified make-whole payments in the case of the Class A-2 Notes under certain circumstances, (iii) certain indemnification payments in the event, among other things, the assets pledged as collateral for the Series 2018-1 Senior Notes are in stated ways defective or ineffective, and (iv) covenants relating to recordkeeping, access to information and similar matters. The Series 2018-1 Senior Notes are also subject to customary rapid amortization events provided for in the Indenture, including events tied to failure to maintain stated debt service coverage ratios, certain manager termination events, an event of default, and the failure to repay or refinance the Class A-2 Notes on the applicable scheduled Anticipated Repayment Dates. The Series 2018-1 Senior Notes are also subject to certain customary events of default, including events relating to non-payment of required interest, principal, or other amounts due on or with respect to the Series 2018-1 Senior Notes, failure to comply with covenants within certain time frames, certain bankruptcy events, breaches of specified representations and warranties, failure of security interests to be effective, and certain judgments.
In accordance with the Indenture, certain cash accounts have been established with the Indenture trustee (the "Trustee") for the benefit of the trustee and the noteholders, and are restricted in their use. The Company holds restricted cash which primarily represents cash collections held by the Trustee, interest, principal, and commitment fee reserves held by the Trustee related to the Company’s Series 2018-1 Senior Notes. As of
December 31, 2018
, the Company had restricted cash held by the Trustee of $
30,708
. Restricted cash has been combined with cash and cash equivalents when reconciling the beginning and end of period balances in the consolidated statements of cash flows.
The proceeds from the issuance of the Class A-2 Notes were used to repay all amounts outstanding on the Term Loan B under the Company’s prior credit facility. As a result, the Company recorded a loss on early extinguishment of debt of $
4,570
within interest expense on the consolidated statement of operations, primarily consisting of the write-off of deferred costs related to the prior credit facility. In connection with the repayment of the Term Loan B, the Company terminated the related interest rate caps with notional amounts totaling
$219,837
, which had been designated as a cash flow hedge. See Note 9 for more information on the interest rate caps.
On November 10, 2016, the Company amended its credit facility to increase the Revolving Credit Facility to
$75,000
, reduce the interest rate margin for term loan borrowings by 25 basis points, and increase the Term Loan to
$718,450
primarily in order to fund a cash dividend and other equivalent payments totaling
$271,011
. In connection with the amendment, during the year ended December 31, 2016, the Company capitalized and deferred financing costs of
$2,219
, recorded expense of
$3,001
related to certain third party fees included in other expense on the consolidated statement of operations, and a loss on extinguishment of debt of
$606
included in interest expense on the consolidated statement of operations.
91
Planet Fitness, Inc. and subsidiaries
Notes to Consolidated financial statements
(Amounts in thousands, except share and per share amounts)
On May 26, 2017, the Company amended the credit facility to reduce the applicable interest rate margin for term loan borrowings by
50 basis points, to LIBOR plus 300 basis points
, with an additional 25 basis point reduction in applicable interest rate possible in the future so long as the Total Net Leverage Ratio (as defined in the credit agreement) is less than 3.50 to 1.00. The amendment to the credit agreement also reduced the interest rate margin for revolving loan borrowings by 25 basis points. In connection with the amendment to the credit agreement, in the year ended December 31, 2017, the Company capitalized deferred financing costs of
$257
, recorded expense of
$1,021
related to certain third party fees included in other expense on the consolidated statement of operations, and a loss on extinguishment of debt of
$79
included in interest expense on the consolidated statement of operations.
Future annual principal payments of long-term debt as of
December 31, 2018
are as follows:
|
|
Amount
|
||
|
2019
|
$
|
12,000
|
|
|
2020
|
12,000
|
|
|
|
2021
|
12,000
|
|
|
|
2022
|
562,563
|
|
|
|
2023
|
6,250
|
|
|
|
Thereafter
|
592,187
|
|
|
|
Total
|
$
|
1,197,000
|
|
(9) Derivative instruments and hedging activities
Prior to the refinancing transactions described in Note 8, the Company used interest-rate-related derivative instruments to manage its exposure related to changes in interest rates on its variable-rate debt instruments. The Company does not enter into derivative instruments for any purpose other than cash flow hedging. The Company does not speculate using derivative instruments.
In order to manage the market risk arising from the previously outstanding term loans, the Company entered into a series of interest rate caps. As of
December 31, 2018
, the Company had no interest rate cap agreements outstanding. In connection with the issuance of the Class A-2 Notes, the Company terminated the interest rate caps it had entered into in order to hedge one month LIBOR greater than
2.5%
through March 31, 2019.
The interest rate cap balances of
$0
and
$340
were recorded within other assets in the consolidated balance sheets as of
December 31, 2018
and
2017
, respectively. These amounts have been measured at fair value and are considered to be a Level 2 fair value measurement. During the year ended
December 31, 2018
, the Company has reversed all historical unrealized gains and losses associated with its interest rate caps due to the termination or maturity of all previously outstanding caps. The Company recorded an increase to the value of its interest rate caps of
$1,143
net of tax of
$280
for the year ended
December 31, 2017
, and a reduction to the value of its interest rate caps of
$78
, net of tax of
$35
, during the years ended December 31,
2016
, within other comprehensive income (loss).
92
Planet Fitness, Inc. and subsidiaries
Notes to Consolidated financial statements
(Amounts in thousands, except share and per share amounts)
(10) Revenue recognition
Revenue from Contracts with Customers
We transitioned to FASB Accounting Standards Codification (“ASC”) Topic 606,
Revenue From Contracts with Customers
(“ASC 606”), from ASC Topic 605,
Revenue Recognition
and ASC Subtopic 952-605,
Franchisors - Revenue Recognition
(together, the “Previous Standards”) on January 1, 2018 using the modified retrospective transition method. Our Financial Statements reflect the application of ASC 606 guidance beginning in 2018, while our consolidated financial statements for prior periods were prepared under the guidance of Previous Standards. The
$9,192
cumulative effect of our transition to ASC 606 is reflected as an adjustment to January 1, 2018 stockholders' deficit.
Our transition to ASC 606 represents a change in accounting principle. ASC 606 eliminates industry-specific guidance and provides a single revenue recognition model for recognizing revenue from contracts with customers. The core principle of ASC 606 is that a reporting entity should recognize revenue to depict the transfer of promised goods or services to customers in an amount that reflects the consideration to which the reporting entity expects to be entitled in exchange for those goods or services.
Contract Liabilities
Contract liabilities consist of deferred revenue resulting from initial and successor franchise fees and ADA fees paid by franchisees, as well as transfer fees, which are generally recognized on a straight-line basis over the term of the underlying franchise agreement. Also included are corporate-owned store enrollment fees, annual fees and monthly fees. We classify these contract liabilities as deferred revenue in our condensed consolidated balance sheets. The following table reflects the change in contract liabilities between the date of adoption (January 1, 2018) and
December 31, 2018
,
|
Contract liabilities
|
|||
|
Balance at January 1, 2018
|
$
|
40,000
|
|
|
Revenue recognized that was included in the contract liability at the beginning of the year
|
(20,439
|
)
|
|
|
Increase, excluding amounts recognized as revenue during the period
|
30,301
|
|
|
|
Balance at December 31, 2018
|
$
|
49,862
|
|
The following table illustrates estimated revenues expected to be recognized in the future related to performance obligations that are unsatisfied (or partially unsatisfied) as of
December 31, 2018
. The Company has elected to exclude short term contracts, sales and usage based royalties and any other variable consideration recognized on an "as invoiced" basis.
|
Contract liabilities to be recognized in:
|
Amount
|
|||
|
2019
|
$
|
23,606
|
|
|
|
2020
|
2,797
|
|
||
|
2021
|
2,432
|
|
||
|
2022
|
2,345
|
|
||
|
2023
|
2,261
|
|
||
|
Thereafter
|
16,421
|
|
||
|
Total
|
$
|
49,862
|
|
|
The summary set forth below represents the balances in deferred revenue as of
December 31, 2018
and
2017
:
93
Planet Fitness, Inc. and subsidiaries
Notes to Consolidated financial statements
(Amounts in thousands, except share and per share amounts)
|
|
December 31, 2018
|
December 31, 2017
|
|||||
|
Prepaid membership fees
|
$
|
6,085
|
|
$
|
5,198
|
|
|
|
Enrollment fees
|
1,104
|
|
1,014
|
|
|||
|
Equipment discount
|
3,855
|
|
2,567
|
|
|||
|
Annual membership fees
|
10,142
|
|
8,113
|
|
|||
|
Area development and franchise fees
|
28,676
|
|
10,631
|
|
|||
|
Total deferred revenue
|
49,862
|
|
27,523
|
|
|||
|
Long-term portion of deferred revenue
|
26,374
|
|
8,440
|
|
|||
|
Current portion of deferred revenue
|
$
|
23,488
|
|
$
|
19,083
|
|
|
Equipment deposits received in advance of delivery as of
December 31, 2018
and
2017
were
$7,908
and
$6,498
, respectively and are expected to be recognized as revenue in the next
twelve
months.
Financial Statement Impact of Transition to ASC 606
As noted above, we transitioned to ASC 606 using the modified retrospective method on January 1, 2018. The cumulative effect of this transition to applicable contracts with customers that were not completed as of January 1, 2018 was recorded as an adjustment to stockholders' deficit as of that date. As a result of applying the modified retrospective method to transition to ASC 606, the following adjustments were made to the consolidated balance sheet as of January 1, 2018:
94
Planet Fitness, Inc. and subsidiaries
Notes to Consolidated financial statements
(Amounts in thousands, except share and per share amounts)
|
As Reported December 31,
|
Total adjustments
|
Adjusted January 1,
|
|||||||||
|
2017
|
2018
|
||||||||||
|
Assets
|
|||||||||||
|
Current assets:
|
|||||||||||
|
Cash and cash equivalents
|
$
|
113,080
|
|
$
|
—
|
|
$
|
113,080
|
|
||
|
Accounts receivable, net
|
37,272
|
|
—
|
|
37,272
|
|
|||||
|
Due from related parties
|
3,020
|
|
—
|
|
3,020
|
|
|||||
|
Inventory
|
2,692
|
|
—
|
|
2,692
|
|
|||||
|
Restricted assets – national advertising fund
|
499
|
|
—
|
|
499
|
|
|||||
|
Prepaid expenses
|
3,929
|
|
—
|
|
3,929
|
|
|||||
|
Other receivables
|
9,562
|
|
—
|
|
9,562
|
|
|||||
|
Other current assets
|
6,947
|
|
—
|
|
6,947
|
|
|||||
|
Total current assets
|
177,001
|
|
—
|
|
177,001
|
|
|||||
|
Property and equipment, net
|
83,327
|
|
—
|
|
83,327
|
|
|||||
|
Intangible assets, net
|
235,657
|
|
—
|
|
235,657
|
|
|||||
|
Goodwill
|
176,981
|
|
—
|
|
176,981
|
|
|||||
|
Deferred income taxes
|
407,782
|
|
3,285
|
|
411,067
|
|
|||||
|
Other assets, net
|
11,717
|
|
—
|
|
11,717
|
|
|||||
|
Total assets
|
$
|
1,092,465
|
|
$
|
3,285
|
|
$
|
1,095,750
|
|
||
|
Liabilities and stockholders' equity (deficit)
|
|||||||||||
|
Current liabilities:
|
|||||||||||
|
Current maturities of long-term debt
|
$
|
7,185
|
|
$
|
—
|
|
$
|
7,185
|
|
||
|
Accounts payable
|
28,648
|
|
—
|
|
28,648
|
|
|||||
|
Accrued expenses
|
18,590
|
|
—
|
|
18,590
|
|
|||||
|
Equipment deposits
|
6,498
|
|
—
|
|
6,498
|
|
|||||
|
Restricted liabilities – national advertising fund
|
490
|
|
—
|
|
490
|
|
|||||
|
Deferred revenue, current
|
19,083
|
|
(764
|
)
|
18,319
|
|
|||||
|
Payable pursuant to tax benefit arrangements, current
|
31,062
|
|
—
|
|
31,062
|
|
|||||
|
Other current liabilities
|
474
|
|
—
|
|
474
|
|
|||||
|
Total current liabilities
|
112,030
|
|
(764
|
)
|
111,266
|
|
|||||
|
Long-term debt, net of current maturities
|
696,576
|
|
—
|
|
696,576
|
|
|||||
|
Deferred rent, net of current portion
|
6,127
|
|
—
|
|
6,127
|
|
|||||
|
Deferred revenue, net of current portion
|
8,440
|
|
13,241
|
|
21,681
|
|
|||||
|
Deferred tax liabilities
|
1,629
|
|
—
|
|
1,629
|
|
|||||
|
Payable pursuant to tax benefit arrangements, net of current portion
|
400,298
|
|
—
|
|
400,298
|
|
|||||
|
Other liabilities
|
4,302
|
|
—
|
|
4,302
|
|
|||||
|
Total noncurrent liabilities
|
1,117,372
|
|
13,241
|
|
1,130,613
|
|
|||||
|
Stockholders' equity (deficit):
|
|||||||||||
|
Class A common stock
|
9
|
|
—
|
|
9
|
|
|||||
|
Class B common stock
|
1
|
|
—
|
|
1
|
|
|||||
|
Accumulated other comprehensive loss
|
(648
|
)
|
—
|
|
(648
|
)
|
|||||
|
Additional paid in capital
|
12,118
|
|
—
|
|
12,118
|
|
|||||
|
Accumulated deficit
|
(130,966
|
)
|
(9,192
|
)
|
(140,158
|
)
|
|||||
|
Total stockholders' deficit attributable to Planet Fitness Inc.
|
(119,486
|
)
|
(9,192
|
)
|
(128,678
|
)
|
|||||
|
Non-controlling interests
|
(17,451
|
)
|
—
|
|
(17,451
|
)
|
|||||
|
Total stockholders' deficit
|
(136,937
|
)
|
(9,192
|
)
|
(146,129
|
)
|
|||||
|
Total liabilities and stockholders' deficit
|
$
|
1,092,465
|
|
$
|
3,285
|
|
$
|
1,095,750
|
|
||
Franchise Fees
The cumulative adjustment for franchise fees, including ADA fees, successor fees and transfer fees which will all be recognized over the franchise contract term consist of the following:
95
Planet Fitness, Inc. and subsidiaries
Notes to Consolidated financial statements
(Amounts in thousands, except share and per share amounts)
|
•
|
An increase in deferred revenue, net of $
12,477
for the cumulative reversal and deferral of previously recognized fees related to franchise agreements in effect at January 1, 2018 that were entered into subsequent to the acquisition of Pla-Fit Holdings on November 8, 2012 by TSG Consumer Partners, LLC (the “2012 Acquisition”) (net of the cumulative revenue attributable for the period through January 1, 2018), with a corresponding decrease to Shareholders’ equity.
|
|
•
|
An increase to deferred income taxes, net of $
3,285
for the tax effects of the adjustment noted above, with a corresponding increase to stockholders' equity.
|
Comparison to Amounts if Previous Standards Had Been in Effect
The following tables reflect the impact of adoption of ASC 606 on our consolidated statements of operations for the year ended December 31, 2018, cash flows from operating activities for the year ended December 31, 2018 and our condensed consolidated balance sheet as of December 31, 2018 and the amounts as if the Previous Standards were in effect (“Amounts Under Previous Standards”):
|
As reported for the year ended December 31, 2018
|
Total adjustments
|
Amounts under Previous Standards
|
|||||||||
|
Revenue:
|
|||||||||||
|
Franchise
|
$
|
175,314
|
|
$
|
5,666
|
|
$
|
180,980
|
|
||
|
Commission income
|
6,632
|
|
—
|
|
6,632
|
|
|||||
|
National advertising fund revenue
|
42,194
|
|
(42,194
|
)
|
—
|
|
|||||
|
Corporate-owned stores
|
138,599
|
|
—
|
|
138,599
|
|
|||||
|
Equipment
|
210,159
|
|
—
|
|
210,159
|
|
|||||
|
Total revenue
|
572,898
|
|
(36,528
|
)
|
536,370
|
|
|||||
|
Operating costs and expenses:
|
|||||||||||
|
Cost of revenue
|
162,646
|
|
—
|
|
162,646
|
|
|||||
|
Store operations
|
75,005
|
|
—
|
|
75,005
|
|
|||||
|
Selling, general and administrative
|
72,446
|
|
—
|
|
72,446
|
|
|||||
|
National advertising fund expense
|
42,619
|
|
(42,619
|
)
|
—
|
|
|||||
|
Depreciation and amortization
|
35,260
|
|
—
|
|
35,260
|
|
|||||
|
Other loss (gain)
|
878
|
|
—
|
|
878
|
|
|||||
|
Total operating costs and expenses
|
388,854
|
|
(42,619
|
)
|
346,235
|
|
|||||
|
Income from operations
|
184,044
|
|
6,091
|
|
190,135
|
|
|||||
|
Other expense, net:
|
|||||||||||
|
Interest income
|
4,681
|
|
—
|
|
4,681
|
|
|||||
|
Interest expense
|
(50,746
|
)
|
—
|
|
(50,746
|
)
|
|||||
|
Other (expense) income
|
(6,175
|
)
|
—
|
|
(6,175
|
)
|
|||||
|
Total other expense, net
|
(52,240
|
)
|
—
|
|
(52,240
|
)
|
|||||
|
Income before income taxes
|
131,804
|
|
6,091
|
|
137,895
|
|
|||||
|
Provision for income taxes
|
28,642
|
|
1,437
|
|
30,079
|
|
|||||
|
Net income
|
103,162
|
|
4,654
|
|
107,816
|
|
|||||
|
Less net income attributable to non-controlling interests
|
15,141
|
|
642
|
|
15,783
|
|
|||||
|
Net income attributable to Planet Fitness, Inc.
|
$
|
88,021
|
|
$
|
4,012
|
|
$
|
92,033
|
|
||
|
Net income per share of Class A common stock:
|
|||||||||||
|
Basic
|
$
|
1.01
|
|
$
|
1.06
|
|
|||||
|
Diluted
|
$
|
1.00
|
|
$
|
1.05
|
|
|||||
96
Planet Fitness, Inc. and subsidiaries
Notes to Consolidated financial statements
(Amounts in thousands, except share and per share amounts)
Consolidated Statement of Cash Flows
|
As reported December 31, 2018
|
Total adjustments
|
Amounts under Previous Standards
|
|||||||||
|
Cash flows from operating activities:
|
|||||||||||
|
Net income
|
$
|
103,162
|
|
$
|
4,654
|
|
$
|
107,816
|
|
||
|
Adjustments to reconcile net income to net cash provided by operating activities:
|
|||||||||||
|
Depreciation and amortization
|
35,260
|
|
—
|
|
35,260
|
|
|||||
|
Amortization of deferred financing costs
|
3,400
|
|
—
|
|
3,400
|
|
|||||
|
Amortization of favorable leases and asset retirement obligations
|
375
|
|
—
|
|
375
|
|
|||||
|
Amortization of interest rate caps
|
1,170
|
|
—
|
|
1,170
|
|
|||||
|
Deferred tax expense
|
23,933
|
|
—
|
|
23,933
|
|
|||||
|
Loss (gain) on re-measurement of tax benefit arrangement
|
4,765
|
|
—
|
|
4,765
|
|
|||||
|
Provision for bad debts
|
19
|
|
—
|
|
19
|
|
|||||
|
Gain on disposal of property and equipment
|
462
|
|
—
|
|
462
|
|
|||||
|
Loss on extinguishment of debt
|
4,570
|
|
—
|
|
4,570
|
|
|||||
|
Third party debt refinancing expense
|
—
|
|
—
|
|
—
|
|
|||||
|
Loss on reacquired franchise rights
|
360
|
|
—
|
|
360
|
|
|||||
|
Equity-based compensation
|
5,479
|
|
—
|
|
5,479
|
|
|||||
|
Changes in operating assets and liabilities:
|
—
|
|
—
|
|
|||||||
|
Accounts receivable
|
(1,923
|
)
|
—
|
|
(1,923
|
)
|
|||||
|
Due from related parties
|
3,598
|
|
—
|
|
3,598
|
|
|||||
|
Inventory
|
(2,430
|
)
|
—
|
|
(2,430
|
)
|
|||||
|
Other assets and other current assets
|
5,778
|
|
—
|
|
5,778
|
|
|||||
|
National advertising fund
|
—
|
|
(425
|
)
|
(425
|
)
|
|||||
|
Accounts payable and accrued expenses
|
14,506
|
|
—
|
|
14,506
|
|
|||||
|
Other liabilities and other current liabilities
|
(2,835
|
)
|
—
|
|
(2,835
|
)
|
|||||
|
Income taxes
|
194
|
|
1,437
|
|
1,631
|
|
|||||
|
Payments pursuant to tax benefit arrangements
|
(30,493
|
)
|
—
|
|
(30,493
|
)
|
|||||
|
Equipment deposits
|
1,410
|
|
—
|
|
1,410
|
|
|||||
|
Deferred revenue
|
9,640
|
|
$
|
(5,666
|
)
|
3,974
|
|
||||
|
Deferred rent
|
3,999
|
|
—
|
|
3,999
|
|
|||||
|
Net cash provided by operating activities
|
$
|
184,399
|
|
$
|
—
|
|
$
|
184,399
|
|
||
97
Planet Fitness, Inc. and subsidiaries
Notes to Consolidated financial statements
(Amounts in thousands, except share and per share amounts)
Consolidated Balance Sheet
|
As reported December 31, 2018
|
Total adjustments
|
Amounts under Previous Standards
|
|||||||||
|
Assets
|
|||||||||||
|
Current assets:
|
|||||||||||
|
Cash and cash equivalents
|
$
|
289,431
|
|
$
|
—
|
|
$
|
289,431
|
|
||
|
Restricted cash
|
30,708
|
|
—
|
|
30,708
|
|
|||||
|
Accounts receivable, net
|
38,960
|
|
—
|
|
38,960
|
|
|||||
|
Due from related parties
|
—
|
|
—
|
|
—
|
|
|||||
|
Inventory
|
5,122
|
|
—
|
|
5,122
|
|
|||||
|
Restricted assets – national advertising fund
|
—
|
|
425
|
|
425
|
|
|||||
|
Prepaid expenses
|
4,947
|
|
—
|
|
4,947
|
|
|||||
|
Other receivables
|
12,548
|
|
—
|
|
12,548
|
|
|||||
|
Income tax receivable
|
6,824
|
|
(1,437
|
)
|
5,387
|
|
|||||
|
Total current assets
|
388,540
|
|
(1,012
|
)
|
387,528
|
|
|||||
|
Property and equipment, net
|
114,367
|
|
—
|
|
114,367
|
|
|||||
|
Intangible assets, net
|
234,330
|
|
—
|
|
234,330
|
|
|||||
|
Goodwill
|
199,513
|
|
—
|
|
199,513
|
|
|||||
|
Deferred income taxes
|
414,841
|
|
(3,285
|
)
|
411,556
|
|
|||||
|
Other assets, net
|
1,825
|
|
—
|
|
1,825
|
|
|||||
|
Total assets
|
$
|
1,353,416
|
|
$
|
(4,297
|
)
|
$
|
1,349,119
|
|
||
|
Liabilities and stockholders' equity (deficit)
|
|||||||||||
|
Current liabilities:
|
|||||||||||
|
Current maturities of long-term debt
|
$
|
12,000
|
|
$
|
—
|
|
$
|
12,000
|
|
||
|
Accounts payable
|
30,428
|
|
—
|
|
30,428
|
|
|||||
|
Accrued expenses
|
32,384
|
|
—
|
|
32,384
|
|
|||||
|
Equipment deposits
|
7,908
|
|
—
|
|
7,908
|
|
|||||
|
Restricted liabilities – national advertising fund
|
—
|
|
—
|
|
—
|
|
|||||
|
Deferred revenue, current
|
23,488
|
|
118
|
|
23,606
|
|
|||||
|
Payable pursuant to tax benefit arrangements, current
|
24,765
|
|
—
|
|
24,765
|
|
|||||
|
Other current liabilities
|
430
|
|
—
|
|
430
|
|
|||||
|
Total current liabilities
|
131,403
|
|
118
|
|
131,521
|
|
|||||
|
Long-term debt, net of current maturities
|
1,160,127
|
|
—
|
|
1,160,127
|
|
|||||
|
Deferred rent, net of current portion
|
10,083
|
|
—
|
|
10,083
|
|
|||||
|
Deferred revenue, net of current portion
|
26,374
|
|
(18,448
|
)
|
7,926
|
|
|||||
|
Deferred tax liabilities
|
2,303
|
|
—
|
|
2,303
|
|
|||||
|
Payable pursuant to tax benefit arrangements, net of current portion
|
404,468
|
|
—
|
|
404,468
|
|
|||||
|
Other liabilities
|
1,447
|
|
—
|
|
1,447
|
|
|||||
|
Total noncurrent liabilities
|
1,604,802
|
|
(18,448
|
)
|
1,586,354
|
|
|||||
|
Commitments and contingencies (note 16)
|
|||||||||||
|
Stockholders' equity (deficit):
|
|||||||||||
|
Class A common stock
|
9
|
|
—
|
|
9
|
|
|||||
|
Class B common stock
|
1
|
|
—
|
|
1
|
|
|||||
|
Accumulated other comprehensive income
|
94
|
|
—
|
|
94
|
|
|||||
|
Additional paid in capital
|
19,732
|
|
—
|
|
19,732
|
|
|||||
|
Accumulated deficit
|
(394,410
|
)
|
13,391
|
|
(381,019
|
)
|
|||||
|
Total stockholders' deficit attributable to Planet Fitness Inc.
|
(374,574
|
)
|
13,391
|
|
(361,183
|
)
|
|||||
|
Non-controlling interests
|
(8,215
|
)
|
642
|
|
(7,573
|
)
|
|||||
|
Total stockholders' deficit
|
(382,789
|
)
|
14,033
|
|
(368,756
|
)
|
|||||
|
Total liabilities and stockholders' deficit
|
$
|
1,353,416
|
|
$
|
(4,297
|
)
|
$
|
1,349,119
|
|
||
98
(11) Related party transactions
Amounts due from related parties of
$0
and
$3,020
as of
December 31, 2018
and
2017
, respectively, primarily relate to currently due or potential reimbursements for certain taxes accrued or paid by the Company (see note 15).
Activity with franchisees considered to be related parties is summarized below.
|
|
For the Year Ended
December 31,
|
||||||||||
|
|
2018
|
2017
|
2016
|
||||||||
|
Franchise revenue
|
$
|
3,179
|
|
$
|
2,130
|
|
$
|
1,760
|
|
||
|
Equipment revenue
|
3,977
|
|
3,464
|
|
1,338
|
|
|||||
|
Total revenue from related parties
|
$
|
7,156
|
|
$
|
5,594
|
|
$
|
3,098
|
|
||
Additionally, the Company had deferred ADA revenue from related parties of
$779
and
$389
as of
December 31, 2018
and
2017
, respectively.
The Company entered into a consulting agreement that terminated on December 31, 2018 with a shareholder and former executive officer of the Company.
The Company paid rent and lease termination costs for its former headquarters to MMC Fox Run, LLC, which was owned by Chris Rondeau, our CEO, and Marc Grondahl, a shareholder and former executive officer and former member of our board of directors, in the amounts of
$0
,
$898
, and
$406
, for the years ended
December 31, 2018
,
2017
and
2016
, respectively.
As of
December 31, 2018
and
2017
, the Company had
$59,458
and
$44,794
, respectively, payable to related parties pursuant to tax benefit arrangements, see Note 15.
A member of the Company’s board of directors, who is also a franchisee, holds an approximate
10.5%
ownership of a company that sells amenity tracking compliance software to Planet Fitness stores. As of
December 31, 2018
, the software was being utilized at
35
corporate-owned stores and approximately
400
franchise stores.
(12) Stockholder’s equity
Pursuant to the exchange agreement between the Company and the Continuing LLC Owners, the Continuing LLC Owners (or certain permitted transferees thereof) have the right, from time to time and subject to the terms of the exchange agreement, to exchange their Holdings Units, along with a corresponding number of shares of Class B common stock, for shares of Class A common stock (or cash at the option of the Company) on a
one
-for-one basis, subject to customary conversion rate adjustments for stock splits, stock dividends, reclassifications and similar transactions. In connection with any exchange of Holdings Units for shares of Class A common stock by a Continuing LLC Owner, the number of Holdings Units held by the Company is correspondingly increased as it acquires the exchanged Holdings Units, and a corresponding number of shares of Class B common stock are canceled.
June 2016 Secondary Offering
As described in Note 1, on June 28, 2016 the Company completed the June Secondary Offering of
11,500,000
shares of our Class A common stock at a price of
$16.50
per share. All of the shares sold in the offering were offered by Direct TSG Investors and the participating Continuing LLC Owners. The Company did not receive any proceeds from the sale of shares of Class A common stock offered by the Direct TSG Investors and the participating Continuing LLC Owners. The shares sold in the offering consisted of (i)
3,608,840
existing shares of Class A common stock held by the Direct TSG Investors and (ii)
7,891,160
newly-issued shares of Class A common stock issued in connection with the exercise of the exchange right by the Continuing LLC Owners that participated in the June Secondary Offering. Simultaneously, and in connection with the exchange,
7,891,160
shares of Class B common stock were surrendered by the Continuing LLC Owners that participated in the June Secondary Offering and canceled. Additionally, in connection with the exchange, Planet Fitness, Inc. received
7,891,160
Holdings Units, increasing its total ownership interest in Pla-Fit Holdings.
September 2016 Secondary Offering
As described in Note 1, on September 28, 2016, the Company completed the September Secondary Offering of
8,000,000
shares of our Class A common stock at a price of
19.62
per share. All of the shares sold in the offering were offered by the Direct TSG Investors and participating Continuing LLC Owners. The Company did not receive any proceeds from the sale of shares of Class A common stock offered by the Direct TSG Investors and the participating Continuing LLC Owners. The shares sold in the offering consisted of (i)
2,593,981
existing shares of Class A common stock held by the Direct TSG Investors and (ii)
5,406,019
newly-
99
Planet Fitness, Inc. and subsidiaries
Notes to Consolidated financial statements
(Amounts in thousands, except share and per share amounts)
issued shares of Class A common stock issued in connection with the exercise of the exchange right by the Continuing LLC Owners that participated in the September Secondary Offering. Simultaneously, and in connection with the exchange,
5,406,019
shares of Class B common stock were surrendered by the Continuing LLC Owners that participated in the September Secondary Offering and canceled. Additionally, in connection with the exchange, Planet Fitness, Inc. received
5,406,019
Holdings Units, increasing its total ownership interest in Pla-Fit Holdings.
November 2016 Secondary Offering
As described in Note 1, on November 22, 2016, the Company completed the November Secondary Offering of
15,000,000
shares of our Class A common stock at a price of
$23.22
per share. All of the shares sold in the offering were offered by the Direct TSG Investors and participating Continuing LLC Owners. The Company did not receive any proceeds from the sale of shares of Class A common stock offered by the Direct TSG Investors and the participating Continuing LLC Owners. The shares sold in the offering consisted of (i)
4,863,715
existing shares of Class A common stock held by the Direct TSG Investors and (ii)
10,136,285
newly-issued shares of Class A common stock issued in connection with the exercise of the exchange right by the Continuing LLC Owners that participated in the November Secondary Offering. Simultaneously, and in connection with the exchange,
10,136,285
shares of Class B common stock were surrendered by the Continuing LLC Owners that participated in the November Secondary Offering and canceled. Additionally, in connection with the exchange, Planet Fitness, Inc. received
10,136,285
Holdings Units, increasing its total ownership interest in Pla-Fit Holdings.
March 2017 Secondary Offering
As described in Note 1, on March 14, 2017, the Company completed the March Secondary Offering of
15,000,000
shares of its Class A common stock at a price of
$20.44
per share. All of the shares sold in the March Secondary Offering were offered by certain existing holders of Holdings Units and the Direct TSG Investors. The Company did not receive any proceeds from the sale of shares of Class A common stock offered by the Direct TSG Investors and the participating holders of Holdings Units. The shares sold in the March Secondary Offering consisted of (i)
4,790,758
existing shares of Class A common stock held by the Direct TSG Investors and (ii)
10,209,242
newly-issued shares of Class A common stock issued in connection with the exercise of the exchange right by the holders of Holdings Units that participated in the March Secondary Offering. Simultaneously, and in connection with the exchange,
10,209,242
shares of Class B common stock were surrendered by the holders of Holdings Units that participated in the March Secondary Offering and canceled. Additionally, in connection with the exchange, Planet Fitness, Inc. received
10,209,242
Holdings Units, increasing its total ownership interest in Pla-Fit Holdings.
May 2017 Secondary Offering
As described in Note 1, on May 10, 2017, the Company completed the May Secondary Offering of
16,085,510
shares of its Class A common stock at a price of
$20.28
per share. All of the shares sold in the May Secondary Offering were offered by certain existing holders of Holdings Units and the Direct TSG Investors. The Company did not receive any proceeds from the sale of shares of Class A common stock offered by the Direct TSG Investors and the participating holders of Holdings Units. The shares sold in the May Secondary Offering consisted of (i)
5,215,691
existing shares of Class A common stock held by the Direct TSG Investors and (ii)
10,869,819
newly-issued shares of Class A common stock issued in connection with the exercise of the exchange right by the holders of Holdings Units that participated in the May Secondary Offering. Simultaneously, and in connection with the exchange,
10,869,819
shares of Class B common stock were surrendered by the holders of Holdings Units that participated in the May Secondary Offering and canceled. Additionally, in connection with the exchange, Planet Fitness, Inc. received
10,869,819
Holdings Units, increasing its total ownership interest in Pla-Fit Holdings.
Other Exchanges
In addition to the secondary offerings mentioned above, during the years ended
December 31, 2018
and
2017
, respectively, certain Continuing LLC Owners have exercised their exchange right and exchanged
1,736,020
and
4,762,943
Holdings Units for
1,736,020
4,762,943
newly-issued shares of Class A common stock. Simultaneously, and in connection with these exchanges,
1,736,020
and
4,762,943
shares of Class B common stock were surrendered by the Continuing LLC Owners that exercised their exchange right and canceled in the years ended
December 31, 2018
and
2017
, respectively. Additionally, in connection with these exchanges, Planet Fitness, Inc. received
1,736,020
and
4,762,943
Holdings Units, during the years ended
December 31, 2018
and
2017
respectively, increasing its total ownership in Pla-Fit Holdings. Future exchanges of Holdings Units by the Continuing LLC Owners will result in a change in ownership and reduce the amount recorded as non-controlling interest and increase additional paid-in capital on our consolidated balance sheets.
As a result of the recapitalization transactions, the IPO, completion of our secondary offerings, and other exchanges and equity activity, as of
December 31, 2018
:
100
Planet Fitness, Inc. and subsidiaries
Notes to Consolidated financial statements
(Amounts in thousands, except share and per share amounts)
|
•
|
the public investors collectively owned
83,583,860
shares of our Class A common stock, representing
89.8%
of the voting power in the Company and, through the Company,
89.8%
of the economic interest in Pla-Fit Holdings; and
|
|
•
|
the Continuing LLC Owners collectively hold
9,447,730
Holdings Units, representing
10.2%
of the economic interest in Pla-Fit Holdings and
9,447,730
shares of our Class B common stock, representing
10.2%
of the voting power in the Company;
|
Share repurchase program
On August 3, 2018, our board of directors approved an increase to the total amount of the previously approved share repurchase program to $
500,000
.
On November 13, 2018, the Company entered into a $
300,000
accelerated share repurchase agreement (the “ASR Agreement”) with Citibank, N.A. (“the Bank”). Pursuant to the terms of the ASR Agreement, on November 14, 2018, the Company paid the Bank $
300,000
upfront in cash and received
4,607,410
shares of the Company’s Class A common stock, which were retired, and the Company elected to record as a reduction to retained earnings of
$240,000
. The final number of shares to be repurchased will be determined based on the volume-weighted average stock price of our common stock during the term of the transaction, less a discount and subject to adjustments pursuant to the terms and conditions of the ASR Agreement, and will also be retired upon delivery to us . This has been evaluated as an unsettled forward contract indexed to our own stock, with
$60,000
classified as a reduction to retained earnings. Final settlement of the ASR Agreement is expected to be completed during the second quarter of 2019, although the settlement may be accelerated at the Bank's option. At final settlement, the Bank may be required to deliver additional shares to the Company, or, under certain circumstances, the Company may be required to deliver shares of its Class A common stock or may elect to make a cash payment to the Bank. The ASR Agreement contains provisions customary for agreements of this type, including provisions for adjustments to the transaction terms, the circumstances generally under which the ASR Agreement may be accelerated, extended or terminated early by the Bank and various acknowledgments, representations and warranties made by the parties to one another.
Additionally, prior to the ASR Agreement, during the year ended December 31, 2018, the Company repurchased at market value and retired
824,312
shares of Class A common stock for a total cost of $
42,090
.
The timing of the purchases and the amount of stock repurchased is subject to the Company’s discretion and depends on market and business conditions, the Company’s general working capital needs, stock price, applicable legal requirements and other factors. Our ability to repurchase shares at any particular time is also subject to the terms of the indenture governing the Series 2018-1 Senior Notes. Purchases may be effected through one or more open market transactions, privately negotiated transactions, transactions structured through investment banking institutions, or a combination of the foregoing. Planet Fitness is not obligated under the program to acquire any particular amount of stock and can suspend or terminate the program at any time.
Dividends
The Company did not declare or pay any dividends during the years ended
December 31, 2018
or 2017. Dividends declared and paid to holders of the Company’s Class A common stock during the year ended December 31, 2016 were
$169,282
, or
$2.78
per share of Class A common stock. The dividend was declared on
November 10, 2016
and paid on
December 5, 2016
to Class A common stock holders of record as of
November 22, 2016
. The Company also paid cash dividend equivalents of
$101,729
, or
$2.78
per share, to holders of Holdings Units on December 5, 2016 and accrued
$3,899
of dividend equivalents for future payment to holders of unvested share awards to be paid upon vesting of the related awards.
(13) Equity-based compensation
2013 Equity Incentive Plan
In 2013, the Company’s Board of Directors adopted the 2013 Equity Incentive Plan (the “2013 Plan”). Under the 2013 Plan, the Company granted awards in the form of Class M Units to certain employees and directors of the Company and its subsidiaries. The Class M Units received distributions (other than tax distributions) only upon a liquidity event, as defined, that exceeded a threshold equivalent to the fair value of the Company, as determined by the Company’s Board of Directors, at the grant date.
Eighty percent
of the awards vest over
five years
of continuous employment or service while the other
twenty percent
only vest in the event of an initial public offering of the Company’s common stock or that of its parent or one of its subsidiaries, subject to the holder of the Class M Units remaining employed or providing services on the date of such initial public offering. All awards include a repurchase option at the election of the Company for the vested portion upon termination of employment or service, and have a
ten
year contractual term. These awards are accounted for as equity at their fair value as of the grant date. In connection with the IPO and related recapitalization transactions, all of the outstanding Class M Units were converted into Holdings Units and shares of Class B common stock of Planet Fitness, Inc. in accordance with the terms of the awards. The Company’s IPO constituted a qualifying event under the terms of the awards and as a result
4,238,338
Holdings Units and corresponding shares of Class B
101
Planet Fitness, Inc. and subsidiaries
Notes to Consolidated financial statements
(Amounts in thousands, except share and per share amounts)
common stock were issued to the existing Class M Unit holders with a weighted-average grant date fair value of
$1.52
per share. The Company recorded $
21
, $
152
and $
784
of compensation expense in the years ended
December 31, 2018
,
2017
and
2016
, respectively, related to these awards.
The fair value of each award was estimated on the date of grant using a Monte Carlo simulation model.
During the year ended December 31, 2016, the Company modified the vesting terms of
22,527
outstanding Holdings Units such that those units were fully vested immediately. In connection with the modification, the Company recorded
$337
of compensation expense in the year ended December 31, 2016.
A summary of unvested Holdings Unit activity is presented below:
|
|
Holdings Units
|
Weighted average grant date fair value
|
Weighted average remaining contractual term (years)
|
Aggregate intrinsic value
|
||||||||
|
Unvested outstanding at January 1, 2018
|
270,221
|
|
$
|
1.52
|
|
|||||||
|
Units granted
|
—
|
|
—
|
|
||||||||
|
Units forfeited
|
(8,990
|
)
|
$
|
1.52
|
|
|||||||
|
Units vested
|
(247,746
|
)
|
$
|
1.52
|
|
|||||||
|
Unvested outstanding at December 31, 2018
|
13,485
|
|
$
|
1.52
|
|
0.9
|
$
|
723
|
|
|||
The amount of total unrecognized compensation cost related to all awards under this plan was
$3
as of
December 31, 2018
, which is expected to be recognized over a weighted-average period of
0.9 years
.
2015 Omnibus Incentive Plan
Stock Options
In August 2015, the Company adopted the 2015 Omnibus Incentive Plan (the "2015 Plan") under which the Company may grant options and other equity-based awards to purchase up to
7,896,800
shares to employees, directors and officers. Generally, stock options awarded vest annually, on a tranche by tranche basis, over a period of
four years
with a maximum contractual term of
10 years
.
The fair value of stock option awards granted were determined on the grant date using the Black-Scholes valuation model based on the following assumptions:
|
|
Year ended December 31,
|
||||
|
|
2018
|
2017
|
|||
|
Expected term (years)
(1)
|
6.25 -6.5
|
|
6.25
|
|
|
|
Expected volatility
(2)
|
29.1% - 29.3%
|
|
|
28.6% - 32.9%
|
|
|
Risk-free interest rate
(3)
|
2.61% - 2.88%
|
|
|
1.86% - 2.10%
|
|
|
Dividend yield
(4)
|
—
|
%
|
—
|
%
|
|
|
(1)
|
Expected term represents the estimated period of time until an award is exercised and was determined using the simplified method.
|
|
(2)
|
Expected volatility is based on the historical volatility of a selected peer group over a period equivalent to the expected term.
|
|
(3)
|
The risk-free rate is an interpolation of yields on U.S. Treasury securities with maturities equivalent to the expected term.
|
|
(4)
|
Based on an assumed a dividend yield of zero at the time of grant.
|
102
Planet Fitness, Inc. and subsidiaries
Notes to Consolidated financial statements
(Amounts in thousands, except share and per share amounts)
A summary of stock option activity for the year ended
December 31, 2018
:
|
|
Stock Options
|
Weighted average
exercise price
|
Weighted average remaining contractual term (years)
|
Aggregate intrinsic value
|
||||||||
|
Outstanding at January 1, 2018
|
918,206
|
|
$
|
19.59
|
|
|||||||
|
Granted
|
224,141
|
|
$
|
38.83
|
|
|||||||
|
Exercised
|
(67,349
|
)
|
$
|
18.04
|
|
|||||||
|
Forfeited
|
(60,793
|
)
|
$
|
25.02
|
|
|||||||
|
Outstanding at December 31, 2018
|
1,014,205
|
|
$
|
23.62
|
|
8.0
|
$
|
30,427
|
|
|||
|
Vested or expected to vest at December 31, 2018
|
1,014,205
|
|
$
|
23.62
|
|
8.0
|
$
|
30,427
|
|
|||
|
Exercisable at December 31, 2018
|
256,970
|
|
$
|
19.04
|
|
7.3
|
$
|
8,887
|
|
|||
The weighted-average grant date fair value of stock options granted during the year ended
December 31, 2018
was
$13.49
. During the years ended
December 31, 2018
and
2017
,
$3,316
and
$2,195
, respectively, was recorded to selling, general and administrative expense related to these stock options. As of
December 31, 2018
, total unrecognized compensation expense related to unvested stock options, was
$3,228
, which is expected to be recognized over a weighted-average period of
2.0 years
.
Restricted stock units
During the year ended
December 31, 2018
, the Company granted
94,177
restricted Class A stock units (“RSUs”) under the 2015 Plan. RSUs granted to members of the Board of Directors vest on the first anniversary of the grant date, provided that the recipient continues to serve on the Board of Directors through the vesting dates. RSUs are also granted to certain employees of the Company and generally vest annually, on a tranche by tranche basis, over a period of
four years
. RSU awards are valued using the intrinsic value method.
|
|
Restricted stock units
|
Weighted average
fair value
|
Weighted average remaining contractual term (years)
|
Aggregate intrinsic value
|
||||||||
|
Unvested outstanding at January 1, 2018
|
16,218
|
|
$
|
23.26
|
|
|||||||
|
Granted
|
94,177
|
|
$
|
39.71
|
|
|||||||
|
Vested
|
(24,053
|
)
|
$
|
28.85
|
|
|||||||
|
Forfeited
|
(4,546
|
)
|
$
|
36.42
|
|
|||||||
|
Unvested outstanding at December 31, 2018
|
81,796
|
|
$
|
39.82
|
|
2.1
|
$
|
4,386
|
|
|||
The weighted-average grant date fair value of RSUs granted during the year ended
December 31, 2018
was
$39.71
. During the years ended
December 31, 2018
and
2017
,
$1,637
and
$184
, respectively, was recorded to selling, general and administrative expense related to these RSUs. As of
December 31, 2018
, total unrecognized compensation expense related to unvested RSUs was
$2,155
, which is expected to be recognized over a weighted-average period of
2.1 years
.
Employee stock purchase plan
The 2018 Employee Stock Purchase Plan (the "ESPP"), as adopted by the Board of Directors in March 2018, allows eligible employees to purchase shares of the Company’s Class A common stock at a discount through payroll deductions of up to
10%
of their eligible compensation, subject to any plan limitations. The ESPP provides for
six
-month offering periods, and at the end of each offering period, employees are able to purchase shares at
85%
of the lower of the fair market value of the Company’s Class A common stock on the first trading day of the offering period or on the last day of the offering period. As of
December 31, 2018
, a total of
1,000,000
shares of common stock were authorized and available for the issuance of equity awards under the ESPP. The first purchase of Class A common stock under the plan will occur in January, 2019. During the year ended December 31, 2018, $
129
was recorded to expense related to the ESPP.
(14) Earnings per share
Basic earnings per share of Class A common stock is computed by dividing net income attributable to Planet Fitness, Inc. for the years ended
December 31, 2018
,
2017
, and
2016
, by the weighted-average number of shares of Class A common stock outstanding during the same periods. Diluted earnings per share of Class A common stock is computed by dividing net income attributable to
103
Planet Fitness, Inc. and subsidiaries
Notes to Consolidated financial statements
(Amounts in thousands, except share and per share amounts)
Planet Fitness, Inc. by the weighted-average number of shares of Class A common stock outstanding adjusted to give effect to potentially dilutive securities.
Shares of the Company’s Class B common stock do not share in the earnings or losses attributable to Planet Fitness, Inc. and are therefore not participating securities. As such, separate presentation of basic and diluted earnings per share of Class B common stock under the two-class method has not been presented. Shares of the Company’s Class B common stock are, however, considered potentially dilutive shares of Class A common stock because shares of Class B common stock, together with the related Holdings Units, are exchangeable into shares of Class A common stock on a one-for-one basis.
The following table sets forth reconciliations of the numerators and denominators used to compute basic and diluted earnings per share of Class A common stock:
|
Basic net income per share:
|
Year Ended December 31, 2018
|
Year Ended December 31, 2017
|
Year Ended December 31, 2016
|
||||||||
|
Numerator
|
|||||||||||
|
Net income
|
$
|
103,162
|
|
$
|
55,601
|
|
$
|
71,247
|
|
||
|
Less: net income attributable to non-controlling interests
|
15,141
|
|
22,455
|
|
49,747
|
|
|||||
|
Net income attributable to Planet Fitness, Inc. - basic & diluted
|
$
|
88,021
|
|
$
|
33,146
|
|
$
|
21,500
|
|
||
|
Denominator
|
|||||||||||
|
Weighted-average shares of Class A common stock outstanding - basic
|
87,235,021
|
|
78,910,390
|
|
43,300,288
|
|
|||||
|
Effect of dilutive securities:
|
|||||||||||
|
Stock options
|
417,264
|
|
56,198
|
|
1,489
|
|
|||||
|
Restricted stock units
|
22,618
|
|
4,962
|
|
2,908
|
|
|||||
|
Weighted-average shares of Class A common stock outstanding - diluted
|
87,674,903
|
|
78,971,550
|
|
43,304,685
|
|
|||||
|
Earnings per share of Class A common stock - basic
|
$
|
1.01
|
|
$
|
0.42
|
|
$
|
0.50
|
|
||
|
Earnings per share of Class A common stock - diluted
|
$
|
1.00
|
|
$
|
0.42
|
|
$
|
0.50
|
|
||
Weighted average shares of Class B common stock of
10,275,077
,
19,483,737
and
55,305,992
for the years ended
December 31, 2018
,
2017
and
2016
, respectively, were evaluated under the if-converted method for potential dilutive effects and were determined to be anti-dilutive. Weighted-average stock options outstanding of
143,006
,
489,133
and
208,452
for the years ended
December 31, 2018
,
2017
and
2016
, respectively, were evaluated under the treasury stock method for potential dilutive effects and were determined to be anti-dilutive. Weighted average restricted stock units outstanding of
131
,
1,829
and
0
, for the year ended
December 31, 2018
,
2017
and
2016
, respectively, were evaluated under the treasury stock method for potential dilutive effects and were determined to be anti-dilutive.
(15) Income taxes
Income before the provision for income taxes as shown in the accompanying consolidated statements of operations is as follows:
|
|
Year Ended December 31,
|
||||||||||
|
|
2018
|
2017
|
2016
|
||||||||
|
Domestic
|
$
|
128,861
|
|
$
|
426,873
|
|
$
|
88,016
|
|
||
|
Foreign
|
2,943
|
|
2,308
|
|
1,892
|
|
|||||
|
Total income before the provision for income taxes
|
131,804
|
|
429,181
|
|
89,908
|
|
|||||
104
Planet Fitness, Inc. and subsidiaries
Notes to Consolidated financial statements
(Amounts in thousands, except share and per share amounts)
The provision (benefit) for income taxes consists of the following:
|
|
Year Ended December 31,
|
||||||||||
|
|
2018
|
2017
|
2016
|
||||||||
|
Current:
|
|||||||||||
|
Federal
|
$
|
178
|
|
$
|
(2,600
|
)
|
$
|
1,206
|
|
||
|
State
|
3,586
|
|
2,941
|
|
1,428
|
|
|||||
|
Foreign
|
945
|
|
817
|
|
421
|
|
|||||
|
Total current tax expense
|
4,709
|
|
1,158
|
|
3,055
|
|
|||||
|
Deferred:
|
|||||||||||
|
Federal
|
22,757
|
|
365,470
|
|
11,633
|
|
|||||
|
State
|
946
|
|
6,857
|
|
3,755
|
|
|||||
|
Foreign
|
230
|
|
95
|
|
218
|
|
|||||
|
Total deferred tax expense
|
23,933
|
|
372,422
|
|
15,606
|
|
|||||
|
Provision for income taxes
|
$
|
28,642
|
|
$
|
373,580
|
|
$
|
18,661
|
|
||
The Company is the sole managing member of Pla-Fit Holdings, which is treated as a partnership for U.S. federal and most applicable state and local income tax purposes. As a partnership, Pla-Fit Holdings is not subject to U.S. federal and certain state and local income taxes. Any taxable income or loss generated by Pla-Fit Holdings is passed through to and included in the taxable income or loss of its members, including the Company, on a pro rata basis. Planet Fitness, Inc. is subject to U.S. federal income taxes, in addition to state and local income taxes with respect to our allocable share of any taxable income of Pla-Fit Holdings. The Company is also subject to taxes in certain foreign jurisdictions.
On December 22, 2017, the 2017 Tax Act was enacted, making significant changes to the Internal Revenue Code. Changes included, but were not limited to, a corporate tax rate decrease from
35%
to
21%
beginning on January 1, 2018, the transition of U.S international taxation from a worldwide tax system to a modified territorial system, and a one-time transition tax on the mandatory deemed repatriation of cumulative foreign earnings as of December 31, 2017. The Company recognized
$334,619
of income tax expense in our income tax provision in the fourth quarter of 2017 as a result of the enactment of the 2017 Tax Act, of which
$334,022
related to the remeasurement of certain deferred tax assets and liabilities, and
$597
related to mandatory repatriation. The 2017 Tax Act also caused a remeasurement of our tax benefit arrangements, as discussed in more detail below. During 2018, the Company filed all of its 2017 U.S. federal and state returns and the provisional net tax expense was finalized. There was no material change in the provisional amount recorded in 2017 in accordance with Staff Accounting Bulletin No. 118.
A reconciliation of the U.S. statutory income tax rate to the Company’s effective tax rate is as follows:
|
|
Year Ended December 31,
|
|||||||
|
|
2018
|
2017
|
2016
|
|||||
|
U.S. statutory tax rate
|
21.0
|
%
|
35.0
|
%
|
35.0
|
%
|
||
|
State and local taxes, net of federal benefit
|
5.9
|
%
|
1.0
|
%
|
4.9
|
%
|
||
|
State rate change impact on deferred taxes
|
(3.4
|
)%
|
0.8
|
%
|
(1.4
|
)%
|
||
|
Federal rate change impact on deferred taxes
|
—
|
%
|
77.8
|
%
|
—
|
%
|
||
|
Tax benefit arrangement liability adjustment
|
0.8
|
%
|
(25.8
|
)%
|
—
|
%
|
||
|
Foreign tax rate differential
|
0.2
|
%
|
—
|
%
|
(0.3
|
)%
|
||
|
Withholding taxes and other
|
(0.3
|
)%
|
0.1
|
%
|
—
|
%
|
||
|
Reserve for uncertain tax position
|
(0.2
|
)%
|
0.1
|
%
|
3.1
|
%
|
||
|
Income attributable to non-controlling interests
|
(2.3
|
)%
|
(1.9
|
)%
|
(20.5
|
)%
|
||
|
Effective tax rate
|
21.7
|
%
|
87.1
|
%
|
20.8
|
%
|
||
The Company’s effective tax rate was
21.7%
in 2018, in comparison to the U.S. statutory tax rate in 2018 of
21%
. The comparison of our effective tax rate to U.S. statutory tax rate is influenced by the fact that we are subject to taxation in various state and local jurisdictions resulting in an increase in our effective tax rate, offset mainly by income tax benefit recorded in 2018 to remeasure deferred tax assets. This remeasurement was a result of various state tax legislation enacted in the year as well as acquisitions
105
Planet Fitness, Inc. and subsidiaries
Notes to Consolidated financial statements
(Amounts in thousands, except share and per share amounts)
which resulted in an increase in the amount of income apportioned to various states in future periods and accordingly resulted in recognition of a deferred tax benefit in 2018, and a decrease to our effective income tax rate in 2018.
The Company’s effective tax rate is
21.7%
for the year ended December 31, 2018, compared to
87.1%
in the prior year. The decrease in our effective income tax rate is primarily due to the recognition of an income tax expense in connection with remeasurement of our deferred taxes in 2017 as a result of the Tax Act, as well as a decrease in the U.S. statutory tax rate in 2018. These factors are partially offset by the income tax benefit recognized in 2017 in connection with the remeasurement of our TRA liability as a result of the Tax Act.
Deferred income taxes are provided for the effects of temporary differences between the tax basis of an asset or liability and its reported amount in the accompanying consolidated balance sheets. These temporary differences result in taxable or deductible amounts in future years. Details of the Company’s deferred tax assets and liabilities are summarized as follows:
|
|
Year Ended December 31,
|
||||||
|
|
2018
|
2017
|
|||||
|
Deferred tax assets:
|
|||||||
|
Accrued expense and reserves
|
$
|
37
|
|
$
|
1,422
|
|
|
|
Deferred revenue
|
4,619
|
|
1,900
|
|
|||
|
Goodwill and intangible assets
|
409,740
|
|
404,547
|
|
|||
|
Net operating loss
|
—
|
|
603
|
|
|||
|
Other
|
4,901
|
|
3,619
|
|
|||
|
Deferred tax assets
|
$
|
419,297
|
|
$
|
412,091
|
|
|
|
Deferred tax liabilities:
|
|||||||
|
Prepaid expenses
|
(922
|
)
|
(773
|
)
|
|||
|
Property and equipment
|
(5,837
|
)
|
(5,165
|
)
|
|||
|
Total deferred tax liabilities
|
$
|
(6,759
|
)
|
$
|
(5,938
|
)
|
|
|
Total deferred tax assets and liabilities
|
$
|
412,538
|
|
$
|
406,153
|
|
|
|
Reported as:
|
|||||||
|
Deferred income taxes - non-current assets
|
$
|
414,841
|
|
$
|
407,782
|
|
|
|
Deferred income taxes - non-current liabilities
|
(2,303
|
)
|
(1,629
|
)
|
|||
|
Total deferred tax assets and liabilities
|
$
|
412,538
|
|
$
|
406,153
|
|
|
As of
December 31, 2018
, the Company does not have any material net operating loss carryforwards.
A summary of the changes in the Company’s unrecognized tax positions is as follows:
|
|
Year Ended December 31,
|
||||||
|
|
2018
|
2017
|
|||||
|
Balance at beginning of year
|
$
|
2,608
|
|
$
|
2,608
|
|
|
|
Decrease related to prior year tax positions
|
(2,308
|
)
|
—
|
|
|||
|
Balance at end of year
|
$
|
300
|
|
$
|
2,608
|
|
|
As of
December 31, 2018
and
2017
, the total liability related to uncertain tax positions was
$300
and
2,608
, respectively, and is included within other liabilities on our consolidated balance sheets. The table above presents a reconciliation of the beginning and ending balances of the liability for unrecognized tax benefits, excluding interest and penalties, for the years ended December 31, 2018 and 2017. The decrease in the liability for uncertain tax position is due to a settlement of a tax examination during 2018. During 2018, the Company settled a tax examination for $
2,625
which was fully indemnified. At the date of settlement the Company had recorded on its balance sheet an unrecognized tax benefit and related indemnification asset of $
2,967
, reflecting principal and interest, and released $
342
as an offset to provision for income taxes and also released an indemnification asset of $
342
through other expense. The Company recognized interest and penalties related to uncertain tax positions as a component of income tax expense.
The Company and its subsidiaries file U.S. federal income tax returns, as well as tax returns in various state and foreign jurisdictions. Generally, the tax years 2015 through 2018 remain open to examination by the tax authorities in these jurisdictions.
106
Planet Fitness, Inc. and subsidiaries
Notes to Consolidated financial statements
(Amounts in thousands, except share and per share amounts)
Tax benefit arrangements
The Company’s acquisition of Holdings Units in connection with the IPO and future and certain past exchanges of Holdings Units for shares of the Company’s Class A common stock (or cash at the option of the Company) are expected to produce and have produced favorable tax attributes. In connection with the IPO, the Company entered into
two
tax receivable agreements. Under the first of those agreements, the Company generally is required to pay to the TRA Holders
85%
of the applicable tax savings, if any, in U.S. federal and state income tax that the Company is deemed to realize as a result of certain tax attributes of their Holdings Units sold to the Company (or exchanged in a taxable sale) and that are created as a result of (i) the sales of their Holdings Units for shares of Class A common stock and (ii) tax benefits attributable to payments made under the tax receivable agreement (including imputed interest). Under the second tax receivable agreement, the Company generally is required to pay to the Direct TSG Investors
85%
of the amount of tax savings, if any, that the Company is deemed to realize as a result of the tax attributes of the Holdings Units held in respect of the Direct TSG Investors’ interest in the Company, which resulted from the Direct TSG Investors’ purchase of interests in Pla-Fit Holdings in 2012, and certain other tax benefits. Under both agreements, the Company generally retains the benefit of the remaining
15%
of the applicable tax savings. Also, to the extent an exchange results in Pla-Fit Holdings, LLC incurring a current tax liability relating to the New Hampshire business profits tax, the TRA Holders have agreed that they will contribute to Pla-Fit Holdings, LLC an amount sufficient to pay such liability (up to
3.5%
of the value receive upon exchange). If and when the Company subsequently realizes a related tax benefit, Pla-Fit Holdings, LLC will distribute the amount of any such tax benefit to the relevant TRA LLC Owner in respect of its contribution. Due to changes in New Hampshire tax law during 2016, the Company no longer expects to incur any such liability under the New Hampshire business profits tax. The Company recorded other expense of
$4,765
, other income of
$317,350
and other expense of
$72
and in the years ended
December 31, 2018
,
2017
and
2016
, respectively, reflecting a change in the tax benefit obligation attributable to a change in the expected tax benefits. In 2018, the remeasurement was primarily due to various state tax legislation changes enacted in the year as well as acquisitions which resulted in an increase in the amount of income apportioned to various states in future periods and accordingly resulted in a decrease to the tax benefit arrangement liability. Included in this amount in 2017, was a gain of
$316,813
related to the remeasurement of our tax benefit arrangements in connection with changes in the tax rate due to the 2017 Tax Act. This remeasurement gain, which is not subject to federal or state income tax, favorably impacted our effective federal and state income tax rates in 2017.
In connection with the exchanges that occurred in the secondary offerings and other exchanges during
2018
and
2017
,
1,736,020
and
25,842,004
Holdings Units, respectively, were redeemed by the Continuing LLC Owners for newly-issued shares of Class A common stock, resulting in an increase in the tax basis of the net assets of Pla-Fit Holdings subject to the provisions of the tax receivable agreements. As a result of the change in Planet Fitness, Inc.’s ownership percentage of Pla-Fit Holdings that occurred in conjunction with the exchanges, we recorded a decrease to our net deferred tax assets of
$721
and
$24,371
, during the years ended
December 31, 2018
and
2017
, respectively. As a result of these exchanges, during the years ended
December 31, 2018
and
2017
we also recognized deferred tax assets in the amount of
$27,565
and
$394,108
, respectively, and corresponding tax benefit arrangement liabilities of
$23,526
and
$341,089
, respectively, representing approximately
85%
of the tax benefits due to the TRA Holders. The offset to the entries recorded in connection with exchanges in each year was to stockholders’ equity.
The tax benefit obligation was
$429,233
and
$431,360
as of
December 31, 2018
and
2017
, respectively.
Projected future payments under the tax benefit arrangements are as follows:
|
|
Amount
|
||
|
2019
|
$
|
24,765
|
|
|
2020
|
24,996
|
|
|
|
2021
|
25,450
|
|
|
|
2022
|
25,975
|
|
|
|
2023
|
26,482
|
|
|
|
Thereafter
|
301,565
|
|
|
|
Total
|
$
|
429,233
|
|
(16) Commitments and contingencies
(a) Operating lease commitments
The Company rents equipment, office, and warehouse space at various locations in the United States and Canada under noncancelable operating leases. Rental expense was
$24,900
,
$20,296
, and
$19,203
for the years ended
December 31, 2018
,
2017
107
Planet Fitness, Inc. and subsidiaries
Notes to Consolidated financial statements
(Amounts in thousands, except share and per share amounts)
and
2016
, respectively. Approximate annual future commitments under noncancelable operating leases as of
December 31, 2018
are as follows:
|
|
Amount
|
||
|
2019
|
$
|
15,911
|
|
|
2020
|
15,219
|
|
|
|
2021
|
13,454
|
|
|
|
2022
|
12,561
|
|
|
|
2023
|
11,133
|
|
|
|
Thereafter
|
45,324
|
|
|
|
Total
|
$
|
113,602
|
|
(b) Legal matters
From time to time, and in the ordinary course of business, the Company is subject to various claims, charges, and litigation, such as employment-related claims and slip and fall cases. The Company is not currently aware of any legal proceedings or claims that the Company believes will have, individually or in the aggregate, a material adverse effect on the Company’s financial position or result of operations.
(c) Purchase commitments
As of
December 31, 2018
, the Company had advertising purchase commitments of approximately
$17,848
, including commitments made by the NAF. In addition, the Company had open purchase orders of approximately
$18,189
primarily related to equipment to be sold to franchisees.
(d) Guarantees
The Company has guaranteed certain leases of entities that were previously related through common ownership. These guarantees relate to leases for operating space of franchises operated by the related entities. The Company’s maximum obligation, as a result of its guarantees of leases, is approximately
$732
and
$979
as of
December 31, 2018
and
2017
, respectively, and would only require payment upon default by the primary obligor. The Company has determined the fair value of these guarantees at inception is not material, and as of
December 31, 2018
and
2017
,
no
accrual has been recorded for the Company’s potential obligation under its guaranty arrangement.
(17) Retirement Plan
The Company maintains a 401(k) deferred tax savings plan (the Plan) for eligible employees. The Plan provides for the Company to make an employer matching contribution currently equal to
100%
of employee deferrals up to a maximum of
4%
of each eligible participating employees’ wages. Total employer matching contributions expensed in the consolidated statements of operations were approximately
$832
,
$623
, and
$484
for the years ended
December 31, 2018
,
2017
and
2016
, respectively.
(18) Segments
The Company has
three
reportable segments: (i) Franchise; (ii) Corporate-owned stores; and (iii) Equipment.
The Company’s operations are organized and managed by type of products and services and segment information is reported accordingly. The Company’s chief operating decision maker (the “CODM”) is its Chief Executive Officer. The CODM reviews financial performance and allocates resources by reportable segment. There have been
no
operating segments aggregated to arrive at the Company’s reportable segments.
The Franchise segment includes operations related to the Company’s franchising business in the United States, Puerto Rico, Canada, the Dominican Republic, Panama and Mexico. The Corporate-owned stores segment includes operations with respect to all Corporate-owned stores throughout the United States and Canada. The Equipment segment includes the sale of equipment to franchisee-owned stores.
The accounting policies of the reportable segments are the same as those described in Note 2. The Company evaluates the performance of its segments and allocates resources to them based on revenue and earnings before interest, taxes, depreciation,
108
Planet Fitness, Inc. and subsidiaries
Notes to Consolidated financial statements
(Amounts in thousands, except share and per share amounts)
and amortization, referred to as Segment EBITDA. Revenues for all operating segments include only transactions with unaffiliated customers and include
no
intersegment revenues.
The tables below summarize the financial information for the Company’s reportable segments for the years ended
December 31, 2018
,
2017
and
2016
. The “Corporate and other” column, as it relates to Segment EBITDA, primarily includes corporate overhead costs, such as payroll and related benefit costs and professional services which are not directly attributable to any individual segment.
|
|
Year Ended December 31,
|
||||||||||
|
|
2018
|
2017
|
2016
|
||||||||
|
Revenue
|
|||||||||||
|
Franchise segment revenue - U.S.
|
$
|
219,506
|
|
$
|
147,787
|
|
$
|
114,717
|
|
||
|
Franchise segment revenue - International
|
4,634
|
|
2,368
|
|
1,771
|
|
|||||
|
Franchise segment total
|
224,140
|
|
150,155
|
|
116,488
|
|
|||||
|
Corporate-owned stores segment - U.S.
|
134,174
|
|
107,712
|
|
100,541
|
|
|||||
|
Corporate-owned stores segment - International
|
4,425
|
|
4,402
|
|
4,180
|
|
|||||
|
Corporate-owned stores segment total
|
138,599
|
|
112,114
|
|
104,721
|
|
|||||
|
Equipment segment - U.S.
|
210,159
|
|
167,673
|
|
157,032
|
|
|||||
|
Equipment segment total
|
210,159
|
|
167,673
|
|
157,032
|
|
|||||
|
Total revenue
|
$
|
572,898
|
|
$
|
429,942
|
|
$
|
378,241
|
|
||
Franchise segment revenue includes franchise revenue, commission income and in 2018 includes NAF revenue, see Note 2 and Note 10.
Franchise revenue includes revenue generated from placement services of
$11,502
,
$11,371
, and
$10,513
for the years ended
December 31, 2018
,
2017
and
2016
, respectively.
|
|
Year Ended December 31,
|
||||||||||
|
|
2018
|
2017
|
2016
|
||||||||
|
Segment EBITDA
|
|||||||||||
|
Franchise
|
$
|
152,571
|
|
$
|
126,459
|
|
$
|
97,256
|
|
||
|
Corporate-owned stores
|
56,704
|
|
46,855
|
|
40,847
|
|
|||||
|
Equipment
|
47,607
|
|
38,539
|
|
36,439
|
|
|||||
|
Corporate and other
|
(43,753
|
)
|
284,372
|
|
(26,007
|
)
|
|||||
|
Total Segment EBITDA
|
$
|
213,129
|
|
$
|
496,225
|
|
$
|
148,535
|
|
||
The following table reconciles total Segment EBITDA to income before taxes:
|
|
Year Ended December 31,
|
||||||||||
|
|
2018
|
2017
|
2016
|
||||||||
|
Total Segment EBITDA
|
$
|
213,129
|
|
$
|
496,225
|
|
$
|
148,535
|
|
||
|
Less:
|
|||||||||||
|
Depreciation and amortization
|
35,260
|
|
31,761
|
|
31,502
|
|
|||||
|
Other income (expense)
|
(6,175
|
)
|
316,928
|
|
1,371
|
|
|||||
|
Income from operations
|
184,044
|
|
147,536
|
|
115,662
|
|
|||||
|
Interest expense, net
|
(46,065
|
)
|
(35,283
|
)
|
(27,125
|
)
|
|||||
|
Other income (expense)
|
(6,175
|
)
|
316,928
|
|
1,371
|
|
|||||
|
Income before income taxes
|
$
|
131,804
|
|
$
|
429,181
|
|
$
|
89,908
|
|
||
109
Planet Fitness, Inc. and subsidiaries
Notes to Consolidated financial statements
(Amounts in thousands, except share and per share amounts)
The following table summarizes the Company’s assets by reportable segment:
|
|
December 31, 2018
|
December 31, 2017
|
|||||
|
Franchise
|
$
|
319,422
|
|
$
|
243,348
|
|
|
|
Corporate-owned stores
|
243,221
|
|
167,367
|
|
|||
|
Equipment
|
210,462
|
|
206,632
|
|
|||
|
Unallocated
|
580,311
|
|
475,118
|
|
|||
|
Total consolidated assets
|
$
|
1,353,416
|
|
$
|
1,092,465
|
|
|
The table above includes
$1,892
and
$2,558
of long-lived assets located in the Company’s international corporate-owned stores as of
December 31, 2018
and
2017
, respectively.
The following table summarizes the Company’s goodwill by reportable segment:
|
|
December 31, 2018
|
December 31, 2017
|
|||||
|
Franchise
|
$
|
16,938
|
|
$
|
16,938
|
|
|
|
Corporate-owned stores
|
89,909
|
|
67,377
|
|
|||
|
Equipment
|
92,666
|
|
92,666
|
|
|||
|
Total consolidated goodwill
|
$
|
199,513
|
|
$
|
176,981
|
|
|
(19) Corporate-owned and franchisee-owned stores
The following table shows changes in our corporate-owned and franchisee-owned stores for the years ended
December 31, 2018
,
2017
and
2016
:
|
|
Year Ended December 31,
|
|||||||
|
|
2018
|
2017
|
2016
|
|||||
|
Franchisee-owned stores:
|
||||||||
|
Stores operated at beginning of period
|
1,456
|
|
1,255
|
|
1,066
|
|
||
|
New stores opened
|
226
|
|
206
|
|
195
|
|
||
|
Stores debranded, sold or consolidated
(1)
|
(16
|
)
|
(5
|
)
|
(6
|
)
|
||
|
Stores operated at end of period
|
1,666
|
|
1,456
|
|
1,255
|
|
||
|
Corporate-owned stores:
|
||||||||
|
Stores operated at beginning of period
|
62
|
|
58
|
|
58
|
|
||
|
New stores opened
|
4
|
|
4
|
|
—
|
|
||
|
Stores acquired from franchisees
|
10
|
|
—
|
|
—
|
|
||
|
Stores operated at end of period
|
76
|
|
62
|
|
58
|
|
||
|
Total stores:
|
||||||||
|
Stores operated at beginning of period
|
1,518
|
|
1,313
|
|
1,124
|
|
||
|
New stores opened
|
230
|
|
210
|
|
195
|
|
||
|
Stores debranded, sold or consolidated
(1)
|
(6
|
)
|
(5
|
)
|
(6
|
)
|
||
|
Stores operated at end of period
|
1,742
|
|
1,518
|
|
1,313
|
|
||
|
(1)
|
The term “debrand” refers to a franchisee-owned store whose right to use the Planet Fitness brand and marks has been terminated in accordance with the franchise agreement. We retain the right to prevent debranded stores from continuing to operate as fitness centers. The term “consolidated” refers to the combination of a franchisee’s store with another store located in close proximity with our prior approval. This often coincides with an enlargement, re-equipment and/or refurbishment of the remaining store.
|
110
(20) Quarterly financial data (unaudited)
|
|
For the quarter ended
|
||||||||||||||
|
|
March 31,
2018 |
June 30,
2018 |
September 30,
2018 |
December 31,
2018 |
|||||||||||
|
Total revenue
|
$
|
121,333
|
|
$
|
140,550
|
|
$
|
136,656
|
|
$
|
174,359
|
|
|||
|
Income from operations
|
38,918
|
|
48,811
|
|
43,573
|
|
52,742
|
|
|||||||
|
Net income
|
23,493
|
|
30,418
|
|
20,472
|
|
28,779
|
|
|||||||
|
Net income attributable to Planet Fitness, Inc.
|
19,880
|
|
25,874
|
|
17,471
|
|
24,796
|
|
|||||||
|
Earnings per share:
|
|||||||||||||||
|
Class A - Basic
|
$
|
0.23
|
|
$
|
0.30
|
|
$
|
0.20
|
|
$
|
0.29
|
|
|||
|
Class A - Diluted
|
$
|
0.23
|
|
$
|
0.29
|
|
$
|
0.20
|
|
$
|
0.29
|
|
|||
|
|
For the quarter ended
|
||||||||||||||
|
|
March 31,
2017 |
June 30,
2017 |
September 30,
2017 |
December 31,
2017 |
|||||||||||
|
Total revenue
|
$
|
91,102
|
|
$
|
107,316
|
|
$
|
97,496
|
|
$
|
134,028
|
|
|||
|
Income from operations
|
33,055
|
|
38,250
|
|
33,954
|
|
42,277
|
|
|||||||
|
Net income
|
17,866
|
|
18,004
|
|
18,902
|
|
829
|
|
|||||||
|
Net income (loss) attributable to Planet Fitness, Inc.
|
8,842
|
|
12,412
|
|
15,345
|
|
(3,453
|
)
|
|||||||
|
Earnings (loss) per share:
|
|||||||||||||||
|
Class A - Basic
|
$
|
0.14
|
|
$
|
0.16
|
|
$
|
0.18
|
|
$
|
(0.04
|
)
|
|||
|
Class A - Diluted
|
$
|
0.14
|
|
$
|
0.16
|
|
$
|
0.18
|
|
$
|
(0.04
|
)
|
|||
Item 9. Changes in and Disagreements with Accountants on Accounting and Financial Disclosure.
None.
Item 9A. Controls and Procedures.
Evaluation of Disclosure Controls and Procedures
We maintain disclosure controls and procedures (as defined in Rule 13a-15(e) under the Securities Exchange Act of 1934, as amended (the “Exchange Act”), that are intended to ensure that information that would be required to be disclosed in Exchange Act reports is recorded, processed, summarized and reported within the time periods specified in the SEC’s rules and forms, and that such information is accumulated and communicated to our management, including the Chief Executive Officer and the Chief Financial Officer, as appropriate, to allow timely decisions regarding required disclosure.
An evaluation was performed, under the supervision, and with the participation of our management, including our Chief Executive Officer and Chief Financial Officer, of the effectiveness of the design and operation of our disclosure controls and procedures as of
December 31, 2018
. Based on this evaluation, our Chief Executive Officer and Chief Financial Officer concluded that our disclosure controls and procedures were effective as of
December 31, 2018
at the reasonable assurance level.
Management's Annual Report on Internal Control over Financial Reporting
Our management is responsible for establishing and maintaining adequate internal control over financial reporting. Internal control over financial reporting is defined in Rule 13a-15(f) or 15d-15(f) promulgated under the Securities Exchange Act of 1934 as a process designed by, or under the supervision of, the company’s principal executive and principal financial officers and effected by the company’s board of directors, management and other personnel, to provide reasonable assurance regarding the reliability of financial reporting and the preparation of financial statements for external purposes in accordance with generally accepted accounting principles and includes those policies and procedures that:
|
•
|
Pertain to the maintenance of records that in reasonable detail accurately and fairly reflect the transactions and dispositions of the assets of the company;
|
|
•
|
Provide reasonable assurance that transactions are recorded as necessary to permit preparation of financial statements in accordance with generally accepted accounting principles, and that receipts and expenditures of the company are being made only in accordance with authorizations of management and directors of the company; and
|
111
|
•
|
Provide reasonable assurance regarding prevention or timely detection of unauthorized acquisition, use or disposition of the company’s assets that could have a material effect on the financial statements.
|
Because of its inherent limitations, internal control over financial reporting may not prevent or detect misstatements. Projections of any evaluation of effectiveness to future periods are subject to the risk that controls may become inadequate because of changes in conditions, or that the degree of compliance with the policies or procedures may deteriorate.
Our management assessed the effectiveness of our internal control over financial reporting as of
December 31, 2018
.
In making this assessment, the company’s management used the criteria set forth by the Committee of Sponsoring Organizations of the Treadway Commission (COSO) in Internal Control-Integrated 2013 Framework.
Based on this assessment, our management concluded that, as of
December 31, 2018
, our internal control over financial reporting is effective based on those criteria.
KPMG LLP, our independent registered public accounting firm, has issued an audit report appearing in this Annual Report on Form 10-K on the effectiveness of our internal control over financial reporting as of
December 31, 2018
.
Changes in Internal Control Over Financial Reporting
There have been no changes in our internal control over financial reporting that occurred during our most recent fiscal quarter that have materially affected, or are reasonably likely to materially affect, our internal control over financial reporting.
112
Report of Independent Registered Public Accounting Firm
To the Stockholders and Board of Directors
Planet Fitness, Inc.:
Opinion on Internal Control Over Financial Reporting
We have audited Planet Fitness, Inc. and subsidiaries’ (the "Company") internal control over financial reporting as of
December 31, 2018
, based on criteria established in
Internal Control – Integrated Framework (2013)
issued by the Committee of Sponsoring Organizations of the Treadway Commission. In our opinion, the Company maintained, in all material respects, effective internal control over financial reporting as of
December 31, 2018
, based on criteria established in
Internal Control – Integrated Framework (2013)
issued by the Committee of Sponsoring Organizations of the Treadway Commission.
We also have audited, in accordance with the standards of the Public Company Accounting Oversight Board (United States) (PCAOB), the consolidated balance sheets of the Company as of
December 31, 2018
and
2017
, the related consolidated statements of operations, comprehensive income, cash flows and changes in equity for each of the years in the three-year period ended
December 31, 2018
, and the related notes and financial statement Schedule II-Valuation and Qualifying Accounts (collectively, the “consolidated financial statements”), and our report dated March 1, 2019 expressed an unqualified opinion on those consolidated financial statements.
Basis for Opinion
The Company’s management is responsible for maintaining effective internal control over financial reporting and for its assessment of the effectiveness of internal control over financial reporting, included in the accompanying Management’s Annual Report on Internal Control over Financial Reporting. Our responsibility is to express an opinion on the Company’s internal control over financial reporting based on our audit. We are a public accounting firm registered with the PCAOB and are required to be independent with respect to the Company in accordance with the U.S. federal securities laws and the applicable rules and regulations of the Securities and Exchange Commission and the PCAOB.
We conducted our audit in accordance with the standards of the PCAOB. Those standards require that we plan and perform the audit to obtain reasonable assurance about whether effective internal control over financial reporting was maintained in all material respects. Our audit of internal control over financial reporting included obtaining an understanding of internal control over financial reporting, assessing the risk that a material weakness exists, and testing and evaluating the design and operating effectiveness of internal control based on the assessed risk. Our audit also included performing such other procedures as we considered necessary in the circumstances. We believe that our audit provides a reasonable basis for our opinion.
Definition and Limitations of Internal Control Over Financial Reporting
A company’s internal control over financial reporting is a process designed to provide reasonable assurance regarding the reliability of financial reporting and the preparation of financial statements for external purposes in accordance with generally accepted accounting principles. A company’s internal control over financial reporting includes those policies and procedures that (1) pertain to the maintenance of records that, in reasonable detail, accurately and fairly reflect the transactions and dispositions of the assets of the company; (2) provide reasonable assurance that transactions are recorded as necessary to permit preparation of financial statements in accordance with generally accepted accounting principles, and that receipts and expenditures of the company are being made only in accordance with authorizations of management and directors of the company; and (3) provide reasonable assurance regarding prevention or timely detection of unauthorized acquisition, use, or disposition of the company’s assets that could have a material effect on the financial statements.
Because of its inherent limitations, internal control over financial reporting may not prevent or detect misstatements. Also, projections of any evaluation of effectiveness to future periods are subject to the risk that controls may become inadequate because of changes in conditions, or that the degree of compliance with the policies or procedures may deteriorate.
/s/ KPMG LLP
Boston, Massachusetts
March 1, 2019
113
Item 9B. Other Information.
Not applicable.
PART III
Item 10. Directors, Executive Officers and Corporate Governance.
The information called for by Item 10 is incorporated herein by reference to our Definitive Proxy Statement relating to our 2019 Annual Meeting of Stockholders to be held April 29, 2019. We intend to file such Definitive Proxy Statement with the Securities and Exchange Commission pursuant to Regulation 14A within 120 days after the end of the fiscal year covered by this Annual Report on Form 10-K.
Item 11. Executive Compensation.
The information required by this Item 11 will be contained in the Definitive Proxy Statement referenced above in Item 10 and is incorporated herein by reference.
Item 12. Security Ownership of Certain Beneficial Owners and Management and Related Stockholder Matters.
The information required by this Item 12 will be contained in the Definitive Proxy Statement referenced above in Item 10 and is incorporated herein by reference.
Item 13. Certain Relationships and Related Transactions, and Director Independence.
The information required by this Item 13 will be contained in the Definitive Proxy Statement referenced above in Item 10 and is incorporated herein by reference.
Item 14. Principal Accounting Fees and Services.
The information required by this Item 14 will be contained in the Definitive Proxy Statement referenced above in Item 10 and is incorporated herein by reference.
114
PART IV
Item 15. Exhibits, Financial Statement Schedules.
|
(a)
|
The following documents are filed as part of this Annual Report on Form 10-K:
|
|
(1)
|
Financial statements (included in Item 8 of this Annual Report on Form 10-K):
|
|
•
|
Report of Independent Registered Public Accounting Firm
|
|
•
|
Consolidated Balance Sheets as of December 31, 2017 and 2016
|
|
•
|
Consolidated Statements of Operations and Comprehensive Income for the years ended December 31, 2017, 2016 and 2015
|
|
•
|
Consolidated Statements of Cash Flows for the years ended December 31, 2017, 2016 and 2015
|
|
•
|
Consolidated Statements of Changes in Equity for the years ended December 31, 2017, 2016 and 2015
|
|
•
|
Notes to Consolidated Financial Statements
|
|
(2)
|
Financial Statements Schedules
|
|
•
|
Schedule II – Valuation and Qualifying Accounts
|
|
(in thousands)
|
Balance at Beginning of Period
|
Provision for (recovery of) doubtful accounts, net
|
Write-offs and other
|
Balance at End of Period
|
|||||||||||
|
Allowance for doubtful accounts:
|
|
|
|
|
|||||||||||
|
December 31, 2018
|
$
|
32
|
|
$
|
19
|
|
$
|
33
|
|
$
|
84
|
|
|||
|
December 31, 2017
|
687
|
|
$
|
(19
|
)
|
$
|
(636
|
)
|
32
|
|
|||||
|
December 31, 2016
|
629
|
|
58
|
|
—
|
|
687
|
|
|||||||
All other separate financial statements schedules have been omitted because such information is inapplicable or is included in the financial statements or notes described above.
|
(3)
|
Exhibits
|
The exhibits listed in the following Exhibits Index, are filed or incorporated by reference as part of this Annual Report on Form 10-K.
|
|
|
|
Incorporated by Reference
|
|||||||||
|
Exhibit
number
|
Exhibit
description
|
Filed herewith
|
Form
|
File no.
|
Exhibit
|
Filing date
|
||||||
|
1.1
|
8-K
|
001-37534
|
1.1
|
20-Jul-18
|
||||||||
|
3.1
|
|
S-1/A
|
333-205141
|
3.1
|
15-Jul-15
|
|||||||
|
3.2
|
|
S-1
|
333-205141
|
3.2
|
22-Jun-15
|
|||||||
|
4.1
|
|
S-1/A
|
333-205141
|
4.1
|
27-Jul-15
|
|||||||
115
|
|
|
|
Incorporated by Reference
|
|||||||||
|
Exhibit
number
|
Exhibit
description
|
Filed herewith
|
Form
|
File no.
|
Exhibit
|
Filing date
|
||||||
|
4.2
|
8-K
|
001-37534
|
4.1
|
1-Aug-18
|
||||||||
|
4.3
|
8-K
|
001-37534
|
4.2
|
1-Aug-18
|
||||||||
|
10.1
|
|
S-1/A
|
333-205141
|
10.4
|
15-Jul-15
|
|||||||
|
10.2
|
|
S-1/A
|
333-205141
|
10.5
|
15-Jul-15
|
|||||||
|
10.3
|
|
S-1/A
|
333-205141
|
10.6
|
15-Jul-15
|
|||||||
|
10.4
|
|
S-1/A
|
333-205141
|
10.7
|
15-Jul-15
|
|||||||
|
10.5
|
|
10-Q
|
001-37534
|
10.2
|
03-Nov-16
|
|||||||
|
10.6
|
|
S-1/A
|
333-205141
|
10.8
|
15-Jul-15
|
|||||||
|
10.7
|
|
S-1/A
|
333-205141
|
10.9
|
15-Jul-15
|
|||||||
|
10.8
|
|
10-Q
|
001-37534
|
10.1
|
03-Nov-16
|
|||||||
|
10.9
|
|
S-1/A
|
333-205141
|
10.10
|
15-Jul-15
|
|||||||
|
10.10
|
|
S-1/A
|
333-205141
|
10.11
|
15-Jul-15
|
|||||||
|
10.11
|
|
S-1/A
|
333-205141
|
10.12
|
15-Jul-15
|
|||||||
|
10.12
|
|
S-1
|
333-205141
|
10.14
|
22-Jun-15
|
|||||||
|
10.13
|
|
S-1
|
333-205141
|
10.15
|
22-Jun-15
|
|||||||
|
10.14
|
|
S-1/A
|
333-205141
|
10.16
|
15-Jul-15
|
|||||||
|
10.15
|
|
S-1
|
333-205141
|
10.17
|
22-Jun-15
|
|||||||
|
10.16
|
|
S-1/A
|
333-205141
|
10.18
|
15-Jul-15
|
|||||||
|
10.17
|
|
S-1/A
|
333-205141
|
10.19
|
15-Jul-15
|
|||||||
|
10.18
|
|
S-1/A
|
333-205141
|
10.20
|
15-Jul-15
|
|||||||
|
10.19
|
8-K
|
001-37534
|
10.1
|
14-Nov-18
|
||||||||
116
|
|
|
|
Incorporated by Reference
|
|||||||||
|
Exhibit
number
|
Exhibit
description
|
Filed herewith
|
Form
|
File no.
|
Exhibit
|
Filing date
|
||||||
|
10.20
|
8-K
|
001-37534
|
10.1
|
20-Jul-18
|
||||||||
|
10.21
|
8-K
|
001-37534
|
10.1
|
1-Aug-18
|
||||||||
|
10.22
|
8-K
|
001-37534
|
10.2
|
1-Aug-18
|
||||||||
|
21.1
|
X
|
|
|
|
|
|||||||
|
23.1
|
X
|
|
|
|
|
|||||||
|
31.1
|
X
|
|
|
|
|
|||||||
|
31.2
|
X
|
|
|
|
|
|||||||
|
32.1
|
X
|
|
|
|
|
|||||||
|
32.2
|
|
|
X
|
|
|
|
|
|
|
|
|
|
|
101
|
|
Interactive Data Files Pursuant to Rule 405 of Regulation S-T: (i) Consolidated Statements of Operations, (ii) Consolidated Statements of Comprehensive Income, (iii) Consolidated Balance Sheets, (iv) Consolidated Statements of Cash Flows, and (v) Notes to Consolidated Financial Statements
|
|
X
|
|
|
|
|
|
|
|
|
117
Item 16. Form 10-K Summary.
None.
118
SIGNATURES
Pursuant to the requirements of Section 13 or 15(d) of the Securities Exchange Act of 1934, as amended, the Registrant has duly caused this Report to be signed on its behalf by the undersigned, thereunto duly authorized
.
|
|
Planet Fitness, Inc.
|
|
|
|
|
|
|
Date: March 1, 2019
|
|
/s/ Dorvin Lively
|
|
|
|
Dorvin Lively
|
|
|
|
President and Chief Financial Officer
|
Pursuant to the requirements of the Securities Exchange Act of 1934, as amended, this Report has been signed below by the following persons on behalf of the Registrant in the capacities and on the dates indicated.
|
Name
|
|
Title
|
|
Date
|
|
|
|
|
|
|
|
/s/ Christopher Rondeau
|
|
Chief Executive Officer and Director
|
|
March 1, 2019
|
|
Christopher Rondeau
|
|
(Principal Executive Officer)
|
|
|
|
|
|
|
|
|
|
/s/ Dorvin Lively
|
|
President and Chief Financial Officer
|
|
March 1, 2019
|
|
Dorvin Lively
|
|
(Principal Financial Officer and Principal Accounting Officer)
|
|
|
|
|
|
|
|
|
|
/s/ David Berg
|
|
Director
|
|
March 1, 2019
|
|
David Berg
|
|
|
|
|
|
|
|
|
|
|
|
/s/ Frances Rathke
|
|
Director
|
|
March 1, 2019
|
|
Frances Rathke
|
|
|
|
|
|
|
|
|
|
|
|
/s/ Craig Benson
|
|
Director
|
|
March 1, 2019
|
|
Craig Benson
|
|
|
|
|
|
|
|
|
|
|
|
/s/ Cammie Dunaway
|
|
Director
|
|
March 1, 2019
|
|
Cammie Dunaway
|
|
|
|
|
|
|
|
|
|
|
|
/s/ Stephen Spinelli, Jr.
|
|
Director
|
|
March 1, 2019
|
|
Stephen Spinelli, Jr.
|
|
|
|
|
119
TABLE OF CONTENTS
Part IItem 1. BusinessItem 1A. Risk FactorsItem 1B. Unresolved Staff CommentsItem 2. PropertiesItem 3. Legal ProceedingsItem 4. Mine Safety DisclosuresPart IIItem 5. Market For Registrant S Common Equity, Related Stockholder Matters and Issuer Purchases Of Equity SecuritiesItem 6. Selected Financial DataItem 7. Management S Discussion and Analysis Of Financial Condition and Results Of OperationsItem 7: Critical Accounting Policies and Use Of EstimatesItem 8: Financial StatementsItem 7A. Quantitative and Qualitative Disclosure About Market RiskItem 8. Financial Statements and Supplementary DataItem 9. Changes in and Disagreements with Accountants on Accounting and Financial DisclosureItem 9A. Controls and ProceduresItem 9B. Other InformationPart IIIItem 10. Directors, Executive Officers and Corporate GovernanceItem 11. Executive CompensationItem 12. Security Ownership Of Certain Beneficial Owners and Management and Related Stockholder MattersItem 13. Certain Relationships and Related Transactions, and Director IndependenceItem 14. Principal Accounting Fees and ServicesPart IVItem 15. Exhibits, Financial Statement SchedulesItem 16. Form 10-k Summary