Form 10-Q
UNITED STATES
SECURITIES AND EXCHANGE COMMISSION
Washington, DC 20549
FORM 10-Q
|
x
|
QUARTERLY REPORT PURSUANT TO SECTION 13 OR 15(d) OF THE SECURITIES EXCHANGE ACT OF 1934
|
For the quarterly period ended September 30, 2010
or
|
¨
|
TRANSITION REPORT PURSUANT TO SECTION 13 OR 15(d) OF THE SECURITIES EXCHANGE ACT OF 1934
|
For the transition period from
to
Commission file number 001-09718
The PNC Financial Services Group, Inc.
(Exact name of registrant as
specified in its charter)
|
|
|
|
|
Pennsylvania
|
|
25-1435979
|
|
(State or other jurisdiction of
incorporation or organization)
|
|
(I.R.S. Employer Identification No.)
|
One PNC Plaza, 249 Fifth Avenue, Pittsburgh, Pennsylvania 15222-2707
(Address of principal executive offices, including zip code)
(412) 762-2000
(Registrant’s telephone number, including area code)
(Former name, former address and former fiscal year, if changed since last report)
Indicate by check mark whether the registrant: (1) has filed all reports required to be filed by Section 13 or 15(d) of the
Securities Exchange Act of 1934 during the preceding 12 months (or for such shorter period that the registrant was required to file such reports), and (2) has been subject to such filing requirements for the past 90 days.
Yes
x
No
¨
Indicate by check mark whether the registrant has submitted electronically
and posted on its corporate Web site, if any, every Interactive Data File required to be submitted and posted pursuant to Rule 405 of Regulation S-T (§232.405 of this chapter) during the preceding 12 months (or for such shorter period that the
registrant was required to submit and post such files).
Yes
x
No
¨
Indicate by check mark whether the registrant is a large accelerated filer,
an accelerated filer, a non-accelerated filer, or a smaller reporting company. See the definitions of “large accelerated filer”, “accelerated filer” and “smaller reporting company” in Rule 12b-2 of the Exchange Act.
Large accelerated
filer
x
Accelerated
filer
¨
Non-accelerated
filer
¨
Smaller reporting company
¨
Indicate by check mark whether the registrant is a shell company (as defined in Rule 12b-2 of the Exchange Act).
Yes
¨
No
x
As of October 29, 2010, there were 525,796,405 shares of the
registrant’s common stock ($5 par value) outstanding.
The PNC Financial
Services Group, Inc.
Cross-Reference Index to Third Quarter 2010 Form 10-Q
F
INANCIAL
R
EVIEW
C
ONSOLIDATED
F
INANCIAL
H
IGHLIGHTS
T
HE
PNC F
INANCIAL
S
ERVICES
G
ROUP
, I
NC
.
|
|
|
|
|
|
|
|
|
|
|
|
|
|
|
|
|
|
|
Dollars in millions, except per share data
|
|
Three months ended September 30
|
|
|
Nine months ended September 30
|
|
|
Unaudited
|
|
2010
|
|
|
2009
|
|
|
2010
|
|
|
2009
|
|
|
F
INANCIAL
R
ESULTS
(a)
|
|
|
|
|
|
|
|
|
|
|
|
|
|
|
|
|
|
Revenue
|
|
|
|
|
|
|
|
|
|
|
|
|
|
|
|
|
|
Net interest income
|
|
$
|
2,215
|
|
|
$
|
2,224
|
|
|
$
|
7,029
|
|
|
$
|
6,737
|
|
|
Noninterest income
|
|
|
1,383
|
|
|
|
1,629
|
|
|
|
4,244
|
|
|
|
4,605
|
|
|
Total revenue
|
|
|
3,598
|
|
|
|
3,853
|
|
|
|
11,273
|
|
|
|
11,342
|
|
|
Noninterest expense
|
|
|
2,158
|
|
|
|
2,214
|
|
|
|
6,273
|
|
|
|
6,864
|
|
|
Pretax, pre-provision earnings (b)
|
|
$
|
1,440
|
|
|
$
|
1,639
|
|
|
$
|
5,000
|
|
|
$
|
4,478
|
|
|
Provision for credit losses
|
|
$
|
486
|
|
|
$
|
914
|
|
|
$
|
2,060
|
|
|
$
|
2,881
|
|
|
Income from continuing operations before noncontrolling interests
|
|
$
|
775
|
|
|
$
|
540
|
|
|
$
|
2,204
|
|
|
$
|
1,255
|
|
|
Income from discontinued operations, net of income taxes (c)
|
|
$
|
328
|
|
|
$
|
19
|
|
|
$
|
373
|
|
|
$
|
41
|
|
|
Net income
|
|
$
|
1,103
|
|
|
$
|
559
|
|
|
$
|
2,577
|
|
|
$
|
1,296
|
|
|
Net income attributable to common shareholders (d)
|
|
$
|
1,094
|
|
|
$
|
467
|
|
|
$
|
2,213
|
|
|
$
|
992
|
|
|
Diluted earnings per common share
|
|
|
|
|
|
|
|
|
|
|
|
|
|
|
|
|
|
Continuing operations
|
|
$
|
1.45
|
|
|
$
|
.96
|
|
|
$
|
3.52
|
|
|
$
|
2.08
|
|
|
Discontinued operations (c)
|
|
|
.62
|
|
|
|
.04
|
|
|
|
.72
|
|
|
|
.09
|
|
|
Net income
|
|
$
|
2.07
|
|
|
$
|
1.00
|
|
|
$
|
4.24
|
|
|
$
|
2.17
|
|
|
Cash dividends declared per common share
|
|
$
|
.10
|
|
|
$
|
.10
|
|
|
$
|
.30
|
|
|
$
|
.86
|
|
|
Total preferred dividends declared, including TARP
|
|
$
|
4
|
|
|
$
|
99
|
|
|
$
|
122
|
|
|
$
|
269
|
|
|
TARP Capital Purchase Program preferred dividends (d)
|
|
|
|
|
|
$
|
95
|
|
|
$
|
89
|
|
|
$
|
237
|
|
|
Impact of TARP Capital Purchase Program preferred dividends per diluted common share
|
|
|
|
|
|
$
|
.21
|
|
|
$
|
.17
|
|
|
$
|
.52
|
|
|
Redemption of TARP preferred stock discount accretion (d)
|
|
|
|
|
|
|
|
|
|
$
|
250
|
|
|
|
|
|
|
P
ERFORMANCE
R
ATIOS
|
|
|
|
|
|
|
|
|
|
|
|
|
|
|
|
|
|
From continuing operations
|
|
|
|
|
|
|
|
|
|
|
|
|
|
|
|
|
|
Noninterest income to total revenue
|
|
|
38
|
%
|
|
|
42
|
%
|
|
|
38
|
%
|
|
|
41
|
%
|
|
Efficiency
|
|
|
60
|
|
|
|
57
|
|
|
|
56
|
|
|
|
61
|
|
|
From net income
|
|
|
|
|
|
|
|
|
|
|
|
|
|
|
|
|
|
Net interest margin (e)
|
|
|
3.96
|
%
|
|
|
3.76
|
%
|
|
|
4.18
|
%
|
|
|
3.72
|
%
|
|
Return on:
|
|
|
|
|
|
|
|
|
|
|
|
|
|
|
|
|
|
Average common shareholders’ equity
|
|
|
15.12
|
|
|
|
8.70
|
|
|
|
10.98
|
|
|
|
6.77
|
|
|
Average assets
|
|
|
1.65
|
|
|
|
.81
|
|
|
|
1.30
|
|
|
|
.62
|
|
See page 53 for a glossary of certain terms used in this Report.
Certain prior period amounts have been reclassified to conform with the current period presentation, which we believe is more meaningful to readers of our consolidated financial statements.
|
(a)
|
The Executive Summary and Consolidated Income Statement Review portions of the Financial Review section of this Report provide information regarding items impacting the
comparability of the periods presented.
|
|
(b)
|
We believe that pretax, pre-provision earnings, a non-GAAP measure, is useful as a tool to help evaluate our ability to provide for credit costs through operations.
|
|
(c)
|
Includes results of operations for PNC Global Investment Servicing Inc. (GIS) through June 30, 2010 and the related after-tax gain on sale. We sold GIS effective
July 1, 2010, resulting in a gain of $639 million, or $328 million after taxes, recognized during the third quarter of 2010. See Sale of PNC Global Investment Servicing in the Executive Summary section of the Financial Review section of this
Report and Note 2 Divestiture in the Notes To Consolidated Financial Statements of this Report for additional information.
|
|
(d)
|
We redeemed the Series N (TARP) Preferred Stock on February 10, 2010. In connection with the redemption, we accelerated the accretion of the remaining issuance
discount on the Series N Preferred Stock and recorded a corresponding reduction in retained earnings of $250 million in the first quarter of 2010. This resulted in a one-time, noncash reduction in net income attributable to common shareholders and
related basic and diluted earnings per share.
|
|
(e)
|
Calculated as annualized taxable-equivalent net interest income divided by average earning assets. The interest income earned on certain earning assets is completely or
partially exempt from Federal income tax. As such, these tax-exempt instruments typically yield lower returns than taxable investments. To provide more meaningful comparisons of margins for all earning assets, we use net interest income on a
taxable-equivalent basis in calculating net interest margin by increasing the interest income earned on tax-exempt assets to make it fully equivalent to interest income earned on taxable investments. This adjustment is not permitted under GAAP in
the Consolidated Income Statement. The taxable-equivalent adjustments to net interest income for the three months ended September 30, 2010 and September 30, 2009 were $22 million and $16 million, respectively. The taxable-equivalent
adjustments to net interest income for the nine months ended September 30, 2010 and September 30, 2009 were $59 million and $47 million, respectively.
|
1
C
ONSOLIDATED
F
INANCIAL
H
IGHLIGHTS
(C
ONTINUED
)
(a)
|
|
|
|
|
|
|
|
|
|
|
|
|
|
|
Unaudited
|
|
September 30
2010
|
|
|
December 31
2009
|
|
|
September 30
2009
|
|
|
B
ALANCE
S
HEET
D
ATA
(dollars in millions, except per share
data)
|
|
|
|
|
|
|
|
|
|
|
|
|
|
Assets
|
|
$
|
260,133
|
|
|
$
|
269,863
|
|
|
$
|
271,407
|
|
|
Loans (b) (c)
|
|
|
150,127
|
|
|
|
157,543
|
|
|
|
160,608
|
|
|
Allowance for loan and lease losses (b)
|
|
|
5,231
|
|
|
|
5,072
|
|
|
|
4,810
|
|
|
Interest-earning deposits with banks (b)
|
|
|
415
|
|
|
|
4,488
|
|
|
|
1,129
|
|
|
Investment securities (b)
|
|
|
63,461
|
|
|
|
56,027
|
|
|
|
54,413
|
|
|
Loans held for sale (c)
|
|
|
3,275
|
|
|
|
2,539
|
|
|
|
3,509
|
|
|
Goodwill and other intangible assets
|
|
|
10,518
|
|
|
|
12,909
|
|
|
|
12,734
|
|
|
Equity investments (b)
|
|
|
10,137
|
|
|
|
10,254
|
|
|
|
8,684
|
|
|
Noninterest-bearing deposits
|
|
|
46,065
|
|
|
|
44,384
|
|
|
|
43,025
|
|
|
Interest-bearing deposits
|
|
|
133,118
|
|
|
|
142,538
|
|
|
|
140,784
|
|
|
Total deposits
|
|
|
179,183
|
|
|
|
186,922
|
|
|
|
183,809
|
|
|
Transaction deposits
|
|
|
128,197
|
|
|
|
126,244
|
|
|
|
121,631
|
|
|
Borrowed funds (b)
|
|
|
39,763
|
|
|
|
39,261
|
|
|
|
41,910
|
|
|
Shareholders’ equity
|
|
|
30,042
|
|
|
|
29,942
|
|
|
|
28,928
|
|
|
Common shareholders’ equity
|
|
|
29,394
|
|
|
|
22,011
|
|
|
|
20,997
|
|
|
Accumulated other comprehensive income (loss)
|
|
|
146
|
|
|
|
(1,962
|
)
|
|
|
(1,947
|
)
|
|
Book value per common share
|
|
|
55.91
|
|
|
|
47.68
|
|
|
|
45.52
|
|
|
Common shares outstanding (millions)
|
|
|
526
|
|
|
|
462
|
|
|
|
461
|
|
|
Loans to deposits
|
|
|
84
|
%
|
|
|
84
|
%
|
|
|
87
|
%
|
|
|
|
|
|
|
A
SSETS
U
NDER
A
DMINISTRATION
(billions)
|
|
|
|
|
|
|
|
|
|
|
|
|
|
Discretionary assets under management
|
|
$
|
105
|
|
|
$
|
103
|
|
|
$
|
104
|
|
|
Nondiscretionary assets under administration
|
|
|
101
|
|
|
|
102
|
|
|
|
113
|
|
|
Total assets under administration
|
|
|
206
|
|
|
|
205
|
|
|
|
217
|
|
|
|
|
|
|
|
C
APITAL
R
ATIOS
|
|
|
|
|
|
|
|
|
|
|
|
|
|
Tier 1 risk-based (d)
|
|
|
11.9
|
%
|
|
|
11.4
|
%
|
|
|
10.9
|
%
|
|
Tier 1 common
|
|
|
9.6
|
|
|
|
6.0
|
|
|
|
5.5
|
|
|
Total risk-based (d)
|
|
|
15.6
|
|
|
|
15.0
|
|
|
|
14.5
|
|
|
Leverage (d)
|
|
|
9.9
|
|
|
|
10.1
|
|
|
|
9.6
|
|
|
Common shareholders’ equity to assets
|
|
|
11.3
|
|
|
|
8.2
|
|
|
|
7.7
|
|
|
|
|
|
|
|
A
SSET
Q
UALITY
R
ATIOS
|
|
|
|
|
|
|
|
|
|
|
|
|
|
Nonperforming loans to total loans
|
|
|
3.22
|
%
|
|
|
3.60
|
%
|
|
|
3.19
|
%
|
|
Nonperforming assets to total loans and foreclosed and other assets
|
|
|
3.76
|
|
|
|
3.99
|
|
|
|
3.50
|
|
|
Nonperforming assets to total assets
|
|
|
2.18
|
|
|
|
2.34
|
|
|
|
2.08
|
|
|
Net charge-offs to average loans (for the three months ended) (annualized)
|
|
|
1.61
|
|
|
|
2.09
|
|
|
|
1.59
|
|
|
Allowance for loan and lease losses to total loans
|
|
|
3.48
|
|
|
|
3.22
|
|
|
|
2.99
|
|
|
Allowance for loan and lease losses to nonperforming loans (e)
|
|
|
108
|
|
|
|
89
|
|
|
|
94
|
|
|
(a)
|
The Executive Summary and Consolidated Balance Sheet Review portions of the Financial Review section of this Report provide information regarding items impacting the
comparability of the periods presented.
|
|
(b)
|
Amounts include consolidated variable interest entities. Some September 30, 2010 amounts include consolidated variable interest entities that we consolidated
effective January 1, 2010 based on guidance in ASC 810, Consolidation. See Consolidated Balance Sheet in Part I, Item 1 of this Report for additional information.
|
|
(c)
|
Amounts include items for which we have elected the fair value option. See Consolidated Balance Sheet in Part I, Item 1 of this Report for additional information.
|
|
(d)
|
The regulatory minimums are 4.0% for Tier 1 risk-based, 8.0% for Total risk-based, and 4.0% for Leverage capital ratios. The well-capitalized levels are 6.0% for Tier 1
risk-based, 10.0% for Total risk-based, and 5.0% for Leverage capital ratios.
|
|
(e)
|
The allowance for loan and lease losses includes impairment reserves attributable to purchased impaired loans. Nonperforming loans do not include purchased impaired
loans or loans held for sale.
|
2
F
INANCIAL
R
EVIEW
T
HE
PNC F
INANCIAL
S
ERVICES
G
ROUP
,
I
NC
.
This Financial Review, including the Consolidated Financial Highlights, should be read together with our unaudited
Consolidated Financial Statements and unaudited Statistical Information included elsewhere in this Report and with Items 6, 7, 8 and 9A of our 2009 Annual Report on Form 10-K (2009 Form 10-K). We have reclassified certain prior period amounts to
conform with the current period presentation, which we believe is more meaningful to readers of our consolidated financial statements. For information regarding certain business and regulatory risks, see the Risk Management section in this Financial
Review and Items 1A and 7 of our 2009 Form 10-K and Item 1A included in Part II of our second quarter 2010 report on Form 10-Q and in Part II of this Report. Also, see the Cautionary Statement Regarding Forward-Looking Information and Critical
Accounting Estimates And Judgments sections in this Financial Review for certain other factors that could cause actual results or future events to differ, perhaps materially, from historical performance and those anticipated in the forward-looking
statements included in this Report. See Note 19 Segment Reporting in the Notes To Consolidated Financial Statements included in Part I, Item 1 of this Report for a reconciliation of total business segment earnings to total PNC consolidated net
income from continuing operations before noncontrolling interests as reported on a generally accepted accounting principles (GAAP) basis.
E
XECUTIVE
S
UMMARY
T
HE
PNC F
INANCIAL
S
ERVICES
G
ROUP
, I
NC
.
PNC is one of the largest diversified financial services companies in the United States and is headquartered in Pittsburgh, Pennsylvania.
PNC has businesses engaged in retail banking, corporate and institutional banking, asset management, and residential mortgage banking, providing many of
its products and services nationally and others in PNC’s primary geographic markets located in Pennsylvania, Ohio, New Jersey, Michigan, Maryland, Illinois, Indiana, Kentucky, Florida, Virginia, Missouri, Delaware, Washington, D.C., and
Wisconsin. PNC also provides certain products and services internationally.
K
EY
S
TRATEGIC
G
OALS
We manage our company for the long term and are focused on returning to a moderate risk profile while maintaining
strong capital and liquidity positions, investing in our markets and products, and embracing our corporate responsibility to the communities where we do business.
Our strategy to enhance shareholder value centers on driving pre-tax, pre-provision earnings in excess of credit costs by achieving growth in revenue from our balance sheet and diverse business mix that
exceeds growth in expenses controlled through disciplined cost management. The primary drivers of revenue growth are the acquisition, expansion and retention of customer relationships. We strive to expand our customer base by offering convenient
banking options and leading technology solutions, providing a broad range of fee-based and credit products and services, focusing on customer service, and through a significantly enhanced branding initiative. We may also grow revenue through
appropriate and targeted acquisitions and, in certain businesses, by expanding into new geographical markets.
We are focused on our
strategies for quality growth. We are committed to re-establishing a moderate risk profile characterized by disciplined credit management and limited exposure to earnings volatility resulting from interest rate
fluctuations and the shape of the interest rate yield curve. We made substantial progress in transitioning our balance sheet throughout 2009 and in the first nine months of 2010, working to
return to our moderate risk philosophy throughout our expanded franchise. Our actions have created a well- positioned balance sheet, strong bank level liquidity and investment flexibility to adjust, where appropriate and permissible, to changing
interest rates and market conditions.
We also continue to be focused on building capital in the current environment characterized by economic
and regulatory uncertainty. See the Funding and Capital Sources section of the Consolidated Balance Sheet Review section and the Liquidity Risk Management section of this Financial Review.
S
ALE
OF
PNC G
LOBAL
I
NVESTMENT
S
ERVICING
On July 1, 2010, we sold PNC Global Investment Servicing Inc. (GIS), a leading provider of processing, technology and business intelligence services to asset managers, broker-dealers and financial
advisors worldwide, for $2.3 billion in cash pursuant to a definitive agreement entered into on February 2, 2010. The gain recorded in the third quarter of 2010 related to this sale was $639 million, or $328 million after taxes.
Results of operations of GIS through June 30, 2010 and the related after-tax gain on sale in the third quarter of 2010 are presented as income from
discontinued operations, net of income taxes, on our Consolidated Income Statement for the periods presented in this Report. Once we entered into the sales agreement, GIS was no longer a reportable business segment. Further information regarding the
GIS sale is included in Note 2 Divestiture in our Notes To Consolidated Financial Statements in this Report.
N
ATIONAL
C
ITY
I
NTEGRATION
C
OSTS
A summary of pretax merger and integration costs in connection
with our December 31, 2008 acquisition of National City Corporation (National City) follows.
3
National City Integration Costs
|
|
|
|
|
|
|
|
|
|
|
|
|
|
|
In millions
|
|
Third
Quarter
|
|
|
First
Nine
Months
|
|
|
Full
Year
|
|
|
2010
|
|
$
|
96
|
|
|
$
|
309
|
|
|
$
|
370
|
(a)
|
|
2009
|
|
$
|
89
|
|
|
$
|
266
|
|
|
$
|
421
|
|
|
2008
|
|
|
—
|
|
|
|
—
|
|
|
$
|
575
|
(b)
|
|
(b)
|
Includes $504 million conforming provision for credit losses.
|
The National City transaction is expected to result in the reduction of more than $1.8 billion of combined company annualized noninterest expense by the end of 2010 through the elimination of operational
and administrative redundancies. We have completed the customer and branch conversions to our technology platforms and have integrated the businesses and operations of National City with those of PNC.
R
ECENT
M
ARKET
AND
I
NDUSTRY
D
EVELOPMENTS
The economic turmoil that began in the middle of 2007 and continued through most of 2008 and 2009 has now settled into a slow economic recovery with, at
this time, somewhat uncertain prospects. This has been accompanied by dramatic changes in the competitive landscape of the financial services industry and a wholesale reformation of the legislative and regulatory landscape with the passage of the
Dodd-Frank Wall Street Reform and Consumer Protection Act (“Dodd-Frank”), which was signed into law by President Obama on July 21, 2010.
Dodd-Frank is extensive, complicated and comprehensive legislation that impacts practically all aspects of a banking organization. Dodd-Frank will negatively impact revenue and increase both the direct
and indirect costs of doing business for PNC, as it includes provisions that could increase regulatory fees and deposit insurance assessments and impose heightened capital and prudential standards, while at the same time impacting the nature and
costs of PNC’s businesses, including consumer lending, private equity investment, derivatives transactions, interchange fees on debit card transactions, and asset securitizations.
Until such time as the regulatory agencies issue proposed and final regulations implementing the numerous provisions of Dodd-Frank, a process that will extend at least over the next year and might last
several years, PNC will not be able to fully assess the impact the legislation will have on its businesses. However, we believe that the expected changes will be manageable for PNC and will have a smaller impact on us than many of our larger peers.
Items 1 and 7 of our 2009 Form 10-K include information regarding efforts beginning in late 2008 by the Federal government, including the US
Congress, the US Department of the Treasury, the Federal Reserve, the FDIC, and the Securities and Exchange Commission, to stabilize and restore confidence in the financial services industry that have impacted and will likely continue to impact PNC
and our
stakeholders. These efforts, which will continue to evolve, include the Emergency Economic Stabilization Act of 2008, the American Recovery and Reinvestment Act of 2009, Dodd-Frank and other
legislative, administrative and regulatory initiatives.
Included in these efforts are evolving regulatory capital standards for financial
institutions. Dodd-Frank requires the Federal Reserve Board to establish capital requirements that would, among other things, eliminate the Tier 1 treatment of trust preferred securities following a phase-in period expected to begin in 2013.
Evolving standards also include the so-called “Basel III” initiatives that are part of the Basel II effort by international banking supervisors to update the original international bank capital accord (Basel I), which has been in effect
since 1988. The recent Basel III capital initiative, which has the support of US banking regulators, includes heightened capital requirements for major banking institutions in terms of both higher quality capital and higher regulatory capital
ratios. Basel III capital standards will require implementing regulations by the banking regulators and are expected to include a phase-in period beginning in 2013 and ending January 1, 2019.
Residential Mortgage Foreclosure Matters
Beginning in the third quarter of 2010, mortgage foreclosure documentation practices among US financial institutions have received heightened attention by regulators and the media. PNC’s market share
for residential servicing is less than 2%. The vast majority of our servicing business is on behalf of other investors, principally the Federal Home Loan Mortgage Corporation (FHLMC) and the Federal National Mortgage Association (FNMA). Regardless,
we have been conducting an internal review of our foreclosure procedures. Based upon our review thus far, we believe that PNC has systems designed to ensure that no foreclosure proceeds unless the loan is genuinely in default. On average, our
residential mortgage loans in foreclosure are more than one year delinquent.
Similar to other banks, we have identified issues regarding some
of our documentation. Accordingly, we are delaying pursuing individual foreclosures when we commenced our review until we are confident that any pending documentation issues have been resolved. We are currently proceeding with new foreclosures under
enhanced procedures designed as part of this review to minimize the risk of errors related to the processing of documentation in foreclosure cases.
For additional information, please see Note 17 Legal Proceedings and Note 18 Commitments and Guarantees in our Notes To Consolidated Financial Statements in Part I of this Report and Item 1A Risk
Factors in Part II of this Report.
TARP Capital Purchase Program
We redeemed the Series N (TARP) Preferred Stock on February 10, 2010. In connection with the redemption, we accelerated the accretion of the remaining issuance discount on the Series N Preferred
Stock and recorded a corresponding
4
reduction in retained earnings of $250 million in the first quarter of 2010. This resulted in a one-time, noncash reduction in net income attributable to common shareholders and related basic and
diluted earnings per share. See Repurchase of Outstanding TARP Preferred Stock and Sale by US Treasury of TARP Warrant in Note 14 Total Equity And Other Comprehensive Income in the Notes To Consolidated Financial Statements in this Report for
additional information.
FDIC Temporary Liquidity Guarantee Program
The FDIC’s TLGP is designed to strengthen confidence and encourage liquidity in the banking system by:
|
|
•
|
|
Guaranteeing newly issued senior unsecured debt of eligible institutions, including FDIC-insured banks and thrifts, as well as certain holding
companies (TLGP-Debt Guarantee Program), and
|
|
|
•
|
|
Providing full deposit insurance coverage for non-interest bearing transaction accounts in FDIC-insured institutions, regardless of the dollar amount
(TLGP-Transaction Account Guarantee Program).
|
PNC did not issue any securities under the TLGP-Debt Guarantee Program during
the first nine months of 2010.
From October 14, 2008 through December 31, 2009, PNC Bank, National Association (PNC Bank, N.A.)
participated in the TLGP-Transaction Account Guarantee Program. Beginning January 1, 2010, PNC Bank, N.A. is no longer participating in this program, but Dodd-Frank extends the program for all banks for two years, beginning December 31,
2010.
Public-Private Investment Fund Programs (PPIFs)
PNC did not participate in these programs during the first nine months of 2010.
Home
Affordable Modification Program (HAMP)
PNC began participating in HAMP for GSE mortgages in May 2009 and for non-GSE mortgages in July
2009, and recently signed the agreements to begin participating in the Second Lien Program. HAMP is scheduled to terminate as of December 31, 2012.
Home Affordable Refinance Program (HARP)
PNC began participating in HARP in May 2009. The
program terminated as of June 10, 2010.
As noted above, Dodd-Frank and its implementation, as well as other statutory and regulatory
initiatives that will be ongoing, will introduce numerous regulatory changes over the next several years. While we believe that we are well
positioned to navigate through this process, we cannot predict the ultimate impact of these actions on PNC’s business plans and strategies.
K
EY
F
ACTORS
A
FFECTING
F
INANCIAL
P
ERFORMANCE
Our financial performance is substantially affected by several external factors outside of our control including the following:
|
|
•
|
|
General economic conditions, including the speed and stamina of the moderate economic recovery that began last year in general and on our customers in
particular,
|
|
|
•
|
|
The level of, and direction, timing and magnitude of movement in, interest rates and the shape of the interest rate yield curve,
|
|
|
•
|
|
The functioning and other performance of, and availability of liquidity in, the capital and other financial markets,
|
|
|
•
|
|
Loan demand, utilization of credit commitments and standby letters of credit, and asset quality,
|
|
|
•
|
|
Customer demand for other products and services,
|
|
|
•
|
|
Changes in the competitive and regulatory landscape and in counterparty creditworthiness and performance as the financial services industry
restructures in the current environment,
|
|
|
•
|
|
The impact of the extensive reforms enacted in the Dodd-Frank legislation and other legislative, regulatory and administrative initiatives, including
those outlined above, and
|
|
|
•
|
|
The impact of market credit spreads on asset valuations.
|
In addition, our success will depend, among other things, upon:
|
|
•
|
|
Further success in the acquisition, growth and retention of customers,
|
|
|
•
|
|
Continued development of the geographic markets related to our recent acquisitions, including full deployment of our product offerings,
|
|
|
•
|
|
A sustained focus on expense management, and creating positive pre-tax, pre-provision earnings,
|
|
|
•
|
|
Managing the distressed assets portfolio and other impaired assets,
|
|
|
•
|
|
Improving our overall asset quality and continuing to meet evolving regulatory capital standards,
|
|
|
•
|
|
Continuing to maintain and grow our deposit base as a low-cost funding source,
|
|
|
•
|
|
Prudent risk and capital management related to our efforts to return to our desired moderate risk profile, and
|
|
|
•
|
|
Actions we take within the capital and other financial markets.
|
5
S
UMMARY
F
INANCIAL
R
ESULTS
|
|
|
|
|
|
|
|
|
|
|
|
|
|
|
|
|
|
|
|
|
Three months ended
September 30
|
|
|
Nine months ended
September 30
|
|
|
|
|
2010
|
|
|
2009
|
|
|
2010
|
|
|
2009
|
|
|
Net income (millions)
|
|
$
|
1,103
|
|
|
$
|
559
|
|
|
$
|
2,577
|
|
|
$
|
1,296
|
|
|
Diluted earnings per common share
|
|
|
|
|
|
|
|
|
|
|
|
|
|
|
|
|
|
Continuing operations
|
|
$
|
1.45
|
|
|
$
|
.96
|
|
|
$
|
3.52
|
|
|
$
|
2.08
|
|
|
Discontinued operations
|
|
|
.62
|
|
|
|
.04
|
|
|
|
.72
|
|
|
|
.09
|
|
|
Net income
|
|
$
|
2.07
|
|
|
$
|
1.00
|
|
|
$
|
4.24
|
|
|
$
|
2.17
|
|
|
Return from net income on:
|
|
|
|
|
|
|
|
|
|
|
|
|
|
|
|
|
|
Average common shareholders’ equity
|
|
|
15.12
|
%
|
|
|
8.70
|
%
|
|
|
10.98
|
%
|
|
|
6.77
|
%
|
|
Average assets
|
|
|
1.65
|
%
|
|
|
.81
|
%
|
|
|
1.30
|
%
|
|
|
.62
|
%
|
Income Statement Highlights for the Third Quarter
|
|
•
|
|
Strong earnings for the third quarter of 2010 reflected an improvement in the provision for credit losses compared with the third quarter of 2009 as we
continue to focus on returning to a moderate risk profile. Pretax pre-provision earnings of $1.4 billion significantly exceeded the provision for credit losses of $.5 billion.
|
|
|
•
|
|
Net interest income declined $220 million to $2.2 billion and the net interest margin fell 39 basis points to 3.96% compared with the second quarter of
2010 due to lower purchase accounting accretion, loan sales, continued soft loan demand and the low interest rate environment.
|
|
|
•
|
|
Noninterest income totaled $1.4 billion for the third quarter and was derived from diversified sources. The $246 million decline compared with the
third quarter of 2009 was mainly due to a decrease in overdraft charges, the reduction in value of commercial mortgage servicing rights and the third quarter 2009 gain on sales of commercial loans.
|
|
|
•
|
|
The provision for credit losses declined to $486 million in the third quarter compared with $914 million in the third quarter of 2009 reflecting
overall credit quality improvement driven by improving credit migration and actions taken to reduce exposure levels.
|
|
|
•
|
|
We continued our disciplined expense management while investing in our businesses. Noninterest expense of $2.2 billion declined $56 million, or 3%,
compared with the third quarter of 2009 primarily due to higher acquisition-related cost savings.
|
|
|
•
|
|
We achieved acquisition cost savings of $1.7 billion on an annualized basis in the third quarter of 2010, well ahead of the original target amount and
schedule, and are on track to meet our higher goal of $1.8 billion by the end of 2010.
|
|
|
•
|
|
The July 1, 2010 sale of GIS resulted in an after-tax gain of $328 million reported in discontinued operations. Goodwill and other intangible
assets net of deferred income taxes removed from the Consolidated Balance Sheet as a result of the transaction were $1.1 billion.
|
Credit Quality Highlights
|
|
•
|
|
Overall credit quality showed continued signs of improvement during the third quarter of 2010. Net charge-offs to average loans improved to 1.61% in
the third quarter from 2.18% in the second quarter of 2010. Nonperforming assets declined $235 million to $5.7 billion as of September 30, 2010. Delinquencies continued to improve during the quarter. The allowance for loan and lease losses was
$5.2 billion, or 3.48% of total loans and 108% of nonperforming loans, as of September 30, 2010.
|
Balance Sheet
Highlights
|
|
•
|
|
PNC remains committed to responsible lending to support economic growth. Loans and commitments originated and renewed totaled approximately $39 billion
in the third quarter and $112 billion for the first nine months of 2010, including $2.6 billion of small business loans. Total loans were $150.1 billion at September 30, 2010 and decreased $4.2 billion compared with June 30, 2010 primarily
due to loan repayments, dispositions and net charge-offs that exceeded customer loan demand.
|
|
|
•
|
|
Total deposits were $179.2 billion at September 30, 2010. Transaction deposits grew $2.5 billion, or 2%, while certificates of deposit declined by
$2.0 billion, or 5%, compared with June 30, 2010 further reducing the average rate paid on deposits by 3 basis points to .68% in the third quarter.
|
|
|
•
|
|
PNC’s well-positioned balance sheet reflected core funding with a loan to deposit ratio of 84% at September 30, 2010 and a strong bank
liquidity position to support growth.
|
|
|
•
|
|
Investment securities of $63.5 billion at September 30, 2010 increased by 18% compared with June 30, 2010 as excess liquidity was invested in
short duration, high quality securities.
|
|
|
•
|
|
The Tier 1 common capital ratio was 9.6% at September 30, 2010, up from 8.3% at June 30, 2010 and 6.0% at December 31, 2009.
|
Our Consolidated Income Statement and Consolidated Balance Sheet Review sections of this Financial Review describe in
greater detail the various items that impacted our results for the third quarter and first nine months of 2010 and 2009.
6
A
VERAGE
C
ONSOLIDATED
B
ALANCE
S
HEET
H
IGHLIGHTS
Various seasonal and other factors
impact our period-end balances whereas average balances are generally more indicative of underlying business trends apart from the impact of acquisitions, divestitures and consolidations of variable interest entities.
The Consolidated Balance Sheet Review section of this Financial Review provides information on changes in selected Consolidated Balance Sheet categories
at September 30, 2010 compared with December 31, 2009.
Total average assets were $265.4 billion for the first nine months of 2010
compared with $278.6 billion for the first nine months of 2009.
Average interest-earning assets were $225.1 billion for the first nine months
of 2010, compared with $241.0 billion in the first nine months of 2009. Decreases of $13.1 billion in loans and $6.5 billion in other interest-earning assets, partially offset by a $5.3 billion increase in investment securities, drove the decrease
in average interest-earning assets.
The decrease in average total loans reflected a decline in commercial loans of $8.6 billion, commercial
real estate loans of $4.1 billion and residential mortgage loans of $3.3 billion, partially offset by an increase of $2.9 billion in consumer loans.
Loans represented 69% of average interest-earning assets for the first nine months of 2010 and 70% for the first nine months of 2009.
Average securities available for sale increased $2.0 billion, to $49.4 billion, in the first nine months of 2010 compared with the first nine months of 2009. Average US Treasury and government agencies
securities increased $4.2 billion while average other debt securities increased $1.4 billion in the comparison. These increases were partially offset by a decline of $2.9 billion in average non-agency residential mortgage-backed securities and a
decline of $.8 billion in commercial mortgage-backed securities.
Average securities held to maturity increased $3.3 billion, to $7.2 billion,
in the first nine months of 2010 compared with the first nine months of 2009. The increase reflected purchases of asset-backed and non-agency commercial mortgage-backed securities, the transfer of securities from the available for sale portfolio,
and the impact of the Market Street Funding LLC (Market Street) consolidation effective January 1, 2010.
Total investment securities
comprised 25% of average interest-earning assets for the first nine months of 2010 and 21% for the first nine months of 2009.
Average
noninterest-earning assets totaled $40.3 billion in the first nine months of 2010 compared with $37.6 billion in the prior year period.
Average total deposits were $182.0 billion for the first nine months of 2010 compared with $191.2 billion
for the first nine months of 2009. Average deposits declined from the prior year period primarily as a result of decreases in retail certificates of deposit and other time deposits, which were partially offset by an increase in transaction deposits.
Total deposits at September 30, 2010 were $179.2 billion compared with $186.9 billion at December 31, 2009 and are further discussed within the Consolidated Balance Sheet Review section of this Report.
Average total deposits represented 69% of average total assets for both the first nine months of 2010 and the first nine months of 2009.
Average transaction deposits were $127.2 billion for the first nine months of 2010 compared with $118.7 billion for the first nine months of 2009.
Average borrowed funds were $40.8 billion for the first nine months of 2010 compared with $45.7 billion for the first nine months of 2009. A
$6.7 billion decline in Federal Home Loan Bank borrowings drove the decline in the comparison, partially offset by higher average commercial paper borrowings that reflected the consolidation of Market Street. Total borrowed funds at
September 30, 2010 were $39.8 billion compared with $39.3 billion at December 31, 2009 and are further discussed within the Consolidated Balance Sheet Review section of this Report. In addition, the Liquidity Risk Management portion of the
Risk Management section of this Report includes additional information regarding our sources and uses of borrowed funds.
L
INE
OF
B
USINESS
H
IGHLIGHTS
We have six reportable business segments:
|
|
•
|
|
Corporate & Institutional Banking
|
|
|
•
|
|
Residential Mortgage Banking
|
|
|
•
|
|
Distressed Assets Portfolio
|
Total business segment earnings were $2.0 billion for the first nine months of 2010 and $1.8 billion for the first nine months of 2009. Highlights of
results for the first nine months and third quarter of 2010 and 2009 are included below. The Business Segments Review section of this Financial Review includes a Results of Business-Summary table and further analysis of our business segment results
over the first nine months of 2010 and 2009 including presentation differences from Note 19 Segment Reporting.
We provide a reconciliation of
total business segment earnings to PNC consolidated income from continuing operations before noncontrolling interests as reported on a GAAP basis in Note 19 Segment Reporting.
7
Retail Banking
Retail Banking earned $97 million for the first nine months of 2010 compared with earnings of $161 million for the same period a year ago. Earnings
declined from the prior year due primarily due to lower revenues as a result of lower interest credits assigned to deposits and a decline in fees which were partially offset by well-managed expenses. Retail Banking continued to maintain its focus on
growing customers and deposits, customer and employee satisfaction, investing in the business for future growth, as well as, disciplined expense management during this period of market and economic uncertainty.
Retail Banking had a loss of $7 million in the third quarter of 2010 compared with earnings of $50 million in the third quarter of 2009. Earnings
decreased from the prior year quarter due to a decline in fees, a higher provision for credit losses and lower net interest income.
Corporate & Institutional Banking
Corporate & Institutional Banking earned $1.2 billion in the first nine months of 2010 compared with $775 million in the first nine months of 2009. Significantly higher earnings for the first
nine months of 2010 reflected a lower provision for credit losses and lower noninterest expense which more than offset declines in net interest income and noninterest income compared with the 2009 period.
Corporate & Institutional Banking earned $427 million in the third quarter of 2010 compared with $309 million in the third quarter of 2009. The
increase in earnings compared with third quarter 2009 was primarily due to a lower provision for credit losses driven by reduced exposure levels along with positive credit migration.
Asset Management Group
Asset Management Group earned $112 million for the first nine
months of 2010 compared with $82 million for the same period in 2009. Assets under administration were $206 billion at September 30, 2010 and $217 billion at September 30, 2009. The first nine months of 2010 reflected a lower provision for
credit losses, lower expenses from disciplined expense management and higher noninterest income. These improvements were partially offset by a decrease in net interest income from lower yields on loans.
Earnings for Asset Management Group totaled $44 million for the third quarter of 2010 compared with $35 million for the third quarter of 2009. The
increase in earnings from the prior year quarter reflected a benefit from the provision for credit losses and lower expenses that more than offset a decline in revenue.
Residential Mortgage Banking
Residential Mortgage Banking earned $272 million for the first nine months of 2010 compared with $410 million in the first nine months of 2009. Earnings decreased from the first nine months of 2009
primarily due to reduced loan sales revenue and lower net hedging gains on mortgage servicing rights, partially offset by lower noninterest expense.
Residential Mortgage Banking earned $98 million in the third quarter of 2010 compared with $91 million for the third quarter of 2009. Higher net hedging gains on mortgage servicing rights and lower
expenses in the 2010 quarter more than offset a decline in net interest income and a higher provision for credit losses.
BlackRock
Our BlackRock business segment earned $253 million in the first nine months of 2010 and $151 million in the first nine months of 2009.
Third quarter 2010 business segment earnings from BlackRock were $99 million compared with $74 million in the third quarter of 2009. The benefits of BlackRock’s December 2009 acquisition of Barclays Global Investors (BGI) and improved capital
markets conditions contributed to higher earnings at BlackRock.
Distressed Assets Portfolio
The Distressed Assets Portfolio earned $8 million for the first nine months of 2010 compared with $172 million for the first nine months of 2009. A $288
million increase in the provision for credit losses was the primary factor driving the decrease in earnings in the comparison.
For the third
quarter of 2010, Distressed Assets Portfolio had earnings of $17 million compared with $14 million for the third quarter of 2009. Higher net interest income and lower expenses more than offset the impact of lower noninterest income and a higher
provision for credit losses.
Other
“Other” reported earnings of $232 million for the first nine months of 2010 compared with a net loss of $496 million for the first nine months of 2009. The net loss for the 2009 period included
higher other-than-temporary impairment (OTTI) charges compared with the 2010 period, alternative investment writedowns, a $133 million special FDIC assessment, and equity management losses.
“Other” reported earnings of $97 million for the third quarter of 2010 compared with a net loss of $33 million for the third quarter of 2009.
8
C
ONSOLIDATED
I
NCOME
S
TATEMENT
R
EVIEW
Our Consolidated Income Statement is presented in Part I, Item 1 of this Report.
Net income for the first nine months of 2010 was $2.6 billion compared with $1.3 billion for the first nine months of 2009. Net income for the third quarter of 2010 was $1.1 billion compared with $.6
billion for the third quarter of 2009. Total revenue for the first nine months of both 2010 and 2009 was $11.3 billion. Total revenue for the third quarter of 2010 decreased 7% to $3.6 billion from $3.9 billion for the third quarter of 2009.
N
ET
I
NTEREST
I
NCOME
AND
N
ET
I
NTEREST
M
ARGIN
|
|
|
|
|
|
|
|
|
|
|
|
|
|
|
|
|
|
|
|
|
Three months ended
September 30
|
|
|
Nine months ended
September 30
|
|
|
Dollars in millions
|
|
2010
|
|
|
2009
|
|
|
2010
|
|
|
2009
|
|
|
Net interest income
|
|
$
|
2,215
|
|
|
$
|
2,224
|
|
|
$
|
7,029
|
|
|
$
|
6,737
|
|
|
Net interest margin
|
|
|
3.96
|
%
|
|
|
3.76
|
%
|
|
|
4.18
|
%
|
|
|
3.72
|
%
|
Changes in net interest income and margin result from the interaction of the volume and composition of interest-earning assets and related yields, interest-bearing liabilities and related rates paid, and
noninterest-bearing sources of funding. See the Statistical Information – Average Consolidated Balance Sheet And Net Interest Analysis section of this Report for additional information.
The increase in net interest income for the first nine months of 2010 compared with the first nine months of 2009 resulted primarily from the impact of lower deposit and borrowing costs somewhat offset by
lower loan volume and lower revenue from our investment securities portfolio. Our deposit strategy included the retention and repricing at lower rates of relationship-based certificates of deposit and the planned run off of maturing non-relationship
certificates of deposit and brokered deposits.
The net interest margin was 4.18% for the first nine months of 2010 and 3.72% for the first
nine months of 2009. The following factors impacted the comparison:
|
|
•
|
|
A decrease in the rate accrued on interest-bearing liabilities of 57 basis points. The rate accrued on interest-bearing deposits, the largest
component, decreased 52 basis points.
|
|
|
•
|
|
A decrease in the yield on interest-earning assets of 3 basis points. The yield on loans, the largest portion of our interest-earning assets, increased
8 basis points but was more than offset by the 111 basis point decline in yield on investment securities.
|
|
|
•
|
|
The benefit of noninterest-bearing sources of funding decreased 8 basis points primarily due to the decline in interest rates.
|
The net interest margin was 3.96% for the third quarter of 2010 and 3.76% for the third quarter of 2009.
The following factors impacted the comparison:
|
|
•
|
|
A decrease in the rate accrued on interest-bearing liabilities of 29 basis points. The rate accrued on interest-bearing deposits, the largest
component, decreased 36 basis points.
|
|
|
•
|
|
A 6 basis point decrease in the yield on interest-earning assets. This decrease was driven by a 105 basis point decline in the yield on investment
securities, partially offset by higher yields on loans.
|
|
|
•
|
|
In addition, the benefit of noninterest-bearing sources of funding decreased 3 basis points primarily due to the decline in interest rates.
|
We expect net interest income and margin to trend down in the fourth quarter of 2010 but at a slower pace than we
experienced from the second quarter of 2010 to the third quarter of 2010. We believe that lower purchase accounting accretion, continued soft loan demand and the low interest rate environment will contribute to lower net interest income and margin
in the fourth quarter of 2010 compared with the third quarter of 2010.
N
ONINTEREST
I
NCOME
Summary
Noninterest income totaled $4.2 billion for the first nine months of 2010, a decline of $361 million or 8% compared with the first nine months of 2009.
Decreases in residential mortgage loan sales revenue, the value of commercial mortgage servicing rights and net hedging gains on residential mortgage servicing rights, along with lower service charges on deposits, were the primary factors in the
comparison. Partially offsetting these items were lower OTTI charges and higher asset management fees.
Noninterest income totaled $1.4
billion for the third quarter of 2010, a decline of $246 million or 15% compared with the third quarter of 2009. This decrease was mainly due to the decrease in overdraft charges, the reduction in value of commercial mortgage servicing rights and
third quarter 2009 gains on sales of commercial loans.
Additional Analysis
Asset management revenue was $751 million in the first nine months of 2010 compared with $639 million in the first nine months of 2009. Asset management
revenue was $249 million in the third quarter of 2010 compared with $242 million in the third quarter of 2009. These increases reflected higher equity earnings from our BlackRock investment, improved equity markets and client growth. Discretionary
assets under management at September 30, 2010 totaled $105 billion compared with $104 billion at September 30, 2009.
For the first
nine months of 2010, consumer services fees totaled $939 million compared with $975 million in the first nine months of 2009. Consumer services fees were $328
9
million for the third quarter of 2010 compared with $330 million for the third quarter of 2009. Lower consumer service fees for 2010 in both comparisons reflected lower brokerage fees and the
impact of the consolidation of the securitized credit card portfolio, partially offset by higher volume-related transaction fees. As further discussed in the Retail Banking section of the Business Segments Review portion of this Financial Review, we
expect that the Credit CARD Act of 2009 will negatively impact full year 2010 revenues by approximately $75 million, a portion of which will be in the fourth quarter of 2010.
Corporate services revenue totaled $712 million in the first nine months of 2010 and $761 million in the first nine months of 2009. Corporate services revenue declined in the third quarter of 2010 to $183
million, compared with $252 million for the third quarter of 2009. The declines in both comparisons were largely the result of a reduction in the value of commercial mortgage servicing rights largely driven by lower interest rates, partially offset
by higher merger and acquisition advisory and ancillary commercial mortgage servicing fees. Corporate services fees include the noninterest component of treasury management fees, which continued to be a strong contributor to revenue.
Residential mortgage revenue totaled $542 million in the first nine months of 2010 compared with $883 million in the first nine months of 2009. Third
quarter 2010 residential mortgage revenue totaled $216 million compared with $207 million in the third quarter of 2009. The nine-month decline reflected reduced loan sales revenue given the strong loan origination refinance volume in 2009 and lower
net hedging gains on mortgage servicing rights. Higher net hedging gains on mortgage servicing rights drove the third quarter 2010 increase.
Service charges on deposits totaled $573 million for the first nine months of 2010 and $714 million for the first nine months of 2009. Service charges on
deposits totaled $164 million for the third quarter of 2010 compared with $248 million for the third quarter of 2009. The decrease in both instances was due to lower overdraft charges and required branch divestitures in the third quarter of 2009. As
further discussed in the Retail Banking section of the Business Segments Review portion of this Financial Review, we expect that the new Regulation E rules related to overdraft charges will negatively impact our fourth quarter 2010 revenue by an
estimated $100 million, or approximately $55 million more than its impact on the third quarter of 2010.
Net gains on sales of securities
totaled $358 million for the first nine months of 2010 and $406 million for the first nine months of 2009. Third quarter net gains on sales of securities were $121 million in 2010 and $168 million in 2009.
The net credit component of OTTI of securities recognized in earnings was a loss of $281 million in the first nine months of
2010, including $71 million in the third quarter, compared with losses of $433 million and $129 million, respectively, for the same periods in 2009.
Other noninterest income totaled $650 million for the first nine months of 2010 compared with $660 million for the first nine months of 2009. Other
noninterest income for the third quarter of 2010 totaled $193 million compared with $311 million for the third quarter of 2009. The third quarter of 2009 included $88 million of gains on sales of loans.
Other noninterest income typically fluctuates from period to period depending on the nature and magnitude of transactions completed. Further details
regarding our trading activities are included in the Market Risk Management – Trading Risk portion of the Risk Management section of this Financial Review, further details regarding private equity and alternative investments are included in the
Market Risk Management-Equity And Other Investment Risk section, and further details regarding gains or losses related to our equity investment in BlackRock are included in the Business Segments Review section.
We believe that as the economy recovers, there will be greater opportunities for growth in client-related fee-based revenue.
P
RODUCT
R
EVENUE
In addition to credit and deposit products for commercial customers, Corporate & Institutional Banking offers other services, including treasury management, commercial real estate, and capital
markets-related products and services that are marketed by several businesses primarily to commercial customers.
Treasury management revenue,
which includes fees as well as net interest income from customer deposit balances, totaled $919 million for the first nine months of 2010, an increase of $78 million or 9% compared with the first nine months of 2009. For the third quarter of 2010,
treasury management revenue was $319 million, an increase of $38 million or 14% compared with the third quarter of 2009. These increases were primarily related to deposit growth and continued growth in legacy offerings such as purchasing cards and
lockbox as well as services provided to the Federal government and healthcare customers.
Revenue from capital markets-related products and
services totaled $411 million in the first nine months of 2010 compared with $346 million in the first nine months of 2009, an increase of $65 million or 19%. Higher underwriting, mergers and acquisition advisory fees, and syndications fees
contributed to the improved results. Third quarter 2010 revenue was $119 million compared with $155 million for the third quarter of 2009, a decline of $36 million or 23%. The decline was driven by lower loan sale gains partially offset by increased
mergers and acquisition advisory fees and syndications fees.
10
Commercial mortgage banking
activities include revenue derived from commercial mortgage servicing (including net interest income and noninterest income from loan servicing and ancillary services) and revenue derived from commercial mortgage loans intended for sale and related
hedges (including loan origination fees, net interest income, valuation adjustments and gains or losses on sales).
Commercial mortgage
banking activities resulted in revenue of $146 million in the first nine months of 2010, a decrease of $206 million or 59% compared with the first nine months of 2009. For the third quarter of 2010, losses from commercial mortgage banking activities
totaled $16 million compared with third quarter 2009 revenue of $119 million. These decreases were primarily due to valuations associated with commercial mortgage loans held for sale, net of hedges, higher impairment of mortgage servicing rights,
and the sale during the second quarter 2010 of a duplicative agency servicing operation acquired as part of the National City transaction. These decreases were partially offset by higher ancillary commercial mortgage servicing fees.
P
ROVISION
F
OR
C
REDIT
L
OSSES
The provision for credit losses totaled $2.1 billion for the first nine months of 2010 compared with $2.9 billion for the first nine months of 2009. For
the third quarter of 2010, the provision for credit losses totaled $486 million compared with $914 million for the third quarter of 2009. The lower provision in both comparisons reflected credit exposure reductions and overall improving credit
migration during 2010.
We are optimistic about prospects for a stable-to-lower provision for credit losses in the fourth quarter of 2010
compared with the third quarter of 2010. Future provision levels will depend primarily on the level of nonperforming loans and the pace of economic recovery.
The Credit Risk Management portion of the Risk Management section of this Financial Review includes additional information regarding factors impacting the provision for credit losses.
N
ONINTEREST
E
XPENSE
Noninterest expense for the first nine months of 2010 was $6.3 billion compared with $6.9 billion for the first nine months of 2009, a decline of $591 million or 9%. The impact of higher cost savings
related to the National City acquisition
and the reversal of certain accrued liabilities in the second quarter of 2010, including $73 million associated with a franchise tax settlement and $47 million associated with an indemnification
for certain Visa litigation, were reflected in the lower nine-month expenses. Lower expenses in the first nine months of 2010 also reflected a special FDIC assessment, intended to build the FDIC’s Deposit Insurance Fund, of $133 million in the
second quarter of 2009.
Noninterest expense totaled $2.2 billion in the third quarter of 2010, a decline of 3% compared with the third
quarter of 2009. Noninterest expense declined compared with the year ago quarter primarily due to higher acquisition-related cost savings.
We
expect noninterest expense to be lower in the fourth quarter of 2010 relative to the third quarter of 2010 primarily due to lower integration costs and an expected fourth quarter reduction in our Visa indemnification liability.
See National City Integration Costs in the Executive Summary section of this Financial Review for details of integration costs incurred, including
through the first nine months of 2010 and 2009.
We achieved National City acquisition cost savings of $1.7 billion on an annualized basis in
the third quarter of 2010, higher and earlier than our original goal of $1.2 billion, and are on track to meet our new goal of $1.8 billion by the end of 2010.
E
FFECTIVE
T
AX
R
ATE
The effective tax
rate was 25.0% for the first nine months of 2010 compared with 21.4% for the first nine months of 2009. The tax rate was lower on a year-to-date basis in 2009 due to lower levels of pretax income in 2009 partially offset by the 2010 favorable IRS
letter ruling noted below.
For the third quarter of 2010, our effective tax rate was 18.8% compared with 25.5% for the third quarter of 2009.
The lower tax rate in the third quarter of 2010 was primarily the result of receiving a favorable IRS letter ruling in July 2010 that resolved a prior tax position and resulted in a tax benefit of $89 million.
We anticipate that the full year 2010 effective tax rate will be approximately 26%.
11
C
ONSOLIDATED
B
ALANCE
S
HEET
R
EVIEW
S
UMMARIZED
B
ALANCE
S
HEET
D
ATA
|
|
|
|
|
|
|
|
|
|
|
In millions
|
|
Sept. 30
2010
|
|
|
Dec. 31
2009
|
|
|
Assets
|
|
|
|
|
|
|
|
|
|
Loans
|
|
$
|
150,127
|
|
|
$
|
157,543
|
|
|
Investment securities
|
|
|
63,461
|
|
|
|
56,027
|
|
|
Cash and short-term investments
|
|
|
7,188
|
|
|
|
13,290
|
|
|
Loans held for sale
|
|
|
3,275
|
|
|
|
2,539
|
|
|
Goodwill and other intangible assets
|
|
|
10,518
|
|
|
|
12,909
|
|
|
Equity investments
|
|
|
10,137
|
|
|
|
10,254
|
|
|
Other
|
|
|
15,427
|
|
|
|
17,301
|
|
|
Total assets
|
|
$
|
260,133
|
|
|
$
|
269,863
|
|
|
Liabilities
|
|
|
|
|
|
|
|
|
|
Deposits
|
|
$
|
179,183
|
|
|
$
|
186,922
|
|
|
Borrowed funds
|
|
|
39,763
|
|
|
|
39,261
|
|
|
Other
|
|
|
8,521
|
|
|
|
11,113
|
|
|
Total liabilities
|
|
|
227,467
|
|
|
|
237,296
|
|
|
Total shareholders’ equity
|
|
|
30,042
|
|
|
|
29,942
|
|
|
Noncontrolling interests
|
|
|
2,624
|
|
|
|
2,625
|
|
|
Total equity
|
|
|
32,666
|
|
|
|
32,567
|
|
|
Total liabilities and equity
|
|
$
|
260,133
|
|
|
$
|
269,863
|
|
The summarized balance sheet data above is based upon our Consolidated Balance Sheet in Part I, Item 1 of this Report.
The decline in total assets at September 30, 2010 compared with December 31, 2009 was primarily due to decreases in loans and cash and
short-term investments, partially offset by an increase in investment securities.
Total assets and liabilities at September 30, 2010
included $4.5 billion and $3.2 billion, respectively, related to Market Street and a credit card securitization trust as more fully described in the Off-Balance Sheet Arrangements And Variable Interest Entities section of this Financial Review and
Note 3 Loan Sale and Servicing Activities and Variable Interest Entities in the Notes To Consolidated Financial Statements of this Report.
An
analysis of changes in selected balance sheet categories follows.
L
OANS
A summary of the major categories of loans outstanding follows. Outstanding loan balances reflect unearned income, unamortized discount and premium, and
purchase discounts and premiums totaling $2.8 billion at September 30, 2010 and $3.2 billion at December 31, 2009. The balances do not include future accretable net interest on the purchased impaired loans.
Loans decreased $7.4 billion, or 5%, as of September 30, 2010 compared with December 31, 2009. An increase in loans of $3.5 billion from the
initial consolidation of Market Street and
the securitized credit card portfolio was more than offset by the impact of soft customer loan demand combined with loan repayments and payoffs in the distressed assets portfolio.
Loans represented 58% of total assets at both September 30, 2010 and at December 31, 2009. Commercial lending represented 52% of the loan
portfolio and consumer lending represented 48% at September 30, 2010.
Commercial real estate loans represented 7% of total assets at
September 30, 2010 and 9% of total assets at December 31, 2009.
Details Of Loans
|
|
|
|
|
|
|
|
|
|
|
In millions
|
|
Sept.
30
2010
|
|
|
Dec. 31
2009
|
|
|
Commercial
|
|
|
|
|
|
|
|
|
|
Retail/wholesale
|
|
$
|
9,752
|
|
|
$
|
9,515
|
|
|
Manufacturing
|
|
|
9,519
|
|
|
|
9,880
|
|
|
Service providers
|
|
|
8,747
|
|
|
|
8,256
|
|
|
Real estate related (a)
|
|
|
7,398
|
|
|
|
7,403
|
|
|
Financial services
|
|
|
3,773
|
|
|
|
3,874
|
|
|
Health care
|
|
|
3,169
|
|
|
|
2,970
|
|
|
Other
|
|
|
10,830
|
|
|
|
12,920
|
|
|
Total commercial
|
|
|
53,188
|
|
|
|
54,818
|
|
|
Commercial real estate
|
|
|
|
|
|
|
|
|
|
Real estate projects
|
|
|
13,021
|
|
|
|
15,582
|
|
|
Commercial mortgage
|
|
|
6,070
|
|
|
|
7,549
|
|
|
Total commercial real estate
|
|
|
19,091
|
|
|
|
23,131
|
|
|
Equipment lease financing
|
|
|
6,408
|
|
|
|
6,202
|
|
|
TOTAL COMMERCIAL LENDING (b)
|
|
|
78,687
|
|
|
|
84,151
|
|
|
Consumer
|
|
|
|
|
|
|
|
|
|
Home equity
|
|
|
|
|
|
|
|
|
|
Lines of credit
|
|
|
23,770
|
|
|
|
24,236
|
|
|
Installment
|
|
|
10,815
|
|
|
|
11,711
|
|
|
Education
|
|
|
8,819
|
|
|
|
7,468
|
|
|
Automobile
|
|
|
2,863
|
|
|
|
2,013
|
|
|
Credit card and other unsecured lines of credit
|
|
|
4,843
|
|
|
|
3,536
|
|
|
Other
|
|
|
3,846
|
|
|
|
4,618
|
|
|
Total consumer
|
|
|
54,956
|
|
|
|
53,582
|
|
|
Residential real estate
|
|
|
|
|
|
|
|
|
|
Residential mortgage
|
|
|
15,708
|
|
|
|
18,190
|
|
|
Residential construction
|
|
|
776
|
|
|
|
1,620
|
|
|
Total residential real estate
|
|
|
16,484
|
|
|
|
19,810
|
|
|
TOTAL CONSUMER LENDING
|
|
|
71,440
|
|
|
|
73,392
|
|
|
Total loans
|
|
$
|
150,127
|
|
|
$
|
157,543
|
|
|
(a)
|
Includes loans to customers in the real estate and construction industries.
|
|
(b)
|
Construction loans with interest reserves, and A Note/B Note restructurings are not significant to PNC.
|
Total loans above include purchased impaired loans related to National City amounting to $8.1 billion, or 5% of total loans, at September 30, 2010,
and $10.3 billion, or 7% of total loans, at December 31, 2009.
We are committed to providing credit and liquidity to qualified
borrowers. Total loan originations and new
12
commitments and renewals totaled $112 billion for the first nine months of 2010, including $39 billion in the third quarter.
Our loan portfolio continued to be diversified among numerous industries and types of businesses. The loans that we hold are also concentrated in, and diversified across, our principal geographic markets.
Commercial lending is the largest category and is the most sensitive to changes in assumptions and judgments underlying the determination of
the allowance for loan and lease losses. This estimate also considers other relevant factors such as:
|
|
•
|
|
Actual versus estimated losses,
|
|
|
•
|
|
Regional and national economic conditions,
|
|
|
•
|
|
Business segment and portfolio concentrations,
|
|
|
•
|
|
The impact of government regulations, and
|
|
|
•
|
|
Risk of potential estimation or judgmental errors, including the accuracy of risk ratings.
|
Higher Risk Loans
Our loan
portfolio includes certain loans deemed to be higher risk and therefore more likely to result in credit losses. We established specific and pooled reserves on the total commercial lending category of $2.9 billion at September 30, 2010. This
commercial lending reserve provided adequate and appropriate loss coverage on the higher risk commercial loans in the total commercial portfolio. The commercial lending reserve represented 56% of the total allowance for loan and lease losses of $5.2
billion at that date. The remaining 44% of the allowance for loan and lease losses pertained to the total consumer lending category. This category of loans is more homogenous in nature and has certain characteristics that can be assessed at a total
portfolio level in terms of loans representing higher risk. We do not consider government insured/government guaranteed loans to be higher risk as we do not believe these loans will result in a significant loss because of their structure. Such loans
are excluded from the following assessment of higher risk loans.
Our home equity lines of credit and installment loans outstanding totaled
$34.6 billion at September 30, 2010. In this portfolio, we consider the higher risk loans to be those with a recent FICO credit score of less than or equal to 660 and an original loan-to-value ratio greater than 90%. Such loans totaled $1.2
billion or approximately 4% of the total home equity line of credit and installment loans at September 30, 2010. These higher risk loans were concentrated in our geographic footprint with 28% in
Pennsylvania, 13% in Ohio, 11% in New Jersey, 7% in Illinois, 6% in Michigan, and 5% in Kentucky, with the remaining loans dispersed across several other states. Option ARM loans and negative
amortization loans in this portfolio were not significant. Within the higher risk home equity portfolio, approximately 12% are in some stage of delinquency and 6% are in late stage (90+ days) delinquency status.
In our $15.7 billion residential mortgage portfolio, loans with a recent FICO credit score of less than or equal to 660 and a recent loan-to-value ratio
greater than 90% totaled $.7 billion and comprised approximately 4% of this portfolio at September 30, 2010. Twenty-three percent of the higher risk loans are located in California, 12% in Florida, 11% in Illinois, 8% in Maryland, 5% in
Pennsylvania, and 5% in New Jersey, with the remaining loans dispersed across several other states. Option ARM loans and negative amortization loans in this portfolio were not significant. Within the higher risk residential mortgage portfolio of $.7
billion, approximately 47% are in some stage of delinquency and 36% are in 90+ days late stage delinquency status.
Within our broader home
equity lines of credit, installment loans and residential mortgage portfolios, approximately 5% of the aggregate $50.3 billion loan outstandings have loan-to-value ratios in excess of 100%. The impact of housing price depreciation is reflected in
the allowance for loans and lease losses as a result of the consumer reserve methodology process. The consumer reserve process is sensitive to collateral values which in turn affect loan loss severity. While our consumer reserve methodology strives
to reflect all significant risk factors, there is an element of uncertainty associated with, but not limited to, potential imprecision in the estimation process due to the inherent time lag of obtaining information such as housing price
depreciation. We provide additional reserves where appropriate to provide coverage for losses attributable to such risks.
We obtain updated
property values annually for select residential mortgage loan portfolios. We are expanding this valuation process to update the property values on the majority of our real estate secured consumer loan portfolios.
Information related to purchased impaired loans, purchase accounting accretion and accretable net interest recognized during the first nine months of
2010 in connection with our acquisition of National City follows.
13
Valuation of Purchased Impaired
Loans
|
|
|
|
|
|
|
|
|
|
|
|
|
|
|
|
|
|
|
|
|
|
|
|
|
|
|
|
|
December 31, 2008
|
|
|
December 31, 2009
|
|
|
September 30, 2010
|
|
|
Dollars in billions
|
|
Balance
|
|
|
Net
Investment
|
|
|
Balance
|
|
|
Net
Investment
|
|
|
Balance
|
|
|
Net
Investment
|
|
|
Commercial and commercial real estate loans:
|
|
|
|
|
|
|
|
|
|
|
|
|
|
|
|
|
|
|
|
|
|
|
|
|
|
Unpaid principal balance
|
|
$
|
6.3
|
|
|
|
|
|
|
$
|
3.5
|
|
|
|
|
|
|
$
|
2.2
|
|
|
|
|
|
|
Purchased impaired mark
|
|
|
(3.4
|
)
|
|
|
|
|
|
|
(1.3
|
)
|
|
|
|
|
|
|
(.7
|
)
|
|
|
|
|
|
Recorded investment
|
|
|
2.9
|
|
|
|
|
|
|
|
2.2
|
|
|
|
|
|
|
|
1.5
|
|
|
|
|
|
|
Allowance for loan losses
|
|
|
|
|
|
|
|
|
|
|
(.2
|
)
|
|
|
|
|
|
|
(.3
|
)
|
|
|
|
|
|
Net investment
|
|
|
2.9
|
|
|
|
46
|
%
|
|
|
2.0
|
|
|
|
57
|
%
|
|
|
1.2
|
|
|
|
55
|
%
|
|
Consumer and residential mortgage loans:
|
|
|
|
|
|
|
|
|
|
|
|
|
|
|
|
|
|
|
|
|
|
|
|
|
|
Unpaid principal balance
|
|
|
15.6
|
|
|
|
|
|
|
|
11.7
|
|
|
|
|
|
|
|
8.4
|
|
|
|
|
|
|
Purchased impaired mark
|
|
|
(5.8
|
)
|
|
|
|
|
|
|
(3.6
|
)
|
|
|
|
|
|
|
(1.8
|
)
|
|
|
|
|
|
Recorded investment
|
|
|
9.8
|
|
|
|
|
|
|
|
8.1
|
|
|
|
|
|
|
|
6.6
|
|
|
|
|
|
|
Allowance for loan losses
|
|
|
|
|
|
|
|
|
|
|
(.3
|
)
|
|
|
|
|
|
|
(.6
|
)
|
|
|
|
|
|
Net investment
|
|
|
9.8
|
|
|
|
63
|
%
|
|
|
7.8
|
|
|
|
67
|
%
|
|
|
6.0
|
|
|
|
71
|
%
|
|
Total purchased impaired loans:
|
|
|
|
|
|
|
|
|
|
|
|
|
|
|
|
|
|
|
|
|
|
|
|
|
|
Unpaid principal balance
|
|
|
21.9
|
|
|
|
|
|
|
|
15.2
|
|
|
|
|
|
|
|
10.6
|
|
|
|
|
|
|
Purchased impaired mark (a)
|
|
|
(9.2
|
)
|
|
|
|
|
|
|
(4.9
|
)
|
|
|
|
|
|
|
(2.5
|
)
|
|
|
|
|
|
Recorded investment
|
|
|
12.7
|
|
|
|
|
|
|
|
10.3
|
|
|
|
|
|
|
|
8.1
|
|
|
|
|
|
|
Allowance for loan losses
|
|
|
|
|
|
|
|
|
|
|
(.5
|
)
|
|
|
|
|
|
|
(.9
|
)(b)
|
|
|
|
|
|
Net investment
|
|
$
|
12.7
|
|
|
|
58
|
%
|
|
$
|
9.8
|
|
|
|
64
|
%
|
|
$
|
7.2
|
|
|
|
68
|
%
|
|
(a)
|
Comprised of $5.5 billion of nonaccretable principal cash flows and $3.7 billion of accretable total cash flows at December 31, 2008, $1.4 billion of nonaccretable
principal cash flows and $3.5 billion of accretable total cash flows at December 31, 2009, and $.2 billion of nonaccretable principal cash flows and $2.3 billion of accretable total cash flows at September 30, 2010.
|
|
(b)
|
Impairment reserves of $.9 billion at September 30, 2010 reflect impaired loans with further credit quality deterioration since acquisition. This deterioration was
more than offset by the cash received to date in excess of recorded investment of $.6 billion and the net reclassification to accretable, to be recognized over time, of $.9 billion.
|
The unpaid principal balance of purchased impaired loans declined from $21.9 billion at December 31,
2008 to $10.6 billion at September 30, 2010 due to amounts determined to be uncollectible, payoffs and disposals. The remaining purchased impaired mark at September 30, 2010 was $2.5 billion which was a decline from $9.2 billion at
December 31, 2008. The net investment of $12.7 billion at December 31, 2008 declined 43% to $7.2 billion at September 30, 2010 primarily due to payoffs, disposals and further impairment partially offset by accretion during 2009 and
the first nine months of 2010. At September 30, 2010, our largest individual purchased impaired loan had a recorded investment of $21 million.
We currently expect to collect total cash flows of $9.5 billion on purchased impaired loans, representing the $7.2 billion net investment at September 30, 2010 and the accretable net interest of $2.3
billion shown in the Accretable Net Interest table that follows.
Purchase Accounting Accretion
|
|
|
|
|
|
|
|
|
|
|
|
|
|
|
|
|
|
|
|
|
Three months ended
Sept. 30
|
|
|
Nine months ended
Sept. 30
|
|
|
In millions
|
|
2010
|
|
|
2009
|
|
|
2010
|
|
|
2009
|
|
|
Non-impaired loans
|
|
$
|
70
|
|
|
$
|
172
|
|
|
$
|
293
|
|
|
$
|
662
|
|
|
Impaired loans
|
|
|
187
|
|
|
|
193
|
|
|
|
710
|
|
|
|
670
|
|
|
Reversal of contractual interest on impaired loans
|
|
|
(138
|
)
|
|
|
(167
|
)
|
|
|
(408
|
)
|
|
|
(584
|
)
|
|
Net impaired loans
|
|
|
49
|
|
|
|
26
|
|
|
|
302
|
|
|
|
86
|
|
|
Securities
|
|
|
15
|
|
|
|
25
|
|
|
|
39
|
|
|
|
97
|
|
|
Deposits
|
|
|
122
|
|
|
|
231
|
|
|
|
433
|
|
|
|
807
|
|
|
Borrowings
|
|
|
(42
|
)
|
|
|
(58
|
)
|
|
|
(112
|
)
|
|
|
(195
|
)
|
|
Total
|
|
$
|
214
|
|
|
$
|
396
|
|
|
$
|
955
|
|
|
$
|
1,457
|
|
Cash received in excess of recorded investment from sales or payoffs of impaired commercial loans (cash recoveries) totaled $350 million for the first
nine months of 2010, including $111 million in the third quarter. We do not expect this level of cash recoveries to be sustainable on a quarterly basis.
14
Remaining Purchase Accounting
Accretion
|
|
|
|
|
|
|
|
|
|
|
|
|
|
|
In billions
|
|
Dec. 31
2008
|
|
|
Dec. 31
2009
|
|
|
Sept. 30
2010
|
|
|
Non-impaired loans
|
|
$
|
2.4
|
|
|
$
|
1.6
|
|
|
$
|
1.3
|
|
|
Impaired loans (a)
|
|
|
3.7
|
|
|
|
3.5
|
|
|
|
2.3
|
|
|
Total loans (gross)
|
|
|
6.1
|
|
|
|
5.1
|
|
|
|
3.6
|
|
|
Securities
|
|
|
.2
|
|
|
|
.1
|
|
|
|
.1
|
|
|
Deposits
|
|
|
2.1
|
|
|
|
1.0
|
|
|
|
.6
|
|
|
Borrowings
|
|
|
(1.5
|
)
|
|
|
(1.2
|
)
|
|
|
(1.1
|
)
|
|
Total
|
|
$
|
6.9
|
|
|
$
|
5.0
|
|
|
$
|
3.2
|
|
|
(a)
|
Adjustments include purchase accounting accretion, reclassifications from non-accretable to accretable net interest as a result of increases in estimated cash flows,
and reductions in the accretable amount as a result of the identification of additional purchased impaired loans as of the National City acquisition close date of December 31, 2008.
|
Accretable Net Interest – Purchased Impaired Loans
|
|
|
|
|
|
|
In billions
|
|
|
|
|
January 1, 2010
|
|
$
|
3.5
|
|
|
Accretion (including cash recoveries)
|
|
|
(1.1
|
)
|
|
Net reclassifications to accretable from non-accretable
|
|
|
.1
|
|
|
Disposals
|
|
|
(.2
|
)
|
|
September 30, 2010
|
|
$
|
2.3
|
|
|
|
|
|
|
|
|
In billions
|
|
|
|
|
January 1, 2009
|
|
$
|
3.7
|
|
|
Accretion (including cash recoveries)
|
|
|
(2.2
|
)
|
|
Adjustments resulting from changes in purchase price allocation
|
|
|
.3
|
|
|
Net reclassifications to accretable from non-accretable
|
|
|
.9
|
|
|
Disposals
|
|
|
(.4
|
)
|
|
September 30, 2010
|
|
$
|
2.3
|
|
Net unfunded credit commitments are comprised of the following:
Net Unfunded Credit Commitments
|
|
|
|
|
|
|
|
|
|
|
In millions
|
|
Sept. 30
2010
|
|
|
Dec. 31
2009
|
|
|
Commercial / commercial real estate (a)
|
|
$
|
59,834
|
|
|
$
|
60,143
|
|
|
Home equity lines of credit
|
|
|
19,500
|
|
|
|
20,367
|
|
|
Consumer credit card and other unsecured lines
|
|
|
16,478
|
|
|
|
18,800
|
|
|
Other
|
|
|
1,335
|
|
|
|
1,485
|
|
|
Total
|
|
$
|
97,147
|
|
|
$
|
100,795
|
|
|
(a)
|
Less than 4% of these amounts at each date relate to commercial real estate.
|
Unfunded commitments are concentrated in our primary geographic markets. Commitments to extend credit represent arrangements to lend funds or provide liquidity subject to specified contractual conditions.
Commercial commitments are reported net of participations, assignments and syndications, primarily to financial institutions, totaling $15.3 billion at September 30, 2010 and $13.2 billion at December 31, 2009.
Unfunded credit commitments related to the consolidation of Market Street totaled $3.4 billion at September 30, 2010 and are now a component of
PNC’s total unfunded credit commitments. These amounts are included in the preceding table within the “Commercial / commercial real estate” category.
In addition to credit commitments, our net outstanding standby letters of credit totaled $9.9 billion at September 30, 2010 and $10.0 billion at December 31, 2009. Standby letters of credit
commit us to make payments on behalf of our customers if specified future events occur.
Unfunded liquidity facility commitments and standby
bond purchase agreements totaled $509 million at September 30, 2010 and $6.2 billion at December 31, 2009 and are included in the preceding table primarily within the “Commercial / commercial real estate” category. Due to the
consolidation of Market Street, $5.5 billion of unfunded liquidity facility commitments were no longer included in the amounts in the preceding table as of September 30, 2010.
15
INVESTMENT SECURITIES
Details of Investment Securities
|
|
|
|
|
|
|
|
|
|
|
In millions
|
|
Amortized
Cost
|
|
|
Fair
Value
|
|
|
September 30, 2010
|
|
|
|
|
|
|
|
|
|
S
ECURITIES
A
VAILABLE
FOR
S
ALE
|
|
|
|
|
|
|
|
|
|
Debt securities
|
|
|
|
|
|
|
|
|
|
US Treasury and government agencies
|
|
$
|
7,546
|
|
|
$
|
7,883
|
|
|
Residential mortgage-backed
|
|
|
|
|
|
|
|
|
|
Agency
|
|
|
28,470
|
|
|
|
29,093
|
|
|
Non-agency
|
|
|
8,663
|
|
|
|
7,581
|
|
|
Commercial mortgage-backed
|
|
|
|
|
|
|
|
|
|
Agency
|
|
|
1,560
|
|
|
|
1,641
|
|
|
Non-agency
|
|
|
1,795
|
|
|
|
1,853
|
|
|
Asset-backed
|
|
|
2,897
|
|
|
|
2,702
|
|
|
State and municipal
|
|
|
1,578
|
|
|
|
1,601
|
|
|
Other debt
|
|
|
3,157
|
|
|
|
3,297
|
|
|
Corporate stocks and other
|
|
|
399
|
|
|
|
399
|
|
|
Total securities available for sale
|
|
$
|
56,065
|
|
|
$
|
56,050
|
|
|
S
ECURITIES
H
ELD
TO
M
ATURITY
|
|
|
|
|
|
|
|
|
|
Debt securities
|
|
|
|
|
|
|
|
|
|
Commercial mortgage-backed (non-agency)
|
|
$
|
4,378
|
|
|
$
|
4,618
|
|
|
Asset-backed
|
|
|
3,024
|
|
|
|
3,104
|
|
|
Other debt
|
|
|
9
|
|
|
|
11
|
|
|
Total securities held to maturity
|
|
$
|
7,411
|
|
|
$
|
7,733
|
|
|
December 31, 2009
|
|
|
|
|
|
|
|
|
|
S
ECURITIES
A
VAILABLE
FOR
S
ALE
|
|
|
|
|
|
|
|
|
|
Debt securities
|
|
|
|
|
|
|
|
|
|
US Treasury and government agencies
|
|
$
|
7,548
|
|
|
$
|
7,520
|
|
|
Residential mortgage-backed
|
|
|
|
|
|
|
|
|
|
Agency
|
|
|
24,076
|
|
|
|
24,438
|
|
|
Non-agency
|
|
|
10,419
|
|
|
|
8,302
|
|
|
Commercial mortgage-backed
|
|
|
|
|
|
|
|
|
|
Agency
|
|
|
1,299
|
|
|
|
1,297
|
|
|
Non-agency
|
|
|
4,028
|
|
|
|
3,848
|
|
|
Asset-backed
|
|
|
2,019
|
|
|
|
1,668
|
|
|
State and municipal
|
|
|
1,346
|
|
|
|
1,350
|
|
|
Other debt
|
|
|
1,984
|
|
|
|
2,015
|
|
|
Corporate stocks and other
|
|
|
360
|
|
|
|
360
|
|
|
Total securities available for sale
|
|
$
|
53,079
|
|
|
$
|
50,798
|
|
|
S
ECURITIES
H
ELD
TO
M
ATURITY
|
|
|
|
|
|
|
|
|
|
Debt securities
|
|
|
|
|
|
|
|
|
|
Commercial mortgage-backed (non-agency)
|
|
$
|
2,030
|
|
|
$
|
2,225
|
|
|
Asset-backed
|
|
|
3,040
|
|
|
|
3,136
|
|
|
Other debt
|
|
|
159
|
|
|
|
160
|
|
|
Total securities held to maturity
|
|
$
|
5,229
|
|
|
$
|
5,521
|
|
The carrying amount of investment securities totaled $63.5 billion at September 30, 2010 and $56.0 billion at December 31, 2009. The increase
in investment securities reflected a $5.3 billion increase in securities available for sale and a $2.2 billion increase in securities held to maturity as excess liquidity was invested in short duration, high quality securities. Investment securities
represented 24% of total assets at September 30, 2010 and 21% at December 31, 2009.
We evaluate our portfolio of investment
securities in light of changing market conditions and other factors and, where
appropriate, take steps intended to improve our overall positioning. We consider the portfolio to be well-diversified and of high quality. US Treasury and government agencies, agency residential
mortgage-backed securities and agency commercial mortgage-backed securities collectively represented 61% of the investment securities portfolio at September 30, 2010.
In March 2010, we transferred $2.2 billion of available for sale commercial mortgage-backed non-agency securities to the held to maturity portfolio. The transfer involved high-quality securities where
management’s intent to hold changed. In reassessing the classification of these securities, management considered the potential for the fair value of the securities to be adversely impacted, even where there is no indication of credit
impairment.
At September 30, 2010, the securities available for sale portfolio included a net unrealized loss of $15 million, which
represented the difference between fair value and amortized cost. The comparable amount at December 31, 2009 was a net unrealized loss of $2.3 billion. The fair value of investment securities is impacted by interest rates, credit spreads,
market volatility and liquidity conditions. The fair value of investment securities generally decreases when interest rates increase and vice versa. In addition, the fair value generally decreases when credit spreads widen and vice versa.
The significant decline in the net unrealized loss from December 31, 2009 was primarily the result of lower market interest rates and
improving liquidity and credit spreads on non-agency residential mortgage-backed and non-agency commercial mortgage-backed securities. Net unrealized gains and losses in the securities available for sale portfolio are included in shareholders’
equity as accumulated other comprehensive income or loss from continuing operations, net of tax.
Unrealized gains and losses on available for
sale securities do not impact liquidity or risk-based capital. However, reductions in the credit ratings of these securities would have an impact on the determination of risk-weighted assets which could reduce our regulatory capital ratios. In
addition, the amount representing the credit-related portion of OTTI on available for sale securities would reduce our earnings and regulatory capital ratios.
The expected weighted-average life of investment securities (excluding corporate stocks and other) was 4.0 years at September 30, 2010 and 4.1 years at December 31, 2009.
We estimate that, at September 30, 2010, the effective duration of investment securities was 2.4 years for an immediate 50 basis points parallel
increase in interest rates and 2.4 years for an immediate 50 basis points parallel decrease in interest rates. Comparable amounts at December 31, 2009 were 2.9 years and 2.5 years, respectively.
16
The following table provides detail
regarding the vintage, current credit rating, and FICO score of the underlying collateral at origination for residential mortgage-backed, commercial mortgage-backed and other asset-backed securities held in the available for sale and held to
maturity portfolios:
|
|
|
|
|
|
|
|
|
|
|
|
|
|
|
|
|
|
|
|
|
|
|
|
|
September 30, 2010
|
|
|
|
|
Agency
|
|
|
Non-agency
|
|
|
|
|
|
Dollars in millions
|
|
Residential
Mortgage-Backed
Securities
|
|
|
Commercial
Mortgage-Backed
Securities
|
|
|
Residential
Mortgage-Backed
Securities
|
|
|
Commercial
Mortgage-Backed
Securities
|
|
|
Asset-Backed
Securities
|
|
|
Fair Value – Available for Sale
|
|
$
|
29,093
|
|
|
$
|
1,641
|
|
|
$
|
7,581
|
|
|
$
|
1,853
|
|
|
$
|
2,702
|
|
|
Fair Value – Held to Maturity
|
|
|
|
|
|
|
|
|
|
|
|
|
|
|
4,618
|
|
|
|
3,104
|
|
|
Total Fair Value
|
|
$
|
29,093
|
|
|
$
|
1,641
|
|
|
$
|
7,581
|
|
|
$
|
6,471
|
|
|
$
|
5,806
|
|
|
% of Fair Value:
|
|
|
|
|
|
|
|
|
|
|
|
|
|
|
|
|
|
|
|
|
|
By Vintage
|
|
|
|
|
|
|
|
|
|
|
|
|
|
|
|
|
|
|
|
|
|
2010
|
|
|
23
|
%
|
|
|
29
|
%
|
|
|
|
|
|
|
|
|
|
|
6
|
%
|
|
2009
|
|
|
22
|
%
|
|
|
39
|
%
|
|
|
|
|
|
|
3
|
%
|
|
|
15
|
%
|
|
2008
|
|
|
9
|
%
|
|
|
6
|
%
|
|
|
|
|
|
|
|
|
|
|
17
|
%
|
|
2007
|
|
|
14
|
%
|
|
|
3
|
%
|
|
|
17
|
%
|
|
|
10
|
%
|
|
|
12
|
%
|
|
2006
|
|
|
7
|
%
|
|
|
6
|
%
|
|
|
23
|
%
|
|
|
30
|
%
|
|
|
13
|
%
|
|
2005 and earlier
|
|
|
25
|
%
|
|
|
17
|
%
|
|
|
60
|
%
|
|
|
57
|
%
|
|
|
15
|
%
|
|
Not Available
|
|
|
|
|
|
|
|
|
|
|
|
|
|
|
|
|
|
|
22
|
%
|
|
Total
|
|
|
100
|
%
|
|
|
100
|
%
|
|
|
100
|
%
|
|
|
100
|
%
|
|
|
100
|
%
|
|
By Credit Rating
|
|
|
|
|
|
|
|
|
|
|
|
|
|
|
|
|
|
|
|
|
|
Agency
|
|
|
100
|
%
|
|
|
100
|
%
|
|
|
|
|
|
|
|
|
|
|
|
|
|
AAA
|
|
|
|
|
|
|
|
|
|
|
8
|
%
|
|
|
87
|
%
|
|
|
72
|
%
|
|
AA
|
|
|
|
|
|
|
|
|
|
|
4
|
%
|
|
|
5
|
%
|
|
|
6
|
%
|
|
A
|
|
|
|
|
|
|
|
|
|
|
5
|
%
|
|
|
4
|
%
|
|
|
4
|
%
|
|
BBB
|
|
|
|
|
|
|
|
|
|
|
4
|
%
|
|
|
3
|
%
|
|
|
|
|
|
BB
|
|
|
|
|
|
|
|
|
|
|
11
|
%
|
|
|
1
|
%
|
|
|
1
|
%
|
|
B
|
|
|
|
|
|
|
|
|
|
|
19
|
%
|
|
|
|
|
|
|
4
|
%
|
|
Lower than B
|
|
|
|
|
|
|
|
|
|
|
49
|
%
|
|
|
|
|
|
|
11
|
%
|
|
No rating
|
|
|
|
|
|
|
|
|
|
|
|
|
|
|
|
|
|
|
2
|
%
|
|
Total
|
|
|
100
|
%
|
|
|
100
|
%
|
|
|
100
|
%
|
|
|
100
|
%
|
|
|
100
|
%
|
|
By FICO Score
|
|
|
|
|
|
|
|
|
|
|
|
|
|
|
|
|
|
|
|
|
|
>720
|
|
|
|
|
|
|
|
|
|
|
60
|
%
|
|
|
|
|
|
|
4
|
%
|
|
<720 and >660
|
|
|
|
|
|
|
|
|
|
|
31
|
%
|
|
|
|
|
|
|
8
|
%
|
|
<660
|
|
|
|
|
|
|
|
|
|
|
|
|
|
|
|
|
|
|
3
|
%
|
|
No FICO score
|
|
|
N/A
|
|
|
|
N/A
|
|
|
|
9
|
%
|
|
|
N/A
|
|
|
|
85
|
%
|
|
Total
|
|
|
|
|
|
|
|
|
|
|
100
|
%
|
|
|
|
|
|
|
100
|
%
|
We conduct a comprehensive security-level impairment assessment quarterly on all securities in an
unrealized loss position to determine whether the loss represents OTTI. Our assessment considers the security structure, recent security collateral performance metrics, external credit ratings, failure of the issuer to make scheduled interest or
principal payments, our judgment and expectations of future performance, and relevant independent industry research, analysis and forecasts.
We also consider the severity of the impairment and the length of time that the security has been impaired in our assessment. Results of the periodic
assessment are reviewed by a
cross-
functional senior management team representing Asset & Liability Management, Finance, and Balance Sheet Risk Management. The senior management team considers the results of the
assessments, as well as other factors, in determining whether the impairment is other-than-temporary.
We recognize the credit portion of OTTI
charges in current earnings for those debt securities where there is no intent to sell and it is not more likely than not that we would be required to sell the security prior to expected recovery. The remaining portion of OTTI charges is included in
accumulated other comprehensive loss.
17
We recognized OTTI for the first nine months and third quarter of 2010 and 2009 as follows:
Other-Than-Temporary Impairments
|
|
|
|
|
|
|
|
|
|
|
|
|
|
|
|
|
|
|
|
|
Three months ended
September 30
|
|
|
Nine months ended
September 30
|
|
|
In millions
|
|
2010
|
|
|
2009
|
|
|
2010
|
|
|
2009
|
|
|
Credit portion of OTTI losses (a)
|
|
$
|
(71
|
)
|
|
$
|
(129
|
)
|
|
$
|
(281
|
)
|
|
$
|
(433
|
)
|
|
Noncredit portion of OTTI losses (b)
|
|
|
(46
|
)
|
|
|
(272
|
)
|
|
|
(194
|
)
|
|
|
(1,107
|
)
|
|
Total OTTI losses
|
|
$
|
(117
|
)
|
|
$
|
(401
|
)
|
|
$
|
(475
|
)
|
|
$
|
(1,540
|
)
|
|
(a)
|
Reduction of noninterest income in our Consolidated Income Statement.
|
|
(b)
|
Included in Accumulated other comprehensive loss on our Consolidated Balance Sheet.
|
Included below is detail on the net unrealized losses and OTTI credit losses recorded on non-agency
residential and commercial mortgage-backed and other asset-backed securities, which represent our most significant categories of securities not backed by the US government or its agencies. A summary of all OTTI credit losses recognized for the third
quarter and first nine months of 2010 by investment type is included in Note 7 Investment Securities in the Notes To Consolidated Financial Statements of this Report.
|
|
|
|
|
|
|
|
|
|
|
|
|
|
|
|
|
|
|
|
|
|
|
|
|
|
|
|
|
September 30, 2010
|
|
|
In millions
|
|
Residential Mortgage-
Backed Securities
|
|
|
Commercial Mortgage-
Backed Securities
|
|
|
Asset-Backed
Securities (a)
|
|
|
AVAILABLE FOR SALE SECURITIES (NON-AGENCY)
|
|
|
|
|
|
|
|
|
|
|
|
|
|
|
|
|
|
|
|
|
|
|
|
|
|
|
|
Fair
Value
|
|
|
Net Unrealized
Gain (Loss)
|
|
|
Fair
Value
|
|
|
Net Unrealized
Gain (Loss)
|
|
|
Fair
Value
|
|
|
Net Unrealized
Gain (Loss)
|
|
|
Credit Rating Analysis
|
|
|
|
|
|
|
|
|
|
|
|
|
|
|
|
|
|
|
|
|
|
|
|
|
|
AAA
|
|
$
|
580
|
|
|
$
|
(24
|
)
|
|
$
|
1,131
|
|
|
$
|
50
|
|
|
$
|
1,527
|
|
|
$
|
4
|
|
|
Other Investment Grade (AA, A, BBB)
|
|
|
1,027
|
|
|
|
(49
|
)
|
|
|
667
|
|
|
|
13
|
|
|
|
277
|
|
|
|
(6
|
)
|
|
Total Investment Grade
|
|
|
1,607
|
|
|
|
(73
|
)
|
|
|
1,798
|
|
|
|
63
|
|
|
|
1,804
|
|
|
|
(2
|
)
|
|
BB
|
|
|
798
|
|
|
|
(121
|
)
|
|
|
49
|
|
|
|
(7
|
)
|
|
|
2
|
|
|
|
|
|
|
B
|
|
|
1,436
|
|
|
|
(221
|
)
|
|
|
6
|
|
|
|
2
|
|
|
|
222
|
|
|
|
(39
|
)
|
|
Lower than B
|
|
|
3,740
|
|
|
|
(667
|
)
|
|
|
|
|
|
|
|
|
|
|
641
|
|
|
|
(129
|
)
|
|
No Rating
|
|
|
|
|
|
|
|
|
|
|
|
|
|
|
|
|
|
|
29
|
|
|
|
(25
|
)
|
|
Total Sub-Investment Grade
|
|
|
5,974
|
|
|
|
(1,009
|
)
|
|
|
55
|
|
|
|
(5
|
)
|
|
|
894
|
|
|
|
(193
|
)
|
|
Total
|
|
$
|
7,581
|
|
|
$
|
(1,082
|
)
|
|
$
|
1,853
|
|
|
$
|
58
|
|
|
$
|
2,698
|
|
|
$
|
(195
|
)
|
|
OTTI Analysis
|
|
|
|
|
|
|
|
|
|
|
|
|
|
|
|
|
|
|
|
|
|
|
|
|
|
Investment Grade:
|
|
|
|
|
|
|
|
|
|
|
|
|
|
|
|
|
|
|
|
|
|
|
|
|
|
OTTI has been recognized
|
|
$
|
62
|
|
|
$
|
(12
|
)
|
|
|
|
|
|
|
|
|
|
|
|
|
|
|
|
|
|
No OTTI recognized to date
|
|
|
1,545
|
|
|
|
(61
|
)
|
|
$
|
1,798
|
|
|
$
|
63
|
|
|
$
|
1,804
|
|
|
$
|
(2
|
)
|
|
Total Investment Grade
|
|
|
1,607
|
|
|
|
(73
|
)
|
|
|
1,798
|
|
|
|
63
|
|
|
|
1,804
|
|
|
|
(2
|
)
|
|
Sub-Investment Grade:
|
|
|
|
|
|
|
|
|
|
|
|
|
|
|
|
|
|
|
|
|
|
|
|
|
|
OTTI has been recognized
|
|
|
3,610
|
|
|
|
(838
|
)
|
|
|
18
|
|
|
|
(1
|
)
|
|
|
639
|
|
|
|
(160
|
)
|
|
No OTTI recognized to date
|
|
|
2,364
|
|
|
|
(171
|
)
|
|
|
37
|
|
|
|
(4
|
)
|
|
|
255
|
|
|
|
(33
|
)
|
|
Total Sub-Investment Grade
|
|
|
5,974
|
|
|
|
(1,009
|
)
|
|
|
55
|
|
|
|
(5
|
)
|
|
|
894
|
|
|
|
(193
|
)
|
|
Total
|
|
$
|
7,581
|
|
|
$
|
(1,082
|
)
|
|
$
|
1,853
|
|
|
$
|
58
|
|
|
$
|
2,698
|
|
|
$
|
(195
|
)
|
|
SECURITIES HELD TO MATURITY (NON-AGENCY)
|
|
|
|
|
|
|
|
|
|
|
|
|
|
|
|
|
|
|
|
|
|
|
|
|
|
Credit Rating Analysis
|
|
|
|
|
|
|
|
|
|
|
|
|
|
|
|
|
|
|
|
|
|
|
|
|
|
AAA
|
|
|
|
|
|
|
|
|
|
$
|
4,510
|
|
|
$
|
239
|
|
|
$
|
2,676
|
|
|
$
|
67
|
|
|
Other Investment Grade (AA, A, BBB)
|
|
|
|
|
|
|
|
|
|
|
108
|
|
|
|
1
|
|
|
|
290
|
|
|
|
7
|
|
|
Total Investment Grade
|
|
|
|
|
|
|
|
|
|
|
4,618
|
|
|
|
240
|
|
|
|
2,966
|
|
|
|
74
|
|
|
BB
|
|
|
|
|
|
|
|
|
|
|
|
|
|
|
|
|
|
|
16
|
|
|
|
|
|
|
B
|
|
|
|
|
|
|
|
|
|
|
|
|
|
|
|
|
|
|
2
|
|
|
|
|
|
|
Lower than B
|
|
|
|
|
|
|
|
|
|
|
|
|
|
|
|
|
|
|
10
|
|
|
|
|
|
|
No Rating
|
|
|
|
|
|
|
|
|
|
|
|
|
|
|
|
|
|
|
98
|
|
|
|
6
|
|
|
Total Sub-Investment Grade
|
|
|
|
|
|
|
|
|
|
|
|
|
|
|
|
|
|
|
126
|
|
|
|
6
|
|
|
Total
|
|
|
|
|
|
|
|
|
|
$
|
4,618
|
|
|
$
|
240
|
|
|
$
|
3,092
|
|
|
$
|
80
|
|
|
(a)
|
Table excludes $4 million and $12 million of available for sale and held to maturity agency asset-backed securities, respectively.
|
18
Residential Mortgage-Backed
Securities
At September 30, 2010, our residential mortgage-backed securities portfolio was comprised of $29.1 billion fair value of
US government agency-backed securities and $7.6 billion fair value of non-agency (private issuer) securities. The agency securities are generally collateralized by 1-4 family, conforming, fixed-rate residential mortgages
.
The non-agency
securities are also generally collateralized by 1-4 family residential mortgages. The mortgage loans underlying the non-agency securities are generally non-conforming (i.e., original balances in excess of the amount qualifying for agency securities)
and predominately have interest rates that are fixed for a period of time, after which the rate adjusts to a floating rate based upon a contractual spread that is indexed to a market rate (i.e., a “hybrid ARM”), or interest rates that are
fixed for the term of the loan.
Substantially all of the securities are senior tranches in the securitization structure and have credit
protection in the form of credit enhancement, over-collateralization and/or excess spread accounts.
During the first nine months of 2010, we
recorded OTTI credit losses of $211 million on non-agency residential mortgage-backed securities, including $57 million in the third quarter. As of September 30, 2010, $207 million of the year-to-date credit losses related to securities rated
below investment grade. As of September 30, 2010, the noncredit portion of OTTI losses recorded in accumulated other comprehensive loss for non-agency residential mortgage-backed securities totaled $850 million and the related securities had a
fair value of $3.7 billion.
The fair value of sub-investment grade investment securities for which we have not recorded an OTTI credit loss
as of September 30, 2010 totaled $2.4 billion, with unrealized net losses of $171 million. The results of our security-level assessments indicate that we will recover the entire cost basis of these securities. Note 7 Investment Securities in
the Notes To Consolidated Financial Statements of this Report provides further detail regarding our process for assessing OTTI for these securities.
Commercial Mortgage-Backed Securities
The fair value of the non-agency commercial
mortgage-backed securities portfolio was $6.5 billion at September 30, 2010 and consisted of fixed-rate, private-issuer securities collateralized by non-residential properties, primarily retail properties, office buildings, and multi-family
housing. The agency commercial mortgage-backed securities portfolio was $1.6 billion fair value at September 30, 2010 consisting of multi-family housing. Substantially all of the securities are the most senior tranches in the subordination
structure.
OTTI credit losses on commercial mortgage-backed securities for the first nine months of 2010 were not significant. In addition,
the noncredit portion of OTTI losses recorded in
accumulated other comprehensive loss for commercial mortgage-backed securities and the fair value of the related securities at September 30, 2010 were not significant. The remaining fair
value for which OTTI was previously recorded approximates zero.
Asset-Backed Securities
The fair value of the asset-backed securities portfolio was $5.8 billion at September 30, 2010 and consisted of fixed-rate and floating-rate,
private-issuer securities collateralized primarily by various consumer credit products, including residential mortgage loans, credit cards, and automobile loans. Substantially all of the securities are senior tranches in the securitization structure
and have credit protection in the form of credit enhancement, over-collateralization and/or excess spread accounts.
During the first nine
months of 2010, we recorded OTTI credit losses of $67 million on asset-backed securities, including $14 million in the third quarter. All of the securities were collateralized by first and second lien residential mortgage loans and were rated below
investment grade. As of September 30, 2010, the noncredit portion of OTTI losses recorded in accumulated other comprehensive loss for asset-backed securities totaled $160 million and the related securities had a fair value of $639 million.
For the sub-investment grade investment securities (available for sale and held to maturity) for which we have not recorded an OTTI loss
through September 30, 2010, the remaining fair value was $381 million, with unrealized net losses of $27 million. The results of our security-level assessments indicate that we will recover the entire cost basis of these securities. Note 7
Investment Securities in the Notes To Consolidated Financial Statements of this Report provides further detail regarding our process for assessing OTTI for these securities.
If current housing and economic conditions were to continue for the foreseeable future or worsen, if market volatility and illiquidity were to continue or worsen, or if market interest rates were to
increase appreciably, the valuation of our investment securities portfolio could continue to be adversely affected and we could incur additional OTTI credit losses that would impact our Consolidated Income Statement.
L
OANS
H
ELD
F
OR
S
ALE
|
|
|
|
|
|
|
|
|
|
|
In millions
|
|
Sept.
30
2010
|
|
|
Dec. 31
2009
|
|
|
Commercial mortgages at fair value
|
|
$
|
1,028
|
|
|
$
|
1,050
|
|
|
Commercial mortgages at lower of cost or market
|
|
|
353
|
|
|
|
251
|
|
|
Total commercial mortgages
|
|
|
1,381
|
|
|
|
1,301
|
|
|
Residential mortgages at fair value
|
|
|
1,777
|
|
|
|
1,012
|
|
|
Residential mortgages at lower of cost or market
|
|
|
9
|
|
|
|
|
|
|
Total residential mortgages
|
|
|
1,786
|
|
|
|
1,012
|
|
|
Other
|
|
|
108
|
|
|
|
226
|
|
|
Total
|
|
$
|
3,275
|
|
|
$
|
2,539
|
|
19
We stopped originating certain
commercial mortgage loans designated as held for sale during the first quarter of 2008 and continue pursuing opportunities to reduce these positions at appropriate prices. We sold $82 million of commercial mortgage loans held for sale carried at
fair value in the first nine months of 2010 and sold $234 million in the first nine months of 2009.
We recognized net losses of $6 million in
the first nine months of 2010 on the valuation and sale of commercial mortgage loans held for sale, net of hedges, including net gains of $7 million in the third quarter. Net gains of $62 million on the valuation and sale of commercial mortgages
loans held for sale, net of hedges, were recognized in the first nine months of 2009, including $28 million in the third quarter.
Residential
mortgage loan origination volume was $7.0 billion in the first nine months of 2010. Substantially all such loans were originated to agency or FHA standards. We sold $6.6 billion of loans and recognized related gains of $165 million during the first
nine months of 2010, of which $77 million occurred in the third quarter. The comparable amounts for the first nine months of 2009 were $17.0 billion and $409 million, respectively, including $83 million in the third quarter.
Interest income on loans held for sale was $208 million for the first nine months of 2010, including $55 million in the third quarter. Comparable amounts
in 2009 were $195 million and $68 million, respectively.
G
OODWILL
AND
O
THER
I
NTANGIBLE
A
SSETS
Goodwill and other intangible assets totaled $10.5 billion at September 30, 2010
compared with $12.9 billion at December, 31, 2009. Goodwill declined $1.3 billion, to $8.2 billion, at September 30, 2010 compared with the year-end balance primarily due to the sale of GIS which reduced goodwill by $1.2 billion. The $1.1
billion decline in other intangible assets from December 31, 2009 included a $.5 billion decline in residential mortgage servicing rights and a $.3 billion decline in commercial mortgage servicing rights. Note 9 Goodwill and Other Intangible
Assets included in the Notes To Consolidated Financial Statements of this Report provides further information on these items.
F
UNDING
AND
C
APITAL
S
OURCES
Details Of Funding Sources
|
|
|
|
|
|
|
|
|
|
|
In millions
|
|
Sept. 30
2010
|
|
|
Dec. 31
2009
|
|
|
Deposits
|
|
|
|
|
|
|
|
|
|
Money market
|
|
$
|
82,386
|
|
|
$
|
85,838
|
|
|
Demand
|
|
|
45,811
|
|
|
|
40,406
|
|
|
Retail certificates of deposit
|
|
|
40,716
|
|
|
|
48,622
|
|
|
Savings
|
|
|
7,099
|
|
|
|
6,401
|
|
|
Other time
|
|
|
686
|
|
|
|
1,088
|
|
|
Time deposits in foreign offices
|
|
|
2,485
|
|
|
|
4,567
|
|
|
Total deposits
|
|
|
179,183
|
|
|
|
186,922
|
|
|
Borrowed funds
|
|
|
|
|
|
|
|
|
|
Federal funds purchased and repurchase agreements
|
|
|
4,661
|
|
|
|
3,998
|
|
|
Federal Home Loan Bank borrowings
|
|
|
7,106
|
|
|
|
10,761
|
|
|
Bank notes and senior debt
|
|
|
13,508
|
|
|
|
12,362
|
|
|
Subordinated debt
|
|
|
10,023
|
|
|
|
9,907
|
|
|
Other
|
|
|
4,465
|
|
|
|
2,233
|
|
|
Total borrowed funds
|
|
|
39,763
|
|
|
|
39,261
|
|
|
Total
|
|
$
|
218,946
|
|
|
$
|
226,183
|
|
Total funding sources decreased $7.2 billion, or 3%, at September 30, 2010 compared with December 31, 2009.
Total deposits decreased $7.7 billion at September 30, 2010 compared with December 31, 2009. Deposits decreased in the comparison primarily due
to declines in retail certificates of deposit and money market deposits partially offset by an increase in demand deposits.
Interest-bearing
deposits represented 74% of total deposits at September 30, 2010 compared with 76% at December 31, 2009.
Total borrowed funds
increased $.5 billion since December 31, 2009. Other borrowed funds increased $2.2 billion in the comparison primarily due to an increase in commercial paper borrowings of $2.3 billion with the consolidation of Market Street. Bank notes and
senior debt increased $1.1 billion since year-end. These increases were partially offset by a decline of $3.7 billion in Federal Home Loan Bank borrowings since December 31, 2009.
Capital
PNC increased common equity during the first nine months of 2010 as
outlined below. We manage our capital position by making adjustments to our balance sheet size and composition, issuing debt, equity or hybrid instruments, executing treasury stock transactions, managing dividend policies and retaining earnings.
20
Total shareholders’ equity
increased $.1 billion, to $30.0 billion, at September 30, 2010 compared with December 31, 2009 and included the impact of the following:
|
|
•
|
|
The first quarter 2010 issuance of 63.9 million shares of common stock in an underwritten offering at $54 per share resulted in a $3.4 billion
increase in total shareholders’ equity,
|
|
|
•
|
|
An increase of $2.0 billion to retained earnings, and
|
|
|
•
|
|
A positive swing of $2.1 billion in accumulated other comprehensive income (loss) largely due to decreases in net unrealized securities losses as more
fully described in the Investment Securities portion of this Consolidated Balance Sheet Review.
|
The factors above were
mostly offset by a decline of $7.3 billion in capital surplus preferred stock in connection with our February 2010 redemption of the Series N (TARP) Preferred Stock as explained further in Note 14 Total Equity And Other Comprehensive Income in the
Notes To Consolidated Financial Statements in this Report.
Common shares outstanding were 526 million at September 30, 2010 and
462 million at December 31, 2009. Our first quarter 2010 common stock offering referred to above drove this increase.
Since our
acquisition of National City on December 31, 2008, we have increased total common shareholders’ equity by $11.9 billion, or 68%. We expect to continue to increase our common equity as a proportion of total capital through growth in
retained earnings and will consider other capital opportunities as appropriate.
Our current common stock repurchase program permits us to
purchase up to 25 million shares of PNC common stock on the open market or in privately negotiated transactions. This program will remain in effect until fully utilized or until modified, superseded or terminated. The extent and timing of share
repurchases under this program will depend on a number of factors including, among others, market and general economic conditions, economic and regulatory capital considerations, alternative uses of capital, regulatory and contractual limitations,
and the potential impact on our credit ratings. We did not purchase any shares during the first nine months of 2010 under this program and, as described in our 2009 Form 10-K, were restricted from doing so under the TARP Capital Purchase Program
prior to our February 2010 redemption of the Series N Preferred Stock.
Risk-Based Capital
|
|
|
|
|
|
|
|
|
|
|
Dollars in millions
|
|
Sept. 30
2010
|
|
|
Dec. 31
2009
|
|
|
Capital components
|
|
|
|
|
|
|
|
|
|
Shareholders’ equity
|
|
|
|
|
|
|
|
|
|
Common
|
|
$
|
29,394
|
|
|
$
|
21,967
|
|
|
Preferred
|
|
|
648
|
|
|
|
7,975
|
|
|
Trust preferred capital securities
|
|
|
2,941
|
|
|
|
2,996
|
|
|
Noncontrolling interests
|
|
|
1,350
|
|
|
|
1,611
|
|
|
Goodwill and other intangible assets
|
|
|
(9,111
|
)
|
|
|
(10,652
|
)
|
|
Eligible deferred income taxes on goodwill and other intangible assets
|
|
|
528
|
|
|
|
738
|
|
|
Pension, other postretirement benefit plan adjustments
|
|
|
402
|
|
|
|
542
|
|
|
Net unrealized securities losses, after-tax
|
|
|
86
|
|
|
|
1,575
|
|
|
Net unrealized losses (gains) on cash flow hedge derivatives, after-tax
|
|
|
(655
|
)
|
|
|
(166
|
)
|
|
Other
|
|
|
(207
|
)
|
|
|
(63
|
)
|
|
Tier 1 risk-based capital
|
|
|
25,376
|
|
|
|
26,523
|
|
|
Subordinated debt
|
|
|
5,143
|
|
|
|
5,356
|
|
|
Eligible allowance for credit losses
|
|
|
2,704
|
|
|
|
2,934
|
|
|
Total risk-based capital
|
|
$
|
33,223
|
|
|
$
|
34,813
|
|
|
Tier 1 common capital
|
|
|
|
|
|
|
|
|
|
Tier 1 risk-based capital
|
|
$
|
25,376
|
|
|
$
|
26,523
|
|
|
Preferred equity
|
|
|
(648
|
)
|
|
|
(7,975
|
)
|
|
Trust preferred capital securities
|
|
|
(2,941
|
)
|
|
|
(2,996
|
)
|
|
Noncontrolling interests
|
|
|
(1,350
|
)
|
|
|
(1,611
|
)
|
|
Tier 1 common capital
|
|
$
|
20,437
|
|
|
$
|
13,941
|
|
|
Assets
|
|
|
|
|
|
|
|
|
|
Risk-weighted assets, including off- balance sheet instruments and market risk equivalent assets
|
|
$
|
213,655
|
|
|
$
|
232,257
|
|
|
Adjusted average total assets
|
|
|
255,800
|
|
|
|
263,103
|
|
|
Capital ratios
|
|
|
|
|
|
|
|
|
|
Tier 1 risk-based
|
|
|
11.9
|
%
|
|
|
11.4
|
%
|
|
Tier 1 common
|
|
|
9.6
|
|
|
|
6.0
|
|
|
Total risk-based
|
|
|
15.6
|
|
|
|
15.0
|
|
|
Leverage
|
|
|
9.9
|
|
|
|
10.1
|
|
Federal banking regulators have stated that they expect all bank holding companies to have a level and composition of Tier 1 capital well in excess of
the 4% regulatory minimum, and they have required the largest US bank holding companies, including PNC, to have a capital buffer sufficient to withstand losses and allow them to meet credit needs of their customers through the economic downturn.
They have also stated their view that common equity should be the dominant form of Tier 1 capital. As a result, regulators are now emphasizing the Tier 1 common capital ratio in their evaluation of bank holding company capital levels, although this
metric is not provided for in the regulations. We seek to manage our capital consistent with these regulatory principles, and believe that our September 30, 2010 capital levels were aligned with them.
21
Dodd-Frank requires the Federal Reserve Board to establish capital requirements that would, among other
things, eliminate the Tier 1 treatment of trust preferred securities following a phase-in period expected to begin in 2013. Accordingly, PNC will evaluate its alternatives, including the potential for early redemption of some or all of its trust
preferred securities, based on such considerations it may consider relevant, including dividend rates, the specifics of the future capital requirements, capital market conditions and other factors.
Our Tier 1 risk-based capital ratio increased 50 basis points to 11.9% at September 30, 2010 from 11.4% at December 31, 2009. Our Tier 1 common
capital ratio was 9.6% at September 30, 2010, an increase of 360 basis points compared with 6.0% at December 31, 2009. Increases in both ratios were attributable to retention of earnings in 2010, the first quarter 2010 equity offering, the
third quarter 2010 sale of GIS, and lower risk-weighted assets. The increases in the Tier 1 risk-based capital ratio noted above were offset by the impact of the $7.6 billion first quarter 2010 redemption of the Series N (TARP) Preferred Stock. See
Note 14 Total Equity And Other Comprehensive Income in the Notes To Consolidated Financial Statements in this Report for additional information regarding the Series N Preferred Stock redemption.
At September 30, 2010, PNC Bank, N.A., our domestic bank subsidiary, was considered “well capitalized” based on US regulatory capital
ratio requirements, which are indicated on page 2 of this Report. We believe PNC Bank, N.A. will continue to meet these requirements during the remainder of 2010.
The access to, and cost of, funding for new business initiatives including acquisitions, the ability to engage in expanded business activities, the ability to pay dividends, the level of deposit insurance
costs, and the level and nature of regulatory oversight depend, in part, on a financial institution’s capital strength.
O
FF
-B
ALANCE
S
HEET
A
RRANGEMENTS
A
ND
V
ARIABLE
I
NTEREST
E
NTITIES
We engage in a
variety of activities that involve unconsolidated entities or that are otherwise not reflected in our Consolidated Balance Sheet that are generally referred to as “off-balance sheet arrangements.” Additional information on these types of
activities is included in the following sections of this Report:
|
|
•
|
|
Commitments, including contractual obligations and other commitments, included within the Risk Management section of this Financial Review,
|
|
|
•
|
|
Note 3 Loan Sale and Servicing Activities and Variable Interest Entities,
|
|
|
•
|
|
Note 18 Commitments and Guarantees and
|
|
|
•
|
|
Both Note 3 and Note 18 are in the Notes To Consolidated Financial Statements included in Part I, Item 1 of this Report.
|
On January 1, 2010, we adopted ASU 2009-17 – Consolidations (Topic 810) – Improvements to Financial
Reporting by Enterprises Involved with Variable Interest Entities. This guidance removes the scope exception for qualifying special-purpose entities, contains new criteria for determining the primary beneficiary of a variable interest entity (VIE)
and increases the frequency of required reassessments to determine whether an entity is the primary beneficiary of a VIE. VIEs are assessed for consolidation under Topic 810 when we hold variable interests in these entities. PNC consolidates VIEs
when we are deemed to be the primary beneficiary. The primary beneficiary of a VIE is determined to be the party that meets both of the following criteria: (1) has the power to make decisions that most significantly affect the economic
performance of the VIE and (2) has the obligation to absorb losses or the right to receive benefits that in either case could potentially be significant to the VIE. Effective January 1, 2010, we consolidated Market Street, a credit card
securitization trust, and certain Low Income Housing Tax Credit (LIHTC) investments. We recorded consolidated assets of $4.2 billion, consolidated liabilities of $4.2 billion, and an after-tax cumulative effect adjustment to retained earnings of $92
million upon adoption.
22
The following provides a summary of
VIEs, including those that we have consolidated and those in which we hold variable interests but have not consolidated into our financial statements, as of September 30, 2010 and December 31, 2009, respectively.
Consolidated VIEs – Carrying Value (a)
|
|
|
|
|
|
|
|
|
|
|
|
|
|
|
|
|
|
|
|
|
|
|
September 30, 2010
In millions
|
|
Market
Street
|
|
|
Credit Card
Securitization
Trust
|
|
|
Tax Credit
Investments (b)
|
|
|
Credit
Risk
Transfer
Transaction
|
|
|
Total
|
|
|
Assets
|
|
|
|
|
|
|
|
|
|
|
|
|
|
|
|
|
|
|
|
|
|
Cash and due from banks
|
|
|
|
|
|
|
|
|
|
$
|
2
|
|
|
|
|
|
|
$
|
2
|
|
|
Interest-earning deposits with banks
|
|
|
|
|
|
|
|
|
|
|
5
|
|
|
|
|
|
|
|
5
|
|
|
Investment securities
|
|
$
|
202
|
|
|
|
|
|
|
|
|
|
|
|
|
|
|
|
202
|
|
|
Loans
|
|
|
2,094
|
|
|
$
|
2,103
|
|
|
|
|
|
|
$
|
447
|
|
|
|
4,644
|
|
|
Allowance for loan and lease losses
|
|
|
|
|
|
|
(213
|
)
|
|
|
|
|
|
|
(6
|
)
|
|
|
(219
|
)
|
|
Equity investments
|
|
|
|
|
|
|
|
|
|
|
1,177
|
|
|
|
|
|
|
|
1,177
|
|
|
Other assets
|
|
|
339
|
|
|
|
3
|
|
|
|
435
|
|
|
|
10
|
|
|
|
787
|
|
|
Total assets
|
|
$
|
2,635
|
|
|
$
|
1,893
|
|
|
$
|
1,619
|
|
|
$
|
451
|
|
|
$
|
6,598
|
|
|
Liabilities
|
|
|
|
|
|
|
|
|
|
|
|
|
|
|
|
|
|
|
|
|
|
Other borrowed funds
|
|
$
|
2,298
|
|
|
$
|
523
|
|
|
$
|
116
|
|
|
|
|
|
|
$
|
2,937
|
|
|
Accrued expenses
|
|
|
|
|
|
|
|
|
|
|
79
|
|
|
|
|
|
|
|
79
|
|
|
Other liabilities
|
|
|
336
|
|
|
|
|
|
|
|
187
|
|
|
|
|
|
|
|
523
|
|
|
Total liabilities
|
|
$
|
2,634
|
|
|
$
|
523
|
|
|
$
|
382
|
|
|
|
|
|
|
$
|
3,539
|
|
|
(a)
|
Amounts represent carrying value on PNC’s Consolidated Balance Sheet.
|
|
(b)
|
Amounts reported primarily represent LIHTC investments.
|
Consolidated VIEs
|
|
|
|
|
|
|
|
|
|
|
In millions
|
|
Aggregate
Assets
|
|
|
Aggregate
Liabilities
|
|
|
September 30, 2010
|
|
|
|
|
|
|
|
|
|
Market Street
|
|
$
|
3,220
|
|
|
$
|
3,226
|
|
|
Credit Card Securitization Trust
|
|
|
2,231
|
|
|
|
995
|
|
|
Tax Credit Investments (a)
|
|
|
1,631
|
|
|
|
417
|
|
|
Credit Risk Transfer Transaction
|
|
|
766
|
|
|
|
766
|
|
|
|
|
|
|
December 31, 2009
|
|
|
|
|
|
|
|
|
|
Tax Credit Investments (a)
|
|
$
|
1,933
|
|
|
$
|
808
|
|
|
Credit Risk Transfer Transaction
|
|
|
860
|
|
|
|
860
|
|
|
(a)
|
Amounts reported primarily represent LIHTC investments.
|
Aggregate assets and aggregate liabilities differ from the consolidated carrying value of assets and liabilities due to elimination of intercompany assets and liabilities held by the consolidated VIE.
Non-Consolidated VIEs
|
|
|
|
|
|
|
|
|
|
|
|
|
|
|
|
|
|
|
|
|
|
|
In millions
|
|
Aggregate
Assets
|
|
|
Aggregate
Liabilities
|
|
|
PNC Risk
of
Loss
|
|
|
Carrying
Value of
Assets
|
|
|
Carrying
Value of
Liabilities
|
|
|
September 30, 2010
|
|
|
|
|
|
|
|
|
|
|
|
|
|
|
|
|
|
|
|
|
|
Tax Credit Investments (a)
|
|
$
|
3,818
|
|
|
$
|
2,028
|
|
|
$
|
850
|
|
|
$
|
850
|
(c)
|
|
$
|
347
|
(d)
|
|
Commercial Mortgage-Backed Securitizations (b)
|
|
|
73,206
|
|
|
|
73,206
|
|
|
|
1,727
|
|
|
|
1,727
|
(e)
|
|
|
|
|
|
Residential Mortgage-Backed Securitizations (b)
|
|
|
47,585
|
|
|
|
47,585
|
|
|
|
1,936
|
|
|
|
1,930
|
(e)
|
|
|
6
|
(d)
|
|
Collateralized Debt Obligations
|
|
|
18
|
|
|
|
|
|
|
|
2
|
|
|
|
2
|
(c)
|
|
|
|
|
|
Total
|
|
$
|
124,627
|
|
|
$
|
122,819
|
|
|
$
|
4,515
|
|
|
$
|
4,509
|
|
|
$
|
353
|
|
|
|
|
|
|
|
|
|
|
|
|
|
|
|
|
|
|
|
|
|
|
|
|
In millions
|
|
Aggregate
Assets
|
|
|
Aggregate
Liabilities
|
|
|
PNC Risk
of Loss
|
|
|
|
|
|
|
|
|
December 31, 2009
|
|
|
|
|
|
|
|
|
|
|
|
|
|
|
|
|
|
|
|
|
|
Market Street
|
|
$
|
3,698
|
|
|
$
|
3,718
|
|
|
$
|
6,155
|
(f)
|
|
|
|
|
|
|
|
|
|
Tax Credit Investments (a)
|
|
|
1,786
|
|
|
|
1,156
|
|
|
|
743
|
|
|
|
|
|
|
|
|
|
|
Collateralized Debt Obligations
|
|
|
23
|
|
|
|
|
|
|
|
2
|
|
|
|
|
|
|
|
|
|
|
Total
|
|
$
|
5,507
|
|
|
$
|
4,874
|
|
|
$
|
6,900
|
|
|
|
|
|
|
|
|
|
|
(a)
|
Amounts reported primarily represent LIHTC investments. Aggregate assets and aggregate liabilities represent estimated balances due to limited availability of financial
information associated with certain acquired partnerships.
|
23
|
(b)
|
Amounts reported reflect involvement with securitization SPEs where PNC transferred to and/or services loans for a SPE and we hold securities issued by that SPE. We
also invest in other mortgage and asset-backed securities issued by third-party VIEs with which we have no continuing involvement. Further information on these securities is included in Note 7 Investment Securities and values disclosed represent our
maximum exposure to loss for those securities’ holdings.
|
|
(c)
|
Included in Equity investments on our Consolidated Balance Sheet.
|
|
(d)
|
Included in Other liabilities on our Consolidated Balance Sheet.
|
|
(e)
|
Included in Trading securities, Investment securities, Other intangible assets, and Other assets on our Consolidated Balance Sheet.
|
|
(f)
|
PNC’s risk of loss consisted of off-balance sheet liquidity commitments to Market Street of $5.6 billion and other credit enhancements of $.6 billion at
December 31, 2009.
|
Market Street
Market Street is a multi-seller asset-backed commercial paper conduit that is owned by an independent third party. Market Street’s activities primarily involve purchasing assets or making loans
secured by interests in pools of receivables from US corporations that desire access to the commercial paper market. Market Street funds the purchases of assets or loans by issuing commercial paper and is supported by pool-specific credit
enhancements, liquidity facilities and program-level credit enhancement. Generally, Market Street mitigates its potential interest rate risk by entering into agreements with its borrowers that reflect interest rates based upon its weighted average
commercial paper cost of funds. During 2009 and the first nine months of 2010, Market Street met all of its funding needs through the issuance of commercial paper.
Market Street commercial paper outstanding was $2.3 billion at September 30, 2010 and $3.1 billion at December 31, 2009. The weighted average maturity of the commercial paper was 39 days at
September 30, 2010 and 36 days at December 31, 2009.
During 2009, PNC Capital Markets, acting as a placement agent for Market
Street, held a maximum daily position in Market Street commercial paper of $135 million with an average balance of $19 million. This compares with a maximum daily position and an average balance of zero for the first nine months of 2010. PNC Capital
Markets owned no Market Street commercial paper at September 30, 2010 and December 31, 2009. PNC Bank, N.A. made no purchases of Market Street commercial paper during the first nine months of 2010.
Assets of Market Street (a)
|
|
|
|
|
|
|
|
|
|
|
|
|
|
|
In millions
|
|
Outstanding
|
|
|
Commitments
|
|
|
Weighted
Average
Remaining
Maturity
In Years
|
|
|
December 31, 2009
|
|
|
|
|
|
|
|
|
|
|
|
|
|
Trade receivables
|
|
$
|
1,551
|
|
|
$
|
4,105
|
|
|
|
2.01
|
|
|
Automobile financing
|
|
|
480
|
|
|
|
480
|
|
|
|
4.20
|
|
|
Auto fleet leasing
|
|
|
412
|
|
|
|
543
|
|
|
|
.85
|
|
|
Collateralized loan obligations
|
|
|
126
|
|
|
|
150
|
|
|
|
.36
|
|
|
Residential mortgage
|
|
|
13
|
|
|
|
13
|
|
|
|
26.01
|
|
|
Other
|
|
|
534
|
|
|
|
567
|
|
|
|
1.65
|
|
|
Cash and miscellaneous receivables
|
|
|
582
|
|
|
|
|
|
|
|
|
|
|
Total
|
|
$
|
3,698
|
|
|
$
|
5,858
|
|
|
|
2.06
|
|
|
(a)
|
Market Street did not recognize an asset impairment charge or experience any material rating downgrades during 2009.
|
Market Street Commitments by Credit Rating (a)
|
|
|
|
|
|
|
|
|
|
|
|
|
September 30,
2010
|
|
|
December 31,
2009
|
|
|
AAA/Aaa
|
|
|
26
|
%
|
|
|
14
|
%
|
|
AA/Aa
|
|
|
61
|
|
|
|
50
|
|
|
A/A
|
|
|
12
|
|
|
|
34
|
|
|
BBB/Baa
|
|
|
1
|
|
|
|
2
|
|
|
Total
|
|
|
100
|
%
|
|
|
100
|
%
|
|
(a)
|
The majority of our facilities are not explicitly rated by the rating agencies. All facilities are structured to meet rating agency standards for applicable rating
levels.
|
Perpetual Trust Securities
We issue certain hybrid capital vehicles that qualify as capital for regulatory and rating agency purposes.
In February 2008, PNC Preferred Funding LLC (the LLC), one of our indirect subsidiaries, sold $375 million of 8.700% Fixed-to-Floating Rate Non-Cumulative Exchangeable Perpetual Trust Securities of PNC
Preferred Funding Trust III (Trust III) to third parties in a private placement. In connection with the private placement, Trust III acquired $375 million of Fixed-to-Floating Rate Non-Cumulative Perpetual Preferred Securities of the LLC (the LLC
Preferred Securities). The sale was similar to the March 2007 private placement by the LLC of $500 million of 6.113% Fixed-to-Floating Rate Non-Cumulative Exchangeable Trust Securities (the Trust II Securities) of PNC Preferred Funding Trust II
(Trust II) in which Trust II acquired $500 million of LLC Preferred Securities and to the December 2006 private placement by PNC REIT Corp. of $500 million of 6.517% Fixed-to-Floating Rate Non-Cumulative Exchangeable Perpetual Trust Securities (the
Trust I Securities) of PNC Preferred Funding Trust I (Trust I) in which Trust I acquired $500 million of LLC Preferred Securities.
Each Trust
III Security is automatically exchangeable into a share of Series J Non-Cumulative Perpetual Preferred Stock of PNC, each Trust II Security is automatically exchangeable into a share of Series I Non-Cumulative Perpetual Preferred Stock of PNC
(Series I Preferred Stock), and each Trust I Security is automatically exchangeable into a share of Series F Non-Cumulative Perpetual Preferred Stock of PNC Bank, N.A. (PNC Bank Preferred Stock), in each case under certain conditions relating to the
capitalization or the financial condition of PNC Bank, N.A. and upon the direction of the Office of the Comptroller of the Currency.
Our 2009
Form 10-K includes additional information regarding the Trust I and Trust II Securities, including descriptions of replacement capital covenants.
24
PNC has contractually committed to
Trust II and Trust III that if full dividends are not paid in a dividend period on the Trust II Securities or the Trust III Securities, as applicable, or the LLC Preferred Securities held by Trust II or Trust III, as applicable, PNC will not declare
or pay dividends with respect to, or redeem, purchase or acquire, any of its equity capital securities during the next succeeding dividend period, other than: (i) purchases, redemptions or other acquisitions of shares of capital stock of PNC in
connection with any employment contract, benefit plan or other similar arrangement with or for the benefit of employees, officers, directors or consultants, (ii) purchases of shares of common stock of PNC pursuant to a contractually binding
requirement to buy stock existing prior to the commencement of the extension period, including under a contractually binding stock repurchase plan, (iii) any dividend in connection with the implementation of a shareholders’ rights plan, or
the redemption or repurchase of any rights under any such plan, (iv) as a result of an exchange or conversion of any class or series of PNC’s capital stock for any other class or series of PNC’s capital stock, (v) the purchase of
fractional interests in shares of PNC capital stock pursuant to the conversion or exchange provisions of such stock or the security being converted or exchanged or (vi) any stock dividends paid by PNC where the dividend stock is the same stock
as that on which the dividend is being paid.
PNC Bank, N.A. has contractually committed to Trust I that if full dividends are not paid in a
dividend period on the Trust I Securities, LLC Preferred Securities or any other parity equity securities issued by the LLC, neither PNC Bank, N.A. nor its subsidiaries will declare or pay dividends or other distributions with respect to, or redeem,
purchase or acquire or make a liquidation payment with respect to, any of its equity capital securities during the next succeeding period (other than to holders of the LLC Preferred Securities and any parity equity securities issued by the LLC)
except: (i) in the case of dividends payable to subsidiaries of PNC Bank, N.A., to PNC Bank, N.A. or another wholly-owned subsidiary of PNC Bank, N.A. or (ii) in the case of dividends payable to persons that are not subsidiaries of PNC
Bank, N.A., to such persons only if, (A) in the case of a cash dividend, PNC has first irrevocably committed to contribute amounts at least equal to such cash dividend or (B) in the case of in-kind dividends payable by PNC REIT Corp., PNC
has committed to purchase such in-kind dividend from the applicable PNC REIT Corp. holders in exchange for a cash payment representing the market value of such in-kind dividend, and PNC has committed to contribute such in-kind dividend to PNC Bank,
N.A.
PNC Capital Trust E Trust Preferred Securities
In February 2008, PNC Capital Trust E issued $450 million of 7.75% Trust Preferred Securities due March 15, 2068 (the Trust E Securities). PNC Capital Trust E’s only assets are $450 million of
7.75% Junior Subordinated Notes due
March 15, 2068 and issued by PNC (the JSNs). The Trust E Securities are fully and unconditionally guaranteed by PNC. We may, at our option, redeem the JSNs at 100% of their principal amount
on or after March 15, 2013.
In connection with the closing of the Trust E Securities sale, we agreed that, if we have given notice of
our election to defer interest payments on the JSNs or a related deferral period is continuing, then PNC would be subject during such period to restrictions on dividends and other provisions protecting the status of the JSN debenture holder similar
to or in some ways more restrictive than those potentially imposed under the Exchange Agreements with Trust II and Trust III, as described above. PNC Capital Trusts C and D have similar protective provisions with respect to $500 million in principal
amount of junior subordinated debentures. Also, in connection with the closing of the Trust E Securities sale, we entered into a replacement capital covenant as described more fully in our 2009 Form 10-K.
Acquired Entity Trust Preferred Securities
As a result of the National City acquisition, we assumed obligations with respect to $2.4 billion in principal amount of junior subordinated debentures issued by the acquired entity. As a result of the
Mercantile, Yardville and Sterling acquisitions, we assumed obligations with respect to $158 million in principal amount of junior subordinated debentures issued by the acquired entities. As described in Note 10 Capital Securities of Subsidiary
Trusts and Perpetual Trust Securities in our Notes To Consolidated Financial Statements in this Report, in September 2010 we redeemed $71 million in principal amounts related to the junior subordinated debentures issued by the acquired entities.
Under the terms of the outstanding debentures, if there is an event of default under the debentures or PNC exercises its right to defer payments on the related trust preferred securities issued by the statutory trusts or there is a default under
PNC’s guarantee of such payment obligations, PNC would be subject during the period of such default or deferral to restrictions on dividends and other provisions protecting the status of the debenture holders similar to or in some ways more
restrictive than those potentially imposed under the Exchange Agreements with Trust II and Trust III, as described above.
As more fully
described in our 2009 Form 10-K, we are subject to replacement capital covenants with respect to four tranches of junior subordinated debentures inherited from National City as well as a replacement capital covenant with respect to our Series L
Preferred Stock. As a result of a successful consent solicitation of the holders of our 6.875% Subordinated Notes due May 15, 2019, we terminated the replacement capital covenants with respect to these four tranches of junior subordinated
debentures and our Series L Preferred Stock on November 5, 2010.
25
F
AIR
V
ALUE
M
EASUREMENTS
In addition to the following, see Note 8 Fair Value in the Notes To Consolidated Financial Statements under Part 1, Item 1 of this Report for
further information regarding fair value.
Assets recorded at fair value represented 28% and 23% of total assets at September 30, 2010
and December 31, 2009, respectively. The increase in the percentage of total assets recorded at fair value at September 30, 2010 compared with the prior year end was primarily due to increases in securities available for sale and financial
derivatives. Liabilities recorded at fair value represented 3% and 2% of total liabilities at September 30, 2010 and December 31, 2009, respectively.
The following table includes the assets and liabilities measured at fair value and the portion of such assets and liabilities that are classified within Level 3 of the valuation hierarchy.
|
|
|
|
|
|
|
|
|
|
|
|
|
|
|
|
|
|
|
|
|
Sept. 30, 2010
|
|
|
Dec. 31, 2009
|
|
|
In millions
|
|
Total Fair
Value
|
|
|
Level 3
|
|
|
Total Fair
Value
|
|
|
Level 3
|
|
|
Assets
|
|
|
|
|
|
|
|
|
|
|
|
|
|
|
|
|
|
Securities available for sale
|
|
$
|
56,050
|
|
|
$
|
9,024
|
|
|
$
|
50,798
|
|
|
$
|
9,933
|
|
|
Financial derivatives
|
|
|
7,856
|
|
|
|
120
|
|
|
|
3,916
|
|
|
|
50
|
|
|
Residential mortgage loans held for sale
|
|
|
1,777
|
|
|
|
|
|
|
|
1,012
|
|
|
|
|
|
|
Trading securities
|
|
|
955
|
|
|
|
71
|
|
|
|
2,124
|
|
|
|
89
|
|
|
Residential mortgage servicing rights
|
|
|
788
|
|
|
|
788
|
|
|
|
1,332
|
|
|
|
1,332
|
|
|
Commercial mortgage loans held for sale
|
|
|
1,028
|
|
|
|
1,028
|
|
|
|
1,050
|
|
|
|
1,050
|
|
|
Equity investments
|
|
|
1,375
|
|
|
|
1,375
|
|
|
|
1,188
|
|
|
|
1,188
|
|
|
Customer resale agreements
|
|
|
921
|
|
|
|
|
|
|
|
990
|
|
|
|
|
|
|
Loans
|
|
|
90
|
|
|
|
|
|
|
|
107
|
|
|
|
|
|
|
Other assets
|
|
|
780
|
|
|
|
361
|
|
|
|
716
|
|
|
|
509
|
|
|
Total assets
|
|
$
|
71,620
|
|
|
$
|
12,767
|
|
|
$
|
63,233
|
|
|
$
|
14,151
|
|
|
Level 3 assets as a percentage of total assets at fair value
|
|
|
|
|
|
|
18
|
%
|
|
|
|
|
|
|
22
|
%
|
|
Level 3 assets as a percentage of consolidated assets
|
|
|
|
|
|
|
5
|
%
|
|
|
|
|
|
|
5
|
%
|
|
Liabilities
|
|
|
|
|
|
|
|
|
|
|
|
|
|
|
|
|
|
Financial derivatives
|
|
$
|
6,233
|
|
|
$
|
403
|
|
|
$
|
3,839
|
|
|
$
|
506
|
|
|
Trading securities sold short
|
|
|
872
|
|
|
|
|
|
|
|
1,344
|
|
|
|
|
|
|
Other liabilities
|
|
|
8
|
|
|
|
|
|
|
|
6
|
|
|
|
|
|
|
Total liabilities
|
|
$
|
7,113
|
|
|
$
|
403
|
|
|
$
|
5,189
|
|
|
$
|
506
|
|
|
Level 3 liabilities as a percentage of total liabilities at fair value
|
|
|
|
|
|
|
6
|
%
|
|
|
|
|
|
|
10
|
%
|
|
Level 3 liabilities as a percentage of consolidated liabilities
|
|
|
|
|
|
|
<1
|
%
|
|
|
|
|
|
|
<1
|
%
|
The majority of Level 3 assets represent non-agency residential mortgage-backed and asset-backed securities
in the available for sale securities portfolio for which there was a lack of observable trading activity.
During the first nine months of 2010, no material transfers of assets or liabilities between the hierarchy
levels occurred.
26
B
USINESS
S
EGMENTS
R
EVIEW
We have six reportable business segments:
|
|
•
|
|
Corporate & Institutional Banking
|
|
|
•
|
|
Residential Mortgage Banking
|
|
|
•
|
|
Distressed Assets Portfolio
|
Business segment results, including inter-segment revenues, and a description of each business are included in Note 19 Segment Reporting included in the
Notes To Consolidated Financial Statements of this Report. Certain amounts included in this Financial Review differ from those in Note 19 primarily due to the presentation in this Financial Review of business net interest revenue on a
taxable-equivalent basis.
Results of individual businesses are presented based on our management accounting practices and management
structure. There is no comprehensive, authoritative body of guidance for management accounting equivalent to GAAP; therefore, the financial results of our individual businesses are not necessarily comparable with similar information for any other
company. We refine our methodologies from time to time as our management accounting practices are enhanced and our businesses and management structure change. Certain prior period amounts have been reclassified to reflect current methodologies and
our current business and management structure. As a result of its sale, GIS is no longer a reportable business segment. Financial results are presented, to the extent practicable, as if each business operated on a stand-alone basis. We have
aggregated the business results for certain similar operating segments for financial reporting purposes.
Assets receive a funding charge and
liabilities and capital receive a funding credit based on a transfer pricing methodology that incorporates product maturities, duration and other factors. Capital is intended to cover unexpected losses and is assigned to the banking and servicing
businesses using our risk-based economic capital model. We have assigned capital equal to 6% of funds to Retail Banking to reflect the capital required for well-capitalized domestic banks and to approximate market comparables for this business.
We have allocated the allowances for loan and lease losses and unfunded loan commitments and letters of credit based on our assessment of
risk inherent in the business segment loan portfolios. Our allocation of the costs incurred by operations and other shared support areas not directly aligned with the businesses is primarily based on the use of services.
Total business segment financial results differ from total consolidated results from continuing operations
before noncontrolling interests, which itself excludes the earnings and revenue attributable to GIS, including the related after-tax third quarter 2010 sale of GIS that are reflected in discontinued operations. The impact of these differences is
reflected in the “Other” category. “Other” for purposes of this Business Segments Review and the Business Segment Highlights in the Executive Summary includes residual activities that do not meet the criteria for disclosure as a
separate reportable business, such as gains or losses related to BlackRock transactions including LTIP share distributions and obligations, integration costs, asset and liability management activities including net securities gains or losses and
certain trading activities, exited businesses, equity management activities, alternative investments, intercompany eliminations, most corporate overhead, and differences between business segment performance reporting and financial statement
reporting (GAAP), including the presentation of net income attributable to noncontrolling interests.
Period-end Employees
|
|
|
|
|
|
|
|
|
|
|
|
|
|
|
|
|
Sept.
30
2010
|
|
|
Dec. 31
2009
|
|
|
Sept. 30
2009
|
|
|
Full-time employees
|
|
|
|
|
|
|
|
|
|
|
|
|
|
Retail Banking
|
|
|
21,203
|
|
|
|
21,416
|
|
|
|
21,644
|
|
|
Corporate & Institutional Banking
|
|
|
3,660
|
|
|
|
3,746
|
|
|
|
3,861
|
|
|
Asset Management Group
|
|
|
2,971
|
|
|
|
2,969
|
|
|
|
3,076
|
|
|
Residential Mortgage Banking
|
|
|
3,339
|
|
|
|
3,267
|
|
|
|
3,606
|
|
|
Distressed Assets Portfolio
|
|
|
170
|
|
|
|
175
|
|
|
|
157
|
|
|
Other
|
|
|
|
|
|
|
|
|
|
|
|
|
|
Operations & Technology
|
|
|
8,689
|
|
|
|
9,249
|
|
|
|
9,373
|
|
|
Staff Services and other (a)
|
|
|
4,588
|
|
|
|
8,939
|
|
|
|
8,812
|
|
|
Total Other
|
|
|
13,277
|
|
|
|
18,188
|
|
|
|
18,185
|
|
|
Total full-time employees
|
|
|
44,620
|
|
|
|
49,761
|
|
|
|
50,529
|
|
|
Retail Banking part-time employees
|
|
|
4,799
|
|
|
|
4,737
|
|
|
|
4,859
|
|
|
Other part-time employees
|
|
|
974
|
|
|
|
1,322
|
|
|
|
1,520
|
|
|
Total part-time employees
|
|
|
5,773
|
|
|
|
6,059
|
|
|
|
6,379
|
|
|
Total
|
|
|
50,393
|
|
|
|
55,820
|
|
|
|
56,908
|
|
|
(a)
|
Includes employees of GIS 4,450 at December 31, 2009 and 4,561 at September 30, 2009. We sold GIS effective July 1, 2010.
|
Employee data as reported by each business segment in the table above reflects staff directly employed by the respective businesses and excludes
operations, technology and staff services employees reported in the Other segment. Total employees have decreased since September 30, 2009 primarily as a result of the sale of GIS and integration and conversion activities related to our
National City acquisition.
27
Results Of Businesses –
Summary
(Unaudited)
|
|
|
|
|
|
|
|
|
|
|
|
|
|
|
|
|
|
|
|
|
|
|
|
|
|
|
|
|
Income (Loss)
|
|
|
Revenue
|
|
|
Average Assets (a)
|
|
|
Nine months ended September 30 – in millions
|
|
2010
|
|
|
2009
|
|
|
2010
|
|
|
2009
|
|
|
2010
|
|
|
2009
|
|
|
Retail Banking (b)
|
|
$
|
97
|
|
|
$
|
161
|
|
|
$
|
4,101
|
|
|
$
|
4,342
|
|
|
$
|
67,380
|
|
|
$
|
65,281
|
|
|
Corporate & Institutional Banking
|
|
|
1,230
|
|
|
|
775
|
|
|
|
3,537
|
|
|
|
3,889
|
|
|
|
77,764
|
|
|
|
86,391
|
|
|
Asset Management Group
|
|
|
112
|
|
|
|
82
|
|
|
|
665
|
|
|
|
701
|
|
|
|
7,043
|
|
|
|
7,367
|
|
|
Residential Mortgage Banking
|
|
|
272
|
|
|
|
410
|
|
|
|
774
|
|
|
|
1,152
|
|
|
|
8,903
|
|
|
|
8,289
|
|
|
BlackRock
|
|
|
253
|
|
|
|
151
|
|
|
|
326
|
|
|
|
191
|
|
|
|
6,275
|
|
|
|
4,599
|
|
|
Distressed Assets Portfolio
|
|
|
8
|
|
|
|
172
|
|
|
|
927
|
|
|
|
932
|
|
|
|
18,246
|
|
|
|
23,627
|
|
|
Total business segments
|
|
|
1,972
|
|
|
|
1,751
|
|
|
|
10,330
|
|
|
|
11,207
|
|
|
|
185,611
|
|
|
|
195,554
|
|
|
Other (b) (c) (d)
|
|
|
232
|
|
|
|
(496
|
)
|
|
|
943
|
|
|
|
135
|
|
|
|
79,744
|
|
|
|
83,006
|
|
|
Income from continuing operations before noncontrolling interests (e)
|
|
$
|
2,204
|
|
|
$
|
1,255
|
|
|
$
|
11,273
|
|
|
$
|
11,342
|
|
|
$
|
265,355
|
|
|
$
|
278,560
|
|
|
(a)
|
Period-end balances for BlackRock.
|
|
(b)
|
Amounts for 2009 include the results of the 61 branches divested by early September 2009.
|
|
(c)
|
For our segment reporting presentation in this Financial Review, “Other” for the first nine months of 2010 and 2009 included $309 million and $266 million,
respectively, of pretax integration costs related to National City.
|
|
(d)
|
“Other” average assets include securities available for sale associated with asset and liability management activities.
|
|
(e)
|
Amounts are presented on a continuing operations basis and therefore exclude the earnings, revenue, and assets of GIS, including the third quarter 2010 gain on sale of
GIS.
|
28
R
ETAIL
B
ANKING
(Unaudited)
|
|
|
|
|
|
|
|
|
|
|
Nine months ended September 30
Dollars in millions
|
|
2010 (a)
|
|
|
2009 (b)
|
|
|
I
NCOME
S
TATEMENT
|
|
|
|
|
|
|
|
|
|
Net interest income
|
|
$
|
2,608
|
|
|
$
|
2,689
|
|
|
Noninterest income
|
|
|
|
|
|
|
|
|
|
Service charges on deposits
|
|
|
556
|
|
|
|
701
|
|
|
Brokerage
|
|
|
161
|
|
|
|
186
|
|
|
Consumer services
|
|
|
673
|
|
|
|
662
|
|
|
Other
|
|
|
103
|
|
|
|
104
|
|
|
Total noninterest income
|
|
|
1,493
|
|
|
|
1,653
|
|
|
Total revenue
|
|
|
4,101
|
|
|
|
4,342
|
|
|
Provision for credit losses
|
|
|
946
|
|
|
|
921
|
|
|
Noninterest expense
|
|
|
3,007
|
|
|
|
3,158
|
|
|
Pretax earnings
|
|
|
148
|
|
|
|
263
|
|
|
Income taxes
|
|
|
51
|
|
|
|
102
|
|
|
Earnings
|
|
$
|
97
|
|
|
$
|
161
|
|
|
A
VERAGE
B
ALANCE
S
HEET
|
|
|
|
|
|
|
|
|
|
Loans
|
|
|
|
|
|
|
|
|
|
Consumer
|
|
|
|
|
|
|
|
|
|
Home equity
|
|
$
|
26,538
|
|
|
$
|
27,502
|
|
|
Indirect
|
|
|
3,960
|
|
|
|
4,049
|
|
|
Education
|
|
|
8,409
|
|
|
|
5,278
|
|
|
Credit cards
|
|
|
3,975
|
|
|
|
2,150
|
|
|
Other consumer
|
|
|
1,792
|
|
|
|
1,791
|
|
|
Total consumer
|
|
|
44,674
|
|
|
|
40,770
|
|
|
Commercial and commercial real estate
|
|
|
11,302
|
|
|
|
12,488
|
|
|
Floor plan
|
|
|
1,287
|
|
|
|
1,307
|
|
|
Residential mortgage
|
|
|
1,669
|
|
|
|
2,120
|
|
|
Total loans
|
|
|
58,932
|
|
|
|
56,685
|
|
|
Goodwill and other intangible assets
|
|
|
5,881
|
|
|
|
5,828
|
|
|
Other assets
|
|
|
2,567
|
|
|
|
2,768
|
|
|
Total assets
|
|
$
|
67,380
|
|
|
$
|
65,281
|
|
|
Deposits
|
|
|
|
|
|
|
|
|
|
Noninterest-bearing demand
|
|
$
|
17,054
|
|
|
$
|
16,238
|
|
|
Interest-bearing demand
|
|
|
19,654
|
|
|
|
18,327
|
|
|
Money market
|
|
|
40,045
|
|
|
|
39,401
|
|
|
Total transaction deposits
|
|
|
76,753
|
|
|
|
73,966
|
|
|
Savings
|
|
|
6,865
|
|
|
|
6,621
|
|
|
Certificates of deposit
|
|
|
42,749
|
|
|
|
54,765
|
|
|
Total deposits
|
|
|
126,367
|
|
|
|
135,352
|
|
|
Other liabilities
|
|
|
1,602
|
|
|
|
58
|
|
|
Capital
|
|
|
8,187
|
|
|
|
8,564
|
|
|
Total liabilities and equity
|
|
$
|
136,156
|
|
|
$
|
143,974
|
|
|
P
ERFORMANCE
R
ATIOS
|
|
|
|
|
|
|
|
|
|
Return on average capital
|
|
|
2
|
%
|
|
|
3
|
%
|
|
Return on average assets
|
|
|
.19
|
|
|
|
.33
|
|
|
Noninterest income to total revenue
|
|
|
36
|
|
|
|
38
|
|
|
Efficiency
|
|
|
73
|
|
|
|
73
|
|
|
O
THER
I
NFORMATION
(c)
|
|
|
|
|
|
|
|
|
|
Credit-related statistics
:
|
|
|
|
|
|
|
|
|
|
Commercial nonperforming assets
|
|
$
|
262
|
|
|
$
|
311
|
|
|
Consumer nonperforming assets
|
|
|
400
|
|
|
|
191
|
|
|
Total nonperforming assets (d)
|
|
$
|
662
|
|
|
$
|
502
|
|
|
Impaired loans (e)
|
|
$
|
939
|
|
|
$
|
1,161
|
|
|
Commercial lending net charge-offs
|
|
$
|
281
|
|
|
$
|
242
|
|
|
Credit card lending net charge-offs (on balance sheet)
|
|
|
248
|
|
|
|
152
|
|
|
Consumer lending (excluding credit card) net charge-offs
|
|
|
316
|
|
|
|
293
|
|
|
Total net charge-offs
|
|
$
|
845
|
|
|
$
|
687
|
|
|
Commercial lending annualized net charge-off ratio
|
|
|
2.98
|
%
|
|
|
2.35
|
%
|
|
Credit card annualized net charge-off ratio (on balance sheet)
|
|
|
8.34
|
%
|
|
|
9.45
|
%
|
|
Consumer lending (excluding credit card) annualized net charge-off ratio
|
|
|
1.00
|
%
|
|
|
.96
|
%
|
|
Total annualized net charge-off ratio
|
|
|
1.92
|
%
|
|
|
1.62
|
%
|
|
Other statistics
:
|
|
|
|
|
|
|
|
|
|
ATMs
|
|
|
6,626
|
|
|
|
6,463
|
|
|
Branches (f)
|
|
|
2,461
|
|
|
|
2,554
|
|
|
|
|
|
|
|
|
|
|
|
|
At September 30
Dollars in millions, except as noted
|
|
2010 (a)
|
|
|
2009 (b)
|
|
|
O
THER
I
NFORMATION
(
CONTINUED
)
(
C
)
|
|
|
|
|
|
|
|
|
|
Home equity portfolio credit statistics
:
|
|
|
|
|
|
|
|
|
|
% of first lien positions (g)
|
|
|
35
|
%
|
|
|
35
|
%
|
|
Weighted average loan-to-value ratios (g)
|
|
|
73
|
%
|
|
|
74
|
%
|
|
Weighted average FICO scores (h)
|
|
|
725
|
|
|
|
727
|
|
|
Annualized net charge-off ratio
|
|
|
.87
|
%
|
|
|
.70
|
%
|
|
Loans 30 – 89 days past due
|
|
|
.79
|
%
|
|
|
.75
|
%
|
|
Loans 90 days past due
|
|
|
.94
|
%
|
|
|
.73
|
%
|
|
Customer-related statistics
:
|
|
|
|
|
|
|
|
|
|
Retail Banking checking relationships (i)
|
|
|
5,461,000
|
|
|
|
5,392,000
|
|
|
Retail online banking active customers
|
|
|
2,968,000
|
|
|
|
2,682,000
|
|
|
Retail online bill payment active customers
|
|
|
942,000
|
|
|
|
753,000
|
|
|
Brokerage statistics
:
|
|
|
|
|
|
|
|
|
|
Financial consultants (j)
|
|
|
713
|
|
|
|
655
|
|
|
Full service brokerage offices
|
|
|
40
|
|
|
|
42
|
|
|
Brokerage account assets (billions)
|
|
$
|
31
|
|
|
$
|
30
|
|
|
(a)
|
Information for 2010 reflects the impact of the consolidation in our financial statements for the securitized credit card portfolio of approximately $1.6 billion of
credit card loans as of January 1, 2010.
|
|
(b)
|
PNC completed the required divestiture of 61 branches in early September 2009. Amounts for periods prior to the divestiture included the impact of those branches.
|
|
(c)
|
Presented as of September 30 except for net charge-offs and annualized net charge-off ratios, which are for the nine months ended.
|
|
(d)
|
Includes nonperforming loans of $638 million at September 30, 2010 and $490 million at September 30, 2009.
|
|
(e)
|
Recorded investment of purchased impaired loans related to National City, adjusted to reflect additional loan impairments effective December 31, 2008.
|
|
(f)
|
Excludes certain satellite branches that provide limited products and/or services.
|
|
(g)
|
Includes loans from acquired portfolios for which lien position and loan-to-value information is not available.
|
|
(h)
|
Represents the most recent FICO scores we have on file.
|
|
(i)
|
Retail checking relationships for the prior period presented have been refined subsequent to completion of application system conversion activities related to the
National City acquisition.
|
|
(j)
|
Financial consultants provide services in full service brokerage offices and PNC traditional branches.
|
Retail Banking earned $97 million for the first nine months of 2010 compared with earnings of $161 million for the same period a year ago. Earnings
declined from the prior year primarily due to lower revenues as a result of lower interest credits assigned to deposits and a decline in fees which were partially offset by well-managed expenses. Retail Banking continued to maintain its focus on
growing customers and deposits, customer and employee satisfaction, investing in the business for future growth, as well as disciplined expense management during this period of market and economic uncertainty.
Information for the first nine months of 2010 reflects the impact of the consolidation in our financial statements of the securitized credit card
portfolio of approximately $1.6 billion of credit card loans as of January 1, 2010. This consolidation impacted primarily the loan and borrowings categories on the balance sheet and nearly all major categories of our income statement.
Highlights of Retail Banking’s performance for the first nine months of 2010 include the following:
|
|
•
|
|
PNC successfully completed the conversion of customers at over 1,300 branches across nine states from National City Bank to PNC, providing further
growth opportunities throughout our expanded footprint.
|
29
|
|
•
|
|
Success in implementing Retail Banking’s deposit strategy resulted in growth in average demand deposits of $2.1 billion, or 6%, over the prior
year. Excluding approximately $0.9 billion of average demand deposits from year-to-date 2009 balances related to the 61 required branch divestitures completed in early September 2009, average demand deposits increased $3.0 billion, or 9%, over the
prior year.
|
|
|
•
|
|
Growth in demand deposits reflected the continued focus of Retail Banking on expanding and deepening customer relationships. Checking relationships
grew by 67,000 from the beginning of 2010, better than expected in consideration of the impact of branch conversion activities in many markets. Markets not impacted by conversion activities had strong checking relationship results, and we have seen
improved sales momentum in the acquired markets post-conversion, as a result of implementing our business model.
|
|
|
•
|
|
Our investment in online banking capabilities continues to pay off. Active online bill payment and active online banking customers grew by 21% and 8%,
respectively, during the first nine months of 2010. In a year-over-year comparison, active online bill pay and active online banking customers have increased 25% and 11%, respectively.
|
|
|
•
|
|
For the second consecutive year, the Retail Bank was named a Gallup Great WorkPlace Award Winner, reflecting our brand attributes of ease, confidence
and achievement. This recognition reflects our commitment to having an engaged workforce.
|
|
|
•
|
|
PNC’s expansive branch footprint covers nearly one-third of the U.S. population with a network of 2,461 branches and 6,626 ATM machines at
September 30, 2010. We continue to invest in the branch network. In the first nine months of 2010, we opened 17 traditional and 18 in-store branches, and consolidated 87 branches. The decrease in branches was primarily driven by
acquisition-related branch consolidations.
|
Total revenue for the first nine months of 2010 was $4.1 billion compared with
$4.3 billion for the same period in 2009. Net interest income of $2.6 billion declined $81 million compared with the first nine months of 2009. Net interest income was negatively impacted by lower interest credits assigned to deposits, reflective of
the rate environment, and benefited from the consolidation of the securitized credit card portfolio, higher demand deposits, and increased education loans.
Noninterest income declined $160 million over the first nine months of 2009. The decrease was due to a decrease in service charges on deposits related to lower overdraft charges, the negative impact of
the consolidation of the securitized credit card portfolio, lower brokerage fees, and the impact of the
required branch divestitures partially offset by, higher transaction volume-related fees within consumer services.
In 2010, Retail Banking revenues are negatively impacted by the implementation of new federal regulations. These regulations include: 1) the new rules set forth in Regulation E related to overdraft
charges, 2) the Credit CARD Act of 2009, and 3) the education lending portions of the Health Care and Education Reconciliation Act of 2010 (HCERA).
The negative impact of Regulation E on revenue for the fourth quarter of 2010 is expected to be approximately $100 million, or approximately $55 million more than its impact on the third quarter of 2010.
Additionally, the full year 2010 negative impact of the Credit CARD Act on revenues will be approximately $75 million. A portion of this impact will be in the fourth quarter of 2010. These estimates do not include additional impacts to revenue for
other changes that may be made in 2010 responding to market conditions, or other/additional regulatory requirements, or any offsetting impact of changes to products and/or pricing.
The education lending business will be adversely impacted by provisions of HCERA that went into effect on July 1, 2010. The law essentially eliminates the Federal Family Education Loan Program
(FFELP), the federally guaranteed portion of this business available to private lenders. For 2009, we originated $2.6 billion of federally guaranteed loans under FFELP. We plan to continue to provide private education loans as another source of
funding for students and families.
See additional information regarding Dodd-Frank in the Executive Summary section of this Financial Review.
Over at least the next year, as regulatory agencies issue proposed and final regulations and as the new Consumer Financial Protection Bureau is organized, we will continue to evaluate the impact of Dodd-Frank.
The provision for credit losses was $946 million through September 30, 2010 compared with $921 million over the same period in 2009. Net charge-offs
were $845 million for the first nine months of 2010 compared with $687 million in the same period last year. The year-over-year increase in provision and net charge-offs is due to the deteriorating economy that occurred throughout 2009, as well as
an increase of $1.8 billion in average credit card loans primarily due to the consolidation of the $1.6 billion of credit card loans as of January 1, 2010, as previously mentioned. Credit quality has shown signs of stabilization during the
first nine months of 2010 with a declining net charge-off trend in each of the first three quarters.
Noninterest expense for the first nine
months of the year declined $151 million from the same period last year. Expenses were well-managed as continued investments in distribution channels were more than offset by acquisition cost savings and the required branch divestitures.
30
Growing core checking deposits as a
lower-cost funding source and as the cornerstone product to build customer relationships is the primary objective of our deposit strategy. Furthermore, core checking accounts are critical to our strategy of expanding our payments business. The
deposit strategy of Retail Banking is to remain disciplined on pricing, target specific products and markets for growth, and focus on the retention and growth of balances for relationship customers.
In the first nine months of 2010, average total deposits decreased $9.0 billion, or 7%, compared with 2009.
|
|
•
|
|
Average demand deposits increased $2.1 billion, or 6%, over the first nine months of 2009. The increase was primarily driven by customer growth and
customer preferences for liquidity.
|
|
|
•
|
|
Average money market deposits increased $644 million, or 2%, from the first nine months of 2009. The increase was primarily due to core money market
growth as customers generally prefer more liquid deposits in a low rate environment.
|
|
|
•
|
|
In the first nine months of 2010, average certificates of deposit decreased $12.0 billion from the same period last year. A continued decline in
certificates of deposit is expected in the fourth quarter of 2010 due to the planned run off of higher rate certificates of deposit that were primarily obtained through the National City acquisition.
|
Currently, we plan to maintain our focus on a relationship-based lending strategy that targets specific customer sectors (mass consumers, homeowners,
students, small businesses and auto dealerships) and our moderate risk lending approach. In the first nine months of 2010, average total loans were $58.9 billion, an increase of $2.2 billion, or 4%, over the same period last year.
|
|
•
|
|
Average education loans grew $3.1 billion compared with the first nine months of 2009 primarily due to increases in federal loan volumes as a result of
non-bank competitors exiting from the business, portfolio purchases, and the impact of our current strategy of holding education loans on the balance sheet. As previously noted, the federally guaranteed portion of this business was essentially
eliminated going forward beginning July 1, 2010 due to HCERA.
|
|
|
•
|
|
Average credit card balances increased $1.8 billion over the first nine months of 2009. The increase was primarily the result of the consolidation of
the securitized credit card portfolio effective January 1, 2010.
|
|
|
•
|
|
Average home equity loans declined $964 million over the same period of 2009. Consumer loan demand has slowed as a result of the current economic
environment. The decline is driven by loan demand being outpaced by paydowns, refinancings, and charge-offs. Retail Banking’s home equity loan portfolio is relationship based, with 96% of the portfolio attributable to borrowers in our primary
geographic footprint. The nonperforming assets and charge-offs that we have experienced are within our expectations given current market conditions.
|
|
|
•
|
|
Average commercial and commercial real estate loans declined $1.2 billion compared with the first nine months of 2009. The decline was primarily due to
loan demand being outpaced by refinancings, paydowns, charge-offs and the required branch divestitures (approximately $0.3 billion of the decline on average).
|
31
C
ORPORATE
& I
NSTITUTIONAL
B
ANKING
(Unaudited)
|
|
|
|
|
|
|
|
|
|
|
Nine months ended September 30
Dollars in millions except as noted
|
|
2010 (a)
|
|
|
2009
|
|
|
I
NCOME
S
TATEMENT
|
|
|
|
|
|
|
|
|
|
Net interest income
|
|
$
|
2,633
|
|
|
$
|
2,824
|
|
|
Noninterest income
|
|
|
|
|
|
|
|
|
|
Corporate service fees
|
|
|
627
|
|
|
|
680
|
|
|
Other
|
|
|
277
|
|
|
|
385
|
|
|
Noninterest income
|
|
|
904
|
|
|
|
1,065
|
|
|
Total revenue
|
|
|
3,537
|
|
|
|
3,889
|
|
|
Provision for credit losses
|
|
|
285
|
|
|
|
1,320
|
|
|
Noninterest expense
|
|
|
1,312
|
|
|
|
1,356
|
|
|
Pretax earnings
|
|
|
1,940
|
|
|
|
1,213
|
|
|
Income taxes
|
|
|
710
|
|
|
|
438
|
|
|
Earnings
|
|
$
|
1,230
|
|
|
$
|
775
|
|
|
A
VERAGE
B
ALANCE
S
HEET
|
|
|
|
|
|
|
|
|
|
Loans
|
|
|
|
|
|
|
|
|
|
Commercial
|
|
$
|
33,019
|
|
|
$
|
38,755
|
|
|
Commercial real estate
|
|
|
16,948
|
|
|
|
19,346
|
|
|
Commercial – real estate related
|
|
|
3,016
|
|
|
|
3,922
|
|
|
Asset-based lending
|
|
|
6,124
|
|
|
|
6,443
|
|
|
Equipment lease financing
|
|
|
5,444
|
|
|
|
5,397
|
|
|
Total loans
|
|
|
64,551
|
|
|
|
73,863
|
|
|
Goodwill and other intangible assets
|
|
|
3,669
|
|
|
|
3,532
|
|
|
Loans held for sale
|
|
|
1,415
|
|
|
|
1,728
|
|
|
Other assets
|
|
|
8,129
|
|
|
|
7,268
|
|
|
Total assets
|
|
$
|
77,764
|
|
|
$
|
86,391
|
|
|
Deposits
|
|
|
|
|
|
|
|
|
|
Noninterest-bearing demand
|
|
$
|
23,759
|
|
|
$
|
18,756
|
|
|
Money market
|
|
|
12,246
|
|
|
|
9,402
|
|
|
Other
|
|
|
7,097
|
|
|
|
7,636
|
|
|
Total deposits
|
|
|
43,102
|
|
|
|
35,794
|
|
|
Other liabilities
|
|
|
11,542
|
|
|
|
9,357
|
|
|
Capital
|
|
|
7,593
|
|
|
|
7,810
|
|
|
Total liabilities and equity
|
|
$
|
62,237
|
|
|
$
|
52,961
|
|
|
|
|
|
|
|
|
|
|
|
|
Nine months ended September 30
Dollars in millions except as noted
|
|
2010 (a)
|
|
|
2009
|
|
|
P
ERFORMANCE
R
ATIOS
|
|
|
|
|
|
|
|
|
|
Return on average capital
|
|
|
22
|
%
|
|
|
13
|
%
|
|
Return on average assets
|
|
|
2.11
|
|
|
|
1.20
|
|
|
Noninterest income to total revenue
|
|
|
26
|
|
|
|
27
|
|
|
Efficiency
|
|
|
37
|
|
|
|
35
|
|
|
C
OMMERCIAL
M
ORTGAGE
S
ERVICING
P
ORTFOLIO
(in
billions)
|
|
|
|
|
|
|
|
|
|
Beginning of period
|
|
$
|
287
|
|
|
$
|
270
|
|
|
Acquisitions/additions
|
|
|
23
|
|
|
|
31
|
|
|
Repayments/transfers
|
|
|
(47
|
)
|
|
|
(26
|
)
|
|
End of period
|
|
$
|
263
|
|
|
$
|
275
|
|
|
O
THER
I
NFORMATION
|
|
|
|
|
|
|
|
|
|
Consolidated revenue from: (b)
|
|
|
|
|
|
|
|
|
|
Treasury Management
|
|
$
|
919
|
|
|
$
|
841
|
|
|
Capital Markets
|
|
$
|
411
|
|
|
$
|
346
|
|
|
Commercial mortgage loans held for
sale (c)
|
|
$
|
49
|
|
|
$
|
138
|
|
|
Commercial mortgage loan servicing (d)
|
|
|
97
|
|
|
|
214
|
|
|
Total commercial mortgage
banking activities
|
|
$
|
146
|
|
|
$
|
352
|
|
|
Total loans (e)
|
|
$
|
62,388
|
|
|
$
|
68,352
|
|
|
Credit-related statistics:
|
|
|
|
|
|
|
|
|
|
Nonperforming assets (e) (f)
|
|
$
|
3,064
|
|
|
$
|
2,992
|
|
|
Impaired loans (e) (g)
|
|
$
|
890
|
|
|
$
|
1,482
|
|
|
Net charge-offs
|
|
$
|
725
|
|
|
$
|
711
|
|
|
Net carrying amount of commercial
mortgage servicing rights (e)
|
|
$
|
616
|
|
|
$
|
897
|
|
|
(a)
|
Information as of nine months ended September 30, 2010 reflects the impact of the consolidation in our financial statements of Market Street effective
January 1, 2010. Includes $1.5 billion of loans, net of eliminations, and $2.6 billion of commercial paper borrowings included in Other liabilities.
|
|
(b)
|
Represents consolidated PNC amounts.
|
|
(c)
|
Includes valuations on commercial mortgage loans held for sale and related commitments, derivative valuations, origination fees, gains on sale of loans held for sale
and net interest income on loans held for sale.
|
|
(d)
|
Includes net interest income and noninterest income from loan servicing and ancillary services and commercial mortgage servicing rights valuations.
|
|
(f)
|
Includes nonperforming loans of $2.9 billion at both September 30, 2010 and September 30, 2009.
|
|
(g)
|
Recorded investment of purchased impaired loans related to National City, adjusted to reflect additional loan impairments effective December 31, 2008.
|
Corporate & Institutional Banking earned $1.2 billion in the first nine months of 2010 compared with $775 million in
the first nine months of 2009. Significantly higher earnings for the first nine months of 2010 reflected a lower provision for credit losses and lower noninterest expense which more than offset declines in net interest income and noninterest income
compared with the 2009 period.
Highlights of Corporate & Institutional Banking performance over the first nine months of 2010
include:
|
|
•
|
|
Net interest income for the first nine months of 2010 was $2.6 billion, a decrease of $191 million from 2009, impacted by a decrease in average loans
and lower interest credits assigned to deposits.
|
|
|
•
|
|
Corporate service fees were $627 million for the first nine months of 2010, a decrease of $53 million over the same period a year ago primarily due to
a
|
32
|
|
|
reduction in the value of commercial mortgage servicing rights largely driven by lower interest rates somewhat offset by higher merger and acquisition advisory and ancillary commercial mortgage
servicing fees. The major components of corporate service fees are treasury management, corporate finance fees and commercial mortgage servicing revenue.
|
|
|
•
|
|
Our Treasury Management business, which is ranked in the top ten nationally, continues to invest in the healthcare initiative which is designed to help
provide our customers opportunities to reduce operating costs. Healthcare-related revenues in the first nine months of 2010 increased over 20% from the same period of last year.
|
|
|
•
|
|
Harris Williams is one of the nation’s largest and most successful mergers and acquisitions advisory teams focused exclusively on the middle
markets. Revenues increased over $40 million in the first nine months of 2010 compared with the same period in 2009 on higher deal activity driven by the improved financing environment. Harris Williams recently established its first overseas
operation in London.
|
|
|
•
|
|
Midland Loan Services is one of the leading third-party providers of loan servicing, asset management and technology solutions for the commercial real
estate finance industry. Midland is the only company in the industry with the highest U.S. servicer and special servicer ratings from Fitch Ratings and Standard & Poor’s and has achieved these highest ratings for 11 consecutive years.
|
|
|
•
|
|
The commercial mortgage servicing portfolio was $263 billion at September 30, 2010 compared with $275 billion at September 30, 2009. The
decrease was driven by the sale of a duplicative agency servicing operation acquired with National City during the second quarter of 2010 partially offset by the continued growth in the agency and conventional servicing portfolios.
|
|
•
|
|
Other noninterest income was $277 million for 2010, a decrease of $108 million from the same period in 2009 primarily due to lower gains on loan sales
from portfolio management activities, the sale of the duplicative agency servicing operation in the second quarter of 2010, and a decline in the value of commercial mortgage loans held for sale, net of hedges.
|
|
•
|
|
The provision for credit losses was $285 million in the first nine months of 2010 compared with $1.3 billion in the first nine months of 2009. The
decline reflected improvements in portfolio credit quality along with lower loan and commitment levels. Net charge-offs for the first
|
|
|
|
nine months of 2010 were $725 million compared with $711 million for the first nine months of 2009. Net charge-offs continued to show signs of slowing in the middle market and asset-based lending
portfolios.
|
|
•
|
|
Noninterest expense was $1.3 billion for 2010, a decrease of $44 million from the same period in 2009. The decline resulted in part from the second
quarter 2010 sale of the duplicative agency servicing operation. In addition, the first nine months of 2009 included net losses on the disposition of repossessed assets and lease residual impairment charges.
|
|
•
|
|
Average loans were $65 billion for the first nine months of 2010 compared with $74 billion in the first nine months of 2009. Average loans for 2010
included the impact of the consolidation of Market Street. Excluding the impact of the Market Street consolidation, average loans decreased $11 billion or 15% compared with 2009. The decrease was due to exits of certain client relationships combined
with continued soft utilization rates.
|
|
•
|
|
PNC Real Estate is one of the industry’s top providers of both conventional and affordable multifamily financing. It specializes in providing
access to federal agency loan programs and is a top Fannie Mae DUS, FHA/Ginnie Mae and Freddie MAC Program Plus lender. Commercial real estate loans declined due to reduced demand, paydowns and charge-offs.
|
|
•
|
|
PNC Business Credit is one of the top asset-based lenders in the country and plans to expand its operations with the pending acquisition of an
asset-based lending group in the United Kingdom.
|
|
•
|
|
PNC Equipment Finance is the 6th largest bank-affiliated leasing company with over $9 billion in equipment finance assets. Average loans and leases
declined approximately $.2 billion for the first nine months of 2010 compared with the first nine months of 2009 due to runoff and sales of non-strategic portfolios more than offsetting portfolio acquisitions and improved origination volumes within
our middle market customer base.
|
|
•
|
|
Average deposits were $43 billion for the first nine months of 2010, an increase of $7.3 billion, or 20%, compared with the 2009 period. During 2010,
customers continued to move balances from off-balance sheet sweep products to noninterest-bearing demand deposits and deposit inflows continued from National City customers who had previously moved funds to other institutions.
|
See the additional revenue discussion regarding treasury management, capital markets-related products and services, and
commercial mortgage banking activities on page 10.
33
A
SSET
M
ANAGEMENT
G
ROUP
(Unaudited)
|
|
|
|
|
|
|
|
|
|
|
Nine months ended September 30
Dollars in millions except as noted
|
|
2010
|
|
|
2009
|
|
|
I
NCOME
S
TATEMENT
|
|
|
|
|
|
|
|
|
|
Net interest income
|
|
$
|
197
|
|
|
$
|
241
|
|
|
Noninterest income
|
|
|
468
|
|
|
|
460
|
|
|
Total revenue
|
|
|
665
|
|
|
|
701
|
|
|
Provision for credit losses
|
|
|
11
|
|
|
|
72
|
|
|
Noninterest expense
|
|
|
477
|
|
|
|
499
|
|
|
Pretax earnings
|
|
|
177
|
|
|
|
130
|
|
|
Income taxes
|
|
|
65
|
|
|
|
48
|
|
|
Earnings
|
|
$
|
112
|
|
|
$
|
82
|
|
|
A
VERAGE
B
ALANCE
S
HEET
|
|
|
|
|
|
|
|
|
|
Loans
|
|
|
|
|
|
|
|
|
|
Consumer
|
|
$
|
4,006
|
|
|
$
|
3,928
|
|
|
Commercial and commercial real estate
|
|
|
1,503
|
|
|
|
1,682
|
|
|
Residential mortgage
|
|
|
893
|
|
|
|
1,104
|
|
|
Total loans
|
|
|
6,402
|
|
|
|
6,714
|
|
|
Goodwill and other intangible assets
|
|
|
404
|
|
|
|
404
|
|
|
Other assets
|
|
|
237
|
|
|
|
249
|
|
|
Total assets
|
|
$
|
7,043
|
|
|
$
|
7,367
|
|
|
Deposits
|
|
|
|
|
|
|
|
|
|
Noninterest-bearing demand
|
|
$
|
1,288
|
|
|
$
|
1,080
|
|
|
Interest-bearing demand
|
|
|
1,768
|
|
|
|
1,550
|
|
|
Money market
|
|
|
3,245
|
|
|
|
3,233
|
|
|
Total transaction deposits
|
|
|
6,301
|
|
|
|
5,863
|
|
|
Certificates of deposit and other
|
|
|
766
|
|
|
|
1,129
|
|
|
Total deposits
|
|
|
7,067
|
|
|
|
6,992
|
|
|
Other liabilities
|
|
|
95
|
|
|
|
101
|
|
|
Capital
|
|
|
544
|
|
|
|
582
|
|
|
Total liabilities and equity
|
|
$
|
7,706
|
|
|
$
|
7,675
|
|
|
P
ERFORMANCE
R
ATIOS
|
|
|
|
|
|
|
|
|
|
Return on average capital
|
|
|
28
|
%
|
|
|
19
|
%
|
|
Return on average assets
|
|
|
2.13
|
|
|
|
1.49
|
|
|
Noninterest income to total revenue
|
|
|
70
|
|
|
|
66
|
|
|
Efficiency
|
|
|
72
|
|
|
|
71
|
|
|
O
THER
I
NFORMATION
|
|
|
|
|
|
|
|
|
|
Total nonperforming assets (a) (b)
|
|
$
|
102
|
|
|
$
|
129
|
|
|
Impaired loans (a) (c)
|
|
$
|
155
|
|
|
$
|
206
|
|
|
Total net charge-offs
|
|
$
|
21
|
|
|
$
|
41
|
|
|
|
|
|
|
ASSETS UNDER
ADMINISTRATION
(in billions) (a) (d)
|
|
|
|
|
|
|
|
|
|
Personal
|
|
$
|
95
|
|
|
$
|
93
|
|
|
Institutional
|
|
|
111
|
|
|
|
124
|
|
|
Total
|
|
$
|
206
|
|
|
$
|
217
|
|
|
Asset Type
|
|
|
|
|
|
|
|
|
|
Equity
|
|
$
|
107
|
|
|
$
|
98
|
|
|
Fixed Income
|
|
|
66
|
|
|
|
56
|
|
|
Liquidity/Other
|
|
|
33
|
|
|
|
63
|
|
|
Total
|
|
$
|
206
|
|
|
$
|
217
|
|
|
Discretionary assets under management
|
|
|
|
|
|
|
|
|
|
Personal
|
|
$
|
67
|
|
|
$
|
66
|
|
|
Institutional
|
|
|
38
|
|
|
|
38
|
|
|
Total
|
|
$
|
105
|
|
|
$
|
104
|
|
|
Asset Type
|
|
|
|
|
|
|
|
|
|
Equity
|
|
$
|
51
|
|
|
$
|
47
|
|
|
Fixed Income
|
|
|
38
|
|
|
|
34
|
|
|
Liquidity/Other
|
|
|
16
|
|
|
|
23
|
|
|
Total
|
|
$
|
105
|
|
|
$
|
104
|
|
|
Nondiscretionary assets under administration
|
|
|
|
|
|
|
|
|
|
Personal
|
|
$
|
28
|
|
|
$
|
27
|
|
|
Institutional
|
|
|
73
|
|
|
|
86
|
|
|
Total
|
|
$
|
101
|
|
|
$
|
113
|
|
|
Asset Type
|
|
|
|
|
|
|
|
|
|
Equity
|
|
$
|
56
|
|
|
$
|
51
|
|
|
Fixed Income
|
|
|
28
|
|
|
|
22
|
|
|
Liquidity/Other
|
|
|
17
|
|
|
|
40
|
|
|
Total
|
|
$
|
101
|
|
|
$
|
113
|
|
|
(b)
|
Includes nonperforming loans of $94 million at September 30, 2010 and $124 million at September 30, 2009.
|
|
(c)
|
Recorded investment of purchased impaired loans related to National City, adjusted to reflect additional loan impairments effective December 31, 2008.
|
|
(d)
|
Excludes brokerage account assets.
|
Asset
Management Group earned $112 million for the first nine months of 2010 compared with $82 million for the same period in 2009. Assets under administration were $206 billion at September 30, 2010 and $217 billion at September 30, 2009. The
first nine months of 2010 reflected a lower provision for credit losses, lower expenses from disciplined expense management and higher noninterest income. These improvements were partially offset by a decrease in net interest income from lower
yields on loans.
Highlights of Asset Management Group’s performance during the first nine months of 2010 include the following:
|
•
|
|
Successfully executed its National City trust system conversions,
|
|
•
|
|
Outperformed its sales and client acquisition goals,
|
|
•
|
|
Exceeded expense management targets, and
|
|
•
|
|
Credit performance showed signs of stabilization.
|
Assets under administration of $206 billion at September 30, 2010 decreased $11 billion compared with the balance at September 30, 2009. Discretionary assets under management of $105 billion at
September 30, 2010 increased $1 billion compared with the balance at September 30, 2009 as year-over-year improvement in the equity markets and strong sales results were mitigated by integration impacts. Nondiscretionary assets under
administration of $101 billion declined $12 billion from 2009 due to the strategic exit of noncore businesses.
Total revenue for the first
nine months of 2010 was $665 million compared with $701 million for the same period in 2009. Net interest income for the first nine months of 2010 decreased $44 million compared with the first nine months of 2009, primarily due to a reduction in
higher yield loans. Noninterest income of $468 million for the first nine months of 2010 increased $8 million compared with the first nine months of 2009 as the impacts of strong sales results and the improved equity markets were partially offset by
the strategic exit of noncore businesses.
The provision for credit losses was $11 million for the first nine months of 2010 compared with $72
million for the first nine months of 2009. Net charge-offs were $21 million for the first nine months of 2010 and $41 million for the first nine months of 2009. Credit quality has shown signs of stabilization in the first nine months of 2010.
Noninterest expense of $477 million in the first nine months of 2010 decreased $22 million or 4% from the same period in 2009. The decline is
attributable to disciplined expense management including integration-related initiatives. The implementation of efficiency initiatives will continue through the remainder of 2010.
34
Average deposits for the first nine
months of 2010 increased $75 million from the comparable period last year as a 7% increase in transaction deposits more than offset the strategic exit of higher rate certificates of deposit. Average loan balances decreased $312 million, or 5%, from
the first nine months of 2009 as commercial and residential mortgage declines more than offset growth in home equity loans.
R
ESIDENTIAL
M
ORTGAGE
B
ANKING
(Unaudited)
|
|
|
|
|
|
|
|
|
|
|
Nine months ended September 30
Dollars in millions, except as noted
|
|
2010
|
|
|
2009
|
|
|
I
NCOME
S
TATEMENT
|
|
|
|
|
|
|
|
|
|
Net interest income
|
|
$
|
206
|
|
|
$
|
261
|
|
|
Noninterest income
|
|
|
|
|
|
|
|
|
|
Loan servicing revenue
|
|
|
|
|
|
|
|
|
|
Servicing fees
|
|
|
196
|
|
|
|
171
|
|
|
Net MSR hedging gains
|
|
|
198
|
|
|
|
320
|
|
|
Loan sales revenue
|
|
|
165
|
|
|
|
409
|
|
|
Other
|
|
|
9
|
|
|
|
(9
|
)
|
|
Total noninterest income
|
|
|
568
|
|
|
|
891
|
|
|
Total revenue
|
|
|
774
|
|
|
|
1,152
|
|
|
Provision for (recoveries of) credit losses
|
|
|
(3
|
)
|
|
|
3
|
|
|
Noninterest expense
|
|
|
349
|
|
|
|
490
|
|
|
Pretax earnings
|
|
|
428
|
|
|
|
659
|
|
|
Income taxes
|
|
|
156
|
|
|
|
249
|
|
|
Earnings
|
|
$
|
272
|
|
|
$
|
410
|
|
|
A
VERAGE
B
ALANCE
S
HEET
|
|
|
|
|
|
|
|
|
|
Portfolio loans
|
|
$
|
2,643
|
|
|
$
|
1,780
|
|
|
Loans held for sale
|
|
|
1,184
|
|
|
|
2,498
|
|
|
Mortgage servicing rights (MSR)
|
|
|
1,069
|
|
|
|
1,318
|
|
|
Other assets
|
|
|
4,007
|
|
|
|
2,693
|
|
|
Total assets
|
|
$
|
8,903
|
|
|
$
|
8,289
|
|
|
Deposits
|
|
$
|
2,927
|
|
|
$
|
4,306
|
|
|
Borrowings and other liabilities
|
|
|
2,614
|
|
|
|
2,861
|
|
|
Capital
|
|
|
1,320
|
|
|
|
1,322
|
|
|
Total liabilities and equity
|
|
$
|
6,861
|
|
|
$
|
8,489
|
|
|
P
ERFORMANCE
R
ATIOS
|
|
|
|
|
|
|
|
|
|
Return on average capital
|
|
|
28
|
%
|
|
|
41
|
%
|
|
Return on average assets
|
|
|
4.08
|
|
|
|
6.61
|
|
|
Noninterest income to total revenue
|
|
|
73
|
|
|
|
77
|
|
|
Efficiency
|
|
|
45
|
|
|
|
43
|
|
|
O
THER
I
NFORMATION
|
|
|
|
|
|
|
|
|
|
Servicing portfolio for others (in billions) (a)
|
|
$
|
131
|
|
|
$
|
158
|
|
|
Fixed rate
|
|
|
89
|
%
|
|
|
88
|
%
|
|
Adjustable rate/balloon
|
|
|
11
|
%
|
|
|
12
|
%
|
|
Weighted average interest rate
|
|
|
5.69
|
%
|
|
|
5.89
|
%
|
|
MSR capitalized value (in billions)
|
|
$
|
0.8
|
|
|
$
|
1.3
|
|
|
MSR capitalization value (in basis points)
|
|
|
60
|
|
|
|
81
|
|
|
Weighted average servicing fee (in basis points)
|
|
|
30
|
|
|
|
30
|
|
|
Loan origination volume (in billions)
|
|
$
|
7.0
|
|
|
$
|
16.9
|
|
|
Percentage of originations represented by:
|
|
|
|
|
|
|
|
|
|
Agency and government programs
|
|
|
99
|
%
|
|
|
97
|
%
|
|
Refinance volume
|
|
|
69
|
%
|
|
|
74
|
%
|
|
Total nonperforming assets (a) (b)
|
|
$
|
327
|
|
|
$
|
343
|
|
|
Impaired loans (a) (c)
|
|
$
|
173
|
|
|
$
|
412
|
|
|
(b)
|
Includes nonperforming loans of $104 million at September 30, 2010 and $180 million at September 30, 2009.
|
|
(c)
|
Recorded investment of purchased impaired loans related to National City, adjusted to reflect additional loan impairments effective December 31, 2008.
|
Residential Mortgage Banking earned $272 million for the first nine months of 2010 compared with $410
million in the first nine months of 2009. Earnings decreased from the first nine months of 2009 primarily due to reduced loan sales revenue and lower net hedging gains on mortgage servicing rights, partially offset by lower noninterest expense.
Residential Mortgage Banking overview:
|
|
•
|
|
Total loan originations were $7.0 billion for the first nine months of 2010 compared with $16.9 billion for the first nine months of 2009. Lower
mortgage rates in the first nine months of 2009 resulted in high loan application and origination volumes. Even though mortgage interest rates fell considerably near the end of the second quarter of 2010, management does not expect to experience the
same level of loan refinance origination volume as occurred in 2009. Loans continued to be primarily originated through direct channels under FNMA, FHLMC and FHA/VA agency guidelines.
|
Investors may request PNC to indemnify them against losses on certain loans or to repurchase loans that they believe do not comply with
applicable representations. At September 30, 2010, the liability for estimated losses on repurchase and indemnification claims for the Residential Mortgage Banking business segment was $155 million. We recognized $53 million of additional
reserves in the third quarter of 2010.
|
|
•
|
|
Residential mortgage loans serviced for others totaled $131 billion at September 30, 2010 compared with $158 billion at September 30, 2009.
Payoffs continued to outpace new direct loan origination volume during the first nine months of 2010. The decline from a year earlier also reflected the sale of a $7.9 billion servicing portfolio in the fourth quarter of 2009.
|
|
|
•
|
|
Noninterest income was $568 million in the first nine months of 2010 compared with $891 million in the first nine months of 2009. The decline was due
to reduced loan sales revenue, net of additional repurchase reserves, reflective of strong loan origination refinance volume in the first nine months of 2009 and lower net hedging gains on mortgage servicing rights.
|
|
|
•
|
|
Net interest income was $206 million for the first nine months of 2010 compared with $261 million for the first nine months of 2009. The decrease
resulted from lower escrow deposit balances and residential mortgage loans held for sale.
|
|
|
•
|
|
Noninterest expense declined to $349 million in the first nine months of 2010 compared with $490 million in the first nine months of 2009 as lower loan
origination volume drove a reduction in expense.
|
|
|
•
|
|
The fair value of mortgage servicing rights was $.8 billion at September 30, 2010 compared with $1.3 billion at September 30, 2009. The
decline in fair value resulted from lower mortgage rates at September 30, 2010 and a smaller servicing portfolio.
|
35
B
LACK
R
OCK
Information related to our equity investment in BlackRock follows:
|
|
|
|
|
|
|
|
|
|
|
Nine months ended September 30
Dollars in millions
|
|
2010
|
|
|
2009
|
|
|
Business segment earnings (a)
|
|
$
|
253
|
|
|
$
|
151
|
|
|
PNC’s share of BlackRock earnings (b)
|
|
|
23
|
%
|
|
|
31
|
%
|
|
(a)
|
Includes PNC’s share of BlackRock’s reported GAAP earnings and additional income taxes on those earnings incurred by PNC.
|
|
|
|
|
|
|
|
|
|
|
|
In billions
|
|
Sept. 30
2010
|
|
|
Dec. 31
2009
|
|
|
Carrying value of PNC’s investment in
BlackRock (c)
|
|
$
|
6.0
|
|
|
$
|
5.8
|
|
|
Market value of PNC’s investment in
BlackRock (d)
|
|
|
7.4
|
|
|
|
10.1
|
|
|
(c)
|
The September 30, 2010 amount is comprised of our equity investment of $5.9 billion and $.1 billion of goodwill and accumulated other comprehensive income related
to our BlackRock investment. The comparable amounts at December 31, 2009 were $5.7 billion and $.1 billion. PNC accounts for its investment in BlackRock under the equity method of accounting, exclusive of a related $1.9 billion deferred tax
liability as of September 30, 2010 and December 31, 2009.
|
|
(d)
|
Does not include liquidity discount.
|
B
LACK
R
OCK
S
ECONDARY
C
OMMON
S
TOCK
O
FFERING
On November 3, 2010, BlackRock announced the commencement of a secondary offering of 42 million shares of its common stock.
Of the shares being offered, 34.5 million shares are being offered by another BlackRock shareholder and up to 7.5 million common
shares are being offered by PNC. The proposed sale includes common shares issuable upon conversion of shares of BlackRock’s Series B Preferred Stock. Although we have elected to adjust our stake in BlackRock, we continue to consider our
investment in BlackRock a key component of our diversified revenue strategy.
B
LACK
R
OCK
/B
ARCLAYS
G
LOBAL
I
NVESTORS
T
RANSACTION
As more fully described in Item 7 of our 2009 Form 10-K, on December 1, 2009, BlackRock acquired BGI from Barclays Bank PLC
in exchange for approximately $6.65 billion in cash and 37,566,771 shares of BlackRock common and participating preferred stock. In connection with the BGI transaction, BlackRock entered into a stock purchase agreement with PNC in which we purchased
3,556,188 shares of BlackRock’s Series D Preferred Stock at a price of $140.60 per share, or $500 million, to partially finance the transaction. On January 31, 2010, the Series D Preferred Stock was converted to Series B Preferred Stock.
B
LACK
R
OCK
LTIP
AND
E
XCHANGE
A
GREEMENTS
PNC’s noninterest income for the first nine months of 2009 included a pretax gain of $98 million
related to our BlackRock LTIP shares obligation. This gain represented the mark-to-market adjustment related to our remaining BlackRock LTIP common shares obligation and resulted from the decrease in the market value of BlackRock common shares in
that period.
Item 7 of our 2009 Form 10-K describes the Exchange Agreement that PNC entered into with BlackRock on December 26,
2008 and the Exchange Agreement that BlackRock entered into with Merrill Lynch on that same date and the resulting impact on PNC’s equity ownership interest in BlackRock that was effective February 27, 2009. The PNC and Merrill Lynch
Exchange Agreements restructured PNC’s and Merrill Lynch’s respective ownership of BlackRock common and preferred equity.
In
connection with the PNC Exchange Agreement, PNC’s obligation to deliver BlackRock common shares in connection with the BlackRock LTIP was replaced with an obligation to deliver shares of BlackRock’s new Series C Preferred Stock. PNC
acquired 2.9 million shares of Series C Preferred Stock from BlackRock in exchange for common shares on that same date. PNC accounts for its BlackRock Series C Preferred Stock at fair value, which offsets the impact of marking-to-market the
obligation to deliver these shares to BlackRock. The fair value amount of the BlackRock Series C Preferred Stock is included on our Consolidated Balance Sheet in the caption Other assets. Additional information regarding the valuation of the
BlackRock Series C Preferred Stock is included in Note 8 Fair Value in the Notes To Consolidated Financial Statements of this Report.
PNC
accounts for its remaining investment in BlackRock under the equity method of accounting. As a result of the Exchange Agreements, our percentage ownership of BlackRock common stock (approximately 35% at September 30, 2010) is higher than our
overall share of BlackRock’s equity and earnings. The transactions related to the Exchange Agreements do not affect our right to receive dividends declared by BlackRock.
36
D
ISTRESSED
A
SSETS
P
ORTFOLIO
(Unaudited)
|
|
|
|
|
|
|
|
|
|
|
Nine months ended September 30
Dollars in millions, except as noted
|
|
2010
|
|
|
2009
|
|
|
I
NCOME
S
TATEMENT
|
|
|
|
|
|
|
|
|
|
Net interest income
|
|
$
|
964
|
|
|
$
|
861
|
|
|
Noninterest income (loss)
|
|
|
(37
|
)
|
|
|
71
|
|
|
Total revenue
|
|
|
927
|
|
|
|
932
|
|
|
Provision for credit losses
|
|
|
745
|
|
|
|
457
|
|
|
Noninterest expense
|
|
|
169
|
|
|
|
197
|
|
|
Pretax earnings
|
|
|
13
|
|
|
|
278
|
|
|
Income taxes
|
|
|
5
|
|
|
|
106
|
|
|
Earnings
|
|
$
|
8
|
|
|
$
|
172
|
|
|
A
VERAGE
B
ALANCE
S
HEET
|
|
|
|
|
|
|
|
|
|
C
OMMERCIAL
LENDING
:
|
|
|
|
|
|
|
|
|
|
Commercial/Commercial real estate (a)
|
|
$
|
2,374
|
|
|
$
|
3,565
|
|
|
Lease financing
|
|
|
788
|
|
|
|
823
|
|
|
Total commercial lending
|
|
|
3,162
|
|
|
|
4,388
|
|
|
C
ONSUMER
LENDING
:
|
|
|
|
|
|
|
|
|
|
Consumer (b)
|
|
|
6,354
|
|
|
|
7,236
|
|
|
Residential real estate
|
|
|
7,835
|
|
|
|
10,243
|
|
|
Total consumer lending
|
|
|
14,189
|
|
|
|
17,479
|
|
|
Total portfolio loans
|
|
|
17,351
|
|
|
|
21,867
|
|
|
Other assets
|
|
|
895
|
|
|
|
1,760
|
|
|
Total assets
|
|
$
|
18,246
|
|
|
$
|
23,627
|
|
|
Deposits
|
|
$
|
89
|
|
|
$
|
42
|
|
|
Other liabilities
|
|
|
78
|
|
|
|
100
|
|
|
Capital
|
|
|
1,351
|
|
|
|
1,576
|
|
|
Total liabilities and equity
|
|
$
|
1,518
|
|
|
$
|
1,718
|
|
|
P
ERFORMANCE
R
ATIOS
|
|
|
|
|
|
|
|
|
|
Return on average capital
|
|
|
1
|
%
|
|
|
15
|
%
|
|
Return on average assets
|
|
|
.06
|
|
|
|
.97
|
|
|
O
THER
I
NFORMATION
|
|
|
|
|
|
|
|
|
|
Nonperforming assets (c) (d)
|
|
$
|
1,218
|
|
|
$
|
1,473
|
|
|
Impaired loans (c) (e)
|
|
$
|
6,001
|
|
|
$
|
7,803
|
|
|
Net charge-offs (f)
|
|
$
|
494
|
|
|
$
|
423
|
|
|
Annualized net charge-off ratio (f)
|
|
|
3.81
|
%
|
|
|
2.59
|
%
|
|
L
OANS
(c)
|
|
|
|
|
|
|
|
|
|
C
OMMERCIAL
L
ENDING
|
|
|
|
|
|
|
|
|
|
Commercial/Commercial real estate (a)
|
|
$
|
1,911
|
|
|
$
|
3,162
|
|
|
Lease financing
|
|
|
757
|
|
|
|
798
|
|
|
Total commercial lending
|
|
|
2,668
|
|
|
|
3,960
|
|
|
C
ONSUMER
L
ENDING
|
|
|
|
|
|
|
|
|
|
Consumer (b)
|
|
|
6,011
|
|
|
|
6,783
|
|
|
Residential real estate
|
|
|
7,014
|
|
|
|
8,939
|
|
|
Total consumer lending
|
|
|
13,025
|
|
|
|
15,722
|
|
|
Total loans
|
|
$
|
15,693
|
|
|
$
|
19,682
|
|
|
(a)
|
Primarily residential real estate development loans.
|
|
(b)
|
Primarily brokered home equity loans.
|
|
(d)
|
Includes nonperforming loans of $.9 billion at September 30, 2010 and $1.3 billion at September 30, 2009.
|
|
(e)
|
Recorded investment of purchased impaired loans related to National City, adjusted to reflect additional loan impairments effective December 31, 2008. At
September 30, 2010, this segment contained 74% of PNC’s purchased impaired loans.
|
|
(f)
|
For the nine months ended September 30.
|
This business segment consists primarily of assets acquired with National City and had earnings of $8 million for the first
nine months of 2010 compared with $172 million for the first nine months of 2009. A $288 million increase in the provision for credit losses was the primary factor driving the decrease in
earnings in the comparison.
Distressed Assets Portfolio overview:
|
•
|
|
Sales of residential mortgage loans and brokered home equity loans with unpaid principal balances of approximately $1.6 billion and carrying value of
$0.6 billion closed during the third quarter of 2010. We do not have any continuing servicing involvement and very limited representations and warranties with the loans sold.
|
|
•
|
|
Average loans declined to $17.4 billion in the first nine months of 2010 compared with $21.9 billion in the 2009 period. The decline was impacted by
portfolio management activities including loan sales and efforts to encourage customers to refinance or pay off loan balances.
|
|
•
|
|
Net interest income was $964 million in the first nine months of 2010 compared with $861 million for the 2009 period. The increase was driven by higher
accretion on impaired loans due to improved cash collection results which more than offset the decline in average loans.
|
|
•
|
|
Noninterest income was a loss of $37 million for first nine months of 2010 compared with revenue of $71 million for the first nine months of 2009 due
to an increase in recourse reserves for potential repurchases of brokered home equity loans sold in 2007 and prior years. The 2009 period included asset disposition gains which were higher than those in 2010.
|
|
•
|
|
The provision for credit losses was $745 million in the first nine months of 2010 compared with $457 million in the comparable 2009 period. The
provision for 2010 included $109 million related to the third quarter sales of residential mortgage loans and brokered home equity loans, along with higher reserves for seriously delinquent impaired consumer loans.
|
|
•
|
|
Noninterest expense for the first nine months of 2010 of $169 million declined $28 million compared with the 2009 period primarily due to lower other
real estate owned related expenses and losses.
|
|
•
|
|
Nonperforming loans decreased $.4 billion, to $.9 billion, at September 30, 2010 compared with September 30, 2009. The consumer lending
portfolio comprised 45% of the nonperforming loans at September 30, 2010. An improvement was seen in both the consumer and commercial lending portfolios with a decline of $.2 billion in both portfolios.
|
|
•
|
|
Net charge-offs were $494 million for the first nine months of 2010 and $423 million for the first nine months of 2009. Net charge-offs in 2010
included $75 million related to the residential mortgage loan sales in the third quarter. Net charge-offs for each portfolio increased in the comparison with the exception of non-prime mortgages and brokered home equity.
|
37
Certain loans in this business
segment may require special servicing given current loan performance and market conditions. Consequently, the business activities of this segment are focused on maximizing the value of the portfolio assigned to it while mitigating risk. Business
intent drives the inclusion of assets in this business segment. Not all impaired loans are included in this business segment, nor are all of the loans included in this business segment considered impaired.
|
•
|
|
The $15.7 billion of loans held in this portfolio at September 30, 2010 are stated inclusive of a fair value adjustment on purchased impaired
loans at acquisition. Taking the adjustment and loan loss allowance into account, the net carrying basis of this loan portfolio is 79% of customer outstandings.
|
|
•
|
|
Commercial Lending within the Distressed Assets Portfolio business segment is comprised of $1.9 billion in residential development assets (i.e.
condominiums, townhomes, developed and undeveloped land) primarily acquired from National City. This commercial lending portfolio has declined 33% since September 30, 2009. A team of asset managers actively deploy workout strategies on this
portfolio through reducing unfunded loan exposure, refinancing, customer payoffs, foreclosures and loan sales. The overall credit quality of this portfolio is considered to be moderately better at September 30, 2010 compared with the beginning
of 2010 based upon continuing dispositions of credits, improved economic conditions and increased activity in several markets. The other primary component of Commercial Lending is $.8 billion of performing cross-border leases.
|
The fair value adjustments taken upon our acquisition of National City, along with the team assembled to
provide specific focus on this business segment, put us in a good position to manage these assets. Additionally, our capital and liquidity position provide us flexibility to be prudent in terms of continuing to hold these assets or selling them to
another investor to obtain the optimum return taking into account risk mitigation.
|
•
|
|
Consumer Lending consists mainly of residential mortgages and home equity loans.
|
|
|
•
|
|
Residential mortgages are primarily jumbo and ALT-A first lien mortgages originated for sale in the second half of 2007 for which firm commitments to
lend had been extended but there was no market to sell the production. Given the low level of mortgage rates relative to where these loans were originated, we have implemented several internal and external refinance programs to proactively work with
the borrowers to explore refinance alternatives that would allow them to qualify for a conforming mortgage loan which would be originated and sold by the company or originated by a third party originator.
|
|
|
•
|
|
Residential construction loans remain available as a part of some construction phases of the real estate development and have not been fully funded.
Properties are reviewed by a dedicated team to assess
|
|
|
|
the appropriate strategy for optimizing the return on these assets while mitigating risk. To the extent we believe that completion of the construction on a particular project will maximize value,
additional advances under the construction facility may be considered. The goal for these projects would be to move them toward completion. Otherwise, the property is to be managed on an “as is” basis or returned to raw land for sale.
|
|
|
•
|
|
Home equity loans include closed-end second liens and open-end home equity lines of credit. Our focus for managing these portfolios is to maximize the
value of the portfolio. We have implemented several modification programs to assist the loss mitigation teams that manage this risk. Additionally, we have initiated several voluntary and involuntary programs to reduce and/or block line availability
on home equity lines of credit.
|
|
|
•
|
|
When loans are sold, investors may request PNC to indemnify them against losses or to repurchase loans that they believe do not comply with applicable
representations. From 2005 to 2007, we sold home equity loans with such representations. At September 30, 2010, the liability for estimated losses on repurchase and indemnification claims for the Distressed Assets Portfolio business segment was
$103 million. We recognized $53 million of additional reserves in the third quarter of 2010.
|
C
RITICAL
A
CCOUNTING
E
STIMATES
A
ND
J
UDGMENTS
Note 1 Accounting Policies in Part II, Item 8 of our 2009 Form 10-K and in the Notes To Consolidated Financial Statements
included in Part I, Item 1 of this Report describe the most significant accounting policies that we use. Certain of these policies require us to make estimates or economic assumptions that may prove inaccurate or be subject to variations that
may significantly affect our reported results and financial position for the period or in future periods.
We must use estimates, assumptions,
and judgments when assets and liabilities are required to be recorded at, or adjusted to reflect, fair value. This includes the initial measurement at fair value of the assets acquired and liabilities assumed in acquisitions qualifying as business
combinations.
Assets and liabilities carried at fair value inherently result in a higher degree of financial statement volatility. Fair
values and the information used to record valuation adjustments for certain assets and liabilities are based on either quoted market prices or are provided by independent third-party sources, including appraisers and valuation specialists, when
available. When such third-party information is not available, we estimate fair value primarily by using cash flow and other financial modeling techniques. Changes in underlying factors,
38
assumptions, or estimates in any of these areas could materially impact our future financial condition and results of operations.
We discuss the following critical accounting policies and judgments under this same heading in Item 7 of our 2009 Form 10-K:
|
|
•
|
|
Fair Value Measurements
|
|
|
•
|
|
Allowances For Loan And Lease Losses And Unfunded Loan Commitments And Letters of Credit
|
|
|
•
|
|
Estimated Cash Flows on Purchased Impaired Loans
|
|
|
•
|
|
Residential Mortgage Servicing Rights
|
Residential Mortgage Servicing Rights
– In conjunction with the acquisition of National City, PNC acquired servicing rights for residential
real estate loans. We have elected to measure these mortgage servicing rights (MSRs) at fair value. MSRs are established and valued using discounted cash flow modeling techniques which require management to make estimates regarding future net
servicing cash flows, taking into consideration actual and expected mortgage loan prepayment rates, discount rates, servicing costs, and numerous other factors.
PNC employs a risk management strategy designed to protect the value of MSRs from changes in interest rates. MSR values are economically hedged with securities and a portfolio of derivatives, including
interest-rate swaps, options, and forward mortgage-backed and futures contracts. As interest rates change, these financial instruments are expected to have changes in fair value which are negatively correlated to the change in fair value of the
hedged MSR portfolio. The hedge relationships are actively managed in response to changing market conditions over the life of the MSR assets. Selecting appropriate financial instruments to hedge this risk requires significant management judgment to
assess how mortgage rates and prepayment speeds could affect the future values of MSRs. Hedging results can frequently be volatile in the short term, but over longer periods of time are expected to protect the economic value of the MSR portfolio.
The fair value of residential MSRs and significant inputs to the valuation model as of September 30, 2010 are shown in the table below.
The expected and actual rates of mortgage loan prepayments are significant factors driving the fair value. Management uses an internal proprietary model to estimate future loan prepayments. This model uses empirical data drawn from the historical
performance of our managed portfolio, as adjusted for current market conditions. Future interest rates are another important factor in the valuation of MSRs. Management utilizes market implied forward interest rates to estimate the future direction
of mortgage and discount rates. The forward rates utilized are derived from the current
yield curve for U.S. dollar interest rate swaps and are consistent with pricing of capital markets instruments. Changes in the shape and slope of the forward curve in future periods may result in
volatility in the fair value estimate.
|
|
|
|
|
|
|
|
|
|
|
Dollars in millions
|
|
Sept. 30,
2010
|
|
|
Dec. 31
2009
|
|
|
Fair value
|
|
$
|
788
|
|
|
$
|
1,332
|
|
|
Weighted-average life (in years)
|
|
|
2.5
|
|
|
|
4.5
|
|
|
Weighted-average constant prepayment rate
|
|
|
21.47
|
%
|
|
|
19.92
|
%
|
|
Spread over forward interest rate swap rates
|
|
|
12.23
|
%
|
|
|
12.16
|
%
|
A sensitivity analysis of the hypothetical effect on the fair value of MSRs to adverse changes in key assumptions is presented below. These sensitivities do not include the impact of the related hedging
activities. Changes in fair value generally cannot be extrapolated because the relationship of the change in the assumption to the change in fair value may not be linear. Also, the effect of a variation in a particular assumption on the fair value
of the MSRs is calculated independently without changing any other assumption. In reality, changes in one factor may result in changes in another (for example, changes in mortgage interest rates, which drive changes in prepayment rate estimates,
could result in changes in the interest rate spread), which could either magnify or counteract the sensitivities.
|
|
|
|
|
|
|
|
|
|
|
Dollars in millions
|
|
Sept. 30,
2010
|
|
|
Dec. 31,
2009
|
|
|
Prepayment rate:
|
|
|
|
|
|
|
|
|
|
Decline in fair value from 10% adverse change
|
|
$
|
35
|
|
|
$
|
56
|
|
|
Decline in fair value from 20% adverse change
|
|
$
|
66
|
|
|
$
|
109
|
|
|
Spread over forward interest rate swap rates:
|
|
|
|
|
|
|
|
|
|
Decline in fair value from 10% adverse change
|
|
$
|
30
|
|
|
$
|
55
|
|
|
Decline in fair value from 20% adverse change
|
|
$
|
58
|
|
|
$
|
106
|
|
Proposed Accounting Standards
The FASB issued several Exposure Drafts for comment during 2010, including, in May 2010, the Proposed Accounting Standards Update –
Accounting for
Financial Instruments and Revisions to the Accounting for Derivative Instruments and Hedging Activities – Financial Instruments (Topic 825) and Derivatives and Hedging (Topic 815).
Under the proposal, most financial instruments (including
loans and securities) would be measured at fair value with changes in fair value recognized in either net income or other comprehensive income. Additional aspects of this proposal include modifications for recognizing credit impairments, changes to
hedge accounting requirements, and disclosures of both fair value and amortized cost information on the face of the financial statements.
In
July 2010, the FASB issued Proposed Accounting Standards Update –
Contingencies (Topic 450) – Disclosure of Certain Loss Contingencies.
Under the proposal, additional disclosures would be required, including for remote loss
contingencies with a potentially severe impact and a tabular reconciliation of accrued loss contingencies.
39
In August 2010, the FASB issued
Proposed Accounting Standards Update –
Leases (Topic 840).
Under the proposal, lessees and lessors would apply a right-of-use model in accounting for most leases, including subleases. A lessee would recognize an asset representing its
right to use the leased asset for the lease term and a liability to make lease payments and a lessor would recognize an asset representing its right to receive lease payments and recognize a lease liability while continuing to recognize the
underlying asset or a residual asset representing its rights to the underlying asset at the end of the lease term. The exposure draft also proposes disclosures about the amounts recognized in the financial statements arising from leases and the
amount, timing and uncertainty of cash flows arising from those contracts.
In October 2010, the FASB issued Proposed Accounting Standards
Update –
Receivables (Topic 310) – Clarification to Accounting for Troubled Debt Restructurings by Creditors.
The proposed ASU would preclude a creditor from using an effective rate test in its evaluation of whether a restructuring
constitutes a troubled debt restructuring. Furthermore, guidance would be clarified to indicate 1) If a debtor does not otherwise have access to funds at a market rate for debt with similar risk characteristics as the restructured debt, the
restructuring would be considered to be at below a market rate and therefore should be considered a troubled debt restructuring, 2) A restructuring that results in a temporary or permanent increase in the contractual interest rate cannot be presumed
to be at a rate that is at or above market, 3) A borrower that is not currently in default may still be considered to be experiencing financial difficulty when payment default is considered “probable in the foreseeable future” and 4) A
restructuring that results in an insignificant delay in contractual cash flows may still be considered a troubled debt restructuring. Under the proposal, additional disclosures (including comparative information) would be required.
Also, see Note 1 Accounting Policies in the Notes To Consolidated Financial Statements of this Report regarding the impact of the adoption of new
accounting guidance issued by the Financial Accounting Standards Board.
S
TATUS
O
F
Q
UALIFIED
D
EFINED
B
ENEFIT
P
ENSION
P
LAN
We have a noncontributory, qualified defined
benefit pension plan (plan or pension plan) covering eligible employees. Benefits are derived from a cash balance formula based on compensation levels, age and length of service. Pension contributions are based on an actuarially determined amount
necessary to fund total benefits payable to plan participants. Consistent with our investment strategy, plan assets are primarily invested in equity investments and fixed income instruments. Plan fiduciaries determine and review the plan’s
investment policy, which is described more fully in Note 15 Employee Benefit Plans in the Notes To Consolidated Financial Statements in Item 8 of our 2009 Form 10-K.
We calculate the expense associated with the pension plan and the assumptions and methods that we use include a policy of reflecting trust assets at their fair market value. On an annual basis, we review
the actuarial assumptions related to the pension plan, including the discount rate, the rate of compensation increase and the expected return on plan assets. The discount rate and compensation increase assumptions do not significantly affect pension
expense.
However, the expected long-term return on assets assumption does significantly affect pension expense. Our expected long-term return
on plan assets for determining net periodic pension expense was 8.25% for 2009, 2008 and 2007. The expected return on plan assets is a long-term assumption established by considering historical and anticipated returns of the asset classes invested
in by the pension plan and the allocation strategy currently in place among those classes. While this analysis gives appropriate consideration to recent asset performance and historical returns, the assumption represents a long-term prospective
return. We review this assumption at each measurement date and adjust it if warranted.
For purposes of setting and reviewing this assumption,
“long term” refers to the period over which the plan’s projected benefit obligation will be disbursed. While year-to-year annual returns can vary significantly (rates of return for the reporting years of 2009, 2008, and 2007 were
+20.61%, -32.91%, and +7.57% respectively), the assumption represents our estimate of long-term average prospective returns. Our selection process references certain historical data and the current environment, but primarily utilizes qualitative
judgment regarding future return expectations. Recent annual returns may differ but, recognizing the volatility and unpredictability of investment returns, we generally do not change the assumption unless we modify our investment strategy or
identify events that would alter our expectations of future returns.
To evaluate the continued reasonableness of our assumption, we examine a
variety of viewpoints and data. Various studies have shown that portfolios comprised primarily of US equity
40
securities have returned approximately 10% over long periods of time, while US debt securities have returned approximately 6% annually over long periods. Application of these historical returns
to the plan’s allocation of equities and bonds produces a result between 8% and 8.5% and is one point of reference, among many other factors, that is taken into consideration. We also examine the plan’s actual historical returns over
various periods. Recent experience is considered in our evaluation with appropriate consideration that, especially for short time periods, recent returns are not reliable indicators of future returns, and in many cases low returns in recent time
periods are followed by higher returns in future periods (and vice versa).
Acknowledging the potentially wide range for this assumption, we
also annually examine the assumption used by other companies with similar pension investment strategies, so that we can ascertain whether our determinations markedly differ from other observers. In all cases, however, this data simply informs our
process, which places the greatest emphasis on our qualitative judgment of future investment returns, given the conditions existing at each annual measurement date.
The expected long-term return on plan assets for determining net periodic pension cost for 2010 is 8.00%, down from 8.25% for 2009. During 2010, we decreased the midpoint of the plan’s target
allocation range for equities by approximately five percentage points. As a result of this change and taking into account all other factors described above, we changed the expected long-term return on plan assets to 8.00% for determining net
periodic pension cost for 2010. Under current accounting rules, the difference between expected long-term returns and actual returns is accumulated and amortized to pension expense over future periods. Each one percentage point difference in actual
return compared with our expected return causes expense in subsequent years to change by up to $8 million as the impact is amortized into results of operations.
The table below reflects the estimated effects on pension expense of certain changes in annual assumptions, using 2010 estimated expense as a baseline.
|
|
|
|
|
|
|
Change in Assumption (a)
|
|
Estimated
Increase to 2010
Pension
Expense
(In millions)
|
|
|
.5% decrease in discount rate
|
|
$
|
10
|
|
|
.5% decrease in expected long-term return on assets
|
|
$
|
18
|
|
|
.5% increase in compensation rate
|
|
$
|
3
|
|
|
(a)
|
The impact is the effect of changing the specified assumption while holding all other assumptions constant.
|
We currently estimate a pretax pension expense of $46 million in 2010 compared with pretax expense of $117 million in 2009. This year-over-year expected
reduction is primarily due
to the amortization impact of the favorable 2009 investment returns as compared with the expected long-term return assumption.
Our pension plan contribution requirements are not particularly sensitive to actuarial assumptions. Investment performance has the most impact on contribution requirements and will drive the amount of
permitted contributions in future years. Also, current law, including the provisions of the Pension Protection Act of 2006, sets limits as to both minimum and maximum contributions to the plan. We do not expect to be required by law to make any
contributions to the plan for 2010.
We maintain other defined benefit plans that have a less significant effect on financial results,
including various nonqualified supplemental retirement plans for certain employees.
R
ISK
M
ANAGEMENT
We encounter risks as part of the normal course of our business and we design risk management processes to
help manage these risks.
The Risk Management section included in Item 7 of our 2009 Form 10-K includes a description of our risk
management philosophy, principles, governance and various aspects of our corporate-level risk management program, and a 2009 overview of enterprise-wide risk. Additionally, our 2009 Form 10-K provides an analysis of the risk management
processes for what we view as our primary areas of risk: credit, operational, liquidity and market, as well as a discussion of our use of financial derivatives as part of our overall asset and liability risk management process, and addresses
historical performance in appropriate places within the Risk Management section of that report.
The following information updates our 2009
Form 10-K risk management disclosures.
C
REDIT
R
ISK
M
ANAGEMENT
Credit risk represents the possibility that a customer, counterparty or issuer may not perform in accordance with contractual terms. Credit risk is
inherent in the financial services business and results from extending credit to customers, purchasing securities, and entering into financial derivative transactions and certain guarantee contracts. Credit risk is one of our most significant risks.
Nonperforming, Past Due And Potential Problem Assets
Credit quality showed further signs of stabilization during the third quarter of 2010 and delinquency measures improved compared with prior periods. During the third quarter, we continued to see an
overall improvement in credit migration for performing loans and a reduction in overall credit exposure. Assuming at least modest US Gross Domestic
41
Product (GDP) growth, we believe our delinquencies and nonperforming metrics will continue to decline in the fourth quarter of 2010 compared with the third quarter of 2010.
Nonperforming assets were $5.7 billion at September 30, 2010, a decline of $647 million compared with $6.3 billion at December 31, 2009.
Nonperforming loans decreased $835 million since December 31, 2009 while foreclosed and other assets increased $188 million.
Nonperforming assets at September 30, 2010 declined in the Corporate & Institutional Banking, Asset Management Group, Residential Mortgage
Banking, and Distressed Assets Portfolio business segments compared with the balances at December 31, 2009 and increased 9% in the Retail Banking business segment.
Purchased impaired loans are excluded from nonperforming loans. Any decrease, other than for prepayments or interest rate decreases for variable rate notes, in the net present value of expected cash flows
of individual commercial or pooled consumer purchased impaired loans would result in an impairment charge to the provision for loan losses in the period in which the change becomes probable. Any increase in the net present value of expected cash
flows of purchased impaired loans would first result in a recovery of previously recorded allowance for loan losses, to the extent applicable, and then an increase to accretable interest income for the remaining life of the impaired loans. See Note
6 Purchased Impaired Loans Related to National City in the Notes To Consolidated Financial Statements in this Report for additional information.
Additionally, most consumer loans and lines of credit, not secured by residential real estate, are charged off after 120 to 180 days past due, are not placed on nonaccrual status, and are excluded from
nonperforming loans. Nonperforming loans also do not include loans held for sale.
The portion of the allowance for loan and lease losses
allocated to commercial lending nonperforming loans was 28% at September 30, 2010 and 29% at December 31, 2009. Approximately 76% of these nonperforming loans are secured by collateral that is expected to reduce credit losses and require
less reserves in the event of default.
Nonperforming assets were 3.76% of total loans and foreclosed and other assets at September 30,
2010 compared with 3.99% at December 31, 2009.
Nonperforming Assets By Type
|
|
|
|
|
|
|
|
|
|
|
In millions
|
|
Sept.
30
2010
|
|
|
Dec. 31
2009
|
|
|
Nonaccrual loans
|
|
|
|
|
|
|
|
|
|
Commercial
|
|
|
|
|
|
|
|
|
|
Retail/wholesale
|
|
$
|
219
|
|
|
$
|
231
|
|
|
Manufacturing
|
|
|
266
|
|
|
|
423
|
|
|
Real estate related (a)
|
|
|
338
|
|
|
|
419
|
|
|
Financial services
|
|
|
36
|
|
|
|
117
|
|
|
Health care
|
|
|
59
|
|
|
|
41
|
|
|
Other
|
|
|
612
|
|
|
|
575
|
|
|
Total commercial
|
|
|
1,530
|
|
|
|
1,806
|
|
|
Commercial real estate
|
|
|
|
|
|
|
|
|
|
Real estate projects
|
|
|
1,562
|
|
|
|
1,754
|
|
|
Commercial mortgage
|
|
|
427
|
|
|
|
386
|
|
|
Total commercial real estate
|
|
|
1,989
|
|
|
|
2,140
|
|
|
Equipment lease financing
|
|
|
104
|
|
|
|
130
|
|
|
TOTAL COMMERCIAL LENDING
|
|
|
3,623
|
|
|
|
4,076
|
|
|
Consumer
|
|
|
|
|
|
|
|
|
|
Home equity
|
|
|
406
|
|
|
|
356
|
|
|
Other
|
|
|
38
|
|
|
|
36
|
|
|
Total consumer
|
|
|
444
|
|
|
|
392
|
|
|
Residential real estate
|
|
|
|
|
|
|
|
|
|
Residential mortgage
|
|
|
727
|
|
|
|
955
|
|
|
Residential construction
|
|
|
42
|
|
|
|
248
|
|
|
Total residential real estate
|
|
|
769
|
|
|
|
1,203
|
|
|
TOTAL CONSUMER LENDING
|
|
|
1,213
|
|
|
|
1,595
|
|
|
Total nonperforming loans
|
|
|
4,836
|
|
|
|
5,671
|
|
|
Foreclosed and other assets
|
|
|
|
|
|
|
|
|
|
Commercial lending
|
|
|
366
|
|
|
|
266
|
|
|
Consumer lending
|
|
|
467
|
|
|
|
379
|
|
|
Total foreclosed and other assets
|
|
|
833
|
|
|
|
645
|
|
|
Total nonperforming assets
|
|
$
|
5,669
|
|
|
$
|
6,316
|
|
|
(a)
|
Includes loans related to customers in the real estate and construction industries.
|
Change In Nonperforming Assets
|
|
|
|
|
|
|
|
|
|
|
In millions
|
|
2010
|
|
|
2009
|
|
|
January 1
|
|
$
|
6,316
|
|
|
$
|
2,181
|
|
|
Transferred from accrual
|
|
|
4,154
|
|
|
|
6,458
|
|
|
Charge-offs and valuation adjustments
|
|
|
(1,604
|
)
|
|
|
(1,230
|
)
|
|
Principal activity including payoffs
|
|
|
(939
|
)
|
|
|
(828
|
)
|
|
Asset sales and transfers to held for sale
|
|
|
(1,036
|
)
|
|
|
(566
|
)
|
|
Returned to performing-TDRs
|
|
|
(425
|
)
|
|
|
|
|
|
Returned to performing-Other
|
|
|
(797
|
)
|
|
|
(371
|
)
|
|
September 30
|
|
$
|
5,669
|
|
|
$
|
5,644
|
|
Total nonperforming loans and nonperforming assets in the tables above are significantly lower than they would have been otherwise due to the accounting
treatment for purchased impaired loans. This treatment also results in lower ratio of nonperforming loans to total loans and allowance for loan and lease losses to nonperforming loans. We recorded purchased impaired loans at estimated fair value of
$12.7 billion at December 31, 2008, including an adjustment mark for life of loan credit losses. These loans are considered performing,
42
even if contractually past due (or if we do not expect to receive payment in full based on the original contractual terms), as we are currently accreting interest income over the expected life of
the loans. The accretable interest/yield represents the excess of the net present value of expected cash flows on the loans at the measurement date over the recorded investment. See Note 6 Purchased Impaired Loans Related to National City in the
Notes To Consolidated Financial Statements in this Report for additional information on those loans.
At September 30, 2010, our largest
nonperforming asset was approximately $54 million and our average nonperforming loan associated with commercial lending was approximately $1 million.
The amount of nonperforming loans that was current as to remaining principal and interest was $1.3 billion at September 30, 2010 and $1.7 billion at December 31, 2009.
PNC modifies loans under government and PNC-developed modification programs based upon our commitment to help eligible homeowners avoid foreclosure where
appropriate. Initially, a borrower is evaluated for a modification under a government program. If a borrower does not qualify under a government program, then the borrower is evaluated under a PNC program. As of September 30, 2010, approximately
1,000 or $228 million of owned residential real estate loans have been modified under the government HAMP program. Currently, only the HAMP program includes a trial payment period. Under HAMP, the trial payment period is three months, and upon
successful completion, the loan is permanently modified. The impacts of these modifications are considered in our allowance for loan and lease losses. Loans permanently modified under this program are classified as troubled debt restructurings
(TDRs), as further discussed below, and are placed on nonaccrual status.
PNC programs utilize both temporary and permanent modifications and
typically reduce the interest rate, extend the term and/or forgive principal. Temporary modifications fall between 3 – 60 months in length, with the majority for a period of up to 24 months after which the interest rate reverts to that under
the original loan. Regardless of the length of the modification, all modifications are evaluated to determine whether they are TDRs. The impacts of these modifications are considered in our allowance for loan and lease losses. Additionally, when
modified, TDRs are placed on nonaccrual status, except as noted below.
Loans whose contractual terms have been restructured in a manner which
grants a concession to a borrower experiencing financial difficulties are considered TDRs. TDRs typically result from our loss mitigation activities and could include rate reductions, term extensions and/or principal forgiveness intended to minimize
the economic loss and to avoid foreclosure or repossession of collateral. Total nonperforming
loans included TDRs of $595 million at September 30, 2010 and $440 million at December 31, 2009. Purchased impaired loans are excluded from TDRs.
TDRs returned to performing (accrual) status totaled $425 million at September 30, 2010 and are excluded from nonperforming loans. These loans have
demonstrated a period of at least six months of performance under the modified terms. Approximately $17 million of TDRs previously returned to performing status are now classified as nonperforming as they are no longer current under the modified
terms.
In addition, credit cards and certain small business and consumer credit agreements whose terms have been modified primarily through
interest rate reductions totaling $315 million at September 30, 2010 are TDRs. However, since our policy is to exempt these loans from being placed on nonaccrual status as permitted by regulatory guidance as these loans are directly charged off in
the period that they become 180 days past due, these loans are excluded from nonperforming loans.
Accruing Loans Past Due 30 To 89 Days
(a) (c)
|
|
|
|
|
|
|
|
|
|
|
|
|
|
|
|
|
|
|
|
|
Amount
|
|
|
Percent of Outstandings
|
|
|
Dollars in millions
|
|
Sept. 30
2010
|
|
|
Dec. 31
2009
|
|
|
Sept. 30
2010
|
|
|
Dec. 31
2009
|
|
|
Commercial
|
|
$
|
293
|
|
|
$
|
684
|
|
|
|
.55
|
%
|
|
|
1.26
|
%
|
|
Commercial real estate
|
|
|
353
|
|
|
|
666
|
|
|
|
1.97
|
|
|
|
3.10
|
|
|
Equipment lease
financing
|
|
|
10
|
|
|
|
128
|
|
|
|
.16
|
|
|
|
2.06
|
|
|
Consumer
|
|
|
430
|
|
|
|
438
|
|
|
|
.83
|
|
|
|
.87
|
|
|
Residential real estate
|
|
|
347
|
|
|
|
472
|
|
|
|
2.70
|
|
|
|
3.12
|
|
|
Total
|
|
$
|
1,433
|
|
|
$
|
2,388
|
|
|
|
1.01
|
|
|
|
1.62
|
|
Accruing Loans Past Due 90 Days Or More (b) (d)
|
|
|
|
|
|
|
|
|
|
|
|
|
|
|
|
|
|
|
|
|
Amount
|
|
|
Percent of Outstandings
|
|
|
Dollars in millions
|
|
Sept. 30
2010
|
|
|
Dec. 31
2009
|
|
|
Sept. 30
2010
|
|
|
Dec. 31
2009
|
|
|
Commercial
|
|
$
|
90
|
|
|
$
|
188
|
|
|
|
.17
|
%
|
|
|
.35
|
%
|
|
Commercial real estate
|
|
|
58
|
|
|
|
150
|
|
|
|
.32
|
|
|
|
.70
|
|
|
Equipment lease
financing
|
|
|
4
|
|
|
|
6
|
|
|
|
.06
|
|
|
|
.10
|
|
|
Consumer
|
|
|
270
|
|
|
|
226
|
|
|
|
.52
|
|
|
|
.45
|
|
|
Residential real estate
|
|
|
179
|
|
|
|
314
|
|
|
|
1.60
|
|
|
|
2.07
|
|
|
Total
|
|
$
|
601
|
|
|
$
|
884
|
|
|
|
.43
|
|
|
|
.60
|
|
|
(a)
|
Excludes loans that are government insured/guaranteed, primarily residential mortgages, totaling $.4 billion at September 30, 2010 and $.2 billion at
December 31, 2009.
|
|
(b)
|
Excludes loans that are government insured/guaranteed, primarily residential mortgages, totaling $2.0 billion at September 30, 2010 and $1.8 billion at
December 31, 2009.
|
|
(c)
|
Excludes purchased impaired loans acquired from National City totaling $.4 billion at September 30, 2010 and $.8 billion at December 31, 2009. These loans are
excluded as they are considered performing loans due to the accretion of interest income.
|
|
(d)
|
Excludes purchased impaired loans acquired from National City totaling $1.8 billion at September 30, 2010 and $2.9 billion at December 31, 2009. These loans
are excluded as they are considered performing loans due to the accretion of interest income.
|
43
Loans that are not included in nonperforming or past due categories and which we are uncertain about the
borrower’s ability to comply with existing repayment terms over the next six months totaled $742 million at September 30, 2010 and $811 million at December 31, 2009.
Allowances for Loan and Lease Losses and Unfunded Loan Commitments and Letters of Credit
We maintain an allowance for loan and lease losses to absorb losses from the loan portfolio. We determine the allowance based on quarterly assessments of the estimated probable credit losses incurred in
the loan portfolio. While we make allocations to specific loans and pools of loans, the total reserve is available for all loan and lease losses. There were no significant changes during the first nine months of 2010 to the process and procedures we
follow to determine our allowance of loan and lease losses.
As noted above, we establish an allowance for specific loans. Generally, the
allowance is determined based upon the fair value of the collateral underlying the specific loan. The fair value of the collateral is based upon an appraisal or, if a recent appraisal is not available, the net book value of the asset from its most
recent financial statements adjusted for loss given default collateral recovery rates.
A portion of the allowance for loan and lease losses
related to qualitative and measurement factors has been assigned to loan categories based on the relative specific and pool allocation amounts to provide coverage for probable losses not covered in specific and pool reserve methodologies. These
factors include, but are not limited to, the following:
|
|
•
|
|
industry concentrations and conditions,
|
|
|
•
|
|
recent loss experience in particular sectors of the portfolio,
|
|
|
•
|
|
ability and depth of lending management,
|
|
|
•
|
|
changes in risk selection and underwriting standards, and
|
|
|
•
|
|
timing of available information.
|
At September 30, 2010, the portion of reserves for these factors was $261 million.
We
increased the allowance for loan and lease losses to $5.2 billion at September 30, 2010 compared with $5.1 billion at December 31, 2009. The increase was primarily due to consolidation of the securitized credit card portfolio. The
allowance as a percent of nonperforming loans was 108% and as a percent of total loans was 3.48% at September 30, 2010. The comparable percentages at December 31, 2009 were 89% and 3.22%, respectively. Excluding the allowance for purchased
impaired loans and consumer loans and lines of credit, not secured by residential real estate, of $1.4 billion at September 30, 2010 and $1.0 billion at December 31, 2009, respectively, the allowance as a percent of nonperforming
loans was 78% at September 30, 2010 and 72% at December 31, 2009.
The
majority of the commercial portfolio is secured by collateral, including loans to asset-based lending customers that continue to show demonstrably lower loss given default. Further, the large investment grade or equivalent portion of the loan
portfolio has performed well and has not been subject to significant deterioration. The overall level of commercial allowance has decreased in the third quarter of 2010 based upon these factors, as well as lower outstanding balances. Additionally,
guarantees on loans greater than $1 million and owner guarantees for small business loans do not significantly impact our allowance for loan and lease losses. We continue to experience some pressure in the residential real estate and commercial real
estate lending sectors consistent with the current slow and somewhat uncertain economic recovery.
The allowance for loan and lease losses is
significantly lower than it would have been otherwise due to the accounting treatment for purchased impaired loans. This treatment also results in a lower ratio of allowance for loan and lease losses to total loans. Loan loss reserves on the
purchased impaired loans were not carried over on the date of acquisition. In addition, these loans were recorded net of $9.2 billion of fair value adjustments as of December 31, 2008. As of September 30, 2010, we have reserves of $.9
billion for purchased impaired loans.
In addition to the allowance for loan and lease losses, we maintain an allowance for unfunded loan
commitments and letters of credit. We report this allowance as a liability on our Consolidated Balance Sheet. We determine this amount using estimates of the probability of the ultimate funding and losses related to those credit exposures. This
methodology is similar to the one we use for determining the adequacy of our allowance for loan and lease losses.
We refer you to Note 5
Asset Quality and Note 6 Purchased Impaired Loans Related to National City in the Notes To Consolidated Financial Statements in this Report regarding changes in the allowance for loan and lease losses and in the allowance for unfunded loan
commitments and letters of credit.
We are optimistic about prospects for a stable-to-lower provision for credit losses in the fourth quarter
of 2010 compared with the third quarter of 2010. Future provision levels will depend primarily on the level of nonperforming loans, our related coverage ratios, and the pace of economic recovery.
44
Charge-Offs And Recoveries
|
|
|
|
|
|
|
|
|
|
|
|
|
|
|
|
|
|
|
Nine months ended September 30
Dollars in millions
|
|
Charge-
offs
|
|
|
Recoveries
|
|
|
Net
Charge-
offs
|
|
|
Percent
of
Average
Loans
|
|
|
2010
|
|
|
|
|
|
|
|
|
|
|
|
|
|
|
|
|
|
Commercial
|
|
$
|
896
|
|
|
$
|
223
|
|
|
$
|
673
|
|
|
|
1.65
|
%
|
|
Commercial real estate
|
|
|
489
|
|
|
|
57
|
|
|
|
432
|
|
|
|
2.74
|
|
|
Equipment lease financing
|
|
|
91
|
|
|
|
38
|
|
|
|
53
|
|
|
|
1.14
|
|
|
Consumer
|
|
|
810
|
|
|
|
85
|
|
|
|
725
|
|
|
|
1.76
|
|
|
Residential real estate
|
|
|
282
|
|
|
|
20
|
|
|
|
262
|
|
|
|
1.92
|
|
|
Total
|
|
$
|
2,568
|
|
|
$
|
423
|
|
|
$
|
2,145
|
|
|
|
1.85
|
|
|
2009
|
|
|
|
|
|
|
|
|
|
|
|
|
|
|
|
|
|
Commercial
|
|
$
|
896
|
|
|
$
|
94
|
|
|
$
|
802
|
|
|
|
1.70
|
%
|
|
Commercial real estate
|
|
|
250
|
|
|
|
23
|
|
|
|
227
|
|
|
|
1.21
|
|
|
Equipment lease financing
|
|
|
115
|
|
|
|
17
|
|
|
|
98
|
|
|
|
2.11
|
|
|
Consumer
|
|
|
694
|
|
|
|
78
|
|
|
|
616
|
|
|
|
1.58
|
|
|
Residential real estate
|
|
|
176
|
|
|
|
43
|
|
|
|
133
|
|
|
|
.83
|
|
|
Total
|
|
$
|
2,131
|
|
|
$
|
255
|
|
|
$
|
1,876
|
|
|
|
1.49
|
|
Total net charge-offs are significantly lower than they would have been otherwise due to the accounting treatment for purchased impaired loans. This
treatment also results in a lower ratio of net charge-offs to average loans. Customer balances related to these impaired loans were reduced by the fair value adjustments of $9.2 billion as of December 31, 2008. However, as a result of further
credit deterioration on purchased impaired commercial loans, we recorded $158 million of net charge-offs during the first nine months of 2010. Net charge-offs were not recorded on purchased impaired consumer pools.
C
REDIT
D
EFAULT
S
WAPS
From a credit risk management perspective, we buy and sell credit loss protection via the use of credit derivatives. When we buy loss protection by purchasing a credit default swap (CDS), we pay a fee to
the seller, or CDS counterparty, in return for the right to receive a payment if a specified credit event occurs for a particular obligor or reference entity. We purchase CDSs to mitigate the risk of economic loss on a portion of our loan exposures.
We also sell loss protection to mitigate the net premium cost and the impact of fair value accounting on the CDS in cases where we buy
protection to hedge the loan portfolio. These activities represent additional risk positions rather than hedges of risk.
We approve
counterparty credit lines for all of our CDS activities. Counterparty credit lines are approved based on a review of credit quality in accordance with our traditional credit quality standards and credit policies. The credit risk of our
counterparties is monitored in the normal course of business. In addition, all counterparty credit lines are subject to collateral thresholds and exposures above these thresholds are secured.
CDSs are included in the “Derivatives not designated as hedging instruments under GAAP” table in the Financial Derivatives section of this Risk Management discussion.
O
PERATIONAL
R
ISK
M
ANAGEMENT
The operational risk in connection with the National City integration has been effectively managed. Our integration objectives have been successfully met
and integration-related risk issues have been proactively identified, assessed and mitigated. Post-integration, our operational risk management focus has shifted to continued stabilization, the increased complexities driven by our size and several
external environmental factors impacting our business model. We will continue to execute our rigorous risk management processes and evaluate the effectiveness of key processes, technologies and controls to help ensure performance at expected levels.
L
IQUIDITY
R
ISK
M
ANAGEMENT
Liquidity risk has two fundamental components. The first is the potential loss if we were unable to meet our funding requirements at a reasonable cost. The second is the potential inability to operate our
businesses because adequate contingent liquidity is not available in a stressed environment. We manage liquidity risk at the bank and parent company to help ensure that we can obtain cost-effective funding to meet current and future obligations
under both normal “business as usual” and stressful circumstances and to help ensure that we maintain an appropriate level of contingent liquidity.
Spot and forward funding gap analyses are the primary metrics used to measure and monitor bank liquidity risk. Funding gaps represent the difference in projected sources of liquidity available to offset
projected uses. We calculate funding gaps for the overnight, thirty-day, ninety-day, one hundred eighty-day and one-year time intervals. Risk limits are established within our Liquidity Risk Policy. Management’s Asset and Liability Committee
regularly reviews compliance with the established limits.
Parent company liquidity guidelines are designed to help ensure that sufficient
liquidity is available to meet our parent company obligations over the succeeding 24-month period. Risk limits for parent company liquidity are established within our Enterprise Capital Management Policy. The Board of Directors’ Joint Risk
Committee regularly reviews compliance with the established limits.
Bank Level Liquidity – Uses
Obligations requiring the use of liquidity can generally be characterized as either contractual or discretionary. At the bank level, primary contractual
obligations include funding loan commitments, satisfying deposit withdrawal requests and maturities and debt service related to bank borrowings. We also maintain adequate bank liquidity to meet future potential loan demand and provide for other
business needs, as necessary.
As of September 30, 2010, there were approximately $5.0 billion of bank borrowings with maturities of less
than one year.
45
Bank Level Liquidity – Sources
Our largest source of bank liquidity on a consolidated basis is the deposit base that comes from our retail and commercial businesses. Liquid assets and unused borrowing capacity from a number of sources
are also available to maintain our liquidity position. Borrowed funds come from a diverse mix of short and long-term funding sources.
At
September 30, 2010, our liquid assets consisted of short-term investments (Federal funds sold, resale agreements, trading securities, and interest-earning deposits with banks) totaling $3.5 billion and securities available for sale totaling
$56.0 billion. Of our total liquid assets of $59.5 billion, we had $28.7 billion pledged as collateral for borrowings, trust, and other commitments. The level of liquid assets fluctuates over time based on many factors, including market conditions,
loan and deposit growth and active balance sheet management.
In addition to the customer deposit base, which has historically provided the
single largest source of relatively stable and low-cost funding and liquid assets, the bank also obtains liquidity through the issuance of traditional forms of funding including long-term debt (senior notes and subordinated debt and Federal Home
Loan Bank (FHLB) advances) and short-term borrowings (Federal funds purchased, securities sold under repurchase agreements, commercial paper issuances, and other short-term borrowings).
PNC Bank, N.A. has the ability to offer up to $20 billion in senior and subordinated unsecured debt obligations with maturities of more than nine months. Through September 30, 2010, PNC Bank, N.A.
had issued $6.9 billion of debt under this program. Total senior and subordinated debt declined to $5.6 billion at September 30, 2010 from $7.4 billion at December 31, 2009 due to maturities.
PNC Bank, N.A. is a member of the FHLB-Pittsburgh and as such has access to advances from FHLB-Pittsburgh secured generally by residential mortgage and
other mortgage-related loans. At September 30, 2010, our unused secured borrowing capacity was $8.4 billion with FHLB-Pittsburgh. Total FHLB borrowings declined to $7.1 billion at September 30, 2010 from $10.8 billion at December 31,
2009 due to maturities.
PNC Bank, N.A. has the ability to offer up to $3.0 billion of its commercial paper. As of September 30, 2010,
there were no issuances outstanding under this program. Commercial paper included in Other borrowed funds on our Consolidated Balance Sheet is issued by Market Street as described in Off-Balance Sheet Arrangements and Variable Interest Entities in
this Financial Review.
PNC Bank, N.A. can also borrow from the Federal Reserve Bank of Cleveland’s (Federal Reserve Bank) discount
window to meet short-term liquidity requirements. The Federal
Reserve, however, is not viewed as the primary means of funding our routine business activities, but rather as a potential source of liquidity in a stressed environment or during a market
disruption. These potential borrowings are secured by securities and commercial loans. At September 30, 2010, our unused secured borrowing capacity was $23.7 billion with the Federal Reserve Bank.
Parent Company Liquidity – Uses
Obligations requiring the use of liquidity can generally be characterized as either contractual or discretionary. The parent company’s contractual obligations consist primarily of debt service
related to parent company borrowings and funding non-bank affiliates. Additionally, the parent company maintains adequate liquidity to fund discretionary activities such as paying dividends to PNC shareholders, share repurchases, and acquisitions.
As of September 30, 2010, there were approximately $2.7 billion of parent company borrowings with maturities of less than one year.
Parent Company Liquidity – Sources
The principal source of parent company liquidity is the dividends it receives from its subsidiary bank, which may be impacted by the following:
|
|
•
|
|
Bank-level capital needs,
|
|
|
•
|
|
Contractual restrictions, and
|
The amount
available for dividend payments to the parent company by PNC Bank, N.A. without prior regulatory approval was approximately $2.0 billion at September 30, 2010. There are statutory and regulatory limitations on the ability of national banks to
pay dividends or make other capital distributions or to extend credit to the parent company or its non-bank subsidiaries. See Note 23 Regulatory Matters in the Notes To Consolidated Financial Statements in Item 8 of our 2009 Form 10-K for a
further discussion of these limitations. Dividends may also be impacted by the bank’s capital needs and by contractual restrictions. We provide additional information on certain contractual restrictions under the “Perpetual Trust
Securities,” “PNC Capital Trust E Trust Preferred Securities,” and “Acquired Entity Trust Preferred Securities” sections of the Off-Balance Sheet Arrangements And Variable Interest Entities section of this Financial Review.
In addition to dividends from PNC Bank, N.A., other sources of parent company liquidity include cash and short-term investments, as well as
dividends and loan repayments from other subsidiaries and dividends or distributions from equity investments. As of September 30, 2010, the parent company had approximately $4.2 billion in funds available from its cash and short-term
investments. This amount includes $1.8 billion of net after-tax cash proceeds from the sale of GIS.
46
We can also generate liquidity for the parent company and PNC’s non-bank subsidiaries through the
issuance of debt securities and equity securities, including certain capital securities, in public or private markets and commercial paper.
We have effective shelf registration statements pursuant to which we can issue additional debt and equity securities, including certain hybrid capital
instruments. Total senior and subordinated debt and hybrid capital instruments increased to $18.0 billion at September 30, 2010 from $14.9 billion at December 31, 2009 due to net year-to-date issuances. On August 11, 2010, PNC Funding
Corp issued $750 million of senior notes due August 2020. Interest will be paid semiannually at a fixed rate of 4.375%.
Note 19 Equity in our
2009 Form 10-K describes the December 31, 2008 issuance of 75,792 shares of our Fixed Rate Cumulative Perpetual Preferred Shares, Series N (Series N Preferred Stock), related issuance discount and the warrant to purchase common shares to the US
Treasury under the TARP Capital Purchase Program.
As approved by the Federal Reserve Board, US Treasury and our other banking regulators, on
February 10, 2010, we redeemed all 75,792 shares of our Series N Preferred Stock held by the US Treasury totaling $7.6 billion. We used the net proceeds from the first quarter 2010 common stock and senior notes offerings described in Note 28
Subsequent Events in our 2009 Form 10-K and other funds to redeem the Series N Preferred Stock.
In connection with the redemption of the
Series N Preferred Stock, we accelerated the accretion of the remaining issuance discount on the Series N Preferred Stock and recorded a corresponding reduction in retained earnings of $250 million during the first quarter of 2010. This resulted in
a one-time, noncash reduction in net income attributable to common shareholders and related basic and diluted earnings per share.
Dividends
of $89 million were paid on February 10, 2010 when the Series N Preferred Stock was redeemed. PNC paid total dividends of $421 million to the US Treasury while the Series N preferred shares were outstanding.
After exchanging its TARP Warrant for 16,885,192 warrants, each to purchase one share of PNC common stock, the US Treasury sold the warrants in a
secondary public offering. The sale closed on May 5, 2010.
The parent company, through its subsidiary PNC Funding Corp. has the ability
to offer up to $3.0 billion of commercial paper to provide additional liquidity. As of September 30, 2010, there were no issuances outstanding under this program.
Status of Credit Ratings
The cost and availability of short- and long-term funding, as well as collateral requirements for certain derivative instruments, is influenced by debt ratings.
In general, rating agencies base their ratings on many quantitative and qualitative factors, including capital adequacy, liquidity, asset quality,
business mix, level and quality of earnings, and the current legislative and regulatory environment, including implied government support. In addition, rating agencies themselves have been subject to scrutiny arising from the financial crisis and
could make or be required to make substantial changes to their ratings policies and practices, particularly in response to legislative and regulatory changes, including as a result of provisions in Dodd-Frank. Potential changes in the legislative
and regulatory environment and the timing of those changes could impact our ratings, which as noted above, could impact our liquidity and financial condition. A decrease, or potential decrease, in credit ratings could impact access to the capital
markets and/or increase the cost of debt, and thereby adversely affect liquidity and financial condition.
Credit ratings as of
November 1, 2010 for PNC and PNC Bank, N.A. follow:
|
|
|
|
|
|
|
|
|
|
|
|
|
|
|
|
|
Moody’s
|
|
|
Standard
&
Poor’s
|
|
|
Fitch
|
|
|
The PNC Financial Services Group, Inc.
|
|
|
|
|
|
|
Senior debt
|
|
|
A3
|
|
|
|
A
|
|
|
|
A+
|
|
|
Subordinated debt
|
|
|
Baa1
|
|
|
|
A-
|
|
|
|
A
|
|
|
Preferred stock
|
|
|
Baa3
|
|
|
|
BBB
|
|
|
|
A
|
|
|
|
|
|
|
|
PNC Bank, N.A.
|
|
|
|
|
|
|
|
|
|
|
|
|
|
Subordinated debt
|
|
|
A3
|
|
|
|
A
|
|
|
|
A
|
|
|
Long-term deposits
|
|
|
A2
|
|
|
|
A+
|
|
|
|
AA-
|
|
|
Short-term deposits
|
|
|
P-1
|
|
|
|
A-1
|
|
|
|
F1+
|
|
On November 1, 2010, Moody’s announced that they had downgraded the ratings of 10 large US regional banks after reducing its government support
assumptions for these entities. The ratings for these companies, which had been placed on review for possible downgrade on July 27, 2010, had benefitted from Moody’s support assumptions since 2009. The reduction in the support assumption
resulted in a one-notch downgrade of PNC’s bank-level debt and long-term deposits ratings. The ratings of PNC’s holding company were not on review and were affirmed. Moody’s indicated that the firm continues to ascribe support in the
case of PNC, but at a reduced level. The ongoing assumption of support for PNC is primarily due to our importance in the payment system and significant national deposit share. However, the assumed level of support does not provide any lift to the
bank’s current stand-alone ratings. At the same time, the ratings outlook on PNC was changed to positive from stable reflecting its improving credit metrics and strengthened capital profile. All of the other ratings in the table above were the
same on both September 30, 2010 and November 1, 2010.
47
Commitments
The following tables set forth contractual obligations and various other commitments as of September 30, 2010 representing required and potential cash outflows.
Contractual Obligations
|
|
|
|
|
|
|
September 30, 2010 – in millions
|
|
Total
|
|
|
Remaining contractual maturities of time deposits
|
|
$
|
43,887
|
|
|
Borrowed funds
|
|
|
39,763
|
|
|
Minimum annual rentals on noncancellable leases
|
|
|
2,459
|
|
|
Nonqualified pension and postretirement benefits
|
|
|
539
|
|
|
Purchase obligations (a)
|
|
|
583
|
|
|
Total contractual cash obligations
|
|
$
|
87,231
|
|
|
(a)
|
Includes purchase obligations for goods and services covered by noncancellable contracts and contracts including cancellation fees.
|
At September 30, 2010, the liability for uncertain tax positions, excluding associated interest and penalties, was $246 million. This liability
represents an estimate of tax positions that we have taken in our tax returns which ultimately may not be sustained upon examination by taxing authorities. Since the ultimate amount and timing of any future cash settlements cannot be predicted with
reasonable certainty, this estimated liability has been excluded from the contractual obligations table. See Note 15 Income Taxes in the Notes To Consolidated Financial Statements of this Report for additional information.
Our contractual obligations totaled $97.6 billion at December 31, 2009 as further detailed in Item 7 of our 2009 Form 10-K. The decline to
$87.2 billion at September 30, 2010 as outlined in the table above was due primarily to a $10.4 billion decline in the remaining contractual maturities of time deposits.
Other Commitments (a)
|
|
|
|
|
|
|
|
|
Total
|
|
|
September 30, 2010 – in millions
|
|
Amounts
Committed
|
|
|
Net unfunded credit commitments
|
|
$
|
97,147
|
|
|
Standby letters of credit (b)
|
|
|
9,937
|
|
|
Reinsurance agreements (c)
|
|
|
4,272
|
|
|
Recourse agreements (d)
|
|
|
4,029
|
|
|
Other commitments (e)
|
|
|
784
|
|
|
Total commitments
|
|
$
|
116,169
|
|
|
(a)
|
Other commitments are funding commitments that could potentially require performance in the event of demands by third parties or contingent events. Loan commitments are
reported net of participations, assignments and syndications.
|
|
(b)
|
Includes $6.3 billion of standby letters of credit that support remarketing programs for customers’ variable rate demand notes.
|
|
(c)
|
Reinsurance agreements are with third-party insurers related to insurance sold to our customers.
|
|
(d)
|
Recourse agreements are arrangements with FNMA’s and FHLMC’s DUS Programs.
|
|
(e)
|
Includes unfunded commitments related to private equity investments of $370 million and other investments of $21 million which are not on our Consolidated Balance
Sheet. Also includes commitments related to tax credit investments of $377 million and other direct equity investments of $16 million which are included in Other liabilities on our Consolidated Balance Sheet.
|
M
ARKET
R
ISK
M
ANAGEMENT
O
VERVIEW
Market risk is the risk of a loss in earnings or economic value due to adverse movements in market factors such as interest rates,
credit spreads, foreign exchange rates, and equity prices.
M
ARKET
R
ISK
M
ANAGEMENT
–
I
NTEREST
R
ATE
R
ISK
Interest rate risk results primarily from our traditional banking
activities of gathering deposits and extending loans. Many factors, including economic and financial conditions, movements in interest rates, and consumer preferences, affect the difference between the interest that we earn on assets and the
interest that we pay on liabilities and the level of our noninterest-bearing funding sources. Due to the repricing term mismatches and embedded options inherent in certain of these products, changes in market interest rates not only affect expected
near-term earnings, but also the economic values of these assets and liabilities.
Asset and Liability Management centrally manages interest
rate risk within limits and guidelines set forth in our risk management policies approved by management’s Asset and Liability Committee and the Joint Risk Committee of the Board.
Sensitivity results and market interest rate benchmarks for the third quarters of 2010 and 2009 follow:
Interest Sensitivity Analysis
|
|
|
|
|
|
|
|
|
|
|
|
|
Third
Quarter
2010
|
|
|
Third
Quarter
2009
|
|
|
Net Interest Income Sensitivity Simulation
|
|
|
|
|
|
|
|
|
|
Effect on net interest income in first year from gradual interest rate change over following 12 months of:
|
|
|
|
|
|
|
|
|
|
100 basis point increase
|
|
|
1.5
|
%
|
|
|
.9
|
%
|
|
100 basis point decrease (a)
|
|
|
(1.8
|
)%
|
|
|
(2.0
|
)%
|
|
Effect on net interest income in second year from gradual interest rate change over the preceding 12 months of:
|
|
|
|
|
|
|
|
|
|
100 basis point increase
|
|
|
4.6
|
%
|
|
|
1.4
|
%
|
|
100 basis point decrease (a)
|
|
|
(5.9
|
)%
|
|
|
(5.5
|
)%
|
|
Duration of Equity Model (a)
|
|
|
|
|
|
|
|
|
|
Base case duration of equity (in years):
|
|
|
(3.0
|
)
|
|
|
(2.2
|
)
|
|
Key Period-End Interest Rates
|
|
|
|
|
|
|
|
|
|
One-month LIBOR
|
|
|
.26
|
%
|
|
|
.25
|
%
|
|
Three-year swap
|
|
|
.87
|
%
|
|
|
1.87
|
%
|
|
(a)
|
Given the inherent limitations in certain of these measurement tools and techniques, results become less meaningful as interest rates approach zero.
|
48
In addition to measuring the effect on net interest income assuming parallel changes in current interest
rates, we routinely simulate the effects of a number of nonparallel interest rate environments. The following Net Interest Income Sensitivity to Alternative Rate Scenarios table reflects the percentage change in net interest income over the next two
12-month periods assuming (i) the PNC Economist’s most likely rate forecast, (ii) implied market forward rates, and (iii) a Two-Ten Slope decrease (a 200 basis point decrease between two-year and ten-year rates superimposed on
current base rates) scenario.
Net Interest Income Sensitivity to Alternative Rate Scenarios (Third Quarter 2010)
|
|
|
|
|
|
|
|
|
|
|
|
|
|
|
|
|
PNC
Economist
|
|
|
Market
Forward
|
|
|
Two-Ten
Slope
|
|
|
First year sensitivity
|
|
|
1.0
|
%
|
|
|
(.3
|
)%
|
|
|
(1.1
|
)%
|
|
Second year sensitivity
|
|
|
3.9
|
%
|
|
|
1.2
|
%
|
|
|
(1.8
|
)%
|
All changes in forecasted net interest income are relative to results in a base rate scenario where current market rates are assumed to remain unchanged
over the forecast horizon.
When forecasting net interest income, we make assumptions about interest rates and the shape of the yield curve,
the volume and characteristics of new business, and the behavior of existing on- and off-balance sheet positions. These assumptions determine the future level of simulated net interest income in the base interest rate scenario and the other interest
rate scenarios presented in the above table. These simulations assume that as assets and liabilities mature, they are replaced or repriced at then current market rates. We also consider forward projections of purchase accounting accretion when
forecasting net interest income.
The graph below presents the yield curves for the base rate scenario and each of the alternate scenarios one
year forward.
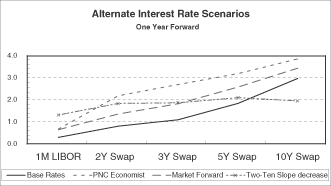
The third quarter 2010 interest sensitivity analyses indicate that our Consolidated Balance Sheet is positioned to benefit
from an increase in interest rates. We believe that we have the deposit funding base and balance sheet flexibility to adjust, where appropriate and permissible, to changing interest rates and market conditions.
M
ARKET
R
ISK
M
ANAGEMENT
– T
RADING
R
ISK
Our trading activities are primarily customer-driven trading in fixed income securities, equities, derivatives,
and foreign exchange contracts. They also include the underwriting of fixed income and equity securities. Proprietary trading positions were essentially eliminated by the end of the second quarter of 2010.
We use value-at-risk (VaR) as the primary means to measure and monitor market risk in trading activities. The Joint Risk Committee of the Board
establishes an enterprise-wide VaR limit on our trading activities.
During the first nine months of 2010, our VaR ranged between $2.8 million
and $8.8 million, averaging $5.8 million. During the first nine months of 2009, our VaR ranged between $5.8 million and $10.1 million, averaging $7.4 million.
To help ensure the integrity of the models used to calculate VaR for each portfolio and enterprise-wide, we use a process known as backtesting. The backtesting process consists of comparing actual
observations of trading-related gains or losses against the VaR levels that were calculated at the close of the prior day. Over a typical business cycle, we would expect an average of two to three instances a year in which actual losses exceeded the
prior day VaR measure at the enterprise-wide level. There were no such instances during the first nine months of either 2010 or 2009, as the trading markets have moved into a period of relatively low pricing volatility.
The following graph shows a comparison of enterprise-wide trading-related gains and losses against prior day VaR for the period.
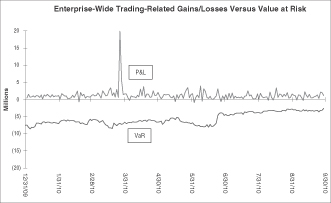
49
Trading Revenue
|
|
|
|
|
|
|
|
|
|
|
Nine months ended September 30
In millions
|
|
2010
|
|
|
2009
|
|
|
Net interest income
|
|
$
|
43
|
|
|
$
|
46
|
|
|
Noninterest income
|
|
|
99
|
|
|
|
111
|
|
|
Total trading revenue
|
|
$
|
142
|
|
|
$
|
157
|
|
|
Securities underwriting and trading (a)
|
|
$
|
70
|
|
|
$
|
63
|
|
|
Foreign exchange
|
|
|
59
|
|
|
|
53
|
|
|
Financial derivatives
|
|
|
13
|
|
|
|
41
|
|
|
Total trading revenue (b)
|
|
$
|
142
|
|
|
$
|
157
|
|
|
|
|
|
|
Three months ended September 30
In millions
|
|
2010
|
|
|
2009
|
|
|
Net interest income
|
|
$
|
11
|
|
|
$
|
14
|
|
|
Noninterest income
|
|
|
21
|
|
|
|
31
|
|
|
Total trading revenue
|
|
$
|
32
|
|
|
$
|
45
|
|
|
Securities underwriting and trading (a)
|
|
$
|
17
|
|
|
$
|
24
|
|
|
Foreign exchange
|
|
|
14
|
|
|
|
12
|
|
|
Financial derivatives
|
|
|
1
|
|
|
|
9
|
|
|
Total trading revenue (b)
|
|
$
|
32
|
|
|
$
|
45
|
|
|
(a)
|
Includes changes in fair value for certain loans accounted for at fair value.
|
|
(b)
|
Product trading revenue includes related hedged activity.
|
Trading revenue excludes the impact of economic hedging activities, which relate primarily to residential mortgage servicing rights, and residential and held-for-sale commercial real estate loans.
Trading revenue decreased by $15 million compared with the first nine months of 2009 and $13 million compared with the third quarter of 2009
primarily due to lower proprietary trading results and the increased impact of counterparty credit risk on valuations of customer derivative positions. The decline in the nine month comparison was partially offset by improved underwriting results.
The decline in the quarterly comparison was partially offset by improved customer-driven trading results. Proprietary trading positions were essentially eliminated in the second quarter of 2010.
M
ARKET
R
ISK
M
ANAGEMENT
– E
QUITY
A
ND
O
THER
I
NVESTMENT
R
ISK
Equity investment risk is the risk of potential losses associated with investing in both private and public equity markets.
A summary of our equity investments follows:
|
|
|
|
|
|
|
|
|
|
|
In millions
|
|
Sept.
30
2010
|
|
|
Dec. 31
2009
|
|
|
BlackRock
|
|
$
|
5,904
|
|
|
$
|
5,736
|
|
|
Tax credit investments
|
|
|
2,102
|
|
|
|
2,510
|
|
|
Private equity
|
|
|
1,366
|
|
|
|
1,184
|
|
|
Visa
|
|
|
456
|
|
|
|
456
|
|
|
Other
|
|
|
309
|
|
|
|
368
|
|
|
Total
|
|
$
|
10,137
|
|
|
$
|
10,254
|
|
BlackRock
PNC owned approximately 44 million common stock equivalent shares of BlackRock equity at September 30, 2010, accounted for under the equity method. The carrying value of our investment in
BlackRock at September 30, 2010 was $6.0 billion, which includes our equity investment of $5.9 billion and $.1 billion of related goodwill and accumulated other comprehensive income related to our BlackRock investment. The market value of our
investment in BlackRock was $7.4 billion at September 30, 2010 (not including liquidity discount). The primary risk measurement, similar to other equity investments, is economic capital. Further information about BlackRock is included in the
Business Segments Review section of this Financial Review.
Tax Credit Investments
Included in our equity investments are tax credit investments which are mostly accounted for under the equity method.
These investments, as well as equity investments held by consolidated partnerships, totaled $2.1 billion at September 30, 2010 and $2.5 billion at
December 31, 2009.
Private Equity
The private equity portfolio is an illiquid portfolio comprised of equity and mezzanine investments that vary by industry, stage and type of investment.
Private equity investments carried at estimated fair value totaled $1.4 billion at September 30, 2010 and $1.2 billion at December 31, 2009. As
of September 30, 2010, $740 million was invested directly in a variety of companies and $626 million was invested indirectly through various private equity funds. Included in direct investments are investment activities of two private equity
funds that are consolidated for financial reporting purposes. The noncontrolling interests of these funds totaled $220 million as of September 30, 2010. The indirect private equity funds are not redeemable, but PNC receives distributions over
the life of the partnership from liquidation of the underlying investments by the investee.
Our unfunded commitments related to private
equity totaled $370 million at September 30, 2010 compared with $453 million at December 31, 2009.
50
Visa
At September 30, 2010, our investment in Visa Class B common shares totaled approximately 23 million shares. In May 2010, Visa funded $500 million to their litigation escrow account and reduced
the conversion ratio of Visa B to A shares. We consequently recognized our estimated $47 million share of the $500 million as a reduction of our indemnification liability and a reduction of noninterest expense. Considering the adjustment to the
conversion ratio, the Class B shares would convert to approximately 12.9 million of publicly traded Visa Class A common shares. In September 2010, Visa announced their intention to fund their litigation escrow account by an additional $800
million. This funding occurred in October 2010. As a result, we expect to recognize an additional $76 million reduction of the indemnification liability in the fourth quarter of 2010.
As of September 30, 2010, we had recognized $456 million of our Visa ownership, which we acquired with National City, on our Consolidated Balance Sheet. Based on the September 30, 2010 closing
price of $74.26 for the Visa Class A shares, the market value of our investment was $960 million. The Visa Class B common shares we own generally will not be transferable, except under limited circumstances, until they can be converted into
shares of the publicly traded class of stock, which cannot happen until the later of three years after the IPO, March 25, 2011, or settlement of all of the specified litigation. It is expected that Visa will continue to adjust the conversion
ratio of Visa Class B to Class A shares in connection with any settlements in excess of any amounts then in escrow for that purpose and will also reduce the conversion ratio to the extent that it adds any funds to the escrow in the future.
Note 18 Commitments and Guarantees in our Notes To Consolidated Financial Statements of this Report and Note 25 Commitments and Guarantees in
our Notes To Consolidated Financial Statements under Item 8 of our 2009 Form 10-K have further information on our Visa indemnification obligation.
Other Investments
We also make investments in affiliated and non-affiliated funds
with both traditional and alternative investment strategies. The economic values could be driven by either the fixed-income market or the equity markets, or both. At September 30, 2010, other investments totaled $309 million compared with $368
million at December 31, 2009. We recognized net gains related to these investments of $33 million during the first nine months of 2010, including $7 million during the third quarter. We recognized net losses related to these investments of $62
million during the first nine months of 2009, including a gain of $17 million during the third quarter.
Given the nature of these
investments, if market conditions affecting their valuation were to worsen, we could incur future losses.
Our unfunded commitments related to other investments totaled $21 million at September 30, 2010 and
$66 million at December 31, 2009.
F
INANCIAL
D
ERIVATIVES
We use a variety of financial derivatives as part of the overall asset and liability risk management process to help manage interest rate, market and
credit risk inherent in our business activities. Substantially all such instruments are used to manage risk related to changes in interest rates. Interest rate and total return swaps, interest rate caps and floors, swaptions, options, forwards and
futures contracts are the primary instruments we use for interest rate risk management.
Financial derivatives involve, to varying degrees,
interest rate, market and credit risk. For interest rate swaps and total return swaps, options and futures contracts, only periodic cash payments and, with respect to options, premiums are exchanged. Therefore, cash requirements and exposure to
credit risk are significantly less than the notional amount on these instruments.
Further information on our financial derivatives is
presented in Note 1 Accounting Policies in our Notes To Consolidated Financial Statements under Item 8 of our 2009 Form 10-K and in Note 12 Financial Derivatives in the Notes To Consolidated Financial Statements in this Report, which is
incorporated here by reference.
Not all elements of interest rate, market and credit risk are addressed through the use of financial or other
derivatives, and such instruments may be ineffective for their intended purposes due to unanticipated market changes, among other reasons.
51
The following table provides the
notional or contractual amounts and estimated net fair value of financial derivatives at September 30, 2010 and December 31, 2009.
Financial Derivatives
|
|
|
|
|
|
|
|
|
|
|
|
|
|
|
|
|
|
|
|
|
September 30, 2010
|
|
|
December 31, 2009
|
|
|
In millions
|
|
Notional/
Contractual
Amount
|
|
|
Estimated
Net Fair
Value
|
|
|
Notional/
Contractual
Amount
|
|
|
Estimated
Net Fair
Value
|
|
|
Derivatives designated as hedging instrument under GAAP
|
|
|
|
|
|
|
|
|
|
|
|
|
|
|
|
|
|
Interest rate contracts (a)
|
|
|
|
|
|
|
|
|
|
|
|
|
|
|
|
|
|
Asset rate conversion
|
|
|
|
|
|
|
|
|
|
|
|
|
|
|
|
|
|
Receive fixed swaps
|
|
$
|
14,637
|
|
|
$
|
525
|
|
|
$
|
13,055
|
|
|
$
|
(64
|
)
|
|
Pay fixed swaps (c)
|
|
|
1,815
|
|
|
|
(66
|
)
|
|
|
|
|
|
|
|
|
|
Liability rate conversion
|
|
|
|
|
|
|
|
|
|
|
|
|
|
|
|
|
|
Receive fixed swaps
|
|
|
11,203
|
|
|
|
1,272
|
|
|
|
13,048
|
|
|
|
707
|
|
|
Forward purchase commitments
|
|
|
4,005
|
|
|
|
34
|
|
|
|
350
|
|
|
|
1
|
|
|
Total interest rate risk management
|
|
|
31,660
|
|
|
|
1,765
|
|
|
|
26,453
|
|
|
|
644
|
|
|
Total derivatives designated as hedging instruments (b)
|
|
$
|
31,660
|
|
|
$
|
1,765
|
|
|
$
|
26,453
|
|
|
$
|
644
|
|
|
Derivatives not designated as hedging instruments under GAAP
|
|
|
|
|
|
|
|
|
|
|
|
|
|
|
|
|
|
Derivatives used for residential mortgage banking activities:
|
|
|
|
|
|
|
|
|
|
|
|
|
|
|
|
|
|
Interest rate contracts
|
|
|
|
|
|
|
|
|
|
|
|
|
|
|
|
|
|
Swaps
|
|
$
|
69,752
|
|
|
$
|
288
|
|
|
$
|
38,596
|
|
|
$
|
(152
|
)
|
|
Caps/floors – Purchased
|
|
|
|
|
|
|
|
|
|
|
5,200
|
|
|
|
50
|
|
|
Futures
|
|
|
57,269
|
|
|
|
|
|
|
|
41,609
|
|
|
|
|
|
|
Future options
|
|
|
83,800
|
|
|
|
20
|
|
|
|
18,580
|
|
|
|
28
|
|
|
Swaptions
|
|
|
13,155
|
|
|
|
(2
|
)
|
|
|
24,145
|
|
|
|
(22
|
)
|
|
Commitments related to residential mortgage assets
|
|
|
18,680
|
|
|
|
58
|
|
|
|
9,565
|
|
|
|
6
|
|
|
Total residential mortgage banking activities
|
|
$
|
242,656
|
|
|
$
|
364
|
|
|
$
|
137,695
|
|
|
$
|
(90
|
)
|
|
Derivatives used for commercial mortgage banking activities:
|
|
|
|
|
|
|
|
|
|
|
|
|
|
|
|
|
|
Interest rate contracts
|
|
|
|
|
|
|
|
|
|
|
|
|
|
|
|
|
|
Swaps (c)
|
|
$
|
1,668
|
|
|
$
|
(66
|
)
|
|
$
|
1,948
|
|
|
$
|
(15
|
)
|
|
Commitments related to commercial mortgage assets
|
|
|
3,027
|
|
|
|
3
|
|
|
|
1,733
|
|
|
|
8
|
|
|
Credit contracts
|
|
|
|
|
|
|
|
|
|
|
|
|
|
|
|
|
|
Credit default swaps
|
|
|
185
|
|
|
|
11
|
|
|
|
460
|
|
|
|
52
|
|
|
Total commercial mortgage banking activities
|
|
$
|
4,880
|
|
|
$
|
(52
|
)
|
|
$
|
4,141
|
|
|
$
|
45
|
|
|
Derivatives used for customer-related activities:
|
|
|
|
|
|
|
|
|
|
|
|
|
|
|
|
|
|
Interest rate contracts
|
|
|
|
|
|
|
|
|
|
|
|
|
|
|
|
|
|
Swaps (c)
|
|
$
|
88,592
|
|
|
$
|
(178
|
)
|
|
$
|
91,090
|
|
|
$
|
(54
|
)
|
|
Caps/floors
|
|
|
|
|
|
|
|
|
|
|
|
|
|
|
|
|
|
Sold
|
|
|
3,174
|
|
|
|
(10
|
)
|
|
|
3,457
|
|
|
|
(15
|
)
|
|
Purchased
|
|
|
2,442
|
|
|
|
9
|
|
|
|
2,115
|
|
|
|
14
|
|
|
Swaptions
|
|
|
2,367
|
|
|
|
60
|
|
|
|
1,996
|
|
|
|
11
|
|
|
Futures
|
|
|
2,122
|
|
|
|
|
|
|
|
2,271
|
|
|
|
|
|
|
Foreign exchange contracts
|
|
|
8,618
|
|
|
|
10
|
|
|
|
8,002
|
|
|
|
14
|
|
|
Equity contracts
|
|
|
378
|
|
|
|
|
|
|
|
351
|
|
|
|
|
|
|
Credit contracts
|
|
|
|
|
|
|
|
|
|
|
|
|
|
|
|
|
|
Risk participation agreements
|
|
|
2,922
|
|
|
|
1
|
|
|
|
2,819
|
|
|
|
1
|
|
|
Total customer-related
|
|
$
|
110,615
|
|
|
$
|
(108
|
)
|
|
$
|
112,101
|
|
|
$
|
(29
|
)
|
|
Derivatives used for other risk management activities:
|
|
|
|
|
|
|
|
|
|
|
|
|
|
|
|
|
|
Interest rate contracts
|
|
|
|
|
|
|
|
|
|
|
|
|
|
|
|
|
|
Swaps
|
|
$
|
865
|
|
|
|
|
|
|
$
|
4,667
|
|
|
$
|
3
|
|
|
Caps/floors – Purchased
|
|
|
100
|
|
|
$
|
1
|
|
|
|
|
|
|
|
|
|
|
Swaptions
|
|
|
|
|
|
|
|
|
|
|
720
|
|
|
|
(9
|
)
|
|
Futures
|
|
|
280
|
|
|
|
|
|
|
|
145
|
|
|
|
|
|
|
Future options
|
|
|
|
|
|
|
|
|
|
|
|
|
|
|
|
|
|
Commitments related to residential mortgage assets
|
|
|
|
|
|
|
|
|
|
|
50
|
|
|
|
|
|
|
Foreign exchange contracts (c)
|
|
|
34
|
|
|
|
(2
|
)
|
|
|
41
|
|
|
|
1
|
|
|
Credit contracts
|
|
|
|
|
|
|
|
|
|
|
|
|
|
|
|
|
|
Credit default swaps
|
|
|
664
|
|
|
|
9
|
|
|
|
1,128
|
|
|
|
(2
|
)
|
|
Other contracts (d)
|
|
|
209
|
|
|
|
(354
|
)
|
|
|
211
|
|
|
|
(486
|
)
|
|
Total other risk management
|
|
$
|
2,152
|
|
|
$
|
(346
|
)
|
|
$
|
6,962
|
|
|
$
|
(493
|
)
|
|
Total derivatives not designated as hedging instruments
|
|
$
|
360,303
|
|
|
$
|
(142
|
)
|
|
$
|
260,899
|
|
|
$
|
(567
|
)
|
|
Total Gross Derivatives
|
|
$
|
391,963
|
|
|
$
|
1,623
|
|
|
$
|
287,352
|
|
|
$
|
77
|
|
|
(a)
|
The floating rate portion of interest rate contracts is based on money-market indices. As a percent of notional amount, 58% were based on 1-month LIBOR and 42% on
3-month LIBOR at September 30, 2010 compared with 57% and 43%, respectively, at December 31, 2009.
|
|
(b)
|
Fair value amount includes net accrued interest receivable of $151 million at September 30, 2010 and $162 million at December 31, 2009.
|
|
(c)
|
The increases in the negative fair values from December 31, 2009 to September 30, 2010 for interest rate contracts, foreign exchange, equity contracts and
other contracts were due to the changes in fair values of the existing contracts along with new contracts entered into during 2010 and contracts terminated.
|
|
(d)
|
Includes PNC’s obligation to fund a portion of certain BlackRock LTIP programs.
|
52
I
NTERNAL
C
ONTROLS
A
ND
D
ISCLOSURE
C
ONTROLS
A
ND
P
ROCEDURES
As of September 30, 2010, we performed an evaluation under the supervision and with
the participation of our management, including the Chairman and Chief Executive Officer and the Executive Vice President and Chief Financial Officer, of the effectiveness of the design and operation of our disclosure controls and procedures and of
changes in our internal control over financial reporting.
Based on that evaluation, our Chairman and Chief Executive Officer and our
Executive Vice President and Chief Financial Officer concluded that our disclosure controls and procedures (as defined in Rule 13a-15(e) under the Securities and Exchange Act of 1934, as amended) were effective as of September 30, 2010, and
that there has been no change in PNC’s internal control over financial reporting that occurred during the third quarter of 2010 that has materially affected, or is reasonably likely to materially affect, our internal control over financial
reporting.
G
LOSSARY
O
F
T
ERMS
Accretable net interest
(Accretable yield) – The excess of cash flows expected to be collected on a purchased impaired loan over the carrying
value of the loan. The accretable net interest is recognized into interest income over the remaining life of the loan using the constant effective yield method.
Adjusted average total assets
– Primarily comprised of total average quarterly (or annual) assets plus (less) unrealized losses (gains) on investment securities, less goodwill and certain
other intangible assets (net of eligible deferred taxes).
Annualized
– Adjusted to reflect a full year of activity.
Assets under management
– Assets over which we have sole or shared investment authority for our customers/clients. We do not include these
assets on our Consolidated Balance Sheet.
Basis point
– One hundredth of a percentage point.
Cash recoveries
– Cash recoveries used in the context of purchased impaired loans represent cash payments from customers that exceeded the
recorded investment of the designated impaired loan.
Charge-off
– Process of removing a loan or portion of a loan from our
balance sheet because it is considered uncollectible. We also record a charge-off when a loan is transferred to held for sale by reducing the loan carrying amount to the fair value of the loan, if fair value is less than carrying amount.
Client-related noninterest income
– Total noninterest income included on our Consolidated
Income Statement less amounts for net gains (losses) on sales of securities, net other-than-temporary impairments, and other noninterest income.
Common shareholders’ equity to total assets
– Common shareholders’ equity divided by total assets. Common shareholders’ equity equals total shareholders’ equity less the
liquidation value of preferred stock.
Credit derivatives
– Contractual agreements, primarily credit default swaps, that provide
protection against a credit event of one or more referenced credits. The nature of a credit event is established by the protection buyer and protection seller at the inception of a transaction, and such events include bankruptcy, insolvency and
failure to meet payment obligations when due. The buyer of the credit derivative pays a periodic fee in return for a payment by the protection seller upon the occurrence, if any, of a credit event.
Credit spread
– The difference in yield between debt issues of similar maturity. The excess of yield attributable to credit spread is often
used as a measure of relative creditworthiness, with a reduction in the credit spread reflecting an improvement in the borrower’s perceived creditworthiness.
Derivatives
– Financial contracts whose value is derived from publicly traded securities, interest rates, currency exchange rates or market indices. Derivatives cover a wide assortment of
financial contracts, including but not limited to forward contracts, futures, options and swaps.
Duration of equity
– An estimate
of the rate sensitivity of our economic value of equity. A negative duration of equity is associated with asset sensitivity (
i.e.,
positioned for rising interest rates), while a positive value implies liability sensitivity (
i.e.,
positioned for declining interest rates). For example, if the duration of equity is +1.5 years, the economic value of equity declines by 1.5% for each 100 basis point increase in interest rates.
Earning assets
– Assets that generate income, which include: Federal funds sold; resale agreements; trading securities; interest-earning
deposits with banks; loans held for sale; loans; investment securities; and certain other assets.
Economic capital
– Represents
the amount of resources that a business segment should hold to guard against potentially large losses that could cause insolvency. It is based on a measurement of economic risk, as opposed to risk as defined by regulatory bodies. The economic
capital measurement process involves converting a risk distribution to the capital that is required to support the risk, consistent with our target credit rating. As such, economic risk serves as a “common currency” of risk that allows us
to compare different risks on a similar basis.
Effective duration
– A measurement, expressed in years, that, when multiplied by a
change in interest rates, would
53
approximate the percentage change in value of on- and off- balance sheet positions.
Efficiency
– Noninterest expense divided by the sum of net interest income (GAAP basis) and noninterest income.
Fair value
– The price that would be received to sell an asset or the price that would be paid to transfer a liability on the measurement
date using the principal or most advantageous market for the asset or liability in an orderly transaction between willing market participants.
Foreign exchange contracts
– Contracts that provide for the future receipt and delivery of foreign currency at previously agreed-upon terms.
Funds transfer pricing
– A management accounting methodology designed to recognize the net interest income effects of sources and
uses of funds provided by the assets and liabilities of a business segment. We assign these balances LIBOR-based funding rates at origination that represent the interest cost for us to raise/invest funds with similar maturity and repricing
structures.
Futures and forward contracts
– Contracts in which the buyer agrees to purchase and the seller agrees to deliver a
specific financial instrument at a predetermined price or yield. May be settled either in cash or by delivery of the underlying financial instrument.
GAAP
– Accounting principles generally accepted in the United States of America.
Interest rate floors and caps
– Interest rate protection instruments that involve payment from the protection seller to the protection buyer
of an interest differential, which represents the difference between a short-term rate (e.g., three-month LIBOR) and an agreed-upon rate (the strike rate) applied to a notional principal amount.
Interest rate swap contracts
– Contracts that are entered into primarily as an asset/liability management strategy to reduce interest rate
risk. Interest rate swap contracts are exchanges of interest rate payments, such as fixed-rate payments for floating-rate payments, based on notional principal amounts.
Intrinsic value
– The amount by which the fair value of an underlying stock exceeds the exercise price of an option on that stock.
Investment securities
– Collectively, securities available for sale and securities held to maturity.
Leverage ratio
– Tier 1 risk-based capital divided by adjusted average total assets.
LIBOR
– Acronym for London InterBank Offered Rate. LIBOR is the average interest rate charged when banks in the
London wholesale money market (or interbank market) borrow unsecured funds from each other. LIBOR rates are used as a benchmark for interest rates on a global basis.
Net interest income from loans and deposits
– A management accounting assessment, using funds transfer pricing methodology, of the net
interest contribution from loans and deposits.
Net interest margin
– Annualized taxable-equivalent net interest income divided by
average earning assets.
Nonaccretable difference
– Contractually required payments receivable on a purchased impaired loan in
excess of the cash flows expected to be collected.
Nondiscretionary assets under administration
– Assets we hold for our
customers/clients in a non-discretionary, custodial capacity. We do not include these assets on our Consolidated Balance Sheet.
Noninterest income to total revenue
– Noninterest income divided by the sum of net interest income (GAAP basis) and noninterest income.
Nonperforming assets
– Nonperforming assets include nonaccrual loans, troubled debt restructured loans, foreclosed assets and
other assets. We do not accrue interest income on assets classified as nonperforming.
Nonperforming loans
– Nonperforming loans
include loans to commercial, commercial real estate, equipment lease financing, consumer, and residential mortgage customers and construction customers as well as certain troubled debt restructured loans. Nonperforming loans do not include loans
held for sale or foreclosed and other assets. We do not accrue interest income on loans classified as nonperforming. Nonperforming loans do not include purchased impaired loans as we are currently accreting interest income over the expected life of
the loans.
Notional amount
– A number of currency units, shares, or other units specified in a derivatives contract.
Operating leverage
– The period to period dollar or percentage change in total revenue (GAAP basis) less the dollar or percentage change in
noninterest expense. A positive variance indicates that revenue growth exceeded expense growth (
i.e.,
positive operating leverage) while a negative variance implies expense growth exceeded revenue growth (
i.e.,
negative operating
leverage).
Options
– Contracts that grant the purchaser, for a premium payment, the right, but not the obligation, to either
purchase or sell the associated financial instrument at a set price during a specified period or at a specified date in the future.
54
Other-than-temporary impairment
(OTTI)
– When the fair value of a security is less than its amortized cost basis, an assessment is performed to determine whether the impairment is other-than-temporary. If we intend to sell the security or more likely than not will be
required to sell the security before recovery of its amortized cost basis less any current-period credit loss, an other-than-temporary impairment is considered to have occurred. In such cases, an other-than-temporary impairment is recognized in
earnings equal to the entire difference between the investment’s amortized cost basis and its fair value at the balance sheet date. Further, if we do not expect to recover the entire amortized cost of the security, an other-than-temporary
impairment is considered to have occurred. However for debt securities, if we do not intend to sell the security and it is not more likely than not that we will be required to sell the security before its recovery, the other-than-temporary loss is
separated into (a) the amount representing the credit loss, and (b) the amount related to all other factors. The other-than-temporary impairment related to credit losses is recognized in earnings while the amount related to all other
factors is recognized in other comprehensive income, net of tax.
Pretax, pre-provision earnings
– Total revenue less noninterest
expense.
Purchase accounting accretion
– Accretion of the discounts and premiums on acquired assets and liabilities. The purchase
accounting accretion is recognized in net interest income over the weighted average life of the financial instruments using the constant effective yield method.
Purchased impaired loans
– Acquired loans determined to be credit impaired under FASB ASC 310-30 (AICPA SOP 03-3). Loans are determined to be impaired if there is evidence of credit
deterioration since origination and for which it is probable that all contractually required payments will not be collected.
Recorded
investment
– The initial investment of a purchased impaired loan plus interest accretion and less any cash payments and writedowns to date. The recorded investment excludes any valuation allowance which is included in our allowance for loan
and lease losses.
Recovery
– Cash proceeds received on a loan that we had previously charged off. We credit the amount received
to the allowance for loan and lease losses.
Residential development loans
– Project-specific loans to commercial customers for
the construction or development of residential real estate including land, single family homes, condominiums and other residential properties. This would exclude loans to commercial customers where proceeds are for general corporate purposes whether
or not such facilities are secured.
Residential mortgage servicing rights hedge gains / (losses), net
– We have elected to measure
acquired or originated residential mortgage servicing rights (MSRs) at fair value under GAAP. We employ a risk management strategy designed to protect the economic value of MSRs from changes in interest rates. This strategy utilizes securities and a
portfolio of derivative instruments to hedge changes in the fair value of MSRs arising from changes in interest rates. These financial instruments are expected to have changes in fair value which are negatively correlated to the change in fair value
of the MSR portfolio. Net MSR hedge gains/ (losses) represent the change in the fair value of MSRs, exclusive of changes due to time decay and payoffs, combined with the change in the fair value of the associated derivative instruments.
Return on average assets
– Annualized net income divided by average assets.
Return on average capital
– Annualized net income divided by average capital.
Return on average common shareholders’ equity
– Annualized net income less preferred stock dividends, including preferred stock discount
accretion and redemptions, divided by average common shareholders’ equity.
Risk-weighted assets
– Computed by the assignment
of specific risk-weights (as defined by the Board of Governors of the Federal Reserve System) to assets and off-balance sheet instruments.
Securitization
– The process of legally transforming financial assets into securities.
Servicing rights
– An intangible asset or liability created by an obligation to service assets for others. Typical servicing rights include
the right to receive a fee for collecting and forwarding payments on loans and related taxes and insurance premiums held in escrow.
Swaptions
– Contracts that grant the purchaser, for a premium payment, the right, but not the obligation, to enter into an interest rate swap
agreement during a specified period or at a specified date in the future.
Taxable-equivalent interest
– The interest income
earned on certain assets is completely or partially exempt from Federal income tax. As such, these tax-exempt instruments typically yield lower returns than taxable investments. To provide more meaningful comparisons of yields and margins for all
interest-earning assets, we use interest income on a taxable-equivalent basis in calculating average yields and net interest margins by increasing the interest income earned on tax-exempt assets to make it fully equivalent to interest income earned
on other taxable investments. This adjustment is not permitted under GAAP on the Consolidated Income Statement.
55
Tier 1 common capital
–
Tier 1 risk-based capital, less preferred equity, less trust preferred capital securities, and less noncontrolling interests.
Tier 1
common capital ratio
– Tier 1 common capital divided by period-end risk-weighted assets.
Tier 1 risk-based capital
–
Total shareholders’ equity, plus trust preferred capital securities, plus certain noncontrolling interests that are held by others; less goodwill and certain other intangible assets (net of eligible deferred taxes relating to taxable and
nontaxable combinations), less equity investments in nonfinancial companies less ineligible servicing assets and less net unrealized holding losses on available for sale equity securities. Net unrealized holding gains on available for sale equity
securities, net unrealized holding gains (losses) on available for sale debt securities and net unrealized holding gains (losses) on cash flow hedge derivatives are excluded from total shareholders’ equity for Tier 1 risk-based capital
purposes.
Tier 1 risk-based capital ratio
– Tier 1 risk-based capital divided by period-end risk-weighted assets.
Total equity
– Total shareholders’ equity plus noncontrolling interests.
Total return swap
– A non-traditional swap where one party agrees to pay the other the “total return” of a defined underlying asset (e.g
.,
a loan), usually in return for
receiving a stream of LIBOR-based cash flows. The total returns of the asset, including interest and any default shortfall, are passed through to the counterparty. The counterparty is therefore assuming the credit and economic risk of the underlying
asset.
Total risk-based capital
– Tier 1 risk-based capital plus qualifying subordinated debt and trust preferred securities,
other noncontrolling interest not qualified as Tier 1, eligible gains on available for sale equity securities and the allowance for loan and lease losses, subject to certain limitations.
Total risk-based capital ratio
– Total risk-based capital divided by period-end risk-weighted assets.
Transaction deposits
– The sum of interest-bearing money market deposits, interest-bearing demand deposits, and noninterest-bearing deposits.
Troubled debt restructuring
– A restructuring of a loan whereby the lender for economic or legal reasons related to the borrower’s
financial difficulties grants a concession to the borrower that the lender would not otherwise consider or for which the lender would not be adequately compensated.
Value-at-risk (VaR)
– A statistically-based measure of risk which describes the amount of potential loss which may be incurred due to severe and adverse market movements. The measure is of the
maximum loss which should not be exceeded on 99 out of 100 days.
Watchlist
– A list of criticized loans, credit exposure or other assets compiled for internal
monitoring purposes. We define criticized exposure for this purpose as exposure with an internal risk rating of other assets especially mentioned, substandard, doubtful or loss.
Yield curve
– A graph showing the relationship between the yields on financial instruments or market indices of the same credit quality with different maturities. For example, a
“normal” or “positive” yield curve exists when long-term bonds have higher yields than short-term bonds. A “flat” yield curve exists when yields are the same for short-term and long-term bonds. A “steep” yield
curve exists when yields on long-term bonds are significantly higher than on short-term bonds. An “inverted” or “negative” yield curve exists when short-term bonds have higher yields than long-term bonds.
C
AUTIONARY
S
TATEMENT
R
EGARDING
F
ORWARD
-L
OOKING
I
NFORMATION
We make statements in this Report, and we may from time to
time make other statements, regarding our outlook or expectations for earnings, revenues, expenses, capital levels, liquidity levels, asset quality and/or other matters regarding or affecting PNC that are forward-looking statements within the
meaning of the Private Securities Litigation Reform Act. Forward-looking statements are typically identified by words such as “believe,” “plan,” “expect,” “anticipate,” “intend,” “outlook,”
“estimate,” “forecast,” “will,” “should,” “project,” “goal” and other similar words and expressions.
Forward-looking statements are subject to numerous assumptions, risks and uncertainties, which change over time. Forward-looking statements speak only as of the date they are made. We do not assume any
duty and do not undertake to update our forward-looking statements. Actual results or future events could differ, possibly materially, from those that we anticipated in our forward-looking statements, and future results could differ materially from
our historical performance.
Our forward-looking statements are subject to the following principal risks and uncertainties. We provide greater
detail regarding some of these factors in our 2009 Form 10-K, other 2010 Form 10-Qs and elsewhere in this Report, including in the Risk Factors and Risk Management sections of those reports. Our forward-looking statements may also be subject to
other risks and uncertainties, including those discussed elsewhere in this Report or in our other filings with the SEC.
|
•
|
|
Our businesses and financial results are affected by business and economic conditions, both generally and specifically in the principal markets in
which we operate. In particular, our businesses and financial results may be impacted by:
|
|
|
•
|
|
Changes in interest rates and valuations in the debt, equity and other financial markets.
|
56
|
|
•
|
|
Disruptions in the liquidity and other functioning of financial markets, including such disruptions in the markets for real estate and other assets
commonly securing financial products.
|
|
|
•
|
|
Actions by the Federal Reserve and other government agencies, including those that impact money supply and market interest rates.
|
|
|
•
|
|
Changes in our customers’, suppliers’ and other counterparties’ performance in general and their creditworthiness in particular.
|
|
|
•
|
|
A slowing or failure of the moderate economic recovery that began last year.
|
|
|
•
|
|
Continued effects of the aftermath of recessionary conditions and the uneven spread of the positive impacts of the recovery on the economy in general
and our customers in particular, including adverse impact on loan utilization rates as well as delinquencies, defaults and customer ability to meet credit obligations.
|
|
|
•
|
|
Changes in levels of unemployment.
|
|
|
•
|
|
Changes in customer preferences and behavior, whether as a result of changing business and economic conditions, climate-related physical changes or
legislative and regulatory initiatives, or other factors.
|
|
•
|
|
A continuation of turbulence in significant portions of the US and global financial markets, particularly if it worsens, could impact our performance,
both directly by affecting our revenues and the value of our assets and liabilities and indirectly by affecting our counterparties and the economy generally.
|
|
•
|
|
We will be impacted by the extensive reforms enacted in the Dodd-Frank Wall Street Reform and Consumer Protection Act. Further, as much of that Act
will require the adoption of implementing regulations by a number of different regulatory bodies, the precise nature, extent and timing of many of these reforms and the impact on us is still uncertain.
|
|
•
|
|
Financial industry restructuring in the current environment could also impact our business and financial performance as a result of changes in the
creditworthiness and performance of our counterparties and by changes in the competitive and regulatory landscape.
|
|
•
|
|
Our results depend on our ability to manage current elevated levels of impaired assets.
|
|
•
|
|
Given current economic and financial market conditions, our forward-looking financial statements are subject to the risk that these conditions will be
substantially different than we are currently expecting. These statements are based on our current view that the moderate economic recovery that began last year will continue throughout the rest of 2010 and slowly gather momentum in 2011 amidst
continued low interest rates.
|
|
•
|
|
Legal and regulatory developments could have an impact on our ability to operate our businesses or our financial condition or results of operations or
our competitive
|
|
|
|
position or reputation. Reputational impacts, in turn, could affect matters such as business generation and retention, our ability to attract and retain management, liquidity, and funding. These
legal and regulatory developments could include:
|
|
|
•
|
|
Changes resulting from legislative and regulatory responses to the current economic and financial industry environment.
|
|
|
•
|
|
Other legislative and regulatory reforms, including broad-based restructuring of financial industry regulation as well as changes to laws and
regulations involving tax, pension, bankruptcy, consumer protection, and other aspects of the financial institution industry.
|
|
|
•
|
|
Unfavorable resolution of legal proceedings or other claims and regulatory and other governmental investigations or other inquiries. In addition to
matters relating to PNC’s business and activities, such matters may also include proceedings, claims, investigations, or inquiries relating to pre-acquisition business and activities of acquired companies such as National City.
|
|
|
•
|
|
The results of the regulatory examination and supervision process, including our failure to satisfy the requirements of agreements with governmental
agencies.
|
|
|
•
|
|
Changes in accounting policies and principles.
|
|
|
•
|
|
Changes resulting from legislative and regulatory initiatives relating to climate change that have or may have a negative impact on our customers’
demand for or use of our products and services in general and their creditworthiness in particular.
|
|
|
•
|
|
Changes to regulations governing bank capital, including as a result of the so-called “Basel III” initiatives.
|
|
•
|
|
Our business and operating results are affected by our ability to identify and effectively manage risks inherent in our businesses, including, where
appropriate, through the effective use of third-party insurance, derivatives, and capital management techniques, and by our ability to meet evolving regulatory capital standards.
|
|
•
|
|
The adequacy of our intellectual property protection, and the extent of any costs associated with obtaining rights in intellectual property claimed by
others, can impact our business and operating results.
|
|
•
|
|
Our ability to anticipate and respond to technological changes can have an impact on our ability to respond to customer needs and to meet competitive
demands.
|
|
•
|
|
Our ability to implement our business initiatives and strategies could affect our financial performance over the next several years.
|
|
•
|
|
Our expansion with our National City acquisition in geographic markets and into business operations in areas in which we did not have significant
experience or presence prior to 2009 presents greater risks and uncertainties than were present for us in other recent acquisitions.
|
57
|
•
|
|
Competition can have an impact on customer acquisition, growth and retention, as well as on our credit spreads and product pricing, which can affect
market share, deposits and revenues.
|
|
•
|
|
Our business and operating results can also be affected by widespread disasters, terrorist activities or international hostilities, either as a result
of the impact on the economy and capital and other financial markets generally or on us or on our customers, suppliers or other counterparties specifically.
|
|
•
|
|
Also, risks and uncertainties that could affect the results anticipated in forward-looking statements or from historical performance relating to our
equity interest in BlackRock, Inc. are discussed in more detail in BlackRock’s filings with the SEC, including in the Risk Factors sections of BlackRock’s reports. BlackRock’s SEC filings are accessible on the SEC’s website and
on or through BlackRock’s website at www.blackrock.com. This material is referenced for informational purposes only and should not be deemed to constitute a part of this Report.
|
We grow our business in part by acquiring from time to time other financial services companies. Acquisitions present us
with risks in addition to those presented by the nature of the business acquired. These include risks and uncertainties related both to the acquisition transactions themselves and to the
integration of the acquired businesses into PNC after closing.
Acquisitions may be substantially more expensive to complete (including
unanticipated costs incurred in connection with the integration of the acquired company) and the anticipated benefits (including anticipated cost savings and strategic gains) may be significantly harder or take longer to achieve than expected.
Acquisitions may involve our entry into new businesses or new geographic or other markets, and these situations also present risks resulting from our inexperience in those new areas.
As a regulated financial institution, our pursuit of attractive acquisition opportunities could be negatively impacted due to regulatory delays or other regulatory issues. Regulatory and/or legal issues
relating to the pre-acquisition operations of an acquired business may cause reputational harm to PNC following the acquisition and integration of the acquired business into ours and may result in additional future costs or regulatory limitations
arising as a result of those issues.
58
CONSOLIDATED INCOME STATEMENT
THE PNC FINANCIAL SERVICES GROUP, INC.
|
|
|
|
|
|
|
|
|
|
|
|
|
|
|
|
|
|
|
In millions, except per share data
|
|
Three months ended
September 30
|
|
|
Nine months ended
September 30
|
|
|
Unaudited
|
|
2010
|
|
|
2009
|
|
|
2010
|
|
|
2009
|
|
|
Interest Income
|
|
|
|
|
|
|
|
|
|
|
|
|
|
|
|
|
|
Loans
|
|
$
|
1,996
|
|
|
$
|
2,091
|
|
|
$
|
6,314
|
|
|
$
|
6,759
|
|
|
Investment securities
|
|
|
592
|
|
|
|
684
|
|
|
|
1,787
|
|
|
|
2,045
|
|
|
Other
|
|
|
113
|
|
|
|
113
|
|
|
|
378
|
|
|
|
343
|
|
|
Total interest income
|
|
|
2,701
|
|
|
|
2,888
|
|
|
|
8,479
|
|
|
|
9,147
|
|
|
Interest Expense
|
|
|
|
|
|
|
|
|
|
|
|
|
|
|
|
|
|
Deposits
|
|
|
233
|
|
|
|
387
|
|
|
|
758
|
|
|
|
1,407
|
|
|
Borrowed funds
|
|
|
253
|
|
|
|
277
|
|
|
|
692
|
|
|
|
1,003
|
|
|
Total interest expense
|
|
|
486
|
|
|
|
664
|
|
|
|
1,450
|
|
|
|
2,410
|
|
|
Net interest income
|
|
|
2,215
|
|
|
|
2,224
|
|
|
|
7,029
|
|
|
|
6,737
|
|
|
Noninterest Income
|
|
|
|
|
|
|
|
|
|
|
|
|
|
|
|
|
|
Asset management
|
|
|
249
|
|
|
|
242
|
|
|
|
751
|
|
|
|
639
|
|
|
Consumer services
|
|
|
328
|
|
|
|
330
|
|
|
|
939
|
|
|
|
975
|
|
|
Corporate services
|
|
|
183
|
|
|
|
252
|
|
|
|
712
|
|
|
|
761
|
|
|
Residential mortgage
|
|
|
216
|
|
|
|
207
|
|
|
|
542
|
|
|
|
883
|
|
|
Service charges on deposits
|
|
|
164
|
|
|
|
248
|
|
|
|
573
|
|
|
|
714
|
|
|
Net gains on sales of securities
|
|
|
121
|
|
|
|
168
|
|
|
|
358
|
|
|
|
406
|
|
|
Other-than-temporary impairments
|
|
|
(117
|
)
|
|
|
(401
|
)
|
|
|
(475
|
)
|
|
|
(1,540
|
)
|
|
Less: Noncredit portion of other-than-temporary impairments (a)
|
|
|
(46
|
)
|
|
|
(272
|
)
|
|
|
(194
|
)
|
|
|
(1,107
|
)
|
|
Net other-than-temporary impairments
|
|
|
(71
|
)
|
|
|
(129
|
)
|
|
|
(281
|
)
|
|
|
(433
|
)
|
|
Other
|
|
|
193
|
|
|
|
311
|
|
|
|
650
|
|
|
|
660
|
|
|
Total noninterest income
|
|
|
1,383
|
|
|
|
1,629
|
|
|
|
4,244
|
|
|
|
4,605
|
|
|
Total revenue
|
|
|
3,598
|
|
|
|
3,853
|
|
|
|
11,273
|
|
|
|
11,342
|
|
|
Provision For Credit Losses
|
|
|
486
|
|
|
|
914
|
|
|
|
2,060
|
|
|
|
2,881
|
|
|
Noninterest Expense
|
|
|
|
|
|
|
|
|
|
|
|
|
|
|
|
|
|
Personnel
|
|
|
959
|
|
|
|
1,068
|
|
|
|
2,874
|
|
|
|
3,150
|
|
|
Occupancy
|
|
|
177
|
|
|
|
172
|
|
|
|
536
|
|
|
|
533
|
|
|
Equipment
|
|
|
152
|
|
|
|
170
|
|
|
|
492
|
|
|
|
522
|
|
|
Marketing
|
|
|
81
|
|
|
|
58
|
|
|
|
196
|
|
|
|
174
|
|
|
Other
|
|
|
789
|
|
|
|
746
|
|
|
|
2,175
|
|
|
|
2,485
|
|
|
Total noninterest expense
|
|
|
2,158
|
|
|
|
2,214
|
|
|
|
6,273
|
|
|
|
6,864
|
|
|
Income from continuing operations before income taxes and noncontrolling interests
|
|
|
954
|
|
|
|
725
|
|
|
|
2,940
|
|
|
|
1,597
|
|
|
Income taxes
|
|
|
179
|
|
|
|
185
|
|
|
|
736
|
|
|
|
342
|
|
|
Income from continuing operations before noncontrolling interests
|
|
|
775
|
|
|
|
540
|
|
|
|
2,204
|
|
|
|
1,255
|
|
|
Income from discontinued operations (net of income taxes of $311, $11, $338, and
$22)
|
|
|
328
|
|
|
|
19
|
|
|
|
373
|
|
|
|
41
|
|
|
Net income
|
|
|
1,103
|
|
|
|
559
|
|
|
|
2,577
|
|
|
|
1,296
|
|
|
Less: Net income (loss) attributable to noncontrolling interests
|
|
|
2
|
|
|
|
(20
|
)
|
|
|
(12
|
)
|
|
|
(7
|
)
|
|
Preferred stock dividends
|
|
|
4
|
|
|
|
99
|
|
|
|
122
|
|
|
|
269
|
|
|
Preferred stock discount
accretion and redemptions
|
|
|
3
|
|
|
|
13
|
|
|
|
254
|
|
|
|
42
|
|
|
Net income attributable to common shareholders
|
|
$
|
1,094
|
|
|
$
|
467
|
|
|
$
|
2,213
|
|
|
$
|
992
|
|
|
Basic Earnings Per Common Share
|
|
|
|
|
|
|
|
|
|
|
|
|
|
|
|
|
|
Continuing operations
|
|
$
|
1.45
|
|
|
$
|
.97
|
|
|
$
|
3.56
|
|
|
$
|
2.10
|
|
|
Discontinued operations
|
|
|
.63
|
|
|
|
.04
|
|
|
|
.72
|
|
|
|
.09
|
|
|
Net income
|
|
$
|
2.08
|
|
|
$
|
1.01
|
|
|
$
|
4.28
|
|
|
$
|
2.19
|
|
|
Diluted Earnings Per Common Share
|
|
|
|
|
|
|
|
|
|
|
|
|
|
|
|
|
|
Continuing operations
|
|
$
|
1.45
|
|
|
$
|
.96
|
|
|
$
|
3.52
|
|
|
$
|
2.08
|
|
|
Discontinued operations
|
|
|
.62
|
|
|
|
.04
|
|
|
|
.72
|
|
|
|
.09
|
|
|
Net income
|
|
$
|
2.07
|
|
|
$
|
1.00
|
|
|
$
|
4.24
|
|
|
$
|
2.17
|
|
|
Average Common Shares Outstanding
|
|
|
|
|
|
|
|
|
|
|
|
|
|
|
|
|
|
Basic
|
|
|
523
|
|
|
|
460
|
|
|
|
515
|
|
|
|
451
|
|
|
Diluted
|
|
|
526
|
|
|
|
461
|
|
|
|
518
|
|
|
|
452
|
|
|
(a)
|
Included in accumulated other comprehensive income (loss).
|
See accompanying Notes To Consolidated Financial Statements.
59
CONSOLIDATED BALANCE SHEET
THE PNC FINANCIAL SERVICES GROUP, INC.
|
|
|
|
|
|
|
|
|
|
|
In millions, except par value
Unaudited
|
|
September 30
2010
|
|
|
December 31
2009
|
|
|
Assets
|
|
|
|
|
|
|
|
|
|
Cash and due from banks (September 30, 2010 includes $2 for VIEs) (a)
|
|
$
|
3,724
|
|
|
$
|
4,288
|
|
|
Federal funds sold and resale agreements (includes $921 and $990 measured at fair value) (b)
|
|
|
2,094
|
|
|
|
2,390
|
|
|
Trading securities
|
|
|
955
|
|
|
|
2,124
|
|
|
Interest-earning deposits with banks (September 30, 2010 includes $5 for VIEs) (a)
|
|
|
415
|
|
|
|
4,488
|
|
|
Loans held for sale (includes $2,805 and $2,062 measured at fair value) (b)
|
|
|
3,275
|
|
|
|
2,539
|
|
|
Investment securities (September 30, 2010 includes $202 for VIEs) (a)
|
|
|
63,461
|
|
|
|
56,027
|
|
|
Loans (September 30, 2010 includes $4,644 for VIEs) (includes $90 and $88 measured at fair value) (a) (b)
|
|
|
150,127
|
|
|
|
157,543
|
|
|
Allowance for loan and lease losses (September 30, 2010 includes $(219) for VIEs)
(a)
|
|
|
(5,231
|
)
|
|
|
(5,072
|
)
|
|
Net loans
|
|
|
144,896
|
|
|
|
152,471
|
|
|
Goodwill
|
|
|
8,166
|
|
|
|
9,505
|
|
|
Other intangible assets
|
|
|
2,352
|
|
|
|
3,404
|
|
|
Equity investments (September 30, 2010 includes $1,177 for VIEs) (a)
|
|
|
10,137
|
|
|
|
10,254
|
|
|
Other (September 30, 2010 includes $787 for VIEs) (includes $354 and $486 measured at
fair value) (a) (b)
|
|
|
20,658
|
|
|
|
22,373
|
|
|
Total assets
|
|
$
|
260,133
|
|
|
$
|
269,863
|
|
|
Liabilities
|
|
|
|
|
|
|
|
|
|
Deposits
|
|
|
|
|
|
|
|
|
|
Noninterest-bearing
|
|
$
|
46,065
|
|
|
$
|
44,384
|
|
|
Interest-bearing
|
|
|
133,118
|
|
|
|
142,538
|
|
|
Total deposits
|
|
|
179,183
|
|
|
|
186,922
|
|
|
Borrowed funds
|
|
|
|
|
|
|
|
|
|
Federal funds purchased and repurchase agreements
|
|
|
4,661
|
|
|
|
3,998
|
|
|
Federal Home Loan Bank borrowings
|
|
|
7,106
|
|
|
|
10,761
|
|
|
Bank notes and senior debt
|
|
|
13,508
|
|
|
|
12,362
|
|
|
Subordinated debt
|
|
|
10,023
|
|
|
|
9,907
|
|
|
Other (September 30, 2010 includes $2,937 for VIEs) (a)
|
|
|
4,465
|
|
|
|
2,233
|
|
|
Total borrowed funds
|
|
|
39,763
|
|
|
|
39,261
|
|
|
Allowance for unfunded loan commitments and letters of credit
|
|
|
193
|
|
|
|
296
|
|
|
Accrued expenses (September 30, 2010 includes $79 for VIEs) (a)
|
|
|
3,134
|
|
|
|
3,590
|
|
|
Other (September 30, 2010 includes $523 for VIEs) (a)
|
|
|
5,194
|
|
|
|
7,227
|
|
|
Total liabilities
|
|
|
227,467
|
|
|
|
237,296
|
|
|
Equity
|
|
|
|
|
|
|
|
|
|
Preferred stock (c)
|
|
|
|
|
|
|
|
|
|
Common stock – $5 par value
|
|
|
|
|
|
|
|
|
|
Authorized 800 shares, issued 536 and 471 shares
|
|
|
2,680
|
|
|
|
2,354
|
|
|
Capital surplus – preferred stock
|
|
|
646
|
|
|
|
7,974
|
|
|
Capital surplus – common stock and other
|
|
|
12,008
|
|
|
|
8,945
|
|
|
Retained earnings
|
|
|
15,114
|
|
|
|
13,144
|
|
|
Accumulated other comprehensive income (loss)
|
|
|
146
|
|
|
|
(1,962
|
)
|
|
Common stock held in treasury at cost: 10 and 9 shares
|
|
|
(552
|
)
|
|
|
(513
|
)
|
|
Total shareholders’ equity
|
|
|
30,042
|
|
|
|
29,942
|
|
|
Noncontrolling interests
|
|
|
2,624
|
|
|
|
2,625
|
|
|
Total equity
|
|
|
32,666
|
|
|
|
32,567
|
|
|
Total liabilities and equity
|
|
$
|
260,133
|
|
|
$
|
269,863
|
|
|
(a)
|
Amounts represent the assets or liabilities of consolidated variable interest entities (VIEs).
|
|
(b)
|
Amounts represent items for which the Corporation has elected the fair value option.
|
|
(c)
|
Par value less than $.5 million at each date.
|
See accompanying Notes To Consolidated Financial Statements.
60
CONSOLIDATED STATEMENT OF CASH FLOWS
THE PNC FINANCIAL SERVICES GROUP, INC.
|
|
|
|
|
|
|
|
|
|
|
In millions
|
|
Nine months ended September 30
|
|
|
Unaudited
|
|
2010
|
|
|
2009
|
|
|
Operating Activities
|
|
|
|
|
|
|
|
|
|
Net income
|
|
$
|
2,577
|
|
|
$
|
1,296
|
|
|
Adjustments to reconcile net income to net cash provided by operating activities
|
|
|
|
|
|
|
|
|
|
Provision for credit losses
|
|
|
2,060
|
|
|
|
2,881
|
|
|
Depreciation and amortization
|
|
|
753
|
|
|
|
747
|
|
|
Deferred income taxes
|
|
|
691
|
|
|
|
143
|
|
|
Net gains on sales of securities
|
|
|
(358
|
)
|
|
|
(406
|
)
|
|
Net other-than-temporary impairments
|
|
|
281
|
|
|
|
433
|
|
|
Gain on sale of PNC Global Investment Servicing
|
|
|
(639
|
)
|
|
|
|
|
|
Net gains related to BlackRock LTIP shares adjustment
|
|
|
|
|
|
|
(103
|
)
|
|
Undistributed earnings of BlackRock
|
|
|
(176
|
)
|
|
|
(107
|
)
|
|
Excess tax benefits from share-based payment arrangements
|
|
|
(1
|
)
|
|
|
(1
|
)
|
|
Net change in
|
|
|
|
|
|
|
|
|
|
Trading securities and other short-term investments
|
|
|
1,092
|
|
|
|
(35
|
)
|
|
Loans held for sale
|
|
|
(1,056
|
)
|
|
|
267
|
|
|
Other assets
|
|
|
(1,411
|
)
|
|
|
3,094
|
|
|
Accrued expenses and other liabilities
|
|
|
566
|
|
|
|
(5,978
|
)
|
|
Other
|
|
|
58
|
|
|
|
298
|
|
|
Net cash provided by operating activities
|
|
|
4,437
|
|
|
|
2,529
|
|
|
Investing Activities
|
|
|
|
|
|
|
|
|
|
Sales
|
|
|
|
|
|
|
|
|
|
Securities available for sale
|
|
|
17,994
|
|
|
|
12,611
|
|
|
Loans
|
|
|
2,326
|
|
|
|
408
|
|
|
Repayments/maturities
|
|
|
|
|
|
|
|
|
|
Securities available for sale
|
|
|
5,869
|
|
|
|
5,552
|
|
|
Securities held to maturity
|
|
|
1,857
|
|
|
|
251
|
|
|
Purchases
|
|
|
|
|
|
|
|
|
|
Securities available for sale
|
|
|
(28,344
|
)
|
|
|
(25,364
|
)
|
|
Securities held to maturity
|
|
|
(1,180
|
)
|
|
|
(1,514
|
)
|
|
Loans
|
|
|
(3,680
|
)
|
|
|
(212
|
)
|
|
Net change in
|
|
|
|
|
|
|
|
|
|
Federal funds sold and resale agreements
|
|
|
310
|
|
|
|
(589
|
)
|
|
Interest-earning deposits with banks
|
|
|
3,880
|
|
|
|
13,623
|
|
|
Loans
|
|
|
8,247
|
|
|
|
10,977
|
|
|
Net cash received from (paid for) acquisition and divestiture activity
|
|
|
2,479
|
|
|
|
(3,396
|
)
|
|
Other (a)
|
|
|
686
|
|
|
|
(9
|
)
|
|
Net cash provided by investing activities
|
|
|
10,444
|
|
|
|
12,338
|
|
|
Financing Activities
|
|
|
|
|
|
|
|
|
|
Net change in
|
|
|
|
|
|
|
|
|
|
Noninterest-bearing deposits
|
|
|
1,912
|
|
|
|
6,650
|
|
|
Interest-bearing deposits
|
|
|
(9,097
|
)
|
|
|
(11,603
|
)
|
|
Federal funds purchased and repurchase agreements
|
|
|
667
|
|
|
|
(1,177
|
)
|
|
Federal Home Loan Bank short-term borrowings
|
|
|
(280
|
)
|
|
|
|
|
|
Other short-term borrowed funds
|
|
|
(461
|
)
|
|
|
(1,755
|
)
|
|
Sales/issuances
|
|
|
|
|
|
|
|
|
|
Federal Home Loan Bank long-term borrowings
|
|
|
|
|
|
|
1,500
|
|
|
Bank notes and senior debt
|
|
|
3,270
|
|
|
|
2,459
|
|
|
Other long-term borrowed funds
|
|
|
3,090
|
|
|
|
147
|
|
|
Supervisory Capital Assessment Program – common stock
|
|
|
|
|
|
|
624
|
|
|
Common and treasury stock
|
|
|
3,466
|
|
|
|
174
|
|
|
Repayments/maturities
|
|
|
|
|
|
|
|
|
|
Federal Home Loan Bank long-term borrowings
|
|
|
(3,310
|
)
|
|
|
(7,633
|
)
|
|
Bank notes and senior debt
|
|
|
(2,455
|
)
|
|
|
(3,868
|
)
|
|
Subordinated debt
|
|
|
(269
|
)
|
|
|
(529
|
)
|
|
Other long-term borrowed funds
|
|
|
(3,856
|
)
|
|
|
(125
|
)
|
|
Preferred stock – TARP
|
|
|
(7,579
|
)
|
|
|
|
|
|
Redemption of noncontrolling interest
|
|
|
(99
|
)
|
|
|
|
|
|
Excess tax benefits from share-based payment arrangements
|
|
|
1
|
|
|
|
1
|
|
|
Acquisition of treasury stock
|
|
|
(172
|
)
|
|
|
(124
|
)
|
|
Preferred stock cash dividends paid
|
|
|
(122
|
)
|
|
|
(269
|
)
|
|
Common stock cash dividends paid
|
|
|
(151
|
)
|
|
|
(384
|
)
|
|
Net cash used by financing activities
|
|
|
(15,445
|
)
|
|
|
(15,912
|
)
|
|
Net Decrease In Cash And Due From Banks
|
|
|
(564
|
)
|
|
|
(1,045
|
)
|
|
Cash and due from banks at beginning of period
|
|
|
4,288
|
|
|
|
4,471
|
|
|
Cash and due from banks at end of period
|
|
$
|
3,724
|
|
|
$
|
3,426
|
|
|
Supplemental Disclosures
|
|
|
|
|
|
|
|
|
|
Interest paid
|
|
$
|
1,419
|
|
|
$
|
2,526
|
|
|
Income taxes paid
|
|
|
571
|
|
|
|
53
|
|
|
Income taxes refunded
|
|
|
8
|
|
|
|
611
|
|
|
Non-cash Investing and Financing Items
|
|
|
|
|
|
|
|
|
|
Transfer from (to) loans to (from) loans held for sale, net
|
|
|
632
|
|
|
|
(190
|
)
|
|
Transfer from loans to foreclosed assets
|
|
|
1,064
|
|
|
|
698
|
|
|
(a)
|
Includes the impact of the consolidation of variable interest entities as of January 1, 2010.
|
See accompanying Notes To Consolidated Financial Statements.
61
N
OTES
T
O
C
ONSOLIDATED
F
INANCIAL
S
TATEMENTS
(U
NAUDITED
)
T
HE
PNC F
INANCIAL
S
ERVICES
G
ROUP
,
I
NC
.
Business
PNC is one of the largest diversified financial services companies in the United States and is headquartered in Pittsburgh, Pennsylvania.
PNC has businesses engaged in retail banking, corporate and institutional banking, asset management, and residential mortgage banking, providing many of its products and services nationally and others in
PNC’s primary geographic markets located in Pennsylvania, Ohio, New Jersey, Michigan, Maryland, Illinois, Indiana, Kentucky, Florida, Virginia, Missouri, Delaware, Washington, D.C., and Wisconsin. PNC also provides certain products and services
internationally.
N
OTE
1 A
CCOUNTING
P
OLICIES
B
ASIS
O
F
F
INANCIAL
S
TATEMENT
P
RESENTATION
Our consolidated financial statements include the accounts of the parent company and its subsidiaries, most of which are wholly owned, and certain
partnership interests and variable interest entities.
We prepared these consolidated financial statements in accordance with accounting
principles generally accepted in the United States of America. We have eliminated intercompany accounts and transactions. We have also reclassified certain prior year amounts to conform with the 2010 presentation. These reclassifications did not
have a material impact on our consolidated financial condition or results of operations.
The second quarter of 2010 included a $105 million
pretax adjustment primarily related to the recognition of $64 million of additional interest income on purchased impaired loans, a $29 million reduction of interest expense related to the accretion of the purchase accounting adjustment for
borrowings assumed in the National City acquisition, and another miscellaneous item. This correction should have been recorded in 2009. Management believes that the impact of this correction is not material to any prior period, the current period,
or the estimated 2010 full year consolidated financial statements.
See Note 2 Divestiture regarding our July 1, 2010 sale of PNC Global
Investment Servicing Inc. The Consolidated Income Statement for all periods presented and related Notes To Consolidated Financial Statements reflect the global investment servicing business as discontinued operations.
In our opinion, the unaudited interim consolidated financial statements reflect all normal, recurring adjustments needed to present fairly our results
for the interim periods. The results of operations for interim periods are not necessarily indicative of
the results that may be expected for the full year or any other interim period.
When
preparing these unaudited interim consolidated financial statements, we have assumed that you have read the audited consolidated financial statements included in our 2009 Annual Report on Form 10-K (2009 Form 10-K). Reference is made to Note 1
Accounting Policies in the 2009 Form 10-K for a detailed description of significant accounting policies. There have been no significant changes to these policies in the first nine months of 2010 other than as disclosed herein. These interim
consolidated financial statements serve to update the 2009 Form 10-K and may not include all information and notes necessary to constitute a complete set of financial statements.
We have considered the impact on these consolidated financial statements of events occurring subsequent to September 30, 2010.
U
SE
O
F
E
STIMATES
We prepare the
consolidated financial statements using financial information available at the time, which requires us to make estimates and assumptions that affect the amounts reported. Our most significant estimates pertain to our allowance for loan and lease
losses, impaired loans, fair value measurements, including security valuations and residential mortgage servicing rights, and revenue recognition. Actual results may differ from the estimates and the differences may be material to the consolidated
financial statements.
I
NVESTMENT
IN
B
LACK
R
OCK
, I
NC
.
We account for our investment in the common stock, Series B and Series D Preferred Stocks of BlackRock (both deemed to be in substance
common stock) under the equity method of accounting. On January 31, 2010, the Series D Preferred Stock was converted to Series B Preferred Stock. The investment in BlackRock is reflected on our Consolidated Balance Sheet in the caption Equity
investments, while our equity in earnings of BlackRock is reported on our Consolidated Income Statement in the caption Asset management.
On
February 27, 2009, PNC’s obligation to deliver BlackRock common shares in connection with BlackRock’s long-term incentive plan programs was replaced with an obligation to deliver shares of BlackRock’s new Series C Preferred
Stock. The 2.9 million shares of Series C Preferred Stock were acquired from BlackRock in exchange for common shares on that same date. Since these preferred shares were not deemed to be in substance common stock, we elected to account for
these preferred shares at fair value and the changes in fair value will offset the impact of marking-to-market the obligation to deliver these shares to BlackRock. Our
62
investment in the BlackRock Series C Preferred Stock is included on our Consolidated Balance Sheet in the caption Other assets.
As noted above, we mark-to-market our obligation to transfer BlackRock shares related to certain BlackRock long-term incentive plan (LTIP) programs. This obligation is classified as a derivative not
designated as a hedging instrument under GAAP as disclosed in Note 12 Financial Derivatives.
E
ARNINGS
P
ER
C
OMMON
S
HARE
Basic earnings per common share is calculated using the two-class method to determine
income attributable to common stockholders. Unvested share-based payment awards that contain nonforfeitable rights to dividends or dividend equivalents are considered participating securities under the two-class method. Income attributable to common
stockholders is then divided by the weighted-average common shares outstanding for the period.
Diluted earnings per common share is
calculated under the more dilutive of either the treasury method or the two-class method. For the diluted calculation, we increase the weighted-average number of shares of common stock outstanding by the assumed conversion of outstanding convertible
preferred stock and debentures from the beginning of the year or date of issuance, if later, and the number of shares of common stock that would be issued assuming the exercise of stock options and warrants and the issuance of incentive shares using
the treasury stock method. These adjustments to the weighted-average number of shares of common stock outstanding are made only when such adjustments will dilute earnings per common share. See Note 13 Earnings Per Share for additional information.
R
ECENT
A
CCOUNTING
P
RONOUNCEMENTS
On January 1, 2010, we adopted ASU 2009-16 – Transfers and Servicing (Topic 860) – Accounting For Transfers of Financial Assets which is a
codification of guidance issued in June 2009. This guidance removes the concept of a qualifying special-purpose entity. The guidance also establishes conditions for accounting and reporting of a transfer of a portion of a financial asset, modifies
the asset sale/derecognition criteria, and changes how retained interests are initially measured.
On January 1, 2010, we adopted ASU
2009-17 – Consolidations (Topic 810) – Improvements to Financial Reporting by Enterprises Involved with Variable Interest Entities which is a codification of guidance issued in June 2009. This guidance removes the scope exception for
qualifying special-purpose entities, contains new criteria for determining the primary beneficiary of a variable interest entity (VIE) and increases the frequency of required reassessments to determine whether an entity is the primary beneficiary of
a VIE. VIEs are assessed for consolidation
under Topic 810 when we hold variable interests in these entities. PNC consolidates VIEs when we are deemed to be the primary beneficiary. The primary beneficiary of a VIE is determined to be the
party that meets both of the following criteria: (1) has the power to make decisions that most significantly affect the economic performance of the VIE and (2) has the obligation to absorb losses or the right to receive benefits that in
either case could potentially be significant to the VIE. Effective January 1, 2010, we consolidated Market Street Funding LLC (Market Street), a credit card securitization trust, and certain Low Income Housing Tax Credit (LIHTC) investments. We
recorded consolidated assets of $4.2 billion, consolidated liabilities of $4.2 billion, and an after-tax cumulative effect adjustment to retained earnings of $92 million upon adoption (see Note 3 Loan Sale and Servicing Activities and Variable
Interest Entities).
In January 2010, the FASB issued ASU 2010-6, Fair Value Measurements and Disclosures (Topic 820), Improving Disclosures
About Fair Value Measurements. This guidance requires new disclosures as follows: 1) transfers in and out of Levels 1 and 2 and the reasons for the transfers, 2) additional breakout of asset and liability categories and 3) purchases, sales,
issuances and settlements to be reported separately in the Level 3 rollforward. This guidance was effective for PNC for first quarter 2010 reporting with the exception of item 3 which is effective beginning with first quarter 2011 reporting.
In April 2010, the FASB issued ASU 2010-18, Receivables (Topic 310), Effect of a Loan Modification When the Loan Is Part of a Pool That Is
Accounted for as a Single Asset. This ASU amends the accounting guidance related to loans that are accounted for within a pool under ASC 310-30. The new guidance clarifies that modifications of such loans do not result in the removal of those loans
from the pool even if the modification of those loans would otherwise be considered a troubled debt restructuring. The amended guidance continues to require that an entity consider whether the pool of assets in which the loan is included is impaired
if expected cash flows for the pool change. No additional disclosures are required as a result of this ASU. ASU 2010-18 is effective for modifications of loans accounted for within pools under ASC 310-30 occurring in the first interim or annual
period ending on or after July 15, 2010 with early adoption permitted. PNC accounts for loans within pools consistent with the guidance in this ASU.
In July 2010, the FASB issued ASU 2010-20 – Receivables (Topic 310) – Disclosures about the Credit Quality of Financing Receivables and the Allowance for Credit Losses. This ASU requires
additional disclosures related to an entity’s allowance for credit losses and the credit quality of its financing receivables (e.g., loans). Certain disclosures will be effective December 31, 2010 and others beginning in the first quarter
of 2011.
63
N
OTE
2 D
IVESTITURE
S
ALE
OF
PNC G
LOBAL
I
NVESTMENT
S
ERVICING
On July 1, 2010, we sold PNC Global Investment Servicing Inc. (GIS), a leading provider of processing, technology and business intelligence services
to asset managers, broker-dealers and financial advisors worldwide, for $2.3 billion in cash pursuant to a definitive agreement entered into on February 2, 2010. This transaction resulted in a pretax gain of $639 million, net of transaction
costs. The after-tax amount of the gain of $328 million is included within Income from discontinued operations, on our Consolidated Income Statement.
Results of operations of GIS through June 30, 2010 are presented as Income from discontinued operations, net of income taxes, on our Consolidated Income Statement for all periods presented.
As part of the sale agreement, PNC has agreed to provide certain transitional services on behalf of GIS until completion of related systems
conversion activities.
Asset and liabilities of GIS at December 31, 2009 follow.
Investment in Discontinued Operations
|
|
|
|
|
|
|
In millions
|
|
December 31,
2009
|
|
|
Interest-earning deposits with banks
|
|
$
|
255
|
|
|
Goodwill
|
|
|
1,243
|
|
|
Other intangible assets
|
|
|
51
|
|
|
Other
|
|
|
359
|
|
|
Total assets
|
|
$
|
1,908
|
|
|
Interest-bearing deposits
|
|
$
|
93
|
|
|
Accrued expenses
|
|
|
266
|
|
|
Other
|
|
|
1,009
|
|
|
Total liabilities
|
|
$
|
1,368
|
|
|
Net assets
|
|
$
|
540
|
|
N
OTE
3 L
OAN
S
ALE
AND
S
ERVICING
A
CTIVITIES
AND
V
ARIABLE
I
NTEREST
E
NTITIES
L
OAN
S
ALE
A
ND
S
ERVICING
A
CTIVITIES
We have transferred residential and commercial mortgage loans in securitization or sales transactions in which we have continuing involvement. These
transfers have occurred through Agency securitization, Non-Agency securitization, and whole-loan sale transactions. In Agency securitizations, Ginnie Mae (GNMA), Fannie Mae (FNMA), and Freddie Mac (FHLMC) (collectively “the Agencies”)
securitize our transferred loans into mortgage-backed securities for sale into the secondary market through Special Purpose Entities (SPEs) they sponsor. In Non-Agency securitizations, we have
transferred loans into securitization SPEs. In other instances third-party investors have purchased (in whole-loan sale transactions) and subsequently sold our loans into securitization SPEs.
Third-party investors have also purchased our loans in whole-loan sale transactions. Securitization SPEs, which are legal entities that are utilized in the Agency and Non-Agency securitization transactions, are VIEs.
Our continuing involvement in the Agency securitizations, Non-Agency securitizations, and whole-loan sale transactions generally consists of servicing,
limited repurchases of previously transferred loans and loss share arrangements, and, in limited circumstances, holding of mortgage-backed securities issued by the securitization SPEs.
Depending on the transaction, we may act as the master, primary, and/or special servicer to the securitization SPEs or third-party investors. Servicing responsibilities typically consist of collecting and
remitting monthly borrower principal and interest payments, maintaining escrow deposits, performing loss mitigation and foreclosure activities, and, in certain instances, funding of servicing advances. Servicing advances, which are reimbursable, are
recognized in Other assets at cost and are made for principal and interest and collateral protection. With respect to Agency securitizations, the Agencies are responsible for working out defaulted loans.
We earn servicing and other ancillary fees for our role as servicer and depending on the contractual terms of the servicing arrangement, we can be
terminated as servicer with or without cause. At the consummation date of each type of loan transfer, we recognize a servicing asset at fair value. Servicing assets are recognized in Other intangible assets on our Consolidated Balance Sheet and are
classified within Level 3 of the fair value hierarchy. See Note 8 Fair Value and Note 9 Goodwill and Other Intangible Assets for further discussion of our residential and commercial servicing assets.
Certain loans transferred to the Agencies contain removal of account provisions (ROAPs). Under these ROAPs, we hold an option to repurchase at par
individual delinquent loans that meet certain criteria. When we have the unilateral ability to repurchase a delinquent loan, effective control over the loan has been regained and we recognize the loan and a corresponding liability on the balance
sheet regardless of our intent to repurchase the loan. At September 30, 2010 and December 31, 2009, the balance of our ROAP asset and liability totaled $367 million and $577 million, respectively.
We generally do not retain mortgage-backed securities issued by the Agency and Non-Agency securitization SPEs at the inception of the securitization
transactions. Rather, our limited holdings of these securities occur through subsequent purchases in the secondary market. PNC does not retain any credit risk on its Agency mortgage-backed security positions as FNMA, FHLMC, and the U.S. Government
(for GNMA)
64
guarantee losses of principal and interest on the underlying mortgage loans. We generally hold a senior class of Non-Agency mortgage-backed securities.
We also have involvement with certain Agency and Non-Agency commercial securitization SPEs where we have not transferred commercial mortgage loans. These
SPEs were sponsored by independent third-parties and the loans held by these entities were purchased exclusively from other third-parties. Generally, our involvement with these SPEs is as servicer with servicing activities consistent to those
described above. In certain instances, we can be terminated as servicer in these commercial securitization structures without cause by the controlling class of mortgage-backed security holders of the SPE.
We recognize a liability for our loss exposure associated with contractual obligations to repurchase
previously transferred loans due to breaches of representations and warranties and also for loss sharing arrangements with the Agencies (collectively “recourse obligations”). Other than providing temporary liquidity under servicing
advances and our loss exposure associated with our recourse obligations, we have not provided nor are we required to provide any type of credit support, guarantees, or commitments to the securitization SPEs or third-party investors in these
transactions. See Note 18 Commitments and Guarantees for further discussion of our recourse obligations.
Certain Financial Information
and Cash Flows Associated with Loan Sale and Servicing Activities
|
|
|
|
|
|
|
|
|
|
|
|
|
|
|
|
|
|
|
|
|
September 30, 2010
|
|
|
December 31, 2009
|
|
|
In millions
|
|
Residential
Mortgages
|
|
|
Commercial
Mortgages (a)
|
|
|
Residential
Mortgages
|
|
|
Commercial
Mortgages (a)
|
|
|
FINANCIAL INFORMATION
|
|
|
|
|
|
|
|
|
|
|
|
|
|
|
|
|
|
Servicing portfolio (b)
|
|
$
|
131,594
|
|
|
$
|
164,191
|
|
|
$
|
146,050
|
|
|
$
|
185,167
|
|
|
Carrying value of servicing assets (c)
|
|
|
788
|
|
|
|
616
|
|
|
|
1,332
|
|
|
|
921
|
|
|
Servicing advances
|
|
|
569
|
|
|
|
380
|
|
|
|
599
|
|
|
|
383
|
|
|
Servicing deposits
|
|
|
2,855
|
|
|
|
3,400
|
|
|
|
3,118
|
|
|
|
3,774
|
|
|
Recourse obligations (d)
|
|
|
155
|
|
|
|
30
|
|
|
|
229
|
|
|
|
71
|
|
|
Carrying value of mortgage-backed securities held (e)
|
|
|
1,907
|
|
|
|
1,578
|
|
|
|
2,011
|
|
|
|
1,905
|
|
|
|
|
|
|
|
|
|
|
|
|
|
|
Three Months
Ended
September 30, 2010
|
|
|
Nine Months
Ended
September 30, 2010
|
|
|
In millions
|
|
Residential
Mortgages
|
|
|
Commercial
Mortgages (a)
|
|
|
Residential
Mortgages
|
|
|
Commercial
Mortgages (a)
|
|
|
CASH FLOWS
|
|
|
|
|
|
|
|
|
|
|
|
|
|
|
|
|
|
Sales of loans (f)
|
|
$
|
2,381
|
|
|
$
|
475
|
|
|
$
|
6,607
|
|
|
$
|
1,453
|
|
|
Repurchases of previously transferred loans
|
|
|
550
|
|
|
|
|
|
|
|
1,756
|
|
|
|
|
|
|
Contractual servicing fees received
|
|
|
100
|
|
|
|
48
|
|
|
|
316
|
|
|
|
174
|
|
|
Servicing advances recovered/(funded), net
|
|
|
(30
|
)
|
|
|
1
|
|
|
|
30
|
|
|
|
3
|
|
|
Cash flows on mortgage-backed securities held (e)
|
|
|
143
|
|
|
|
237
|
|
|
|
433
|
|
|
|
441
|
|
|
(a)
|
Represents financial and cash flow information associated with both commercial mortgage loan transfer and servicing activities.
|
|
(b)
|
For our continuing involvement with residential mortgage loan transfers, amount represents outstanding balance of loans transferred and serviced. For commercial
mortgages, amount represents the portion of the overall servicing portfolio in which loans have been transferred by us or third parties to VIEs. It does not include loans serviced by us that were originated by third parties and have not been
transferred to a VIE.
|
|
(c)
|
See Note 8 Fair Value and Note 9 Goodwill and Other Intangible Assets for further information.
|
|
(d)
|
Represents liability for our loss exposure associated with loan repurchases for breaches of representations and warranties and our commercial mortgage loss share
arrangements for our Residential Mortgage Banking and Corporate & Institutional Banking business segments, respectively. See Note 18 Commitments and Guarantees for further information.
|
|
(e)
|
Represents securities held where PNC transferred and/or serviced loans to a securitization SPE and we hold securities issued by that SPE.
|
|
(f)
|
There were no gains or losses recognized on the transaction date for sales of residential mortgage and certain commercial mortgage loans as these loans are recognized
on the balance sheet at fair value. For transfers of commercial loans not recognized on the balance sheet at fair value, gains/losses recognized on sales of these loans were insignificant for the three months and nine months ended September 30,
2010.
|
V
ARIABLE
I
NTEREST
E
NTITIES
(VIE
S
)
We are involved with various entities in the normal course of business that are deemed to be VIEs. We assess VIEs for consolidation based upon the
accounting policies described in Note 1 and effective January 1, 2010, we consolidated Market Street, a credit card securitization trust, and certain Low Income Housing Tax Credit (LIHTC) investments as a result of adopting ASU 2009-17 –
Consolidations (Topic 810).
65
The following provides a summary of
VIEs, including those that we have consolidated and those in which we hold variable interests but have not consolidated into our financial statements as of September 30, 2010 and December 31, 2009, respectively.
Consolidated VIEs – Carrying Value (a)
|
|
|
|
|
|
|
|
|
|
|
|
|
|
|
|
|
|
|
|
|
|
|
September 30, 2010
In millions
|
|
Market Street
|
|
|
Credit Card
Securitization Trust
|
|
|
Tax Credit
Investments (b)
|
|
|
Credit Risk
Transfer Transaction
|
|
|
Total
|
|
|
Assets
|
|
|
|
|
|
|
|
|
|
|
|
|
|
|
|
|
|
|
|
|
|
Cash and due from banks
|
|
|
|
|
|
|
|
|
|
$
|
2
|
|
|
|
|
|
|
$
|
2
|
|
|
Interest-earning deposits with banks
|
|
|
|
|
|
|
|
|
|
|
5
|
|
|
|
|
|
|
|
5
|
|
|
Investment securities
|
|
$
|
202
|
|
|
|
|
|
|
|
|
|
|
|
|
|
|
|
202
|
|
|
Loans
|
|
|
2,094
|
|
|
$
|
2,103
|
|
|
|
|
|
|
$
|
447
|
|
|
|
4,644
|
|
|
Allowance for loan and lease losses
|
|
|
|
|
|
|
(213
|
)
|
|
|
|
|
|
|
(6
|
)
|
|
|
(219
|
)
|
|
Equity investments
|
|
|
|
|
|
|
|
|
|
|
1,177
|
|
|
|
|
|
|
|
1,177
|
|
|
Other assets
|
|
|
339
|
|
|
|
3
|
|
|
|
435
|
|
|
|
10
|
|
|
|
787
|
|
|
Total assets
|
|
$
|
2,635
|
|
|
$
|
1,893
|
|
|
$
|
1,619
|
|
|
$
|
451
|
|
|
$
|
6,598
|
|
|
Liabilities
|
|
|
|
|
|
|
|
|
|
|
|
|
|
|
|
|
|
|
|
|
|
Other borrowed funds
|
|
$
|
2,298
|
|
|
$
|
523
|
|
|
$
|
116
|
|
|
|
|
|
|
$
|
2,937
|
|
|
Accrued expenses
|
|
|
|
|
|
|
|
|
|
|
79
|
|
|
|
|
|
|
|
79
|
|
|
Other liabilities
|
|
|
336
|
|
|
|
|
|
|
|
187
|
|
|
|
|
|
|
|
523
|
|
|
Total liabilities
|
|
$
|
2,634
|
|
|
$
|
523
|
|
|
$
|
382
|
|
|
|
|
|
|
$
|
3,539
|
|
|
(a)
|
Amounts represent carrying value on PNC’s Consolidated Balance Sheet.
|
|
(b)
|
Amounts reported primarily represent LIHTC investments.
|
Consolidated VIEs
|
|
|
|
|
|
|
|
|
|
|
In millions
|
|
Aggregate
Assets
|
|
|
Aggregate
Liabilities
|
|
|
September 30, 2010
|
|
|
|
|
|
|
|
|
|
Market Street
|
|
$
|
3,220
|
|
|
$
|
3,226
|
|
|
Credit Card Securitization Trust
|
|
|
2,231
|
|
|
|
995
|
|
|
Tax Credit Investments (a)
|
|
|
1,631
|
|
|
|
417
|
|
|
Credit Risk Transfer Transaction
|
|
|
766
|
|
|
|
766
|
|
|
|
|
|
|
December 31, 2009
|
|
|
|
|
|
|
|
|
|
Tax Credit Investments (a)
|
|
$
|
1,933
|
|
|
$
|
808
|
|
|
Credit Risk Transfer Transaction
|
|
|
860
|
|
|
|
860
|
|
|
(a)
|
Amounts reported primarily represent LIHTC investments.
|
Aggregate assets and aggregate liabilities differ from the consolidated carrying value of assets and liabilities due to elimination of intercompany assets and liabilities held by the consolidated VIE.
Non-Consolidated VIEs
|
|
|
|
|
|
|
|
|
|
|
|
|
|
|
|
|
|
|
|
|
|
|
In millions
|
|
Aggregate
Assets
|
|
|
Aggregate
Liabilities
|
|
|
PNC Risk
of
Loss
|
|
|
Carrying
Value of
Assets
|
|
|
Carrying
Value of
Liabilities
|
|
|
September 30, 2010
|
|
|
|
|
|
|
|
|
|
|
|
|
|
|
|
|
|
|
|
|
|
Tax Credit Investments (a)
|
|
$
|
3,818
|
|
|
$
|
2,028
|
|
|
$
|
850
|
|
|
$
|
850
|
(c)
|
|
$
|
347
|
(d)
|
|
Commercial Mortgage-Backed Securitizations (b)
|
|
|
73,206
|
|
|
|
73,206
|
|
|
|
1,727
|
|
|
|
1,727
|
(e)
|
|
|
|
|
|
Residential Mortgage-Backed Securitizations (b)
|
|
|
47,585
|
|
|
|
47,585
|
|
|
|
1,936
|
|
|
|
1,930
|
(e)
|
|
|
6
|
(d)
|
|
Collateralized Debt Obligations
|
|
|
18
|
|
|
|
|
|
|
|
2
|
|
|
|
2
|
(c)
|
|
|
|
|
|
Total
|
|
$
|
124,627
|
|
|
$
|
122,819
|
|
|
$
|
4,515
|
|
|
$
|
4,509
|
|
|
$
|
353
|
|
|
|
|
|
|
|
|
|
|
|
|
|
|
|
|
In millions
|
|
Aggregate
Assets
|
|
|
Aggregate
Liabilities
|
|
|
PNC Risk
of
Loss
|
|
|
December 31, 2009
|
|
|
|
|
|
|
|
|
|
|
|
|
|
Market Street
|
|
$
|
3,698
|
|
|
$
|
3,718
|
|
|
$
|
6,155
|
(f)
|
|
Tax Credit Investments (a)
|
|
|
1,786
|
|
|
|
1,156
|
|
|
|
743
|
|
|
Collateralized Debt Obligations
|
|
|
23
|
|
|
|
|
|
|
|
2
|
|
|
Total
|
|
$
|
5,507
|
|
|
$
|
4,874
|
|
|
$
|
6,900
|
|
|
(a)
|
Amounts reported primarily represent LIHTC investments. Aggregate assets and aggregate liabilities represent estimated balances due to limited availability of financial
information associated with certain acquired partnerships.
|
66
|
(b)
|
Amounts reported reflect involvement with securitization SPEs where PNC transferred to and/or services loans for a SPE and we hold securities issued by that SPE. We
also invest in other mortgage and asset-backed securities issued by third-party VIEs with which we have no continuing involvement. Further information on these securities is included in Note 7 Investment Securities and values disclosed represent our
maximum exposure to loss for those securities’ holdings.
|
|
(c)
|
Included in Equity investments on our Consolidated Balance Sheet.
|
|
(d)
|
Included in Other liabilities on our Consolidated Balance Sheet.
|
|
(e)
|
Included in Trading securities, Investment securities, Other intangible assets, and Other assets on our Consolidated Balance Sheet.
|
|
(f)
|
PNC’s risk of loss consisted of off-balance sheet liquidity commitments to Market Street of $5.6 billion and other credit enhancements of $.6 billion at
December 31, 2009.
|
M
ARKET
S
TREET
Market Street is a multi-seller asset-backed commercial paper conduit that is owned by an independent third party. Market Street’s activities
primarily involve purchasing assets or making loans secured by interests in pools of receivables from US corporations that desire access to the commercial paper market. Market Street funds the purchases of assets or loans by issuing commercial paper
and is supported by pool-specific credit enhancements, liquidity facilities and program-level credit enhancement. Generally, Market Street mitigates its potential interest rate risk by entering into agreements with its borrowers that reflect
interest rates based upon its weighted average commercial paper cost of funds. During 2009 and the first nine months of 2010, Market Street met all of its funding needs through the issuance of commercial paper.
PNC Bank, N.A. provides certain administrative services, the program-level credit enhancement and all of the liquidity facilities to Market Street in
exchange for fees negotiated based on market rates. Through these arrangements, PNC has the power to direct the activities of the special purpose entity (SPE) that most significantly affect its economic performance and these arrangements expose PNC
to expected losses or residual returns that are significant to Market Street.
The commercial paper obligations at September 30, 2010 and
December 31, 2009 were supported by Market Street’s assets. While PNC may be obligated to fund under the $5.5 billion of liquidity facilities for events such as commercial paper market disruptions, borrower bankruptcies, collateral
deficiencies or covenant violations, our credit risk under the liquidity facilities is secondary to the risk of first loss provided by the borrower such as by the over-collateralization of the assets or by another third party in the form of
deal-specific credit enhancement. Deal-specific credit enhancement that supports the commercial paper issued by Market Street is generally structured to cover a multiple of expected losses for the pool of assets and is sized to generally meet rating
agency standards for comparably structured transactions. In addition, PNC would be required to fund $652 million of the liquidity facilities if the underlying assets are in default. Market Street creditors have no direct recourse to PNC.
PNC provides program-level credit enhancement to cover net losses in the amount of 10% of commitments, excluding explicitly rated AAA/Aaa facilities. PNC
provides 100% of
the enhancement in the form of a cash collateral account funded by a loan facility. This facility expires in June 2015. At September 30, 2010, $584 million was outstanding on this facility.
This amount was eliminated in PNC’s Consolidated Balance Sheet as of September 30, 2010 due to the consolidation of Market Street. We are not required to nor have we provided additional financial support to the SPE.
C
REDIT
C
ARD
S
ECURITIZATION
T
RUST
We are the sponsor of several credit card securitizations facilitated through an SPE trust. This bankruptcy-remote SPE or VIE was established to purchase
credit card receivables from the sponsor and to issue and sell asset-backed securities created by it to independent third-parties. The SPE was financed primarily through the sale of these asset-backed securities. These transactions were originally
structured as a form of liquidity and to afford favorable capital treatment. At September 30, 2010, Series 2006-1, 2007-1, and 2008-3 issued by the SPE were outstanding. Series 2005-1 was paid off during the third quarter of 2010.
Our continuing involvement in these securitization transactions consists primarily of holding certain retained interests and acting as the primary
servicer. For each securitization series, our retained interests held are in the form of a pro-rata undivided interest, or sellers’ interest, in the transferred receivables, subordinated tranches of asset-backed securities, interest-only
strips, discount receivables, and subordinated interests in accrued interest and fees in securitized receivables. We consolidated the SPE as of January 1, 2010 as we are deemed the primary beneficiary of the entity based upon our level of
continuing involvement. Our role as primary servicer gives us the power to direct the activities of the SPE that most significantly affect its economic performance and our holding of retained interests gives us the obligation to absorb or receive
expected losses or residual returns that are significant to the SPE. Accordingly, all retained interests held in the credit card SPE are eliminated in consolidation. The underlying assets of the consolidated SPE are restricted only for payment of
the beneficial interest issued by the SPE. We are not required to nor have we provided additional financial support to the SPE. Additionally, creditors of the SPE have no direct recourse to PNC.
T
AX
C
REDIT
I
NVESTMENTS
We make certain equity investments in various limited partnerships or limited liability companies (LLCs) that sponsor affordable housing projects utilizing the LIHTC pursuant to Sections 42 and 47 of
the Internal Revenue Code. The purpose of these investments is to achieve a satisfactory return on capital, to facilitate the sale of additional affordable housing product offerings and to assist us in achieving goals associated with the Community
Reinvestment Act. The primary activities of the investments include the identification, development and operation of multi-family housing that is leased to qualifying residential tenants. Generally, these types
67
of investments are funded through a combination of debt and equity. We typically invest in these partnerships as a limited partner or non-managing member.
Also, we are a national syndicator of affordable housing equity (together with the investments described above, the “LIHTC investments”). In
these syndication transactions, we create funds in which our subsidiaries are the general partner or managing member and sell limited partnership or non-managing member interests to third parties, and in some cases may also purchase a limited
partnership or non-managing member interest in the fund and/or provide mezzanine financing to the fund. The purpose of this business is to generate income from the syndication of these funds, generate servicing fees by managing the funds, and earn
tax credits to reduce our tax liability. General partner or managing member activities include selecting, evaluating, structuring, negotiating, and closing the fund investments in operating limited partnerships, as well as oversight of the ongoing
operations of the fund portfolio.
Typically, the general partner or managing member will be the party that has the right to make decisions
that will most significantly impact the economic performance of the entity. The primary sources of losses and benefits in LIHTC investments are the tax credits, tax benefits due to passive losses on the investments, and development and operating
cash flows. We have consolidated LIHTC investments in which we are the general partner or managing member and have a limited partnership interest or non-managing member interest that could potentially absorb losses or receive benefits that are
significant. The assets are primarily included in Equity investments and Other assets on our Consolidated Balance Sheet with the liabilities classified in Other liabilities and third party investors’ interests included in the Equity section as
Noncontrolling interests. Neither creditors nor equity investors in the LIHTC investments have any recourse to our general credit. There are no terms or conditions that have required or could require us, as the primary beneficiary, to provide
financial support. Also, we have not provided nor do we intend to provide financial or other support to the limited partnership or LLC that we are not contractually obligated to provide. The consolidated aggregate assets and liabilities of these
LIHTC investments are provided in the Consolidated VIEs table and reflected in the “Other” business segment.
We also have LIHTC
investments in which we are not the general partner and do not have the right to make decisions that will most significantly impact the economic performance of the entity. Accordingly, we are not the primary beneficiary of these investments and thus
they are not consolidated. These investments are disclosed in the Non-Consolidated VIEs table. The table also reflects our maximum exposure to loss. Our maximum exposure to loss is equal to our legally binding equity commitments adjusted for
recorded impairment and
partnership results. We use the equity method to account for our investment in these entities with the investments reflected in Equity investments on our Consolidated Balance Sheet. In addition,
we increase our recognized investments and recognize a liability for all legally binding unfunded equity commitments. These liabilities are reflected in Other liabilities on our Consolidated Balance Sheet.
C
REDIT
R
ISK
T
RANSFER
T
RANSACTION
National City Bank (which merged into PNC Bank, N.A. in November 2009) sponsored an SPE and concurrently entered into a credit risk transfer agreement
with an independent third party to mitigate credit losses on a pool of nonconforming residential mortgage loans originated by its former First Franklin business unit. The SPE or VIE was formed with a small equity contribution and was structured as a
bankruptcy-remote entity so that its creditors have no recourse to the sponsor. In exchange for a perfected security interest in the cash flows of the nonconforming mortgage loans, the SPE issued asset-backed securities to the sponsor in the form of
senior, mezzanine, and subordinated equity notes.
The credit risk transfer agreement associated with this transaction is no longer
outstanding as a result of certain actions taken by us and the independent third-party in 2009. Refer to our 2009 Form 10-K for further details of these actions. We continue to hold all asset-backed securities issued by the SPE and are also the
depositor in this transaction. As a result, we are deemed the primary beneficiary of the SPE. Our rights as depositor give us the power to direct the activities of the SPE that most significantly affect its economic performance and our holding of
all asset-backed securities gives us the obligation to absorb or receive expected losses or residual returns that are significant to the SPE. Accordingly, this SPE is consolidated and all of the entity’s assets, liabilities, and equity
associated with the securities held by us are intercompany balances and are eliminated in consolidation. The underlying assets of the consolidated SPE are restricted only for payment of the asset-backed securities issued by the SPE. We are not
required to nor have we provided additional financial support to the SPE.
In October 2010, the governing documents were amended to give PNC
the option to unilaterally terminate the securitization structure. On October 28, 2010, PNC exercised its option to terminate the securitization structure. The dissolution of the structure did not have any impact on the statement of financial
condition, liquidity, or cash flows of PNC.
68
R
ESIDENTIAL
AND
C
OMMERCIAL
M
ORTGAGE
-B
ACKED
S
ECURITIZATIONS
In connection with each Agency and Non-Agency
securitization discussed above, we evaluate each SPE utilized in these transactions for consolidation. In performing these assessments, we evaluate our level of continuing involvement in these transactions as the magnitude of our involvement
ultimately determines whether or not we hold a variable interest and/or are the primary beneficiary of the SPE. Factors we consider in our consolidation assessment include the significance of (1) our role as servicer, (2) our holdings of
mortgage-backed securities issued by the securitization SPE, and (3) the rights of third-party variable interest holders.
Our first step
in our assessment is to determine whether we hold a variable interest in the securitization SPE. We hold a variable interest in an Agency and Non-Agency securitization SPE through our holding of mortgage-backed securities issued by the SPE and/or
our recourse obligations. Each SPE in which we hold a variable interest is evaluated to determine whether we are the primary beneficiary of the entity. For Agency securitization transactions, our contractual role as servicer does not give us the
power to direct the activities that most significantly affect the economic performance of the SPEs. Thus, we are not the primary beneficiary of these entities. For Non-Agency securitization transactions, we would be the primary beneficiary to the
extent our servicing activities give us the power to direct the activities that most significantly affect the economic performance of the SPE and we hold a more than insignificant variable interest in the entity. At September 30, 2010, our
level of continuing involvement in Non-Agency securitization SPEs did not result in PNC being deemed the primary beneficiary of any of these entities. Details about the Agency and Non-Agency securitization SPEs where we hold a variable interest and
are not the primary beneficiary are included in the table above. Our maximum exposure to loss as a result of our involvement with these SPEs is the carrying value of the mortgage-backed securities, servicing assets, servicing advances, and our
liabilities associated with our recourse obligations. Creditors of the securitization SPEs have no recourse to PNC’s assets or general credit.
N
OTE
4 L
OANS
AND
C
OMMITMENTS
T
O
E
XTEND
C
REDIT
Loans outstanding were as follows:
|
|
|
|
|
|
|
|
|
|
|
In millions
|
|
September 30
2010
|
|
|
December 31
2009
|
|
|
Commercial
|
|
$
|
53,188
|
|
|
$
|
54,818
|
|
|
Commercial real estate
|
|
|
19,091
|
|
|
|
23,131
|
|
|
Consumer
|
|
|
54,956
|
|
|
|
53,582
|
|
|
Residential real estate
|
|
|
16,484
|
|
|
|
19,810
|
|
|
Equipment lease financing
|
|
|
6,408
|
|
|
|
6,202
|
|
|
Total loans (a)
|
|
$
|
150,127
|
|
|
$
|
157,543
|
|
|
(a)
|
Net of unearned income, net deferred loan fees, unamortized discounts and premiums, and purchase discounts and premiums totaling $2.8 billion and $3.2 billion at
September 30, 2010 and December 31, 2009, respectively.
|
Future accretable discounts related to purchased impaired loans are not included in loans outstanding.
At September 30, 2010, we pledged $11.9 billion of loans to the Federal Reserve Bank and $26.6 billion of loans to the Federal Home Loan
Bank as collateral for the contingent ability to borrow, if necessary. The comparable amounts at December 31, 2009 were $18.8 billion and $32.6 billion, respectively.
Certain loans are accounted for at fair value with changes in the fair value reported in current period earnings. The fair value of these loans was $90 million, or less than 1% of the total loan
portfolio, at September 30, 2010.
Net Unfunded Credit Commitments
|
|
|
|
|
|
|
|
|
|
|
In millions
|
|
September 30
2010
|
|
|
December 31
2009
|
|
|
Commercial and commercial real estate (a) (b)
|
|
$
|
59,834
|
|
|
$
|
60,143
|
|
|
Home equity lines of credit
|
|
|
19,500
|
|
|
|
20,367
|
|
|
Consumer credit card line and other unsecured lines
|
|
|
16,478
|
|
|
|
18,800
|
|
|
Other
|
|
|
1,335
|
|
|
|
1,485
|
|
|
Total
|
|
$
|
97,147
|
|
|
$
|
100,795
|
|
|
(a)
|
Amount related to purchased customer receivables totaled $3.4 billion at September 30, 2010 due to the January 1, 2010 consolidation of Market Street.
|
|
(b)
|
Amount related to Market Street totaled $5.6 billion at December 31, 2009. This amount was eliminated as of September 30, 2010 due to the consolidation of
Market Street
.
|
Commitments to extend credit represent arrangements to lend funds or provide liquidity subject to
specified contractual conditions. At September 30, 2010 commercial commitments are reported net of $15.3 billion of participations, assignments and syndications, primarily to financial institutions. The comparable amount at December 31,
2009 was $13.2 billion.
Commitments generally have fixed expiration dates, may require payment of a fee, and contain termination clauses in
the event the customer’s credit quality deteriorates. Based on our historical experience, most commitments expire unfunded, and therefore cash requirements are substantially less than the total commitment.
69
N
OTE
5 A
SSET
Q
UALITY
The following amounts exclude purchased impaired loans acquired in connection with the December 31, 2008 National City
acquisition. See Note 6 Purchased Impaired Loans Related to National City for further information.
Nonperforming Assets
|
|
|
|
|
|
|
|
|
|
|
Dollars in millions
|
|
September 30,
2010
|
|
|
December 31,
2009
|
|
|
Nonaccrual loans
|
|
|
|
|
|
|
|
|
|
Commercial
|
|
$
|
1,530
|
|
|
$
|
1,806
|
|
|
Commercial real estate
|
|
|
1,989
|
|
|
|
2,140
|
|
|
Equipment lease financing
|
|
|
104
|
|
|
|
130
|
|
|
TOTAL COMMERCIAL LENDING
|
|
|
3,623
|
|
|
|
4,076
|
|
|
Consumer
|
|
|
|
|
|
|
|
|
|
Home equity
|
|
|
406
|
|
|
|
356
|
|
|
Other
|
|
|
38
|
|
|
|
36
|
|
|
Total consumer
|
|
|
444
|
|
|
|
392
|
|
|
Residential real estate
|
|
|
|
|
|
|
|
|
|
Residential mortgage
|
|
|
727
|
|
|
|
955
|
|
|
Residential construction
|
|
|
42
|
|
|
|
248
|
|
|
Total residential real estate
|
|
|
769
|
|
|
|
1,203
|
|
|
TOTAL CONSUMER LENDING
|
|
|
1,213
|
|
|
|
1,595
|
|
|
Total nonaccrual/nonperforming loans
|
|
|
4,836
|
|
|
|
5,671
|
|
|
Foreclosed and other assets
|
|
|
|
|
|
|
|
|
|
Commercial lending
|
|
|
366
|
|
|
|
266
|
|
|
Consumer lending
|
|
|
467
|
|
|
|
379
|
|
|
Total foreclosed and other assets
|
|
|
833
|
|
|
|
645
|
|
|
Total nonperforming assets
|
|
$
|
5,669
|
|
|
$
|
6,316
|
|
|
Nonperforming loans to total loans
|
|
|
3.22
|
%
|
|
|
3.60
|
%
|
|
Nonperforming assets to total loans and foreclosed and other assets
|
|
|
3.76
|
|
|
|
3.99
|
|
|
Nonperforming assets to total assets
|
|
|
2.18
|
|
|
|
2.34
|
|
Loans whose contractual terms have been restructured in a manner which grants a concession to a borrower experiencing financial difficulties are
considered troubled debt restructurings (TDRs). TDRs typically result from our loss mitigation activities and could include rate reductions, principal forgiveness, forbearance and other actions intended to minimize the economic loss and to avoid
foreclosure or repossession of collateral. Total nonperforming loans in the table above include TDRs of $595 million at September 30, 2010 and $440 million at December 31, 2009.
TDRs returned to performing (accrual) status totaled $425 million at September 30, 2010 and are excluded from nonperforming loans. These loans have demonstrated a period of at least six months of
performance under the modified terms.
In addition, credit cards and certain small business and consumer credit agreements whose terms have
been modified totaled $315 million at September 30, 2010 and are TDRs. However, since our policy is to exempt these loans from being
placed on nonaccrual status as permitted by regulatory guidance as these loans are directly charged off in the period that they become 180 days past due, these loans are excluded from
nonperforming loans.
Net interest income less the provision for credit losses was $5.0 billion for the first nine months of 2010 compared
with $3.9 billion for the first nine months of 2009. Comparable amounts for the third quarter of 2010 and the third quarter of 2009 were $1.7 billion and $1.3 billion, respectively.
Rollforward of Allowance for Loan and
Lease Losses
|
|
|
|
|
|
|
|
|
|
|
In millions
|
|
2010
|
|
|
2009
|
|
|
January 1
|
|
$
|
5,072
|
|
|
$
|
3,917
|
|
|
Charge-offs
|
|
|
(2,568
|
)
|
|
|
(2,131
|
)
|
|
Recoveries
|
|
|
423
|
|
|
|
255
|
|
|
Net charge-offs
|
|
|
(2,145
|
)
|
|
|
(1,876
|
)
|
|
Provision for credit losses
|
|
|
2,060
|
|
|
|
2,881
|
|
|
Acquired allowance (a)
|
|
|
|
|
|
|
(114
|
)
|
|
Adoption of ASU 2009-17,
Consolidations
|
|
|
141
|
|
|
|
|
|
|
Divestiture
|
|
|
|
|
|
|
(18
|
)
|
|
Net change in allowance for unfunded loan commitments and letters of
credit
|
|
|
103
|
|
|
|
20
|
|
|
September 30
|
|
$
|
5,231
|
|
|
$
|
4,810
|
|
|
(a)
|
Reflects adjustments to the National City allowance acquired December 31, 2008 due to additional impairment of loans effective at that date.
|
Rollforward of Allowance for Unfunded Loan
Commitments and Letters of Credit
|
|
|
|
|
|
|
|
|
|
|
In millions
|
|
2010
|
|
|
2009
|
|
|
January 1
|
|
$
|
296
|
|
|
$
|
344
|
|
|
Net change in allowance for unfunded loan commitments and letters of
credit
|
|
|
(103
|
)
|
|
|
(20
|
)
|
|
September 30
|
|
$
|
193
|
|
|
$
|
324
|
|
Originated Impaired Loans exclude leases and smaller homogeneous type loans as well as purchased impaired loans related to our acquisition of National
City, but include acquired loans that are impaired subsequent to acquisition. We did not recognize any interest income on Originated Impaired Loans, including TDRs that have not returned to performing status, while they were impaired in the first
nine months of 2010 or 2009. The following table provides further detail on Originated Impaired Loans individually evaluated for reserves and the associated allowance for loan losses:
Originated Impaired Loans (a)
|
|
|
|
|
|
|
|
|
|
|
In millions
|
|
Sept. 30
2010
|
|
|
Dec. 31
2009
|
|
|
Impaired loans with an associated reserve
|
|
$
|
3,752
|
|
|
$
|
3,475
|
|
|
Impaired loans without an associated reserve
|
|
|
289
|
|
|
|
471
|
|
|
Total impaired loans
|
|
$
|
4,041
|
|
|
$
|
3,946
|
|
|
Specific allowance for credit losses (b)
|
|
$
|
1,400
|
|
|
$
|
1,148
|
|
|
Average impaired loan balance (c)
|
|
$
|
4,241
|
|
|
$
|
2,664
|
|
|
(a)
|
Purchased impaired loans related to our acquisition of National City are excluded from this table and are disclosed in Note 6 Purchased Impaired Loans Related to
National City.
|
|
(b)
|
Amounts include $516 million at September 30, 2010 for TDRs.
|
|
(c)
|
Nine-month average for each year.
|
70
N
OTE
6 P
URCHASED
I
MPAIRED
L
OANS
R
ELATED
TO
N
ATIONAL
C
ITY
As further described in Note 6 of the 2009 Form 10-K, at December 31, 2008, we identified certain loans related to the National City acquisition, for
which there was evidence of credit quality deterioration since origination and it was probable that we would be unable to collect all contractually required principal and interest payments. GAAP requires these loans to be recorded at fair value at
acquisition date and prohibits the “carrying over” or the creation of valuation allowances in the initial accounting for such loans acquired in a transfer.
Purchased Impaired Loans
|
|
|
|
|
|
|
|
|
|
|
|
|
|
|
|
|
|
|
|
|
September 30, 2010
|
|
|
December 31, 2009
|
|
|
In millions
|
|
Recorded
Investment
|
|
|
Outstanding
Balance
|
|
|
Recorded
Investment
|
|
|
Outstanding
Balance
|
|
|
Commercial
|
|
$
|
353
|
|
|
$
|
526
|
|
|
$
|
531
|
|
|
$
|
921
|
|
|
Commercial real estate
|
|
|
1,206
|
|
|
|
1,679
|
|
|
|
1,636
|
|
|
|
2,600
|
|
|
Consumer
|
|
|
3,112
|
|
|
|
4,343
|
|
|
|
3,457
|
|
|
|
5,097
|
|
|
Residential real estate
|
|
|
3,459
|
|
|
|
4,072
|
|
|
|
4,663
|
|
|
|
6,620
|
|
|
Total
|
|
$
|
8,130
|
|
|
$
|
10,620
|
|
|
$
|
10,287
|
|
|
$
|
15,238
|
|
During the first nine months of 2010, the recorded investment of purchased impaired loans decreased by a net $2.2 billion as a result of payments and
other exit activities partially offset by accretion of purchase accounting discount.
The excess of cash flows expected at acquisition over
the estimated fair value is referred to as the accretable yield and is recognized in interest income over the remaining life of the loan using the constant effective yield method. The difference between contractually required payments at acquisition
and the cash flows expected to be collected at acquisition is referred to as the nonaccretable difference. Changes in the expected cash flows of individual commercial or pooled consumer purchased impaired loans from the date of acquisition will
either impact the accretable yield or result in an impairment charge to the provision for credit losses in the
period in which the changes become probable. Subsequent decreases to the net present value of expected cash flows will generally result in an impairment charge to the provision for credit losses,
resulting in an increase to the allowance for loan and lease losses, and a reclassification from accretable yield to nonaccretable difference. Prepayments and interest rate decreases for variable rate notes are treated as a reduction of cash flows
expected to be collected and a reduction of projections of contractual cash flows such that the nonaccretable difference is not affected. Thus, for decreases in cash flows expected to be collected resulting from prepayments and interest rate
decreases for variable rate notes, the effect will be to reduce the yield prospectively. During the first nine months of 2010, $508 million of provision and $158 million of charge-offs were recorded on impaired loans. As of September 30, 2010,
decreases in the net present value of expected cash flows of purchased impaired loans resulted in an allowance for loan and lease losses of $906 million on $7.1 billion of the impaired loans while the remaining $1.0 billion of impaired loans
required no allowance as net present value of expected cash flows improved or remained the same. Subsequent increases in the net present value of cash flows will result in a recovery of any previously recorded allowance for loan and lease losses, to
the extent applicable, and a reclassification from nonaccretable difference to accretable yield, which is recognized prospectively. Disposals of loans, which may include sales of loans or foreclosures, result in removal of the loan from the
purchased impaired loan portfolio at its carrying amount.
Activity for the accretable yield for the first nine months of 2010 follows.
Accretable Yield
|
|
|
|
|
|
|
In millions
|
|
2010
|
|
|
January 1
|
|
$
|
3,502
|
|
|
Accretion (including cash recoveries)
|
|
|
(1,060
|
)
|
|
Net reclassifications to accretable from non-accretable
|
|
|
73
|
|
|
Disposals
|
|
|
(187
|
)
|
|
September 30
|
|
$
|
2,328
|
|
71
N
OTE
7 I
NVESTMENT
S
ECURITIES
Investment Securities Summary
|
|
|
|
|
|
|
|
|
|
|
|
|
|
|
|
|
|
|
|
|
Amortized
|
|
|
Unrealized
|
|
|
Fair
|
|
|
In millions
|
|
Cost
|
|
|
Gains
|
|
|
Losses
|
|
|
Value
|
|
|
September 30, 2010
|
|
|
|
|
|
|
|
|
|
|
|
|
|
|
|
|
|
|
|
|
|
|
|
S
ECURITIES
A
VAILABLE
F
OR
S
ALE
|
|
|
|
|
|
|
|
|
|
|
|
|
|
|
|
|
|
Debt securities
|
|
|
|
|
|
|
|
|
|
|
|
|
|
|
|
|
|
US Treasury and government agencies
|
|
$
|
7,546
|
|
|
$
|
337
|
|
|
|
|
|
|
$
|
7,883
|
|
|
Residential mortgage-backed
|
|
|
|
|
|
|
|
|
|
|
|
|
|
|
|
|
|
Agency
|
|
|
28,470
|
|
|
|
716
|
|
|
$
|
(93
|
)
|
|
|
29,093
|
|
|
Non-agency
|
|
|
8,663
|
|
|
|
241
|
|
|
|
(1,323
|
)
|
|
|
7,581
|
|
|
Commercial mortgage-backed
|
|
|
|
|
|
|
|
|
|
|
|
|
|
|
|
|
|
Agency
|
|
|
1,560
|
|
|
|
81
|
|
|
|
|
|
|
|
1,641
|
|
|
Non-agency
|
|
|
1,795
|
|
|
|
75
|
|
|
|
(17
|
)
|
|
|
1,853
|
|
|
Asset-backed
|
|
|
2,897
|
|
|
|
46
|
|
|
|
(241
|
)
|
|
|
2,702
|
|
|
State and municipal
|
|
|
1,578
|
|
|
|
80
|
|
|
|
(57
|
)
|
|
|
1,601
|
|
|
Other debt
|
|
|
3,157
|
|
|
|
144
|
|
|
|
(4
|
)
|
|
|
3,297
|
|
|
Total debt securities
|
|
|
55,666
|
|
|
|
1,720
|
|
|
|
(1,735
|
)
|
|
|
55,651
|
|
|
Corporate stocks and other
|
|
|
399
|
|
|
|
|
|
|
|
|
|
|
|
399
|
|
|
Total securities available for sale
|
|
$
|
56,065
|
|
|
$
|
1,720
|
|
|
$
|
(1,735
|
)
|
|
$
|
56,050
|
|
|
S
ECURITIES
H
ELD
T
O
M
ATURITY
|
|
|
|
|
|
|
|
|
|
|
|
|
|
|
|
|
|
Debt securities
|
|
|
|
|
|
|
|
|
|
|
|
|
|
|
|
|
|
Commercial mortgage-backed (non-agency)
|
|
$
|
4,378
|
|
|
$
|
241
|
|
|
$
|
(1
|
)
|
|
$
|
4,618
|
|
|
Asset-backed
|
|
|
3,024
|
|
|
|
80
|
|
|
|
|
|
|
|
3,104
|
|
|
Other debt
|
|
|
9
|
|
|
|
2
|
|
|
|
|
|
|
|
11
|
|
|
Total securities held to maturity
|
|
$
|
7,411
|
|
|
$
|
323
|
|
|
$
|
(1
|
)
|
|
$
|
7,733
|
|
|
|
|
|
|
|
|
December 31, 2009
|
|
|
|
|
|
|
|
|
|
|
|
|
|
|
|
|
|
|
|
|
|
|
|
S
ECURITIES
A
VAILABLE
F
OR
S
ALE
|
|
|
|
|
|
|
|
|
|
|
|
|
|
|
|
|
|
Debt securities
|
|
|
|
|
|
|
|
|
|
|
|
|
|
|
|
|
|
US Treasury and government agencies
|
|
$
|
7,548
|
|
|
$
|
20
|
|
|
$
|
(48
|
)
|
|
$
|
7,520
|
|
|
Residential mortgage-backed
|
|
|
|
|
|
|
|
|
|
|
|
|
|
|
|
|
|
Agency
|
|
|
24,076
|
|
|
|
439
|
|
|
|
(77
|
)
|
|
|
24,438
|
|
|
Non-agency
|
|
|
10,419
|
|
|
|
236
|
|
|
|
(2,353
|
)
|
|
|
8,302
|
|
|
Commercial mortgage-backed
|
|
|
|
|
|
|
|
|
|
|
|
|
|
|
|
|
|
Agency
|
|
|
1,299
|
|
|
|
10
|
|
|
|
(12
|
)
|
|
|
1,297
|
|
|
Non-agency
|
|
|
4,028
|
|
|
|
42
|
|
|
|
(222
|
)
|
|
|
3,848
|
|
|
Asset-backed
|
|
|
2,019
|
|
|
|
30
|
|
|
|
(381
|
)
|
|
|
1,668
|
|
|
State and municipal
|
|
|
1,346
|
|
|
|
58
|
|
|
|
(54
|
)
|
|
|
1,350
|
|
|
Other debt
|
|
|
1,984
|
|
|
|
38
|
|
|
|
(7
|
)
|
|
|
2,015
|
|
|
Total debt securities
|
|
|
52,719
|
|
|
|
873
|
|
|
|
(3,154
|
)
|
|
|
50,438
|
|
|
Corporate stocks and other
|
|
|
360
|
|
|
|
|
|
|
|
|
|
|
|
360
|
|
|
Total securities available for sale
|
|
$
|
53,079
|
|
|
$
|
873
|
|
|
$
|
(3,154
|
)
|
|
$
|
50,798
|
|
|
S
ECURITIES
H
ELD
T
O
M
ATURITY
|
|
|
|
|
|
|
|
|
|
|
|
|
|
|
|
|
|
Debt securities
|
|
|
|
|
|
|
|
|
|
|
|
|
|
|
|
|
|
Commercial mortgage-backed (non-agency)
|
|
$
|
2,030
|
|
|
$
|
195
|
|
|
|
|
|
|
$
|
2,225
|
|
|
Asset-backed
|
|
|
3,040
|
|
|
|
109
|
|
|
$
|
(13
|
)
|
|
|
3,136
|
|
|
Other debt
|
|
|
159
|
|
|
|
1
|
|
|
|
|
|
|
|
160
|
|
|
Total securities held to maturity
|
|
$
|
5,229
|
|
|
$
|
305
|
|
|
$
|
(13
|
)
|
|
$
|
5,521
|
|
72
The fair value of investment
securities is impacted by interest rates, credit spreads, market volatility and liquidity conditions. Net unrealized gains and losses in the securities available for sale portfolio are included in shareholders’ equity as accumulated other
comprehensive income or loss, net of tax, unless credit-related.
In March 2010, we transferred $2.2 billion of available for sale commercial
mortgage-backed non-agency securities to the held to maturity portfolio. The reclassification was made at fair value at the date of transfer. Net pretax unrealized gains in accumulated other comprehensive loss totaled $92 million at the transfer
date and will be accreted over the remaining life of the related securities as an adjustment of yield in a manner consistent with the amortization of the premium on the same transferred securities, resulting in no impact on net income.
The following table presents gross unrealized loss and fair value of securities available for sale at September 30, 2010 and December 31, 2009.
The securities are segregated between investments that have been in a continuous unrealized loss position for less than twelve months and twelve months or more based on the point in time the fair value declined below the amortized cost basis. The
table includes debt securities where a portion of other-than-temporary impairment (OTTI) has been recognized in accumulated other comprehensive loss. The gross unrealized loss on debt securities held to maturity was $1 million at September 30,
2010 and $13 million at December 31, 2009 with the majority of positions in a continuous loss position for less than 12 months.
Gross Unrealized Loss and Fair Value of Securities Available for Sale
|
|
|
|
|
|
|
|
|
|
|
|
|
|
|
|
|
|
|
|
|
|
|
|
|
|
|
In millions
|
|
Unrealized loss position less
than 12 months
|
|
|
Unrealized loss position 12
months or more
|
|
|
Total
|
|
|
|
|
Unrealized
Loss
|
|
|
Fair
Value
|
|
|
Unrealized
Loss
|
|
|
Fair
Value
|
|
|
Unrealized
Loss
|
|
|
Fair
Value
|
|
|
September 30, 2010
|
|
|
|
|
|
|
|
|
|
|
|
|
|
|
|
|
|
|
|
|
|
|
|
|
|
Debt securities
|
|
|
|
|
|
|
|
|
|
|
|
|
|
|
|
|
|
|
|
|
|
|
|
|
|
Residential mortgage-backed
|
|
|
|
|
|
|
|
|
|
|
|
|
|
|
|
|
|
|
|
|
|
|
|
|
|
Agency
|
|
$
|
(76
|
)
|
|
$
|
6,823
|
|
|
$
|
(17
|
)
|
|
$
|
275
|
|
|
$
|
(93
|
)
|
|
$
|
7,098
|
|
|
Non-agency
|
|
|
(24
|
)
|
|
|
155
|
|
|
|
(1,299
|
)
|
|
|
6,072
|
|
|
|
(1,323
|
)
|
|
|
6,227
|
|
|
Commercial mortgage-backed
|
|
|
|
|
|
|
|
|
|
|
|
|
|
|
|
|
|
|
|
|
|
|
|
|
|
Non-agency
|
|
|
(2
|
)
|
|
|
66
|
|
|
|
(15
|
)
|
|
|
225
|
|
|
|
(17
|
)
|
|
|
291
|
|
|
Asset-backed
|
|
|
(15
|
)
|
|
|
371
|
|
|
|
(226
|
)
|
|
|
801
|
|
|
|
(241
|
)
|
|
|
1,172
|
|
|
State and municipal
|
|
|
(3
|
)
|
|
|
235
|
|
|
|
(54
|
)
|
|
|
250
|
|
|
|
(57
|
)
|
|
|
485
|
|
|
Other debt
|
|
|
(1
|
)
|
|
|
82
|
|
|
|
(3
|
)
|
|
|
11
|
|
|
|
(4
|
)
|
|
|
93
|
|
|
Total
|
|
$
|
(121
|
)
|
|
$
|
7,732
|
|
|
$
|
(1,614
|
)
|
|
$
|
7,634
|
|
|
$
|
(1,735
|
)
|
|
$
|
15,366
|
|
|
|
|
|
|
|
|
|
|
December 31, 2009
|
|
|
|
|
|
|
|
|
|
|
|
|
|
|
|
|
|
|
|
|
|
|
|
|
|
Debt securities
|
|
|
|
|
|
|
|
|
|
|
|
|
|
|
|
|
|
|
|
|
|
|
|
|
|
US Treasury and government agencies
|
|
$
|
(48
|
)
|
|
$
|
4,015
|
|
|
|
|
|
|
|
|
|
|
$
|
(48
|
)
|
|
$
|
4,015
|
|
|
Residential mortgage-backed
|
|
|
|
|
|
|
|
|
|
|
|
|
|
|
|
|
|
|
|
|
|
|
|
|
|
Agency
|
|
|
(76
|
)
|
|
|
6,960
|
|
|
$
|
(1
|
)
|
|
$
|
56
|
|
|
|
(77
|
)
|
|
|
7,016
|
|
|
Non-agency
|
|
|
(7
|
)
|
|
|
79
|
|
|
|
(2,346
|
)
|
|
|
7,223
|
|
|
|
(2,353
|
)
|
|
|
7,302
|
|
|
Commercial mortgage-backed
|
|
|
|
|
|
|
|
|
|
|
|
|
|
|
|
|
|
|
|
|
|
|
|
|
|
Agency
|
|
|
(12
|
)
|
|
|
779
|
|
|
|
|
|
|
|
|
|
|
|
(12
|
)
|
|
|
779
|
|
|
Non-agency
|
|
|
(3
|
)
|
|
|
380
|
|
|
|
(219
|
)
|
|
|
1,353
|
|
|
|
(222
|
)
|
|
|
1,733
|
|
|
Asset-backed
|
|
|
(1
|
)
|
|
|
142
|
|
|
|
(380
|
)
|
|
|
1,153
|
|
|
|
(381
|
)
|
|
|
1,295
|
|
|
State and municipal
|
|
|
(1
|
)
|
|
|
49
|
|
|
|
(53
|
)
|
|
|
285
|
|
|
|
(54
|
)
|
|
|
334
|
|
|
Other debt
|
|
|
(3
|
)
|
|
|
299
|
|
|
|
(4
|
)
|
|
|
18
|
|
|
|
(7
|
)
|
|
|
317
|
|
|
Total
|
|
$
|
(151
|
)
|
|
$
|
12,703
|
|
|
$
|
(3,003
|
)
|
|
$
|
10,088
|
|
|
$
|
(3,154
|
)
|
|
$
|
22,791
|
|
Evaluating Investments for Other-than-Temporary Impairments
For the securities in the above table, as of September 30, 2010 we do not intend to sell and have determined it is not more likely than not we will
be required to sell the securities prior to recovery of the amortized cost basis.
On at least a quarterly basis, we conduct a comprehensive
security-level assessment on all securities in an unrealized loss position to determine if OTTI exists. An unrealized loss exists
when the current fair value of an individual security is less than its amortized cost basis. An OTTI loss must be recognized for a debt security in an unrealized loss position if we intend to
sell the security or it is more likely than not we will be required to sell the security prior to recovery of its amortized cost basis. In this situation, the amount of loss recognized in income is equal to the difference between the fair value and
the amortized cost basis of the security. Even if we do not expect to sell the security, we must evaluate the expected cash flows to be received to determine if we believe
73
a credit loss has occurred. In the event of a credit loss, only the amount of impairment associated with the credit loss is recognized in income. The portion of the unrealized loss relating to
other factors, such as liquidity conditions in the market or changes in market interest rates, is recorded in accumulated other comprehensive loss.
Equity securities are also evaluated to determine whether the unrealized loss is expected to be recoverable based on whether evidence exists to support a realizable value equal to or greater than the cost
basis. If it is probable that we will not recover the amortized cost basis, taking into consideration the estimated recovery period and our ability to hold the equity security until recovery, OTTI is recognized in earnings equal to the difference
between the fair value and the amortized cost basis of the security.
The security-level assessment is performed on each security, regardless
of the classification of the security as available for sale or held to maturity. Our assessment considers the security structure, recent security collateral performance metrics if applicable, external credit ratings, failure of the issuer to make
scheduled interest or principal payments, our judgment and expectations of future performance, and relevant independent industry research, analysis and forecasts. We also consider the severity of the impairment and the length of time the security
has been impaired in our assessment. Results of the periodic assessment are reviewed by a cross-functional senior management team representing Asset & Liability Management, Finance, and Balance Sheet Risk Management. The senior management
team considers the results of the assessments, as well as other factors, in determining whether the impairment is other-than-temporary.
For
debt securities, a critical component of the evaluation for OTTI is the identification of credit-impaired securities, where management does not expect to receive cash flows sufficient to recover the entire amortized cost basis of the security. The
paragraphs below describe our process for identifying credit impairment for our most significant categories of securities not backed by the US government or its agencies.
Non-Agency Residential Mortgage-Backed Securities and Asset-Backed Securities Collateralized by First-Lien and Second-Lien Residential Mortgage Loans
To measure credit losses for these securities, we compile relevant collateral details and performance statistics on a security-by-security basis. The
securities are then processed through a series of pre-established filters based upon ratings, collateral performance, projected losses, market prices and
judgment to identify bonds that have the potential to be credit impaired.
Securities
not passing all of the filters are subjected to further analysis. Cash flows are projected for the underlying collateral and are applied to the securities according to the deal structure using a third-party default model. Collateral cash flows are
estimated using assumptions for prepayment rates, future defaults, and loss severity rates. The assumptions are security specific and are based on collateral characteristics, historical performance, and future expected performance. Based on the
results of the cash flow analysis, we determine whether we will recover the amortized cost basis of our security.
Credit Impairment
Assessment Assumptions – Non-Agency Residential Mortgage-Backed and Asset-Backed Securities (a)
|
|
|
|
|
|
|
|
|
|
|
September 30, 2010
|
|
Range
|
|
|
Weighted-
average (b)
|
|
|
Long-term prepayment rate (annual CPR)
|
|
|
|
|
|
|
|
|
|
Prime
|
|
|
7-20
|
%
|
|
|
14
|
%
|
|
Alt-A
|
|
|
3-12
|
|
|
|
5
|
|
|
Remaining collateral expected to default
|
|
|
|
|
|
|
|
|
|
Prime
|
|
|
0-52
|
%
|
|
|
20
|
%
|
|
Alt-A
|
|
|
0-82
|
|
|
|
44
|
|
|
Loss severity
|
|
|
|
|
|
|
|
|
|
Prime
|
|
|
15-60
|
%
|
|
|
44
|
%
|
|
Alt-A
|
|
|
27-80
|
|
|
|
56
|
|
|
(a)
|
Collateralized by first and second-lien non-agency residential mortgage loans.
|
|
(b)
|
Calculated by weighting the relevant assumption for each individual security by the current outstanding cost basis of the security.
|
Non-Agency Commercial Mortgage-Backed Securities
Credit losses on these securities are measured using property-level cash flow projections and forward-looking property valuations. Cash flows are projected using a detailed analysis of net operating
income (NOI) by property type which, in turn, is based on the analysis of NOI performance over the past several business cycles combined with PNC’s economic outlook for the current cycle. Loss severities are based on property price projections,
which are calculated using capitalization rate projections. The capitalization rate projections are based on a combination of historical capitalization rates and expected capitalization rates implied by current market activity, our outlook and
relevant independent industry research, analysis and forecast. Securities exhibiting weaker performance within the model are subject to further analysis. This analysis is performed at the loan level, and includes assessing local market conditions,
reserves, occupancy, rent rolls and master/special servicer details.
74
During the third quarter and first nine months of 2010 and 2009, the OTTI credit losses recognized in
noninterest income related to estimated credit losses on securities that we do not expect to sell were as follows:
Summary of OTTI
Credit Losses Recognized in Earnings
|
|
|
|
|
|
|
|
|
|
|
|
|
|
|
|
|
|
|
|
|
Three months ended September 30
|
|
|
Nine months ended September 30
|
|
|
In millions
|
|
2010
|
|
|
2009
|
|
|
2010
|
|
|
2009
|
|
|
Available for sale securities:
|
|
|
|
|
|
|
|
|
|
|
|
|
|
|
|
|
|
Non-agency residential mortgage-backed
|
|
$
|
(57
|
)
|
|
$
|
(92
|
)
|
|
$
|
(211
|
)
|
|
$
|
(340
|
)
|
|
Non-agency commercial mortgage-backed
|
|
|
|
|
|
|
|
|
|
|
(3
|
)
|
|
|
(6
|
)
|
|
Asset-backed
|
|
|
(14
|
)
|
|
|
(34
|
)
|
|
|
(67
|
)
|
|
|
(76
|
)
|
|
Other debt
|
|
|
|
|
|
|
(3
|
)
|
|
|
|
|
|
|
(7
|
)
|
|
Marketable equity securities
|
|
|
|
|
|
|
|
|
|
|
|
|
|
|
(4
|
)
|
|
Total
|
|
$
|
(71
|
)
|
|
$
|
(129
|
)
|
|
$
|
(281
|
)
|
|
$
|
(433
|
)
|
Summary of OTTI Noncredit Losses Included in Accumulated Other Comprehensive Loss
|
|
|
|
|
|
|
|
|
|
|
|
|
|
|
|
|
|
|
|
|
Three months ended September 30
|
|
|
Nine months ended September 30
|
|
|
In millions
|
|
2010
|
|
|
2009
|
|
|
2010
|
|
|
2009
|
|
|
Total
|
|
$
|
(46
|
)
|
|
$
|
(272
|
)
|
|
$
|
(194
|
)
|
|
$
|
(1,107
|
)
|
The following table presents a rollforward of the cumulative OTTI credit losses recognized in earnings for all debt securities for which a portion of an OTTI loss was recognized in accumulated other
comprehensive loss:
Rollforward of Cumulative OTTI Credit Losses Recognized in Earnings
|
|
|
|
|
|
|
|
|
|
|
|
|
|
|
|
|
|
|
|
|
|
|
In millions
|
|
Non-agency
residential
mortgage-backed
|
|
|
Non-agency
commercial
mortgage-backed
|
|
|
Asset-backed
|
|
|
Other debt
|
|
|
Total
|
|
|
For the three months ended September 30, 2010
|
|
|
|
|
|
|
|
|
|
|
|
|
|
|
|
|
|
|
|
|
|
June 30, 2010
|
|
$
|
(621
|
)
|
|
$
|
(9
|
)
|
|
$
|
(198
|
)
|
|
$
|
(12
|
)
|
|
$
|
(840
|
)
|
|
Loss where impairment was not previously recognized
|
|
|
(15
|
)
|
|
|
|
|
|
|
|
|
|
|
|
|
|
|
(15
|
)
|
|
Additional loss where credit impairment was previously recognized
|
|
|
(42
|
)
|
|
|
|
|
|
|
(14
|
)
|
|
|
|
|
|
|
(56
|
)
|
|
September 30, 2010
|
|
$
|
(678
|
)
|
|
$
|
(9
|
)
|
|
$
|
(212
|
)
|
|
$
|
(12
|
)
|
|
$
|
(911
|
)
|
|
|
|
|
|
|
|
|
|
|
|
|
|
|
|
|
|
|
|
|
|
|
|
In millions
|
|
Non-agency
residential
mortgage-backed
|
|
|
Non-agency
commercial
mortgage-backed
|
|
|
Asset-backed
|
|
|
Other debt
|
|
|
Total
|
|
|
For the three months ended September 30, 2009
|
|
|
|
|
|
|
|
|
|
|
|
|
|
|
|
|
|
|
|
|
|
June 30, 2009
|
|
$
|
(284
|
)
|
|
$
|
(6
|
)
|
|
$
|
(75
|
)
|
|
$
|
(4
|
)
|
|
$
|
(369
|
)
|
|
Loss where impairment was not previously recognized
|
|
|
(37
|
)
|
|
|
|
|
|
|
(20
|
)
|
|
|
|
|
|
|
(57
|
)
|
|
Additional loss where credit impairment was previously recognized
|
|
|
(55
|
)
|
|
|
|
|
|
|
(14
|
)
|
|
|
(3
|
)
|
|
|
(72
|
)
|
|
September 30, 2009
|
|
$
|
(376
|
)
|
|
$
|
(6
|
)
|
|
$
|
(109
|
)
|
|
$
|
(7
|
)
|
|
$
|
(498
|
)
|
|
|
|
|
|
|
|
|
|
|
|
|
|
|
|
|
|
|
|
|
|
|
|
In millions
|
|
Non-agency
residential
mortgage-backed
|
|
|
Non-agency
commercial
mortgage-backed
|
|
|
Asset-backed
|
|
|
Other debt
|
|
|
Total
|
|
|
For the nine months ended September 30, 2010
|
|
|
|
|
|
|
|
|
|
|
|
|
|
|
|
|
|
|
|
|
|
December 31, 2009
|
|
$
|
(479
|
)
|
|
$
|
(6
|
)
|
|
$
|
(145
|
)
|
|
$
|
(12
|
)
|
|
$
|
(642
|
)
|
|
Loss where impairment was not previously recognized
|
|
|
(41
|
)
|
|
|
(3
|
)
|
|
|
(11
|
)
|
|
|
|
|
|
|
(55
|
)
|
|
Additional loss where credit impairment was previously recognized
|
|
|
(170
|
)
|
|
|
|
|
|
|
(56
|
)
|
|
|
|
|
|
|
(226
|
)
|
|
Reduction due to credit impaired securities sold
|
|
|
12
|
|
|
|
|
|
|
|
|
|
|
|
|
|
|
|
12
|
|
|
September 30, 2010
|
|
$
|
(678
|
)
|
|
$
|
(9
|
)
|
|
$
|
(212
|
)
|
|
$
|
(12
|
)
|
|
$
|
(911
|
)
|
|
|
|
|
|
|
|
|
|
|
|
|
|
|
|
|
|
|
|
|
|
|
|
In millions
|
|
Non-agency
residential
mortgage-backed
|
|
|
Non-agency
commercial
mortgage-backed
|
|
|
Asset-backed
|
|
|
Other debt
|
|
|
Total
|
|
|
For the nine months ended September 30, 2009 (a)
|
|
|
|
|
|
|
|
|
|
|
|
|
|
|
|
|
|
|
|
|
|
December 31, 2008
|
|
$
|
(35
|
)
|
|
|
|
|
|
$
|
(34
|
)
|
|
|
|
|
|
$
|
(69
|
)
|
|
Loss where impairment was not previously recognized
|
|
|
(192
|
)
|
|
$
|
(6
|
)
|
|
|
(54
|
)
|
|
$
|
(4
|
)
|
|
|
(256
|
)
|
|
Additional loss where credit impairment was previously recognized
|
|
|
(149
|
)
|
|
|
|
|
|
|
(21
|
)
|
|
|
(3
|
)
|
|
|
(173
|
)
|
|
September 30, 2009
|
|
$
|
(376
|
)
|
|
$
|
(6
|
)
|
|
$
|
(109
|
)
|
|
$
|
(7
|
)
|
|
$
|
(498
|
)
|
|
(a)
|
Excludes OTTI credit losses related to equity securities totaling $4 million.
|
75
Information relating to gross realized
securities gains and losses from the sales of securities is set forth in the following table.
Gains (Losses) on Sales of Securities
Available for Sale
|
|
|
|
|
|
|
|
|
|
|
|
|
|
|
|
|
|
|
|
|
|
|
Nine months ended
September 30
In millions
|
|
Proceeds
|
|
|
Gross
Gains
|
|
|
Gross
Losses
|
|
|
Net
Gains
|
|
|
Tax
Expense
|
|
|
2010
|
|
$
|
18,285
|
|
|
$
|
421
|
|
|
$
|
(63
|
)
|
|
$
|
358
|
|
|
$
|
125
|
|
|
2009
|
|
|
12,655
|
|
|
|
421
|
|
|
|
(15
|
)
|
|
|
406
|
|
|
|
142
|
|
The following table presents, by remaining contractual maturity, the amortized cost, fair value and weighted-average yield of debt securities at
September 30, 2010.
Contractual Maturity of Debt Securities
|
|
|
|
|
|
|
|
|
|
|
|
|
|
|
|
|
|
|
|
|
|
|
September 30, 2010
Dollars in millions
|
|
1 Year or Less
|
|
|
After 1 Year
through 5 Years
|
|
|
After 5 Years
through 10 Years
|
|
|
After 10
Years
|
|
|
Total
|
|
|
S
ECURITIES
A
VAILABLE
F
OR
S
ALE
|
|
|
|
|
|
|
|
|
|
|
|
|
|
|
|
|
|
|
|
|
|
US Treasury and government agencies
|
|
$
|
9
|
|
|
$
|
4,200
|
|
|
$
|
2,848
|
|
|
$
|
489
|
|
|
$
|
7,546
|
|
|
Residential mortgage-backed
|
|
|
|
|
|
|
|
|
|
|
|
|
|
|
|
|
|
|
|
|
|
Agency
|
|
|
|
|
|
|
42
|
|
|
|
1,398
|
|
|
|
27,030
|
|
|
|
28,470
|
|
|
Non-agency
|
|
|
|
|
|
|
|
|
|
|
39
|
|
|
|
8,624
|
|
|
|
8,663
|
|
|
Commercial mortgage-backed
|
|
|
|
|
|
|
|
|
|
|
|
|
|
|
|
|
|
|
|
|
|
Agency
|
|
|
1
|
|
|
|
425
|
|
|
|
1,129
|
|
|
|
5
|
|
|
|
1,560
|
|
|
Non-agency
|
|
|
|
|
|
|
57
|
|
|
|
|
|
|
|
1,738
|
|
|
|
1,795
|
|
|
Asset-backed
|
|
|
1
|
|
|
|
294
|
|
|
|
405
|
|
|
|
2,197
|
|
|
|
2,897
|
|
|
State and municipal
|
|
|
52
|
|
|
|
150
|
|
|
|
196
|
|
|
|
1,180
|
|
|
|
1,578
|
|
|
Other debt
|
|
|
6
|
|
|
|
2,696
|
|
|
|
263
|
|
|
|
192
|
|
|
|
3,157
|
|
|
Total debt securities available for sale
|
|
$
|
69
|
|
|
$
|
7,864
|
|
|
$
|
6,278
|
|
|
$
|
41,455
|
|
|
$
|
55,666
|
|
|
Fair value
|
|
$
|
69
|
|
|
$
|
8,078
|
|
|
$
|
6,638
|
|
|
$
|
40,866
|
|
|
$
|
55,651
|
|
|
Weighted-average yield, GAAP basis
|
|
|
3.71
|
%
|
|
|
2.54
|
%
|
|
|
3.59
|
%
|
|
|
4.39
|
%
|
|
|
4.04
|
%
|
|
S
ECURITIES
H
ELD
TO
M
ATURITY
|
|
|
|
|
|
|
|
|
|
|
|
|
|
|
|
|
|
|
|
|
|
Commercial mortgage-backed (non-agency)
|
|
|
|
|
|
$
|
212
|
|
|
$
|
72
|
|
|
$
|
4,094
|
|
|
$
|
4,378
|
|
|
Asset-backed
|
|
$
|
43
|
|
|
|
2,265
|
|
|
|
348
|
|
|
|
368
|
|
|
|
3,024
|
|
|
Other debt
|
|
|
|
|
|
|
1
|
|
|
|
6
|
|
|
|
2
|
|
|
|
9
|
|
|
Total debt securities held to maturity
|
|
$
|
43
|
|
|
$
|
2,478
|
|
|
$
|
426
|
|
|
$
|
4,464
|
|
|
$
|
7,411
|
|
|
Fair value
|
|
$
|
43
|
|
|
$
|
2,563
|
|
|
$
|
440
|
|
|
$
|
4,687
|
|
|
$
|
7,733
|
|
|
Weighted-average yield, GAAP basis
|
|
|
2.77
|
%
|
|
|
2.86
|
%
|
|
|
2.56
|
%
|
|
|
4.91
|
%
|
|
|
4.08
|
%
|
Based on current interest rates and expected prepayment speeds, the weighted-average expected maturity of mortgage and other asset-backed debt securities
were as follows as of September 30, 2010:
Weighted-Average Expected Maturity of Mortgage and Other Asset-Backed Debt Securities
|
|
|
|
|
|
|
|
|
September 30,
2010
|
|
|
Agency mortgage-backed securities
|
|
|
3.8 years
|
|
|
Non-agency mortgage-backed securities
|
|
|
4.5 years
|
|
|
Agency commercial mortgage-backed securities
|
|
|
5.6 years
|
|
|
Non-agency commercial mortgage-backed securities
|
|
|
3.5 years
|
|
|
Asset-backed securities
|
|
|
3.3 years
|
|
Weighted-average yields are based on historical cost with effective yields weighted for the contractual maturity of each security.
76
The following table presents the fair
value of securities that have been either pledged to or accepted from others to collateralize outstanding borrowings.
Fair Value of
Securities Pledged and Accepted as Collateral
|
|
|
|
|
|
|
|
|
|
|
In millions
|
|
September 30,
2010
|
|
|
December 31,
2009
|
|
|
Pledged to others
|
|
$
|
28,717
|
|
|
$
|
23,368
|
|
|
Accepted from others:
|
|
|
|
|
|
|
|
|
|
Permitted by contract or custom to sell or repledge
|
|
|
2,001
|
|
|
|
2,357
|
|
|
Permitted amount repledged to others
|
|
|
672
|
|
|
|
1,283
|
|
The securities pledged to others include positions held in our portfolio of investment securities, trading securities, and securities accepted as
collateral from others that we are permitted by contract or custom to sell or repledge, and were used to secure public and trust deposits, repurchase agreements, and for other purposes. The securities accepted from others that we are permitted by
contract or custom to sell or repledge are a component of Federal funds sold and resale agreements on our Consolidated Balance Sheet.
N
OTE
8 F
AIR
V
ALUE
Fair Value Measurement
Fair value is defined in GAAP as the price that would be received to sell an asset or the price paid to transfer a liability on the measurement date. The
standard focuses on the exit price in the principal or most advantageous market for the asset or liability in an orderly transaction between willing market participants. GAAP establishes a fair value reporting hierarchy to maximize the use of
observable inputs when measuring fair value and defines the three levels of inputs as noted below.
Level 1
Quoted prices in active markets for identical assets or liabilities. Level 1 assets and liabilities may include debt securities, equity securities and
listed derivative contracts that are traded in an active exchange market and certain US government agency securities that are actively traded in over-the-counter markets.
Level 2
Observable inputs other than Level 1 such as: quoted prices for similar assets or
liabilities in active markets, quoted prices for identical or similar assets or liabilities in markets that are not active, or other inputs that are observable or can be corroborated to observable market data for substantially the full term of the
asset or liability. Level 2 assets and liabilities may include debt securities, equity securities and listed derivative contracts with quoted prices that are traded in markets that are not active, and certain debt and equity securities and
over-the-counter derivative contracts whose fair value is determined using a pricing model without significant unobservable inputs. This category generally includes agency residential and commercial mortgage-backed debt securities, asset-backed
securities, corporate debt securities, residential mortgage loans held for sale, and derivative contracts.
Level 3
Unobservable inputs that are supported by minimal or no market activity and that are significant to the fair value of the assets or liabilities. Level 3 assets and liabilities may include financial
instruments whose value is determined using pricing models with internally developed assumptions, discounted cash flow methodologies, or similar techniques, as well as instruments for which the determination of fair value requires significant
management judgment or estimation. This category generally includes certain available for sale and trading securities, commercial mortgage loans held for sale, private equity investments, residential mortgage servicing rights, BlackRock Series C
Preferred Stock and certain financial derivative contracts. The available for sale and trading securities within Level 3 include non-agency residential mortgage-backed securities, auction rate securities, certain private-issuer asset-backed
securities and corporate debt securities. Nonrecurring items, primarily certain nonaccrual and other loans held for sale, commercial mortgage servicing rights, equity investments and other assets are also included in this category.
We characterize active markets as those where transaction volumes are sufficient to provide objective pricing information, with reasonably narrow bid/ask
spreads and where dealer quotes received do not vary widely and are based on current information. Inactive markets are typically characterized by low transaction volumes, price quotations which vary substantially among market participants or are not
based on current information, wide bid/ask spreads, a significant increase in implied liquidity risk premiums, yields, or performance indicators for observed transactions or quoted prices compared to historical periods, a significant decline or
absence of a market for new issuance, or any combination of the above factors. We also consider nonperformance risks including credit risk as part of our valuation methodology for all assets and liabilities measured at fair value.
77
Any models used to determine fair values or to validate dealer quotes based on the descriptions below are
subject to review and independent testing as part of our model validation and internal control testing processes. Our Model Validation Committee tests significant models on at least an annual basis. In addition, we have teams, independent of the
traders, verify marks and assumptions used for valuations at each period end.
Securities Available for Sale and Trading Securities
Securities measured at fair value include both the available for sale and trading portfolios. We use prices obtained from pricing
services, dealer quotes or recent trades to determine the fair value of securities. For 55% of our positions, we use prices obtained from pricing services provided by the Barclay’s Capital Index and Interactive Data Corp. (IDC). For 15% of our
positions, we use prices obtained from the pricing services as the primary input into the valuation process. Barclay’s Capital Index prices are set with reference to market activity for highly liquid assets such as agency mortgage-backed
securities, and matrix pricing for other assets, such as CMBS and asset-backed securities. IDC primarily uses pricing models considering adjustments for ratings, spreads, matrix pricing and prepayments for the instruments we value using this
service, such as non-agency residential mortgage-backed securities, agency adjustable rate mortgage securities, agency CMOs and municipal bonds. Dealer quotes received are typically non-binding and corroborated with other dealer or market quotes, by
reviewing valuations of comparable instruments, or by comparison to internal valuations. In circumstances where relevant market prices are limited or unavailable, valuations may require significant management judgments or adjustments to determine
fair value. In these cases, the securities are classified as Level 3.
The valuation techniques used for securities classified as Level 3
include using a discounted cash flow approach or, in certain instances, identifying a proxy security, market transaction or index. For certain security types, primarily non-agency residential securities, the fair value methodology incorporates
values obtained from a discounted cash flow model. The modeling process incorporates assumptions management believes willing market participants would use to value the security under current market conditions. The assumptions used include prepayment
projections, credit loss assumptions, and discount rates, which include a risk premium due to liquidity and uncertainty that are based on both observable and unobservable inputs. We use the discounted cash flow analysis, in conjunction with other
relevant pricing information obtained from either pricing services or broker quotes to establish the fair value that management believes is representative under current market conditions. For purposes of determining fair value at September 30,
2010, the relevant pricing service information was the predominant input.
In the proxy approach, the proxy selected generally has similar
credit, tenor, duration, pricing and structuring attributes to the PNC position. The price, market spread, or
yield on the proxy is then used to calculate an indicative market price for the security. Depending on the nature of the PNC position and its attributes relative to the proxy, management may make
additional adjustments to account for market conditions, liquidity, and nonperformance risk, based on various inputs including recent trades of similar securities, single dealer quotes, and/or other observable and unobservable inputs.
Financial Derivatives
Exchange-traded derivatives are valued using quoted market prices and are classified as Level 1. However, the majority of derivatives that we enter into
are executed over-the-counter and are valued using internal techniques. Readily observable market inputs to these models can be validated to external sources, including industry pricing services, or corroborated through recent trades, dealer quotes,
yield curves, implied volatility or other market-related data. Certain derivatives, such as total rate of return swaps, are corroborated to the CMBX index. These derivatives are classified as Level 2. Derivatives priced using significant management
judgment or assumptions are classified as Level 3.
The fair values of our derivatives are adjusted for nonperformance risk including credit
risk as appropriate. Our nonperformance risk adjustment is computed using new loan pricing and considers externally available bond spreads, in conjunction with internal historical recovery observations. The credit risk adjustment is not currently
material to the overall derivatives valuation.
Residential Mortgage Loans Held for Sale
We have elected to account for certain residential mortgage loans originated for sale on a recurring basis at fair value. At December 31, 2009, all
residential mortgage loans held for sale were at fair value. Residential mortgage loans are valued based on quoted market prices, where available, prices for other traded mortgage loans with similar characteristics, and purchase commitments and bid
information received from market participants. These loans are regularly traded in active markets and observable pricing information is available from market participants. The prices are adjusted as necessary to include the embedded servicing value
in the loans and to take into consideration the specific characteristics of certain loans that are priced based on the pricing of similar loans. These adjustments represent unobservable inputs to the valuation but are not considered significant to
the fair value of the loans. Accordingly, residential mortgage loans held for sale are classified as Level 2.
Residential Mortgage
Servicing Rights
Residential mortgage servicing rights (MSRs) are carried at fair value on a recurring basis. Currently, these
residential MSRs do not trade in an active open market with readily observable prices. Although sales of servicing assets do occur, the precise terms and conditions typically would not be available. Accordingly, management determines the fair value
78
of its residential MSRs using a discounted cash flow model incorporating assumptions about loan prepayment rates, discount rates, servicing costs, and other economic factors. As part of the
pricing process, management compares its fair value estimates to third-party valuations on a quarterly basis to assess the reasonableness of the fair values calculated by its internal valuation models. Due to the nature of the valuation inputs,
residential MSRs are classified as Level 3.
Commercial Mortgage Loans Held for Sale
We account for certain commercial mortgage loans classified as held for sale at fair value. The election of the fair value option aligns the accounting
for the commercial mortgages with the related hedges. At origination, these loans were intended for securitization.
Due to inactivity in the
CMBS securitization market in 2010 and 2009, we determine the fair value of commercial mortgage loans held for sale by using a whole loan methodology. Fair value is determined using sale valuation assumptions that management believes a market
participant would use in pricing the loans. When available, valuation assumptions included observable inputs based on whole loan sales. Adjustments are made to these assumptions to account for situations when uncertainties exist, including market
conditions and liquidity. Credit risk is included as part of our valuation process for these loans by considering expected rates of return for market participants for similar loans in the marketplace. Based on the significance of unobservable
inputs, we classified this portfolio as Level 3.
Equity Investments
The valuation of direct and indirect private equity investments requires significant management judgment due to the absence of quoted market prices, inherent lack of liquidity and the long-term nature of
such investments. The carrying values of direct and affiliated partnership interests reflect the expected exit price and are based on various techniques including multiples of adjusted earnings of the entity, independent appraisals, anticipated
financing and sale transactions with
third parties, or the pricing used to value the entity in a recent financing transaction. We value indirect investments in private equity funds based on net asset value as provided in the
financial statements that we receive from their managers. Due to the time lag in our receipt of the financial information and based on a review of investments and valuation techniques applied, adjustments to the manager-provided value are made when
available recent portfolio company information or market information indicates a significant change in value from that provided by the manager of the fund. These investments are classified as Level 3.
Customer Resale Agreements
We
have elected to account for structured resale agreements, which are economically hedged using free-standing financial derivatives, at fair value. The fair value for structured resale agreements is determined using a model which includes observable
market data such as interest rates as inputs. Readily observable market inputs to this model can be validated to external sources, including yield curves, implied volatility or other market-related data. These instruments are classified as Level 2.
BlackRock Series C Preferred Stock
We have elected to account for the 2.9 million shares of the BlackRock Series C Preferred Stock received in a stock exchange with BlackRock at fair value. The Series C Preferred Stock economically
hedges the BlackRock LTIP liability that is accounted for as a derivative. The fair value of the Series C Preferred Stock is determined using a third-party modeling approach, which includes both observable and unobservable inputs. This approach
considers expectations of a default/liquidation event and the use of liquidity discounts based on our inability to sell the security at a fair, open market price in a timely manner. Although dividends are equal to common shares and other preferred
series, significant transfer restrictions exist on our Series C shares for any purpose other than to satisfy the LTIP obligation. Due to the significance of unobservable inputs, this security is classified as Level 3.
79
Assets and liabilities measured at
fair value on a recurring basis, including instruments for which PNC has elected the fair value option, follow.
Fair Value Measurements
– Summary
|
|
|
|
|
|
|
|
|
|
|
|
|
|
|
|
|
|
|
|
|
|
|
|
|
|
|
|
|
|
|
|
|
|
|
|
|
September 30, 2010
|
|
|
December 31, 2009
|
|
|
In millions
|
|
Level 1
|
|
|
Level 2
|
|
|
Level 3
|
|
|
Total Fair
Value
|
|
|
Level 1
|
|
|
Level 2
|
|
|
Level 3
|
|
|
Total Fair
Value
|
|
|
Assets
|
|
|
|
|
|
|
|
|
|
|
|
|
|
|
|
|
|
|
|
|
|
|
|
|
|
|
|
|
|
|
|
|
|
Securities available for sale
|
|
|
|
|
|
|
|
|
|
|
|
|
|
|
|
|
|
|
|
|
|
|
|
|
|
|
|
|
|
|
|
|
|
US Treasury and government agencies
|
|
$
|
7,440
|
|
|
$
|
443
|
|
|
|
|
|
|
$
|
7,883
|
|
|
$
|
7,026
|
|
|
$
|
494
|
|
|
|
|
|
|
$
|
7,520
|
|
|
Residential mortgage-backed
|
|
|
|
|
|
|
|
|
|
|
|
|
|
|
|
|
|
|
|
|
|
|
|
|
|
|
|
|
|
|
|
|
|
Agency
|
|
|
|
|
|
|
29,093
|
|
|
|
|
|
|
|
29,093
|
|
|
|
|
|
|
|
24,433
|
|
|
$
|
5
|
|
|
|
24,438
|
|
|
Non-agency
|
|
|
|
|
|
|
|
|
|
$
|
7,581
|
|
|
|
7,581
|
|
|
|
|
|
|
|
|
|
|
|
8,302
|
|
|
|
8,302
|
|
|
Commercial mortgage-backed
|
|
|
|
|
|
|
|
|
|
|
|
|
|
|
|
|
|
|
|
|
|
|
|
|
|
|
|
|
|
|
|
|
|
Agency
|
|
|
|
|
|
|
1,641
|
|
|
|
|
|
|
|
1,641
|
|
|
|
|
|
|
|
1,297
|
|
|
|
|
|
|
|
1,297
|
|
|
Non-agency
|
|
|
|
|
|
|
1,853
|
|
|
|
|
|
|
|
1,853
|
|
|
|
|
|
|
|
3,842
|
|
|
|
6
|
|
|
|
3,848
|
|
|
Asset-backed
|
|
|
|
|
|
|
1,577
|
|
|
|
1,125
|
|
|
|
2,702
|
|
|
|
|
|
|
|
414
|
|
|
|
1,254
|
|
|
|
1,668
|
|
|
State and municipal
|
|
|
|
|
|
|
1,368
|
|
|
|
233
|
|
|
|
1,601
|
|
|
|
|
|
|
|
1,084
|
|
|
|
266
|
|
|
|
1,350
|
|
|
Other debt
|
|
|
|
|
|
|
3,225
|
|
|
|
72
|
|
|
|
3,297
|
|
|
|
|
|
|
|
1,962
|
|
|
|
53
|
|
|
|
2,015
|
|
|
Total debt securities
|
|
|
7,440
|
|
|
|
39,200
|
|
|
|
9,011
|
|
|
|
55,651
|
|
|
|
7,026
|
|
|
|
33,526
|
|
|
|
9,886
|
|
|
|
50,438
|
|
|
Corporate stocks and other
|
|
|
266
|
|
|
|
120
|
|
|
|
13
|
|
|
|
399
|
|
|
|
230
|
|
|
|
83
|
|
|
|
47
|
|
|
|
360
|
|
|
Total securities available for sale
|
|
|
7,706
|
|
|
|
39,320
|
|
|
|
9,024
|
|
|
|
56,050
|
|
|
|
7,256
|
|
|
|
33,609
|
|
|
|
9,933
|
|
|
|
50,798
|
|
|
Financial derivatives (a) (b)
|
|
|
|
|
|
|
|
|
|
|
|
|
|
|
|
|
|
|
|
|
|
|
|
|
|
|
|
|
|
|
|
|
|
Interest rate contracts
|
|
|
|
|
|
|
7,564
|
|
|
|
113
|
|
|
|
7,677
|
|
|
|
25
|
|
|
|
3,630
|
|
|
|
47
|
|
|
|
3,702
|
|
|
Other contracts
|
|
|
|
|
|
|
172
|
|
|
|
7
|
|
|
|
179
|
|
|
|
2
|
|
|
|
209
|
|
|
|
3
|
|
|
|
214
|
|
|
Total financial derivatives
|
|
|
|
|
|
|
7,736
|
|
|
|
120
|
|
|
|
7,856
|
|
|
|
27
|
|
|
|
3,839
|
|
|
|
50
|
|
|
|
3,916
|
|
|
Residential mortgage loans held for sale (c)
|
|
|
|
|
|
|
1,777
|
|
|
|
|
|
|
|
1,777
|
|
|
|
|
|
|
|
1,012
|
|
|
|
|
|
|
|
1,012
|
|
|
Trading securities (d)
|
|
|
|
|
|
|
|
|
|
|
|
|
|
|
|
|
|
|
|
|
|
|
|
|
|
|
|
|
|
|
|
|
|
Debt (e)
|
|
|
523
|
|
|
|
319
|
|
|
|
71
|
|
|
|
913
|
|
|
|
1,690
|
|
|
|
299
|
|
|
|
89
|
|
|
|
2,078
|
|
|
Equity
|
|
|
42
|
|
|
|
|
|
|
|
|
|
|
|
42
|
|
|
|
46
|
|
|
|
|
|
|
|
|
|
|
|
46
|
|
|
Total trading securities
|
|
|
565
|
|
|
|
319
|
|
|
|
71
|
|
|
|
955
|
|
|
|
1,736
|
|
|
|
299
|
|
|
|
89
|
|
|
|
2,124
|
|
|
Residential mortgage servicing rights (f)
|
|
|
|
|
|
|
|
|
|
|
788
|
|
|
|
788
|
|
|
|
|
|
|
|
|
|
|
|
1,332
|
|
|
|
1,332
|
|
|
Commercial mortgage loans held for sale (c)
|
|
|
|
|
|
|
|
|
|
|
1,028
|
|
|
|
1,028
|
|
|
|
|
|
|
|
|
|
|
|
1,050
|
|
|
|
1,050
|
|
|
Equity investments
|
|
|
|
|
|
|
|
|
|
|
|
|
|
|
|
|
|
|
|
|
|
|
|
|
|
|
|
|
|
|
|
|
|
Direct investments
|
|
|
|
|
|
|
|
|
|
|
740
|
|
|
|
740
|
|
|
|
|
|
|
|
|
|
|
|
595
|
|
|
|
595
|
|
|
Indirect investments (g)
|
|
|
|
|
|
|
|
|
|
|
635
|
|
|
|
635
|
|
|
|
|
|
|
|
|
|
|
|
593
|
|
|
|
593
|
|
|
Total equity investments
|
|
|
|
|
|
|
|
|
|
|
1,375
|
|
|
|
1,375
|
|
|
|
|
|
|
|
|
|
|
|
1,188
|
|
|
|
1,188
|
|
|
Customer resale agreements (h)
|
|
|
|
|
|
|
921
|
|
|
|
|
|
|
|
921
|
|
|
|
|
|
|
|
990
|
|
|
|
|
|
|
|
990
|
|
|
Loans (i)
|
|
|
|
|
|
|
90
|
|
|
|
|
|
|
|
90
|
|
|
|
|
|
|
|
107
|
|
|
|
|
|
|
|
107
|
|
|
Other assets
|
|
|
|
|
|
|
|
|
|
|
|
|
|
|
|
|
|
|
|
|
|
|
|
|
|
|
|
|
|
|
|
|
|
BlackRock Series C Preferred Stock (j)
|
|
|
|
|
|
|
|
|
|
|
354
|
|
|
|
354
|
|
|
|
|
|
|
|
|
|
|
|
486
|
|
|
|
486
|
|
|
Other
|
|
|
|
|
|
|
419
|
|
|
|
7
|
|
|
|
426
|
|
|
|
|
|
|
|
207
|
|
|
|
23
|
|
|
|
230
|
|
|
Total other assets
|
|
|
|
|
|
|
419
|
|
|
|
361
|
|
|
|
780
|
|
|
|
|
|
|
|
207
|
|
|
|
509
|
|
|
|
716
|
|
|
Total assets
|
|
$
|
8,271
|
|
|
$
|
50,582
|
|
|
$
|
12,767
|
|
|
$
|
71,620
|
|
|
$
|
9,019
|
|
|
$
|
40,063
|
|
|
$
|
14,151
|
|
|
$
|
63,233
|
|
|
Liabilities
|
|
|
|
|
|
|
|
|
|
|
|
|
|
|
|
|
|
|
|
|
|
|
|
|
|
|
|
|
|
|
|
|
|
Financial derivatives (b) (k)
|
|
|
|
|
|
|
|
|
|
|
|
|
|
|
|
|
|
|
|
|
|
|
|
|
|
|
|
|
|
|
|
|
|
Interest rate contracts
|
|
|
|
|
|
$
|
5,687
|
|
|
$
|
42
|
|
|
$
|
5,729
|
|
|
$
|
2
|
|
|
$
|
3,185
|
|
|
$
|
18
|
|
|
$
|
3,205
|
|
|
BlackRock LTIP
|
|
|
|
|
|
|
|
|
|
|
354
|
|
|
|
354
|
|
|
|
|
|
|
|
|
|
|
|
486
|
|
|
|
486
|
|
|
Other contracts
|
|
|
|
|
|
|
143
|
|
|
|
7
|
|
|
|
150
|
|
|
|
|
|
|
|
146
|
|
|
|
2
|
|
|
|
148
|
|
|
Total financial derivatives
|
|
|
|
|
|
|
5,830
|
|
|
|
403
|
|
|
|
6,233
|
|
|
|
2
|
|
|
|
3,331
|
|
|
|
506
|
|
|
|
3,839
|
|
|
Trading securities sold short (l)
|
|
|
|
|
|
|
|
|
|
|
|
|
|
|
|
|
|
|
|
|
|
|
|
|
|
|
|
|
|
|
|
|
|
Debt (e)
|
|
$
|
861
|
|
|
|
11
|
|
|
|
|
|
|
|
872
|
|
|
|
1,288
|
|
|
|
42
|
|
|
|
|
|
|
|
1,330
|
|
|
Equity
|
|
|
|
|
|
|
|
|
|
|
|
|
|
|
|
|
|
|
14
|
|
|
|
|
|
|
|
|
|
|
|
14
|
|
|
Total trading securities sold short
|
|
|
861
|
|
|
|
11
|
|
|
|
|
|
|
|
872
|
|
|
|
1,302
|
|
|
|
42
|
|
|
|
|
|
|
|
1,344
|
|
|
Other liabilities
|
|
|
|
|
|
|
8
|
|
|
|
|
|
|
|
8
|
|
|
|
|
|
|
|
6
|
|
|
|
|
|
|
|
6
|
|
|
Total liabilities
|
|
$
|
861
|
|
|
$
|
5,849
|
|
|
$
|
403
|
|
|
$
|
7,113
|
|
|
$
|
1,304
|
|
|
$
|
3,379
|
|
|
$
|
506
|
|
|
$
|
5,189
|
|
|
(a)
|
Included in Other assets on our Consolidated Balance Sheet.
|
|
(b)
|
Amounts at September 30, 2010 and December 31, 2009 are presented gross and are not reduced by the impact of legally enforceable master netting agreements
that allow PNC to net positive and negative positions and cash collateral held or placed with the same counterparty. At September 30, 2010 and December 31, 2009, respectively, the net asset amounts were $2.446 billion and $2.047 billion
and the net liability amounts were $1.022 billion and $1.733 billion.
|
|
(c)
|
Included in Loans held for sale on our Consolidated Balance Sheet. PNC has elected the fair value option for certain commercial and residential mortgage loans held for
sale.
|
80
|
(d)
|
Fair value includes net unrealized losses of $4 million at September 30, 2010 and net unrealized gains of $9 million at December 31, 2009.
|
|
(e)
|
Comprised primarily of US Treasury and government agencies securities.
|
|
(f)
|
Included in Other intangible assets on our Consolidated Balance Sheet.
|
|
(g)
|
The indirect equity funds are not redeemable, but PNC receives distributions over the life of the partnership from liquidation of the underlying investments by the
investee.
|
|
(h)
|
Included in Federal funds sold and resale agreements on our Consolidated Balance Sheet. PNC has elected the fair value option for these items.
|
|
(i)
|
Included in Loans on our Consolidated Balance Sheet. PNC has elected the fair value option for residential mortgage loans originated for sale. Certain of these loans
have been subsequently reclassified into portfolio loans.
|
|
(j)
|
PNC has elected the fair value option for these shares.
|
|
(k)
|
Included in Other liabilities on our Consolidated Balance Sheet.
|
|
(l)
|
Included in Other borrowed funds on our Consolidated Balance Sheet.
|
Reconciliations of assets and liabilities measured at fair value on a recurring basis using Level 3 inputs for the three months and nine months ended September 30, 2010 and 2009 follow.
Three Months Ended September 30, 2010
|
|
|
|
|
|
|
|
|
|
|
|
|
|
|
|
|
|
|
|
|
|
|
|
|
|
|
|
|
|
|
|
Total realized / unrealized
gains or losses (a)
|
|
|
|
|
|
|
|
|
(*) Attributable to
unrealized
gains
or losses
related to assets
and liabilities held at
September 30,
2010
|
|
|
Level 3 Instruments Only
In millions
|
|
June 30,
2010
|
|
|
Included in
earnings (*)
|
|
|
Included in
other
comprehensive
income
|
|
|
Purchases,
issuances, and
settlements,
net
|
|
|
September 30,
2010 (d)
|
|
|
|
Assets
|
|
|
|
|
|
|
|
|
|
|
|
|
|
|
|
|
|
|
|
|
|
|
|
|
|
Securities available for sale
|
|
|
|
|
|
|
|
|
|
|
|
|
|
|
|
|
|
|
|
|
|
|
|
|
|
Residential mortgage- backed non-agency
|
|
$
|
7,635
|
|
|
$
|
(57
|
)
|
|
$
|
(90
|
)
|
|
$
|
93
|
|
|
$
|
7,581
|
|
|
$
|
(57
|
)
|
|
Asset-backed
|
|
|
1,150
|
|
|
|
(14
|
)
|
|
|
18
|
|
|
|
(29
|
)
|
|
|
1,125
|
|
|
|
(14
|
)
|
|
State and municipal
|
|
|
237
|
|
|
|
|
|
|
|
(4
|
)
|
|
|
|
|
|
|
233
|
|
|
|
|
|
|
Other debt
|
|
|
82
|
|
|
|
|
|
|
|
2
|
|
|
|
(12
|
)
|
|
|
72
|
|
|
|
|
|
|
Corporate stocks and other
|
|
|
47
|
|
|
|
|
|
|
|
|
|
|
|
(34
|
)
|
|
|
13
|
|
|
|
|
|
|
Total securities available for sale
|
|
|
9,151
|
|
|
|
(71
|
)
|
|
|
(74
|
)
|
|
|
18
|
|
|
|
9,024
|
|
|
|
(71
|
)
|
|
Financial derivatives
|
|
|
85
|
|
|
|
45
|
|
|
|
|
|
|
|
(10
|
)
|
|
|
120
|
|
|
|
42
|
|
|
Trading securities – Debt
|
|
|
73
|
|
|
|
1
|
|
|
|
|
|
|
|
(3
|
)
|
|
|
71
|
|
|
|
|
|
|
Residential mortgage servicing rights
|
|
|
963
|
|
|
|
(149
|
)
|
|
|
|
|
|
|
(26
|
)
|
|
|
788
|
|
|
|
(153
|
)
|
|
Commercial mortgage loans held for sale
|
|
|
1,036
|
|
|
|
11
|
|
|
|
|
|
|
|
(19
|
)
|
|
|
1,028
|
|
|
|
17
|
|
|
Equity investments
|
|
|
|
|
|
|
|
|
|
|
|
|
|
|
|
|
|
|
|
|
|
|
|
|
|
Direct investments
|
|
|
650
|
|
|
|
47
|
|
|
|
|
|
|
|
43
|
|
|
|
740
|
|
|
|
42
|
|
|
Indirect investments
|
|
|
618
|
|
|
|
26
|
|
|
|
|
|
|
|
(9
|
)
|
|
|
635
|
|
|
|
22
|
|
|
Total equity investments
|
|
|
1,268
|
|
|
|
73
|
|
|
|
|
|
|
|
34
|
|
|
|
1,375
|
|
|
|
64
|
|
|
Other assets
|
|
|
|
|
|
|
|
|
|
|
|
|
|
|
|
|
|
|
|
|
|
|
|
|
|
BlackRock Series C Preferred Stock
|
|
|
298
|
|
|
|
56
|
|
|
|
|
|
|
|
|
|
|
|
354
|
|
|
|
56
|
|
|
Other
|
|
|
7
|
|
|
|
|
|
|
|
|
|
|
|
|
|
|
|
7
|
|
|
|
|
|
|
Total other assets
|
|
|
305
|
|
|
|
56
|
|
|
|
|
|
|
|
|
|
|
|
361
|
|
|
|
56
|
|
|
Total assets
|
|
$
|
12,881
|
|
|
$
|
(34
|
)
|
|
$
|
(74
|
)
|
|
$
|
(6
|
)
|
|
$
|
12,767
|
|
|
$
|
(45
|
)
|
|
Total liabilities (c)
|
|
$
|
355
|
|
|
$
|
52
|
|
|
|
|
|
|
$
|
(4
|
)
|
|
$
|
403
|
|
|
$
|
50
|
|
81
Three Months Ended
September 30, 2009
|
|
|
|
|
|
|
|
|
|
|
|
|
|
|
|
|
|
|
|
|
|
|
|
|
|
|
|
|
|
|
|
|
|
|
|
Total realized / unrealized
gains or losses (a)
|
|
|
|
|
|
|
|
|
|
|
|
(*) Attributable to
unrealized gains
or losses
related to
assets
and liabilities held
at September 30,
2009
|
|
|
Level 3 Instruments Only
In millions
|
|
June 30,
2009
|
|
|
Included in
earnings (*)
|
|
|
Included in
other
comprehensive
income
|
|
|
Purchases,
issuances, and
settlements,
net
|
|
|
Transfers
into
Level 3,
net (b)
|
|
|
September 30,
2009
|
|
|
|
Assets
|
|
|
|
|
|
|
|
|
|
|
|
|
|
|
|
|
|
|
|
|
|
|
|
|
|
|
|
|
|
Securities available for sale
|
|
|
|
|
|
|
|
|
|
|
|
|
|
|
|
|
|
|
|
|
|
|
|
|
|
|
|
|
|
Residential mortgage-backed agency
|
|
$
|
5
|
|
|
|
|
|
|
|
|
|
|
|
|
|
|
|
|
|
|
$
|
5
|
|
|
|
|
|
|
Residential mortgage-backed non-agency
|
|
|
9,014
|
|
|
$
|
(92
|
)
|
|
$
|
256
|
|
|
$
|
(498
|
)
|
|
$
|
28
|
|
|
|
8,708
|
|
|
$
|
(92
|
)
|
|
Commercial mortgage-backed non-agency
|
|
|
3,658
|
|
|
|
|
|
|
|
302
|
|
|
|
(211
|
)
|
|
|
2
|
|
|
|
3,751
|
|
|
|
|
|
|
Asset-backed
|
|
|
1,212
|
|
|
|
(34
|
)
|
|
|
66
|
|
|
|
(32
|
)
|
|
|
|
|
|
|
1,212
|
|
|
|
(34
|
)
|
|
State and municipal
|
|
|
276
|
|
|
|
|
|
|
|
(2
|
)
|
|
|
(11
|
)
|
|
|
|
|
|
|
263
|
|
|
|
|
|
|
Other debt
|
|
|
53
|
|
|
|
(3
|
)
|
|
|
3
|
|
|
|
(2
|
)
|
|
|
|
|
|
|
51
|
|
|
|
(3
|
)
|
|
Corporate stocks and other
|
|
|
50
|
|
|
|
|
|
|
|
|
|
|
|
(2
|
)
|
|
|
|
|
|
|
48
|
|
|
|
|
|
|
Total securities available for sale
|
|
|
14,268
|
|
|
|
(129
|
)
|
|
|
625
|
|
|
|
(756
|
)
|
|
|
30
|
|
|
|
14,038
|
|
|
|
(129
|
)
|
|
Financial derivatives
|
|
|
125
|
|
|
|
29
|
|
|
|
|
|
|
|
(46
|
)
|
|
|
(24
|
)
|
|
|
84
|
|
|
|
30
|
|
|
Trading securities
|
|
|
|
|
|
|
|
|
|
|
|
|
|
|
|
|
|
|
|
|
|
|
|
|
|
|
|
|
|
Debt
|
|
|
97
|
|
|
|
3
|
|
|
|
|
|
|
|
(14
|
)
|
|
|
|
|
|
|
86
|
|
|
|
3
|
|
|
Equity
|
|
|
29
|
|
|
|
1
|
|
|
|
|
|
|
|
(12
|
)
|
|
|
(6
|
)
|
|
|
12
|
|
|
|
1
|
|
|
Total trading securities
|
|
|
126
|
|
|
|
4
|
|
|
|
|
|
|
|
(26
|
)
|
|
|
(6
|
)
|
|
|
98
|
|
|
|
4
|
|
|
Residential mortgage servicing rights
|
|
|
1,459
|
|
|
|
(176
|
)
|
|
|
|
|
|
|
(1
|
)
|
|
|
|
|
|
|
1,282
|
|
|
|
(179
|
)
|
|
Commercial mortgage loans held for sale
|
|
|
1,179
|
|
|
|
30
|
|
|
|
|
|
|
|
(88
|
)
|
|
|
|
|
|
|
1,121
|
|
|
|
30
|
|
|
Equity investments
|
|
|
1,160
|
|
|
|
(1
|
)
|
|
|
|
|
|
|
1
|
|
|
|
|
|
|
|
1,160
|
|
|
|
(5
|
)
|
|
Other assets
|
|
|
|
|
|
|
|
|
|
|
|
|
|
|
|
|
|
|
|
|
|
|
|
|
|
|
|
|
|
BlackRock Series C Preferred Stock
|
|
|
367
|
|
|
|
87
|
|
|
|
|
|
|
|
|
|
|
|
|
|
|
|
454
|
|
|
|
87
|
|
|
Other
|
|
|
38
|
|
|
|
|
|
|
|
9
|
|
|
|
(5
|
)
|
|
|
|
|
|
|
42
|
|
|
|
|
|
|
Total other assets
|
|
|
405
|
|
|
|
87
|
|
|
|
9
|
|
|
|
(5
|
)
|
|
|
|
|
|
|
496
|
|
|
|
87
|
|
|
Total assets
|
|
$
|
18,722
|
|
|
$
|
(156
|
)
|
|
$
|
634
|
|
|
$
|
(921
|
)
|
|
|
|
|
|
$
|
18,279
|
|
|
$
|
(162
|
)
|
|
Total liabilities (c)
|
|
$
|
414
|
|
|
$
|
101
|
|
|
|
|
|
|
$
|
(19
|
)
|
|
$
|
(1
|
)
|
|
$
|
495
|
|
|
$
|
99
|
|
|
(a)
|
Losses for assets are bracketed while losses for liabilities are not.
|
|
(b)
|
PNC’s policy is to recognize transfers in and transfers out as of the end of the reporting period.
|
|
(c)
|
Financial derivatives.
|
|
(d)
|
There were no transfers into or out of Level 3 for the three months ended September 30, 2010.
|
82
Nine Months Ended
September 30, 2010
|
|
|
|
|
|
|
|
|
|
|
|
|
|
|
|
|
|
|
|
|
|
|
|
|
|
|
|
|
|
|
|
|
|
|
Level 3 Instruments Only
In millions
|
|
December 31,
2009
|
|
|
Total realized / unrealized
gains or losses (a)
|
|
|
Purchases,
issuances, and
settlements,
net
|
|
|
Transfers
into
Level 3 (b)
|
|
|
Transfers
out
of
Level 3 (b)
|
|
|
September 30,
2010
|
|
|
(*) Attributable
to unrealized
gains or losses
related to
assets
and
liabilities
held at
September 30,
2010
|
|
|
|
|
Included in
earnings (*)
|
|
|
Included in
other
comprehensive
income
|
|
|
|
|
|
|
|
Assets
|
|
|
|
|
|
|
|
|
|
|
|
|
|
|
|
|
|
|
|
|
|
|
|
|
|
|
|
|
|
|
|
|
|
Securities available for sale
|
|
|
|
|
|
|
|
|
|
|
|
|
|
|
|
|
|
|
|
|
|
|
|
|
|
|
|
|
|
|
|
|
|
Residential mortgage-backed agency
|
|
$
|
5
|
|
|
|
|
|
|
|
|
|
|
$
|
(5
|
)
|
|
|
|
|
|
|
|
|
|
|
|
|
|
|
|
|
|
Residential mortgage-backed non-agency
|
|
|
8,302
|
|
|
$
|
(239
|
)
|
|
$
|
(110
|
)
|
|
|
(370
|
)
|
|
|
|
|
|
$
|
(2
|
)
|
|
$
|
7,581
|
|
|
$
|
(211
|
)
|
|
Commercial mortgage-backed non-agency
|
|
|
6
|
|
|
|
|
|
|
|
|
|
|
|
|
|
|
$
|
2
|
|
|
|
(8
|
)
|
|
|
|
|
|
|
|
|
|
Asset-backed
|
|
|
1,254
|
|
|
|
(67
|
)
|
|
|
50
|
|
|
|
(112
|
)
|
|
|
|
|
|
|
|
|
|
|
1,125
|
|
|
|
(67
|
)
|
|
State and municipal
|
|
|
266
|
|
|
|
5
|
|
|
|
(21
|
)
|
|
|
(18
|
)
|
|
|
1
|
|
|
|
|
|
|
|
233
|
|
|
|
|
|
|
Other debt
|
|
|
53
|
|
|
|
|
|
|
|
6
|
|
|
|
(16
|
)
|
|
|
29
|
|
|
|
|
|
|
|
72
|
|
|
|
|
|
|
Corporate stocks and other
|
|
|
47
|
|
|
|
|
|
|
|
(1
|
)
|
|
|
(33
|
)
|
|
|
|
|
|
|
|
|
|
|
13
|
|
|
|
|
|
|
Total securities available for sale
|
|
|
9,933
|
|
|
|
(301
|
)
|
|
|
(76
|
)
|
|
|
(554
|
)
|
|
|
32
|
|
|
|
(10
|
)
|
|
|
9,024
|
|
|
|
(278
|
)
|
|
Financial derivatives
|
|
|
50
|
|
|
|
87
|
|
|
|
|
|
|
|
(17
|
)
|
|
|
|
|
|
|
|
|
|
|
120
|
|
|
|
86
|
|
|
Trading securities – Debt
|
|
|
89
|
|
|
|
(2
|
)
|
|
|
|
|
|
|
(16
|
)
|
|
|
|
|
|
|
|
|
|
|
71
|
|
|
|
(4
|
)
|
|
Residential mortgage servicing rights
|
|
|
1,332
|
|
|
|
(472
|
)
|
|
|
|
|
|
|
(72
|
)
|
|
|
|
|
|
|
|
|
|
|
788
|
|
|
|
(464
|
)
|
|
Commercial mortgage loans held for sale
|
|
|
1,050
|
|
|
|
33
|
|
|
|
|
|
|
|
(55
|
)
|
|
|
|
|
|
|
|
|
|
|
1,028
|
|
|
|
42
|
|
|
Equity investments
|
|
|
|
|
|
|
|
|
|
|
|
|
|
|
|
|
|
|
|
|
|
|
|
|
|
|
|
|
|
|
|
|
|
Direct investments
|
|
|
595
|
|
|
|
135
|
|
|
|
|
|
|
|
10
|
|
|
|
|
|
|
|
|
|
|
|
740
|
|
|
|
112
|
|
|
Indirect investments
|
|
|
593
|
|
|
|
67
|
|
|
|
|
|
|
|
(25
|
)
|
|
|
|
|
|
|
|
|
|
|
635
|
|
|
|
54
|
|
|
Total equity investments
|
|
|
1,188
|
|
|
|
202
|
|
|
|
|
|
|
|
(15
|
)
|
|
|
|
|
|
|
|
|
|
|
1,375
|
|
|
|
166
|
|
|
Other assets
|
|
|
|
|
|
|
|
|
|
|
|
|
|
|
|
|
|
|
|
|
|
|
|
|
|
|
|
|
|
|
|
|
|
BlackRock Series C Preferred Stock
|
|
|
486
|
|
|
|
(128
|
)
|
|
|
|
|
|
|
(4
|
)
|
|
|
|
|
|
|
|
|
|
|
354
|
|
|
|
(128
|
)
|
|
Other
|
|
|
23
|
|
|
|
|
|
|
|
(4
|
)
|
|
|
(12
|
)
|
|
|
|
|
|
|
|
|
|
|
7
|
|
|
|
|
|
|
Total other assets
|
|
|
509
|
|
|
|
(128
|
)
|
|
|
(4
|
)
|
|
|
(16
|
)
|
|
|
|
|
|
|
|
|
|
|
361
|
|
|
|
(128
|
)
|
|
Total assets
|
|
$
|
14,151
|
|
|
$
|
(581
|
)
|
|
$
|
(80
|
)
|
|
$
|
(745
|
)
|
|
$
|
32
|
|
|
$
|
(10
|
)
|
|
$
|
12,767
|
|
|
$
|
(580
|
)
|
|
Total liabilities (c)
|
|
$
|
506
|
|
|
$
|
(121
|
)
|
|
|
|
|
|
$
|
17
|
|
|
$
|
1
|
|
|
|
|
|
|
$
|
403
|
|
|
$
|
(122
|
)
|
83
Nine Months Ended
September 30, 2009
|
|
|
|
|
|
|
|
|
|
|
|
|
|
|
|
|
|
|
|
|
|
|
|
|
|
|
|
|
|
|
|
|
|
|
|
|
|
|
|
|
|
|
|
|
|
|
|
|
|
Total realized / unrealized
gains or losses (a)
|
|
|
|
|
|
|
|
|
|
|
|
(*) Attributable
to unrealized
gains or losses
related to
assets
and
liabilities
held at
September 30,
2009
|
|
|
Level 3 Instruments Only
In millions
|
|
Dec. 31,
2008
|
|
|
National
City
Acquisition
|
|
|
Balance,
January 1,
2009
|
|
|
Included in
earnings (*)
|
|
|
Included in
other
comprehensive
income
|
|
|
Purchases,
issuances,
and
settlements,
net
|
|
|
Transfers
into Level 3,
net (b)
|
|
|
September 30,
2009
|
|
|
|
Assets
|
|
|
|
|
|
|
|
|
|
|
|
|
|
|
|
|
|
|
|
|
|
|
|
|
|
|
|
|
|
|
|
|
|
|
|
|
|
Securities available for sale
|
|
|
|
|
|
|
|
|
|
|
|
|
|
|
|
|
|
|
|
|
|
|
|
|
|
|
|
|
|
|
|
|
|
|
|
|
|
Residential mortgage- backed agency
|
|
|
|
|
|
$
|
7
|
|
|
$
|
7
|
|
|
|
|
|
|
$
|
(2
|
)
|
|
|
|
|
|
|
|
|
|
$
|
5
|
|
|
|
|
|
|
Residential mortgage-backed non-agency
|
|
$
|
3,304
|
|
|
|
899
|
|
|
|
4,203
|
|
|
$
|
(340
|
)
|
|
|
839
|
|
|
$
|
(713
|
)
|
|
$
|
4,719
|
|
|
|
8,708
|
|
|
$
|
(340
|
)
|
|
Commercial mortgage-backed non-agency
|
|
|
337
|
|
|
|
|
|
|
|
337
|
|
|
|
(6
|
)
|
|
|
627
|
|
|
|
(255
|
)
|
|
|
3,048
|
|
|
|
3,751
|
|
|
|
(6
|
)
|
|
Asset-backed
|
|
|
833
|
|
|
|
59
|
|
|
|
892
|
|
|
|
(68
|
)
|
|
|
(35
|
)
|
|
|
(44
|
)
|
|
|
467
|
|
|
|
1,212
|
|
|
|
(68
|
)
|
|
State and municipal
|
|
|
271
|
|
|
|
50
|
|
|
|
321
|
|
|
|
|
|
|
|
1
|
|
|
|
(33
|
)
|
|
|
(26
|
)
|
|
|
263
|
|
|
|
|
|
|
Other debt
|
|
|
34
|
|
|
|
48
|
|
|
|
82
|
|
|
|
(6
|
)
|
|
|
|
|
|
|
(25
|
)
|
|
|
|
|
|
|
51
|
|
|
|
(6
|
)
|
|
Corporate stocks and other
|
|
|
58
|
|
|
|
|
|
|
|
58
|
|
|
|
|
|
|
|
(6
|
)
|
|
|
(4
|
)
|
|
|
|
|
|
|
48
|
|
|
|
|
|
|
Total securities available for sale
|
|
|
4,837
|
|
|
|
1,063
|
|
|
|
5,900
|
|
|
|
(420
|
)
|
|
|
1,424
|
|
|
|
(1,074
|
)
|
|
|
8,208
|
|
|
|
14,038
|
|
|
|
(420
|
)
|
|
Financial derivatives
|
|
|
125
|
|
|
|
35
|
|
|
|
160
|
|
|
|
125
|
|
|
|
|
|
|
|
(181
|
)
|
|
|
(20
|
)
|
|
|
84
|
|
|
|
28
|
|
|
Trading securities
|
|
|
|
|
|
|
|
|
|
|
|
|
|
|
|
|
|
|
|
|
|
|
|
|
|
|
|
|
|
|
|
|
|
|
|
|
|
Debt
|
|
|
56
|
|
|
|
26
|
|
|
|
82
|
|
|
|
1
|
|
|
|
|
|
|
|
8
|
|
|
|
(5
|
)
|
|
|
86
|
|
|
|
6
|
|
|
Equity
|
|
|
17
|
|
|
|
6
|
|
|
|
23
|
|
|
|
2
|
|
|
|
|
|
|
|
(9
|
)
|
|
|
(4
|
)
|
|
|
12
|
|
|
|
1
|
|
|
Total trading securities
|
|
|
73
|
|
|
|
32
|
|
|
|
105
|
|
|
|
3
|
|
|
|
|
|
|
|
(1
|
)
|
|
|
(9
|
)
|
|
|
98
|
|
|
|
7
|
|
|
Residential mortgage servicing rights
|
|
|
6
|
|
|
|
1,019
|
|
|
|
1,025
|
|
|
|
243
|
|
|
|
|
|
|
|
14
|
|
|
|
|
|
|
|
1,282
|
|
|
|
207
|
|
|
Commercial mortgage loans held for sale
|
|
|
1,400
|
|
|
|
1
|
|
|
|
1,401
|
|
|
|
(48
|
)
|
|
|
|
|
|
|
(232
|
)
|
|
|
|
|
|
|
1,121
|
|
|
|
(39
|
)
|
|
Equity investments
|
|
|
571
|
|
|
|
610
|
|
|
|
1,181
|
|
|
|
(80
|
)
|
|
|
|
|
|
|
60
|
|
|
|
(1
|
)
|
|
|
1,160
|
|
|
|
(88
|
)
|
|
Other assets
|
|
|
|
|
|
|
|
|
|
|
|
|
|
|
|
|
|
|
|
|
|
|
|
|
|
|
|
|
|
|
|
|
|
|
|
|
|
BlackRock Series C Preferred Stock
|
|
|
|
|
|
|
|
|
|
|
|
|
|
|
243
|
|
|
|
|
|
|
|
211
|
|
|
|
|
|
|
|
454
|
|
|
|
243
|
|
|
Other
|
|
|
|
|
|
|
40
|
|
|
|
40
|
|
|
|
(5
|
)
|
|
|
(3
|
)
|
|
|
10
|
|
|
|
|
|
|
|
42
|
|
|
|
(5
|
)
|
|
Total other assets
|
|
|
|
|
|
|
40
|
|
|
|
40
|
|
|
|
238
|
|
|
|
(3
|
)
|
|
|
221
|
|
|
|
|
|
|
|
496
|
|
|
|
238
|
|
|
Total assets
|
|
$
|
7,012
|
|
|
$
|
2,800
|
|
|
$
|
9,812
|
|
|
$
|
61
|
|
|
$
|
1,421
|
|
|
$
|
(1,193
|
)
|
|
$
|
8,178
|
|
|
$
|
18,279
|
|
|
$
|
(67
|
)
|
|
Total liabilities (c)
|
|
$
|
22
|
|
|
$
|
16
|
|
|
$
|
38
|
|
|
$
|
241
|
|
|
|
|
|
|
$
|
217
|
|
|
$
|
(1
|
)
|
|
$
|
495
|
|
|
$
|
242
|
|
|
(a)
|
Losses for assets are bracketed while losses for liabilities are not.
|
|
(b)
|
PNC’s policy is to recognize transfers in and transfers out as of the end of the reporting period.
|
|
(c)
|
Financial derivatives.
|
Net losses (realized and unrealized) included in earnings relating to Level 3 assets and liabilities were
$460 million for the first nine months of 2010 compared with $180 million for the first nine months of 2009. The net losses (realized and unrealized) for the third quarter of 2010 were $86 million compared with $257 million for the third quarter of
2009. These amounts included net unrealized losses of $458 million and $95 million, respectively, for the 2010 periods. The comparable amounts for the 2009 periods were net unrealized losses of $309 million and $261 million, respectively. These
amounts were included in noninterest income on the Consolidated Income Statement.
During the first nine months of 2010, no material transfers
of assets or liabilities between the hierarchy levels occurred.
During the first nine months of 2009, securities transferred into Level 3
from Level 2 exceeded securities transferred out
by $8.2 billion. These primarily related to non-agency residential and commercial mortgage-backed securities where management determined that the volume and level of market activity for these
assets had significantly decreased. Other Level 3 assets include commercial mortgage loans held for sale, certain equity securities, auction rate securities, corporate debt securities, certain private-issuer asset-backed securities, private equity
investments, certain derivative instruments, residential mortgage servicing rights and other assets.
Interest income earned from trading
securities totaled $32 million for the first nine months of 2010 and $43 million for the first nine months of 2009. For the third quarter of 2010 and 2009, interest income related to trading securities totaled $7 million and $18 million,
respectively. These amounts are included in other interest income on the Consolidated Income Statement.
84
Nonrecurring Fair Value Changes
We may be required to measure certain other financial assets at fair value on a nonrecurring basis. These adjustments to fair value usually result from the application of lower-of-cost-or-fair value
accounting or write-downs of individual assets due to impairment. The amounts below for nonaccrual loans represent the carrying value of loans for which adjustments are primarily based on the appraised value of collateral or the net book value of
the collateral from the borrower’s most recent financial statements if no appraisal is available. If the net book value is utilized, loss given default (LGD) collateral recovery rates are employed, by collateral type, in calculating disposition
costs to arrive at an adjusted fair value. If an appraisal is outdated due to changed project or market conditions, values based on the LGD recovery rates are used pending receipt of an updated appraisal. The amounts below for loans held for sale
represent the carrying value of
loans for which adjustments are primarily based on the appraised value of collateral, which often results in significant management assumptions and input with respect to the determination of fair
value, or based on an observable market price. The fair value determination of the equity investment resulting in an impairment loss included below was based on observable market data for other comparable entities as adjusted for internal
assumptions and unobservable inputs. The amounts below for commercial mortgage servicing rights reflect an impairment of four strata at September 30, 2010 while no strata were impaired at December 31, 2009 and one stratum was impaired at
September 30, 2009. The fair value of commercial mortgage servicing rights is estimated by using an internal valuation model. The model calculates the present value of estimated future net servicing cash flows considering estimates of servicing
revenue and costs, discount rates and prepayment speeds.
Fair Value Measurements –
Nonrecurring (a)
|
|
|
|
|
|
|
|
|
|
|
|
|
|
|
|
|
|
|
|
|
|
|
|
|
|
|
|
|
Fair Value
|
|
|
Gains
(Losses)
Three months ended
|
|
|
Gains
(Losses)
Nine months ended
|
|
|
In millions
|
|
September 30
2010
|
|
|
December 31
2009
|
|
|
September 30
2010
|
|
|
September 30
2009
|
|
|
September 30
2010
|
|
|
September 30
2009
|
|
|
Assets
|
|
|
|
|
|
|
|
|
|
|
|
|
|
|
|
|
|
|
|
|
|
|
|
|
|
Nonaccrual loans
|
|
$
|
853
|
|
|
$
|
939
|
|
|
$
|
(2
|
)
|
|
$
|
(201
|
)
|
|
$
|
(6
|
)
|
|
$
|
(342
|
)
|
|
Loans held for sale
|
|
|
191
|
|
|
|
168
|
|
|
|
(1
|
)
|
|
|
1
|
|
|
|
(44
|
)
|
|
|
3
|
|
|
Equity investments (b)
|
|
|
21
|
|
|
|
154
|
|
|
|
(3
|
)
|
|
|
(4
|
)
|
|
|
(3
|
)
|
|
|
(55
|
)
|
|
Commercial mortgage servicing rights (c)
|
|
|
616
|
|
|
|
|
|
|
|
(81
|
)
|
|
|
|
|
|
|
(99
|
)
|
|
|
|
|
|
Other intangible assets
|
|
|
1
|
|
|
|
1
|
|
|
|
|
|
|
|
|
|
|
|
|
|
|
|
|
|
|
Foreclosed and other assets
|
|
|
211
|
|
|
|
108
|
|
|
|
(38
|
)
|
|
|
(17
|
)
|
|
|
(75
|
)
|
|
|
(41
|
)
|
|
Long-lived assets held for sale
|
|
|
24
|
|
|
|
30
|
|
|
|
(4
|
)
|
|
|
|
|
|
|
(20
|
)
|
|
|
1
|
|
|
Total assets
|
|
$
|
1,917
|
|
|
$
|
1,400
|
|
|
$
|
(129
|
)
|
|
$
|
(221
|
)
|
|
$
|
(247
|
)
|
|
$
|
(434
|
)
|
|
(a)
|
All Level 3 except $5 million in loans held for sale which were Level 2 at December 31, 2009.
|
|
(b)
|
Includes LIHTC and other equity investments.
|
|
(c)
|
Four strata at fair value at September 30, 2010 and no strata at fair value at December 31, 2009. During the first nine months of 2009, we recorded a $35
million recovery of previous impairment on commercial mortgage servicing rights. Refer to Note 9 Goodwill and Other Intangible Assets for additional information.
|
Fair Value Option
Refer to the Fair Value Measurement section of this Note 8 regarding the fair value of commercial mortgage loans held for sale, residential mortgage loans held for sale, customer resale agreements, and
BlackRock Series C Preferred Stock.
Commercial Mortgage Loans Held for Sale
Interest income on these loans is recorded as earned and reported on the Consolidated Income Statement in other interest income. The impact on earnings of offsetting economic hedges is not reflected in
these amounts. Changes in fair value due to instrument-specific credit risk for both the third quarter and first nine months of 2010 and the third quarter and first nine months of 2009 were not material.
Residential Mortgage Loans Held for Sale
Interest income on these loans is recorded as earned and reported on the Consolidated Income Statement in other interest income. Throughout 2010 and 2009, certain residential mortgage loans for which we
elected the fair value option were subsequently reclassified to portfolio loans. Changes in fair value due to instrument-specific credit risk for the third quarter and first nine months of 2010 and the third quarter and first nine months of 2009
were not material.
Customer Resale Agreements
Interest income on structured resale agreements is reported on the Consolidated Income Statement in other interest income. Changes in fair value due to instrument-specific credit risk for both the third
quarter and first nine months of 2010 and the third quarter and first nine months of 2009 were not material.
85
The changes in fair value included in
noninterest income for items for which we elected the fair value option follow.
Fair Value Option – Changes in Fair Value (a)
|
|
|
|
|
|
|
|
|
|
|
|
|
|
|
|
|
|
|
|
|
Gains
(Losses)
Three months ended
|
|
|
Gains
(Losses)
Nine months ended
|
|
|
In millions
|
|
September 30
2010
|
|
|
September 30
2009
|
|
|
September 30
2010
|
|
|
September 30
2009
|
|
|
Assets
|
|
|
|
|
|
|
|
|
|
|
|
|
|
|
|
|
|
Customer resale agreements
|
|
$
|
6
|
|
|
$
|
7
|
|
|
$
|
14
|
|
|
$
|
(18
|
)
|
|
Commercial mortgage loans held for sale
|
|
|
11
|
|
|
|
30
|
|
|
|
33
|
|
|
|
(48
|
)
|
|
Residential mortgage loans held for sale
|
|
|
80
|
|
|
|
126
|
|
|
|
220
|
|
|
|
374
|
|
|
Residential mortgage loans – portfolio
|
|
|
(1
|
)
|
|
|
1
|
|
|
|
2
|
|
|
|
(3
|
)
|
|
BlackRock Series C Preferred Stock
|
|
|
56
|
|
|
|
87
|
|
|
|
(128
|
)
|
|
|
243
|
|
|
(a)
|
The impact on earnings of offsetting hedged items or hedging instruments is not reflected in these amounts.
|
Fair values and aggregate unpaid principal balances of items for which we elected the fair value option follow.
Fair Value Option – Fair Value and Principal Balances
|
|
|
|
|
|
|
|
|
|
|
|
|
|
|
In millions
|
|
Fair Value
|
|
|
Aggregate Unpaid
Principal Balance
|
|
|
Difference
|
|
|
September 30, 2010
|
|
|
|
|
|
|
|
|
|
|
|
|
|
Customer resale agreements
|
|
$
|
921
|
|
|
$
|
845
|
|
|
$
|
76
|
|
|
Residential mortgage loans held for sale
|
|
|
|
|
|
|
|
|
|
|
|
|
|
Performing loans
|
|
|
1,744
|
|
|
|
1,728
|
|
|
|
16
|
|
|
Loans 90 days or more past due
|
|
|
31
|
|
|
|
40
|
|
|
|
(9
|
)
|
|
Nonaccrual loans
|
|
|
2
|
|
|
|
4
|
|
|
|
(2
|
)
|
|
Total
|
|
|
1,777
|
|
|
|
1,772
|
|
|
|
5
|
|
|
Commercial mortgage loans held for sale (a)
|
|
|
|
|
|
|
|
|
|
|
|
|
|
Performing loans
|
|
|
989
|
|
|
|
1,129
|
|
|
|
(140
|
)
|
|
Nonaccrual loans
|
|
|
39
|
|
|
|
61
|
|
|
|
(22
|
)
|
|
Total
|
|
|
1,028
|
|
|
|
1,190
|
|
|
|
(162
|
)
|
|
Residential mortgage loans – portfolio
|
|
|
|
|
|
|
|
|
|
|
|
|
|
Performing loans
|
|
|
31
|
|
|
|
35
|
|
|
|
(4
|
)
|
|
Loans 90 days or more past due
|
|
|
44
|
|
|
|
45
|
|
|
|
(1
|
)
|
|
Nonaccrual loans
|
|
|
15
|
|
|
|
28
|
|
|
|
(13
|
)
|
|
Total
|
|
$
|
90
|
|
|
$
|
108
|
|
|
$
|
(18
|
)
|
|
December 31, 2009
|
|
|
|
|
|
|
|
|
|
|
|
|
|
Customer resale agreements
|
|
$
|
990
|
|
|
$
|
925
|
|
|
$
|
65
|
|
|
Residential mortgage loans held for sale
|
|
|
|
|
|
|
|
|
|
|
|
|
|
Performing loans
|
|
|
971
|
|
|
|
977
|
|
|
|
(6
|
)
|
|
Loans 90 days or more past due
|
|
|
40
|
|
|
|
50
|
|
|
|
(10
|
)
|
|
Nonaccrual loans
|
|
|
1
|
|
|
|
9
|
|
|
|
(8
|
)
|
|
Total
|
|
|
1,012
|
|
|
|
1,036
|
|
|
|
(24
|
)
|
|
Commercial mortgage loans held for sale (a)
|
|
|
|
|
|
|
|
|
|
|
|
|
|
Performing loans
|
|
|
1,023
|
|
|
|
1,235
|
|
|
|
(212
|
)
|
|
Nonaccrual loans
|
|
|
27
|
|
|
|
41
|
|
|
|
(14
|
)
|
|
Total
|
|
|
1,050
|
|
|
|
1,276
|
|
|
|
(226
|
)
|
|
Residential mortgage loans – portfolio
|
|
|
|
|
|
|
|
|
|
|
|
|
|
Performing loans
|
|
|
25
|
|
|
|
27
|
|
|
|
(2
|
)
|
|
Loans 90 days or more past due
|
|
|
51
|
|
|
|
54
|
|
|
|
(3
|
)
|
|
Nonaccrual loans
|
|
|
12
|
|
|
|
23
|
|
|
|
(11
|
)
|
|
Total
|
|
$
|
88
|
|
|
$
|
104
|
|
|
$
|
(16
|
)
|
|
(a)
|
There were no loans 90 days or more past due within this category at September 30, 2010 or December 31, 2009.
|
86
A
DDITIONAL
F
AIR
V
ALUE
I
NFORMATION
R
ELATED
TO
F
INANCIAL
I
NSTRUMENTS
|
|
|
|
|
|
|
|
|
|
|
|
|
|
|
|
|
|
|
|
|
September 30, 2010
|
|
|
December 31, 2009
|
|
|
In millions
|
|
Carrying
Amount
|
|
|
Fair
Value
|
|
|
Carrying
Amount
|
|
|
Fair
Value
|
|
|
Assets
|
|
|
|
|
|
|
|
|
|
|
|
|
|
|
|
|
|
Cash and short-term assets
|
|
$
|
7,361
|
|
|
$
|
7,361
|
|
|
$
|
12,248
|
|
|
$
|
12,248
|
|
|
Trading securities
|
|
|
955
|
|
|
|
955
|
|
|
|
2,124
|
|
|
|
2,124
|
|
|
Investment securities
|
|
|
63,461
|
|
|
|
63,783
|
|
|
|
56,027
|
|
|
|
56,319
|
|
|
Loans held for sale
|
|
|
3,275
|
|
|
|
3,276
|
|
|
|
2,539
|
|
|
|
2,597
|
|
|
Net loans (excludes leases)
|
|
|
138,489
|
|
|
|
142,116
|
|
|
|
146,270
|
|
|
|
145,014
|
|
|
Other assets
|
|
|
4,599
|
|
|
|
4,599
|
|
|
|
4,883
|
|
|
|
4,883
|
|
|
Mortgage and other loan servicing rights
|
|
|
1,404
|
|
|
|
1,404
|
|
|
|
2,253
|
|
|
|
2,352
|
|
|
Financial derivatives
|
|
|
|
|
|
|
|
|
|
|
|
|
|
|
|
|
|
Designated as hedging instruments under GAAP
|
|
|
1,831
|
|
|
|
1,831
|
|
|
|
739
|
|
|
|
739
|
|
|
Not designated as hedging instruments under GAAP
|
|
|
6,025
|
|
|
|
6,025
|
|
|
|
3,177
|
|
|
|
3,177
|
|
|
|
|
|
|
|
|
Liabilities
|
|
|
|
|
|
|
|
|
|
|
|
|
|
|
|
|
|
Demand, savings and money market deposits
|
|
|
135,295
|
|
|
|
135,295
|
|
|
|
132,645
|
|
|
|
132,645
|
|
|
Time deposits
|
|
|
43,888
|
|
|
|
44,450
|
|
|
|
54,277
|
|
|
|
54,534
|
|
|
Borrowed funds
|
|
|
40,149
|
|
|
|
41,659
|
|
|
|
39,621
|
|
|
|
39,977
|
|
|
Financial derivatives
|
|
|
|
|
|
|
|
|
|
|
|
|
|
|
|
|
|
Designated as hedging instruments under GAAP
|
|
|
66
|
|
|
|
66
|
|
|
|
95
|
|
|
|
95
|
|
|
Not designated as hedging instruments under GAAP
|
|
|
6,167
|
|
|
|
6,167
|
|
|
|
3,744
|
|
|
|
3,744
|
|
|
Unfunded loan commitments and letters of credit
|
|
|
179
|
|
|
|
179
|
|
|
|
290
|
|
|
|
290
|
|
The aggregate fair values in the table above do not represent the total market value of PNC’s assets
and liabilities as the table excludes the following:
|
|
•
|
|
real and personal property,
|
|
|
•
|
|
loan customer relationships,
|
|
|
•
|
|
deposit customer intangibles,
|
|
|
•
|
|
retail branch networks,
|
|
|
•
|
|
fee-based businesses, such as asset management and brokerage, and
|
|
|
•
|
|
trademarks and brand names.
|
We used the following methods and assumptions to estimate fair value amounts for financial instruments.
G
ENERAL
For
short-term financial instruments realizable in three months or less, the carrying amount reported on our Consolidated Balance Sheet approximates fair value. Unless otherwise stated, the rates used in discounted cash flow analyses are based on market
yield curves.
C
ASH
A
ND
S
HORT
-T
ERM
A
SSETS
The carrying amounts reported on our Consolidated Balance Sheet for cash and short-term investments approximate fair values primarily due to their
short-term nature. For purposes of this disclosure only, short-term assets include the following:
|
|
•
|
|
interest-earning deposits with banks,
|
|
|
•
|
|
federal funds sold and resale agreements,
|
|
|
•
|
|
cash collateral (excluding cash collateral netted against derivative fair values),
|
|
|
•
|
|
customers’ acceptance liability, and
|
|
|
•
|
|
accrued interest receivable.
|
S
ECURITIES
Securities include both the investment securities
(comprised of available for sale and held to maturity securities) and trading portfolios. We use prices obtained from pricing services, dealer quotes or recent trades to determine the fair value of securities. For 57% of our positions, we use prices
obtained from pricing services provided by the Barclay’s Capital Index and Interactive Data Corp. (IDC). For 13% of our positions, we use prices obtained from the pricing services as the primary input into the valuation process. Barclay’s
Capital Index prices are set with reference to market activity for highly liquid assets such as agency mortgage-backed securities, and matrix pricing for other assets, such as CMBS and asset-backed securities. IDC primarily uses pricing models
considering adjustments for ratings, spreads, matrix pricing and prepayments for the instruments we value using this service, such as non-agency residential mortgage-backed securities, agency adjustable rate mortgage securities, agency CMOs and
municipal bonds. Dealer quotes received are typically non-binding and corroborated with other dealers’ quotes, by reviewing valuations of comparable instruments, or by comparison to internal valuations.
N
ET
L
OANS
A
ND
L
OANS
H
ELD
F
OR
S
ALE
Fair values are estimated based on the discounted value of expected net cash flows incorporating assumptions about prepayment rates,
net credit losses and servicing fees. For revolving home equity loans and commercial credit lines, this fair value does not include any amount for new loans or the related fees that will be generated from the existing customer
87
relationships. Non-accrual loans are valued at their estimated recovery value. Also refer to the Fair Value Measurement and Fair Value Option sections of this Note 8 regarding the fair value of
commercial and residential mortgage loans held for sale. Loans are presented net of the allowance for loan and lease losses and do not include future accretable discounts related to purchased impaired loans.
O
THER
A
SSETS
Other assets as shown in the accompanying table include the following:
|
|
•
|
|
noncertificated interest-only strips,
|
|
|
•
|
|
equity investments carried at cost and fair value, and
|
|
|
•
|
|
private equity investments carried at fair value.
|
Investments accounted for under the equity method, including our investment in BlackRock, are not included in the accompanying table.
The carrying amounts of private equity investments are recorded at fair value. The valuation procedures applied to direct investments include techniques such as multiples of adjusted earnings of the
entity, independent appraisals, anticipated financing and sales transactions with third parties, or the pricing used to value the entity in a recent financing transaction. We value indirect investments in private equity funds based on net asset
value as provided in the financial statements that we receive from their managers. Due to the time lag in our receipt of the financial information and based on a review of investments and valuation techniques applied, adjustments to the
manager-provided value are made when available recent investment portfolio company or market information indicates a significant change in value from that provided by the general partner.
Fair value of the noncertificated interest-only strips is estimated based on the discounted value of expected net cash flows. The aggregate carrying value of our equity investments carried at cost and
FHLB and FRB stock was $2.4 billion at September 30, 2010 and $2.6 billion as of December 31, 2009, both of which approximate fair value at each date.
M
ORTGAGE
A
ND
O
THER
L
OAN
S
ERVICING
A
SSETS
Fair value is based on the present value of the estimated future cash flows, incorporating assumptions as to prepayment speeds, discount rates, escrow balances, interest rates, cost to
service and other factors. We have controls in place intended to ensure that our fair values are appropriate. An independent model review group reviews our valuation models and validates them for
their intended use.
The key valuation assumptions for commercial and residential mortgage loan servicing assets at September 30, 2010
and December 31, 2009 are included in Note 9 Goodwill and Other Intangible Assets.
C
USTOMER
R
ESALE
A
GREEMENTS
Refer to the Fair Value Measurement section of this Note 8 regarding the fair value of customer resale
agreements.
D
EPOSITS
The carrying amounts of noninterest-bearing demand and interest-bearing money market and savings deposits approximate fair values. For time deposits, which include foreign deposits, fair values are
estimated based on the discounted value of expected net cash flows assuming current interest rates.
B
ORROWED
F
UNDS
The carrying amounts of Federal funds purchased, commercial paper, repurchase agreements, proprietary trading
short positions, cash collateral (excluding cash collateral netted against derivative fair values), other short-term borrowings, acceptances outstanding and accrued interest payable are considered to be their fair value because of their short-term
nature. For all other borrowed funds, fair values are estimated primarily based on dealer quotes.
U
NFUNDED
L
OAN
C
OMMITMENTS
A
ND
L
ETTERS
O
F
C
REDIT
The
fair value of unfunded loan commitments and letters of credit is our estimate of the cost to terminate them. For purposes of this disclosure, this fair value is the sum of the deferred fees currently recorded by us on these facilities and the
liability established on these facilities related to their creditworthiness.
F
INANCIAL
D
ERIVATIVES
For exchange-traded contracts, fair value is based on quoted market prices. For nonexchange-traded contracts, fair value is based on
dealer quotes, pricing models or quoted prices for instruments with similar characteristics. Amounts for financial derivatives are presented on a gross basis.
88
N
OTE
9 G
OODWILL
AND
O
THER
I
NTANGIBLE
A
SSETS
Changes in goodwill by business segment during the first nine months of 2010 follow:
Changes in Goodwill by Business Segment (a)
|
|
|
|
|
|
|
|
|
|
|
|
|
|
|
|
|
|
|
|
|
|
|
|
|
|
|
|
|
|
|
In millions
|
|
Retail
Banking
|
|
|
Corporate &
Institutional
Banking
|
|
|
Asset
Management
Group
|
|
|
Black-
Rock
|
|
|
Residential
Mortgage
Banking
|
|
|
Other
|
|
|
Total
|
|
|
January 1, 2010
|
|
$
|
5,369
|
|
|
$
|
2,756
|
|
|
$
|
68
|
|
|
$
|
26
|
|
|
$
|
43
|
|
|
$
|
1,243
|
|
|
$
|
9,505
|
|
|
Sale of GIS
|
|
|
|
|
|
|
|
|
|
|
|
|
|
|
|
|
|
|
|
|
|
|
(1,232
|
)
|
|
|
(1,232
|
)
|
|
Acquisition-related
|
|
|
(59
|
)
|
|
|
(23
|
)
|
|
|
(5
|
)
|
|
|
|
|
|
|
|
|
|
|
(11
|
)
|
|
|
(98
|
)
|
|
BlackRock
|
|
|
|
|
|
|
|
|
|
|
|
|
|
|
(9
|
)
|
|
|
|
|
|
|
|
|
|
|
(9
|
)
|
|
September 30, 2010
|
|
$
|
5,310
|
|
|
$
|
2,733
|
|
|
$
|
63
|
|
|
$
|
17
|
|
|
$
|
43
|
|
|
$
|
—
|
|
|
$
|
8,166
|
|
|
(a)
|
The Distressed Assets Portfolio business segment does not have any goodwill allocated to it.
|
Changes in goodwill and other intangible assets during the first nine months of 2010 follow:
Summary of Changes in Goodwill and Other Intangible Assets
|
|
|
|
|
|
|
|
|
|
|
|
|
|
|
In millions
|
|
Goodwill
|
|
|
Customer-
Related
|
|
|
Servicing
Rights
|
|
|
January 1, 2010
|
|
$
|
9,505
|
|
|
$
|
1,145
|
|
|
$
|
2,259
|
|
|
Additions/adjustments:
|
|
|
|
|
|
|
|
|
|
|
|
|
|
Sale of GIS
|
|
|
(1,232
|
)
|
|
|
(49
|
)
|
|
|
|
|
|
Acquisition-related
|
|
|
(98
|
)
|
|
|
|
|
|
|
|
|
|
Mortgage and other loan servicing rights
|
|
|
|
|
|
|
|
|
|
|
(485
|
)
|
|
BlackRock
|
|
|
(9
|
)
|
|
|
|
|
|
|
|
|
|
Sale of servicing rights
|
|
|
|
|
|
|
|
|
|
|
(192
|
)
|
|
Impairment charge
|
|
|
|
|
|
|
|
|
|
|
(99
|
)
|
|
Amortization
|
|
|
|
|
|
|
(152
|
)
|
|
|
(75
|
)
|
|
September 30, 2010
|
|
$
|
8,166
|
|
|
$
|
944
|
|
|
$
|
1,408
|
|
Assets and liabilities of acquired entities are recorded at estimated fair value as of the acquisition date and are subject to refinement as information
relative to the fair values at the date of acquisition becomes available.
See Note 2 Divestiture regarding our July 1, 2010 sale of GIS.
Our investment in BlackRock changes when BlackRock repurchases its shares in the open market or issues shares for an acquisition or pursuant
to its employee compensation plans. We adjust goodwill when BlackRock repurchases its shares at an amount greater (or less) than book value per share which results in an increase (or decrease) in our percentage ownership interest.
The gross carrying amount, accumulated amortization and net carrying amount of other intangible assets by
major category consisted of the following:
Other Intangible Assets
|
|
|
|
|
|
|
|
|
|
|
In millions
|
|
September 30
2010
|
|
|
December 31
2009
|
|
|
Customer-related and other intangibles
|
|
|
|
|
|
|
|
|
|
Gross carrying amount
|
|
$
|
1,547
|
|
|
$
|
1,742
|
|
|
Accumulated amortization
|
|
|
(603
|
)
|
|
|
(597
|
)
|
|
Net carrying amount
|
|
$
|
944
|
|
|
$
|
1,145
|
|
|
Mortgage and other loan servicing rights
|
|
|
|
|
|
|
|
|
|
Gross carrying amount
|
|
$
|
2,024
|
|
|
$
|
2,729
|
|
|
Valuation allowance
|
|
|
(99
|
)
|
|
|
|
|
|
Accumulated amortization
|
|
|
(517
|
)
|
|
|
(470
|
)
|
|
Net carrying amount
|
|
$
|
1,408
|
|
|
$
|
2,259
|
|
|
Total
|
|
$
|
2,352
|
|
|
$
|
3,404
|
|
While certain of our other intangible assets have finite lives and are amortized primarily on a straight-line basis, certain core deposit intangibles are
amortized on an accelerated basis.
For customer-related and other intangibles, the estimated remaining useful lives range from 2 years to 10
years, with a weighted-average remaining useful life of 9 years.
Amortization expense on existing intangible assets, net of impairment
reversal (charge) follows:
Amortization Expense on Existing Intangible Assets (a)
|
|
|
|
|
|
|
In millions
|
|
|
|
|
Nine months ended September 30, 2010
|
|
$
|
126
|
|
|
Nine months ended September 30, 2009
|
|
|
226
|
|
|
Remainder of 2010
|
|
|
64
|
|
|
2011
|
|
|
249
|
|
|
2012
|
|
|
210
|
|
|
2013
|
|
|
209
|
|
|
2014
|
|
|
191
|
|
|
2015
|
|
|
177
|
|
|
(a)
|
Net of impairment reversal (charge).
|
89
Changes in commercial mortgage servicing rights follow:
Commercial Mortgage Servicing Rights
|
|
|
|
|
|
|
|
|
|
|
In millions
|
|
2010
|
|
|
2009
|
|
|
January 1
|
|
$
|
921
|
|
|
$
|
864
|
|
|
Additions (a)
|
|
|
59
|
|
|
|
84
|
|
|
Acquisition adjustment
|
|
|
|
|
|
|
(7
|
)
|
|
Sale of servicing rights
|
|
|
(192
|
)
|
|
|
|
|
|
Impairment (charge) reversal
|
|
|
(99
|
)
|
|
|
35
|
|
|
Amortization expense
|
|
|
(73
|
)
|
|
|
(79
|
)
|
|
September 30
|
|
$
|
616
|
|
|
$
|
897
|
|
|
(a)
|
From loans sold with servicing retained and purchases of servicing rights from third parties.
|
We recognize as an other intangible asset the right to service mortgage loans for others. Commercial mortgage servicing rights are purchased in the open market and originated when loans are sold with
servicing retained. Commercial mortgage servicing rights are initially recorded at fair value. These rights are subsequently measured using the amortization method. Accordingly, the commercial mortgage servicing rights are substantially amortized in
proportion to and over the period of estimated net servicing income over a period of 5 to 10 years.
Commercial mortgage servicing rights are
periodically evaluated for impairment. For purposes of impairment, the commercial mortgage servicing rights are stratified based on asset type, which characterizes the predominant risk of the underlying financial asset. If the carrying amount of any
individual stratum exceeds its fair value, a valuation reserve is established with a corresponding charge to Corporate Services on our Consolidated Income Statement.
The fair value of commercial mortgage servicing rights is estimated by using an internal valuation model. The model calculates the present value of estimated future net servicing cash flows considering
estimates on servicing revenue and costs, discount rates and prepayment speeds.
Changes in the residential mortgage servicing rights follow:
Residential Mortgage Servicing Rights
|
|
|
|
|
|
|
|
|
|
|
In millions
|
|
2010
|
|
|
2009
|
|
|
January 1
|
|
$
|
1,332
|
|
|
$
|
1,008
|
|
|
Additions:
|
|
|
|
|
|
|
|
|
|
From loans sold with servicing retained
|
|
|
61
|
|
|
|
232
|
|
|
Changes in fair value due to:
|
|
|
|
|
|
|
|
|
|
Time and payoffs (a)
|
|
|
(133
|
)
|
|
|
(218
|
)
|
|
Purchase accounting adjustments
|
|
|
|
|
|
|
17
|
|
|
Other (b)
|
|
|
(472
|
)
|
|
|
243
|
|
|
September 30
|
|
$
|
788
|
|
|
$
|
1,282
|
|
|
Unpaid principal balance of loans serviced for others at
September 30
|
|
$
|
131,594
|
|
|
$
|
159,075
|
|
|
(a)
|
Represents decrease in mortgage servicing rights value due to passage of time, including the impact from both regularly scheduled loan principal payments and loans that
paid down or paid off during the period.
|
|
(b)
|
Represents mortgage servicing rights value changes resulting primarily from market-driven changes in interest rates.
|
We recognize mortgage servicing right assets on residential real estate loans when we retain the obligation to service these loans upon sale and the
servicing fee is more than adequate compensation. Mortgage servicing rights are subject to declines in value principally from actual or expected prepayment of the underlying loans and defaults. We manage this risk by economically hedging the fair
value of mortgage servicing rights with securities and derivative instruments which are expected to increase in value when the value of mortgage servicing rights declines.
The fair value of residential mortgage servicing rights is estimated by using third party software with internal valuation assumptions. The software calculates the present value of estimated future net
servicing cash flows considering estimates on servicing revenue and costs, discount rates, prepayment speeds and future mortgage rates.
The
fair value of residential and commercial MSRs and significant inputs to the valuation model as of September 30, 2010 are shown in the tables below. The expected and actual rates of mortgage loan prepayments are significant factors driving the
fair value. Management uses internal proprietary models to estimate future loan prepayments. These models use empirical data drawn from the historical performance of our managed portfolio, as adjusted for current market conditions. Future interest
rates are another important factor in the valuation of MSRs. Consistent with the pricing of capital market instruments, management utilizes market implied forward interest rates to estimate the future direction of mortgage and discount rates.
Changes in the shape and slope of the forward curve in future periods may result in volatility in the fair value estimate.
A sensitivity
analysis of the hypothetical effect on the fair value of MSRs to adverse changes in key assumptions is presented below. These sensitivities do not include the impact of the related hedging activities. Changes in fair value generally cannot be
extrapolated because the relationship of the change in the assumption to the change in fair value may not be linear. Also, the effect of a variation in a particular assumption on the fair value of the MSRs is calculated independently without
changing any other assumption. In reality, changes in one factor may result in changes in another (for example, changes in mortgage interest rates, which drive changes in prepayment rate estimates, could result in changes in the interest rate
spread), which could either magnify or counteract the sensitivities.
90
The following tables set forth the fair value of commercial and residential MSRs and the sensitivity
analysis of the hypothetical effect on the fair value of MSRs to immediate adverse changes of 10% and 20% in those assumptions:
Commercial Mortgage Loan Servicing Assets – Key Valuation Assumptions
|
|
|
|
|
|
|
|
|
|
|
Dollars in millions
|
|
Sept. 30,
2010
|
|
|
Dec. 31,
2009
|
|
|
Fair value
|
|
$
|
616
|
|
|
$
|
1,020
|
|
|
Weighted-average life (years)
|
|
|
7.0
|
|
|
|
7.8
|
|
|
Weighted-average constant prepayment rate
|
|
|
8%-21
|
%
|
|
|
6%-19
|
%
|
|
Decline in fair value from 10% adverse change
|
|
$
|
8.2
|
|
|
$
|
9.7
|
|
|
Decline in fair value from 20% adverse change
|
|
$
|
15.8
|
|
|
$
|
18.8
|
|
|
Spread over forward interest rate swap rates
|
|
|
6%-8
|
%
|
|
|
7%-9
|
%
|
|
Decline in fair value from 10% adverse change
|
|
$
|
13.5
|
|
|
$
|
24.6
|
|
|
Decline in fair value from 20% adverse change
|
|
$
|
27.0
|
|
|
$
|
49.3
|
|
Residential Mortgage Loan Servicing Assets – Key Valuation Assumptions
|
|
|
|
|
|
|
|
|
|
|
Dollars in millions
|
|
Sept. 30,
2010
|
|
|
Dec. 31,
2009
|
|
|
Fair value
|
|
$
|
788
|
|
|
$
|
1,332
|
|
|
Weighted-average life (years)
|
|
|
2.5
|
|
|
|
4.5
|
|
|
Weighted-average constant prepayment rate
|
|
|
21.47
|
%
|
|
|
19.92
|
%
|
|
Decline in fair value from 10% adverse change
|
|
$
|
35
|
|
|
$
|
56
|
|
|
Decline in fair value from 20% adverse change
|
|
$
|
66
|
|
|
$
|
109
|
|
|
Spread over forward interest rate swap rates
|
|
|
12.23
|
%
|
|
|
12.16
|
%
|
|
Decline in fair value from 10% adverse change
|
|
$
|
30
|
|
|
$
|
55
|
|
|
Decline in fair value from 20% adverse change
|
|
$
|
58
|
|
|
$
|
106
|
|
Revenue from mortgage and other loan servicing comprised of contractually specified servicing fees, late fees, and ancillary fees follows:
Revenue from Mortgage and Other Loan Servicing
|
|
|
|
|
|
|
|
|
|
|
In millions
|
|
2010
|
|
|
2009
|
|
|
Nine months ended September 30
|
|
$
|
526
|
|
|
$
|
631
|
|
|
Three months ended September 30
|
|
|
170
|
|
|
|
205
|
|
We also generate servicing revenue from fee-based activities provided to others.
Revenue from commercial mortgage servicing rights, residential mortgage servicing rights and other loan servicing are reported on our Consolidated Income Statement in the line items Corporate services,
Residential mortgage, and Consumer services, respectively.
N
OTE
10 C
APITAL
S
ECURITIES
OF
S
UBSIDIARY
T
RUSTS
AND
P
ERPETUAL
T
RUST
S
ECURITIES
C
APITAL
S
ECURITIES
OF
S
UBSIDIARY
T
RUSTS
Our capital securities of subsidiary trusts are described in Note 14 Capital Securities of Subsidiary Trusts in our 2009 Form 10-K. All of these Trusts are wholly owned finance subsidiaries of PNC. In the
event of certain changes or amendments to regulatory requirements or federal tax rules, the capital securities are redeemable. The financial statements of the Trusts are not included in PNC’s consolidated financial statements in accordance with
GAAP.
The obligations of the respective parent of each Trust, when taken collectively, are the equivalent of a full and unconditional
guarantee of the obligations of such Trust under the terms of the capital securities. Such guarantee is subordinate in right of payment in the same manner as other junior subordinated debt. There are certain restrictions on PNC’s overall
ability to obtain funds from its subsidiaries. For additional disclosure on these funding restrictions, including an explanation of dividend and intercompany loan limitations, see Note 23 Regulatory Matters in our 2009 Form 10-K.
PNC is subject to restrictions on dividends and other provisions similar to or in some ways more restrictive than those potentially imposed under the
Exchange Agreements with Trust II and Trust III, as described in Note 3 Variable Interest Entities in our 2009 Form 10-K.
In September 2010,
we redeemed all of the underlying capital securities of Sterling Financial Statutory Trust II, Yardville Capital Trusts II and IV, and James Monroe Statutory Trust II. The capital securities redeemed totaled $71 million.
P
ERPETUAL
T
RUST
S
ECURITIES
We issue certain hybrid capital vehicles that qualify as capital for regulatory purposes.
In
February 2008, PNC Preferred Funding LLC (the LLC), one of our indirect subsidiaries, sold $375 million of 8.700% Fixed-to-Floating Rate Non-Cumulative Exchangeable Perpetual Trust Securities of PNC Preferred Funding Trust III (Trust III) to third
parties in a private placement. In connection with the private placement, Trust III acquired $375 million of Fixed-to-Floating Rate Non-Cumulative Perpetual Preferred Securities of the LLC (the LLC Preferred Securities). The sale was similar to the
March 2007 private placement by the LLC of $500 million of 6.113% Fixed-to-Floating Rate Non-Cumulative Exchangeable Trust Securities (the Trust II Securities) of PNC Preferred Funding Trust II (Trust II) in which Trust II acquired $500 million of
LLC Preferred Securities and to the December 2006 private placement by PNC REIT Corp. of $500 million of 6.517% Fixed-to-Floating Rate Non-Cumulative Exchangeable Perpetual Trust Securities (the Trust I Securities) of PNC
91
Preferred Funding Trust I (Trust I) in which Trust I acquired $500 million of LLC Preferred Securities. PNC REIT Corp. owns 100% of LLC’s common voting securities. As a result, LLC is an
indirect subsidiary of PNC and is consolidated on our Consolidated Balance Sheet. Trust I, II and III’s investment in LLC Preferred Securities is characterized as a noncontrolling interest on our Consolidated Balance Sheet since we are not the
primary beneficiary of Trust I, Trust II and Trust III. This noncontrolling interest totaled $1.3 billion at September 30, 2010.
Our
2009 Form 10-K includes additional information regarding the Trust I and Trust II Securities, including descriptions of replacement capital and dividend restriction covenants. The Trust III Securities include dividend restriction covenants similar
to those described for Trust II Securities.
N
OTE
11 C
ERTAIN
E
MPLOYEE
B
ENEFIT
A
ND
S
TOCK
-B
ASED
C
OMPENSATION
P
LANS
P
ENSION
A
ND
P
OSTRETIREMENT
P
LANS
As described in Note 15 Employee Benefit Plans in our 2009 Form 10-K, we have a noncontributory, qualified defined benefit pension plan covering eligible employees. The plan derives benefits from cash
balance formulas based on compensation levels, age and length of service. Pension contributions are based on an actuarially determined amount necessary to fund total benefits payable to plan participants.
Effective January 1, 2010, the pension plan has one design for all eligible employees. All new participants on or after January 1, 2010 will
receive a fixed earnings credit of 3%. However, participants as of December 31, 2009 will be maintained at the earnings credit level they have attained as of that date going forward. The percentage will not increase in future years.
We also maintain nonqualified supplemental retirement plans for certain employees and provide certain health care and life insurance benefits for
qualifying retired employees (postretirement benefits) through various plans. The nonqualified pension and postretirement benefit plans are unfunded. The Company reserves the right to terminate or make plan changes at any time. Effective
January 1, 2010, various benefit plans were amended to provide one plan design for all eligible employees.
The July 1, 2010 sale of
GIS affected GIS participants in the pension and postretirement plans. At closing, all GIS participants were vested in their benefits under the pension plan and their active participation in such plan was terminated. However, certain GIS employees
will continue to accrue service towards earning their retiree medical benefit. These changes will not have a significant impact on any of the plans.
The components of our net periodic pension and post-retirement benefit cost for the third quarter and first
nine months of 2010 and 2009 were as follows:
Net Periodic Pension and Postretirement Benefits Costs
|
|
|
|
|
|
|
|
|
|
|
|
|
|
|
|
|
|
|
|
|
|
|
|
|
|
|
|
|
Qualified
Pension Plan
|
|
|
Nonqualified
Retirement Plans
|
|
|
Postretirement
Benefits
|
|
|
Three months ended
September 30
In millions
|
|
2010
|
|
|
2009
|
|
|
2010
|
|
|
2009
|
|
|
2010
|
|
|
2009
|
|
|
Net periodic cost consists of:
|
|
|
|
|
|
|
|
|
|
|
|
|
|
|
|
|
|
|
|
|
|
|
|
|
|
Service cost
|
|
$
|
25
|
|
|
$
|
22
|
|
|
$
|
1
|
|
|
$
|
1
|
|
|
$
|
1
|
|
|
$
|
1
|
|
|
Interest cost
|
|
|
51
|
|
|
|
52
|
|
|
|
3
|
|
|
|
4
|
|
|
|
5
|
|
|
|
5
|
|
|
Expected return on plan assets
|
|
|
(71
|
)
|
|
|
(65
|
)
|
|
|
|
|
|
|
|
|
|
|
|
|
|
|
|
|
|
Amortization of prior service cost
|
|
|
(2
|
)
|
|
|
(1
|
)
|
|
|
|
|
|
|
|
|
|
|
|
|
|
|
(1
|
)
|
|
Amortization of actuarial losses
|
|
|
8
|
|
|
|
21
|
|
|
|
1
|
|
|
|
|
|
|
|
|
|
|
|
|
|
|
Net periodic cost (benefit)
|
|
$
|
11
|
|
|
$
|
29
|
|
|
$
|
5
|
|
|
$
|
5
|
|
|
$
|
6
|
|
|
$
|
5
|
|
|
|
|
|
|
|
|
|
|
|
|
|
|
|
|
|
|
|
|
|
|
|
|
|
|
|
|
|
|
Qualified
Pension Plan
|
|
|
Nonqualified
Retirement Plans
|
|
|
Postretirement
Benefits
|
|
|
Nine months ended
September 30
In millions
|
|
2010
|
|
|
2009
|
|
|
2010
|
|
|
2009
|
|
|
2010
|
|
|
2009
|
|
|
Net periodic cost consists of:
|
|
|
|
|
|
|
|
|
|
|
|
|
|
|
|
|
|
|
|
|
|
|
|
|
|
Service cost
|
|
$
|
77
|
|
|
$
|
67
|
|
|
$
|
2
|
|
|
$
|
2
|
|
|
$
|
4
|
|
|
$
|
3
|
|
|
Interest cost
|
|
|
152
|
|
|
|
155
|
|
|
|
10
|
|
|
|
11
|
|
|
|
15
|
|
|
|
15
|
|
|
Expected return on plan assets
|
|
|
(214
|
)
|
|
|
(195
|
)
|
|
|
|
|
|
|
|
|
|
|
|
|
|
|
|
|
|
Amortization of prior service cost
|
|
|
(6
|
)
|
|
|
(1
|
)
|
|
|
|
|
|
|
|
|
|
|
(2
|
)
|
|
|
(3
|
)
|
|
Amortization of actuarial losses
|
|
|
25
|
|
|
|
62
|
|
|
|
3
|
|
|
|
1
|
|
|
|
|
|
|
|
|
|
|
Net periodic cost (benefit)
|
|
$
|
34
|
|
|
$
|
88
|
|
|
$
|
15
|
|
|
$
|
14
|
|
|
$
|
17
|
|
|
$
|
15
|
|
S
TOCK
-B
ASED
C
OMPENSATION
P
LANS
As more fully described in Note 16 Stock-Based Compensation Plans in our 2009 Form 10-K, we have long-term incentive award plans (Incentive Plans) that
provide for the granting of incentive stock options, nonqualified stock options, stock appreciation rights, incentive shares/performance units, restricted stock, restricted share units, other share-based awards and dollar-denominated awards to
executives and, other than incentive stock options, to non-employee directors. Certain Incentive Plan awards may be paid in stock, cash or a combination of stock and cash. We typically grant a substantial portion of our stock-based compensation
awards during the first quarter of the year. As of September 30, 2010, no stock appreciation rights were outstanding.
92
Total compensation expense recognized related to all share-based payment arrangements during the first nine
months of 2010 and 2009 was $70 million and $63 million, respectively.
N
ONQUALIFIED
S
TOCK
O
PTIONS
Options are granted at exercise prices not less than the market value of common stock on the grant date.
Generally, options become exercisable in installments after the grant date. No option may be exercisable after 10 years from its grant date. Payment of the option exercise price may be in cash or shares of common stock at market value on the
exercise date. The exercise price may be paid in previously owned shares.
For purposes of computing stock option expense, we estimated the fair value of stock options primarily by
using the Black-Scholes option-pricing model. Option pricing models require the use of numerous assumptions, many of which are very subjective.
Stock Option Expense – Option Pricing Models Assumptions
|
|
|
|
|
|
|
|
|
|
|
Weighted-average for the nine months ended
September 30
|
|
2010
|
|
|
2009
|
|
|
Risk-free interest rate
|
|
|
2.9
|
%
|
|
|
1.9
|
%
|
|
Dividend yield
|
|
|
0.7
|
|
|
|
3.6
|
|
|
Volatility
|
|
|
32.7
|
|
|
|
27.2
|
|
|
Expected life
|
|
|
6.0 yrs.
|
|
|
|
5.6 yrs.
|
|
|
Grant-date fair value
|
|
$
|
19.59
|
|
|
$
|
5.61
|
|
Stock Option Information
|
|
|
|
|
|
|
|
|
|
|
|
|
|
|
|
|
|
|
|
|
|
|
|
|
|
|
|
|
PNC
|
|
|
PNC
Options
Converted From
National City
Options
|
|
|
Total
|
|
|
In thousands, except weighted-average data
|
|
Shares
|
|
|
Weighted-
Average
Exercise
Price
|
|
|
Shares
|
|
|
Weighted-
Average
Exercise
Price
|
|
|
Shares
|
|
|
Weighted-
Average
Exercise
Price
|
|
|
Outstanding at December 31, 2009
|
|
|
18,496
|
|
|
$
|
56.10
|
|
|
|
1,522
|
|
|
$
|
637.64
|
|
|
|
20,018
|
|
|
$
|
100.32
|
|
|
Granted
|
|
|
2,720
|
|
|
|
56.84
|
|
|
|
|
|
|
|
|
|
|
|
2,720
|
|
|
|
56.84
|
|
|
Exercised
|
|
|
(286
|
)
|
|
|
46.23
|
|
|
|
|
|
|
|
|
|
|
|
(286
|
)
|
|
|
46.23
|
|
|
Cancelled
|
|
|
(988
|
)
|
|
|
56.37
|
|
|
|
(287
|
)
|
|
|
482.08
|
|
|
|
(1,275
|
)
|
|
|
152.07
|
|
|
Outstanding at September 30, 2010
|
|
|
19,942
|
|
|
$
|
56.33
|
|
|
|
1,235
|
|
|
$
|
673.73
|
|
|
|
21,177
|
|
|
$
|
92.35
|
|
|
Exercisable at September 30, 2010
|
|
|
12,255
|
|
|
$
|
62.38
|
|
|
|
1,235
|
|
|
$
|
673.73
|
|
|
|
13,490
|
|
|
$
|
118.37
|
|
During the first nine months of 2010 we issued 282,000 shares from treasury stock in connection with stock
option exercise activity. As with past exercise activity, we currently intend to utilize treasury stock primarily for any future stock option exercises.
I
NCENTIVE
/P
ERFORMANCE
U
NIT
S
HARE
A
WARDS
AND
R
ESTRICTED
S
TOCK
/U
NIT
A
WARDS
The fair value of nonvested incentive/performance unit share awards and
restricted stock/unit awards is initially determined based on prices not less than the market value of our common stock price on the date of grant. Incentive/performance unit share awards are subsequently valued subject to the achievement of one or
more financial and other performance goals over a three-year period. The Personnel and Compensation Committee of the Board of Directors approves the final award payout with respect to incentive/performance unit share awards. Restricted stock/unit
awards have various vesting periods generally ranging from 12 months to 60 months. We recognize compensation expense for such awards ratably over the corresponding vesting and/or performance periods for each type of program.
Summary of Nonvested Incentive/Performance Unit and Restricted Stock/Unit Shares Activity
|
|
|
|
|
|
|
|
|
|
|
|
|
|
|
|
|
|
|
Shares in thousands
|
|
Nonvested
Incentive/
Performance
Unit Shares
|
|
|
Weighted-
Average
Grant Date
Fair Value
|
|
|
Nonvested
Restricted
Stock/
Unit
Shares
|
|
|
Weighted-
Average
Grant Date
Fair Value
|
|
|
Dec. 31, 2009
|
|
|
285
|
|
|
$
|
66.45
|
|
|
|
2,213
|
|
|
$
|
53.45
|
|
|
Granted
|
|
|
189
|
|
|
|
53.78
|
|
|
|
668
|
|
|
|
54.86
|
|
|
Vested/Released
|
|
|
(128
|
)
|
|
|
74.96
|
|
|
|
(537
|
)
|
|
|
69.14
|
|
|
Forfeited
|
|
|
(3
|
)
|
|
|
53.78
|
|
|
|
(53
|
)
|
|
|
48.97
|
|
|
Sept. 30, 2010
|
|
|
343
|
|
|
$
|
56.43
|
|
|
|
2,291
|
|
|
$
|
50.29
|
|
In the chart above, the unit shares and related weighted-average grant-date fair value of the incentive/performance awards exclude the effect of
dividends on the underlying shares, as those dividends will be paid in cash.
At September 30, 2010, there was $51 million of
unrecognized deferred compensation expense related to nonvested share-based compensation arrangements granted under the Incentive Plans. This cost is expected to be recognized as expense over a period of no longer than five years.
93
L
IABILITY
A
WARDS
Beginning in 2008, we granted cash-payable restricted share units to certain members of management. The grants were made primarily as part of an annual
bonus incentive deferral plan. While there are time-based, service-related vesting criteria, there are no market or performance criteria associated with these awards. Compensation expense recognized related to these awards was recorded in prior
periods as part of annual cash bonus criteria. As of September 30, 2010, there were 484,003 of these cash-payable restricted share units outstanding.
During the third quarter of 2009, we entered into an agreement with certain of our executives regarding a portion of their salary to be payable in stock units. These units, which are cash-payable, have no
future service, market or performance criteria and as such are fully expensed at grant date. These units will be settled in cash on March 31, 2011. We eliminated the granting of any future salary payable in stock units beginning March 2010. As
of September 30, 2010, there were 280,174 of these units outstanding, with a current market value of $15 million.
Summary of
Nonvested, Cash-Payable Restricted Share Unit Activity
|
|
|
|
|
|
|
|
|
|
|
In thousands
|
|
Nonvested
Cash-Payable
Restricted
Unit Shares
|
|
|
Aggregate
Intrinsic
Value
|
|
|
Outstanding at December 31, 2009
|
|
|
1,001
|
|
|
|
|
|
|
Granted
|
|
|
316
|
|
|
|
|
|
|
Vested and Released
|
|
|
(181
|
)
|
|
|
|
|
|
Forfeited
|
|
|
(24
|
)
|
|
|
|
|
|
Outstanding at September 30, 2010
|
|
|
1,112
|
|
|
$
|
57,728
|
|
N
OTE
12 F
INANCIAL
D
ERIVATIVES
We use derivative financial instruments (derivatives) primarily to help manage exposure to interest rate, market and credit risk and reduce the effects
that changes in interest rates may have on net income, fair value of assets and liabilities, and cash flows. We also enter into derivatives with customers to facilitate their risk management activities.
Derivatives represent contracts between parties that usually require little or no initial net investment and result in one party delivering cash or
another type of asset to the other party based on a notional amount and an underlying as specified in the contract. Derivative transactions are often measured in terms of notional amount, but this amount is generally not exchanged and it is not
recorded on the balance sheet. The notional amount is the basis to which the underlying is applied to determine required payments under the derivative contract. The underlying is a referenced interest rate, commonly LIBOR, security price, credit
spread or other index. Certain contracts and commitments, such as residential and commercial real estate loan commitments associated with loans to be sold, also qualify as derivative instruments.
All derivatives are carried on our Consolidated Balance Sheet at fair value. Derivative balances are
presented on a net basis taking into consideration the effects of legally enforceable master netting agreements. Cash collateral exchanged with counterparties is also netted against the applicable derivative fair values.
Further discussion on how derivatives are accounted for is included in Note 1 Accounting Policies in our 2009 Form 10-K.
Derivatives Designated in Hedge Relationships
Certain derivatives used to manage interest rate risk as part of our asset and liability risk management activities are designated as accounting hedges under GAAP. Derivatives hedging the risks associated
with changes in the fair value of assets or liabilities are considered fair value hedges, while derivatives hedging the variability of expected future cash flows are considered cash flow hedges. Designating derivatives as accounting hedges allows
for gains and losses on those derivatives, to the extent effective, to be recognized in the income statement in the same period the hedged items affect earnings.
Cash Flow Hedges
We enter into receive-fixed, pay-variable interest rate swaps to
modify the interest rate characteristics of designated commercial loans from variable to fixed in order to reduce the impact of changes in future cash flows due to market interest rate changes. For these cash flow hedges, any changes in the fair
value of the derivatives that are effective in offsetting changes in the forecasted interest cash flows are recorded in accumulated other comprehensive income and are reclassified to interest income in conjunction with the recognition of interest
receipts on the loans. In the 12 months that follow September 30, 2010, we expect to reclassify from the amount currently reported in accumulated other comprehensive income net derivative gains of $331 million pretax, or $215 million after-tax,
in association with interest receipts on the hedged loans. This amount could differ from amounts actually recognized due to changes in interest rates, hedge dedesignations, and the addition of other hedges subsequent to September 30, 2010. The
maximum length of time over which forecasted loan cash flows are hedged is 10 years. We use statistical regression analysis to assess the effectiveness of these hedge relationships at both the inception of the hedge relationship and on an ongoing
basis.
We also periodically enter into forward purchase and sale contracts to hedge the variability of the consideration that will be paid or
received related to the purchase or sale of debt securities classified as available for sale. The forecasted purchase or sale is consummated upon gross settlement of the forward contract itself. As a result, hedge ineffectiveness, if any, is
typically minimal. Gains and losses on these forward contracts are recorded in accumulated other comprehensive income and are recognized in earnings when the hedged cash
94
flows affect earnings. In the 12 months that follow September 30, 2010, we expect to reclassify from the amount currently reported in accumulated other comprehensive loss, net derivative
gains of $76 million pretax, or $50 million after-tax, as adjustments of yield on securities available for sale. The maximum length of time we are hedging forecasted purchases is three months. There were no amounts in accumulated other comprehensive
income related to the forecasted sale of securities at September 30, 2010.
There were no components of derivative gains or losses
excluded from the assessment of hedge effectiveness related to either cash flow hedge strategy.
During the first nine months of 2010 and
2009, there were no gains or losses from cash flow hedge derivatives reclassified to earnings because it became probable that the original forecasted transaction would not occur.
Fair Value Hedges
We enter into receive-fixed, pay-variable interest rate swaps to
hedge changes in the fair value of outstanding fixed-rate debt and borrowings caused by fluctuations in market interest rates. The specific products hedged include bank notes, Federal Home Loan Bank borrowings, and senior and subordinated debt. We
also enter into pay-fixed, receive- variable interest rate swaps to hedge changes in the fair value of fixed rate investment securities caused by fluctuations in market interest rates. The specific products hedged include US Treasury and government
agency securities. For these hedge relationships, we use statistical regression analysis to assess hedge effectiveness at both the inception of the hedge relationship and on an ongoing basis. There were no components of derivative gains or losses
excluded from the assessment of hedge effectiveness.
Further detail regarding the notional amounts, fair values and gains and losses
recognized related to derivatives used in fair value and cash flow hedge strategies is presented in the tables that follow.
The ineffective
portion of the change in value of our fair value and cash flow hedge derivatives resulted in net losses of $8 million for the first nine months of 2010 compared with net losses of $29 million for the first nine months of 2009.
Derivatives Not Designated in Hedge Relationships
We also enter into derivatives which are not designated as accounting hedges under GAAP.
The
majority of these derivatives are used to manage risk related to residential and commercial mortgage banking activities and are considered economic hedges. Although these derivatives are used to hedge risk, they are not designated as accounting
hedges because the contracts they are hedging are typically also carried at fair value on the balance sheet, resulting in symmetrical accounting treatment for both the hedging instrument and the hedged item.
Our residential mortgage banking activities consist of originating, selling and servicing mortgage loans.
Residential mortgage loans that will be sold in the secondary market, and the related loan commitments, which are considered derivatives, are accounted for at fair value. Changes in the fair value of the loans and commitments due to interest rate
risk are hedged with forward loan sale contracts and Treasury and Eurodollar futures and options. Gains and losses on the loans and commitments held for sale and the derivatives used to economically hedge them are included in residential mortgage
noninterest income on the Consolidated Income Statement.
We typically retain the servicing rights related to residential mortgage loans that
we sell. Residential mortgage servicing rights are accounted for at fair value with changes in fair value influenced primarily by changes in interest rates. Derivatives used to hedge the fair value of residential mortgage servicing rights include
interest rate futures, swaps and options, including caps, floors, and swaptions, and forward contracts to purchase mortgage-backed securities. Gains and losses on residential mortgage servicing rights and the related derivatives used for hedging are
included in residential mortgage noninterest income.
Commercial mortgage loans are also sold into the secondary market as part of our
commercial mortgage banking activities and are accounted for at fair value. Commitments related to loans that will be sold are considered derivatives and are also accounted for at fair value. Derivatives used to economically hedge these loans and
commitments from changes in fair value due to interest rate risk and credit risk include forward loan sale contracts, interest rate swaps, and credit default swaps. Gains and losses on the commitments, loans and derivatives are included in other
noninterest income.
The residential and commercial loan commitments associated with loans to be sold which are accounted for as derivatives
are valued based on the estimated fair value of the underlying loan and the probability that the loan will fund within the terms of the commitment. The fair value also takes into account the fair value of the embedded servicing right.
We offer derivatives to our customers in connection with their risk management needs. These derivatives primarily consist of interest rate swaps,
interest rate caps, floors, swaptions, and foreign exchange and equity contracts. We primarily manage our market risk exposure from customer transactions by entering into offsetting derivative transactions with third-party dealers. Gains and losses
on customer-related derivatives are included in other noninterest income.
The derivatives portfolio also includes derivatives used for other
risk management activities. These derivatives are entered into based on stated risk management objectives.
This segment of the portfolio
includes credit default swaps (CDS) used to mitigate the risk of economic loss on a portion
95
of our loan exposure. We also sell loss protection to mitigate the net premium cost and the impact of mark-to-market accounting on CDS purchases to hedge the loan portfolio. The fair values of
these derivatives typically are based on related credit spreads. Gains and losses on the derivatives entered into for other risk management are included in other noninterest income.
Included in the customer, mortgage banking risk management, and other risk management portfolios are written interest-rate caps and floors entered into with customers and for risk management purposes. We
receive an upfront premium from the counterparty and are obligated to make payments to the counterparty if the underlying market interest rate rises above or falls below a certain level designated in the contract. At September 30, 2010, the
fair value of the written caps and floors liability on our Consolidated Balance Sheet was $10 million compared with $15 million at December 31, 2009. Our ultimate obligation under written options is based on future market conditions and is only
quantifiable at settlement.
Further detail regarding the derivatives not designated in hedging relationships is presented in the tables that
follow.
Derivative Counterparty Credit Risk
By entering into derivative contracts we are exposed to credit risk. We seek to minimize credit risk through internal credit approvals, limits, monitoring procedures, executing master netting agreements
and collateral requirements. We generally enter into transactions with counterparties that carry high quality credit ratings. Nonperformance risk including credit risk is included in the determination of the estimated net fair value.
We generally have established agreements with our major derivative dealer counterparties that provide for exchanges of marketable securities or cash to
collateralize either party’s positions. At September 30, 2010, we held cash, US government securities and mortgage-backed securities totaling $1.3 billion under these agreements. We pledged cash of $888 million under these agreements. To
the extent not netted
against derivative fair values under a master netting agreement, cash pledged is included in Other assets and cash held is included in Other borrowed funds on our Consolidated Balance Sheet.
The credit risk associated with derivatives executed with customers is essentially the same as that involved in extending loans and is
subject to normal credit policies. We may obtain collateral based on our assessment of the customer’s credit quality.
We periodically
enter into risk participation agreements to share some of the credit exposure with other counterparties related to interest rate derivative contracts or to take on credit exposure to generate revenue. We will make/receive payments under these
agreements if a customer defaults on its obligation to perform under certain derivative swap contracts. Risk participation agreements are included in the derivatives table that follows. Our exposure related to risk participations where we sold
protection is discussed in the Credit Derivatives section below.
Contingent Features
Some of PNC’s derivative instruments contain provisions that require PNC’s debt to maintain an investment grade credit rating from each of the
major credit rating agencies. If PNC’s debt ratings were to fall below investment grade, it would be in violation of these provisions, and the counterparties to the derivative instruments could request immediate payment or demand immediate and
ongoing full overnight collateralization on derivative instruments in net liability positions.
The aggregate fair value of all derivative
instruments with credit-risk-related contingent features that were in a net liability position on September 30, 2010 was $1.0 billion for which PNC had posted collateral of $874 million in the normal course of business. The maximum amount of
collateral PNC would have been required to post if the credit-risk-related contingent features underlying these agreements had been triggered on September 30, 2010, would be an additional $159 million.
96
Derivatives Total Notional or
Contractual Amounts and Estimated Net Fair Values
|
|
|
|
|
|
|
|
|
|
|
|
|
|
|
|
|
|
|
|
|
|
|
|
|
|
|
|
|
|
|
|
|
|
|
|
|
|
|
|
|
Asset Derivatives
|
|
|
|
|
|
Liability Derivatives
|
|
|
|
|
September 30, 2010
|
|
|
December 31, 2009
|
|
|
|
|
|
September 30, 2010
|
|
|
December 31, 2009
|
|
|
In millions
|
|
Notional/
Contract
Amount
|
|
|
Fair
Value (a)
|
|
|
Notional/
Contract
Amount
|
|
|
Fair
Value (a)
|
|
|
|
|
|
Notional/
Contract
Amount
|
|
|
Fair
Value (b)
|
|
|
Notional/
Contract
Amount
|
|
|
Fair
Value (b)
|
|
|
Derivatives designated as hedging instruments under GAAP
|
|
|
|
|
|
|
|
|
|
|
|
|
|
|
|
|
|
|
|
|
|
|
|
|
|
|
|
|
|
|
|
|
|
|
|
|
|
Interest rate contracts:
|
|
|
|
|
|
|
|
|
|
|
|
|
|
|
|
|
|
|
|
|
|
|
|
|
|
|
|
|
|
|
|
|
|
|
|
|
|
Cash flow hedges
|
|
$
|
18,642
|
|
|
$
|
559
|
|
|
$
|
6,394
|
|
|
$
|
32
|
|
|
|
|
|
|
|
|
|
|
|
|
|
|
$
|
7,011
|
|
|
$
|
95
|
|
|
Fair value hedges
|
|
|
11,203
|
|
|
|
1,272
|
|
|
|
13,048
|
|
|
|
707
|
|
|
|
|
|
|
$
|
1,815
|
|
|
$
|
66
|
|
|
|
|
|
|
|
|
|
|
Total derivatives designated as hedging instruments
|
|
$
|
29,845
|
|
|
$
|
1,831
|
|
|
$
|
19,442
|
|
|
$
|
739
|
|
|
|
|
|
|
$
|
1,815
|
|
|
$
|
66
|
|
|
$
|
7,011
|
|
|
$
|
95
|
|
|
Derivatives not designated as hedging instruments under GAAP
|
|
|
|
|
|
|
|
|
|
|
|
|
|
|
|
|
|
|
|
|
|
|
|
|
|
|
|
|
|
|
|
|
|
|
|
|
|
Derivatives used for residential mortgage banking activities:
|
|
|
|
|
|
|
|
|
|
|
|
|
|
|
|
|
|
|
|
|
|
|
|
|
|
|
|
|
|
|
|
|
|
|
|
|
|
Residential mortgage servicing
|
|
|
|
|
|
|
|
|
|
|
|
|
|
|
|
|
|
|
|
|
|
|
|
|
|
|
|
|
|
|
|
|
|
|
|
|
|
Interest rate contracts
|
|
$
|
138,402
|
|
|
$
|
2,179
|
|
|
$
|
88,593
|
|
|
$
|
651
|
|
|
|
|
|
|
$
|
84,823
|
|
|
$
|
1,869
|
|
|
$
|
42,874
|
|
|
$
|
766
|
|
|
Loan sales
|
|
|
|
|
|
|
|
|
|
|
|
|
|
|
|
|
|
|
|
|
|
|
|
|
|
|
|
|
|
|
|
|
|
|
|
|
|
Interest rate contracts
|
|
|
12,993
|
|
|
|
86
|
|
|
|
4,251
|
|
|
|
39
|
|
|
|
|
|
|
|
6,438
|
|
|
|
32
|
|
|
|
1,977
|
|
|
|
14
|
|
|
Subtotal
|
|
$
|
151,395
|
|
|
$
|
2,265
|
|
|
$
|
92,844
|
|
|
$
|
690
|
|
|
|
|
|
|
$
|
91,261
|
|
|
$
|
1,901
|
|
|
$
|
44,851
|
|
|
$
|
780
|
|
|
Derivatives used for commercial mortgage banking activities:
|
|
|
|
|
|
|
|
|
|
|
|
|
|
|
|
|
|
|
|
|
|
|
|
|
|
|
|
|
|
|
|
|
|
|
|
|
|
Interest rate contracts
|
|
$
|
2,127
|
|
|
$
|
96
|
|
|
$
|
2,128
|
|
|
$
|
67
|
|
|
|
|
|
|
$
|
2,568
|
|
|
$
|
159
|
|
|
$
|
1,553
|
|
|
$
|
74
|
|
|
Credit contracts:
|
|
|
|
|
|
|
|
|
|
|
|
|
|
|
|
|
|
|
|
|
|
|
|
|
|
|
|
|
|
|
|
|
|
|
|
|
|
Credit default swaps
|
|
|
185
|
|
|
|
11
|
|
|
|
410
|
|
|
|
59
|
|
|
|
|
|
|
|
|
|
|
|
|
|
|
|
50
|
|
|
|
7
|
|
|
Subtotal
|
|
$
|
2,312
|
|
|
$
|
107
|
|
|
$
|
2,538
|
|
|
$
|
126
|
|
|
|
|
|
|
$
|
2,568
|
|
|
$
|
159
|
|
|
$
|
1,603
|
|
|
$
|
81
|
|
|
Derivatives used for customer- related activities:
|
|
|
|
|
|
|
|
|
|
|
|
|
|
|
|
|
|
|
|
|
|
|
|
|
|
|
|
|
|
|
|
|
|
|
|
|
|
Interest rate contracts
|
|
$
|
48,855
|
|
|
$
|
3,482
|
|
|
$
|
51,270
|
|
|
$
|
2,193
|
|
|
|
|
|
|
$
|
49,842
|
|
|
$
|
3,601
|
|
|
$
|
49,659
|
|
|
$
|
2,237
|
|
|
Foreign exchange contracts
|
|
|
4,541
|
|
|
|
134
|
|
|
|
4,168
|
|
|
|
122
|
|
|
|
|
|
|
|
4,077
|
|
|
|
124
|
|
|
|
3,834
|
|
|
|
108
|
|
|
Equity contracts
|
|
|
231
|
|
|
|
20
|
|
|
|
195
|
|
|
|
16
|
|
|
|
|
|
|
|
147
|
|
|
|
20
|
|
|
|
156
|
|
|
|
16
|
|
|
Credit contracts:
|
|
|
|
|
|
|
|
|
|
|
|
|
|
|
|
|
|
|
|
|
|
|
|
|
|
|
|
|
|
|
|
|
|
|
|
|
|
Risk participation agreements
|
|
|
1,329
|
|
|
|
4
|
|
|
|
1,091
|
|
|
|
3
|
|
|
|
|
|
|
|
1,593
|
|
|
|
3
|
|
|
|
1,728
|
|
|
|
2
|
|
|
Subtotal
|
|
$
|
54,956
|
|
|
$
|
3,640
|
|
|
$
|
56,724
|
|
|
$
|
2,334
|
|
|
|
|
|
|
$
|
55,659
|
|
|
$
|
3,748
|
|
|
$
|
55,377
|
|
|
$
|
2,363
|
|
|
Derivatives used for other risk management activities:
|
|
|
|
|
|
|
|
|
|
|
|
|
|
|
|
|
|
|
|
|
|
|
|
|
|
|
|
|
|
|
|
|
|
|
|
|
|
Interest rate contracts
|
|
$
|
812
|
|
|
$
|
3
|
|
|
$
|
3,222
|
|
|
$
|
13
|
|
|
|
|
|
|
$
|
433
|
|
|
$
|
2
|
|
|
$
|
2,360
|
|
|
$
|
19
|
|
|
Foreign exchange contracts
|
|
|
|
|
|
|
|
|
|
|
39
|
|
|
|
1
|
|
|
|
|
|
|
|
34
|
|
|
|
2
|
|
|
|
2
|
|
|
|
|
|
|
Credit contracts:
|
|
|
|
|
|
|
|
|
|
|
|
|
|
|
|
|
|
|
|
|
|
|
|
|
|
|
|
|
|
|
|
|
|
|
|
|
|
Credit default swaps
|
|
|
406
|
|
|
|
10
|
|
|
|
516
|
|
|
|
13
|
|
|
|
|
|
|
|
258
|
|
|
|
1
|
|
|
|
612
|
|
|
|
15
|
|
|
Other contracts (c)
|
|
|
|
|
|
|
|
|
|
|
|
|
|
|
|
|
|
|
|
|
|
|
209
|
|
|
|
354
|
|
|
|
211
|
|
|
|
486
|
|
|
Subtotal
|
|
$
|
1,218
|
|
|
$
|
13
|
|
|
$
|
3,777
|
|
|
$
|
27
|
|
|
|
|
|
|
$
|
934
|
|
|
$
|
359
|
|
|
$
|
3,185
|
|
|
$
|
520
|
|
|
Total derivatives not designated as hedging instruments
|
|
$
|
209,881
|
|
|
$
|
6,025
|
|
|
$
|
155,883
|
|
|
$
|
3,177
|
|
|
|
|
|
|
$
|
150,422
|
|
|
$
|
6,167
|
|
|
$
|
105,016
|
|
|
$
|
3,744
|
|
|
Total Gross Derivatives
|
|
$
|
239,726
|
|
|
$
|
7,856
|
|
|
$
|
175,325
|
|
|
$
|
3,916
|
|
|
|
|
|
|
$
|
152,237
|
|
|
$
|
6,233
|
|
|
$
|
112,027
|
|
|
$
|
3,839
|
|
|
Less: Legally enforceable master netting agreements
|
|
|
|
|
|
|
4,363
|
|
|
|
|
|
|
|
1,600
|
|
|
|
|
|
|
|
|
|
|
|
4,363
|
|
|
|
|
|
|
|
1,600
|
|
|
Less: Cash collateral
|
|
|
|
|
|
|
1,047
|
|
|
|
|
|
|
|
269
|
|
|
|
|
|
|
|
|
|
|
|
848
|
|
|
|
|
|
|
|
506
|
|
|
Total Net Derivatives
|
|
|
|
|
|
$
|
2,446
|
|
|
|
|
|
|
$
|
2,047
|
|
|
|
|
|
|
|
|
|
|
$
|
1,022
|
|
|
|
|
|
|
$
|
1,733
|
|
|
(a)
|
Included in Other Assets on our Consolidated Balance Sheet.
|
|
(b)
|
Included in Other Liabilities on our Consolidated Balance Sheet.
|
|
(c)
|
Includes PNC’s obligation to fund a portion of certain BlackRock LTIP programs.
|
97
Gains (losses) on derivative
instruments and related hedged items follow:
Derivatives Designated in GAAP Hedge Relationships – Fair Value Hedges
|
|
|
|
|
|
|
|
|
|
|
|
|
|
|
|
|
|
|
|
|
|
|
|
|
|
|
|
|
September 30, 2010
|
|
|
September 30, 2009
|
|
|
Nine months ended
|
|
|
|
|
|
Gain
(Loss) on
Derivatives
Recognized
in Income
|
|
|
Gain
(Loss) on
Related
Hedged
Items
Recognized
in Income
|
|
|
Gain
(Loss) on
Derivatives
Recognized
in Income
|
|
|
Gain
(Loss) on
Related
Hedged
Items
Recognized
in Income
|
|
|
In millions
|
|
Hedged Items
|
|
Location
|
|
Amount
|
|
|
Amount
|
|
|
Amount
|
|
|
Amount
|
|
|
Interest rate contracts
|
|
US Treasury Securities
|
|
Investment securities (interest income)
|
|
$
|
(73
|
)
|
|
$
|
69
|
|
|
|
|
|
|
|
|
|
|
Interest rate contracts
|
|
US Agency Securities
|
|
Investment securities (interest income)
|
|
|
(2
|
)
|
|
|
2
|
|
|
|
|
|
|
|
|
|
|
Interest rate contracts
|
|
Federal Home Loan Bank borrowings
|
|
Borrowed funds (interest expense)
|
|
|
(65
|
)
|
|
|
63
|
|
|
$
|
(81
|
)
|
|
$
|
83
|
|
|
Interest rate contracts
|
|
Subordinated debt
|
|
Borrowed funds (interest expense)
|
|
|
395
|
|
|
|
(409
|
)
|
|
|
(311
|
)
|
|
|
275
|
|
|
Interest rate contracts
|
|
Bank notes and senior debt
|
|
Borrowed funds (interest expense)
|
|
|
359
|
|
|
|
(347
|
)
|
|
|
27
|
|
|
|
(22
|
)
|
|
Total
|
|
|
|
|
|
$
|
614
|
|
|
$
|
(622
|
)
|
|
$
|
(365
|
)
|
|
$
|
336
|
|
|
|
|
|
|
|
|
|
|
|
|
|
|
|
|
|
|
|
|
|
|
|
|
|
|
|
|
|
|
September 30, 2010
|
|
|
September 30, 2009
|
|
|
Three months ended
|
|
|
|
|
|
Gain
(Loss) on
Derivatives
Recognized
in Income
|
|
|
Gain
(Loss) on
Related
Hedged
Items
Recognized
in Income
|
|
|
Gain
(Loss) on
Derivatives
Recognized
in Income
|
|
|
Gain
(Loss) on
Related
Hedged
Items
Recognized
in Income
|
|
|
In millions
|
|
Hedged Items
|
|
Location
|
|
Amount
|
|
|
Amount
|
|
|
Amount
|
|
|
Amount
|
|
|
Interest rate contracts
|
|
US Treasury Securities
|
|
Investment securities (interest income)
|
|
$
|
(46
|
)
|
|
$
|
43
|
|
|
|
|
|
|
|
|
|
|
Interest rate contracts
|
|
US Agency Securities
|
|
Investment securities (interest income)
|
|
|
(2
|
)
|
|
|
2
|
|
|
|
|
|
|
|
|
|
|
Interest rate contracts
|
|
Federal Home Loan Bank borrowings
|
|
Borrowed funds (interest expense)
|
|
|
(17
|
)
|
|
|
16
|
|
|
$
|
(27
|
)
|
|
$
|
27
|
|
|
Interest rate contracts
|
|
Subordinated debt
|
|
Borrowed funds (interest expense)
|
|
|
135
|
|
|
|
(137
|
)
|
|
|
61
|
|
|
|
(89
|
)
|
|
Interest rate contracts
|
|
Bank notes and senior debt
|
|
Borrowed funds (interest expense)
|
|
|
145
|
|
|
|
(149
|
)
|
|
|
52
|
|
|
|
(50
|
)
|
|
Total
|
|
|
|
|
|
$
|
215
|
|
|
$
|
(225
|
)
|
|
$
|
86
|
|
|
$
|
(112
|
)
|
Derivatives Designated in GAAP Hedge Relationships – Cash Flow Hedges
|
|
|
|
|
|
|
|
|
|
|
|
|
|
|
|
|
|
|
|
|
|
|
Nine months ended
In millions
|
|
Gain (Loss) on Derivatives
Recognized in OCI
(Effective Portion)
|
|
|
Gain Reclassified from Accumulated
OCI into
Income (Effective Portion)
|
|
|
Gain Recognized in
Income
on Derivatives
(Ineffective Portion)
|
|
|
|
|
|
|
|
|
|
Location
|
|
Amount
|
|
|
Location
|
|
|
Amount
|
|
|
September 30, 2010
|
|
Interest rate contracts
|
|
$
|
1,066
|
|
|
Interest income
|
|
$
|
259
|
|
|
|
Interest income
|
|
|
$
|
0
|
|
|
|
|
|
|
|
|
|
|
Noninterest income
|
|
|
33
|
|
|
|
|
|
|
|
|
|
|
September 30, 2009
|
|
Interest rate contracts
|
|
$
|
28
|
|
|
Interest income
|
|
$
|
232
|
|
|
|
Interest income
|
|
|
$
|
0
|
|
|
|
|
|
|
|
|
|
|
|
|
|
|
|
|
|
|
|
|
|
|
|
|
Three months ended
In millions
|
|
|
|
|
|
|
Gain (Loss) Reclassified from
Accumulated OCI into Income
(Effective Portion)
|
|
|
Gain (Loss) Recognized in Income
on
Derivatives
(Ineffective Portion)
|
|
|
|
|
|
|
|
|
|
Location
|
|
Amount
|
|
|
Location
|
|
|
Amount
|
|
|
September 30, 2010
|
|
Interest rate contracts
|
|
$
|
341
|
|
|
Interest income
|
|
$
|
84
|
|
|
|
Interest income
|
|
|
$
|
(2
|
)
|
|
|
|
|
|
|
|
|
|
Noninterest income
|
|
|
8
|
|
|
|
|
|
|
|
|
|
|
September 30, 2009
|
|
Interest rate contracts
|
|
$
|
236
|
|
|
Interest income
|
|
$
|
87
|
|
|
|
Interest income
|
|
|
$
|
0
|
|
98
Derivatives Not Designated as
Hedging Instruments under GAAP
|
|
|
|
|
|
|
|
|
|
|
|
|
|
|
|
|
|
|
|
|
Three months ended
September 30
|
|
|
Nine months ended
September 30
|
|
|
In millions
|
|
2010
|
|
|
2009
|
|
|
2010
|
|
|
2009
|
|
|
Derivatives used for residential mortgage banking activities:
|
|
|
|
|
|
|
|
|
|
|
|
|
|
|
|
|
|
Residential mortgage servicing
|
|
|
|
|
|
|
|
|
|
|
|
|
|
|
|
|
|
Interest rate contracts
|
|
$
|
231
|
|
|
$
|
226
|
|
|
$
|
652
|
|
|
$
|
95
|
|
|
Loan sales
|
|
|
|
|
|
|
|
|
|
|
|
|
|
|
|
|
|
Interest rate contracts
|
|
|
(15
|
)
|
|
|
(63
|
)
|
|
|
(92
|
)
|
|
|
(56
|
)
|
|
Gains (losses) included in residential mortgage noninterest income
|
|
$
|
216
|
|
|
$
|
163
|
|
|
$
|
560
|
|
|
$
|
39
|
|
|
Derivatives used for commercial mortgage banking activities:
|
|
|
|
|
|
|
|
|
|
|
|
|
|
|
|
|
|
Interest rate contracts
|
|
$
|
(17
|
)
|
|
$
|
(22
|
)
|
|
$
|
(88
|
)
|
|
$
|
61
|
|
|
Credit contracts
|
|
|
(9
|
)
|
|
|
(27
|
)
|
|
|
(18
|
)
|
|
|
(26
|
)
|
|
Gains (losses) from commercial mortgage banking activities (a)
|
|
$
|
(26
|
)
|
|
$
|
(49
|
)
|
|
$
|
(106
|
)
|
|
$
|
35
|
|
|
Derivatives used for customer-related activities:
|
|
|
|
|
|
|
|
|
|
|
|
|
|
|
|
|
|
Interest rate contracts
|
|
$
|
(12
|
)
|
|
$
|
(19
|
)
|
|
$
|
(39
|
)
|
|
$
|
(1
|
)
|
|
Foreign exchange contracts
|
|
|
22
|
|
|
|
27
|
|
|
|
28
|
|
|
|
66
|
|
|
Equity contracts
|
|
|
(1
|
)
|
|
|
4
|
|
|
|
|
|
|
|
2
|
|
|
Credit contracts
|
|
|
|
|
|
|
|
|
|
|
(2
|
)
|
|
|
|
|
|
Gains (losses) from customer-related activities (a)
|
|
$
|
9
|
|
|
$
|
12
|
|
|
$
|
(13
|
)
|
|
$
|
67
|
|
|
Derivatives used for other risk management activities:
|
|
|
|
|
|
|
|
|
|
|
|
|
|
|
|
|
|
Interest rate contracts
|
|
$
|
(2
|
)
|
|
$
|
1
|
|
|
$
|
(16
|
)
|
|
$
|
19
|
|
|
Foreign exchange contracts
|
|
|
(5
|
)
|
|
|
(4
|
)
|
|
|
(3
|
)
|
|
|
(10
|
)
|
|
Credit contracts
|
|
|
1
|
|
|
|
(9
|
)
|
|
|
5
|
|
|
|
(23
|
)
|
|
Other contracts (b)
|
|
|
(56
|
)
|
|
|
(87
|
)
|
|
|
128
|
|
|
|
(145
|
)
|
|
Gains (losses) from other risk management activities (a)
|
|
$
|
(62
|
)
|
|
$
|
(99
|
)
|
|
$
|
114
|
|
|
$
|
(159
|
)
|
|
Total gains (losses) from derivatives not designated as hedging
instruments
|
|
$
|
137
|
|
|
$
|
27
|
|
|
$
|
555
|
|
|
$
|
(18
|
)
|
|
(a)
|
Included in other noninterest income.
|
|
(b)
|
Relates to BlackRock LTIP.
|
C
REDIT
D
ERIVATIVES
The credit derivative underlying is based on the credit risk of a specific entity, entities, or an index. As discussed above, we enter into credit derivatives, specifically credit default swaps and risk
participation agreements, as part of our commercial mortgage banking hedging activities and for customer and other risk management purposes. Further detail regarding credit default swaps and risk participations sold follows:
Credit Default Swaps
|
|
|
|
|
|
|
|
|
|
|
|
|
|
|
|
|
|
|
|
|
|
|
|
|
|
|
|
|
|
|
|
|
September 30, 2010
|
|
|
|
|
|
December 31, 2009
|
|
|
Dollars in millions
|
|
Notional
Amount
|
|
|
Estimated
Net Fair
Value
|
|
|
Weighted-
Average
Remaining
Maturity
In Years
|
|
|
|
|
|
Notional
Amount
|
|
|
Estimated
Net Fair
Value
|
|
|
Weighted-
Average
Remaining
Maturity
In Years
|
|
|
Credit Default Swaps – Sold
|
|
|
|
|
|
|
|
|
|
|
|
|
|
|
|
|
|
|
|
|
|
|
|
|
|
|
|
|
|
Single name
|
|
$
|
45
|
|
|
$
|
3
|
|
|
|
3.08
|
|
|
|
|
|
|
$
|
85
|
|
|
$
|
(4
|
)
|
|
|
3.18
|
|
|
Index traded
|
|
|
257
|
|
|
|
1
|
|
|
|
1.88
|
|
|
|
|
|
|
|
457
|
|
|
|
|
|
|
|
6.12
|
|
|
Total
|
|
$
|
302
|
|
|
$
|
4
|
|
|
|
2.06
|
|
|
|
|
|
|
$
|
542
|
|
|
$
|
(4
|
)
|
|
|
5.66
|
|
|
Credit Default Swaps – Purchased
|
|
|
|
|
|
|
|
|
|
|
|
|
|
|
|
|
|
|
|
|
|
|
|
|
|
|
|
|
|
Single name
|
|
$
|
362
|
|
|
$
|
5
|
|
|
|
2.59
|
|
|
|
|
|
|
$
|
586
|
|
|
$
|
1
|
|
|
|
3.69
|
|
|
Index traded
|
|
|
185
|
|
|
|
11
|
|
|
|
39.05
|
|
|
|
|
|
|
|
460
|
|
|
|
53
|
|
|
|
35.89
|
|
|
Total
|
|
$
|
547
|
|
|
$
|
16
|
|
|
|
14.92
|
|
|
|
|
|
|
$
|
1,046
|
|
|
$
|
54
|
|
|
|
17.85
|
|
|
Total
|
|
$
|
849
|
|
|
$
|
20
|
|
|
|
10.35
|
|
|
|
|
|
|
$
|
1,588
|
|
|
$
|
50
|
|
|
|
13.69
|
|
99
The notional amount of these credit default swaps by credit rating as of September 30, 2010 and
December 31, 2009 follows:
Credit Ratings of Credit Default Swaps
|
|
|
|
|
|
|
|
|
|
|
Dollars in millions
|
|
September 30,
2010
|
|
|
December 31,
2009
|
|
|
Credit Default Swaps – Sold
|
|
|
|
|
|
|
|
|
|
Investment grade (a)
|
|
$
|
281
|
|
|
$
|
496
|
|
|
Subinvestment grade (b)
|
|
|
21
|
|
|
|
46
|
|
|
Total
|
|
$
|
302
|
|
|
$
|
542
|
|
|
Credit Default Swaps – Purchased
|
|
|
|
|
|
|
|
|
|
Investment grade (a)
|
|
$
|
405
|
|
|
$
|
894
|
|
|
Subinvestment grade (b)
|
|
|
142
|
|
|
|
152
|
|
|
Total
|
|
$
|
547
|
|
|
$
|
1,046
|
|
|
Total
|
|
$
|
849
|
|
|
$
|
1,588
|
|
|
(a)
|
Investment grade with a rating of BBB-/Baa3 or above based on published rating agency information.
|
|
(b)
|
Subinvestment grade with a rating below BBB-/Baa3 based on published rating agency information.
|
The referenced/underlying assets for these credit default swaps as of September 30, 2010 and December 31, 2009 follow:
Referenced/Underlying Assets of Credit Default Swaps
|
|
|
|
|
|
|
|
|
|
|
|
|
|
|
|
|
Corporate
Debt
|
|
|
Commercial
mortgage-
backed
securities
|
|
|
Loans
|
|
|
September 30, 2010
|
|
|
69
|
%
|
|
|
22
|
%
|
|
|
9
|
%
|
|
December 31, 2009
|
|
|
66
|
%
|
|
|
29
|
%
|
|
|
5
|
%
|
We enter into credit default swaps under which we buy loss protection from or sell loss protection to a counterparty for the occurrence of a credit event related to a referenced entity or index. The
maximum amount we would be required to pay under the credit default swaps in which we sold protection,
assuming all referenced underlyings experience a credit event at a total loss, without recoveries, was $302 million at September 30, 2010 compared with $542 million at December 31,
2009.
Risk Participation Agreements
We have entered into risk participation agreements sold with terms ranging from less than one year to 21 years. We will be required to make payments under these agreements if a customer defaults on its
obligation to perform under certain derivative swap contracts with third parties.
Risk Participation Agreements Sold
|
|
|
|
|
|
|
|
|
|
|
|
|
|
|
Dollars in millions
|
|
Notional
Amount
|
|
|
Estimated
Net Fair
Value
|
|
|
Weighted-Average
Remaining
Maturity In Years
|
|
|
September 30, 2010
|
|
$
|
1,593
|
|
|
$
|
(3
|
)
|
|
|
1.60
|
|
|
December 31, 2009
|
|
$
|
1,728
|
|
|
$
|
(2
|
)
|
|
|
2.03
|
|
Based on our internal risk rating process of the underlying swap counterparties, the percentages of the exposure amount of risk participation agreements
sold by internal credit rating as of September 30, 2010 and December 31, 2009 follow:
Internal Credit Ratings of Risk
Participation Agreements Sold
|
|
|
|
|
|
|
|
|
|
|
|
|
September 30, 2010
|
|
|
December 31, 2009
|
|
|
Pass (a)
|
|
|
95
|
%
|
|
|
96
|
%
|
|
Below pass (b)
|
|
|
5
|
%
|
|
|
4
|
%
|
|
(a)
|
Indicates the expected risk of default is currently low.
|
|
(b)
|
Indicates a higher degree of risk of default.
|
Assuming all underlying swap counterparties defaulted at September 30, 2010, the exposure from these agreements would be $66 million based on the
fair value of the underlying swaps compared with $78 million at December 31, 2009.
100
N
OTE
13 E
ARNINGS
P
ER
S
HARE
Basic and Diluted Earnings per Common Share
|
|
|
|
|
|
|
|
|
|
|
|
|
|
|
|
|
|
|
|
|
Three months ended
September 30
|
|
|
Nine months ended
September 30
|
|
|
In millions, except per share data
|
|
2010
|
|
|
2009
|
|
|
2010
|
|
|
2009
|
|
|
Basic
|
|
|
|
|
|
|
|
|
|
|
|
|
|
|
|
|
|
Net income from continuing operations
|
|
$
|
775
|
|
|
$
|
540
|
|
|
$
|
2,204
|
|
|
$
|
1,255
|
|
|
Less:
|
|
|
|
|
|
|
|
|
|
|
|
|
|
|
|
|
|
Net income (loss) attributable to noncontrolling interests
|
|
|
2
|
|
|
|
(20
|
)
|
|
|
(12
|
)
|
|
|
(7
|
)
|
|
Dividends distributed to common shareholders
|
|
|
53
|
|
|
|
46
|
|
|
|
151
|
|
|
|
382
|
|
|
Dividends distributed to preferred shareholders
|
|
|
4
|
|
|
|
99
|
|
|
|
122
|
|
|
|
269
|
|
|
Dividends distributed to nonvested restricted shares
|
|
|
|
|
|
|
|
|
|
|
|
|
|
|
1
|
|
|
Preferred stock discount accretion and redemptions
|
|
|
3
|
|
|
|
13
|
|
|
|
254
|
|
|
|
42
|
|
|
Undistributed net income from continuing operations
|
|
$
|
713
|
|
|
$
|
402
|
|
|
$
|
1,689
|
|
|
$
|
568
|
|
|
Undistributed net income from discontinued operations
|
|
|
328
|
|
|
|
19
|
|
|
|
373
|
|
|
|
41
|
|
|
Undistributed net income
|
|
$
|
1,041
|
|
|
$
|
421
|
|
|
$
|
2,062
|
|
|
$
|
609
|
|
|
Percentage of undistributed income allocated to common shares
|
|
|
99.6
|
%
|
|
|
99.7
|
%
|
|
|
99.6
|
%
|
|
|
99.7
|
%
|
|
Undistributed income from continuing operations allocated to common shares
|
|
$
|
709
|
|
|
$
|
400
|
|
|
$
|
1,681
|
|
|
$
|
566
|
|
|
Plus: common dividends
|
|
|
53
|
|
|
|
46
|
|
|
|
151
|
|
|
|
382
|
|
|
Net income from continuing operations attributable to basic common shares
|
|
$
|
762
|
|
|
$
|
446
|
|
|
$
|
1,832
|
|
|
$
|
948
|
|
|
Net income from discontinued operations attributable to common shares
|
|
|
328
|
|
|
|
19
|
|
|
|
373
|
|
|
|
41
|
|
|
Net income attributable to basic common shares
|
|
$
|
1,090
|
|
|
$
|
465
|
|
|
$
|
2,205
|
|
|
$
|
989
|
|
|
Basic weighted-average common shares outstanding
|
|
|
523
|
|
|
|
460
|
|
|
|
515
|
|
|
|
451
|
|
|
Basic earnings per common share from continuing operations
|
|
$
|
1.45
|
|
|
$
|
.97
|
|
|
$
|
3.56
|
|
|
$
|
2.10
|
|
|
Basic earnings per common share from discontinued operations
|
|
|
.63
|
|
|
|
.04
|
|
|
|
.72
|
|
|
|
.09
|
|
|
Basic earnings per common share
|
|
$
|
2.08
|
|
|
$
|
1.01
|
|
|
$
|
4.28
|
|
|
$
|
2.19
|
|
|
Diluted
|
|
|
|
|
|
|
|
|
|
|
|
|
|
|
|
|
|
Net income from continuing operations attributable to basic common shares
|
|
$
|
762
|
|
|
$
|
446
|
|
|
$
|
1,832
|
|
|
$
|
948
|
|
|
Less: BlackRock common stock equivalents
|
|
|
3
|
|
|
|
5
|
|
|
|
11
|
|
|
|
9
|
|
|
Net income from continuing operations attributable to diluted common
shares
|
|
$
|
759
|
|
|
$
|
441
|
|
|
$
|
1,821
|
|
|
$
|
939
|
|
|
Net income from discontinued operations attributable to common shares
|
|
|
328
|
|
|
|
19
|
|
|
|
373
|
|
|
|
41
|
|
|
Net income attributable to diluted common shares
|
|
$
|
1,087
|
|
|
$
|
460
|
|
|
$
|
2,194
|
|
|
$
|
980
|
|
|
Basic weighted-average common shares outstanding
|
|
|
523
|
|
|
|
460
|
|
|
|
515
|
|
|
|
451
|
|
|
Dilutive potential common shares (a) (b)
|
|
|
3
|
|
|
|
1
|
|
|
|
3
|
|
|
|
1
|
|
|
Diluted weighted-average common shares outstanding
|
|
|
526
|
|
|
|
461
|
|
|
|
518
|
|
|
|
452
|
|
|
Diluted earnings per common share from continuing operations
|
|
$
|
1.45
|
|
|
$
|
.96
|
|
|
$
|
3.52
|
|
|
$
|
2.08
|
|
|
Diluted earnings per common share from discontinued operations
|
|
|
.62
|
|
|
|
.04
|
|
|
|
.72
|
|
|
|
.09
|
|
|
Diluted earnings per common share
|
|
$
|
2.07
|
|
|
$
|
1.00
|
|
|
$
|
4.24
|
|
|
$
|
2.17
|
|
|
(a)Excludes stock options considered to be anti-dilutive
|
|
|
13
|
|
|
|
15
|
|
|
|
11
|
|
|
|
16
|
|
|
(b)Excludes warrants considered to be anti-dilutive
|
|
|
22
|
|
|
|
22
|
|
|
|
22
|
|
|
|
22
|
|
101
N
OTE
14 T
OTAL
E
QUITY
A
ND
O
THER
C
OMPREHENSIVE
I
NCOME
Activity in total equity for the first nine months of 2010 follows. The par value
of our preferred stock outstanding at September 30, 2010 totaled $.1 million and is excluded from the table.
Rollforward of Total
Equity
|
|
|
|
|
|
|
|
|
|
|
|
|
|
|
|
|
|
|
|
|
|
|
|
|
|
|
|
|
|
|
|
|
|
|
|
|
|
|
|
|
Shareholders’ Equity
|
|
|
In millions
|
|
Shares
Outstanding
Common
Stock
|
|
|
Common
Stock
|
|
|
Capital
Surplus –
Preferred
Stock
|
|
|
Capital
Surplus –
Common
Stock
and
Other
|
|
|
Retained
Earnings
|
|
|
Accumulated
Other
Comprehensive
Income (Loss)
|
|
|
Treasury
Stock
|
|
|
Noncontrolling
Interests
|
|
|
Total
Equity
|
|
|
Balance at December 31, 2009
|
|
|
462
|
|
|
$
|
2,354
|
|
|
$
|
7,974
|
|
|
$
|
8,945
|
|
|
$
|
13,144
|
|
|
$
|
(1,962
|
)
|
|
$
|
(513
|
)
|
|
$
|
2,625
|
|
|
$
|
32,567
|
|
|
Cumulative effect of adopting ASU 2009-17,
Consolidations
|
|
|
|
|
|
|
|
|
|
|
|
|
|
|
|
|
|
|
(92
|
)
|
|
|
(13
|
)
|
|
|
|
|
|
|
|
|
|
|
(105
|
)
|
|
Balance at January 1, 2010
|
|
|
462
|
|
|
$
|
2,354
|
|
|
$
|
7,974
|
|
|
$
|
8,945
|
|
|
$
|
13,052
|
|
|
$
|
(1,975
|
)
|
|
$
|
(513
|
)
|
|
$
|
2,625
|
|
|
$
|
32,462
|
|
|
Net income
|
|
|
|
|
|
|
|
|
|
|
|
|
|
|
|
|
|
|
2,589
|
|
|
|
|
|
|
|
|
|
|
|
(12
|
)
|
|
|
2,577
|
|
|
Other comprehensive income (loss), net of tax
|
|
|
|
|
|
|
|
|
|
|
|
|
|
|
|
|
|
|
|
|
|
|
|
|
|
|
|
|
|
|
|
|
|
|
|
|
|
Other-than-temporary impairment losses on debt securities
|
|
|
|
|
|
|
|
|
|
|
|
|
|
|
|
|
|
|
|
|
|
|
185
|
|
|
|
|
|
|
|
|
|
|
|
185
|
|
|
Net unrealized securities gains
|
|
|
|
|
|
|
|
|
|
|
|
|
|
|
|
|
|
|
|
|
|
|
1,318
|
|
|
|
|
|
|
|
|
|
|
|
1,318
|
|
|
Net unrealized gains on cash flow hedge derivatives
|
|
|
|
|
|
|
|
|
|
|
|
|
|
|
|
|
|
|
|
|
|
|
488
|
|
|
|
|
|
|
|
|
|
|
|
488
|
|
|
Pension, other postretirement and postemployment benefit plan adjustments
|
|
|
|
|
|
|
|
|
|
|
|
|
|
|
|
|
|
|
|
|
|
|
140
|
|
|
|
|
|
|
|
|
|
|
|
140
|
|
|
Other
|
|
|
|
|
|
|
|
|
|
|
|
|
|
|
|
|
|
|
|
|
|
|
(10
|
)
|
|
|
|
|
|
|
|
|
|
|
(10
|
)
|
|
Comprehensive income
|
|
|
|
|
|
|
|
|
|
|
|
|
|
|
|
|
|
|
|
|
|
|
|
|
|
|
|
|
|
|
(12
|
)
|
|
|
4,698
|
|
|
Cash dividends declared
|
|
|
|
|
|
|
|
|
|
|
|
|
|
|
|
|
|
|
|
|
|
|
|
|
|
|
|
|
|
|
|
|
|
|
|
|
|
Common ($.30 per share)
|
|
|
|
|
|
|
|
|
|
|
|
|
|
|
|
|
|
|
(151
|
)
|
|
|
|
|
|
|
|
|
|
|
|
|
|
|
(151
|
)
|
|
Preferred
|
|
|
|
|
|
|
|
|
|
|
|
|
|
|
|
|
|
|
(122
|
)
|
|
|
|
|
|
|
|
|
|
|
|
|
|
|
(122
|
)
|
|
Redemption of Series N (TARP)
|
|
|
|
|
|
|
|
|
|
|
|
|
|
|
|
|
|
|
|
|
|
|
|
|
|
|
|
|
|
|
|
|
|
|
|
|
|
Preferred Stock
|
|
|
|
|
|
|
|
|
|
|
(7,579
|
)
|
|
|
|
|
|
|
|
|
|
|
|
|
|
|
|
|
|
|
|
|
|
|
(7,579
|
)
|
|
Preferred stock discount accretion and redemptions
|
|
|
|
|
|
|
|
|
|
|
251
|
|
|
|
|
|
|
|
(254
|
)
|
|
|
|
|
|
|
|
|
|
|
|
|
|
|
(3
|
)
|
|
Common stock activity (a)
|
|
|
65
|
|
|
|
326
|
|
|
|
|
|
|
|
3,093
|
|
|
|
|
|
|
|
|
|
|
|
|
|
|
|
|
|
|
|
3,419
|
|
|
Treasury stock activity
|
|
|
(1
|
)
|
|
|
|
|
|
|
|
|
|
|
(55
|
)
|
|
|
|
|
|
|
|
|
|
|
(39
|
)
|
|
|
|
|
|
|
(94
|
)
|
|
Other
|
|
|
|
|
|
|
|
|
|
|
|
|
|
|
25
|
|
|
|
|
|
|
|
|
|
|
|
|
|
|
|
11
|
|
|
|
36
|
|
|
Balance at September 30, 2010
|
|
|
526
|
|
|
$
|
2,680
|
|
|
$
|
646
|
|
|
$
|
12,008
|
|
|
$
|
15,114
|
|
|
$
|
146
|
|
|
$
|
(552
|
)
|
|
$
|
2,624
|
|
|
$
|
32,666
|
|
|
(a)
|
Includes 63.9 million common shares issuance, the net proceeds of which were used together with other available funds to redeem the Series N (TARP) Preferred
Stock, for a $3.4 billion net increase in total equity.
|
Comprehensive income for the first nine months of 2009 was $3.4
billion.
Change in Accumulated Other Comprehensive Income (Loss)
|
|
|
|
|
|
|
|
|
|
|
|
|
|
|
Nine months ended September 30, 2010
In millions
|
|
Pretax
|
|
|
Tax (Expense)
Benefit
|
|
|
After-tax
|
|
|
Change in net unrealized securities losses:
|
|
|
|
|
|
|
|
|
|
|
|
|
|
Decrease in net unrealized losses for securities with OTTI charges
|
|
$
|
5
|
|
|
$
|
(2
|
)
|
|
$
|
3
|
|
|
Less: OTTI losses realized in net income
|
|
|
(281
|
)
|
|
|
99
|
|
|
|
(182
|
)
|
|
Change in net unrealized losses on OTTI securities
|
|
|
286
|
|
|
|
(101
|
)
|
|
|
185
|
|
|
Increase in net unrealized gains arising during the period for non-OTTI securities
|
|
|
2,463
|
|
|
|
(913
|
)
|
|
|
1,550
|
|
|
Less: Net gains realized in net income
|
|
|
358
|
|
|
|
(126
|
)
|
|
|
232
|
|
|
Change in net unrealized gains on non-OTTI securities
|
|
|
2,105
|
|
|
|
(787
|
)
|
|
|
1,318
|
|
|
Change in net unrealized securities losses
|
|
|
2,391
|
|
|
|
(888
|
)
|
|
|
1,503
|
|
|
Change in net unrealized gains on cash flow hedge derivatives:
|
|
|
|
|
|
|
|
|
|
|
|
|
|
Increase in net unrealized gains during the period on cash flow hedge derivatives
|
|
|
1,066
|
|
|
|
(394
|
)
|
|
|
672
|
|
|
Less: Net gains realized in net income
|
|
|
292
|
|
|
|
(108
|
)
|
|
|
184
|
|
|
Change in net unrealized gains on cash flow hedge derivatives
|
|
|
774
|
|
|
|
(286
|
)
|
|
|
488
|
|
|
Change in pension, other postretirement and postemployment benefit plan
adjustments
|
|
|
222
|
|
|
|
(82
|
)
|
|
|
140
|
|
|
Change in other, net
|
|
|
(23
|
)
|
|
|
13
|
|
|
|
(10
|
)
|
|
Change in other comprehensive income (loss)
|
|
$
|
3,364
|
|
|
$
|
(1,243
|
)
|
|
$
|
2,121
|
|
102
Accumulated Other Comprehensive
Income (Loss) Components
|
|
|
|
|
|
|
|
|
|
|
|
|
|
|
|
|
|
|
|
|
September 30, 2010
|
|
|
December 31, 2009
|
|
|
In millions
|
|
Pretax
|
|
|
After-tax
|
|
|
Pretax
|
|
|
After-tax
|
|
|
Net unrealized securities gains/(losses)
|
|
$
|
878
|
|
|
$
|
545
|
|
|
$
|
(1,207
|
)
|
|
$
|
(760
|
)
|
|
OTTI losses on debt securities
|
|
|
(1,010
|
)
|
|
|
(631
|
)
|
|
|
(1,296
|
)
|
|
|
(816
|
)
|
|
Net unrealized gains on cash flow hedge derivatives
|
|
|
1,037
|
|
|
|
654
|
|
|
|
263
|
|
|
|
166
|
|
|
Pension, other postretirement and postemployment benefit plan adjustments
|
|
|
(636
|
)
|
|
|
(402
|
)
|
|
|
(858
|
)
|
|
|
(542
|
)
|
|
Other, net
|
|
|
(50
|
)
|
|
|
(20
|
)
|
|
|
(27
|
)
|
|
|
(10
|
)
|
|
Accumulated other comprehensive income (loss)
|
|
$
|
219
|
|
|
$
|
146
|
|
|
$
|
(3,125
|
)
|
|
$
|
(1,962
|
)
|
Repurchase of Outstanding TARP Preferred Stock and Sale by US Treasury of TARP Warrant
Note 19 Equity in our 2009 Form 10-K describes our December 31, 2008 issuance of 75,792 shares of our Fixed Rate Cumulative Perpetual Preferred
Shares, Series N (Series N Preferred Stock), related issuance discount and issuance of the warrant to purchase common shares to the US Treasury under the TARP Capital Purchase Program.
As approved by the Federal Reserve Board, US Treasury and our other banking regulators, on February 10, 2010, we redeemed all 75,792 shares of our Series N Preferred Stock held by the US Treasury
totaling $7.6 billion. We used the net proceeds from the common stock and senior notes offerings described in Note 28 Subsequent Events in our 2009 Form 10-K and other funds to redeem the Series N Preferred Stock.
In connection with the redemption of the Series N Preferred Stock, we accelerated the accretion of the remaining issuance discount on the Series N
Preferred Stock and recorded a corresponding reduction in retained earnings of $250 million during the first quarter of 2010. This resulted in a one-time, noncash reduction in net income attributable to common shareholders and related basic and
diluted earnings per share.
Dividends of $89 million were paid on February 10, 2010 when the Series N Preferred Stock was redeemed. PNC
paid total dividends of $421 million to the US Treasury while the Series N preferred shares were outstanding.
After exchanging its TARP
Warrant for 16,885,192 warrants, each to purchase one share of PNC common stock, the US Treasury sold the warrants in a secondary public offering. The sale closed on May 5, 2010.
N
OTE
15 I
NCOME
T
AXES
The net operating loss carryforwards and tax credit carryforwards at September 30, 2010 and December 31, 2009 follow:
Net Operating Loss Carryforwards and Tax Credit Carryforwards
|
|
|
|
|
|
|
|
|
|
|
In millions
|
|
September 30,
2010
|
|
|
December 31,
2009
|
|
|
Net Operating Loss Carryforwards:
|
|
|
|
|
|
|
|
|
|
Federal
|
|
|
|
|
|
$
|
1,200
|
|
|
State
|
|
$
|
1,630
|
|
|
|
2,000
|
|
|
Valuation allowance – State
|
|
|
31
|
|
|
|
31
|
|
|
Tax Credit Carryforwards:
|
|
|
|
|
|
|
|
|
|
Federal
|
|
|
|
|
|
$
|
254
|
|
|
State
|
|
$
|
4
|
|
|
|
4
|
|
The federal net operating loss and tax credit carryforwards from December 31, 2009 were all utilized as of September 30, 2010.
The state net operating loss carryforwards will expire from 2010 to 2031. We have established a valuation allowance of $31 million relating to the state
net operating losses at both September 30, 2010 and December 31, 2009.
The state tax credit carryforwards will expire from 2012 to
2031. We have established that no valuation allowance relating to the state tax credits is necessary based upon all available positive and negative evidence including PNC’s forecast of future taxable income.
PNC’s consolidated federal income tax returns through 2006 have been audited by the IRS and we have resolved all matters through the IRS Appeals
Division. The IRS began its examination of PNC’s 2007 and 2008 consolidated federal income tax returns during the third quarter of 2010.
103
The consolidated federal income tax returns of National City through 2007 have been audited by the IRS.
Included in the 2003-2004 examination and the 2005-2007 examination were certain adjustments which are under review by the IRS Appeals Division. We do not anticipate any significant adverse impact to net income. The IRS began its examination of
National City’s 2008 consolidated federal income tax return during the third quarter of 2010. Also, in July 2010, we received a favorable IRS letter ruling that resolved a prior tax position and resulted in a tax benefit of $89 million.
We had unrecognized tax benefits of $246 million at September 30, 2010 and $227 million at December 31, 2009. At September 30,
2010, the amount of unrecognized tax benefits that if recognized would impact the effective tax rate was $120 million.
It is reasonably
possible that the liability for uncertain tax positions could increase or decrease in the next twelve months due to completion of tax authorities’ exams or the expiration of statutes of limitations. Management estimates that the liability for
uncertain tax positions could decrease by $16 million within the next twelve months.
N
OTE
16
S
UMMARIZED
F
INANCIAL
I
NFORMATION
OF
B
LACK
R
OCK
Summarized Consolidated Financial Information of BlackRock
|
|
|
|
|
|
|
|
|
|
|
In millions
|
|
Nine months ended
September 30
|
|
|
|
|
2010
|
|
|
2009
|
|
|
Total revenue
|
|
$
|
6,119
|
|
|
$
|
3,156
|
|
|
Total expenses
|
|
|
4,061
|
|
|
|
2,267
|
|
|
Operating income
|
|
|
2,058
|
|
|
|
889
|
|
|
Non-operating income (expense)
|
|
|
5
|
|
|
|
(24
|
)
|
|
Income before income taxes
|
|
|
2,063
|
|
|
|
865
|
|
|
Income tax expense
|
|
|
662
|
|
|
|
225
|
|
|
Net income
|
|
|
1,401
|
|
|
|
640
|
|
|
Less: net income (loss) attributable to non-controlling interests
|
|
|
(5
|
)
|
|
|
21
|
|
|
Net income attributable to BlackRock
|
|
$
|
1,406
|
|
|
$
|
619
|
|
|
|
|
|
|
|
|
|
|
|
|
In millions
|
|
Three months ended
September 30
|
|
|
|
|
2010
|
|
|
2009
|
|
|
Total revenue
|
|
$
|
2,092
|
|
|
$
|
1,140
|
|
|
Total expenses
|
|
|
1,385
|
|
|
|
783
|
|
|
Operating income
|
|
|
707
|
|
|
|
357
|
|
|
Non-operating income
|
|
|
78
|
|
|
|
78
|
|
|
Income before income taxes
|
|
|
785
|
|
|
|
435
|
|
|
Income tax expense
|
|
|
201
|
|
|
|
101
|
|
|
Net income
|
|
|
584
|
|
|
|
334
|
|
|
Less: net income attributable to non-controlling interests
|
|
|
33
|
|
|
|
17
|
|
|
Net income attributable to BlackRock
|
|
$
|
551
|
|
|
$
|
317
|
|
N
OTE
17 L
EGAL
P
ROCEEDINGS
The disclosure below updates the description of legal proceedings in Note 24 Legal Proceedings in Part II, Item 8 of our 2009
Annual Report on Form 10-K and in Note 17 Legal Proceedings in Part I, Item 1 of our first and second quarter 2010 Quarterly Reports on Form 10-Q (the “Prior Filings”).
In accordance with ASC 450-20-25, we establish accruals for legal proceedings when information related to the loss contingencies represented by those matters indicates both that a liability is probable
and that the amount of loss can be reasonably estimated. Any such accruals are adjusted thereafter if appropriate in light of changed circumstances. We cannot provide any assurance that any amounts already accrued will represent the ultimate loss to
us from the legal proceeding in question.
In our experience, legal proceedings are inherently unpredictable, and in many legal proceedings
various factors exacerbate this inherent unpredictability, including where the damages sought are unsubstantiated or indeterminate, it is unclear whether a case brought as a class action will be allowed to proceed on that basis (and, if proceeding
as a class action, how the class will be defined), discovery is not complete, the proceeding is not yet in its final stages, the matters present legal uncertainties, there are significant facts in dispute, there are a large number of parties
(including where it is uncertain how liability, if any, will be shared among multiple defendants), or there is a wide range of potential results.
National City Matters
In December 2008, we completed the acquisition of National
City through the merger of National City into The PNC Financial Services Group, Inc. As a result, we are now responsible for litigation and other claims pending against National City and its subsidiaries at that time. We are also responsible for
litigation and other claims arising out of the conduct of the business of National City and its subsidiaries before the acquisition that have been or will be in the future brought against us.
The lawsuits and other matters described below arise from National City’s business prior to the merger. We may be responsible for indemnifying individual defendants in these lawsuits and other
matters.
ERISA Cases.
The settlement reached by the parties in February 2010 remains subject to, among other things, final court
approval. The court has scheduled a final settlement approval hearing for November 2010. The amount of the settlement is immaterial and has been accrued.
104
Securities and State Law Fiduciary Cases.
|
|
•
|
|
In the lawsuit filed in August 2008 in the Palm Beach County, Florida, Circuit Court against National City and certain officers and directors of
National City, the settlement reached by the parties in March 2010 remains subject to, among other things, final court approval. The court has scheduled a final settlement approval hearing for December 2010. The amount of the settlement is
immaterial and has been accrued.
|
|
|
•
|
|
In the lawsuit filed in December 2008 in the United States District Court for the Northern District of Ohio against National City and some of its
officers and directors, the settlement reached by the parties in July 2010 remains subject to, among other things, final court approval. The court has scheduled a final settlement approval hearing for November 2010. The amount of the settlement is
immaterial and has been accrued.
|
Mortgage-Related Litigation
In October 2010, the Federal Home Loan Bank of Chicago brought a lawsuit in the Circuit Court of Cook County, Illinois, against numerous financial
companies, including The PNC Financial Services Group, Inc., as successor in interest to National City Corporation, and PNC Investments LLC, as successor in interest to National City Investments, Inc. The complaint alleges that the defendants have
liability to the Federal Home Loan Bank of Chicago in a variety of capacities (in the case of the National City entities, as underwriters) under Illinois state securities law and common law in connection with the alleged purchase of private-label
mortgage-backed securities by the Federal Home Loan Bank of Chicago. According to the complaint, the Federal Home Loan Bank of Chicago purchased approximately $3.3 billion in mortgage-backed securities in total in transactions addressed by the
complaint, approximately $345 million of which was allegedly in transactions involving the National City entities. The complaint alleges misrepresentations and omissions in connection with the sales of the mortgage-backed securities in question. The
Federal Home Loan Bank seeks rescission, unspecified compensatory damages, interest, attorneys’ fees, costs, and any other relief deemed proper by the court.
Adelphia
In September 2010, the parties in the lawsuit being prosecuted by the
Adelphia Recovery Trust reached a tentative settlement. The settlement is subject, among other things, to final documentation and court approval. Our share of the settlement is immaterial and has been accrued.
CBNV Mortgage Litigation
In
September 2010, the United States Court of Appeals for the Third Circuit vacated the district court’s class certification decision and approval of the class settlement in the class action lawsuit in which the plaintiffs and class members have
second mortgages that were assigned to Residential Finance
Corporation (“RFC”) and remanded the case to the district court for further proceedings. The plaintiffs in this litigation allege an illegal home equity lending scheme involving CBNV,
another bank and RFC. Plaintiffs allege violations of the Real Estate Settlement Procedures Act (“RESPA”), the Racketeer Influenced and Corrupt Organizations Act, and certain state laws.
In connection with their appeal, the objecting class members asserted that CBNV’s annual percentage rate disclosures violated the Truth in Lending
Act (“TILA”) and the Home Ownership and Equity Protection Act (“HOEPA”), that those claims are very valuable, and that the settling plaintiffs should have asserted those claims. The settling plaintiffs advanced a number of
reasons why they did not assert TILA/HOEPA claims. The court of appeals decision focused on the district court’s finding that such claims were time-barred and for that reason not viable.
The court of appeals remanded the case to the United States District Court for the Western District of Pennsylvania for consideration of certain aspects of its decision certifying the settlement class and
approving the settlement. The court of appeals instructed the district court to consider (a) whether a sub-class should be created for class members whose transactions occurred within one year (the limitations period for RESPA and TILA/HOEPA claims)
of the date of filing of the earliest complaint in these actions, (b) whether class counsel is adequate in light of counsel’s justifications for not bringing TILA/HOEPA claims, and (c) whether a sub-class of North Carolina borrowers should be
created.
In the proceedings in the General Court of Justice, Superior Court Division, for Wake County, North Carolina and the North Carolina
Court of Appeals, in September 2010, one of the plaintiffs filed papers seeking permission to proceed with certification proceedings for a class of North Carolina borrowers, noting that the injunction against such class proceedings contained in the
order of the Pennsylvania federal district court’s order approving the settlement will expire when the decision of the federal court of appeals becomes final.
The remand to the federal district court for consideration of the issues described above increases the unpredictability of our exposure in our CBNV mortgage cases.
Overdraft Litigation
In August
2010, the Judicial Panel on Multidistrict Litigation denied the motion to transfer to the United States District Court for the Southern District of Florida (the “MDL Court”) the lawsuit pending against National City Bank in the United
States District Court for the District of Columbia. The plaintiffs have filed a motion with the District of Columbia court for preliminary approval of the parties’ settlement. A member of the proposed settlement class, who is the named
plaintiff in another lawsuit filed in the MDL Court, has filed objections to approval of this settlement. If preliminary
105
approval is granted, the settlement of the lawsuit pending in the District of Columbia would be subject to, among other things, notice to the proposed class and final court approval. The amount
of the settlement is immaterial and has been accrued.
Regulatory and Governmental Inquiries
Numerous federal and state governmental, legislative and regulatory authorities are investigating practices in the mortgage lending and servicing
industries. PNC has received inquiries from governmental, legislative and regulatory authorities on this topic and is cooperating with these inquiries. These inquiries may lead to administrative, civil or criminal proceedings, possibly resulting in
remedies including fines, penalties, restitution, or alterations in our business practices. At this time, as a result of the number and range of authorities conducting the investigations and inquiries, as well as the nature of these types of
investigations and inquiries, among other factors, PNC cannot predict the cost to or effect on PNC from potential governmental, legislative or regulatory actions arising out of these investigations and inquiries.
N
OTE
18 C
OMMITMENTS
AND
G
UARANTEES
E
QUITY
F
UNDING
A
ND
O
THER
C
OMMITMENTS
Our unfunded commitments at September 30, 2010 included private equity investments of $370 million and other investments of $21 million.
S
TANDBY
L
ETTERS
OF
C
REDIT
We issue standby letters of credit and have risk participations in standby letters of credit and bankers’ acceptances issued by other financial
institutions, in each case to support obligations of our customers to third parties, such as remarketing programs for customers’ variable rate demand notes. Net outstanding standby letters of credit and internal credit ratings were as follows:
Net Outstanding Standby Letters of Credit
|
|
|
|
|
|
|
|
|
|
|
Dollars in billions
|
|
September 30
2010
|
|
|
December 31
2009
|
|
|
Net outstanding standby letters of credit
|
|
$
|
9.9
|
|
|
$
|
10.0
|
|
|
Internal credit ratings (as percentage of portfolio):
|
|
|
|
|
|
|
|
|
|
Pass (a)
|
|
|
90
|
%
|
|
|
86
|
%
|
|
Below pass (b)
|
|
|
10
|
%
|
|
|
14
|
%
|
|
(a)
|
Indicates that expected risk of loss is currently low.
|
|
(b)
|
Indicates a higher degree of risk of default.
|
If the customer fails to meet its financial or performance obligation to the third party under the terms of the contract or there is a need to support a
remarketing program, then upon the request of the guaranteed party, we would be obligated to make payment to them. The standby letters of credit and risk participations in standby letters of credit and bankers’ acceptances outstanding on
September 30, 2010 had terms
ranging from less than 1 year to 9 years. The aggregate maximum amount of future payments PNC could be required to make under outstanding standby letters of credit and risk participations in
standby letters of credit and bankers’ acceptances was $12.7 billion at September 30, 2010, of which $6.3 billion support remarketing programs.
As of September 30, 2010, assets of $2.1 billion secured certain specifically identified standby letters of credit. Recourse provisions from third parties of $2.8 billion were also available for this
purpose as of September 30, 2010. In addition, a portion of the remaining standby letters of credit and letter of credit risk participations issued on behalf of specific customers is also secured by collateral or guarantees that secure the
customers’ other obligations to us. The carrying amount of the liability for our obligations related to standby letters of credit and risk participations in standby letters of credit and bankers’ acceptances was $233 million at
September 30, 2010.
S
TANDBY
B
OND
P
URCHASE
A
GREEMENTS
AND
O
THER
L
IQUIDITY
F
ACILITIES
We enter into standby bond purchase
agreements to support municipal bond obligations. At September 30, 2010, the aggregate of our commitments under these facilities was $328 million. We also enter into certain other liquidity facilities to support individual pools of receivables
acquired by commercial paper conduits. At September 30, 2010 our total commitments under these facilities were $145 million.
I
NDEMNIFICATIONS
As further described in our 2009 Form 10-K, we are a party to numerous acquisition or divestiture agreements under which we have purchased or sold, or
agreed to purchase or sell, various types of assets. These agreements generally include indemnification provisions under which we indemnify the third parties to these agreements against a variety of risks to the indemnified parties as a result of
the transaction in question. When PNC is the seller, the indemnification provisions will generally also provide the buyer with protection relating to the quality of the assets we are selling and the extent of any liabilities being assumed by the
buyer. Due to the nature of these indemnification provisions, we cannot quantify the total potential exposure to us resulting from them.
We
provide indemnification in connection with securities offering transactions in which we are involved. When we are the issuer of the securities, we provide indemnification to the underwriters or placement agents analogous to the indemnification
provided to the purchasers of businesses from us, as described above. When we are an underwriter or placement agent, we provide a limited indemnification to the issuer related to our actions in connection with the offering and, if there are other
underwriters, indemnification to the other underwriters intended to result in an appropriate sharing
106
of the risk of participating in the offering. Due to the nature of these indemnification provisions, we cannot quantify the total potential exposure to us resulting from them.
In the ordinary course of business, we enter into certain types of agreements that include provisions for indemnifying third parties. We also enter into
certain types of agreements, including leases, assignments of leases, and subleases, in which we agree to indemnify third parties for acts by our
agents, assignees and/or sublessees, and employees. We also enter into contracts for the delivery of technology service in which we indemnify the other party against claims of patent and copyright
infringement by third parties. Due to the nature of these indemnification provisions, we cannot calculate our aggregate potential exposure under them.
We engage in certain insurance activities which require our employees to be bonded. We satisfy this bonding requirement by issuing letters of credit which were insignificant at September 30, 2010.
In the ordinary course of business, we enter into contracts with third parties under which the third parties provide services on behalf of
PNC. In many of these contracts, we agree to indemnify the third party service provider under certain circumstances. The terms of the indemnity vary from contract to contract and the amount of the indemnification liability, if any, cannot be
determined.
We are a general or limited partner in certain asset management and investment limited partnerships, many of which contain
indemnification provisions that would require us to make payments in excess of our remaining funding commitments. While in certain of these partnerships the maximum liability to us is limited to the sum of our unfunded commitments and partnership
distributions received by us, in the others the indemnification liability is unlimited. As a result, we cannot determine our aggregate potential exposure for these indemnifications.
Pursuant to their bylaws, PNC and its subsidiaries provide indemnification to directors, officers and, in some cases, employees and agents against certain liabilities incurred as a result of their service
on behalf of or at the request of PNC and its subsidiaries. PNC and its subsidiaries also advance on behalf of covered individuals costs incurred in connection with certain claims or proceedings, subject to written undertakings by each such
individual to repay all amounts advanced if it is ultimately determined that the individual is not entitled to indemnification. We generally are responsible for similar indemnifications and advancement obligations that companies we acquire had to
their officers, directors and sometimes employees and agents at the time of acquisition. We advanced such costs on behalf of several such individuals with respect to pending litigation or investigations during the first nine months of 2010. It is
not possible for us to determine the aggregate potential exposure resulting from the obligation to provide this indemnity or to advance such costs.
In connection with the sale of GIS, PNC agreed to continue to act for the benefit of GIS as securities
lending agent for certain of GIS’s clients. In such role, we provide indemnification to those clients against the failure of the borrowers to return the securities. The market value of the securities lent is fully secured on a daily basis;
therefore, the exposure to us is limited to temporary shortfalls in the collateral as a result of short-term fluctuations in trading prices of the loaned securities. At September 30, 2010, the total maximum potential exposure as a result of
these indemnity obligations was $6.6 billion, although the collateral at the time exceeded that amount. In addition, the purchaser of GIS, The Bank of New York Mellon Corporation, has entered into an agreement to indemnify PNC with respect to such
exposure on the terms set forth in such indemnification agreement.
V
ISA
I
NDEMNIFICATION
Our payment services business issues and acquires credit and debit card transactions through Visa U.S.A. Inc. card association or its
affiliates (Visa). Our 2009 Form 10-K has additional information regarding the October 2007 Visa restructuring, our involvement with judgment and loss sharing agreements with Visa and certain other banks, and other 2009 developments in this area.
In May 2010, Visa funded $500 million to their litigation escrow account and reduced the conversion ratio of Visa B to A shares. We
consequently recognized our estimated $47 million share of the $500 million as a reduction of our indemnification liability and a reduction of noninterest expense.
In September 2010, Visa announced their intention to fund their litigation escrow account by $800 million. This announcement did not have an impact on our Visa indemnification liability as of
September 30, 2010. This funding occurred in October 2010. As a result, we expect to recognize an additional $76 million reduction of the indemnification liability.
Our Visa indemnification liability included on our Consolidated Balance Sheet at September 30, 2010 totaled $146 million as a result of the indemnification provision in Section 2.05j of the Visa
By-Laws and/or the indemnification provided through the judgment and loss sharing agreements which is considered appropriate at this time in consideration of the Visa announcement. Any ultimate exposure to the specified Visa litigation may be
different than this amount.
R
ECOURSE
A
GREEMENTS
We are authorized to originate, underwrite, close to fund and service commercial mortgage loans and then sell them to FNMA under FNMA’s DUS program.
We have similar arrangements with FHLMC.
Under these programs, we generally assume up to one-third of the risk of loss on unpaid principal
balances through a loss
107
share arrangement. At September 30, 2010, the potential exposure to loss was $4.0 billion. Accordingly, we maintain a reserve for such potential losses. At September 30, 2010, the
unpaid principal balance outstanding of loans sold as a participant in these programs was $13.4 billion. The reserves for losses under these programs, totaled $30 million as of September 30, 2010 and is included in Other liabilities on our
Consolidated Balance Sheet. If payment is required under these programs, we would not have a contractual interest in the collateral underlying the mortgage loans on which losses occurred, although the value of the collateral is taken into account in
determining our share of such losses. The serviced loans are not included on our Consolidated Balance Sheet.
We sell residential mortgage
loans pursuant to agreements which require us to make certain representations and warranties to investors for defects that may have occurred during the origination of the sold loans. Key aspects of such representations and warranties cover the
loan’s compliance with any applicable loan criteria established by the investor, including underwriting standards; delivery of all required loan documents to the investor or its designated party; and the ownership of the loan and validity of
the lien securing the loan. As a result of these contractual obligations, investors may request PNC to indemnify them against losses on certain loans or to repurchase loans in which investors believe a breach in an origination representation and
warrant has occurred. We respond to these requests within 30 to 60 days. During 2009 and the first nine months of 2010 the frequency of indemnification and repurchase requests increased in relation to prior years. This increase was primarily driven
by higher sold loan delinquencies, resulting from deterioration in the overall economic conditions and trends, particularly those impacting the residential housing sector.
We have established reserves pursuant to these recourse agreements based on claims made and our estimate of expected future claims on a loan by loan basis which relate primarily to loans originated in
years 2006-2008. Origination and sale of residential mortgages is an ongoing business activity and, accordingly, management continually assesses the need for reserves pursuant to the associated recourse agreements. Because the amount of future
claims made could exceed our estimate or the extent of risk could be greater than that which we assumed in establishing our reserve, potential exists for additional loss above our established recourse reserves. Additionally, because the ultimate
amount of claims made is based on the behavior of each counterparty to the original loan sale, as well as our ability to negotiate a mutually satisfactory resolution, we are unable to estimate the amount of loss that could occur in excess of our
established reserves.
Additionally, prior to the acquisition, National City also sold home equity loans/lines of credit under agreements with
similar contractual loan representation and warranties. We have established a reserve of approximately 2% on a portfolio of $6 billion covered by the representation and warranties
agreement. These activities were part of a brokered home equity business that PNC is no longer engaged in.
Upon completion of its own investigation as to the validity of the claim, PNC will repurchase or provide indemnification on such loans where appropriate. This may take the form of an outright repurchase
of the loan or a settlement payment to the investor. If the loan is repurchased it is properly considered in our nonperforming loan disclosures and statistics.
Management maintains a liability for estimated losses on loans expected to be repurchased, or on which indemnification is expected to be provided, and regularly evaluates the adequacy of this recourse
liability based on trends in repurchase and indemnification requests, actual loss experience, known and inherent risks in the loans, and current economic conditions. As part of its evaluation of the adequacy
of this recourse liability, management considers estimated loss projections over the life of the subject loan portfolio.
At September 30, 2010, the total liability for estimated losses on such repurchase and indemnification claims, including reserves related to the DUS
programs described above, was $290 million, which is reported in Other liabilities on the Consolidated Balance Sheet. An analysis of the changes in this liability during the first nine months of 2010 follows:
Analysis of Estimated Losses on Repurchase and Indemnification Claims
|
|
|
|
|
|
|
|
|
|
|
|
|
|
|
|
|
|
|
In millions
|
|
Residential
Mortgage
Banking
|
|
|
Distressed
Assets
Portfolio (a)
|
|
|
Other (b)
|
|
|
Total
|
|
|
January 1, 2010
|
|
$
|
229
|
|
|
$
|
44
|
|
|
$
|
73
|
|
|
$
|
346
|
|
|
Reserve adjustments, net
|
|
|
103
|
|
|
|
71
|
|
|
|
(17
|
)
|
|
|
157
|
|
|
Losses – loan repurchases and settlements
|
|
|
(177
|
)
|
|
|
(12
|
)
|
|
|
|
|
|
|
(189
|
)
|
|
Loan sales
|
|
|
|
|
|
|
|
|
|
|
(24
|
)
|
|
|
(24
|
)
|
|
September 30, 2010
|
|
$
|
155
|
|
|
$
|
103
|
|
|
$
|
32
|
|
|
$
|
290
|
|
|
(a)
|
Consists of reserves for repurchases and indemnifications for home equity loans/lines of credit sold from 2005 to 2007.
|
|
(b)
|
Consists primarily of reserves for DUS and similar programs described above.
|
R
EINSURANCE
A
GREEMENTS
We have two wholly-owned
captive insurance subsidiaries which provide reinsurance to third-party insurers related to insurance sold to our customers. These subsidiaries enter into various types of reinsurance agreements with third-party insurers where the subsidiary assumes
the risk of loss through either an excess of loss or quota share agreement up to 100% reinsurance. In excess of loss agreements, these subsidiaries assume the risk of loss for an excess layer of coverage up to specified limits, once a defined first
loss percentage is met. In quota share agreements, the subsidiaries and third-party insurers share the responsibility for payment of all claims.
108
Reserves recognized for probable losses on these policies and the aggregate maximum exposure up to the
specified limits for all reinsurance contracts were as follows:
Reinsurance Agreements
|
|
|
|
|
|
|
In millions except as noted
|
|
September 30,
2010
|
|
|
Reserves for probable losses
|
|
$
|
178
|
|
|
Maximum exposure (billions)
|
|
$
|
4.3
|
|
The comparable amount of reserves for probable losses as of December 31, 2009 was $220 million.
R
EPURCHASE
AND
R
ESALE
A
GREEMENTS
We enter into repurchase and resale agreements where we transfer investment securities to/from a third party with the agreement to repurchase/resell those investment securities at a future date for a
specified price. These transactions are accounted for as collateralized borrowings/financings.
N
OTE
19 S
EGMENT
R
EPORTING
We have six reportable business segments:
|
|
•
|
|
Corporate & Institutional Banking
|
|
|
•
|
|
Residential Mortgage Banking
|
|
|
•
|
|
Distressed Assets Portfolio
|
Results of individual businesses are presented based on our management accounting practices and management structure. There is no comprehensive,
authoritative body of guidance for management accounting equivalent to GAAP; therefore, the financial results of our individual businesses are not necessarily comparable with similar information for any other company. We refine our methodologies
from time to time as our management accounting practices are enhanced and our businesses and management structure change. As a result of its sale, GIS is no longer a reportable business segment.
Financial results are presented, to the extent practicable, as if each business operated on a stand-alone basis. As permitted under GAAP, we have
aggregated the business results for certain similar operating segments for financial reporting purposes.
Assets receive a funding charge and
liabilities and capital receive a funding credit based on a transfer pricing methodology that incorporates product maturities, duration and other factors. Capital is intended to cover unexpected losses and is assigned to the banking and servicing
businesses using our risk-based economic capital model. We have assigned capital to Retail Banking equal to 6% of funds to approximate market comparables for this business.
We have allocated the allowances for loan and lease losses and unfunded loan commitments and letters of credit based on
our assessment of risk inherent in each business segment’s loan portfolio. Our allocation of the costs incurred by operations and other shared support areas not directly aligned with the
businesses is primarily based on the use of services.
Total business segment financial results differ from consolidated income from
continuing operations before noncontrolling interests, which itself excludes the earnings and revenue attributable to GIS, including the related after-tax gain on sale in the third quarter of 2010, that are reflected in discontinued operations. The
impact of these differences is reflected in the “Other” category in the business segment tables. “Other” includes residual activities that do not meet the criteria for disclosure as a separate reportable business, such as gains
or losses related to BlackRock transactions including LTIP share distributions and obligations, integration costs, asset and liability management activities including net securities gains or losses and certain trading activities, exited businesses,
equity management activities, alternative investments, intercompany eliminations, most corporate overhead, and differences between business segment performance reporting and financial statement reporting (GAAP), including the presentation of net
income attributable to noncontrolling interests. Assets, revenue and earnings attributable to foreign activities were not material in the periods presented for comparative purposes.
B
USINESS
S
EGMENT
P
RODUCTS
A
ND
S
ERVICES
Retail Banking
provides deposit, lending, brokerage, trust, investment management, and cash management services to consumer and small business customers within our primary geographic
markets. Our customers are serviced through our branch network, call centers and the internet. The branch network is located primarily in Pennsylvania, Ohio, New Jersey, Michigan, Maryland, Illinois, Indiana, Kentucky, Florida, Virginia, Missouri,
Delaware, Washington, D.C., and Wisconsin.
Corporate & Institutional Banking
provides lending, treasury management,
and capital markets-related products and services to mid-sized corporations, government and not-for-profit entities, and selectively to large corporations. Lending products include secured and unsecured loans, letters of credit and equipment leases.
Treasury management services include cash and investment management, receivables management, disbursement services, funds transfer services, information reporting, and global trade services. Capital markets-related products and services include
foreign exchange, derivatives, loan syndications, mergers and acquisitions advisory and related services to middle-market companies, our multi-seller conduit, securities underwriting, and securities sales and trading. Corporate &
Institutional Banking also provides commercial loan servicing, and real estate advisory and technology solutions for the commercial real estate finance industry. Corporate & Institutional Banking provides products and services generally
within our primary geographic markets, with certain products and services offered nationally.
109
Asset Management Group
includes personal wealth management for high net worth and ultra high
net worth clients and institutional asset management. Wealth management products and services include financial planning, customized investment management, private banking, tailored credit solutions and trust management and administration for
individuals and their families. Institutional asset management provides investment management, custody, and retirement planning services. The institutional clients include corporations, foundations and unions and charitable endowments located
primarily in our geographic footprint.
Residential Mortgage Banking
directly originates primarily first lien residential
mortgage loans on a nationwide basis with a significant presence within the retail banking footprint and also originates loans through joint venture partners. Mortgage loans represent loans collateralized by one-to-four-family residential real
estate. These loans are typically underwritten to government agency and/or third party standards, and sold, servicing retained, to primary mortgage market conduits FNMA, FHLMC, Federal Home Loan Banks and third-party investors, or are securitized
and issued under the Government National Mortgage Association (GNMA) program. The mortgage servicing operation performs all functions related to
servicing mortgage loans – primarily those in first lien position – for various investors and for loans owned by PNC. Certain loans originated through our joint ventures are serviced by
a joint venture partner.
BlackRock
is the largest publicly traded investment management firm in the world.
BlackRock manages assets on behalf of institutional and individual investors worldwide through a variety of equity, fixed income, multi-asset class, alternative and cash management separate accounts and funds, including iShares
®
, the global product leader in exchange traded funds. In addition, BlackRock provides market risk management,
financial markets advisory and enterprise investment system services globally to a broad base of clients. At September 30, 2010, our share of BlackRock’s earnings was 23%.
Distressed Assets Portfolio
includes commercial residential development loans, cross-border leases, consumer brokered home equity loans, retail mortgages, non-prime mortgages, and
residential construction loans. These loans require special servicing and management oversight given current market conditions. The majority of these loans are from acquisitions, primarily National City.
110
Results Of Businesses
|
|
|
|
|
|
|
|
|
|
|
|
|
|
|
|
|
|
|
|
|
|
|
|
|
|
|
|
|
|
|
|
|
|
|
Three months ended September 30
In millions
|
|
Retail
Banking
|
|
|
Corporate &
Institutional
Banking
|
|
|
Asset
Management
Group
|
|
|
Residential
Mortgage
Banking
|
|
|
BlackRock
|
|
|
Distressed
Assets
Portfolio
|
|
|
Other
|
|
|
Consolidated
|
|
|
2010
|
|
|
|
|
|
|
|
|
|
|
|
|
|
|
|
|
|
|
|
|
|
|
|
|
|
|
|
|
|
|
|
|
|
Income Statement
|
|
|
|
|
|
|
|
|
|
|
|
|
|
|
|
|
|
|
|
|
|
|
|
|
|
|
|
|
|
|
|
|
|
Net interest income
|
|
$
|
858
|
|
|
$
|
818
|
|
|
$
|
67
|
|
|
$
|
53
|
|
|
|
|
|
|
$
|
279
|
|
|
$
|
140
|
|
|
$
|
2,215
|
|
|
Noninterest income
|
|
|
497
|
|
|
|
237
|
|
|
|
150
|
|
|
|
232
|
|
|
$
|
128
|
|
|
|
(35
|
)
|
|
|
174
|
|
|
|
1,383
|
|
|
Total revenue
|
|
|
1,355
|
|
|
|
1,055
|
|
|
|
217
|
|
|
|
285
|
|
|
|
128
|
|
|
|
244
|
|
|
|
314
|
|
|
|
3,598
|
|
|
Provision for (recoveries of) credit losses
|
|
|
327
|
|
|
|
(48
|
)
|
|
|
(12
|
)
|
|
|
21
|
|
|
|
|
|
|
|
176
|
|
|
|
22
|
|
|
|
486
|
|
|
Depreciation and amortization
|
|
|
47
|
|
|
|
33
|
|
|
|
10
|
|
|
|
1
|
|
|
|
|
|
|
|
|
|
|
|
67
|
|
|
|
158
|
|
|
Other noninterest expense
|
|
|
991
|
|
|
|
413
|
|
|
|
150
|
|
|
|
118
|
|
|
|
|
|
|
|
46
|
|
|
|
282
|
|
|
|
2,000
|
|
|
Income (loss) from continuing operations before income taxes
|
|
|
(10
|
)
|
|
|
657
|
|
|
|
69
|
|
|
|
145
|
|
|
|
128
|
|
|
|
22
|
|
|
|
(57
|
)
|
|
|
954
|
|
|
Income taxes (benefit)
|
|
|
(3
|
)
|
|
|
230
|
|
|
|
25
|
|
|
|
47
|
|
|
|
29
|
|
|
|
5
|
|
|
|
(154
|
)
|
|
|
179
|
|
|
Income (loss) from continuing operations before noncontrolling interests
|
|
$
|
(7
|
)
|
|
$
|
427
|
|
|
$
|
44
|
|
|
$
|
98
|
|
|
$
|
99
|
|
|
$
|
17
|
|
|
$
|
97
|
|
|
$
|
775
|
|
|
Inter-segment revenue
|
|
|
|
|
|
|
|
|
|
$
|
3
|
|
|
$
|
4
|
|
|
$
|
6
|
|
|
$
|
(3
|
)
|
|
$
|
(10
|
)
|
|
|
|
|
|
Average Assets (a)
|
|
$
|
66,594
|
|
|
$
|
76,852
|
|
|
$
|
6,972
|
|
|
$
|
9,164
|
|
|
$
|
6,275
|
|
|
$
|
16,745
|
|
|
$
|
81,977
|
|
|
$
|
264,579
|
|
|
2009
|
|
|
|
|
|
|
|
|
|
|
|
|
|
|
|
|
|
|
|
|
|
|
|
|
|
|
|
|
|
|
|
|
|
Income Statement
|
|
|
|
|
|
|
|
|
|
|
|
|
|
|
|
|
|
|
|
|
|
|
|
|
|
|
|
|
|
|
|
|
|
Net interest income
|
|
$
|
865
|
|
|
$
|
907
|
|
|
$
|
70
|
|
|
$
|
83
|
|
|
|
|
|
|
$
|
235
|
|
|
$
|
64
|
|
|
$
|
2,224
|
|
|
Noninterest income
|
|
|
569
|
|
|
|
401
|
|
|
|
155
|
|
|
|
209
|
|
|
$
|
98
|
|
|
|
19
|
|
|
|
178
|
|
|
|
1,629
|
|
|
Total revenue
|
|
|
1,434
|
|
|
|
1,308
|
|
|
|
225
|
|
|
|
292
|
|
|
|
98
|
|
|
|
254
|
|
|
|
242
|
|
|
|
3,853
|
|
|
Provision for credit losses
|
|
|
313
|
|
|
|
384
|
|
|
|
9
|
|
|
|
4
|
|
|
|
|
|
|
|
168
|
|
|
|
36
|
|
|
|
914
|
|
|
Depreciation and amortization
|
|
|
66
|
|
|
|
35
|
|
|
|
10
|
|
|
|
1
|
|
|
|
|
|
|
|
|
|
|
|
78
|
|
|
|
190
|
|
|
Other noninterest expense
|
|
|
974
|
|
|
|
424
|
|
|
|
152
|
|
|
|
140
|
|
|
|
|
|
|
|
62
|
|
|
|
272
|
|
|
|
2,024
|
|
|
Income (loss) from continuing operations before income taxes
|
|
|
81
|
|
|
|
465
|
|
|
|
54
|
|
|
|
147
|
|
|
|
98
|
|
|
|
24
|
|
|
|
(144
|
)
|
|
|
725
|
|
|
Income taxes (benefit)
|
|
|
31
|
|
|
|
156
|
|
|
|
19
|
|
|
|
56
|
|
|
|
24
|
|
|
|
10
|
|
|
|
(111
|
)
|
|
|
185
|
|
|
Income (loss) from continuing operations before noncontrolling interests
|
|
$
|
50
|
|
|
$
|
309
|
|
|
$
|
35
|
|
|
$
|
91
|
|
|
$
|
74
|
|
|
$
|
14
|
|
|
$
|
(33
|
)
|
|
$
|
540
|
|
|
Inter-segment revenue
|
|
$
|
(2
|
)
|
|
$
|
3
|
|
|
$
|
5
|
|
|
$
|
1
|
|
|
$
|
4
|
|
|
$
|
(4
|
)
|
|
$
|
(7
|
)
|
|
|
|
|
|
Average Assets (a)
|
|
$
|
65,053
|
|
|
$
|
81,245
|
|
|
$
|
7,260
|
|
|
$
|
9,039
|
|
|
$
|
4,599
|
|
|
$
|
22,317
|
|
|
$
|
84,535
|
|
|
$
|
274,048
|
|
|
|
|
|
|
|
|
|
|
|
|
Nine months ended September 30
In millions
|
|
Retail
Banking
|
|
|
Corporate &
Institutional
Banking
|
|
|
Asset
Management
Group
|
|
|
Residential
Mortgage
Banking
|
|
|
BlackRock
|
|
|
Distressed
Assets
Portfolio
|
|
|
Other
|
|
|
Consolidated
|
|
|
2010
|
|
|
|
|
|
|
|
|
|
|
|
|
|
|
|
|
|
|
|
|
|
|
|
|
|
|
|
|
|
|
|
|
|
Income Statement
|
|
|
|
|
|
|
|
|
|
|
|
|
|
|
|
|
|
|
|
|
|
|
|
|
|
|
|
|
|
|
|
|
|
Net interest income
|
|
$
|
2,607
|
|
|
$
|
2,597
|
|
|
$
|
197
|
|
|
$
|
206
|
|
|
|
|
|
|
$
|
964
|
|
|
$
|
458
|
|
|
$
|
7,029
|
|
|
Noninterest income
|
|
|
1,493
|
|
|
|
904
|
|
|
|
468
|
|
|
|
568
|
|
|
$
|
326
|
|
|
|
(37
|
)
|
|
|
522
|
|
|
|
4,244
|
|
|
Total revenue
|
|
|
4,100
|
|
|
|
3,501
|
|
|
|
665
|
|
|
|
774
|
|
|
|
326
|
|
|
|
927
|
|
|
|
980
|
|
|
|
11,273
|
|
|
Provision for (recoveries of) credit losses
|
|
|
946
|
|
|
|
285
|
|
|
|
11
|
|
|
|
(3
|
)
|
|
|
|
|
|
|
745
|
|
|
|
76
|
|
|
|
2,060
|
|
|
Depreciation and amortization
|
|
|
169
|
|
|
|
105
|
|
|
|
31
|
|
|
|
3
|
|
|
|
|
|
|
|
|
|
|
|
207
|
|
|
|
515
|
|
|
Other noninterest expense
|
|
|
2,838
|
|
|
|
1,207
|
|
|
|
446
|
|
|
|
346
|
|
|
|
|
|
|
|
169
|
|
|
|
752
|
|
|
|
5,758
|
|
|
Income (loss) from continuing operations before income taxes
|
|
|
147
|
|
|
|
1,904
|
|
|
|
177
|
|
|
|
428
|
|
|
|
326
|
|
|
|
13
|
|
|
|
(55
|
)
|
|
|
2,940
|
|
|
Income taxes (benefit)
|
|
|
50
|
|
|
|
674
|
|
|
|
65
|
|
|
|
156
|
|
|
|
73
|
|
|
|
5
|
|
|
|
(287
|
)
|
|
|
736
|
|
|
Income from continuing operations before noncontrolling interests
|
|
$
|
97
|
|
|
$
|
1,230
|
|
|
$
|
112
|
|
|
$
|
272
|
|
|
$
|
253
|
|
|
$
|
8
|
|
|
$
|
232
|
|
|
$
|
2,204
|
|
|
Inter-segment revenue
|
|
|
|
|
|
$
|
20
|
|
|
$
|
9
|
|
|
$
|
9
|
|
|
$
|
17
|
|
|
$
|
(10
|
)
|
|
$
|
(45
|
)
|
|
|
|
|
|
Average Assets (a)
|
|
$
|
67,380
|
|
|
$
|
77,764
|
|
|
$
|
7,043
|
|
|
$
|
8,903
|
|
|
$
|
6,275
|
|
|
$
|
18,246
|
|
|
$
|
79,744
|
|
|
$
|
265,355
|
|
|
2009
|
|
|
|
|
|
|
|
|
|
|
|
|
|
|
|
|
|
|
|
|
|
|
|
|
|
|
|
|
|
|
|
|
|
Income Statement
|
|
|
|
|
|
|
|
|
|
|
|
|
|
|
|
|
|
|
|
|
|
|
|
|
|
|
|
|
|
|
|
|
|
Net interest income (expense)
|
|
$
|
2,688
|
|
|
$
|
2,802
|
|
|
$
|
241
|
|
|
$
|
261
|
|
|
|
|
|
|
$
|
861
|
|
|
$
|
(116
|
)
|
|
$
|
6,737
|
|
|
Noninterest income
|
|
|
1,653
|
|
|
|
1,065
|
|
|
|
460
|
|
|
|
891
|
|
|
$
|
191
|
|
|
|
71
|
|
|
|
274
|
|
|
|
4,605
|
|
|
Total revenue
|
|
|
4,341
|
|
|
|
3,867
|
|
|
|
701
|
|
|
|
1,152
|
|
|
|
191
|
|
|
|
932
|
|
|
|
158
|
|
|
|
11,342
|
|
|
Provision for credit losses
|
|
|
921
|
|
|
|
1,320
|
|
|
|
72
|
|
|
|
3
|
|
|
|
|
|
|
|
457
|
|
|
|
108
|
|
|
|
2,881
|
|
|
Depreciation and amortization
|
|
|
201
|
|
|
|
106
|
|
|
|
31
|
|
|
|
4
|
|
|
|
|
|
|
|
|
|
|
|
241
|
|
|
|
583
|
|
|
Other noninterest expense
|
|
|
2,957
|
|
|
|
1,250
|
|
|
|
468
|
|
|
|
486
|
|
|
|
|
|
|
|
197
|
|
|
|
923
|
|
|
|
6,281
|
|
|
Income (loss) from continuing operations before income taxes
|
|
|
262
|
|
|
|
1,191
|
|
|
|
130
|
|
|
|
659
|
|
|
|
191
|
|
|
|
278
|
|
|
|
(1,114
|
)
|
|
|
1,597
|
|
|
Income taxes (benefit)
|
|
|
101
|
|
|
|
416
|
|
|
|
48
|
|
|
|
249
|
|
|
|
40
|
|
|
|
106
|
|
|
|
(618
|
)
|
|
|
342
|
|
|
Income (loss) from continuing operations before noncontrolling interests
|
|
$
|
161
|
|
|
$
|
775
|
|
|
$
|
82
|
|
|
$
|
410
|
|
|
$
|
151
|
|
|
$
|
172
|
|
|
$
|
(496
|
)
|
|
$
|
1,255
|
|
|
Inter-segment revenue
|
|
$
|
(3
|
)
|
|
$
|
8
|
|
|
$
|
14
|
|
|
$
|
4
|
|
|
$
|
12
|
|
|
$
|
(13
|
)
|
|
$
|
(22
|
)
|
|
|
|
|
|
Average Assets (a)
|
|
$
|
65,281
|
|
|
$
|
86,391
|
|
|
$
|
7,367
|
|
|
$
|
8,289
|
|
|
$
|
4,599
|
|
|
$
|
23,627
|
|
|
$
|
83,006
|
|
|
$
|
278,560
|
|
|
(a)
|
Period-end balances for BlackRock.
|
111
STATISTICAL INFORMATION (Unaudited)
T
HE
PNC F
INANCIAL
S
ERVICES
G
ROUP
, I
NC
.
Average Consolidated Balance Sheet And Net Interest Analysis
|
|
|
|
|
|
|
|
|
|
|
|
|
|
|
|
|
|
|
|
|
|
|
|
|
|
|
|
|
Nine months ended September 30
|
|
|
|
|
2010
|
|
|
2009
|
|
|
Taxable-equivalent basis Dollars in millions
|
|
Average
Balances
|
|
|
Interest
Income/
Expense
|
|
|
Average
Yields/
Rates
|
|
|
Average
Balances
|
|
|
Interest
Income/
Expense
|
|
|
Average
Yields/
Rates
|
|
|
Assets
|
|
|
|
|
|
|
|
|
|
|
|
|
|
|
|
|
|
|
|
|
|
|
|
|
|
Interest-earning assets:
|
|
|
|
|
|
|
|
|
|
|
|
|
|
|
|
|
|
|
|
|
|
|
|
|
|
Investment securities
|
|
|
|
|
|
|
|
|
|
|
|
|
|
|
|
|
|
|
|
|
|
|
|
|
|
Securities available for sale
|
|
|
|
|
|
|
|
|
|
|
|
|
|
|
|
|
|
|
|
|
|
|
|
|
|
Residential mortgage-backed
|
|
|
|
|
|
|
|
|
|
|
|
|
|
|
|
|
|
|
|
|
|
|
|
|
|
Agency
|
|
$
|
21,745
|
|
|
$
|
653
|
|
|
|
4.00
|
%
|
|
$
|
21,628
|
|
|
$
|
791
|
|
|
|
4.87
|
%
|
|
Non-agency
|
|
|
9,491
|
|
|
|
424
|
|
|
|
5.96
|
|
|
|
12,399
|
|
|
|
621
|
|
|
|
6.67
|
|
|
Commercial mortgage-backed
|
|
|
3,798
|
|
|
|
152
|
|
|
|
5.31
|
|
|
|
4,645
|
|
|
|
196
|
|
|
|
5.63
|
|
|
Asset-backed
|
|
|
2,043
|
|
|
|
64
|
|
|
|
4.20
|
|
|
|
1,975
|
|
|
|
118
|
|
|
|
7.99
|
|
|
US Treasury and government agencies
|
|
|
7,987
|
|
|
|
173
|
|
|
|
2.88
|
|
|
|
3,829
|
|
|
|
87
|
|
|
|
3.01
|
|
|
State and municipal
|
|
|
1,348
|
|
|
|
57
|
|
|
|
5.65
|
|
|
|
1,356
|
|
|
|
55
|
|
|
|
5.41
|
|
|
Other debt
|
|
|
2,502
|
|
|
|
55
|
|
|
|
2.92
|
|
|
|
1,118
|
|
|
|
30
|
|
|
|
3.58
|
|
|
Corporate stocks and other
|
|
|
458
|
|
|
|
|
|
|
|
.12
|
|
|
|
410
|
|
|
|
2
|
|
|
|
.79
|
|
|
Total securities available for sale
|
|
|
49,372
|
|
|
|
1,578
|
|
|
|
4.26
|
|
|
|
47,360
|
|
|
|
1,900
|
|
|
|
5.35
|
|
|
Securities held to maturity
|
|
|
|
|
|
|
|
|
|
|
|
|
|
|
|
|
|
|
|
|
|
|
|
|
|
Commercial mortgage-backed
|
|
|
3,509
|
|
|
|
151
|
|
|
|
5.72
|
|
|
|
1,985
|
|
|
|
93
|
|
|
|
6.24
|
|
|
Asset-backed
|
|
|
3,598
|
|
|
|
70
|
|
|
|
2.61
|
|
|
|
1,827
|
|
|
|
66
|
|
|
|
4.82
|
|
|
Other
|
|
|
63
|
|
|
|
5
|
|
|
|
11.57
|
|
|
|
41
|
|
|
|
2
|
|
|
|
6.20
|
|
|
Total securities held to maturity
|
|
|
7,170
|
|
|
|
226
|
|
|
|
4.21
|
|
|
|
3,853
|
|
|
|
161
|
|
|
|
5.56
|
|
|
Total investment securities
|
|
|
56,542
|
|
|
|
1,804
|
|
|
|
4.25
|
|
|
|
51,213
|
|
|
|
2,061
|
|
|
|
5.36
|
|
|
Loans
|
|
|
|
|
|
|
|
|
|
|
|
|
|
|
|
|
|
|
|
|
|
|
|
|
|
Commercial
|
|
|
54,431
|
|
|
|
2,138
|
|
|
|
5.18
|
|
|
|
63,054
|
|
|
|
2,433
|
|
|
|
5.09
|
|
|
Commercial real estate
|
|
|
21,068
|
|
|
|
801
|
|
|
|
5.01
|
|
|
|
25,173
|
|
|
|
1,013
|
|
|
|
5.31
|
|
|
Equipment lease financing
|
|
|
6,243
|
|
|
|
242
|
|
|
|
5.17
|
|
|
|
6,213
|
|
|
|
221
|
|
|
|
4.74
|
|
|
Consumer
|
|
|
55,107
|
|
|
|
2,174
|
|
|
|
5.27
|
|
|
|
52,185
|
|
|
|
2,066
|
|
|
|
5.29
|
|
|
Residential mortgage
|
|
|
18,237
|
|
|
|
998
|
|
|
|
7.30
|
|
|
|
21,529
|
|
|
|
1,054
|
|
|
|
6.53
|
|
|
Total loans
|
|
|
155,086
|
|
|
|
6,353
|
|
|
|
5.44
|
|
|
|
168,154
|
|
|
|
6,787
|
|
|
|
5.36
|
|
|
Loans held for sale
|
|
|
2,716
|
|
|
|
208
|
|
|
|
10.22
|
|
|
|
4,322
|
|
|
|
196
|
|
|
|
6.05
|
|
|
Federal funds sold and resale agreements
|
|
|
1,821
|
|
|
|
28
|
|
|
|
2.04
|
|
|
|
1,921
|
|
|
|
32
|
|
|
|
2.23
|
|
|
Other
|
|
|
8,906
|
|
|
|
144
|
|
|
|
2.15
|
|
|
|
15,400
|
|
|
|
120
|
|
|
|
1.03
|
|
|
Total interest-earning assets/interest income
|
|
|
225,071
|
|
|
|
8,537
|
|
|
|
5.04
|
|
|
|
241,010
|
|
|
|
9,196
|
|
|
|
5.07
|
|
|
Noninterest-earning assets:
|
|
|
|
|
|
|
|
|
|
|
|
|
|
|
|
|
|
|
|
|
|
|
|
|
|
Allowance for loan and lease losses
|
|
|
(5,180
|
)
|
|
|
|
|
|
|
|
|
|
|
(4,248
|
)
|
|
|
|
|
|
|
|
|
|
Cash and due from banks
|
|
|
3,587
|
|
|
|
|
|
|
|
|
|
|
|
3,645
|
|
|
|
|
|
|
|
|
|
|
Other
|
|
|
41,877
|
|
|
|
|
|
|
|
|
|
|
|
38,153
|
|
|
|
|
|
|
|
|
|
|
Total assets
|
|
$
|
265,355
|
|
|
|
|
|
|
|
|
|
|
$
|
278,560
|
|
|
|
|
|
|
|
|
|
|
Liabilities and Equity
|
|
|
|
|
|
|
|
|
|
|
|
|
|
|
|
|
|
|
|
|
|
|
|
|
|
Interest-bearing liabilities:
|
|
|
|
|
|
|
|
|
|
|
|
|
|
|
|
|
|
|
|
|
|
|
|
|
|
Interest-bearing deposits
|
|
|
|
|
|
|
|
|
|
|
|
|
|
|
|
|
|
|
|
|
|
|
|
|
|
Money market
|
|
$
|
58,206
|
|
|
|
206
|
|
|
|
.47
|
|
|
$
|
54,999
|
|
|
|
457
|
|
|
|
1.11
|
|
|
Demand
|
|
|
24,903
|
|
|
|
27
|
|
|
|
.14
|
|
|
|
23,225
|
|
|
|
54
|
|
|
|
.31
|
|
|
Savings
|
|
|
6,932
|
|
|
|
10
|
|
|
|
.19
|
|
|
|
6,534
|
|
|
|
11
|
|
|
|
.22
|
|
|
Retail certificates of deposit
|
|
|
44,190
|
|
|
|
492
|
|
|
|
1.49
|
|
|
|
56,249
|
|
|
|
825
|
|
|
|
1.96
|
|
|
Other time
|
|
|
885
|
|
|
|
19
|
|
|
|
2.84
|
|
|
|
6,228
|
|
|
|
53
|
|
|
|
1.13
|
|
|
Time deposits in foreign offices
|
|
|
2,781
|
|
|
|
4
|
|
|
|
.22
|
|
|
|
3,510
|
|
|
|
7
|
|
|
|
.25
|
|
|
Total interest-bearing deposits
|
|
|
137,897
|
|
|
|
758
|
|
|
|
.73
|
|
|
|
150,745
|
|
|
|
1,407
|
|
|
|
1.25
|
|
|
Borrowed funds
|
|
|
|
|
|
|
|
|
|
|
|
|
|
|
|
|
|
|
|
|
|
|
|
|
|
Federal funds purchased and repurchase agreements
|
|
|
4,227
|
|
|
|
10
|
|
|
|
.32
|
|
|
|
4,571
|
|
|
|
13
|
|
|
|
.38
|
|
|
Federal Home Loan Bank borrowings
|
|
|
8,612
|
|
|
|
56
|
|
|
|
.86
|
|
|
|
15,288
|
|
|
|
179
|
|
|
|
1.55
|
|
|
Bank notes and senior debt
|
|
|
12,694
|
|
|
|
225
|
|
|
|
2.33
|
|
|
|
13,202
|
|
|
|
352
|
|
|
|
3.52
|
|
|
Subordinated debt
|
|
|
9,700
|
|
|
|
367
|
|
|
|
5.04
|
|
|
|
10,297
|
|
|
|
460
|
|
|
|
5.96
|
|
|
Other
|
|
|
5,604
|
|
|
|
36
|
|
|
|
.86
|
|
|
|
2,310
|
|
|
|
29
|
|
|
|
1.66
|
|
|
Total borrowed funds
|
|
|
40,837
|
|
|
|
694
|
|
|
|
2.25
|
|
|
|
45,668
|
|
|
|
1,033
|
|
|
|
3.00
|
|
|
Total interest-bearing liabilities/interest expense
|
|
|
178,734
|
|
|
|
1,452
|
|
|
|
1.08
|
|
|
|
196,413
|
|
|
|
2,440
|
|
|
|
1.65
|
|
|
Noninterest-bearing liabilities and equity:
|
|
|
|
|
|
|
|
|
|
|
|
|
|
|
|
|
|
|
|
|
|
|
|
|
|
Noninterest-bearing deposits
|
|
|
44,092
|
|
|
|
|
|
|
|
|
|
|
|
40,436
|
|
|
|
|
|
|
|
|
|
|
Allowance for unfunded loan commitments and letters of credit
|
|
|
255
|
|
|
|
|
|
|
|
|
|
|
|
330
|
|
|
|
|
|
|
|
|
|
|
Accrued expenses and other liabilities
|
|
|
11,186
|
|
|
|
|
|
|
|
|
|
|
|
11,782
|
|
|
|
|
|
|
|
|
|
|
Equity
|
|
|
31,088
|
|
|
|
|
|
|
|
|
|
|
|
29,599
|
|
|
|
|
|
|
|
|
|
|
Total liabilities and equity
|
|
$
|
265,355
|
|
|
|
|
|
|
|
|
|
|
$
|
278,560
|
|
|
|
|
|
|
|
|
|
|
Interest rate spread
|
|
|
|
|
|
|
|
|
|
|
3.96
|
|
|
|
|
|
|
|
|
|
|
|
3.42
|
|
|
Impact of noninterest-bearing sources
|
|
|
|
|
|
|
|
|
|
|
.22
|
|
|
|
|
|
|
|
|
|
|
|
.30
|
|
|
Net interest income/margin
|
|
|
|
|
|
$
|
7,085
|
|
|
|
4.18
|
%
|
|
|
|
|
|
$
|
6,756
|
|
|
|
3.72
|
%
|
Nonaccrual loans are included in loans, net of unearned income. The impact of financial derivatives used in interest rate risk management is included in
the interest income/expense and average yields/rates of the related assets and liabilities. Basis adjustments related to hedged items are included in noninterest-earning assets and noninterest-bearing liabilities. Average balances of securities are
based on amortized historical cost (excluding adjustments to fair value, which are included in other assets). Average balances for certain loans and borrowed funds accounted for at fair value, with changes in fair value recorded in trading
noninterest income, are included in noninterest-earning assets and noninterest-bearing liabilities. The interest-earning deposits with the Federal Reserve are included in the 'Other' interest-earning assets category.
112
Average Consolidated Balance Sheet
And Net Interest Analysis (Continued)
|
|
|
|
|
|
|
|
|
|
|
|
|
|
|
|
|
|
|
|
|
|
|
|
|
|
|
|
|
|
|
|
|
|
|
Third Quarter 2010
|
|
|
Second Quarter 2010
|
|
|
Third Quarter 2009
|
|
|
Average
Balances
|
|
Interest
Income/
Expense
|
|
|
Average
Yields/
Rates
|
|
|
Average
Balances
|
|
|
Interest
Income/
Expense
|
|
|
Average
Yields/
Rates
|
|
|
Average
Balances
|
|
|
Interest
Income/
Expense
|
|
|
Average
Yields/
Rates
|
|
|
|
|
|
|
|
|
|
|
|
|
|
|
|
|
|
|
|
|
|
|
|
|
|
|
|
|
|
|
|
|
|
|
|
|
|
|
|
|
|
|
|
|
|
|
|
|
|
|
|
|
|
|
|
|
|
|
|
|
|
|
|
|
|
|
|
|
|
|
|
|
|
|
|
|
|
|
|
|
|
|
|
|
|
|
|
|
|
|
|
|
|
|
|
|
|
|
|
|
|
|
|
|
|
|
|
|
|
|
|
|
|
|
|
|
|
|
|
|
|
|
|
|
|
|
|
|
|
|
|
|
|
|
|
|
|
|
|
|
|
|
|
|
|
|
|
|
|
|
|
|
|
|
|
|
|
|
|
|
|
|
|
|
|
|
|
|
|
|
|
|
$22,916
|
|
$
|
229
|
|
|
|
4.00
|
%
|
|
$
|
20,382
|
|
|
$
|
196
|
|
|
|
3.83
|
%
|
|
$
|
20,838
|
|
|
$
|
248
|
|
|
|
4.75
|
%
|
|
8,917
|
|
|
134
|
|
|
|
6.04
|
|
|
|
9,358
|
|
|
|
140
|
|
|
|
5.97
|
|
|
|
11,553
|
|
|
|
191
|
|
|
|
6.60
|
|
|
3,100
|
|
|
42
|
|
|
|
5.34
|
|
|
|
2,962
|
|
|
|
39
|
|
|
|
5.29
|
|
|
|
5,052
|
|
|
|
68
|
|
|
|
5.40
|
|
|
2,436
|
|
|
21
|
|
|
|
3.51
|
|
|
|
1,695
|
|
|
|
21
|
|
|
|
4.96
|
|
|
|
1,911
|
|
|
|
47
|
|
|
|
10.04
|
|
|
7,758
|
|
|
52
|
|
|
|
2.67
|
|
|
|
8,708
|
|
|
|
61
|
|
|
|
2.81
|
|
|
|
6,026
|
|
|
|
47
|
|
|
|
3.06
|
|
|
1,323
|
|
|
17
|
|
|
|
5.19
|
|
|
|
1,356
|
|
|
|
19
|
|
|
|
5.50
|
|
|
|
1,367
|
|
|
|
18
|
|
|
|
5.16
|
|
|
3,092
|
|
|
21
|
|
|
|
2.64
|
|
|
|
2,526
|
|
|
|
18
|
|
|
|
2.94
|
|
|
|
1,647
|
|
|
|
14
|
|
|
|
3.40
|
|
|
472
|
|
|
|
|
|
|
.12
|
|
|
|
446
|
|
|
|
|
|
|
|
.13
|
|
|
|
388
|
|
|
|
|
|
|
|
.41
|
|
|
50,014
|
|
|
516
|
|
|
|
4.13
|
|
|
|
47,433
|
|
|
|
494
|
|
|
|
4.16
|
|
|
|
48,782
|
|
|
|
633
|
|
|
|
5.19
|
|
|
|
|
|
|
|
|
|
|
|
|
|
|
|
|
|
|
|
|
|
|
|
|
|
|
|
|
|
|
|
|
|
|
|
|
4,130
|
|
|
60
|
|
|
|
5.81
|
|
|
|
4,264
|
|
|
|
60
|
|
|
|
5.62
|
|
|
|
1,987
|
|
|
|
30
|
|
|
|
6.02
|
|
|
3,435
|
|
|
21
|
|
|
|
2.45
|
|
|
|
3,697
|
|
|
|
24
|
|
|
|
2.61
|
|
|
|
2,197
|
|
|
|
25
|
|
|
|
4.63
|
|
|
9
|
|
|
|
|
|
|
7.87
|
|
|
|
21
|
|
|
|
|
|
|
|
9.29
|
|
|
|
102
|
|
|
|
2
|
|
|
|
6.21
|
|
|
7,574
|
|
|
81
|
|
|
|
4.29
|
|
|
|
7,982
|
|
|
|
84
|
|
|
|
4.23
|
|
|
|
4,286
|
|
|
|
57
|
|
|
|
5.31
|
|
|
57,588
|
|
|
597
|
|
|
|
4.15
|
|
|
|
55,415
|
|
|
|
578
|
|
|
|
4.17
|
|
|
|
53,068
|
|
|
|
690
|
|
|
|
5.20
|
|
|
|
|
|
|
|
|
|
|
|
|
|
|
|
|
|
|
|
|
|
|
|
|
|
|
|
|
|
|
|
|
|
|
|
|
53,502
|
|
|
713
|
|
|
|
5.21
|
|
|
|
54,349
|
|
|
|
729
|
|
|
|
5.30
|
|
|
|
58,457
|
|
|
|
771
|
|
|
|
5.17
|
|
|
19,847
|
|
|
223
|
|
|
|
4.40
|
|
|
|
20,963
|
|
|
|
269
|
|
|
|
5.08
|
|
|
|
24,491
|
|
|
|
311
|
|
|
|
4.96
|
|
|
6,514
|
|
|
86
|
|
|
|
5.27
|
|
|
|
6,080
|
|
|
|
77
|
|
|
|
5.13
|
|
|
|
6,045
|
|
|
|
65
|
|
|
|
4.27
|
|
|
55,036
|
|
|
708
|
|
|
|
5.11
|
|
|
|
54,939
|
|
|
|
736
|
|
|
|
5.37
|
|
|
|
52,066
|
|
|
|
656
|
|
|
|
5.00
|
|
|
16,766
|
|
|
281
|
|
|
|
6.70
|
|
|
|
18,576
|
|
|
|
359
|
|
|
|
7.73
|
|
|
|
20,847
|
|
|
|
297
|
|
|
|
5.70
|
|
|
151,665
|
|
|
2,011
|
|
|
|
5.24
|
|
|
|
154,907
|
|
|
|
2,170
|
|
|
|
5.58
|
|
|
|
161,906
|
|
|
|
2,100
|
|
|
|
5.12
|
|
|
3,021
|
|
|
55
|
|
|
|
7.22
|
|
|
|
2,646
|
|
|
|
87
|
|
|
|
13.15
|
|
|
|
3,696
|
|
|
|
69
|
|
|
|
7.34
|
|
|
1,602
|
|
|
9
|
|
|
|
2.26
|
|
|
|
2,193
|
|
|
|
10
|
|
|
|
1.73
|
|
|
|
2,417
|
|
|
|
10
|
|
|
|
1.74
|
|
|
9,801
|
|
|
51
|
|
|
|
2.04
|
|
|
|
9,419
|
|
|
|
46
|
|
|
|
1.93
|
|
|
|
14,607
|
|
|
|
35
|
|
|
|
.95
|
|
|
223,677
|
|
|
2,723
|
|
|
|
4.82
|
|
|
|
224,580
|
|
|
|
2,891
|
|
|
|
5.13
|
|
|
|
235,694
|
|
|
|
2,904
|
|
|
|
4.88
|
|
|
|
|
|
|
|
|
|
|
|
|
|
|
|
|
|
|
|
|
|
|
|
|
|
|
|
|
|
|
|
|
|
|
|
|
(5,290)
|
|
|
|
|
|
|
|
|
|
|
(5,113
|
)
|
|
|
|
|
|
|
|
|
|
|
(4,264
|
)
|
|
|
|
|
|
|
|
|
|
3,436
|
|
|
|
|
|
|
|
|
|
|
3,595
|
|
|
|
|
|
|
|
|
|
|
|
3,547
|
|
|
|
|
|
|
|
|
|
|
42,756
|
|
|
|
|
|
|
|
|
|
|
41,304
|
|
|
|
|
|
|
|
|
|
|
|
39,071
|
|
|
|
|
|
|
|
|
|
|
$264,579
|
|
|
|
|
|
|
|
|
|
$
|
264,366
|
|
|
|
|
|
|
|
|
|
|
$
|
274,048
|
|
|
|
|
|
|
|
|
|
|
|
|
|
|
|
|
|
|
|
|
|
|
|
|
|
|
|
|
|
|
|
|
|
|
|
|
|
|
|
|
|
|
|
|
|
|
|
|
|
|
|
|
|
|
|
|
|
|
|
|
|
|
|
|
|
|
|
|
|
|
|
|
|
|
|
|
|
|
|
|
|
|
|
|
|
|
|
|
|
|
|
|
|
|
|
|
|
|
|
|
|
|
|
|
|
|
|
|
|
|
|
|
$58,016
|
|
|
62
|
|
|
|
.42
|
|
|
$
|
58,679
|
|
|
|
68
|
|
|
|
.46
|
|
|
$
|
56,662
|
|
|
|
111
|
|
|
|
.77
|
|
|
25,078
|
|
|
7
|
|
|
|
.11
|
|
|
|
24,953
|
|
|
|
9
|
|
|
|
.14
|
|
|
|
23,874
|
|
|
|
14
|
|
|
|
.24
|
|
|
7,092
|
|
|
3
|
|
|
|
.18
|
|
|
|
7,075
|
|
|
|
4
|
|
|
|
.19
|
|
|
|
6,652
|
|
|
|
3
|
|
|
|
.18
|
|
|
41,724
|
|
|
155
|
|
|
|
1.47
|
|
|
|
43,745
|
|
|
|
156
|
|
|
|
1.44
|
|
|
|
53,468
|
|
|
|
245
|
|
|
|
1.81
|
|
|
740
|
|
|
5
|
|
|
|
2.54
|
|
|
|
881
|
|
|
|
6
|
|
|
|
2.90
|
|
|
|
2,841
|
|
|
|
11
|
|
|
|
1.63
|
|
|
2,650
|
|
|
1
|
|
|
|
.23
|
|
|
|
2,661
|
|
|
|
1
|
|
|
|
.21
|
|
|
|
3,356
|
|
|
|
3
|
|
|
|
.27
|
|
|
135,300
|
|
|
233
|
|
|
|
.68
|
|
|
|
137,994
|
|
|
|
244
|
|
|
|
.71
|
|
|
|
146,853
|
|
|
|
387
|
|
|
|
1.04
|
|
|
|
|
|
|
|
|
|
|
|
|
|
|
|
|
|
|
|
|
|
|
|
|
|
|
|
|
|
|
|
|
|
|
|
|
4,179
|
|
|
3
|
|
|
|
.29
|
|
|
|
4,159
|
|
|
|
3
|
|
|
|
.29
|
|
|
|
4,422
|
|
|
|
3
|
|
|
|
.33
|
|
|
7,680
|
|
|
20
|
|
|
|
1.04
|
|
|
|
8,575
|
|
|
|
19
|
|
|
|
.83
|
|
|
|
12,996
|
|
|
|
34
|
|
|
|
1.03
|
|
|
12,799
|
|
|
92
|
|
|
|
2.81
|
|
|
|
12,666
|
|
|
|
49
|
|
|
|
1.53
|
|
|
|
12,542
|
|
|
|
99
|
|
|
|
3.09
|
|
|
9,569
|
|
|
127
|
|
|
|
5.27
|
|
|
|
9,764
|
|
|
|
110
|
|
|
|
4.54
|
|
|
|
10,214
|
|
|
|
134
|
|
|
|
5.24
|
|
|
4,886
|
|
|
11
|
|
|
|
.89
|
|
|
|
6,005
|
|
|
|
14
|
|
|
|
.92
|
|
|
|
2,806
|
|
|
|
9
|
|
|
|
1.25
|
|
|
39,113
|
|
|
253
|
|
|
|
2.56
|
|
|
|
41,169
|
|
|
|
195
|
|
|
|
1.88
|
|
|
|
42,980
|
|
|
|
279
|
|
|
|
2.57
|
|
|
174,413
|
|
|
486
|
|
|
|
1.10
|
|
|
|
179,163
|
|
|
|
439
|
|
|
|
.98
|
|
|
|
189,833
|
|
|
|
666
|
|
|
|
1.39
|
|
|
|
|
|
|
|
|
|
|
|
|
|
|
|
|
|
|
|
|
|
|
|
|
|
|
|
|
|
|
|
|
|
|
|
|
45,306
|
|
|
|
|
|
|
|
|
|
|
44,308
|
|
|
|
|
|
|
|
|
|
|
|
41,816
|
|
|
|
|
|
|
|
|
|
|
218
|
|
|
|
|
|
|
|
|
|
|
251
|
|
|
|
|
|
|
|
|
|
|
|
319
|
|
|
|
|
|
|
|
|
|
|
12,687
|
|
|
|
|
|
|
|
|
|
|
10,446
|
|
|
|
|
|
|
|
|
|
|
|
11,489
|
|
|
|
|
|
|
|
|
|
|
31,955
|
|
|
|
|
|
|
|
|
|
|
30,198
|
|
|
|
|
|
|
|
|
|
|
|
30,591
|
|
|
|
|
|
|
|
|
|
|
$264,579
|
|
|
|
|
|
|
|
|
|
$
|
264,366
|
|
|
|
|
|
|
|
|
|
|
$
|
274,048
|
|
|
|
|
|
|
|
|
|
|
|
|
|
|
|
|
|
3.72
|
|
|
|
|
|
|
|
|
|
|
|
4.15
|
|
|
|
|
|
|
|
|
|
|
|
3.49
|
|
|
|
|
|
|
|
|
|
.24
|
|
|
|
|
|
|
|
|
|
|
|
.20
|
|
|
|
|
|
|
|
|
|
|
|
.27
|
|
|
|
|
$
|
2,237
|
|
|
|
3.96
|
%
|
|
|
|
|
|
$
|
2,452
|
|
|
|
4.35
|
%
|
|
|
|
|
|
$
|
2,238
|
|
|
|
3.76
|
%
|
Loan fees for the nine months ended September 30, 2010 and September 30, 2009 were $117 million and $118 million, respectively. Loan fees for the three
months ended September 30, 2010, June 30, 2010, and September 30, 2009 were $29 million, $43 million, and $40 million, respectively. Interest income includes the effects of taxable-equivalent adjustments using a marginal federal income tax rate of
35% to increase tax-exempt interest income to a taxable-equivalent basis. The taxable-equivalent adjustments to interest income for the nine months ended September 30, 2010 and September 30, 2009 were $59 million and $47 million, respectively. The
taxable-equivalent adjustments to interest income for the three months ended September 30, 2010, June 30, 2010, and September 30, 2009 were $22 million, $19 million, and $16 million, respectively.
113
P
ART
II – O
THER
I
NFORMATION
I
TEM
1. L
EGAL
P
ROCEEDINGS
See the information set forth in Note 17 Legal Proceedings in the Notes To Consolidated Financial Statements under Part I, Item 1 of this Report,
which is incorporated by reference in response to this item.
I
TEM
1A.
R
ISK
F
ACTORS
The following risk factor is added to the risk factors previously disclosed in PNC’s
2009 Form 10-K and its Form 10-Q for the quarter ended June 30, 2010, in response to Part II, Item 1A. In general, these risk factors, including the risk factor added below, may present the risk of a material impact on our results of
operations or financial condition, in addition to other possible consequences described therein. These risk factors are also discussed further in other parts of our Form 10-K and this Report.
PNC faces increased risk arising out of its mortgage lending and servicing businesses.
Numerous federal and state governmental, legislative and regulatory authorities are investigating practices in the mortgage lending and servicing
industries. PNC has received inquiries from governmental, legislative and regulatory authorities on this topic and is cooperating with these inquiries. These inquiries may lead to administrative, civil or criminal proceedings, possibly resulting in
remedies including fines, penalties, restitution, or alterations in our business practices.
In addition to governmental or regulatory
investigations, PNC, like other companies with residential mortgage origination and servicing operations, faces the risk of class actions, other litigation and claims from the owners of, investors in or purchasers of mortgages originated or serviced
by PNC (or securities backed by such mortgages); homeowners involved in foreclosure proceedings; downstream purchasers of homes sold after foreclosure; title insurers; and other potential claimants. At this time PNC cannot predict the cost to or
effect upon PNC from governmental, legislative or regulatory actions or private litigation or claims arising out of residential mortgage lending and servicing practices, although such actions, litigation and claims could, individually or in the
aggregate, result in significant expense.
PNC commenced a review of its residential mortgage servicing procedures related to foreclosures
after learning of the industry-wide servicing issues in late September 2010. After a review of the legal requirements in all fifty states and the District of Columbia, and of its own procedures, practices, information systems, and documentation, PNC
has developed enhanced procedures designed to ensure that the documentation accompanying the foreclosures it pursues complies with all relevant law. The review, correction and refiling of foreclosure documentation in the various states
could continue for a number of months, depending upon federal, state, local and private judicial and regulatory actions.
PNC expects that its mortgage servicing-related costs will increase. These incremental costs include, but are not limited to, the costs associated with commitment of additional resources to review and
enhance PNC’s procedures and to replace foreclosure documentation, as well as associated noninterest expenses for higher servicing and legal costs.
The issues described above may affect the value of our ownership interests, direct or indirect, in property subject to foreclosure. In addition, possible delays in the schedule for processing foreclosures
also may result in an increase in nonperforming loans, additional servicing costs and possible demands for contractual fees or penalties under servicing agreements. There is also an increase in the risk of repurchase requests arising out of either
the foreclosure process or origination issues. Reputational damage arising out of this industry-wide inquiry could also have an adverse effect upon our existing mortgage business and could reduce future business opportunities.
One or more of the foregoing could adversely affect PNC’s operations and financial condition.
I
TEM
2. U
NREGISTERED
S
ALES
O
F
E
QUITY
S
ECURITIES
A
ND
U
SE
O
F
P
ROCEEDS
(c) Details of our
repurchases of PNC common stock during the third quarter of 2010 are included in the following table:
In thousands, except per share data
|
|
|
|
|
|
|
|
|
|
|
|
|
|
|
|
|
|
|
2010 period
|
|
Total shares
purchased
(a)
|
|
|
Average
price
paid per
share
|
|
|
Total shares
purchased as
part
of
publicly
announced
programs (b)
|
|
|
Maximum
number
of
shares that
may yet be
purchased
under the
programs (b)
|
|
|
July 1 – July 31
|
|
|
162
|
|
|
$
|
59.08
|
|
|
|
|
|
|
|
24,710
|
|
|
Aug 1 – Aug 31
|
|
|
145
|
|
|
$
|
55.21
|
|
|
|
|
|
|
|
24,710
|
|
|
Sep 1 – Sep 30
|
|
|
127
|
|
|
$
|
53.47
|
|
|
|
|
|
|
|
24,710
|
|
|
Total
|
|
|
434
|
|
|
$
|
56.14
|
|
|
|
|
|
|
|
|
|
|
(a)
|
Reflects PNC common stock purchased in connection with our various employee benefit plans. No shares were purchased under the program referred to in note (b) to
this table during the third quarter of 2010.
|
|
(b)
|
Our current stock repurchase program allows us to purchase up to 25 million shares on the open market or in privately negotiated transactions. This program was
authorized on October 4, 2007 and will remain in effect until fully utilized or until modified, superseded or terminated.
|
In addition to the repurchases of PNC common stock during the third quarter of 2010 included in the table above, PNC called its $1.80 Cumulative
Convertible Preferred Stock – Series A for redemption in accordance with the terms of that stock effective September 10, 2010 and redeemed 1,777 outstanding shares of that stock at the redemption price of $40.00 per share.
114
I
TEM
6. E
XHIBITS
The following exhibit index lists Exhibits filed, or in the case of Exhibits 32.1 and 32.2 furnished, with this Quarterly Report on Form 10-Q:
E
XHIBIT
I
NDEX
|
|
|
|
|
10.75
|
|
2010 forms of employee performance units agreements
|
|
|
|
|
12.1
|
|
Computation of Ratio of Earnings to Fixed Charges
|
|
|
|
|
12.2
|
|
Computation of Ratio of Earnings to Fixed Charges and Preferred Stock Dividends
|
|
|
|
|
31.1
|
|
Certification of Chairman and Chief Executive Officer pursuant to Section 302 of the Sarbanes-Oxley Act of 2002
|
|
|
|
|
31.2
|
|
Certification of Chief Financial Officer pursuant to Section 302 of the Sarbanes-Oxley Act of 2002
|
|
|
|
|
32.1
|
|
Certification by Chief Executive Officer pursuant to 18 U.S.C. Section 1350
|
|
|
|
|
32.2
|
|
Certification by Chief Financial Officer pursuant to 18 U.S.C. Section 1350
|
|
|
|
|
101
|
|
Interactive Data File (XBRL)
|
You can obtain copies of these
Exhibits electronically at the SEC’s website at www.sec.gov or by mail from the Public Reference Section of the SEC, 100 F Street, N.E., Washington, DC 20549 at prescribed rates. The Exhibits are also available as part of this Form 10-Q on or
through PNC’s corporate website at www.pnc.com/secfilings. Shareholders and bondholders may also receive copies of Exhibits, without charge, by contacting Shareholder Relations at 800-843-2206 or via e-mail at investor.relations@pnc.com. The
interactive data file (XBRL) exhibit is only available electronically.
S
IGNATURE
Pursuant to the requirements of the Securities Exchange Act of 1934, the registrant has duly caused this report to be signed on November 9, 2010 on
its behalf by the undersigned thereunto duly authorized.
|
|
|
|
|
The PNC Financial Services Group, Inc.
|
|
|
|
|
|
|
/s/ Richard J. Johnson
|
|
|
|
Richard J. Johnson
|
|
|
|
Executive Vice President and Chief Financial Officer
|
|
|
|
(Principal Financial Officer)
|
|
|
115
CORPORATE INFORMATION
T
HE
PNC F
INANCIAL
S
ERVICES
G
ROUP
, I
NC
.
C
ORPORATE
H
EADQUARTERS
The PNC Financial Services
Group, Inc.
One PNC Plaza, 249 Fifth Avenue
Pittsburgh, Pennsylvania 15222-2707
412-762-2000
S
TOCK
L
ISTING
The common stock of the PNC Financial Services Group, Inc. is listed on the New York Stock
Exchange under the symbol PNC.
I
NTERNET
I
NFORMATION
The PNC Financial Services Group, Inc.’s
financial reports and information about its products and services are available on the internet at www.pnc.com. We provide information for investors in portions of our corporate website, such as the Investor Events, Quarterly Earnings, SEC Filings,
Financial Information, Financial Press Releases and Message from the Chairman areas that you can find under “About PNC – Investor Relations.” In this section, we will from time to time post information that we believe may be important
or useful to investors. We generally post the following shortly before or promptly following its first use or release: financially-related press releases (including earnings releases), various SEC filings, presentation materials associated with
earnings and other investor conference calls or events, and access to live and taped audio from such calls or events. When warranted, we will also use our website to expedite public access to time-critical information regarding PNC in advance of
distribution of a press release or a filing with the SEC disclosing the same information. You can also find the SEC reports and corporate governance information described in the sections below in the Investor Relations section of our website.
Where we have included web addresses in this Report, such as our web address and web addresses of the SEC and of BlackRock, we have included
those web addresses as inactive textual references only. Except as specifically incorporated by reference into this Report, information on those websites is not part hereof.
F
INANCIAL
I
NFORMATION
We are subject to the informational requirements of the Securities Exchange Act of 1934, as amended (Exchange Act), and, in accordance
with the Exchange Act, we file annual, quarterly and current reports, proxy statements, and other information with the SEC. You can obtain copies of these and other filings, including exhibits, electronically at the SEC’s internet website at
www.sec.gov or on or through PNC’s corporate internet website at www.pnc.com/secfilings. Copies may also be obtained without charge by contacting Shareholder Services at 800-982-7652 or via the online contact form at
www.computershare.com/contactus for copies without exhibits or by contacting Shareholder Relations at
800-843-2206 or via email at investor.relations@pnc.com for copies of exhibits. The interactive data file (XBRL) exhibit is only available electronically.
C
ORPORATE
G
OVERNANCE
AT
PNC
Information about our Board of Directors and its committees and
corporate governance at PNC is available on PNC’s corporate website at www.pnc.com/corporategovernance. Shareholders who would like to request printed copies of PNC’s Code of Business Conduct and Ethics or our Corporate Governance
Guidelines or the charters of our Board’s Audit, Nominating and Governance, Personnel and Compensation, or Risk Committees (all of which are posted on the PNC corporate website) may do so by sending their requests to George P. Long, III, Chief
Governance Counsel and Corporate Secretary, at corporate headquarters at the above address. Copies will be provided without charge to shareholders.
I
NQUIRIES
For financial services call 888-PNC-2265.
Individual
shareholders should contact Shareholder Services at 800-982-7652.
Analysts and institutional investors should contact William H. Callihan,
Senior Vice President, Director of Investor Relations, at 412-762-8257 or via email at investor.relations@pnc.com.
News media representatives
and others seeking general information should contact Fred Solomon, Vice President, Corporate Communications, at 412-762-4550 or via email at corporate.communications@pnc.com.
C
OMMON
S
TOCK
P
RICES
/D
IVIDENDS
D
ECLARED
The table below sets forth by quarter the range of high and low sale and
quarter-end closing prices for The PNC Financial Services Group, Inc. common stock and the cash dividends declared per common share.
|
|
|
|
|
|
|
|
|
|
|
|
|
|
|
|
|
|
|
|
|
High
|
|
|
Low
|
|
|
Close
|
|
|
Cash
Dividends
Declared
|
|
|
2010 Quarter
|
|
|
|
|
|
|
|
|
|
|
|
|
|
|
|
|
|
First
|
|
$
|
61.80
|
|
|
$
|
50.46
|
|
|
$
|
59.70
|
|
|
$
|
.10
|
|
|
Second
|
|
|
70.45
|
|
|
|
56.30
|
|
|
|
56.50
|
|
|
|
.10
|
|
|
Third
|
|
|
62.99
|
|
|
|
49.43
|
|
|
|
51.91
|
|
|
|
.10
|
|
|
Total
|
|
|
|
|
|
|
|
|
|
|
|
|
|
$
|
.30
|
|
|
2009 Quarter
|
|
|
|
|
|
|
|
|
|
|
|
|
|
|
|
|
|
First
|
|
$
|
50.42
|
|
|
$
|
16.20
|
|
|
$
|
29.29
|
|
|
$
|
.66
|
|
|
Second
|
|
|
53.22
|
|
|
|
27.50
|
|
|
|
38.81
|
|
|
|
.10
|
|
|
Third
|
|
|
48.78
|
|
|
|
33.06
|
|
|
|
48.59
|
|
|
|
.10
|
|
|
Fourth
|
|
|
57.86
|
|
|
|
43.37
|
|
|
|
52.79
|
|
|
|
.10
|
|
|
Total
|
|
|
|
|
|
|
|
|
|
|
|
|
|
$
|
.96
|
|
D
IVIDEND
P
OLICY
Holders of PNC common stock are entitled to receive dividends when declared by the Board of
Directors out of funds legally available for this purpose. Our Board of Directors may not pay or set apart dividends on the common
116
stock until dividends for all past dividend periods on any series of outstanding preferred stock have been paid or declared and set apart for payment. The Board presently intends to continue the
policy of paying quarterly cash dividends. The amount of any future dividends will depend on economic and market conditions, our financial condition and operating results, and other factors, including contractual restrictions and applicable
government regulations and policies (such as those relating to the ability of bank and non-bank subsidiaries to pay dividends to the parent company).
D
IVIDEND
R
EINVESTMENT
A
ND
S
TOCK
P
URCHASE
P
LAN
The PNC Financial Services Group, Inc. Dividend Reinvestment and Stock Purchase Plan
enables holders of our common and preferred stock to conveniently purchase additional shares of common stock. You can obtain a prospectus and enrollment form by contacting Shareholder Services at 800-982-7652.
R
EGISTRAR
A
ND
S
TOCK
T
RANSFER
A
GENT
Computershare Trust Company, N.A.
250 Royall
Street
Canton, MA 02021
800-982-7652
117