Form 10-Q
UNITED STATES
SECURITIES AND EXCHANGE COMMISSION
Washington, DC 20549
FORM 10-Q
|
x
|
QUARTERLY REPORT PURSUANT TO SECTION 13 OR 15(d) OF THE SECURITIES EXCHANGE ACT OF 1934
|
For the quarterly period ended June 30, 2011
or
|
¨
|
TRANSITION REPORT PURSUANT TO SECTION 13 OR 15(d) OF THE SECURITIES EXCHANGE ACT OF 1934
|
For the transition period from to
Commission file number 001-09718
The PNC Financial Services Group, Inc.
(Exact name of registrant as specified in its charter)
|
|
|
|
|
Pennsylvania
|
|
25-1435979
|
|
(State or other jurisdiction of
incorporation or organization)
|
|
(I.R.S. Employer
Identification No.)
|
One PNC Plaza, 249 Fifth Avenue, Pittsburgh, Pennsylvania 15222-2707
(Address of principal executive offices, including zip code)
(412) 762-2000
(Registrant’s telephone number, including area code)
(Former name, former address and former fiscal year, if changed since last report)
Indicate by check mark whether the registrant: (1) has filed all reports required to be filed by Section 13 or 15(d) of the
Securities Exchange Act of 1934 during the preceding 12 months (or for such shorter period that the registrant was required to file such reports), and (2) has been subject to such filing requirements for the past 90
days. Yes
x
No
¨
Indicate by check mark whether the registrant has submitted electronically and posted on its corporate Web site, if any, every
Interactive Data File required to be submitted and posted pursuant to Rule 405 of Regulation S-T (§232.405 of this chapter) during the preceding 12 months (or for such shorter period that the registrant was required to submit and post such
files). Yes
x
No
¨
Indicate by check mark whether the registrant is a large accelerated filer, an accelerated filer, a non-accelerated filer, or a smaller
reporting company. See the definitions of “large accelerated filer”, “accelerated filer” and “smaller reporting company” in Rule 12b-2 of the Exchange Act.
|
|
|
|
|
|
|
|
|
Large accelerated filer
|
|
x
|
|
Accelerated filer
|
|
¨
|
|
|
|
|
|
|
Non-accelerated filer
|
|
¨
|
|
Smaller reporting company
|
|
¨
|
Indicate by check mark whether the registrant is a shell company (as defined in Rule 12b-2 of the
Exchange Act). Yes
¨
No
x
As of July 29, 2011, there were 526,240,991 shares of the registrant’s common stock ($5 par value) outstanding.
T
HE
P
NC
F
INANCIAL
S
ERVICES
G
ROUP
,
I
NC
.
Cross-Reference Index to Second Quarter 2011 Form 10-Q
F
INANCIAL
R
EVIEW
C
ONSOLIDATED
F
INANCIAL
H
IGHLIGHTS
T
HE
PNC F
INANCIAL
S
ERVICES
G
ROUP
, I
NC
.
|
|
|
|
|
|
|
|
|
|
|
|
|
|
|
|
|
|
|
Dollars in millions, except per share data
|
|
Three months ended
June 30
|
|
|
Six months ended
June 30
|
|
|
Unaudited
|
|
2011
|
|
|
2010
|
|
|
2011
|
|
|
2010
|
|
|
F
INANCIAL
R
ESULTS
(a)
|
|
|
|
|
|
|
|
|
|
|
|
|
|
|
|
|
|
Revenue
|
|
|
|
|
|
|
|
|
|
|
|
|
|
|
|
|
|
Net interest income
|
|
$
|
2,150
|
|
|
$
|
2,435
|
|
|
$
|
4,326
|
|
|
$
|
4,814
|
|
|
Noninterest income
|
|
|
1,452
|
|
|
|
1,477
|
|
|
|
2,907
|
|
|
|
2,861
|
|
|
Total revenue
|
|
|
3,602
|
|
|
|
3,912
|
|
|
|
7,233
|
|
|
|
7,675
|
|
|
Noninterest expense
|
|
|
2,176
|
|
|
|
2,002
|
|
|
|
4,246
|
|
|
|
4,115
|
|
|
Pretax, pre-provision earnings from continuing operations (b)
|
|
|
1,426
|
|
|
|
1,910
|
|
|
|
2,987
|
|
|
|
3,560
|
|
|
Provision for credit losses
|
|
|
280
|
|
|
|
823
|
|
|
|
701
|
|
|
|
1,574
|
|
|
Income from continuing operations before income taxes and noncontrolling interests (pretax earnings)
|
|
$
|
1,146
|
|
|
$
|
1,087
|
|
|
$
|
2,286
|
|
|
$
|
1,986
|
|
|
Income from continuing operations before noncontrolling interests
|
|
$
|
912
|
|
|
$
|
781
|
|
|
$
|
1,744
|
|
|
$
|
1,429
|
|
|
Income from discontinued operations, net of income taxes (c)
|
|
|
|
|
|
|
22
|
|
|
|
|
|
|
|
45
|
|
|
Net income
|
|
$
|
912
|
|
|
$
|
803
|
|
|
$
|
1,744
|
|
|
$
|
1,474
|
|
|
Less:
|
|
|
|
|
|
|
|
|
|
|
|
|
|
|
|
|
|
Net income (loss) attributable to noncontrolling interests
|
|
|
(1
|
)
|
|
|
(9
|
)
|
|
|
(6
|
)
|
|
|
(14
|
)
|
|
Preferred stock dividends, including TARP (d)
|
|
|
24
|
|
|
|
25
|
|
|
|
28
|
|
|
|
118
|
|
|
Preferred stock discount accretion and redemptions, including redemption of TARP
preferred stock discount accretion (d)
|
|
|
1
|
|
|
|
1
|
|
|
|
1
|
|
|
|
251
|
|
|
Net income attributable to common shareholders (d)
|
|
$
|
888
|
|
|
$
|
786
|
|
|
$
|
1,721
|
|
|
$
|
1,119
|
|
|
Diluted earnings per common share
|
|
|
|
|
|
|
|
|
|
|
|
|
|
|
|
|
|
Continuing operations
|
|
$
|
1.67
|
|
|
$
|
1.43
|
|
|
$
|
3.24
|
|
|
$
|
2.06
|
|
|
Discontinued operations (c)
|
|
|
|
|
|
|
.04
|
|
|
|
|
|
|
|
.09
|
|
|
Net income
|
|
$
|
1.67
|
|
|
$
|
1.47
|
|
|
$
|
3.24
|
|
|
$
|
2.15
|
|
|
Cash dividends declared per common share
|
|
$
|
.35
|
|
|
$
|
.10
|
|
|
$
|
.45
|
|
|
$
|
.20
|
|
|
P
ERFORMANCE
R
ATIOS
|
|
|
|
|
|
|
|
|
|
|
|
|
|
|
|
|
|
Net interest margin (e)
|
|
|
3.93
|
%
|
|
|
4.35
|
%
|
|
|
3.93
|
%
|
|
|
4.29
|
%
|
|
Noninterest income to total revenue
|
|
|
40
|
|
|
|
38
|
|
|
|
40
|
|
|
|
37
|
|
|
Efficiency
|
|
|
60
|
|
|
|
51
|
|
|
|
59
|
|
|
|
54
|
|
|
Return on:
|
|
|
|
|
|
|
|
|
|
|
|
|
|
|
|
|
|
Average common shareholders’ equity
|
|
|
11.44
|
|
|
|
11.52
|
|
|
|
11.29
|
|
|
|
8.63
|
|
|
Average assets
|
|
|
1.40
|
|
|
|
1.22
|
|
|
|
1.34
|
|
|
|
1.12
|
|
See page 59 for a glossary of certain terms used in this Report.
Certain prior period amounts have been reclassified to conform with the current period presentation, which we believe is more meaningful to readers of our consolidated financial statements.
|
(a)
|
The Executive Summary and Consolidated Income Statement Review portions of the Financial Review section of this Report provide information regarding items impacting the
comparability of the periods presented.
|
|
(b)
|
We believe that pretax, pre-provision earnings from continuing operations, a non-GAAP measure, is useful as a tool to help evaluate our ability to provide for credit
costs through operations.
|
|
(c)
|
Includes results of operations for PNC Global Investment Servicing Inc. (GIS). We sold GIS effective July 1, 2010. See Sale of PNC Global Investment Servicing in
the Executive Summary section of the Financial Review section of this Report and Note 2 Acquisition and Divestiture Activity in the Notes To Consolidated Financial Statements of this Report for additional information.
|
|
(d)
|
We redeemed the Series N (TARP) Preferred Stock on February 10, 2010. In connection with the redemption, we accelerated the accretion of the remaining issuance
discount on the Series N Preferred Stock and recorded a corresponding reduction in retained earnings of $250 million in the first quarter of 2010. This resulted in a one-time, noncash reduction in net income attributable to common shareholders and
related basic and diluted earnings per share. The impact on diluted earnings per share was $.49 for the six months ended June 30, 2010. Total dividends declared during the first six months of 2010 included $89 million on the Series N Preferred
Stock.
|
|
(e)
|
Calculated as annualized taxable-equivalent net interest income divided by average earning assets. The interest income earned on certain earning assets is completely or
partially exempt from federal income tax. As such, these tax-exempt instruments typically yield lower returns than taxable investments. To provide more meaningful comparisons of net interest margins for all earning assets, we use net interest income
on a taxable-equivalent basis in calculating net interest margin by increasing the interest income earned on tax-exempt assets to make it fully equivalent to interest income earned on taxable investments. This adjustment is not permitted under
generally accepted accounting principles (GAAP) in the Consolidated Income Statement. The taxable-equivalent adjustments to net interest income for the three months ended June 30, 2011 and June 30, 2010 were $25 million and $19 million,
respectively. The taxable-equivalent adjustments to net interest income for the six months ended June 30, 2011 and June 30, 2010 were $49 million and $37 million, respectively.
|
1
C
ONSOLIDATED
F
INANCIAL
H
IGHLIGHTS
(C
ONTINUED
) (a)
|
|
|
|
|
|
|
|
|
|
|
|
|
|
|
Unaudited
|
|
June 30
2011
|
|
|
December 31
2010
|
|
|
June 30
2010
|
|
|
Balance Sheet Data
(dollars in millions, except per share data)
|
|
|
|
|
|
|
|
|
|
|
|
|
|
Assets
|
|
$
|
263,117
|
|
|
$
|
264,284
|
|
|
$
|
261,695
|
|
|
Loans (b) (c)
|
|
|
150,319
|
|
|
|
150,595
|
|
|
|
154,342
|
|
|
Allowance for loan and lease losses (b)
|
|
|
4,627
|
|
|
|
4,887
|
|
|
|
5,336
|
|
|
Interest-earning deposits with banks (b)
|
|
|
4,508
|
|
|
|
1,610
|
|
|
|
5,028
|
|
|
Investment securities (b)
|
|
|
59,414
|
|
|
|
64,262
|
|
|
|
53,717
|
|
|
Loans held for sale (c)
|
|
|
2,679
|
|
|
|
3,492
|
|
|
|
2,756
|
|
|
Goodwill and other intangible assets
|
|
|
10,594
|
|
|
|
10,753
|
|
|
|
12,138
|
|
|
Equity investments (b)
|
|
|
9,776
|
|
|
|
9,220
|
|
|
|
10,159
|
|
|
Noninterest-bearing deposits
|
|
|
52,683
|
|
|
|
50,019
|
|
|
|
44,312
|
|
|
Interest-bearing deposits
|
|
|
129,208
|
|
|
|
133,371
|
|
|
|
134,487
|
|
|
Total deposits
|
|
|
181,891
|
|
|
|
183,390
|
|
|
|
178,799
|
|
|
Transaction deposits
|
|
|
137,109
|
|
|
|
134,654
|
|
|
|
125,712
|
|
|
Borrowed funds (b)
|
|
|
35,176
|
|
|
|
39,488
|
|
|
|
40,427
|
|
|
Shareholders’ equity
|
|
|
32,235
|
|
|
|
30,242
|
|
|
|
28,377
|
|
|
Common shareholders’ equity
|
|
|
31,588
|
|
|
|
29,596
|
|
|
|
27,725
|
|
|
Accumulated other comprehensive income (loss)
|
|
|
69
|
|
|
|
(431
|
)
|
|
|
(442
|
)
|
|
Book value per common share
|
|
|
60.02
|
|
|
|
56.29
|
|
|
|
52.77
|
|
|
Common shares outstanding (millions)
|
|
|
526
|
|
|
|
526
|
|
|
|
525
|
|
|
Loans to deposits
|
|
|
83
|
%
|
|
|
82
|
%
|
|
|
86
|
%
|
|
|
|
|
|
|
Assets Under Administration
(billions)
|
|
|
|
|
|
|
|
|
|
|
|
|
|
Discretionary assets under management
|
|
$
|
109
|
|
|
$
|
108
|
|
|
$
|
99
|
|
|
Nondiscretionary assets under administration
|
|
|
110
|
|
|
|
104
|
|
|
|
100
|
|
|
Total assets under administration
|
|
|
219
|
|
|
|
212
|
|
|
|
199
|
|
|
|
|
|
|
|
Capital Ratios
|
|
|
|
|
|
|
|
|
|
|
|
|
|
Tier 1 common
|
|
|
10.5
|
%
|
|
|
9.8
|
%
|
|
|
8.3
|
%
|
|
Tier 1 risk-based (d)
|
|
|
12.8
|
|
|
|
12.1
|
|
|
|
10.7
|
|
|
Total risk-based (d)
|
|
|
16.2
|
|
|
|
15.6
|
|
|
|
14.3
|
|
|
Leverage (d)
|
|
|
11.0
|
|
|
|
10.2
|
|
|
|
9.1
|
|
|
Common shareholders’ equity to assets
|
|
|
12.0
|
|
|
|
11.2
|
|
|
|
10.6
|
|
|
|
|
|
|
|
Asset Quality Ratios
|
|
|
|
|
|
|
|
|
|
|
|
|
|
Nonperforming loans to total loans
|
|
|
2.57
|
%
|
|
|
2.97
|
%
|
|
|
3.31
|
%
|
|
Nonperforming assets to total loans, OREO and foreclosed assets
|
|
|
2.97
|
|
|
|
3.39
|
|
|
|
3.70
|
|
|
Nonperforming assets to total assets
|
|
|
1.70
|
|
|
|
1.94
|
|
|
|
2.19
|
|
|
Net charge-offs to average loans (for the three months ended) (annualized)
|
|
|
1.11
|
|
|
|
2.09
|
|
|
|
2.18
|
|
|
Allowance for loan and lease losses to total loans
|
|
|
3.08
|
|
|
|
3.25
|
|
|
|
3.46
|
|
|
Allowance for loan and lease losses to nonperforming loans (e)
|
|
|
120
|
|
|
|
109
|
|
|
|
104
|
|
|
(a)
|
The Executive Summary and Consolidated Balance Sheet Review portions of the Financial Review section of this Report provide information regarding items impacting the
comparability of the periods presented.
|
|
(b)
|
Amounts include consolidated variable interest entities. See Consolidated Balance Sheet in Part I, Item 1 of this Report for additional information. Also includes
our equity interest in BlackRock under Equity investments.
|
|
(c)
|
Amounts include assets for which we have elected the fair value option. See Consolidated Balance Sheet in Part I, Item 1 of this Report for additional information.
|
|
(d)
|
The minimum US regulatory capital ratios under Basel I are 4.0% for Tier 1 risk-based, 8.0% for Total risk-based, and 4.0% for Leverage. The well-capitalized levels are
6.0% for Tier 1 risk-based, 10.0% for Total risk-based, and 5.0% for Leverage.
|
|
(e)
|
The allowance for loan and lease losses includes impairment reserves attributable to purchased impaired loans. Nonperforming loans do not include purchased impaired
loans or loans held for sale and, effective in 2011, do not include nonperforming residential real estate loans accounted for under the fair value option.
|
2
F
INANCIAL
R
EVIEW
T
HE
PNC F
INANCIAL
S
ERVICES
G
ROUP
, I
NC
.
This Financial Review, including the Consolidated Financial Highlights, should be read together with our unaudited Consolidated Financial Statements
and unaudited Statistical Information included elsewhere in this Report and with Items 6, 7, 8 and 9A of our 2010 Annual Report on Form 10-K (2010 Form 10-K). We have reclassified certain prior period amounts to conform with the current period
presentation, which we believe is more meaningful to readers of our consolidated financial statements. For information regarding certain business and regulatory risks, see the following sections as they appear in this Report, in our 2010 Form 10-K,
and in our first quarter 2011 Form 10-Q: the Risk Management section of the Financial Review portion of the respective report; Item 1A Risk Factors included in the respective report; and the Legal Proceedings and Commitments and Guarantees
Notes of the Notes to Consolidated Financial Statements included in the respective report. Also, see the Cautionary Statement Regarding Forward-Looking Information and Critical Accounting Estimates And Judgments sections in this Financial Review for
certain other factors that could cause actual results or future events to differ, perhaps materially, from historical performance and those anticipated in the forward-looking statements included in this Report. See Note 18 Segment Reporting in the
Notes To Consolidated Financial Statements included in Part I, Item 1 of this Report for a reconciliation of total business segment earnings to total PNC consolidated net income from continuing operations before noncontrolling interests as
reported on a generally accepted accounting principles (GAAP) basis.
E
XECUTIVE
S
UMMARY
PNC is one of the largest diversified financial services companies in the United States and is headquartered in Pittsburgh, Pennsylvania.
PNC has businesses engaged in retail banking, corporate and institutional banking, asset management, and residential mortgage banking, providing many of
its products and services nationally and others in PNC’s primary geographic markets located in Pennsylvania, Ohio, New Jersey, Michigan, Maryland, Illinois, Indiana, Kentucky, Florida, Virginia, Missouri, Delaware, Washington, D.C., and
Wisconsin. PNC also provides certain products and services internationally.
K
EY
S
TRATEGIC
G
OALS
We manage our company for the long term and are focused on managing toward a moderate risk profile while
maintaining strong capital and liquidity positions, investing in our markets and products, and embracing our corporate responsibility to the communities where we do business.
Our strategy to enhance shareholder value centers on driving growth in pre-tax, pre-provision earnings by achieving growth in revenue from our balance sheet and diverse business mix that exceeds growth in
expenses controlled through disciplined cost management.
The primary drivers of revenue growth are the acquisition, expansion and retention
of customer relationships. We strive to expand our customer base by offering convenient banking options and leading technology solutions, providing a broad range of fee-based and credit products and services, focusing on customer service, and
through a significantly enhanced branding initiative. This strategy is designed to give our consumer customers choices based on their needs. Rather than striving to optimize fee revenue in the short term, our approach is focused on effectively
growing targeted market share and “share of wallet.” We may also grow revenue
through appropriate and targeted acquisitions and, in certain businesses, by expanding into new geographical markets.
We are focused on our strategies for quality growth. We are committed to a moderate risk philosophy characterized by disciplined credit management and limited exposure to earnings volatility resulting
from interest rate fluctuations and the shape of the interest rate yield curve. We made substantial progress in transitioning our balance sheet over the past two years, working to return to our moderate risk profile throughout our expanded
franchise. Our actions have created a well-positioned balance sheet, strong bank level liquidity and investment flexibility to adjust, where appropriate and permissible, to changing interest rates and market conditions.
P
ENDING
A
CQUISITION
OF
RBC B
ANK
(USA)
On June 19, 2011, PNC entered into a definitive agreement to acquire RBC Bank (USA), the US retail banking subsidiary of Royal Bank of Canada. RBC
Bank (USA) has approximately $25 billion of assets and 424 branches in North Carolina, Florida, Alabama, Georgia, Virginia and South Carolina. The transaction is expected to add approximately $19 billion of deposits and $16 billion of loans to
PNC’s Consolidated Balance Sheet and to close in March 2012, subject to customary closing conditions, including regulatory approvals. Note 2 Acquisition and Divestiture Activity in the Notes To Consolidated Financial Statements of this Report
and our Current Report on Form 8-K dated June 19, 2011 contain additional information regarding this pending acquisition.
P
ENDING
A
CQUISITION
OF
F
LAGSTAR
B
RANCHES
On July 26, 2011, PNC signed a definitive agreement to acquire 27 branches in metropolitan Atlanta, Georgia from Flagstar Bank, FSB, a subsidiary of
Flagstar Bancorp, Inc., and assume approximately $240 million of deposits associated with those branches based on balances as of June 30, 2011. Under the agreement, PNC will purchase 21 branches and lease six branches located in a seven-county
area primarily
3
north of Atlanta. Acquired real estate and fixed assets associated with the branches will be purchased for net book value, of approximately $42 million. No deposit premium will be paid and no
loans will be acquired in the transaction, which is expected to close in December 2011 subject to customary closing conditions, including regulatory approvals.
2011 C
APITAL
A
CTIONS
Our ability to take certain
capital actions has been subject to the results of the supervisory assessment of capital adequacy undertaken by the Board of Governors of the Federal Reserve System (Federal Reserve) and our primary bank regulators as part of the capital adequacy
assessment of the 19 bank holding companies that participate in the Supervisory Capital Assessment Program. As we announced on March 18, 2011, the Federal Reserve accepted the capital plan that we had previously submitted for their review and
did not object to our capital actions.
On July 27, 2011, we issued one million depositary shares, each representing
a 1/100
th
interest in a share of our Fixed-to-Floating
Rate Non-Cumulative Perpetual Preferred Stock, Series O, in an underwritten public offering resulting in gross proceeds to us before commissions and expenses of $1 billion. We intend to use the net proceeds from this offering for general corporate
purposes, including funding for the pending RBC Bank (USA) acquisition.
On April 7, 2011, consistent with our capital plan submitted to
the Federal Reserve, our Board of Directors approved an increase to PNC’s quarterly common stock dividend from $.10 per common share to $.35 per common share, which was paid on May 5, 2011. Additionally, also consistent with that capital
plan, our Board of Directors also confirmed that PNC may begin to purchase common stock under its existing 25 million share repurchase program in open market or privately negotiated transactions. We have placed on hold our plans to repurchase
up to $500 million of common stock during the remainder of 2011 until we obtain regulatory approval for the RBC Bank (USA) acquisition, and will reevaluate share repurchase plans at that time. The discussion of capital within the Consolidated
Balance Sheet Review section of this Financial Review includes additional information regarding our common stock repurchase program.
R
ECENT
M
ARKET
AND
I
NDUSTRY
D
EVELOPMENTS
There have been numerous legislative and regulatory developments and dramatic changes in the competitive landscape of our industry over the last several
years.
The United States and other governments have undertaken major reform of the regulatory oversight structure of the financial services
industry, including engaging in new efforts to impose requirements designed to protect consumers and investors from financial abuse. We expect to face further increased regulation of our industry as a result of current and future initiatives
intended to provide economic stimulus,
financial market stability and enhanced regulation of financial services companies and to enhance the liquidity and solvency of financial institutions and markets. We also expect in many cases
more intense scrutiny from our bank supervisors in the examination process and more aggressive enforcement of regulations on both the federal and state levels. Compliance with regulations and other supervisory initiatives will likely increase our
costs and reduce our revenue, and may limit our ability to pursue certain desirable business opportunities.
The Dodd-Frank Wall Street Reform
and Consumer Protection Act (Dodd-Frank) mandates the most wide-ranging overhaul of financial industry regulation in decades. Dodd-Frank was signed into law on July 21, 2010. Although Dodd-Frank and other reforms will affect a number of the
areas in which we do business, it is not clear at this time the full extent of the adjustments that will be required and the extent to which we will be able to adjust our businesses in response to the requirements. Many parts of the law are now in
effect and others are now in the implementation stage, which is likely to continue for several years. The law requires that regulators, some of which are new regulatory bodies created by Dodd-Frank, draft, review and approve more than 300
implementing regulations and conduct numerous studies that are likely to lead to more regulations, a process that, while well underway, is proceeding somewhat slower than originally anticipated, thus extending the uncertainty surrounding the
ultimate impact of Dodd-Frank on us.
A number of reform provisions are likely to significantly impact the ways in which banks and bank
holding companies, including PNC, do business. We provide additional information on a number of these provisions (including new consumer protection regulation, enhanced capital requirements, limitations on investment in and sponsorship of funds,
risk retention by securitization participants, new regulation of derivatives, potential applicability of state consumer protection laws, and limitations on interchange fees) and some of their potential impacts on PNC in Item 1A Risk Factors
included in Part II of this Report.
R
ESIDENTIAL
M
ORTGAGE
F
ORECLOSURE
M
ATTERS
Beginning in the third quarter of 2010, mortgage foreclosure documentation practices among US financial institutions received
heightened attention by regulators and the media. PNC’s US market share for residential servicing based on retail origination volume is approximately 1.6%. The vast majority of our servicing business is on behalf of other investors, principally
the Federal Home Loan Mortgage Corporation (FHLMC) and the Federal National Mortgage Association (FNMA). Following the initial reports regarding these practices, we conducted an internal review of our foreclosure procedures. Based upon our review,
we believe that PNC has systems designed to ensure that no foreclosure proceeds unless the loan is genuinely in default.
4
Similar to other banks, however, we identified issues regarding some of our foreclosure practices.
Accordingly, after implementing a delay in pursuing individual foreclosures, we have been moving forward in most jurisdictions on such matters under procedures designed to address as appropriate any documentation issues. We are also proceeding with
new foreclosures under enhanced procedures designed as part of this review to minimize the risk of errors related to the processing of documentation in foreclosure cases.
The Federal Reserve and the Office of the Comptroller of the Currency (OCC), together with the FDIC and others, conducted a publicly-disclosed interagency horizontal review of residential mortgage
servicing operations at PNC and thirteen other federally regulated mortgage servicers. As a result of that review, in April 2011 PNC entered into a consent order with the Federal Reserve and PNC Bank, National Association (PNC Bank) entered into a
consent order with the OCC. Collectively, these consent orders describe certain foreclosure-related practices and controls that the regulators found to be deficient and require PNC and PNC Bank to, among other things, develop and implement plans and
programs to enhance PNC’s residential mortgage servicing and foreclosure processes, retain an independent consultant to review certain residential mortgage foreclosure actions, take certain remedial actions, and oversee compliance with the
orders and the new plans and programs. The two orders do not foreclose the potential for civil money penalties from either of these regulators.
Other governmental, legislative and regulatory inquiries on this topic are ongoing, and may result in significant additional actions, penalties or other
remedies.
For additional information, including with respect to some of these other ongoing governmental, legislative and regulatory
inquiries, please see Note 16 Legal Proceedings and Note 17 Commitments and Guarantees in the Notes To Consolidated Financial Statements in this Report and our Current Report on Form 8-K dated April 14, 2011.
K
EY
F
ACTORS
A
FFECTING
F
INANCIAL
P
ERFORMANCE
Our financial performance is substantially affected by a number of external factors outside of our control, including the following:
|
|
•
|
|
General economic conditions, including the speed and stamina of the moderate economic recovery in general and on our customers in particular,
|
|
|
•
|
|
The level of, and direction, timing and magnitude of movement in, interest rates and the shape of the interest rate yield curve,
|
|
|
•
|
|
The functioning and other performance of, and availability of liquidity in, the capital and other financial markets,
|
|
|
•
|
|
Loan demand, utilization of credit commitments and standby letters of credit, and asset quality,
|
|
|
•
|
|
Customer demand for non-loan products and services,
|
|
|
•
|
|
Changes in the competitive and regulatory landscape and in counterparty creditworthiness and performance as the financial services industry
restructures in the current environment,
|
|
|
•
|
|
The impact of the extensive reforms enacted in the Dodd-Frank legislation and other legislative, regulatory and administrative initiatives, including
those outlined elsewhere in this Report, and
|
|
|
•
|
|
The impact of market credit spreads on asset valuations.
|
In addition, our success will depend, among other things, upon:
|
|
•
|
|
Further success in the acquisition, growth and retention of customers,
|
|
|
•
|
|
Continued development of the geographic markets related to our recent acquisitions, including full deployment of our product offerings,
|
|
|
•
|
|
Progress towards closing the pending RBC Bank (USA) and Flagstar branches acquisitions,
|
|
|
•
|
|
A sustained focus on expense management,
|
|
|
•
|
|
Managing the distressed assets portfolio and other impaired assets,
|
|
|
•
|
|
Improving our overall asset quality and continuing to meet evolving regulatory capital standards,
|
|
|
•
|
|
Continuing to maintain and grow our deposit base as a low-cost funding source,
|
|
|
•
|
|
Prudent risk and capital management related to our efforts to return to our desired moderate risk profile,
|
|
|
•
|
|
Actions we take within the capital and other financial markets, and
|
|
|
•
|
|
The impact of legal and regulatory contingencies.
|
S
ALE
OF
PNC G
LOBAL
I
NVESTMENT
S
ERVICING
On July 1, 2010, we sold PNC Global Investment Servicing Inc. (GIS), a leading provider of processing, technology and business intelligence services to asset managers, broker-dealers and financial
advisors worldwide, for $2.3 billion in cash pursuant to a definitive agreement entered into on February 2, 2010. The pretax gain recorded in the third quarter of 2010 related to this sale was $639 million, or $328 million after taxes.
Results of operations of GIS through June 30, 2010 are presented as income from discontinued operations, net of income taxes, on our
Consolidated Income Statement in this Report. Once we entered into the sales agreement, GIS was no longer a reportable business segment. See Note 2 Acquisition and Divestiture Activity in our Notes To Consolidated Financial Statements in this
Report.
5
I
NCOME
S
TATEMENT
H
IGHLIGHTS
|
|
•
|
|
Strong earnings for the second quarter of 2011 reflected improved credit quality and client sales and revenue momentum.
|
|
|
•
|
|
Net interest income of $2.2 billion and net interest margin of 3.93% for the second quarter both declined compared with the second quarter of 2010,
reflecting a lower yield on interest-earning assets resulting from lower purchase accounting accretion, soft loan demand and the low interest rate environment.
|
|
|
•
|
|
Noninterest income of $1.5 billion for the second quarter reflected lower service charges on deposits from the impact of Regulation E rules pertaining
to overdraft fees, partially offset by higher asset management fees.
|
|
|
•
|
|
The provision for credit losses of $280 million for the second quarter declined from $823 million in the second quarter of 2010 as overall credit
quality continued to improve.
|
|
|
•
|
|
Noninterest expense of $2.2 billion for the second quarter of 2011 increased $174 million compared with the second quarter of 2010 primarily due the
impact of second quarter 2010 benefits from the reversal of certain accrued liabilities, with $73 million associated with a franchise tax settlement and $47 million associated with an indemnification liability for certain Visa litigation.
|
|
|
•
|
|
A decline in the effective tax rate to 20.4% for the second quarter compared with 28.2% for the second quarter of 2010 was primarily attributable to a
reversal of certain deferred tax liabilities.
|
C
REDIT
Q
UALITY
H
IGHLIGHTS
|
|
•
|
|
Credit quality further improved in the second quarter of 2011. Nonperforming assets declined $642 million, or 13%, to $4.5 billion at June 30,
2011 compared with December 31, 2010. Accruing loans past due decreased 8% to $4.1 billion from $4.5 billion at December 31, 2010. Net charge-offs totaled $947 million for the first half of 2011 compared with $1.5 billion for the first
half of 2010, a decline of 38%. Second quarter 2011 net charge-offs declined to $414 million compared with $840 million in the second quarter of 2010. The allowance for loan and lease losses was 3.08% of total loans and 120% of nonperforming loans
as of June 30, 2011.
|
B
ALANCE
S
HEET
H
IGHLIGHTS
|
|
•
|
|
We continued our momentum in acquiring new clients and deepening customer relationships during the second quarter of 2011 with our innovative products
and services, distribution network and cross sell expertise. Retail banking checking relationships grew organically by 74,000 during the second quarter of 2011 compared with 10,000 during second quarter of 2010. Corporate banking is on track to
exceed its goal of adding 1,000 new primary clients in 2011.
|
|
|
|
Asset management sales referrals from PNC’s retail, corporate and commercial bankers for the first half of 2011 were double those in first half 2010.
|
|
|
•
|
|
Total loans of $150 billion at June 30, 2011 were about flat compared with December 31, 2010 as a result of growth in commercial loans
largely from new client acquisition and increased utilization from existing clients partially offset by declines in commercial real estate and consumer loans. Loans and commitments originated and renewed totaled approximately $38 billion in the
second quarter of 2011, including $1 billion of small business loans.
|
|
|
•
|
|
Total deposits were $182 billion at June 30, 2011, down slightly from December 31, 2010. Higher cost retail certificates of deposit continued
to decline with a net reduction of 4% in the second quarter, offset by growth in noninterest-bearing demand deposits.
|
|
|
•
|
|
PNC’s high quality balance sheet remained core funded with a loan to deposit ratio of 83% at June 30, 2011 and a strong liquidity position to
support growth.
|
|
|
•
|
|
PNC had strong capital levels at June 30, 2011 with a Tier 1 common capital ratio of 10.5% at June 30, 2011, an increase from 9.8% at
December 31, 2010.
|
|
|
•
|
|
PNC successfully completed the acquisition and conversion of 19 branches and $324 million of deposits from BankAtlantic in the Tampa, Florida area, on
June 6, 2011.
|
Our Consolidated Income Statement and Consolidated Balance Sheet Review sections of this Financial
Review describe in greater detail the various items that impacted our results for the first six months of 2011 and 2010.
A
VERAGE
C
ONSOLIDATED
B
ALANCE
S
HEET
H
IGHLIGHTS
Various seasonal and other factors impact our period-end balances whereas average balances are generally more indicative of underlying business trends
apart from the impact of acquisitions, divestitures and consolidations of variable interest entities. The Consolidated Balance Sheet Review section of this Financial Review provides information on changes in selected Consolidated Balance Sheet
categories at June 30, 2011 compared with December 31, 2010.
Total average assets were $261.8 billion for the first six months of
2011 compared with $265.7 billion for the first six months of 2010. Average interest-earning assets were $222.4 billion for the first six months of 2011, compared with $225.8 billion in the first six months of 2010. In both comparisons, the declines
were primarily driven by a $6.8 billion decrease in average total loans partially offset by a $4.3 billion increase in average total investment securities. The overall decline in average loans reflected soft customer loan demand, loan repayments,
dispositions and net charge-offs. The increase in total investment securities reflected net investments of excess liquidity in high quality securities primarily agency residential mortgage-backed securities.
6
Average total loans decreased $6.8 billion, to $150.0 billion for the first six months of 2011 compared
with the first six months of 2010. The decrease in average total loans primarily reflected declines in commercial real estate of $4.5 billion and residential real estate of $3.7 billion, partially offset by a $2.2 billion increase in commercial
loans. Commercial real estate loans declined due to loan sales, paydowns, and charge-offs. The decrease in residential real estate was impacted by portfolio management activities, paydowns and net charge-offs. Commercial loans increased due to a
combination of new client acquisition and improved utilization. Loans represented 67% of average interest-earning assets for the first six months of 2011 and 69% of average interest-earning assets for the first six months of 2010.
Average securities available for sale increased $4.0 billion, to $53.1 billion, in the first six months of 2011 compared with the first six months of
2010. Average agency residential mortgage-backed securities increased $6.4 billion and other debt securities increased $1.6 billion in the comparison while US Treasury and government agency securities decreased $3.0 billion and non-agency
residential mortgage-backed securities declined $1.9 billion. The impact of purchases of high quality agency residential mortgage-backed securities and other debt was partially offset by paydowns of other security types.
Average securities held to maturity increased $.3 billion, to $7.2 billion, in the first six months of 2011 compared with the first six months of 2010.
The increases of $1.0 billion in commercial mortgage-backed securities and $.6 billion in residential mortgage-backed securities more than offset a $1.3 billion decrease in asset-backed securities in the comparison.
Total investment securities comprised 27% of average interest-earning assets for the first six months of 2011 and 25% for the first six months of 2010.
Average noninterest-earning assets totaled $39.4 billion in the first six months of 2011 compared with $40.0 billion in the first six months
of 2010.
Average total deposits were $180.8 billion for the current year-to-date compared with $182.7 billion for the prior year-to-date.
Average deposits declined from the prior year period primarily as a result of decreases of $9.6 billion in average retail certificates of deposit and $.5 billion in average other time deposits, which were partially offset by increases of $5.3
billion in average noninterest-bearing deposits, $1.8 billion in average demand deposits and $1.1 billion in average savings deposits. Total deposits at June 30, 2011 were $181.9 billion compared with $183.4 billion at December 31, 2010
and are further discussed within the Consolidated Balance Sheet Review section of this Report.
Average total deposits represented 69% of
average total assets for the first six months of both 2011 and 2010.
Average transaction deposits were $133.9 billion for the first six months of 2011 compared with $126.6
billion for the first six months of 2010. The ongoing planned reduction of high-cost and primarily non-relationship certificates of deposit is part of our overall deposit strategy that is focused on growing demand and other transaction deposits as
cornerstone products of customer relationships and a lower-cost, stable funding source. Furthermore, core checking accounts are critical to our strategy of expanding our payments business.
Average borrowed funds were $36.7 billion for the current year-to-date compared with $41.7 billion for the prior year-to-date. Maturities of Federal Home Loan Bank (FHLB) borrowings drove the decline
compared with the first half of 2010. Total borrowed funds at June 30, 2011 were $35.2 billion compared with $39.5 billion at December 31, 2010 and are further discussed within the Consolidated Balance Sheet Review section of this
Financial Review. The Liquidity Risk Management portion of the Risk Management section of this Financial Review includes additional information regarding our sources and uses of borrowed funds.
B
USINESS
S
EGMENT
H
IGHLIGHTS
Total business segment earnings were $1.4 billion for the first six months of 2011 and $1.3 billion for the first six months of 2010. Highlights of results for the second quarters of 2011 and 2010 are
included below. The Business Segments Review section of this Financial Review includes a Results of Business-Summary table and further analysis of our business segment results over the first six months of 2011 and 2010 including presentation
differences from Note 18 Segment Reporting in our Notes To Consolidated Financial Statements of this Report.
We provide a reconciliation of
total business segment earnings to PNC consolidated income from continuing operations before noncontrolling interests as reported on a GAAP basis in Note 18 Segment Reporting in our Notes To Consolidated Financial Statements of this Report.
Retail Banking
Retail
Banking earned $26 million in the first six months of 2011 compared with earnings of $104 million for the same period a year ago. Earnings declined from the prior year as lower revenues from the impact of Regulation E rules related to overdraft fees
and a low interest rate environment were partially offset by a lower provision for credit losses. Retail Banking continued to maintain its focus on growing customers and deposits, improving customer and employee satisfaction, investing in the
business for future growth, and disciplined expense management during this period of market and economic uncertainty.
Retail Banking earned
$44 million for the second quarter of 2011 compared with earnings of $80 million for second quarter 2010. The decrease from the prior year second quarter
7
was a result of lower revenue from the impact of Regulation E rules related to overdraft fees, lower net interest income and higher noninterest expense somewhat offset by a lower provision for
credit losses and higher consumer service fees.
Corporate & Institutional Banking
Corporate & Institutional Banking earned $880 million in the first six months of 2011 compared with $816 million in the first six months of 2010.
The increase in earnings was due to a decrease in the provision for credit losses, somewhat offset by declines in net interest income and revenue from commercial mortgage banking activities. We continued to focus on adding new clients and increased
our cross selling to serve our clients’ needs, particularly in the western markets, and remained committed to strong expense discipline.
Corporate & Institutional Banking earned $448 million in both the second quarter of 2011 and the second quarter of 2010. While earnings were
flat in the comparison, lower net interest income and higher noninterest expense were offset by a lower provision for credit losses and higher noninterest income.
Asset Management Group
Asset Management Group earned $91 million in the first six months
of 2011 compared with $66 million in the first six months of 2010. Earnings for the first half of 2011 reflected a benefit from the provision for credit losses and growth in noninterest income as assets under administration increased to $219
billion, a 10% increase over June 30, 2010. The business remained focused on its core strategies to drive growth, including: increasing channel penetration; investing in higher growth geographies; and investing in differentiated client facing
technology.
Asset Management Group earned $48 million in the second quarter of 2011 compared with $27 million in the second quarter of 2010.
Higher earnings for the 2011 quarter were driven by a benefit from the provision for credit losses and growth in noninterest income partially offset by an increase in noninterest expense from investments in the business in the comparison. Overall
second quarter results benefited from strong sales and significant referrals from other PNC lines of business.
Residential Mortgage
Banking
Residential Mortgage Banking earned $126 million in the first six months of 2011 compared with $169 million in the first six
months of 2010. Earnings declined from the prior year period
primarily as a result of higher noninterest expense, lower net interest income, a benefit from the provision for credit losses in the first six months of 2010, and lower servicing fees partially
offset by increased loan sales revenue.
Residential Mortgage Banking earned $55 million in the second quarter of 2011 compared with $91
million in the second quarter of 2010. The decline in earnings primarily resulted from higher noninterest expense and lower net interest income.
BlackRock
Our BlackRock business segment earned $179 million in the first six months of
2011 and $154 million in the first six months of 2010. Second quarter 2011 business segment earnings from BlackRock were $93 million compared with $77 million in the second quarter of 2010. Higher earnings at BlackRock for the second quarter of 2011
compared to the second quarter of 2010 were primarily due to the effect of growth in investment advisory fees related to growth in long-term assets under management.
Distressed Assets Portfolio
This business segment consists primarily of assets acquired
with acquisitions and had earnings of $109 million for the first six months of 2011 compared with a loss of $6 million in the first six months of 2010. The increase was driven primarily by a lower provision for credit losses partially offset by a
decline in net interest income.
Distressed Assets Portfolio segment had earnings of $84 million for the second quarter of 2011 compared with
a loss of $79 million for the second quarter of 2010. The increase primarily resulted from a lower provision for loan losses.
Other
“Other” reported earnings of $333 million for the six months of 2011 compared with earnings of $126 million for the first six
months of 2010. The increase in earnings over the first six months of 2010 primarily reflected the impact of integration costs incurred in the 2010 period, the benefit of the lower effective tax rate in the 2011 period and lower net
other-than-temporary impairments (OTTI) in the 2011 period.
“Other” reported earnings of $140 million in the second quarter of 2011
and $137 million in the second quarter of 2010.
8
C
ONSOLIDATED
I
NCOME
S
TATEMENT
R
EVIEW
Our Consolidated Income Statement is presented in Part I, Item 1 of this Report.
Net income for the first six months of 2011 was $1.7 billion compared with $1.5 billion for the first six months of 2010. Net income for the second
quarter of 2011 was $912 million compared with $803 million for the second quarter of 2010. Strong earnings for the first half and second quarter of 2011 reflect improved credit quality, client sales and revenue momentum.
Total revenue for the first six months of 2011 was $7.2 billion compared with $7.7 billion for the first six months of 2010. Total revenue for the second
quarter of 2011 was $3.6 billion compared with $3.9 billion for the second quarter of 2010. The decline in both comparisons reflected lower net interest income in the 2011 periods attributable to purchase accounting.
N
ET
I
NTEREST
I
NCOME
AND
N
ET
I
NTEREST
M
ARGIN
|
|
|
|
|
|
|
|
|
|
|
|
|
|
|
|
|
|
|
|
|
Three months ended
June 30
|
|
|
Six months ended
June 30
|
|
|
Dollars in millions
|
|
2011
|
|
|
2010
|
|
|
2011
|
|
|
2010
|
|
|
Net interest income
|
|
$
|
2,150
|
|
|
$
|
2,435
|
|
|
$
|
4,326
|
|
|
$
|
4,814
|
|
|
Net interest margin
|
|
|
3.93
|
%
|
|
|
4.35
|
%
|
|
|
3.93
|
%
|
|
|
4.29
|
%
|
Changes in net interest income and margin result from the interaction of the volume and composition of interest-earning
assets and related yields, interest-bearing liabilities and related rates paid, and noninterest-bearing sources of funding. See the Statistical Information (Unaudited) – Average Consolidated Balance Sheet And Net Interest Analysis section of
this Report for additional information.
The decreases in net interest income and net interest margin compared with both the second quarter of
2010 and the first six months of 2010 were primarily attributable to lower purchase accounting accretion. A decline in loan balances and the low interest rate environment, partially offset by lower funding costs, also contributed to the decrease in
each period.
The net interest margin was 3.93% for the first six months of 2011 and 4.29% for the first six months of 2010. The following
factors impacted the comparison:
|
|
•
|
|
A 49 basis point decrease in the yield on interest-earning assets. The yield on loans, the largest portion of our earning assets, decreased 44 basis
points.
|
|
|
•
|
|
These factors were partially offset by an 11 basis point decline in the rate accrued on interest-bearing liabilities. The rate accrued on
interest-bearing deposits, the largest component, decreased 21 basis points, the impact of which was partially offset by a
|
|
|
|
29 basis point increase in the rate accrued on total borrowed funds.
|
The net interest margin was 3.93% for the second quarter of 2011 and 4.35% for the second quarter of 2010. The following factors impacted the comparison:
|
|
•
|
|
A 49 basis point decrease in the yield on interest-earning assets. The yield on loans, the largest portion of our earning assets, decreased 47 basis
points.
|
|
|
•
|
|
These factors were partially offset by a 3 basis point decline in the rate accrued on interest-bearing liabilities. The rate accrued on
interest-bearing deposits, the largest component, decreased 16 basis points, the impact of which was partially offset by a 58 basis point increase in the rate accrued on total borrowed funds.
|
We expect that our purchase accounting accretion will decline by approximately $700 million for full year 2011 compared with 2010. Excluding the impact
of this factor, we expect our net interest income and net interest margin to be stable for full year 2011 compared with 2010. Approximately $11.3 billion of higher cost retail consumer CDs are scheduled to mature in the second half of 2011 at a
weighted-average rate of about 1.74%. We expect that these will be redeemed or re-priced at a lower rate, which will benefit our funding costs.
N
ONINTEREST
I
NCOME
Summary
Noninterest income totaled $2.9 billion for the first six months of both
2011 and 2010 and was $1.5 billion for the second quarter of both 2011 and 2010. Noninterest income for the second quarter of 2011 reflected lower service charges on deposits from the impact of Regulation E rules pertaining to overdraft fees,
partially offset by higher asset management fees.
Additional Analysis
Asset management revenue increased $49 million to $551 million in the first six months of 2011 compared with the first six months of 2010. Asset management revenue was $288 million in the second quarter
of 2011 compared with $243 million in the second quarter of 2010. These increases in the comparisons were driven by higher equity earnings from our BlackRock investment and by higher equity markets, successful client retention, growth in new clients
and strong sales performance. Discretionary assets under management at June 30, 2011 totaled $109 billion compared with $99 billion at June 30, 2010.
For the first half of 2011, consumer services fees totaled $644 million compared with $611 million in the first half of 2010. Consumer services fees were $333 million in the second quarter of 2011
compared with $315 million in the second quarter of 2010. The increases reflected higher volume-related transaction fees, such as debit and credit cards and merchant services.
9
Corporate services revenue totaled $445 million in the first six months of 2011 and $529 million in the
first six months of 2010. Corporate services revenue was $228 million in the second quarter of 2011 compared with $261 million in the second quarter of 2010. Commercial mortgage servicing revenue declined in both comparisons due to higher mortgage
servicing rights impairment charges and lower ancillary fee income. Corporate services fees include the noninterest component of treasury management fees, which continued to be a strong contributor to revenue.
Residential mortgage revenue totaled $358 million in the first half of 2011 and $326 million in the first half of 2010. Second quarter 2011 residential
mortgage revenue totaled $163 million compared with $179 million in the second quarter of 2010. Higher loans sales revenue drove the year-to-date comparison, while lower net hedging gains on mortgage servicing rights were reflected in the quarterly
decline.
Service charges on deposits totaled $254 million for the first six months of 2011 and $409 million for the first six months of 2010.
Service charges on deposits totaled $131 million for the second quarter of 2011 and $209 million for second quarter of 2010. The decline in both comparisons resulted primarily from the impact of Regulation E rules pertaining to overdraft fees.
Net gains on sales of securities totaled $119 million for the first half of 2011 and $237 million for the first half of 2010. Net gains on
sales of securities were $82 million for the second quarter of 2011 and $147 million for second quarter of 2010.
The net credit component of
OTTI of securities recognized in earnings was a loss of $73 million in the six months of 2011, including $39 million in the second quarter, compared with losses of $210 million and $94 million, respectively for the same periods in 2010.
Other noninterest income totaled $609 million for the first six months of 2011 compared with $457 million for the first six months of 2010. Other
noninterest income totaled $266 million for second quarter of 2011 compared with $217 million for second quarter of 2010. Both increases over the comparable 2010 periods were driven by several individually insignificant items.
Other noninterest income typically fluctuates from period to period depending on the nature and magnitude of transactions completed. Further details
regarding our trading activities are included in the Market Risk Management – Trading Risk portion of the Risk Management section of this Financial Review, further details regarding equity and alternative investments are included in the Market
Risk Management-Equity And Other Investment Risk section and further details regarding gains or losses related to our equity investment in BlackRock are included in the Business Segments Review section.
Looking to full year 2011, we see opportunities for growth in our fee-based revenues resulting from client
growth and depth in our expanded franchise. At the same time, we will see the continued impact of ongoing regulatory reforms. Revenue is likely to decline compared with 2010 from the impact of the rules set forth in Regulation E related to overdraft
fees and the Dodd-Frank limits related to interchange rates on debit card transactions. Regulation E, which became effective July 1, 2010, is expected to have an incremental negative impact to 2011 revenues of approximately $200 million based on
expected 2011 transaction volumes. The Dodd-Frank limits related to interchange rates on debit cards will be effective October 1, 2011 and are expected to have a negative incremental impact of approximately $75 million in 2011 and an additional
incremental reduction in future periods’ annual revenue of approximately $175 million based on expected 2011 transaction volumes. Excluding the expected incremental negative impact of these two regulatory changes, we expect noninterest income
for full year 2011 to increase in the low-to-mid single digits (in terms of percentages) compared with 2010.
P
RODUCT
R
EVENUE
In addition to credit and deposit products for commercial customers, Corporate & Institutional Banking
offers other services, including treasury management, capital markets-related products and services, and commercial real estate loan servicing.
Treasury management revenue, which includes fees as well as net interest income from customer deposit balances, totaled $593 million for the first six
months of 2011 and $595 million for the first six months of 2010. For the second quarter of 2011, treasury management revenue was $292 million compared with $299 million for the second quarter of 2010. Declining deposit spreads offset increases in
core processing products, such as lockbox and information reporting, and in growth products such as commercial card and healthcare related services.
Revenue from capital markets-related products and services totaled $304 million in the first half of 2011 compared with $285 million in the first half of 2010. Second quarter 2011 revenue was $165 million
compared with $124 million for the second quarter of 2010. Both comparisons were driven by improved valuations on customer derivatives and sales volumes.
Commercial mortgage banking activities include revenue derived from commercial mortgage servicing (including net interest income and noninterest income from loan servicing and ancillary services, net of
commercial mortgage servicing rights amortization, and commercial mortgage servicing rights valuations), and revenue derived from commercial mortgage loans intended for sale and related hedges (including loan origination fees, net interest income,
valuation adjustments and gains or losses on sales).
10
Commercial mortgage banking activities resulted in revenue of $53 million in the first six months of 2011
compared with $162 million in the first six months of 2010. For the second quarter of 2011, revenue from commercial mortgage banking activities totaled $12 million compared with $47 million for the second quarter of 2010. Higher amortization and
impairment charges in 2011 were due primarily to decreased interest rates and related prepayments by borrowers. Impairments totaled $75 million in the first half of 2011, including $40 million for the second quarter. The comparable amounts for 2010
were $18 million and $14 million, respectively. The six months of 2010 included a higher level of ancillary commercial mortgage servicing fees and revenue from a duplicative agency servicing operation that was sold in the second quarter of last year
which contributed to the year-over-year decrease. Improved valuations on commercial mortgage loans held for sale benefited both comparisons.
P
ROVISION
F
OR
C
REDIT
L
OSSES
The provision for credit losses totaled $.7 billion for the first six months of 2011 compared with $1.6 billion for the first six months of 2010. The
provision for credit losses totaled $280 million for the second quarter of 2011 compared with $823 million for the second quarter of 2010. The decline in both comparisons was driven by overall credit quality improvement and continuation of actions
to reduce exposure levels.
The Credit Risk Management portion of the Risk Management section of this Financial Review includes additional
information regarding factors impacting the provision for credit losses.
We anticipate an overall improvement in credit migration for full
year 2011 and a continued reduction in our nonperforming loans assuming modest GDP growth. As a result, we expect that our full year 2011 provision for credit losses will be at least $1 billion less than our full year 2010 provision for credit
losses assuming budgeted loan growth projections.
N
ONINTEREST
E
XPENSE
Noninterest expense was $4.2 billion for the first six months of 2011 and $4.1 billion for the first six months of 2010. Noninterest expense totaled $2.2
billion for the second quarter of 2011 compared with $2.0 billion for the second quarter of 2010. The increase in noninterest expense compared with the second quarter of 2010 was primarily due to the impact of second quarter of 2010 benefits from
the reversal of certain accrued liabilities, with $73 million associated with a franchise tax settlement and $47 million associated with an indemnification liability for certain Visa litigation, and various small increases in expenses incurred in
the second quarter of 2011 partially offset by the impact of integration costs during the second quarter of 2010. Integration costs included in noninterest expense totaled $213 million for the first half of 2010, including $100 million in the second
quarter of that year. Noninterest expense for the first half of 2011 included higher personnel and occupancy expense and, in the second quarter, a charge of approximately $40 million related to accruals for legal contingencies primarily associated
with pending lawsuits offset in part by anticipated insurance recoveries.
Apart from the possible impact of legal and regulatory
contingencies we expect that total noninterest expense for full year 2011 will be flat compared with full year 2010. This expectation reflects the shift in the deposit insurance base calculations from deposits to average assets less Tier 1 capital
which was effective April 1, 2011 under Dodd-Frank. The difference in premium is not material.
E
FFECTIVE
T
AX
R
ATE
The effective tax rate was 23.7% in the first half of 2011 compared with 28.0% in the first
half of 2010. For the second quarter of 2011, our effective tax rate was 20.4% compared with 28.2% for the second quarter of 2010. The decline in the effective tax rate in both comparisons was primarily driven by a $54 million benefit related to the
reversal of deferred tax liabilities associated with adjustments to the tax basis of an asset during the second quarter of 2011. We anticipate that the effective tax rate will be approximately 27% for the second half of 2011.
11
C
ONSOLIDATED
B
ALANCE
S
HEET
R
EVIEW
S
UMMARIZED
B
ALANCE
S
HEET
D
ATA
|
|
|
|
|
|
|
|
|
|
|
In millions
|
|
June 30
2011
|
|
|
Dec. 31
2010
|
|
|
Assets
|
|
|
|
|
|
|
|
|
|
Loans
|
|
$
|
150,319
|
|
|
$
|
150,595
|
|
|
Investment securities
|
|
|
59,414
|
|
|
|
64,262
|
|
|
Cash and short-term investments
|
|
|
12,805
|
|
|
|
10,437
|
|
|
Loans held for sale
|
|
|
2,679
|
|
|
|
3,492
|
|
|
Goodwill and other intangible assets
|
|
|
10,594
|
|
|
|
10,753
|
|
|
Equity investments
|
|
|
9,776
|
|
|
|
9,220
|
|
|
Other, net
|
|
|
17,530
|
|
|
|
15,525
|
|
|
Total assets
|
|
$
|
263,117
|
|
|
$
|
264,284
|
|
|
Liabilities
|
|
|
|
|
|
|
|
|
|
Deposits
|
|
$
|
181,891
|
|
|
$
|
183,390
|
|
|
Borrowed funds
|
|
|
35,176
|
|
|
|
39,488
|
|
|
Other
|
|
|
11,177
|
|
|
|
8,568
|
|
|
Total liabilities
|
|
|
228,244
|
|
|
|
231,446
|
|
|
Total shareholders’ equity
|
|
|
32,235
|
|
|
|
30,242
|
|
|
Noncontrolling interests
|
|
|
2,638
|
|
|
|
2,596
|
|
|
Total equity
|
|
|
34,873
|
|
|
|
32,838
|
|
|
Total liabilities and equity
|
|
$
|
263,117
|
|
|
$
|
264,284
|
|
The summarized balance sheet data above is based upon our Consolidated Balance Sheet in this Report.
The decline in total assets at June 30, 2011 compared with December 31, 2010 was primarily due to lower investment securities, partially offset
by an increase in interest-earning deposits with banks.
An analysis of changes in selected balance sheet categories follows.
L
OANS
A summary
of the major categories of loans outstanding follows. Outstanding loan balances reflect unearned income, unamortized discount and premium, and purchase discounts and premiums totaling $2.5 billion at June 30, 2011 and $2.7 billion at
December 31, 2010. The balances do not include future accretable net interest (i.e., the difference between the undiscounted expected cash flows and the carrying value of the loan) on the purchased impaired loans.
Loans decreased $.3 billion as of June 30, 2011 compared with December 31, 2010. Growth in commercial loans of $3.4 billion was offset by
declines of $1.6 billion in commercial real estate loans, $1 billion of residential real estate loans and $.8 billion of home equity loans compared with year end. Commercial loans increased due to a combination of new client acquisition and improved
utilization. Commercial real estate loans declined due to loan sales, paydowns, and charge-offs. The decrease in residential real estate was impacted by paydowns, loans sales, and charge-offs. Home equity loans
declined in the second quarter as paydowns, charge-offs, and portfolio management activities exceeded new loan production and draws on existing lines.
Loans represented 57% of total assets at June 30, 2011 and December 31, 2010. Commercial lending represented 54% of the loan portfolio at
June 30, 2011 and 53% at December 31, 2010. Consumer lending represented 46% at June 30, 2011 and 47% at December 31, 2010.
Commercial real estate loans represented 6% of total assets at June 30, 2011 and 7% of total assets at December 31, 2010.
Details Of Loans
|
|
|
|
|
|
|
|
|
|
|
In millions
|
|
Jun. 30
2011
|
|
|
Dec. 31
2010
|
|
|
Commercial
|
|
|
|
|
|
|
|
|
|
Retail/wholesale trade
|
|
$
|
10,952
|
|
|
$
|
9,901
|
|
|
Manufacturing
|
|
|
10,426
|
|
|
|
9,334
|
|
|
Service providers
|
|
|
8,984
|
|
|
|
8,866
|
|
|
Real estate related (a)
|
|
|
7,515
|
|
|
|
7,500
|
|
|
Financial services
|
|
|
5,206
|
|
|
|
4,573
|
|
|
Health care
|
|
|
4,115
|
|
|
|
3,481
|
|
|
Other industries
|
|
|
11,422
|
|
|
|
11,522
|
|
|
Total commercial
|
|
|
58,620
|
|
|
|
55,177
|
|
|
Commercial real estate
|
|
|
|
|
|
|
|
|
|
Real estate projects
|
|
|
11,086
|
|
|
|
12,211
|
|
|
Commercial mortgage
|
|
|
5,233
|
|
|
|
5,723
|
|
|
Total commercial real estate
|
|
|
16,319
|
|
|
|
17,934
|
|
|
Equipment lease financing
|
|
|
6,210
|
|
|
|
6,393
|
|
|
TOTAL COMMERCIAL LENDING (b)
|
|
|
81,149
|
|
|
|
79,504
|
|
|
Consumer
|
|
|
|
|
|
|
|
|
|
Home equity
|
|
|
|
|
|
|
|
|
|
Lines of credit
|
|
|
22,838
|
|
|
|
23,473
|
|
|
Installment
|
|
|
10,541
|
|
|
|
10,753
|
|
|
Residential real estate
|
|
|
|
|
|
|
|
|
|
Residential mortgage
|
|
|
14,302
|
|
|
|
15,292
|
|
|
Residential construction
|
|
|
680
|
|
|
|
707
|
|
|
Credit card
|
|
|
3,754
|
|
|
|
3,920
|
|
|
Other consumer
|
|
|
|
|
|
|
|
|
|
Education
|
|
|
8,816
|
|
|
|
9,196
|
|
|
Automobile
|
|
|
3,705
|
|
|
|
2,983
|
|
|
Other
|
|
|
4,534
|
|
|
|
4,767
|
|
|
TOTAL CONSUMER LENDING
|
|
|
69,170
|
|
|
|
71,091
|
|
|
Total loans
|
|
$
|
150,319
|
|
|
$
|
150,595
|
|
|
(a)
|
Includes loans to customers in the real estate and construction industries.
|
|
(b)
|
Construction loans with interest reserves, and A/B Note restructurings are not significant to PNC.
|
Total loans above include purchased impaired loans of $7.3 billion, or 5% of total loans, at June 30, 2011, and $7.8 billion, or 5% of total loans,
at December 31, 2010.
We are committed to providing credit and liquidity to qualified borrowers. Total loan originations and new
commitments and renewals totaled $65 billion for the first six months of 2011.
12
Our loan portfolio continued to be diversified among numerous industries and types of businesses in our
principal geographic markets.
Commercial lending is the largest category and is the most sensitive to changes in assumptions and judgments
underlying the determination of the allowance for loan and lease losses (ALLL). This estimate also considers other relevant factors such as:
|
|
•
|
|
Actual versus estimated losses,
|
|
|
•
|
|
Regional and national economic conditions,
|
|
|
•
|
|
Business segment and portfolio concentrations,
|
|
|
•
|
|
The impact of government regulations, and
|
|
|
•
|
|
Risk of potential estimation or judgmental errors, including the accuracy of risk ratings.
|
Higher Risk Loans
Our loan
portfolio includes certain loans deemed to be higher risk and therefore more likely to result in credit losses. We established specific and pooled reserves on the total
commercial lending category of $2.4 billion at June 30, 2011. This commercial lending reserve included what we believe to be appropriate loss coverage on the higher risk commercial loans in
the total commercial portfolio. The commercial lending reserve represented 52% of the total ALLL of $4.6 billion at that date. The remaining 48% of ALLL pertained to the total consumer lending category. This category of loans is more homogenous in
nature and has certain characteristics that can be assessed at a total portfolio level in terms of loans representing higher risk. We do not consider government insured/government guaranteed loans to be higher risk as we do not believe these loans
will result in a significant loss because of their structure. Additional information regarding our higher risk loans is included in Note 5 Asset Quality and Allowances for Loan and Lease Losses and Unfunded Loan Commitments and Letters of Credit in
our Notes To Consolidated Financial Statements included in this Report.
Information related to purchased impaired loans, purchase accounting
accretion and accretable net interest recognized during the first six months of 2011 and 2010 follows.
Valuation of Purchased Impaired
Loans
|
|
|
|
|
|
|
|
|
|
|
|
|
|
|
|
|
|
|
|
|
June 30, 2011
|
|
|
December 31, 2010
|
|
|
Dollars in billions
|
|
Balance
|
|
|
Net
Investment
|
|
|
Balance
|
|
|
Net
Investment
|
|
|
Commercial and commercial real estate loans:
|
|
|
|
|
|
|
|
|
|
|
|
|
|
|
|
|
|
Unpaid principal balance
|
|
$
|
1.4
|
|
|
|
|
|
|
$
|
1.8
|
|
|
|
|
|
|
Purchased impaired mark
|
|
|
(.3
|
)
|
|
|
|
|
|
|
(.4
|
)
|
|
|
|
|
|
Recorded investment
|
|
|
1.1
|
|
|
|
|
|
|
|
1.4
|
|
|
|
|
|
|
Allowance for loan losses
|
|
|
(.3
|
)
|
|
|
|
|
|
|
(.3
|
)
|
|
|
|
|
|
Net investment
|
|
|
.8
|
|
|
|
57
|
%
|
|
|
1.1
|
|
|
|
61
|
%
|
|
Consumer and residential mortgage loans:
|
|
|
|
|
|
|
|
|
|
|
|
|
|
|
|
|
|
Unpaid principal balance
|
|
|
7.1
|
|
|
|
|
|
|
|
7.9
|
|
|
|
|
|
|
Purchased impaired mark
|
|
|
(.9
|
)
|
|
|
|
|
|
|
(1.5
|
)
|
|
|
|
|
|
Recorded investment
|
|
|
6.2
|
|
|
|
|
|
|
|
6.4
|
|
|
|
|
|
|
Allowance for loan losses
|
|
|
(.7
|
)
|
|
|
|
|
|
|
(.6
|
)
|
|
|
|
|
|
Net investment
|
|
|
5.5
|
|
|
|
77
|
%
|
|
|
5.8
|
|
|
|
73
|
%
|
|
Total purchased impaired loans:
|
|
|
|
|
|
|
|
|
|
|
|
|
|
|
|
|
|
Unpaid principal balance
|
|
|
8.5
|
|
|
|
|
|
|
|
9.7
|
|
|
|
|
|
|
Purchased impaired mark
|
|
|
(1.2
|
)
|
|
|
|
|
|
|
(1.9
|
)
|
|
|
|
|
|
Recorded investment
|
|
|
7.3
|
|
|
|
|
|
|
|
7.8
|
|
|
|
|
|
|
Allowance for loan losses
|
|
|
(1.0
|
)
|
|
|
|
|
|
|
(.9
|
)
|
|
|
|
|
|
Net investment
|
|
$
|
6.3
|
|
|
|
74
|
%
|
|
$
|
6.9
|
|
|
|
71
|
%
|
The unpaid principal balance of purchased impaired loans declined from $9.7 billion at December 31,
2010 to $8.5 billion at June 30, 2011 due to payments, disposals, and charge-offs of amounts determined to be uncollectible. The remaining purchased impaired mark at June 30, 2011 was $1.2 billion which was a decline from $1.9 billion at
December 31, 2010. The associated allowance for loan losses increased slightly by $.1 billion to $1.0 billion at June 30, 2011. The net investment of $6.9 billion at December 31, 2010 declined 9% to $6.3 billion at June 30, 2011.
At June 30, 2011, our largest
individual purchased impaired loan had a recorded investment of $25 million.
We
currently expect to collect total cash flows of $8.6 billion on purchased impaired loans, representing the $6.3 billion net investment at June 30, 2011 and the accretable net interest of $2.3 billion shown in the Accretable Net
Interest-Purchased Impaired Loans table that follows. These represent the net future cash flows on purchased impaired loans, as contractual interest will be reversed.
13
Purchase Accounting Accretion
|
|
|
|
|
|
|
|
|
|
|
|
|
|
|
|
|
|
|
|
|
Three months ended
June 30
|
|
|
Six months ended
June 30
|
|
|
In millions
|
|
2011
|
|
|
2010
|
|
|
2011
|
|
|
2010
|
|
|
Non-impaired loans
|
|
$
|
72
|
|
|
$
|
111
|
|
|
$
|
140
|
|
|
$
|
223
|
|
|
Impaired loans
|
|
|
186
|
|
|
|
258
|
|
|
|
346
|
|
|
|
523
|
|
|
Reversal of contractual interest on impaired loans
|
|
|
(88
|
)
|
|
|
(136
|
)
|
|
|
(194
|
)
|
|
|
(270
|
)
|
|
Net impaired loans
|
|
|
98
|
|
|
|
122
|
|
|
|
152
|
|
|
|
253
|
|
|
Securities
|
|
|
14
|
|
|
|
13
|
|
|
|
23
|
|
|
|
24
|
|
|
Deposits
|
|
|
91
|
|
|
|
144
|
|
|
|
191
|
|
|
|
311
|
|
|
Borrowings
|
|
|
(25
|
)
|
|
|
(14
|
)
|
|
|
(56
|
)
|
|
|
(70
|
)
|
|
Total
|
|
$
|
250
|
|
|
$
|
376
|
|
|
$
|
450
|
|
|
$
|
741
|
|
In addition to the amounts in the table above, cash received in excess of recorded investment from sales or payoffs of
impaired commercial loans (cash recoveries) totaled $40 million for the second quarter of 2011 and $164 million for the second quarter of 2010.
Remaining Purchase Accounting Accretion
|
|
|
|
|
|
|
|
|
|
|
In billions
|
|
June 30
2011
|
|
|
Dec. 31
2010
|
|
|
Non-impaired loans
|
|
$
|
1.1
|
|
|
$
|
1.2
|
|
|
Impaired loans
|
|
|
2.3
|
|
|
|
2.2
|
|
|
Total loans (gross)
|
|
|
3.4
|
|
|
|
3.4
|
|
|
Securities
|
|
|
.2
|
|
|
|
.1
|
|
|
Deposits
|
|
|
.3
|
|
|
|
.5
|
|
|
Borrowings
|
|
|
(1.0
|
)
|
|
|
(1.1
|
)
|
|
Total
|
|
$
|
2.9
|
|
|
$
|
2.9
|
|
Accretable Net Interest – Purchased Impaired Loans
|
|
|
|
|
|
|
|
|
|
|
In billions
|
|
2011
|
|
|
2010
|
|
|
January 1
|
|
$
|
2.2
|
|
|
$
|
3.5
|
|
|
Accretion (including cash recoveries)
|
|
|
(.5
|
)
|
|
|
(.8
|
)
|
|
Net reclassifications to accretable from non-accretable
|
|
|
.6
|
|
|
|
(.3
|
)
|
|
Disposals
|
|
|
|
|
|
|
(.1
|
)
|
|
June 30
|
|
$
|
2.3
|
|
|
$
|
2.3
|
|
Net unfunded credit commitments are comprised of the following:
Net Unfunded Credit Commitments
|
|
|
|
|
|
|
|
|
|
|
In millions
|
|
June 30,
2011
|
|
|
December 31,
2010
|
|
|
Commercial / commercial real estate (a)
|
|
$
|
62,834
|
|
|
$
|
59,256
|
|
|
Home equity lines of credit
|
|
|
18,994
|
|
|
|
19,172
|
|
|
Consumer credit card and other unsecured lines
|
|
|
15,206
|
|
|
|
14,725
|
|
|
Other
|
|
|
2,757
|
|
|
|
2,652
|
|
|
Total
|
|
$
|
99,791
|
|
|
$
|
95,805
|
|
|
(a)
|
Less than 3% of these amounts at each date relate to commercial real estate.
|
Commitments to extend credit represent arrangements to lend funds or provide liquidity subject to specified contractual conditions. Commercial commitments reported above exclude syndications, assignments
and participations, primarily to financial institutions, totaling $18.5 billion at June 30, 2011 and $16.7 billion at December 31, 2010.
Unfunded liquidity facility commitments and standby bond purchase agreements totaled $458 million at June 30, 2011 and December 31, 2010 and are included in the preceding table primarily within
the “Commercial / commercial real estate” category.
In addition to credit commitments, our net outstanding standby letters of
credit totaled $10.7 billion at June 30, 2011 and $10.1 billion at December 31, 2010. Standby letters of credit commit us to make payments on behalf of our customers if specified future events occur.
14
INVESTMENT SECURITIES
Details of Investment Securities
|
|
|
|
|
|
|
|
|
|
|
In millions
|
|
Amortized
Cost
|
|
|
Fair
Value
|
|
|
June 30, 2011
|
|
|
|
|
|
|
|
|
|
S
ECURITIES
A
VAILABLE
FOR
S
ALE
|
|
|
|
|
|
|
|
|
|
Debt securities
|
|
|
|
|
|
|
|
|
|
US Treasury and government agencies
|
|
$
|
3,954
|
|
|
$
|
4,130
|
|
|
Residential mortgage-backed
|
|
|
|
|
|
|
|
|
|
Agency
|
|
|
25,126
|
|
|
|
25,500
|
|
|
Non-agency
|
|
|
7,232
|
|
|
|
6,454
|
|
|
Commercial mortgage-backed
|
|
|
|
|
|
|
|
|
|
Agency
|
|
|
1,276
|
|
|
|
1,303
|
|
|
Non-agency
|
|
|
2,494
|
|
|
|
2,545
|
|
|
Asset-backed
|
|
|
3,839
|
|
|
|
3,685
|
|
|
State and municipal
|
|
|
2,281
|
|
|
|
2,302
|
|
|
Other debt
|
|
|
3,343
|
|
|
|
3,442
|
|
|
Corporate stocks and other
|
|
|
306
|
|
|
|
306
|
|
|
Total securities available for sale
|
|
$
|
49,851
|
|
|
$
|
49,667
|
|
|
S
ECURITIES
H
ELD
TO
M
ATURITY
|
|
|
|
|
|
|
|
|
|
Debt securities
|
|
|
|
|
|
|
|
|
|
Residential mortgage-backed (agency)
|
|
$
|
2,775
|
|
|
$
|
2,768
|
|
|
Commercial mortgage-backed
|
|
|
|
|
|
|
|
|
|
Agency
|
|
|
508
|
|
|
|
506
|
|
|
Non-agency
|
|
|
4,027
|
|
|
|
4,172
|
|
|
Asset-backed
|
|
|
2,063
|
|
|
|
2,092
|
|
|
State and municipal
|
|
|
8
|
|
|
|
9
|
|
|
Other debt
|
|
|
366
|
|
|
|
363
|
|
|
Total securities held to maturity
|
|
$
|
9,747
|
|
|
$
|
9,910
|
|
|
December 31, 2010
|
|
|
|
|
|
|
|
|
|
S
ECURITIES
A
VAILABLE
FOR
S
ALE
|
|
|
|
|
|
|
|
|
|
Debt securities
|
|
|
|
|
|
|
|
|
|
US Treasury and government agencies
|
|
$
|
5,575
|
|
|
$
|
5,710
|
|
|
Residential mortgage-backed
|
|
|
|
|
|
|
|
|
|
Agency
|
|
|
31,697
|
|
|
|
31,720
|
|
|
Non-agency
|
|
|
8,193
|
|
|
|
7,233
|
|
|
Commercial mortgage-backed
|
|
|
|
|
|
|
|
|
|
Agency
|
|
|
1,763
|
|
|
|
1,797
|
|
|
Non-agency
|
|
|
1,794
|
|
|
|
1,856
|
|
|
Asset-backed
|
|
|
2,780
|
|
|
|
2,582
|
|
|
State and municipal
|
|
|
1,999
|
|
|
|
1,957
|
|
|
Other debt
|
|
|
3,992
|
|
|
|
4,077
|
|
|
Corporate stocks and other
|
|
|
378
|
|
|
|
378
|
|
|
Total securities available for sale
|
|
$
|
58,171
|
|
|
$
|
57,310
|
|
|
S
ECURITIES
H
ELD
TO
M
ATURITY
|
|
|
|
|
|
|
|
|
|
Debt securities
|
|
|
|
|
|
|
|
|
|
Commercial mortgage-backed (non-agency)
|
|
$
|
4,316
|
|
|
$
|
4,490
|
|
|
Asset-backed
|
|
|
2,626
|
|
|
|
2,676
|
|
|
Other debt
|
|
|
10
|
|
|
|
11
|
|
|
Total securities held to maturity
|
|
$
|
6,952
|
|
|
$
|
7,177
|
|
The carrying amount of investment securities totaled $59.4 billion at June 30, 2011, a decrease of $4.9 billion, or
8%, from $64.3 billion at December 31, 2010. The decline resulted from principal payments and net sales of primarily agency mortgage-backed securities and government agency securities.
Investment securities represented 23% of total assets at June 30, 2011 and 24% of total assets at December 31, 2010.
We evaluate our portfolio of investment securities in light of changing market conditions and other factors and, where appropriate, take steps intended to improve our overall positioning. We consider the
portfolio to be well-diversified and of high quality. US Treasury and government agencies, agency residential mortgage-backed securities and agency commercial mortgage-backed securities collectively represented 58% of the investment securities
portfolio at June 30, 2011.
During the second quarter of 2011, we transferred securities with a fair value of $3.4 billion from
available for sale to held to maturity. The securities transferred included $2.8 billion of agency residential-mortgage backed securities, $285 million of agency commercial mortgage-backed securities, and $365 million of agency guaranteed other debt
securities. We changed our intent and committed to hold these high-quality securities to maturity. The reclassification was made at fair value at the date of transfer, resulting in no impact on net income. Net pretax unrealized gains in accumulated
other comprehensive income totaled $40 million at the transfer date and will be accreted over the remaining life of the related securities as an adjustment of yield in a manner consistent with the amortization of a premium.
At June 30, 2011, the securities available for sale portfolio included a net unrealized loss of $184 million, which represented the difference
between fair value and amortized cost. The comparable amount at December 31, 2010 was a net unrealized loss of $861 million. The fair value of investment securities is impacted by interest rates, credit spreads, market volatility and liquidity
conditions. The fair value of investment securities generally decreases when interest rates increase and vice versa. In addition, the fair value generally decreases when credit spreads widen and vice versa.
The improvement in the net unrealized pretax loss compared with December 31, 2010 was primarily due to lower market interest rates and improved
liquidity in non-agency residential mortgage-backed securities markets. Net unrealized gains and losses in the securities available for sale portfolio are included in shareholders’ equity as accumulated other comprehensive income or loss from
continuing operations, net of tax.
Unrealized gains and losses on available for sale securities do not impact liquidity or risk-based
capital. However, reductions in the credit ratings of these securities could have an impact on the determination of risk-weighted assets which could reduce our regulatory capital ratios. In addition, the amount representing the credit-related
portion of OTTI on available for sale securities would reduce our earnings and regulatory capital ratios.
15
The expected weighted-average life of investment securities (excluding corporate stocks and other) was 4.4
years at June 30, 2011 and 4.7 years at December 31, 2010.
We estimate that, at June 30, 2011, the effective duration of
investment securities was 3.2 years for an immediate 50 basis
points parallel increase in interest rates and 3.0 years for an immediate 50 basis points parallel decrease in interest rates. Comparable amounts at December 31, 2010 were 3.1 years and 2.9
years, respectively.
The following table provides detail
regarding the vintage, current credit rating, and FICO score of the underlying collateral at origination, where available, for residential mortgage-backed, commercial mortgage-backed and other asset-backed securities held in the available for sale
and held to maturity portfolios:
|
|
|
|
|
|
|
|
|
|
|
|
|
|
|
|
|
|
|
|
|
|
|
|
|
June 30, 2011
|
|
|
|
|
Agency
|
|
|
Non-agency
|
|
|
|
|
|
Dollars in millions
|
|
Residential
Mortgage-Backed
Securities
|
|
|
Commercial
Mortgage-Backed
Securities
|
|
|
Residential
Mortgage-Backed
Securities
|
|
|
Commercial
Mortgage-Backed
Securities
|
|
|
Asset-Backed
Securities
|
|
|
Fair Value – Available for Sale
|
|
$
|
25,500
|
|
|
$
|
1,303
|
|
|
$
|
6,454
|
|
|
$
|
2,545
|
|
|
$
|
3,685
|
|
|
Fair Value – Held to Maturity
|
|
|
2,768
|
|
|
|
506
|
|
|
|
|
|
|
|
4,172
|
|
|
|
2,092
|
|
|
Total Fair Value
|
|
$
|
28,268
|
|
|
$
|
1,809
|
|
|
$
|
6,454
|
|
|
$
|
6,717
|
|
|
$
|
5,777
|
|
|
% of Fair Value:
|
|
|
|
|
|
|
|
|
|
|
|
|
|
|
|
|
|
|
|
|
|
By Vintage
|
|
|
|
|
|
|
|
|
|
|
|
|
|
|
|
|
|
|
|
|
|
2011
|
|
|
16
|
%
|
|
|
8
|
%
|
|
|
|
|
|
|
4
|
%
|
|
|
|
|
|
2010
|
|
|
32
|
%
|
|
|
26
|
%
|
|
|
|
|
|
|
2
|
%
|
|
|
6
|
%
|
|
2009
|
|
|
14
|
%
|
|
|
24
|
%
|
|
|
|
|
|
|
2
|
%
|
|
|
12
|
%
|
|
2008
|
|
|
5
|
%
|
|
|
3
|
%
|
|
|
|
|
|
|
|
|
|
|
6
|
%
|
|
2007
|
|
|
7
|
%
|
|
|
3
|
%
|
|
|
18
|
%
|
|
|
9
|
%
|
|
|
7
|
%
|
|
2006
|
|
|
4
|
%
|
|
|
5
|
%
|
|
|
24
|
%
|
|
|
29
|
%
|
|
|
10
|
%
|
|
2005 and earlier
|
|
|
12
|
%
|
|
|
15
|
%
|
|
|
58
|
%
|
|
|
53
|
%
|
|
|
11
|
%
|
|
Not Available
|
|
|
10
|
%
|
|
|
16
|
%
|
|
|
|
|
|
|
1
|
%
|
|
|
48
|
%
|
|
Total
|
|
|
100
|
%
|
|
|
100
|
%
|
|
|
100
|
%
|
|
|
100
|
%
|
|
|
100
|
%
|
|
By Credit Rating
|
|
|
|
|
|
|
|
|
|
|
|
|
|
|
|
|
|
|
|
|
|
Agency
|
|
|
100
|
%
|
|
|
100
|
%
|
|
|
|
|
|
|
|
|
|
|
|
|
|
AAA
|
|
|
|
|
|
|
|
|
|
|
3
|
%
|
|
|
82
|
%
|
|
|
78
|
%
|
|
AA
|
|
|
|
|
|
|
|
|
|
|
1
|
%
|
|
|
6
|
%
|
|
|
5
|
%
|
|
A
|
|
|
|
|
|
|
|
|
|
|
3
|
%
|
|
|
7
|
%
|
|
|
1
|
%
|
|
BBB
|
|
|
|
|
|
|
|
|
|
|
9
|
%
|
|
|
4
|
%
|
|
|
|
|
|
BB
|
|
|
|
|
|
|
|
|
|
|
9
|
%
|
|
|
|
|
|
|
|
|
|
B
|
|
|
|
|
|
|
|
|
|
|
14
|
%
|
|
|
|
|
|
|
3
|
%
|
|
Lower than B
|
|
|
|
|
|
|
|
|
|
|
60
|
%
|
|
|
|
|
|
|
10
|
%
|
|
No rating
|
|
|
|
|
|
|
|
|
|
|
1
|
%
|
|
|
1
|
%
|
|
|
3
|
%
|
|
Total
|
|
|
100
|
%
|
|
|
100
|
%
|
|
|
100
|
%
|
|
|
100
|
%
|
|
|
100
|
%
|
|
By FICO Score
|
|
|
|
|
|
|
|
|
|
|
|
|
|
|
|
|
|
|
|
|
|
>720
|
|
|
|
|
|
|
|
|
|
|
55
|
%
|
|
|
|
|
|
|
3
|
%
|
|
<720 and >660
|
|
|
|
|
|
|
|
|
|
|
36
|
%
|
|
|
|
|
|
|
7
|
%
|
|
<660
|
|
|
|
|
|
|
|
|
|
|
1
|
%
|
|
|
|
|
|
|
2
|
%
|
|
No FICO score
|
|
|
|
|
|
|
|
|
|
|
8
|
%
|
|
|
|
|
|
|
88
|
%
|
|
Total
|
|
|
|
|
|
|
|
|
|
|
100
|
%
|
|
|
|
|
|
|
100
|
%
|
We conduct a comprehensive security-level impairment assessment quarterly on all securities in an
unrealized loss position to determine whether the loss represents OTTI. Our assessment considers the security structure, recent security collateral performance metrics, external credit ratings, failure of the issuer to make scheduled interest or
principal payments, our judgment and expectations of future performance, and relevant independent industry research, analysis and forecasts.
We also consider the severity of the impairment and the length of time that the security has been impaired in our assessment. Results of the periodic
assessment are reviewed by a cross-functional senior management team representing Asset &
Liability Management, Finance, and Market Risk Management. The senior management team considers the results of the assessments, as well as other factors, in determining whether the impairment is
other-than-temporary.
We recognize the credit portion of OTTI charges in current earnings for those debt securities where we do not intend to
sell and believe we will not be required to sell the securities prior to expected recovery. The noncredit portion of OTTI is included in accumulated other comprehensive loss.
16
We recognized OTTI for the second quarter and first six months of 2011 and 2010 as follows:
Other-Than-Temporary Impairments
|
|
|
|
|
|
|
|
|
|
|
|
|
|
|
|
|
|
|
|
|
Three months ended
June 30
|
|
|
Six months ended
June 30
|
|
|
In millions
|
|
2011
|
|
|
2010
|
|
|
2011
|
|
|
2010
|
|
|
Credit portion of OTTI losses (a)
|
|
|
|
|
|
|
|
|
|
|
|
|
|
|
|
|
|
Non-agency residential mortgage-backed
|
|
$
|
(35
|
)
|
|
$
|
(81
|
)
|
|
$
|
(63
|
)
|
|
$
|
(154
|
)
|
|
Non-agency commercial mortgage-backed
|
|
|
|
|
|
|
(3
|
)
|
|
|
|
|
|
|
(3
|
)
|
|
Asset-backed
|
|
|
(4
|
)
|
|
|
(10
|
)
|
|
|
(9
|
)
|
|
|
(53
|
)
|
|
Other debt
|
|
|
|
|
|
|
|
|
|
|
(1
|
)
|
|
|
|
|
|
Total credit portion of OTTI losses
|
|
|
(39
|
)
|
|
|
(94
|
)
|
|
|
(73
|
)
|
|
|
(210
|
)
|
|
Noncredit portion of OTTI losses (b)
|
|
|
(34
|
)
|
|
|
(24
|
)
|
|
|
(30
|
)
|
|
|
(148
|
)
|
|
Total OTTI losses
|
|
$
|
(73
|
)
|
|
$
|
(118
|
)
|
|
$
|
(103
|
)
|
|
$
|
(358
|
)
|
|
(a)
|
Reduction of noninterest income in our Consolidated Income Statement.
|
|
(b)
|
Included in Accumulated other comprehensive loss, net of tax, on our Consolidated Balance Sheet.
|
The following table summarizes net unrealized gains and losses (including the credit and noncredit portions of OTTI) recorded on non-agency residential and commercial mortgage-backed and other
asset-backed securities, which represent our most significant categories of securities not backed by the US government or its agencies. A summary of all OTTI credit losses recognized for the first six months of 2011 by investment type is included in
Note 7 Investment Securities in the Notes To Consolidated Financial Statements in this Report.
|
|
|
|
|
|
|
|
|
|
|
|
|
|
|
|
|
|
|
|
|
|
|
|
|
|
|
|
|
June 30, 2011
|
|
|
In millions
|
|
Residential Mortgage-
Backed Securities
|
|
|
Commercial Mortgage-
Backed Securities
|
|
|
Asset-Backed
Securities
|
|
|
Available for Sale Securities (Non-Agency)
|
|
|
|
|
|
|
|
|
|
|
|
|
|
|
|
|
|
|
|
|
|
|
|
|
|
|
|
Fair
Value
|
|
|
Net Unrealized
Gain (Loss)
|
|
|
Fair
Value
|
|
|
Net Unrealized
Gain (Loss)
|
|
|
Fair
Value
|
|
|
Net Unrealized
Gain (Loss)
|
|
|
Credit Rating Analysis
|
|
|
|
|
|
|
|
|
|
|
|
|
|
|
|
|
|
|
|
|
|
|
|
|
|
AAA
|
|
$
|
189
|
|
|
$
|
(16
|
)
|
|
$
|
1,515
|
|
|
$
|
35
|
|
|
$
|
2,761
|
|
|
$
|
8
|
|
|
Other Investment Grade (AA, A, BBB)
|
|
|
826
|
|
|
|
(34
|
)
|
|
|
928
|
|
|
|
16
|
|
|
|
125
|
|
|
|
(8
|
)
|
|
Total Investment Grade
|
|
|
1,015
|
|
|
|
(50
|
)
|
|
|
2,443
|
|
|
|
51
|
|
|
|
2,886
|
|
|
|
|
|
|
BB
|
|
|
594
|
|
|
|
(6
|
)
|
|
|
27
|
|
|
|
|
|
|
|
|
|
|
|
|
|
|
B
|
|
|
929
|
|
|
|
(116
|
)
|
|
|
|
|
|
|
|
|
|
|
191
|
|
|
|
(29
|
)
|
|
Lower than B
|
|
|
3,877
|
|
|
|
(606
|
)
|
|
|
|
|
|
|
|
|
|
|
579
|
|
|
|
(107
|
)
|
|
Total Sub-Investment Grade
|
|
|
5,400
|
|
|
|
(728
|
)
|
|
|
27
|
|
|
|
|
|
|
|
770
|
|
|
|
(136
|
)
|
|
Total No Rating
|
|
|
39
|
|
|
|
|
|
|
|
75
|
|
|
|
|
|
|
|
26
|
|
|
|
(18
|
)
|
|
Total
|
|
$
|
6,454
|
|
|
$
|
(778
|
)
|
|
$
|
2,545
|
|
|
$
|
51
|
|
|
$
|
3,682
|
|
|
$
|
(154
|
)
|
|
OTTI Analysis
|
|
|
|
|
|
|
|
|
|
|
|
|
|
|
|
|
|
|
|
|
|
|
|
|
|
Investment Grade:
|
|
|
|
|
|
|
|
|
|
|
|
|
|
|
|
|
|
|
|
|
|
|
|
|
|
OTTI has been recognized
|
|
$
|
103
|
|
|
$
|
(14
|
)
|
|
|
|
|
|
|
|
|
|
|
|
|
|
|
|
|
|
No OTTI recognized to date
|
|
|
912
|
|
|
|
(36
|
)
|
|
$
|
2,443
|
|
|
$
|
51
|
|
|
$
|
2,886
|
|
|
|
|
|
|
Total Investment Grade
|
|
|
1,015
|
|
|
|
(50
|
)
|
|
|
2,443
|
|
|
|
51
|
|
|
|
2,886
|
|
|
|
|
|
|
Sub-Investment Grade:
|
|
|
|
|
|
|
|
|
|
|
|
|
|
|
|
|
|
|
|
|
|
|
|
|
|
OTTI has been recognized
|
|
|
3,403
|
|
|
|
(659
|
)
|
|
|
|
|
|
|
|
|
|
|
621
|
|
|
|
(146
|
)
|
|
No OTTI recognized to date
|
|
|
1,997
|
|
|
|
(69
|
)
|
|
|
27
|
|
|
|
|
|
|
|
149
|
|
|
|
10
|
|
|
Total Sub-Investment Grade
|
|
|
5,400
|
|
|
|
(728
|
)
|
|
|
27
|
|
|
|
|
|
|
|
770
|
|
|
|
(136
|
)
|
|
No Rating:
|
|
|
|
|
|
|
|
|
|
|
|
|
|
|
|
|
|
|
|
|
|
|
|
|
|
OTTI has been recognized
|
|
|
|
|
|
|
|
|
|
|
|
|
|
|
|
|
|
|
26
|
|
|
|
(18
|
)
|
|
No OTTI recognized to date
|
|
|
39
|
|
|
|
|
|
|
|
75
|
|
|
|
|
|
|
|
|
|
|
|
|
|
|
Total No Rating
|
|
|
39
|
|
|
|
|
|
|
|
75
|
|
|
|
|
|
|
|
26
|
|
|
|
(18
|
)
|
|
Total
|
|
$
|
6,454
|
|
|
$
|
(778
|
)
|
|
$
|
2,545
|
|
|
$
|
51
|
|
|
$
|
3,682
|
|
|
$
|
(154
|
)
|
|
Securities Held to Maturity (Non-Agency)
|
|
|
|
|
|
|
|
|
|
|
|
|
|
|
|
|
|
|
|
|
|
|
|
|
|
Credit Rating Analysis
|
|
|
|
|
|
|
|
|
|
|
|
|
|
|
|
|
|
|
|
|
|
|
|
|
|
AAA
|
|
|
|
|
|
|
|
|
|
$
|
3,967
|
|
|
$
|
142
|
|
|
$
|
1,714
|
|
|
$
|
22
|
|
|
Other Investment Grade (AA, A, BBB)
|
|
|
|
|
|
|
|
|
|
|
205
|
|
|
|
3
|
|
|
|
234
|
|
|
|
1
|
|
|
Total Investment Grade
|
|
|
|
|
|
|
|
|
|
|
4,172
|
|
|
|
145
|
|
|
|
1,948
|
|
|
|
23
|
|
|
BB
|
|
|
|
|
|
|
|
|
|
|
|
|
|
|
|
|
|
|
6
|
|
|
|
|
|
|
B
|
|
|
|
|
|
|
|
|
|
|
|
|
|
|
|
|
|
|
1
|
|
|
|
|
|
|
Lower than B
|
|
|
|
|
|
|
|
|
|
|
|
|
|
|
|
|
|
|
|
|
|
|
|
|
|
Total Sub-Investment Grade
|
|
|
|
|
|
|
|
|
|
|
|
|
|
|
|
|
|
|
7
|
|
|
|
|
|
|
Total No Rating
|
|
|
|
|
|
|
|
|
|
|
|
|
|
|
|
|
|
|
128
|
|
|
|
6
|
|
|
Total
|
|
|
|
|
|
|
|
|
|
$
|
4,172
|
|
|
$
|
145
|
|
|
$
|
2,083
|
|
|
$
|
29
|
|
17
Residential Mortgage-Backed Securities
At June 30, 2011, our residential mortgage-backed securities portfolio was comprised of $28.3 billion fair value of US government agency-backed securities and $6.5 billion fair value of non-agency
(private issuer) securities. The agency securities are generally collateralized by 1-4 family, conforming, fixed-rate residential mortgages
.
The non-agency securities are also generally collateralized by 1-4 family residential mortgages. The
mortgage loans underlying the non-agency securities are generally non-conforming (i.e., original balances in excess of the amount qualifying for agency securities) and predominately have interest rates that are fixed for a period of time, after
which the rate adjusts to a floating rate based upon a contractual spread that is indexed to a market rate (i.e., a “hybrid ARM”), or interest rates that are fixed for the term of the loan.
Substantially all of the non-agency securities are senior tranches in the securitization structure and at origination had credit protection in the form
of credit enhancement, over-collateralization and/or excess spread accounts.
During the first half of 2011, we recorded OTTI credit losses of
$63 million on non-agency residential mortgage-backed securities, including $35 million in the second quarter. Almost all of the losses were associated with securities rated below investment grade. As of June 30, 2011, the noncredit portion of
OTTI losses recorded in accumulated other comprehensive loss for non-agency residential mortgage-backed securities totaled $673 million and the related securities had a fair value of $3.5 billion.
The fair value of sub-investment grade investment securities for which we have not recorded an OTTI credit loss as of June 30, 2011 totaled $2.0
billion, with unrealized net losses of $69 million. The results of our security-level assessments indicate that we will recover the entire cost basis of these securities. Note 7 Investment Securities in the Notes To Consolidated Financial Statements
in this Report provides further detail regarding our process for assessing OTTI for these securities.
Commercial Mortgage-Backed
Securities
The fair value of the non-agency commercial mortgage-backed securities portfolio was $6.7 billion at June 30, 2011 and
consisted of fixed-rate, private-issuer securities collateralized by non-residential properties, primarily retail properties, office buildings, and multi-family housing. The agency commercial mortgage-backed securities portfolio was $1.8 billion
fair value at June 30, 2011 consisting of multi-family housing. Substantially all of the securities are the most senior tranches in the subordination structure.
There were no OTTI credit losses on commercial mortgage- backed securities during the first six months of 2011.
Asset-Backed Securities
The fair value of the asset-backed securities portfolio was $5.8 billion at June 30, 2011 and consisted of fixed-rate and floating-rate, private-issuer securities collateralized primarily by various
consumer credit products, including residential mortgage loans, credit cards, automobile loans, and student loans. Substantially all of the securities are senior tranches in the securitization structure and have credit protection in the form of
credit enhancement, over-collateralization and/or excess spread accounts.
We recorded OTTI credit losses of $9 million on asset-backed
securities during the first six months of 2011, including $4 million during the second quarter. All of the securities are collateralized by first and second lien residential mortgage loans and are rated below investment grade. As of June 30,
2011, the noncredit portion of OTTI losses recorded in accumulated other comprehensive loss for asset-backed securities totaled $164 million and the related securities had a fair value of $647 million.
For the sub-investment grade investment securities (available for sale and held to maturity) for which we have not recorded an OTTI loss through
June 30, 2011, the remaining fair value was $156 million, with unrealized net gains of $10 million. The results of our security-level assessments indicate that we will recover the cost basis of these securities. Note 7 Investment Securities in
the Notes To Consolidated Financial Statements in this Report provides further detail regarding our process for assessing OTTI for these securities.
If current housing and economic conditions were to worsen, if market volatility and illiquidity were to worsen, or if market interest rates were to increase appreciably, the valuation of our investment
securities portfolio could continue to be adversely affected and we could incur additional OTTI credit losses that would impact our Consolidated Income Statement.
L
OANS
H
ELD
F
OR
S
ALE
|
|
|
|
|
|
|
|
|
|
|
In millions
|
|
June
30
2011
|
|
|
December 31
2010
|
|
|
Commercial mortgages at fair value
|
|
$
|
856
|
|
|
$
|
877
|
|
|
Commercial mortgages at lower of cost or market
|
|
|
370
|
|
|
|
330
|
|
|
Total commercial mortgages
|
|
|
1,226
|
|
|
|
1,207
|
|
|
Residential mortgages at fair value
|
|
|
1,351
|
|
|
|
1,878
|
|
|
Residential mortgages at lower of cost or market
|
|
|
|
|
|
|
12
|
|
|
Total residential mortgages
|
|
|
1,351
|
|
|
|
1,890
|
|
|
Other
|
|
|
102
|
|
|
|
395
|
|
|
Total
|
|
$
|
2,679
|
|
|
|
3,492
|
|
18
We stopped originating certain commercial mortgage loans designated as held for sale in 2008 and continue
pursuing opportunities to reduce these positions at appropriate prices. We sold $25 million of commercial mortgage loans held for sale carried at fair value in the first six months of 2011 and sold $44 million in the first six months of 2010.
We recognized net gains of $20 million in the first six months of 2011, including $7 million in the second quarter, on the valuation and sale
of commercial mortgage loans held for sale, net of hedges. Net losses of $13 million on the valuation and sale of commercial mortgage loans held for sale, net of hedges, were recognized in the first six months of 2010, including $22 million in the
second quarter.
Residential mortgage loan origination volume was $5.8 billion in the first six months of 2011. Substantially all such loans
were originated under agency or Federal Housing Administration (FHA) standards. We sold $6.5 billion of loans and recognized related gains of $136 million during the first six months of 2011, of which $52 million occurred in the second quarter. The
comparable amounts for the first six months of 2010 were $4.2 billion and $88 million, respectively, including $49 million in the second quarter.
Interest income on loans held for sale was $107 million in the first six months of 2011, including $38 million in the second quarter. Comparable amounts for 2010 were $153 million and $73 million,
respectively. These amounts are included in Other interest income on our Consolidated Income Statement.
G
OODWILL
AND
O
THER
I
NTANGIBLE
A
SSETS
Goodwill and other intangible assets totaled
$10.6 billion at June 30, 2011 and $10.8 billion at December 31, 2010. See Note 9 Goodwill and Other Intangible Assets included in the Notes To Consolidated Financial Statements in this Report.
F
UNDING
AND
C
APITAL
S
OURCES
Details Of Funding Sources
|
|
|
|
|
|
|
|
|
|
|
In millions
|
|
June 30
2011
|
|
|
December 31
2010
|
|
|
Deposits
|
|
|
|
|
|
|
|
|
|
Money market
|
|
$
|
85,170
|
|
|
$
|
84,581
|
|
|
Demand
|
|
|
51,930
|
|
|
|
50,069
|
|
|
Retail certificates of deposit
|
|
|
34,351
|
|
|
|
37,337
|
|
|
Savings
|
|
|
8,257
|
|
|
|
7,340
|
|
|
Other time
|
|
|
390
|
|
|
|
549
|
|
|
Time deposits in foreign offices
|
|
|
1,793
|
|
|
|
3,514
|
|
|
Total deposits
|
|
|
181,891
|
|
|
|
183,390
|
|
|
Borrowed funds
|
|
|
|
|
|
|
|
|
|
Federal funds purchased and repurchase agreements
|
|
|
3,812
|
|
|
|
4,144
|
|
|
Federal Home Loan Bank borrowings
|
|
|
5,022
|
|
|
|
6,043
|
|
|
Bank notes and senior debt
|
|
|
10,526
|
|
|
|
12,904
|
|
|
Subordinated debt
|
|
|
9,358
|
|
|
|
9,842
|
|
|
Other
|
|
|
6,458
|
|
|
|
6,555
|
|
|
Total borrowed funds
|
|
|
35,176
|
|
|
|
39,488
|
|
|
Total
|
|
$
|
217,067
|
|
|
$
|
222,878
|
|
Total funding sources decreased $5.8 billion at June 30, 2011 compared with December 31, 2010.
Total deposits decreased $1.5 billion, or 1% at June 30, 2011 compared with December 31, 2010 primarily due to redemption of retail
certificates of deposit. Interest-bearing deposits represented 71% of total deposits at June 30, 2011 compared to 73% at December 31, 2010. Total borrowed funds decreased $4.3 billion since December 31, 2010. The decline from
December 31, 2010 was primarily due to maturities of FHLB borrowings, bank notes and senior debt, and subordinated debt.
Capital
See 2011 Capital Actions in the Executive Summary section of this Financial Review for additional information regarding our July 2011
issuance of depository shares representing preferred stock, our April 2011 increase to PNC’s quarterly common stock dividend, and our plans regarding purchase of shares under PNC’s existing common stock repurchase program.
We manage our capital position by making adjustments to our balance sheet size and composition, issuing debt, equity or hybrid instruments, executing
treasury stock transactions, managing dividend policies and retaining earnings.
Total shareholders’ equity increased $2 billion, to
$32.2 billion, at June 30, 2011 compared with December 31, 2010 as retained earnings increased $1.5 billion. Common shares outstanding were 526 million at both June 30, 2011 and December 31, 2010.
Our current common stock repurchase program permits us to purchase up to 25 million shares of PNC common stock on the open market or in privately
negotiated transactions. This program will remain in effect until fully utilized or until modified, superseded or terminated. The extent and timing of share repurchases under this program will depend on a number of factors including, among others,
market and general economic conditions, economic and regulatory capital considerations, alternative uses of capital, regulatory and contractual limitations, and the potential impact on our credit ratings. We did not purchase any shares in the first
six months of 2011 under this program.
19
Risk-Based Capital
|
|
|
|
|
|
|
|
|
|
|
Dollars in millions
|
|
June 30
2011
|
|
|
December 31
2010
|
|
|
Capital components
|
|
|
|
|
|
|
|
|
|
Shareholders’ equity
|
|
|
|
|
|
|
|
|
|
Common
|
|
$
|
31,588
|
|
|
$
|
29,596
|
|
|
Preferred
|
|
|
647
|
|
|
|
646
|
|
|
Trust preferred capital securities
|
|
|
2,909
|
|
|
|
2,907
|
|
|
Noncontrolling interests
|
|
|
1,350
|
|
|
|
1,351
|
|
|
Goodwill and other intangible assets
|
|
|
(9,005
|
)
|
|
|
(9,053
|
)
|
|
Eligible deferred income taxes on goodwill and other intangible assets
|
|
|
445
|
|
|
|
461
|
|
|
Pension, other postretirement benefit plan adjustments
|
|
|
373
|
|
|
|
380
|
|
|
Net unrealized securities losses, after-tax
|
|
|
101
|
|
|
|
550
|
|
|
Net unrealized gains on cash flow hedge derivatives, after-tax
|
|
|
(544
|
)
|
|
|
(522
|
)
|
|
Other
|
|
|
(213
|
)
|
|
|
(224
|
)
|
|
Tier 1 risk-based capital
|
|
|
27,651
|
|
|
|
26,092
|
|
|
Subordinated debt
|
|
|
4,742
|
|
|
|
4,899
|
|
|
Eligible allowance for credit losses
|
|
|
2,734
|
|
|
|
2,733
|
|
|
Total risk-based capital
|
|
$
|
35,127
|
|
|
$
|
33,724
|
|
|
Tier 1 common capital
|
|
|
|
|
|
|
|
|
|
Tier 1 risk-based capital
|
|
$
|
27,651
|
|
|
$
|
26,092
|
|
|
Preferred equity
|
|
|
(647
|
)
|
|
|
(646
|
)
|
|
Trust preferred capital securities
|
|
|
(2,909
|
)
|
|
|
(2,907
|
)
|
|
Noncontrolling interests
|
|
|
(1,350
|
)
|
|
|
(1,351
|
)
|
|
Tier 1 common capital
|
|
$
|
22,745
|
|
|
$
|
21,188
|
|
|
Assets
|
|
|
|
|
|
|
|
|
|
Risk-weighted assets, including off-balance sheet instruments and market risk equivalent assets
|
|
$
|
216,643
|
|
|
$
|
216,283
|
|
|
Adjusted average total assets
|
|
|
252,032
|
|
|
|
254,693
|
|
|
Capital ratios
|
|
|
|
|
|
|
|
|
|
Tier 1 common
|
|
|
10.5
|
%
|
|
|
9.8
|
%
|
|
Tier 1 risk-based
|
|
|
12.8
|
|
|
|
12.1
|
|
|
Total risk-based
|
|
|
16.2
|
|
|
|
15.6
|
|
|
Leverage
|
|
|
11.0
|
|
|
|
10.2
|
|
Federal banking regulators have stated that they expect all bank holding companies to have a level and composition of
Tier 1 capital well in excess of the 4% regulatory minimum, and they have required the largest US bank holding companies, including PNC, to have a capital buffer sufficient to withstand losses and allow them to meet credit needs of their customers
through the economic downturn. They have also stated their view that common equity should be the
dominant form of Tier 1 capital. As a result, regulators are now emphasizing the Tier 1 common capital ratio in their evaluation of bank holding company capital levels, although this metric is
not provided for in the regulations. We seek to manage our capital consistent with these regulatory principles, and believe that our June 30, 2011 capital levels were aligned with them.
Dodd-Frank requires the Federal Reserve Board to establish capital requirements that would, among other things, eliminate the Tier 1 treatment of trust preferred securities following a phase-in period
expected to begin in 2013. Accordingly, PNC will evaluate its alternatives, including the potential for early redemption of some or all of its trust preferred securities, based on such considerations it may consider relevant, including dividend
rates, the specifics of the future capital requirements, capital market conditions and other factors. PNC is also subject to replacement capital covenants with respect to certain of its trust preferred securities as discussed in Note 13 Capital
Securities of Subsidiary Trusts and Perpetual Trust Securities in Item 8 of our 2010 Form 10-K.
Our Tier 1 common capital ratio was
10.5% at June 30, 2011, compared with 9.8% at December 31, 2010. Our Tier 1 risk-based capital ratio increased 70 basis points to 12.8% at June 30, 2011 from 12.1% at December 31, 2010. Increases in both ratios were attributable
to retention of earnings in 2011.
At June 30, 2011, PNC Bank, N.A., our domestic bank subsidiary, was considered “well
capitalized” based on US regulatory capital ratio requirements. To qualify as “well-capitalized”, regulators currently require banks to maintain capital ratios of at least 6% for Tier 1 risk-based, 10% for total risk-based, and 5% for
leverage, which are indicated on page 3 of this Report. We believe PNC Bank, N.A. will continue to meet these requirements during the remainder of 2011.
The access to, and cost of, funding for new business initiatives including acquisitions, the ability to engage in expanded business activities, the ability to pay dividends, the level of deposit insurance
costs, and the level and nature of regulatory oversight depend, in part, on a financial institution’s capital strength.
We provide
additional information regarding enhanced capital requirements and some of their potential impacts on PNC in Item 1A Risk Factors included in Part II of this Report.
20
O
FF
-B
ALANCE
S
HEET
A
RRANGEMENTS
A
ND
V
ARIABLE
I
NTEREST
E
NTITIES
We engage in a
variety of activities that involve unconsolidated entities or that are otherwise not reflected in our Consolidated Balance Sheet that are generally referred to as “off-balance sheet arrangements.” Additional information on these types of
activities is included in our 2010 Form 10-K and in the following sections of this Report:
|
|
•
|
|
Commitments, including contractual obligations and other commitments, included within the Risk Management section of this Financial Review,
|
|
|
•
|
|
Note 3 Loan Sale and Servicing Activities and Variable Interest Entities in the Notes To Consolidated Financial Statements,
|
|
|
•
|
|
Note 10 Capital Securities of Subsidiary Trusts and Perpetual Trust Securities in the Notes To Consolidated Financial Statements, and
|
|
|
•
|
|
Note 17 Commitments and Guarantees in the Notes To Consolidated Financial Statements.
|
PNC consolidates variable interest entities (VIEs) when we are deemed to be the primary beneficiary. The primary beneficiary of a VIE is determined to be
the party that meets both of the following criteria: (1) has the power to make decisions that most significantly affect the economic performance of the VIE and (2) has the obligation to absorb losses or the right to receive benefits that
in either case could potentially be significant to the VIE.
A summary of VIEs, including those that we have consolidated and those in which
we hold variable interests but have not consolidated into our financial statements, as of June 30, 2011 and December 31, 2010 is included in Note 3 of this Report.
PNC Capital Trust E Trust Preferred Securities
In February 2008, PNC Capital Trust
E issued $450 million of 7.75% Trust Preferred Securities due March 15, 2068 (the Trust E Securities). PNC Capital Trust E’s only assets are $450 million of 7.75% Junior Subordinated Notes due March 15, 2068 and issued by PNC (the
JSNs). The Trust E
Securities are fully and unconditionally guaranteed by PNC. We may, at our option, redeem the JSNs at 100% of their principal amount on or after March 15, 2013.
In connection with the closing of the Trust E Securities sale, we agreed that, if we have given notice of our election to defer interest payments on the
JSNs or a related deferral period is continuing, then PNC would be subject during such period to restrictions on dividends and other provisions protecting the status of the JSN debenture holder similar to or in some ways more restrictive than those
potentially imposed under the Exchange Agreements with Trust II and Trust III, as described in Note 13 Capital Securities of Subsidiary Trusts and Perpetual Trust Securities (Note 13) in our 2010 Form 10-K. PNC Capital Trusts C and D have similar
protective provisions with respect to $500 million in principal amount of junior subordinated debentures. Also, in connection with the closing of the Trust E Securities sale, we entered into a replacement capital covenant, which is described in Note
13 in our 2010 Form 10-K.
Acquired Entity Trust Preferred Securities
As a result of the National City acquisition, we assumed obligations with respect to $2.4 billion in principal amount of junior subordinated debentures issued by the acquired entity. As a result of other
prior acquisitions, we assumed obligations with respect to $158 million in principal amount of junior subordinated debentures issued by the acquired entities. As described in Note 13 in our 2010 Form 10-K, during 2010 we redeemed $81 million in
principal amount related to the junior subordinated debentures issued by the acquired entities. Under the terms of the outstanding debentures, if there is an event of default under the debentures or PNC exercises its right to defer payments on the
related trust preferred securities issued by the statutory trusts or there is a default under PNC’s guarantee of such payment obligations, PNC would be subject during the period of such default or deferral to restrictions on dividends and other
provisions protecting the status of the debenture holders similar to or in some ways more restrictive than those potentially imposed under the Exchange Agreements with Trust II and Trust III, as described in Note 13 in our 2010 Form 10-K.
21
F
AIR
V
ALUE
M
EASUREMENTS
In addition to the following, see Note 8 Fair Value in the Notes To Consolidated Financial Statements in this Report for further
information regarding fair value.
Assets recorded at fair value represented 24% of total assets at June 30, 2011 and 27% at
December 31, 2010. Liabilities recorded at fair value represented 3% of total liabilities at both June 30, 2011 and December 31, 2010, respectively.
The following table includes the assets and liabilities measured at fair value and the portion of such assets and liabilities that are classified within Level 3 of the valuation hierarchy.
|
|
|
|
|
|
|
|
|
|
|
|
|
|
|
|
|
|
|
|
|
June 30, 2011
|
|
|
December 31, 2010
|
|
|
In millions
|
|
Total Fair
Value
|
|
|
Level 3
|
|
|
Total Fair
Value
|
|
|
Level 3
|
|
|
Assets
|
|
|
|
|
|
|
|
|
|
|
|
|
|
|
|
|
|
Securities available for sale
|
|
$
|
49,667
|
|
|
$
|
7,821
|
|
|
$
|
57,310
|
|
|
$
|
8,583
|
|
|
Financial derivatives
|
|
|
5,855
|
|
|
|
60
|
|
|
|
5,757
|
|
|
|
77
|
|
|
Residential mortgage loans held for sale
|
|
|
1,351
|
|
|
|
|
|
|
|
1,878
|
|
|
|
|
|
|
Trading securities
|
|
|
2,075
|
|
|
|
56
|
|
|
|
1,826
|
|
|
|
69
|
|
|
Residential mortgage servicing rights
|
|
|
996
|
|
|
|
996
|
|
|
|
1,033
|
|
|
|
1,033
|
|
|
Commercial mortgage loans held for sale
|
|
|
856
|
|
|
|
856
|
|
|
|
877
|
|
|
|
877
|
|
|
Equity investments
|
|
|
1,513
|
|
|
|
1,513
|
|
|
|
1,384
|
|
|
|
1,384
|
|
|
Customer resale agreements
|
|
|
813
|
|
|
|
|
|
|
|
866
|
|
|
|
|
|
|
Loans
|
|
|
239
|
|
|
|
4
|
|
|
|
116
|
|
|
|
2
|
|
|
Other assets
|
|
|
902
|
|
|
|
434
|
|
|
|
853
|
|
|
|
403
|
|
|
Total assets
|
|
$
|
64,267
|
|
|
$
|
11,740
|
|
|
$
|
71,900
|
|
|
$
|
12,428
|
|
|
Level 3 assets as a percentage of total assets at fair value
|
|
|
|
|
|
|
18
|
%
|
|
|
|
|
|
|
17
|
%
|
|
Level 3 assets as a percentage of consolidated assets
|
|
|
|
|
|
|
4
|
%
|
|
|
|
|
|
|
5
|
%
|
|
Liabilities
|
|
|
|
|
|
|
|
|
|
|
|
|
|
|
|
|
|
Financial derivatives
|
|
$
|
4,863
|
|
|
$
|
444
|
|
|
$
|
4,935
|
|
|
$
|
460
|
|
|
Trading securities sold short
|
|
|
1,845
|
|
|
|
|
|
|
|
2,530
|
|
|
|
|
|
|
Other liabilities
|
|
|
|
|
|
|
|
|
|
|
6
|
|
|
|
|
|
|
Total liabilities
|
|
$
|
6,708
|
|
|
$
|
444
|
|
|
$
|
7,471
|
|
|
$
|
460
|
|
|
Level 3 liabilities as a percentage of total liabilities at fair value
|
|
|
|
|
|
|
7
|
%
|
|
|
|
|
|
|
6
|
%
|
|
Level 3 liabilities as a percentage of consolidated liabilities
|
|
|
|
|
|
|
<1
|
%
|
|
|
|
|
|
|
<1
|
%
|
The majority of Level 3 assets represent non-agency residential mortgage-backed and asset-backed securities
in the available for sale securities portfolio for which there was a lack of observable market activity.
During the first six months of 2011, no material transfers of assets or liabilities between the hierarchy
levels occurred.
22
B
USINESS
S
EGMENTS
R
EVIEW
We have six reportable business segments:
|
|
•
|
|
Corporate & Institutional Banking
|
|
|
•
|
|
Residential Mortgage Banking
|
|
|
•
|
|
Distressed Assets Portfolio
|
Once we entered into an agreement to sell GIS, it was no longer a reportable business segment. We sold GIS on July 1, 2010.
Business segment results, including inter-segment revenues, and a description of each business are included in Note 18 Segment Reporting included in the
Notes To Consolidated Financial Statements of this Report. Certain amounts included in this Financial Review differ from those amounts shown in Note 18 primarily due to the presentation in this Financial Review of business net interest revenue on a
taxable-equivalent basis.
Results of individual businesses are presented based on our management accounting practices and management
structure. There is no comprehensive, authoritative body of guidance for management accounting equivalent to GAAP; therefore, the financial results of our individual businesses are not necessarily comparable with similar information for any other
company. We refine our methodologies from time to time as our management accounting practices are enhanced and our businesses and management structure change. Certain prior period amounts have been reclassified to reflect current methodologies and
our current business and management structure. Financial results are presented, to the extent practicable, as if each business operated on a stand-alone basis. We have aggregated the business results for certain similar operating segments for
financial reporting purposes.
Assets receive a funding charge and liabilities and capital receive a funding credit based on a transfer
pricing methodology that incorporates product maturities, duration and other factors.
Capital is intended to cover unexpected losses and is assigned to our business segments using our
risk-based economic capital model, including consideration of the goodwill and other intangible assets at those business segments, as well as the diversification of risk among the business segments. We have revised certain capital allocations among
our business segments, including amounts for prior periods. PNC’s total capital did not change as a result of these adjustments for any periods presented. However, capital allocations to the segments were lower in the year-over-year comparisons
primarily due to improving credit quality.
We have allocated the ALLL and unfunded loan commitments and letters of credit based on our
assessment of risk in the business segment loan portfolios. Our allocation of the costs incurred by operations and other shared support areas not directly aligned with the businesses is primarily based on the use of services.
Total business segment financial results differ from total consolidated results from continuing operations before noncontrolling interests, which itself
excludes the earnings and revenue attributable to GIS through June 30, 2010 that is reflected in discontinued operations. The impact of these differences is reflected in the “Other” category. “Other” for purposes of this
Business Segments Review and the Business Segment Highlights in the Executive Summary includes residual activities that do not meet the criteria for disclosure as a separate reportable business, such as gains or losses related to BlackRock
transactions including LTIP share distributions and obligations, integration costs, asset and liability management activities including net securities gains or losses, other-than-temporary impairment of investment securities and certain trading
activities, exited businesses, equity management activities, alternative investments, intercompany eliminations, most corporate overhead, tax adjustments that are not allocated to business segments, and differences between business segment
performance reporting and financial statement reporting (GAAP), including the presentation of net income attributable to noncontrolling interests.
23
Results Of Businesses – Summary
(Unaudited)
|
|
|
|
|
|
|
|
|
|
|
|
|
|
|
|
|
|
|
|
|
|
|
|
|
|
|
|
|
Income (Loss)
|
|
|
Revenue
|
|
|
Average Assets (a)
|
|
|
Six months ended June 30 - in millions
|
|
2011
|
|
|
2010
|
|
|
2011
|
|
|
2010
|
|
|
2011
|
|
|
2010
|
|
|
Retail Banking
|
|
$
|
26
|
|
|
$
|
104
|
|
|
$
|
2,518
|
|
|
$
|
2,748
|
|
|
$
|
66,210
|
|
|
$
|
68,178
|
|
|
Corporate & Institutional Banking
|
|
|
880
|
|
|
|
816
|
|
|
|
2,278
|
|
|
|
2,491
|
|
|
|
78,002
|
|
|
|
78,295
|
|
|
Asset Management Group
|
|
|
91
|
|
|
|
66
|
|
|
|
448
|
|
|
|
444
|
|
|
|
6,786
|
|
|
|
7,016
|
|
|
Residential Mortgage Banking
|
|
|
126
|
|
|
|
169
|
|
|
|
477
|
|
|
|
480
|
|
|
|
11,218
|
|
|
|
8,770
|
|
|
BlackRock
|
|
|
179
|
|
|
|
154
|
|
|
|
229
|
|
|
|
198
|
|
|
|
5,596
|
|
|
|
6,125
|
|
|
Distressed Assets Portfolio
|
|
|
109
|
|
|
|
(6
|
)
|
|
|
515
|
|
|
|
688
|
|
|
|
13,743
|
|
|
|
19,009
|
|
|
Total business segments
|
|
|
1,411
|
|
|
|
1,303
|
|
|
|
6,465
|
|
|
|
7,049
|
|
|
|
181,555
|
|
|
|
187,393
|
|
|
Other (b) (c)
|
|
|
333
|
|
|
|
126
|
|
|
|
768
|
|
|
|
626
|
|
|
|
80,271
|
|
|
|
78,356
|
|
|
Income from continuing operations before noncontrolling interests (d)
|
|
$
|
1,744
|
|
|
$
|
1,429
|
|
|
$
|
7,233
|
|
|
$
|
7,675
|
|
|
$
|
261,826
|
|
|
$
|
265,749
|
|
|
(a)
|
Period-end balances for BlackRock.
|
|
(b)
|
For our segment reporting presentation in this Financial Review, “Other” for the first six months of 2010 included $213 million of pretax integration costs
related to acquisitions.
|
|
(c)
|
“Other” average assets include securities available for sale associated with asset and liability management activities.
|
|
(d)
|
Amounts are presented on a continuing operations basis and therefore exclude the earnings, revenue, and assets of GIS for the first six months of 2010.
|
24
R
ETAIL
B
ANKING
(Unaudited)
|
|
|
|
|
|
|
|
|
|
|
Six months ended June 30
Dollars in millions, except as noted
|
|
2011
|
|
|
2010
|
|
|
I
NCOME
S
TATEMENT
|
|
|
|
|
|
|
|
|
|
Net interest income
|
|
$
|
1,628
|
|
|
$
|
1,748
|
|
|
Noninterest income
|
|
|
|
|
|
|
|
|
|
Service charges on deposits
|
|
|
242
|
|
|
|
399
|
|
|
Brokerage
|
|
|
105
|
|
|
|
108
|
|
|
Consumer services
|
|
|
481
|
|
|
|
431
|
|
|
Other
|
|
|
62
|
|
|
|
62
|
|
|
Total noninterest income
|
|
|
890
|
|
|
|
1,000
|
|
|
Total revenue
|
|
|
2,518
|
|
|
|
2,748
|
|
|
Provision for credit losses
|
|
|
456
|
|
|
|
619
|
|
|
Noninterest expense
|
|
|
2,022
|
|
|
|
1,969
|
|
|
Pretax earnings
|
|
|
40
|
|
|
|
160
|
|
|
Income taxes
|
|
|
14
|
|
|
|
56
|
|
|
Earnings
|
|
$
|
26
|
|
|
$
|
104
|
|
|
A
VERAGE
B
ALANCE
S
HEET
|
|
|
|
|
|
|
|
|
|
Loans
|
|
|
|
|
|
|
|
|
|
Consumer
|
|
|
|
|
|
|
|
|
|
Home equity
|
|
$
|
25,984
|
|
|
$
|
26,665
|
|
|
Indirect auto
|
|
|
2,579
|
|
|
|
1,950
|
|
|
Indirect other
|
|
|
1,565
|
|
|
|
2,009
|
|
|
Education
|
|
|
8,991
|
|
|
|
8,202
|
|
|
Credit cards
|
|
|
3,706
|
|
|
|
4,013
|
|
|
Other
|
|
|
1,815
|
|
|
|
1,784
|
|
|
Total consumer
|
|
|
44,640
|
|
|
|
44,623
|
|
|
Commercial and commercial real estate
|
|
|
10,711
|
|
|
|
11,365
|
|
|
Floor plan
|
|
|
1,522
|
|
|
|
1,297
|
|
|
Residential mortgage
|
|
|
1,241
|
|
|
|
1,741
|
|
|
Total loans
|
|
|
58,114
|
|
|
|
59,026
|
|
|
Goodwill and other intangible assets
|
|
|
5,760
|
|
|
|
5,904
|
|
|
Other assets
|
|
|
2,336
|
|
|
|
3,248
|
|
|
Total assets
|
|
$
|
66,210
|
|
|
$
|
68,178
|
|
|
Deposits
|
|
|
|
|
|
|
|
|
|
Noninterest-bearing demand
|
|
$
|
18,272
|
|
|
$
|
17,009
|
|
|
Interest-bearing demand
|
|
|
21,397
|
|
|
|
19,597
|
|
|
Money market
|
|
|
40,575
|
|
|
|
39,992
|
|
|
Total transaction deposits
|
|
|
80,244
|
|
|
|
76,598
|
|
|
Savings
|
|
|
7,856
|
|
|
|
6,780
|
|
|
Certificates of deposit
|
|
|
34,708
|
|
|
|
43,955
|
|
|
Total deposits
|
|
|
122,808
|
|
|
|
127,333
|
|
|
Other liabilities
|
|
|
955
|
|
|
|
1,654
|
|
|
Capital
|
|
|
8,147
|
|
|
|
8,424
|
|
|
Total liabilities and equity
|
|
$
|
131,910
|
|
|
$
|
137,411
|
|
|
P
ERFORMANCE
R
ATIOS
|
|
|
|
|
|
|
|
|
|
Return on average capital
|
|
|
1
|
%
|
|
|
2
|
%
|
|
Return on average assets
|
|
|
.08
|
|
|
|
.31
|
|
|
Noninterest income to total revenue
|
|
|
35
|
|
|
|
36
|
|
|
Efficiency
|
|
|
80
|
|
|
|
72
|
|
|
O
THER
I
NFORMATION
(a)
|
|
|
|
|
|
|
|
|
|
Credit-related statistics:
|
|
|
|
|
|
|
|
|
|
Commercial nonperforming assets
|
|
$
|
301
|
|
|
$
|
297
|
|
|
Consumer nonperforming assets
|
|
|
403
|
|
|
|
336
|
|
|
Total nonperforming assets (b)
|
|
$
|
704
|
|
|
$
|
633
|
|
|
Impaired loans (c)
|
|
$
|
826
|
|
|
$
|
974
|
|
|
Commercial lending net charge-offs
|
|
$
|
132
|
|
|
$
|
196
|
|
|
Credit card lending net charge-offs
|
|
|
122
|
|
|
|
185
|
|
|
Consumer lending (excluding credit card) net charge-offs
|
|
|
226
|
|
|
|
217
|
|
|
Total net charge-offs
|
|
$
|
480
|
|
|
$
|
598
|
|
|
Commercial lending annualized net charge-off ratio
|
|
|
2.18
|
%
|
|
|
3.12
|
%
|
|
Credit card lending annualized net charge-off ratio
|
|
|
6.64
|
%
|
|
|
9.30
|
%
|
|
Consumer lending (excluding credit card) annualized net charge-off ratio
|
|
|
1.08
|
%
|
|
|
1.03
|
%
|
|
Total annualized net charge-off ratio
|
|
|
1.67
|
%
|
|
|
2.04
|
%
|
|
Other statistics:
|
|
|
|
|
|
|
|
|
|
ATMs
|
|
|
6,707
|
|
|
|
6,539
|
|
|
Branches (d)
|
|
|
2,459
|
|
|
|
2,458
|
|
|
|
|
|
|
|
|
|
|
|
|
At June 30
Dollars in millions, except as noted
|
|
2011
|
|
|
2010
|
|
|
O
THER
I
NFORMATION
(C
ONTINUED
) (a)
|
|
|
|
|
|
|
|
|
|
Home equity portfolio credit statistics: (e)
|
|
|
|
|
|
|
|
|
|
% of first lien positions (f)
|
|
|
37
|
%
|
|
|
35
|
%
|
|
Weighted average loan-to-value ratios (f)
|
|
|
73
|
%
|
|
|
73
|
%
|
|
Weighted average FICO scores (g)
|
|
|
743
|
|
|
|
727
|
|
|
Annualized net charge-off ratio
|
|
|
1.16
|
%
|
|
|
.86
|
%
|
|
Loans 30 – 59 days past due
|
|
|
.48
|
%
|
|
|
.45
|
%
|
|
Loans 60 – 89 days past due
|
|
|
.30
|
%
|
|
|
.29
|
%
|
|
Loans 90 days past due
|
|
|
1.02
|
%
|
|
|
.91
|
%
|
|
Customer-related statistics: (in thousands)
|
|
|
|
|
|
|
|
|
|
Retail Banking checking relationships
|
|
|
5,627
|
|
|
|
5,389
|
|
|
Retail online banking active customers
|
|
|
3,354
|
|
|
|
2,774
|
|
|
Retail online bill payment active customers
|
|
|
1,045
|
|
|
|
870
|
|
|
Brokerage statistics:
|
|
|
|
|
|
|
|
|
|
Financial consultants (h)
|
|
|
712
|
|
|
|
711
|
|
|
Full service brokerage offices
|
|
|
37
|
|
|
|
41
|
|
|
Brokerage account assets (billions)
|
|
$
|
35
|
|
|
$
|
33
|
|
|
(a)
|
Presented as of June 30 except for net charge-offs and annualized net charge-off ratios, which are for the six months ended.
|
|
(b)
|
Includes nonperforming loans of $679 million at June 30, 2011 and $612 million at June 30, 2010.
|
|
(c)
|
Recorded investment of purchased impaired loans related to acquisitions.
|
|
(d)
|
Excludes certain satellite branches that provide limited products and/or services.
|
|
(e)
|
Home equity lien position, loan to value, FICO and delinquency statistics are based on borrower contractual amounts and include purchased impaired loans.
|
|
(f)
|
Includes loans from acquired portfolios for which lien position and loan-to-value information was limited. Additionally, excludes brokered home equity loans.
|
|
(g)
|
Represents the most recent FICO scores we have on file.
|
|
(h)
|
Financial consultants provide services in full service brokerage offices and traditional bank branches.
|
Retail Banking earned $26 million in the first six months of 2011 compared with earnings of $104 million for the same period a year ago. Earnings declined
from the prior year as lower revenues from the impact of Regulation E rules related to overdraft fees and a low interest rate environment were partially offset by a lower provision for credit losses. Retail Banking continued to maintain its focus on
growing customers and deposits, improving customer and employee satisfaction, investing in the business for future growth, and disciplined expense management during this period of market and economic uncertainty.
Highlights of Retail Banking’s performance for the first six months of 2011 include the following:
|
|
•
|
|
The planned acquisition of RBC Bank (USA) in March 2012 is expected to add 424 banking locations and expand PNC’s footprint to 19 states and over
2,800 branches.
|
|
|
•
|
|
On July 26, 2011, PNC signed a definitive agreement to acquire 27 branches and related deposits in metropolitan Atlanta, Georgia from Flagstar
Bank, FSB, a subsidiary of Flagstar Bancorp, Inc.
|
|
|
•
|
|
Retail Banking added approximately $280 million in deposits, 32,000 checking relationships, 19 branches and 27 ATMs in the June 2011 acquisition from
BankAtlantic in the Tampa, Florida area.
|
|
|
•
|
|
Retail Banking launched new checking account and credit card products during the first quarter. These new products are designed to provide more choices
for customers.
|
|
|
•
|
|
Net new checking relationships grew 130,000 in the first half of 2011 exclusive of the 32,000 added with
|
25
|
|
|
the BankAtlantic acquisition, strong results reflecting gains in all of our markets. We are seeing strong customer retention in the overall network.
|
|
|
•
|
|
Success in implementing Retail Banking’s deposit strategy resulted in growth in average demand deposits of $3.1 billion, or 8%, over the prior
year.
|
|
|
•
|
|
Our investment in online banking capabilities continues to pay off. Excluding the impact of the BankAtlantic branches, active online bill payment and
active online banking customers grew by 7% and 9%, respectively, during the first half of 2011; and both have grown approximately 20% since June 30, 2010.
|
|
|
•
|
|
PNC’s expansive branch footprint covers nearly one-third of the U.S. population in 15 states and Washington, DC with a network of 2,459 branches
and 6,707 ATMs at June 30, 2011. In the first six months of 2011, we opened 11 traditional and 3 in-store branches and consolidated 44 branches.
|
Total revenue for the first half of 2011 was $2.5 billion compared with $2.7 billion for the same period of 2010. Net interest income of $1.6 billion declined $120 million compared with the first half of
2010. The decrease over the prior period resulted from lower interest credits assigned to deposits, reflective of the rate environment, and lower average loan balances while benefiting from higher demand deposit balances.
Noninterest income declined $110 million over the first six months of 2010. The decline was driven by lower overdraft fees resulting from the impact of
Regulation E rules partially offset by higher volumes of customer-initiated transactions including debit and credit cards and merchant services.
For 2011, Retail Banking revenue is likely to decline compared with 2010 from the impact of the rules set forth in Regulation E related to overdraft fees and the Dodd-Frank limits related to interchange
rates on debit card transactions. Regulation E, which became effective July 1, 2010, is expected to have an incremental negative impact to 2011 revenues of approximately $200 million based on expected 2011 transaction volumes.
The Dodd-Frank limits related to interchange rates on debit cards will be effective October 1, 2011 and are expected to have a negative incremental
impact of approximately $75 million in 2011 and an additional incremental reduction in future periods’ annual revenue of approximately $175 million based on expected 2011 transaction volumes.
For 2011, the incremental decline compared to 2010 from the impact of the Credit CARD Act was not material. These estimates do not include any additional
financial impact to revenue of other or additional regulatory requirements. There could be other aspects of regulatory reform that further impact
these or other areas of our business as regulatory agencies, including the new Bureau of Consumer Financial Protection (CFPB), issue proposed and final regulations pursuant to Dodd-Frank and
other legislation. See additional information regarding legislative and regulatory developments in the Executive Summary section of this Financial Review and in Item 1A Risk Factors in Part II of this Report.
The provision for credit losses was $456 million through June 30, 2011 compared with $619 million over the same period in 2010. Net charge-offs were
$480 million for the first half of 2011 compared with $598 million in the same period last year. Improvements in credit quality are evident in the credit card and small business portfolios. Additionally, the home equity portfolio has shown recent
signs of improvement during the second quarter of 2011. The level of provisioning will be dependent on general economic conditions, loan growth, utilization of credit commitments and asset quality.
Noninterest expense for the first half of the year increased $53 million from the same period last year. The increase resulted from higher new product
marketing expenses and investments in the business partially offset by lower FDIC expenses resulting from an FDIC required methodology change.
Growing core checking deposits as a low-cost funding source and as the cornerstone product to build customer relationships is the primary objective of
our retail strategy. Furthermore, core checking accounts are critical to growing our overall payments business. The deposit strategy of Retail Banking is to remain disciplined on pricing, target specific products and markets for growth, and focus on
the retention and growth of balances for relationship customers.
In the first half of 2011, average total deposits of $122.8 billion
decreased $4.5 billion, or 4%, compared with the first half of 2010.
|
|
•
|
|
Average demand deposits increased $3.1 billion, or 8%, over the first six months of 2010. The increase was primarily driven by customer growth and
customer preferences for liquidity.
|
|
|
•
|
|
Average money market deposits increased $583 million, or 1%, from the first six months of 2010. The increase was primarily due to core money market
growth as customers generally prefer more liquid deposits in a low rate environment.
|
|
|
•
|
|
Average savings deposits increased $1.1 billion, or 16%, over the first six months of 2010. The increase is attributable to net customer growth and new
product offerings.
|
|
|
•
|
|
In the first half of 2011, average consumer certificates of deposit decreased $9.2 billion or 21% from the same period last year. This decline is
expected to continue in 2011, although at a slower pace, due to the continued run-off of higher rate certificates of deposit.
|
26
Currently, our primary focus is on a relationship-based lending strategy that targets specific customer
sectors (mass consumers, homeowners, students, small businesses and auto dealerships). In the first six months of 2011, average total loans were $58.1 billion, a decrease of $912 million, or 2%, over the same period last year.
|
|
•
|
|
Average education loans grew $789 million, or 10%, compared with the first half of 2010, primarily due to portfolio purchases.
|
|
|
•
|
|
Average indirect auto loans increased $629 million, or 32%, over the first six months of 2010. The increase was due to the expansion of our indirect
sales force and product introduction to acquired markets, as well as overall increases in auto sales. The indirect other portfolio is primarily a run-off portfolio comprised of marine, RV, and other indirect loan products.
|
|
|
•
|
|
Average auto dealer floor plan loans grew $225 million, or 17%, compared with the first half of 2010, primarily resulting from higher line utilization
as dealers maintained larger inventory levels due to product availability and improved sales prospects.
|
|
|
•
|
|
Average credit card balances decreased $307 million, or 8%, over the first six months of 2010. The decrease was primarily the result of fewer active
accounts generating balances coupled with increased paydowns on existing accounts.
|
|
|
•
|
|
Average commercial and commercial real estate loans declined $654 million, or 6%, compared with the first half of 2010. The decline was primarily due
to loan demand being outpaced by refinancings, paydowns, and charge-offs.
|
|
|
•
|
|
Average home equity loans declined $681 million, or 3% compared with the first six months of 2010. Consumer loan demand remained soft in the current
economic climate. The decline is driven by loan demand being outpaced by paydowns, refinancings, and charge-offs. Retail Banking’s home equity loan portfolio is relationship based, with 96% of the portfolio attributable to borrowers in our
primary geographic footprint. The nonperforming assets and charge-offs that we have experienced are within our expectations given current market conditions.
|
27
C
ORPORATE
& I
NSTITUTIONAL
B
ANKING
(Unaudited)
|
|
|
|
|
|
|
|
|
|
|
Six months ended June 30
Dollars in millions, except as noted
|
|
2011
|
|
|
2010
|
|
|
I
NCOME
S
TATEMENT
|
|
|
|
|
|
|
|
|
|
Net interest income
|
|
$
|
1,647
|
|
|
$
|
1,824
|
|
|
Noninterest income
|
|
|
|
|
|
|
|
|
|
Corporate service fees
|
|
|
384
|
|
|
|
479
|
|
|
Other
|
|
|
247
|
|
|
|
188
|
|
|
Noninterest income
|
|
|
631
|
|
|
|
667
|
|
|
Total revenue
|
|
|
2,278
|
|
|
|
2,491
|
|
|
Provision for credit losses
|
|
|
1
|
|
|
|
333
|
|
|
Noninterest expense
|
|
|
888
|
|
|
|
868
|
|
|
Pretax earnings
|
|
|
1,389
|
|
|
|
1,290
|
|
|
Income taxes
|
|
|
509
|
|
|
|
474
|
|
|
Earnings
|
|
$
|
880
|
|
|
$
|
816
|
|
|
A
VERAGE
B
ALANCE
S
HEET
|
|
|
|
|
|
|
|
|
|
Loans
|
|
|
|
|
|
|
|
|
|
Commercial
|
|
$
|
33,939
|
|
|
$
|
33,541
|
|
|
Commercial real estate
|
|
|
14,091
|
|
|
|
17,483
|
|
|
Commercial – real estate related
|
|
|
3,478
|
|
|
|
3,014
|
|
|
Asset-based lending
|
|
|
7,667
|
|
|
|
6,003
|
|
|
Equipment lease financing
|
|
|
5,511
|
|
|
|
5,292
|
|
|
Total loans
|
|
|
64,686
|
|
|
|
65,333
|
|
|
Goodwill and other intangible assets
|
|
|
3,470
|
|
|
|
3,727
|
|
|
Loans held for sale
|
|
|
1,285
|
|
|
|
1,409
|
|
|
Other assets
|
|
|
8,561
|
|
|
|
7,826
|
|
|
Total assets
|
|
$
|
78,002
|
|
|
$
|
78,295
|
|
|
Deposits
|
|
|
|
|
|
|
|
|
|
Noninterest-bearing demand
|
|
$
|
28,678
|
|
|
$
|
22,997
|
|
|
Money market
|
|
|
12,388
|
|
|
|
12,317
|
|
|
Other
|
|
|
5,601
|
|
|
|
7,231
|
|
|
Total deposits
|
|
|
46,667
|
|
|
|
42,545
|
|
|
Other liabilities
|
|
|
12,540
|
|
|
|
10,833
|
|
|
Capital
|
|
|
7,893
|
|
|
|
8,902
|
|
|
Total liabilities and equity
|
|
$
|
67,100
|
|
|
$
|
62,280
|
|
|
|
|
|
|
|
|
|
|
|
|
Six months ended June 30
Dollars in millions, except as noted
|
|
2011
|
|
|
2010
|
|
|
P
ERFORMANCE
R
ATIOS
|
|
|
|
|
|
|
|
|
|
Return on average capital
|
|
|
22
|
%
|
|
|
18
|
%
|
|
Return on average assets
|
|
|
2.28
|
|
|
|
2.10
|
|
|
Noninterest income to total revenue
|
|
|
28
|
|
|
|
27
|
|
|
Efficiency
|
|
|
39
|
|
|
|
35
|
|
|
C
OMMERCIAL
M
ORTGAGE
S
ERVICING
P
ORTFOLIO
(in
billions)
|
|
|
|
|
|
|
|
|
|
Beginning of period
|
|
$
|
266
|
|
|
$
|
287
|
|
|
Acquisitions/additions
|
|
|
23
|
|
|
|
15
|
|
|
Repayments/transfers
|
|
|
(21
|
)
|
|
|
(37
|
)
|
|
End of period
|
|
$
|
268
|
|
|
$
|
265
|
|
|
O
THER
I
NFORMATION
|
|
|
|
|
|
|
|
|
|
Consolidated revenue from: (a)
|
|
|
|
|
|
|
|
|
|
Treasury Management
|
|
$
|
593
|
|
|
$
|
595
|
|
|
Capital Markets
|
|
$
|
304
|
|
|
$
|
285
|
|
|
Commercial mortgage loans held for sale (b)
|
|
$
|
52
|
|
|
$
|
25
|
|
|
Commercial mortgage loan servicing income, net of amortization (c)
|
|
|
76
|
|
|
|
155
|
|
|
Commercial mortgage servicing rights (impairment)/recovery
|
|
|
(75
|
)
|
|
|
(18
|
)
|
|
Total commercial mortgage banking activities
|
|
$
|
53
|
|
|
$
|
162
|
|
|
Total loans (d)
|
|
$
|
66,142
|
|
|
$
|
63,994
|
|
|
Credit-related statistics:
|
|
|
|
|
|
|
|
|
|
Nonperforming assets (d) (e)
|
|
$
|
2,260
|
|
|
$
|
3,103
|
|
|
Impaired loans (d) (f)
|
|
$
|
603
|
|
|
$
|
923
|
|
|
Net charge-offs
|
|
$
|
238
|
|
|
$
|
514
|
|
|
Net carrying amount of commercial mortgage servicing rights (d)
|
|
$
|
592
|
|
|
$
|
722
|
|
|
(a)
|
Represents consolidated PNC amounts.
|
|
(b)
|
Includes valuations on commercial mortgage loans held for sale and related commitments, derivative valuations, origination fees, gains on sale of loans held for sale
and net interest income on loans held for sale.
|
|
(c)
|
Includes net interest income and noninterest income from loan servicing and ancillary services, net of commercial mortgage servicing rights amortization. Commercial
mortgage servicing rights (impairment)/recovery is shown separately. Higher amortization and impairment charges in 2011 were due primarily to decreased interest rates and related prepayments by borrowers.
|
|
(e)
|
Includes nonperforming loans of $2.1 billion at June 30, 2011 and $3.0 billion at June 30, 2010.
|
|
(f)
|
Recorded investment of purchased impaired loans related to acquisitions.
|
Corporate & Institutional Banking earned $880 million in the first six months of 2011 compared with $816 million in the first six months of 2010. The increase in earnings was due to lower
provision for credit losses, somewhat offset by declines in net interest income and revenue from commercial mortgage banking activities. We continued to focus on adding new clients and increased our cross selling to serve our clients’ needs,
particularly in the western markets, and remained committed to strong expense discipline.
Highlights of Corporate & Institutional
Banking performance include:
|
|
•
|
|
Overall results benefited from successful sales efforts to new clients and product penetration of the existing customer base. New client acquisitions
in our Corporate Banking business were on pace to exceed
|
28
|
|
|
the 1,000 new primary client goal for the year and increased 29% compared to the first half of 2010.
|
|
|
•
|
|
Loan commitments, primarily in our Healthcare, Public Finance and Business Credit businesses, grew from the second quarter of 2010 due to new clients
and higher commitments to selected existing clients.
|
|
|
•
|
|
Average loans grew over $1 billion from the second quarter of 2010, and over $1.5 billion from the first quarter of 2011.
|
|
|
•
|
|
Our Treasury Management business, which is one of the top providers in the country, continued to invest in markets, products and infrastructure as well
as major initiatives such as healthcare. The healthcare initiative is designed to help provide our customers opportunities to reduce operating costs.
|
|
|
•
|
|
Cross sales of treasury management and capital markets products to customers in PNC’s western markets continued to be successful and were ahead of
both target and the first half of 2010 levels.
|
|
|
•
|
|
Midland Loan Services, one of the leading third-party providers of servicing for the commercial real estate industry, received the highest U.S.
servicer and special servicer ratings from Fitch Ratings and Standard & Poor’s and is in its 11th consecutive year of achieving these ratings.
|
|
|
•
|
|
Midland was the number one servicer of FNMA and FHLMC loans and was the second leading servicer of commercial and multifamily loans by volume as of
December 31, 2010 according to Mortgage Bankers Association.
|
|
|
•
|
|
Mergers and Acquisitions Journal named Harris Williams & Co. Advisor of the Year in its March 2011 issue.
|
Net interest income for the first six months of 2011 was $1.6 billion, a 10% decline from the first six months of 2010, reflecting lower purchase
accounting accretion, lower interest credits assigned to deposits and a decrease in average loans, partially offset by improved loan spreads and an increase in average deposits.
Corporate service fees were $384 million for the first half of 2011, a decrease of $95 million from the first half of 2010, primarily due to a reduction in the value of commercial mortgage servicing
rights largely driven by higher loan prepayment rates and lower interest rates, and lower ancillary commercial mortgage servicing fees. The major components of corporate service fees are treasury management, corporate finance fees and commercial
mortgage servicing revenue.
Other noninterest income was $247 million for the first six months of 2011 compared with $188 million in the
first six months of 2010. The increase of $59 million was primarily due to valuations associated with the commercial mortgage held-for-sale portfolio and client-related trading positions.
The provision for credit losses was $1 million in the first half of 2011 compared with $333 million in the
first half of 2010. The improvement reflected continued positive migration in portfolio credit quality along with lower loan levels. Net charge-offs for the first six months of 2011 of $238 million decreased $276 million, or 54%, compared with the
2010 period. The decline was attributable primarily to the commercial real estate and equipment finance portfolios. Nonperforming assets declined for the fifth consecutive quarter.
Noninterest expense was $888 million in the first six months of 2011, up 2% compared with the same period a year ago. Higher compensation-related costs and higher FDIC expenses, due to an FDIC required
methodology change, were partially offset by the sale of a duplicative agency servicing operation in the second quarter of 2010.
Average
loans were $64.7 billion for the first half of 2011 compared with $65.3 billion in the first half of 2010, a decline of 1%.
|
|
•
|
|
Our Corporate Banking business provides lending, treasury management, and capital markets-related products and services to mid-sized corporations,
government and not-for-profit entities and selectively to large corporations. Average loans for this business increased in the first six months of 2011 compared with the first six months of 2010. Loan commitments have increased since the second
quarter of 2010 due to the impact of new customers and increased demand. As a result, average loans increased 4% in the second quarter of 2011 compared with the second quarter of 2010.
|
|
|
•
|
|
PNC Real Estate provides commercial real estate and real-estate related lending and is one of the industry’s top providers of both conventional
and affordable multifamily financing. Commercial real estate loans declined in the first six months of 2011 compared with the first six months of 2010 due to loan sales, paydowns and charge-offs.
|
|
|
•
|
|
PNC Business Credit is one of the top asset-based lenders in the country. It expanded its operations with the acquisition of an asset-based lending
group in the United Kingdom which was completed in November 2010. Total loans acquired were approximately $300 million. Loan commitments and loan utilization rates increased throughout 2010 and into the first half of 2011.
|
|
|
•
|
|
PNC Equipment Finance is the 4th largest bank-affiliated leasing company with $9 billion in equipment finance assets. Spot loans and leases declined
$.4 billion in the first six months of 2011 compared with the first six months of 2010 due to
|
29
|
|
|
runoff and sales of non-strategic portfolios, which offset portfolio acquisitions and improved origination volumes within our middle market customer base.
|
Average deposits were $46.7 billion for the first six months of 2011, an increase of $4.1 billion, or 10%, compared with the first six months of 2010.
Our customers have continued to move balances to noninterest-bearing demand deposits to maintain liquidity.
The commercial mortgage servicing portfolio was $268 billion at June 30, 2011 compared with $265
billion at June 30, 2010. The increase was largely the result of purchased servicing net of portfolio run-off.
See the additional
revenue discussion regarding treasury management, capital markets-related products and services, and commercial mortgage banking activities in the Product Revenue section of the Consolidated Income Statement Review.
30
A
SSET
M
ANAGEMENT
G
ROUP
(Unaudited)
|
|
|
|
|
|
|
|
|
|
|
Six months ended June 30
Dollars in millions, except as noted
|
|
2011
|
|
|
2010
|
|
|
I
NCOME
S
TATEMENT
|
|
|
|
|
|
|
|
|
|
Net interest income
|
|
$
|
119
|
|
|
$
|
125
|
|
|
Noninterest income
|
|
|
329
|
|
|
|
319
|
|
|
Total revenue
|
|
|
448
|
|
|
|
444
|
|
|
Provision for credit losses (benefit)
|
|
|
(24
|
)
|
|
|
23
|
|
|
Noninterest expense
|
|
|
328
|
|
|
|
316
|
|
|
Pretax earnings
|
|
|
144
|
|
|
|
105
|
|
|
Income taxes
|
|
|
53
|
|
|
|
39
|
|
|
Earnings
|
|
$
|
91
|
|
|
$
|
66
|
|
|
A
VERAGE
B
ALANCE
S
HEET
|
|
|
|
|
|
|
|
|
|
Loans
|
|
|
|
|
|
|
|
|
|
Consumer
|
|
$
|
4,062
|
|
|
$
|
3,998
|
|
|
Commercial and commercial real estate
|
|
|
1,395
|
|
|
|
1,432
|
|
|
Residential mortgage
|
|
|
713
|
|
|
|
939
|
|
|
Total loans
|
|
|
6,170
|
|
|
|
6,369
|
|
|
Goodwill and other intangible assets
|
|
|
370
|
|
|
|
409
|
|
|
Other assets
|
|
|
246
|
|
|
|
238
|
|
|
Total assets
|
|
$
|
6,786
|
|
|
$
|
7,016
|
|
|
Deposits
|
|
|
|
|
|
|
|
|
|
Noninterest-bearing demand
|
|
$
|
1,112
|
|
|
$
|
1,249
|
|
|
Interest-bearing demand
|
|
|
2,301
|
|
|
|
1,717
|
|
|
Money market
|
|
|
3,577
|
|
|
|
3,239
|
|
|
Total transaction deposits
|
|
|
6,990
|
|
|
|
6,205
|
|
|
CDs/IRAs/savings deposits
|
|
|
664
|
|
|
|
793
|
|
|
Total deposits
|
|
|
7,654
|
|
|
|
6,998
|
|
|
Other liabilities
|
|
|
70
|
|
|
|
102
|
|
|
Capital
|
|
|
349
|
|
|
|
408
|
|
|
Total liabilities and equity
|
|
$
|
8,073
|
|
|
$
|
7,508
|
|
|
P
ERFORMANCE
R
ATIOS
|
|
|
|
|
|
|
|
|
|
Return on average capital
|
|
|
53
|
%
|
|
|
33
|
%
|
|
Return on average assets
|
|
|
2.70
|
|
|
|
1.90
|
|
|
Noninterest income to total revenue
|
|
|
73
|
|
|
|
72
|
|
|
Efficiency
|
|
|
73
|
|
|
|
71
|
|
|
O
THER
I
NFORMATION
|
|
|
|
|
|
|
|
|
|
Total nonperforming assets (a) (b)
|
|
$
|
69
|
|
|
$
|
114
|
|
|
Impaired loans (a) (c)
|
|
$
|
135
|
|
|
$
|
182
|
|
|
Total net charge-offs (recoveries)
|
|
$
|
(11
|
)
|
|
$
|
20
|
|
|
A
SSETS
U
NDER
A
DMINISTRATION
(in billions)
(a) (d)
|
|
|
|
|
|
|
|
|
|
Personal
|
|
$
|
102
|
|
|
$
|
92
|
|
|
Institutional
|
|
|
117
|
|
|
|
107
|
|
|
Total
|
|
$
|
219
|
|
|
$
|
199
|
|
|
Asset Type
|
|
|
|
|
|
|
|
|
|
Equity
|
|
$
|
121
|
|
|
$
|
98
|
|
|
Fixed Income
|
|
|
65
|
|
|
|
64
|
|
|
Liquidity/Other
|
|
|
33
|
|
|
|
37
|
|
|
Total
|
|
$
|
219
|
|
|
$
|
199
|
|
|
Discretionary assets under management
|
|
|
|
|
|
|
|
|
|
Personal
|
|
$
|
70
|
|
|
$
|
65
|
|
|
Institutional
|
|
|
39
|
|
|
|
34
|
|
|
Total
|
|
$
|
109
|
|
|
$
|
99
|
|
|
Asset Type
|
|
|
|
|
|
|
|
|
|
Equity
|
|
$
|
56
|
|
|
$
|
46
|
|
|
Fixed Income
|
|
|
37
|
|
|
|
36
|
|
|
Liquidity/Other
|
|
|
16
|
|
|
|
17
|
|
|
Total
|
|
$
|
109
|
|
|
$
|
99
|
|
|
Nondiscretionary assets under administration
|
|
|
|
|
|
|
|
|
|
Personal
|
|
$
|
32
|
|
|
$
|
27
|
|
|
Institutional
|
|
|
78
|
|
|
|
73
|
|
|
Total
|
|
$
|
110
|
|
|
$
|
100
|
|
|
Asset Type
|
|
|
|
|
|
|
|
|
|
Equity
|
|
$
|
65
|
|
|
$
|
52
|
|
|
Fixed Income
|
|
|
28
|
|
|
|
28
|
|
|
Liquidity/Other
|
|
|
17
|
|
|
|
20
|
|
|
Total
|
|
$
|
110
|
|
|
$
|
100
|
|
|
(b)
|
Includes nonperforming loans of $64 million at June 30, 2011 and $106 million at June 30, 2010.
|
|
(c)
|
Recorded investment of purchased impaired loans related to acquisitions.
|
|
(d)
|
Excludes brokerage account assets.
|
Asset
Management Group earned $91 million in the first six months of 2011 compared with $66 million in the first six months of 2010. Earnings for the first half of 2011 reflected a benefit from the provision for credit losses and growth in noninterest
income as assets under administration increased to $219 billion, a 10% increase over June 30, 2010. The business remained focused on its core strategies to drive growth, including: increasing channel penetration; investing in higher growth
geographies; and investing in differentiated client facing technology.
Highlights of Asset Management Group’s performance during the
first half of 2011 include the following:
|
|
•
|
|
Record level new sales production, including a 50% increase in year-over-year acquisition of new high value clients;
|
|
|
•
|
|
Referral sales from other PNC lines of business double the level for the comparable 2010 period;
|
|
|
•
|
|
Year to date positive net flows of $3.4 billion in total assets under administration;
|
|
|
•
|
|
150 external new hires primarily driven by front line talent acquisition; and
|
|
|
•
|
|
Pilot of new online Wealth Management client reporting tool.
|
Assets under administration were $219 billion at June 30, 2011 compared with $199 billion at June 30, 2010. Discretionary assets under management were $109 billion at June 30, 2011 compared with $99
billion at June 30, 2010. The 10% increase in the comparisons was driven by higher equity markets, strong sales performance and client retention.
Total revenue for the first six months of 2011 was $448 million compared with $444 million for the same period in 2010. Net interest income was $119 million for the first half of 2011 compared with $125
million in the first half of 2010. The decrease was attributable to lower loan yields and lower interest credits assigned to deposits, which were reflective of the current low rate environment. Noninterest income was $329 million for the first six
months of 2011, up $10 million from the prior year period due to higher asset values from stronger equity markets and new client acquisition. Noninterest income in the prior year period benefitted from approximately $19 million of tax, termination,
integration, and litigation related items that were not repeated in the current year period. Excluding these items in the comparison, total noninterest income grew 10%.
Provision for credit losses was a benefit of $24 million in the first half of 2011 reflecting improved credit quality compared with provision of $23 million for the first half of 2010. A net recovery of
$11 million was recognized for the first six months of 2011 compared with net charge-offs of $20 million in the first six months of 2010.
31
Noninterest expense was $328 million in the first six months of 2011, an increase of $12 million or 4% from
the prior year period. The increase was attributable to investments in the business to drive growth and higher compensation-related costs. Asset Management Group remains focused on disciplined expense management as it invests in these strategic
growth opportunities.
Average deposits for the first half of 2011 increased $656 million, or 9%, over the prior year first half.
Average transaction deposits grew 13% compared with the first six months of 2010 and were partially offset by the strategic run off of higher rate certificates of deposit in the comparison. Average loan balances decreased $199 million, or 3%, from
the prior year first half primarily due to credit risk management activities within the portfolio offsetting new client acquisition.
32
R
ESIDENTIAL
M
ORTGAGE
B
ANKING
(Unaudited)
|
|
|
|
|
|
|
|
|
|
|
Six months ended June 30
Dollars in millions, except as noted
|
|
2011
|
|
|
2010
|
|
|
I
NCOME
S
TATEMENT
|
|
|
|
|
|
|
|
|
|
Net interest income
|
|
$
|
103
|
|
|
$
|
144
|
|
|
Noninterest income
|
|
|
|
|
|
|
|
|
|
Loan servicing revenue
|
|
|
|
|
|
|
|
|
|
Servicing fees
|
|
|
113
|
|
|
|
135
|
|
|
Net MSR hedging gains
|
|
|
116
|
|
|
|
112
|
|
|
Loan sales revenue
|
|
|
136
|
|
|
|
88
|
|
|
Other
|
|
|
9
|
|
|
|
1
|
|
|
Total noninterest income
|
|
|
374
|
|
|
|
336
|
|
|
Total revenue
|
|
|
477
|
|
|
|
480
|
|
|
Provision for credit losses (benefit)
|
|
|
|
|
|
|
(24
|
)
|
|
Noninterest expense
|
|
|
277
|
|
|
|
229
|
|
|
Pretax earnings
|
|
|
200
|
|
|
|
275
|
|
|
Income taxes
|
|
|
74
|
|
|
|
106
|
|
|
Earnings
|
|
$
|
126
|
|
|
$
|
169
|
|
|
A
VERAGE
B
ALANCE
S
HEET
|
|
|
|
|
|
|
|
|
|
Portfolio loans
|
|
$
|
2,718
|
|
|
$
|
2,679
|
|
|
Loans held for sale
|
|
|
1,632
|
|
|
|
1,062
|
|
|
Mortgage servicing rights (MSR)
|
|
|
1,037
|
|
|
|
1,173
|
|
|
Other assets
|
|
|
5,831
|
|
|
|
3,856
|
|
|
Total assets
|
|
$
|
11,218
|
|
|
$
|
8,770
|
|
|
Deposits
|
|
$
|
1,578
|
|
|
$
|
3,344
|
|
|
Borrowings and other liabilities
|
|
|
3,696
|
|
|
|
2,550
|
|
|
Capital
|
|
|
698
|
|
|
|
1,085
|
|
|
Total liabilities and equity
|
|
$
|
5,972
|
|
|
$
|
6,979
|
|
|
P
ERFORMANCE
R
ATIOS
|
|
|
|
|
|
|
|
|
|
Return on average capital
|
|
|
36
|
%
|
|
|
31
|
%
|
|
Return on average assets
|
|
|
2.27
|
%
|
|
|
3.89
|
%
|
|
Noninterest income to total revenue
|
|
|
78
|
%
|
|
|
70
|
%
|
|
Efficiency
|
|
|
58
|
%
|
|
|
48
|
%
|
|
R
ESIDENTIAL
M
ORTGAGE
S
ERVICING
P
ORTFOLIO
(in
billions)
|
|
|
|
|
|
|
|
|
|
Beginning of period
|
|
$
|
125
|
|
|
$
|
145
|
|
|
Acquisitions
|
|
|
5
|
|
|
|
|
|
|
Additions
|
|
|
7
|
|
|
|
4
|
|
|
Repayments/transfers
|
|
|
(12
|
)
|
|
|
(12
|
)
|
|
End of period
|
|
$
|
125
|
|
|
$
|
137
|
|
|
Servicing portfolio statistics: (a)
|
|
|
|
|
|
|
|
|
|
Fixed rate
|
|
|
90
|
%
|
|
|
89
|
%
|
|
Adjustable rate/balloon
|
|
|
10
|
%
|
|
|
11
|
%
|
|
Weighted average interest rate
|
|
|
5.49
|
%
|
|
|
5.74
|
%
|
|
MSR capitalized value (in billions)
|
|
$
|
1.0
|
|
|
$
|
1.0
|
|
|
MSR capitalization value (in basis points)
|
|
|
80
|
|
|
|
71
|
|
|
Weighted average servicing fee (in basis points)
|
|
|
29
|
|
|
|
30
|
|
|
O
THER
I
NFORMATION
|
|
|
|
|
|
|
|
|
|
Loan origination volume (in billions)
|
|
$
|
5.8
|
|
|
$
|
4.3
|
|
|
Percentage of originations represented by:
|
|
|
|
|
|
|
|
|
|
Agency and government programs
|
|
|
100
|
%
|
|
|
99
|
%
|
|
Refinance volume
|
|
|
77
|
%
|
|
|
65
|
%
|
|
Total nonperforming assets (a) (b)
|
|
$
|
65
|
|
|
$
|
160
|
|
|
Impaired loans (a) (c)
|
|
$
|
141
|
|
|
$
|
168
|
|
|
(b)
|
Includes nonperforming loans of $10 million at June 30, 2011 and $101 million at June 30, 2010.
|
|
(c)
|
Recorded investment of purchased impaired loans related to acquisitions.
|
Residential Mortgage Banking earned $126 million in the first six months of 2011 compared with $169 million in the first six months of 2010. Earnings declined from the prior year period primarily as a
result of higher noninterest expense, lower net interest income, a benefit from the provision for credit losses in the first six months of 2010, and lower servicing fees offset partially by increased loan sales revenue.
Residential Mortgage Banking overview:
|
|
•
|
|
Total loan originations were $5.8 billion for the first half of 2011 compared with $4.3 billion in the first half of 2010. Refinance volume increased
compared to the 2010 period. Loans continue to be originated primarily through direct channels under FNMA, FHLMC and FHA/VA agency guidelines.
|
|
|
•
|
|
Investors may request PNC to indemnify them against losses on certain loans or to repurchase loans that they believe do not comply with applicable
contractual loan origination covenants and representations and warranties we have made. At June 30, 2011, the liability for estimated losses on repurchase and indemnification claims for the Residential Mortgage Banking business segment was $95
million compared with $159 million at June 30, 2010. See the Recourse And Repurchase Obligations section of this Financial Review and Note 17 Commitments and Guarantees in the Notes To Consolidated Financial Statements of this Report for
additional information.
|
|
|
•
|
|
Residential mortgage loans serviced for others totaled $125 billion at June 30, 2011 compared with $137 billion at June 30, 2010 as payoffs
continued to outpace new direct loan origination volume.
|
|
|
•
|
|
Noninterest income was $374 million in the first six months of 2011 compared with $336 million in the first six months of 2010. The increase resulted
from higher loan sales revenue driven by higher loan origination volume, partially offset by lower loan servicing revenue.
|
|
|
•
|
|
Net interest income was $103 million in the first half of 2011 compared with $144 million in the first half of 2010. The decrease in the comparison was
primarily due to lower interest earned on escrow deposits.
|
|
|
•
|
|
Noninterest expense was $277 million in the first six months of 2011 compared with $229 million in the first six months of 2010. The increase from the
prior year period was driven by higher loan origination volume and higher foreclosure-related expenses.
|
|
|
•
|
|
The fair value of mortgage servicing rights was $1.0 billion at both June 30, 2011 and June 30, 2010.
|
33
B
LACK
R
OCK
(Unaudited)
Information related to our
equity investment in BlackRock follows:
|
|
|
|
|
|
|
|
|
|
|
Six months ended June 30
Dollars in millions
|
|
2011
|
|
|
2010
|
|
|
Business segment earnings (a)
|
|
$
|
179
|
|
|
$
|
154
|
|
|
PNC’s economic interest in BlackRock (b)
|
|
|
22
|
%
|
|
|
24
|
%
|
|
(a)
|
Includes PNC’s share of BlackRock’s reported GAAP earnings and additional income taxes on those earnings incurred by PNC.
|
|
|
|
|
|
|
|
|
|
|
|
In billions
|
|
June 30
2011
|
|
|
Dec. 31
2010
|
|
|
Carrying value of PNC’s investment in BlackRock (c)
|
|
$
|
5.2
|
|
|
$
|
5.1
|
|
|
Market value of PNC’s investment in BlackRock (d)
|
|
|
6.9
|
|
|
|
6.9
|
|
|
(c)
|
The June 30, 2011 amount is comprised of our equity investment of $5,158 million and $14 million of goodwill and accumulated other comprehensive income related to
our BlackRock investment. The comparable amounts at December 31, 2010 were $5,017 million and $37 million.
|
|
|
PNC accounts for its investment in BlackRock under the equity method of accounting, exclusive of a related deferred tax liability of $1.8 billion at both June 30,
2011 and December 31, 2010.
|
|
(d)
|
Does not include liquidity discount.
|
PNC
accounts for its BlackRock Series C Preferred Stock at fair value, which offsets the impact of marking-to-market the obligation to deliver these shares to BlackRock to help fund BlackRock LTIP programs. The fair value amount of the BlackRock Series
C Preferred Stock is included on our Consolidated Balance Sheet in the caption Other assets. Additional information regarding the valuation of the BlackRock Series C Preferred Stock is included in Note 8 Fair Value in the Notes To Consolidated
Financial Statements of this Report.
PNC accounts for its remaining investment in BlackRock under the equity method of accounting. Our
percentage ownership of BlackRock common stock (approximately 25% at June 30, 2011) is higher than our overall share of BlackRock’s equity and earnings.
Our 2010 Form 10-K includes additional information about our investment in BlackRock, including BlackRock’s November 2010 secondary common stock offering and our sale of a portion of our shares of
BlackRock common stock in that offering.
D
ISTRESSED
A
SSETS
P
ORTFOLIO
(Unaudited)
|
|
|
|
|
|
|
|
|
|
|
Six months ended June 30
Dollars in millions, except as noted
|
|
2011
|
|
|
2010
|
|
|
I
NCOME
S
TATEMENT
|
|
|
|
|
|
|
|
|
|
Net interest income
|
|
$
|
493
|
|
|
$
|
690
|
|
|
Noninterest income
|
|
|
22
|
|
|
|
(2
|
)
|
|
Total revenue
|
|
|
515
|
|
|
|
688
|
|
|
Provision for credit losses
|
|
|
233
|
|
|
|
569
|
|
|
Noninterest expense
|
|
|
109
|
|
|
|
123
|
|
|
Pretax earnings (loss)
|
|
|
173
|
|
|
|
(4
|
)
|
|
Income taxes
|
|
|
64
|
|
|
|
2
|
|
|
Earnings (loss)
|
|
$
|
109
|
|
|
$
|
(6
|
)
|
|
A
VERAGE
B
ALANCE
S
HEET
|
|
|
|
|
|
|
|
|
|
Commercial Lending:
|
|
|
|
|
|
|
|
|
|
Commercial/Commercial real estate
|
|
$
|
1,477
|
|
|
$
|
2,520
|
|
|
Lease financing
|
|
|
727
|
|
|
|
805
|
|
|
Total commercial lending
|
|
|
2,204
|
|
|
|
3,325
|
|
|
Consumer Lending:
|
|
|
|
|
|
|
|
|
|
Consumer
|
|
|
5,429
|
|
|
|
6,461
|
|
|
Residential real estate
|
|
|
6,293
|
|
|
|
8,155
|
|
|
Total consumer lending
|
|
|
11,722
|
|
|
|
14,616
|
|
|
Total portfolio loans
|
|
|
13,926
|
|
|
|
17,941
|
|
|
Other assets (e)
|
|
|
(183
|
)
|
|
|
1,068
|
|
|
Total assets
|
|
$
|
13,743
|
|
|
$
|
19,009
|
|
|
Deposits
|
|
|
|
|
|
$
|
133
|
|
|
Other liabilities
|
|
$
|
148
|
|
|
|
66
|
|
|
Capital
|
|
|
1,397
|
|
|
|
1,702
|
|
|
Total liabilities and equity
|
|
$
|
1,545
|
|
|
$
|
1,901
|
|
|
P
ERFORMANCE
R
ATIOS
|
|
|
|
|
|
|
|
|
|
Return on average capital
|
|
|
16
|
%
|
|
|
(1
|
)%
|
|
Return on average assets
|
|
|
1.60
|
|
|
|
(.06
|
)
|
|
O
THER
I
NFORMATION
|
|
|
|
|
|
|
|
|
|
Nonperforming assets (a) (b)
|
|
$
|
1,087
|
|
|
$
|
1,435
|
|
|
Impaired loans (a) (c)
|
|
$
|
5,543
|
|
|
$
|
6,867
|
|
|
Net charge-offs (d)
|
|
$
|
219
|
|
|
$
|
387
|
|
|
Annualized net charge-off ratio (d)
|
|
|
3.17
|
%
|
|
|
4.35
|
%
|
|
L
OANS
(a)
|
|
|
|
|
|
|
|
|
|
Commercial Lending
|
|
|
|
|
|
|
|
|
|
Commercial/Commercial real estate
|
|
$
|
1,222
|
|
|
$
|
2,282
|
|
|
Lease financing
|
|
|
701
|
|
|
|
757
|
|
|
Total commercial lending
|
|
|
1,923
|
|
|
|
3,039
|
|
|
Consumer Lending
|
|
|
|
|
|
|
|
|
|
Consumer
|
|
|
5,240
|
|
|
|
6,323
|
|
|
Residential real estate
|
|
|
6,250
|
|
|
|
7,911
|
|
|
Total consumer lending
|
|
|
11,490
|
|
|
|
14,234
|
|
|
Total loans
|
|
$
|
13,413
|
|
|
$
|
17,273
|
|
|
(b)
|
Includes nonperforming loans of $.8 billion at June 30, 2011 and $1.0 billion at June 30, 2010.
|
|
(c)
|
Recorded investment of purchased impaired loans related to acquisitions. At June 30, 2011, this segment contained 76% of PNC’s purchased impaired loans.
|
|
(d)
|
For the six months ended June 30.
|
|
(e)
|
Other assets includes deferred taxes and loan reserves.
|
This business segment consists primarily of assets acquired with acquisitions for which we intend to run-off while maximizing our value. Distressed Assets Portfolio had
34
earnings of $109 million for the first six months of 2011 compared with a loss of $6 million in the first six months of 2010. The increase was driven primarily by a lower provision for credit
losses partially offset by a decline in net interest income.
Distressed Assets Portfolio overview:
|
|
•
|
|
Average loans declined to $13.9 billion in the first half of 2011 compared with $17.9 billion in the first half of 2010. The decline was impacted by
portfolio management activities to reduce under-performing assets.
|
|
|
•
|
|
Net interest income was $493 million in the first six months of 2011 compared with $690 million for the first six months of 2010. The decrease
reflected lower loan balances, both impaired and non-impaired.
|
|
|
•
|
|
Noninterest income was $22 million for the first half of 2011 compared with a loss of $2 million for the first half of 2010. The increase from the
prior year was due primarily to funding a recourse liability in 2010 for estimated losses on repurchase and indemnification claims.
|
|
|
•
|
|
The provision for credit losses was $233 million in the first six months of 2011 compared with $569 million in the first six months of 2010. The
decline was driven primarily by lower losses in first mortgage and residential construction portfolios.
|
|
|
•
|
|
Noninterest expense for the first half of 2011 was $109 million compared with $123 million in the first half of 2010. The decrease was driven by a
reduction in loan servicing fees, non-credit losses and other real estate owned-related losses and expenses.
|
|
|
•
|
|
Nonperforming loans decreased to $.8 billion at June 30, 2011 compared with $1.0 billion at June 30, 2010. The consumer lending portfolio
comprised 53% of the nonperforming loans at June 30, 2011. Nonperforming consumer loans decreased $.1 billion.
|
|
|
•
|
|
Net charge-offs were $219 million for the first half of 2011 and $387 million for the first half of 2010. The decrease was a result of net charge-offs
taken in the second quarter 2010 related to sales of residential mortgage loans and a decrease in net charge-offs on the residential construction and first mortgage portfolios.
|
Certain loans in this business segment may require special servicing given current loan performance and market conditions. Consequently, the business
activities of this segment are focused on maximizing the value of the portfolio assigned to it while mitigating risk. Business intent drives the inclusion of assets in this business segment. Not all impaired loans are included in this business
segment, nor are all of the loans included in this business segment considered impaired.
|
|
•
|
|
The $13.4 billion of loans held in this portfolio at June 30, 2011 are stated inclusive of a fair value
|
|
|
|
adjustment on purchased impaired loans at acquisition. Taking the adjustment and the ALLL into account, the net carrying basis of this loan portfolio is 78% of customer outstandings.
|
|
|
•
|
|
Commercial Lending within the Distressed Assets Portfolio business segment is comprised of $1.2 billion in residential development loans (i.e.
condominiums, townhomes, developed and undeveloped land) primarily acquired from National City and $.7 billion of performing cross-border leases. This commercial lending portfolio has declined 37% since June 30, 2010. For the residential
development portfolio, a team of asset managers actively deploy workout strategies on this portfolio through reducing unfunded loan exposure, refinancing, customer payoffs, foreclosures and loan sales. The overall credit quality of this portfolio is
considered to be moderately better at June 30, 2011 compared with the beginning of 2010 based upon continuing dispositions of credits, improved economic conditions and increased activity in several markets. The cross-border lease portfolio
continues to demonstrate good credit quality.
|
|
|
•
|
|
The performance of the Consumer Lending portfolio is dependent upon economic growth, unemployment rates, the housing market recovery and the interest
rate environment. The portfolio’s credit quality performance has stabilized through actions taken by management over the last two years. Approximately 76% of customers have been current with principal and interest payments for the past 12
months. Currently, the portfolio yields over 7%. Consumer Lending consists of residential real estate mortgages and consumer or brokered home equity loans.
|
|
|
•
|
|
Residential real estate mortgages are primarily legacy National City, originate for sale programs (now discontinued) and acquired portfolios. The
residential real estate mortgage portfolio is composed of jumbo and ALT-A first lien mortgages, non-prime first and second lien mortgages and, to a lesser extent, residential construction loans. We have implemented internal and external programs to
proactively explore refinancing opportunities that would allow the borrower to qualify for a conforming mortgage loan which would be originated and sold by PNC or originated by a third-party originator. Also, loss mitigation programs have been
developed to help manage risk and assist borrowers to maintain homeownership, when possible.
|
|
|
•
|
|
Home equity loans include second liens and brokered home equity lines of credit. We have implemented several modification programs to assist the loss
mitigation teams that manage this risk. Additionally, we have initiated several voluntary and involuntary programs to reduce and/or block line availability on home equity lines of credit.
|
35
|
|
•
|
|
When loans are sold, investors may request PNC to indemnify them against losses or to repurchase loans that they believe do not comply with applicable
contractual loan origination covenants and representations and warranties we have made. From 2005 to 2007, home equity loans were sold with such contractual provisions. At June 30, 2011, the liability for estimated losses on repurchase and
indemnification claims for the Distressed Assets Portfolio business segment was $55 million. Additional reserves of $2.8 million were recorded in the first six months of 2011. See the Recourse And Repurchase Obligations section of this Financial
Review and Note 17 Commitments and Guarantees in the Notes To Consolidated Financial Statements included in this Report for additional information.
|
C
RITICAL
A
CCOUNTING
E
STIMATES
A
ND
J
UDGMENTS
Note 1 Accounting Policies in Part II, Item 8 of our 2010 Form 10-K and in the Notes To Consolidated Financial Statements included in Part I,
Item 1 of this Report describe the most significant accounting policies that we use. Certain of these policies require us to make estimates or economic assumptions that may prove inaccurate or be subject to variations that may significantly
affect our reported results and financial position for the period or in future periods.
We must use estimates, assumptions, and judgments
when assets and liabilities are required to be recorded at, or adjusted to reflect, fair value.
Assets and liabilities carried at fair value
inherently result in a higher degree of financial statement volatility. Fair values and the information used to record valuation adjustments for certain assets and liabilities are based on either quoted market prices or are provided by independent
third-party sources, including appraisers and valuation specialists, when available. When such third-party information is not available, we estimate fair value primarily by using cash flow and other financial modeling techniques. Changes in
underlying factors, assumptions, or estimates could materially impact our future financial condition and results of operations.
We discuss
the following critical accounting policies and judgments under this same heading in Part II, Item 7 of our 2010 Form 10-K:
|
|
•
|
|
Fair Value Measurements
|
|
|
•
|
|
Allowances For Loan And Lease Losses And Unfunded Loan Commitments And Letters of Credit
|
|
|
•
|
|
Estimated Cash Flows on Purchased Impaired Loans
|
|
|
•
|
|
Residential Mortgage Servicing Rights
|
Residential Mortgage Servicing Rights
In conjunction with the acquisition of National City, PNC acquired servicing rights for residential real estate loans. We have elected to measure these mortgage servicing rights (MSRs) at fair value. This
election was made to be consistent with our risk management strategy to hedge changes in the fair value of these assets as described below. The fair value of these MSRs is estimated by using a cash flow valuation model which calculates the present
value of estimated future net servicing cash flows, taking into consideration actual and expected mortgage loan prepayment rates, discount rates, servicing costs, and other economic factors which are determined based on current market conditions.
Assumptions incorporated into the valuation model reflect management’s best estimate of factors that a market participant would use in
valuing the MSR. Residential MSRs do not trade in an active, open market with readily observable prices. Although sales of MSRs do occur, the precise terms and conditions are not available. As a benchmark for the reasonableness of its MSR fair
value, PNC obtains servicing valuation opinions from independent parties (“brokers”). PNC compares its internally-developed MSR value to the range of opinions of value received from the brokers. If our MSR fair value falls outside of the
range, management will assess whether a valuation adjustment is warranted. We consider our MSR value to represent a reasonable estimate of fair value.
PNC employs a risk management strategy designed to protect the value of MSRs from changes in interest rates and related market factors. MSR values are economically hedged with securities and derivatives,
including interest-rate swaps, options, and forward mortgage-backed and futures contracts. As interest rates change, these financial instruments are expected to have changes in fair value negatively correlated to the change in fair value of the
hedged MSR portfolio. The hedge relationships are actively managed in response to changing market conditions over the life of the MSR assets. Selecting appropriate financial instruments to hedge MSR valuation risk requires significant management
judgment to assess how mortgage rates and prepayment speeds could affect the future values of MSRs. Hedging results can frequently be less predictable in the short term, but over longer periods of time are expected to protect the economic value of
the MSR portfolio.
The fair value of residential MSRs and significant inputs to the valuation model as of June 30, 2011 are shown in the
table below. The expected and actual rates of mortgage loan prepayments are the most significant factors driving the fair value. Management uses a third party model to estimate future loan prepayments. This model has been refined based on historical
performance of PNC’s managed portfolio, as
36
adjusted for current market conditions. Future interest rates are another important factor in the valuation of MSRs. Management utilizes market implied forward interest rates to estimate the
future direction of mortgage and discount rates. The forward rates utilized are derived from the current yield curve for U.S. dollar interest rate swaps and are consistent with pricing of capital markets instruments. Changes in the shape and slope
of the forward curve in future periods may result in volatility in the fair value estimate.
|
|
|
|
|
|
|
|
|
|
|
Dollars in millions
|
|
June 30,
2011
|
|
|
December 31,
2010
|
|
|
Fair value
|
|
$
|
996
|
|
|
$
|
1,033
|
|
|
Weighted-average life (in years) (a)
|
|
|
6.2
|
|
|
|
5.8
|
|
|
Weighted-average constant prepayment rate (a)
|
|
|
11.40
|
%
|
|
|
12.61
|
%
|
|
Spread over forward interest rate swap rates
|
|
|
11.71
|
%
|
|
|
12.18
|
%
|
|
(a)
|
Changes in weighted-average life and weighted-average constant prepayment rate reflect the cumulative impact of changes in rates, prepayment expectations and model
changes.
|
A sensitivity analysis of the hypothetical effect on the fair value of MSRs for adverse changes in key assumptions is
presented below. These sensitivities do not include the impact of the related hedging activities. Changes in fair value generally cannot be extrapolated because the relationship of the change in the assumption to the change in fair value may not be
linear. Also, the effect of a variation in a particular assumption on the fair value of the MSRs is calculated independently without changing any other assumption. In reality, changes in one factor may result in changes in another (for example,
changes in mortgage interest rates, which drive changes in prepayment rate estimates, could result in changes in the interest rate spread), which could either magnify or counteract the sensitivities.
|
|
|
|
|
|
|
|
|
|
|
Dollars in millions
|
|
June 30,
2011
|
|
|
December 31,
2010
|
|
|
Prepayment rate:
|
|
|
|
|
|
|
|
|
|
Decline in fair value from 10% adverse change
|
|
$
|
45
|
|
|
$
|
41
|
|
|
Decline in fair value from 20% adverse change
|
|
$
|
87
|
|
|
$
|
86
|
|
|
Spread over forward interest rate swap rates:
|
|
|
|
|
|
|
|
|
|
Decline in fair value from 10% adverse change
|
|
$
|
43
|
|
|
$
|
43
|
|
|
Decline in fair value from 20% adverse change
|
|
$
|
83
|
|
|
$
|
83
|
|
Recent Accounting Pronouncements
See Note 1 Accounting Policies in the Notes to the Consolidated Financial Statements of this Report regarding the impact of the adoption of new accounting guidance issued by the Financial Accounting
Standards Board.
S
TATUS
O
F
Q
UALIFIED
D
EFINED
B
ENEFIT
P
ENSION
P
LAN
We have a noncontributory, qualified defined
benefit pension plan (plan or pension plan) covering eligible employees. Benefits are determined using a cash balance formula where earnings credits are a percentage of eligible compensation. Pension contributions are based on an actuarially
determined amount necessary to fund total benefits payable to plan participants. Consistent with our investment strategy, plan assets are primarily invested in equity investments and fixed income instruments. Plan fiduciaries determine and review
the plan’s investment policy, which is described more fully in Note 14 Employee Benefit Plans in our 2010 Form 10-K.
We calculate the
expense associated with the pension plan and the assumptions and methods that we use include a policy of reflecting trust assets at their fair market value. On an annual basis, we review the actuarial assumptions related to the pension plan. The
primary assumptions used to measure pension obligations and costs are the discount rate, compensation increase and expected long-term return on assets. Among these, the compensation increase assumption does not significantly affect pension expense.
The discount rate used to measure pension obligations is determined by comparing the expected future benefits that will be paid under the
plan with yields available on high quality corporate bonds of similar duration. In lower interest rate environments, the sensitivity of pension expense to the assumed discount rate increases. The impact on pension expense of a 0.5% decrease in
discount rate in the current environment is $19 million. In contrast, the sensitivity to the same change in discount rate in a higher interest rate environment is less significant.
The expected long-term return on assets assumption also has a significant effect on pension expense. The expected return on plan assets is a long-term assumption established by considering historical and
anticipated returns of the asset classes invested in by the pension plan and the asset allocation policy currently in place. For purposes of setting and reviewing this assumption, “long term” refers to the period over which the plan’s
projected benefit obligations will be disbursed. We review this assumption at each measurement date and adjust it if warranted. Our selection process references certain historical data and the current environment, but primarily utilizes qualitative
judgment regarding future return expectations. Accordingly, we generally do not change the assumption unless we modify our investment strategy or identify events that would alter our expectations of future returns.
37
To evaluate the continued reasonableness of our assumption, we examine a variety of viewpoints and data.
Various studies have shown that portfolios comprised primarily of US equity securities have returned approximately 10% annually over long periods of time, while US debt securities have returned approximately 6% annually over long periods.
Application of these historical returns to the plan’s allocation ranges for equities and bonds produces a result between 7.25% and 8.75% and is one point of reference, among many other factors, that is taken into consideration. We also examine
the plan’s actual historical returns over various periods. Recent experience is considered in our evaluation with appropriate consideration that, especially for short time periods, recent returns are not reliable indicators of future returns.
While annual returns can vary significantly (rates of return for 2010, 2009, and 2008 were +14.87%, +20.61%, and -32.91%, respectively), the selected assumption represents our estimated long-term average prospective returns.
Acknowledging the potentially wide range for this assumption, we also annually examine the assumption used by other companies with similar pension
investment strategies, so that we can ascertain whether our determinations markedly differ from others. In all cases, however, this data simply informs our process, which places the greatest emphasis on our qualitative judgment of future investment
returns, given the conditions existing at each annual measurement date.
As more fully described in our 2010 Form 10-K, the expected long-term
return on plan assets for determining net periodic pension cost for 2011 is 7.75%, down from 8.00% in 2010.
Under current accounting rules,
the difference between expected long-term returns and actual returns is accumulated and amortized to pension expense over future periods. Each one percentage point difference in actual return compared with our expected return causes expense in
subsequent years to increase or decrease by up to $9 million as the impact is amortized into results of operations.
The table below reflects
the estimated effects on pension expense of certain changes in annual assumptions, using 2011 estimated expense as a baseline.
|
|
|
|
|
|
|
Change in Assumption (a)
|
|
Estimated
Increase to 2011
Pension
Expense
(In
millions)
|
|
|
.5% decrease in discount rate
|
|
$
|
19
|
|
|
.5% decrease in expected long-term return on assets
|
|
$
|
19
|
|
|
.5% increase in compensation rate
|
|
$
|
3
|
|
|
(a)
|
The impact is the effect of changing the specified assumption while holding all other assumptions constant.
|
We currently estimate a pretax pension expense of $3 million in 2011 compared with pretax expense of $46 million in 2010. This year-over-year expected
reduction is primarily due to the amortization impact of the favorable 2010 investment returns as compared with the expected long-term return assumption,
which has been established by considering the time over which the Plan’s obligations are expected to be paid.
Our pension plan contribution requirements are not particularly sensitive to actuarial assumptions. Investment performance has the most impact on contribution requirements and will drive the amount of
permitted contributions in future years. Also, current law, including the provisions of the Pension Protection Act of 2006, sets limits as to both minimum and maximum contributions to the plan. We do not expect to be required by law to make any
contributions to the plan during 2011.
We maintain other defined benefit plans that have a less significant effect on financial results,
including various nonqualified supplemental retirement plans for certain employees.
R
ECOURSE
A
ND
R
EPURCHASE
O
BLIGATIONS
As discussed in Note 3 Loan Sale and Servicing Activities and
Variable Interest Entities in our 2010 Form 10-K, PNC has sold commercial mortgage and residential mortgage loans directly or indirectly in securitizations and whole-loan sale transactions with continuing involvement. One form of continuing
involvement includes certain recourse and loan repurchase obligations associated with the transferred assets in these transactions.
C
OMMERCIAL
M
ORTGAGE
R
ECOURSE
O
BLIGATIONS
We originate, close, and service certain multi-family commercial mortgage loans which are sold to FNMA under FNMA’s Delegated Underwriting and
Servicing (DUS) program. We have similar arrangements with FHLMC.
Under these programs, we generally assume up to a one-third pari passu risk
of loss on unpaid principal balances through a loss share arrangement. At June 30, 2011 and December 31, 2010, the unpaid principal balance outstanding of loans sold as a participant in these programs was $13.0 billion and $13.2 billion,
respectively. At June 30, 2011 and December 31, 2010, the potential maximum exposure under the loss share arrangements was $3.9 billion and $4.0 billion, respectively. We maintain a reserve for estimated losses based on our exposure. The
reserve for losses under these programs totaled $55 million and $54 million as of June 30, 2011 and December 31, 2010, respectively, and is included in Other liabilities on our Consolidated Balance Sheet. If payment is required under these
programs, we would not have a contractual interest in the collateral underlying the mortgage loans on which losses occurred, although the value of the collateral is taken into account in determining our share of such losses. Our exposure and
activity associated with these recourse obligations are reported in the Corporate & Institutional Banking segment.
38
R
ESIDENTIAL
M
ORTGAGE
L
OAN
R
EPURCHASE
O
BLIGATIONS
While residential mortgage loans are sold on a non-recourse basis, we assume certain loan repurchase
obligations associated with mortgage loans we have sold to investors. These loan repurchase obligations primarily relate to situations where PNC is alleged to have breached certain origination covenants and representations and warranties made to
purchasers of the loans in the respective purchase and sale agreements. Residential mortgage loans covered by these loan repurchase obligations include first and second-lien mortgage loans we have sold through Agency securitizations, Non-Agency
securitizations, and whole-loan sale transactions. As discussed in Note 3 in our 2010 Form 10-K, Agency securitizations consist of mortgage loans sale transactions with FNMA, FHLMC, and the Government National Mortgage Association (GNMA) program,
while Non-Agency securitizations and whole-loan sale transactions consist of mortgage loans sale transactions with private investors. Our exposure and activity associated with Agency securitization repurchase obligations has primarily been related
to transactions with FNMA and FHLMC, as indemnification and repurchase losses associated with Federal Housing Agency (FHA) and Department of Veterans Affairs (VA)-insured loans pooled in GNMA securitizations historically have been minimal.
Repurchase obligation activity associated with residential mortgages is reported in the Residential Mortgage Banking segment.
PNC’s
residential mortgage loan repurchase obligations also include certain brokered home equity loans/lines that were sold to a limited number of private investors in the financial services industry by National City prior to our acquisition. PNC is no
longer engaged in the brokered home equity lending business, and our exposure under these loan repurchase obligations is limited to repurchases of the whole-loans sold in these transactions. Repurchase activity associated with brokered home equity
lines/loans are reported in the Distressed Assets Portfolio segment.
Loan covenants and representations and warranties are established
through loan sale agreements with various investors to provide assurance that PNC has sold loans to investors of sufficient investment quality. Key aspects of such covenants and representations and warranties include the loan’s compliance with
any applicable loan criteria established by the investor, including underwriting standards, delivery of all required loan documents to the investor or its designated party, sufficient collateral valuation, and the validity of the lien securing the
loan. As a result of alleged breaches of these contractual obligations, investors may request PNC to indemnify them against losses on certain loans or to repurchase loans.
Indemnifications for loss or loan repurchases typically occur when, after review of the claim, we agree
insufficient evidence exists to dispute the investor’s claim that a breach of a loan covenant and representation and warranty has occurred, such breach has not been cured, and the effect of such breach is deemed to have had a material and
adverse effect on the value of the transferred loan. Depending on the sale agreement and upon proper notice from the investor, we typically respond to such indemnification and repurchase requests within 60 days, although final resolution of the
claim may take a longer period of time. With the exception of the sales agreements associated with the Agency securitizations, most sale agreements do not provide for penalties or other remedies if we do not respond timely to investor
indemnification or repurchase requests.
Investor indemnification or repurchase claims are typically settled on an individual loan basis
through make-whole payments or loan repurchases; however, on occasion we may negotiate pooled settlements with investors. In connection with pooled settlements, we typically do not repurchase loans and the consummation of such transactions results
in us no longer having indemnification and repurchase exposure with the investor in the transaction.
The following table details the unpaid
principal balance of our unresolved indemnification and repurchase claims at June 30, 2011 and December 31, 2010.
Analysis of
Unresolved Asserted Indemnification and Repurchase Claims
|
|
|
|
|
|
|
|
|
|
|
In millions
|
|
June 30,
2011
|
|
|
Dec. 31,
2010
|
|
|
Residential mortgages:
|
|
|
|
|
|
|
|
|
|
Agency securitizations
|
|
$
|
204
|
|
|
$
|
110
|
|
|
Private investors (a)
|
|
|
65
|
|
|
|
100
|
|
|
|
|
|
|
Home equity loans/lines:
|
|
|
|
|
|
|
|
|
|
Private investors (b)
|
|
|
88
|
|
|
|
299
|
|
|
Total unresolved claims
|
|
$
|
357
|
|
|
$
|
509
|
|
|
(a)
|
Activity relates to loans sold through Non-Agency securitization and whole-loan sale transactions.
|
|
(b)
|
Activity relates to brokered home equity loans/lines sold through whole-loan sale transactions which occurred during 2005-2007.
|
To mitigate losses associated with indemnification and repurchase claims, we have established quality assurance programs designed to ensure loans sold
meet specific underwriting and origination criteria provided for in the investor sale agreements. In addition, we investigate every investor claim on a loan by loan basis to determine the existence of a legitimate claim, and that all other
conditions for indemnification or repurchase have been met prior to the settlement with an investor.
39
The table below details our indemnification and repurchase claim settlement activity during the first six
months and three months of 2011 and 2010. Any repurchased loan is appropriately considered in our asset quality loan disclosures and statistics.
Analysis of Indemnification and Repurchase Claim Settlement Activity
|
|
|
|
|
|
|
|
|
|
|
|
|
|
|
|
|
|
|
|
|
|
|
|
|
|
|
|
|
2011
|
|
|
2010
|
|
|
Six months ended June 30 - In millions
|
|
Unpaid
Principal
Balance (a)
|
|
|
Losses
Incurred (b)
|
|
|
Fair Value of
Repurchased
Loans (c)
|
|
|
Unpaid
Principal
Balance (a)
|
|
|
Losses
Incurred (b)
|
|
|
Fair Value of
Repurchased
Loans (c)
|
|
|
Residential mortgages (d):
|
|
|
|
|
|
|
|
|
|
|
|
|
|
|
|
|
|
|
|
|
|
|
|
|
|
Agency securitizations
|
|
$
|
110
|
|
|
$
|
54
|
|
|
$
|
42
|
|
|
$
|
180
|
|
|
$
|
76
|
|
|
$
|
68
|
|
|
Private investors (e)
|
|
|
56
|
|
|
|
30
|
|
|
|
12
|
|
|
|
87
|
|
|
|
44
|
|
|
|
24
|
|
|
|
|
|
|
|
|
|
|
Home equity loans/lines:
|
|
|
|
|
|
|
|
|
|
|
|
|
|
|
|
|
|
|
|
|
|
|
|
|
|
Private investors - Repurchases (f)
|
|
|
30
|
|
|
|
98
|
|
|
|
1
|
|
|
|
7
|
|
|
|
9
|
|
|
|
2
|
|
|
Total indemnification and repurchase settlements
|
|
$
|
196
|
|
|
$
|
182
|
|
|
$
|
55
|
|
|
$
|
274
|
|
|
$
|
129
|
|
|
$
|
94
|
|
|
|
|
|
|
|
|
|
|
|
|
|
|
|
|
|
|
|
|
|
|
|
|
|
|
|
|
|
|
2011
|
|
|
2010
|
|
|
Three months ended June 30 - In millions
|
|
Unpaid
Principal
Balance (a)
|
|
|
Losses
Incurred (b)
|
|
|
Fair Value of
Repurchased
Loans (c)
|
|
|
Unpaid
Principal
Balance (a)
|
|
|
Losses
Incurred (b)
|
|
|
Fair Value of
Repurchased
Loans (c)
|
|
|
Residential mortgages (d):
|
|
|
|
|
|
|
|
|
|
|
|
|
|
|
|
|
|
|
|
|
|
|
|
|
|
Agency securitizations
|
|
$
|
51
|
|
|
$
|
25
|
|
|
$
|
18
|
|
|
$
|
89
|
|
|
$
|
34
|
|
|
$
|
36
|
|
|
Private investors (e)
|
|
|
35
|
|
|
|
25
|
|
|
|
6
|
|
|
|
43
|
|
|
|
18
|
|
|
|
8
|
|
|
|
|
|
|
|
|
|
|
Home equity loans/lines:
|
|
|
|
|
|
|
|
|
|
|
|
|
|
|
|
|
|
|
|
|
|
|
|
|
|
Private investors - Repurchases (f)
|
|
|
8
|
|
|
|
76
|
|
|
|
1
|
|
|
|
6
|
|
|
|
8
|
|
|
|
2
|
|
|
Total indemnification and repurchase settlements
|
|
$
|
94
|
|
|
$
|
126
|
|
|
$
|
25
|
|
|
$
|
138
|
|
|
$
|
60
|
|
|
$
|
46
|
|
|
(a)
|
Represents unpaid principal balance of loans at the indemnification or repurchase date.
|
|
(b)
|
Represents both i) amounts paid for indemnification/settlement payments and ii) the difference between loan repurchase price and fair value of the loan at the
repurchase date. These losses are charged to the indemnification and repurchase liability.
|
|
(c)
|
Represents fair value of loans repurchased only as we have no exposure to changes in the fair value of loans or underlying collateral when indemnification/settlement
payments are made to investors.
|
|
(d)
|
Repurchase activity associated with insured loans, government-guaranteed loans, and loans repurchased through the exercise of our removal of account provision (ROAP)
option are excluded from this table. Refer to Note 3 in the Notes To Consolidated Financial Statements in this Report for further discussion of ROAPs.
|
|
(e)
|
Activity relates to loans sold through Non-Agency securitizations and whole-loan sale transactions.
|
|
(f)
|
Activity relates to brokered home equity loans/lines sold through whole-loan sale transactions which occurred during 2005-2007.
|
During 2010 and the first six months of 2011, unresolved and settled investor indemnification and
repurchase claims were primarily related to one of the following alleged breaches in representations and warranties: 1) misrepresentation of income, assets or employment; 2) property evaluation or status issues (e.g., appraisal, title, etc.); or 3)
underwriting guideline violations. During 2010, the frequency and timing of unresolved and settled investor indemnification and repurchase claims increased as a result of higher loan delinquencies which have been impacted by the deterioration in the
overall economy and the prolonged weak residential housing sector. The increased volume of claims was also reflective of an industry trend where investors implemented certain strategies to aggressively reduce their exposure to losses on purchased
loans. These same factors, along with an increase in the average time to resolve investor claims, have contributed to the higher balances of unresolved claims, primarily Agency securitizations, for residential mortgages at June 30, 2011. The
year-over-year second quarter 2011 decline in indemnification and repurchase settlements for residential mortgages resulted primarily from higher claim rescission rates. As the level of residential mortgage claims
increased over the past couple of years, management focused its efforts on improving its process to review and respond to these claims. The lower balance of unresolved indemnification and
repurchase claims for home equity loans/lines at June 30, 2011 was primarily attributed to pooled settlement activity and higher claim rescission rates during the first half of the year. Management also implemented enhancements to its process
of reviewing and responding to investor claims for this sold portfolio. The year-over-year increase in home equity indemnification and repurchase settlements was primarily attributed to the timing of when repurchases and pooled settlement activities
were executed.
For the first and second-lien mortgage balances of unresolved and settled claims contained in the tables above, a significant
amount of these claims were associated with sold loans originated through correspondent lender and broker origination channels. For the home equity loans/lines sold portfolio, all unresolved and settled claims relate to loans originated through the
broker origination channel. In certain instances when indemnification or repurchase claims are settled for these types of sold loans, we have recourse back to
40
the correspondent lenders, brokers and other third-parties (e.g., contract underwriting companies, closing agents, appraisers, etc.). Depending on the underlying reason for the investor claim, we
determine our ability to pursue recourse with these parties and file claims with them accordingly. Our historical recourse recovery rate has been insignificant as our efforts have been impacted by the inability of such parties to reimburse us for
their recourse obligations (e.g., their capital availability or whether they remain in business) or contractual limitations that limit our ability to pursue recourse with these parties (e.g., loss caps, statutes of limitations, etc.). These factors
as well as the trends in unresolved claim and indemnification and repurchase activity described above are considered in the determination of our estimated indemnification and repurchase liability detailed below.
Origination and sale of residential mortgages is an ongoing business activity and, accordingly, management continually assesses the need for
indemnification and repurchase liabilities pursuant to the associated investor sale agreements. We establish indemnification and repurchase liabilities for estimated losses on sold first and second-lien mortgages and home equity loans/lines for
which indemnification is expected to be provided or for loans that are expected to be repurchased. For the first and second-lien mortgage sold portfolio, we have established an indemnification and repurchase liability pursuant to investor sale
agreements based on claims made and our estimate of future claims on a loan by loan basis. These relate primarily to loans originated during 2006-2008. For the home equity loans/lines sold portfolio, we have established indemnification and
repurchase liabilities based upon this same methodology for loans sold during 2005-2007.
Indemnification and repurchase liabilities are
initially recognized when loans are sold to investors and are subsequently evaluated by management. Initial recognition and subsequent adjustments to the indemnification and repurchase liability for the sold residential mortgage portfolio are
recognized in Residential mortgage revenue on the Consolidated Income Statement. Since PNC is no longer engaged in the brokered home equity lending business, only subsequent adjustments are recognized to the home equity loans/lines indemnification
and repurchase liability. These adjustments are recognized in Other noninterest income on the Consolidated Income Statement.
Management’s subsequent evaluation of these indemnification and repurchase liabilities is based upon trends in indemnification and repurchase
requests, actual loss experience, risks in the underlying serviced loan portfolios, and current economic conditions. As part of its evaluation, management considers estimated loss projections over the life of the subject loan portfolio. At
June 30, 2011 and December 31, 2010, the liability for estimated losses on indemnification and repurchase claims for residential
mortgages totaled $95 million and $144 million, respectively. The indemnification and repurchase liability for home equity loans/lines was $55 million and $150 million at June 30, 2011 and
December 31, 2010, respectively. These liabilities are included in Other liabilities on the Consolidated Balance Sheet. We believe our indemnification and repurchase liabilities appropriately reflect the estimated probable losses on investor
indemnification and repurchase claims at June 30, 2011 and December 31, 2010.
The lower residential mortgage indemnification and
repurchase liability balance at June 30, 2011 reflects lower estimated losses driven primarily by the seasoning of the sold portfolio and higher claim rescission rates as described above. This decrease resulted despite higher levels of investor
indemnification and repurchase claim activity. The reduction in the home equity loans/lines indemnification and repurchase liability at June 30, 2011 is reflective of lower anticipated indemnification and repurchase activity for the sold
portfolio. This lower estimated activity is primarily attributed to pooled settlement activities, improved investor rescission rates as described above, and the seasoning of the sold home equity portfolio.
R
ISK
M
ANAGEMENT
We encounter risk as part of the normal course of our business and we design risk management processes to help manage these risks.
The Risk Management section included in Part II, Item 7 of our 2010 Form 10-K describes our risk management philosophy, principles, governance and various aspects of our corporate-level risk
management program. Additionally, our 2010 Form 10-K provides an analysis of our primary areas of risk: credit, operational, liquidity, and market, as well as a discussion of our use of financial derivatives as part of our overall asset and
liability risk management process, and addresses historical performance in appropriate places within the Risk Management section of that report.
The following information updates our 2010 Form 10-K risk management disclosures.
C
REDIT
R
ISK
M
ANAGEMENT
Credit risk represents the possibility that a customer, counterparty or issuer may not perform in accordance with contractual terms. Credit risk is inherent in the financial services business and results
from extending credit to customers, purchasing securities, and entering into financial derivative transactions and certain guarantee contracts. Credit risk is one of our most significant risks.
41
A
SSET
Q
UALITY
O
VERVIEW
Asset quality trends for the second quarter of 2011 were positive and included the following:
|
|
•
|
|
Second quarter 2011 net charge-offs declined significantly to $414 million, down 51% from second quarter 2010 net charge-offs of $840 million. Second
quarter 2011 net charge-offs represented the lowest quarterly level of net charge-offs since fourth quarter 2008.
|
|
|
•
|
|
Reflecting ongoing reductions in credit exposure and improvements in asset quality, the provision for credit losses declined to $280 million for the
second quarter 2011. The ALLL has also been decreasing.
|
|
|
•
|
|
Due to the improvement in the economy, nonperforming loans declined $596 million, or 13%, to $3.9 billion as of June 30, 2011 compared with
December 31, 2010. Similarly, nonperforming assets decreased $642 million, or 13%, to $4.5 billion as of June 30, 2011, compared with December 31, 2010.
|
|
|
•
|
|
Overall loan delinquency levels have declined due to the improving economy.
|
|
|
•
|
|
Commercial credit quality trends improved noticeably with levels of criticized commercial loan outstandings declining by approximately $2 billion, or
15% compared with December 31, 2010, to $11.7 billion at June 30, 2011. See Note 5 Asset Quality and Allowances for Loan and Lease Losses and Unfunded Loan Commitments and Letters of Credit in the Notes To Consolidated Financial Statements
in this Report for additional information.
|
These positive trends were partially offset by our ongoing loan modification
efforts to assist homeowners and other borrowers. These efforts continued to increase our overall level of troubled debt restructurings (TDRs). In particular, nonperforming TDRs increased to 22% of total nonperforming loans. However, as the economy
has improved, our loan modification efforts have begun to show signs of slowing and the amount of TDRs returning to performing status has increased.
N
ONPERFORMING
A
SSETS
AND
L
OAN
D
ELINQUENCIES
Nonperforming Assets, including OREO and Foreclosed Assets
Nonperforming assets
include nonaccrual loans and leases for which ultimate collectability of the full amount of principal
and interest is doubtful and includes TDRs, OREO and other foreclosed assets. Loans held for sale, purchased impaired loans and loans accounted for under the fair value option are excluded from
nonperforming loans. Additional information regarding our nonaccrual policies is included in Note 1 Accounting Policies in the Notes to Consolidated Financial Statements in this Report. A summary of nonperforming assets is presented in the table
below.
Nonperforming assets decreased $642 million from December 31, 2010, to $4.5 billion at June 30, 2011. Nonperforming loans
decreased $596 million to $3.9 billion while OREO and foreclosed assets decreased $46 million to $611 million. The ratio of nonperforming assets to total loans and OREO and foreclosed assets was 2.97% at June 30, 2011 and 3.39% at
December 31, 2010. The ratio of nonperforming loans to total loans declined to 2.57%. The decrease in nonperforming loans from December 31, 2010 occurred across all loan classes. Total nonperforming assets have declined $1.9 billion, or
30%, from their peak of $6.4 billion at March 31, 2010.
At June 30, 2011, TDRs included in nonperforming loans increased to $845
million or 22% of total nonperforming loans compared to $784 million or 18% of nonperforming loans as of December 31, 2010. Within consumer nonperforming loans, residential real estate TDRs comprise 37% of total residential real estate
nonperforming loans at June 30, 2011, up from 30% at December 31, 2010. Similarly, home equity TDRs comprise 77% of home equity nonperforming loans at June 30, 2011, up slightly from 75% at December 31, 2010. The level of
modifications that were determined to be TDRs in these portfolios is expected to result in elevated nonperforming loan levels for longer periods because TDRs remain in nonperforming status until a borrower has made at least six consecutive months of
payments under the modified terms or ultimate resolution occurs.
At June 30, 2011, our largest nonperforming asset was $32 million in
the Accommodation and Food Services Industry and our average nonperforming loan associated with commercial lending was under $1 million. Our top ten nonperforming assets are all commercial loans and represent 21% and 5% of total commercial
nonperforming loans and total nonperforming assets, respectively, as of June 30, 2011.
42
Nonperforming Assets By Type
|
|
|
|
|
|
|
|
|
|
|
In millions
|
|
June 30
2011
|
|
|
Dec. 31
2010
|
|
|
Nonperforming loans
|
|
|
|
|
|
|
|
|
|
Commercial
|
|
|
|
|
|
|
|
|
|
Retail/wholesale trade
|
|
$
|
148
|
|
|
$
|
197
|
|
|
Manufacturing
|
|
|
160
|
|
|
|
250
|
|
|
Service providers
|
|
|
189
|
|
|
|
218
|
|
|
Real estate related (a)
|
|
|
261
|
|
|
|
233
|
|
|
Financial services
|
|
|
18
|
|
|
|
16
|
|
|
Health care
|
|
|
38
|
|
|
|
50
|
|
|
Other industries
|
|
|
233
|
|
|
|
289
|
|
|
Total commercial
|
|
|
1,047
|
|
|
|
1,253
|
|
|
Commercial real estate
|
|
|
|
|
|
|
|
|
|
Real estate projects
|
|
|
1,289
|
|
|
|
1,422
|
|
|
Commercial mortgage
|
|
|
378
|
|
|
|
413
|
|
|
Total commercial real estate
|
|
|
1,667
|
|
|
|
1,835
|
|
|
Equipment lease financing
|
|
|
35
|
|
|
|
77
|
|
|
TOTAL COMMERCIAL LENDING
|
|
|
2,749
|
|
|
|
3,165
|
|
|
Consumer (b)
|
|
|
|
|
|
|
|
|
|
Home equity
|
|
|
421
|
|
|
|
448
|
|
|
Residential real estate
|
|
|
|
|
|
|
|
|
|
Residential mortgage (c)
|
|
|
630
|
|
|
|
764
|
|
|
Residential construction
|
|
|
36
|
|
|
|
54
|
|
|
Credit card (d)
|
|
|
8
|
|
|
|
|
|
|
Other consumer
|
|
|
26
|
|
|
|
35
|
|
|
TOTAL CONSUMER LENDING
|
|
|
1,121
|
|
|
|
1,301
|
|
|
Total nonperforming loans (e)
|
|
|
3,870
|
|
|
|
4,466
|
|
|
OREO and foreclosed assets
|
|
|
|
|
|
|
|
|
|
Other real estate owned (OREO) (f)
|
|
|
546
|
|
|
|
589
|
|
|
Foreclosed and other assets
|
|
|
65
|
|
|
|
68
|
|
|
OREO and foreclosed assets
|
|
|
611
|
|
|
|
657
|
|
|
Total nonperforming assets
|
|
$
|
4,481
|
|
|
$
|
5,123
|
|
|
Amount of commercial nonperforming loans current as to remaining principal and interest
|
|
$
|
692
|
|
|
$
|
988
|
|
|
Percentage of total commercial nonperforming loans
|
|
|
25
|
%
|
|
|
31
|
%
|
|
Amount of TDRs included in nonperforming loans
|
|
$
|
845
|
|
|
$
|
784
|
|
|
Percentage of total nonperforming loans
|
|
|
22
|
%
|
|
|
18
|
%
|
|
Nonperforming loans to total loans
|
|
|
2.57
|
%
|
|
|
2.97
|
%
|
|
Nonperforming assets to total loans, OREO and foreclosed assets
|
|
|
2.97
|
|
|
|
3.39
|
|
|
Nonperforming assets to total assets
|
|
|
1.70
|
|
|
|
1.94
|
|
|
Allowance for loan and lease losses to total nonperforming loans
(e) (g)
|
|
|
120
|
|
|
|
109
|
|
|
(a)
|
Includes loans related to customers in the real estate and construction industries.
|
|
(b)
|
Excludes most consumer loans and lines of credit, not secured by residential real estate, which are charged off after 120 to 180 days past due and are not placed on
nonperforming status.
|
|
(c)
|
Effective in 2011, nonperforming residential real estate excludes loans of $85 million accounted for under the fair value option as of June 30, 2011. The
comparable balance at December 31, 2010 was not material.
|
|
(d)
|
Effective in the second quarter 2011, the commercial nonaccrual policy was applied to certain small business credit card balances. This change resulted in loans placed
on nonaccrual status when they become 90 days or more past due, rather than being excluded and charged off at 180 days past due.
|
|
(e)
|
Nonperforming loans do not include purchased impaired loans or loans held for sale.
|
|
(f)
|
Other real estate owned excludes $273 million and $178 million at June 30, 2011 and December 31, 2010, respectively, related to serviced loans insured by the
Federal Housing Administration (FHA) or guaranteed by the Department of Veterans Affairs (VA).
|
|
(g)
|
The allowance for loan and lease losses includes impairment reserves attributable to purchased impaired loans.
|
OREO and Foreclosed Assets
|
|
|
|
|
|
|
|
|
|
|
In millions
|
|
June 30
2011
|
|
|
Dec. 31
2010
|
|
|
Other real estate owned (OREO):
|
|
|
|
|
|
|
|
|
|
Residential properties
|
|
$
|
231
|
|
|
$
|
304
|
|
|
Residential development properties
|
|
|
184
|
|
|
|
166
|
|
|
Commercial properties
|
|
|
131
|
|
|
|
119
|
|
|
Total OREO
|
|
|
546
|
|
|
|
589
|
|
|
Foreclosed and other assets
|
|
|
65
|
|
|
|
68
|
|
|
OREO and foreclosed assets
|
|
$
|
611
|
|
|
$
|
657
|
|
Total OREO and foreclosed assets decreased $46 million during the first six months of 2011 from $657 million at
December 31, 2010, to $611 million at June 30, 2011, which represents 14% of total nonperforming assets. As of June 30, 2011 and December 31, 2010, 42% and 52%, respectively, of our OREO and foreclosed assets were comprised of
single family residential properties. The lower level of OREO and foreclosed assets was driven by lower levels of residential properties as new foreclosures have continued to fall from the very high levels of early 2010 and sales have rebounded from
a low point in the fourth quarter 2010. Excluded from OREO at June 30, 2011 and December 31, 2010, respectively, was $273 million and $178 million of real estate that was acquired by us upon foreclosure of serviced loans insured by the
Federal Housing Administration (FHA) or guaranteed by the Department of Veterans Affairs (VA). These balances are excluded from OREO as we will be reimbursed once the property is conveyed to GNMA.
Change in Nonperforming Assets
|
|
|
|
|
|
|
|
|
|
|
In millions
|
|
2011
|
|
|
2010
|
|
|
January 1
|
|
$
|
5,123
|
|
|
$
|
6,204
|
|
|
New nonperforming assets
|
|
|
1,846
|
|
|
|
2,730
|
|
|
Charge-offs and valuation adjustments
|
|
|
(713
|
)
|
|
|
(1,152
|
)
|
|
Principal activity, including paydowns and payoffs
|
|
|
(983
|
)
|
|
|
(574
|
)
|
|
Asset sales and transfers to loans held for sale
|
|
|
(306
|
)
|
|
|
(685
|
)
|
|
Returned to performing status
|
|
|
(486
|
)
|
|
|
(786
|
)
|
|
June 30
|
|
$
|
4,481
|
|
|
$
|
5,737
|
|
The table above presents nonperforming asset activity for the six months ended June 30, 2011 and 2010. Nonperforming
assets decreased $642 million from $5.1 billion at December 31, 2010, to $4.5 billion at June 30, 2011, driven primarily by paydowns, payoffs and charge-offs. Approximately 78% of total nonperforming loans are secured by collateral which
would be expected to reduce credit losses and require less reserves in the event of default, and 25% of
43
commercial lending nonperforming loans are contractually current as to principal and interest. As a measure of the level of charge-offs already taken, as of June 30, 2011, commercial
nonperforming loans are carried at approximately 68% of their unpaid principal balance before consideration of the allowance for loan and lease losses.
Purchased impaired loans are considered performing, even if contractually past due (or if we do not expect to receive payment in full based on the original contractual terms), as we are currently
accreting interest income over the expected life of the loans. The accretable yield represents the excess of the expected cash flows on the loans at the measurement date over the carrying value. Any decrease, other than for prepayments or interest
rate decreases for variable rate notes, in the net present value of expected cash flows of individual commercial or pooled consumer purchased impaired loans would result in an impairment charge to the provision for loan losses in the period in which
the change is deemed probable. Any increase in the net present value of expected cash flows of purchased impaired loans would first result in a recovery of previously recorded allowance for loan losses, to the extent applicable, and then an increase
to accretable yield for the remaining life of the purchased impaired loans. Total nonperforming loans and assets in the tables above are significantly lower than they would have been due to this accounting treatment for purchased impaired loans.
This treatment also results in a lower ratio of nonperforming loans to total loans and a higher ratio of ALLL to nonperforming loans. See Note 6 Purchased Impaired Loans in the Notes To Consolidated Financial Statements in this Report for additional
information on these loans.
Loan Delinquencies
We regularly monitor the level of loan delinquencies and believe these levels to be a key indicator of loan portfolio asset quality. Measurement of delinquency and past due status are based on the
contractual terms of each loan. Loans that are 30 days or more past due in terms of payment are considered delinquent. Loan delinquencies exclude loans held for sale and purchased impaired loans.
Total early stage loan delinquencies (accruing loans past due 30 to 89 days) decreased by $319 million from December 31, 2010, to $1.5 billion at
June 30, 2011. Commercial early stage delinquencies declined by $168 million from December 31, 2010, while consumer delinquencies fell by $151 million. Improvement in early stage delinquency levels was experienced across all loan classes.
Accruing loans past due 90 days or more are referred to as late stage delinquencies. These loans are not included in nonperforming loans and
continue to accrue interest because they are well secured by collateral, are in the process of
collection and are reasonably expected to result in repayment or restoration to current status, or are managed in homogenous portfolios with specified charge-off timeframes adhering to regulatory
guidelines. These loans declined 2% from $2.7 billion at December 31, 2010, to $2.6 billion at June 30, 2011, reflecting improvement in commercial and consumer delinquency levels, excluding government insured delinquent loans. The
following tables display the delinquency status of our loans at June 30, 2011 and December 31, 2010. Additional information regarding accruing loans past due is included in Note 5 Asset Quality and Allowances for Loan and Lease Losses and
Unfunded Loan Commitments and Letters of Credit in the Notes To Consolidated Financial Statements in this Report.
Accruing Loans Past
Due 30 To 59 Days
|
|
|
|
|
|
|
|
|
|
|
|
|
|
|
|
|
|
|
|
|
Amount
|
|
|
Percent of Total
Outstandings
|
|
|
Dollars in millions
|
|
June 30
2011
|
|
|
Dec. 31
2010
|
|
|
June 30
2011
|
|
|
Dec. 31
2010
|
|
|
Commercial
|
|
$
|
149
|
|
|
$
|
251
|
|
|
|
.25
|
%
|
|
|
.45
|
%
|
|
Commercial real estate
|
|
|
98
|
|
|
|
128
|
|
|
|
.60
|
|
|
|
.71
|
|
|
Equipment lease financing
|
|
|
9
|
|
|
|
37
|
|
|
|
.14
|
|
|
|
.58
|
|
|
Residential real estate – non government insured
|
|
|
201
|
|
|
|
226
|
|
|
|
1.34
|
|
|
|
1.41
|
|
|
Residential real estate – government insured
|
|
|
123
|
|
|
|
105
|
|
|
|
.82
|
|
|
|
.66
|
|
|
Home equity
|
|
|
141
|
|
|
|
159
|
|
|
|
.42
|
|
|
|
.47
|
|
|
Credit card
|
|
|
39
|
|
|
|
46
|
|
|
|
1.04
|
|
|
|
1.17
|
|
|
Other consumer – non government insured
|
|
|
51
|
|
|
|
95
|
|
|
|
.30
|
|
|
|
.56
|
|
|
Other consumer – government insured
|
|
|
134
|
|
|
|
165
|
|
|
|
.79
|
|
|
|
.97
|
|
|
Total
|
|
$
|
945
|
|
|
$
|
1,212
|
|
|
|
.63
|
|
|
|
.81
|
|
Accruing Loans Past Due 60 To 89 Days
|
|
|
|
|
|
|
|
|
|
|
|
|
|
|
|
|
|
|
|
|
Amount
|
|
|
Percent of Total
Outstandings
|
|
|
Dollars in millions
|
|
June 30
2011
|
|
|
Dec. 31
2010
|
|
|
June 30
2011
|
|
|
Dec. 31
2010
|
|
|
Commercial
|
|
$
|
75
|
|
|
$
|
92
|
|
|
|
.13
|
%
|
|
|
.17
|
%
|
|
Commercial real estate
|
|
|
71
|
|
|
|
62
|
|
|
|
.44
|
|
|
|
.35
|
|
|
Equipment lease financing
|
|
|
2
|
|
|
|
2
|
|
|
|
.03
|
|
|
|
.03
|
|
|
Residential real estate – non government insured
|
|
|
68
|
|
|
|
107
|
|
|
|
.45
|
|
|
|
.67
|
|
|
Residential real estate – government insured
|
|
|
119
|
|
|
|
118
|
|
|
|
.80
|
|
|
|
.74
|
|
|
Home equity
|
|
|
91
|
|
|
|
91
|
|
|
|
.27
|
|
|
|
.27
|
|
|
Credit card
|
|
|
23
|
|
|
|
32
|
|
|
|
.61
|
|
|
|
.82
|
|
|
Other consumer – non government insured
|
|
|
20
|
|
|
|
32
|
|
|
|
.12
|
|
|
|
.19
|
|
|
Other consumer – government insured
|
|
|
84
|
|
|
|
69
|
|
|
|
.49
|
|
|
|
.41
|
|
|
Total
|
|
$
|
553
|
|
|
$
|
605
|
|
|
|
.37
|
|
|
|
.40
|
|
44
Accruing Loans Past Due 90 Days Or More
|
|
|
|
|
|
|
|
|
|
|
|
|
|
|
|
|
|
|
|
|
Amount
|
|
|
Percent of Total
Outstandings
|
|
|
Dollars in millions
|
|
June 30
2011
|
|
|
Dec. 31
2010
|
|
|
June 30
2011
|
|
|
Dec. 31
2010
|
|
|
Commercial
|
|
$
|
42
|
|
|
$
|
59
|
|
|
|
.08
|
%
|
|
|
.11
|
%
|
|
Commercial real estate
|
|
|
12
|
|
|
|
43
|
|
|
|
.07
|
|
|
|
.24
|
|
|
Equipment lease financing
|
|
|
1
|
|
|
|
1
|
|
|
|
.02
|
|
|
|
.02
|
|
|
Residential real estate – non government insured
|
|
|
145
|
|
|
|
160
|
|
|
|
.97
|
|
|
|
1.00
|
|
|
Residential real estate – government insured
|
|
|
1,926
|
|
|
|
1,961
|
|
|
|
12.85
|
|
|
|
12.26
|
|
|
Home equity
|
|
|
182
|
|
|
|
174
|
|
|
|
.55
|
|
|
|
.51
|
|
|
Credit card
|
|
|
45
|
|
|
|
77
|
|
|
|
1.20
|
|
|
|
1.96
|
|
|
Other consumer – non government insured
|
|
|
21
|
|
|
|
28
|
|
|
|
.12
|
|
|
|
.16
|
|
|
Other consumer – government insured
|
|
|
272
|
|
|
|
206
|
|
|
|
1.60
|
|
|
|
1.22
|
|
|
Total
|
|
$
|
2,646
|
|
|
$
|
2,709
|
|
|
|
1.76
|
|
|
|
1.80
|
|
Our Special Asset Committee closely monitors loans that are not included in the nonperforming or accruing past due
categories and for which we are uncertain about the borrower’s ability to comply with existing repayment terms over the next six months. These loans totaled $447 million at June 30, 2011 and $574 million at December 31, 2010.
Home Equity Loan Portfolio
Our home equity loan portfolio totaled $33.4 billion as of June 30, 2011, or 22% of the total loan portfolio. Of that total, $22.8 billion, or 68%, was outstanding under primarily variable-rate home
equity lines of credit and $10.5 billion, or 32%, consisted of closed-end home equity installment loans. Less than 2% of the portfolio was on nonperforming status as of June 30, 2011.
As of June 30, 2011, we are in an originated first lien position for approximately 30% of the total portfolio and, where originated as a second lien, we currently hold the first lien position for
approximately an additional 2% of the portfolio. The remaining 68% of the portfolio was secured by second liens where we do not hold the first lien position. Historically, we have originated and sold first mortgages which has resulted in a low
percentage of home equity loans where we hold the first lien position. We regularly track borrower performance and for the majority of the home equity portfolio where we are in or hold the first lien position, the credit performance of this portion
of the portfolio is superior to the portion of the portfolio where we hold the second lien position but do not hold the first lien.
For the
portion of the home equity portfolio in a second lien position, we consider a borrower’s current status and historical credit performance of the first lien loan and FICO scores in determining our allowance for loan losses. Our ability to
validate lien positions, and therefore determine whether the first lien position is in default, is based upon available external
information, which we continue to obtain and analyze. In certain circumstances, we may be unable to determine whether the same collateral applies to both the first and second liens. We are
currently in the process of enhancing our ability to specifically track the underlying collateral. See Note 5 Asset Quality and Allowances for Loan and Lease Losses and Unfunded Loan Commitments and Letters of Credit in the Notes to Consolidated
Financial Statements in this Report for additional information.
Generally, our variable-rate home equity lines of credit have either a seven
or ten year draw period, followed by a 20 year amortization term. Based upon outstanding balances at June 30, 2011, approximately $0.3 billion, $1.0 billion, $1.1 billion, $1.4 billion, and $7.5 billion will convert to amortizing during the
remainder of 2011, and the years 2012, 2013, 2014, and beyond, respectively.
Based upon outstanding amortizing home equity lines of credit
balances, including purchased impaired loans, at June 30, 2011, approximately 3.64% were 1-89 days past due and approximately 4.60% were greater than or equal to 90 days past due. When a borrower becomes 60 days past due, we terminate borrowing
privileges and the outstanding balance becomes an amortizing loan. Accordingly, the majority of non-amortizing home equity lines of credit are current. Additionally, for those non-amortizing home equity lines of credit approximately 23% of our
borrowers are paying interest only per the loan’s contractual terms.
L
OAN
M
ODIFICATIONS
AND
T
ROUBLED
D
EBT
R
ESTRUCTURINGS
Consumer Loan Modifications
We modify loans under government and PNC-developed programs based upon our commitment to help eligible homeowners and borrowers avoid
foreclosure, where appropriate. Initially, a borrower is evaluated for a modification under a government program. If a borrower does not qualify under a government program, the borrower is then evaluated under a PNC program. Our programs utilize
both temporary and permanent modifications and typically reduce the interest rate, extend the term and/or defer or forgive principal. Temporary and permanent modifications under programs involving a contractual change to loan terms are substantially
all classified as TDRs, regardless of the period of time for which the modified terms apply, as discussed in more detail below.
A temporary
modification, with a term between three and 60 months, involves a change in original loan terms for a period of time and reverts to the original loan terms as of a specific date or the occurrence of an event, such as a failure to pay in accordance
with the terms of the modification. Typically, these modifications are for a period of up to 24 months after which the interest rate reverts to the original loan rate. A permanent modification, with a term greater than 60 months,
45
is a modification in which the terms of the original loan are changed, but could revert back to the original loan terms. Permanent modifications primarily include the government-created Home
Affordable Modification Program (HAMP) or PNC-developed HAMP-like modification programs.
For consumer loan programs (e.g., residential
mortgages, home equity loans and lines), we will enter into a temporary modification when the borrower has indicated a temporary hardship and a willingness to bring current the delinquent loan balance. Examples of this situation often include
delinquency due to illness or death in the family, or a loss of employment. Permanent modifications are entered into when it is confirmed that the borrower does not possess the income necessary to continue making loan payments at the current amount,
but our expectation is that payments at lower amounts can be made.
Residential mortgage and home equity loans and lines have been modified
with changes in contractual terms for up to 60 months, although the majority involve periods of three to 24 months. The change in terms may include a reduced interest rate and/or an extension of the amortization period.
We also monitor the success rates and delinquency status of our loan modification programs to assess their effectiveness in serving our customers’
needs while mitigating credit losses. The following tables provide the number of accounts and unpaid principal balance of modified consumer real estate related loans as well as the number of accounts and unpaid
principal balance of modified loans that were 60 days or more past due as of six months, nine months and twelve months after the modification date.
Bank-Owned Consumer Real Estate Related Loan Modifications
|
|
|
|
|
|
|
|
|
|
|
|
|
|
|
|
|
|
|
|
|
June 30, 2011
|
|
|
December 31, 2010
|
|
|
Dollars in millions
|
|
Number of
Accounts
|
|
|
Unpaid
Principal
Balance
|
|
|
Number of
Accounts
|
|
|
Unpaid
Principal
Balance
|
|
|
Conforming Mortgages
|
|
|
|
|
|
|
|
|
|
|
|
|
|
|
|
|
|
Permanent Modifications
|
|
|
6,076
|
|
|
$
|
1,143
|
|
|
|
5,517
|
|
|
$
|
1,137
|
|
|
Non-Prime Mortgages
|
|
|
|
|
|
|
|
|
|
|
|
|
|
|
|
|
|
Permanent Modifications
|
|
|
4,169
|
|
|
|
561
|
|
|
|
3,405
|
|
|
|
441
|
|
|
Residential Construction
|
|
|
|
|
|
|
|
|
|
|
|
|
|
|
|
|
|
Permanent Modifications
|
|
|
1,069
|
|
|
|
496
|
|
|
|
470
|
|
|
|
235
|
|
|
Home Equity
|
|
|
|
|
|
|
|
|
|
|
|
|
|
|
|
|
|
Temporary Modifications
|
|
|
14,076
|
|
|
|
1,293
|
|
|
|
12,643
|
|
|
|
1,151
|
|
|
Permanent Modifications
|
|
|
566
|
|
|
|
38
|
|
|
|
163
|
|
|
|
17
|
|
|
Total Home Equity
|
|
|
14,642
|
|
|
|
1,331
|
|
|
|
12,806
|
|
|
|
1,168
|
|
|
Total Bank-Owned Consumer Real Estate Related Loan Modifications
|
|
|
25,956
|
|
|
$
|
3,531
|
|
|
|
22,198
|
|
|
$
|
2,981
|
|
46
Bank-Owned Consumer Real Estate Related Loan Modifications Re-Default by Vintage
|
|
|
|
|
|
|
|
|
|
|
|
|
|
|
|
|
|
|
|
|
|
|
|
|
|
|
|
|
|
|
|
|
Six Months
|
|
|
Nine Months
|
|
|
12 Months
|
|
|
|
|
|
June 30, 2011
Dollars in millions, except as noted
|
|
Number of
Accounts
Re-defaulted
|
|
|
% of
Vintage
Re-defaulted
|
|
|
Number of
Accounts
Re-defaulted
|
|
|
% of
Vintage
Re-defaulted
|
|
|
Number of
Accounts
Re-defaulted
|
|
|
% of
Vintage
Re-defaulted
|
|
|
Unpaid
Principal
Balance
|
|
|
Permanent Modifications
|
|
|
|
|
|
|
|
|
|
|
|
|
|
|
|
|
|
|
|
|
|
|
|
|
|
|
|
|
|
Conforming Mortgages
|
|
|
|
|
|
|
|
|
|
|
|
|
|
|
|
|
|
|
|
|
|
|
|
|
|
|
|
|
|
Fourth Quarter 2010
|
|
|
356
|
|
|
|
19.2
|
%
|
|
|
|
|
|
|
|
|
|
|
|
|
|
|
|
|
|
$
|
61.6
|
|
|
Third Quarter 2010
|
|
|
523
|
|
|
|
26.0
|
|
|
|
635
|
|
|
|
31.6
|
%
|
|
|
|
|
|
|
|
|
|
|
108.0
|
|
|
Second Quarter 2010
|
|
|
345
|
|
|
|
23.3
|
|
|
|
437
|
|
|
|
29.5
|
|
|
|
505
|
|
|
|
34.1
|
%
|
|
|
82.7
|
|
|
First Quarter 2010
|
|
|
285
|
|
|
|
21.8
|
|
|
|
435
|
|
|
|
33.3
|
|
|
|
494
|
|
|
|
37.8
|
|
|
|
71.0
|
|
|
Fourth Quarter 2009
|
|
|
212
|
|
|
|
24.7
|
|
|
|
285
|
|
|
|
33.2
|
|
|
|
369
|
|
|
|
43.0
|
|
|
|
53.0
|
|
|
Non-Prime Mortgages
|
|
|
|
|
|
|
|
|
|
|
|
|
|
|
|
|
|
|
|
|
|
|
|
|
|
|
|
|
|
Fourth Quarter 2010
|
|
|
13
|
|
|
|
13.5
|
|
|
|
|
|
|
|
|
|
|
|
|
|
|
|
|
|
|
|
1.8
|
|
|
Third Quarter 2010
|
|
|
96
|
|
|
|
18.5
|
|
|
|
115
|
|
|
|
22.2
|
|
|
|
|
|
|
|
|
|
|
|
17.5
|
|
|
Second Quarter 2010
|
|
|
104
|
|
|
|
23.8
|
|
|
|
114
|
|
|
|
26.1
|
|
|
|
130
|
|
|
|
29.7
|
|
|
|
19.0
|
|
|
First Quarter 2010
|
|
|
68
|
|
|
|
20.5
|
|
|
|
82
|
|
|
|
24.7
|
|
|
|
94
|
|
|
|
28.3
|
|
|
|
10.9
|
|
|
Fourth Quarter 2009
|
|
|
119
|
|
|
|
18.6
|
|
|
|
198
|
|
|
|
30.9
|
|
|
|
223
|
|
|
|
34.8
|
|
|
|
16.4
|
|
|
Residential Construction (a)
|
|
|
|
|
|
|
|
|
|
|
|
|
|
|
|
|
|
|
|
|
|
|
|
|
|
|
|
|
|
Fourth Quarter 2010
|
|
|
9
|
|
|
|
4.0
|
|
|
|
|
|
|
|
|
|
|
|
|
|
|
|
|
|
|
|
3.2
|
|
|
Third Quarter 2010
|
|
|
20
|
|
|
|
7.1
|
|
|
|
25
|
|
|
|
8.9
|
|
|
|
|
|
|
|
|
|
|
|
7.8
|
|
|
Second Quarter 2010
|
|
|
32
|
|
|
|
12.0
|
|
|
|
33
|
|
|
|
12.4
|
|
|
|
38
|
|
|
|
14.2
|
|
|
|
10.5
|
|
|
First Quarter 2010
|
|
|
5
|
|
|
|
12.8
|
|
|
|
6
|
|
|
|
15.4
|
|
|
|
5
|
|
|
|
12.8
|
|
|
|
3.0
|
|
|
Home Equity (b)
|
|
|
|
|
|
|
|
|
|
|
|
|
|
|
|
|
|
|
|
|
|
|
|
|
|
|
|
|
|
Fourth Quarter 2010
|
|
|
4
|
|
|
|
14.3
|
|
|
|
|
|
|
|
|
|
|
|
|
|
|
|
|
|
|
|
|
|
|
Third Quarter 2010
|
|
|
1
|
|
|
|
9.1
|
|
|
|
2
|
|
|
|
18.2
|
|
|
|
|
|
|
|
|
|
|
|
|
|
|
Second Quarter 2010
|
|
|
2
|
|
|
|
12.5
|
|
|
|
4
|
|
|
|
25.0
|
|
|
|
4
|
|
|
|
25.0
|
|
|
|
|
|
|
First Quarter 2010
|
|
|
1
|
|
|
|
2.5
|
|
|
|
5
|
|
|
|
12.5
|
|
|
|
7
|
|
|
|
17.5
|
|
|
|
|
|
|
Fourth Quarter 2009
|
|
|
|
|
|
|
|
|
|
|
1
|
|
|
|
8.3
|
|
|
|
3
|
|
|
|
25.0
|
|
|
|
|
|
|
Temporary Modifications
|
|
|
|
|
|
|
|
|
|
|
|
|
|
|
|
|
|
|
|
|
|
|
|
|
|
|
|
|
|
Home Equity
|
|
|
|
|
|
|
|
|
|
|
|
|
|
|
|
|
|
|
|
|
|
|
|
|
|
|
|
|
|
Fourth Quarter 2010
|
|
|
111
|
|
|
|
5.3
|
%
|
|
|
|
|
|
|
|
|
|
|
|
|
|
|
|
|
|
$
|
9.9
|
|
|
Third Quarter 2010
|
|
|
118
|
|
|
|
5.5
|
|
|
|
213
|
|
|
|
10.0
|
%
|
|
|
|
|
|
|
|
|
|
|
18.3
|
|
|
Second Quarter 2010
|
|
|
165
|
|
|
|
7.6
|
|
|
|
210
|
|
|
|
9.7
|
|
|
|
311
|
|
|
|
14.4
|
%
|
|
|
24.1
|
|
|
First Quarter 2010
|
|
|
241
|
|
|
|
8.6
|
|
|
|
402
|
|
|
|
14.4
|
|
|
|
433
|
|
|
|
15.5
|
|
|
|
30.1
|
|
|
Fourth Quarter 2009
|
|
|
198
|
|
|
|
9.0
|
|
|
|
331
|
|
|
|
15.0
|
|
|
|
429
|
|
|
|
19.5
|
|
|
|
28.1
|
|
|
(a)
|
Amounts for fourth quarter 2009 are zero.
|
|
(b)
|
The unpaid principal balance for permanent home equity modifications totals less than $1 million for each vintage.
|
In addition to temporary loan modifications, we may make available to a borrower a payment plan or a HAMP
trial payment period. Under a payment plan or a HAMP trial payment period, there is no change to the loan’s contractual terms so the borrower remains legally responsible for payment of the loan under its original terms. A payment plan involves
the borrower making payments that differ from the contractual payment amount for a short period of time, generally three months, during which time a borrower is brought current. Our motivation is to allow for repayment of an outstanding past due
amount through payment of additional amounts over the short period of time. Due to the short term nature of the payment plan and the expectation that all contractual principal and interest will be collected, there is a minimal impact to the ALLL.
Under a HAMP trial payment period, we allow a borrower to demonstrate successful payment performance before contractually establishing an
alternative payment amount. Subsequent to successful borrower performance under the trial
payment period, we will change a loan’s contractual terms and the loan would be classified as a TDR and a nonperforming loan. However, the borrower is often already delinquent at the time of
participation in the HAMP trial payment period. As such, upon successful completion, there is not a significant increase in the ALLL. If the trial payment period is unsuccessful, the loan will be charged-off at the end of the trial payment period to
its estimated fair value of the underlying collateral less costs to sell.
Residential conforming and certain residential construction loans
have been permanently modified under HAMP or, if they do not qualify for a HAMP modification, under PNC- developed programs, which in some cases may operate similar to HAMP. These programs first require a reduction of the interest rate followed by
an extension of term and, if appropriate, deferral or forgiveness of principal payments. As of June 30, 2011 and December 31, 2010, 1,822 accounts with a balance of $379 million and 1,027 accounts with a balance of $262 million,
respectively, of residential real estate loans
47
have been modified under HAMP and were still outstanding on our balance sheet.
We do
not re-modify a defaulted modified loan except for subsequent significant life events, as defined by the OCC. A re-modified loan continues to be classified as a TDR for the remainder of its term regardless of subsequent payment performance.
Commercial Loan Modifications
Modifications of terms for commercial loans are based on individual facts and circumstances. Commercial loan modifications may involve reduction of the interest rate, extension of the term of the loan
and/or forgiveness of principal. Modified large commercial loans are usually already nonperforming prior to modification.
Beginning in 2010,
we established certain commercial loan modification programs for small business loans, Small Business Administration loans, and investment real estate loans. As of June 30, 2011 and December 31, 2010, approximately $98 million and $88
million, respectively, in loan balances had been modified under these small business modification programs. None of these small business loan modifications have been determined to be TDRs.
Troubled Debt Restructurings
Loan modifications are evaluated and subject to
classification as a TDR if the borrower is experiencing financial difficulty and we grant a concession to the borrower. TDRs typically result from our loss mitigation activities and could include interest rate reductions and/or principal forgiveness
intended to minimize the economic loss and to avoid foreclosure or repossession of collateral. Government insured or guaranteed/held for sale loans, purchased impaired loans and loans accounted for under the fair value option are not classified as
TDRs. Consumer loans modified in the second quarter of 2011 that are government insured or guaranteed/held for sale totaling $194 million are not classified as TDRs.
Troubled Debt Restructurings By Type
|
|
|
|
|
|
|
|
|
|
|
In millions
|
|
June 30
2011
|
|
|
Dec. 31
2010
|
|
|
Consumer lending:
|
|
|
|
|
|
|
|
|
|
Real estate-related
|
|
$
|
1,286
|
|
|
$
|
1,087
|
|
|
Credit card (a)
|
|
|
322
|
|
|
|
331
|
|
|
Other consumer
|
|
|
6
|
|
|
|
4
|
|
|
Total consumer lending
|
|
|
1,614
|
|
|
|
1,422
|
|
|
Total commercial lending
|
|
|
305
|
|
|
|
236
|
|
|
Total TDRs
|
|
$
|
1,919
|
|
|
$
|
1,658
|
|
|
Nonperforming status
|
|
$
|
845
|
|
|
$
|
784
|
|
|
Accrual status
|
|
|
752
|
|
|
|
543
|
|
|
Credit card (a)
|
|
|
322
|
|
|
|
331
|
|
|
Total TDRs
|
|
$
|
1,919
|
|
|
$
|
1,658
|
|
|
(a)
|
Credit cards and certain consumer small business and other credit agreements whose terms have been modified primarily through interest rate reductions are also
classified as TDRs. However, these loans are excluded from nonperforming loans
|
|
|
since our policy is to exempt these loans from being placed on nonaccrual status as permitted by regulatory guidance. As such, generally under modified terms, these loans are directly charged off
in the period that they become 120 to 180 days past due.
|
Total TDRs increased $261 million or 14% during the first half of 2011
to $1.9 billion as of June 30, 2011. Of this total, nonperforming TDRs totaled $845 million, which represents approximately 22% of total nonperforming loans. However, as the economy has continued to improve, our consumer real estate related
loan modification efforts have begun to show signs of slowing and the amount of TDRs returning to performing status has been increasing as noted below.
TDRs that have returned to performing (accrual) status are excluded from nonperforming loans. These loans have demonstrated a period of at least six months of consecutive performance under the modified
terms. These TDRs increased $209 million or 28% during the first half of 2011 to $752 million as of June 30, 2011. This increase reflects the further seasoning and performance of the loan modification portfolio. Cumulatively, of the TDRs that
have returned to performing status, approximately $65 million have subsequently re-defaulted and are no longer current under their modified terms.
A
LLOWANCES
F
OR
L
OAN
A
ND
L
EASE
L
OSSES
A
ND
U
NFUNDED
L
OAN
C
OMMITMENTS
A
ND
L
ETTERS
O
F
C
REDIT
We recorded $947 million
in net charge-offs for the first half of 2011, compared to $1.5 billion in the first half of 2010. This significantly lower level of total net charge-offs represents our lowest level of quarterly net charge-offs in over two years. Commercial net
charge-offs fell from $841 million in the first half of 2010 to $429 million in the first half of 2011. Consumer net charge-offs declined from $690 million in the first half of 2010 to $518 million in the first half of 2011.
Loan Charge-Offs And Recoveries
|
|
|
|
|
|
|
|
|
|
|
|
|
|
|
|
|
|
|
Six months ended June 30
Dollars in millions
|
|
Charge-
offs
|
|
|
Recoveries
|
|
|
Net
Charge-
offs
|
|
|
Percent
of
Average
Loans
|
|
|
2011
|
|
|
|
|
|
|
|
|
|
|
|
|
|
|
|
|
|
Commercial
|
|
$
|
364
|
|
|
$
|
178
|
|
|
$
|
186
|
|
|
|
.66
|
%
|
|
Commercial real estate
|
|
|
282
|
|
|
|
40
|
|
|
|
242
|
|
|
|
2.84
|
|
|
Equipment lease financing
|
|
|
25
|
|
|
|
24
|
|
|
|
1
|
|
|
|
.03
|
|
|
Residential real estate
|
|
|
101
|
|
|
|
2
|
|
|
|
99
|
|
|
|
1.31
|
|
|
Home equity
|
|
|
252
|
|
|
|
21
|
|
|
|
231
|
|
|
|
1.38
|
|
|
Credit card
|
|
|
134
|
|
|
|
12
|
|
|
|
122
|
|
|
|
6.58
|
|
|
Other consumer
|
|
|
100
|
|
|
|
34
|
|
|
|
66
|
|
|
|
.79
|
|
|
Total
|
|
$
|
1,258
|
|
|
$
|
311
|
|
|
$
|
947
|
|
|
|
1.27
|
|
|
2010
|
|
|
|
|
|
|
|
|
|
|
|
|
|
|
|
|
|
Commercial
|
|
$
|
586
|
|
|
$
|
143
|
|
|
$
|
443
|
|
|
|
1.63
|
%
|
|
Commercial real estate
|
|
|
387
|
|
|
|
43
|
|
|
|
344
|
|
|
|
3.20
|
|
|
Equipment lease financing
|
|
|
79
|
|
|
|
25
|
|
|
|
54
|
|
|
|
1.78
|
|
|
Residential real estate
|
|
|
235
|
|
|
|
13
|
|
|
|
222
|
|
|
|
2.36
|
|
|
Home equity
|
|
|
204
|
|
|
|
22
|
|
|
|
182
|
|
|
|
1.04
|
|
|
Credit card
|
|
|
195
|
|
|
|
10
|
|
|
|
185
|
|
|
|
9.25
|
|
|
Other consumer
|
|
|
126
|
|
|
|
25
|
|
|
|
101
|
|
|
|
1.30
|
|
|
Total
|
|
$
|
1,812
|
|
|
$
|
281
|
|
|
$
|
1,531
|
|
|
|
1.97
|
|
48
Total net charge-offs are significantly lower than they would have been otherwise due to the accounting
treatment for purchased impaired loans. This treatment also results in a lower ratio of net charge-offs to average loans. See Note 6 Purchased Impaired Loans in the Notes To Consolidated Financial Statements in this Report for additional information
on net charge-offs related to these loans.
We maintain an ALLL to absorb losses from the loan portfolio and determine this allowance based on
quarterly assessments of the estimated probable credit losses incurred in the loan portfolio. We maintain the ALLL at a level that we believe to be appropriate to absorb estimated probable credit losses incurred in the loan portfolio as of the
balance sheet date. While we make allocations to specific loans and pools of loans, the total reserve is available for all loan and lease losses. Although quantitative modeling factors as discussed below are constantly changing as the financial
strength of the borrower and overall economic conditions change, there were no significant changes during the first half of 2011 to the methodology we follow to determine our ALLL.
We establish specific allowances for loans considered impaired using methods prescribed by GAAP. All impaired loans are subject to individual analysis, except leases and large groups of smaller-balance
homogeneous loans which may include, but are not limited to, credit card, residential mortgage, and consumer installment loans. Specific allowances for individual loans are determined by our Special Asset Committee based on an analysis of the
present value of expected future cash flows from the loans discounted at their effective interest rate, observable market price, or the fair value of the underlying collateral.
Allocations to commercial loan classes (pool reserve methodology) are assigned to pools of loans as defined by our business structure and are based on internal probability of default and loss given
default credit risk ratings. Key elements of the pool reserve methodology include:
|
|
•
|
|
Probability of Default (PD), which is primarily based on historical default analyses and is derived from the borrower’s internal PD credit risk
rating;
|
|
|
•
|
|
Exposure at Default (EAD), which is derived from historical default data; and
|
|
|
•
|
|
Loss Given Default (LGD), which is based on historical loss data, collateral value and other structural factors that may affect our ultimate ability to
collect on the loan and is derived from the loan’s internal LGD credit risk rating.
|
As more fully described in Part
II, Item 7 of our 2010 Form 10-K, our pool reserve methodology is sensitive to changes in key risk parameters such as PDs, LGDs and EADs. In general, a given change in any of the major risk parameters will have a corresponding change in the
pool reserve allocations for non-impaired commercial loans. Our commercial loans are the
largest category of credits and are most sensitive to changes in the key risk parameters and pool reserve loss rates. Additionally, other factors such as the rate of migration in the severity of
problem loans will contribute to the final pool reserve allocations.
The majority of the commercial portfolio is secured by collateral,
including loans to asset-based lending customers that continue to show demonstrably lower loss given default. Further, the large investment grade or equivalent portion of the loan portfolio has performed well and has not been subject to significant
deterioration. Additionally, guarantees on loans greater than $1 million and owner guarantees for small business loans do not significantly impact our ALLL.
Allocations to consumer loan classes are based upon a roll-rate model which uses statistical relationships, calculated from historical data that estimate the movement of loan outstandings through the
various stages of delinquency and ultimately charge-off. In general, the estimated rates at which loan outstandings roll from one stage of delinquency to another are influenced by various factors such as FICO credit scores, loan-to-value ratios, the
current economic environment, and geography.
The ALLL is significantly lower than it would have been otherwise due to the accounting
treatment for purchased impaired loans. This treatment also results in a lower ratio of ALLL to total loans. Loan loss reserves on the purchased impaired loans were not carried over on the date of acquisition. As of June 30, 2011, we have
established reserves of $949 million for purchased impaired loans.
A portion of the ALLL related to qualitative and measurement factors has
been assigned to loan categories. These factors include, but are not limited to, the following:
|
|
•
|
|
Industry concentrations and conditions,
|
|
|
•
|
|
Recent credit quality trends,
|
|
|
•
|
|
Recent loss experience in particular portfolios,
|
|
|
•
|
|
Recent macro economic factors,
|
|
|
•
|
|
Changes in risk selection and underwriting standards, and
|
|
|
•
|
|
Timing of available information.
|
In addition to the ALLL, we maintain an allowance for unfunded loan commitments and letters of credit. We report this allowance as a liability on our Consolidated Balance Sheet. We maintain the allowance
for unfunded loan commitments and letters of credit at a level we believe is appropriate to absorb estimated probable losses on these unfunded credit facilities. We determine this amount using estimates of the probability of the ultimate funding and
losses related to those credit exposures. This methodology is very similar to the one we use for determining our ALLL.
49
We refer you to Note 5 Asset Quality and Allowances for Loan and Lease Losses and Unfunded Loan Commitments
and Letters of Credit for further information on key asset quality indicators that we use to evaluate our portfolio and establish the allowances.
Allowance for Loan and Lease Losses
|
|
|
|
|
|
|
|
|
|
|
Dollars in millions
|
|
2011
|
|
|
2010
|
|
|
January 1
|
|
$
|
4,887
|
|
|
$
|
5,072
|
|
|
Total net charge-offs
|
|
|
(947
|
)
|
|
|
(1,531
|
)
|
|
Provision for credit losses
|
|
|
701
|
|
|
|
1,574
|
|
|
Adoption of ASU 2009-17, Consolidations
|
|
|
|
|
|
|
141
|
|
|
Other
|
|
|
|
|
|
|
2
|
|
|
Net change in allowance for unfunded loan commitments and letters of
credit
|
|
|
(14
|
)
|
|
|
78
|
|
|
June 30
|
|
$
|
4,627
|
|
|
$
|
5,336
|
|
|
Net charge-offs to average loans (for the six months ended) (annualized)
|
|
|
1.27
|
%
|
|
|
1.97
|
%
|
|
Allowance for loan and lease losses to total loans
|
|
|
3.08
|
|
|
|
3.46
|
|
|
Commercial lending net charge-offs
|
|
$
|
(429
|
)
|
|
$
|
(841
|
)
|
|
Consumer lending net charge-offs
|
|
|
(518
|
)
|
|
|
(690
|
)
|
|
Total net charge-offs
|
|
$
|
(947
|
)
|
|
$
|
(1,531
|
)
|
|
Net charge-offs to average loans (for the six months ended) (annualized)
|
|
|
|
|
|
|
|
|
|
Commercial lending
|
|
|
1.07
|
%
|
|
|
2.05
|
%
|
|
Consumer lending
|
|
|
1.50
|
|
|
|
1.88
|
|
Net charge-offs to average loans
As further described in the Consolidated Income Statement section of this Report, the provision for credit losses totaled $701 million for the first half of 2011 compared to $1.6 billion for the first
half of 2010. For the first half of 2011, the provision for commercial credit losses declined by $423 million or 64% from the first half of 2010. Similarly, the provision for consumer credit losses decreased $450 million or 50% from the first half
of 2010. Correspondingly, the level of ALLL has also been decreasing.
The portion of the ALLL allocated to commercial nonperforming loans was
27% at June 30, 2011, and 28% at December 31, 2010. The allowance allocated to purchased impaired loans and consumer loans and lines of credit not secured by residential real estate, which are both excluded from nonperforming loans, was
$1.3 billion and $1.4 billion at June 30, 2011, and December 31, 2010, respectively. Excluding these balances, the allowance as a percent of nonperforming loans was 87% and 77% as of June 30, 2011 and December 31, 2010,
respectively.
See Note 5 Asset Quality and Allowances for Loan and Lease Losses and Unfunded Loan Commitments and Letters of Credit and Note
6 Purchased Impaired Loans in the Notes To Consolidated Financial Statements of this Report regarding changes in the ALLL and in the allowance for unfunded loan commitments and letters of credit.
C
REDIT
D
EFAULT
S
WAPS
From a credit risk management perspective, we buy and sell credit loss protection via the use of credit derivatives. When we buy loss protection by
purchasing a credit default swap (CDS), we pay a fee to the seller, or CDS counterparty, in return for the right to receive a payment if a specified credit event occurs for a particular obligor or reference entity. We purchase CDSs to mitigate the
risk of economic loss on a portion of our loan exposures.
We also sell loss protection to mitigate the net premium cost and the impact of
fair value accounting on the CDS in cases where we buy protection to hedge the loan portfolio. These activities represent additional risk positions rather than hedges of risk.
We approve counterparty credit lines for all of our CDS activities. Counterparty credit lines are approved based on a review of credit quality in accordance with our traditional credit quality standards
and credit policies. The credit risk of our counterparties is monitored in the normal course of business. In addition, all counterparty credit lines are subject to collateral thresholds and exposures above these thresholds are secured.
CDSs are included in the “Derivatives not designated as hedging instruments under GAAP” table in the Financial Derivatives section of this Risk
Management discussion.
L
IQUIDITY
R
ISK
M
ANAGEMENT
Liquidity risk has two fundamental components. The first is the potential loss if we were unable to meet our funding requirements at a reasonable cost.
The second is the potential inability to operate our businesses because adequate contingent liquidity is not available in a stressed environment. We manage liquidity risk at the bank and parent company levels to help ensure that we can obtain
cost-effective funding to meet current and future obligations under both normal “business as usual” and stressful circumstances and to help ensure that we maintain an appropriate level of contingent liquidity.
Spot and forward funding gap analyses are used to measure and monitor bank liquidity risk. Funding gaps represent the difference in projected sources of
liquidity available to offset projected uses. We calculate funding gaps for the overnight, thirty-day, ninety-day, one hundred eighty-day and one-year time intervals. Management also monitors liquidity through a series of early warning indicators
that may indicate a potential market, or PNC-specific, liquidity stress event. Finally, management performs a set of liquidity stress tests and maintains a contingency funding plan to address a potential liquidity crisis. In the most severe
liquidity stress simulation, we assume that PNC’s liquidity position is under pressure, while the market in general is under systemic pressure. The simulation considers, among other things, the impact of
50
restricted access to both secured and unsecured external sources of funding, accelerated run-off of customer deposits, valuation pressure on assets, and heavy demand to fund contingent
obligations. Risk limits are established within our Liquidity Risk Policy. Management’s Asset and Liability Committee regularly reviews compliance with the established limits.
Parent company liquidity guidelines are designed to help ensure that sufficient liquidity is available to meet our parent company obligations over the succeeding 24-month period. Risk limits for parent
company liquidity are established within our Enterprise Capital Management Policy. The Board of Directors’ Risk Committee regularly reviews compliance with the established limits.
Bank Level Liquidity – Uses
Obligations requiring the use of liquidity can
generally be characterized as either contractual or discretionary. At the bank level, primary contractual obligations include funding loan commitments, satisfying deposit withdrawal requests and maturities and debt service related to bank
borrowings. We also maintain adequate bank liquidity to meet future potential loan demand and provide for other business needs, as necessary.
As of June 30, 2011, there were approximately $4.3 billion of bank borrowings with maturities of less than one year.
Bank Level Liquidity – Sources
Our largest source of bank liquidity on a consolidated basis is the deposit base that comes from our retail and commercial businesses. Liquid assets and unused borrowing capacity from a number of sources
are also available to maintain our liquidity position. Borrowed funds come from a diverse mix of short and long-term funding sources.
At
June 30, 2011, our liquid assets consisted of short-term investments (Federal funds sold, resale agreements, trading securities, and interest-earning deposits with banks) totaling $8.9 billion and securities available for sale totaling $49.7
billion. Of our total liquid assets of $58.6 billion, we had $23.1 billion pledged as collateral for borrowings, trust, and other commitments. The level of liquid assets fluctuates over time based on many factors, including market conditions, loan
and deposit growth and active balance sheet management.
In addition to the customer deposit base, which has historically provided the single
largest source of relatively stable and low-cost funding and liquid assets, the bank also obtains liquidity through the issuance of traditional forms of funding including long-term debt (senior notes and subordinated debt and FHLB advances) and
short-term borrowings (Federal funds purchased, securities sold under repurchase agreements, commercial paper issuances, and other short-term borrowings).
PNC Bank, N.A. has the ability to offer up to $20 billion in senior and subordinated unsecured debt
obligations with maturities of more than nine months. Through June 30, 2011, PNC Bank, N.A. had issued $6.9 billion of debt under this program. Total senior and subordinated debt declined to $4.9 billion at June 30, 2011 from $5.5 billion
at December 31, 2010 due to maturities.
PNC Bank, N.A. is a member of the FHLB-Pittsburgh and as such has access to advances from
FHLB-Pittsburgh secured generally by residential mortgage and other mortgage-related loans. At June 30, 2011, our unused secured borrowing capacity was $14.6 billion with FHLB-Pittsburgh. Total FHLB borrowings declined to $5.0 billion at
June 30, 2011 from $6.0 billion at December 31, 2010 due to maturities.
PNC Bank, N.A. has the ability to offer up to $3.0 billion
of its commercial paper. As of June 30, 2011, there were no issuances outstanding under this program. Other borrowed funds on our Consolidated Balance Sheet includes $3.3 billion of commercial paper issued by Market Street Funding LLC, a
consolidated VIE.
PNC Bank, N.A. can also borrow from the Federal Reserve Bank of Cleveland’s (Federal Reserve Bank) discount window to
meet short-term liquidity requirements. The Federal Reserve Bank, however, is not viewed as the primary means of funding our routine business activities, but rather as a potential source of liquidity in a stressed environment or during a market
disruption. These potential borrowings are secured by securities and commercial loans. At June 30, 2011, our unused secured borrowing capacity was $26.6 billion with the Federal Reserve Bank.
Parent Company Liquidity – Uses
Obligations requiring the use of liquidity can generally be characterized as either contractual or discretionary. The parent company’s contractual obligations consist primarily of debt service
related to parent company borrowings and funding non-bank affiliates. Additionally, the parent company maintains adequate liquidity to fund discretionary activities such as paying dividends to PNC shareholders, share repurchases, and acquisitions.
See 2011 Capital Actions in the Executive Summary section of this Financial Review for additional information regarding our July 2011
issuance of depository shares representing interests in our Fixed-to-Floating Rate Non-Cumulative Perpetual Preferred Stock, Series O, our April 2011 increase to PNC’s quarterly common stock dividend, and our plans regarding purchase of shares
under PNC’s existing common stock repurchase program.
As of June 30, 2011, there were approximately $3.8 billion of parent company
borrowings with maturities of less than one year.
51
Parent Company Liquidity – Sources
The principal source of parent company liquidity is the dividends it receives from its subsidiary bank, which may be impacted by the following:
|
|
•
|
|
Bank-level capital needs,
|
|
|
•
|
|
Contractual restrictions, and
|
The amount
available for dividend payments by PNC Bank, N.A. to the parent company without prior regulatory approval was approximately $2.0 billion at June 30, 2011. There are statutory and regulatory limitations on the ability of national banks to pay
dividends or make other capital distributions or to extend credit to the parent company or its non-bank subsidiaries. See Note 21 Regulatory Matters in the Notes To Consolidated Financial Statements in Part II, Item 8 of our 2010 Form 10-K for
a further discussion of these limitations. Dividends may also be impacted by the bank’s capital needs and by contractual restrictions. We provide additional information on certain contractual restrictions under the “PNC Capital Trust E
Trust Preferred Securities” and “Acquired Entity Trust Preferred Securities” sections of the Off-Balance Sheet Arrangements And Variable Interest Entities section of this Financial Review and in Note 13 Capital Securities of
Subsidiary Trusts and Perpetual Trust Securities in the Notes To Consolidated Financial Statements in Part II, Item 8 of our 2010 Form 10-K.
In addition to dividends from PNC Bank, N.A., other sources of parent company liquidity include cash and short-term investments, as well as dividends and loan repayments from other subsidiaries and
dividends or distributions from equity investments. As of June 30, 2011, the parent company had approximately $4.9 billion in funds available from its cash and short-term investments.
We can also generate liquidity for the parent company and PNC’s non-bank subsidiaries through the issuance of debt securities and equity securities, including certain capital securities, in public or
private markets and commercial paper.
We have effective shelf registration statements pursuant to which we can issue additional debt and
equity securities, including certain hybrid capital instruments. Total senior and subordinated debt and hybrid capital instruments declined to $15.0 billion at June 30, 2011 from $17.3 billion at December 31, 2010 due to maturities.
The parent company, through its subsidiary PNC Funding Corp, has the ability to offer up to $3.0 billion of commercial paper to provide
additional liquidity. As of June 30, 2011, there were no issuances outstanding under this program.
Note 18 Equity in Part II, Item 8 of our 2010 Form 10-K describes the December 31, 2008 issuance
of 75,792 shares of our Fixed Rate Cumulative Perpetual Preferred Shares, Series N (Series N Preferred Stock), related issuance discount and the issuance of a related common stock warrant to the US Treasury under the TARP Capital Purchase Program.
In addition, Note 18 in our 2010 Form 10-K describes our February 2010 redemption of the Series N Preferred Stock, the acceleration of the accretion of the remaining issuance discount on the Series N Preferred Stock in the first quarter of 2010 (and
a corresponding reduction in retained earnings of $250 million in the first quarter of 2010), and the exchange by the US Treasury of the TARP warrant into warrants sold by the US Treasury in a secondary public offering. These common stock warrants
will expire December 31, 2018.
Status of Credit Ratings
The cost and availability of short- and long-term funding, as well as collateral requirements for certain derivative instruments, is influenced by debt ratings.
In general, rating agencies base their ratings on many quantitative and qualitative factors, including capital adequacy, liquidity, asset quality,
business mix, level and quality of earnings, and the current legislative and regulatory environment, including implied government support. In addition, rating agencies themselves have been subject to scrutiny arising from the financial crisis and
could make or be required to make substantial changes to their ratings policies and practices, particularly in response to legislative and regulatory changes, including as a result of provisions in Dodd-Frank. Potential changes in the legislative
and regulatory environment and the timing of those changes could impact our ratings, which as noted above, could impact our liquidity and financial condition. A decrease, or potential decrease, in credit ratings could impact access to the capital
markets and/or increase the cost of debt, and thereby adversely affect liquidity and financial condition.
Credit ratings as of June 30,
2011 for PNC and PNC Bank, N.A. follow:
|
|
|
|
|
|
|
|
|
|
|
|
|
|
|
|
|
Moody’s
|
|
|
Standard &
Poor’s
|
|
|
Fitch
|
|
|
The PNC Financial Services Group, Inc.
|
|
|
|
|
|
|
|
|
|
|
|
|
|
Senior debt
|
|
|
A3
|
|
|
|
A
|
|
|
|
A+
|
|
|
Subordinated debt
|
|
|
Baa1
|
|
|
|
A-
|
|
|
|
A
|
|
|
Preferred stock
|
|
|
Baa3
|
|
|
|
BBB
|
|
|
|
A
|
|
|
|
|
|
|
|
PNC Bank, N.A.
|
|
|
|
|
|
|
|
|
|
|
|
|
|
Subordinated debt
|
|
|
A3
|
|
|
|
A
|
|
|
|
A
|
|
|
Long-term deposits
|
|
|
A2
|
|
|
|
A+
|
|
|
|
AA-
|
|
|
Short-term deposits
|
|
|
P-1
|
|
|
|
A-1
|
|
|
|
F1+
|
|
52
Commitments
The following tables set forth contractual obligations and various other commitments as of June 30, 2011 representing required and potential cash outflows.
Contractual Obligations
|
|
|
|
|
|
|
|
|
|
|
|
|
|
|
|
|
|
|
|
|
|
|
|
|
|
|
|
Payment Due By Period
|
|
|
June 30, 2011 – in millions
|
|
Total
|
|
|
Less than
one year
|
|
|
One to
three
years
|
|
|
Four to
five
years
|
|
|
After five
years
|
|
|
Remaining contractual maturities of time deposits (a)
|
|
$
|
36,534
|
|
|
$
|
29,913
|
|
|
$
|
4,465
|
|
|
$
|
1,343
|
|
|
$
|
813
|
|
|
Borrowed funds (a) (b)
|
|
|
35,176
|
|
|
|
14,381
|
|
|
|
6,301
|
|
|
|
3,857
|
|
|
|
10,637
|
|
|
Minimum annual rentals on noncancellable leases
|
|
|
2,423
|
|
|
|
332
|
|
|
|
569
|
|
|
|
408
|
|
|
|
1,114
|
|
|
Nonqualified pension and postretirement benefits
|
|
|
572
|
|
|
|
69
|
|
|
|
123
|
|
|
|
117
|
|
|
|
263
|
|
|
Purchase obligations (c)
|
|
|
608
|
|
|
|
258
|
|
|
|
247
|
|
|
|
96
|
|
|
|
7
|
|
|
Total contractual cash obligations
|
|
$
|
75,313
|
|
|
$
|
44,953
|
|
|
$
|
11,705
|
|
|
$
|
5,821
|
|
|
$
|
12,834
|
|
|
(a)
|
Includes purchase accounting adjustments.
|
|
(b)
|
Includes basis adjustment relating to accounting hedges.
|
|
(c)
|
Includes purchase obligations for goods and services covered by noncancellable contracts and contracts including cancellation fees.
|
At June 30, 2011, the liability for uncertain tax positions, excluding associated interest and penalties, was $285 million. This liability
represents an estimate of tax positions that we have taken in our tax returns which ultimately may not be sustained upon examination by taxing authorities. Since the ultimate amount and timing of any future cash settlements cannot be predicted with
reasonable certainty, this estimated liability has been excluded from the contractual obligations table. See Note 15 Income Taxes in the Notes To Consolidated Financial Statements of this Report for additional information.
Our contractual obligations totaled $84.6 billion at December 31, 2010. The decline in the comparison is primarily attributable to decreases in the
remaining contractual maturities of time deposits and maturities on borrowed funds.
Other Commitments (a)
|
|
|
|
|
|
|
|
|
|
|
|
|
|
|
|
|
|
|
|
|
|
|
|
|
|
|
|
Amount Of Commitment Expiration
By Period
|
|
|
June 30, 2011 – in millions
|
|
Total
Amounts
Committed
|
|
|
Less
than one
year
|
|
|
One to
three
years
|
|
|
Four to
five
years
|
|
|
After
five
years
|
|
|
Net unfunded credit commitments
|
|
$
|
99,791
|
|
|
$
|
52,536
|
|
|
$
|
33,471
|
|
|
$
|
13,376
|
|
|
$
|
408
|
|
|
Standby letters of credit (b)
|
|
|
10,697
|
|
|
|
4,387
|
|
|
|
5,212
|
|
|
|
1,014
|
|
|
|
84
|
|
|
Reinsurance agreements (c)
|
|
|
5,713
|
|
|
|
2,057
|
|
|
|
112
|
|
|
|
57
|
|
|
|
3,487
|
|
|
Other commitments (d)
|
|
|
734
|
|
|
|
399
|
|
|
|
259
|
|
|
|
70
|
|
|
|
6
|
|
|
Total commitments
|
|
$
|
116,935
|
|
|
$
|
59,379
|
|
|
$
|
39,054
|
|
|
$
|
14,517
|
|
|
$
|
3,985
|
|
|
(a)
|
Other commitments are funding commitments that could potentially require performance in the event of demands by third parties or contingent events. Loan commitments are
reported net of syndications, assignments and participations.
|
|
(b)
|
Includes $7.4 billion of standby letters of credit that support remarketing programs for customers’ variable rate demand notes.
|
|
(c)
|
Reinsurance agreements are with third-party insurers related to insurance sold to our customers.
|
|
(d)
|
Includes unfunded commitments related to private equity investments of $285 million and other investments of $6 million that are not on our Consolidated Balance Sheet.
Also includes commitments related to tax credit investments of $409 million and other direct equity investments of $34 million that are included in Other liabilities on our Consolidated Balance Sheet.
|
M
ARKET
R
ISK
M
ANAGEMENT
O
VERVIEW
Market risk is the risk of a loss in earnings or economic value due to adverse movements in market factors such as interest rates, credit spreads, foreign
exchange rates, and equity prices. We are exposed to market risk primarily by our involvement in the following activities, among others:
|
|
•
|
|
Traditional banking activities of taking deposits and extending loans,
|
|
|
•
|
|
Equity and other investments and activities whose economic values are directly impacted by market factors, and
|
|
|
•
|
|
Trading in fixed income products, equities, derivatives, and foreign exchange, as a result of customer activities and underwriting.
|
We have established enterprise-wide policies and methodologies to identify, measure, monitor, and report market risk.
Market Risk Management provides independent oversight by monitoring compliance with these limits and guidelines, and reporting significant risks in the business to the Risk Committee of the Board.
M
ARKET
R
ISK
M
ANAGEMENT
– I
NTEREST
R
ATE
R
ISK
Interest rate risk results primarily from our traditional banking activities of gathering deposits and extending loans. Many factors,
including economic and financial conditions, movements in interest rates, and consumer preferences, affect the difference between the interest that we earn on assets and the interest that we pay on liabilities and the level of our
noninterest-bearing funding sources. Due to the repricing term mismatches and embedded options inherent in certain of these products, changes in market interest rates not only affect expected near-term earnings, but also the economic values of these
assets and liabilities.
Asset and Liability Management centrally manages interest rate risk within limits and guidelines set forth in our
risk management policies approved by management’s Asset and Liability Committee and the Risk Committee of the Board.
53
Sensitivity results and market interest rate benchmarks for the second quarters of 2011 and 2010 follow:
Interest Sensitivity Analysis
|
|
|
|
|
|
|
|
|
|
|
|
|
Second
Quarter
2011
|
|
|
Second
Quarter
2010
|
|
|
Net Interest Income Sensitivity Simulation
|
|
|
|
|
|
|
|
|
|
Effect on net interest income in first year from gradual interest rate change over following 12 months of:
|
|
|
|
|
|
|
|
|
|
100 basis point increase
|
|
|
1.4
|
%
|
|
|
1.1
|
%
|
|
100 basis point decrease (a)
|
|
|
(1.1
|
)%
|
|
|
(1.6
|
)%
|
|
Effect on net interest income in second year from gradual interest rate change over the preceding 12 months of:
|
|
|
|
|
|
|
|
|
|
100 basis point increase
|
|
|
4.5
|
%
|
|
|
.7
|
%
|
|
100 basis point decrease (a)
|
|
|
(3.8
|
)%
|
|
|
(5.4
|
)%
|
|
Duration of Equity Model (a)
|
|
|
|
|
|
|
|
|
|
Base case duration of equity (in years):
|
|
|
(1.0
|
)
|
|
|
(3.0
|
)
|
|
Key Period-End Interest Rates
|
|
|
|
|
|
|
|
|
|
One-month LIBOR
|
|
|
.19
|
%
|
|
|
.35
|
%
|
|
Three-year swap
|
|
|
1.15
|
%
|
|
|
1.33
|
%
|
|
(a)
|
Given the inherent limitations in certain of these measurement tools and techniques, results become less meaningful as interest rates approach zero.
|
In addition to measuring the effect on net interest income assuming parallel changes in current interest rates, we routinely
simulate the effects of a number of nonparallel interest rate environments. The following Net Interest Income Sensitivity to Alternative Rate Scenarios table reflects the percentage change in net interest income over the next two 12-month periods
assuming (i) the PNC Economist’s most likely rate forecast, (ii) implied market forward rates, and (iii) a Two-Ten Slope decrease (a 200 basis point decrease between two-year and ten-year rates superimposed on current base rates)
scenario.
Net Interest Income Sensitivity to Alternative Rate Scenarios (Second Quarter 2011)
|
|
|
|
|
|
|
|
|
|
|
|
|
|
|
|
|
PNC
Economist
|
|
|
Market
Forward
|
|
|
Two-Ten
Slope
|
|
|
First year sensitivity
|
|
|
.1
|
%
|
|
|
—
|
%
|
|
|
.8
|
%
|
|
Second year sensitivity
|
|
|
3.1
|
%
|
|
|
2.5
|
%
|
|
|
.5
|
%
|
All changes in forecasted net interest income are relative to results in a base rate scenario where current market rates
are assumed to remain unchanged over the forecast horizon.
When forecasting net interest income, we make assumptions about interest rates and
the shape of the yield curve, the volume and characteristics of new business, and the behavior of existing on- and off-balance sheet positions. These assumptions determine the future level of simulated net interest income in the base interest rate
scenario and the other interest rate scenarios presented in the above table. These simulations assume that as assets and liabilities mature, they are replaced or repriced at then current market rates. We also
consider forward projections of purchase accounting accretion when forecasting net interest income.
The following graph presents the yield curves for the base rate scenario and each of the alternate scenarios one year forward.
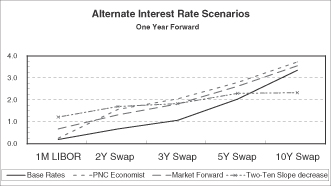
The second quarter 2011 interest sensitivity analyses indicate that our Consolidated Balance Sheet is positioned to
benefit from an increase in interest rates and an upward sloping interest rate yield curve. We believe that we have the deposit funding base and balance sheet flexibility to adjust, where appropriate and permissible, to changing interest rates and
market conditions.
M
ARKET
R
ISK
M
ANAGEMENT
– T
RADING
R
ISK
Our trading activities are primarily customer-driven trading in fixed income securities, derivatives, and foreign
exchange contracts. They also include the underwriting of fixed income and equity securities.
We use value-at-risk (VaR) as the primary means
to measure and monitor market risk in trading activities. PNC began measuring enterprise wide VaR internally on a diversified basis at a 95% confidence interval in the second quarter of 2011. Prior to this change, we had evaluated both diversified
and non-diversified VaR during the first quarter of 2011. During the first six months of 2011, our diversified VaR ranged between $.5 million and $3.5 million, averaging $1.0 million. Previously, we reported VaR on a non-diversified basis at a 99%
confidence interval. We believe a diversified VaR is a better representation of risk as it reflects empirical correlations across different asset classes. Additionally, moving to a 95% confidence interval from a 99% confidence interval allows for a
risk metric that is not heavily influenced by a few outliers.
To help ensure the integrity of the models used to calculate VaR for each
portfolio and enterprise-wide, we use a process known as backtesting. The backtesting process consists of comparing actual observations of trading-related gains or losses against the VaR levels that were calculated at the close of the prior day.
Over a typical business cycle, we would expect an average of twelve to thirteen instances a year in which actual losses exceeded the prior day VaR measure at the
54
enterprise-wide level at a 95% confidence interval; we would also expect an average of two or three instances a year at a 99% confidence interval. There were no such instances during the three
months from April 1, 2011 to June 30, 2011 under our diversified VaR measure. Additionally, there were no such instances during the first six months of 2011 or 2010, under our non-diversified VaR measure. Under both measures, we use a 500
day look back period for backtesting and include customer related revenue. Comparatively, the results in the first six months of 2011 and 2010 to the applicable 500 day look back periods were less volatile; and customer revenue helps reduce trading
losses. Therefore, there were no instances of actual losses exceeding the prior day VaR measure.
The following graph shows a comparison of
enterprise-wide trading-related gains and losses against prior day diversified VaR for the period.

Total trading revenue was as follows:
Trading Revenue
|
|
|
|
|
|
|
|
|
|
|
Six months ended June 30
In millions
|
|
2011
|
|
|
2010
|
|
|
Net interest income
|
|
$
|
22
|
|
|
$
|
33
|
|
|
Noninterest income
|
|
|
108
|
|
|
|
78
|
|
|
Total trading revenue
|
|
$
|
130
|
|
|
$
|
111
|
|
|
Securities underwriting and trading (a)
|
|
$
|
45
|
|
|
$
|
53
|
|
|
Foreign exchange
|
|
|
36
|
|
|
|
45
|
|
|
Financial derivatives and other
|
|
|
49
|
|
|
|
13
|
|
|
Total trading revenue (b)
|
|
$
|
130
|
|
|
$
|
111
|
|
|
|
|
|
|
Three months ended June 30
In millions
|
|
2011
|
|
|
2010
|
|
|
Net interest income
|
|
$
|
11
|
|
|
$
|
17
|
|
|
Noninterest income
|
|
|
58
|
|
|
|
20
|
|
|
Total trading revenue
|
|
$
|
69
|
|
|
$
|
37
|
|
|
Securities underwriting and trading (a)
|
|
$
|
29
|
|
|
$
|
13
|
|
|
Foreign exchange
|
|
|
19
|
|
|
|
23
|
|
|
Financial derivatives and other
|
|
|
21
|
|
|
|
1
|
|
|
Total trading revenue (b)
|
|
$
|
69
|
|
|
$
|
37
|
|
|
(a)
|
Includes changes in fair value for certain loans accounted for at fair value.
|
|
(b)
|
Product trading revenue includes customer related hedged activity.
|
Trading revenue excludes the impact of economic hedging activities, which relate primarily to residential mortgage servicing rights, and residential and held-for-sale commercial real estate loans.
Trading revenue for the first six months of 2011 increased $19 million compared with the first six months
of 2010 primarily due to improved customer derivatives results and the reduced impact of counterparty credit risk on valuations of customer derivative positions. These increases were partially offset by lower underwriting activity and the
elimination of proprietary trading activities.
Trading revenue for the second quarter increased $32 million compared to the second quarter of
2010 primarily due to the reduced impact of counterparty credit risk on valuations of customer positions and higher underwriting revenues. These increases were partially offset by the elimination of proprietary trading activities.
M
ARKET
R
ISK
M
ANAGEMENT
– E
QUITY
A
ND
O
THER
I
NVESTMENT
R
ISK
Equity investment risk is the risk of potential losses associated with investing in both
private and public equity markets. PNC invests primarily in private equity markets. In addition to extending credit, taking deposits, and underwriting and trading financial instruments, we make and manage direct investments in a variety of
transactions, including management buyouts, recapitalizations, and growth financings in a variety of industries. We also have investments in affiliated and non-affiliated funds that make similar investments in private equity and in debt and
equity-oriented hedge funds. The economic and/or book value of these investments and other assets such as loan servicing rights are directly affected by changes in market factors.
The primary risk measurement for equity and other investments is economic capital. Economic capital is a common measure of risk for credit, market and operational risk. It is an estimate of the worst-case
value depreciation over a one year horizon to a level commensurate with a financial institution with an A rating by the credit rating agencies. Given the illiquid nature of many of these types of investments, it can be a challenge to determine their
fair values. Market Risk Management and Finance provide independent oversight of the valuation process.
Various PNC business units manage our
equity and other investment activities. Our businesses are responsible for making investment decisions within the approved policy limits and associated guidelines.
A summary of our equity investments follows:
|
|
|
|
|
|
|
|
|
|
|
In millions
|
|
June 30
2011
|
|
|
Dec. 31
2010
|
|
|
BlackRock
|
|
$
|
5,158
|
|
|
$
|
5,017
|
|
|
Tax credit investments
|
|
|
2,360
|
|
|
|
2,054
|
|
|
Private equity
|
|
|
1,501
|
|
|
|
1,375
|
|
|
Visa
|
|
|
456
|
|
|
|
456
|
|
|
Other
|
|
|
301
|
|
|
|
318
|
|
|
Total
|
|
$
|
9,776
|
|
|
$
|
9,220
|
|
55
BlackRock
PNC owned approximately 36 million common stock equivalent shares of BlackRock equity at June 30, 2011, accounted for under the equity method. The primary risk measurement, similar to other
equity investments, is economic capital. The Business Segments Review section of this Financial Review includes additional information about BlackRock.
Tax Credit Investments
Included in our equity investments are tax credit
investments which are mostly accounted for under the equity method. These investments, as well as equity investments held by consolidated partnerships, totaled $2.4 billion at June 30, 2011 and $2.1 billion at December 31, 2010.
Private Equity
The
private equity portfolio is an illiquid portfolio comprised of equity and mezzanine investments that vary by industry, stage and type of investment.
Private equity investments carried at estimated fair value totaled $1.5 billion at June 30, 2011 and $1.4 billion at December 31, 2010. As of June 30, 2011, $849 million was invested
directly in a variety of companies and $652 million was invested indirectly through various private equity funds. Included in direct investments are investment activities of two private equity funds that are consolidated for financial reporting
purposes. The noncontrolling interests of these funds totaled $260 million as of June 30, 2011. The indirect private equity funds are not redeemable, but PNC receives distributions over the life of the partnership from liquidation of the
underlying investments by the investee.
Our unfunded commitments related to private equity totaled $285 million at June 30, 2011
compared with $319 million at December 31, 2010.
Visa
At June 30, 2011, our investment in Visa Class B common shares totaled approximately 23 million shares. In March 2011, Visa funded $400 million to their litigation escrow account and reduced the
conversion ratio of Visa B to A shares. We consequently recognized our estimated $38 million share of the $400 million as a reduction of our previously established indemnification liability and a reduction of noninterest expense. Our indemnification
liability included on our Consolidated Balance Sheet at June 30, 2011 totaled $32 million. Our ultimate exposure to the specified Visa litigation may be different than this amount.
As of June 30, 2011, we had recognized $456 million of our Visa ownership, which we acquired with National City, on our Consolidated Balance Sheet. Based on the June 30, 2011 closing price of
$84.26 for the Visa Class A shares, the market value of our total investment was $958 million. The Visa
Class B common shares we own generally will not be transferable, except under limited circumstances, until they can be converted into shares of the publicly traded class of stock, which cannot
happen until the settlement of all of the specified litigation. It is expected that Visa will continue to adjust the conversion ratio of Visa Class B to Class A shares in connection with any settlements in excess of any amounts then in escrow
for that purpose and will also reduce the conversion ratio to the extent that it adds any funds to the escrow in the future.
Note 17
Commitments and Guarantees in our Notes To Consolidated Financial Statements of this Report has further information on our Visa indemnification obligation.
Other Investments
We also make investments in affiliated and non-affiliated funds
with both traditional and alternative investment strategies. The economic values could be driven by either the fixed-income market or the equity markets, or both. At June 30, 2011, other investments totaled $301 million compared with $318
million at December 31, 2010. We recognized net gains related to these investments of $13 million during the first six months of 2011, including net losses of $2 million during the second quarter. We recognized net gains related to these
investments of $26 million during the first six months of 2010, including $8 million during the second quarter.
Given the nature of these
investments, if market conditions affecting their valuation were to worsen, we could incur future losses.
Our unfunded commitments related to
other investments totaled $6 million at June 30, 2011 and $11 million at December 31, 2010.
Financial Derivatives
We use a variety of financial derivatives as part of the overall asset and liability risk management process to help manage interest
rate, market and credit risk inherent in our business activities. Substantially all such instruments are used to manage risk related to changes in interest rates. Interest rate and total return swaps, interest rate caps and floors, swaptions,
options, forwards and futures contracts are the primary instruments we use for interest rate risk management. We also enter into derivatives with customers to facilitate their risk management activities.
Financial derivatives involve, to varying degrees, interest rate, market and credit risk. For interest rate swaps and total return swaps, options and
futures contracts, only periodic cash payments and, with respect to options, premiums are exchanged. Therefore, cash requirements and exposure to credit risk are significantly less than the notional amount on these instruments.
56
Further information on our financial derivatives is presented in Note 1 Accounting Policies in our Notes To
Consolidated Financial Statements under Part II, Item 8 of our 2010 Form 10-K and in Note 12 Financial Derivatives in the Notes To Consolidated Financial Statements in this Report, which is incorporated here by reference.
Not all elements of interest rate, market and credit risk are addressed through the use of financial or
other derivatives, and such instruments may be ineffective for their intended purposes due to unanticipated market changes, among other reasons.
57
The following table provides the notional or contractual amounts and estimated net fair value of financial
derivatives at June 30, 2011 and December 31, 2010.
Financial Derivatives
|
|
|
|
|
|
|
|
|
|
|
|
|
|
|
|
|
|
|
|
|
June 30, 2011
|
|
|
December 31, 2010
|
|
|
In millions
|
|
Notional/
Contractual
Amount
|
|
|
Estimated
Net Fair
Value
|
|
|
Notional/
Contractual
Amount
|
|
|
Estimated
Net Fair
Value
|
|
|
Derivatives designated as hedging instruments under GAAP
|
|
|
|
|
|
|
|
|
|
|
|
|
|
|
|
|
|
Interest rate contracts (a)
|
|
|
|
|
|
|
|
|
|
|
|
|
|
|
|
|
|
Asset rate conversion
|
|
|
|
|
|
|
|
|
|
|
|
|
|
|
|
|
|
Receive fixed swaps
|
|
$
|
13,813
|
|
|
$
|
423
|
|
|
$
|
14,452
|
|
|
$
|
332
|
|
|
Pay fixed swaps (c) (d)
|
|
|
2,784
|
|
|
|
(22
|
)
|
|
|
1,669
|
|
|
|
12
|
|
|
Liability rate conversion
|
|
|
|
|
|
|
|
|
|
|
|
|
|
|
|
|
|
Receive fixed swaps
|
|
|
9,249
|
|
|
|
911
|
|
|
|
9,803
|
|
|
|
834
|
|
|
Forward purchase commitments
|
|
|
1,750
|
|
|
|
(1
|
)
|
|
|
2,350
|
|
|
|
(8
|
)
|
|
Total interest rate risk management
|
|
|
27,596
|
|
|
|
1,311
|
|
|
|
28,274
|
|
|
|
1,170
|
|
|
Total derivatives designated as hedging instruments (b)
|
|
$
|
27,596
|
|
|
$
|
1,311
|
|
|
$
|
28,274
|
|
|
$
|
1,170
|
|
|
Derivatives not designated as hedging instruments under GAAP
|
|
|
|
|
|
|
|
|
|
|
|
|
|
|
|
|
|
Derivatives used for residential mortgage banking activities:
|
|
|
|
|
|
|
|
|
|
|
|
|
|
|
|
|
|
Interest rate contracts
|
|
|
|
|
|
|
|
|
|
|
|
|
|
|
|
|
|
Swaps
|
|
$
|
99,579
|
|
|
$
|
154
|
|
|
$
|
83,421
|
|
|
$
|
63
|
|
|
Futures
|
|
|
56,940
|
|
|
|
|
|
|
|
51,699
|
|
|
|
|
|
|
Future options
|
|
|
6,040
|
|
|
|
2
|
|
|
|
31,250
|
|
|
|
21
|
|
|
Bond options
|
|
|
650
|
|
|
|
2
|
|
|
|
|
|
|
|
|
|
|
Swaptions
|
|
|
6,370
|
|
|
|
64
|
|
|
|
11,040
|
|
|
|
28
|
|
|
Commitments related to residential mortgage assets
|
|
|
12,153
|
|
|
|
6
|
|
|
|
16,652
|
|
|
|
47
|
|
|
Total residential mortgage banking activities
|
|
$
|
181,732
|
|
|
$
|
228
|
|
|
$
|
194,062
|
|
|
$
|
159
|
|
|
Derivatives used for commercial mortgage banking activities:
|
|
|
|
|
|
|
|
|
|
|
|
|
|
|
|
|
|
Interest rate contracts
|
|
|
|
|
|
|
|
|
|
|
|
|
|
|
|
|
|
Swaps
|
|
$
|
1,680
|
|
|
$
|
(40
|
)
|
|
$
|
1,744
|
|
|
$
|
(41
|
)
|
|
Swaptions
|
|
|
100
|
|
|
|
|
|
|
|
|
|
|
|
|
|
|
Commitments related to commercial mortgage assets
|
|
|
1,221
|
|
|
|
21
|
|
|
|
1,228
|
|
|
|
5
|
|
|
Credit contracts
|
|
|
|
|
|
|
|
|
|
|
|
|
|
|
|
|
|
Credit default swaps
|
|
|
145
|
|
|
|
6
|
|
|
|
210
|
|
|
|
8
|
|
|
Total commercial mortgage banking activities
|
|
$
|
3,146
|
|
|
$
|
(13
|
)
|
|
$
|
3,182
|
|
|
$
|
(28
|
)
|
|
Derivatives used for customer-related activities:
|
|
|
|
|
|
|
|
|
|
|
|
|
|
|
|
|
|
Interest rate contracts
|
|
|
|
|
|
|
|
|
|
|
|
|
|
|
|
|
|
Swaps (d)
|
|
$
|
95,822
|
|
|
$
|
(133
|
)
|
|
$
|
92,248
|
|
|
$
|
(104
|
)
|
|
Caps/floors
|
|
|
|
|
|
|
|
|
|
|
|
|
|
|
|
|
|
Sold
|
|
|
4,038
|
|
|
|
(14
|
)
|
|
|
3,207
|
|
|
|
(15
|
)
|
|
Purchased
|
|
|
3,973
|
|
|
|
20
|
|
|
|
2,528
|
|
|
|
14
|
|
|
Swaptions
|
|
|
2,172
|
|
|
|
21
|
|
|
|
2,165
|
|
|
|
13
|
|
|
Futures
|
|
|
2,638
|
|
|
|
|
|
|
|
2,793
|
|
|
|
|
|
|
Commitments related to residential mortgage assets
|
|
|
1,327
|
|
|
|
1
|
|
|
|
738
|
|
|
|
|
|
|
Foreign exchange contracts
|
|
|
10,447
|
|
|
|
(5
|
)
|
|
|
7,913
|
|
|
|
(6
|
)
|
|
Equity contracts (d)
|
|
|
344
|
|
|
|
(4
|
)
|
|
|
334
|
|
|
|
(3
|
)
|
|
Credit contracts
|
|
|
|
|
|
|
|
|
|
|
|
|
|
|
|
|
|
Risk participation agreements
|
|
|
3,166
|
|
|
|
1
|
|
|
|
2,738
|
|
|
|
3
|
|
|
Total customer-related
|
|
$
|
123,927
|
|
|
$
|
(113
|
)
|
|
$
|
114,664
|
|
|
$
|
(98
|
)
|
|
Derivatives used for other risk management activities:
|
|
|
|
|
|
|
|
|
|
|
|
|
|
|
|
|
|
Interest rate contracts
|
|
|
|
|
|
|
|
|
|
|
|
|
|
|
|
|
|
Swaps
|
|
$
|
1,754
|
|
|
$
|
5
|
|
|
$
|
3,021
|
|
|
$
|
6
|
|
|
Swaptions
|
|
|
|
|
|
|
|
|
|
|
100
|
|
|
|
4
|
|
|
Futures
|
|
|
725
|
|
|
|
|
|
|
|
298
|
|
|
|
|
|
|
Commitments related to residential mortgage assets
|
|
|
|
|
|
|
|
|
|
|
1,100
|
|
|
|
1
|
|
|
Foreign exchange contracts (d)
|
|
|
29
|
|
|
|
(6
|
)
|
|
|
32
|
|
|
|
(4
|
)
|
|
Credit contracts
|
|
|
|
|
|
|
|
|
|
|
|
|
|
|
|
|
|
Credit default swaps
|
|
|
438
|
|
|
|
6
|
|
|
|
551
|
|
|
|
8
|
|
|
Other contracts (d) (e)
|
|
|
209
|
|
|
|
(426
|
)
|
|
|
209
|
|
|
|
(396
|
)
|
|
Total other risk management
|
|
$
|
3,155
|
|
|
$
|
(421
|
)
|
|
$
|
5,311
|
|
|
$
|
(381
|
)
|
|
Total derivatives not designated as hedging instruments
|
|
$
|
311,960
|
|
|
$
|
(319
|
)
|
|
$
|
317,219
|
|
|
$
|
(348
|
)
|
|
Total Gross Derivatives
|
|
$
|
339,556
|
|
|
$
|
992
|
|
|
$
|
345,493
|
|
|
$
|
822
|
|
|
(a)
|
The floating rate portion of interest rate contracts is based on money-market indices. As a percent of notional amount, 57% were based on 1-month LIBOR and 43% on
3-month LIBOR at June 30, 2011 compared with 58% and 42%, respectively, at December 31, 2010.
|
|
(b)
|
Fair value amount includes net accrued interest receivable of $142 million at June 30, 2011 and $132 million at December 31, 2010.
|
|
(c)
|
Includes zero-coupon swaps.
|
|
(d)
|
The increases in the negative fair values from December 31, 2010 to June 30, 2011 for interest rate contracts, foreign exchange, equity contracts and other contracts
were due to the changes in fair values of the existing contracts along with new contracts entered into during the first six months of 2011 and contracts terminated during that period.
|
|
(e)
|
Includes PNC’s obligation to fund a portion of certain BlackRock LTIP programs.
|
58
I
NTERNAL
C
ONTROLS
A
ND
D
ISCLOSURE
C
ONTROLS
A
ND
P
ROCEDURES
As of June 30, 2011, we performed
an evaluation under the supervision and with the participation of our management, including the Chairman and Chief Executive Officer and the Executive Vice President and Chief Financial Officer, of the effectiveness of the design and operation of
our disclosure controls and procedures and of changes in our internal control over financial reporting.
Based on that evaluation, our
Chairman and Chief Executive Officer and our Executive Vice President and Chief Financial Officer concluded that our disclosure controls and procedures (as defined in Rule 13a-15(e) under the Securities and Exchange Act of 1934, as amended) were
effective as of June 30, 2011, and that there has been no change in PNC’s internal control over financial reporting that occurred during the second quarter of 2011 that has materially affected, or is reasonably likely to materially affect,
our internal control over financial reporting.
G
LOSSARY
OF
T
ERMS
Accretable net interest (Accretable yield)
– The excess of cash flows expected to be collected on a
purchased impaired loan over the carrying value of the loan. The accretable net interest is recognized into interest income over the remaining life of the loan using the constant effective yield method.
Adjusted average total assets
– Primarily comprised of total average quarterly (or annual) assets plus (less) unrealized losses (gains) on
investment securities, less goodwill and certain other intangible assets (net of eligible deferred taxes).
Annualized
– Adjusted
to reflect a full year of activity.
Assets under management
– Assets over which we have sole or shared investment authority for
our customers/clients. We do not include these assets on our Consolidated Balance Sheet.
Basis point
– One hundredth of a
percentage point.
Cash recoveries
– Cash recoveries used in the context of purchased impaired loans represent cash payments from
customers that exceeded the recorded investment of the designated impaired loan.
Charge-off
– Process of removing a loan or
portion of a loan from our balance sheet because it is considered uncollectible. We also record a charge-off when a loan is transferred from portfolio holdings to held for sale by reducing the loan carrying amount to the fair value of the loan, if
fair value is less than carrying amount.
Carrying value of purchased impaired loans
– The net value on the balance sheet which
represents the recorded investment less any valuation allowance.
Common shareholders’ equity to total assets
– Common
shareholders’ equity divided by total assets. Common shareholders’ equity equals total shareholders’ equity less the liquidation value of preferred stock.
Corporate banking primary client
– A corporate banking client relationship with annual revenue generation of $10,000 to $50,000 or more.
Credit derivatives
– Contractual agreements, primarily credit default swaps, that provide protection against a credit event of one or more
referenced credits. The nature of a credit event is established by the protection buyer and protection seller at the inception of a transaction, and such events include bankruptcy, insolvency and failure to meet payment obligations when due. The
buyer of the credit derivative pays a periodic fee in return for a payment by the protection seller upon the occurrence, if any, of a credit event.
Credit spread
– The difference in yield between debt issues of similar maturity. The excess of yield attributable to credit spread is often used as a measure of relative creditworthiness, with
a reduction in the credit spread reflecting an improvement in the borrower’s perceived creditworthiness.
Derivatives
–
Financial contracts whose value is derived from changes in publicly traded securities, interest rates, currency exchange rates or market indices. Derivatives cover a wide assortment of financial contracts, including but not limited to forward
contracts, futures, options and swaps.
Duration of equity
– An estimate of the rate sensitivity of our economic value of equity.
A negative duration of equity is associated with asset sensitivity (
i.e.,
positioned for rising interest rates), while a positive value implies liability sensitivity (
i.e.,
positioned for declining interest rates). For example, if the
duration of equity is +1.5 years, the economic value of equity declines by 1.5% for each 100 basis point increase in interest rates.
Earning assets
– Assets that generate income, which include: Federal funds sold; resale agreements; trading securities; interest-earning
deposits with banks; loans held for sale; loans; investment securities; and certain other assets.
Economic capital
– Represents
the amount of resources that a business or business segment should hold to guard against potentially large losses that could cause insolvency. It is based on a measurement of economic risk, as opposed to risk as defined by regulatory bodies. The
economic capital measurement process involves converting a risk distribution to the capital that is required to support the risk, consistent with our target credit rating. As such, economic risk serves as a
59
“common currency” of risk that allows us to compare different risks on a similar basis.
Effective duration
– A measurement, expressed in years, that, when multiplied by a change in interest rates, would approximate the percentage change in value of on- and off- balance sheet
positions.
Efficiency
– Noninterest expense divided by total revenue.
Fair value
– The price that would be received to sell an asset or paid to transfer a liability in an orderly transaction between market participants at the measurement date.
FICO score
– A credit bureau-based industry standard score created by Fair Isaac Co. which predicts the likelihood of borrower default. We
use FICO scores both in underwriting and assessing credit risk in our consumer lending portfolio. Lower FICO scores indicate likely higher risk of default, while higher FICO scores indicate likely lower risk of default. FICO scores are updated on a
periodic basis.
Foreign exchange contracts
– Contracts that provide for the future receipt and delivery of foreign currency at
previously agreed-upon terms.
Funds transfer pricing
– A management accounting methodology designed to recognize the net interest
income effects of sources and uses of funds provided by the assets and liabilities of a business segment. We assign these balances LIBOR-based funding rates at origination that represent the interest cost for us to raise/invest funds with similar
maturity and repricing structures.
Futures and forward contracts
– Contracts in which the buyer agrees to purchase and the seller
agrees to deliver a specific financial instrument at a predetermined price or yield. May be settled either in cash or by delivery of the underlying financial instrument.
GAAP
– Accounting principles generally accepted in the United States of America.
Interest rate floors and caps
– Interest rate protection instruments that involve payment from the protection seller to the protection buyer
of an interest differential, which represents the difference between a short-term rate (e.g., three-month LIBOR) and an agreed-upon rate (the strike rate) applied to a notional principal amount.
Interest rate swap contracts
– Contracts that are entered into primarily as an asset/liability management strategy to reduce interest rate
risk. Interest rate swap contracts are exchanges of interest rate payments, such as fixed-rate payments for floating-rate payments, based on notional principal amounts.
Intrinsic value
– The difference between the price, if any, required to be paid for stock
issued pursuant to an equity compensation arrangement and the fair market value of the underlying stock.
Investment securities
–
Collectively, securities available for sale and securities held to maturity.
Leverage ratio
– Tier 1 risk-based capital divided
by adjusted average total assets.
LIBOR
– Acronym for London InterBank Offered Rate. LIBOR is the average interest rate charged
when banks in the London wholesale money market (or interbank market) borrow unsecured funds from each other. LIBOR rates are used as a benchmark for interest rates on a global basis.
Loan-to-value ratio (LTV)
– A calculation of a loan’s collateral coverage that is used both in underwriting and assessing credit risk in our lending portfolio. LTV is the sum total of
loan obligations secured by collateral divided by the market value of that same collateral. Market values of the collateral are based on an independent valuation of the collateral. For example, an LTV of less than 90% is better secured and has less
credit risk than an LTV of greater than or equal to 90%. Our real estate market values are updated on an annual basis but may be updated more frequently for select loans.
Loss Given Default (LGD)
– An estimate of recovery based on collateral type, collateral value, loan exposure, or the guarantor(s) quality and guaranty type (full or partial). Each loan
has its own LGD. The LGD risk rating measures the percentage of exposure of a specific credit obligation that we expect to lose if default occurs. LGD is net of recovery, through either liquidation of collateral or deficiency judgments rendered from
foreclosure or bankruptcy proceedings. The LGD rating is updated with the same frequency as the borrower’s PD rating, and should be done more frequently than the PD if the collateral values and amounts change often.
Net interest income from loans and deposits
– A management accounting assessment, using funds transfer pricing methodology, of the net
interest contribution from loans and deposits.
Net interest margin
– Annualized taxable-equivalent net interest income divided by
average earning assets.
Nonaccretable difference
– Contractually required payments receivable on a purchased impaired loan in
excess of the cash flows expected to be collected.
Nondiscretionary assets under administration
– Assets we hold for our
customers/clients in a non-discretionary, custodial capacity. We do not include these assets on our Consolidated Balance Sheet.
60
Nonperforming assets
– Nonperforming assets include non-accrual loans, certain non-accrual
troubled debt restructured loans, OREO, foreclosed and other assets. We do not accrue interest income on assets classified as nonperforming.
Nonperforming loans
– Loans for which we do not accrue interest income. Nonperforming loans include loans to commercial, commercial real
estate, equipment lease financing, consumer (including loans and lines of credit secured by residential real estate), and residential real estate (including mortgages and construction) customers as well as certain non-accrual troubled debt
restructured loans. Nonperforming loans do not include loans held for sale or OREO and foreclosed assets. Nonperforming loans do not include purchased impaired loans as we are currently accreting interest income over the expected life of the loans.
Notional amount
– A number of currency units, shares, or other units specified in a derivative contract.
Operating leverage
– The period to period dollar or percentage change in total revenue (GAAP basis) less the dollar or percentage change in
noninterest expense. A positive variance indicates that revenue growth exceeded expense growth (
i.e.,
positive operating leverage) while a negative variance implies expense growth exceeded revenue growth (
i.e.,
negative operating
leverage).
Options
– Contracts that grant the purchaser, for a premium payment, the right, but not the obligation, to either
purchase or sell the associated financial instrument at a set price during a specified period or at a specified date in the future.
Other
real estate owned (OREO)
– Foreclosed assets taken in settlement of troubled loans through surrender or foreclosure. Foreclosed assets include all assets received in full or partial satisfaction of a loan and include real and personal
property, equity interests in corporations, partnerships, joint ventures, and beneficial interests in trusts. Premises that are no longer used in operations may also be included in real estate owned.
Other-than-temporary impairment (OTTI)
– When the fair value of a security is less than its amortized cost basis, an assessment is performed
to determine whether the impairment is other-than-temporary. If we intend to sell the security or more likely than not will be required to sell the security before recovery of its amortized cost basis less any current-period credit loss, an
other-than-temporary impairment is considered to have occurred. In such cases, an other-than-temporary impairment is recognized in earnings equal to the entire difference between the investment’s amortized cost basis and its fair value at the
balance sheet date. Further, if we do not expect to recover the entire amortized cost of the security, an other-than-temporary impairment is considered to have occurred. However for debt securities, if we do not intend to sell the security and it is
not more likely than not that we will
be required to sell the security before its recovery, the other-than-temporary loss is separated into (a) the amount representing the credit loss, and (b) the amount related to all
other factors. The other-than-temporary impairment related to credit losses is recognized in earnings while the amount related to all other factors is recognized in other comprehensive income, net of tax.
Pretax earnings
– Income from continuing operations before income taxes and noncontrolling interests.
Pretax, pre-provision earnings from continuing operations
– Total revenue less noninterest expense, both from continuing operations.
Probability of Default (PD)
– An internal risk rating that indicates the likelihood that a credit obligor will enter into default
status.
Purchase accounting accretion
– Accretion of the discounts and premiums on acquired assets and liabilities. The purchase
accounting accretion is recognized in net interest income over the weighted average life of the financial instruments using the constant effective yield method.
Purchased impaired loans
– Acquired loans determined to be credit impaired under FASB ASC 310-30 (AICPA SOP 03-3). Loans are determined to be impaired if there is evidence of credit
deterioration since origination and for which it is probable that all contractually required payments will not be collected.
Recorded
investment
– The initial investment of a purchased impaired loan plus interest accretion and less any cash payments and writedowns to date. The recorded investment excludes any valuation allowance which is included in our allowance for loan
and lease losses.
Recovery
– Cash proceeds received on a loan that we had previously charged off. We credit the amount received
to the allowance for loan and lease losses.
Residential development loans
– Project-specific loans to commercial customers for
the construction or development of residential real estate including land, single family homes, condominiums and other residential properties. This would exclude loans to commercial customers where proceeds are for general corporate purposes whether
or not such facilities are secured.
Residential mortgage servicing rights hedge gains/(losses), net
– We have elected to measure
acquired or originated residential mortgage servicing rights (MSRs) at fair value under GAAP. We employ a risk management strategy designed to protect the economic value of MSRs from changes in interest rates. This strategy utilizes securities and a
portfolio of derivative instruments to hedge changes in the fair value of
61
MSRs arising from changes in interest rates. These financial instruments are expected to have changes in fair value which are negatively correlated to the change in fair value of the MSR
portfolio. Net MSR hedge gains/(losses) represent the change in the fair value of MSRs, exclusive of changes due to time decay and payoffs, combined with the change in the fair value of the associated securities and derivative instruments.
Return on average assets
– Annualized net income divided by average assets.
Return on average capital
– Annualized net income divided by average capital.
Return on average common shareholders’ equity
– Annualized net income less preferred stock dividends, including preferred stock discount accretion and redemptions, divided by average
common shareholders’ equity.
Risk-weighted assets
– Computed by the assignment of specific risk-weights (as defined by the
Board of Governors of the Federal Reserve System) to assets and off-balance sheet instruments.
Securitization
– The process of
legally transforming financial assets into securities.
Servicing rights
– An intangible asset or liability created by an
obligation to service assets for others. Typical servicing rights include the right to receive a fee for collecting and forwarding payments on loans and related taxes and insurance premiums held in escrow.
Swaptions
– Contracts that grant the purchaser, for a premium payment, the right, but not the obligation, to enter into an interest rate swap
agreement during a specified period or at a specified date in the future.
Taxable-equivalent interest
– The interest income
earned on certain assets is completely or partially exempt from Federal income tax. As such, these tax-exempt instruments typically yield lower returns than taxable investments. To provide more meaningful comparisons of yields and margins for all
interest-earning assets, we use interest income on a taxable-equivalent basis in calculating average yields and net interest margins by increasing the interest income earned on tax-exempt assets to make it fully equivalent to interest income earned
on other taxable investments. This adjustment is not permitted under GAAP on the Consolidated Income Statement.
Tier 1 common capital
– Tier 1 risk-based capital, less preferred equity, less trust preferred capital securities, and less noncontrolling interests.
Tier
1 common capital ratio
– Tier 1 common capital divided by period-end risk-weighted assets.
Tier 1 risk-based capital
– Total shareholders’ equity, plus trust preferred capital
securities, plus certain noncontrolling interests that are held by others; less goodwill and certain other intangible assets (net of eligible deferred taxes relating to taxable and nontaxable combinations), less equity investments in nonfinancial
companies less ineligible servicing assets and less net unrealized holding losses on available for sale equity securities. Net unrealized holding gains on available for sale equity securities, net unrealized holding gains (losses) on available for
sale debt securities and net unrealized holding gains (losses) on cash flow hedge derivatives are excluded from total shareholders’ equity for Tier 1 risk-based capital purposes.
Tier 1 risk-based capital ratio
– Tier 1 risk-based capital divided by period-end risk-weighted assets.
Total equity
– Total shareholders’ equity plus noncontrolling interests.
Total return swap
– A non-traditional swap where one party agrees to pay the other the “total return” of a defined underlying asset
(e.g
.,
a loan), usually in return for receiving a stream of LIBOR-based cash flows. The total returns of the asset, including interest and any default shortfall, are passed through to the counterparty. The counterparty is therefore assuming
the credit and economic risk of the underlying asset.
Total risk-based capital
– Tier 1 risk-based capital plus qualifying
subordinated debt and trust preferred securities, other noncontrolling interest not qualified as Tier 1, eligible gains on available for sale equity securities and the allowance for loan and lease losses, subject to certain limitations.
Total risk-based capital ratio
– Total risk-based capital divided by period-end risk-weighted assets.
Transaction deposits
– The sum of interest-bearing money market deposits, interest-bearing demand deposits, and noninterest-bearing deposits.
Troubled debt restructuring
– A restructuring of a loan whereby the lender for economic or legal reasons related to the
borrower’s financial difficulties grants a concession to the borrower that the lender would not otherwise consider.
Value-at-risk
(VaR)
– A statistically-based measure of risk which describes the amount of potential loss which may be incurred due to severe and adverse market movements. The measure is of the maximum loss which should not be exceeded on 99 out of 100
days.
Watchlist
– A list of criticized loans, credit exposure or other assets compiled for internal monitoring purposes. We
define criticized exposure for this purpose as exposure with an internal risk rating of other assets especially mentioned, substandard, doubtful or loss.
62
Yield curve
– A graph showing the relationship between the yields on financial instruments or
market indices of the same credit quality with different maturities. For example, a “normal” or “positive” yield curve exists when long-term bonds have higher yields than short-term bonds. A “flat” yield curve exists
when yields are the same for short-term and long-term bonds. A “steep” yield curve exists when yields on long-term bonds are significantly higher than on short-term bonds. An “inverted” or “negative” yield curve exists
when short-term bonds have higher yields than long-term bonds.
C
AUTIONARY
S
TATEMENT
R
EGARDING
F
ORWARD
-L
OOKING
I
NFORMATION
We make
statements in this Report, and may from time to time make other statements, regarding our outlook for earnings, revenues, expenses, capital levels, liquidity levels, asset quality and other matters regarding or affecting PNC and its future business
and operations that are forward-looking statements within the meaning of the Private Securities Litigation Reform Act. Forward-looking statements are typically identified by words such as “believe,” “plan,” “expect,”
“anticipate,” “see,” “intend,” “outlook,” “project,” “forecast,” “estimate,” “goal,” “will,” “should” and other similar words and expressions.
Forward-looking statements are subject to numerous assumptions, risks and uncertainties, which change over time.
Forward-looking statements
speak only as of the date made. We do not assume any duty and do not undertake to update forward-looking statements. Actual results or future events could differ, possibly materially, from those anticipated in forward-looking statements, as well as
from historical performance.
Our forward-looking statements are subject to the following principal risks and uncertainties.
|
•
|
|
Our businesses, financial results and balance sheet values are affected by business and economic conditions, including the following:
|
|
|
•
|
|
Changes in interest rates and valuations in debt, equity and other financial markets.
|
|
|
•
|
|
Disruptions in the liquidity and other functioning of U.S. and global financial markets.
|
|
|
•
|
|
The impact on financial markets and the economy of the downgrade by Standard & Poor’s of U.S. Treasury obligations and other U.S.
government-backed debt, as well as issues surrounding the level of U.S. and European government debt.
|
|
|
•
|
|
Actions by Federal Reserve, U.S. Treasury and other government agencies, including those that impact money supply and market interest rates.
|
|
|
•
|
|
Changes in customers’, suppliers’ and other counterparties’ performance and creditworthiness.
|
|
|
•
|
|
Slowing or failure of the current moderate economic recovery.
|
|
|
•
|
|
Continued effects of aftermath of recessionary conditions and uneven spread of positive impacts of recovery on the economy and our counterparties,
including adverse impacts on levels of unemployment, loan utilization rates, delinquencies, defaults and counterparty ability to meet credit and other obligations.
|
|
|
•
|
|
Changes in customer preferences and behavior, whether due to changing business and economic conditions, legislative and regulatory initiatives, or
other factors.
|
|
•
|
|
Our forward-looking financial statements are subject to the risk that economic and financial market conditions will be substantially different than we
are currently expecting. These statements are based on our current view that the moderate economic recovery is transitioning into a self-sustaining economic expansion in 2011, with faster economic growth in the second half pushing the unemployment
rate lower amidst continued low interest rates.
|
|
•
|
|
Legal and regulatory developments could have an impact on ability to operate our businesses, financial condition, results of operations, competitive
position, reputation, or pursuit of attractive acquisition opportunities. Reputational impacts could affect matters such as business generation and retention, liquidity, funding, and ability to attract and retain management. These developments could
include:
|
|
|
•
|
|
Changes resulting from legislative and regulatory reforms, including broad-based restructuring of financial industry regulation and changes to laws and
regulations involving tax, pension, bankruptcy, consumer protection, and other industry aspects, and changes in accounting policies and principles. We will be impacted by extensive reforms provided for in the Dodd-Frank Act and otherwise growing out
of the recent financial crisis, the precise nature, extent and timing of which, and their impact on us, remains uncertain.
|
|
|
•
|
|
Changes to regulations governing bank capital, including due to the Dodd-Frank Act and to Basel III initiatives.
|
|
|
•
|
|
Unfavorable resolution of legal proceedings or other claims and regulatory and other governmental investigations or other inquiries. In addition to
matters relating to PNC’s business and activities, such matters may include proceedings, claims, investigations, or inquiries relating to pre-acquisition business and activities of acquired companies, such as National City. These matters may
result in monetary judgments or settlements or other remedies, including fines, penalties, restitution or alterations in our business practices, and in additional expenses and
|
63
|
|
|
collateral costs, and may cause reputational harm to PNC following the acquisition and integration of acquired businesses into ours.
|
|
|
•
|
|
Results of regulatory examination and supervision process, including our failure to satisfy requirements of agreements with governmental agencies.
|
|
|
•
|
|
Impact on business and operating results of any costs associated with obtaining rights in intellectual property claimed by others and of adequacy of
our intellectual property protection in general.
|
|
•
|
|
Business and operating results are affected by our ability to identify and effectively manage risks inherent in our businesses, including, where
appropriate, through effective use of third-party insurance, derivatives, and capital management techniques, and to meet evolving regulatory capital standards. In particular, our results currently depend on our ability to manage elevated levels of
impaired assets.
|
|
•
|
|
Business and operating results also include impacts relating to our equity interest in BlackRock, Inc. and rely to a significant extent on information
provided to us by BlackRock. Risks and uncertainties that could affect BlackRock are discussed in more detail by BlackRock in SEC filings.
|
|
•
|
|
Our planned acquisition of RBC Bank (USA) presents us with risks and uncertainties related both to the acquisition transaction itself and its
integration into PNC after closing, including:
|
|
|
•
|
|
Closing is dependent on, among other things, receipt of regulatory and other applicable approvals, the timing of which cannot be predicted with
precision at this point and which may not be received at all. The impact of closing on PNC’s financial statements will be affected by the timing of the transaction.
|
|
|
•
|
|
The transaction (including integration of RBC Bank (USA)’s businesses) may be substantially more expensive to complete than anticipated.
Anticipated benefits, including cost savings and strategic gains, may be significantly harder or take longer to achieve than expected or may not be achieved in their entirety as a result of unexpected factors or events.
|
|
|
•
|
|
Our ability to achieve anticipated results from this transaction is dependent also on the following factors, in part related to the state of economic
and financial markets: the extent of credit losses in the acquired loan portfolios and the extent of deposit attrition. Also, litigation and governmental investigations that may be filed or commenced, as a
|
|
|
|
result of this transaction or otherwise, could impact the timing or realization of anticipated benefits to PNC.
|
|
|
•
|
|
Integration of RBC Bank (USA)’s business and operations into PNC, which will include conversion of RBC Bank (USA)’s different systems and
procedures, may take longer than anticipated or be more costly than anticipated or have unanticipated adverse results relating to RBC Bank (USA)’s or PNC’s existing businesses. PNC’s ability to integrate RBC Bank (USA) successfully
may be adversely affected by the fact that this transaction will result in PNC entering several markets where PNC does not currently have any meaningful retail presence.
|
|
•
|
|
In addition to the planned RBC Bank (USA) transaction, we grow our business in part by acquiring from time to time other financial services companies,
financial services assets and related deposits. These other acquisitions, including our planned acquisition of Flagstar branches and related deposits, often present risks and uncertainties analogous to those presented by the RBC Bank (USA)
transaction, as well as, in some cases, with risks related to entering into new lines of business.
|
|
•
|
|
Competition can have an impact on customer acquisition, growth and retention and on credit spreads and product pricing, which can affect market share,
deposits and revenues. Industry restructuring in the current environment could also impact our business and financial performance through changes in counterparty creditworthiness and performance and in competitive and regulatory landscape. Our
ability to anticipate and respond to technological changes can also impact our ability to respond to customer needs and meet competitive demands.
|
|
•
|
|
Business and operating results can also be affected by widespread disasters, dislocations, terrorist activities or international hostilities through
impacts on the economy and financial markets generally or on us or our counterparties specifically.
|
We provide greater
detail regarding some of these factors in our 2010 Form 10-K, first quarter 2011 Form 10-Q and elsewhere in this Report, including Risk Factors and Risk Management sections of those reports. Our forward-looking statements may also be subject to
other risks and uncertainties, including those discussed elsewhere in this Report or in our other filings with the SEC.
64
Consolidated Income Statement
The PNC Financial Services Group, Inc.
|
|
|
|
|
|
|
|
|
|
|
|
|
|
|
|
|
|
|
In millions, except per share data
|
|
Three months ended
June 30
|
|
|
Six months ended
June 30
|
|
|
Unaudited
|
|
2011
|
|
|
2010
|
|
|
2011
|
|
|
2010
|
|
|
Interest Income
|
|
|
|
|
|
|
|
|
|
|
|
|
|
|
|
|
|
Loans
|
|
$
|
1,905
|
|
|
$
|
2,158
|
|
|
$
|
3,789
|
|
|
$
|
4,318
|
|
|
Investment securities
|
|
|
549
|
|
|
|
572
|
|
|
|
1,127
|
|
|
|
1,195
|
|
|
Other
|
|
|
93
|
|
|
|
143
|
|
|
|
214
|
|
|
|
265
|
|
|
Total interest income
|
|
|
2,547
|
|
|
|
2,873
|
|
|
|
5,130
|
|
|
|
5,778
|
|
|
Interest Expense
|
|
|
|
|
|
|
|
|
|
|
|
|
|
|
|
|
|
Deposits
|
|
|
180
|
|
|
|
244
|
|
|
|
362
|
|
|
|
525
|
|
|
Borrowed funds
|
|
|
217
|
|
|
|
194
|
|
|
|
442
|
|
|
|
439
|
|
|
Total interest expense
|
|
|
397
|
|
|
|
438
|
|
|
|
804
|
|
|
|
964
|
|
|
Net interest income
|
|
|
2,150
|
|
|
|
2,435
|
|
|
|
4,326
|
|
|
|
4,814
|
|
|
Noninterest Income
|
|
|
|
|
|
|
|
|
|
|
|
|
|
|
|
|
|
Asset management
|
|
|
288
|
|
|
|
243
|
|
|
|
551
|
|
|
|
502
|
|
|
Consumer services
|
|
|
333
|
|
|
|
315
|
|
|
|
644
|
|
|
|
611
|
|
|
Corporate services
|
|
|
228
|
|
|
|
261
|
|
|
|
445
|
|
|
|
529
|
|
|
Residential mortgage
|
|
|
163
|
|
|
|
179
|
|
|
|
358
|
|
|
|
326
|
|
|
Service charges on deposits
|
|
|
131
|
|
|
|
209
|
|
|
|
254
|
|
|
|
409
|
|
|
Net gains on sales of securities
|
|
|
82
|
|
|
|
147
|
|
|
|
119
|
|
|
|
237
|
|
|
Other-than-temporary impairments
|
|
|
(73
|
)
|
|
|
(118
|
)
|
|
|
(103
|
)
|
|
|
(358
|
)
|
|
Less: Noncredit portion of other-than-temporary impairments (a)
|
|
|
(34
|
)
|
|
|
(24
|
)
|
|
|
(30
|
)
|
|
|
(148
|
)
|
|
Net other-than-temporary impairments
|
|
|
(39
|
)
|
|
|
(94
|
)
|
|
|
(73
|
)
|
|
|
(210
|
)
|
|
Other
|
|
|
266
|
|
|
|
217
|
|
|
|
609
|
|
|
|
457
|
|
|
Total noninterest income
|
|
|
1,452
|
|
|
|
1,477
|
|
|
|
2,907
|
|
|
|
2,861
|
|
|
Total revenue
|
|
|
3,602
|
|
|
|
3,912
|
|
|
|
7,233
|
|
|
|
7,675
|
|
|
Provision For Credit Losses
|
|
|
280
|
|
|
|
823
|
|
|
|
701
|
|
|
|
1,574
|
|
|
Noninterest Expense
|
|
|
|
|
|
|
|
|
|
|
|
|
|
|
|
|
|
Personnel
|
|
|
976
|
|
|
|
959
|
|
|
|
1,965
|
|
|
|
1,915
|
|
|
Occupancy
|
|
|
176
|
|
|
|
172
|
|
|
|
369
|
|
|
|
359
|
|
|
Equipment
|
|
|
158
|
|
|
|
168
|
|
|
|
325
|
|
|
|
340
|
|
|
Marketing
|
|
|
63
|
|
|
|
65
|
|
|
|
103
|
|
|
|
115
|
|
|
Other
|
|
|
803
|
|
|
|
638
|
|
|
|
1,484
|
|
|
|
1,386
|
|
|
Total noninterest expense
|
|
|
2,176
|
|
|
|
2,002
|
|
|
|
4,246
|
|
|
|
4,115
|
|
|
Income from continuing operations before income taxes and noncontrolling interests
|
|
|
1,146
|
|
|
|
1,087
|
|
|
|
2,286
|
|
|
|
1,986
|
|
|
Income taxes
|
|
|
234
|
|
|
|
306
|
|
|
|
542
|
|
|
|
557
|
|
|
Income from continuing operations before noncontrolling interests
|
|
|
912
|
|
|
|
781
|
|
|
|
1,744
|
|
|
|
1,429
|
|
|
Income from discontinued operations (net of income taxes of zero, $13, zero, and
$27)
|
|
|
|
|
|
|
22
|
|
|
|
|
|
|
|
45
|
|
|
Net income
|
|
|
912
|
|
|
|
803
|
|
|
|
1,744
|
|
|
|
1,474
|
|
|
Less: Net income (loss) attributable to noncontrolling interests
|
|
|
(1
|
)
|
|
|
(9
|
)
|
|
|
(6
|
)
|
|
|
(14
|
)
|
|
Preferred stock dividends
|
|
|
24
|
|
|
|
25
|
|
|
|
28
|
|
|
|
118
|
|
|
Preferred stock discount accretion
|
|
|
1
|
|
|
|
1
|
|
|
|
1
|
|
|
|
251
|
|
|
Net income attributable to common shareholders
|
|
$
|
888
|
|
|
$
|
786
|
|
|
$
|
1,721
|
|
|
$
|
1,119
|
|
|
Basic Earnings Per Common Share
|
|
|
|
|
|
|
|
|
|
|
|
|
|
|
|
|
|
Continuing operations
|
|
$
|
1.69
|
|
|
$
|
1.45
|
|
|
$
|
3.27
|
|
|
$
|
2.09
|
|
|
Discontinued operations
|
|
|
|
|
|
|
.04
|
|
|
|
|
|
|
|
.09
|
|
|
Net income
|
|
$
|
1.69
|
|
|
$
|
1.49
|
|
|
$
|
3.27
|
|
|
$
|
2.18
|
|
|
Diluted Earnings Per Common Share
|
|
|
|
|
|
|
|
|
|
|
|
|
|
|
|
|
|
Continuing operations
|
|
$
|
1.67
|
|
|
$
|
1.43
|
|
|
$
|
3.24
|
|
|
$
|
2.06
|
|
|
Discontinued operations
|
|
|
|
|
|
|
.04
|
|
|
|
|
|
|
|
.09
|
|
|
Net income
|
|
$
|
1.67
|
|
|
$
|
1.47
|
|
|
$
|
3.24
|
|
|
$
|
2.15
|
|
|
Average Common Shares Outstanding
|
|
|
|
|
|
|
|
|
|
|
|
|
|
|
|
|
|
Basic
|
|
|
524
|
|
|
|
524
|
|
|
|
524
|
|
|
|
511
|
|
|
Diluted
|
|
|
527
|
|
|
|
527
|
|
|
|
527
|
|
|
|
514
|
|
|
(a)
|
Included in accumulated other comprehensive income (loss).
|
See accompanying Notes To Consolidated Financial Statements.
65
Consolidated Balance Sheet
The PNC Financial Services Group, Inc.
|
|
|
|
|
|
|
|
|
|
|
In millions, except par value
Unaudited
|
|
June 30
2011
|
|
|
December 31
2010
|
|
|
Assets
|
|
|
|
|
|
|
|
|
|
Cash and due from banks (includes $4 and $2 for VIEs) (a)
|
|
$
|
3,865
|
|
|
$
|
3,297
|
|
|
Federal funds sold and resale agreements (includes $813 and $866 measured at fair value) (b)
|
|
|
2,357
|
|
|
|
3,704
|
|
|
Trading securities
|
|
|
2,075
|
|
|
|
1,826
|
|
|
Interest-earning deposits with banks (includes $9 and $288 for VIEs) (a)
|
|
|
4,508
|
|
|
|
1,610
|
|
|
Loans held for sale (includes $2,207 and $2,755 measured at fair value) (b)
|
|
|
2,679
|
|
|
|
3,492
|
|
|
Investment securities (includes $317 and $192 for VIEs) (a)
|
|
|
59,414
|
|
|
|
64,262
|
|
|
Loans (includes $4,974 and $4,645 for VIEs) (includes $239 and $116 measured at fair value) (a) (b)
|
|
|
150,319
|
|
|
|
150,595
|
|
|
Allowance for loan and lease losses (includes $(105) and $(183) for VIEs)
(a)
|
|
|
(4,627
|
)
|
|
|
(4,887
|
)
|
|
Net loans
|
|
|
145,692
|
|
|
|
145,708
|
|
|
Goodwill
|
|
|
8,182
|
|
|
|
8,149
|
|
|
Other intangible assets
|
|
|
2,412
|
|
|
|
2,604
|
|
|
Equity investments (includes $1,332 and $1,177 for VIEs) (a)
|
|
|
9,776
|
|
|
|
9,220
|
|
|
Other (includes $1,035 and $676 for VIEs) (includes $426 and $396 measured at fair value)
(a) (b)
|
|
|
22,157
|
|
|
|
20,412
|
|
|
Total assets
|
|
$
|
263,117
|
|
|
$
|
264,284
|
|
|
Liabilities
|
|
|
|
|
|
|
|
|
|
Deposits
|
|
|
|
|
|
|
|
|
|
Noninterest-bearing
|
|
$
|
52,683
|
|
|
$
|
50,019
|
|
|
Interest-bearing
|
|
|
129,208
|
|
|
|
133,371
|
|
|
Total deposits
|
|
|
181,891
|
|
|
|
183,390
|
|
|
Borrowed funds
|
|
|
|
|
|
|
|
|
|
Federal funds purchased and repurchase agreements
|
|
|
3,812
|
|
|
|
4,144
|
|
|
Federal Home Loan Bank borrowings
|
|
|
5,022
|
|
|
|
6,043
|
|
|
Bank notes and senior debt
|
|
|
10,526
|
|
|
|
12,904
|
|
|
Subordinated debt
|
|
|
9,358
|
|
|
|
9,842
|
|
|
Other (includes $3,859 and $3,354 for VIEs) (a)
|
|
|
6,458
|
|
|
|
6,555
|
|
|
Total borrowed funds
|
|
|
35,176
|
|
|
|
39,488
|
|
|
Allowance for unfunded loan commitments and letters of credit
|
|
|
202
|
|
|
|
188
|
|
|
Accrued expenses (includes $129 and $88 for VIEs) (a)
|
|
|
3,502
|
|
|
|
3,188
|
|
|
Other (includes $824 and $456 for VIEs) (a)
|
|
|
7,473
|
|
|
|
5,192
|
|
|
Total liabilities
|
|
|
228,244
|
|
|
|
231,446
|
|
|
Equity
|
|
|
|
|
|
|
|
|
|
Preferred stock (c)
|
|
|
|
|
|
|
|
|
|
Common stock – $5 par value
|
|
|
|
|
|
|
|
|
|
Authorized 800 shares, issued 536 shares
|
|
|
2,682
|
|
|
|
2,682
|
|
|
Capital surplus – preferred stock
|
|
|
648
|
|
|
|
647
|
|
|
Capital surplus – common stock and other
|
|
|
12,025
|
|
|
|
12,057
|
|
|
Retained earnings
|
|
|
17,344
|
|
|
|
15,859
|
|
|
Accumulated other comprehensive income (loss)
|
|
|
69
|
|
|
|
(431
|
)
|
|
Common stock held in treasury at cost: 10 shares
|
|
|
(533
|
)
|
|
|
(572
|
)
|
|
Total shareholders’ equity
|
|
|
32,235
|
|
|
|
30,242
|
|
|
Noncontrolling interests
|
|
|
2,638
|
|
|
|
2,596
|
|
|
Total equity
|
|
|
34,873
|
|
|
|
32,838
|
|
|
Total liabilities and equity
|
|
$
|
263,117
|
|
|
$
|
264,284
|
|
|
(a)
|
Amounts represent the assets or liabilities of consolidated variable interest entities (VIEs).
|
|
(b)
|
Amounts represent items for which the Corporation has elected the fair value option.
|
|
(c)
|
Par value less than $.5 million at each date.
|
See accompanying Notes To Consolidated Financial Statements.
66
Consolidated Statement of Cash Flows
The PNC Financial Services Group, Inc.
|
|
|
|
|
|
|
|
|
|
|
In millions
|
|
Six months ended June 30
|
|
|
Unaudited
|
|
2011
|
|
|
2010
|
|
|
Operating Activities
|
|
|
|
|
|
|
|
|
|
Net income
|
|
$
|
1,744
|
|
|
$
|
1,474
|
|
|
Adjustments to reconcile net income to net cash provided (used) by operating activities
|
|
|
|
|
|
|
|
|
|
Provision for credit losses
|
|
|
701
|
|
|
|
1,574
|
|
|
Depreciation and amortization
|
|
|
569
|
|
|
|
442
|
|
|
Deferred income taxes (benefit)
|
|
|
(127
|
)
|
|
|
571
|
|
|
Net gains on sales of securities
|
|
|
(119
|
)
|
|
|
(237
|
)
|
|
Net other-than-temporary impairments
|
|
|
73
|
|
|
|
210
|
|
|
Undistributed earnings of BlackRock
|
|
|
(132
|
)
|
|
|
(115
|
)
|
|
Net change in
|
|
|
|
|
|
|
|
|
|
Trading securities and other short-term investments
|
|
|
779
|
|
|
|
1,214
|
|
|
Loans held for sale
|
|
|
411
|
|
|
|
(330
|
)
|
|
Other assets
|
|
|
(1,048
|
)
|
|
|
(528
|
)
|
|
Accrued expenses and other liabilities
|
|
|
583
|
|
|
|
(406
|
)
|
|
Other
|
|
|
271
|
|
|
|
400
|
|
|
Net cash provided (used) by operating activities
|
|
|
3,705
|
|
|
|
4,269
|
|
|
Investing Activities
|
|
|
|
|
|
|
|
|
|
Sales
|
|
|
|
|
|
|
|
|
|
Securities available for sale
|
|
|
15,023
|
|
|
|
14,123
|
|
|
Loans
|
|
|
1,027
|
|
|
|
926
|
|
|
Repayments/maturities
|
|
|
|
|
|
|
|
|
|
Securities available for sale
|
|
|
2,792
|
|
|
|
3,904
|
|
|
Securities held to maturity
|
|
|
1,230
|
|
|
|
880
|
|
|
Purchases
|
|
|
|
|
|
|
|
|
|
Securities available for sale
|
|
|
(12,866
|
)
|
|
|
(13,111
|
)
|
|
Securities held to maturity
|
|
|
(187
|
)
|
|
|
(693
|
)
|
|
Loans
|
|
|
(712
|
)
|
|
|
(2,930
|
)
|
|
Net change in
|
|
|
|
|
|
|
|
|
|
Federal funds sold and resale agreements
|
|
|
1,340
|
|
|
|
189
|
|
|
Interest-earning deposits with banks
|
|
|
(2,897
|
)
|
|
|
(549
|
)
|
|
Loans
|
|
|
(1,393
|
)
|
|
|
5,788
|
|
|
Net cash received from acquisition and divestiture activity
|
|
|
261
|
|
|
|
156
|
|
|
Other
|
|
|
(387
|
)
|
|
|
593
|
|
|
Net cash provided (used) by investing activities
|
|
|
3,231
|
|
|
|
9,276
|
|
(continued on following
page)
67
Consolidated Statement of Cash Flows
The PNC Financial Services Group, Inc.
(continued from previous page)
|
|
|
|
|
|
|
|
|
|
|
In millions
|
|
Six months ended June 30
|
|
|
Unaudited
|
|
2011
|
|
|
2010
|
|
|
Financing Activities
|
|
|
|
|
|
|
|
|
|
Net change in
|
|
|
|
|
|
|
|
|
|
Noninterest-bearing deposits
|
|
$
|
2,618
|
|
|
$
|
623
|
|
|
Interest-bearing deposits
|
|
|
(4,385
|
)
|
|
|
(7,441
|
)
|
|
Federal funds purchased and repurchase agreements
|
|
|
(327
|
)
|
|
|
(305
|
)
|
|
Federal Home Loan Bank short-term borrowings
|
|
|
|
|
|
|
(280
|
)
|
|
Other short-term borrowed funds
|
|
|
(393
|
)
|
|
|
(60
|
)
|
|
Sales/issuances
|
|
|
|
|
|
|
|
|
|
Bank notes and senior debt
|
|
|
|
|
|
|
2,528
|
|
|
Other long-term borrowed funds
|
|
|
4,634
|
|
|
|
2,219
|
|
|
Common and treasury stock
|
|
|
24
|
|
|
|
3,441
|
|
|
Repayments/maturities
|
|
|
|
|
|
|
|
|
|
Federal Home Loan Bank long-term borrowings
|
|
|
(1,021
|
)
|
|
|
(2,313
|
)
|
|
Bank notes and senior debt
|
|
|
(2,427
|
)
|
|
|
(2,462
|
)
|
|
Subordinated debt
|
|
|
(524
|
)
|
|
|
28
|
|
|
Other long-term borrowed funds
|
|
|
(4,251
|
)
|
|
|
(2,342
|
)
|
|
Preferred stock – TARP
|
|
|
|
|
|
|
(7,579
|
)
|
|
Acquisition of treasury stock
|
|
|
(52
|
)
|
|
|
(116
|
)
|
|
Preferred stock cash dividends paid
|
|
|
(28
|
)
|
|
|
(118
|
)
|
|
Common stock cash dividends paid
|
|
|
(236
|
)
|
|
|
(98
|
)
|
|
Net cash provided (used) by financing activities
|
|
|
(6,368
|
)
|
|
|
(14,275
|
)
|
|
Net Increase (Decrease) In Cash And Due From Banks
|
|
|
568
|
|
|
|
(730
|
)
|
|
Cash and due from banks at beginning of period
|
|
|
3,297
|
|
|
|
4,288
|
|
|
Cash and due from banks at end of period
|
|
$
|
3,865
|
|
|
$
|
3,558
|
|
|
Supplemental Disclosures
|
|
|
|
|
|
|
|
|
|
Interest paid
|
|
$
|
819
|
|
|
$
|
921
|
|
|
Income taxes paid
|
|
|
697
|
|
|
|
339
|
|
|
Income taxes refunded
|
|
|
27
|
|
|
|
4
|
|
|
Non-cash Investing and Financing Items
|
|
|
|
|
|
|
|
|
|
Transfer from (to) loans to (from) loans held for sale, net
|
|
|
429
|
|
|
|
514
|
|
|
Transfer from loans to foreclosed assets
|
|
|
352
|
|
|
|
670
|
|
See accompanying Notes To Consolidated Financial Statements.
68
N
OTES
T
O
C
ONSOLIDATED
F
INANCIAL
S
TATEMENTS
(U
NAUDITED
)
T
HE
PNC F
INANCIAL
S
ERVICES
G
ROUP
, I
NC
.
Business
PNC is one of the largest diversified financial services companies in the United States and is headquartered in Pittsburgh, Pennsylvania.
PNC has businesses engaged in retail banking, corporate and institutional banking, asset management, and residential mortgage banking, providing many of its products and services nationally and others in
PNC’s primary geographic markets located in Pennsylvania, Ohio, New Jersey, Michigan, Maryland, Illinois, Indiana, Kentucky, Florida, Virginia, Missouri, Delaware, Washington, D.C., and Wisconsin. PNC also provides certain products and services
internationally.
N
OTE
1 A
CCOUNTING
P
OLICIES
B
ASIS
O
F
F
INANCIAL
S
TATEMENT
P
RESENTATION
Our consolidated financial statements include the accounts of the parent company and its subsidiaries, most of which are wholly owned,
and certain partnership interests and variable interest entities.
We prepared these consolidated financial statements in accordance with
accounting principles generally accepted in the United States of America (GAAP). We have eliminated intercompany accounts and transactions. We have also reclassified certain prior year amounts to conform with the 2011 presentation. These
reclassifications did not have a material impact on our consolidated financial condition or results of operations.
See Note 2 Acquisition and
Divestiture Activity regarding our July 1, 2010 sale of PNC Global Investment Servicing Inc. The Consolidated Income Statement for the first six months of 2010 and related disclosures in the Notes To Consolidated Financial Statements reflect
the global investment servicing business as discontinued operations.
In our opinion, the unaudited interim consolidated financial statements
reflect all normal, recurring adjustments needed to present fairly our results for the interim periods. The results of operations for interim periods are not necessarily indicative of the results that may be expected for the full year or any other
interim period.
When preparing these unaudited interim consolidated financial statements, we have assumed that you have read the audited
consolidated financial statements included in our 2010 Annual Report on Form 10-K (2010 Form 10-K). Reference is made to Note 1 Accounting Policies in the 2010 Form 10-K for a detailed description of significant accounting policies.
There have been no significant changes to these policies in the first six months of 2011 other than as disclosed herein. These interim consolidated financial statements serve to update the 2010
Form 10-K and may not include all information and notes necessary to constitute a complete set of financial statements.
We have considered
the impact on these consolidated financial statements of subsequent events.
U
SE
O
F
E
STIMATES
We prepared these consolidated financial statements using financial information available at the time, which
requires us to make estimates and assumptions that affect the amounts reported. Our most significant estimates pertain to our fair value measurements, allowances for loan and lease losses and unfunded loan commitments and letters of credit, and
revenue recognition for purchase accounting accretion on purchased impaired loans. Actual results may differ from the estimates and the differences may be material to the consolidated financial statements.
I
NVESTMENT
I
N
B
LACK
R
OCK
, I
NC
.
We account for our investment in the common stock and Series B Preferred Stock of BlackRock (deemed to be in-substance common stock) under the equity
method of accounting. The investment in BlackRock is reflected on our Consolidated Balance Sheet in Equity investments, while our equity in earnings of BlackRock is reported on our Consolidated Income Statement in Asset management revenue.
We also own 2.9 million shares of Series C Preferred Stock of BlackRock. Since these preferred shares are not deemed to be in substance
common stock, we have elected to account for these preferred shares at fair value and the changes in fair value will offset the impact of marking-to-market the obligation to deliver these shares to BlackRock. Our investment in the BlackRock Series C
Preferred Stock is included on our Consolidated Balance Sheet in Other assets.
As noted above, we mark-to-market our obligation to transfer
BlackRock shares related to certain BlackRock long-term incentive plan (LTIP) programs. This obligation is classified as a derivative not designated as a hedging instrument under GAAP as disclosed in Note 12 Financial Derivatives.
N
ONPERFORMING
A
SSETS
Nonperforming assets include:
|
|
•
|
|
Nonaccrual loans and leases,
|
|
|
•
|
|
Troubled debt restructurings, and
|
|
|
•
|
|
Other real estate owned and foreclosed assets.
|
69
Nonperforming loans are those loans that have deteriorated in credit quality to the extent that full
collection of original contractual principal and interest is doubtful. When a loan is determined to be nonperforming (and as a result is impaired), the accrual of interest is ceased and the loan is classified as nonaccrual. The current year accrued
and uncollected interest is reversed out of net interest income.
A loan acquired and accounted for under ASC Sub-Topic 310-30 – Loans
and Debt Securities Acquired with Deteriorated Credit Quality is reported as an accruing loan and a performing asset due to the accretion of interest income.
We generally classify Commercial Lending (Commercial, Commercial Real Estate, and Equipment Lease Financing) loans as nonaccrual (and therefore nonperforming) when we determine that the collection of
interest or principal is doubtful or when delinquency of interest or principal payments has existed for 90 days or more and the loans are not well-secured and in the process of collection. A loan is considered well-secured when the collateral in the
form of liens on (or pledges of) real or personal property, including marketable securities, has a realizable value sufficient to discharge the debt in full, including accrued interest. Such factors that would lead to nonperforming status and
subject to an impairment test would include, but are not limited to, the following:
|
|
•
|
|
Deterioration in the financial position of the borrower resulting in the loan moving from accrual to cash basis,
|
|
|
•
|
|
The collection of principal or interest is 90 days or more past due unless the asset is both well-secured and in the process of collection,
|
|
|
•
|
|
Reasonable doubt exists as to the certainty of the future debt service ability, whether 90 days have passed or not,
|
|
|
•
|
|
Customer has filed or will likely file for bankruptcy,
|
|
|
•
|
|
The bank advances additional funds to cover principal or interest,
|
|
|
•
|
|
We are in the process of liquidation of a commercial borrower, or
|
|
|
•
|
|
We are pursuing remedies under a guaranty.
|
We charge off commercial nonaccrual loans when we determine that a specific loan, or portion thereof, is uncollectible. This determination is based on the specific facts and circumstances of the
individual loans. In making this determination, we consider the viability of the business or project as a going concern, the past due status when the asset is not well-secured, the expected cash flows to repay the loan, the value of the collateral,
and the ability and willingness of any guarantors to perform.
Additionally, in general, for smaller dollar commercial loans of $1 million or
less, a partial or full charge-off will occur at 120 days past due for term loans and 180 days past due for revolvers.
Home equity installment loans and lines of credit, as well as residential real estate loans, that are
well-secured are classified as nonaccrual at 180 days past due. A consumer loan is considered well-secured when the collateral in the form of liens on (or pledges of) real or personal property, including marketable securities, has a realizable value
sufficient to discharge the debt in full, including accrued interest.
Home equity installment loans and lines of credit and residential real
estate loans that are not well-secured and/or are in the process of collection are charged off at 180 days past due to the estimated fair value of the collateral less cost to sell. The remaining portion of the loan is placed on nonaccrual status.
Subprime mortgage loans for first liens with a loan-to-value (LTV) ratio of equal to or greater than 90% and second liens are classified as
nonaccrual at 90 days past due. These loans are charged off as discussed above.
Most consumer loans and lines of credit, not secured by
residential real estate, are charged off after 120 to 180 days past due. Generally, they are not placed on nonaccrual status as permitted by regulatory guidance.
If payment is received on a nonperforming loan, the payment is first applied to the past due principal; once this principal obligation has been fulfilled, payments are applied to recover any partial
charge-off related to the impaired loan that might exist. Finally, if both past due principal and any partial charge-off have been recovered, then the payment will result in the recognition and recording of interest income. This process is followed
for originated impaired loans with the exception of performing troubled debt restructurings (TDRs). Payments received on performing TDRs and other modified loans will be applied in accordance with the terms of the modified loan.
A loan is categorized as a TDR if a concession is granted due to deterioration in the financial condition of the borrower. TDRs may include certain
modifications of terms of loans, receipts of assets from debtors in partial satisfaction of loans, or a combination thereof. Modified loans classified as TDRs are included in nonperforming loans until returned to performing status through the
fulfilling of contractual terms for a reasonable period of time (generally 6 months).
See Note 5 Asset Quality and Allowances for Loan and
Lease Losses and Unfunded Loan Commitments and Letters of Credit for additional TDR information.
Nonperforming loans are generally not
returned to performing status until the obligation is brought current and the borrower has performed in accordance with the contractual terms for a reasonable period of time and collection of the contractual principal and interest is no longer in
doubt.
70
Foreclosed assets are comprised of any asset seized or property acquired through a foreclosure proceeding
or acceptance of a deed-in-lieu of foreclosure. Other real estate owned is comprised principally of commercial real estate and residential real estate properties obtained in partial or total satisfaction of loan obligations. Following the obtaining
of a foreclosure judgment, or in some jurisdictions the initiation of proceedings under a power of sale in the loan instruments, the property will be sold. When we acquire the deed, we transfer the loan to other real estate owned included in Other
assets on our Consolidated Balance Sheet. Property obtained in satisfaction of a loan is recorded at estimated fair value less cost to sell. We estimate fair values primarily based on appraisals, when available, or quoted market prices on liquid
assets. Anticipated recoveries and government guarantees are also considered in evaluating the potential impairment of loans at the date of transfer. If the estimated fair value less cost to sell is less than the recorded investment, a charge-off is
recognized against the Allowance for Loan and Lease Losses (ALLL).
Subsequently, foreclosed assets are valued at the lower of the amount
recorded at acquisition date or estimated fair value less cost to sell. Valuation adjustments on these assets and gains or losses realized from disposition of such property are reflected in Other noninterest expense.
See Note 5 Asset Quality and Allowances for Loan and Lease Losses and Unfunded Loan Commitments and Letters of Credit for additional information.
A
LLOWANCE
F
OR
L
OAN
A
ND
L
EASE
L
OSSES
We maintain the ALLL at a level that we believe to be appropriate to absorb estimated probable credit losses incurred in the loan
portfolio as of the balance sheet date. Our determination of the allowance is based on periodic evaluations of the loan and lease portfolios and other relevant factors. This evaluation is inherently subjective as it requires material estimates, all
of which may be susceptible to significant change, including, among others:
|
|
•
|
|
Probability of default (PD),
|
|
|
•
|
|
Loss given default (LGD),
|
|
|
•
|
|
Exposure at date of default (EAD),
|
|
|
•
|
|
Amounts and timing of expected future cash flows,
|
|
|
•
|
|
Value of collateral, and
|
|
|
•
|
|
Qualitative factors such as changes in economic conditions that may not be reflected in historical results.
|
While our reserve methodologies strive to reflect all relevant risk factors, there continues to be uncertainty associated with, but not limited to,
potential imprecision in the estimation process due to the inherent time lag of obtaining information and normal variations between estimates and actual outcomes. We provide additional reserves that are designed to provide coverage for losses
attributable to such risks. The ALLL also includes factors which may not be directly measured in the
determination of specific or pooled reserves. Such qualitative factors include:
|
|
•
|
|
Industry concentrations and conditions,
|
|
|
•
|
|
Recent credit quality trends,
|
|
|
•
|
|
Recent loss experience in particular portfolios,
|
|
|
•
|
|
Recent macro economic factors,
|
|
|
•
|
|
Changes in risk selection and underwriting standards, and
|
|
|
•
|
|
Timing of available information.
|
In determining the appropriateness of the ALLL, we make specific allocations to impaired loans and allocations to portfolios of commercial and consumer loans. We also allocate reserves to provide coverage
for probable losses incurred in the portfolio at the balance sheet date based upon current market conditions, which may not be reflected in historical loss data. While allocations are made to specific loans and pools of loans, the total reserve is
available for all credit losses.
Nonperforming loans are considered impaired under ASC 310-Receivables and are allocated a specific reserve.
Specific reserve allocations are determined as follows:
|
|
•
|
|
For nonperforming loans greater than or equal to a defined dollar threshold and TDRs, specific reserves are based on an analysis of the present value
of the loan’s expected future cash flows, the loan’s observable market price or the fair value of the collateral.
|
|
|
•
|
|
For nonperforming loans below the defined dollar threshold, the loans are aggregated for purposes of measuring specific reserve impairment using the
applicable loan’s LGD percentage multiplied by the balance of the loan.
|
|
|
•
|
|
For purchased impaired loans, subsequent decreases to the net present value of expected cash flows will generally result in an impairment charge to the
provision for credit losses, resulting in an increase to the ALLL.
|
When applicable, this process is applied across all the
loan classes in a similar manner. However, as previously discussed, certain consumer loans and lines of credit, not secured by residential real estate, are charged off instead of being classified as nonperforming.
Our credit risk management policies, procedures and practices are designed to promote sound and fair lending standards while achieving prudent credit
risk management. We have policies, procedures and practices that address financial statement requirements, collateral review and appraisal requirements, advance rates based upon collateral types, appropriate levels of exposure, cross-border risk,
lending to specialized industries or borrower type, guarantor requirements, and regulatory compliance.
71
See Note 5 Asset Quality and Allowances for Loan and Lease Losses and Unfunded Loan Commitments and Letters
of Credit for additional information.
A
LLOWANCE
F
OR
U
NFUNDED
L
OAN
C
OMMITMENTS
A
ND
L
ETTERS
O
F
C
REDIT
We maintain the allowance
for unfunded loan commitments and letters of credit at a level we believe is appropriate to absorb estimated probable credit losses incurred on these unfunded credit facilities. We determine the allowance based on periodic evaluations of the
unfunded credit facilities, including an assessment of the probability of commitment usage, credit risk factors, and the terms and expiration dates of the unfunded credit facilities. The allowance for unfunded loan commitments and letters of credit
is recorded as a liability on the Consolidated Balance Sheet. Net adjustments to the allowance for unfunded loan commitments and letters of credit are included in the provision for credit losses.
The reserve for unfunded loan commitments is estimated in a manner similar to the methodology used for determining reserves for similar funded exposures.
However, there is one important distinction. This distinction lies in the estimation of the amount of these unfunded commitments that will become funded. This is determined using a cash conversion factor or loan equivalency factor, which is a
statistical estimate of the amount of an unfunded commitment that will fund over a given period of time. Once the future funded amount is estimated, the calculation of the allowance follows similar methodologies to those employed for on-balance
sheet exposure.
See Note 5 Asset Quality and Allowances for Loan and Lease Losses and Unfunded Loan Commitments and Letters of Credit for
additional information.
E
ARNINGS
P
ER
C
OMMON
S
HARE
Basic earnings per common share is calculated using the two-class method to determine income attributable to common shareholders. Unvested share-based
payment awards that contain nonforfeitable rights to dividends or dividend equivalents are considered participating securities under the two-class method. Income attributable to common shareholders is then divided by the weighted-average common
shares outstanding for the period.
Diluted earnings per common share is calculated under the more dilutive of either the treasury method or
the two-class method. For the diluted calculation, we increase the weighted-average number of shares of common stock outstanding by the assumed conversion of outstanding convertible preferred stock and debentures from the beginning of the year or
date of issuance, if later, and the number of shares of common stock that would be issued assuming the exercise of stock options and warrants and the issuance of incentive shares using the treasury stock method. These adjustments to the
weighted-average number of shares of common stock outstanding are
made only when such adjustments will dilute earnings per common share. See Note 13 Earnings Per Share for additional information.
R
ECENT
A
CCOUNTING
P
RONOUNCEMENTS
In
June 2011, the Financial Accounting Standards Board (FASB) issued Accounting Standard Update (ASU) 2011-05-
Comprehensive Income (Topic 220), Presentation of Comprehensive Income.
This ASU will require an entity to present each component of
net income along with total net income, each component of other comprehensive income along with total other comprehensive income, and a total amount for comprehensive income either in a single continuous statement of comprehensive income or in two
separate but consecutive statements. Regardless of which option an entity chooses, the entity is required to present on the face of the financial statement reclassification adjustments for items that are reclassified from other comprehensive income
to net income. Also, in both presentation options, the tax effect for each component must be disclosed in the notes to the financial statements or presented in the statement in which other comprehensive income is presented. This ASU does not change
the items that must be reported in other comprehensive income or when an item of other comprehensive income must be reclassified to net income. Additionally, this ASU does not change the calculation or presentation of earnings per share. ASU 2011-05
is effective for the first interim or annual period beginning after December 15, 2011, and should be applied retrospectively. Early adoption is permitted. We do not believe these disclosures will have a material impact on PNC.
In May 2011, the FASB issued ASU 2011-04-
Fair Value Measurement (Topic 820)
,
Amendments to Achieve Common Fair Value Measurement and Disclosure
Requirements in U.S. GAAP and IFRSs
. This ASU provides guidance to clarify the concept of valuation premise and highest and best use, how a principal market is determined, and the application of the fair value measurement of instruments with
offsetting market or counterparty credit risks. It also extends the prohibition on blockage factors to all fair value hierarchy levels. This ASU will require additional disclosures for the following: (1) quantitative information about the
significant unobservable inputs used in all Level 3 financial instruments, (2) the valuation processes used by the reporting entity as well as a narrative description of the sensitivity of the fair value measurement to changes in unobservable
inputs, (3) a reporting entity’s use of a nonfinancial asset in a way that differs from the asset’s highest and best use if the fair value of the asset is reported, (4) the categorization by level of the fair value hierarchy for
items that are not measured at fair value in financial statements and (5) any transfers between Level 1 and 2 and the reason for those transfers. ASU 2011-04 is effective for the first interim or annual period beginning after December 15,
2011, and should be applied prospectively. Early adoption is not permitted. PNC is currently evaluating the impact of this ASU.
72
In April 2011, the FASB issued ASU 2011- 03–
Transfers and Servicing (Topic 860
):
Reconsideration of Effective Control for Repurchase Agreements.
This ASU removes from the assessment of effective control (1) the criterion requiring the transferor to have the ability to repurchase or redeem the financial assets on
substantially the agreed terms, even in the event of default by the transferee, and (2) the collateral maintenance implementation guidance related to that criterion. Other criteria applicable to the assessment of effective control have not been
changed by this ASU. ASU 2011-03 is effective for the first interim or annual period beginning on or after December 15, 2011 and should be applied prospectively to transactions or modifications of existing transactions that occur on or after
the effective date. Early adoption is not permitted. The adoption of this new guidance is not expected to have a material effect on our results of operations or financial position.
In April 2011, the FASB issued ASU 2011-02,
Receivables (Topic 310): A Creditor’s Determination of Whether a Restructuring Is a Troubled Debt Restructuring
. The ASU clarifies when a loan
modification constitutes a troubled debt restructuring (TDR). This ASU (1) eliminates the sole use of the borrower’s effective interest rate test to determine if a concession has occurred on the part of the creditor, (2) requires a
modification with below market terms to be considered in determining classification as a TDR, (3) specifies that a borrower not currently in default may still be experiencing
financial difficulty
when payment default is “probable in
the foreseeable future,” and (4) specifies that a delay in payment should be considered along with all other factors in determining classification as a TDR. The ASU guidance is effective for interim and annual periods beginning after
June 15, 2011 and is to be applied retrospectively to the beginning of the annual period of adoption. PNC is currently evaluating the impact of this ASU.
In January 2010, the FASB issued ASU 2010-06, Fair Value Measurements and Disclosures (Topic 820),
Improving Disclosures About Fair Value Measurements.
This ASU requires purchases, sales, issuances
and settlements to be reported separately in the Level 3 fair value measurement rollforward beginning with the first quarter 2011 reporting. See Note 8 Fair Value for additional information.
In July 2010, the FASB issued ASU 2010-20 – Receivables (Topic 310) –
Disclosures about the Credit Quality of Financing Receivables and the Allowance for Credit Losses
. While the majority
of the disclosures within this ASU were already required to be adopted and included in the 2010 Form 10-K, required disclosures about activity that occurs during a reporting period are effective for interim and annual reporting periods beginning on
or after December 15, 2010. Comparative disclosures for earlier reporting periods that ended before initial adoption is encouraged. Comparative disclosures for those reporting periods ending after initial adoption are required. See Note 5 Asset
Quality and
Allowances for Loan and Lease Losses and Unfunded Loan Commitments and Letters of Credit for additional information. The effective date for disclosures related to troubled debt restructurings
required by ASU 2010-20 was deferred by ASU 2011-01 – Receivables (Topic 310):
Deferral of the Effective Date of Disclosures about Troubled Debt Restructurings in Update No. 2010-20
, which was issued in January 2011. The disclosures
were deferred until the FASB had completed ASU 2011-02. The TDR disclosures are effective for interim and annual periods beginning after June 15, 2011.
N
OTE
2 A
CQUISITION
AND
D
IVESTITURE
A
CTIVITY
P
ENDING
A
CQUISITION
OF
RBC B
ANK
(USA)
On June 19, 2011, we entered into a definitive agreement with Royal Bank of Canada and RBC USA Holdco Corporation to acquire RBC Bank (USA), the US
retail banking subsidiary of Royal Bank of Canada, for $3.45 billion. This purchase price is subject to post-closing adjustments based on the closing date tangible net asset value of RBC Bank (USA), as defined in the definitive agreement. Under the
terms of the agreement, PNC has the option to pay a portion of the purchase price using shares of PNC common stock. The amount of PNC common stock, if any, issued to Royal Bank of Canada at closing may not exceed the lesser of $1.0 billion of such
shares (according to a weighted average valuation of such shares prior to closing) or 4.9% of the total number of shares of PNC common stock issued and outstanding immediately following closing. PNC has also agreed to acquire certain credit card
accounts of RBC Bank (USA) customers issued by RBC Bank (Georgia), National Association, a wholly-owned subsidiary of Royal Bank of Canada.
RBC Bank (USA) has approximately $25 billion in “proforma” assets as reflected in the definitive agreement to be included in the transaction
and 424 branches in North Carolina, Florida, Alabama, Georgia, Virginia and South Carolina. The transaction is expected to close in March 2012, subject to customary closing conditions, including regulatory approvals.
P
ENDING
A
CQUISITION
OF
F
LAGSTAR
B
RANCHES
On July 26, 2011, PNC signed a definitive agreement to acquire 27 branches in metropolitan Atlanta, Georgia from Flagstar Bank, FSB, a subsidiary of
Flagstar Bancorp, Inc., and assume approximately $240 million of deposits associated with these branches based on balances as of June 30, 2011. Under the agreement, PNC will purchase 21 branches and lease 6 branches located in a seven-county
area primarily north of Atlanta. Acquired real estate and fixed assets associated with the branches will be purchased for net book value, or approximately $42 million. No deposit premium will be paid and no loans will be acquired in the transaction,
which is expected to close in December 2011, subject to customary closing conditions, including regulatory approvals.
73
B
ANK
A
TLANTIC
B
RANCH
A
CQUISITION
Effective June 6, 2011, we acquired 19 branches from BankAtlantic adding approximately $325 million of assets to our Consolidated
Balance sheet, including $257 million in cash and $41 million of goodwill. In addition, we added $324 million of deposits in connection with this acquisition. Our Consolidated Income Statement includes the impact of the branch activity subsequent to
our June 6, 2011 acquisition.
S
ALE
OF
PNC G
LOBAL
I
NVESTMENT
S
ERVICING
On July 1, 2010, we sold PNC Global Investment Servicing Inc. (GIS), a leading provider of processing,
technology and business intelligence services to asset managers, broker-dealers and financial advisors worldwide, for $2.3 billion in cash pursuant to a definitive agreement entered into on February 2, 2010. This transaction resulted in a
pretax gain of $639 million, net of transaction costs, in the third quarter of 2010. Results of operations of GIS through June 30, 2010 are presented as Income from discontinued operations, net of income taxes, on our Consolidated Income
Statement. As part of the sale agreement, PNC has agreed to provide certain transitional services on behalf of GIS until completion of related systems conversion activities. There were no assets or liabilities of GIS remaining at December 31,
2010.
N
OTE
3 L
OAN
S
ALE
AND
S
ERVICING
A
CTIVITIES
AND
V
ARIABLE
I
NTEREST
E
NTITIES
L
OAN
S
ALE
AND
S
ERVICING
A
CTIVITIES
We have transferred residential and commercial mortgage loans in securitization or sales transactions in which we have continuing
involvement. These transfers have occurred through Agency securitization, Non-Agency securitization, and whole-loan sale transactions. Agency securitizations consist of securitization transactions with Federal National Mortgage Association (FNMA),
Federal Home Loan Mortgage Corporation (FHLMC), and Government National
Mortgage Association (GNMA) (collectively the Agencies). FNMA and FHLMC generally securitize our transferred loans into mortgage-backed securities for sale into
the secondary market through special purpose entities (SPEs) they sponsor. We, as an authorized GNMA issuer/servicer, pool Federal Housing Administration
(FHA) and Department of Veterans Affairs (VA) insured loans into mortgage-backed securities for sale into the secondary market. In Non-Agency securitizations, we have transferred loans into securitization SPEs. In other instances third-party
investors have purchased (in whole-loan sale transactions) and subsequently sold our loans into securitization SPEs. Third-party investors have also purchased our loans in whole-loan sale transactions. Securitization SPEs, which are legal entities
that are utilized in the Agency and Non-Agency securitization transactions, are VIEs.
Our continuing involvement in the Agency
securitizations, Non-Agency securitizations, and whole-loan sale transactions generally consists of servicing, repurchases of previously transferred loans and loss share arrangements, and, in limited circumstances, holding of mortgage-backed
securities issued by the securitization SPEs. Refer to Note 3 Loan Sale and Servicing Activities and Variable Interest Entities in our 2010 Form 10-K for additional information regarding our continuing involvement in these transactions. In addition,
further details of our repurchase and loss share obligations are contained in Note 17 Commitments and Guarantees.
Certain loans transferred
to the Agencies contain removal of account provisions (ROAPs). Under these ROAPs, we hold an option to repurchase at par individual delinquent loans that meet certain criteria. When we have the unilateral ability to repurchase a delinquent loan,
effective control over the loan has been regained and we recognize the loan and a corresponding liability on the balance sheet regardless of our intent to repurchase the loan. At June 30, 2011 and December 31, 2010, the balance of our ROAP
asset and liability totaled $272 million and $336 million, respectively.
Certain Financial Information
and Cash Flows Associated with Loan Sale and Servicing Activities
|
|
|
|
|
|
|
|
|
|
|
|
|
|
|
In millions
|
|
Residential
Mortgages
|
|
|
Commercial
Mortgages (a)
|
|
|
Home Equity
Loans/Lines (b)
|
|
|
FINANCIAL INFORMATION – June 30, 2011
|
|
|
|
|
|
|
|
|
|
|
|
|
|
Servicing portfolio (c)
|
|
$
|
124,765
|
|
|
$
|
163,240
|
|
|
$
|
5,810
|
|
|
Carrying value of servicing assets (d)
|
|
|
996
|
|
|
|
592
|
|
|
|
1
|
|
|
Servicing advances
|
|
|
525
|
|
|
|
451
|
|
|
|
6
|
|
|
Servicing deposits
|
|
|
2,072
|
|
|
|
3,700
|
|
|
|
40
|
|
|
Repurchase and recourse obligations (e)
|
|
|
95
|
|
|
|
55
|
|
|
|
55
|
|
|
Carrying value of mortgage-backed securities held (f)
|
|
|
1,688
|
|
|
|
1,973
|
|
|
|
|
|
|
FINANCIAL INFORMATION – December 31, 2010
|
|
|
|
|
|
|
|
|
|
|
|
|
|
Servicing portfolio (c)
|
|
$
|
125,806
|
|
|
$
|
162,514
|
|
|
$
|
6,041
|
|
|
Carrying value of servicing assets (d)
|
|
|
1,033
|
|
|
|
665
|
|
|
|
2
|
|
|
Servicing advances
|
|
|
533
|
|
|
|
415
|
|
|
|
21
|
|
|
Servicing deposits
|
|
|
2,661
|
|
|
|
3,537
|
|
|
|
61
|
|
|
Repurchase and recourse obligations (e)
|
|
|
144
|
|
|
|
54
|
|
|
|
150
|
|
|
Carrying value of mortgage-backed securities held (f)
|
|
|
2,171
|
|
|
|
1,875
|
|
|
|
|
|
74
|
|
|
|
|
|
|
|
|
|
|
|
|
|
|
In millions
|
|
Residential
Mortgages
|
|
|
Commercial
Mortgages (a)
|
|
|
Home Equity
Loans/Lines (b)
|
|
|
CASH FLOWS – Three months ended June 30, 2011
|
|
|
|
|
|
|
|
|
|
|
|
|
|
Sales of loans (g)
|
|
$
|
3,144
|
|
|
$
|
421
|
|
|
|
|
|
|
Repurchases of previously transferred loans (h)
|
|
|
365
|
|
|
|
|
|
|
$
|
8
|
|
|
Contractual servicing fees received
|
|
|
87
|
|
|
|
44
|
|
|
|
6
|
|
|
Servicing advances recovered/(funded), net
|
|
|
(22
|
)
|
|
|
(1
|
)
|
|
|
|
|
|
Cash flows on mortgage-backed securities held (f)
|
|
|
107
|
|
|
|
80
|
|
|
|
|
|
|
CASH FLOWS – Three months ended June 30, 2010
|
|
|
|
|
|
|
|
|
|
|
|
|
|
Sales of loans (g)
|
|
$
|
2,296
|
|
|
$
|
636
|
|
|
|
|
|
|
Repurchases of previously transferred loans (h)
|
|
|
465
|
|
|
|
|
|
|
$
|
6
|
|
|
Contractual servicing fees received
|
|
|
107
|
|
|
|
71
|
|
|
|
7
|
|
|
Servicing advances recovered/(funded), net
|
|
|
174
|
|
|
|
57
|
|
|
|
3
|
|
|
Cash flows on mortgage-backed securities held (f)
|
|
|
148
|
|
|
|
167
|
|
|
|
|
|
|
CASH FLOWS – Six months ended June 30, 2011
|
|
|
|
|
|
|
|
|
|
|
|
|
|
Sales of loans (g)
|
|
$
|
6,529
|
|
|
$
|
904
|
|
|
|
|
|
|
Repurchases of previously transferred loans (h)
|
|
|
809
|
|
|
|
|
|
|
$
|
30
|
|
|
Contractual servicing fees received
|
|
|
177
|
|
|
|
87
|
|
|
|
12
|
|
|
Servicing advances recovered/(funded), net
|
|
|
8
|
|
|
|
(36
|
)
|
|
|
15
|
|
|
Cash flows on mortgage-backed securities held (f)
|
|
|
258
|
|
|
|
177
|
|
|
|
|
|
|
CASH FLOWS – Six months ended June 30, 2010
|
|
|
|
|
|
|
|
|
|
|
|
|
|
Sales of loans (g)
|
|
$
|
4,226
|
|
|
$
|
978
|
|
|
|
|
|
|
Repurchases of previously transferred loans (h)
|
|
|
1,206
|
|
|
|
|
|
|
$
|
7
|
|
|
Contractual servicing fees received
|
|
|
216
|
|
|
|
126
|
|
|
|
14
|
|
|
Servicing advances recovered/(funded), net
|
|
|
60
|
|
|
|
2
|
|
|
|
9
|
|
|
Cash flows on mortgage-backed securities held (f)
|
|
|
290
|
|
|
|
204
|
|
|
|
|
|
|
(a)
|
Represents financial and cash flow information associated with both commercial mortgage loan transfer and servicing activities.
|
|
(b)
|
These activities were part of an acquired brokered home equity business in which PNC is no longer engaged. See Note 17 Commitments and Guarantees for further
information.
|
|
(c)
|
For our continuing involvement with residential mortgages and home equity loan/line transfers, amount represents outstanding balance of loans transferred and serviced.
For commercial mortgages, amount represents the portion of the overall servicing portfolio in which loans have been transferred by us or third parties to VIEs.
|
|
(d)
|
See Note 8 Fair Value and Note 9 Goodwill and Other Intangible Assets for further information.
|
|
(e)
|
Represents liability for our loss exposure associated with loan repurchases for breaches of representations and warranties for our Residential Mortgage Banking and
Distressed Assets Portfolio segments, and our multifamily commercial mortgage loss share arrangements for our Corporate & Institutional Banking segment. See Note 17 Commitments and Guarantees for further information.
|
|
(f)
|
Represents securities held where PNC transferred to and/or serviced loans for a securitization SPE and we hold securities issued by that SPE.
|
|
(g)
|
There were no gains or losses recognized on the transaction date for sales of residential mortgage and certain commercial mortgage loans as these loans are recognized
on the balance sheet at fair value. For transfers of commercial loans not recognized on the balance sheet at fair value, gains/losses recognized on sales of these loans were insignificant for the periods presented.
|
|
(h)
|
Includes repurchases of insured loans, government guaranteed loans, and loans repurchased through the exercise of our ROAP option.
|
V
ARIABLE
I
NTEREST
E
NTITIES
(VIE
S
)
As discussed in our 2010 Form 10-K, we are involved with various entities in the normal course of business that are deemed to be VIEs. The following
provides a summary of VIEs, including those that we have consolidated and those in which we hold variable interests but have not consolidated into our financial statements as of June 30, 2011 and December 31, 2010.
Consolidated VIEs – Carrying Value (a)
|
|
|
|
|
|
|
|
|
|
|
|
|
|
|
|
|
|
|
June 30, 2011
In millions
|
|
Market Street
|
|
|
Credit Card
Securitization Trust
|
|
|
Tax Credit
Investments (b)
|
|
|
Total
|
|
|
Assets
|
|
|
|
|
|
|
|
|
|
|
|
|
|
|
|
|
|
Cash and due from banks
|
|
|
|
|
|
|
|
|
|
$
|
4
|
|
|
$
|
4
|
|
|
Interest-earning deposits with banks
|
|
|
|
|
|
|
|
|
|
|
9
|
|
|
|
9
|
|
|
Investment securities
|
|
$
|
317
|
|
|
|
|
|
|
|
|
|
|
|
317
|
|
|
Loans
|
|
|
3,010
|
|
|
$
|
1,964
|
|
|
|
|
|
|
|
4,974
|
|
|
Allowance for loan and lease losses
|
|
|
|
|
|
|
(105
|
)
|
|
|
|
|
|
|
(105
|
)
|
|
Equity investments
|
|
|
|
|
|
|
|
|
|
|
1,332
|
|
|
|
1,332
|
|
|
Other assets
|
|
|
421
|
|
|
|
8
|
|
|
|
606
|
|
|
|
1,035
|
|
|
Total assets
|
|
$
|
3,748
|
|
|
$
|
1,867
|
|
|
$
|
1,951
|
|
|
$
|
7,566
|
|
|
Liabilities
|
|
|
|
|
|
|
|
|
|
|
|
|
|
|
|
|
|
Other borrowed funds
|
|
$
|
3,339
|
|
|
$
|
287
|
|
|
$
|
233
|
|
|
$
|
3,859
|
|
|
Accrued expenses
|
|
|
|
|
|
|
31
|
|
|
|
98
|
|
|
|
129
|
|
|
Other liabilities
|
|
|
417
|
|
|
|
|
|
|
|
407
|
|
|
|
824
|
|
|
Total liabilities
|
|
$
|
3,756
|
|
|
$
|
318
|
|
|
$
|
738
|
|
|
$
|
4,812
|
|
75
|
|
|
|
|
|
|
|
|
|
|
|
|
|
|
|
|
|
|
December 31, 2010
In millions
|
|
Market Street
|
|
|
Credit Card
Securitization Trust
|
|
|
Tax Credit
Investments (b)
|
|
|
Total
|
|
|
Assets
|
|
|
|
|
|
|
|
|
|
|
|
|
|
|
|
|
|
Cash and due from banks
|
|
|
|
|
|
|
|
|
|
$
|
2
|
|
|
$
|
2
|
|
|
Interest-earning deposits with banks
|
|
|
|
|
|
$
|
284
|
|
|
|
4
|
|
|
|
288
|
|
|
Investment securities
|
|
$
|
192
|
|
|
|
|
|
|
|
|
|
|
|
192
|
|
|
Loans
|
|
|
2,520
|
|
|
|
2,125
|
|
|
|
|
|
|
|
4,645
|
|
|
Allowance for loan and lease losses
|
|
|
|
|
|
|
(183
|
)
|
|
|
|
|
|
|
(183
|
)
|
|
Equity investments
|
|
|
|
|
|
|
|
|
|
|
1,177
|
|
|
|
1,177
|
|
|
Other assets
|
|
|
271
|
|
|
|
9
|
|
|
|
396
|
|
|
|
676
|
|
|
Total assets
|
|
$
|
2,983
|
|
|
$
|
2,235
|
|
|
$
|
1,579
|
|
|
$
|
6,797
|
|
|
Liabilities
|
|
|
|
|
|
|
|
|
|
|
|
|
|
|
|
|
|
Other borrowed funds
|
|
$
|
2,715
|
|
|
$
|
523
|
|
|
$
|
116
|
|
|
$
|
3,354
|
|
|
Accrued expenses
|
|
|
|
|
|
|
9
|
|
|
|
79
|
|
|
|
88
|
|
|
Other liabilities
|
|
|
268
|
|
|
|
|
|
|
|
188
|
|
|
|
456
|
|
|
Total liabilities
|
|
$
|
2,983
|
|
|
$
|
532
|
|
|
$
|
383
|
|
|
$
|
3,898
|
|
|
(a)
|
Amounts represent carrying value on PNC’s Consolidated Balance Sheet.
|
|
(b)
|
Amounts primarily represent Low Income Housing Tax Credit (LIHTC) investments.
|
Assets and Liabilities of Consolidated VIEs (a)
|
|
|
|
|
|
|
|
|
|
|
In millions
|
|
Aggregate
Assets
|
|
|
Aggregate
Liabilities
|
|
|
June 30, 2011
|
|
|
|
|
|
|
|
|
|
Market Street
|
|
$
|
4,513
|
|
|
$
|
4,517
|
|
|
Credit Card Securitization Trust
|
|
|
1,902
|
|
|
|
475
|
|
|
Tax Credit Investments (b)
|
|
|
1,958
|
|
|
|
775
|
|
|
|
|
|
|
December 31, 2010
|
|
|
|
|
|
|
|
|
|
Market Street
|
|
$
|
3,584
|
|
|
$
|
3,588
|
|
|
Credit Card Securitization Trust
|
|
|
2,269
|
|
|
|
1,004
|
|
|
Tax Credit Investments (b)
|
|
|
1,590
|
|
|
|
420
|
|
|
(a)
|
Amounts in this table differ from total assets and liabilities in the preceding “Consolidated VIEs – Carrying Value” table as amounts in the preceding
table reflect the elimination of intercompany assets and liabilities.
|
|
(b)
|
Amounts primarily represent LIHTC investments.
|
Non-Consolidated VIEs
|
|
|
|
|
|
|
|
|
|
|
|
|
|
|
|
|
|
|
|
|
|
|
In millions
|
|
Aggregate
Assets
|
|
|
Aggregate
Liabilities
|
|
|
PNC Risk
of Loss
|
|
|
Carrying
Value of
Assets
|
|
|
Carrying
Value of
Liabilities
|
|
|
June 30, 2011
|
|
|
|
|
|
|
|
|
|
|
|
|
|
|
|
|
|
|
|
|
|
Tax Credit Investments (a)
|
|
$
|
4,550
|
|
|
$
|
2,488
|
|
|
$
|
924
|
|
|
$
|
924
|
(c)
|
|
$
|
399
|
(d)
|
|
Commercial Mortgage-Backed Securitizations (b)
|
|
|
74,727
|
|
|
|
74,727
|
|
|
|
2,200
|
|
|
|
2,200
|
(e)
|
|
|
|
|
|
Residential Mortgage-Backed Securitizations (b)
|
|
|
35,729
|
|
|
|
35,729
|
|
|
|
1,712
|
|
|
|
1,710
|
(e)
|
|
|
2
|
(d)
|
|
Collateralized Debt Obligations
|
|
|
16
|
|
|
|
|
|
|
|
1
|
|
|
|
1
|
(c)
|
|
|
|
|
|
Total
|
|
$
|
115,022
|
|
|
$
|
112,944
|
|
|
$
|
4,837
|
|
|
$
|
4,835
|
|
|
$
|
401
|
|
|
|
|
|
|
|
|
|
|
|
|
|
|
|
|
|
|
|
|
|
|
|
|
In millions
|
|
Aggregate
Assets
|
|
|
Aggregate
Liabilities
|
|
|
PNC Risk
of Loss
|
|
|
Carrying
Value of
Assets
|
|
|
Carrying
Value of
Liabilities
|
|
|
December 31, 2010
|
|
|
|
|
|
|
|
|
|
|
|
|
|
|
|
|
|
|
|
|
|
Tax Credit Investments (a)
|
|
$
|
4,086
|
|
|
$
|
2,258
|
|
|
$
|
782
|
|
|
$
|
782
|
(c)
|
|
$
|
301
|
(d)
|
|
Commercial Mortgage-Backed Securitizations (b)
|
|
|
79,142
|
|
|
|
79,142
|
|
|
|
2,068
|
|
|
|
2,068
|
(e)
|
|
|
|
|
|
Residential Mortgage-Backed Securitizations (b)
|
|
|
42,986
|
|
|
|
42,986
|
|
|
|
2,203
|
|
|
|
2,199
|
(e)
|
|
|
4
|
(d)
|
|
Collateralized Debt Obligations
|
|
|
18
|
|
|
|
|
|
|
|
1
|
|
|
|
1
|
(c)
|
|
|
|
|
|
Total
|
|
$
|
126,232
|
|
|
$
|
124,386
|
|
|
$
|
5,054
|
|
|
$
|
5,050
|
|
|
$
|
305
|
|
|
(a)
|
Amounts primarily represent LIHTC investments. Aggregate assets and aggregate liabilities represent estimated balances due to limited availability of financial
information associated with certain acquired partnerships.
|
|
(b)
|
Amounts reflect involvement with securitization SPEs where PNC transferred to and/or services loans for a SPE and we hold securities issued by that SPE. We also invest
in other mortgage and asset-backed securities issued by third-party VIEs with which we have no continuing involvement. Further information on these securities is included in Note 7 Investment Securities and values disclosed represent our maximum
exposure to loss for those securities’ holdings.
|
|
(c)
|
Included in Equity investments on our Consolidated Balance Sheet.
|
|
(d)
|
Included in Other liabilities on our Consolidated Balance Sheet.
|
|
(e)
|
Included in Trading securities, Investment securities, Other intangible assets, and Other assets on our Consolidated Balance Sheet.
|
76
M
ARKET
S
TREET
Market Street Funding LLC (Market Street) is a multi-seller asset-backed commercial paper conduit that is owned by an independent third party. Market
Street’s activities primarily involve purchasing assets or making loans secured by interests in pools of receivables from US corporations that desire access to the commercial paper market. Market Street funds the purchases of assets or loans by
issuing commercial paper and is supported by pool-specific credit enhancements, liquidity facilities and program-level credit enhancement. Generally, Market Street mitigates its potential interest rate risk by entering into agreements with its
borrowers that reflect interest rates based upon its weighted average commercial paper cost of funds. During 2010 and the first six months of 2011, Market Street met all of its funding needs through the issuance of commercial paper.
PNC Bank, N.A. provides certain administrative services, the program-level credit enhancement and all of the liquidity facilities to Market Street in
exchange for fees negotiated based on market rates. Through these arrangements, PNC Bank, N.A. has the power to direct the activities of the SPE that most significantly affect its economic performance and these arrangements expose PNC Bank, N.A. to
expected losses or residual returns that are significant to Market Street.
The commercial paper obligations at June 30, 2011 and
December 31, 2010 were supported by Market Street’s assets. While PNC Bank, N.A. may be obligated to fund under the $7.2 billion of liquidity facilities for events such as commercial paper market disruptions, borrower bankruptcies,
collateral deficiencies or covenant violations, our credit risk under the liquidity facilities is secondary to the risk of first loss provided by the borrower such as by the over-collateralization of the assets or by another third party in the form
of deal-specific credit enhancement. Deal-specific credit enhancement that supports the commercial paper issued by Market Street is generally structured to cover a multiple of expected losses for the pool of assets and is sized to generally meet
rating agency standards for comparably structured transactions. In addition, PNC Bank, N.A. would be required to fund $1.4 billion of the liquidity facilities regardless of whether the underlying assets are in default. Market Street creditors have
no direct recourse to PNC Bank, N.A.
PNC Bank, N.A. provides program-level credit enhancement to cover net losses in the amount of 10% of
commitments, excluding explicitly rated AAA/Aaa facilities. PNC Bank, N.A. provides 100% of the enhancement in the form of a cash collateral account funded by a loan facility. This facility expires in June 2016. At June 30, 2011, $750 million
was outstanding on this facility. This amount is eliminated in PNC’s Consolidated Balance Sheet as we consolidate Market Street. We are not required to nor have we provided additional financial support to the SPE.
C
REDIT
C
ARD
S
ECURITIZATION
T
RUST
We are the sponsor of several credit card securitizations facilitated through a trust. This bankruptcy-remote SPE or VIE was
established to purchase credit card receivables from the sponsor and to issue and sell asset-backed securities created by it to independent third-parties. The SPE was financed primarily through the sale of these asset-backed securities. These
transactions were originally structured as a form of liquidity and to afford favorable capital treatment. At June 30, 2011, only Series 2007-1 issued by the SPE was outstanding. Series 2006-1 and 2008-3 were paid off during the first and second
quarters of 2011, respectively.
Our continuing involvement in these securitization transactions consists primarily of holding certain
retained interests and acting as the primary servicer. For each securitization series, our retained interests held are in the form of a pro-rata undivided interest, or sellers’ interest, in the transferred receivables, subordinated tranches of
asset-backed securities, interest-only strips, discount receivables, and subordinated interests in accrued interest and fees in securitized receivables. We have consolidated the SPE as we are deemed the primary beneficiary of the entity based upon
our level of continuing involvement. Our role as primary servicer gives us the power to direct the activities of the SPE that most significantly affect its economic performance and our holding of retained interests gives us the obligation to absorb
or receive expected losses or residual returns that are significant to the SPE. Accordingly, all retained interests held in the credit card SPE are eliminated in consolidation. The underlying assets of the consolidated SPE are restricted only for
payment of the beneficial interest issued by the SPE. We are not required to nor have we provided additional financial support to the SPE. Additionally, creditors of the SPE have no direct recourse to PNC.
T
AX
C
REDIT
I
NVESTMENTS
We make certain equity investments in various limited partnerships or limited liability companies (LLCs) that sponsor affordable housing projects utilizing the LIHTC pursuant to Sections 42 and 47 of
the Internal Revenue Code. The purpose of these investments is to achieve a satisfactory return on capital, to facilitate the sale of additional affordable housing product offerings and to assist us in achieving goals associated with the Community
Reinvestment Act. The primary activities of the investments include the identification, development and operation of multi-family housing that is leased to qualifying residential tenants. Generally, these types of investments are funded through a
combination of debt and equity. We typically invest in these partnerships as a limited partner or non-managing member. We make similar investments in other types of tax credit investments.
Also, we are a national syndicator of affordable housing equity (together with the investments described above, the LIHTC investments). In these syndication transactions, we
77
create funds in which our subsidiaries are the general partner or managing member and sell limited partnership or non-managing member interests to third parties, and in some cases may also
purchase a limited partnership or non-managing member interest in the fund and/or provide mezzanine financing to the fund. The purpose of this business is to generate income from the syndication of these funds, generate servicing fees by managing
the funds, and earn tax credits to reduce our tax liability. General partner or managing member activities include selecting, evaluating, structuring, negotiating, and closing the fund investments in operating limited partnerships or LLCs, as well
as oversight of the ongoing operations of the fund portfolio.
Typically, the general partner or managing member will be the party that has
the right to make decisions that will most significantly impact the economic performance of the entity. However, certain partnership or LLC agreements provide the limited partner or non-managing member the ability to remove the general partner or
managing member without cause. This results in the limited partner or non-managing member being the party that has the right to make decisions that will most significantly impact the economic performance of the entity. The primary sources of losses
and benefits in LIHTC investments are the tax credits, tax benefits due to passive losses on the investments, and development and operating cash flows. We have consolidated LIHTC investments in which we are the general partner or managing member and
have a limited partnership interest or non-managing member interest that could potentially absorb losses or receive benefits that are significant. The assets are primarily included in Equity investments and Other assets on our Consolidated Balance
Sheet with the liabilities classified in Other liabilities and third party investors’ interests included in the Equity section as Noncontrolling interests. Neither creditors nor equity investors in the LIHTC investments have any recourse to our
general credit. There are no terms or conditions that have required or could require us, as the primary beneficiary, to provide financial support. Also, we have not provided nor do we intend to provide financial or other support to the limited
partnership or LLC that we are not contractually obligated to provide. The consolidated aggregate assets and liabilities of these LIHTC investments are provided in the Consolidated VIEs table and reflected in the “Other” business segment.
For tax credit investments in which we do not have the right to make decisions that will most significantly impact the economic performance
of the entity, we are not the primary beneficiary and thus they are not consolidated. These investments are disclosed in the Non-Consolidated VIEs table. The table also reflects our maximum exposure to loss. Our
maximum exposure to loss is equal to our legally binding equity commitments adjusted for recorded impairment and partnership results. We use the equity method to account for our investment in
these entities with the investments reflected in Equity investments on our Consolidated Balance Sheet. In addition, we increase our recognized investments and recognize a liability for all legally binding unfunded equity commitments. These
liabilities are reflected in Other liabilities on our Consolidated Balance Sheet.
R
ESIDENTIAL
AND
C
OMMERCIAL
M
ORTGAGE
-B
ACKED
S
ECURITIZATIONS
In connection with each Agency
and Non-Agency securitization discussed above, we evaluate each SPE utilized in these transactions for consolidation. In performing these assessments, we evaluate our level of continuing involvement in these transactions as the nature of our
involvement ultimately determines whether or not we hold a variable interest and/or are the primary beneficiary of the SPE. Factors we consider in our consolidation assessment include the significance of (1) our role as servicer, (2) our
holdings of mortgage-backed securities issued by the securitization SPE, and (3) the rights of third-party variable interest holders.
Our first step in our assessment is to determine whether we hold a variable interest in the securitization SPE. We hold a variable interest in an Agency
and Non-Agency securitization SPE through our holding of mortgage-backed securities issued by the SPE and/or our repurchase and recourse obligations. Each SPE in which we hold a variable interest is evaluated to determine whether we are the primary
beneficiary of the entity. For Agency securitization transactions, our contractual role as servicer does not give us the power to direct the activities that most significantly affect the economic performance of the SPEs. Thus, we are not the primary
beneficiary of these entities. For Non-Agency securitization transactions, we would be the primary beneficiary to the extent our servicing activities give us the power to direct the activities that most significantly affect the economic performance
of the SPE and we hold a more than insignificant variable interest in the entity. At June 30, 2011, our level of continuing involvement in Non-Agency securitization SPEs did not result in PNC being deemed the primary beneficiary of any of these
entities. Details about the Agency and Non-Agency securitization SPEs where we hold a variable interest and are not the primary beneficiary are included in the table above. Our maximum exposure to loss as a result of our involvement with these SPEs
is the carrying value of the mortgage-backed securities, servicing assets, servicing advances, and our liabilities associated with our repurchase and recourse obligations. Creditors of the securitization SPEs have no recourse to PNC’s assets or
general credit.
78
N
OTE
4 L
OANS
AND
C
OMMITMENTS
TO
E
XTEND
C
REDIT
Loans outstanding were as follows:
Loans Outstanding
|
|
|
|
|
|
|
|
|
|
|
In millions
|
|
June 30
2011
|
|
|
December 31
2010
|
|
|
Commercial lending
|
|
|
|
|
|
|
|
|
|
Commercial
|
|
$
|
58,620
|
|
|
$
|
55,177
|
|
|
Commercial real estate
|
|
|
16,319
|
|
|
|
17,934
|
|
|
Equipment lease financing
|
|
|
6,210
|
|
|
|
6,393
|
|
|
TOTAL COMMERCIAL LENDING
|
|
|
81,149
|
|
|
|
79,504
|
|
|
Consumer lending
|
|
|
|
|
|
|
|
|
|
Home equity
|
|
|
33,379
|
|
|
|
34,226
|
|
|
Residential real estate
|
|
|
14,982
|
|
|
|
15,999
|
|
|
Credit card
|
|
|
3,754
|
|
|
|
3,920
|
|
|
Other
|
|
|
17,055
|
|
|
|
16,946
|
|
|
TOTAL CONSUMER LENDING
|
|
|
69,170
|
|
|
|
71,091
|
|
|
Total loans (a) (b)
|
|
$
|
150,319
|
|
|
$
|
150,595
|
|
|
(a)
|
Net of unearned income, net deferred loan fees, unamortized discounts and premiums, and purchase discounts and premiums totaling $2.5 billion and $2.7 billion at
June 30, 2011 and December 31, 2010, respectively.
|
|
(b)
|
Future accretable yield related to purchased impaired loans is not included in loans outstanding.
|
At June 30, 2011, we pledged $18.0 billion of commercial loans to the Federal Reserve Bank and $31.8 billion of residential real estate and other
loans to the Federal Home Loan Bank as collateral for the contingent ability to borrow, if necessary. The comparable amounts at December 31, 2010 were $12.6 billion and $32.4 billion, respectively.
Net Unfunded Credit Commitments
|
|
|
|
|
|
|
|
|
|
|
In millions
|
|
June 30
2011
|
|
|
December 31
2010
|
|
|
Commercial and commercial real estate
|
|
$
|
62,834
|
|
|
$
|
59,256
|
|
|
Home equity lines of credit
|
|
|
18,994
|
|
|
|
19,172
|
|
|
Credit card
|
|
|
15,206
|
|
|
|
14,725
|
|
|
Other
|
|
|
2,757
|
|
|
|
2,652
|
|
|
Total (a)
|
|
$
|
99,791
|
|
|
$
|
95,805
|
|
|
(a)
|
Excludes standby letters of credit. See Note 17 Commitments and Guarantees for additional information on standby letters of credit.
|
Commitments to extend credit represent arrangements to lend funds or provide liquidity subject to specified
contractual conditions. At June 30, 2011, commercial commitments reported above exclude $18.5 billion of syndications, assignments and participations, primarily to financial institutions. The comparable amount at December 31, 2010 was
$16.7 billion.
Commitments generally have fixed expiration dates, may require payment of a fee, and contain termination clauses in the event
the customer’s credit quality deteriorates. Based on our historical experience, most commitments expire unfunded, and therefore cash requirements are substantially less than the total commitment.
N
OTE
5 A
SSET
Q
UALITY
AND
A
LLOWANCES
FOR
L
OAN
AND
L
EASE
L
OSSES
AND
U
NFUNDED
L
OAN
C
OMMITMENTS
AND
L
ETTERS
OF
C
REDIT
Asset Quality
We
closely monitor economic conditions and loan performance trends to manage and evaluate our exposure to credit risk. Trends in delinquency rates are a key indicator, among other considerations, of credit risk within the loan portfolios. The
measurement of delinquency status is based on the contractual terms of each loan. Loans that are 30 days or more past due in terms of payment are considered delinquent. Loan delinquencies exclude loans held for sale and purchased impaired loans.
The level of nonperforming assets represents another key indicator of the potential for future credit losses. Nonperforming assets include
nonperforming loans, TDRs, and other real estate owned (OREO) and foreclosed assets, but exclude loans held for sale, purchased impaired loans and loans accounted for under the fair value option. See Note 6 Purchased Impaired Loans for further
information.
See Note 1 Accounting Policies for additional delinquency, nonperforming, and charge-off information.
79
The following tables display the delinquency status of our loans and our nonperforming assets at
June 30, 2011 and December 31, 2010.
Age Analysis of Past Due Accruing Loans
|
|
|
|
|
|
|
|
|
|
|
|
|
|
|
|
|
|
|
|
|
|
|
|
|
|
|
|
|
|
|
|
|
|
|
|
|
Accruing
|
|
|
|
|
|
|
|
|
|
|
|
In millions
|
|
Current or Less
Than 30 Days
Past Due
|
|
|
30-59 Days
Past Due
|
|
|
60-89 Days
Past Due
|
|
|
90 Days
Or More
Past Due
|
|
|
Total Past
Due (a)
|
|
|
Nonperforming
Loans
|
|
|
Purchased
Impaired
|
|
|
Total
Loans
|
|
|
June 30, 2011
|
|
|
|
|
|
|
|
|
|
|
|
|
|
|
|
|
|
|
|
|
|
|
|
|
|
|
|
|
|
|
|
|
|
Commercial
|
|
$
|
57,140
|
|
|
$
|
149
|
|
|
$
|
75
|
|
|
$
|
42
|
|
|
$
|
266
|
|
|
$
|
1,047
|
|
|
$
|
167
|
|
|
$
|
58,620
|
|
|
Commercial real estate
|
|
|
13,518
|
|
|
|
98
|
|
|
|
71
|
|
|
|
12
|
|
|
|
181
|
|
|
|
1,667
|
|
|
|
953
|
|
|
|
16,319
|
|
|
Equipment lease financing
|
|
|
6,163
|
|
|
|
9
|
|
|
|
2
|
|
|
|
1
|
|
|
|
12
|
|
|
|
35
|
|
|
|
|
|
|
|
6,210
|
|
|
Residential real estate (b)
|
|
|
8,493
|
|
|
|
324
|
|
|
|
187
|
|
|
|
2,071
|
|
|
|
2,582
|
|
|
|
666
|
|
|
|
3,241
|
|
|
|
14,982
|
|
|
Home equity
|
|
|
29,651
|
|
|
|
141
|
|
|
|
91
|
|
|
|
182
|
|
|
|
414
|
|
|
|
421
|
|
|
|
2,893
|
|
|
|
33,379
|
|
|
Credit card
|
|
|
3,639
|
|
|
|
39
|
|
|
|
23
|
|
|
|
45
|
|
|
|
107
|
|
|
|
8
|
|
|
|
|
|
|
|
3,754
|
|
|
Other consumer (c)
|
|
|
16,445
|
|
|
|
185
|
|
|
|
104
|
|
|
|
293
|
|
|
|
582
|
|
|
|
26
|
|
|
|
2
|
|
|
|
17,055
|
|
|
Total
|
|
$
|
135,049
|
|
|
$
|
945
|
|
|
$
|
553
|
|
|
$
|
2,646
|
|
|
$
|
4,144
|
|
|
$
|
3,870
|
|
|
$
|
7,256
|
|
|
$
|
150,319
|
|
|
Percentage of total loans
|
|
|
89.84
|
%
|
|
|
.63
|
%
|
|
|
.37
|
%
|
|
|
1.76
|
%
|
|
|
2.76
|
%
|
|
|
2.57
|
%
|
|
|
4.83
|
%
|
|
|
100.00
|
%
|
|
December 31, 2010
|
|
|
|
|
|
|
|
|
|
|
|
|
|
|
|
|
|
|
|
|
|
|
|
|
|
|
|
|
|
|
|
|
|
Commercial
|
|
$
|
53,273
|
|
|
$
|
251
|
|
|
$
|
92
|
|
|
$
|
59
|
|
|
$
|
402
|
|
|
$
|
1,253
|
|
|
$
|
249
|
|
|
$
|
55,177
|
|
|
Commercial real estate
|
|
|
14,713
|
|
|
|
128
|
|
|
|
62
|
|
|
|
43
|
|
|
|
233
|
|
|
|
1,835
|
|
|
|
1,153
|
|
|
|
17,934
|
|
|
Equipment lease financing
|
|
|
6,276
|
|
|
|
37
|
|
|
|
2
|
|
|
|
1
|
|
|
|
40
|
|
|
|
77
|
|
|
|
|
|
|
|
6,393
|
|
|
Residential real estate (b)
|
|
|
9,150
|
|
|
|
331
|
|
|
|
225
|
|
|
|
2,121
|
|
|
|
2,677
|
|
|
|
818
|
|
|
|
3,354
|
|
|
|
15,999
|
|
|
Home equity
|
|
|
30,334
|
|
|
|
159
|
|
|
|
91
|
|
|
|
174
|
|
|
|
424
|
|
|
|
448
|
|
|
|
3,020
|
|
|
|
34,226
|
|
|
Credit card
|
|
|
3,765
|
|
|
|
46
|
|
|
|
32
|
|
|
|
77
|
|
|
|
155
|
|
|
|
|
|
|
|
|
|
|
|
3,920
|
|
|
Other consumer (c)
|
|
|
16,312
|
|
|
|
260
|
|
|
|
101
|
|
|
|
234
|
|
|
|
595
|
|
|
|
35
|
|
|
|
4
|
|
|
|
16,946
|
|
|
Total
|
|
$
|
133,823
|
|
|
$
|
1,212
|
|
|
$
|
605
|
|
|
$
|
2,709
|
|
|
$
|
4,526
|
|
|
$
|
4,466
|
|
|
$
|
7,780
|
|
|
$
|
150,595
|
|
|
Percentage of total loans
|
|
|
88.86
|
%
|
|
|
.81
|
%
|
|
|
.40
|
%
|
|
|
1.80
|
%
|
|
|
3.01
|
%
|
|
|
2.97
|
%
|
|
|
5.16
|
%
|
|
|
100.00
|
%
|
|
(a)
|
Past due loan amounts exclude purchased impaired loans as they are considered performing loans due to the accretion of interest income.
|
|
(b)
|
Past due loan amounts at June 30, 2011, include government insured or guaranteed residential real estate mortgages, totaling $.1 billion for 30 to 59 days past
due, $.1 billion for 60 to 89 days past due and $1.9 billion for 90 days or more past due. Past due loan amounts at December 31, 2010, include government insured or guaranteed residential real estate mortgages, totaling $.1 billion for 30 to 59
days past due, $.1 billion for 60 to 89 days past due and $2.0 billion for 90 days or more past due.
|
|
(c)
|
Past due loan amounts at June 30, 2011, include government insured or guaranteed other consumer loans, totaling $.1 billion for 30 to 59 days past due, $.1 billion
for 60 to 89 days past due and $.3 billion for 90 days or more past due. Past due loan amounts at December 31, 2010, include government insured or guaranteed other consumer loans, totaling $.2 billion for 30 to 59 days past due, $.1 billion for
60 to 89 days past due and $.2 billion for 90 days or more past due.
|
Nonperforming Assets
|
|
|
|
|
|
|
|
|
|
|
Dollars in millions
|
|
June 30, 2011
|
|
|
December 31, 2010
|
|
|
Nonperforming loans
|
|
|
|
|
|
|
|
|
|
Commercial
|
|
$
|
1,047
|
|
|
$
|
1,253
|
|
|
Commercial real estate
|
|
|
1,667
|
|
|
|
1,835
|
|
|
Equipment lease financing
|
|
|
35
|
|
|
|
77
|
|
|
TOTAL COMMERCIAL LENDING
|
|
|
2,749
|
|
|
|
3,165
|
|
|
Consumer (a)
|
|
|
|
|
|
|
|
|
|
Home equity
|
|
|
421
|
|
|
|
448
|
|
|
Residential real estate (b)
|
|
|
666
|
|
|
|
818
|
|
|
Credit card (c)
|
|
|
8
|
|
|
|
|
|
|
Other consumer
|
|
|
26
|
|
|
|
35
|
|
|
TOTAL CONSUMER LENDING
|
|
|
1,121
|
|
|
|
1,301
|
|
|
Total nonperforming loans (d)
|
|
|
3,870
|
|
|
|
4,466
|
|
|
OREO and foreclosed assets
|
|
|
|
|
|
|
|
|
|
Other real estate owned (OREO) (e)
|
|
|
546
|
|
|
|
589
|
|
|
Foreclosed and other assets
|
|
|
65
|
|
|
|
68
|
|
|
TOTAL FORECLOSED AND OTHER ASSETS
|
|
|
611
|
|
|
|
657
|
|
|
Total nonperforming assets
|
|
$
|
4,481
|
|
|
$
|
5,123
|
|
|
Nonperforming loans to total loans
|
|
|
2.57
|
%
|
|
|
2.97
|
%
|
|
Nonperforming assets to total loans, OREO and foreclosed assets
|
|
|
2.97
|
|
|
|
3.39
|
|
|
Nonperforming assets to total assets
|
|
|
1.70
|
|
|
|
1.94
|
|
80
|
(a)
|
Excludes most consumer loans and lines of credit, not secured by residential real estate, which are charged off after 120 to 180 days past due and are not placed on
nonperforming status.
|
|
(b)
|
Effective in 2011, nonperforming residential real estate excludes loans of $85 million accounted for under the fair value option as of June 30, 2011. The
comparable balance at December 31, 2010 was not material.
|
|
(c)
|
Effective in the second quarter 2011, the commercial nonaccrual policy was applied to certain small business credit card balances. This change resulted in loans being
placed on nonaccrual status when they become 90 days or more past due, rather than being excluded and charged off at 180 days past due.
|
|
(d)
|
Nonperforming loans do not include purchased impaired loans or loans held for sale.
|
|
(e)
|
Other real estate owned excludes $273 million and $178 million at June 30, 2011, and December 31, 2010, respectively, related to serviced loans insured by the
Federal Housing Administration (FHA) or guaranteed by the Department of Veterans Affairs (VA).
|
Troubled Debt Restructurings (TDRs)
Nonperforming loans also include loans whose contractual terms have been restructured in a manner that grants a concession to a borrower experiencing financial difficulties. In accordance with applicable
accounting guidance, these loans are considered TDRs. See Note 1 Accounting Policies for additional information. TDRs typically result from our loss mitigation activities and could include interest rate reductions, principal forgiveness and other
actions intended to minimize the economic loss and to avoid foreclosure or repossession of collateral. We typically do not forgive principal for our TDRs, but in those situations where principal is forgiven, the entire amount of such principal
forgiveness is immediately charged off to the extent it was not done so prior to modification. Government insured or guaranteed/held for sale loans, purchased impaired loans and loans accounted for under the fair value option are not classified as
TDRs. Consumer loans modified in the second quarter of 2011 that are government insured or guaranteed/held for sale totaling $194 million are not classified as TDRs.
Total nonperforming loans in the table above include TDRs of $845 million at June 30, 2011 and $784 million at December 31, 2010. TDRs returned to performing (accrual) status totaled $752
million and $543 million at June 30, 2011 and December 31, 2010, respectively, and are excluded from nonperforming loans. These loans have demonstrated a period of at least six months of consecutive performance under the modified terms. At
June 30, 2011 and December 31, 2010, remaining commitments to lend additional funds to debtors whose terms have been modified in a commercial or consumer TDR were immaterial. The following table provides a summary of TDRs by segment and
performing status.
Troubled Debt Restructurings By Type
|
|
|
|
|
|
|
|
|
|
|
In millions
|
|
June 30 2011
|
|
|
Dec. 31 2010
|
|
|
Total consumer lending
|
|
$
|
1,614
|
|
|
$
|
1,422
|
|
|
Total commercial lending
|
|
|
305
|
|
|
|
236
|
|
|
Total TDRs
|
|
$
|
1,919
|
|
|
$
|
1,658
|
|
|
Nonperforming status
|
|
$
|
845
|
|
|
$
|
784
|
|
|
Accrual status
|
|
|
752
|
|
|
|
543
|
|
|
Credit card (a)
|
|
|
322
|
|
|
|
331
|
|
|
Total TDRs
|
|
$
|
1,919
|
|
|
$
|
1,658
|
|
|
(a)
|
Credit cards and certain consumer small business and other credit agreements whose terms have been modified primarily through interest rate reductions are also
classified as TDRs. However, these loans are excluded from nonperforming loans since our policy is to exempt these loans from being placed on nonaccrual status as permitted by regulatory guidance. As such, generally under modified terms, these loans
are directly charged off in the period that they become 120 to 180 days past due.
|
Some loan modifications classified as TDRs may not ultimately result in the full collection of principal
and interest, as modified, and result in potential incremental losses. These potential incremental losses have been factored into our overall ALLL estimate. The level of any re-defaults will likely be affected by future economic conditions. Once a
loan becomes a TDR, it will continue to be reported as a TDR until it is ultimately repaid in full, or foreclosed and sold. We held specific reserves in the ALLL for the TDR portfolio of $577 million and $509 million at June 30, 2011, and
December 31, 2010, respectively.
Additional Asset Quality Indicators
We have two overall portfolio segments – Commercial Lending and Consumer Lending. Each of these two segments is comprised of one or more loan
classes. Classes are characterized by similarities in initial measurement, risk attributes and the manner in which we monitor and assess credit risk. The commercial segment is comprised of the commercial, commercial real estate, equipment lease
financing, and commercial purchased impaired loan classes. The consumer segment is comprised of the residential real estate, home equity, credit card, other consumer, and consumer purchased impaired loan classes. Asset quality indicators for each of
these loan classes are discussed in more detail below.
Commercial Loan Class
For commercial loans, we monitor the performance of the borrower in a disciplined and regular manner based upon the level of credit risk inherent in the
loan. To evaluate the level of credit risk, we assign an internal risk rating reflecting the borrower’s PD and LGD. This two-dimensional credit risk rating methodology provides risk granularity in the monitoring process on an ongoing basis. We
adjust our risk-rating process through updates based on actual experience. The combination of the PD and LGD ratings assigned to a commercial loan, capturing both the combination of expectations of default and loss severity, reflects the relative
estimated likelihood of loss for that loan at the reporting date. Loans with low PD and LGD have the lowest likelihood of loss. Conversely, loans with high PD and LGD have the highest likelihood of loss.
Based upon the amount of the lending arrangement and of the credit risk described above, we follow a formal schedule of periodic review. Generally, for
higher risk loans this occurs on a quarterly basis, although we have established practices to review such credit risk more frequently, if circumstances warrant.
81
Commercial Real Estate Loan Class
We manage credit risk associated with our commercial real estate projects and commercial mortgage activities similar to commercial loans by analyzing PD and LGD. However, due to the nature of the
collateral, for commercial real estate projects and commercial mortgages, the LGDs tend to be significantly lower than those seen in the commercial class. Additionally, risks connected with commercial real estate projects and commercial mortgage
activities tend to be correlated to the loan structure and collateral location, project progress and business environment. As a result, these attributes are also monitored and utilized in assessing credit risk.
As with the commercial class, a formal schedule of periodic review is performed to assess geographic, product and loan type concentrations, in addition
to industry risk and market and economic concerns. Often as a result of these overviews, more in-depth reviews and increased scrutiny is placed on areas of higher risk, adverse changes in risk ratings, deteriorating operating trends, and/or areas
that concern management. The goal of these reviews is to assess risk and take actions to mitigate our exposure to such risks.
Equipment
Lease Financing Loan Class
Similar to the other classes of loans within Commercial Lending, loans within the equipment lease financing
class undergo a rigorous underwriting process. During this process, a PD and LGD are assigned based on the credit risk.
Based upon the dollar amount of the lease and of the level of credit risk, we follow a formal schedule of
periodic review. Generally, this occurs on a quarterly basis, although we have established practices to review such credit risk more frequently, if circumstances warrant. Our review process entails analysis of the following factors: equipment
value/residual value, exposure levels, jurisdiction risk, industry risk, guarantor requirements, and regulatory compliance.
Commercial
Purchased Impaired Loans Class
The credit impacts of purchased impaired loans are primarily determined through the estimation of
expected cash flows. Commercial cash flow estimates are influenced by a number of credit related items, which include but are not limited to: changes in estimated collateral value, receipt of additional collateral, secondary trading prices,
circumstances of possible and/or ongoing liquidation, capital availability, business operations and payment patterns.
We attempt to
proactively manage these factors by using various procedures that are customized to the risk of a given loan. These procedures include a review by our Special Asset Committee (SAC), ongoing outreach, contact, and assessment of obligor financial
conditions, collateral inspection and appraisal.
See Note 6 Purchased Impaired Loans for additional information.
Commercial Lending Asset
Quality Indicators
|
|
|
|
|
|
|
|
|
|
|
|
|
|
|
|
|
|
|
|
|
|
|
|
|
|
|
|
|
|
|
|
|
Criticized Commercial Loans
|
|
|
|
|
|
In millions
|
|
Pass
Rated (a)
|
|
|
Special
Mention (b)
|
|
|
Substandard (c)
|
|
|
Doubtful (d)
|
|
|
Total
Loans
|
|
|
June 30, 2011
|
|
|
|
|
|
|
|
|
|
|
|
|
|
|
|
|
|
|
|
|
|
Commercial
|
|
$
|
52,966
|
|
|
$
|
1,771
|
|
|
$
|
3,410
|
|
|
$
|
306
|
|
|
$
|
58,453
|
|
|
Commercial real estate
|
|
|
10,412
|
|
|
|
1,141
|
|
|
|
3,443
|
|
|
|
369
|
|
|
|
15,365
|
|
|
Equipment lease financing
|
|
|
5,969
|
|
|
|
101
|
|
|
|
120
|
|
|
|
20
|
|
|
|
6,210
|
|
|
Purchased impaired loans
|
|
|
98
|
|
|
|
79
|
|
|
|
747
|
|
|
|
197
|
|
|
|
1,121
|
|
|
Total commercial lending (e)
|
|
$
|
69,445
|
|
|
$
|
3,092
|
|
|
$
|
7,720
|
|
|
$
|
892
|
|
|
$
|
81,149
|
|
|
December 31, 2010
|
|
|
|
|
|
|
|
|
|
|
|
|
|
|
|
|
|
|
|
|
|
Commercial
|
|
$
|
48,556
|
|
|
$
|
1,926
|
|
|
$
|
3,883
|
|
|
$
|
563
|
|
|
$
|
54,928
|
|
|
Commercial real estate
|
|
|
11,014
|
|
|
|
1,289
|
|
|
|
3,914
|
|
|
|
564
|
|
|
|
16,781
|
|
|
Equipment lease financing
|
|
|
6,121
|
|
|
|
64
|
|
|
|
162
|
|
|
|
46
|
|
|
|
6,393
|
|
|
Purchased impaired loans
|
|
|
106
|
|
|
|
35
|
|
|
|
883
|
|
|
|
378
|
|
|
|
1,402
|
|
|
Total commercial lending (e)
|
|
$
|
65,797
|
|
|
$
|
3,314
|
|
|
$
|
8,842
|
|
|
$
|
1,551
|
|
|
$
|
79,504
|
|
|
(a)
|
Pass Rated loans include loans not classified as “Special Mention”, “Substandard”, or “Doubtful”.
|
|
(b)
|
Special Mention rated loans have a potential weakness that deserves management’s close attention. If left uncorrected, these potential weaknesses may result in
deterioration of repayment prospects at some future date. These loans do not expose us to sufficient risk to warrant adverse classification at this time.
|
|
(c)
|
Substandard rated loans have a well-defined weakness or weaknesses that jeopardize the collection or liquidation of debt. They are characterized by the distinct
possibility that we will sustain some loss if the deficiencies are not corrected.
|
|
(d)
|
Doubtful rated loans possess all the inherent weaknesses of a Substandard loan with the additional characteristics that the weakness makes collection or liquidation in
full improbable due to existing facts, conditions, and values.
|
|
(e)
|
Loans are included above based on their contractual terms as “Pass”, “Special Mention”, “Substandard” or “Doubtful”.
|
82
Residential Real Estate and Home Equity Loan Classes
We use several credit quality indicators, including credit scores, LTV ratios, delinquency rates, loan types and geography to monitor and manage credit
risk within the residential real estate and home equity classes. We evaluate mortgage loan performance by source originators and loan servicers. A summary of asset quality indicators follows:
Credit Scores
: We use a national third-party provider to update FICO credit scores for residential real estate and home equity loans on at least an annual basis. The updated scores are incorporated
into a series of credit monitoring reports and the statistical models that estimate the individual loan risk values.
LTV
: We regularly
update the property values of real estate collateral and calculate a LTV ratio. This ratio updates our statistical models that estimate individual and class/segment level risk. The LTV ratio tends to indicate potential loss on a given loan and the
borrower’s likelihood to make payment according to the contractual obligations.
At least annually, we obtain updated property valuations
on the real estate secured loans. For open credit lines secured by real estate or facilities in regions experiencing significant
declines in property values, more frequent valuations may occur. The property values are monitored to determine LTV migration and those LTV migrations are stratified within various markets. We
continue to enhance our capabilities in this area, which may result in more frequent valuations and analysis.
Delinquency Rates
: We
monitor levels of delinquency rates for residential real estate and home equity loans.
Geography
: Geographic concentrations are
monitored to evaluate and manage exposures. Loan purchase programs are sensitive to, and focused within, certain regions to manage geographic exposures and associated risks.
A combination of FICO scores, LTV ratios and geographic location assigned to residential real estate and home equity loans are used to estimate the likelihood of loss for that loan at the reporting date.
Loans with higher FICO scores and lower LTVs tend to have the lower likelihood of loss. Conversely, loans with lower FICO scores, higher LTVs, and in certain geographic locations tend to have a higher likelihood of loss. Certain geographic
distribution information of our higher risk real estate secured portfolio is presented in the footnotes to the table below.
Consumer Higher Risk Real
Estate Secured Asset Quality Indicators
|
|
|
|
|
|
|
|
|
|
|
|
|
|
|
|
|
|
|
|
|
|
|
|
|
Higher Risk Loans (a)
|
|
|
All Other Loans
|
|
|
Home Equity and
Residential Real
Estate
Loans
|
|
|
Dollars in millions
|
|
Amount
|
|
|
% of
Total
Loans
|
|
|
Amount
|
|
|
% of
Total
Loans
|
|
|
Amount
|
|
|
June 30, 2011
|
|
|
|
|
|
|
|
|
|
|
|
|
|
|
|
|
|
|
|
|
|
Home equity (b)
|
|
$
|
987
|
|
|
|
3
|
%
|
|
$
|
32,392
|
|
|
|
97
|
%
|
|
$
|
33,379
|
|
|
Residential real estate (c)
|
|
|
538
|
|
|
|
4
|
%
|
|
|
14,444
|
|
|
|
96
|
%
|
|
|
14,982
|
|
|
Total (d)
|
|
$
|
1,525
|
|
|
|
3
|
%
|
|
$
|
46,836
|
|
|
|
97
|
%
|
|
$
|
48,361
|
|
|
December 31, 2010
|
|
|
|
|
|
|
|
|
|
|
|
|
|
|
|
|
|
|
|
|
|
Home equity (b)
|
|
$
|
1,203
|
|
|
|
4
|
%
|
|
$
|
33,023
|
|
|
|
96
|
%
|
|
$
|
34,226
|
|
|
Residential real estate (c)
|
|
|
671
|
|
|
|
4
|
%
|
|
|
15,328
|
|
|
|
96
|
%
|
|
|
15,999
|
|
|
Total (d)
|
|
$
|
1,874
|
|
|
|
4
|
%
|
|
$
|
48,351
|
|
|
|
96
|
%
|
|
$
|
50,225
|
|
|
(a)
|
Higher risk loans are defined as loans with both a recent FICO credit score of less than or equal to 660 and a LTV ratio greater than or equal to 90%. Higher risk loans
exclude loans held for sale and government insured or guaranteed loans.
|
|
(b)
|
Within the higher risk home equity class at June 30, 2011, approximately 11% were in some stage of delinquency and 6% were in late stage (90+ days) delinquency
status. The majority of the June 30, 2011 balance related to higher risk home equity loans is geographically distributed throughout the following areas: Pennsylvania 30%, Ohio 13%, New Jersey 11%, Illinois 7%, and Michigan 6%. All other states,
none of which comprise more than 5%, make up the remainder of the balance. At December 31, 2010, approximately 10% were in some stage of delinquency and 6% were in late stage (90+ days) delinquency status. The majority of the December 31,
2010 balance related to higher risk home equity loans is geographically distributed throughout the following areas: Pennsylvania 28%, Ohio 13%, New Jersey 11%, Illinois 7%, Michigan 6%, and Kentucky 5%. All other states, none of which comprise more
than 4% make up the remainder of the balance.
|
|
(c)
|
Within the higher risk residential real estate class at June 30, 2011, approximately 43% were in some stage of delinquency and 34% were in late stage (90+ days)
delinquency status. The majority of the June 30, 2011 balance related to higher risk residential real estate loans is geographically distributed throughout the following areas: California 23%, Illinois 13%, Florida 11%, Ohio 5%, and
Pennsylvania 5%. All other states, none of which comprise more than 4%, make up the remainder of the balance. At December 31, 2010, approximately 49% were in some stage of delinquency and 38% were in late stage (90+ days) delinquency status.
The majority of the December 31, 2010 balance related to higher risk residential real estate loans is geographically distributed throughout the following areas: California 23%, Florida 11%, Illinois 11%, and Maryland 8%. All other states, none
of which comprise more than 5%, make up the remainder of the balance.
|
|
(d)
|
Total loans include purchased impaired loans of $6.1 billion at June 30, 2011 and $6.4 billion at December 31, 2010.
|
83
In addition to the higher risk asset quality indicators above, we regularly monitor the portions of the
real estate secured portfolio where LTVs are greater than 100%. The following table presents these balances, as well as the percentage of the applicable home equity or residential real estate loan classes.
Consumer Real Estate Secured High LTVs
|
|
|
|
|
|
|
|
|
|
|
|
|
Loans with LTV > 100%
|
|
|
Dollars in millions
|
|
Amount
|
|
|
% of Total
Loan Class
|
|
|
June 30, 2011
|
|
|
|
|
|
|
|
|
|
Home equity
|
|
$
|
262
|
|
|
|
1
|
%
|
|
Residential real estate
|
|
|
1,066
|
|
|
|
7
|
%
|
|
Total
|
|
$
|
1,328
|
|
|
|
3
|
%
|
|
December 31, 2010
|
|
|
|
|
|
|
|
|
|
Home equity
|
|
$
|
285
|
|
|
|
1
|
%
|
|
Residential real estate
|
|
|
1,331
|
|
|
|
8
|
%
|
|
Total
|
|
$
|
1,616
|
|
|
|
3
|
%
|
Credit Card and Other Consumer Loan Classes
We monitor a variety of asset quality information in the management of the credit card and other consumer loan classes. Other consumer loan classes include education,
automobile, and other secured and unsecured lines and loans. Along with the trending of delinquencies and losses for each class, FICO credit score updates are obtained at least annually, as well
as a variety of credit bureau attributes.
The combination of FICO scores and delinquency status are used to estimate the likelihood of loss
for consumer exposure at the reporting date. Loans with high FICO scores tend to have a lower likelihood of loss. Conversely, loans with low FICO scores tend to have a higher likelihood of loss.
Consumer Purchased Impaired Loans Class
Estimates of the expected cash flows primarily determine the credit impacts of consumer purchased impaired loans. Consumer cash flow estimates are influenced by a number of credit related items, which
include, but are not limited to, estimated real estate values, payment patterns, FICO scores, economic environment, LTV ratios and the date of origination. These key factors are monitored regularly to help ensure that concentrations of risk are
mitigated and cash flows are maximized.
See Note 6 Purchased Impaired Loans for additional information.
Credit Card and Other Consumer
Loan Classes Asset Quality Indicators
|
|
|
|
|
|
|
|
|
|
|
|
|
|
|
|
|
|
|
|
|
Credit Card (a)
|
|
|
Other Consumer (b)
|
|
|
Dollars in millions
|
|
Amount
|
|
|
% of Total Loans
Using FICO
Credit Metric
|
|
|
Amount
|
|
|
% of Total Loans
Using FICO
Credit Metric
|
|
|
June 30, 2011
|
|
|
|
|
|
|
|
|
|
|
|
|
|
|
|
|
|
FICO score greater than 719
|
|
$
|
1,917
|
|
|
|
52
|
%
|
|
$
|
4,806
|
|
|
|
62
|
%
|
|
650 to 719
|
|
|
1,069
|
|
|
|
28
|
|
|
|
1,905
|
|
|
|
25
|
|
|
620 to 649
|
|
|
190
|
|
|
|
5
|
|
|
|
316
|
|
|
|
4
|
|
|
Less than 620
|
|
|
306
|
|
|
|
8
|
|
|
|
491
|
|
|
|
6
|
|
|
No FICO score available or required (c)
|
|
|
272
|
|
|
|
7
|
|
|
|
223
|
|
|
|
3
|
|
|
Total loans using FICO credit metric
|
|
|
3,754
|
|
|
|
100
|
%
|
|
|
7,741
|
|
|
|
100
|
%
|
|
Other internal credit metrics (b)
|
|
|
|
|
|
|
|
|
|
|
9,314
|
|
|
|
|
|
|
Total loan balance
|
|
$
|
3,754
|
|
|
|
|
|
|
$
|
17,055
|
|
|
|
|
|
|
Weighted average current FICO score (d)
|
|
|
|
|
|
|
720
|
|
|
|
|
|
|
|
732
|
|
|
December 31, 2010
|
|
|
|
|
|
|
|
|
|
|
|
|
|
|
|
|
|
FICO score greater than 719
|
|
$
|
1,895
|
|
|
|
48
|
%
|
|
$
|
4,135
|
|
|
|
58
|
%
|
|
650 to 719
|
|
|
1,149
|
|
|
|
29
|
|
|
|
1,984
|
|
|
|
28
|
|
|
620 to 649
|
|
|
183
|
|
|
|
5
|
|
|
|
295
|
|
|
|
4
|
|
|
Less than 620
|
|
|
424
|
|
|
|
11
|
|
|
|
652
|
|
|
|
9
|
|
|
No FICO score available or required (c)
|
|
|
269
|
|
|
|
7
|
|
|
|
81
|
|
|
|
1
|
|
|
Total loans using FICO credit metric
|
|
|
3,920
|
|
|
|
100
|
%
|
|
|
7,147
|
|
|
|
100
|
%
|
|
Other internal credit metrics (b)
|
|
|
|
|
|
|
|
|
|
|
9,799
|
|
|
|
|
|
|
Total loan balance
|
|
$
|
3,920
|
|
|
|
|
|
|
$
|
16,946
|
|
|
|
|
|
|
Weighted average current FICO score (d)
|
|
|
|
|
|
|
709
|
|
|
|
|
|
|
|
713
|
|
84
|
(a)
|
At June 30, 2011, we had $46 million of credit card loans that are higher risk (i.e., loans with both FICO scores less than 660 and in late stage (90+ days)
delinquency status). The majority of the June 30, 2011 balance related to higher risk credit card loans is geographically distributed throughout the following areas: Ohio 23%, Michigan 18%, Pennsylvania 16%, Illinois 9%, and Indiana 8%. All
other states, none of which comprise more than 6%, make up the remainder of the balance. At December 31, 2010, we had $70 million of credit card loans that are higher risk. The majority of the December 31, 2010 balance related to higher
risk credit card loans is geographically distributed throughout the following areas: Ohio 20%, Michigan 14%, Pennsylvania 14%, Illinois 8%, and Indiana 7%. All other states, none of which comprise more than 5%, make up the remainder of the balance.
|
|
(b)
|
Other consumer loans for which FICO scores are used as an asset quality indicator include non-government guaranteed or insured education loans, automobile loans and
other secured and unsecured lines and loans. Other consumer loans for which other internal credit metrics are used as an asset quality indicator include primarily government guaranteed or insured education loans, as well as consumer loans to high
net worth individuals. Other internal credit metrics may include delinquency status, geography or other factors.
|
|
(c)
|
Credit card loans with no FICO score available or required refers to new accounts issued to borrowers with limited credit history, accounts for which we cannot obtain
an updated FICO (e.g., recent profile changes), cards issued with a business name, and/or cards secured by collateral. Management proactively assesses the risk and size of this loan portfolio and, when necessary, takes actions to mitigate the credit
risk.
|
|
(d)
|
Weighted average current FICO score excludes accounts with no FICO score available or required.
|
Allowances for Loan and Lease Losses and Unfunded Loan Commitments and Letters of Credit
We maintain the ALLL and the Allowance for Unfunded Loan Commitments and Letters of Credit at levels that we believe to be appropriate to absorb estimated
probable credit losses incurred in the portfolios as of the balance sheet date. We use the two main portfolio segments – Commercial Lending and Consumer Lending – and we develop and document the ALLL under separate methodologies for each
of these segments as further discussed and presented below.
Allowance for Loan and Lease Losses Components
For all loans, except purchased impaired loans, the ALLL is the sum of three components: (1) asset specific/individual impaired reserves,
(2) quantitative (formulaic or pooled) reserves, and (3) qualitative (judgmental) reserves. See Note 6 Purchased Impaired Loans for additional ALLL information. While we make allocations to specific loans and pools of loans, the total
reserve is available for all loan and lease losses. Although quantitative modeling factors as discussed below are constantly changing as the financial strength of the borrower and overall economic conditions change, there were no significant changes
to our ALLL methodology during the first six months of 2011.
Asset Specific/Individual Component
Commercial nonperforming loans and all TDRs are considered impaired and are allocated a specific reserve. See Note 1 Accounting Policies for additional
information.
Commercial Lending Quantitative Component
The estimates of the quantitative component of ALLL for incurred losses within the commercial lending portfolio segment are determined through a statistical loss model utilizing PD, LGD, and EAD. Based
upon loan risk ratings we
assign PDs and LGDs. Each of these statistical parameters is determined based on historical data and observable factors including those pertaining to specific borrowers that have proven to be
statistically significant in the estimation of incurred losses. PD is influenced by such factors as liquidity, industry, obligor financial structure, access to capital, and cash flow. LGD is influenced by collateral type, LTV, and guarantees by
related parties.
Consumer Lending Quantitative Component
Quantitative estimates within the consumer lending portfolio segment are calculated using a roll-rate model based on statistical relationships, calculated from historical data that estimate the movement
of loan outstandings through the various stages of delinquency and ultimately charge-off. In general, the estimated rates at which loan outstandings roll from one stage of delinquency to another are dependent on various factors such as FICO scores,
LTV ratios, the current economic environment, and geography.
Qualitative Component
While our quantitative reserve methodologies strive to reflect all risk factors, there continues to be a certain element of uncertainty associated with,
but not limited to, potential imprecision in the estimation process due to the inherent time lag of obtaining information and normal variations between estimates and actual outcomes. We adjust the ALLL in consideration of these factors. The ALLL
also includes factors that may not be directly measured in the determination of asset specific or quantitative reserves. Such qualitative factors include:
|
|
•
|
|
Loss experience in particular portfolios;
|
|
|
•
|
|
Macro economic factors; and
|
|
|
•
|
|
Changes in risk selection and underwriting standards.
|
85
Rollforward of Allowance for Loan and Lease Losses and Associated Loan Data
|
|
|
|
|
|
|
|
|
|
|
|
|
|
|
In millions
|
|
Commercial
Lending
|
|
|
Consumer
Lending
|
|
|
Total
|
|
|
June 30, 2011
|
|
|
|
|
|
|
|
|
|
|
|
|
|
ALLOWANCE FOR LOAN AND LEASE LOSSES
|
|
|
|
|
|
|
|
|
|
|
|
|
|
January 1
|
|
$
|
2,567
|
|
|
$
|
2,320
|
|
|
$
|
4,887
|
|
|
Charge-offs
|
|
|
(671
|
)
|
|
|
(587
|
)
|
|
|
(1,258
|
)
|
|
Recoveries
|
|
|
242
|
|
|
|
69
|
|
|
|
311
|
|
|
Net charge-offs
|
|
|
(429
|
)
|
|
|
(518
|
)
|
|
|
(947
|
)
|
|
Provision for credit losses
|
|
|
242
|
|
|
|
459
|
|
|
|
701
|
|
|
Net change in allowance for unfunded loan commitments and letters of
credit
|
|
|
11
|
|
|
|
(25
|
)
|
|
|
(14
|
)
|
|
June 30
|
|
$
|
2,391
|
|
|
$
|
2,236
|
|
|
$
|
4,627
|
|
|
TDRs individually evaluated for impairment
|
|
$
|
27
|
|
|
$
|
550
|
|
|
$
|
577
|
|
|
Other loans individually evaluated for impairment
|
|
|
705
|
|
|
|
|
|
|
|
705
|
|
|
Loans collectively evaluated for impairment
|
|
|
1,382
|
|
|
|
1,014
|
|
|
|
2,396
|
|
|
Purchased impaired loans
|
|
|
277
|
|
|
|
672
|
|
|
|
949
|
|
|
June 30
|
|
$
|
2,391
|
|
|
$
|
2,236
|
|
|
$
|
4,627
|
|
|
LOAN PORTFOLIO
|
|
|
|
|
|
|
|
|
|
|
|
|
|
TDRs individually evaluated for impairment
|
|
$
|
305
|
|
|
$
|
1,614
|
|
|
$
|
1,919
|
|
|
Other loans individually evaluated for impairment
|
|
|
2,445
|
|
|
|
|
|
|
|
2,445
|
|
|
Loans collectively evaluated for impairment
|
|
|
77,279
|
|
|
|
61,420
|
|
|
|
138,699
|
|
|
Purchased impaired loans
|
|
|
1,120
|
|
|
|
6,136
|
|
|
|
7,256
|
|
|
June 30
|
|
$
|
81,149
|
|
|
$
|
69,170
|
|
|
$
|
150,319
|
|
|
Segment ALLL as a percentage of total ALLL
|
|
|
51.67
|
%
|
|
|
48.33
|
%
|
|
|
100.00
|
%
|
|
Ratio of the allowance for loan and lease losses to total loans
|
|
|
2.95
|
%
|
|
|
3.23
|
%
|
|
|
3.08
|
%
|
|
June 30, 2010
|
|
|
|
|
|
|
|
|
|
|
|
|
|
ALLOWANCE FOR LOAN AND LEASE LOSSES
|
|
|
|
|
|
|
|
|
|
|
|
|
|
January 1
|
|
$
|
3,345
|
|
|
$
|
1,727
|
|
|
$
|
5,072
|
|
|
Charge-offs
|
|
|
(1,052
|
)
|
|
|
(760
|
)
|
|
|
(1,812
|
)
|
|
Recoveries
|
|
|
211
|
|
|
|
70
|
|
|
|
281
|
|
|
Net charge-offs
|
|
|
(841
|
)
|
|
|
(690
|
)
|
|
|
(1,531
|
)
|
|
Provision for credit losses
|
|
|
665
|
|
|
|
909
|
|
|
|
1,574
|
|
|
Adoption of ASU 2009-17, Consolidations
|
|
|
|
|
|
|
141
|
|
|
|
141
|
|
|
Other
|
|
|
2
|
|
|
|
|
|
|
|
2
|
|
|
Net change in allowance for unfunded loan commitments and letters of
credit
|
|
|
78
|
|
|
|
|
|
|
|
78
|
|
|
June 30
|
|
$
|
3,249
|
|
|
$
|
2,087
|
|
|
$
|
5,336
|
|
|
TDRs individually evaluated for impairment
|
|
$
|
14
|
|
|
$
|
145
|
|
|
$
|
159
|
|
|
Other loans individually evaluated for impairment
|
|
|
987
|
|
|
|
|
|
|
|
987
|
|
|
Loans collectively evaluated for impairment
|
|
|
1,903
|
|
|
|
1,428
|
|
|
|
3,331
|
|
|
Purchased impaired loans
|
|
|
345
|
|
|
|
514
|
|
|
|
859
|
|
|
June 30
|
|
$
|
3,249
|
|
|
$
|
2,087
|
|
|
$
|
5,336
|
|
|
LOAN PORTFOLIO
|
|
|
|
|
|
|
|
|
|
|
|
|
|
TDRs individually evaluated for impairment
|
|
$
|
54
|
|
|
$
|
775
|
|
|
$
|
829
|
|
|
Other loans individually evaluated for impairment
|
|
|
3,736
|
|
|
|
|
|
|
|
3,736
|
|
|
Loans collectively evaluated for impairment
|
|
|
75,831
|
|
|
|
64,819
|
|
|
|
140,650
|
|
|
Purchased impaired loans
|
|
|
1,605
|
|
|
|
7,522
|
|
|
|
9,127
|
|
|
June 30
|
|
$
|
81,226
|
|
|
$
|
73,116
|
|
|
$
|
154,342
|
|
|
Segment ALLL as a percentage of total ALLL
|
|
|
60.89
|
%
|
|
|
39.11
|
%
|
|
|
100.00
|
%
|
|
Ratio of the allowance for loan and lease losses to total loans
|
|
|
4.00
|
%
|
|
|
2.85
|
%
|
|
|
3.46
|
%
|
86
Originated Impaired Loans
Originated impaired loans include commercial nonperforming loans and certain consumer, residential, and commercial loans whose terms have been modified in a TDR, regardless of nonperforming status.
Nonperforming leases, loans held for sale, smaller balance homogeneous type loans, as well as purchased impaired loans are excluded. See Note 6 Purchased Impaired Loans for additional information. Nonperforming equipment lease financing loans of $35
million and $77 million at June 30, 2011, and December 31, 2010, respectively, are excluded from originated impaired loans pursuant to authoritative lease accounting guidance. We did not recognize any interest income on originated impaired
loans, including TDRs that have not returned to performing status, while they were impaired during the six months ended June 30, 2011 and June 30, 2010. The following table provides further detail on originated impaired loans individually
evaluated for reserves and the associated ALLL. Certain commercial impaired loans do not have a related allowance as the valuation of these impaired loans exceeded the recorded investment.
Originated Impaired Loans
|
|
|
|
|
|
|
|
|
|
|
|
|
|
|
|
|
|
|
In millions
|
|
Unpaid
Principal
Balance
|
|
|
Recorded
Investment (a)
|
|
|
Associated
Allowance (b)
|
|
|
Average
Recorded
Investment (a)
|
|
|
June 30, 2011
|
|
|
|
|
|
|
|
|
|
|
|
|
|
|
|
|
|
Impaired loans with an associated allowance
|
|
|
|
|
|
|
|
|
|
|
|
|
|
|
|
|
|
Commercial
|
|
$
|
1,309
|
|
|
$
|
925
|
|
|
$
|
317
|
|
|
$
|
1,079
|
|
|
Commercial real estate
|
|
|
1,698
|
|
|
|
1,224
|
|
|
|
415
|
|
|
|
1,386
|
|
|
Residential real estate
|
|
|
630
|
|
|
|
570
|
|
|
|
202
|
|
|
|
540
|
|
|
Home equity
|
|
|
751
|
|
|
|
716
|
|
|
|
267
|
|
|
|
670
|
|
|
Credit card
|
|
|
289
|
|
|
|
289
|
|
|
|
75
|
|
|
|
292
|
|
|
Other consumer
|
|
|
39
|
|
|
|
39
|
|
|
|
6
|
|
|
|
35
|
|
|
Total impaired loans with an associated allowance
|
|
$
|
4,716
|
|
|
$
|
3,763
|
|
|
$
|
1,282
|
|
|
$
|
4,002
|
|
|
Impaired loans without an associated allowance
|
|
|
|
|
|
|
|
|
|
|
|
|
|
|
|
|
|
Commercial
|
|
$
|
238
|
|
|
$
|
121
|
|
|
|
|
|
|
$
|
89
|
|
|
Commercial real estate
|
|
|
668
|
|
|
|
480
|
|
|
|
|
|
|
|
428
|
|
|
Total impaired loans without an associated allowance
|
|
$
|
906
|
|
|
$
|
601
|
|
|
|
|
|
|
$
|
517
|
|
|
Total impaired loans
|
|
$
|
5,622
|
|
|
$
|
4,364
|
|
|
$
|
1,282
|
|
|
$
|
4,519
|
|
|
December 31, 2010
|
|
|
|
|
|
|
|
|
|
|
|
|
|
|
|
|
|
Impaired loans with an associated allowance
|
|
|
|
|
|
|
|
|
|
|
|
|
|
|
|
|
|
Commercial
|
|
$
|
1,769
|
|
|
$
|
1,178
|
|
|
$
|
410
|
|
|
$
|
1,533
|
|
|
Commercial real estate
|
|
|
1,927
|
|
|
|
1,446
|
|
|
|
449
|
|
|
|
1,732
|
|
|
Residential real estate
|
|
|
521
|
|
|
|
465
|
|
|
|
122
|
|
|
|
309
|
|
|
Home equity
|
|
|
622
|
|
|
|
622
|
|
|
|
207
|
|
|
|
448
|
|
|
Credit card
|
|
|
301
|
|
|
|
301
|
|
|
|
149
|
|
|
|
275
|
|
|
Other consumer
|
|
|
34
|
|
|
|
34
|
|
|
|
7
|
|
|
|
30
|
|
|
Total impaired loans with an associated allowance
|
|
$
|
5,174
|
|
|
$
|
4,046
|
|
|
$
|
1,344
|
|
|
$
|
4,327
|
|
|
Impaired loans without an associated allowance
|
|
|
|
|
|
|
|
|
|
|
|
|
|
|
|
|
|
Commercial
|
|
$
|
87
|
|
|
$
|
75
|
|
|
|
|
|
|
$
|
90
|
|
|
Commercial real estate
|
|
|
525
|
|
|
|
389
|
|
|
|
|
|
|
|
320
|
|
|
Total impaired loans without an associated allowance
|
|
$
|
612
|
|
|
$
|
464
|
|
|
|
|
|
|
$
|
410
|
|
|
Total impaired loans
|
|
$
|
5,786
|
|
|
$
|
4,510
|
|
|
$
|
1,344
|
|
|
$
|
4,737
|
|
|
(a)
|
Recorded investment in a loan includes the unpaid principal balance plus accrued interest and net accounting adjustments, less any charge-offs. Recorded investment does
not include any associated valuation allowance. Average recorded investment is for the six months ended June 30, 2011, and year ended December 31, 2010.
|
|
(b)
|
Associated allowance amounts include $577 million and $509 million for TDRs at June 30, 2011, and December 31, 2010, respectively.
|
Allowance for Unfunded Loan Commitments and Letters of Credit
We maintain the allowance for unfunded loan commitments and letters of credit at a level we believe is appropriate to absorb estimated probable losses on
these unfunded credit facilities. See Note 1 Accounting Policies for additional information.
Rollforward of Allowance for Unfunded Loan Commitments and Letters of Credit
|
|
|
|
|
|
|
|
|
|
|
In millions
|
|
2011
|
|
|
2010
|
|
|
January 1
|
|
$
|
188
|
|
|
$
|
296
|
|
|
Net change in allowance for unfunded loan commitments and letters of
credit
|
|
|
14
|
|
|
|
(78
|
)
|
|
June 30
|
|
$
|
202
|
|
|
$
|
218
|
|
87
N
OTE
6 P
URCHASED
I
MPAIRED
L
OANS
As further described in Note 6 of the 2010 Form 10-K, at December 31, 2008, we identified certain loans related to the National
City acquisition, for which there was evidence of credit quality deterioration since origination and it was probable that we would be unable to collect all contractually required principal and interest payments. GAAP requires these loans to be
recorded at fair value at acquisition date and prohibits the “carrying over” or the creation of valuation allowances in the initial accounting for such loans acquired in a transfer.
Purchased Impaired Loans
|
|
|
|
|
|
|
|
|
|
|
|
|
|
|
|
|
|
|
|
|
June 30, 2011
|
|
|
December 31, 2010
|
|
|
In millions
|
|
Recorded
Investment
|
|
|
Outstanding
Balance
|
|
|
Recorded
Investment
|
|
|
Outstanding
Balance
|
|
|
Commercial
|
|
$
|
167
|
|
|
$
|
302
|
|
|
$
|
249
|
|
|
$
|
408
|
|
|
Commercial real estate
|
|
|
953
|
|
|
|
1,084
|
|
|
|
1,153
|
|
|
|
1,391
|
|
|
Consumer
|
|
|
2,895
|
|
|
|
3,745
|
|
|
|
3,024
|
|
|
|
4,121
|
|
|
Residential real estate
|
|
|
3,241
|
|
|
|
3,359
|
|
|
|
3,354
|
|
|
|
3,803
|
|
|
Total
|
|
$
|
7,256
|
|
|
$
|
8,490
|
|
|
$
|
7,780
|
|
|
$
|
9,723
|
|
The excess of cash flows expected at acquisition over the estimated fair value is referred to as the accretable yield and
is recognized in interest income over the remaining life of the loan using the constant effective yield method. The difference between contractually required payments at acquisition and the cash flows expected to be collected at acquisition is
referred to as the nonaccretable difference. Changes in the expected cash flows of individual commercial or pooled consumer purchased impaired loans from the date of acquisition will either impact the accretable yield or result in an impairment
charge to the provision for credit losses in the period in which the changes become probable. Subsequent decreases to the net present value of expected cash flows will generally result in an impairment charge to the provision for credit losses,
resulting in an increase to the allowance for loan
and lease losses, and a reclassification from accretable yield to nonaccretable difference. Prepayments and interest rate decreases for variable rate notes are treated as a reduction of cash
flows expected to be collected and a reduction of projections of contractual cash flows such that the nonaccretable difference is not affected. Thus, for decreases in cash flows expected to be collected resulting from prepayments and interest rate
decreases for variable rate notes, the effect will be to reduce the yield prospectively.
During the first six months of 2011, $135 million of
provision and $83 million of charge-offs were recorded on purchased impaired loans. As of June 30, 2011, decreases in the net present value of expected cash flows of purchased impaired loans resulted in an allowance for loan and lease losses of
$949 million on $6.9 billion of the impaired loans while the remaining $.4 billion of impaired loans required no allowance as net present value of expected cash flows improved or remained the same. Subsequent increases in the net present value of
cash flows will result in a recovery of any previously recorded allowance for loan and lease losses, to the extent applicable, and/or a reclassification from nonaccretable difference to accretable yield, which is recognized prospectively. Disposals
of loans, which may include sales of loans or foreclosures, result in removal of the loan from the purchased impaired loan portfolio at its carrying amount.
Activity for the accretable yield for the first six months of 2011 follows.
Accretable Yield
|
|
|
|
|
|
|
In millions
|
|
2011
|
|
|
January 1
|
|
$
|
2,185
|
|
|
Accretion (including cash recoveries)
|
|
|
(467
|
)
|
|
Net reclassifications to accretable from non-accretable
|
|
|
592
|
|
|
Disposals
|
|
|
(33
|
)
|
|
June 30
|
|
$
|
2,277
|
|
88
N
OTE
7 I
NVESTMENT
S
ECURITIES
Investment Securities Summary
|
|
|
|
|
|
|
|
|
|
|
|
|
|
|
|
|
|
|
|
|
Amortized
|
|
|
Unrealized
|
|
|
Fair
|
|
|
In millions
|
|
Cost
|
|
|
Gains
|
|
|
Losses
|
|
|
Value
|
|
|
June 30, 2011
|
|
|
|
|
|
|
|
|
|
|
|
|
|
|
|
|
|
Securities Available for Sale
|
|
|
|
|
|
|
|
|
|
|
|
|
|
|
|
|
|
Debt securities
|
|
|
|
|
|
|
|
|
|
|
|
|
|
|
|
|
|
US Treasury and government agencies
|
|
$
|
3,954
|
|
|
$
|
188
|
|
|
$
|
(12
|
)
|
|
$
|
4,130
|
|
|
Residential mortgage-backed
|
|
|
|
|
|
|
|
|
|
|
|
|
|
|
|
|
|
Agency
|
|
|
25,126
|
|
|
|
479
|
|
|
|
(105
|
)
|
|
|
25,500
|
|
|
Non-agency
|
|
|
7,232
|
|
|
|
220
|
|
|
|
(998
|
)
|
|
|
6,454
|
|
|
Commercial mortgage-backed
|
|
|
|
|
|
|
|
|
|
|
|
|
|
|
|
|
|
Agency
|
|
|
1,276
|
|
|
|
28
|
|
|
|
(1
|
)
|
|
|
1,303
|
|
|
Non-agency
|
|
|
2,494
|
|
|
|
63
|
|
|
|
(12
|
)
|
|
|
2,545
|
|
|
Asset-backed
|
|
|
3,839
|
|
|
|
37
|
|
|
|
(191
|
)
|
|
|
3,685
|
|
|
State and municipal
|
|
|
2,281
|
|
|
|
73
|
|
|
|
(52
|
)
|
|
|
2,302
|
|
|
Other debt
|
|
|
3,343
|
|
|
|
111
|
|
|
|
(12
|
)
|
|
|
3,442
|
|
|
Total debt securities
|
|
|
49,545
|
|
|
|
1,199
|
|
|
|
(1,383
|
)
|
|
|
49,361
|
|
|
Corporate stocks and other
|
|
|
306
|
|
|
|
|
|
|
|
|
|
|
|
306
|
|
|
Total securities available for sale
|
|
$
|
49,851
|
|
|
$
|
1,199
|
|
|
$
|
(1,383
|
)
|
|
$
|
49,667
|
|
|
Securities Held to Maturity
|
|
|
|
|
|
|
|
|
|
|
|
|
|
|
|
|
|
Debt securities
|
|
|
|
|
|
|
|
|
|
|
|
|
|
|
|
|
|
Residential mortgage-backed (agency)
|
|
$
|
2,775
|
|
|
$
|
1
|
|
|
$
|
(8
|
)
|
|
$
|
2,768
|
|
|
Commercial mortgage-backed
|
|
|
|
|
|
|
|
|
|
|
|
|
|
|
|
|
|
Agency
|
|
|
508
|
|
|
|
|
|
|
|
(2
|
)
|
|
|
506
|
|
|
Non-agency
|
|
|
4,027
|
|
|
|
147
|
|
|
|
(2
|
)
|
|
|
4,172
|
|
|
Asset-backed
|
|
|
2,063
|
|
|
|
31
|
|
|
|
(2
|
)
|
|
|
2,092
|
|
|
State and municipal
|
|
|
8
|
|
|
|
1
|
|
|
|
|
|
|
|
9
|
|
|
Other debt
|
|
|
366
|
|
|
|
|
|
|
|
(3
|
)
|
|
|
363
|
|
|
Total securities held to maturity
|
|
$
|
9,747
|
|
|
$
|
180
|
|
|
$
|
(17
|
)
|
|
$
|
9,910
|
|
|
|
|
|
|
|
|
December 31, 2010
|
|
|
|
|
|
|
|
|
|
|
|
|
|
|
|
|
|
|
|
|
|
|
|
Securities Available for Sale
|
|
|
|
|
|
|
|
|
|
|
|
|
|
|
|
|
|
Debt securities
|
|
|
|
|
|
|
|
|
|
|
|
|
|
|
|
|
|
US Treasury and government agencies
|
|
$
|
5,575
|
|
|
$
|
157
|
|
|
$
|
(22
|
)
|
|
$
|
5,710
|
|
|
Residential mortgage-backed
|
|
|
|
|
|
|
|
|
|
|
|
|
|
|
|
|
|
Agency
|
|
|
31,697
|
|
|
|
443
|
|
|
|
(420
|
)
|
|
|
31,720
|
|
|
Non-agency
|
|
|
8,193
|
|
|
|
230
|
|
|
|
(1,190
|
)
|
|
|
7,233
|
|
|
Commercial mortgage-backed
|
|
|
|
|
|
|
|
|
|
|
|
|
|
|
|
|
|
Agency
|
|
|
1,763
|
|
|
|
40
|
|
|
|
(6
|
)
|
|
|
1,797
|
|
|
Non-agency
|
|
|
1,794
|
|
|
|
73
|
|
|
|
(11
|
)
|
|
|
1,856
|
|
|
Asset-backed
|
|
|
2,780
|
|
|
|
40
|
|
|
|
(238
|
)
|
|
|
2,582
|
|
|
State and municipal
|
|
|
1,999
|
|
|
|
30
|
|
|
|
(72
|
)
|
|
|
1,957
|
|
|
Other debt
|
|
|
3,992
|
|
|
|
102
|
|
|
|
(17
|
)
|
|
|
4,077
|
|
|
Total debt securities
|
|
|
57,793
|
|
|
|
1,115
|
|
|
|
(1,976
|
)
|
|
|
56,932
|
|
|
Corporate stocks and other
|
|
|
378
|
|
|
|
|
|
|
|
|
|
|
|
378
|
|
|
Total securities available for sale
|
|
$
|
58,171
|
|
|
$
|
1,115
|
|
|
$
|
(1,976
|
)
|
|
$
|
57,310
|
|
|
Securities Held to Maturity
|
|
|
|
|
|
|
|
|
|
|
|
|
|
|
|
|
|
Debt securities
|
|
|
|
|
|
|
|
|
|
|
|
|
|
|
|
|
|
Commercial mortgage-backed (non-agency)
|
|
$
|
4,316
|
|
|
$
|
178
|
|
|
$
|
(4
|
)
|
|
$
|
4,490
|
|
|
Asset-backed
|
|
|
2,626
|
|
|
|
51
|
|
|
|
(1
|
)
|
|
|
2,676
|
|
|
Other debt
|
|
|
10
|
|
|
|
1
|
|
|
|
|
|
|
|
11
|
|
|
Total securities held to maturity
|
|
$
|
6,952
|
|
|
$
|
230
|
|
|
$
|
(5
|
)
|
|
$
|
7,177
|
|
89
The fair value of investment securities is impacted by interest rates, credit spreads, market volatility
and liquidity conditions. Net unrealized gains and losses in the securities available for sale portfolio are included in shareholders’ equity as accumulated other comprehensive income or loss, net of tax, unless credit-related.
The gross unrealized loss on debt securities held to maturity was $17 million at June 30, 2011 and $5 million at December 31, 2010, with $2.3
billion and $.7 billion of positions in a continuous loss position for less than 12 months at June 30, 2011 and December 31, 2010, respectively. The gross unrealized loss and fair value on debt securities held to maturity that were in a
continuous loss position for 12 months or more were not significant at both June 30, 2011 and December 31, 2010. The unrealized loss at June 30, 2011 relates primarily to agency residential mortgage-backed securities.
During the second quarter of 2011, we transferred securities with a fair value of $3.4 billion from available for sale to held to maturity. The
securities transferred included $2.8 billion of
agency residential-mortgage backed securities, $285 million of agency commercial mortgage-backed securities, and $365 million of agency guaranteed other debt securities. We changed our intent and
committed to hold these high-quality securities to maturity. The reclassification was made at fair value at the date of transfer, resulting in no impact on net income. Net pretax unrealized gains in accumulated other comprehensive income totaled $40
million at the transfer date and will be accreted over the remaining life of the related securities as an adjustment of yield in a manner consistent with the amortization of a premium.
The following table presents gross unrealized loss and fair value of securities available for sale at June 30, 2011 and December 31, 2010. The securities are segregated between investments that
have been in a continuous unrealized loss position for less than twelve months and twelve months or more based on the point in time the fair value declined below the amortized cost basis. The table includes debt securities where a portion of
other-than-temporary impairment (OTTI) has been recognized in accumulated other comprehensive loss.
Gross Unrealized Loss and Fair
Value of Securities Available for Sale
|
|
|
|
|
|
|
|
|
|
|
|
|
|
|
|
|
|
|
|
|
|
|
|
|
|
|
In millions
|
|
Unrealized loss position less
than 12 months
|
|
|
Unrealized loss position 12
months or more
|
|
|
Total
|
|
|
|
|
Unrealized
Loss
|
|
|
Fair
Value
|
|
|
Unrealized
Loss
|
|
|
Fair
Value
|
|
|
Unrealized
Loss
|
|
|
Fair
Value
|
|
|
June 30, 2011
|
|
|
|
|
|
|
|
|
|
|
|
|
|
|
|
|
|
|
|
|
|
|
|
|
|
Debt securities
|
|
|
|
|
|
|
|
|
|
|
|
|
|
|
|
|
|
|
|
|
|
|
|
|
|
US Treasury and government agencies
|
|
$
|
(12
|
)
|
|
$
|
232
|
|
|
|
|
|
|
|
|
|
|
$
|
(12
|
)
|
|
$
|
232
|
|
|
Residential mortgage-backed
|
|
|
|
|
|
|
|
|
|
|
|
|
|
|
|
|
|
|
|
|
|
|
|
|
|
Agency
|
|
|
(76
|
)
|
|
|
6,465
|
|
|
$
|
(29
|
)
|
|
$
|
841
|
|
|
|
(105
|
)
|
|
|
7,306
|
|
|
Non-agency
|
|
|
(26
|
)
|
|
|
601
|
|
|
|
(972
|
)
|
|
|
4,810
|
|
|
|
(998
|
)
|
|
|
5,411
|
|
|
Commercial mortgage-backed
|
|
|
|
|
|
|
|
|
|
|
|
|
|
|
|
|
|
|
|
|
|
|
|
|
|
Agency
|
|
|
(1
|
)
|
|
|
1
|
|
|
|
|
|
|
|
|
|
|
|
(1
|
)
|
|
|
1
|
|
|
Non-agency
|
|
|
(12
|
)
|
|
|
1,178
|
|
|
|
|
|
|
|
|
|
|
|
(12
|
)
|
|
|
1,178
|
|
|
Asset-backed
|
|
|
(6
|
)
|
|
|
819
|
|
|
|
(185
|
)
|
|
|
722
|
|
|
|
(191
|
)
|
|
|
1,541
|
|
|
State and municipal
|
|
|
(5
|
)
|
|
|
363
|
|
|
|
(47
|
)
|
|
|
250
|
|
|
|
(52
|
)
|
|
|
613
|
|
|
Other debt
|
|
|
(10
|
)
|
|
|
354
|
|
|
|
(2
|
)
|
|
|
13
|
|
|
|
(12
|
)
|
|
|
367
|
|
|
Total
|
|
$
|
(148
|
)
|
|
$
|
10,013
|
|
|
$
|
(1,235
|
)
|
|
$
|
6,636
|
|
|
$
|
(1,383
|
)
|
|
$
|
16,649
|
|
|
December 31, 2010
|
|
|
|
|
|
|
|
|
|
|
|
|
|
|
|
|
|
|
|
|
|
|
|
|
|
Debt securities
|
|
|
|
|
|
|
|
|
|
|
|
|
|
|
|
|
|
|
|
|
|
|
|
|
|
US Treasury and government agencies
|
|
$
|
(22
|
)
|
|
$
|
398
|
|
|
|
|
|
|
|
|
|
|
$
|
(22
|
)
|
|
$
|
398
|
|
|
Residential mortgage-backed
|
|
|
|
|
|
|
|
|
|
|
|
|
|
|
|
|
|
|
|
|
|
|
|
|
|
Agency
|
|
|
(406
|
)
|
|
|
17,040
|
|
|
$
|
(14
|
)
|
|
$
|
186
|
|
|
|
(420
|
)
|
|
|
17,226
|
|
|
Non-agency
|
|
|
(17
|
)
|
|
|
345
|
|
|
|
(1,173
|
)
|
|
|
5,707
|
|
|
|
(1,190
|
)
|
|
|
6,052
|
|
|
Commercial mortgage-backed
|
|
|
|
|
|
|
|
|
|
|
|
|
|
|
|
|
|
|
|
|
|
|
|
|
|
Agency
|
|
|
(6
|
)
|
|
|
344
|
|
|
|
|
|
|
|
|
|
|
|
(6
|
)
|
|
|
344
|
|
|
Non-agency
|
|
|
(8
|
)
|
|
|
184
|
|
|
|
(3
|
)
|
|
|
84
|
|
|
|
(11
|
)
|
|
|
268
|
|
|
Asset-backed
|
|
|
(5
|
)
|
|
|
441
|
|
|
|
(233
|
)
|
|
|
776
|
|
|
|
(238
|
)
|
|
|
1,217
|
|
|
State and municipal
|
|
|
(22
|
)
|
|
|
931
|
|
|
|
(50
|
)
|
|
|
247
|
|
|
|
(72
|
)
|
|
|
1,178
|
|
|
Other debt
|
|
|
(14
|
)
|
|
|
701
|
|
|
|
(3
|
)
|
|
|
13
|
|
|
|
(17
|
)
|
|
|
714
|
|
|
Total
|
|
$
|
(500
|
)
|
|
$
|
20,384
|
|
|
$
|
(1,476
|
)
|
|
$
|
7,013
|
|
|
$
|
(1,976
|
)
|
|
$
|
27,397
|
|
90
Evaluating Investments for Other-than-Temporary Impairments
For the securities in the above table, as of June 30, 2011 we do not intend to sell and believe we will not be required to sell the securities prior
to recovery of the amortized cost basis.
On at least a quarterly basis, we conduct a comprehensive security-level assessment on all
securities in an unrealized loss position to determine if OTTI exists. An unrealized loss exists when the current fair value of an individual security is less than its amortized cost basis. An OTTI loss must be recognized for a debt security in an
unrealized loss position if we intend to sell the security or it is more likely than not we will be required to sell the security prior to recovery of its amortized cost basis. In this situation, the amount of loss recognized in income is equal to
the difference between the fair value and the amortized cost basis of the security. Even if we do not expect to sell the security, we must evaluate the expected cash flows to be received to determine if we believe a credit loss has occurred. In the
event of a credit loss, only the amount of impairment associated with the credit loss is recognized in income. The portion of the unrealized loss relating to other factors, such as liquidity conditions in the market or changes in market interest
rates, is recorded in accumulated other comprehensive loss.
Equity securities are also evaluated to determine whether the unrealized loss is
expected to be recoverable based on whether evidence exists to support a realizable value equal to or greater than the cost basis. If it is probable that we will not recover the amortized cost basis, taking into consideration the estimated recovery
period and our ability to hold the equity security until recovery, OTTI is recognized in earnings equal to the difference between the fair value and the amortized cost basis of the security.
The security-level assessment is performed on each security, regardless of the classification of the security as available for sale or held to maturity. Our assessment considers the security structure,
recent security collateral performance metrics if applicable, external credit ratings, failure of the issuer to make scheduled interest or principal payments, our judgment and expectations of future performance, and relevant independent industry
research, analysis and forecasts. We also consider the severity of the impairment and the length of time the security has been impaired in our assessment. Results of the periodic assessment are reviewed by a cross-functional senior management team
representing Asset & Liability Management, Finance, and Market Risk Management.
The senior management team considers the results of the assessments, as well as other factors, in determining whether the impairment is other-than-temporary.
For debt securities, a critical component of the evaluation for OTTI is the identification of credit-impaired securities, where management does not
expect to receive cash flows sufficient to recover the entire amortized cost basis of the security. The paragraphs below describe our process for identifying credit impairment for our most significant categories of securities not backed by the US
government or its agencies.
Non-Agency Residential Mortgage-Backed Securities and Asset-Backed Securities Collateralized by First-Lien
and Second-Lien Residential Mortgage Loans
Potential credit losses on these securities are evaluated on a security by security basis.
Collateral performance assumptions are developed for each security after reviewing collateral composition and collateral performance statistics. This includes analyzing recent delinquency roll rates, loss severities, voluntary prepayments, and
various other collateral and performance metrics. This information is then combined with general expectations on the housing market and other economic factors to develop estimates of future performance.
Security level assumptions for prepayments, loan defaults, and loss given default are applied to every security using a third-party cash flow model. The
third-party cash flow model then generates projected cash flows according to the structure of each security. Based on the results of the cash flow analysis, we determine whether we will recover the amortized cost basis of our security.
Credit Impairment Assessment Assumptions – Non-Agency Residential Mortgage-Backed and Asset-Backed Securities (a)
|
|
|
|
|
|
|
|
|
|
|
June 30, 2011
|
|
Range
|
|
|
Weighted-
average (b)
|
|
|
Long-term prepayment rate (annual CPR)
|
|
|
|
|
|
|
|
|
|
Prime
|
|
|
7-20
|
%
|
|
|
14
|
%
|
|
Alt-A
|
|
|
3-12
|
|
|
|
5
|
|
|
Remaining collateral expected to default
|
|
|
|
|
|
|
|
|
|
Prime
|
|
|
1-53
|
%
|
|
|
20
|
%
|
|
Alt-A
|
|
|
3-84
|
|
|
|
43
|
|
|
Loss severity
|
|
|
|
|
|
|
|
|
|
Prime
|
|
|
20-70
|
%
|
|
|
46
|
%
|
|
Alt-A
|
|
|
30-80
|
|
|
|
60
|
|
|
(a)
|
Collateralized by first and second-lien non-agency residential mortgage loans.
|
|
(b)
|
Calculated by weighting the relevant assumption for each individual security by the current outstanding cost basis of the security.
|
91
Non-Agency Commercial Mortgage-Backed Securities
Credit losses on these securities are measured using property-level cash flow projections and forward-looking property valuations. Cash flows are
projected using a detailed analysis of net operating income (NOI) by property type which, in turn, is based on the analysis of NOI performance over the past several business cycles combined with PNC’s economic outlook for the current cycle.
Loss severities are based on property price projections, which are calculated using capitalization rate projections. The capitalization rate projections are based on a combination of historical capitalization rates and expected capitalization rates
implied by current market activity, our outlook and relevant independent industry research, analysis and forecasts. Securities exhibiting weaker performance within the model are subject to further analysis. This analysis is performed at the loan
level, and includes assessing local market conditions, reserves, occupancy, rent rolls and master/special servicer details.
During the second
quarter and first six months of 2011 and 2010, the OTTI credit losses recognized in noninterest income related to estimated credit losses on securities that we do not expect to sell were as follows:
Summary of OTTI Credit Losses Recognized in Earnings
|
|
|
|
|
|
|
|
|
|
|
|
|
|
|
|
|
|
|
|
|
Three months ended
June 30
|
|
|
Six months ended
June 30
|
|
|
In millions
|
|
2011
|
|
|
2010
|
|
|
2011
|
|
|
2010
|
|
|
Available for sale securities:
|
|
|
|
|
|
|
|
|
|
|
|
|
|
|
|
|
|
Non-agency residential mortgage-backed
|
|
$
|
(35
|
)
|
|
$
|
(81
|
)
|
|
$
|
(63
|
)
|
|
$
|
(154
|
)
|
|
Non-agency commercial mortgage-backed
|
|
|
|
|
|
|
(3
|
)
|
|
|
|
|
|
|
(3
|
)
|
|
Asset-backed
|
|
|
(4
|
)
|
|
|
(10
|
)
|
|
|
(9
|
)
|
|
|
(53
|
)
|
|
Other debt
|
|
|
|
|
|
|
|
|
|
|
(1
|
)
|
|
|
|
|
|
Total
|
|
$
|
(39
|
)
|
|
$
|
(94
|
)
|
|
$
|
(73
|
)
|
|
$
|
(210
|
)
|
Summary of OTTI Noncredit Losses Included in Accumulated Other Comprehensive Loss
|
|
|
|
|
|
|
|
|
|
|
|
|
|
|
|
|
|
|
|
|
Three months ended
June 30
|
|
|
Six months ended
June 30
|
|
|
In millions
|
|
2011
|
|
|
2010
|
|
|
2011
|
|
|
2010
|
|
|
Total
|
|
$
|
(34
|
)
|
|
$
|
(24
|
)
|
|
$
|
(30
|
)
|
|
$
|
(148
|
)
|
The following table presents a rollforward of the cumulative OTTI credit losses recognized in earnings for all debt
securities for which a portion of an OTTI loss was recognized in accumulated other comprehensive loss:
Rollforward of Cumulative OTTI
Credit Losses Recognized in Earnings
|
|
|
|
|
|
|
|
|
|
|
|
|
|
|
|
|
|
|
|
|
|
|
In millions
|
|
Non-agency
residential
mortgage-backed
|
|
|
Non-agency
commercial
mortgage-backed
|
|
|
Asset-backed
|
|
|
Other debt
|
|
|
Total
|
|
|
For the three months ended June 30, 2011
|
|
|
|
|
|
|
|
|
|
|
|
|
|
|
|
|
|
|
|
|
|
March 31, 2011
|
|
$
|
(737
|
)
|
|
$
|
(6
|
)
|
|
$
|
(228
|
)
|
|
$
|
(13
|
)
|
|
$
|
(984
|
)
|
|
Loss where impairment was not previously recognized
|
|
|
|
|
|
|
|
|
|
|
(3
|
)
|
|
|
|
|
|
|
(3
|
)
|
|
Additional loss where credit impairment was previously recognized
|
|
|
(35
|
)
|
|
|
|
|
|
|
(1
|
)
|
|
|
|
|
|
|
(36
|
)
|
|
Reduction due to credit impaired securities sold
|
|
|
11
|
|
|
|
|
|
|
|
|
|
|
|
|
|
|
|
11
|
|
|
June 30, 2011
|
|
$
|
(761
|
)
|
|
$
|
(6
|
)
|
|
$
|
(232
|
)
|
|
$
|
(13
|
)
|
|
$
|
(1,012
|
)
|
|
|
|
|
|
|
|
|
|
|
|
|
|
|
|
|
|
|
|
|
|
|
|
In millions
|
|
Non-agency
residential
mortgage-backed
|
|
|
Non-agency
commercial
mortgage-backed
|
|
|
Asset-backed
|
|
|
Other debt
|
|
|
Total
|
|
|
For the three months ended June 30, 2010
|
|
|
|
|
|
|
|
|
|
|
|
|
|
|
|
|
|
|
|
|
|
March 31, 2010
|
|
$
|
(540
|
)
|
|
$
|
(6
|
)
|
|
$
|
(188
|
)
|
|
$
|
(12
|
)
|
|
$
|
(746
|
)
|
|
Loss where impairment was not previously recognized
|
|
|
(14
|
)
|
|
|
(3
|
)
|
|
|
(6
|
)
|
|
|
|
|
|
|
(23
|
)
|
|
Additional loss where credit impairment was previously recognized
|
|
|
(67
|
)
|
|
|
|
|
|
|
(4
|
)
|
|
|
|
|
|
|
(71
|
)
|
|
June 30, 2010
|
|
$
|
(621
|
)
|
|
$
|
(9
|
)
|
|
$
|
(198
|
)
|
|
$
|
(12
|
)
|
|
$
|
(840
|
)
|
|
|
|
|
|
|
|
|
|
|
|
|
|
|
|
|
|
|
|
|
|
|
|
In millions
|
|
Non-agency
residential
mortgage-backed
|
|
|
Non-agency
commercial
mortgage-backed
|
|
|
Asset-backed
|
|
|
Other debt
|
|
|
Total
|
|
|
For the six months ended June 30, 2011
|
|
|
|
|
|
|
|
|
|
|
|
|
|
|
|
|
|
|
|
|
|
December 31, 2010
|
|
$
|
(709
|
)
|
|
$
|
(11
|
)
|
|
$
|
(223
|
)
|
|
$
|
(12
|
)
|
|
$
|
(955
|
)
|
|
Loss where impairment was not previously recognized
|
|
|
(3
|
)
|
|
|
|
|
|
|
(3
|
)
|
|
|
(1
|
)
|
|
|
(7
|
)
|
|
Additional loss where credit impairment was previously recognized
|
|
|
(60
|
)
|
|
|
|
|
|
|
(6
|
)
|
|
|
|
|
|
|
(66
|
)
|
|
Reduction due to credit impaired securities sold
|
|
|
11
|
|
|
|
5
|
|
|
|
|
|
|
|
|
|
|
|
16
|
|
|
June 30, 2011
|
|
$
|
(761
|
)
|
|
$
|
(6
|
)
|
|
$
|
(232
|
)
|
|
$
|
(13
|
)
|
|
$
|
(1,012
|
)
|
92
|
|
|
|
|
|
|
|
|
|
|
|
|
|
|
|
|
|
|
|
|
|
|
In millions
|
|
Non-agency
residential
mortgage-backed
|
|
|
Non-agency
commercial
mortgage-backed
|
|
|
Asset-backed
|
|
|
Other debt
|
|
|
Total
|
|
|
For the six months ended June 30, 2010
|
|
|
|
|
|
|
|
|
|
|
|
|
|
|
|
|
|
|
|
|
|
December 31, 2009
|
|
$
|
(479
|
)
|
|
$
|
(6
|
)
|
|
$
|
(145
|
)
|
|
$
|
(12
|
)
|
|
$
|
(642
|
)
|
|
Loss where impairment was not previously recognized
|
|
|
(26
|
)
|
|
|
(3
|
)
|
|
|
(11
|
)
|
|
|
|
|
|
|
(40
|
)
|
|
Additional loss where credit impairment was previously recognized
|
|
|
(128
|
)
|
|
|
|
|
|
|
(42
|
)
|
|
|
|
|
|
|
(170
|
)
|
|
Reduction due to credit impaired securities sold
|
|
|
12
|
|
|
|
|
|
|
|
|
|
|
|
|
|
|
|
12
|
|
|
June 30, 2010
|
|
$
|
(621
|
)
|
|
$
|
(9
|
)
|
|
$
|
(198
|
)
|
|
$
|
(12
|
)
|
|
$
|
(840
|
)
|
Information relating to gross realized securities gains and losses from the sales of securities is set forth in the
following table.
Gains (Losses) on Sales of Securities Available for Sale
|
|
|
|
|
|
|
|
|
|
|
|
|
|
|
|
|
|
|
|
|
|
|
In millions
|
|
Proceeds
|
|
|
Gross
Gains
|
|
|
Gross
Losses
|
|
|
Net
Gains
|
|
|
Tax
Expense
|
|
|
For the six months ended June 30
|
|
|
|
|
|
|
|
|
|
|
|
|
|
|
|
|
|
|
|
|
|
2011
|
|
$
|
15,436
|
|
|
$
|
267
|
|
|
$
|
148
|
|
|
$
|
119
|
|
|
$
|
42
|
|
|
2010
|
|
|
14,164
|
|
|
|
297
|
|
|
|
60
|
|
|
|
237
|
|
|
|
83
|
|
The following table presents, by remaining contractual maturity, the amortized cost, fair value and weighted-average
yield of debt securities at June 30, 2011.
Contractual Maturity of Debt Securities
|
|
|
|
|
|
|
|
|
|
|
|
|
|
|
|
|
|
|
|
|
|
|
June 30, 2011
Dollars in millions
|
|
1 Year or
Less
|
|
|
After 1 Year
through 5 Years
|
|
|
After 5 Years
through 10 Years
|
|
|
After 10
Years
|
|
|
Total
|
|
|
Securities Available for Sale
|
|
|
|
|
|
|
|
|
|
|
|
|
|
|
|
|
|
|
|
|
|
US Treasury and government agencies
|
|
|
|
|
|
$
|
1,694
|
|
|
$
|
1,830
|
|
|
$
|
430
|
|
|
$
|
3,954
|
|
|
Residential mortgage-backed
|
|
|
|
|
|
|
|
|
|
|
|
|
|
|
|
|
|
|
|
|
|
Agency
|
|
|
|
|
|
|
7
|
|
|
|
1,023
|
|
|
|
24,096
|
|
|
|
25,126
|
|
|
Non-agency
|
|
|
|
|
|
|
|
|
|
|
30
|
|
|
|
7,202
|
|
|
|
7,232
|
|
|
Commercial mortgage-backed
|
|
|
|
|
|
|
|
|
|
|
|
|
|
|
|
|
|
|
|
|
|
Agency
|
|
|
|
|
|
|
723
|
|
|
|
479
|
|
|
|
74
|
|
|
|
1,276
|
|
|
Non-agency
|
|
$
|
33
|
|
|
|
146
|
|
|
|
49
|
|
|
|
2,266
|
|
|
|
2,494
|
|
|
Asset-backed
|
|
|
68
|
|
|
|
795
|
|
|
|
451
|
|
|
|
2,525
|
|
|
|
3,839
|
|
|
State and municipal
|
|
|
37
|
|
|
|
121
|
|
|
|
312
|
|
|
|
1,811
|
|
|
|
2,281
|
|
|
Other debt
|
|
|
156
|
|
|
|
2,162
|
|
|
|
504
|
|
|
|
521
|
|
|
|
3,343
|
|
|
Total debt securities available for sale
|
|
$
|
294
|
|
|
$
|
5,648
|
|
|
$
|
4,678
|
|
|
$
|
38,925
|
|
|
$
|
49,545
|
|
|
Fair value
|
|
$
|
298
|
|
|
$
|
5,816
|
|
|
$
|
4,854
|
|
|
$
|
38,393
|
|
|
$
|
49,361
|
|
|
Weighted-average yield, GAAP basis
|
|
|
3.03
|
%
|
|
|
2.67
|
%
|
|
|
3.48
|
%
|
|
|
3.95
|
%
|
|
|
3.75
|
%
|
|
Securities Held to Maturity
|
|
|
|
|
|
|
|
|
|
|
|
|
|
|
|
|
|
|
|
|
|
Residential mortgage-backed (agency)
|
|
|
|
|
|
|
|
|
|
|
|
|
|
$
|
2,775
|
|
|
$
|
2,775
|
|
|
Commercial mortgage-backed
|
|
|
|
|
|
|
|
|
|
|
|
|
|
|
|
|
|
|
|
|
|
Agency
|
|
|
|
|
|
|
|
|
|
$
|
374
|
|
|
|
134
|
|
|
|
508
|
|
|
Non-agency
|
|
$
|
137
|
|
|
$
|
47
|
|
|
|
58
|
|
|
|
3,785
|
|
|
|
4,027
|
|
|
Asset-backed
|
|
|
30
|
|
|
|
1,517
|
|
|
|
136
|
|
|
|
380
|
|
|
|
2,063
|
|
|
State and municipal
|
|
|
|
|
|
|
|
|
|
|
5
|
|
|
|
3
|
|
|
|
8
|
|
|
Other debt
|
|
|
|
|
|
|
1
|
|
|
|
365
|
|
|
|
|
|
|
|
366
|
|
|
Total debt securities held to maturity
|
|
$
|
167
|
|
|
$
|
1,565
|
|
|
$
|
938
|
|
|
$
|
7,077
|
|
|
$
|
9,747
|
|
|
Fair value
|
|
$
|
171
|
|
|
$
|
1,594
|
|
|
$
|
936
|
|
|
$
|
7,209
|
|
|
$
|
9,910
|
|
|
Weighted-average yield, GAAP basis
|
|
|
4.49
|
%
|
|
|
2.02
|
%
|
|
|
3.28
|
%
|
|
|
4.68
|
%
|
|
|
4.11
|
%
|
93
Based on current interest rates and expected prepayment speeds, the weighted-average expected maturity of
mortgage and other asset-backed debt securities were as follows as of June 30, 2011:
Weighted-Average Expected Maturity of
Mortgage and Other Asset-Backed Debt Securities
|
|
|
|
|
|
|
|
|
June 30, 2011
|
|
|
Agency mortgage-backed securities
|
|
|
4.4 years
|
|
|
Non-agency mortgage-backed securities
|
|
|
4.7 years
|
|
|
Agency commercial mortgage-backed securities
|
|
|
4.6 years
|
|
|
Non-agency commercial mortgage-backed securities
|
|
|
2.9 years
|
|
|
Asset-backed securities
|
|
|
3.2 years
|
|
Weighted-average yields are based on historical cost with effective yields weighted for the contractual maturity of each
security.
The following table presents the fair value of securities that have been either pledged to or accepted from others to collateralize
outstanding borrowings.
Fair Value of Securities Pledged and Accepted as Collateral
|
|
|
|
|
|
|
|
|
|
|
In millions
|
|
June 30,
2011
|
|
|
December 31,
2010
|
|
|
Pledged to others
|
|
$
|
23,071
|
|
|
$
|
27,985
|
|
|
Accepted from others:
|
|
|
|
|
|
|
|
|
|
Permitted by contract or custom to sell or repledge
|
|
|
2,185
|
|
|
|
3,529
|
|
|
Permitted amount repledged to others
|
|
|
1,083
|
|
|
|
1,971
|
|
The securities pledged to others include positions held in our portfolio of investment securities, trading securities,
and securities accepted as collateral from others that we are permitted by contract or custom to sell or repledge, and were used to secure public and trust deposits, repurchase agreements, and for other purposes. The securities accepted from others
that we are permitted by contract or custom to sell or repledge are a component of Federal funds sold and resale agreements on our Consolidated Balance Sheet.
N
OTE
8 F
AIR
V
ALUE
Fair Value Measurement
Fair value is defined in GAAP as the price that would be received to sell an asset or the price paid to transfer a liability on the measurement date. The
standard focuses on the exit price in the principal or most advantageous market for the asset or liability in an orderly transaction between market participants. GAAP establishes a fair value reporting hierarchy to maximize the use of observable
inputs when measuring fair value and defines the three levels of inputs as noted below.
Level 1
Quoted prices in active markets for identical assets or liabilities. Level 1 assets and liabilities may include debt securities, equity securities and
listed derivative contracts that are traded in an active exchange market and certain US government agency securities that are actively traded in over-the-counter markets.
Level 2
Observable inputs other than Level 1 such as: quoted prices for similar assets or
liabilities in active markets, quoted prices for identical or similar assets or liabilities in markets that are not active, or other inputs that are observable or can be corroborated to observable market data for substantially the full term of the
asset or liability. Level 2 assets and liabilities may include debt securities, equity securities and listed derivative contracts with quoted prices that are traded in
markets that are not active, and certain debt and equity securities and over-the-counter derivative contracts whose fair value is determined using a pricing model without significant unobservable
inputs. This category generally includes agency residential and commercial mortgage-backed debt securities, asset-backed securities, corporate debt securities, residential mortgage loans held for sale, and derivative contracts.
Level 3
Unobservable inputs that are
supported by minimal or no market activity and that are significant to the fair value of the assets or liabilities. Level 3 assets and liabilities may include financial instruments whose value is determined using pricing models with internally
developed assumptions, discounted cash flow methodologies, or similar techniques, as well as instruments for which the determination of fair value requires significant management judgment or estimation. This category generally includes certain
available for sale and trading securities, commercial mortgage loans held for sale, private equity investments, residential mortgage servicing rights, BlackRock Series C Preferred Stock and certain financial derivative contracts. The available for
sale and trading securities within Level 3 include non-agency residential mortgage-backed securities, auction rate securities, certain private-issuer asset-backed securities and corporate debt securities. Nonrecurring items, primarily certain
nonaccrual and other loans held for sale, commercial mortgage servicing rights, equity investments and other assets are also included in this category.
94
We characterize active markets as those where transaction volumes are sufficient to provide objective
pricing information, with reasonably narrow bid/ask spreads and where dealer quotes received do not vary widely and are based on current information. Inactive markets are typically characterized by low transaction volumes, price quotations that vary
substantially among market participants or are not based on current information, wide bid/ask spreads, a significant increase in implied liquidity risk premiums, yields, or performance indicators for observed transactions or quoted prices compared
to historical periods, a significant decline or absence of a market for new issuance, or any combination of the above factors. We also consider nonperformance risks including credit risk as part of our valuation methodology for all assets and
liabilities measured at fair value.
Any models used to determine fair values or to validate dealer quotes based on the descriptions below are
subject to review and independent testing as part of our model validation and internal control testing processes. Our Model Validation Committee tests significant models on at least an annual basis. In addition, we have teams, independent of the
traders, verify marks and assumptions used for valuations at each period end.
Securities Available for Sale and Trading Securities
Securities accounted for at fair value include both the available for sale and trading portfolios. We use prices obtained from pricing
services, dealer quotes or recent trades to determine the fair value of securities. For 52% of our positions, we use prices obtained from pricing services provided by third party vendors. For an additional 11% of our positions, we use prices
obtained from the pricing services as the primary input into the valuation process. One of the vendors’ prices are set with reference to market activity for highly liquid assets such as agency mortgage-backed securities, and matrix pricing for
other assets, such as CMBS and asset-backed securities. Another vendor primarily uses pricing models considering adjustments for ratings, spreads, matrix pricing and prepayments for the instruments we value using this service, such as non-agency
residential mortgage-backed securities, agency adjustable rate mortgage securities, agency CMOs and municipal bonds. Management uses various methods and techniques to corroborate prices obtained from pricing services and dealers, including reference
to other dealer or market quotes, by reviewing valuations of comparable instruments, or by comparison to internal valuations. Dealer quotes received are typically non-binding. In circumstances where relevant market prices are limited or unavailable,
valuations may require significant management judgments or adjustments to determine fair value. In these cases, the securities are classified as Level 3.
The valuation techniques used for securities classified as Level 3 include using a discounted cash flow approach or, in certain instances, identifying a proxy security, market transaction or index. For
certain security types, primarily non-agency residential securities, the fair value methodology
incorporates values obtained from a discounted cash flow model. The modeling process incorporates assumptions management believes market participants would use to value the security under current
market conditions. The assumptions used include prepayment projections, credit loss assumptions, and discount rates, which include a risk premium due to liquidity and uncertainty that are based on both observable and unobservable inputs. We use the
discounted cash flow analysis, in conjunction with other relevant pricing information obtained from either pricing services or broker quotes to establish the fair value that management believes is representative under current market conditions. For
purposes of determining fair value at June 30, 2011 and December 31, 2010, the relevant pricing service information was the predominant input.
In the proxy approach, the proxy selected has similar credit, tenor, duration, pricing and structuring attributes to the PNC position. The price, market spread, or yield on the proxy is then used to
calculate an indicative market price for the security. Depending on the nature of the PNC position and its attributes relative to the proxy, management may make additional adjustments to account for market conditions, liquidity, and nonperformance
risk, based on various inputs including recent trades of similar securities, single dealer quotes, and/or other observable and unobservable inputs.
Financial Derivatives
Exchange-traded derivatives are valued using quoted market
prices and are classified as Level 1. However, the majority of derivatives that we enter into are executed over-the-counter and are valued using internal models. Readily observable market inputs to these models can be validated to external sources,
including industry pricing services, or corroborated through recent trades, dealer quotes, yield curves, implied volatility or other market-related data. Certain derivatives, such as total rate of return swaps, are corroborated to the CMBX index.
These derivatives are classified as Level 2. Derivatives priced using significant management judgment or assumptions are classified as Level 3.
The fair values of our derivatives are adjusted for nonperformance risk including credit risk as appropriate. Our nonperformance risk adjustment is
computed using new loan pricing and considers externally available bond spreads, in conjunction with internal historical recovery observations. The credit risk adjustment is not currently material to the overall derivatives valuation.
Residential Mortgage Loans Held for Sale
We have elected to account for certain residential mortgage loans originated for sale on a recurring basis at fair value. Residential mortgage loans are valued based on quoted market prices, where
available, prices for other traded mortgage loans with similar characteristics, and purchase commitments and bid information received from market participants. These loans are regularly traded in active markets and observable
95
pricing information is available from market participants. The prices are adjusted as necessary to include the embedded servicing value in the loans and to take into consideration the specific
characteristics of certain loans that are priced based on the pricing of similar loans. These adjustments represent unobservable inputs to the valuation but are not considered significant to the fair value of the loans. Accordingly, residential
mortgage loans held for sale are classified as Level 2.
Residential Mortgage Servicing Rights
Residential mortgage servicing rights (MSRs) are carried at fair value on a recurring basis. Currently, these residential MSRs do not trade in an active
open market with readily observable prices. Although sales of servicing assets do occur, the precise terms and conditions typically would not be available. Accordingly, management determines the fair value of its residential MSRs using a discounted
cash flow model incorporating assumptions about loan prepayment rates, discount rates, servicing costs, and other economic factors. As part of the pricing process, management compares its fair value estimates to third-party opinions of value on a
quarterly basis to assess the reasonableness of the fair values calculated by its internal valuation models. Due to the nature of the valuation inputs, residential MSRs are classified as Level 3.
Commercial Mortgage Loans Held for Sale
We account for certain commercial mortgage loans classified as held for sale at fair value. The election of the fair value option aligns the accounting for the commercial mortgages with the related
hedges. At origination, these loans were intended for securitization.
We determine the fair value of commercial mortgage loans held for sale
by using a whole loan methodology. Fair value is determined using sale valuation assumptions that management believes a market participant would use in pricing the loans. When available, valuation assumptions included observable inputs based on
whole loan sales. Adjustments are made to these assumptions to account for situations when uncertainties exist, including market conditions and liquidity. Credit risk is included as part of our valuation process for these loans by considering
expected rates of return for market participants for similar loans in the marketplace. Based on the significance of unobservable inputs, we classified this portfolio as Level 3.
Equity Investments
The valuation of direct and indirect private equity investments requires significant management judgment due to the absence of quoted market prices, inherent lack of liquidity and the long-term nature of
such investments. The carrying values of direct and affiliated partnership interests reflect the expected exit price and are based on various techniques including multiples of adjusted earnings of the entity, independent appraisals, anticipated
financing and sale transactions with third parties, or the pricing used to value the entity in a recent financing transaction. We value indirect investments in private equity funds based on net asset value as provided in the financial statements
that we receive from their managers. Due to the time lag in our receipt of the financial information and based on a review of investments and valuation techniques applied, adjustments to the manager-provided value are made when available recent
portfolio company information or market information indicates a significant change in value from that provided by the manager of the fund. These investments are classified as Level 3.
Customer Resale Agreements
We have elected to account for structured resale
agreements, which are economically hedged using free-standing financial derivatives, at fair value. The fair value for structured resale agreements is determined using a model that includes observable market data such as interest rates as inputs.
Readily observable market inputs to this model can be validated to external sources, including yield curves, implied volatility or other market-related data. These instruments are classified as Level 2.
BlackRock Series C Preferred Stock
We have elected to account for the 2.9 million shares of the BlackRock Series C Preferred Stock received in a stock exchange with BlackRock at fair
value. The Series C Preferred Stock economically hedges the BlackRock LTIP liability that is accounted for as a derivative. The fair value of the Series C Preferred Stock is determined using a third-party modeling approach, which includes both
observable and unobservable inputs. This approach considers expectations of a default/liquidation event and the use of liquidity discounts based on our inability to sell the security at a fair, open market price in a timely manner. Although
dividends are equal to common shares and other preferred series, significant transfer restrictions exist on our Series C shares for any purpose other than to satisfy the LTIP obligation. Due to the significance of unobservable inputs, this security
is classified as Level 3.
96
Assets and liabilities measured at fair value on a recurring basis, including instruments for which PNC has
elected the fair value option, follow.
Fair Value Measurements – Summary
|
|
|
|
|
|
|
|
|
|
|
|
|
|
|
|
|
|
|
|
|
|
|
|
|
|
|
|
|
|
|
|
|
|
|
|
|
June 30, 2011
|
|
|
December 31, 2010
|
|
|
In millions
|
|
Level 1
|
|
|
Level 2
|
|
|
Level 3
|
|
|
Total Fair
Value
|
|
|
Level 1
|
|
|
Level 2
|
|
|
Level 3
|
|
|
Total Fair
Value
|
|
|
Assets
|
|
|
|
|
|
|
|
|
|
|
|
|
|
|
|
|
|
|
|
|
|
|
|
|
|
|
|
|
|
|
|
|
|
Securities available for sale
|
|
|
|
|
|
|
|
|
|
|
|
|
|
|
|
|
|
|
|
|
|
|
|
|
|
|
|
|
|
|
|
|
|
US Treasury and government agencies
|
|
$
|
3,692
|
|
|
$
|
438
|
|
|
|
|
|
|
$
|
4,130
|
|
|
$
|
5,289
|
|
|
$
|
421
|
|
|
|
|
|
|
$
|
5,710
|
|
|
Residential mortgage-backed
|
|
|
|
|
|
|
|
|
|
|
|
|
|
|
|
|
|
|
|
|
|
|
|
|
|
|
|
|
|
|
|
|
|
Agency
|
|
|
|
|
|
|
25,500
|
|
|
|
|
|
|
|
25,500
|
|
|
|
|
|
|
|
31,720
|
|
|
|
|
|
|
|
31,720
|
|
|
Non-agency
|
|
|
|
|
|
|
|
|
|
$
|
6,454
|
|
|
|
6,454
|
|
|
|
|
|
|
|
|
|
|
$
|
7,233
|
|
|
|
7,233
|
|
|
Commercial mortgage-backed
|
|
|
|
|
|
|
|
|
|
|
|
|
|
|
|
|
|
|
|
|
|
|
|
|
|
|
|
|
|
|
|
|
|
Agency
|
|
|
|
|
|
|
1,303
|
|
|
|
|
|
|
|
1,303
|
|
|
|
|
|
|
|
1,797
|
|
|
|
|
|
|
|
1,797
|
|
|
Non-agency
|
|
|
|
|
|
|
2,545
|
|
|
|
|
|
|
|
2,545
|
|
|
|
|
|
|
|
1,856
|
|
|
|
|
|
|
|
1,856
|
|
|
Asset-backed
|
|
|
|
|
|
|
2,734
|
|
|
|
951
|
|
|
|
3,685
|
|
|
|
|
|
|
|
1,537
|
|
|
|
1,045
|
|
|
|
2,582
|
|
|
State and municipal
|
|
|
|
|
|
|
1,961
|
|
|
|
341
|
|
|
|
2,302
|
|
|
|
|
|
|
|
1,729
|
|
|
|
228
|
|
|
|
1,957
|
|
|
Other debt
|
|
|
|
|
|
|
3,367
|
|
|
|
75
|
|
|
|
3,442
|
|
|
|
|
|
|
|
4,004
|
|
|
|
73
|
|
|
|
4,077
|
|
|
Total debt securities
|
|
|
3,692
|
|
|
|
37,848
|
|
|
|
7,821
|
|
|
|
49,361
|
|
|
|
5,289
|
|
|
|
43,064
|
|
|
|
8,579
|
|
|
|
56,932
|
|
|
Corporate stocks and other
|
|
|
306
|
|
|
|
|
|
|
|
|
|
|
|
306
|
|
|
|
307
|
|
|
|
67
|
|
|
|
4
|
|
|
|
378
|
|
|
Total securities available for sale
|
|
|
3,998
|
|
|
|
37,848
|
|
|
|
7,821
|
|
|
|
49,667
|
|
|
|
5,596
|
|
|
|
43,131
|
|
|
|
8,583
|
|
|
|
57,310
|
|
|
Financial derivatives (a) (b)
|
|
|
|
|
|
|
|
|
|
|
|
|
|
|
|
|
|
|
|
|
|
|
|
|
|
|
|
|
|
|
|
|
|
Interest rate contracts
|
|
|
2
|
|
|
|
5,597
|
|
|
|
51
|
|
|
|
5,650
|
|
|
|
|
|
|
|
5,502
|
|
|
|
68
|
|
|
|
5,570
|
|
|
Other contracts
|
|
|
|
|
|
|
196
|
|
|
|
9
|
|
|
|
205
|
|
|
|
|
|
|
|
178
|
|
|
|
9
|
|
|
|
187
|
|
|
Total financial derivatives
|
|
|
2
|
|
|
|
5,793
|
|
|
|
60
|
|
|
|
5,855
|
|
|
|
|
|
|
|
5,680
|
|
|
|
77
|
|
|
|
5,757
|
|
|
Residential mortgage loans held for sale (c)
|
|
|
|
|
|
|
1,351
|
|
|
|
|
|
|
|
1,351
|
|
|
|
|
|
|
|
1,878
|
|
|
|
|
|
|
|
1,878
|
|
|
Trading securities (d)
|
|
|
|
|
|
|
|
|
|
|
|
|
|
|
|
|
|
|
|
|
|
|
|
|
|
|
|
|
|
|
|
|
|
Debt (e) (f)
|
|
|
607
|
|
|
|
1,368
|
|
|
|
56
|
|
|
|
2,031
|
|
|
|
1,348
|
|
|
|
367
|
|
|
|
69
|
|
|
|
1,784
|
|
|
Equity
|
|
|
44
|
|
|
|
|
|
|
|
|
|
|
|
44
|
|
|
|
42
|
|
|
|
|
|
|
|
|
|
|
|
42
|
|
|
Total trading securities
|
|
|
651
|
|
|
|
1,368
|
|
|
|
56
|
|
|
|
2,075
|
|
|
|
1,390
|
|
|
|
367
|
|
|
|
69
|
|
|
|
1,826
|
|
|
Residential mortgage servicing rights (g)
|
|
|
|
|
|
|
|
|
|
|
996
|
|
|
|
996
|
|
|
|
|
|
|
|
|
|
|
|
1,033
|
|
|
|
1,033
|
|
|
Commercial mortgage loans held for sale (c)
|
|
|
|
|
|
|
|
|
|
|
856
|
|
|
|
856
|
|
|
|
|
|
|
|
|
|
|
|
877
|
|
|
|
877
|
|
|
Equity investments
|
|
|
|
|
|
|
|
|
|
|
|
|
|
|
|
|
|
|
|
|
|
|
|
|
|
|
|
|
|
|
|
|
|
Direct investments
|
|
|
|
|
|
|
|
|
|
|
849
|
|
|
|
849
|
|
|
|
|
|
|
|
|
|
|
|
749
|
|
|
|
749
|
|
|
Indirect investments (h)
|
|
|
|
|
|
|
|
|
|
|
664
|
|
|
|
664
|
|
|
|
|
|
|
|
|
|
|
|
635
|
|
|
|
635
|
|
|
Total equity investments
|
|
|
|
|
|
|
|
|
|
|
1,513
|
|
|
|
1,513
|
|
|
|
|
|
|
|
|
|
|
|
1,384
|
|
|
|
1,384
|
|
|
Customer resale agreements (i)
|
|
|
|
|
|
|
813
|
|
|
|
|
|
|
|
813
|
|
|
|
|
|
|
|
866
|
|
|
|
|
|
|
|
866
|
|
|
Loans (j)
|
|
|
|
|
|
|
235
|
|
|
|
4
|
|
|
|
239
|
|
|
|
|
|
|
|
114
|
|
|
|
2
|
|
|
|
116
|
|
|
Other assets
|
|
|
|
|
|
|
|
|
|
|
|
|
|
|
|
|
|
|
|
|
|
|
|
|
|
|
|
|
|
|
|
|
|
BlackRock Series C Preferred Stock (k)
|
|
|
|
|
|
|
|
|
|
|
426
|
|
|
|
426
|
|
|
|
|
|
|
|
|
|
|
|
396
|
|
|
|
396
|
|
|
Other
|
|
|
|
|
|
|
468
|
|
|
|
8
|
|
|
|
476
|
|
|
|
|
|
|
|
450
|
|
|
|
7
|
|
|
|
457
|
|
|
Total other assets
|
|
|
|
|
|
|
468
|
|
|
|
434
|
|
|
|
902
|
|
|
|
|
|
|
|
450
|
|
|
|
403
|
|
|
|
853
|
|
|
Total assets
|
|
$
|
4,651
|
|
|
$
|
47,876
|
|
|
$
|
11,740
|
|
|
$
|
64,267
|
|
|
$
|
6,986
|
|
|
$
|
52,486
|
|
|
$
|
12,428
|
|
|
$
|
71,900
|
|
|
Liabilities
|
|
|
|
|
|
|
|
|
|
|
|
|
|
|
|
|
|
|
|
|
|
|
|
|
|
|
|
|
|
|
|
|
|
Financial derivatives (b) (l)
|
|
|
|
|
|
|
|
|
|
|
|
|
|
|
|
|
|
|
|
|
|
|
|
|
|
|
|
|
|
|
|
|
|
Interest rate contracts
|
|
|
|
|
|
$
|
4,223
|
|
|
$
|
7
|
|
|
$
|
4,230
|
|
|
|
|
|
|
$
|
4,302
|
|
|
$
|
56
|
|
|
$
|
4,358
|
|
|
BlackRock LTIP
|
|
|
|
|
|
|
|
|
|
|
426
|
|
|
|
426
|
|
|
|
|
|
|
|
|
|
|
|
396
|
|
|
|
396
|
|
|
Other contracts
|
|
|
|
|
|
|
196
|
|
|
|
11
|
|
|
|
207
|
|
|
|
|
|
|
|
173
|
|
|
|
8
|
|
|
|
181
|
|
|
Total financial derivatives
|
|
|
|
|
|
|
4,419
|
|
|
|
444
|
|
|
|
4,863
|
|
|
|
|
|
|
|
4,475
|
|
|
|
460
|
|
|
|
4,935
|
|
|
Trading securities sold short (m)
|
|
|
|
|
|
|
|
|
|
|
|
|
|
|
|
|
|
|
|
|
|
|
|
|
|
|
|
|
|
|
|
|
|
Debt (e)
|
|
$
|
1,804
|
|
|
|
41
|
|
|
|
|
|
|
|
1,845
|
|
|
$
|
2,514
|
|
|
|
16
|
|
|
|
|
|
|
|
2,530
|
|
|
Total trading securities sold short
|
|
|
1,804
|
|
|
|
41
|
|
|
|
|
|
|
|
1,845
|
|
|
|
2,514
|
|
|
|
16
|
|
|
|
|
|
|
|
2,530
|
|
|
Other liabilities
|
|
|
|
|
|
|
|
|
|
|
|
|
|
|
|
|
|
|
|
|
|
|
6
|
|
|
|
|
|
|
|
6
|
|
|
Total liabilities
|
|
$
|
1,804
|
|
|
$
|
4,460
|
|
|
$
|
444
|
|
|
$
|
6,708
|
|
|
$
|
2,514
|
|
|
$
|
4,497
|
|
|
$
|
460
|
|
|
$
|
7,471
|
|
|
(a)
|
Included in Other assets on our Consolidated Balance Sheet.
|
97
|
(b)
|
Amounts at June 30, 2011 and December 31, 2010 are presented gross and are not reduced by the impact of legally enforceable master netting agreements that
allow PNC to net positive and negative positions and cash collateral held or placed with the same counterparty. At June 30, 2011 and December 31, 2010, respectively, the net asset amounts were $1.8 billion and $1.9 billion and the net
liability amounts were $.9 billion and $1.1 billion.
|
|
(c)
|
Included in Loans held for sale on our Consolidated Balance Sheet. PNC has elected the fair value option for certain commercial and residential mortgage loans held for
sale.
|
|
(d)
|
Fair value includes net unrealized gains of $7 million at June 30, 2011 compared with net unrealized losses of $17 million at December 31, 2010.
|
|
(e)
|
Approximately 57% of these securities are residential mortgage-backed agency hybrid securities and 31% are US Treasury and government agencies securities at
June 30, 2011.
|
|
(f)
|
At June 30, 2011, $1.0 billion of residential mortgage-backed agency hybrid securities are carried in Trading securities.
|
|
(g)
|
Included in Other intangible assets on our Consolidated Balance Sheet.
|
|
(h)
|
The indirect equity funds are not redeemable, but PNC receives distributions over the life of the partnership from liquidation of the underlying investments by the
investee.
|
|
(i)
|
Included in Federal funds sold and resale agreements on our Consolidated Balance Sheet. PNC has elected the fair value option for these items.
|
|
(j)
|
Included in Loans on our Consolidated Balance Sheet.
|
|
(k)
|
PNC has elected the fair value option for these shares.
|
|
(l)
|
Included in Other liabilities on our Consolidated Balance Sheet.
|
|
(m)
|
Included in Other borrowed funds on our Consolidated Balance Sheet.
|
Reconciliations of assets and liabilities measured at fair value on a recurring basis using Level 3 inputs for the three months and six months ended June 30, 2011 and 2010 follow.
Three Months Ended June 30, 2011
|
|
|
|
|
|
|
|
|
|
|
|
|
|
|
|
|
|
|
|
|
|
|
|
|
|
|
|
|
|
|
|
|
|
|
|
|
|
|
Level 3 Instruments Only
In millions
|
|
|
|
|
Total realized /
unrealized
gains or losses for the period (a)
|
|
|
|
|
|
|
|
|
|
|
|
|
|
|
|
|
|
(*) Unrealized
gains or losses
on assets and
liabilities held on
Consolidated
Balance Sheet at
June 30,
2011
|
|
|
|
Fair
Value
March 31,
2011
|
|
|
Included in
Earnings (*)
|
|
|
Included in
other
comprehensive
income
|
|
|
Purchases
|
|
|
Sales
|
|
|
Issuances
|
|
|
Settlements
|
|
|
Fair
Value
June
30,
2011
|
|
|
|
Assets
|
|
|
|
|
|
|
|
|
|
|
|
|
|
|
|
|
|
|
|
|
|
|
|
|
|
|
|
|
|
|
|
|
|
|
|
|
|
Securities available for sale
|
|
|
|
|
|
|
|
|
|
|
|
|
|
|
|
|
|
|
|
|
|
|
|
|
|
|
|
|
|
|
|
|
|
|
|
|
|
Residential mortgage-backed non-agency
|
|
$
|
7,171
|
|
|
$
|
(58
|
)
|
|
$
|
(73
|
)
|
|
$
|
3
|
|
|
$
|
(280
|
)
|
|
|
|
|
|
$
|
(309
|
)
|
|
$
|
6,454
|
|
|
$
|
(35
|
)
|
|
Asset-backed
|
|
|
1,024
|
|
|
|
|
|
|
|
(11
|
)
|
|
|
|
|
|
|
|
|
|
|
|
|
|
|
(62
|
)
|
|
|
951
|
|
|
|
(4
|
)
|
|
State and municipal
|
|
|
341
|
|
|
|
|
|
|
|
1
|
|
|
|
5
|
|
|
|
|
|
|
|
|
|
|
|
(6
|
)
|
|
|
341
|
|
|
|
|
|
|
Other debt
|
|
|
73
|
|
|
|
(1
|
)
|
|
|
2
|
|
|
|
2
|
|
|
|
(2
|
)
|
|
|
|
|
|
|
1
|
|
|
|
75
|
|
|
|
|
|
|
Corporate stocks and other
|
|
|
1
|
|
|
|
|
|
|
|
|
|
|
|
|
|
|
|
|
|
|
|
|
|
|
|
(1
|
)
|
|
|
|
|
|
|
|
|
|
Total securities available for sale
|
|
|
8,610
|
|
|
|
(59
|
)
|
|
|
(81
|
)
|
|
|
10
|
|
|
|
(282
|
)
|
|
|
|
|
|
|
(377
|
)
|
|
|
7,821
|
|
|
|
(39
|
)
|
|
Financial derivatives
|
|
|
50
|
|
|
|
63
|
|
|
|
|
|
|
|
3
|
|
|
|
|
|
|
|
|
|
|
|
(56
|
)
|
|
|
60
|
|
|
|
63
|
|
|
Trading securities – Debt
|
|
|
60
|
|
|
|
1
|
|
|
|
|
|
|
|
|
|
|
|
|
|
|
|
|
|
|
|
(5
|
)
|
|
|
56
|
|
|
|
|
|
|
Residential mortgage servicing rights
|
|
|
1,109
|
|
|
|
(107
|
)
|
|
|
|
|
|
|
|
|
|
|
|
|
|
$
|
31
|
|
|
|
(37
|
)
|
|
|
996
|
|
|
|
(105
|
)
|
|
Commercial mortgage loans held for sale
|
|
|
858
|
|
|
|
6
|
|
|
|
|
|
|
|
|
|
|
|
(6
|
)
|
|
|
|
|
|
|
(2
|
)
|
|
|
856
|
|
|
|
5
|
|
|
Equity investments
|
|
|
|
|
|
|
|
|
|
|
|
|
|
|
|
|
|
|
|
|
|
|
|
|
|
|
|
|
|
|
|
|
|
|
|
|
|
Direct investments
|
|
|
794
|
|
|
|
21
|
|
|
|
|
|
|
|
55
|
|
|
|
(21
|
)
|
|
|
|
|
|
|
|
|
|
|
849
|
|
|
|
20
|
|
|
Indirect investments
|
|
|
663
|
|
|
|
27
|
|
|
|
|
|
|
|
14
|
|
|
|
(40
|
)
|
|
|
|
|
|
|
|
|
|
|
664
|
|
|
|
29
|
|
|
Total equity investments
|
|
|
1,457
|
|
|
|
48
|
|
|
|
|
|
|
|
69
|
|
|
|
(61
|
)
|
|
|
|
|
|
|
|
|
|
|
1,513
|
|
|
|
49
|
|
|
Loans
|
|
|
2
|
|
|
|
|
|
|
|
|
|
|
|
2
|
|
|
|
|
|
|
|
|
|
|
|
|
|
|
|
4
|
|
|
|
|
|
|
Other assets
|
|
|
|
|
|
|
|
|
|
|
|
|
|
|
|
|
|
|
|
|
|
|
|
|
|
|
|
|
|
|
|
|
|
|
|
|
|
BlackRock Series C
|
|
|
|
|
|
|
|
|
|
|
|
|
|
|
|
|
|
|
|
|
|
|
|
|
|
|
|
|
|
|
|
|
|
|
|
|
|
Preferred Stock
|
|
|
447
|
|
|
|
(21
|
)
|
|
|
|
|
|
|
|
|
|
|
|
|
|
|
|
|
|
|
|
|
|
|
426
|
|
|
|
(21
|
)
|
|
Other
|
|
|
8
|
|
|
|
|
|
|
|
|
|
|
|
|
|
|
|
|
|
|
|
|
|
|
|
|
|
|
|
8
|
|
|
|
|
|
|
Total other assets
|
|
|
455
|
|
|
|
(21
|
)
|
|
|
|
|
|
|
|
|
|
|
|
|
|
|
|
|
|
|
|
|
|
|
434
|
|
|
|
(21
|
)
|
|
Total assets
|
|
$
|
12,601
|
|
|
$
|
(69
|
)
|
|
$
|
(81
|
)
|
|
$
|
84
|
|
|
$
|
(349
|
)
|
|
$
|
31
|
|
|
$
|
(477
|
)
|
|
$
|
11,740
|
|
|
$
|
(48
|
)
|
|
Total liabilities (c)
|
|
$
|
476
|
|
|
$
|
(14
|
)
|
|
|
|
|
|
|
|
|
|
$
|
5
|
|
|
|
|
|
|
$
|
(23
|
)
|
|
$
|
444
|
|
|
$
|
(18
|
)
|
98
Three Months Ended June 30, 2010
|
|
|
|
|
|
|
|
|
|
|
|
|
|
|
|
|
|
|
|
|
|
|
|
|
|
|
|
|
|
|
|
|
|
|
|
|
|
|
|
Total realized /
unrealized
gains or losses for the period (a)
|
|
|
|
|
|
|
|
|
|
|
|
|
|
|
(*) Unrealized
gains or losses
on assets and
liabilities held on
Consolidated
Balance Sheet at
June 30,
2010
|
|
|
Level 3 Instruments Only
In millions
|
|
Fair Value
March 31,
2010
|
|
|
Included in
Earnings (*)
|
|
|
Included in
other
comprehensive
income
|
|
|
Purchases,
issuances,
and
settlements,
net
|
|
|
Transfers
into
Level 3
(b)
|
|
|
Transfers
out of
Level 3
(b)
|
|
|
Fair
Value
June 30,
2010
|
|
|
|
Assets
|
|
|
|
|
|
|
|
|
|
|
|
|
|
|
|
|
|
|
|
|
|
|
|
|
|
|
|
|
|
|
|
|
|
Securities available for sale
|
|
|
|
|
|
|
|
|
|
|
|
|
|
|
|
|
|
|
|
|
|
|
|
|
|
|
|
|
|
|
|
|
|
Residential mortgage- backed non-agency
|
|
$
|
7,710
|
|
|
$
|
(46
|
)
|
|
$
|
395
|
|
|
$
|
(422
|
)
|
|
|
|
|
|
$
|
(2
|
)
|
|
$
|
7,635
|
|
|
$
|
(81
|
)
|
|
Commercial mortgage- backed non-agency
|
|
|
3
|
|
|
|
|
|
|
|
|
|
|
|
|
|
|
|
|
|
|
|
(3
|
)
|
|
|
|
|
|
|
|
|
|
Asset-backed
|
|
|
1,187
|
|
|
|
(10
|
)
|
|
|
61
|
|
|
|
(88
|
)
|
|
|
|
|
|
|
|
|
|
|
1,150
|
|
|
|
(10
|
)
|
|
State and municipal
|
|
|
272
|
|
|
|
5
|
|
|
|
(11
|
)
|
|
|
(29
|
)
|
|
|
|
|
|
|
|
|
|
|
237
|
|
|
|
|
|
|
Other debt
|
|
|
83
|
|
|
|
|
|
|
|
1
|
|
|
|
(2
|
)
|
|
|
|
|
|
|
|
|
|
|
82
|
|
|
|
|
|
|
Corporate stocks and other
|
|
|
47
|
|
|
|
|
|
|
|
|
|
|
|
|
|
|
|
|
|
|
|
|
|
|
|
47
|
|
|
|
|
|
|
Total securities available for sale
|
|
|
9,302
|
|
|
|
(51
|
)
|
|
|
446
|
|
|
|
(541
|
)
|
|
|
|
|
|
|
(5
|
)
|
|
|
9,151
|
|
|
|
(91
|
)
|
|
Financial derivatives
|
|
|
86
|
|
|
|
6
|
|
|
|
|
|
|
|
(7
|
)
|
|
|
|
|
|
|
|
|
|
|
85
|
|
|
|
58
|
|
|
Trading securities – Debt
|
|
|
77
|
|
|
|
1
|
|
|
|
|
|
|
|
(5
|
)
|
|
|
|
|
|
|
|
|
|
|
73
|
|
|
|
|
|
|
Residential mortgage servicing rights
|
|
|
1,271
|
|
|
|
(288
|
)
|
|
|
|
|
|
|
(20
|
)
|
|
|
|
|
|
|
|
|
|
|
963
|
|
|
|
(291
|
)
|
|
Commercial mortgage loans held for sale
|
|
|
1,041
|
|
|
|
13
|
|
|
|
|
|
|
|
(18
|
)
|
|
|
|
|
|
|
|
|
|
|
1,036
|
|
|
|
14
|
|
|
Equity investments
|
|
|
|
|
|
|
|
|
|
|
|
|
|
|
|
|
|
|
|
|
|
|
|
|
|
|
|
|
|
|
|
|
|
Direct investments
|
|
|
602
|
|
|
|
63
|
|
|
|
|
|
|
|
(15
|
)
|
|
|
|
|
|
|
|
|
|
|
650
|
|
|
|
58
|
|
|
Indirect investments
|
|
|
606
|
|
|
|
24
|
|
|
|
|
|
|
|
(12
|
)
|
|
|
|
|
|
|
|
|
|
|
618
|
|
|
|
22
|
|
|
Total equity investments
|
|
|
1,208
|
|
|
|
87
|
|
|
|
|
|
|
|
(27
|
)
|
|
|
|
|
|
|
|
|
|
|
1,268
|
|
|
|
80
|
|
|
Other assets
|
|
|
|
|
|
|
|
|
|
|
|
|
|
|
|
|
|
|
|
|
|
|
|
|
|
|
|
|
|
|
|
|
|
BlackRock Series C Preferred Stock
|
|
|
452
|
|
|
|
(154
|
)
|
|
|
|
|
|
|
|
|
|
|
|
|
|
|
|
|
|
|
298
|
|
|
|
|
|
|
Other
|
|
|
9
|
|
|
|
|
|
|
|
(1
|
)
|
|
|
(1
|
)
|
|
|
|
|
|
|
|
|
|
|
7
|
|
|
|
|
|
|
Total other assets
|
|
|
461
|
|
|
|
(154
|
)
|
|
|
(1
|
)
|
|
|
(1
|
)
|
|
|
|
|
|
|
|
|
|
|
305
|
|
|
|
|
|
|
Total assets
|
|
$
|
13,446
|
|
|
$
|
(386
|
)
|
|
$
|
445
|
|
|
$
|
(619
|
)
|
|
|
|
|
|
$
|
(5
|
)
|
|
$
|
12,881
|
|
|
$
|
(230
|
)
|
|
Total liabilities (c)
|
|
$
|
494
|
|
|
$
|
(159
|
)
|
|
|
|
|
|
$
|
19
|
|
|
$
|
1
|
|
|
|
|
|
|
$
|
355
|
|
|
$
|
50
|
|
|
(a)
|
Losses for assets are bracketed while losses for liabilities are not.
|
|
(b)
|
PNC’s policy is to recognize transfers in and transfers out as of the end of the reporting period.
|
|
(c)
|
Financial derivatives.
|
99
Six Months Ended June 30, 2011
|
|
|
|
|
|
|
|
|
|
|
|
|
|
|
|
|
|
|
|
|
|
|
|
|
|
|
|
|
|
|
|
|
|
|
|
|
|
|
|
|
|
|
|
Total realized /
unrealized
gains or losses for the period (a)
|
|
|
|
|
|
|
|
|
|
|
|
|
|
|
|
|
|
(*) Unrealized
gains or losses
on assets and
liabilities held on
Consolidated
Balance Sheet at
June 30,
2011
|
|
|
Level 3 Instruments Only
In millions
|
|
Fair
Value
Dec. 31,
2010
|
|
|
Included in
Earnings (*)
|
|
|
Included in
other
comprehensive
income
|
|
|
Purchases
|
|
|
Sales
|
|
|
Issuances
|
|
|
Settlements
|
|
|
Fair
Value
June 30,
2011
|
|
|
|
Assets
|
|
|
|
|
|
|
|
|
|
|
|
|
|
|
|
|
|
|
|
|
|
|
|
|
|
|
|
|
|
|
|
|
|
|
|
|
|
Securities available for sale
|
|
|
|
|
|
|
|
|
|
|
|
|
|
|
|
|
|
|
|
|
|
|
|
|
|
|
|
|
|
|
|
|
|
|
|
|
|
Residential mortgage- backed non-agency
|
|
$
|
7,233
|
|
|
$
|
(64
|
)
|
|
$
|
182
|
|
|
$
|
45
|
|
|
|
(280
|
)
|
|
|
|
|
|
$
|
(662
|
)
|
|
$
|
6,454
|
|
|
$
|
(63
|
)
|
|
Asset-backed
|
|
|
1,045
|
|
|
|
(3
|
)
|
|
|
43
|
|
|
|
|
|
|
|
|
|
|
|
|
|
|
|
(134
|
)
|
|
|
951
|
|
|
|
(9
|
)
|
|
State and municipal
|
|
|
228
|
|
|
|
|
|
|
|
3
|
|
|
|
121
|
|
|
|
|
|
|
|
|
|
|
|
(11
|
)
|
|
|
341
|
|
|
|
|
|
|
Other debt
|
|
|
73
|
|
|
|
(2
|
)
|
|
|
4
|
|
|
|
2
|
|
|
$
|
(3
|
)
|
|
|
|
|
|
|
1
|
|
|
|
75
|
|
|
|
(1
|
)
|
|
Corporate stocks and other
|
|
|
4
|
|
|
|
|
|
|
|
|
|
|
|
|
|
|
|
|
|
|
|
|
|
|
|
(4
|
)
|
|
|
|
|
|
|
|
|
|
Total securities available for sale
|
|
|
8,583
|
|
|
|
(69
|
)
|
|
|
232
|
|
|
|
168
|
|
|
|
(283
|
)
|
|
|
|
|
|
|
(810
|
)
|
|
|
7,821
|
|
|
|
(73
|
)
|
|
Financial derivatives
|
|
|
77
|
|
|
|
106
|
|
|
|
|
|
|
|
3
|
|
|
|
|
|
|
|
|
|
|
|
(126
|
)
|
|
|
60
|
|
|
|
90
|
|
|
Trading securities – Debt
|
|
|
69
|
|
|
|
(3
|
)
|
|
|
|
|
|
|
|
|
|
|
|
|
|
|
|
|
|
|
(10
|
)
|
|
|
56
|
|
|
|
(5
|
)
|
|
Residential mortgage servicing rights
|
|
|
1,033
|
|
|
|
(71
|
)
|
|
|
|
|
|
|
48
|
|
|
|
|
|
|
$
|
70
|
|
|
|
(84
|
)
|
|
|
996
|
|
|
|
(70
|
)
|
|
Commercial mortgage loans held for sale
|
|
|
877
|
|
|
|
(1
|
)
|
|
|
|
|
|
|
|
|
|
|
(13
|
)
|
|
|
|
|
|
|
(7
|
)
|
|
|
856
|
|
|
|
(1
|
)
|
|
Equity investments
|
|
|
|
|
|
|
|
|
|
|
|
|
|
|
|
|
|
|
|
|
|
|
|
|
|
|
|
|
|
|
|
|
|
|
|
|
|
Direct investments
|
|
|
749
|
|
|
|
34
|
|
|
|
|
|
|
|
102
|
|
|
|
(36
|
)
|
|
|
|
|
|
|
|
|
|
|
849
|
|
|
|
31
|
|
|
Indirect investments
|
|
|
635
|
|
|
|
71
|
|
|
|
|
|
|
|
24
|
|
|
|
(66
|
)
|
|
|
|
|
|
|
|
|
|
|
664
|
|
|
|
71
|
|
|
Total equity investments
|
|
|
1,384
|
|
|
|
105
|
|
|
|
|
|
|
|
126
|
|
|
|
(102
|
)
|
|
|
|
|
|
|
|
|
|
|
1,513
|
|
|
|
102
|
|
|
Loans
|
|
|
2
|
|
|
|
|
|
|
|
|
|
|
|
2
|
|
|
|
|
|
|
|
|
|
|
|
|
|
|
|
4
|
|
|
|
|
|
|
Other assets
|
|
|
|
|
|
|
|
|
|
|
|
|
|
|
|
|
|
|
|
|
|
|
|
|
|
|
|
|
|
|
|
|
|
|
|
|
|
BlackRock Series C Preferred Stock
|
|
|
396
|
|
|
|
30
|
|
|
|
|
|
|
|
|
|
|
|
|
|
|
|
|
|
|
|
|
|
|
|
426
|
|
|
|
30
|
|
|
Other
|
|
|
7
|
|
|
|
|
|
|
|
|
|
|
|
1
|
|
|
|
|
|
|
|
|
|
|
|
|
|
|
|
8
|
|
|
|
|
|
|
Total other assets
|
|
|
403
|
|
|
|
30
|
|
|
|
|
|
|
|
1
|
|
|
|
|
|
|
|
|
|
|
|
|
|
|
|
434
|
|
|
|
30
|
|
|
Total assets
|
|
$
|
12,428
|
|
|
$
|
97
|
|
|
$
|
232
|
|
|
$
|
348
|
|
|
$
|
(398
|
)
|
|
$
|
70
|
|
|
$
|
(1,037
|
)
|
|
$
|
11,740
|
|
|
$
|
73
|
|
|
Total liabilities (c)
|
|
$
|
460
|
|
|
$
|
50
|
|
|
|
|
|
|
|
|
|
|
$
|
8
|
|
|
|
|
|
|
$
|
(74
|
)
|
|
$
|
444
|
|
|
$
|
34
|
|
100
Six Months Ended June 30, 2010
|
|
|
|
|
|
|
|
|
|
|
|
|
|
|
|
|
|
|
|
|
|
|
|
|
|
|
|
|
|
|
|
|
|
|
|
|
|
|
|
Total realized / unrealized
gains or losses for
the
period (a)
|
|
|
|
|
|
|
|
|
|
|
|
|
|
|
(*) Unrealized
gains or losses
on assets and
liabilities held on
Consolidated
Balance Sheet at
June 30,
2010
|
|
|
Level 3 Instruments Only
In millions
|
|
Fair Value
December 31,
2009
|
|
|
Included in
Earnings (*)
|
|
|
Included in
other
comprehensive
income
|
|
|
Purchases,
issuances,
and
settlements,
net
|
|
|
Transfers
into
Level 3
(b)
|
|
|
Transfers
out of
Level 3
(b)
|
|
|
Fair
Value
June
30,
2010
|
|
|
|
Assets
|
|
|
|
|
|
|
|
|
|
|
|
|
|
|
|
|
|
|
|
|
|
|
|
|
|
|
|
|
|
|
|
|
|
Securities available for sale
|
|
|
|
|
|
|
|
|
|
|
|
|
|
|
|
|
|
|
|
|
|
|
|
|
|
|
|
|
|
|
|
|
|
Residential mortgage-backed agency
|
|
$
|
5
|
|
|
|
|
|
|
|
|
|
|
$
|
(5
|
)
|
|
|
|
|
|
|
|
|
|
|
|
|
|
|
|
|
|
Residential mortgage-backed non-agency
|
|
|
8,302
|
|
|
$
|
(115
|
)
|
|
$
|
680
|
|
|
|
(1,230
|
)
|
|
|
|
|
|
|
(2
|
)
|
|
$
|
7,635
|
|
|
$
|
(154
|
)
|
|
Commercial mortgage-backed non-agency
|
|
|
6
|
|
|
|
|
|
|
|
|
|
|
|
|
|
|
$
|
2
|
|
|
$
|
(8
|
)
|
|
|
|
|
|
|
|
|
|
Asset-backed
|
|
|
1,254
|
|
|
|
(53
|
)
|
|
|
118
|
|
|
|
(169
|
)
|
|
|
|
|
|
|
|
|
|
|
1,150
|
|
|
|
(53
|
)
|
|
State and municipal
|
|
|
266
|
|
|
|
5
|
|
|
|
(17
|
)
|
|
|
(18
|
)
|
|
|
1
|
|
|
|
|
|
|
|
237
|
|
|
|
|
|
|
Other debt
|
|
|
53
|
|
|
|
|
|
|
|
4
|
|
|
|
(4
|
)
|
|
|
29
|
|
|
|
|
|
|
|
82
|
|
|
|
|
|
|
Corporate stocks and other
|
|
|
47
|
|
|
|
|
|
|
|
(1
|
)
|
|
|
1
|
|
|
|
|
|
|
|
|
|
|
|
47
|
|
|
|
|
|
|
Total securities available for sale
|
|
|
9,933
|
|
|
|
(163
|
)
|
|
|
784
|
|
|
|
(1,425
|
)
|
|
|
32
|
|
|
|
(10
|
)
|
|
|
9,151
|
|
|
|
(207
|
)
|
|
Financial derivatives
|
|
|
50
|
|
|
|
42
|
|
|
|
|
|
|
|
(7
|
)
|
|
|
|
|
|
|
|
|
|
|
85
|
|
|
|
76
|
|
|
Trading securities – Debt
|
|
|
89
|
|
|
|
(3
|
)
|
|
|
|
|
|
|
(13
|
)
|
|
|
|
|
|
|
|
|
|
|
73
|
|
|
|
(4
|
)
|
|
Residential mortgage servicing rights
|
|
|
1,332
|
|
|
|
(323
|
)
|
|
|
|
|
|
|
(46
|
)
|
|
|
|
|
|
|
|
|
|
|
963
|
|
|
|
(324
|
)
|
|
Commercial mortgage loans held for sale
|
|
|
1,050
|
|
|
|
22
|
|
|
|
|
|
|
|
(36
|
)
|
|
|
|
|
|
|
|
|
|
|
1,036
|
|
|
|
20
|
|
|
Equity investments
|
|
|
|
|
|
|
|
|
|
|
|
|
|
|
|
|
|
|
|
|
|
|
|
|
|
|
|
|
|
|
|
|
|
Direct investments
|
|
|
595
|
|
|
|
88
|
|
|
|
|
|
|
|
(33
|
)
|
|
|
|
|
|
|
|
|
|
|
650
|
|
|
|
73
|
|
|
Indirect investments
|
|
|
593
|
|
|
|
41
|
|
|
|
|
|
|
|
(16
|
)
|
|
|
|
|
|
|
|
|
|
|
618
|
|
|
|
33
|
|
|
Total equity investments
|
|
|
1,188
|
|
|
|
129
|
|
|
|
|
|
|
|
(49
|
)
|
|
|
|
|
|
|
|
|
|
|
1,268
|
|
|
|
106
|
|
|
Other assets
|
|
|
|
|
|
|
|
|
|
|
|
|
|
|
|
|
|
|
|
|
|
|
|
|
|
|
|
|
|
|
|
|
|
BlackRock Series C Preferred Stock
|
|
|
486
|
|
|
|
(184
|
)
|
|
|
|
|
|
|
(4
|
)
|
|
|
|
|
|
|
|
|
|
|
298
|
|
|
|
|
|
|
Other
|
|
|
23
|
|
|
|
|
|
|
|
(4
|
)
|
|
|
(12
|
)
|
|
|
|
|
|
|
|
|
|
|
7
|
|
|
|
|
|
|
Total other assets
|
|
|
509
|
|
|
|
(184
|
)
|
|
|
(4
|
)
|
|
|
(16
|
)
|
|
|
|
|
|
|
|
|
|
|
305
|
|
|
|
|
|
|
Total assets
|
|
$
|
14,151
|
|
|
$
|
(480
|
)
|
|
$
|
780
|
|
|
$
|
(1,592
|
)
|
|
$
|
32
|
|
|
$
|
(10
|
)
|
|
$
|
12,881
|
|
|
$
|
(333
|
)
|
|
Total liabilities (c)
|
|
$
|
506
|
|
|
$
|
(173
|
)
|
|
|
|
|
|
$
|
21
|
|
|
|
1
|
|
|
|
|
|
|
$
|
355
|
|
|
$
|
48
|
|
|
(a)
|
Losses for assets are bracketed while losses for liabilities are not.
|
|
(b)
|
PNC’s policy is to recognize transfers in and transfers out as of the end of the reporting period.
|
|
(c)
|
Financial derivatives.
|
Net gains (realized and unrealized) included in earnings relating to Level 3 assets and liabilities were
$47 million for the first six months of 2011 compared with net losses of $307 million for the first six months of 2010. The net losses (realized and unrealized) for the second quarter of 2011 were $55 million compared with net losses of $227 million
for the second quarter of 2010. These amounts included net unrealized gains of $39 million for the first six months of 2011 compared with net unrealized losses of $381 million for the first six months of 2010 and net unrealized losses of $30 million
and $280 million for the second quarters of 2011 and 2010, respectively. These net gains and losses were included in noninterest income on the Consolidated Income Statement. These amounts also included amortization and accretion of $55 million for
the first six months of 2011 compared with $67 million for the first six months of 2010. The second quarter amounts for 2011 and 2010 were $31 million and $35 million, respectively. The amortization and accretion amounts were included in interest
income on the Consolidated Income Statement.
During the first six months of 2011 and 2010, no material transfers of assets or liabilities
between the hierarchy levels occurred.
Nonrecurring Fair Value Changes
We may be required to measure certain other financial assets at fair value on a nonrecurring basis. These adjustments to fair value usually result from the application of lower-of-cost-or-fair value
accounting or write-downs of individual assets due to impairment. The amounts below for nonaccrual loans represent the carrying value of loans for which adjustments are primarily based on the appraised value of collateral or the net book value of
the collateral from the borrower’s most recent financial statements if no appraisal is available. If an appraisal is outdated due to changed project or market conditions, or if the net book value is utilized, management applies internal
assumptions in determining fair value. The amounts below for loans held for sale represent the carrying value of loans for which adjustments are primarily based on observable market data, management’s internal assumptions or the appraised value
of collateral. The fair value determination of the equity investment resulting in an impairment loss included below was based on observable market data for other comparable entities as adjusted for internal assumptions and unobservable inputs. The
amounts below for commercial mortgage servicing rights reflect an impairment of three strata at June 30, 2011 and at
101
December 31, 2010, respectively. The fair value of commercial mortgage servicing rights is estimated by using an internal valuation model. The model calculates the present value of estimated
future net servicing cash flows considering estimates of servicing revenue and costs, discount rates and prepayment speeds. The amounts below for long-lived assets
held for sale represent the carrying value of the asset for which adjustments are primarily based upon the most recent appraised value or, if the net book value is utilized, management applies
internal assumptions in determining fair value.
Fair Value Measurements –
Nonrecurring (a)
|
|
|
|
|
|
|
|
|
|
|
|
|
|
|
|
|
|
|
|
|
|
|
|
|
|
|
|
|
Fair Value
|
|
|
Gains (Losses)
Three months ended
|
|
|
Gains (Losses) Six
months ended
|
|
|
In millions
|
|
June 30
2011
|
|
|
December 31
2010
|
|
|
June 30
2011
|
|
|
June 30
2010
|
|
|
June 30
2011
|
|
|
June 30
2010
|
|
|
Assets
|
|
|
|
|
|
|
|
|
|
|
|
|
|
|
|
|
|
|
|
|
|
|
|
|
|
Nonaccrual loans
|
|
$
|
339
|
|
|
$
|
429
|
|
|
$
|
(42
|
)
|
|
$
|
26
|
|
|
$
|
(81
|
)
|
|
|
|
|
|
Loans held for sale
|
|
|
267
|
|
|
|
350
|
|
|
|
(18
|
)
|
|
|
(78
|
)
|
|
|
(18
|
)
|
|
$
|
(78
|
)
|
|
Equity investments (b)
|
|
|
|
|
|
|
3
|
|
|
|
|
|
|
|
|
|
|
|
|
|
|
|
|
|
|
Commercial mortgage servicing rights
|
|
|
575
|
|
|
|
644
|
|
|
|
(40
|
)
|
|
|
(14
|
)
|
|
|
(75
|
)
|
|
|
(18
|
)
|
|
Other intangible assets
|
|
|
|
|
|
|
1
|
|
|
|
|
|
|
|
|
|
|
|
|
|
|
|
|
|
|
Foreclosed and other assets
|
|
|
175
|
|
|
|
245
|
|
|
|
(22
|
)
|
|
|
(35
|
)
|
|
|
(42
|
)
|
|
|
(58
|
)
|
|
Long-lived assets held for sale
|
|
|
5
|
|
|
|
25
|
|
|
|
(1
|
)
|
|
|
(4
|
)
|
|
|
(2
|
)
|
|
|
(13
|
)
|
|
Total assets
|
|
$
|
1,361
|
|
|
$
|
1,697
|
|
|
$
|
(123
|
)
|
|
$
|
(105
|
)
|
|
$
|
(218
|
)
|
|
$
|
(167
|
)
|
|
(b)
|
Includes LIHTC and other equity investments.
|
Fair Value Option
Refer to the Fair Value Measurement section of this Note 8 regarding the fair value of commercial mortgage loans held for sale, residential mortgage loans held for sale, customer resale agreements, and
BlackRock Series C Preferred Stock.
Commercial Mortgage Loans Held for Sale
Interest income on these loans is recorded as earned and reported on the Consolidated Income Statement in other interest income. The impact on earnings of offsetting economic hedges is not reflected in
these amounts. Changes in fair value due to instrument-specific credit risk for both the first six months of 2011 and 2010 were not material.
Residential Mortgage Loans Held for Sale
Interest income on these loans is recorded as earned and reported on the Consolidated Income Statement in other
interest income. Throughout 2010 and the first six months of 2011, certain residential mortgage loans for which we elected the fair value option were subsequently reclassified to portfolio loans.
Changes in fair value due to instrument-specific credit risk for the first six months of 2011 and 2010 were not material.
Customer Resale
Agreements
Interest income on structured resale agreements is reported on the Consolidated Income Statement in other interest income.
Changes in fair value due to instrument-specific credit risk for both the first six months of 2011 and 2010 were not material.
Residential
Mortgage-Backed Agency Hybrid Securities
Interest income on securities is reported on the Consolidated Income Statement in interest
income.
The changes in fair value included in
noninterest income for items for which we elected the fair value option follow.
Fair Value Option – Changes in Fair Value
(a)
|
|
|
|
|
|
|
|
|
|
|
|
|
|
|
|
|
|
|
|
|
Gains (Losses)
Three months ended
|
|
|
Gains (Losses)
Six months ended
|
|
|
In millions
|
|
June 30
2011
|
|
|
June 30
2010
|
|
|
June 30
2011
|
|
|
June 30
2010
|
|
|
Assets
|
|
|
|
|
|
|
|
|
|
|
|
|
|
|
|
|
|
Customer resale agreements
|
|
$
|
1
|
|
|
$
|
7
|
|
|
$
|
(7
|
)
|
|
$
|
8
|
|
|
Residential mortgage-backed agency hybrid securities (b)
|
|
|
(3
|
)
|
|
|
|
|
|
|
(3
|
)
|
|
|
|
|
|
Commercial mortgage loans held for sale
|
|
|
6
|
|
|
|
13
|
|
|
|
(1
|
)
|
|
|
22
|
|
|
Residential mortgage loans held for sale
|
|
|
60
|
|
|
|
94
|
|
|
|
108
|
|
|
|
140
|
|
|
Residential mortgage loans – portfolio
|
|
|
(8
|
)
|
|
|
1
|
|
|
|
2
|
|
|
|
3
|
|
|
BlackRock Series C Preferred Stock
|
|
|
(21
|
)
|
|
|
(154
|
)
|
|
|
30
|
|
|
|
(184
|
)
|
|
(a)
|
The impact on earnings of offsetting hedged items or hedging instruments is not reflected in these amounts.
|
|
(b)
|
These residential mortgage-backed agency hybrid securities are carried as trading securities.
|
102
Fair values and aggregate unpaid principal balances of items for which we elected the fair value option
follow.
Fair Value Option – Fair Value and Principal Balances
|
|
|
|
|
|
|
|
|
|
|
|
|
|
|
In millions
|
|
Fair Value
|
|
|
Aggregate Unpaid
Principal Balance
|
|
|
Difference
|
|
|
June 30, 2011
|
|
|
|
|
|
|
|
|
|
|
|
|
|
Customer resale agreements
|
|
$
|
813
|
|
|
$
|
761
|
|
|
$
|
52
|
|
|
Residential mortgage-backed agency hybrid securities (a)
|
|
|
1,023
|
|
|
|
852
|
|
|
|
171
|
|
|
Residential mortgage loans held for sale
|
|
|
|
|
|
|
|
|
|
|
|
|
|
Performing loans
|
|
|
1,333
|
|
|
|
1,286
|
|
|
|
47
|
|
|
Loans 90 days or more past due
|
|
|
16
|
|
|
|
21
|
|
|
|
(5
|
)
|
|
Nonaccrual loans
|
|
|
2
|
|
|
|
4
|
|
|
|
(2
|
)
|
|
Total
|
|
|
1,351
|
|
|
|
1,311
|
|
|
|
40
|
|
|
Commercial mortgage loans held for sale (b)
|
|
|
|
|
|
|
|
|
|
|
|
|
|
Performing loans
|
|
|
839
|
|
|
|
981
|
|
|
|
(142
|
)
|
|
Nonaccrual loans
|
|
|
17
|
|
|
|
25
|
|
|
|
(8
|
)
|
|
Total
|
|
|
856
|
|
|
|
1,006
|
|
|
|
(150
|
)
|
|
Residential mortgage loans – portfolio
|
|
|
|
|
|
|
|
|
|
|
|
|
|
Performing loans
|
|
|
63
|
|
|
|
80
|
|
|
|
(17
|
)
|
|
Loans 90 days or more past due
|
|
|
85
|
|
|
|
92
|
|
|
|
(7
|
)
|
|
Nonaccrual loans
|
|
|
91
|
|
|
|
196
|
|
|
|
(105
|
)
|
|
Total
|
|
$
|
239
|
|
|
$
|
368
|
|
|
$
|
(129
|
)
|
|
December 31, 2010
|
|
|
|
|
|
|
|
|
|
|
|
|
|
Customer resale agreements
|
|
$
|
866
|
|
|
$
|
806
|
|
|
$
|
60
|
|
|
Residential mortgage loans held for sale
|
|
|
|
|
|
|
|
|
|
|
|
|
|
Performing loans
|
|
|
1,844
|
|
|
|
1,839
|
|
|
|
5
|
|
|
Loans 90 days or more past due
|
|
|
33
|
|
|
|
41
|
|
|
|
(8
|
)
|
|
Nonaccrual loans
|
|
|
1
|
|
|
|
2
|
|
|
|
(1
|
)
|
|
Total
|
|
|
1,878
|
|
|
|
1,882
|
|
|
|
(4
|
)
|
|
Commercial mortgage loans held for sale (b)
|
|
|
|
|
|
|
|
|
|
|
|
|
|
Performing loans
|
|
|
847
|
|
|
|
990
|
|
|
|
(143
|
)
|
|
Nonaccrual loans
|
|
|
30
|
|
|
|
49
|
|
|
|
(19
|
)
|
|
Total
|
|
|
877
|
|
|
|
1,039
|
|
|
|
(162
|
)
|
|
Residential mortgage loans – portfolio
|
|
|
|
|
|
|
|
|
|
|
|
|
|
Performing loans
|
|
|
36
|
|
|
|
44
|
|
|
|
(8
|
)
|
|
Loans 90 days or more past due
|
|
|
64
|
|
|
|
67
|
|
|
|
(3
|
)
|
|
Nonaccrual loans
|
|
|
16
|
|
|
|
31
|
|
|
|
(15
|
)
|
|
Total
|
|
$
|
116
|
|
|
$
|
142
|
|
|
$
|
(26
|
)
|
|
(a)
|
These residential mortgage-backed agency hybrid securities are carried as trading securities.
|
|
(b)
|
There were no loans 90 days or more past due within this category at June 30, 2011 or December 31, 2010.
|
103
A
DDITIONAL
F
AIR
V
ALUE
I
NFORMATION
R
ELATED
TO
F
INANCIAL
I
NSTRUMENTS
|
|
|
|
|
|
|
|
|
|
|
|
|
|
|
|
|
|
|
|
|
June 30, 2011
|
|
|
December 31, 2010
|
|
|
In millions
|
|
Carrying
Amount
|
|
|
Fair
Value
|
|
|
Carrying
Amount
|
|
|
Fair
Value
|
|
|
Assets
|
|
|
|
|
|
|
|
|
|
|
|
|
|
|
|
|
|
Cash and short-term assets
|
|
$
|
11,829
|
|
|
$
|
11,829
|
|
|
$
|
9,711
|
|
|
$
|
9,711
|
|
|
Trading securities
|
|
|
2,075
|
|
|
|
2,075
|
|
|
|
1,826
|
|
|
|
1,826
|
|
|
Investment securities
|
|
|
59,414
|
|
|
|
59,577
|
|
|
|
64,262
|
|
|
|
64,487
|
|
|
Loans held for sale
|
|
|
2,679
|
|
|
|
2,683
|
|
|
|
3,492
|
|
|
|
3,492
|
|
|
Net loans (excludes leases)
|
|
|
139,484
|
|
|
|
142,563
|
|
|
|
139,316
|
|
|
|
141,431
|
|
|
Other assets
|
|
|
4,770
|
|
|
|
4,770
|
|
|
|
4,664
|
|
|
|
4,664
|
|
|
Mortgage servicing rights
|
|
|
1,588
|
|
|
|
1,594
|
|
|
|
1,698
|
|
|
|
1,707
|
|
|
Financial derivatives
|
|
|
|
|
|
|
|
|
|
|
|
|
|
|
|
|
|
Designated as hedging instruments under GAAP
|
|
|
1,359
|
|
|
|
1,359
|
|
|
|
1,255
|
|
|
|
1,255
|
|
|
Not designated as hedging instruments under GAAP
|
|
|
4,496
|
|
|
|
4,496
|
|
|
|
4,502
|
|
|
|
4,502
|
|
|
Liabilities
|
|
|
|
|
|
|
|
|
|
|
|
|
|
|
|
|
|
Demand, savings and money market deposits
|
|
|
145,358
|
|
|
|
145,358
|
|
|
|
141,990
|
|
|
|
141,990
|
|
|
Time deposits
|
|
|
36,534
|
|
|
|
36,870
|
|
|
|
41,400
|
|
|
|
41,825
|
|
|
Borrowed funds
|
|
|
35,457
|
|
|
|
37,617
|
|
|
|
39,821
|
|
|
|
41,273
|
|
|
Financial derivatives
|
|
|
|
|
|
|
|
|
|
|
|
|
|
|
|
|
|
Designated as hedging instruments under GAAP
|
|
|
48
|
|
|
|
48
|
|
|
|
85
|
|
|
|
85
|
|
|
Not designated as hedging instruments under GAAP
|
|
|
4,815
|
|
|
|
4,815
|
|
|
|
4,850
|
|
|
|
4,850
|
|
|
Unfunded loan commitments and letters of credit
|
|
|
185
|
|
|
|
185
|
|
|
|
173
|
|
|
|
173
|
|
The aggregate fair values in the table above do not represent the total market value of PNC’s assets
and liabilities as the table excludes the following:
|
|
•
|
|
real and personal property,
|
|
|
•
|
|
loan customer relationships,
|
|
|
•
|
|
deposit customer intangibles,
|
|
|
•
|
|
retail branch networks,
|
|
|
•
|
|
fee-based businesses, such as asset management and brokerage, and
|
|
|
•
|
|
trademarks and brand names.
|
We used the following methods and assumptions to estimate fair value amounts for financial instruments.
General
For short-term financial
instruments realizable in three months or less, the carrying amount reported on our Consolidated Balance Sheet approximates fair value. Unless otherwise stated, the rates used in discounted cash flow analyses are based on market yield curves.
Cash and Short-Term Assets
The carrying amounts reported on our Consolidated Balance Sheet for cash and short-term investments approximate fair values primarily due to their short-term nature. For purposes of this disclosure only,
short-term assets include the following:
|
|
•
|
|
interest-earning deposits with banks,
|
|
|
•
|
|
federal funds sold and resale agreements,
|
|
|
•
|
|
customers’ acceptances, and
|
|
|
•
|
|
accrued interest receivable.
|
Securities
Securities include both the investment securities (comprised of available for sale and held to maturity securities) and trading portfolios. We use prices obtained from pricing services, dealer quotes or
recent trades to determine the fair value of securities. For 56% of our positions, we use prices obtained from pricing services provided by third party vendors. For an additional 10% of our positions, we use prices obtained from the pricing services
as the primary input into the valuation process. One of the vendors’ prices is set with reference to market activity for highly liquid assets such as agency mortgage-backed securities, and matrix pricing for other assets, such as CMBS and
asset-backed securities. Another vendor primarily uses pricing models considering adjustments for ratings, spreads, matrix pricing and prepayments for the instruments we value using this service, such as non-agency residential mortgage-backed
securities, agency adjustable rate mortgage securities, agency CMOs and municipal bonds. Management uses various methods and techniques to corroborate prices obtained from pricing services and dealers, including reference to other dealers’
quotes, by reviewing valuations of comparable instruments, or by comparison to internal valuations. Dealer quotes received are typically non-binding.
N
ET
L
OANS
A
ND
L
OANS
H
ELD
F
OR
S
ALE
Fair values are estimated based on the discounted value of expected net cash flows incorporating assumptions about prepayment rates, net credit losses and
servicing fees. For purchased impaired loans, fair value is assumed to equal PNC’s carrying value, which represents the present value of expected future principal and interest cash flows, as adjusted for any ALLL recorded for these loans. See
Note 6 Purchased Impaired Loans for additional information. For revolving
104
home equity loans and commercial credit lines, this fair value does not include any amount for new loans or the related fees that will be generated from the existing customer relationships.
Non-accrual loans are valued at their estimated recovery value. Also refer to the Fair Value Measurement and Fair Value Option sections of this Note 8 regarding the fair value of commercial and residential mortgage loans held for sale. Loans are
presented net of the ALLL and do not include future accretable discounts related to purchased impaired loans.
O
THER
A
SSETS
Other assets as shown in the accompanying table include the following:
|
|
•
|
|
equity investments carried at cost and fair value, and
|
|
|
•
|
|
BlackRock Series C Preferred Stock.
|
Investments accounted for under the equity method, including our investment in BlackRock, are not included in the accompanying table.
The carrying amounts of private equity investments are recorded at fair value. The valuation procedures applied to direct investments and affiliated partnership interests include techniques such as
multiples of adjusted earnings of the entity, independent appraisals, anticipated financing and sales transactions with third parties, or the pricing used to value the entity in a recent financing transaction. We value indirect investments in
private equity funds based on net asset value as provided in the financial statements that we receive from their managers. Due to the time lag in our receipt of the financial information and based on a review of investments and valuation techniques
applied, adjustments to the manager-provided value are made when available recent investment portfolio company or market information indicates a significant change in value from that provided by the general partner.
The aggregate carrying value of our investments that are carried at cost and FHLB and FRB stock was $2.4 billion at June 30, 2011 and $2.4 billion
as of December 31, 2010, both of which approximate fair value at each date.
M
ORTGAGE
S
ERVICING
A
SSETS
Fair value is based on the present value of the estimated future cash flows, incorporating assumptions as to
prepayment
speeds, discount rates, escrow balances, interest rates, cost to service and other factors.
The key valuation assumptions for commercial and residential mortgage loan servicing assets at June 30, 2011 and December 31, 2010 are included in Note 9 Goodwill and Other Intangible Assets.
C
USTOMER
R
ESALE
A
GREEMENTS
Refer to the Fair Value Measurement section of this Note 8 regarding the fair value of customer resale agreements.
D
EPOSITS
The
carrying amounts of noninterest-bearing demand and interest-bearing money market and savings deposits approximate fair values. For time deposits, which include foreign deposits, fair values are estimated based on the discounted value of expected net
cash flows assuming current interest rates.
B
ORROWED
F
UNDS
The carrying amounts of Federal funds purchased, commercial paper, repurchase agreements, proprietary trading short positions, cash collateral, other
short-term borrowings, acceptances outstanding and accrued interest payable are considered to be their fair value because of their short-term nature. For all other borrowed funds, fair values are estimated primarily based on dealer quotes or
discounted cash flow analysis.
U
NFUNDED
L
OAN
C
OMMITMENTS
A
ND
L
ETTERS
O
F
C
REDIT
The fair value of unfunded loan commitments and letters of credit is
determined from a market participant’s view including the impact of changes in interest rates, credit and other factors. Because the interest rate on substantially all unfunded loan commitments and letters of credit varies with changes in
market rates, these instruments are subject to little fluctuation in fair value due to changes in interest rates. We establish a liability on these facilities related to their creditworthiness.
F
INANCIAL
D
ERIVATIVES
Refer to the Fair Value Measurement section of this Note 8 regarding the fair value of financial derivatives.
105
N
OTE
9 G
OODWILL
AND
O
THER
I
NTANGIBLE
A
SSETS
Changes in goodwill by business segment during the first six months of 2011 follow:
Changes in Goodwill by Business Segment (a)
|
|
|
|
|
|
|
|
|
|
|
|
|
|
|
|
|
|
|
|
|
|
|
|
|
|
|
In millions
|
|
Retail
Banking
|
|
|
Corporate &
Institutional
Banking
|
|
|
Asset
Management
Group
|
|
|
BlackRock
|
|
|
Residential
Mortgage
Banking
|
|
|
Total
|
|
|
December 31, 2010
|
|
$
|
5,302
|
|
|
$
|
2,728
|
|
|
$
|
62
|
|
|
$
|
14
|
|
|
$
|
43
|
|
|
$
|
8,149
|
|
|
BankAtlantic branch acquisition
|
|
|
35
|
|
|
|
6
|
|
|
|
|
|
|
|
|
|
|
|
|
|
|
|
41
|
|
|
Other
|
|
|
(2
|
)
|
|
|
(2
|
)
|
|
|
(1
|
)
|
|
|
(3
|
)
|
|
|
|
|
|
|
(8
|
)
|
|
June 30, 2011
|
|
$
|
5,335
|
|
|
$
|
2,732
|
|
|
$
|
61
|
|
|
$
|
11
|
|
|
$
|
43
|
|
|
$
|
8,182
|
|
|
(a)
|
The Distressed Assets Portfolio business segment does not have any goodwill allocated to it.
|
Changes in goodwill and other intangible assets during the first six months of 2011 follow:
Summary of Changes in Goodwill and Other Intangible Assets
|
|
|
|
|
|
|
|
|
|
|
|
|
|
|
In millions
|
|
Goodwill
|
|
|
Customer-
Related
|
|
|
Servicing
Rights
|
|
|
December 31, 2010
|
|
$
|
8,149
|
|
|
$
|
903
|
|
|
$
|
1,701
|
|
|
Additions/adjustments:
|
|
|
|
|
|
|
|
|
|
|
|
|
|
BankAtlantic branch acquisition
|
|
|
41
|
|
|
|
1
|
|
|
|
|
|
|
Other
|
|
|
(8
|
)
|
|
|
|
|
|
|
|
|
|
Mortgage and other loan servicing rights
|
|
|
|
|
|
|
|
|
|
|
43
|
|
|
Impairment charge
|
|
|
|
|
|
|
|
|
|
|
(75
|
)
|
|
Amortization
|
|
|
|
|
|
|
(82
|
)
|
|
|
(79
|
)
|
|
June 30, 2011
|
|
$
|
8,182
|
|
|
$
|
822
|
|
|
$
|
1,590
|
|
Assets and liabilities of acquired entities are recorded at estimated fair value as of the acquisition date and are
subject to refinement as information relative to the fair values at the date of acquisition becomes available.
The gross carrying amount,
accumulated amortization and net carrying amount of other intangible assets by major category consisted of the following:
Other
Intangible Assets
|
|
|
|
|
|
|
|
|
|
|
In millions
|
|
June 30
2011
|
|
|
December 31
2010
|
|
|
Customer-related and other intangibles
|
|
|
|
|
|
|
|
|
|
Gross carrying amount
|
|
$
|
1,524
|
|
|
$
|
1,524
|
|
|
Accumulated amortization
|
|
|
(702
|
)
|
|
|
(621
|
)
|
|
Net carrying amount
|
|
$
|
822
|
|
|
$
|
903
|
|
|
Mortgage and other loan servicing rights
|
|
|
|
|
|
|
|
|
|
Gross carrying amount
|
|
$
|
2,317
|
|
|
$
|
2,293
|
|
|
Valuation allowance
|
|
|
(115
|
)
|
|
|
(40
|
)
|
|
Accumulated amortization
|
|
|
(612
|
)
|
|
|
(552
|
)
|
|
Net carrying amount
|
|
$
|
1,590
|
|
|
$
|
1,701
|
|
|
Total
|
|
$
|
2,412
|
|
|
$
|
2,604
|
|
While certain of our other intangible assets have finite lives and are amortized primarily on a straight-line basis,
certain core deposit intangibles are amortized on an accelerated basis.
For customer-related and other intangibles, the estimated remaining useful lives range from 1 year to 10
years, with a weighted-average remaining useful life of 9 years.
Amortization expense on existing intangible assets, net of impairment
reversal (charge) follows:
Amortization Expense on Existing Intangible Assets, Net (a)
|
|
|
|
|
|
|
In millions
|
|
|
|
|
Six months ended June 30, 2011
|
|
$
|
236
|
|
|
Six months ended June 30, 2010
|
|
|
160
|
|
|
Remainder of 2011
|
|
|
129
|
|
|
2012
|
|
|
232
|
|
|
2013
|
|
|
203
|
|
|
2014
|
|
|
211
|
|
|
2015
|
|
|
194
|
|
|
2016
|
|
|
164
|
|
|
(a)
|
Includes the impact of impairment charges (reversals).
|
Changes in commercial mortgage servicing rights follow:
Commercial Mortgage Servicing
Rights
|
|
|
|
|
|
|
|
|
|
|
In millions
|
|
2011
|
|
|
2010
|
|
|
January 1
|
|
$
|
665
|
|
|
$
|
921
|
|
|
Additions (a)
|
|
|
80
|
|
|
|
48
|
|
|
Sale of servicing rights (b)
|
|
|
|
|
|
|
(192
|
)
|
|
Impairment (charge) reversal
|
|
|
(75
|
)
|
|
|
(18
|
)
|
|
Amortization expense
|
|
|
(78
|
)
|
|
|
(37
|
)
|
|
June 30
|
|
$
|
592
|
|
|
$
|
722
|
|
|
(a)
|
Additions for the first six months of 2011 included $25 million from loans sold with servicing retained and $55 million from purchases of servicing rights from third
parties. Comparable amounts for the first six months of 2010 were $26 million and $22 million.
|
|
(b)
|
Reflects the sale of a duplicative agency servicing operation in 2010.
|
We recognize as an other intangible asset the right to service mortgage loans for others. Commercial mortgage servicing rights are purchased in the open market and originated when loans are sold with
servicing retained. Commercial mortgage servicing rights are initially recorded at fair value. These rights are subsequently measured using the amortization
106
method. Accordingly, the commercial mortgage servicing rights are substantially amortized in proportion to and over the period of estimated net servicing income over a period of 5 to 10 years.
Commercial mortgage servicing rights are periodically evaluated for impairment. For purposes of impairment, the commercial mortgage servicing
rights are stratified based on asset type, which characterizes the predominant risk of the underlying financial asset. If the carrying amount of any individual stratum exceeds its fair value, a valuation reserve is established with a corresponding
charge to Corporate Services on our Consolidated Income Statement.
The fair value of commercial mortgage servicing rights is estimated by
using an internal valuation model. The model calculates the present value of estimated future net servicing cash flows considering estimates of servicing revenue and costs, discount rates and prepayment speeds.
Changes in the residential mortgage servicing rights follow:
Residential Mortgage Servicing Rights
|
|
|
|
|
|
|
|
|
|
|
In millions
|
|
2011
|
|
|
2010
|
|
|
January 1
|
|
$
|
1,033
|
|
|
$
|
1,332
|
|
|
Additions:
|
|
|
|
|
|
|
|
|
|
From loans sold with servicing retained
|
|
|
70
|
|
|
|
42
|
|
|
Purchases
|
|
|
48
|
|
|
|
|
|
|
Changes in fair value due to:
|
|
|
|
|
|
|
|
|
|
Time and payoffs (a)
|
|
|
(84
|
)
|
|
|
(88
|
)
|
|
Other (b)
|
|
|
(71
|
)
|
|
|
(323
|
)
|
|
June 30
|
|
$
|
996
|
|
|
$
|
963
|
|
|
Unpaid principal balance of loans serviced for others at June 30
|
|
$
|
124,765
|
|
|
$
|
137,399
|
|
|
(a)
|
Represents decrease in mortgage servicing rights value due to passage of time, including the impact from both regularly scheduled loan principal payments and loans that
were paid down or paid off during the period.
|
|
(b)
|
Represents mortgage servicing rights value changes resulting primarily from market-driven changes in interest rates.
|
We recognize mortgage servicing right assets on residential real estate loans when we retain the obligation to service these loans upon sale and the
servicing fee is more than adequate compensation. Mortgage servicing rights are subject to declines in value principally from actual or expected prepayment of the underlying loans and defaults. We manage this risk by economically hedging the fair
value of mortgage servicing rights with securities and derivative instruments which are expected to increase in value when the value of mortgage servicing rights declines.
The fair value of these MSRs is estimated by using a cash flow valuation model which calculates the present value of
estimated future net servicing cash flows, taking into consideration actual and expected mortgage loan prepayment rates, discount rates, servicing costs, and other economic factors which are
determined based on current market conditions.
The fair value of residential and commercial MSRs and significant inputs to the valuation
model as of June 30, 2011 are shown in the tables below. The expected and actual rates of mortgage loan prepayments are significant factors driving the fair value. Management uses a third party model to estimate future residential mortgage loan
prepayments and internal proprietary models to estimate future commercial mortgage loan prepayments. These models have been refined based on historical performance of PNC’s managed portfolio, as adjusted for current market conditions. Future
interest rates are another important factor in the valuation of MSRs. Management utilizes market implied forward interest rates to estimate the future direction of mortgage and discount rates. Changes in the shape and slope of the forward curve in
future periods may result in volatility in the fair value estimate.
A sensitivity analysis of the hypothetical effect on the fair value of
MSRs to adverse changes in key assumptions is presented below. These sensitivities do not include the impact of the related hedging activities. Changes in fair value generally cannot be extrapolated because the relationship of the change in the
assumption to the change in fair value may not be linear. Also, the effect of a variation in a particular assumption on the fair value of the MSRs is calculated independently without changing any other assumption. In reality, changes in one factor
may result in changes in another (for example, changes in mortgage interest rates, which drive changes in prepayment rate estimates, could result in changes in the interest rate spread), which could either magnify or counteract the sensitivities.
The following tables set forth the fair value of commercial and residential MSRs and the sensitivity analysis of the hypothetical effect on
the fair value of MSRs to immediate adverse changes of 10% and 20% in those assumptions:
Commercial Mortgage Loan Servicing Assets
– Key Valuation Assumptions
|
|
|
|
|
|
|
|
|
|
|
Dollars in millions
|
|
June 30,
2011
|
|
|
December 31,
2010
|
|
|
Fair value
|
|
$
|
598
|
|
|
$
|
674
|
|
|
Weighted-average life (years)
|
|
|
6.2
|
|
|
|
6.3
|
|
|
Weighted-average constant prepayment rate
|
|
|
13%-26
|
%
|
|
|
10%-24
|
%
|
|
Decline in fair value from 10% adverse change
|
|
$
|
8
|
|
|
$
|
8
|
|
|
Decline in fair value from 20% adverse change
|
|
$
|
14
|
|
|
$
|
16
|
|
|
Effective discount rate
|
|
|
6%-8
|
%
|
|
|
7%-9
|
%
|
|
Decline in fair value from 10% adverse change
|
|
$
|
11
|
|
|
$
|
13
|
|
|
Decline in fair value from 20% adverse change
|
|
$
|
23
|
|
|
$
|
26
|
|
107
Residential Mortgage Loan Servicing Assets – Key Valuation Assumptions
|
|
|
|
|
|
|
|
|
|
|
Dollars in millions
|
|
June 30,
2011
|
|
|
December 31,
2010
|
|
|
Fair value
|
|
$
|
996
|
|
|
$
|
1,033
|
|
|
Weighted-average life (years)
|
|
|
6.2
|
|
|
|
5.8
|
|
|
Weighted-average constant prepayment rate
|
|
|
11.40
|
%
|
|
|
12.61
|
%
|
|
Decline in fair value from 10% adverse change
|
|
$
|
45
|
|
|
$
|
41
|
|
|
Decline in fair value from 20% adverse change
|
|
$
|
87
|
|
|
$
|
86
|
|
|
Spread over forward interest rate swap rates
|
|
|
11.71
|
%
|
|
|
12.18
|
%
|
|
Decline in fair value from 10% adverse change
|
|
$
|
43
|
|
|
$
|
43
|
|
|
Decline in fair value from 20% adverse change
|
|
$
|
83
|
|
|
$
|
83
|
|
Revenue from mortgage and other loan servicing comprised of contractually specified servicing fees, late fees, and
ancillary fees follows:
Revenue from Mortgage and Other Loan Servicing
|
|
|
|
|
|
|
|
|
|
|
In millions
|
|
2011
|
|
|
2010
|
|
|
Six months ended June 30
|
|
$
|
318
|
|
|
$
|
356
|
|
|
Three months ended June 30
|
|
|
159
|
|
|
|
174
|
|
We also generate servicing revenue from fee-based activities provided to others.
Revenue from commercial mortgage servicing rights, residential mortgage servicing rights and other loan servicing are reported on our Consolidated Income
Statement in the line items Corporate services, Residential mortgage, and Consumer services, respectively.
N
OTE
10 C
APITAL
S
ECURITIES
OF
S
UBSIDIARY
T
RUSTS
AND
P
ERPETUAL
T
RUST
S
ECURITIES
C
APITAL
S
ECURITIES
OF
S
UBSIDIARY
T
RUSTS
Our capital securities of subsidiary trusts are described in Note 13 Capital Securities of Subsidiary Trusts and Perpetual Trust
Securities in our 2010 Form 10-K. All of these Trusts are wholly owned finance subsidiaries of PNC. In the event of certain changes or amendments to regulatory requirements or federal tax rules, the capital securities are redeemable. The financial
statements of the Trusts are not included in PNC’s consolidated financial statements in accordance with GAAP.
The obligations of the
respective parent of each Trust, when taken collectively, are the equivalent of a full and
unconditional guarantee of the obligations of such Trust under the terms of the capital securities. Such guarantee is subordinate in right of payment in the same manner as other junior
subordinated debt. There are certain restrictions on PNC’s overall ability to obtain funds from its subsidiaries. For additional disclosure on these funding restrictions, including an explanation of dividend and intercompany loan limitations,
see Note 21 Regulatory Matters in our 2010 Form 10-K.
PNC is also subject to restrictions on dividends and other provisions potentially
imposed under the Exchange Agreements with Trust II and Trust III, as described in Note 13 in our 2010 Form 10-K in the Perpetual Trust Securities section, and to other provisions similar to or in some ways more restrictive than those potentially
imposed under those agreements.
P
ERPETUAL
T
RUST
S
ECURITIES
Our perpetual trust securities are described in Note 13 in our 2010 Form 10-K. Our 2010 Form 10-K also includes additional information regarding the Trust
I and Trust II Securities, including descriptions of replacement capital and dividend restriction covenants. The Trust III Securities include dividend restriction covenants similar to those described for Trust II Securities.
N
OTE
11 C
ERTAIN
E
MPLOYEE
B
ENEFIT
A
ND
S
TOCK
-B
ASED
C
OMPENSATION
P
LANS
P
ENSION
A
ND
P
OSTRETIREMENT
P
LANS
As described in Note 14 Employee Benefit Plans in our 2010 Form 10-K, we have a noncontributory, qualified defined benefit pension plan covering eligible
employees. Benefits are determined using a cash balance formula where earnings credits are a percentage of eligible compensation. Pension contributions are based on an actuarially determined amount necessary to fund total benefits payable to plan
participants.
We also maintain nonqualified supplemental retirement plans for certain employees and provide certain health care and life
insurance benefits for qualifying retired employees (postretirement benefits) through various plans. The nonqualified pension and postretirement benefit plans are unfunded. The Company reserves the right to terminate or make plan changes at any
time.
108
The components of our net periodic pension and post-retirement benefit cost for the first six months of
2011 and 2010 were as follows:
Net Periodic Pension and Postretirement Benefits Costs
|
|
|
|
|
|
|
|
|
|
|
|
|
|
|
|
|
|
|
|
|
|
|
|
|
|
|
|
|
Qualified
Pension Plan
|
|
|
Nonqualified
Retirement
Plans
|
|
|
Postretirement
Benefits
|
|
|
Three months ended
June 30
In millions
|
|
2011
|
|
|
2010
|
|
|
2011
|
|
|
2010
|
|
|
2011
|
|
|
2010
|
|
|
Net periodic cost consists of:
|
|
|
|
|
|
|
|
|
|
|
|
|
|
|
|
|
|
|
|
|
|
|
|
|
|
Service cost
|
|
$
|
21
|
|
|
$
|
28
|
|
|
$
|
1
|
|
|
|
|
|
|
$
|
3
|
|
|
$
|
1
|
|
|
Interest cost
|
|
|
49
|
|
|
|
50
|
|
|
|
4
|
|
|
$
|
4
|
|
|
|
4
|
|
|
|
5
|
|
|
Expected return on plan assets
|
|
|
(74
|
)
|
|
|
(71
|
)
|
|
|
|
|
|
|
|
|
|
|
|
|
|
|
|
|
|
Amortization of prior service cost
|
|
|
(2
|
)
|
|
|
(2
|
)
|
|
|
|
|
|
|
|
|
|
|
(1
|
)
|
|
|
|
|
|
Amortization of actuarial losses
|
|
|
5
|
|
|
|
8
|
|
|
|
1
|
|
|
|
1
|
|
|
|
|
|
|
|
|
|
|
Net periodic cost (benefit)
|
|
$
|
(1
|
)
|
|
$
|
13
|
|
|
$
|
6
|
|
|
$
|
5
|
|
|
$
|
6
|
|
|
$
|
6
|
|
|
|
|
|
|
|
|
|
|
|
|
|
|
|
|
|
|
|
|
|
|
|
|
|
|
|
|
|
|
Qualified Pension
Plan
|
|
|
Nonqualified
Retirement
Plans
|
|
|
Postretirement
Benefits
|
|
|
Six months ended
June 30
In millions
|
|
2011
|
|
|
2010
|
|
|
2011
|
|
|
2010
|
|
|
2011
|
|
|
2010
|
|
|
Net periodic cost consists of:
|
|
|
|
|
|
|
|
|
|
|
|
|
|
|
|
|
|
|
|
|
|
|
|
|
|
Service cost
|
|
$
|
47
|
|
|
$
|
51
|
|
|
$
|
2
|
|
|
$
|
1
|
|
|
$
|
4
|
|
|
$
|
2
|
|
|
Interest cost
|
|
|
98
|
|
|
|
102
|
|
|
|
7
|
|
|
|
7
|
|
|
|
9
|
|
|
|
10
|
|
|
Expected return on plan assets
|
|
|
(149
|
)
|
|
|
(143
|
)
|
|
|
|
|
|
|
|
|
|
|
(1
|
)
|
|
|
|
|
|
Amortization of prior service cost
|
|
|
(3
|
)
|
|
|
(4
|
)
|
|
|
|
|
|
|
|
|
|
|
|
|
|
|
(1
|
)
|
|
Amortization of actuarial losses
|
|
|
9
|
|
|
|
17
|
|
|
|
2
|
|
|
|
2
|
|
|
|
|
|
|
|
|
|
|
Net periodic cost (benefit)
|
|
$
|
2
|
|
|
$
|
23
|
|
|
$
|
11
|
|
|
$
|
10
|
|
|
$
|
12
|
|
|
$
|
11
|
|
S
TOCK
-B
ASED
C
OMPENSATION
P
LANS
As more fully described in Note 15 Stock-Based Compensation Plans in our 2010 Form 10-K, we have
long-
term incentive award plans (Incentive Plans) that provide for the granting of incentive stock options, nonqualified stock options, stock appreciation rights, incentive shares/performance units,
restricted stock, restricted share units, other share-based awards and dollar-denominated awards to executives and, other than incentive stock options, to non-employee directors. Certain Incentive Plan awards may be paid in stock, cash or a
combination of stock and cash. We typically grant a substantial portion of our stock-based compensation awards during the first quarter of the year. As of June 30, 2011, no stock appreciation rights were outstanding.
Total compensation expense recognized related to all share-based payment arrangements during the first six months of 2011 and 2010 was $53 million and
$48 million, respectively.
N
ONQUALIFIED
S
TOCK
O
PTIONS
Options are granted at exercise prices not less than the market value of common stock on the grant date. Generally, options become exercisable in
installments after the grant date. No option may be exercisable after 10 years from its grant date. Payment of the option exercise price may be in cash or shares of common stock at market value on the exercise date. The exercise price may be paid in
previously owned shares.
For purposes of computing stock option expense, we estimated the fair value of stock options primarily by using the
Black-Scholes option-pricing model. Option pricing models require the use of numerous assumptions, many of which are very subjective.
Option Pricing Assumptions
|
|
|
|
|
|
|
|
|
|
|
Weighted-average for the six months ended
June 30
|
|
2011
|
|
|
2010
|
|
|
Risk-free interest rate
|
|
|
2.8
|
%
|
|
|
2.9
|
%
|
|
Dividend yield
|
|
|
0.6
|
|
|
|
0.7
|
|
|
Volatility
|
|
|
34.7
|
|
|
|
32.7
|
|
|
Expected life
|
|
|
5.9 yrs.
|
|
|
|
6.0 yrs.
|
|
|
Grant-date fair value
|
|
$
|
22.82
|
|
|
$
|
19.58
|
|
109
Stock Option Rollforward
|
|
|
|
|
|
|
|
|
|
|
|
|
|
|
|
|
|
|
|
|
|
|
|
|
|
|
|
|
PNC
|
|
|
PNC
Options
Converted From
National City
Options
|
|
|
Total
|
|
|
In thousands, except weighted-average data
|
|
Shares
|
|
|
Weighted-
Average
Exercise
Price
|
|
|
Shares
|
|
|
Weighted-
Average
Exercise
Price
|
|
|
Shares
|
|
|
Weighted-
Average
Exercise
Price
|
|
|
Outstanding at December 31, 2010
|
|
|
19,825
|
|
|
$
|
56.36
|
|
|
|
1,214
|
|
|
$
|
678.09
|
|
|
|
21,039
|
|
|
$
|
92.25
|
|
|
Granted
|
|
|
833
|
|
|
|
64.04
|
|
|
|
|
|
|
|
|
|
|
|
833
|
|
|
|
64.04
|
|
|
Exercised
|
|
|
(151
|
)
|
|
|
46.02
|
|
|
|
|
|
|
|
|
|
|
|
(151
|
)
|
|
|
46.02
|
|
|
Cancelled
|
|
|
(2,331
|
)
|
|
|
74.02
|
|
|
|
(60
|
)
|
|
|
366.67
|
|
|
|
(2,391
|
)
|
|
|
81.37
|
|
|
Outstanding at June 30, 2011
|
|
|
18,176
|
|
|
$
|
54.53
|
|
|
|
1,154
|
|
|
$
|
694.28
|
|
|
|
19,330
|
|
|
$
|
92.74
|
|
|
Exercisable at June 30, 2011
|
|
|
11,950
|
|
|
$
|
57.79
|
|
|
|
1,154
|
|
|
$
|
694.28
|
|
|
|
13,104
|
|
|
$
|
113.86
|
|
During the first six months of 2011, we issued 146,462 shares from treasury stock in connection with stock
option exercise activity. As with past exercise activity, we currently intend to utilize treasury stock primarily for any future stock option exercises.
I
NCENTIVE
/P
ERFORMANCE
U
NIT
S
HARE
A
WARDS
AND
R
ESTRICTED
S
TOCK
/U
NIT
A
WARDS
The fair value of nonvested incentive/performance unit share awards and
restricted stock/unit awards is initially determined based on prices not less than the market value of our common stock price on the date of grant. The value of certain incentive/performance unit share awards are subsequently remeasured based on the
achievement of one or more financial and other performance goals over a three-year period. The Personnel and Compensation Committee of the Board of Directors approves the final award payout with respect to incentive/performance unit share awards.
Restricted stock/unit awards
have various vesting periods generally ranging from 36 months to 60 months.
Beginning
in 2011, we incorporated two changes to certain awards under our existing long-term incentive compensation programs. First, for certain grants of incentive performance units, the future payout amount will be subject to a negative annual adjustment
if PNC fails to meet certain risk-related performance metrics. This adjustment is in addition to the existing financial performance metrics relative to our peers. These grants have a three-year performance period and are payable in either stock or a
combination of stock and cash. Second, performance-based restricted share units (performance RSUs) were granted in 2011 to certain of our executives in lieu of stock options. These performance RSUs (which are payable solely in stock) have a service
condition, an internal risk-related performance condition, and an external market condition. Satisfaction of the performance condition is based on four independent one-year performance periods.
Nonvested Incentive/Performance
Unit Share Awards and Restricted Stock/Unit Awards – Rollforward
|
|
|
|
|
|
|
|
|
|
|
|
|
|
|
|
|
|
|
Shares in thousands
|
|
Nonvested
Incentive/
Performance
Unit Shares
|
|
|
Weighted-
Average
Grant Date
Fair Value
|
|
|
Nonvested
Restricted
Stock/
Unit
Shares
|
|
|
Weighted-
Average
Grant Date
Fair Value
|
|
|
December 31, 2010
|
|
|
363
|
|
|
$
|
56.40
|
|
|
|
2,250
|
|
|
$
|
49.95
|
|
|
Granted
|
|
|
623
|
|
|
|
64.21
|
|
|
|
909
|
|
|
|
63.98
|
|
|
Vested/Released
|
|
|
(156
|
)
|
|
|
59.54
|
|
|
|
(416
|
)
|
|
|
58.57
|
|
|
Forfeited
|
|
|
|
|
|
|
|
|
|
|
(60
|
)
|
|
|
49.67
|
|
|
June 30, 2011
|
|
|
830
|
|
|
$
|
61.68
|
|
|
|
2,683
|
|
|
$
|
53.37
|
|
In the chart above, the unit shares and related weighted-average grant date fair value of the
incentive/performance awards exclude the effect of dividends on the underlying shares, as those dividends will be paid in cash.
At
June 30, 2011, there was $77 million of unrecognized deferred compensation expense related to nonvested share-based compensation arrangements granted under the Incentive Plans. This cost is expected to be recognized as expense over a period of
no longer than five years.
L
IABILITY
A
WARDS
Beginning in 2008, we granted cash-payable restricted share units to certain executives. The grants were made primarily as part of an annual bonus
incentive deferral plan. While there are time-based and service-related vesting criteria, there are no market or performance criteria associated with these awards. Compensation expense recognized related to these awards was recorded in prior periods
as part of annual cash bonus criteria. As of June 30, 2011, there were 764,091 of these cash-payable restricted share units outstanding.
110
Nonvested Cash-Payable Restricted Share Unit – Rollforward
|
|
|
|
|
|
|
|
|
|
|
In thousands
|
|
Nonvested
Cash-Payable
Restricted
Unit Shares
|
|
|
Aggregate
Intrinsic
Value
|
|
|
Outstanding at December 31, 2010
|
|
|
1,112
|
|
|
|
|
|
|
Granted
|
|
|
525
|
|
|
|
|
|
|
Vested and Released
|
|
|
(547
|
)
|
|
|
|
|
|
Forfeited
|
|
|
(6
|
)
|
|
|
|
|
|
Outstanding at June 30, 2011
|
|
|
1,084
|
|
|
$
|
64,645
|
|
N
OTE
12 F
INANCIAL
D
ERIVATIVES
We use derivative financial instruments (derivatives) primarily to help manage exposure to interest rate, market and credit risk and
reduce the effects that changes in interest rates may have on net income, fair value of assets and liabilities, and cash flows. We also enter into derivatives with customers to facilitate their risk management activities.
Derivatives represent contracts between parties that usually require little or no initial net investment and result in one party delivering cash or
another type of asset to the other party based on a notional amount and an underlying as specified in the contract. Derivative transactions are often measured in terms of notional amount, but this amount is generally not exchanged and it is not
recorded on the balance sheet. The notional amount is the basis to which the underlying is applied to determine required payments under the derivative contract. The underlying is a referenced interest rate (commonly LIBOR), security price, credit
spread or other index. Certain contracts and commitments, such as residential and commercial real estate loan commitments associated with loans to be sold, also qualify as derivative instruments.
All derivatives are carried on our Consolidated Balance Sheet at fair value. Derivative balances are presented on a net basis taking into consideration
the effects of legally enforceable master netting agreements. Cash collateral exchanged with counterparties is also netted against the applicable derivative fair values.
Further discussion on how derivatives are accounted for is included in Note 1 Accounting Policies in our 2010 Form 10-K.
Derivatives Designated in Hedge Relationships
Certain derivatives used to manage interest
rate risk as part of our asset and liability risk management activities are designated as accounting hedges under GAAP. Derivatives hedging the risks associated with changes in the fair value of assets or liabilities are considered fair value
hedges, while derivatives hedging the variability of expected future cash flows are considered cash flow hedges. Designating derivatives as accounting hedges allows for gains and losses on those derivatives, to the extent effective, to be recognized
in the income statement in the same period the hedged items affect earnings.
Cash Flow Hedges
We enter into receive-fixed, pay-variable interest rate swaps to modify the interest rate characteristics of designated commercial loans from variable to fixed in order to reduce the impact of changes in
future cash flows due to market interest rate changes. For these cash flow hedges, any changes in the fair value of the derivatives that are effective in offsetting changes in the forecasted interest cash flows are recorded in accumulated other
comprehensive income and are reclassified to interest income in conjunction with the recognition of interest receipts on the loans. In the 12 months that follow June 30, 2011, we expect to reclassify from the amount currently reported in
accumulated other comprehensive income net derivative gains of $391 million pretax, or $254 million after-tax, in association with interest receipts on the hedged loans. This amount could differ from amounts actually recognized due to changes in
interest rates, hedge dedesignations, and the addition of other hedges subsequent to June 30, 2011. The maximum length of time over which forecasted loan cash flows are hedged is 10 years. We use statistical regression analysis to assess the
effectiveness of these hedge relationships at both the inception of the hedge relationship and on an ongoing basis.
We also periodically
enter into forward purchase and sale contracts to hedge the variability of the consideration that will be paid or received related to the purchase or sale of investment securities. The forecasted purchase or sale is consummated upon gross settlement
of the forward contract itself. As a result, hedge ineffectiveness, if any, is typically minimal. Gains and losses on these forward contracts are recorded in accumulated other comprehensive income and are recognized in earnings when the hedged cash
flows affect earnings. In the 12 months that follow June 30, 2011, we expect to reclassify from the amount currently reported in accumulated other comprehensive loss, net derivative gains of $25 million pretax, or $16 million after-tax, as
adjustments of yield on investment securities. The maximum length of time we are hedging forecasted purchases is three months. There were no amounts in accumulated other comprehensive income related to the forecasted sale of securities at
June 30, 2011.
There were no components of derivative gains or losses excluded from the assessment of hedge effectiveness related to
either cash flow hedge strategy.
During the first six months of 2011 and 2010, there were no gains or losses from cash flow hedge derivatives
reclassified to earnings because it became probable that the original forecasted transaction would not occur.
Fair Value Hedges
We enter into receive-fixed, pay-variable interest rate swaps to hedge changes in the fair value of outstanding fixed-rate debt and
borrowings caused by fluctuations in market interest rates. The specific products hedged may include bank notes, Federal Home Loan Bank borrowings, and senior and subordinated
111
debt. We also enter into pay-fixed, receive-variable interest rate swaps, and zero-coupon swaps to hedge changes in the fair value of fixed rate and zero-coupon investment securities caused by
fluctuations in market interest rates. The specific products hedged include US Treasury, government agency and other debt securities. For these hedge relationships, we use statistical regression analysis to assess hedge effectiveness at both the
inception of the hedge relationship and on an ongoing basis. There were no components of derivative gains or losses excluded from the assessment of hedge effectiveness.
Further detail regarding the notional amounts, fair values and gains and losses recognized related to derivatives used in fair value and cash flow hedge strategies is presented in the tables that follow.
The ineffective portion of the change in value of our fair value and cash flow hedge derivatives resulted in net losses of $22 million for
the first six months of 2011 compared with net gains of $4 million for the first six months of 2010.
Derivatives Not Designated in Hedge
Relationships
We also enter into derivatives that are not designated as accounting hedges under GAAP.
The majority of these derivatives are used to manage risk related to residential and commercial mortgage banking activities and are considered economic
hedges. Although these derivatives are used to hedge risk, they are not designated as accounting hedges because the contracts they are hedging are typically also carried at fair value on the balance sheet, resulting in symmetrical accounting
treatment for both the hedging instrument and the hedged item.
Our residential mortgage banking activities consist of originating, selling
and servicing mortgage loans. Residential mortgage loans that will be sold in the secondary market, and the related loan commitments, which are considered derivatives, are accounted for at fair value. Changes in the fair value of the loans and
commitments due to interest rate risk are hedged with forward loan sale contracts as well as Treasury and Eurodollar futures and options. Gains and losses on the loans and commitments held for sale and the derivatives used to economically hedge them
are included in residential mortgage noninterest income on the Consolidated Income Statement.
We typically retain the servicing rights
related to residential mortgage loans that we sell. Residential mortgage servicing rights are accounted for at fair value with changes in fair value influenced primarily by changes in interest rates. Derivatives used to hedge the fair value of
residential mortgage servicing rights include interest rate futures, swaps, options (including caps, floors, and swaptions), and forward contracts to purchase mortgage-backed securities. Gains and losses on
residential mortgage servicing rights and the related derivatives used for hedging are included in residential mortgage noninterest income.
Certain commercial mortgage loans are also sold into the secondary market as part of our commercial mortgage banking activities and are accounted for at
fair value. Derivatives used to economically hedge these loans and commitments from changes in fair value due to interest rate risk and credit risk include forward loan sale contracts, interest rate swaps, and credit default swaps. Gains and losses
on the commitments, loans and derivatives are included in other noninterest income.
The residential and commercial loan commitments
associated with loans to be sold which are accounted for as derivatives are valued based on the estimated fair value of the underlying loan and the probability that the loan will fund within the terms of the commitment. The fair value also takes
into account the fair value of the embedded servicing right.
We offer derivatives to our customers in connection with their risk management
needs. These derivatives primarily consist of interest rate swaps, interest rate caps, floors, swaptions, foreign exchange contracts, and equity contracts. We primarily manage our market risk exposure from customer transactions by entering into
offsetting derivative transactions with third-party dealers. Gains and losses on customer-related derivatives are included in other noninterest income.
The derivatives portfolio also includes derivatives used for other risk management activities. These derivatives are entered into based on stated risk management objectives.
This segment of the portfolio includes credit default swaps (CDS) used to mitigate the risk of economic loss on a portion of our loan exposure. We also
sell loss protection to mitigate the net premium cost and the impact of mark-to-market accounting on CDS purchases to hedge the loan portfolio. The fair values of these derivatives typically are based on related credit spreads. Gains and losses on
the derivatives entered into for other risk management are included in other noninterest income.
Included in the customer, mortgage banking
risk management, and other risk management portfolios are written interest-rate caps and floors entered into with customers and for risk management purposes. We receive an upfront premium from the counterparty and are obligated to make payments to
the counterparty if the underlying market interest rate rises above or falls below a certain level designated in the contract. At June 30, 2011, the fair value of the written caps and floors liability on our Consolidated Balance Sheet was $14
million compared with $15 million at December 31, 2010. Our ultimate obligation under written options is based on future market conditions and is only quantifiable at settlement.
112
Further detail regarding the derivatives not designated in hedging relationships is presented in the tables
that follow.
Derivative Counterparty Credit Risk
By entering into derivative contracts we are exposed to credit risk. We seek to minimize credit risk through internal credit approvals, limits, monitoring procedures, executing master netting agreements
and collateral requirements. We generally enter into transactions with counterparties that carry high quality credit ratings. Nonperformance risk including credit risk is included in the determination of the estimated net fair value.
We generally have established agreements with our major derivative dealer counterparties that provide for exchanges of marketable securities or cash to
collateralize either party’s positions. At June 30, 2011, we held cash, US government securities and mortgage-backed securities totaling $1 billion under these agreements. We pledged cash of $706 million under these agreements. To the
extent not netted against derivative fair values under a master netting agreement, cash pledged is included in Other assets and cash held is included in Other borrowed funds on our Consolidated Balance Sheet.
The credit risk associated with derivatives executed with customers is essentially the same as that involved in extending loans and is subject to normal
credit policies. We may obtain collateral based on our assessment of the customer’s credit quality.
We periodically enter into risk participation agreements to share some of the credit exposure with other
counterparties related to interest rate derivative contracts or to take on credit exposure to generate revenue. We will make/receive payments under these agreements if a customer defaults on its obligation to perform under certain derivative swap
contracts. Risk participation agreements are included in the derivatives table that follows. Our exposure related to risk participations where we sold protection is discussed in the Credit Derivatives section below.
Contingent Features
Some of PNC’s
derivative instruments contain provisions that require PNC’s debt to maintain an investment grade credit rating from each of the major credit rating agencies. If PNC’s debt ratings were to fall below investment grade, it would be in
violation of these provisions, and the counterparties to the derivative instruments could request immediate payment or demand immediate and ongoing full overnight collateralization on derivative instruments in net liability positions.
The aggregate fair value of all derivative instruments with credit-risk-related contingent features that were in a net liability position on
June 30, 2011 was $831 million for which PNC had posted collateral of $672 million in the normal course of business. The maximum amount of collateral PNC would have been required to post if the credit-risk-related contingent features underlying
these agreements had been triggered on June 30, 2011, would be an additional $159 million.
113
Derivatives Total Notional or Contractual Amounts and Estimated Net Fair Values
|
|
|
|
|
|
|
|
|
|
|
|
|
|
|
|
|
|
|
|
|
|
|
|
|
|
|
|
|
|
|
|
|
|
|
|
|
Asset Derivatives
|
|
|
Liability Derivatives
|
|
|
|
|
June 30, 2011
|
|
|
December 31, 2010
|
|
|
June 30, 2011
|
|
|
December 31, 2010
|
|
|
In millions
|
|
Notional/
Contract
Amount
|
|
|
Fair
Value (a)
|
|
|
Notional/
Contract
Amount
|
|
|
Fair
Value (a)
|
|
|
Notional/
Contract
Amount
|
|
|
Fair
Value (b)
|
|
|
Notional/
Contract
Amount
|
|
|
Fair
Value (b)
|
|
|
Derivatives designated as hedging instruments under GAAP
|
|
|
|
|
|
|
|
|
|
|
|
|
|
|
|
|
|
|
|
|
|
|
|
|
|
|
|
|
|
|
|
|
|
Interest rate contracts:
|
|
|
|
|
|
|
|
|
|
|
|
|
|
|
|
|
|
|
|
|
|
|
|
|
|
|
|
|
|
|
|
|
|
Cash flow hedges
|
|
$
|
13,299
|
|
|
$
|
431
|
|
|
$
|
13,635
|
|
|
$
|
377
|
|
|
$
|
2,264
|
|
|
$
|
9
|
|
|
$
|
3,167
|
|
|
$
|
53
|
|
|
Fair value hedges
|
|
|
9,442
|
|
|
|
928
|
|
|
|
9,878
|
|
|
|
878
|
|
|
|
2,591
|
|
|
|
39
|
|
|
|
1,594
|
|
|
|
32
|
|
|
Total derivatives designated as hedging instruments
|
|
$
|
22,741
|
|
|
$
|
1,359
|
|
|
$
|
23,513
|
|
|
$
|
1,255
|
|
|
$
|
4,855
|
|
|
$
|
48
|
|
|
$
|
4,761
|
|
|
$
|
85
|
|
|
Derivatives not designated as hedging instruments under GAAP
|
|
|
|
|
|
|
|
|
|
|
|
|
|
|
|
|
|
|
|
|
|
|
|
|
|
|
|
|
|
|
|
|
|
Derivatives used for residential mortgage banking activities:
|
|
|
|
|
|
|
|
|
|
|
|
|
|
|
|
|
|
|
|
|
|
|
|
|
|
|
|
|
|
|
|
|
|
Residential mortgage servicing
|
|
|
|
|
|
|
|
|
|
|
|
|
|
|
|
|
|
|
|
|
|
|
|
|
|
|
|
|
|
|
|
|
|
Interest rate contracts
|
|
$
|
114,568
|
|
|
$
|
1,629
|
|
|
$
|
112,236
|
|
|
$
|
1,490
|
|
|
$
|
57,929
|
|
|
$
|
1,414
|
|
|
$
|
66,476
|
|
|
$
|
1,419
|
|
|
Loan sales
|
|
|
|
|
|
|
|
|
|
|
|
|
|
|
|
|
|
|
|
|
|
|
|
|
|
|
|
|
|
|
|
|
|
Interest rate contracts
|
|
|
6,398
|
|
|
|
35
|
|
|
|
11,765
|
|
|
|
119
|
|
|
|
2,837
|
|
|
|
22
|
|
|
|
3,585
|
|
|
|
31
|
|
|
Subtotal
|
|
$
|
120,966
|
|
|
$
|
1,664
|
|
|
$
|
124,001
|
|
|
$
|
1,609
|
|
|
$
|
60,766
|
|
|
$
|
1,436
|
|
|
$
|
70,061
|
|
|
$
|
1,450
|
|
|
Derivatives used for commercial mortgage banking activities:
|
|
|
|
|
|
|
|
|
|
|
|
|
|
|
|
|
|
|
|
|
|
|
|
|
|
|
|
|
|
|
|
|
|
Interest rate contracts
|
|
$
|
1,579
|
|
|
$
|
57
|
|
|
$
|
1,159
|
|
|
$
|
75
|
|
|
$
|
1,422
|
|
|
$
|
76
|
|
|
$
|
1,813
|
|
|
$
|
111
|
|
|
Credit contracts:
|
|
|
|
|
|
|
|
|
|
|
|
|
|
|
|
|
|
|
|
|
|
|
|
|
|
|
|
|
|
|
|
|
|
Credit default swaps
|
|
|
145
|
|
|
|
6
|
|
|
|
210
|
|
|
|
8
|
|
|
|
|
|
|
|
|
|
|
|
|
|
|
|
|
|
|
Subtotal
|
|
$
|
1,724
|
|
|
$
|
63
|
|
|
$
|
1,369
|
|
|
$
|
83
|
|
|
$
|
1,422
|
|
|
$
|
76
|
|
|
$
|
1,813
|
|
|
$
|
111
|
|
|
Derivatives used for customer-related activities:
|
|
|
|
|
|
|
|
|
|
|
|
|
|
|
|
|
|
|
|
|
|
|
|
|
|
|
|
|
|
|
|
|
|
Interest rate contracts
|
|
$
|
59,774
|
|
|
$
|
2,563
|
|
|
$
|
54,060
|
|
|
$
|
2,611
|
|
|
$
|
50,196
|
|
|
$
|
2,668
|
|
|
$
|
49,619
|
|
|
$
|
2,703
|
|
|
Foreign exchange contracts
|
|
|
4,917
|
|
|
|
178
|
|
|
|
3,659
|
|
|
|
149
|
|
|
|
5,530
|
|
|
|
183
|
|
|
|
4,254
|
|
|
|
155
|
|
|
Equity contracts
|
|
|
202
|
|
|
|
10
|
|
|
|
195
|
|
|
|
16
|
|
|
|
142
|
|
|
|
14
|
|
|
|
139
|
|
|
|
19
|
|
|
Credit contracts:
|
|
|
|
|
|
|
|
|
|
|
|
|
|
|
|
|
|
|
|
|
|
|
|
|
|
|
|
|
|
|
|
|
|
Risk participation agreements
|
|
|
1,439
|
|
|
|
4
|
|
|
|
1,371
|
|
|
|
5
|
|
|
|
1,727
|
|
|
|
3
|
|
|
|
1,367
|
|
|
|
2
|
|
|
Subtotal
|
|
$
|
66,332
|
|
|
$
|
2,755
|
|
|
$
|
59,285
|
|
|
$
|
2,781
|
|
|
$
|
57,595
|
|
|
$
|
2,868
|
|
|
$
|
55,379
|
|
|
$
|
2,879
|
|
|
Derivatives used for other risk management activities:
|
|
|
|
|
|
|
|
|
|
|
|
|
|
|
|
|
|
|
|
|
|
|
|
|
|
|
|
|
|
|
|
|
|
Interest rate contracts
|
|
$
|
2,086
|
|
|
$
|
7
|
|
|
$
|
3,420
|
|
|
$
|
20
|
|
|
$
|
393
|
|
|
$
|
2
|
|
|
$
|
1,099
|
|
|
$
|
9
|
|
|
Foreign exchange contracts
|
|
|
|
|
|
|
|
|
|
|
|
|
|
|
|
|
|
|
29
|
|
|
|
6
|
|
|
|
32
|
|
|
|
4
|
|
|
Credit contracts:
|
|
|
|
|
|
|
|
|
|
|
|
|
|
|
|
|
|
|
|
|
|
|
|
|
|
|
|
|
|
|
|
|
|
Credit default swaps
|
|
|
238
|
|
|
|
7
|
|
|
|
376
|
|
|
|
9
|
|
|
|
200
|
|
|
|
1
|
|
|
|
175
|
|
|
|
1
|
|
|
Other contracts (c)
|
|
|
|
|
|
|
|
|
|
|
|
|
|
|
|
|
|
|
209
|
|
|
|
426
|
|
|
|
209
|
|
|
|
396
|
|
|
Subtotal
|
|
$
|
2,324
|
|
|
$
|
14
|
|
|
$
|
3,796
|
|
|
$
|
29
|
|
|
$
|
831
|
|
|
$
|
435
|
|
|
$
|
1,515
|
|
|
$
|
410
|
|
|
Total derivatives not designated as hedging instruments
|
|
$
|
191,346
|
|
|
$
|
4,496
|
|
|
$
|
188,451
|
|
|
$
|
4,502
|
|
|
$
|
120,614
|
|
|
$
|
4,815
|
|
|
$
|
128,768
|
|
|
$
|
4,850
|
|
|
Total Gross Derivatives
|
|
$
|
214,087
|
|
|
$
|
5,855
|
|
|
$
|
211,964
|
|
|
$
|
5,757
|
|
|
$
|
125,469
|
|
|
$
|
4,863
|
|
|
$
|
133,529
|
|
|
$
|
4,935
|
|
|
Less: Legally enforceable master netting agreements
|
|
|
|
|
|
|
3,302
|
|
|
|
|
|
|
|
3,203
|
|
|
|
|
|
|
|
3,302
|
|
|
|
|
|
|
|
3,203
|
|
|
Less: Cash collateral
|
|
|
|
|
|
|
783
|
|
|
|
|
|
|
|
659
|
|
|
|
|
|
|
|
660
|
|
|
|
|
|
|
|
674
|
|
|
Total Net Derivatives
|
|
|
|
|
|
$
|
1,770
|
|
|
|
|
|
|
$
|
1,895
|
|
|
|
|
|
|
$
|
901
|
|
|
|
|
|
|
$
|
1,058
|
|
|
(a)
|
Included in Other Assets on our Consolidated Balance Sheet.
|
|
(b)
|
Included in Other Liabilities on our Consolidated Balance Sheet.
|
|
(c)
|
Includes PNC’s obligation to fund a portion of certain BlackRock LTIP programs.
|
114
Gains (losses) on derivative instruments and related hedged items follow:
Derivatives Designated in GAAP Hedge Relationships – Fair Value Hedges
|
|
|
|
|
|
|
|
|
|
|
|
|
|
|
|
|
|
|
|
|
|
|
|
|
|
|
|
|
June 30, 2011
|
|
|
June 30, 2010
|
|
|
Six months ended
In millions
|
|
Hedged Items
|
|
Location
|
|
Gain
(Loss) on
Derivatives
Recognized
in Income
|
|
|
Gain (Loss)
on Related
Hedged
Items
Recognized
in Income
|
|
|
Gain
(Loss) on
Derivatives
Recognized
in Income
|
|
|
Gain (Loss)
on Related
Hedged
Items
Recognized
in
Income
|
|
|
|
|
|
Amount
|
|
|
Amount
|
|
|
Amount
|
|
|
Amount
|
|
|
Interest rate contracts
|
|
US Treasury and Government Agencies Securities
|
|
Investment securities
(interest income)
|
|
$
|
(25
|
)
|
|
$
|
26
|
|
|
$
|
(27
|
)
|
|
$
|
26
|
|
|
Interest rate contracts
|
|
Other Debt Securities
|
|
Investment securities (interest income)
|
|
|
(9
|
)
|
|
|
9
|
|
|
|
|
|
|
|
|
|
|
Interest rate contracts
|
|
Federal Home Loan Bank borrowings
|
|
Borrowed funds (interest expense)
|
|
|
|
|
|
|
|
|
|
|
(48
|
)
|
|
|
47
|
|
|
Interest rate contracts
|
|
Subordinated debt
|
|
Borrowed funds (interest expense)
|
|
|
30
|
|
|
|
(43
|
)
|
|
|
260
|
|
|
|
(272
|
)
|
|
Interest rate contracts
|
|
Bank notes and senior debt
|
|
Borrowed funds (interest expense)
|
|
|
48
|
|
|
|
(58
|
)
|
|
|
214
|
|
|
|
(198
|
)
|
|
Total
|
|
|
|
|
|
$
|
44
|
|
|
$
|
(66
|
)
|
|
$
|
399
|
|
|
$
|
(397
|
)
|
|
|
|
|
|
|
|
|
|
|
|
|
|
|
|
|
|
|
|
|
|
|
|
|
|
|
|
|
|
June 30, 2011
|
|
|
June 30, 2010
|
|
|
|
|
|
|
|
|
Gain
(Loss) on
Derivatives
Recognized
in Income
|
|
|
Gain (Loss)
on Related
Hedged
Items
Recognized
in Income
|
|
|
Gain
(Loss) on
Derivatives
Recognized
in Income
|
|
|
Gain (Loss)
on Related
Hedged
Items
Recognized
in Income
|
|
|
Three months ended
In millions
|
|
Hedged Items
|
|
Location
|
|
Amount
|
|
|
Amount
|
|
|
Amount
|
|
|
Amount
|
|
|
Interest rate contracts
|
|
US Treasury and Government Agencies Securities
|
|
Investment securities
(interest income)
|
|
$
|
(40
|
)
|
|
$
|
40
|
|
|
$
|
(27
|
)
|
|
$
|
26
|
|
|
Interest rate contracts
|
|
Other Debt Securities
|
|
Investment securities
(interest income)
|
|
|
(13
|
)
|
|
|
13
|
|
|
|
|
|
|
|
|
|
|
Interest rate contracts
|
|
Federal Home Loan Bank borrowings
|
|
Borrowed funds
(interest
expense)
|
|
|
|
|
|
|
|
|
|
|
(23
|
)
|
|
|
23
|
|
|
Interest rate contracts
|
|
Subordinated debt
|
|
Borrowed funds
(interest
expense)
|
|
|
89
|
|
|
|
(94
|
)
|
|
|
200
|
|
|
|
(207
|
)
|
|
Interest rate contracts
|
|
Bank notes and senior debt
|
|
Borrowed funds
(interest expense)
|
|
|
98
|
|
|
|
(108
|
)
|
|
|
172
|
|
|
|
(159
|
)
|
|
Total
|
|
|
|
|
|
$
|
134
|
|
|
$
|
(149
|
)
|
|
$
|
322
|
|
|
$
|
(317
|
)
|
115
Derivatives Designated in GAAP Hedge Relationships – Cash Flow Hedges
|
|
|
|
|
|
|
|
|
|
|
|
|
|
|
|
|
|
|
|
|
Six months ended
In millions
|
|
|
|
Gain (Loss) on Derivatives
Recognized in OCI
(Effective
Portion)
|
|
|
Gain (Loss) Reclassified from Accumulated
OCI into
Income
(Effective Portion)
|
|
|
Gain (Loss) Recognized in Income
on Derivatives
(Ineffective
Portion)
|
|
|
|
|
|
|
|
|
|
Location
|
|
Amount
|
|
|
Location
|
|
Amount
|
|
|
June 30, 2011
|
|
Interest rate contracts
|
|
$
|
280
|
|
|
Interest income
|
|
$
|
212
|
|
|
Interest income
|
|
|
|
|
|
|
|
|
|
|
|
|
|
Noninterest income
|
|
|
33
|
|
|
|
|
|
|
|
|
June 30, 2010
|
|
Interest rate contracts
|
|
$
|
725
|
|
|
Interest income
|
|
$
|
175
|
|
|
Interest income
|
|
$
|
2
|
|
|
|
|
|
|
|
|
|
|
Noninterest income
|
|
|
25
|
|
|
|
|
|
|
|
|
|
|
|
|
|
|
|
|
|
|
|
|
|
|
|
|
|
|
|
|
Three months ended
In millions
|
|
|
|
Gain (Loss) on Derivatives
Recognized in OCI
(Effective
Portion)
|
|
|
Gain (Loss) Reclassified from Accumulated
OCI into
Income
(Effective Portion)
|
|
|
Gain (Loss) Recognized in Income
on Derivatives
(Ineffective
Portion)
|
|
|
|
|
|
|
|
|
|
Location
|
|
Amount
|
|
|
Location
|
|
Amount
|
|
|
June 30, 2011
|
|
Interest rate contracts
|
|
$
|
266
|
|
|
Interest income
|
|
$
|
115
|
|
|
Interest income
|
|
$
|
(1
|
)
|
|
|
|
|
|
|
|
|
|
Noninterest income
|
|
|
8
|
|
|
|
|
|
|
|
|
June 30, 2010
|
|
Interest rate contracts
|
|
$
|
485
|
|
|
Interest income
|
|
$
|
81
|
|
|
Interest income
|
|
$
|
(1
|
)
|
|
|
|
|
|
|
|
|
|
Noninterest income
|
|
|
3
|
|
|
|
|
|
|
|
Derivatives Not Designated as Hedging Instruments under GAAP
|
|
|
|
|
|
|
|
|
|
|
|
|
|
|
|
|
|
|
|
|
|
|
Three months ended
June 30
|
|
|
|
|
Six months ended
June 30
|
|
|
In millions
|
|
2011
|
|
|
2010
|
|
|
|
|
2011
|
|
|
2010
|
|
|
Derivatives used for residential mortgage banking activities:
|
|
|
|
|
|
|
|
|
|
|
|
|
|
|
|
|
|
|
|
Residential mortgage servicing
|
|
|
|
|
|
|
|
|
|
|
|
|
|
|
|
|
|
|
|
Interest rate contracts
|
|
$
|
154
|
|
|
$
|
351
|
|
|
|
|
$
|
165
|
|
|
$
|
421
|
|
|
Loan sales
|
|
|
|
|
|
|
|
|
|
|
|
|
|
|
|
|
|
|
|
Interest rate contracts
|
|
|
(18
|
)
|
|
|
(56
|
)
|
|
|
|
|
(3
|
)
|
|
|
(77
|
)
|
|
Gains (losses) included in residential mortgage banking activities (a)
|
|
$
|
136
|
|
|
$
|
295
|
|
|
|
|
$
|
162
|
|
|
$
|
344
|
|
|
Derivatives used for commercial mortgage banking activities:
|
|
|
|
|
|
|
|
|
|
|
|
|
|
|
|
|
|
|
|
Interest rate contracts
|
|
$
|
(8
|
)
|
|
$
|
(50
|
)
|
|
|
|
$
|
(5
|
)
|
|
$
|
(71
|
)
|
|
Credit contracts
|
|
|
2
|
|
|
|
(2
|
)
|
|
|
|
|
4
|
|
|
|
(9
|
)
|
|
Gains (losses) from commercial mortgage banking activities (b)
|
|
$
|
(6
|
)
|
|
$
|
(52
|
)
|
|
|
|
$
|
(1
|
)
|
|
$
|
(80
|
)
|
|
Derivatives used for customer-related activities:
|
|
|
|
|
|
|
|
|
|
|
|
|
|
|
|
|
|
|
|
Interest rate contracts
|
|
$
|
12
|
|
|
$
|
(21
|
)
|
|
|
|
$
|
40
|
|
|
$
|
(27
|
)
|
|
Foreign exchange contracts
|
|
|
8
|
|
|
|
(7
|
)
|
|
|
|
|
22
|
|
|
|
6
|
|
|
Equity contracts
|
|
|
(1
|
)
|
|
|
2
|
|
|
|
|
|
(3
|
)
|
|
|
1
|
|
|
Credit contracts
|
|
|
2
|
|
|
|
(1
|
)
|
|
|
|
|
2
|
|
|
|
(2
|
)
|
|
Gains (losses) from customer-related activities (b)
|
|
$
|
21
|
|
|
$
|
(27
|
)
|
|
|
|
$
|
61
|
|
|
$
|
(22
|
)
|
|
Derivatives used for other risk management activities:
|
|
|
|
|
|
|
|
|
|
|
|
|
|
|
|
|
|
|
|
Interest rate contracts
|
|
$
|
(3
|
)
|
|
|
(15
|
)
|
|
|
|
$
|
(2
|
)
|
|
$
|
(14
|
)
|
|
Foreign exchange contracts
|
|
|
(2
|
)
|
|
|
3
|
|
|
|
|
|
(3
|
)
|
|
|
2
|
|
|
Credit contracts
|
|
|
(1
|
)
|
|
|
|
|
|
|
|
|
(2
|
)
|
|
|
4
|
|
|
Other contracts (c)
|
|
|
21
|
|
|
|
154
|
|
|
|
|
|
(30
|
)
|
|
|
184
|
|
|
Gains (losses) from other risk management activities (b)
|
|
$
|
15
|
|
|
$
|
142
|
|
|
|
|
$
|
(37
|
)
|
|
$
|
176
|
|
|
Total gains (losses) from derivatives not designated as hedging
instruments
|
|
$
|
166
|
|
|
$
|
358
|
|
|
|
|
$
|
185
|
|
|
$
|
418
|
|
|
(a)
|
Included in residential mortgage noninterest income.
|
|
(b)
|
Included in other noninterest income.
|
|
(c)
|
Relates to BlackRock LTIP.
|
116
C
REDIT
D
ERIVATIVES
The credit derivative underlying is based on the credit risk of a specific entity, entities, or an index. As discussed above, we enter into credit
derivatives, specifically credit default swaps and risk participation agreements, as part of our commercial mortgage banking hedging activities and for customer and other risk management purposes. Detail regarding credit default swaps and risk
participations sold follows:
Credit Default Swaps
|
|
|
|
|
|
|
|
|
|
|
|
|
|
|
|
|
|
|
|
|
|
|
|
|
|
|
|
|
June 30, 2011
|
|
|
December 31, 2010
|
|
|
Dollars in millions
|
|
Notional
Amount
|
|
|
Estimated
Net Fair
Value
|
|
|
Weighted-
Average
Remaining
Maturity
In Years
|
|
|
Notional
Amount
|
|
|
Estimated
Net Fair
Value
|
|
|
Weighted-
Average
Remaining
Maturity
In Years
|
|
|
Credit Default Swaps – Sold
|
|
|
|
|
|
|
|
|
|
|
|
|
|
|
|
|
|
|
|
|
|
|
|
|
|
Single name
|
|
$
|
45
|
|
|
$
|
4
|
|
|
|
2.3
|
|
|
$
|
45
|
|
|
$
|
4
|
|
|
|
2.8
|
|
|
Index traded
|
|
|
118
|
|
|
|
1
|
|
|
|
2.1
|
|
|
|
189
|
|
|
|
2
|
|
|
|
2.0
|
|
|
Total
|
|
$
|
163
|
|
|
$
|
5
|
|
|
|
2.2
|
|
|
$
|
234
|
|
|
$
|
6
|
|
|
|
2.2
|
|
|
Credit Default Swaps – Purchased
|
|
|
|
|
|
|
|
|
|
|
|
|
|
|
|
|
|
|
|
|
|
|
|
|
|
Single name
|
|
$
|
310
|
|
|
$
|
1
|
|
|
|
3.3
|
|
|
$
|
317
|
|
|
$
|
2
|
|
|
|
2.6
|
|
|
Index traded
|
|
|
110
|
|
|
|
6
|
|
|
|
38.2
|
|
|
|
210
|
|
|
|
8
|
|
|
|
38.8
|
|
|
Total
|
|
$
|
420
|
|
|
$
|
7
|
|
|
|
12.5
|
|
|
$
|
527
|
|
|
$
|
10
|
|
|
|
17.0
|
|
|
Total
|
|
$
|
583
|
|
|
$
|
12
|
|
|
|
9.6
|
|
|
$
|
761
|
|
|
$
|
16
|
|
|
|
12.5
|
|
The notional amount of these credit default swaps by credit rating follows:
Credit Ratings of Credit Default Swaps
|
|
|
|
|
|
|
|
|
|
|
Dollars in millions
|
|
June 30,
2011
|
|
|
December 31,
2010
|
|
|
Credit Default Swaps – Sold
|
|
|
|
|
|
|
|
|
|
Investment grade (a)
|
|
$
|
139
|
|
|
$
|
220
|
|
|
Subinvestment grade (b)
|
|
|
24
|
|
|
|
14
|
|
|
Total
|
|
$
|
163
|
|
|
$
|
234
|
|
|
Credit Default Swaps – Purchased
|
|
|
|
|
|
|
|
|
|
Investment grade (a)
|
|
$
|
300
|
|
|
$
|
385
|
|
|
Subinvestment grade (b)
|
|
|
120
|
|
|
|
142
|
|
|
Total
|
|
$
|
420
|
|
|
$
|
527
|
|
|
Total
|
|
$
|
583
|
|
|
$
|
761
|
|
|
(a)
|
Investment grade with a rating of BBB-/Baa3 or above based on published rating agency information.
|
|
(b)
|
Subinvestment grade with a rating below BBB-/Baa3 based on published rating agency information.
|
The referenced/underlying assets for these credit default swaps follow:
Referenced/Underlying Assets of Credit Default Swaps
|
|
|
|
|
|
|
|
|
|
|
|
|
|
|
|
|
Corporate
Debt
|
|
|
Commercial
mortgage-
backed
securities
|
|
|
Loans
|
|
|
June 30, 2011
|
|
|
70
|
%
|
|
|
19
|
%
|
|
|
11
|
%
|
|
December 31, 2010
|
|
|
62
|
%
|
|
|
28
|
%
|
|
|
10
|
%
|
We enter into credit default swaps under which we buy loss protection from or sell loss protection to a counterparty for
the occurrence of a credit event related to a referenced entity or index. The maximum amount we would be required to pay under the credit default swaps in which we sold protection, assuming all referenced underlyings experience a credit event
at a total loss, without recoveries, was $163 million at June 30, 2011 and $234 million at December 31, 2010.
Risk Participation Agreements
We have sold risk participation agreements with terms
ranging from less than one year to 26 years. We will be required to make payments under these agreements if a customer defaults on its obligation to perform under certain derivative swap contracts with third parties.
Risk Participation Agreements Sold
|
|
|
|
|
|
|
|
|
|
|
|
|
|
|
Dollars in millions
|
|
Notional
Amount
|
|
|
Estimated
Net Fair
Value
|
|
|
Weighted-
Average
Remaining
Maturity
In Years
|
|
|
June 30, 2011
|
|
$
|
1,727
|
|
|
$
|
(3
|
)
|
|
|
6.9
|
|
|
December 31, 2010
|
|
$
|
1,367
|
|
|
$
|
(2
|
)
|
|
|
2.0
|
|
Based on our internal risk rating process of the underlying third parties to the swap contracts, the percentages of the
exposure amount of risk participation agreements sold by internal credit rating follow:
Internal Credit Ratings of Risk Participation
Agreements Sold
|
|
|
|
|
|
|
|
|
|
|
|
|
June 30,
2011
|
|
|
December 31,
2010
|
|
|
Pass (a)
|
|
|
98
|
%
|
|
|
95
|
%
|
|
Below pass (b)
|
|
|
2
|
%
|
|
|
5
|
%
|
|
(a)
|
Indicates the expected risk of default is currently low.
|
|
(b)
|
Indicates a higher degree of risk of default.
|
Assuming all underlying swap counterparties defaulted at June 30, 2011, the exposure from these agreements would be $84 million based on the fair
value of the underlying swaps, compared with $49 million at December 31, 2010.
117
N
OTE
13 E
ARNINGS
P
ER
S
HARE
Basic and Diluted Earnings per Common Share
|
|
|
|
|
|
|
|
|
|
|
|
|
|
|
|
|
|
|
|
|
Three months ended
June 30
|
|
|
Six months ended
June 30
|
|
|
In millions, except per share data
|
|
2011
|
|
|
2010
|
|
|
2011
|
|
|
2010
|
|
|
Basic
|
|
|
|
|
|
|
|
|
|
|
|
|
|
|
|
|
|
Net income from continuing operations
|
|
$
|
912
|
|
|
$
|
781
|
|
|
$
|
1,744
|
|
|
$
|
1,429
|
|
|
Less:
|
|
|
|
|
|
|
|
|
|
|
|
|
|
|
|
|
|
Net income (loss) attributable to noncontrolling interests
|
|
|
(1
|
)
|
|
|
(9
|
)
|
|
|
(6
|
)
|
|
|
(14
|
)
|
|
Dividends distributed to common shareholders
|
|
|
183
|
|
|
|
53
|
|
|
|
236
|
|
|
|
98
|
|
|
Dividends distributed to preferred shareholders
|
|
|
24
|
|
|
|
25
|
|
|
|
28
|
|
|
|
118
|
|
|
Dividends distributed to nonvested restricted shares
|
|
|
1
|
|
|
|
|
|
|
|
1
|
|
|
|
|
|
|
Preferred stock discount accretion
|
|
|
1
|
|
|
|
1
|
|
|
|
1
|
|
|
|
251
|
|
|
Undistributed net income from continuing operations
|
|
$
|
704
|
|
|
$
|
711
|
|
|
$
|
1,484
|
|
|
$
|
976
|
|
|
Undistributed net income from discontinued operations
|
|
|
|
|
|
|
22
|
|
|
|
|
|
|
|
45
|
|
|
Undistributed net income
|
|
$
|
704
|
|
|
$
|
733
|
|
|
$
|
1,484
|
|
|
$
|
1,021
|
|
|
Percentage of undistributed income allocated to common shares
|
|
|
99.57
|
%
|
|
|
99.61
|
%
|
|
|
99.62
|
%
|
|
|
99.65
|
%
|
|
Undistributed income from continuing operations allocated to common shares
|
|
$
|
701
|
|
|
$
|
708
|
|
|
$
|
1,479
|
|
|
$
|
972
|
|
|
Plus: common dividends
|
|
|
183
|
|
|
|
53
|
|
|
|
236
|
|
|
|
98
|
|
|
Net income from continuing operations attributable to basic common shares
|
|
$
|
884
|
|
|
$
|
761
|
|
|
$
|
1,715
|
|
|
$
|
1,070
|
|
|
Net income from discontinued operations attributable to common shares
|
|
|
|
|
|
|
22
|
|
|
|
|
|
|
|
45
|
|
|
Net income attributable to basic common shares
|
|
$
|
884
|
|
|
$
|
783
|
|
|
$
|
1,715
|
|
|
$
|
1,115
|
|
|
Basic weighted-average common shares outstanding
|
|
|
524
|
|
|
|
524
|
|
|
|
524
|
|
|
|
511
|
|
|
Basic earnings per common share from continuing operations
|
|
$
|
1.69
|
|
|
$
|
1.45
|
|
|
$
|
3.27
|
|
|
$
|
2.09
|
|
|
Basic earnings per common share from discontinued operations
|
|
|
|
|
|
|
.04
|
|
|
|
|
|
|
|
.09
|
|
|
Basic earnings per common share
|
|
$
|
1.69
|
|
|
$
|
1.49
|
|
|
$
|
3.27
|
|
|
$
|
2.18
|
|
|
Diluted
|
|
|
|
|
|
|
|
|
|
|
|
|
|
|
|
|
|
Net income from continuing operations attributable to basic common shares
|
|
$
|
884
|
|
|
$
|
761
|
|
|
$
|
1,715
|
|
|
$
|
1,070
|
|
|
Less: BlackRock common stock equivalents
|
|
|
4
|
|
|
|
6
|
|
|
|
10
|
|
|
|
8
|
|
|
Net income from continuing operations attributable to diluted common
shares
|
|
$
|
880
|
|
|
$
|
755
|
|
|
$
|
1,705
|
|
|
$
|
1,062
|
|
|
Net income from discontinued operations attributable to common shares
|
|
|
|
|
|
|
22
|
|
|
|
|
|
|
|
45
|
|
|
Net income attributable to diluted common shares
|
|
$
|
880
|
|
|
$
|
777
|
|
|
$
|
1,705
|
|
|
$
|
1,107
|
|
|
Basic weighted-average common shares outstanding
|
|
|
524
|
|
|
|
524
|
|
|
|
524
|
|
|
|
511
|
|
|
Dilutive potential common shares (a) (b)
|
|
|
3
|
|
|
|
3
|
|
|
|
3
|
|
|
|
3
|
|
|
Diluted weighted-average common shares outstanding
|
|
|
527
|
|
|
|
527
|
|
|
|
527
|
|
|
|
514
|
|
|
Diluted earnings per common share from continuing operations
|
|
$
|
1.67
|
|
|
$
|
1.43
|
|
|
$
|
3.24
|
|
|
$
|
2.06
|
|
|
Diluted earnings per common share from discontinued operations
|
|
|
|
|
|
|
.04
|
|
|
|
|
|
|
|
.09
|
|
|
Diluted earnings per common share
|
|
$
|
1.67
|
|
|
$
|
1.47
|
|
|
$
|
3.24
|
|
|
$
|
2.15
|
|
|
(a) Excludes stock options considered to be anti-dilutive
|
|
|
5
|
|
|
|
11
|
|
|
|
5
|
|
|
|
12
|
|
|
(b) Excludes warrants considered to be anti-dilutive
|
|
|
22
|
|
|
|
22
|
|
|
|
22
|
|
|
|
22
|
|
118
N
OTE
14 T
OTAL
E
QUITY
A
ND
O
THER
C
OMPREHENSIVE
I
NCOME
Activity in total equity for the first six months of 2011 follows. The par value of our preferred stock outstanding at June 30,
2011 totaled $.1 million and is excluded from the table.
Rollforward of Total Equity
|
|
|
|
|
|
|
|
|
|
|
|
|
|
|
|
|
|
|
|
|
|
|
|
|
|
|
|
|
|
|
|
|
|
|
|
|
|
|
|
|
Shareholders’ Equity
|
|
|
In millions
|
|
Shares
Outstanding
Common
Stock
|
|
|
Common
Stock
|
|
|
Capital
Surplus –
Preferred
Stock
|
|
|
Capital
Surplus –
Common
Stock
and
Other
|
|
|
Retained
Earnings
|
|
|
Accumulated
Other
Comprehensive
Income (Loss)
|
|
|
Treasury
Stock
|
|
|
Non-
controlling
Interests
|
|
|
Total
Equity
|
|
|
Balance at January 1, 2011
|
|
|
526
|
|
|
$
|
2,682
|
|
|
$
|
647
|
|
|
$
|
12,057
|
|
|
$
|
15,859
|
|
|
$
|
(431
|
)
|
|
$
|
(572
|
)
|
|
$
|
2,596
|
|
|
$
|
32,838
|
|
|
Net income
|
|
|
|
|
|
|
|
|
|
|
|
|
|
|
|
|
|
|
1,750
|
|
|
|
|
|
|
|
|
|
|
|
(6
|
)
|
|
|
1,744
|
|
|
Other comprehensive income (loss), net of tax
|
|
|
|
|
|
|
|
|
|
|
|
|
|
|
|
|
|
|
|
|
|
|
|
|
|
|
|
|
|
|
|
|
|
|
|
|
|
Net unrealized gains on other-than- temporary impairment debt securities
|
|
|
|
|
|
|
|
|
|
|
|
|
|
|
|
|
|
|
|
|
|
|
126
|
|
|
|
|
|
|
|
|
|
|
|
126
|
|
|
Net unrealized securities gains
|
|
|
|
|
|
|
|
|
|
|
|
|
|
|
|
|
|
|
|
|
|
|
324
|
|
|
|
|
|
|
|
|
|
|
|
324
|
|
|
Net unrealized gains on cash flow hedge derivatives
|
|
|
|
|
|
|
|
|
|
|
|
|
|
|
|
|
|
|
|
|
|
|
22
|
|
|
|
|
|
|
|
|
|
|
|
22
|
|
|
Pension and other postretirement benefit plan adjustments
|
|
|
|
|
|
|
|
|
|
|
|
|
|
|
|
|
|
|
|
|
|
|
7
|
|
|
|
|
|
|
|
|
|
|
|
7
|
|
|
Other
|
|
|
|
|
|
|
|
|
|
|
|
|
|
|
|
|
|
|
|
|
|
|
21
|
|
|
|
|
|
|
|
|
|
|
|
21
|
|
|
Comprehensive income (loss)
|
|
|
|
|
|
|
|
|
|
|
|
|
|
|
|
|
|
|
|
|
|
|
|
|
|
|
|
|
|
|
(6
|
)
|
|
|
2,244
|
|
|
Cash dividends declared
|
|
|
|
|
|
|
|
|
|
|
|
|
|
|
|
|
|
|
|
|
|
|
|
|
|
|
|
|
|
|
|
|
|
|
|
|
|
Common ($.45 per share)
|
|
|
|
|
|
|
|
|
|
|
|
|
|
|
|
|
|
|
(236
|
)
|
|
|
|
|
|
|
|
|
|
|
|
|
|
|
(236
|
)
|
|
Preferred
|
|
|
|
|
|
|
|
|
|
|
|
|
|
|
|
|
|
|
(28
|
)
|
|
|
|
|
|
|
|
|
|
|
|
|
|
|
(28
|
)
|
|
Preferred stock discount accretion
|
|
|
|
|
|
|
|
|
|
|
1
|
|
|
|
|
|
|
|
(1
|
)
|
|
|
|
|
|
|
|
|
|
|
|
|
|
|
|
|
|
Common stock activity (a)
|
|
|
|
|
|
|
|
|
|
|
|
|
|
|
5
|
|
|
|
|
|
|
|
|
|
|
|
|
|
|
|
|
|
|
|
5
|
|
|
Treasury stock activity (a)
|
|
|
|
|
|
|
|
|
|
|
|
|
|
|
(19
|
)
|
|
|
|
|
|
|
|
|
|
|
39
|
|
|
|
|
|
|
|
20
|
|
|
Other
|
|
|
|
|
|
|
|
|
|
|
|
|
|
|
(18
|
)
|
|
|
|
|
|
|
|
|
|
|
|
|
|
|
48
|
|
|
|
30
|
|
|
Balance at June 30, 2011
|
|
|
526
|
|
|
$
|
2,682
|
|
|
$
|
648
|
|
|
$
|
12,025
|
|
|
$
|
17,344
|
|
|
$
|
69
|
|
|
$
|
(533
|
)
|
|
$
|
2,638
|
|
|
$
|
34,873
|
|
|
(a)
|
Common and net treasury stock activity totaled less than .5 million shares.
|
Comprehensive income for the first six months of 2010 was $3.0 billion.
Change in
Accumulated Other Comprehensive Income (Loss)
|
|
|
|
|
|
|
|
|
|
|
|
|
|
|
Six months ended June 30, 2011
In millions
|
|
Pretax
|
|
|
Tax
(Expense)
Benefit
|
|
|
After-tax
|
|
|
Change in net unrealized securities losses:
|
|
|
|
|
|
|
|
|
|
|
|
|
|
Decrease in net unrealized OTTI losses on debt securities
|
|
$
|
80
|
|
|
$
|
(23
|
)
|
|
$
|
57
|
|
|
Less: Net losses realized on sales of securities
|
|
|
(34
|
)
|
|
|
12
|
|
|
|
(22
|
)
|
|
Less: Other OTTI losses realized in net income
|
|
|
(73
|
)
|
|
|
26
|
|
|
|
(47
|
)
|
|
Change in net unrealized losses on OTTI securities
|
|
|
187
|
|
|
|
(61
|
)
|
|
|
126
|
|
|
Increase in net unrealized gains for non-OTTI securities
|
|
|
662
|
|
|
|
(239
|
)
|
|
|
423
|
|
|
Less: Net gains realized on sales of securities
|
|
|
153
|
|
|
|
(54
|
)
|
|
|
99
|
|
|
Change in net unrealized gains on non-OTTI securities
|
|
|
509
|
|
|
|
(185
|
)
|
|
|
324
|
|
|
Change in net unrealized securities losses
|
|
|
696
|
|
|
|
(246
|
)
|
|
|
450
|
|
|
Change in net unrealized gains on cash flow hedge derivatives:
|
|
|
|
|
|
|
|
|
|
|
|
|
|
Increase in net unrealized gains during the period on cash flow hedge derivatives
|
|
|
280
|
|
|
|
(103
|
)
|
|
|
177
|
|
|
Less: Net gains realized in net income
|
|
|
245
|
|
|
|
(90
|
)
|
|
|
155
|
|
|
Change in net unrealized gains on cash flow hedge derivatives
|
|
|
35
|
|
|
|
(13
|
)
|
|
|
22
|
|
|
Change in pension and other postretirement benefit plan adjustments
|
|
|
11
|
|
|
|
(4
|
)
|
|
|
7
|
|
|
Change in other, net
|
|
|
39
|
|
|
|
(18
|
)
|
|
|
21
|
|
|
Change in other comprehensive income (loss)
|
|
$
|
781
|
|
|
$
|
(281
|
)
|
|
$
|
500
|
|
119
Accumulated Other Comprehensive Income (Loss) Components
|
|
|
|
|
|
|
|
|
|
|
|
|
|
|
|
|
|
|
|
|
June 30, 2011
|
|
|
December 31, 2010
|
|
|
In millions
|
|
Pretax
|
|
|
After-tax
|
|
|
Pretax
|
|
|
After-tax
|
|
|
Net unrealized securities gains
|
|
$
|
659
|
|
|
$
|
419
|
|
|
$
|
150
|
|
|
$
|
95
|
|
|
OTTI losses on debt securities
|
|
|
(834
|
)
|
|
|
(520
|
)
|
|
|
(1,021
|
)
|
|
|
(646
|
)
|
|
Net unrealized gains on cash flow hedge derivatives
|
|
|
859
|
|
|
|
544
|
|
|
|
824
|
|
|
|
522
|
|
|
Pension and other postretirement benefit plan adjustments
|
|
|
(587
|
)
|
|
|
(373
|
)
|
|
|
(598
|
)
|
|
|
(380
|
)
|
|
Other, net
|
|
|
(8
|
)
|
|
|
(1
|
)
|
|
|
(47
|
)
|
|
|
(22
|
)
|
|
Accumulated other comprehensive income (loss)
|
|
$
|
89
|
|
|
$
|
69
|
|
|
$
|
(692
|
)
|
|
$
|
(431
|
)
|
N
OTE
15 I
NCOME
T
AXES
The net operating loss carryforwards at June 30, 2011 and December 31, 2010 follow:
Net Operating Loss Carryforwards
|
|
|
|
|
|
|
|
|
|
|
In millions
|
|
June 30,
2011
|
|
|
December 31,
2010
|
|
|
Federal
|
|
$
|
30
|
|
|
$
|
54
|
|
|
State
|
|
|
1,485
|
|
|
|
1,600
|
|
|
Valuation allowance – State
|
|
|
21
|
|
|
|
21
|
|
The federal net operating loss carryforwards expire from 2027 to 2028. The state net operating loss carryforwards will
expire from 2011 to 2031.
PNC’s consolidated federal income tax returns through 2006 have been audited by the IRS and we have resolved
all matters through the IRS Appeals Division. The IRS began its examination of PNC’s 2007 and 2008 consolidated federal income tax returns during the third quarter of 2010.
The consolidated federal income tax returns of National City through 2007 have been audited by the IRS. Certain adjustments remain under review by the IRS Appeals Division for years 2003-2007. The IRS
began its examination of National City’s 2008 consolidated federal income tax return during the third quarter of 2010. Any potential adjustments have been considered in establishing our reserve for uncertain tax positions as of June 30, 2011.
We had unrecognized tax benefits of $285 million at June 30, 2011 and $238 million at December 31, 2010. At June 30, 2011, $119 million of
unrecognized tax benefits, if recognized, would favorably impact the effective tax rate.
It is reasonably possible that the liability for
uncertain tax positions could increase or decrease in the next twelve months due to completion of tax authorities’ exams or the expiration of statutes of limitations. Management estimates that the
liability for uncertain tax positions could decrease by $22 million within the next twelve months.
N
OTE
16 L
EGAL
P
ROCEEDINGS
We establish accruals for legal proceedings when information related to the loss contingencies represented by those matters indicates
both that a loss is probable and that the amount of loss can be reasonably estimated. Any such accruals are adjusted thereafter as appropriate to reflect changed circumstances. We also determine estimates of possible losses or ranges of possible
losses, whether in excess of any related accrued liability or where there is no accrued liability, for those matters disclosed in this Note 16 and also those matters disclosed in Note 22 Legal Proceedings in Part II, Item 8 of our 2010 Form
10-K and Note 16 Legal Proceedings in Part I, Item 1 of our first quarter 2011 Form 10-Q and still pending (collectively, “Prior Disclosure”) when we are able to do so. For disclosed matters where we are able to estimate such possible
losses or ranges of possible losses, as of June 30, 2011, we estimate that it is reasonably possible that we could incur losses in an aggregate amount up to approximately $425 million. The estimates included in this amount are based on our
analysis of currently available information and are subject to significant judgment and a variety of assumptions and uncertainties. As new information is obtained we may change our estimates. Due to the inherent subjectivity of the assessments and
unpredictability of outcomes of legal proceedings, any amounts accrued or included in this aggregate amount may not represent the ultimate loss to us from the legal proceedings in question. Thus, our exposure and ultimate losses may be higher or
lower, and possibly significantly so, than the amounts accrued or this aggregate amount.
The aggregate estimated amount provided above does
not include an estimate for every matter disclosed in this Note 16 or in Prior Disclosure, as we are unable, at this time, to estimate the losses that it is reasonably possible that we could incur or ranges of such losses with respect to some of the
matters disclosed for one or more of the following reasons. In our experience, legal proceedings are inherently unpredictable. In many legal proceedings, various factors exacerbate this inherent unpredictability, including, among others, one or more
of the following: the proceeding is in its early stages; the damages sought are unspecified, unsupported or uncertain; it is unclear whether a case brought as a class action will be allowed to proceed on that basis or, if permitted to proceed as a
class action, how the class will be defined; the plaintiff is seeking relief other than compensatory damages; the matter presents meaningful legal uncertainties, including novel issues of law; we have not engaged in meaningful settlement
discussions; discovery has not started or is not complete; there are significant facts in dispute; and there are a large number of parties named as defendants (including where it is uncertain how liability, if any, will be shared among
120
multiple defendants). Generally, the less progress that has been made in the proceedings or the broader the range of potential results, the harder it is for us to estimate losses or ranges of
losses that it is reasonably possible we could incur. Therefore, as the estimated aggregate amount disclosed above does not include all of the matters disclosed below, the amount disclosed above does not represent our maximum reasonably possible
loss exposure for all of the matters disclosed in this Note 16 or in Prior Disclosure. The estimated aggregate amount also does not reflect any of our exposure to matters not so disclosed, as discussed below under “Other.”
We include in some of the descriptions of individual matters in this Note 16 and in Prior Disclosure certain quantitative information related to the
plaintiff’s claim against us alleged in the plaintiff’s pleadings or otherwise publicly available. While information of this type may provide insight into the potential magnitude of a matter, it does not necessarily represent our estimate
of reasonably possible loss or our judgment as to any currently appropriate accrual.
Some of our exposure in matters described below may be
offset by applicable insurance coverage. We do not consider the possible availability of insurance coverage in determining the amounts of any accruals (although we record the amount of related insurance recoveries that are deemed probable up to the
amount of the accrual) or in determining any estimates of possible losses or ranges of possible losses.
Securities and State Law
Fiduciary Cases Against National City
In
In re National City Corporation Securities, Derivative & ERISA Litigation (The
Securities Case)
(MDL No. 2003, Case No: 1:08-nc-70004), pending in the United States District Court for the Northern District of Ohio, the parties entered into a memorandum of understanding in August 2011 providing for the settlement of the
lawsuit for $168 million. The settlement is conditioned on, among other things, final documentation, notice to the class and court approval. As a result of existing accruals and recorded probable insurance recoveries, the impact of this settlement
on PNC’s future results of operations is expected to be immaterial.
CBNV Mortgage Litigation
Status of MDL Proceedings in Pennsylvania.
In May 2011, in the lawsuits pending in the United States District Court for the Western District of
Pennsylvania under the caption
In re: Community Bank of Northern Virginia Mortgage Lending Practices Litigation
(MDL No. 1674), the plaintiffs collectively filed a motion seeking to file a joint amended consolidated class action complaint
covering all of the class action lawsuits pending in this proceeding. The proposed amended complaint names the Community Bank of Northern Virginia (CBNV), a predecessor to PNC Bank, another bank, and purchasers of loans originated by CBNV and the
other bank (including the Residential Funding Company, LLC) as
defendants. The proposed amended complaint alleges, among other things, that a group of persons and entities collectively characterized as the “Shumway/Bapst Organization” referred
prospective second residential mortgage loan borrowers to CBNV and the other bank, that CBNV and the other bank charged these borrowers improper title and loan fees at loan closings, that the disclosures provided to the borrowers at loan closings
were inaccurate, and that CBNV and the other bank paid some of the loan fees to the Shumway/Bapst Organization as purported “kickbacks” for the referrals. The proposed amended complaint asserts claims for violations of the Real Estate
Settlement Procedures Act, the Truth in Lending Act, as amended by the Home Owners Equity Protection Act (HOEPA), and the Racketeer Influenced and Corrupt Organizations Act.
The proposed amended complaint seeks to certify a class of all persons nationwide who obtained a second or subordinate, residential, federally related, non-purchase money, HOEPA qualifying mortgage loan
from CBNV or the other bank that was secured by residential real property used by the class member as a principal dwelling. The plaintiffs allege that there are approximately 50,000 members of this class. They seek, among other things, unspecified
damages (including tripled damages under RICO and RESPA), rescission of loans, declaratory and injunctive relief, interest, and attorneys’ fees.
Overdraft Litigation
In
Henry v. PNC Bank, National Association
(No.
GD-10-022974), the Court of Common Pleas of Allegheny County, Pennsylvania held a hearing on our Preliminary Objections in June 2011.
The
hearing on final approval of the proposed settlement in
Trombley, et al. v. National City Bank
(Civil Action No. 10-00232 (JDB)), pending in the United States District Court for the District of Columbia, took place in July 2011. The
settlement remains subject to final court approval. The amount of the settlement is not material to PNC and has been accrued.
Other
Mortgage-Related Litigation
|
|
•
|
|
In May 2011, the defendants filed a motion to dismiss the corrected amended complaint in
Federal Home Loan Bank of Chicago v. Bank of America
Funding Corp., et al.
(Case No. 10CH45033), pending in the Circuit Court of Cook County, Illinois.
|
|
|
•
|
|
In February 2011, a lawsuit (
National Organization of Assistance for Homeowners of California, et al. v. America’s Servicing Company, et
al.
, (Case No. 30-2011-00447677-CU-OR-CXC)) was filed in the Superior Court of the State of California for Orange County against PNC and numerous other financial institutions and mortgage servicing organizations. In July 2011, the
plaintiffs voluntarily dismissed the lawsuit without prejudice. The lawsuit had been brought as a class action by individual
|
121
|
|
|
plaintiffs, who alleged that they have obtained loans secured by deeds of trust on California real estate, and by a non-profit organization which purported, along with the individual plaintiffs,
to represent a class of similarly situated individuals. The plaintiffs had contended, among other things, that the defendants engaged in misrepresentations and fraudulent concealment in connection with the mortgage loan origination process, engaged
in wrongful foreclosure practices, caused notices of default to be issued against the plaintiffs in a manner not authorized by California law, made inaccurate credit disclosures regarding the plaintiffs, and disclosed the plaintiffs’ private
information without their authorization. The plaintiffs had alleged violations, among other things, of various provisions of California statutory law, the right to privacy provisions of the California Constitution, the federal Fair Credit Reporting
Act and the Gramm-Leach Bliley Act. The plaintiffs had sought, among other things, unspecified actual and punitive damages, statutory civil penalties, restitution, injunctive relief, interest, and attorneys’ fees.
|
Weavering Macro Fixed Income Fund
In July 2010, PNC completed the sale of GIS to The Bank of New York Mellon Corporation (BNY-Mellon), pursuant to a stock purchase agreement dated
February 1, 2010. In July 2009, the liquidators of the Weavering Macro Fixed Income Fund Limited (Weavering) issued a Plenary Summons in the High Court, Dublin, Ireland, in connection with a European subsidiary of GIS’s provision of
administration services to Weavering. The Plenary Summons was served on the GIS subsidiary on or about June 30, 2010. In May 2011, the liquidator served a Notice of Intention to Proceed and Statement of Claim, which alleges that the GIS
subsidiary breached its contractual duties to Weavering as well as an alleged duty of care to Weavering, and investors in Weavering, and makes claims of breach of the administration and accounting services agreement, negligence, gross negligence,
breach of duty, misrepresentation and negligent misstatement. The complaint further alleges that investors in Weavering lost approximately €282 million and also expended approximately €98 million in brokerage and exchange commissions,
interest, and fees as a result of the transactions at issue. The Statement of Claim seeks damages, costs, and interest.
In May 2011,
BNY-Mellon provided notice to PNC of an indemnification claim pursuant to the stock purchase agreement.
365/360 Litigation
PNC Bank and National City Bank have been named as defendants in three lawsuits seeking to certify classes of commercial borrowers
bringing claims for breach of contract
arising from the use of the 365/360 method of interest computation in certain commercial promissory notes. The first of these cases (
DK&D Properties, LLC v. National City Bank
(Case
no. 08 cv 680078)), was filed in December 2008 against National City Bank in the Court of Common Pleas of Cuyahoga County, Ohio. It seeks to certify a class consisting of certain Ohio commercial borrowers of National City Bank for these claims. In
July 2009, the court denied National City Bank’s motion to dismiss. The second case (
Kreisler & Kreisler, LLC v. National City Bank, et al.
(Case no. 4:10-cv-00956)) was filed in the United States District Court for the Eastern
District of Missouri in May 2010 against National City Bank and also purports to name “PNC Bank Corp.” as a defendant. It seeks to certify a national class of commercial borrowers for these claims. In March 2011, the district court granted
the defendants’ motion to dismiss the complaint. The plaintiff has appealed the district court’s grant of this motion to the United States Court of Appeals for the Eighth Circuit. In the third case (
PNC Bank, National Association v. St.
Louis PET Centers, LLC, et al.
(Case no. 10SL-CC01076)), a borrower filed a counterclaim against PNC Bank in the Circuit Court of County of St. Louis, Missouri in November, 2010. The claims and proposed class set forth in this complaint are
similar to those in
Kreisler & Kreisler
. We have filed a motion to strike the class action allegations in the counterclaim.
Plaintiffs in these cases allege generally that they obtained fixed or variable rate commercial loans from PNC Bank or National City Bank pursuant to
promissory notes or loan agreements setting forth annual or per annum interest rates, that the bank’s use of the 365/360 method of calculation of interest caused the borrower to pay interest over a calendar year at a higher rate than the per
annum rate stated in the promissory notes, and that this was a breach of the terms of the promissory notes. Plaintiffs in each of these cases seek declaratory and injunctive relief, compensatory damages, prejudgment interest, and attorneys’
fees.
Regulatory and Governmental Inquiries
As a result of the regulated nature of our business and that of a number of our subsidiaries, particularly in the banking and securities areas, we and our subsidiaries are the subject of investigations,
audits and other forms of regulatory inquiry, in some cases as part of regulatory reviews of specified activities at multiple industry participants, including those described below and in Prior Disclosure.
In April 2011, as a result of a publicly-disclosed interagency horizontal review of residential mortgage servicing operations at fourteen federally
regulated mortgage servicers, PNC entered into a consent order with the Board of Governors of the Federal Reserve System and PNC Bank entered into a consent order with the Office of the Comptroller of the Currency. Collectively, these consent orders
describe certain foreclosure-related practices and controls that the regulators
122
found to be deficient and require PNC and PNC Bank to, among other things, develop and implement plans and programs to enhance PNC’s residential mortgage servicing and foreclosure processes,
retain an independent consultant to review certain residential mortgage foreclosure actions, take certain remedial actions, and oversee compliance with the orders and the new plans and programs. The two orders do not foreclose the potential for
civil money penalties from either of these regulators.
In connection with these orders, PNC has established a Compliance Committee of the
Boards of PNC and PNC Bank to monitor and coordinate PNC’s and PNC Bank’s implementation of the commitments under the orders. PNC and PNC Bank have submitted proposed Action Plans to the regulators setting forth the plan to meet the
requirements of the orders. Consistent with the orders, PNC has also engaged an independent consultant to conduct a review of certain residential foreclosure actions, including those identified through borrower complaints, and identify whether any
remedial actions for borrowers are necessary. Pursuant to the proposed Action Plans, PNC is endeavoring to meet all of the requirements of the orders.
Other governmental, legislative and regulatory inquiries on this topic, referred to in Prior Disclosure, are ongoing, and may result in significant additional actions, penalties or other remedies. These
additional inquiries include a review of the servicers subject to the above-mentioned horizontal review by the Department of Justice, other federal regulators and state attorneys general. In connection with that review, it is understood that the
governmental regulators may seek substantial payments and other relief from the entities subject to the horizontal review, including PNC, and may also seek to impose national mortgage servicing standards. It is not currently known what relief will
be sought against PNC.
In addition, PNC has received subpoenas from the U.S. Attorney’s Office for the Southern District of New York
concerning lending practices of National City Bank and successors in connection with loans insured by the Federal Housing Administration (FHA) as well as certain non-FHA-insured loan origination, sale and securitization practices. The U.S.
Attorney’s Office inquiry is in its early stage and PNC is cooperating with the investigation. The outcome of the investigation is unknown, but it could result in penalties or other remedial actions.
Our practice is to cooperate fully with regulatory and governmental investigations, audits and other inquiries, including those described above and in
Prior Disclosure. Such investigations, audits and other inquiries may lead to remedies including fines, penalties, restitution or alterations in our business practices.
Other
In addition to the proceedings or other matters described above, PNC and persons to whom we may have indemnification obligations, in the normal course of business, are subject to various other pending and
threatened legal proceedings in which claims for monetary damages and other relief are asserted. We do not anticipate, at the present time, that the ultimate aggregate liability, if any, arising out of such other legal proceedings will have a
material adverse effect on our financial position. However, we cannot now determine whether or not any claims asserted against us or others to whom we may have indemnification obligations, whether in the proceedings or other matters described above,
described in Prior Disclosure, or otherwise, will have a material adverse effect on our results of operations in any future reporting period, which will depend on, among other things, the amount of the loss resulting from the claim and the amount of
income otherwise reported for the reporting period.
See Note 17 Commitments and Guarantees for additional information regarding the Visa
indemnification and our other obligations to provide indemnification, including to current and former officers, directors, employees and agents of PNC and companies we have acquired, including National City.
N
OTE
17 C
OMMITMENTS
AND
G
UARANTEES
Equity Funding and Other Commitments
Our unfunded commitments at June 30, 2011 included private equity investments of $285 million, and other investments of $6 million.
Standby Letters of Credit
We issue standby letters of credit and have risk
participations in standby letters of credit and bankers’ acceptances issued by other financial institutions, in each case to support obligations of our customers to third parties, such as remarketing programs for customers’ variable rate
demand notes. Net outstanding standby letters of credit and internal credit ratings were as follows:
Net Outstanding Standby Letters of
Credit
|
|
|
|
|
|
|
|
|
|
|
Dollars in billions
|
|
June 30
2011
|
|
|
December 31
2010
|
|
|
Net outstanding standby letters of credit
|
|
$
|
10.7
|
|
|
$
|
10.1
|
|
|
Internal credit ratings (as a percentage of portfolio):
|
|
|
|
|
|
|
|
|
|
Pass (a)
|
|
|
92
|
%
|
|
|
90
|
%
|
|
Below pass (b)
|
|
|
8
|
%
|
|
|
10
|
%
|
|
(a)
|
Indicates that expected risk of loss is currently low.
|
|
(b)
|
Indicates a higher degree of risk of default.
|
If the customer fails to meet its financial or performance obligation to the third party under the terms of the contract or
123
there is a need to support a remarketing program, then upon the request of the guaranteed party, we would be obligated to make payment to them. The standby letters of credit and risk
participations in standby letters of credit and bankers’ acceptances outstanding on June 30, 2011 had terms ranging from less than 1 year to 8 years. The aggregate maximum amount of future payments PNC could be required to make under
outstanding standby letters of credit and risk participations in standby letters of credit and bankers’ acceptances was $14.1 billion at June 30, 2011, of which $7.4 billion support remarketing programs.
As of June 30, 2011, assets of $1.9 billion secured certain specifically identified standby letters of credit. Recourse provisions from third
parties of $3.4 billion were also available for this purpose as of June 30, 2011. In addition, a portion of the remaining standby letters of credit and letter of credit risk participations issued on behalf of specific customers is also secured
by collateral or guarantees that secure the customers’ other obligations to us. The carrying amount of the liability for our obligations related to standby letters of credit and risk participations in standby letters of credit and bankers’
acceptances was $253 million at June 30, 2011.
Standby Bond Purchase Agreements and Other Liquidity Facilities
We enter into standby bond purchase agreements to support municipal bond obligations. At June 30, 2011, the aggregate of our commitments under these
facilities was $313 million. We also enter into certain other liquidity facilities to support individual pools of receivables acquired by commercial paper conduits. At June 30, 2011, our total commitments under these facilities were $145
million.
Indemnifications
As further described in our 2010 Form 10-K, we are a party to numerous acquisition or divestiture agreements under which we have purchased or sold, or agreed to purchase or sell, various types of assets.
These agreements generally include indemnification provisions under which we indemnify the third parties to these agreements against a variety of risks to the indemnified parties as a result of the transaction in question. When PNC is the seller,
the indemnification provisions will generally also provide the buyer with protection relating to the quality of the assets we are selling and the extent of any liabilities being assumed by the buyer. Due to the nature of these indemnification
provisions, we cannot quantify the total potential exposure to us resulting from them.
We provide indemnification in connection with
securities offering transactions in which we are involved. When we are the issuer of the securities, we provide indemnification to the underwriters or placement agents analogous to the indemnification provided to the purchasers of businesses from
us, as described above. When we are an underwriter or placement agent, we provide a limited indemnification to the issuer related to our actions in connection with the offering and, if there are
other underwriters, indemnification to the other underwriters intended to result in an appropriate sharing of the risk of participating in the offering. Due to the nature of these indemnification provisions, we cannot quantify the total potential
exposure to us resulting from them.
In the ordinary course of business, we enter into certain types of agreements that include provisions for
indemnifying third parties. We also enter into certain types of agreements, including leases, assignments of leases, and subleases, in which we agree to indemnify third parties for acts by our agents, assignees and/or sublessees, and employees. We
also enter into contracts for the delivery of technology service in which we indemnify the other party against claims of patent and copyright infringement by third parties. Due to the nature of these indemnification provisions, we cannot calculate
our aggregate potential exposure under them.
We engage in certain insurance activities that require our employees to be bonded. We satisfy
this bonding requirement by issuing letters of credit, which were insignificant in amount at June 30, 2011.
In the ordinary course of
business, we enter into contracts with third parties under which the third parties provide services on behalf of PNC. In many of these contracts, we agree to indemnify the third party service provider under certain circumstances. The terms of the
indemnity vary from contract to contract and the amount of the indemnification liability, if any, cannot be determined.
We are a general or
limited partner in certain asset management and investment limited partnerships, many of which contain indemnification provisions that would require us to make payments in excess of our remaining unfunded commitments. While in certain of these
partnerships the maximum liability to us is limited to the sum of our unfunded commitments and partnership distributions received by us, in the others the indemnification liability is unlimited. As a result, we cannot determine our aggregate
potential exposure for these indemnifications.
Pursuant to their bylaws, PNC and its subsidiaries provide indemnification to directors,
officers and, in some cases, employees and agents against certain liabilities incurred as a result of their service on behalf of or at the request of PNC and its subsidiaries. PNC and its subsidiaries also advance on behalf of covered individuals
costs incurred in connection with certain claims or proceedings, subject to written undertakings by each such individual to repay all amounts advanced if it is ultimately determined that the individual is not entitled to indemnification. We
generally are responsible for similar indemnifications and advancement obligations that companies we acquire had to their officers, directors and
124
sometimes employees and agents at the time of acquisition. We advanced such costs on behalf of several such individuals with respect to pending litigation or investigations during the first six
months of 2011. It is not possible for us to determine the aggregate potential exposure resulting from the obligation to provide this indemnity or to advance such costs.
In connection with the sale of GIS, and in addition to indemnification provisions as part of the divestiture agreements, PNC agreed to continue to act for the benefit of GIS as securities lending agent
for certain of GIS’s clients. In such role, we provide indemnification to those clients against the failure of the borrowers to return the securities. The market value of the securities lent is fully secured on a daily basis; therefore, the
exposure to us is limited to temporary shortfalls in the collateral as a result of short-term fluctuations in trading prices of the loaned securities. At June 30, 2011, the total maximum potential exposure as a result of these indemnity
obligations was $6.8 billion, although the collateral at the time exceeded that amount. In addition, the purchaser of GIS, BNY-Mellon, has entered into an agreement to indemnify PNC with respect to such exposure on the terms set forth in such
indemnification agreement. Effective July 18, 2011, PNC Bank, National Association assigned its securities lending agent responsibilities to BNY-Mellon and no longer acts as securities lending agent for any of GIS’s clients. Also in
connection with the GIS divestiture, PNC has agreed to indemnify the buyer generally as described above.
VISA Indemnification
Our payment services business issues and acquires credit and debit card transactions through Visa U.S.A. Inc. card association or its
affiliates (Visa). Our 2010 Form 10-K has additional information regarding the October 2007 Visa restructuring, our involvement with judgment and loss sharing agreements with Visa and certain other banks, and other 2010 developments in this area.
In March 2011, Visa funded $400 million to their litigation escrow account and reduced the conversion ratio of Visa B to A shares. We
consequently recognized our estimated $38 million share of the $400 million as a reduction of our previously established indemnification liability and a reduction of noninterest expense.
Our Visa indemnification liability included on our Consolidated Balance Sheet at June 30, 2011 totaled $32 million as a result of the indemnification provision in Section 2.05j of the Visa
By-Laws and/or the indemnification provided through the judgment and loss sharing agreements. Any ultimate exposure to the specified Visa litigation may be different than this amount.
Recourse and Repurchase Obligations
As discussed in Note 3 Loans Sale and Servicing
Activities and Variable Interest Entities, PNC has sold commercial
mortgage and residential mortgage loans directly or indirectly in securitizations and whole-loan sale transactions with continuing involvement. One form of continuing involvement includes certain
recourse and loan repurchase obligations associated with the transferred assets in these transactions.
Commercial Mortgage Recourse
Obligations
We originate, close and service certain multi-family commercial mortgage loans which are sold to FNMA under FNMA’s DUS
program. We have similar arrangements with FHLMC.
Under these programs, we generally assume up to a one-third pari passu risk of loss on
unpaid principal balances through a loss share arrangement. At June 30, 2011 and December 31, 2010, the unpaid principal balance outstanding of loans sold as a participant in these programs was $13.0 billion and $13.2 billion,
respectively. At June 30, 2011 and December 31, 2010, the potential maximum exposure under the loss share arrangements was $3.9 billion and $4.0 billion, respectively. We maintain a reserve for estimated losses based upon our exposure. The
reserve for losses under these programs totaled $55 million and $54 million as of June 30, 2011 and December 31, 2010, respectively, and is included in Other liabilities on our Consolidated Balance Sheet. The comparable reserve as of
June 30, 2010 was $39 million. If payment is required under these programs, we would not have a contractual interest in the collateral underlying the mortgage loans on which losses occurred, although the value of the collateral is taken into
account in determining our share of such losses. Our exposure and activity associated with these recourse obligations are reported in the Corporate & Institutional Banking segment.
Analysis of Commercial Mortgage Recourse Obligations
|
|
|
|
|
|
|
|
|
|
|
In millions
|
|
2011
|
|
|
2010
|
|
|
January 1
|
|
$
|
54
|
|
|
$
|
71
|
|
|
Reserve adjustments, net
|
|
|
4
|
|
|
|
(8
|
)
|
|
Losses – loan repurchases and settlements
|
|
|
(3
|
)
|
|
|
|
|
|
Loan sales
|
|
|
|
|
|
|
(24
|
)
|
|
June 30
|
|
$
|
55
|
|
|
$
|
39
|
|
Residential Mortgage Loan Repurchase Obligations
While residential mortgage loans are sold on a non-recourse basis, we assume certain loan repurchase obligations associated with mortgage loans we have sold to investors. These loan repurchase obligations
primarily relate to situations where PNC is alleged to have breached certain origination covenants and representations and warranties made to purchasers of the loans in the respective purchase and sale agreements. Residential mortgage loans covered
by these loan repurchase obligations include first and second-lien mortgage loans we have sold through Agency securitizations, Non-Agency securitizations, and whole-loan sale transactions. As discussed in Note 3 in our 2010 Form 10-K, Agency
125
securitizations consist of mortgage loans sale transactions with FNMA, FHLMC, and GNMA, while Non-Agency securitizations and whole-loan sale transactions consist of mortgage loans sale
transactions with private investors. Our exposure and activity associated with Agency securitization repurchase obligations has primarily been related to transactions with FNMA and FHLMC, as indemnification and repurchase losses associated with FHA
and VA-insured loans pooled in GNMA securitizations historically have been minimal. Repurchase obligation activity associated with residential mortgages is reported in the Residential Mortgage Banking segment.
PNC’s residential mortgage loan repurchase obligations also include certain brokered home equity loans/lines that were sold to a limited number of
private investors in the financial services industry by National City prior to our acquisition. PNC is no longer engaged in the brokered home equity lending business, and our exposure under these loan repurchase obligations is limited to repurchases
of whole-loans sold in these transactions. Repurchase activity associated with brokered home equity loans/lines is reported in the Distressed Assets Portfolio segment.
Loan covenants and representations and warranties are established through loan sale agreements with various investors to provide assurance that PNC has sold loans to investors of sufficient investment
quality. Key aspects of such covenants and representations and warranties include the loan’s compliance with any applicable loan criteria established by the investor, including underwriting standards, delivery of all required loan documents to
the investor or its designated party, sufficient collateral valuation, and the validity of the lien securing the loan. As a result of alleged breaches of these contractual obligations, investors may request PNC to indemnify them against losses on
certain loans or to repurchase loans.
These investor indemnification or repurchase claims are typically settled on an individual loan basis
through make-whole payments or loan repurchases; however, on occasion we may negotiate pooled settlements with investors.
Indemnifications
for loss or loan repurchases typically occur when, after review of the claim, we agree insufficient
evidence exists to dispute the investor’s claim that a breach of a loan covenant and representation and warranty has occurred, such breach has not been cured, and the effect of such breach
is deemed to have had a material and adverse effect on the value of the transferred loan. Depending on the sale agreement and upon proper notice from the investor, we typically respond to such indemnification and repurchase requests within 60 days,
although final resolution of the claim may take a longer period of time. With the exception of the sales agreements associated with the Agency securitizations, most sale agreements do not provide for penalties or other remedies if we do not respond
timely to investor indemnification or repurchase requests.
Origination and sale of residential mortgages is an ongoing business activity and,
accordingly, management continually assesses the need for indemnification and repurchase liabilities pursuant to the associated investor sale agreements. We establish indemnification and repurchase liabilities for estimated losses on sold first and
second-lien mortgages and home equity loans/lines for which indemnification is expected to be provided or for loans that are expected to be repurchased. For the first and second-lien mortgage sold portfolio, we have established an indemnification
and repurchase liability pursuant to investor sale agreements based on claims made and our estimate of future claims on a loan by loan basis. These relate primarily to loans originated during 2006-2008. For the home equity loans/lines sold
portfolio, we have established indemnification and repurchase liabilities based upon this same methodology for loans sold during 2005-2007.
Indemnification and repurchase liabilities are initially recognized when loans are sold to investors and are subsequently evaluated by management.
Initial recognition and subsequent adjustments to the indemnification and repurchase liability for the sold residential mortgage portfolio are recognized in Residential mortgage revenue on the Consolidated Income Statement. Since PNC is no longer
engaged in the brokered home equity lending business, only subsequent adjustments are recognized to the home equity loans/lines indemnification and repurchase liability. These adjustments are recognized in Other noninterest income on the
Consolidated Income Statement.
126
Management’s subsequent evaluation of these indemnification and repurchase liabilities is based upon
trends in indemnification and repurchase requests, actual loss experience, risks in the underlying serviced loan portfolios, and current economic conditions. As part of its evaluation, management considers estimated loss projections over the life of
the subject loan portfolio. At June 30, 2011 and December 31, 2010, the total indemnification and repurchase liability for estimated losses on indemnification and repurchase claims totaled $150 million and $294 million, respectively, and
was included in Other liabilities on the Consolidated Balance Sheet. The comparable reserve as of June 30, 2010 was $211 million. An analysis of the changes in this liability during the first six months of 2011 and 2010 follows:
Analysis of Indemnification and Repurchase Liability for Asserted Claims and Unasserted Claims
|
|
|
|
|
|
|
|
|
|
|
|
|
|
|
|
|
|
|
|
|
|
|
|
|
|
|
|
|
2011
|
|
|
2010
|
|
|
In millions
|
|
Residential
Mortgages
(a)
|
|
|
Home
Equity
Loans/
Lines
(b)
|
|
|
Total
|
|
|
Residential
Mortgages
(a)
|
|
|
Home
Equity
Loans/
Lines (b)
|
|
|
Total
|
|
|
January 1
|
|
$
|
144
|
|
|
$
|
150
|
|
|
$
|
294
|
|
|
$
|
229
|
|
|
$
|
41
|
|
|
$
|
270
|
|
|
Reserve adjustments, net
|
|
|
35
|
|
|
|
3
|
|
|
|
38
|
|
|
|
50
|
|
|
|
20
|
|
|
|
70
|
|
|
Losses - loan repurchases and settlements
|
|
|
(84
|
)
|
|
|
(98
|
)
|
|
|
(182
|
)
|
|
|
(120
|
)
|
|
|
(9
|
)
|
|
|
(129
|
)
|
|
June 30
|
|
$
|
95
|
|
|
$
|
55
|
|
|
$
|
150
|
|
|
$
|
159
|
|
|
$
|
52
|
|
|
$
|
211
|
|
|
(a)
|
Repurchase obligation associated with sold loan portfolios of $130.7 billion and $152.7 billion at June 30, 2011 and June 30, 2010, respectively.
|
|
(b)
|
Repurchase obligation associated with sold loan portfolios of $4.6 billion and $7.2 billion at June 30, 2011 and June 30, 2010, respectively. PNC is no longer
engaged in the brokered home equity business, which was acquired with National City.
|
Management believes our indemnification and repurchase liabilities appropriately reflect the estimated
probable losses on investor indemnification and repurchase claims at June 30, 2011 and 2010. While management seeks to obtain all relevant information in estimating the indemnification and repurchase liability, the estimation process is inherently
uncertain and imprecise and, accordingly, it is reasonably possible that future indemnification and repurchase losses could be more or less than our established liability. Factors that could affect our estimate include the volume of valid claims
driven by investor strategies and behavior, our ability to successfully negotiate claims with investors, housing prices, and other economic conditions. At June 30, 2011, we estimate that it is reasonably possible that we could incur additional
losses in excess of our indemnification and repurchase liability of up to $54 million. This estimate of potential additional losses in excess of our liability is based on assumed higher investor demands, lower claim rescissions, and lower home
prices than our current assumptions.
R
EINSURANCE
A
GREEMENTS
We have two wholly-owned captive insurance subsidiaries which provide reinsurance to third-party insurers related to insurance sold to our customers.
These subsidiaries enter into various types of reinsurance agreements with third-party insurers where the subsidiary assumes the risk of loss through either an excess of loss or quota share agreement up to 100% reinsurance. In excess of loss
agreements, these subsidiaries assume the risk of loss for an excess layer of coverage up to specified limits, once a defined first loss percentage is met. In quota share agreements, the subsidiaries and third-party insurers share the responsibility
for payment of all claims.
These subsidiaries provide reinsurance for accidental death & dismemberment, credit life,
accident & health, lender placed
hazard, and borrower and lender paid mortgage insurance with an aggregate maximum exposure up to the specified limits for all reinsurance contracts as follows:
R
EINSURANCE
A
GREEMENTS
E
XPOSURE
|
|
|
|
|
|
|
|
|
|
|
In millions
|
|
June 30,
2011
|
|
|
December 31,
2010
|
|
|
Accidental Death & Dismemberment
|
|
$
|
2,372
|
|
|
$
|
2,367
|
|
|
Credit Life, Accident & Health
|
|
|
973
|
|
|
|
1,003
|
|
|
Lender Placed Hazard (a)
|
|
|
1,987
|
|
|
|
709
|
|
|
Borrower and Lender Paid Mortgage Insurance
|
|
|
381
|
|
|
|
463
|
|
|
Maximum Exposure
|
|
$
|
5,713
|
|
|
$
|
4,542
|
|
|
|
|
|
|
Percentage of reinsurance agreements:
|
|
|
|
|
|
|
|
|
|
Excess of Loss – Mortgage Insurance
|
|
|
6
|
%
|
|
|
8
|
%
|
|
Quota Share
|
|
|
94
|
%
|
|
|
92
|
%
|
|
|
|
|
|
Maximum Exposure to Quota Share Agreements with 100% Reinsurance
|
|
$
|
973
|
|
|
$
|
1,001
|
|
|
(a)
|
Lender Placed Hazard contract including stop loss provision expired in the third quarter of 2010. Stop loss provision not available on replacement contract.
|
A rollforward of the reinsurance reserves for probable losses for the first six months of 2011 and 2010 follows:
R
EINSURANCE
R
ESERVES
– R
OLLFORWARD
|
|
|
|
|
|
|
|
|
|
|
In millions
|
|
2011
|
|
|
2010
|
|
|
January 1
|
|
$
|
150
|
|
|
$
|
220
|
|
|
Paid Losses
|
|
|
(73
|
)
|
|
|
(43
|
)
|
|
Net Provision
|
|
|
16
|
|
|
|
21
|
|
|
Changes to Agreements
|
|
|
|
|
|
|
(3
|
)
|
|
June 30
|
|
$
|
93
|
|
|
$
|
195
|
|
Changes to agreements only represent entering into a new relationship or exiting an existing agreement entirely. The
127
impact of changing the terms of existing agreements is reflected in the net provision.
There is a reasonable possibility that losses could be more than or less than the amount reserved due to on-going uncertainty in various economic, social
and other factors that could impact the frequency and severity of claims covered by these reinsurance agreements. At June 30, 2011, the reasonably possible loss above our accrual is not material.
Repurchase and Resale Agreements
We enter into repurchase and resale agreements where we transfer investment securities to/from a third party with the agreement to repurchase/resell those
investment securities at a future date for a specified price. These transactions are accounted for as collateralized borrowings/financings.
N
OTE
18 S
EGMENT
R
EPORTING
We have 6 reportable business segments:
|
|
•
|
|
Corporate & Institutional Banking
|
|
|
•
|
|
Residential Mortgage Banking
|
|
|
•
|
|
Distressed Assets Portfolio
|
Results of individual businesses are presented based on our management accounting practices and management structure. There is no comprehensive,
authoritative body of guidance for management accounting equivalent to GAAP; therefore, the financial results of our individual businesses are not necessarily comparable with similar information for any other company. We refine our methodologies
from time to time as our management accounting practices are enhanced and our businesses and management structure change.
Financial results
are presented, to the extent practicable, as if each business operated on a stand-alone basis. As permitted under GAAP, we have aggregated the business results for certain similar operating segments for financial reporting purposes.
Assets receive a funding charge and liabilities and capital receive a funding credit based on a transfer pricing methodology that incorporates product
maturities, duration and other factors.
Capital is intended to cover unexpected losses and is assigned to our business segments using our
risk-based economic capital model, including consideration of the goodwill and other intangible assets at those business segments, as well as the diversification of risk among the business segments. We have revised certain capital allocations among
our business segments, including amounts for prior periods. PNC’s total capital did not change as a result of these adjustments for any periods presented.
We have allocated the allowances for loan and lease losses and unfunded loan commitments and letters of
credit based on our assessment of risk in each business segment’s loan portfolio. Our allocation of the costs incurred by operations and other shared support areas not directly aligned with the businesses is primarily based on the use of
services.
Total business segment financial results differ from consolidated income from continuing operations before noncontrolling
interests, which itself excludes the earnings and revenue attributable to GIS through June 30, 2010 that is reflected in discontinued operations. The impact of these differences is reflected in the “Other” category in the business
segment tables. “Other” includes residual activities that do not meet the criteria for disclosure as a separate reportable business, such as gains or losses related to BlackRock transactions including LTIP share distributions and
obligations, integration costs, asset and liability management activities including net securities gains or losses, other-than-temporary impairment of investment securities and certain trading activities, exited businesses, equity management
activities, alternative investments, intercompany eliminations, most corporate overhead, tax adjustments that are not allocated to business segments, and differences between business segment performance reporting and financial statement reporting
(GAAP), including the presentation of net income attributable to noncontrolling interests. Assets, revenue and earnings attributable to foreign activities were not material in the periods presented for comparative purposes.
B
USINESS
S
EGMENT
P
RODUCTS
AND
S
ERVICES
Retail Banking
provides deposit, lending, brokerage, investment management, and cash management services to consumer and small business
customers within our primary geographic markets. Our customers are serviced through our branch network, call centers and online banking. The branch network is located primarily in Pennsylvania, Ohio, New Jersey, Michigan, Maryland, Illinois,
Indiana, Kentucky, Florida, Virginia, Missouri, Delaware, Washington, D.C., and Wisconsin.
Corporate & Institutional Banking
provides lending, treasury management, and capital markets-related products and services to mid-sized corporations, government and not-for-profit entities, and selectively to large corporations. Lending products include secured and unsecured
loans, letters of credit and equipment leases. Treasury management services include cash and investment management, receivables management, disbursement services, funds transfer services, information reporting, and global trade services. Capital
markets-related products and services include foreign exchange, derivatives, loan syndications, mergers and acquisitions advisory and related services to middle-market companies, our multi-seller conduit, securities underwriting, and securities
sales and trading. Corporate & Institutional Banking also provides commercial loan servicing, and real
128
estate advisory and technology solutions for the commercial real estate finance industry. Corporate & Institutional Banking provides products and services generally within our primary
geographic markets, with certain products and services offered nationally and internationally.
Asset Management Group
includes
personal wealth management for high net worth and ultra high net worth clients and institutional asset management. Wealth management products and services include financial planning, customized investment management, private banking, tailored credit
solutions and trust management and administration for individuals and their families. Institutional asset management provides investment management, custody, and retirement planning services. The institutional clients include corporations, unions,
municipalities, non-profits, foundations and endowments located primarily in our geographic footprint.
Residential Mortgage
Banking
directly originates primarily first lien residential mortgage loans on a nationwide basis with a significant presence within the retail banking footprint, and also originates loans through majority or minority owned affiliates.
Mortgage loans represent loans collateralized by one-to-four-family residential real estate. These loans are typically underwritten to government agency and/or third party standards, and sold, servicing retained, to secondary mortgage conduits FNMA,
FHLMC, Federal Home Loan Banks and third-party investors, or are securitized and issued under the GNMA program. The mortgage servicing operation
performs all functions related to servicing mortgage loans – primarily those in first lien position – for various investors and for loans owned by PNC. Certain loans originated through
majority or minority owned affiliates are sold to others.
BlackRock
is the largest publicly traded
investment management firm in the world. BlackRock manages assets on behalf of institutional and individual investors worldwide through a variety of equity, fixed income, multi-asset class, alternative and cash management separate accounts and
funds, including iShares
®
, the global product leader in exchange-traded funds. In addition, BlackRock provides
market risk management, financial markets advisory and enterprise investment system services globally to a broad base of clients. At June 30, 2011, our economic interest in BlackRock was 22%.
PNC received cash dividends from BlackRock of $107 million and $93 million during the six months ended June 30, 2011, and June 30, 2010,
respectively.
Distressed Assets Portfolio
includes commercial residential development loans, cross-border leases, consumer
brokered home equity loans, retail mortgages, non-prime mortgages, and residential construction loans. These loans require special servicing and management oversight given current market conditions. We obtained the majority of these loans through
acquisitions of other companies.
129
Results Of Businesses
|
|
|
|
|
|
|
|
|
|
|
|
|
|
|
|
|
|
|
|
|
|
|
|
|
|
|
|
|
|
|
|
|
|
|
Three months ended June 30
In millions
|
|
Retail
Banking
|
|
|
Corporate &
Institutional
Banking
|
|
|
Asset
Management
Group
|
|
|
Residential
Mortgage
Banking
|
|
|
BlackRock
|
|
|
Distressed
Assets
Portfolio
|
|
|
Other
|
|
|
Consolidated
|
|
|
2011
|
|
|
|
|
|
|
|
|
|
|
|
|
|
|
|
|
|
|
|
|
|
|
|
|
|
|
|
|
|
|
|
|
|
Income Statement
|
|
|
|
|
|
|
|
|
|
|
|
|
|
|
|
|
|
|
|
|
|
|
|
|
|
|
|
|
|
|
|
|
|
Net interest income
|
|
$
|
809
|
|
|
$
|
831
|
|
|
$
|
59
|
|
|
$
|
47
|
|
|
|
|
|
|
$
|
257
|
|
|
$
|
147
|
|
|
$
|
2,150
|
|
|
Noninterest income
|
|
|
461
|
|
|
|
332
|
|
|
|
167
|
|
|
|
172
|
|
|
$
|
121
|
|
|
|
13
|
|
|
|
186
|
|
|
|
1,452
|
|
|
Total revenue
|
|
|
1,270
|
|
|
|
1,163
|
|
|
|
226
|
|
|
|
219
|
|
|
|
121
|
|
|
|
270
|
|
|
|
333
|
|
|
|
3,602
|
|
|
Provision for credit losses (benefit)
|
|
|
180
|
|
|
|
31
|
|
|
|
(18
|
)
|
|
|
(8
|
)
|
|
|
|
|
|
|
81
|
|
|
|
14
|
|
|
|
280
|
|
|
Depreciation and amortization
|
|
|
46
|
|
|
|
36
|
|
|
|
10
|
|
|
|
3
|
|
|
|
|
|
|
|
|
|
|
|
68
|
|
|
|
163
|
|
|
Other noninterest expense
|
|
|
975
|
|
|
|
407
|
|
|
|
158
|
|
|
|
137
|
|
|
|
|
|
|
|
56
|
|
|
|
280
|
|
|
|
2,013
|
|
|
Income (loss) from continuing operations before income taxes and noncontrolling interests
|
|
|
69
|
|
|
|
689
|
|
|
|
76
|
|
|
|
87
|
|
|
|
121
|
|
|
|
133
|
|
|
|
(29
|
)
|
|
|
1,146
|
|
|
Income taxes (benefit)
|
|
|
25
|
|
|
|
241
|
|
|
|
28
|
|
|
|
32
|
|
|
|
28
|
|
|
|
49
|
|
|
|
(169
|
)
|
|
|
234
|
|
|
Income from continuing operations before noncontrolling interests
|
|
$
|
44
|
|
|
$
|
448
|
|
|
$
|
48
|
|
|
$
|
55
|
|
|
$
|
93
|
|
|
$
|
84
|
|
|
$
|
140
|
|
|
$
|
912
|
|
|
Inter-segment revenue
|
|
$
|
1
|
|
|
$
|
6
|
|
|
$
|
3
|
|
|
$
|
2
|
|
|
$
|
4
|
|
|
$
|
(2
|
)
|
|
$
|
(14
|
)
|
|
|
|
|
|
Average Assets (a)
|
|
$
|
65,756
|
|
|
$
|
79,012
|
|
|
$
|
6,655
|
|
|
$
|
10,822
|
|
|
$
|
5,596
|
|
|
$
|
13,370
|
|
|
$
|
79,895
|
|
|
$
|
261,106
|
|
|
2010
|
|
|
|
|
|
|
|
|
|
|
|
|
|
|
|
|
|
|
|
|
|
|
|
|
|
|
|
|
|
|
|
|
|
Income Statement
|
|
|
|
|
|
|
|
|
|
|
|
|
|
|
|
|
|
|
|
|
|
|
|
|
|
|
|
|
|
|
|
|
|
Net interest income
|
|
$
|
878
|
|
|
$
|
922
|
|
|
$
|
62
|
|
|
$
|
70
|
|
|
|
|
|
|
$
|
348
|
|
|
$
|
155
|
|
|
$
|
2,435
|
|
|
Noninterest income
|
|
|
510
|
|
|
|
296
|
|
|
|
155
|
|
|
|
182
|
|
|
$
|
99
|
|
|
|
10
|
|
|
|
225
|
|
|
|
1,477
|
|
|
Total revenue
|
|
|
1,388
|
|
|
|
1,218
|
|
|
|
217
|
|
|
|
252
|
|
|
|
99
|
|
|
|
358
|
|
|
|
380
|
|
|
|
3,912
|
|
|
Provision for credit losses (benefit)
|
|
|
280
|
|
|
|
97
|
|
|
|
14
|
|
|
|
(8
|
)
|
|
|
|
|
|
|
404
|
|
|
|
36
|
|
|
|
823
|
|
|
Depreciation and amortization
|
|
|
59
|
|
|
|
37
|
|
|
|
10
|
|
|
|
1
|
|
|
|
|
|
|
|
|
|
|
|
71
|
|
|
|
178
|
|
|
Other noninterest expense
|
|
|
935
|
|
|
|
385
|
|
|
|
150
|
|
|
|
108
|
|
|
|
|
|
|
|
75
|
|
|
|
171
|
|
|
|
1,824
|
|
|
Income (loss) from continuing operations before income taxes and noncontrolling interests
|
|
|
114
|
|
|
|
699
|
|
|
|
43
|
|
|
|
151
|
|
|
|
99
|
|
|
|
(121
|
)
|
|
|
102
|
|
|
|
1,087
|
|
|
Income taxes (benefit)
|
|
|
34
|
|
|
|
251
|
|
|
|
16
|
|
|
|
60
|
|
|
|
22
|
|
|
|
(42
|
)
|
|
|
(35
|
)
|
|
|
306
|
|
|
Income (loss) from continuing operations before noncontrolling interests
|
|
$
|
80
|
|
|
$
|
448
|
|
|
$
|
27
|
|
|
$
|
91
|
|
|
$
|
77
|
|
|
$
|
(79
|
)
|
|
$
|
137
|
|
|
$
|
781
|
|
|
Inter-segment revenue
|
|
|
|
|
|
$
|
4
|
|
|
$
|
2
|
|
|
$
|
3
|
|
|
$
|
7
|
|
|
$
|
(4
|
)
|
|
$
|
(12
|
)
|
|
|
|
|
|
Average Assets (a)
|
|
$
|
68,004
|
|
|
$
|
77,029
|
|
|
$
|
6,992
|
|
|
$
|
8,686
|
|
|
$
|
6,125
|
|
|
$
|
18,516
|
|
|
$
|
79,014
|
|
|
$
|
264,366
|
|
130
|
|
|
|
|
|
|
|
|
|
|
|
|
|
|
|
|
|
|
|
|
|
|
|
|
|
|
|
|
|
|
|
|
|
|
|
|
|
|
|
|
|
|
|
|
Six months ended June 30
In millions
|
|
Retail
Banking
|
|
|
Corporate &
Institutional
Banking
|
|
|
Asset
Management
Group
|
|
|
Residential
Mortgage
Banking
|
|
|
BlackRock
|
|
|
Distressed
Assets
Portfolio
|
|
|
Other
|
|
|
Consolidated
|
|
|
2011
|
|
|
|
|
|
|
|
|
|
|
|
|
|
|
|
|
|
|
|
|
|
|
|
|
|
|
|
|
|
|
|
|
|
Income Statement
|
|
|
|
|
|
|
|
|
|
|
|
|
|
|
|
|
|
|
|
|
|
|
|
|
|
|
|
|
|
|
|
|
|
Net interest income
|
|
$
|
1,627
|
|
|
$
|
1,613
|
|
|
$
|
119
|
|
|
$
|
103
|
|
|
|
|
|
|
$
|
493
|
|
|
$
|
371
|
|
|
$
|
4,326
|
|
|
Noninterest income
|
|
|
890
|
|
|
|
631
|
|
|
|
329
|
|
|
|
374
|
|
|
$
|
229
|
|
|
|
22
|
|
|
|
432
|
|
|
|
2,907
|
|
|
Total revenue
|
|
|
2,517
|
|
|
|
2,244
|
|
|
|
448
|
|
|
|
477
|
|
|
|
229
|
|
|
|
515
|
|
|
|
803
|
|
|
|
7,233
|
|
|
Provision for credit losses (benefit)
|
|
|
456
|
|
|
|
1
|
|
|
|
(24
|
)
|
|
|
|
|
|
|
|
|
|
|
233
|
|
|
|
35
|
|
|
|
701
|
|
|
Depreciation and amortization
|
|
|
93
|
|
|
|
79
|
|
|
|
20
|
|
|
|
5
|
|
|
|
|
|
|
|
|
|
|
|
137
|
|
|
|
334
|
|
|
Other noninterest expense
|
|
|
1,929
|
|
|
|
809
|
|
|
|
308
|
|
|
|
272
|
|
|
|
|
|
|
|
109
|
|
|
|
485
|
|
|
|
3,912
|
|
|
Income from continuing operations before income taxes and noncontrolling interests
|
|
|
39
|
|
|
|
1,355
|
|
|
|
144
|
|
|
|
200
|
|
|
|
229
|
|
|
|
173
|
|
|
|
146
|
|
|
|
2,286
|
|
|
Income taxes (benefit)
|
|
|
13
|
|
|
|
475
|
|
|
|
53
|
|
|
|
74
|
|
|
|
50
|
|
|
|
64
|
|
|
|
(187
|
)
|
|
|
542
|
|
|
Income from continuing operations before noncontrolling interests
|
|
$
|
26
|
|
|
$
|
880
|
|
|
$
|
91
|
|
|
$
|
126
|
|
|
$
|
179
|
|
|
$
|
109
|
|
|
$
|
333
|
|
|
$
|
1,744
|
|
|
Inter-segment revenue
|
|
$
|
1
|
|
|
$
|
9
|
|
|
$
|
6
|
|
|
$
|
4
|
|
|
$
|
8
|
|
|
$
|
(5
|
)
|
|
$
|
(23
|
)
|
|
|
|
|
|
Average Assets (a)
|
|
$
|
66,210
|
|
|
$
|
78,002
|
|
|
$
|
6,786
|
|
|
$
|
11,218
|
|
|
$
|
5,596
|
|
|
$
|
13,743
|
|
|
$
|
80,271
|
|
|
$
|
261,826
|
|
|
2010
|
|
|
|
|
|
|
|
|
|
|
|
|
|
|
|
|
|
|
|
|
|
|
|
|
|
|
|
|
|
|
|
|
|
Income Statement
|
|
|
|
|
|
|
|
|
|
|
|
|
|
|
|
|
|
|
|
|
|
|
|
|
|
|
|
|
|
|
|
|
|
Net interest income
|
|
$
|
1,747
|
|
|
$
|
1,804
|
|
|
$
|
125
|
|
|
$
|
144
|
|
|
|
|
|
|
$
|
690
|
|
|
$
|
304
|
|
|
$
|
4,814
|
|
|
Noninterest income
|
|
|
1,000
|
|
|
|
667
|
|
|
|
319
|
|
|
|
336
|
|
|
$
|
198
|
|
|
|
(2
|
)
|
|
|
343
|
|
|
|
2,861
|
|
|
Total revenue
|
|
|
2,747
|
|
|
|
2,471
|
|
|
|
444
|
|
|
|
480
|
|
|
|
198
|
|
|
|
688
|
|
|
|
647
|
|
|
|
7,675
|
|
|
Provision for credit losses (benefit)
|
|
|
619
|
|
|
|
333
|
|
|
|
23
|
|
|
|
(24
|
)
|
|
|
|
|
|
|
569
|
|
|
|
54
|
|
|
|
1,574
|
|
|
Depreciation and amortization
|
|
|
122
|
|
|
|
71
|
|
|
|
20
|
|
|
|
2
|
|
|
|
|
|
|
|
|
|
|
|
146
|
|
|
|
361
|
|
|
Other noninterest expense
|
|
|
1,847
|
|
|
|
797
|
|
|
|
296
|
|
|
|
227
|
|
|
|
|
|
|
|
123
|
|
|
|
464
|
|
|
|
3,754
|
|
|
Income (loss) from continuing operations before income taxes and noncontrolling interests
|
|
|
159
|
|
|
|
1,270
|
|
|
|
105
|
|
|
|
275
|
|
|
|
198
|
|
|
|
(4
|
)
|
|
|
(17
|
)
|
|
|
1,986
|
|
|
Income taxes (benefit)
|
|
|
55
|
|
|
|
454
|
|
|
|
39
|
|
|
|
106
|
|
|
|
44
|
|
|
|
2
|
|
|
|
(143
|
)
|
|
|
557
|
|
|
Income (loss) from continuing operations before noncontrolling interests
|
|
$
|
104
|
|
|
$
|
816
|
|
|
$
|
66
|
|
|
$
|
169
|
|
|
$
|
154
|
|
|
$
|
(6
|
)
|
|
$
|
126
|
|
|
$
|
1,429
|
|
|
Inter-segment revenue
|
|
|
|
|
|
$
|
20
|
|
|
$
|
6
|
|
|
$
|
5
|
|
|
$
|
11
|
|
|
$
|
(7
|
)
|
|
$
|
(35
|
)
|
|
|
|
|
|
Average Assets (a)
|
|
$
|
68,178
|
|
|
$
|
78,295
|
|
|
$
|
7,016
|
|
|
$
|
8,770
|
|
|
$
|
6,125
|
|
|
$
|
19,009
|
|
|
$
|
78,356
|
|
|
$
|
265,749
|
|
|
(a)
|
Period-end balances for BlackRock.
|
131
Statistical Information (Unaudited)
The PNC Financial Services Group, Inc.
Average Consolidated Balance Sheet And Net Interest Analysis
|
|
|
|
|
|
|
|
|
|
|
|
|
|
|
|
|
|
|
|
|
|
|
|
|
|
|
|
|
Six months ended June 30
|
|
|
|
|
2011
|
|
|
2010
|
|
|
Taxable-equivalent basis
Dollars in millions
|
|
Average
Balances
|
|
|
Interest
Income/
Expense
|
|
|
Average
Yields/
Rates
|
|
|
Average
Balances
|
|
|
Interest
Income/
Expense
|
|
|
Average
Yields/
Rates
|
|
|
Assets
|
|
|
|
|
|
|
|
|
|
|
|
|
|
|
|
|
|
|
|
|
|
|
|
|
|
Interest-earning assets:
|
|
|
|
|
|
|
|
|
|
|
|
|
|
|
|
|
|
|
|
|
|
|
|
|
|
Investment securities
|
|
|
|
|
|
|
|
|
|
|
|
|
|
|
|
|
|
|
|
|
|
|
|
|
|
Securities available for sale
|
|
|
|
|
|
|
|
|
|
|
|
|
|
|
|
|
|
|
|
|
|
|
|
|
|
Residential mortgage-backed
|
|
|
|
|
|
|
|
|
|
|
|
|
|
|
|
|
|
|
|
|
|
|
|
|
|
Agency
|
|
$
|
27,555
|
|
|
$
|
504
|
|
|
|
3.66
|
%
|
|
$
|
21,150
|
|
|
$
|
424
|
|
|
|
4.00
|
%
|
|
Non-agency
|
|
|
7,836
|
|
|
|
210
|
|
|
|
5.35
|
|
|
|
9,783
|
|
|
|
290
|
|
|
|
5.92
|
|
|
Commercial mortgage-backed
|
|
|
3,288
|
|
|
|
78
|
|
|
|
4.73
|
|
|
|
4,153
|
|
|
|
110
|
|
|
|
5.30
|
|
|
Asset-backed
|
|
|
2,972
|
|
|
|
38
|
|
|
|
2.55
|
|
|
|
1,843
|
|
|
|
43
|
|
|
|
4.66
|
|
|
US Treasury and government agencies
|
|
|
5,090
|
|
|
|
63
|
|
|
|
2.49
|
|
|
|
8,104
|
|
|
|
121
|
|
|
|
2.98
|
|
|
State and municipal
|
|
|
2,158
|
|
|
|
50
|
|
|
|
4.65
|
|
|
|
1,360
|
|
|
|
40
|
|
|
|
5.88
|
|
|
Other debt
|
|
|
3,785
|
|
|
|
49
|
|
|
|
2.58
|
|
|
|
2,202
|
|
|
|
34
|
|
|
|
3.13
|
|
|
Corporate stocks and other
|
|
|
409
|
|
|
|
|
|
|
|
.05
|
|
|
|
451
|
|
|
|
|
|
|
|
.12
|
|
|
Total securities available for sale
|
|
|
53,093
|
|
|
|
992
|
|
|
|
3.73
|
|
|
|
49,046
|
|
|
|
1,062
|
|
|
|
4.33
|
|
|
Securities held to maturity
|
|
|
|
|
|
|
|
|
|
|
|
|
|
|
|
|
|
|
|
|
|
|
|
|
|
Residential mortgage-backed
|
|
|
568
|
|
|
|
11
|
|
|
|
3.66
|
|
|
|
|
|
|
|
|
|
|
|
|
|
|
Commercial mortgage-backed
|
|
|
4,227
|
|
|
|
109
|
|
|
|
5.17
|
|
|
|
3,193
|
|
|
|
91
|
|
|
|
5.67
|
|
|
Asset-backed
|
|
|
2,369
|
|
|
|
28
|
|
|
|
2.38
|
|
|
|
3,681
|
|
|
|
49
|
|
|
|
2.69
|
|
|
Other
|
|
|
84
|
|
|
|
1
|
|
|
|
3.15
|
|
|
|
90
|
|
|
|
5
|
|
|
|
11.70
|
|
|
Total securities held to maturity
|
|
|
7,248
|
|
|
|
149
|
|
|
|
4.11
|
|
|
|
6,964
|
|
|
|
145
|
|
|
|
4.17
|
|
|
Total investment securities
|
|
|
60,341
|
|
|
|
1,141
|
|
|
|
3.78
|
|
|
|
56,010
|
|
|
|
1,207
|
|
|
|
4.31
|
|
|
Loans
|
|
|
|
|
|
|
|
|
|
|
|
|
|
|
|
|
|
|
|
|
|
|
|
|
|
Commercial
|
|
|
57,120
|
|
|
|
1,425
|
|
|
|
4.96
|
|
|
|
54,903
|
|
|
|
1,425
|
|
|
|
5.16
|
|
|
Commercial real estate
|
|
|
17,160
|
|
|
|
437
|
|
|
|
5.06
|
|
|
|
21,689
|
|
|
|
578
|
|
|
|
5.30
|
|
|
Equipment lease financing
|
|
|
6,248
|
|
|
|
154
|
|
|
|
4.93
|
|
|
|
6,105
|
|
|
|
156
|
|
|
|
5.12
|
|
|
Consumer
|
|
|
54,236
|
|
|
|
1,335
|
|
|
|
4.97
|
|
|
|
55,143
|
|
|
|
1,466
|
|
|
|
5.36
|
|
|
Residential real estate
|
|
|
15,258
|
|
|
|
472
|
|
|
|
6.19
|
|
|
|
18,985
|
|
|
|
717
|
|
|
|
7.56
|
|
|
Total loans
|
|
|
150,022
|
|
|
|
3,823
|
|
|
|
5.10
|
|
|
|
156,825
|
|
|
|
4,342
|
|
|
|
5.54
|
|
|
Loans held for sale
|
|
|
2,955
|
|
|
|
107
|
|
|
|
7.31
|
|
|
|
2,561
|
|
|
|
153
|
|
|
|
12.02
|
|
|
Federal funds sold and resale agreements
|
|
|
2,566
|
|
|
|
17
|
|
|
|
1.28
|
|
|
|
1,933
|
|
|
|
19
|
|
|
|
1.95
|
|
|
Other
|
|
|
6,525
|
|
|
|
91
|
|
|
|
2.80
|
|
|
|
8,450
|
|
|
|
93
|
|
|
|
2.21
|
|
|
Total interest-earning assets/interest income
|
|
|
222,409
|
|
|
|
5,179
|
|
|
|
4.66
|
|
|
|
225,779
|
|
|
|
5,814
|
|
|
|
5.15
|
|
|
Noninterest-earning assets:
|
|
|
|
|
|
|
|
|
|
|
|
|
|
|
|
|
|
|
|
|
|
|
|
|
|
Allowance for loan and lease losses
|
|
|
(4,781
|
)
|
|
|
|
|
|
|
|
|
|
|
(5,124
|
)
|
|
|
|
|
|
|
|
|
|
Cash and due from banks
|
|
|
3,413
|
|
|
|
|
|
|
|
|
|
|
|
3,664
|
|
|
|
|
|
|
|
|
|
|
Other
|
|
|
40,785
|
|
|
|
|
|
|
|
|
|
|
|
41,430
|
|
|
|
|
|
|
|
|
|
|
Total assets
|
|
$
|
261,826
|
|
|
|
|
|
|
|
|
|
|
$
|
265,749
|
|
|
|
|
|
|
|
|
|
|
Liabilities and Equity
|
|
|
|
|
|
|
|
|
|
|
|
|
|
|
|
|
|
|
|
|
|
|
|
|
|
Interest-bearing liabilities:
|
|
|
|
|
|
|
|
|
|
|
|
|
|
|
|
|
|
|
|
|
|
|
|
|
|
Interest-bearing deposits
|
|
|
|
|
|
|
|
|
|
|
|
|
|
|
|
|
|
|
|
|
|
|
|
|
|
Money market
|
|
$
|
58,575
|
|
|
|
100
|
|
|
|
.34
|
|
|
$
|
58,303
|
|
|
|
144
|
|
|
|
.50
|
|
|
Demand
|
|
|
26,614
|
|
|
|
14
|
|
|
|
.10
|
|
|
|
24,814
|
|
|
|
20
|
|
|
|
.16
|
|
|
Savings
|
|
|
7,941
|
|
|
|
7
|
|
|
|
.19
|
|
|
|
6,850
|
|
|
|
7
|
|
|
|
.19
|
|
|
Retail certificates of deposit
|
|
|
35,799
|
|
|
|
231
|
|
|
|
1.30
|
|
|
|
45,444
|
|
|
|
337
|
|
|
|
1.50
|
|
|
Other time
|
|
|
462
|
|
|
|
7
|
|
|
|
2.94
|
|
|
|
959
|
|
|
|
14
|
|
|
|
2.96
|
|
|
Time deposits in foreign offices
|
|
|
2,642
|
|
|
|
3
|
|
|
|
.21
|
|
|
|
2,847
|
|
|
|
3
|
|
|
|
.21
|
|
|
Total interest-bearing deposits
|
|
|
132,033
|
|
|
|
362
|
|
|
|
.55
|
|
|
|
139,217
|
|
|
|
525
|
|
|
|
.76
|
|
|
Borrowed funds
|
|
|
|
|
|
|
|
|
|
|
|
|
|
|
|
|
|
|
|
|
|
|
|
|
|
Federal funds purchased and repurchase agreements
|
|
|
5,251
|
|
|
|
4
|
|
|
|
.17
|
|
|
|
4,251
|
|
|
|
7
|
|
|
|
.34
|
|
|
Federal Home Loan Bank borrowings
|
|
|
5,054
|
|
|
|
26
|
|
|
|
1.02
|
|
|
|
9,086
|
|
|
|
36
|
|
|
|
.78
|
|
|
Bank notes and senior debt
|
|
|
11,437
|
|
|
|
136
|
|
|
|
2.36
|
|
|
|
12,641
|
|
|
|
133
|
|
|
|
2.08
|
|
|
Subordinated debt
|
|
|
9,166
|
|
|
|
245
|
|
|
|
5.35
|
|
|
|
9,767
|
|
|
|
240
|
|
|
|
4.92
|
|
|
Other
|
|
|
5,779
|
|
|
|
31
|
|
|
|
1.05
|
|
|
|
5,969
|
|
|
|
25
|
|
|
|
.84
|
|
|
Total borrowed funds
|
|
|
36,687
|
|
|
|
442
|
|
|
|
2.40
|
|
|
|
41,714
|
|
|
|
441
|
|
|
|
2.11
|
|
|
Total interest-bearing liabilities/interest expense
|
|
|
168,720
|
|
|
|
804
|
|
|
|
.96
|
|
|
|
180,931
|
|
|
|
966
|
|
|
|
1.07
|
|
|
Noninterest-bearing liabilities and equity:
|
|
|
|
|
|
|
|
|
|
|
|
|
|
|
|
|
|
|
|
|
|
|
|
|
|
Noninterest-bearing deposits
|
|
|
48,743
|
|
|
|
|
|
|
|
|
|
|
|
43,474
|
|
|
|
|
|
|
|
|
|
|
Allowance for unfunded loan commitments and letters of credit
|
|
|
196
|
|
|
|
|
|
|
|
|
|
|
|
273
|
|
|
|
|
|
|
|
|
|
|
Accrued expenses and other liabilities
|
|
|
10,262
|
|
|
|
|
|
|
|
|
|
|
|
10,424
|
|
|
|
|
|
|
|
|
|
|
Equity
|
|
|
33,905
|
|
|
|
|
|
|
|
|
|
|
|
30,647
|
|
|
|
|
|
|
|
|
|
|
Total liabilities and equity
|
|
$
|
261,826
|
|
|
|
|
|
|
|
|
|
|
$
|
265,749
|
|
|
|
|
|
|
|
|
|
|
Interest rate spread
|
|
|
|
|
|
|
|
|
|
|
3.70
|
|
|
|
|
|
|
|
|
|
|
|
4.08
|
|
|
Impact of noninterest-bearing sources
|
|
|
|
|
|
|
|
|
|
|
.23
|
|
|
|
|
|
|
|
|
|
|
|
.21
|
|
|
Net interest income/margin
|
|
|
|
|
|
$
|
4,375
|
|
|
|
3.93
|
%
|
|
|
|
|
|
$
|
4,848
|
|
|
|
4.29
|
%
|
Nonaccrual loans are included in loans, net of
unearned income. The impact of financial derivatives used in interest rate risk management is included in the interest income/expense and average yields/rates of the related assets and liabilities. Basis adjustments related to hedged items are
included in noninterest-earning assets and noninterest-bearing liabilities. Average balances of securities are based on amortized historical cost (excluding adjustments to fair value, which are included in other assets). Average balances for certain
loans and borrowed funds accounted for at fair value, with changes in fair value recorded in trading noninterest income, are included in noninterest-earning assets and noninterest-bearing liabilities. The interest-earning deposits with the Federal
Reserve are included in the ‘Other’ interest-earning assets category.
132
Average Consolidated Balance Sheet And Net Interest Analysis (Continued)
|
|
|
|
|
|
|
|
|
|
|
|
|
|
|
|
|
|
|
|
|
|
|
|
|
|
|
|
|
|
|
|
|
|
|
Second Quarter 2011
|
|
|
First Quarter 2011
|
|
|
Second Quarter 2010
|
|
|
|
|
|
|
|
|
|
|
|
|
|
|
|
|
|
|
|
|
|
|
|
|
|
|
|
|
|
|
|
|
|
|
|
Average
Balances
|
|
Interest
Income/
Expense
|
|
|
Average
Yields/
Rates
|
|
|
Average
Balances
|
|
|
Interest
Income/
Expense
|
|
|
Average
Yields/
Rates
|
|
|
Average
Balances
|
|
|
Interest
Income/
Expense
|
|
|
Average
Yields/
Rates
|
|
|
|
|
|
|
|
|
|
|
|
|
|
|
|
|
|
|
|
|
|
|
|
|
|
|
|
|
|
|
|
|
|
|
|
|
|
|
|
|
|
|
|
|
|
|
|
|
|
|
|
|
|
|
|
|
|
|
|
|
|
|
|
|
|
|
|
|
|
|
|
|
|
|
|
|
|
|
|
|
|
|
|
|
|
|
|
|
|
|
|
|
|
|
|
|
|
|
|
|
|
|
|
|
|
|
|
|
|
|
|
|
|
|
|
|
|
|
|
|
|
|
|
|
|
|
|
|
|
|
|
|
|
|
|
|
|
|
|
|
|
|
|
|
|
|
|
|
|
|
|
|
|
|
|
|
|
|
|
|
|
|
|
|
|
|
|
|
|
|
|
|
$25,993
|
|
$
|
241
|
|
|
|
3.70
|
%
|
|
$
|
29,134
|
|
|
$
|
263
|
|
|
|
3.61
|
%
|
|
$
|
20,382
|
|
|
$
|
196
|
|
|
|
3.83
|
%
|
|
7,618
|
|
|
105
|
|
|
|
5.47
|
|
|
|
8,057
|
|
|
|
105
|
|
|
|
5.23
|
|
|
|
9,358
|
|
|
|
140
|
|
|
|
5.97
|
|
|
3,278
|
|
|
39
|
|
|
|
4.73
|
|
|
|
3,298
|
|
|
|
39
|
|
|
|
4.74
|
|
|
|
2,962
|
|
|
|
39
|
|
|
|
5.29
|
|
|
3,185
|
|
|
19
|
|
|
|
2.43
|
|
|
|
2,757
|
|
|
|
19
|
|
|
|
2.70
|
|
|
|
1,695
|
|
|
|
21
|
|
|
|
4.96
|
|
|
4,505
|
|
|
27
|
|
|
|
2.46
|
|
|
|
5,682
|
|
|
|
36
|
|
|
|
2.51
|
|
|
|
8,708
|
|
|
|
61
|
|
|
|
2.81
|
|
|
2,234
|
|
|
24
|
|
|
|
4.37
|
|
|
|
2,081
|
|
|
|
26
|
|
|
|
4.95
|
|
|
|
1,356
|
|
|
|
19
|
|
|
|
5.50
|
|
|
3,578
|
|
|
23
|
|
|
|
2.58
|
|
|
|
3,994
|
|
|
|
26
|
|
|
|
2.58
|
|
|
|
2,526
|
|
|
|
18
|
|
|
|
2.94
|
|
|
376
|
|
|
|
|
|
|
.04
|
|
|
|
443
|
|
|
|
|
|
|
|
.06
|
|
|
|
446
|
|
|
|
|
|
|
|
.13
|
|
|
50,767
|
|
|
478
|
|
|
|
3.77
|
|
|
|
55,446
|
|
|
|
514
|
|
|
|
3.70
|
|
|
|
47,433
|
|
|
|
494
|
|
|
|
4.16
|
|
|
|
|
|
|
|
|
|
|
|
|
1,130
|
|
|
11
|
|
|
|
3.68
|
|
|
|
|
|
|
|
|
|
|
|
|
|
|
|
|
|
|
|
|
|
|
|
|
|
|
4,215
|
|
|
54
|
|
|
|
5.11
|
|
|
|
4,239
|
|
|
|
55
|
|
|
|
5.22
|
|
|
|
4,264
|
|
|
|
60
|
|
|
|
5.62
|
|
|
2,276
|
|
|
12
|
|
|
|
2.20
|
|
|
|
2,463
|
|
|
|
16
|
|
|
|
2.53
|
|
|
|
3,697
|
|
|
|
24
|
|
|
|
2.61
|
|
|
158
|
|
|
1
|
|
|
|
3.06
|
|
|
|
9
|
|
|
|
|
|
|
|
4.90
|
|
|
|
21
|
|
|
|
|
|
|
|
9.29
|
|
|
7,779
|
|
|
78
|
|
|
|
4.01
|
|
|
|
6,711
|
|
|
|
71
|
|
|
|
4.24
|
|
|
|
7,982
|
|
|
|
84
|
|
|
|
4.23
|
|
|
58,546
|
|
|
556
|
|
|
|
3.80
|
|
|
|
62,157
|
|
|
|
585
|
|
|
|
3.76
|
|
|
|
55,415
|
|
|
|
578
|
|
|
|
4.17
|
|
|
|
|
|
|
|
|
|
|
|
|
57,932
|
|
|
715
|
|
|
|
4.88
|
|
|
|
56,300
|
|
|
|
710
|
|
|
|
5.04
|
|
|
|
54,349
|
|
|
|
729
|
|
|
|
5.30
|
|
|
16,779
|
|
|
234
|
|
|
|
5.51
|
|
|
|
17,545
|
|
|
|
203
|
|
|
|
4.63
|
|
|
|
20,963
|
|
|
|
269
|
|
|
|
5.08
|
|
|
6,189
|
|
|
75
|
|
|
|
4.86
|
|
|
|
6,307
|
|
|
|
79
|
|
|
|
5.00
|
|
|
|
6,080
|
|
|
|
77
|
|
|
|
5.13
|
|
|
54,014
|
|
|
665
|
|
|
|
4.94
|
|
|
|
54,460
|
|
|
|
670
|
|
|
|
4.99
|
|
|
|
54,939
|
|
|
|
736
|
|
|
|
5.37
|
|
|
15,001
|
|
|
233
|
|
|
|
6.22
|
|
|
|
15,518
|
|
|
|
239
|
|
|
|
6.15
|
|
|
|
18,576
|
|
|
|
359
|
|
|
|
7.73
|
|
|
149,915
|
|
|
1,922
|
|
|
|
5.11
|
|
|
|
150,130
|
|
|
|
1,901
|
|
|
|
5.09
|
|
|
|
154,907
|
|
|
|
2,170
|
|
|
|
5.58
|
|
|
2,719
|
|
|
38
|
|
|
|
5.62
|
|
|
|
3,193
|
|
|
|
69
|
|
|
|
8.77
|
|
|
|
2,646
|
|
|
|
87
|
|
|
|
13.15
|
|
|
2,321
|
|
|
9
|
|
|
|
1.39
|
|
|
|
2,813
|
|
|
|
8
|
|
|
|
1.19
|
|
|
|
2,193
|
|
|
|
10
|
|
|
|
1.73
|
|
|
7,241
|
|
|
47
|
|
|
|
2.60
|
|
|
|
5,802
|
|
|
|
44
|
|
|
|
3.06
|
|
|
|
9,419
|
|
|
|
46
|
|
|
|
1.93
|
|
|
220,742
|
|
|
2,572
|
|
|
|
4.64
|
|
|
|
224,095
|
|
|
|
2,607
|
|
|
|
4.67
|
|
|
|
224,580
|
|
|
|
2,891
|
|
|
|
5.13
|
|
|
|
|
|
|
|
|
|
|
|
|
(4,728)
|
|
|
|
|
|
|
|
|
|
|
(4,835
|
)
|
|
|
|
|
|
|
|
|
|
|
(5,113
|
)
|
|
|
|
|
|
|
|
|
|
3,433
|
|
|
|
|
|
|
|
|
|
|
3,393
|
|
|
|
|
|
|
|
|
|
|
|
3,595
|
|
|
|
|
|
|
|
|
|
|
41,659
|
|
|
|
|
|
|
|
|
|
|
39,901
|
|
|
|
|
|
|
|
|
|
|
|
41,304
|
|
|
|
|
|
|
|
|
|
|
$261,106
|
|
|
|
|
|
|
|
|
|
$
|
262,554
|
|
|
|
|
|
|
|
|
|
|
$
|
264,366
|
|
|
|
|
|
|
|
|
|
|
|
|
|
|
|
|
|
|
|
|
$58,594
|
|
|
49
|
|
|
|
.34
|
|
|
$
|
58,556
|
|
|
|
51
|
|
|
|
.35
|
|
|
$
|
58,679
|
|
|
|
68
|
|
|
|
.46
|
|
|
26,912
|
|
|
7
|
|
|
|
.10
|
|
|
|
26,313
|
|
|
|
7
|
|
|
|
.10
|
|
|
|
24,953
|
|
|
|
9
|
|
|
|
.14
|
|
|
8,222
|
|
|
4
|
|
|
|
.19
|
|
|
|
7,656
|
|
|
|
3
|
|
|
|
.19
|
|
|
|
7,075
|
|
|
|
4
|
|
|
|
.19
|
|
|
35,098
|
|
|
115
|
|
|
|
1.32
|
|
|
|
36,509
|
|
|
|
116
|
|
|
|
1.28
|
|
|
|
43,745
|
|
|
|
156
|
|
|
|
1.44
|
|
|
410
|
|
|
4
|
|
|
|
3.15
|
|
|
|
515
|
|
|
|
3
|
|
|
|
2.77
|
|
|
|
881
|
|
|
|
6
|
|
|
|
2.90
|
|
|
1,840
|
|
|
1
|
|
|
|
.22
|
|
|
|
3,452
|
|
|
|
2
|
|
|
|
.21
|
|
|
|
2,661
|
|
|
|
1
|
|
|
|
.21
|
|
|
131,076
|
|
|
180
|
|
|
|
.55
|
|
|
|
133,001
|
|
|
|
182
|
|
|
|
.55
|
|
|
|
137,994
|
|
|
|
244
|
|
|
|
.71
|
|
|
|
|
|
|
|
|
|
|
|
|
4,138
|
|
|
2
|
|
|
|
.17
|
|
|
|
6,376
|
|
|
|
2
|
|
|
|
.16
|
|
|
|
4,159
|
|
|
|
3
|
|
|
|
.29
|
|
|
5,021
|
|
|
13
|
|
|
|
1.02
|
|
|
|
5,088
|
|
|
|
13
|
|
|
|
1.02
|
|
|
|
8,575
|
|
|
|
19
|
|
|
|
.83
|
|
|
11,132
|
|
|
68
|
|
|
|
2.40
|
|
|
|
11,745
|
|
|
|
68
|
|
|
|
2.31
|
|
|
|
12,666
|
|
|
|
49
|
|
|
|
1.53
|
|
|
8,981
|
|
|
117
|
|
|
|
5.24
|
|
|
|
9,353
|
|
|
|
128
|
|
|
|
5.46
|
|
|
|
9,764
|
|
|
|
110
|
|
|
|
4.54
|
|
|
5,713
|
|
|
17
|
|
|
|
1.12
|
|
|
|
5,847
|
|
|
|
14
|
|
|
|
.98
|
|
|
|
6,005
|
|
|
|
14
|
|
|
|
.92
|
|
|
34,985
|
|
|
217
|
|
|
|
2.46
|
|
|
|
38,409
|
|
|
|
225
|
|
|
|
2.35
|
|
|
|
41,169
|
|
|
|
195
|
|
|
|
1.88
|
|
|
166,061
|
|
|
397
|
|
|
|
.95
|
|
|
|
171,410
|
|
|
|
407
|
|
|
|
.95
|
|
|
|
179,163
|
|
|
|
439
|
|
|
|
.98
|
|
|
|
|
|
|
|
|
|
|
|
|
49,720
|
|
|
|
|
|
|
|
|
|
|
47,755
|
|
|
|
|
|
|
|
|
|
|
|
44,308
|
|
|
|
|
|
|
|
|
|
|
204
|
|
|
|
|
|
|
|
|
|
|
188
|
|
|
|
|
|
|
|
|
|
|
|
251
|
|
|
|
|
|
|
|
|
|
|
10,747
|
|
|
|
|
|
|
|
|
|
|
9,771
|
|
|
|
|
|
|
|
|
|
|
|
10,446
|
|
|
|
|
|
|
|
|
|
|
34,374
|
|
|
|
|
|
|
|
|
|
|
33,430
|
|
|
|
|
|
|
|
|
|
|
|
30,198
|
|
|
|
|
|
|
|
|
|
|
$261,106
|
|
|
|
|
|
|
|
|
|
$
|
262,554
|
|
|
|
|
|
|
|
|
|
|
$
|
264,366
|
|
|
|
|
|
|
|
|
|
|
|
|
|
|
|
|
|
3.69
|
|
|
|
|
|
|
|
|
|
|
|
3.72
|
|
|
|
|
|
|
|
|
|
|
|
4.15
|
|
|
|
|
|
|
|
|
|
.24
|
|
|
|
|
|
|
|
|
|
|
|
.22
|
|
|
|
|
|
|
|
|
|
|
|
.20
|
|
|
|
|
$
|
2,175
|
|
|
|
3.93
|
%
|
|
|
|
|
|
$
|
2,200
|
|
|
|
3.94
|
%
|
|
|
|
|
|
$
|
2,452
|
|
|
|
4.35
|
%
|
Loan fees for the six months ended June 30, 2011 and June 30, 2010 were $85 million and $88 million,
respectively. Loan fees for the three months ended June 30, 2011, March 31, 2011, and June 30, 2010 were $47 million, $38 million, and $43 million, respectively.
Interest income includes the effects of taxable-equivalent adjustments using a marginal federal income tax rate of 35% to increase tax-exempt interest income to a taxable-equivalent basis. The
taxable-equivalent adjustments to interest income for the six months ended June 30, 2011 and June 30, 2010 were $49 million and $37 million, respectively. The taxable-equivalent adjustments to interest income for the three months ended
June 30, 2011, March 31, 2011, and June 30, 2010 were $25 million, $24 million, and $19 million, respectively.
133
P
ART
II – O
THER
I
NFORMATION
I
TEM
1.
L
EGAL
P
ROCEEDINGS
See the information set forth in Note 16 Legal Proceedings in
the Notes To Consolidated Financial Statements under Part I, Item 1 of this Report, which is incorporated by reference in response to this item.
I
TEM
1A. R
ISK
F
ACTORS
The following risk factors update the risk factors previously disclosed in PNC’s 2010 Form 10-K. In general, these risk factors, including those provided below, may present the risk of a material
impact on our results of operations or financial condition, in addition to the other possible consequences described in the risk factors. These risk factors are also discussed further in other parts of our Form 10-K and this Report.
The regulatory environment for the financial services industry is being significantly impacted by financial regulatory reform initiatives in the
United States and elsewhere, including Dodd-Frank and regulations promulgated to implement it.
The United States and other governments
have undertaken major reform of the regulatory oversight structure of the financial services industry, including engaging in new efforts to impose requirements designed to protect consumers and investors from financial abuse. We expect to face
further increased regulation of our industry as a result of current and future initiatives intended to provide economic stimulus, financial market stability and enhanced regulation of financial services companies and to enhance the liquidity and
solvency of financial institutions and markets. We also expect in many cases more intense scrutiny from our bank supervisors in the examination process and more aggressive enforcement of regulations on both the federal and state levels. Compliance
with regulations and other supervisory initiatives will likely increase our cost and reduce our revenue, and may limit our ability to pursue certain desirable business opportunities.
The Dodd-Frank Wall Street Reform and Consumer Protection Act (Dodd-Frank) mandates the most wide-ranging overhaul of financial industry regulation in decades. Dodd-Frank was signed into law on
July 21, 2010. Many parts of the law are now in effect and others are now in the implementation stage, which is likely to continue for several years. The law requires that regulators, some of which are new regulatory bodies created by
Dodd-Frank, draft, review and approve more than 300 implementing regulations and conduct numerous studies that are likely to lead to more regulations, a process that, while well underway, is proceeding somewhat slower than originally anticipated,
thus extending the uncertainty surrounding the ultimate impact of Dodd-Frank on us.
A number of reform provisions are likely to significantly impact the ways in which banks and bank holding
companies, including PNC, do business.
|
|
•
|
|
Newly created regulatory bodies include the Bureau of Consumer Financial Protection (CFPB) and the Financial Stability Oversight Council (FSOC). The
CFPB has been given authority to regulate consumer financial products and services sold by banks and non-bank companies and to supervise banks with assets of more than $10 billion and their affiliates for compliance with Federal consumer protection
laws. The FSOC has been charged with identifying systemic risks, promoting stronger financial regulation and identifying those non-bank companies that are “systemically important” and thus should be subject to regulation by the Federal
Reserve. In addition, in extraordinary cases and together with the Federal Reserve, the FSOC could break up financial firms that are deemed to present a grave threat to the financial stability of the United States.
|
|
|
•
|
|
Dodd-Frank (through provisions commonly known as the “Volcker Rule”) prohibits banks from engaging in some types of proprietary trading and
restricts the ability of banks to sponsor or invest in private equity or hedge funds. The relevant regulatory agencies have not yet proposed implementing regulations for the Volcker Rule. Although PNC no longer has a designated proprietary trading
operation, the scope of the proprietary trading prohibition, and its impact on PNC, will depend on definitions in the final rule, particularly those definitions related to statutory exemptions for hedging activities and customer trading. Until more
is known regarding these definitions and the other provisions of the implementing rules, it is not possible to determine the impact of the proprietary trading prohibition, although any meaningful limitation on PNC’s ability to hedge its risks
in the ordinary course or to trade on behalf of customers would likely be adverse to PNC’s business and results of operations. With respect to the restrictions on private equity and hedge fund activities, as of June 30, 2011, PNC held
interests in such funds likely to be covered totaling approximately $950 million and sponsored three such funds with total invested capital of approximately $500 million. PNC expects that over time it will need to eliminate these investments and
cease sponsoring these funds, although it is likely that at least some of these amounts will reduce over time in the ordinary course before compliance is required, and the Volcker Rule also permits extensions of the compliance date under some
circumstances. A forced sale of some of these
|
134
|
|
|
investments due to the Volcker Rule could result in PNC receiving less value than it would otherwise have received. Depending on the provisions of the final rule, it is possible that other
structures through which PNC conducts business but that are not typically referred to as private equity or hedge funds could be restricted, with an impact that cannot now be evaluated.
|
|
|
•
|
|
In addition, the relevant regulatory agencies have proposed rules to implement the Dodd-Frank provisions requiring retention of risk by certain
securitization participants through holding interests in the securitization vehicles, but the rules are not yet finalized or effective. As a result, the ultimate impact of these Dodd-Frank provisions on PNC remains unpredictable. That impact on PNC
could be direct, by requiring PNC to hold interests in a securitization vehicle or other assets that represent a portion of the credit risk held by the securitization vehicle, or indirect, by impacting markets in which PNC participates. Since the
beginning of the financial crisis, there has been and continues to be substantially less private (that is, non-government backed) securitization activity than had previously been the case. It is unclear at present whether and to what extent the
private securitization markets will rebound. In recent years PNC has only engaged to a limited extent in securitization transactions under circumstances where we might expect to be required to retain additional risk on our balance sheet as a result
of implementation of these Dodd-Frank provisions. If the market for private securitizations rebounds and PNC decides to increase its participation in that market, we would likely be required under the regulations to retain more risk than would
otherwise have been the case, with currently uncertain financial impact.
|
On the indirect impact side, PNC
originates loans of a variety of types, including residential and commercial mortgages, credit card, auto, and student, that have historically commonly been securitized, and PNC is also a significant servicer of residential and commercial mortgages
held by others, including securitization vehicles. PNC anticipates that the risk retention requirements will impact the market for loans of types that historically have been securitized, potentially affecting the volumes of loans securitized, the
types of loan products made available, the terms on which loans are offered, consumer and business demand for loans, and the need for third party loan servicers. It should be noted that the risk retention rules themselves could have the effect of
slowing the rebound in the securitization markets. One effect of having substantially reduced opportunities to securitize loans would likely be a reduction in the willingness of banks, including PNC, to make loans
due to balance sheet management requirements. Any of these potential impacts of the Dodd-Frank risk retention rules could affect the way in which PNC conducts its business, including its product
offerings, and could also affect PNC’s revenue and profitability, although, as noted above, not in ways currently predictable.
|
|
•
|
|
Dodd-Frank imposes a new regulatory regime on the U.S. derivatives markets. While some of the provisions related to derivatives came into effect
July 16, 2011, most of the new requirements await final regulations from the relevant regulatory agencies for derivatives, the Commodities Futures Trading Commission (CFTC) and the Securities and Exchange Commission (SEC). One aspect of the
Dodd-Frank regulatory regime for derivatives is that substantial oversight responsibility has been provided to the CFTC, which, as a result, will for the first time have a meaningful supervisory role with respect to some of PNC’s businesses.
Although the ultimate impact will depend on the final regulations, PNC expects that its derivatives business will be subject to new substantive requirements, including registration with the CFTC, margin requirements in excess of current market
practice, capital requirements specific to this business, real time trade reporting and robust record keeping requirements, business conduct requirements (including daily valuations, disclosure of material risks associated with swaps and disclosure
of material incentives and conflicts of interest), and mandatory clearing and exchange trading of all standardized swaps designated by the relevant regulatory agencies as required to be cleared. To the extent PNC acts as an advisor to “special
entities” such as federal, state, and county municipalities and other political subdivisions of a state, under Dodd-Frank PNC will be required to act in the “best interests” of the special entities. Also under proposed rules, offering
of a swap to a municipality could subject PNC to a fiduciary duty owing to such municipal counterparty. These requirements will collectively impose implementation and ongoing compliance burdens on PNC and will introduce additional legal risk
(including as a result of newly applicable antifraud and antimanipulation provisions and private rights of action). In addition, depending on the final rules, the rules related to our municipal swaps business could result in changes in the nature
and extent of that business as conducted by PNC.
|
|
|
•
|
|
New provisions under Dodd-Frank concerning the applicability of state consumer protection laws to national banks, such as PNC Bank, became effective on
July 21, 2011. Questions may arise as to whether certain state consumer financial laws that may have previously been preempted by federal law are no longer preempted as a result of the effectiveness of
|
135
|
|
|
these new provisions. Depending on how such questions are resolved, we may experience an increase in state-level regulation of our retail banking business and additional compliance obligations,
revenue impacts and costs. In addition, provisions under Dodd-Frank that also took effect on July 21, 2011 permit state attorneys general to bring civil actions against national banks, such as PNC, for violations of regulations issued by the
CFPB.
|
|
|
•
|
|
Dodd-Frank directed regulators to set limitations on the interchange fees banks can charge for debit transactions, recently set by final regulation at
$.21 per transaction plus .05% of the amount of the transaction to compensate for fraud related losses and an additional $.01 for banks that have implemented qualifying fraud prevention programs. PNC anticipates that this regulatory limitation will
result in a reduction of approximately $250 million in annual revenues based on recent volumes.
|
|
|
•
|
|
Dodd-Frank requires bank holding companies that have $50 billion or more in assets, such as PNC, to periodically submit to the Federal Reserve, the
FDIC and the FSOC a plan discussing how the company could be resolved in a rapid and orderly fashion if the company were to fail or experience material financial distress. The Federal Reserve and the FDIC may jointly impose restrictions on PNC,
including additional capital requirements or limitations on growth, if the agencies jointly determine that the company’s plan is not credible or would not facilitate a rapid and orderly resolution of PNC under the U.S. Bankruptcy Code, and
additionally could require PNC to divest assets or take other actions if we did not submit an acceptable resolution within two years after any such restrictions were imposed. Depending on the provisions of the final rule implementing these
resolution plan requirements, it is possible that these requirements could affect the ways in which PNC structures and conducts its business and result in higher compliance and operating costs.
|
|
|
•
|
|
Other provisions of Dodd-Frank will affect regulatory oversight, holding company capital requirements, and residential mortgage products.
|
While much of how the Dodd-Frank and other financial industry reforms will change our current business operations depends
on the specific regulatory promulgations and interpretations, many of which have yet to be released or finalized, it is clear that the reforms, both under Dodd-Frank and otherwise, will have a significant effect on our entire industry. Although
Dodd-Frank and other reforms will affect a number of the areas in which we do business, it is not clear at this time the full extent of the adjustments that will be required and the extent to which we will be able to adjust our businesses in
response to the requirements. Although it is difficult to predict the magnitude and extent of these effects at this stage, we believe compliance with Dodd-Frank and its
implementing regulations and other initiatives will likely negatively impact revenue and increase the cost of doing business, both in terms of transition expenses and on an ongoing basis, and may
also limit our ability to pursue certain desirable business opportunities.
Capital requirements imposed by Dodd-Frank, together with new
capital and liquidity standards adopted by the Basel Committee on Banking Supervision (the Basel Committee), will result in banks and bank holding companies needing to maintain more and higher quality capital than has historically been the case.
New and evolving capital standards, both as a result of Dodd-Frank and implementation of new capital standards adopted by the Basel
Committee, including the so-called “Basel III” capital accord issued in December 2010, will have a significant effect on banks and bank holding companies, including PNC. Basel III, among other things, narrows the definition of regulatory
capital and establishes higher minimum risk-based capital ratios that, when fully phased-in, will require banking organizations, including PNC, to maintain a minimum Tier 1 common ratio of 4.5%, a Tier 1 capital ratio of 6.0%, and a total capital
ratio of 8.0%. A capital conservation buffer of 2.5% above each of these levels also is required, which potentially may be supplemented by an additional countercyclical capital buffer. In addition, Basel III introduces new short-term liquidity and
term funding standards, as well as an international leverage ratio. The capital standards adopted by the Basel Committee and to be implemented in the United States also increase the capital requirements for specific types of exposures (including
sub-investment grade securitization exposures) and requires that unconsolidated investments in financial entities (potentially including PNC’s investment in BlackRock), as well as mortgage servicing rights and deferred tax assets, above certain
thresholds be deducted from regulatory capital.
In July 2011, the Basel Committee also issued a consultative document that would require
globally systemically important banks to maintain additional Tier 1 common capital ranging between 1.0% to 2.5% of risk-weighted assets, with the actual required amount varying based on the firm’s global systemic importance as determined using
five criteria (size, interconnectedness, lack of substitutability, cross-jurisdictional activity, and complexity).
Because implementation of
the new Basel III capital and liquidity standards, as well as any additional heightened capital or liquidity standards that may be established by the Federal Reserve under the Dodd-Frank Act, remain subject to rulemaking in the U.S. and, in many
cases, to extended observation and phase-in periods, the full effect of these standards on PNC is uncertain at this time.
Pursuant to the
“Collins Amendment” to Dodd-Frank, the U.S. federal banking agencies recently adopted a final rule that requires the phase-out of trust preferred and other hybrid
136
securities from Tier 1 regulatory capital, and also establishes a risk-based capital floor that is based on the regulatory capital standards generally applicable to all banking organizations.
The need to maintain more and higher quality capital, as well as greater liquidity, going forward than historically has been required could
limit PNC’s business activities, including lending, and its ability to expand, either organically or through acquisitions. It could also result in PNC taking steps to increase its capital that may be dilutive to shareholders or being limited in
its ability to pay dividends or otherwise return capital to shareholders. In addition, the new liquidity standards could require PNC to increase its holdings of highly liquid short-term investments, thereby reducing PNC’s ability to invest in
longer-term assets even if more desirable from a balance sheet management perspective. Moreover, although these new requirements are being phased in over time, U.S. federal banking agencies have been taking into account expectations regarding the
ability of banks to meet these new requirements, including under stressed conditions, in approving actions that represent uses of capital, such as dividend increases and acquisitions.
A failure to sustain reduced amounts of the provision for credit losses, which has benefitted results of operations in recent periods, could result in decreases in net income.
As was typical in the banking industry, the economic downturn that started in 2007 resulted in PNC experiencing high levels of provision for credit
losses. In the quarters from the fourth quarter of 2008 through the second quarter of 2010, PNC’s provision for credit losses ranged from $751 million to $1.1 billion in each quarter. Subsequently, in part due to improvement in economic
conditions, as well as actions taken by PNC to manage its portfolio, PNC’s provision for credit losses has declined substantially, reaching a level of $280
million in the second quarter of 2011. This decline in provision for credit losses has been a major contributor to PNC’s ability to maintain and grow its net income during this period. If
PNC’s provision for credit losses were to rise back towards levels experienced during the height of the economic downturn, it would have an adverse effect on PNC’s net income and could result in lower levels of net income than PNC has
reported in recent periods.
I
TEM
2. U
NREGISTERED
S
ALES
O
F
E
QUITY
S
ECURITIES
A
ND
U
SE
O
F
P
ROCEEDS
(c) Details of our repurchases of PNC common stock during the second quarter of 2011 are included in the following table:
In thousands, except per share data
|
|
|
|
|
|
|
|
|
|
|
|
|
|
|
|
|
2011 period
|
|
Total shares
purchased
(a)
|
|
|
Average
price
paid per
share
|
|
|
Total shares
purchased as
part
of
publicly
announced
programs
(b)
|
|
Maximum
number
of
shares
that may
yet be
purchased
under the
programs
(b)
|
|
|
April 1 – 30
|
|
|
115
|
|
|
$
|
61.67
|
|
|
|
|
|
24,710
|
|
|
May 1 – 31
|
|
|
111
|
|
|
$
|
61.98
|
|
|
|
|
|
24,710
|
|
|
June 1 – 30
|
|
|
99
|
|
|
$
|
58.33
|
|
|
|
|
|
24,710
|
|
|
Total
|
|
|
325
|
|
|
$
|
60.76
|
|
|
|
|
|
|
|
|
(a)
|
Reflects PNC common stock purchased in connection with our various employee benefit plans. No shares were purchased under the program referred to in note (b) to
this table during the second quarter of 2011.
|
|
|
Effective
|
January 2011, employer matching contributions to the PNC Incentive Savings Plan were no longer made in PNC common stock, but rather in cash. Note 14 Employee Benefit
Plans in the Notes To Consolidated Financial Statements in Item 8 of our 2010 Form 10-K includes additional information regarding our employee benefit plans that use PNC common stock.
|
|
(b)
|
Our current stock repurchase program allows us to purchase up to 25 million shares on the open market or in privately negotiated transactions. This program was
authorized on October 4, 2007 and will remain in effect until fully utilized or until modified, superseded or terminated.
|
137
I
TEM
6.
E
XHIBITS
The following exhibit index lists Exhibits filed, or in the case of Exhibits 32.1 and
32.2 furnished, with this Quarterly Report on Form 10-Q:
E
XHIBIT
I
NDEX
|
|
|
|
|
|
|
|
2.2 and 10.73
|
|
Stock Purchase Agreement, dated as of June 19, 2011, among The PNC Financial Services Group, Inc., RBC USA Holdco Corporation and Royal Bank of Canada (the schedules and exhibits
have been omitted pursuant to Item 601(b)(2) of Regulation S-K).
|
|
|
|
|
|
|
Incorporated by reference to Exhibit 2.1 of PNC’s Current Report on Form 8-K filed June 20, 2011.
|
|
|
|
|
3.3 and 4.22
|
|
Statement with Respect to Shares of Fixed-to-Floating Rate Non-Cumulative Perpetual Preferred Stock, Series O dated July 21, 2011.
|
|
|
|
|
|
|
Incorporated by reference to Exhibit 3.1 of PNC’s Current Report on Form 8-K filed July 27, 2011.
|
|
|
|
|
12.1
|
|
Computation of Ratio of Earnings to Fixed Charges
|
|
|
|
|
12.2
|
|
Computation of Ratio of Earnings to Fixed Charges and Preferred Stock Dividends
|
|
|
|
|
31.1
|
|
Certification of Chairman and Chief Executive Officer pursuant to Section 302 of the Sarbanes-Oxley Act of
2002
|
|
|
|
|
|
|
|
|
31.2
|
|
Certification of Chief Financial Officer pursuant to Section 302 of the Sarbanes-Oxley Act of 2002
|
|
|
|
|
32.1
|
|
Certification by Chief Executive Officer pursuant to 18 U.S.C. Section 1350
|
|
|
|
|
32.2
|
|
Certification by Chief Financial Officer pursuant to 18 U.S.C. Section 1350
|
|
|
|
|
101
|
|
Interactive Data File (XBRL)
|
You can obtain copies of these Exhibits electronically at the SEC’s website at www.sec.gov or by mail from the
Public Reference Section of the SEC, at 100 F Street, N.E., Washington, DC 20549 at prescribed rates. The Exhibits are also available as part of this Form 10-Q on PNC’s corporate website at www.pnc.com/secfilings. Shareholders and bondholders
may also obtain copies of Exhibits, without charge, by contacting Shareholder Relations at 800-843-2206 or via e-mail at investor.relations@pnc.com. The interactive data file (XBRL) exhibit is only available electronically.
S
IGNATURE
Pursuant to the requirements of the Securities Exchange Act of 1934, the registrant has duly caused this report to be signed on August 8, 2011 on its behalf by the undersigned thereunto duly
authorized.
|
|
|
|
|
The PNC Financial Services Group, Inc.
|
|
|
|
|
|
|
/s/ Richard J. Johnson
|
|
|
|
Richard J. Johnson
|
|
|
|
Executive Vice President and Chief Financial Officer
|
|
|
|
(Principal Financial Officer)
|
|
|
138
CORPORATE INFORMATION
The PNC Financial Services Group, Inc.
Corporate Headquarters
The PNC
Financial Services Group, Inc.
One PNC Plaza, 249 Fifth Avenue
Pittsburgh, Pennsylvania 15222-2707
412-762-2000
Stock Listing
The common stock of the PNC Financial Services Group, Inc. is listed on the New York Stock Exchange under the symbol PNC.
Internet Information
The PNC Financial Services Group, Inc.’s financial reports and information about its products and
services are available on the internet at www.pnc.com. We provide information for investors on our corporate website under “About PNC – Investor Relations,” such as Investor Events, Quarterly Earnings, SEC Filings, Financial
Information, Financial Press Releases and Message from the Chairman. Under “Investor Relations,” we will from time to time post information that we believe may be important or useful to investors. We generally post the following shortly
before or promptly following its first use or release: financially-related press releases (including earnings releases), various SEC filings, presentation materials associated with earnings and other investor conference calls or events, and access
to live and taped audio from such calls or events. When warranted, we will also use our website to expedite public access to time-critical information regarding PNC in advance of distribution of a press release or a filing with the SEC disclosing
the same information. You can also find the SEC reports and corporate governance information described in the sections below in the Investor Relations section of our website.
Where we have included web addresses in this Report, such as our web address and web addresses of the SEC, we have included those web addresses as inactive textual references only. Except as specifically
incorporated by reference into this Report, information on those websites is not part hereof.
Financial Information
We are
subject to the informational requirements of the Securities Exchange Act of 1934, as amended (Exchange Act), and, in accordance with the Exchange Act, we file annual, quarterly and current reports, proxy statements, and other information with the
SEC. You can obtain copies of these and other filings, including exhibits, electronically at the SEC’s internet website at www.sec.gov or on PNC’s corporate internet website at www.pnc.com/secfilings. Shareholders and bond holders may also
obtain copies of these filings without charge by contacting Shareholder Services at 800-982-7652 or via the online contact form at www.computershare.com/contactus for copies without exhibits, and by contacting Shareholder Relations at 800-843-2206
or via email at investor.relations@pnc.com for
copies of exhibits, including financial statement and schedule exhibits where applicable. The interactive data file (XBRL) exhibit is only available electronically.
Corporate Governance at PNC
Information about our Board of Directors and its committees and corporate governance at PNC is available on
PNC’s corporate website at www.pnc.com/corporategovernance. Shareholders who would like to request printed copies of PNC’s Code of Business Conduct and Ethics or our Corporate Governance Guidelines or the charters of our Board’s
Audit, Nominating and Governance, Personnel and Compensation, or Risk Committees (all of which are posted on the PNC corporate website) may do so by sending their requests to George P. Long, III, Chief Governance Counsel and Corporate Secretary, at
corporate headquarters at the above address. Copies will be provided without charge to shareholders.
Inquiries
For financial
services call 888-PNC-2265.
Individual shareholders should contact Shareholder Services at 800-982-7652.
Analysts and institutional investors should contact William H. Callihan, Senior Vice President, Director of Investor Relations, at 412-762-8257 or via
email at investor.relations@pnc.com.
News media representatives and others seeking general information should contact Fred Solomon, Vice
President, Corporate Communications, at 412-762-4550 or via email at corporate.communications@pnc.com.
Common Stock Prices/Dividends
Declared
The table below sets forth by quarter the range of high and low sale and quarter-end closing prices for The PNC Financial Services Group, Inc. common stock and the cash dividends declared per common share.
|
|
|
|
|
|
|
|
|
|
|
|
|
|
|
|
|
|
|
|
|
High
|
|
|
Low
|
|
|
Close
|
|
|
Cash
Dividends
Declared
|
|
|
2011 Quarter
|
|
|
|
|
|
|
|
|
|
|
|
|
|
|
|
|
|
First
|
|
$
|
65.19
|
|
|
$
|
59.67
|
|
|
$
|
62.99
|
|
|
$
|
.10
|
|
|
Second
|
|
|
64.37
|
|
|
|
55.56
|
|
|
|
59.61
|
|
|
|
.35
|
|
|
Total
|
|
|
|
|
|
|
|
|
|
|
|
|
|
$
|
.45
|
|
|
2010 Quarter
|
|
|
|
|
|
|
|
|
|
|
|
|
|
|
|
|
|
First
|
|
$
|
61.80
|
|
|
$
|
50.46
|
|
|
$
|
59.70
|
|
|
$
|
.10
|
|
|
Second
|
|
|
70.45
|
|
|
|
56.30
|
|
|
|
56.50
|
|
|
|
.10
|
|
|
Third
|
|
|
62.99
|
|
|
|
49.43
|
|
|
|
51.91
|
|
|
|
.10
|
|
|
Fourth
|
|
|
61.79
|
|
|
|
50.69
|
|
|
|
60.72
|
|
|
|
.10
|
|
|
Total
|
|
|
|
|
|
|
|
|
|
|
|
|
|
$
|
.40
|
|
139
Dividend Policy
Holders of PNC common stock are entitled to receive dividends when declared
by the Board of Directors out of funds legally available for this purpose. Our Board of Directors may not pay or set apart dividends on the common stock until dividends for all past dividend periods on any series of outstanding preferred stock have
been paid or declared and set apart for payment. The Board presently intends to continue the policy of paying quarterly cash dividends. The amount of any future dividends will depend on economic and market conditions, our financial condition and
operating results, and other factors, including contractual restrictions and applicable government regulations and policies (such as those relating to the ability of bank and non-bank subsidiaries to pay dividends to the parent company and
regulatory capital limitations).
Dividend Reinvestment And Stock Purchase Plan
The PNC Financial Services Group, Inc. Dividend Reinvestment and Stock Purchase Plan enables holders of our common and preferred stock to conveniently
purchase additional shares of common stock. You can obtain a prospectus and enrollment form by contacting Shareholder Services at 800-982-7652.
Registrar And Stock Transfer Agent
Computershare Trust Company, N.A.
250 Royall
Street
Canton, MA 02021
800-982-7652
140