PNC FINANCIAL SERVICES GROUP, INC.
10-Ks and 10-Qs
|
|
|
|
|
|
|
|
|
|
|
|
|
|
|
|
|
|
|
|
|
|
|
|
|
|
|
|
|
|
|
|
|
|
|
|
|
|
|
|
|
|
|
|
|
|
|
|
|
|
|
|
|
|
|
|
UNITED STATES
SECURITIES AND EXCHANGE COMMISSION
Washington, DC 20549
______________________________________
FORM
10-Q
______________________________________
|
|
QUARTERLY REPORT PURSUANT TO SECTION 13 OR 15(d) OF THE SECURITIES EXCHANGE ACT OF 1934 | ||||
For the quarterly period ended
September 30, 2022
or
|
|
TRANSITION REPORT PURSUANT TO SECTION 13 OR 15(d) OF THE SECURITIES EXCHANGE ACT OF 1934 | ||||
For the transition period from to
Commission file number
001-09718
The
PNC Financial Services Group, Inc.
(Exact name of registrant as specified in its charter)
___________________________________________________________
|
|
|
|||||||
|
(State or other jurisdiction of
incorporation or organization) |
(I.R.S. Employer
Identification No.) |
|||||||
(Address of principal executive offices, including zip code)
(
888
)
762-2265
(Registrant’s telephone number including area code)
(Former name, former address and former fiscal year, if changed since last report)
___________________________________________________________
Securities registered pursuant to Section 12(b) of the Act:
| Title of Each Class | Trading Symbol(s) |
Name of Each Exchange
on Which Registered
|
||||||
|
|
|
|
||||||
Indicate by check mark whether the registrant: (1) has filed all reports required to be filed by Section 13 or 15(d) of the Securities Exchange Act of 1934 during the preceding 12 months (or for such shorter period that the registrant was required to file such reports), and (2) has been subject to such filing requirements for the past 90 days.
Yes
☒
No
☐
Indicate by check mark whether the registrant has submitted electronically every Interactive Data File required to be submitted pursuant to Rule 405 of Regulation S-T (§232.405 of this chapter) during the preceding 12 months (or for such shorter period that the registrant was required to submit such files).
Yes
☒
No
☐
Indicate by check mark whether the registrant is a large accelerated filer, an accelerated filer, a non-accelerated filer, a smaller reporting company, or an emerging growth company. See the definitions of “large accelerated filer”, “accelerated filer”, “smaller reporting company”, and “emerging growth company” in Rule 12b-2 of the Exchange Act.
|
|
☒ | Accelerated filer | ☐ | |||||||||||||||||
| Non-accelerated filer | ☐ | Smaller reporting company |
|
|||||||||||||||||
| Emerging growth company |
|
|||||||||||||||||||
If an emerging growth company, indicate by check mark if the registrant has elected not to use the extended transition period for complying with any new or revised financial accounting standards provided pursuant to Section 13(a) of the Exchange Act. ☐
Indicate by check mark whether the registrant is a shell company (as defined in Rule 12b-2 of the Exchange Act).
Yes ☐ No
☒
As of October 17, 2022, there were
403,319,033
shares of the registrant’s common stock ($5 par value) outstanding.
T
HE
PNC F
INANCIAL
S
ERVICES
G
ROUP
, I
NC
.
Cross-Reference Index to Third Quarter 2022 Form 10-Q
| Pages | |||||
| PART I – FINANCIAL INFORMATION | |||||
| Item 1. Financial Statements (Unaudited). | |||||
| Item 2. Management’s Discussion and Analysis of Financial Condition and Results of Operations (MD&A). | |||||
| Item 3. Quantitative and Qualitative Disclosures about Market Risk. |
21-38, 49-50,
83-89 |
||||
| Item 4. Controls and Procedures. | |||||
| MD&A TABLE REFERENCE | ||||||||
| Table | Description | Page | ||||||
| 1 | ||||||||
| 2 | ||||||||
| 3 | ||||||||
| 4 | ||||||||
| 5 | ||||||||
| 6 | ||||||||
| 7 | ||||||||
| 8 | ||||||||
| 9 | ||||||||
| 10 | ||||||||
| 11 | ||||||||
| 12 | ||||||||
| 13 | ||||||||
| 14 | ||||||||
| 15 | ||||||||
| 16 | ||||||||
| 17 | ||||||||
| 18 | ||||||||
| 19 | ||||||||
| 20 | ||||||||
| 21 | ||||||||
| 22 | ||||||||
| 23 | ||||||||
| 24 | ||||||||
| 25 | ||||||||
| 26 | ||||||||
| 27 | ||||||||
| 28 | ||||||||
| 29 | ||||||||
| 30 | ||||||||
| 31 | ||||||||
| 32 | ||||||||
| 33 | ||||||||
| NOTES TO CONSOLIDATED FINANCIAL STATEMENTS TABLE REFERENCE | ||||||||
| Table | Description | Page | ||||||
| 34 | ||||||||
| 35 | ||||||||
| 36 | ||||||||
| 37 | ||||||||
| 38 | ||||||||
| 39 | ||||||||
| 40 | ||||||||
| 41 | ||||||||
| 42 | ||||||||
| 43 | ||||||||
| 44 | ||||||||
| 45 | ||||||||
| 46 | ||||||||
| 47 | ||||||||
| 48 | ||||||||
| 49 | ||||||||
| 50 | ||||||||
| 51 | ||||||||
| 52 | ||||||||
| 53 | ||||||||
| 54 | ||||||||
| 55 | ||||||||
| 56 | ||||||||
| 57 | ||||||||
| 58 | ||||||||
| 59 | ||||||||
| 60 | ||||||||
| 61 | ||||||||
| 62 | ||||||||
| 63 | ||||||||
| 64 | ||||||||
| 65 | ||||||||
| 66 | ||||||||
| 67 | ||||||||
| 68 | ||||||||
| 69 | ||||||||
| 70 | ||||||||
| 71 | ||||||||
| 72 | ||||||||
| 73 | ||||||||
| 74 | ||||||||
| 75 | ||||||||
| 76 | ||||||||
| 77 | ||||||||
FINANCIAL REVIEW
T
HE
PNC F
INANCIAL
S
ERVICES
G
ROUP
, I
NC
.
This Financial Review, including the Consolidated Financial Highlights, should be read together with our unaudited Consolidated Financial Statements and unaudited Statistical Information included elsewhere in this Quarterly Report on Form 10-Q (the Report or Form 10-Q) and with Items 6, 7, 8 and 9A of our 2021 Annual Report on Form 10-K (2021 Form 10-K). We have reclassified certain prior period amounts to conform with the current period presentation, which we believe is more meaningful to readers of our consolidated financial statements. For information regarding certain business, regulatory and legal risks, see the following: the Risk Management section of this Financial Review and of Item 7 in our 2021 Form 10-K; Item 1A Risk Factors included in our 2021 Form 10-K; and the Commitments and Legal Proceedings Notes of the Notes To Consolidated Financial Statements included in Item 1 of this Report and our first and second quarter 2022 Form 10-Qs and Item 8 of our 2021 Form 10-K. Also, see the Cautionary Statement Regarding Forward-Looking Information section in this Financial Review and the Critical Accounting Estimates and Judgments section in this Financial Review and in our 2021 Form 10-K for certain other factors that could cause actual results or future events to differ, perhaps materially, from historical performance and from those anticipated in the forward-looking statements included in this Report. See Note 15 Segment Reporting in the Notes To Consolidated Financial Statements included in this Report for a reconciliation of total business segment earnings to total PNC consolidated net income as reported on a GAAP basis. In this Report, “PNC”, “we” or “us” refers to The PNC Financial Services Group, Inc. and its subsidiaries on a consolidated basis (except when referring to PNC as a public company, its common stock or other securities issued by PNC, which just refer to The PNC Financial Services Group, Inc.). References to The PNC Financial Services Group, Inc. or to any of its subsidiaries are specifically made where applicable.
See page 99 for a glossary of certain terms and acronyms used in this Report.
Table 1: Consolidated Financial Highlights
|
Dollars in millions, except per share data
Unaudited |
Three months ended | Nine months ended | ||||||||||||||||||
| September 30 | June 30 | September 30 | September 30 | September 30 | ||||||||||||||||
| 2022 | 2022 | 2021 | 2022 | 2021 | ||||||||||||||||
| Financial Results (a) | ||||||||||||||||||||
| Net interest income | $ | 3,475 | $ | 3,051 | $ | 2,856 | $ | 9,330 | $ | 7,785 | ||||||||||
| Noninterest income | 2,074 | 2,065 | 2,341 | 6,027 | 6,299 | |||||||||||||||
| Total revenue | 5,549 | 5,116 | 5,197 | 15,357 | 14,084 | |||||||||||||||
| Provision for (recapture of) credit losses | 241 | 36 | (203) | 69 | (452) | |||||||||||||||
| Noninterest expense | 3,280 | 3,244 | 3,587 | 9,696 | 9,211 | |||||||||||||||
|
Income before income taxes and noncontrolling interests
|
$ | 2,028 | $ | 1,836 | $ | 1,813 | $ | 5,592 | $ | 5,325 | ||||||||||
|
Income taxes
|
388 | 340 | 323 | 1,027 | 906 | |||||||||||||||
| Net income | $ | 1,640 | $ | 1,496 | $ | 1,490 | $ | 4,565 | $ | 4,419 | ||||||||||
| Net income attributable to common shareholders | $ | 1,558 | $ | 1,409 | $ | 1,416 | $ | 4,328 | $ | 4,216 | ||||||||||
|
Per Common Share
|
||||||||||||||||||||
| Basic | $ | 3.78 | $ | 3.39 | $ | 3.31 | $ | 10.39 | $ | 9.84 | ||||||||||
| Diluted | $ | 3.78 | $ | 3.39 | $ | 3.30 | $ | 10.39 | $ | 9.83 | ||||||||||
| Book value per common share | $ | 97.59 | $ | 101.39 | $ | 121.16 | ||||||||||||||
| Performance Ratios | ||||||||||||||||||||
| Net interest margin (b) | 2.82 | % | 2.50 | % | 2.27 | % | 2.54 | % | 2.28 | % | ||||||||||
| Noninterest income to total revenue | 37 | % | 40 | % | 45 | % | 39 | % | 45 | % | ||||||||||
| Efficiency | 59 | % | 63 | % | 69 | % | 63 | % | 65 | % | ||||||||||
| Return on: | ||||||||||||||||||||
| Average common shareholders’ equity | 14.97 | % | 13.52 | % | 10.95 | % | 13.31 | % | 11.17 | % | ||||||||||
| Average assets | 1.19 | % | 1.10 | % | 1.06 | % | 1.11 | % | 1.16 | % | ||||||||||
(a)
The Executive Summary and Consolidated Income Statement Review portions of this Financial Review section provide information regarding items impacting the comparability of the periods presented.
(b)
See explanation and reconciliation of this non-GAAP measure in Average Consolidated Balance Sheet and Net Interest Analysis and Reconciliation of Taxable-Equivalent Net Interest Income (non-GAAP) in the Statistical Information (Unaudited) section in Item 1 of this Report.
The PNC Financial Services Group, Inc. –
Form 10-Q
1
Table 1: Consolidated Financial Highlights (Continued) (a)
|
Dollars in millions, except as noted
Unaudited |
September 30
2022 |
December 31
2021 |
September 30
2021 |
|||||||||||
| Balance Sheet Data | ||||||||||||||
| Assets | $ | 559,477 | $ | 557,191 | $ | 553,515 | ||||||||
| Loans | $ | 315,400 | $ | 288,372 | $ | 290,230 | ||||||||
|
Allowance for loan and lease losses
|
$ | 4,581 | $ | 4,868 | $ | 5,355 | ||||||||
| Interest-earning deposits with banks | $ | 40,278 | $ | 74,250 | $ | 75,478 | ||||||||
| Investment securities | $ | 136,451 | $ | 132,962 | $ | 125,606 | ||||||||
| Total deposits | $ | 438,194 | $ | 457,278 | $ | 448,902 | ||||||||
| Borrowed funds | $ | 54,633 | $ | 30,784 | $ | 33,471 | ||||||||
| Total shareholders’ equity | $ | 46,688 | $ | 55,695 | $ | 56,259 | ||||||||
| Common shareholders’ equity | $ | 39,444 | $ | 50,685 | $ | 51,250 | ||||||||
| Other Selected Ratios | ||||||||||||||
| Common equity Tier 1 | 9.3 | % | 10.3 | % | 10.3 | % | ||||||||
| Loans to deposits | 72 | % | 63 | % | 65 | % | ||||||||
| Common shareholders’ equity to total assets | 7.1 | % | 9.1 | % | 9.3 | % | ||||||||
(a)
The Executive Summary and Consolidated Balance Sheet Review portions of this Financial Review provide information regarding items impacting the comparability of the periods presented.
E
XECUTIVE
S
UMMARY
Headquartered in Pittsburgh, Pennsylvania, we are one of the largest diversified financial institutions in the U.S. We have businesses engaged in retail banking, including residential mortgage, corporate and institutional banking and asset management, providing many of our products and services nationally. Our retail branch network is located coast-to-coast. We also have strategic international offices in four countries outside the U.S.
Key Strategic Goals
At PNC we manage our company for the long term. We are focused on the fundamentals of growing customers, loans, deposits and revenue and improving profitability, while investing for the future and managing risk, expenses and capital. We continue to invest in our products, markets and brand, and embrace our commitments to our customers, shareholders, employees and the communities where we do business.
We strive to serve our customers and expand and deepen relationships by offering a broad range of deposit, credit and fee-based products and services. We are focused on delivering those products and services to our customers with the goal of addressing their financial objectives and needs. Our business model is built on customer loyalty and engagement, understanding our customers’ financial goals and offering our diverse products and services to help them achieve financial well-being. Our approach is concentrated on organically growing and deepening client relationships across our businesses that meet our risk/return measures.
We are focused on our strategic priorities, which are designed to enhance value over the long term, and consist of:
•
Expanding our leading banking franchise to new markets and digital platforms,
•
Deepening customer relationships by delivering a superior banking experience and financial solutions, and
•
Leveraging technology to innovate and enhance products, services, security and processes.
Our capital and liquidity priorities are to support customers, fund business investments and return excess capital to shareholders, while maintaining appropriate capital in light of economic conditions, the Basel III framework and other regulatory expectations. For more detail, see the Capital Highlights portion of this Executive Summary, the Liquidity and Capital Management portion of the Risk Management section of this Financial Review and the Supervision and Regulation section in Item 1 Business of our 2021 Form 10-K.
Hurricane Ian
During the last week of September 2022, Hurricane Ian caused widespread damage in central and southwest Florida, a key market area for us. The storm resulted in significant property damage to our customers, the closing or disruption of many businesses, including some of PNC’s branches and facilities, and damage to the community infrastructure. We continue to evaluate the impact to our businesses, and, based on our assessment to date, we do not expect Hurricane Ian to have a material impact on our operating results, including credit losses.
2
The PNC Financial Services Group, Inc. –
Form 10-Q
Presentation of Noninterest Income
Effective for the first quarter of 2022, PNC updated the presentation of its noninterest income categorization to be based on product and service type, and accordingly, has changed the basis of presentation of its noninterest income revenue streams to: (i) Asset management and brokerage, (ii) Capital markets related, (iii) Card and cash management, (iv) Lending and deposit services, (v) Residential and commercial mortgage and (vi) Other noninterest income. For a description of each updated noninterest income revenue stream, see Note 1 Accounting Policies in the Notes To Consolidated Financial Statements included in Item 1 of this Report.
Acquisition of BBVA USA Bancshares, Inc.
On June 1, 2021, PNC acquired BBVA USA Bancshares, Inc. (BBVA), a U.S. financial holding company conducting its business operations primarily through its U.S. banking subsidiary, BBVA USA. PNC paid $11.5 billion in cash as consideration for the acquisition.
On October 8, 2021, BBVA USA merged into PNC Bank. On October 12, 2021, PNC converted approximately 2.6 million customers, 9,000 employees and over 600 branches across seven states. Our results of operations and balance sheets for all periods presented in this Report reflect the benefit of BBVA's acquired businesses for the period since the acquisition closed on June 1, 2021.
For additional information on the acquisition of BBVA, see Note 2 Acquisition Activity in the Notes To Consolidated Financial Statements included in Item 1 of this Report and Note 2 Acquisition and Divestiture Activity in the Notes To Consolidated Financial Statements included in Item 8 of our 2021 Form 10-K.
Income Statement Highlights
Net income of $1.6 billion, or $3.78 per diluted common share, for the third quarter of 2022 increased $144 million, or 10%, compared to $1.5 billion, or $3.39 per diluted common share, for the second quarter of 2022, primarily driven by higher net interest income, partially offset by a higher provision for credit losses.
•
For the three months ended September 30, 2022 compared to the three months ended June 30, 2022:
•
Total revenue increased $433 million, or 8%, to $5.5 billion.
•
Net interest income of $3.5 billion increased $424 million, or 14%, driven by higher yields on interest-earning assets and loan growth, partially offset by higher funding costs.
•
Net interest margin increased 32 basis points to 2.82% primarily due to higher yields on interest-earning assets.
•
Noninterest income increased $9 million.
•
The third quarter of 2022 included a provision for credit losses of $241 million, reflecting slightly weaker economic expectations which impacted our macroeconomic scenarios and weightings. The second quarter of 2022 included a provision for credit losses of $36 million.
•
Noninterest expense increased $36 million to $3.3 billion, reflecting increased personnel expense to support business growth as well as one additional day in the quarter.
•
We generated positive operating leverage of 7%.
Net income of $4.6 billion, or $10.39 per diluted common share, for the first nine months of 2022 increased $146 million, or 3%, compared to $4.4 billion, or $9.83 per diluted common share, for the first nine months of 2021, driven by higher net interest income, partially offset by an increased provision for credit losses, higher expenses and lower noninterest income.
•
For the nine months ended September 30, 2022 compared to the nine months ended September 30, 2021:
•
Total revenue increased $1.3 billion, or 9%, to $15.4 billion.
•
Net interest income increased $1.5 billion, or 20%, due to higher interest-earning asset balances, which included the benefit of BBVA, and higher yields, partially offset by higher funding costs.
•
Net interest margin increased 26 basis points, primarily due to higher yields on interest-earning assets.
•
Noninterest income decreased $272 million, or 4%, primarily due to lower private equity, residential and commercial mortgage and capital markets related fees, partially offset by an increase in card and cash management revenue and $1 million of positive Visa Class B fair value adjustments compared to $165 million of negative adjustments for the same period in 2021.
•
Noninterest expense increased $485 million, or 5%, driven by the addition of BBVA operating expenses and continued business investment, partially offset by lower integration expenses and a decline in variable compensation related to lower business activity.
For additional detail, see the Consolidated Income Statement Review section of this Financial Review.
The PNC Financial Services Group, Inc. –
Form 10-Q
3
Balance Sheet Highlights
Our balance sheet was well positioned at September 30, 2022. In comparison to December 31, 2021:
•
Total assets increased modestly, to $559.5 billion.
•
Total loans increased $27.0 billion, or 9%, to $315.4 billion.
•
Total commercial loans increased $22.5 billion, or 12%, to $215.6 billion, driven by new production and higher utilization of loan commitments, partially offset by PPP loan forgiveness.
•
PPP loans outstanding were $0.6 billion and $3.4 billion at September 30, 2022 and December 31, 2021, respectively.
•
Total consumer loans increased $4.5 billion, or 5%, to $99.8 billion, primarily due to increases in residential mortgages, home equity and credit card, partially offset by declines in the remaining portfolios as paydowns outpaced new originations.
•
Investment securities increased $3.5 billion to $136.5 billion, as a result of net purchase activity, partially offset by net unrealized losses.
•
Interest-earning deposits with banks, primarily with the Federal Reserve Bank, decreased $34.0 billion, or 46%, to $40.3 billion, reflecting higher loans outstanding and lower deposits, partially offset by an increase in borrowed funds.
•
Total deposits decreased $19.1 billion, or 4%, to $438.2 billion due to lower commercial and consumer deposits, reflecting deposit outflows, higher consumer spending and the impact of inflationary pressures.
•
Borrowed funds increased $23.8 billion, or 77%, to $54.6 billion, driven by increased FHLB borrowings, partially offset by lower bank notes and senior debt.
For additional detail, see the Consolidated Balance Sheet Review section of this Financial Review.
Credit Quality Highlights
The third quarter of 2022 reflected strong credit quality performance.
•
At September 30, 2022 compared to December 31, 2021:
•
Nonperforming assets of $2.1 billion decreased $405 million, or 16%, due to lower commercial and consumer nonperforming loans.
•
Overall loan delinquencies of $1.6 billion decreased $359 million, or 18%, driven by lower consumer delinquencies, which included the resolution of BBVA USA conversion-related administrative and operational delays.
•
The ACL related to loans, which consists of the ALLL and the allowance for unfunded lending related commitments, decreased to $5.3 billion, or 1.67% of total loans, at September 30, 2022, compared to $5.5 billion, or 1.92% of total loans at December 31, 2021. The decrease was primarily driven by the reassessment of pandemic-related risks and the impacts of portfolio changes, partially offset by weaker economic expectations.
•
Net charge-offs of $119 million, or 0.15% of average loans, in the third quarter of 2022 increased $36 million, or 43%, compared to $83 million, or 0.11% of average loans, for the second quarter of 2022, primarily driven by higher commercial loan net charge-offs.
For additional detail see the Credit Risk Management portion of the Risk Management section of this Financial Review.
Capital Highlights
We maintained our strong capital position.
•
Common shareholders’ equity of $39.4 billion at September 30, 2022, decreased $11.3 billion, or 22%, compared to December 31, 2021 as the benefit of net income was more than offset by a decrease in AOCI, reflecting the negative impact of higher interest rates on net unrealized securities and swap losses. The decline was also attributable to share repurchases and common dividends paid.
•
In the third quarter, we returned $1.7 billion of capital to shareholders through common share repurchases of $1.1 billion, representing 6.7 million shares, and dividends on common shares of $0.6 million.
•
The SCB framework allows for capital returns in amounts up to the level of capital in excess of the firm's SCB plus the regulatory minimum level of capital. Consistent with the flexibility provided under the SCB framework, our Board of Directors has authorized a repurchase framework under the previously approved repurchase program of up to 100 million common shares, of which approximately 53% were still available for repurchase at September 30, 2022. Under this framework, PNC expects its quarterly repurchases to approximate $700 million to $750 million with the ability to adjust those levels as conditions warrant. PNC's SCB for the four-quarter period beginning October 1, 2022 is 2.9%.
•
On October 3, 2022, the PNC Board of Directors declared a quarterly cash dividend on common stock of $1.50 per share payable on November 5, 2022.
•
Our CET1 ratio decreased to 9.3% at September 30, 2022 from
10.3%
at December 31, 2021.
4
The PNC Financial Services Group, Inc. –
Form 10-Q
•
PNC elected to delay the estimated impact of CECL on CET1 capital through December 31, 2021, followed by a three-year transition period. CECL’s estimated impact on CET1 capital is defined as the change in retained earnings at adoption plus or minus 25% of the change in CECL ACL at the balance sheet date, excluding the initial allowance for PCD loans from BBVA, compared to CECL ACL at adoption. Effective for the first quarter of 2022, PNC is now in the three-year transition period, and the full impact of the CECL standard is being phased-in to regulatory capital through December 31, 2024. The CET1 fully implemented ratio, which reflects the full impact of CECL and excludes the benefits of the optional five-year transition, was 9.1% at September 30, 2022 compared to 10.0% at December 31, 2021.
See the Liquidity and Capital Management portion of the Risk Management section of this Financial Review for more detail on our 2022 liquidity and capital actions as well as our capital ratios.
PNC’s ability to take certain capital actions, including returning capital to shareholders, is subject to PNC meeting or exceeding an SCB established by the Federal Reserve Board in connection with the Federal Reserve Board’s CCAR process. For additional information, see Capital Management in the Risk Management section in this Financial Review and the Supervision and Regulation section in Item 1 Business and Item 1A Risk Factors of our 2021 Form 10-K.
Business Outlook
Statements regarding our business outlook are forward-looking within the meaning of the Private Securities Litigation Reform Act of 1995. Our forward-looking financial statements are subject to the risk that economic and financial market conditions will be substantially different than those we are currently expecting and do not take into account potential legal and regulatory contingencies. These statements are based on our views that:
•
Although real GDP contracted in the first and second quarters of 2022, the U.S. economy is not in recession. In particular, the labor market remains extremely strong, with average monthly job growth well above the pre-pandemic pace, and the unemployment rate at a 50-year low. Supply-chain difficulties will continue to ease into 2023. Labor shortages will remain a constraint into 2023, although strong wage growth and high levels of household saving will support consumer spending.
•
PNC expects economic growth will be below its long-term trend in the near term as the Federal Reserve continues to tighten monetary policy in an attempt to reduce inflationary pressures, but does not expect a near-term recession. Recession risks over the next few years are elevated, however, because of tighter monetary policy.
•
Inflation has started to slow, but remains near the strongest pace in decades. Inflation should slow further due to softer economic growth and a continued easing in supply-chain difficulties and will return to the Federal Reserve’s 2% long-run objective in 2024.
•
The FOMC raised the federal funds rate by 0.75% in September, to a range of 3.00% to 3.25%. PNC expects further increases in the federal funds rate through the rest of this year, to a range of 4.25% to 4.50% at the end of 2022. PNC expects the federal funds rate to peak between 4.50% and 4.75% in early 2023, before falling in early 2024 as inflation ebbs and economic growth slows.
For the fourth quarter of 2022, compared to the third quarter of 2022, we expect:
•
Average loans to be up approximately 1%,
•
Net interest income to be up 6% to 8%,
•
Fee income to be stable to down 1%,
•
Other noninterest income, excluding net securities gains and Visa activity, to be $200 million to $250 million,
•
Revenue to be up approximately 2%,
•
Noninterest expense to be stable to up 1%,
•
Net loan charge-offs to be $125 million to $175 million, and
•
Effective tax rate to be approximately 18.5%.
See the Cautionary Statement Regarding Forward-Looking Information section in this Financial Review and Item 1A Risk Factors in our 2021 Form 10-K for other factors that could cause future events to differ, perhaps materially, from those anticipated in these forward-looking statements.
C
ONSOLIDATED
I
NCOME
S
TATEMENT
R
EVIEW
Our Consolidated Income Statement is presented in Item 1 of this Report.
Net income of $1.6 billion, or $3.78 per diluted common share for the third quarter of 2022 increased $144 million, or 10%, compared to $1.5 billion, or $3.39 per diluted common share for the second quarter of 2022, primarily driven by higher net interest income, partially offset by a higher provision for credit losses. Net income of $4.6 billion, or $10.39 per diluted common share for the first nine months of 2022 increased $146 million, or 3%, compared to $4.4 billion, or $9.83 per diluted common share, for the same period in
The PNC Financial Services Group, Inc. –
Form 10-Q
5
2021. The increase was driven by higher net interest income, partially offset by an increased provision for credit losses, higher expenses and lower noninterest income.
Net Interest Income
Table 2: Summarized Average Balances and Net Interest Income (a)
| September 30, 2022 | June 30, 2022 | ||||||||||||||||||||||||||||||||||||||||
|
Three months ended
Dollars in millions |
Average
Balances |
Average
Yields/ Rates |
Interest
Income/ Expense |
Average
Balances |
Average
Yields/ Rates |
Interest
Income/ Expense |
|||||||||||||||||||||||||||||||||||
| Assets | |||||||||||||||||||||||||||||||||||||||||
| Interest-earning assets | |||||||||||||||||||||||||||||||||||||||||
| Investment securities | $ | 136,990 | 2.10 | % | $ | 720 | $ | 134,724 | 1.89 | % | $ | 636 | |||||||||||||||||||||||||||||
| Loans | 313,026 | 3.98 | % | 3,162 | 304,790 | 3.29 | % | 2,524 | |||||||||||||||||||||||||||||||||
| Interest-earning deposits with banks | 31,892 | 2.32 | % | 185 | 39,689 | 0.79 | % | 78 | |||||||||||||||||||||||||||||||||
| Other | 9,560 | 3.94 | % | 94 | 9,935 | 2.76 | % | 68 | |||||||||||||||||||||||||||||||||
| Total interest-earning assets/interest income | $ | 491,468 | 3.35 | % | 4,161 | $ | 489,138 | 2.69 | % | 3,306 | |||||||||||||||||||||||||||||||
| Liabilities | |||||||||||||||||||||||||||||||||||||||||
| Interest-bearing liabilities | |||||||||||||||||||||||||||||||||||||||||
| Interest-bearing deposits | $ | 298,073 | 0.45 | % | 340 | $ | 297,096 | 0.12 | % | 88 | |||||||||||||||||||||||||||||||
| Borrowed funds | 44,261 | 2.81 | % | 317 | 35,656 | 1.58 | % | 142 | |||||||||||||||||||||||||||||||||
| Total interest-bearing liabilities/interest expense | $ | 342,334 | 0.75 | % | 657 | $ | 332,752 | 0.27 | % | 230 | |||||||||||||||||||||||||||||||
| Net interest margin/income (non-GAAP) | 2.82 | % | 3,504 | 2.50 | % | 3,076 | |||||||||||||||||||||||||||||||||||
| Taxable-equivalent adjustments | (29) | (25) | |||||||||||||||||||||||||||||||||||||||
| Net interest income (GAAP) | $ | 3,475 | $ | 3,051 | |||||||||||||||||||||||||||||||||||||
| September 30, 2022 | September 30, 2021 | ||||||||||||||||||||||||||||||||||||||||
|
Nine months ended
Dollars in millions |
Average
Balances |
Average
Yields/ Rates |
Interest
Income/ Expense |
Average
Balances |
Average
Yields/ Rates |
Interest
Income/ Expense |
|||||||||||||||||||||||||||||||||||
| Assets | |||||||||||||||||||||||||||||||||||||||||
| Interest-earning assets | |||||||||||||||||||||||||||||||||||||||||
| Investment securities | $ | 135,215 | 1.88 | % | $ | 1,904 | $ | 105,287 | 1.73 | % | $ | 1,366 | |||||||||||||||||||||||||||||
| Loans | 302,921 | 3.50 | % | 7,997 | 261,884 | 3.36 | % | 6,629 | |||||||||||||||||||||||||||||||||
| Interest-earning deposits with banks | 44,641 | 0.87 | % | 292 | 81,383 | 0.12 | % | 74 | |||||||||||||||||||||||||||||||||
| Other | 9,637 | 2.92 | % | 210 | 8,345 | 2.27 | % | 142 | |||||||||||||||||||||||||||||||||
| Total interest-earning assets/interest income | $ | 492,414 | 2.80 | % | 10,403 | $ | 456,899 | 2.38 | % | 8,211 | |||||||||||||||||||||||||||||||
| Liabilities | |||||||||||||||||||||||||||||||||||||||||
| Interest-bearing liabilities | |||||||||||||||||||||||||||||||||||||||||
| Interest-bearing deposits | $ | 298,232 | 0.20 | % | 455 | $ | 273,498 | 0.05 | % | 99 | |||||||||||||||||||||||||||||||
| Borrowed funds | 36,794 | 1.95 | % | 542 | 34,562 | 1.05 | % | 275 | |||||||||||||||||||||||||||||||||
| Total interest-bearing liabilities/interest expense | $ | 335,026 | 0.39 | % | 997 | $ | 308,060 | 0.16 | % | 374 | |||||||||||||||||||||||||||||||
| Net interest margin/income (non-GAAP) | 2.54 | % | 9,406 | 2.28 | % | 7,837 | |||||||||||||||||||||||||||||||||||
| Taxable-equivalent adjustments | (76) | (52) | |||||||||||||||||||||||||||||||||||||||
| Net interest income (GAAP) | $ | 9,330 | $ | 7,785 | |||||||||||||||||||||||||||||||||||||
(a)
Interest income calculated as taxable-equivalent interest income. To provide more meaningful comparisons of interest income and yields for all interest-earning assets, as well as net interest margins, we use interest income on a taxable-equivalent basis in calculating average yields and net interest margins by increasing the interest income earned on tax-exempt assets to make it fully equivalent to interest income earned on taxable investments. This adjustment is not permitted under GAAP on the Consolidated Income Statement. For more information, see Reconciliation of Taxable-Equivalent Net Interest Income (non-GAAP) in the Statistical Information (Unaudited) section in Item 1 of this Report.
Changes in net interest income and margin result from the interaction of the volume and composition of interest-earning assets and related yields, interest-bearing liabilities and related rates paid, and noninterest-bearing sources of funding. See the Statistical Information (Unaudited) – Average Consolidated Balance Sheet And Net Interest Analysis section of this Report for additional information.
Net interest income increased $424 million, or 14%, for the third quarter of 2022 compared to the second quarter of 2022, driven by higher yields on interest-earning assets and loan growth, partially offset by higher funding costs. Net interest income increased $1.5 billion, or 20%, for the first nine months of 2022 compared to the same period in 2021, due to higher interest-earning asset balances, which included the benefit of BBVA, and higher yields, partially offset by higher funding costs.
6
The PNC Financial Services Group, Inc. –
Form 10-Q
Net interest margin in the quarterly and year-to-date comparisons increased 32 basis points and 26 basis points, respectively. In both comparisons the increase was primarily due to higher yields on interest-earning assets.
Average investment securities for the third quarter of 2022 increased $2.3 billion, or 2% compared to the second quarter of 2022 reflecting net purchases, primarily of agency residential mortgage-backed securities within the held-to-maturity portfolio. Average investment securities increased $29.9 billion, or 28% in the year-to-date comparison, due to net securities purchases, primarily of U.S. Treasury and government agency securities, agency residential mortgage-backed securities and the addition of BBVA. Average investment securities represented 28% of average interest-earning assets for both the third and second quarter of 2022, and 27% for the first nine months of 2022 compared to 23% for the first nine months of 2021.
In the quarterly and year-to-date comparisons, average loans increased $8.2 billion, or 3%, and $41.0 billion, or 16%, respectively. In both comparisons, the increase was due to growth in commercial and consumer loans, partially offset by PPP loan forgiveness. The increase in the year-to-date comparison also reflects the impact of the BBVA acquisition. Average loans represented 64% of average interest-earning assets for the third quarter of 2022 compared to 62% for the second quarter of 2022, and 62% for the first nine months of 2022 compared to 57% for the first nine months of 2021.
Average interest-earning deposits with banks for the third quarter of 2022 decreased $7.8 billion, or 20%, compared to the second quarter of 2022, driven by increased loans outstanding and lower deposits, partially offset by higher borrowed funds. In the year-to-date comparison, average interest-earning deposits with banks decreased $36.7 billion, or 45%, reflecting higher loan balances and net securities purchases, partially offset by higher deposits.
Average interest-bearing deposits for the third quarter of 2022 were largely stable compared to the second quarter of 2022. Average interest-bearing deposits increased $24.7 billion, or 9%, in the year-to-date comparison, reflecting the BBVA acquisition and the shift in commercial deposits from noninterest-bearing to interest bearing as deposit rates have risen. In total, average interest-bearing deposits represented 87% of average interest-bearing liabilities for the third quarter of 2022 compared to 89% for the second quarter of 2022, and the first nine months of both 2022 and 2021.
Average borrowed funds for the third quarter of 2022 increased $8.6 billion, or 24%, compared to the second quarter of 2022, primarily due to increased FHLB borrowings. Average borrowed funds for the first nine months of 2022 increased $2.2 billion, or 6%, compared to the first nine months of 2021, reflecting higher FHLB borrowings, partially offset by lower bank notes and senior debt.
Further details regarding average loans and deposits are included in the Business Segments Review section of this Financial Review.
Noninterest Income
Table 3: Noninterest Income
| Three months ended | Nine months ended | ||||||||||||||||||||||||||||||||||||||||||||||
| September 30 | June 30 | Change | September 30 | September 30 | Change | ||||||||||||||||||||||||||||||||||||||||||
| Dollars in millions | 2022 | 2022 | $ | % | 2022 | 2021 | $ | % | |||||||||||||||||||||||||||||||||||||||
| Noninterest income | |||||||||||||||||||||||||||||||||||||||||||||||
| Asset management and brokerage | $ | 357 | $ | 365 | $ | (8) | (2) | % | $ | 1,099 | $ | 1,053 | $ | 46 | 4 | % | |||||||||||||||||||||||||||||||
| Capital markets related | 299 | 409 | (110) | (27) | % | 960 | 1,117 | (157) | (14) | % | |||||||||||||||||||||||||||||||||||||
| Card and cash management | 671 | 671 | — | 1,962 | 1,752 | 210 | 12 | % | |||||||||||||||||||||||||||||||||||||||
| Lending and deposit services | 287 | 282 | 5 | 2 | % | 838 | 829 | 9 | 1 | % | |||||||||||||||||||||||||||||||||||||
| Residential and commercial mortgage | 143 | 161 | (18) | (11) | % | 463 | 641 | (178) | (28) | % | |||||||||||||||||||||||||||||||||||||
| Other | 317 | 177 | 140 | 79 | % | 705 | 907 | (202) | (22) | % | |||||||||||||||||||||||||||||||||||||
|
Total noninterest income
|
$ | 2,074 | $ | 2,065 | $ | 9 | — | $ | 6,027 | $ | 6,299 | $ | (272) | (4) | % | ||||||||||||||||||||||||||||||||
Noninterest income as a percentage of total revenue was 37% for the third quarter of 2022 compared to 40% for second quarter of 2022, and 39% for the first nine months of 2022 compared to 45% for the same period in 2021.
Asset management and brokerage fees decreased compared to the
second quarter of 2022
, and included the impact of lower average equity markets. The increase in the year-to-date comparison reflected the benefit of BBVA and increased product sales, partially offset by lower average equity markets. PNC's discretionary client assets under management of $166 billion at September 30, 2022 decreased from $167 billion at June 30, 2022 and $183 billion at September 30, 2021
, primarily as a result of lower spot equity markets.
Capital markets related revenue decreased compared to the second quarter of 2022 driven by lower merger and acquisition advisory fees, reflecting the impact of elevated second quarter activity. In the year-to-date comparison the decrease was primarily due to a decline in equity capital markets advisory, underwriting and merger and acquisition advisory fees.
The PNC Financial Services Group, Inc. –
Form 10-Q
7
Card and cash management revenue was stable compared to the second quarter of 2022. The increase in the year-to-date comparison was primarily due to increased treasury management product revenue, the addition of BBVA and higher consumer spending.
Lending and deposit services increased compared to the second quarter of 2022, driven by higher loan commitment fees. The increase in the year-to-date comparison included the benefit of BBVA.
Residential and commercial mortgage decreased in both the quarterly and year-to-date comparisons, primarily due to lower residential mortgage banking activities.
Other noninterest income increased compared to the second quarter of 2022, and included higher private equity revenue and positive Visa Class B derivative fair value adjustments of $13 million. The second quarter of 2022 included $16 million of negative Visa Class B fair value adjustments. The decrease in the year-to-date comparison was primarily due to lower private equity revenue, partially offset by positive Visa Class B derivative fair value adjustments. The first nine months of 2022 included $1 million of positive Visa Class B fair value adjustments compared to $165 million of negative adjustments for the same period in 2021.
Noninterest Expense
Table 4: Noninterest Expense
| Three months ended | Nine months ended | ||||||||||||||||||||||||||||||||||||||||||||||||||||
| September 30 | June 30 | Change | September 30 | September 30 | Change | ||||||||||||||||||||||||||||||||||||||||||||||||
| Dollars in millions | 2022 | 2022 | $ | % | 2022 | 2021 | $ | % | |||||||||||||||||||||||||||||||||||||||||||||
| Noninterest expense | |||||||||||||||||||||||||||||||||||||||||||||||||||||
| Personnel | $ | 1,805 | $ | 1,779 | $ | 26 | 1 | % | $ | 5,301 | $ | 5,103 | $ | 198 | 4 | % | |||||||||||||||||||||||||||||||||||||
| Occupancy | 241 | 246 | (5) | (2) | % | 745 | 680 | 65 | 10 | % | |||||||||||||||||||||||||||||||||||||||||||
| Equipment | 344 | 351 | (7) | (2) | % | 1,026 | 974 | 52 | 5 | % | |||||||||||||||||||||||||||||||||||||||||||
| Marketing | 93 | 95 | (2) | (2) | % | 249 | 222 | 27 | 12 | % | |||||||||||||||||||||||||||||||||||||||||||
| Other | 797 | 773 | 24 | 3 | % | 2,375 | 2,232 | 143 | 6 | % | |||||||||||||||||||||||||||||||||||||||||||
|
Total noninterest expense
|
$ | 3,280 | $ | 3,244 | $ | 36 | 1 | % | $ | 9,696 | $ | 9,211 | $ | 485 | 5 | % | |||||||||||||||||||||||||||||||||||||
Noninterest expense increased compared to the second quarter of 2022, reflecting increased personnel expense to support business growth as well as one additional day in the quarter. The increase in the first nine months of 2022 compared to the same period in 2021 was driven by the addition of BBVA operating expenses and continued business investment, partially offset by lower integration expenses and a decline in variable compensation related to lower business activity.
Effective Income Tax Rate
The effective income tax rate was 19.1% in the third quarter of 2022, compared to 18.5% in the second quarter of 2022, and 18.4% in the first nine months of 2022 compared to 17.0% for the same period in 2021.
Provision For (Recapture of) Credit Losses
Table 5: Provision for (Recapture of) Credit Losses
| Three months ended | Nine months ended | ||||||||||||||||||||||||||||||||||
| September 30 | June 30 | Change | September 30 | September 30 | Change | ||||||||||||||||||||||||||||||
| Dollars in millions | 2022 | 2022 | $ | 2022 | 2021 | $ | |||||||||||||||||||||||||||||
| Provision for (recapture of) credit losses | |||||||||||||||||||||||||||||||||||
| Loans and leases | $ | 241 | $ | (10) | $ | 251 | $ | 59 | $ | (525) | $ | 584 | |||||||||||||||||||||||
| Unfunded lending related commitments | 1 | 42 | (41) | 20 | 16 | 4 | |||||||||||||||||||||||||||||
| Investment securities | 3 | 3 | 7 | 51 | (44) | ||||||||||||||||||||||||||||||
| Other financial assets | (4) | 1 | (5) | (17) | 6 | (23) | |||||||||||||||||||||||||||||
| Total provision for (recapture of) credit losses | $ | 241 | $ | 36 | $ | 205 | $ | 69 | $ | (452) | $ | 521 | |||||||||||||||||||||||
The third quarter of 2022 included a provision for credit losses of $241 million, reflecting slightly weaker economic expectations which impacted our macroeconomic scenarios and weightings. The second quarter of 2022 included a provision for credit losses of $36 million.
8
The PNC Financial Services Group, Inc. –
Form 10-Q
C
ONSOLIDATED
B
ALANCE
S
HEET
R
EVIEW
The summarized balance sheet data in Table 6 is based upon our Consolidated Balance Sheet in Item 1 of this Report.
Table 6: Summarized Balance Sheet Data
| September 30 | December 31 | Change | |||||||||||||||||||||
| Dollars in millions | 2022 | 2021 | $ | % | |||||||||||||||||||
| Assets | |||||||||||||||||||||||
| Interest-earning deposits with banks | $ | 40,278 | $ | 74,250 | $ | (33,972) | (46) | % | |||||||||||||||
| Loans held for sale | 1,126 | 2,231 | (1,105) | (50) | % | ||||||||||||||||||
| Investment securities | 136,451 | 132,962 | 3,489 | 3 | % | ||||||||||||||||||
| Loans | 315,400 | 288,372 | 27,028 | 9 | % | ||||||||||||||||||
| Allowance for loan and lease losses | (4,581) | (4,868) | 287 | 6 | % | ||||||||||||||||||
| Mortgage servicing rights | 3,206 | 1,818 | 1,388 | 76 | % | ||||||||||||||||||
| Goodwill | 10,987 | 10,916 | 71 | 1 | % | ||||||||||||||||||
| Other | 56,610 | 51,510 | 5,100 | 10 | % | ||||||||||||||||||
| Total assets | $ | 559,477 | $ | 557,191 | $ | 2,286 | — | ||||||||||||||||
| Liabilities | |||||||||||||||||||||||
| Deposits | $ | 438,194 | $ | 457,278 | $ | (19,084) | (4) | % | |||||||||||||||
| Borrowed funds | 54,633 | 30,784 | 23,849 | 77 | % | ||||||||||||||||||
| Allowance for unfunded lending related commitments | 682 | 662 | 20 | 3 | % | ||||||||||||||||||
| Other | 19,245 | 12,741 | 6,504 | 51 | % | ||||||||||||||||||
| Total liabilities | 512,754 | 501,465 | 11,289 | 2 | % | ||||||||||||||||||
| Equity | |||||||||||||||||||||||
| Total shareholders’ equity | 46,688 | 55,695 | (9,007) | (16) | % | ||||||||||||||||||
| Noncontrolling interests | 35 | 31 | 4 | 13 | % | ||||||||||||||||||
| Total equity | 46,723 | 55,726 | (9,003) | (16) | % | ||||||||||||||||||
| Total liabilities and equity | $ | 559,477 | $ | 557,191 | $ | 2,286 | — | ||||||||||||||||
Our balance sheet was well positioned at September 30, 2022. In comparison to December 31, 2021:
•
Total assets increased modestly, reflecting higher loans, securities and MSRs, partially offset by lower balances held with the Federal Reserve Bank.
•
Total liabilities increased primarily due to higher borrowed funds, partially offset by lower deposits.
•
Total equity decreased as the benefit of net income and preferred stock issuances was more than offset by a decrease in AOCI, reflecting the negative impact of higher interest rates on net unrealized securities and swap losses. The decline was also attributable to common share repurchases and dividends paid.
The ACL related to loans totaled $5.3 billion at September 30, 2022, a decrease of $0.2 billion since December 31, 2021, driven by the reassessment of pandemic-related risks and the impacts of portfolio changes, partially offset by weaker economic expectations. See the following for additional information regarding our ACL related to loans:
•
Allowance for Credit Losses in the Credit Risk Management section of this Financial Review,
•
Critical Accounting Estimates and Judgments section of this Financial Review, and
•
Note 4 Loans and Related Allowance for Credit Losses in the Notes To Consolidated Financial Statements included in this Report.
The following discussion provides additional information about the major components of our balance sheet. Information regarding our capital and regulatory compliance is included in the Liquidity and Capital Management
portion of the Risk Management section in this Financial Review and in Note 20 Regulatory Matters in the Notes To Consolidated Financial Statements included in our 2021 Form 10-K.
The PNC Financial Services Group, Inc. –
Form 10-Q
9
Loans
Table 7: Loans
| September 30 | December 31 | Change | |||||||||||||||||||||
| Dollars in millions | 2022 | 2021 | $ | % | |||||||||||||||||||
| Commercial | |||||||||||||||||||||||
| Commercial and industrial | $ | 173,813 | $ | 152,933 | $ | 20,880 | 14 | % | |||||||||||||||
| Commercial real estate | 35,592 | 34,015 | 1,577 | 5 | % | ||||||||||||||||||
| Equipment lease financing | 6,192 | 6,130 | 62 | 1 | % | ||||||||||||||||||
| Total commercial | 215,597 | 193,078 | 22,519 | 12 | % | ||||||||||||||||||
| Consumer | |||||||||||||||||||||||
| Residential real estate | 45,057 | 39,712 | 5,345 | 13 | % | ||||||||||||||||||
| Home equity | 25,367 | 24,061 | 1,306 | 5 | % | ||||||||||||||||||
| Automobile | 15,025 | 16,635 | (1,610) | (10) | % | ||||||||||||||||||
| Credit card | 6,774 | 6,626 | 148 | 2 | % | ||||||||||||||||||
| Education | 2,287 | 2,533 | (246) | (10) | % | ||||||||||||||||||
| Other consumer | 5,293 | 5,727 | (434) | (8) | % | ||||||||||||||||||
| Total consumer | 99,803 | 95,294 | 4,509 | 5 | % | ||||||||||||||||||
| Total loans | $ | 315,400 | $ | 288,372 | $ | 27,028 | 9 | % | |||||||||||||||
Commercial loans increased driven by new production and higher utilization of loan commitments, partially offset by PPP loan forgiveness. PPP loans outstanding were $0.6 billion and $3.4 billion at September 30, 2022 and December 31, 2021, respectively.
For commercial and industrial loans by industry and commercial real estate loans by geography and property type, see Loan Portfolio Characteristics and Analysis in the Credit Risk Management portion of the Risk Management section of this Financial Review.
Consumer loans increased primarily due to increases in residential mortgages, home equity and credit card, partially offset by declines in the remaining portfolios as paydowns outpaced new originations.
For information on our residential real estate and home equity portfolios, including loans by geography, and our auto loan portfolio, see Loan Portfolio Characteristics and Analysis in the Credit Risk Management portion of the Risk Management section in this Financial Review.
For additional information regarding our loan portfolio see the Credit Risk Management portion of the Risk Management section in this Item 1 and Note 4 Loans and Related Allowance for Credit Losses in the Notes To Consolidated Financial Statements included in this Report.
10
The PNC Financial Services Group, Inc. –
Form 10-Q
Investment Securities
Investment securities of $136.5 billion at September 30, 2022 increased $3.5 billion, or 3%, compared to December 31, 2021, from net purchase activity, partially offset by net unrealized losses.
The level and composition of the investment securities portfolio fluctuates over time based on many factors, including market conditions, loan and deposit growth and balance sheet management activities. We manage our investment securities portfolio to optimize returns, while providing a reliable source of liquidity for our banking and other activities, considering the LCR, NSFR and other internal and external guidelines and constraints.
Table 8: Investment Securities
| September 30, 2022 | December 31, 2021 | Ratings as of September 30, 2022 (a) | ||||||||||||||||||||||||||||||||||||||||||||||||||||||
| Dollars in millions |
Amortized
Cost (b) |
Fair
Value |
Amortized
Cost (b) |
Fair
Value |
AAA/
AA |
A | BBB | BB and Lower |
No
Rating |
|||||||||||||||||||||||||||||||||||||||||||||||
| U.S. Treasury and government agencies | $ | 47,213 | $ | 44,622 | $ | 47,024 | $ | 47,054 | 100 | % | ||||||||||||||||||||||||||||||||||||||||||||||
| Agency residential mortgage-backed | 74,145 | 67,149 | 67,326 | 67,632 | 100 | % | ||||||||||||||||||||||||||||||||||||||||||||||||||
| Non-agency residential mortgage-backed | 1,006 | 1,129 | 927 | 1,158 | 8 | % | 1 | % | 37 | % | 54 | % | ||||||||||||||||||||||||||||||||||||||||||||
| Agency commercial mortgage-backed | 2,593 | 2,391 | 1,740 | 1,773 | 100 | % | ||||||||||||||||||||||||||||||||||||||||||||||||||
| Non-agency commercial mortgage-backed (c) | 3,109 | 3,026 | 3,423 | 3,436 | 85 | % | 1 | % | 2 | % | 12 | % | ||||||||||||||||||||||||||||||||||||||||||||
| Asset-backed (d) | 6,671 | 6,536 | 6,380 | 6,409 | 96 | % | 1 | % | 2 | % | 1 | % | ||||||||||||||||||||||||||||||||||||||||||||
| Other (e) | 6,505 | 6,133 | 5,404 | 5,596 | 50 | % | 29 | % | 18 | % | 3 | % | ||||||||||||||||||||||||||||||||||||||||||||
| Total investment securities (f) | $ | 141,242 | $ | 130,986 | $ | 132,224 | $ | 133,058 | 97 | % | 1 | % | 1 | % | 1 | % | ||||||||||||||||||||||||||||||||||||||||
(a)
Ratings percentages allocated based on amortized cost, net of allowance for investment securities.
(b)
Amortized cost is presented net of the allowance for investment securities, which totaled $140 million at September 30, 2022 and primarily related to non-agency commercial mortgage-backed securities. The comparable amount at December 31, 2021 was $133 million.
(c)
Collateralized primarily by office buildings, multifamily housing, retail properties, lodging properties and industrial properties.
(d)
Collateralized primarily by corporate debt, government guaranteed education loans and other consumer credit products.
(e)
Includes state and municipal securities.
(f)
Includes available for sale and held to maturity securities, which are recorded on our balance sheet at fair value and amortized cost, respectively.
Table 8 presents the distribution of our investment securities portfolio by amortized cost and fair value, as well as by credit rating. The relationship of fair value to amortized cost at September 30, 2022 compared to December 31, 2021 primarily reflected the impact of higher interest rates on the valuation of fixed rate securities. We have included credit ratings information because we believe that the information is an indicator of the degree of credit risk to which we are exposed. Changes in credit ratings classifications could indicate increased or decreased credit risk and could be accompanied by a reduction or increase in the fair value of our investment securities portfolio. We continually monitor the credit risk in our portfolio and maintain the allowance for investment securities at an appropriate level to absorb expected credit losses on our investment securities portfolio for the remaining contractual term of the securities adjusted for expected prepayments. See Note 3 Investment Securities in the Notes To Consolidated Financial Statements included in Item 1 of this Report for additional details regarding the allowance for investment securities.
During the first nine months of 2022, we transferred securities with a fair value of $82.7 billion, from available for sale to held to maturity. We changed our intent and committed to hold these high-quality securities to maturity in order to reduce the impact of price volatility on AOCI and tangible capital. See Note 3 Investment Securities in the Notes To Consolidated Financial Statements included in Item 1 of this Report for additional details regarding these transfers.
The duration of investment securities was 4.5 years at September 30, 2022. We estimate that at September 30, 2022 the effective duration of investment securities was 4.4 years for an immediate 50 basis points parallel increase in interest rates and 4.5 years for an immediate 50 basis points parallel decrease in interest rates. Comparable amounts at December 31, 2021 for the effective duration of investment securities were 3.8 years and 3.5 years, respectively.
Based on expected prepayment speeds, the weighted-average expected maturity of the investment securities portfolio was 5.8 years at September 30, 2022 compared to 4.4 years at December 31, 2021.
The PNC Financial Services Group, Inc. –
Form 10-Q
11
Table 9: Weighted-Average Expected Maturities of Mortgage and Asset-Backed Debt Securities
| September 30, 2022 | Years | |||||||
| Agency residential mortgage-backed | 7.4 | |||||||
| Non-agency residential mortgage-backed | 9.6 | |||||||
| Agency commercial mortgage-backed | 5.3 | |||||||
| Non-agency commercial mortgage-backed | 1.5 | |||||||
| Asset-backed | 2.6 | |||||||
Additional information regarding our investment securities portfolio is included in Note 3 Investment Securities and Note 12 Fair Value in the Notes To Consolidated Financial Statements included in Item 1 of this Report.
Funding Sources
Table 10: Details of Funding Sources
| September 30 | December 31 | Change | |||||||||||||||||||||
| Dollars in millions | 2022 | 2021 | $ | % | |||||||||||||||||||
| Deposits | |||||||||||||||||||||||
| Noninterest-bearing | $ | 138,423 | $ | 155,175 | $ | (16,752) | (11) | % | |||||||||||||||
| Interest-bearing | |||||||||||||||||||||||
| Money market | 61,366 | 61,229 | 137 | — | |||||||||||||||||||
| Demand | 124,167 | 115,910 | 8,257 | 7 | % | ||||||||||||||||||
| Savings | 104,204 | 107,598 | (3,394) | (3) | % | ||||||||||||||||||
| Time deposits | 10,034 | 17,366 | (7,332) | (42) | % | ||||||||||||||||||
| Total interest-bearing deposits | 299,771 | 302,103 | (2,332) | (1) | % | ||||||||||||||||||
| Total deposits | 438,194 | 457,278 | (19,084) | (4) | % | ||||||||||||||||||
| Borrowed funds | |||||||||||||||||||||||
| Federal Home Loan Bank borrowings | 30,075 | 30,075 | — | ||||||||||||||||||||
| Bank notes and senior debt | 13,357 | 20,661 | (7,304) | (35) | % | ||||||||||||||||||
| Subordinated debt | 7,286 | 6,996 | 290 | 4 | % | ||||||||||||||||||
| Other | 3,915 | 3,127 | 788 | 25 | % | ||||||||||||||||||
| Total borrowed funds | 54,633 | 30,784 | 23,849 | 77 | % | ||||||||||||||||||
| Total funding sources | $ | 492,827 | $ | 488,062 | $ | 4,765 | 1 | % | |||||||||||||||
Total deposits decreased due to lower commercial and consumer deposits, reflecting deposit outflows, higher consumer spending and the impact of inflationary pressures.
Borrowed funds increased primarily due to increased FHLB borrowings, partially offset by lower bank notes and senior debt.
The level and composition of borrowed funds fluctuates over time based on many factors including market conditions, loan, investment securities and deposit growth and capital considerations. We manage our borrowed funds to provide a reliable source of liquidity for our banking and other activities, considering our LCR and NSFR requirements and other internal and external guidelines and constraints.
See the Liquidity and Capital Management portion of the Risk Management section of this Financial Review for additional information regarding our 2022 liquidity and capital acti
vities. See Note 8 Borrowed Funds in the Notes To Consolidated Financial Statements in this Report and Note 10 Borrowed Funds in the Notes To Consolidated Financial Statements in Item 8 of our 2021 Form 10-K for additional information related to our borrowings.
Shareholders’ Equity
Total shareholders’ equity was $46.7 billion at September 30, 2022, a decrease of $9.0 billion compared to December 31, 2021, as increases related to net income of $4.6 billion and preferred stock issuances of $2.2 billion were more than offset by a decrease in AOCI of $10.9 billion, reflecting the negative impact of higher interest rates on net unrealized securities and swap losses. The decline was also attributable to common share repurchases of $3.0 billion and dividends paid of $1.9 billion.
12
The PNC Financial Services Group, Inc. –
Form 10-Q
B
USINESS
S
EGMENTS
R
EVIEW
We have three reportable business segments:
•
Retail Banking
•
Corporate & Institutional Banking
•
Asset Management Group
Business segment results and a description of each business are included in Note 15 Segment Reporting in the Notes To Consolidated Financial Statements included in Item 1 of this Report. Certain amounts included in this Business Segments Review differ from those amounts shown in Note 15, primarily due to the presentation in this Financial Review of business net interest income on a taxable-equivalent basis.
Net interest income in business segment results reflects our internal funds transfer pricing methodology. Assets receive a funding charge and liabilities and capital receive a funding credit based on a transfer pricing methodology that incorporates product repricing characteristics, tenor and other factors.
Total business segment financial results differ from total consolidated net income. The impact of these differences is reflected in the “Other” category as shown in Table 76 in Note 15 Segment Reporting in the Notes To Consolidated Financial Statements included in Item 1 of this Report. “Other” includes residual activities that do not meet the criteria for disclosure as a separate reportable business, such as asset and liability management activities, including net securities gains or losses, ACL for investment securities, certain trading activities, certain runoff consumer loan portfolios, private equity investments, intercompany eliminations, certain corporate overhead, tax adjustments that are not allocated to business segments, exited businesses and differences between business segment performance reporting and financial statement reporting (GAAP).
The PNC Financial Services Group, Inc. –
Form 10-Q
13
Retail Banking
Retail Banking's core strategy is to help all of our consumer and small business customers move forward financially. We aim to grow our primary checking and transaction relationships through strong customer acquisition and retention. We seek to deepen relationships by meeting the broad range of our customers’ financial needs with savings, liquidity, lending, payments, investment and retirement solutions. A strategic priority for us is to differentiate the customer experience, leveraging technology to make banking easier for our customers. A key element of our strategy is to expand the use of lower-cost alternative distribution channels, with an emphasis on digital capabilities and ATM access, while continuing to optimize the traditional branch network. In addition, we are focused on consistently engaging both our employees and customers, which is a strong driver of customer growth, retention and relationship expansion.
Table 11: Retail Banking Table
| (Unaudited) | |||||||||||||||||||||||
| Nine months ended September 30 | Change | ||||||||||||||||||||||
| Dollars in millions, except as noted | 2022 | 2021 | $ | % | |||||||||||||||||||
| Income Statement | |||||||||||||||||||||||
| Net interest income | $ | 5,210 | $ | 4,572 | $ | 638 | 14 | % | |||||||||||||||
| Noninterest income | 2,218 | 2,022 | 196 | 10 | % | ||||||||||||||||||
| Total revenue | 7,428 | 6,594 | 834 | 13 | % | ||||||||||||||||||
| Provision for (recapture of) credit losses | 66 | (156) | 222 | * | |||||||||||||||||||
| Noninterest expense | 5,706 | 5,042 | 664 | 13 | % | ||||||||||||||||||
| Pretax earnings | 1,656 | 1,708 | (52) | (3) | % | ||||||||||||||||||
| Income taxes | 389 | 396 | (7) | (2) | % | ||||||||||||||||||
| Noncontrolling interests | 45 | 26 | 19 | 73 | % | ||||||||||||||||||
| Earnings | $ | 1,222 | $ | 1,286 | $ | (64) | (5) | % | |||||||||||||||
| Average Balance Sheet | |||||||||||||||||||||||
| Loans held for sale | $ | 991 | $ | 1,296 | $ | (305) | (24) | % | |||||||||||||||
| Loans | |||||||||||||||||||||||
| Consumer | |||||||||||||||||||||||
| Residential real estate | $ | 33,088 | $ | 23,323 | $ | 9,765 | 42 | % | |||||||||||||||
| Home equity | 22,916 | 22,324 | 592 | 3 | % | ||||||||||||||||||
| Automobile | 15,638 | 15,398 | 240 | 2 | % | ||||||||||||||||||
| Credit card | 6,532 | 6,070 | 462 | 8 | % | ||||||||||||||||||
| Education | 2,422 | 2,820 | (398) | (14) | % | ||||||||||||||||||
| Other consumer | 2,204 | 2,326 | (122) | (5) | % | ||||||||||||||||||
| Total consumer | 82,800 | 72,261 | 10,539 | 15 | % | ||||||||||||||||||
| Commercial | 11,176 | 14,819 | (3,643) | (25) | % | ||||||||||||||||||
| Total loans | $ | 93,976 | $ | 87,080 | $ | 6,896 | 8 | % | |||||||||||||||
| Total assets | $ | 113,157 | $ | 103,820 | $ | 9,337 | 9 | % | |||||||||||||||
| Deposits | |||||||||||||||||||||||
| Noninterest-bearing | $ | 65,026 | $ | 55,107 | $ | 9,919 | 18 | % | |||||||||||||||
| Interest-bearing | 200,918 | 179,567 | 21,351 | 12 | % | ||||||||||||||||||
| Total deposits | $ | 265,944 | $ | 234,674 | $ | 31,270 | 13 | % | |||||||||||||||
| Performance Ratios | |||||||||||||||||||||||
| Return on average assets | 1.44 | % | 1.66 | % | |||||||||||||||||||
| Noninterest income to total revenue | 30 | % | 31 | % | |||||||||||||||||||
| Efficiency | 77 | % | 76 | % | |||||||||||||||||||
14
The PNC Financial Services Group, Inc. –
Form 10-Q
|
At or for nine months ended September 30
|
Change | ||||||||||||||||||||||
| Dollars in millions, except as noted | 2022 | 2021 | $ | % | |||||||||||||||||||
| Supplemental Noninterest Income Information | |||||||||||||||||||||||
| Asset management and brokerage | $ | 400 | $ | 334 | $ | 66 | 20 | % | |||||||||||||||
| Card and cash management | $ | 1,003 | $ | 934 | $ | 69 | 7 | % | |||||||||||||||
| Lending and deposit services | $ | 498 | $ | 462 | $ | 36 | 8 | % | |||||||||||||||
| Residential and commercial mortgage | $ | 208 | $ | 355 | $ | (147) | (41) | % | |||||||||||||||
| Residential Mortgage Information | |||||||||||||||||||||||
| Residential mortgage servicing statistics (in billions, except as noted) (a) | |||||||||||||||||||||||
| Serviced portfolio balance (b) | $ | 170 | $ | 139 | $ | 31 | 22 | % | |||||||||||||||
| Serviced portfolio acquisitions | $ | 50 | $ | 42 | $ | 8 | 19 | % | |||||||||||||||
| MSR asset value (b) | $ | 2.1 | $ | 1.1 | $ | 1.0 | 91 | % | |||||||||||||||
| MSR capitalization value (in basis points) (b) | 122 | 81 | 41 | 51 | % | ||||||||||||||||||
| Servicing income: (in millions) | |||||||||||||||||||||||
| Servicing fees, net (c) | $ | 119 | $ | 20 | $ | 99 | * | ||||||||||||||||
| Mortgage servicing rights valuation, net of economic hedge | $ | (15) | $ | 62 | $ | (77) | (124) | % | |||||||||||||||
| Residential mortgage loan statistics | |||||||||||||||||||||||
| Loan origination volume (in billions) | $ | 13.0 | $ | 18.2 | $ | (5.2) | (29) | % | |||||||||||||||
| Loan sale margin percentage | 2.13 | % | 2.95 | % | |||||||||||||||||||
| Percentage of originations represented by: | |||||||||||||||||||||||
| Purchase volume (d) | 64 | % | 45 | % | |||||||||||||||||||
| Refinance volume | 36 | % | 55 | % | |||||||||||||||||||
| Other Information (b) | |||||||||||||||||||||||
| Customer-related statistics (average) | |||||||||||||||||||||||
| Non-teller deposit transactions (e) | 64 | % | 66 | % | |||||||||||||||||||
| Digital consumer customers (f) | 78 | % | 80 | % | |||||||||||||||||||
| Credit-related statistics | |||||||||||||||||||||||
| Nonperforming assets | $ | 1,027 | $ | 1,220 | $ | (193) | (16) | % | |||||||||||||||
| Net charge-offs - loans and leases | $ | 327 | $ | 269 | $ | 58 | 22 | % | |||||||||||||||
| Other statistics | |||||||||||||||||||||||
| ATMs | 9,169 | 9,572 | (403) | (4) | % | ||||||||||||||||||
| Branches (g) | 2,527 | 2,712 | (185) | (7) | % | ||||||||||||||||||
| Brokerage account client assets (in billions) (h) | $ | 67 | $ | 76 | $ | (9) | (12) | % | |||||||||||||||
*- Not Meaningful
(a) Represents mortgage loan servicing balances for third parties and the related income.
(b)
Presented as of period end, except for average customer-related statistics and net charge-offs, which are both shown for the nine months ended.
(c)
Servicing fees net of impact of decrease in MSR value due to passage of time, including the impact from both regularly scheduled loan payments, prepayments and loans that were paid down or paid off during the period.
(d)
Mortgages with borrowers as part of residential real estate purchase transactions.
(e)
Percentage of total consumer and business banking deposit transactions processed at an ATM or through our mobile banking application.
(f)
Represents consumer checking relationships that process the majority of their transactions through non-teller channels.
(g)
Reflects all branches and solution centers excluding stand-alone mortgage offices and satellite offices (
e.g.
, drive-ups, electronic branches and retirement centers) that provide limited products and/or services.
(h)
Includes cash and money market balances.
Retail Banking earnings for the first
nine months
of 2022 decreased $64 million compared to the same period in 2021 primarily due to increased noninterest expense and a higher provision for credit losses, partially offset by higher net interest and noninterest income.
Net interest income increased primarily due to growth in average deposit and loan balances, reflecting the BBVA acquisition, along with wider interest rate spreads on the value of deposits, partially offset by narrower interest rate spreads on the value of loans.
Noninterest income increased due to the favorable impact of Visa Class B fair value adjustments compared to a negative adjustment in 2021 related to expected litigation timing. The increase was also driven by higher card and cash management revenue, increased asset management and brokerage fees and higher lending and deposit related fees, which included the addition of BBVA customers.
Noninterest expense increased due to the impact of BBVA operating expenses, increased business activity and continued investments in strategic initiatives.
The deposit strategy of Retail Banking is to remain disciplined on pricing and focused on growing and retaining relationship-based balances, executing on market-specific deposit growth strategies and providing a source of low-cost funding and liquidity to PNC. In
The PNC Financial Services Group, Inc. –
Form 10-Q
15
the first nine months of 2022, average total deposits increased compared to the same period in 2021, primarily driven by growth in demand and savings deposits which included the impact of the BBVA acquisition.
Retail Banking average total loans increased in the first nine months of 2022 compared to the same period in 2021. Average consumer loans increased 15% due to the impact of the BBVA acquisition on all loan classes except education loans, which BBVA did not have in their loan portfolio. In addition, average residential real estate loans increased, as new originations outpaced the runoff. The increase was partially offset by a decline in other consumer loans as paydowns outpaced new originations. Average commercial loans decreased primarily due to forgiveness of PPP loans.
As part of our strategic focus on growing customers and meeting their financial needs, we have established a coast-to-coast network of retail branches and ATMs that operate alongside PNC’s suite of digital capabilities. Over time, we plan to continue to convert a portion of these branches to solution centers, which have a distinctive layout and the capability to support transactions, sales and advice using a combination of technology and personalized banker assistance. PNC began to deploy solution centers in 2018.
Retail Banking continues to enhance the customer experience with refinements to product and service offerings that drive value for consumers and small businesses. We are focused on meeting the financial needs of customers by providing a broad range of liquidity, banking, payments and investment products. In 2021, we successfully rolled out Low Cash Mode
®
to all Virtual Wallet
®
customers providing them with the ability to avoid unnecessary overdraft fees through real-time intelligent alerts, extra time to prevent or address overdrafts and controls to choose whether to return certain debits rather than the bank making the decision.
In August, we eliminated non-sufficient fund fees for all consumer checking account customers. Virtual Wallet
®
customers had previously received this benefit with the launch of Low Cash Mode
®
.
Retail Banking continued to execute on its strategy of transforming the customer experience through transaction channel migration, branch network and home lending process transformations and multi-channel engagement and service strategies. We are also continually assessing our current branch network for optimization opportunities as usage of alternative channels has increased and as a result, have closed 105 branches in the first nine months of 2022, consistent with our plan.
16
The PNC Financial Services Group, Inc. –
Form 10-Q
Corporate & Institutional Banking
Corporate & Institutional Banking’s strategy is to be the leading relationship-based provider of traditional banking products and services to its customers through the economic cycles. We aim to grow our market share and drive higher returns by delivering value-added solutions that help our clients better run their organizations, all while maintaining prudent risk and expense management. We continue to focus on building client relationships where the risk-return profile is attractive.
Table 12: Corporate & Institutional Banking Table
| (Unaudited) | |||||||||||||||||||||||
| Nine months ended September 30 | Change | ||||||||||||||||||||||
| Dollars in millions | 2022 | 2021 | $ | % | |||||||||||||||||||
| Income Statement | |||||||||||||||||||||||
| Net interest income | $ | 3,781 | $ | 3,343 | $ | 438 | 13 | % | |||||||||||||||
| Noninterest income | 2,659 | 2,730 | (71) | (3) | % | ||||||||||||||||||
| Total revenue | 6,440 | 6,073 | 367 | 6 | % | ||||||||||||||||||
| Provision for (recapture of) credit losses | 15 | (277) | 292 | * | |||||||||||||||||||
| Noninterest expense | 2,661 | 2,504 | 157 | 6 | % | ||||||||||||||||||
| Pretax earnings | 3,764 | 3,846 | (82) | (2) | % | ||||||||||||||||||
| Income taxes | 864 | 846 | 18 | 2 | % | ||||||||||||||||||
| Noncontrolling interests | 12 | 10 | 2 | 20 | % | ||||||||||||||||||
| Earnings | $ | 2,888 | $ | 2,990 | $ | (102) | (3) | % | |||||||||||||||
| Average Balance Sheet | |||||||||||||||||||||||
| Loans held for sale | $ | 522 | $ | 598 | $ | (76) | (13) | % | |||||||||||||||
| Loans | |||||||||||||||||||||||
| Commercial | |||||||||||||||||||||||
| Commercial and industrial | $ | 151,971 | $ | 123,505 | $ | 28,466 | 23 | % | |||||||||||||||
| Commercial real estate | 32,938 | 30,919 | 2,019 | 7 | % | ||||||||||||||||||
| Equipment lease financing | 6,168 | 6,321 | (153) | (2) | % | ||||||||||||||||||
| Total commercial | 191,077 | 160,745 | 30,332 | 19 | % | ||||||||||||||||||
| Consumer | 9 | 14 | (5) | (36) | % | ||||||||||||||||||
| Total loans | $ | 191,086 | $ | 160,759 | $ | 30,327 | 19 | % | |||||||||||||||
| Total assets | $ | 215,163 | $ | 184,964 | $ | 30,199 | 16 | % | |||||||||||||||
| Deposits | |||||||||||||||||||||||
| Noninterest-bearing | $ | 80,197 | $ | 76,105 | $ | 4,092 | 5 | % | |||||||||||||||
| Interest-bearing | 68,514 | 72,147 | (3,633) | (5) | % | ||||||||||||||||||
| Total deposits | $ | 148,711 | $ | 148,252 | $ | 459 | — | ||||||||||||||||
| Performance Ratios | |||||||||||||||||||||||
| Return on average assets | 1.79 | % | 2.16 | % | |||||||||||||||||||
| Noninterest income to total revenue | 41 | % | 45 | % | |||||||||||||||||||
| Efficiency | 41 | % | 41 | % | |||||||||||||||||||
| Other Information | |||||||||||||||||||||||
| Consolidated revenue from: (a) | |||||||||||||||||||||||
| Treasury Management (b) | $ | 1,958 | $ | 1,609 | $ | 349 | 22 | % | |||||||||||||||
| Commercial mortgage banking activities: | |||||||||||||||||||||||
| Commercial mortgage loans held for sale (c) | $ | 62 | $ | 103 | $ | (41) | (40) | % | |||||||||||||||
| Commercial mortgage loan servicing income (d) | 204 | 244 | (40) | (16) | % | ||||||||||||||||||
| Commercial mortgage servicing rights valuation, net of economic hedge | 99 | 64 | 35 | 55 | % | ||||||||||||||||||
| Total | $ | 365 | $ | 411 | $ | (46) | (11) | % | |||||||||||||||
| MSR asset value (e) | $ | 1,132 | $ | 703 | $ | 429 | 61 | % | |||||||||||||||
| Average loans by C&IB business | |||||||||||||||||||||||
| Corporate Banking | $ | 101,826 | $ | 78,975 | $ | 22,851 | 29 | % | |||||||||||||||
| Real Estate | 44,427 | 42,313 | 2,114 | 5 | % | ||||||||||||||||||
| Business Credit | 27,913 | 23,367 | 4,546 | 19 | % | ||||||||||||||||||
| Commercial Banking | 9,500 | 12,435 | (2,935) | (24) | % | ||||||||||||||||||
| Other | 7,420 | 3,669 | 3,751 | 102 | % | ||||||||||||||||||
| Total average loans | $ | 191,086 | $ | 160,759 | $ | 30,327 | 19 | % | |||||||||||||||
| Credit-related statistics | |||||||||||||||||||||||
| Nonperforming assets (e) | $ | 779 | $ | 1,061 | $ | (282) | (27) | % | |||||||||||||||
| Net charge-offs - loans and leases | $ | 43 | $ | 290 | $ | (247) | (85) | % | |||||||||||||||
*- Not Meaningful
(a)
See the additional revenue discussion regarding treasury management and commercial mortgage banking activities in the Product Revenue section of this Corporate & Institutional Banking section.
(b)
Amounts are reported in net interest income and noninterest income.
(c)
Represents commercial mortgage banking income for valuations on commercial mortgage loans held for sale and related commitments, derivative valuations, origination fees, gains on sale of loans held for sale and net interest income on loans held for sale.
The PNC Financial Services Group, Inc. –
Form 10-Q
17
(d)
Represents net interest income and noninterest income from loan servicing, net of reduction in commercial mortgage servicing rights due to amortization expense and payoffs. Commercial mortgage servicing rights valuation, net of economic hedge is shown separately.
(e)
As of September 30.
Corporate & Institutional Banking earnings in the first nine months of 2022 decreased $102 million compared to the same period in 2021 driven by a higher provision for credit losses, higher noninterest expense and lower noninterest income, substantially offset by higher net interest income.
Net interest income increased in the comparison primarily due to higher average loan balances, reflecting the addition of BBVA and organic growth, as well as wider interest rate spreads on the value of deposits, partially offset by narrower interest rate spreads on the value of loans.
Noninterest income decreased in the comparison driven by lower capital markets related fees and commercial mortgage banking activities, partially offset by higher treasury management product revenue.
Noninterest expense increased in the comparison largely due to the addition of BBVA operating expenses and continued investments in strategic initiatives.
Average loans increased compared to the nine months ended September 30, 2021 due to increases in Corporate Banking, Business Credit and Real Estate, partially offset by a decrease in Commercial Banking:
•
Corporate Banking provides lending, equipment finance, treasury management and capital markets related products and services to mid-sized and large corporations, and government and not-for-profit entities. Average loans for this business increased, driven by strong new production and higher average utilization of loan commitments as well as the addition of loans from BBVA.
•
Business Credit provides asset-based lending and equipment financing solutions. The loan and lease portfolio is relatively high yielding, with acceptable risk as the loans are mainly secured by business assets. Average loans for this business increased, primarily driven by higher utilization of loan commitments and new production.
•
Real Estate provides banking, financing and servicing solutions for commercial real estate clients across the country. Average loans for this business increased reflecting loans from BBVA and new production, partially offset by lower average utilization of loan commitments.
•
Commercial Banking provides lending, treasury management and capital markets related products and services to smaller corporations and businesses. Average loans for this business declined primarily driven by PPP loan forgiveness, partially offset by loans from BBVA.
The deposit strategy of Corporate & Institutional Banking is to remain disciplined on pricing and focused on growing and retaining relationship-based balances over time, executing on customer and segment-specific deposit growth strategies and continuing to provide funding and liquidity to PNC. Average total deposits increased slightly compared to the nine months ended September 30, 2021. We continue to actively monitor the interest rate environment and make adjustments to evolving market conditions, bank funding needs and client relationship dynamics.
In 2021, the BBVA acquisition accelerated Corporate & Institutional Banking’s geographic expansion. Following the BBVA acquisition and our de novo expansion efforts, we are now a coast-to-coast franchise and have a presence in the 30 largest U.S. metropolitan statistical areas. These expanded locations complement Corporate & Institutional Banking’s existing national businesses with a significant presence in these cities and our full suite of commercial products and services is now offered nationally.
Product Revenue
In addition to credit and deposit products for commercial customers, Corporate & Institutional Banking offers other services, including treasury management, capital markets related products and services and commercial mortgage banking activities, for customers of all business segments. On a consolidated basis, the revenue from these other services is included in net interest income and noninterest income, as appropriate. From a business perspective, the majority of the revenue and expense related to these services is reflected in the Corporate & Institutional Banking segment results and the remainder is reflected in the results of other businesses where the customer relationship exists. The Other Information section in Table 12 includes the consolidated revenue to PNC for treasury management and commercial mortgage banking services. A discussion of the consolidated revenue from these services follows.
The Treasury Management business provides corporations with cash and investment management services, receivables and disbursement management services, funds transfer services, international payment services and access to online/mobile information management and reporting services. Within Treasury Management, PNC Global Transfers provides wholesale money transfer processing capabilities between the U.S. and Mexico and other countries primarily in Central and South America. Treasury management revenue is reported in noninterest income and net interest income. Noninterest income includes treasury management product revenue less earnings credits provided to customers on compensating deposit balances used to pay for products and services. Net interest income includes revenue from all treasury management customer deposit balances. Compared to the first nine months of 2021, treasury management revenue increased due to wider interest rate spreads on the value of deposits and higher noninterest income, including the impact of the BBVA acquisition.
18
The PNC Financial Services Group, Inc. –
Form 10-Q
Commercial mortgage banking activities include revenue derived from commercial mortgage servicing (both net interest income and noninterest income), revenue derived from commercial mortgage loans held for sale and hedges related to those activities. Total revenue from commercial mortgage banking activities decreased in the comparison primarily due to lower revenue from commercial mortgage loans held for sale and lower commercial mortgage servicing income, partially offset by a higher benefit from commercial mortgage servicing rights valuation, net of economic hedge.
Capital markets related products and services include foreign exchange, derivatives, fixed income, securities underwriting, loan syndications, mergers and acquisitions advisory and equity capital markets advisory related services. The noninterest income generated from these revenue streams is reflected in the capital markets related category on the Consolidated Income Statement. Compared to the first nine months of 2021, capital markets related noninterest income decreased due to lower equity capital markets advisory fees, lower underwriting fees and lower merger and acquisition fees. These decreases were partially offset by higher fees on customer-related derivatives activities and higher loan syndication fees.
The PNC Financial Services Group, Inc. –
Form 10-Q
19
Asset Management Group
The Asset Management Group strives to be the leading relationship-based provider of investment, planning, credit and cash management solutions and fiduciary services to affluent individuals and institutions by endeavoring to proactively deliver value-added ideas, solutions and exceptional service. Asset Management Group’s priorities are to serve our clients' financial objectives, grow and deepen customer relationships and deliver solid financial performance with prudent risk and expense management.
Table 13: Asset Management Group Table
| (Unaudited) | |||||||||||||||||||||||
| Nine months ended September 30 | Change | ||||||||||||||||||||||
| Dollars in millions, except as noted | 2022 | 2021 | $ | % | |||||||||||||||||||
| Income Statement | |||||||||||||||||||||||
| Net interest income | $ | 456 | $ | 346 | $ | 110 | 32 | % | |||||||||||||||
| Noninterest income | 713 | 729 | (16) | (2) | % | ||||||||||||||||||
| Total revenue | 1,169 | 1,075 | 94 | 9 | % | ||||||||||||||||||
| Provision for credit losses | 11 | 8 | 3 | 38 | % | ||||||||||||||||||
| Noninterest expense | 795 | 676 | 119 | 18 | % | ||||||||||||||||||
| Pretax earnings | 363 | 391 | (28) | (7) | % | ||||||||||||||||||
| Income taxes | 85 | 91 | (6) | (7) | % | ||||||||||||||||||
| Earnings | $ | 278 | $ | 300 | $ | (22) | (7) | % | |||||||||||||||
| Average Balance Sheet | |||||||||||||||||||||||
| Loans | |||||||||||||||||||||||
| Consumer | |||||||||||||||||||||||
| Residential real estate | $ | 7,756 | $ | 4,608 | $ | 3,148 | 68 | % | |||||||||||||||
| Other consumer | 4,605 | 4,249 | 356 | 8 | % | ||||||||||||||||||
| Total consumer | 12,361 | 8,857 | 3,504 | 40 | % | ||||||||||||||||||
| Commercial | 1,577 | 1,629 | (52) | (3) | % | ||||||||||||||||||
| Total loans | $ | 13,938 | $ | 10,486 | $ | 3,452 | 33 | % | |||||||||||||||
| Total assets | $ | 14,360 | $ | 11,124 | $ | 3,236 | 29 | % | |||||||||||||||
| Deposits | |||||||||||||||||||||||
| Noninterest-bearing | $ | 2,852 | $ | 2,884 | $ | (32) | (1) | % | |||||||||||||||
| Interest-bearing | 28,564 | 21,590 | 6,974 | 32 | % | ||||||||||||||||||
| Total deposits | $ | 31,416 | $ | 24,474 | $ | 6,942 | 28 | % | |||||||||||||||
| Performance Ratios | |||||||||||||||||||||||
| Return on average assets | 2.59 | % | 3.61 | % | |||||||||||||||||||
| Noninterest income to total revenue | 61 | % | 68 | % | |||||||||||||||||||
| Efficiency | 68 | % | 63 | % | |||||||||||||||||||
| Supplemental Noninterest Income Information | |||||||||||||||||||||||
| Asset management fees | $ | 693 | $ | 713 | $ | (20) | (3) | % | |||||||||||||||
| Brokerage fees | 6 | 6 | — | ||||||||||||||||||||
| Total | $ | 699 | $ | 719 | $ | (20) | (3) | % | |||||||||||||||
| Other Information | |||||||||||||||||||||||
| Nonperforming assets (a) | $ | 95 | $ | 80 | $ | 15 | 19 | % | |||||||||||||||
| Net charge-offs (recoveries) - loans and leases | $ | (1) | $ | 1 | $ | (2) | (200) | % | |||||||||||||||
| Brokerage account client assets (in billions) (a) | $ | 4 | $ | 5 | $ | (1) | (20) | % | |||||||||||||||
|
Client Assets Under Administration
(in billions) (a) (b)
|
|||||||||||||||||||||||
| Discretionary client assets under management | $ | 166 | $ | 183 | $ | (17) | (9) | % | |||||||||||||||
| Nondiscretionary client assets under administration | 148 | 170 | (22) | (13) | % | ||||||||||||||||||
| Total | $ | 314 | $ | 353 | $ | (39) | (11) | % | |||||||||||||||
| Discretionary client assets under management | |||||||||||||||||||||||
| PNC Private Bank | $ | 99 | $ | 117 | $ | (18) | (15) | % | |||||||||||||||
| Institutional Asset Management | 67 | 66 | 1 | 2 | % | ||||||||||||||||||
| Total | $ | 166 | $ | 183 | $ | (17) | (9) | % | |||||||||||||||
(a)
As of September 30.
(b)
Excludes brokerage account client assets.
The Asset Management Group consists of two primary businesses: PNC Private Bank and Institutional Asset Management.
The PNC Private Bank is focused on being a premier private bank in each of the markets it serves. The business seeks to deliver high quality banking, trust, and investment management services to our emerging affluent, high net worth and ultra-high net worth clients through a broad array of products and services.
20
The PNC Financial Services Group, Inc. –
Form 10-Q
Institutional Asset Management provides outsourced chief investment officer, custody, private real estate, cash and fixed income client solutions, and retirement plan fiduciary investment services to institutional clients including corporations, healthcare systems, insurance companies, unions, municipalities and non-profits.
With the inclusion of BBVA, PNC Private Bank has approximately 100 offices operating in nine of the ten most affluent states in the U.S. with a majority co-located within retail banking branches.
Asset Management Group earnings in the first nine months of 2022 decreased $22 million compared to the same period in 2021 driven by higher noninterest expense and lower noninterest income, partially offset by higher net interest income.
Net interest income increased in the comparison due to growth in average deposit and loan balances, reflecting the BBVA acquisition and organic growth, as well as wider interest rate spreads on the value of deposits.
Noninterest income decreased in the comparison primarily attributable to the asset management fee impact from net client outflows.
Noninterest expense increased in the comparison due to the impact of BBVA operations and strategic investments to support business growth.
Discretionary client assets under management decreased in comparison to the prior year, primarily due to lower equity markets as of September 30, 2022.
R
ISK
M
ANAGEMENT
The Risk Management section included in Item 7 of our 2021 Form 10-K describes our enterprise risk management framework including risk culture, enterprise strategy, risk governance and oversight framework, risk identification, risk assessments, risk controls and monitoring, and risk aggregation and reporting. Additionally, our 2021 Form 10-K provides an analysis of the firm's Capital Management and our key areas of risk, which include but are not limited to Credit, Market, Liquidity and Operational (including Compliance and Information Security).
Credit Risk Management
Credit risk, including our credit risk management processes, is described in further detail in the Credit Risk Management section of our 2021 Form 10-K. The following provides additional information around our loan portfolio, which is our most significant concentration of credit risk.
Loan Portfolio Characteristics and Analysis
Table 14: Details of Loans
In billions
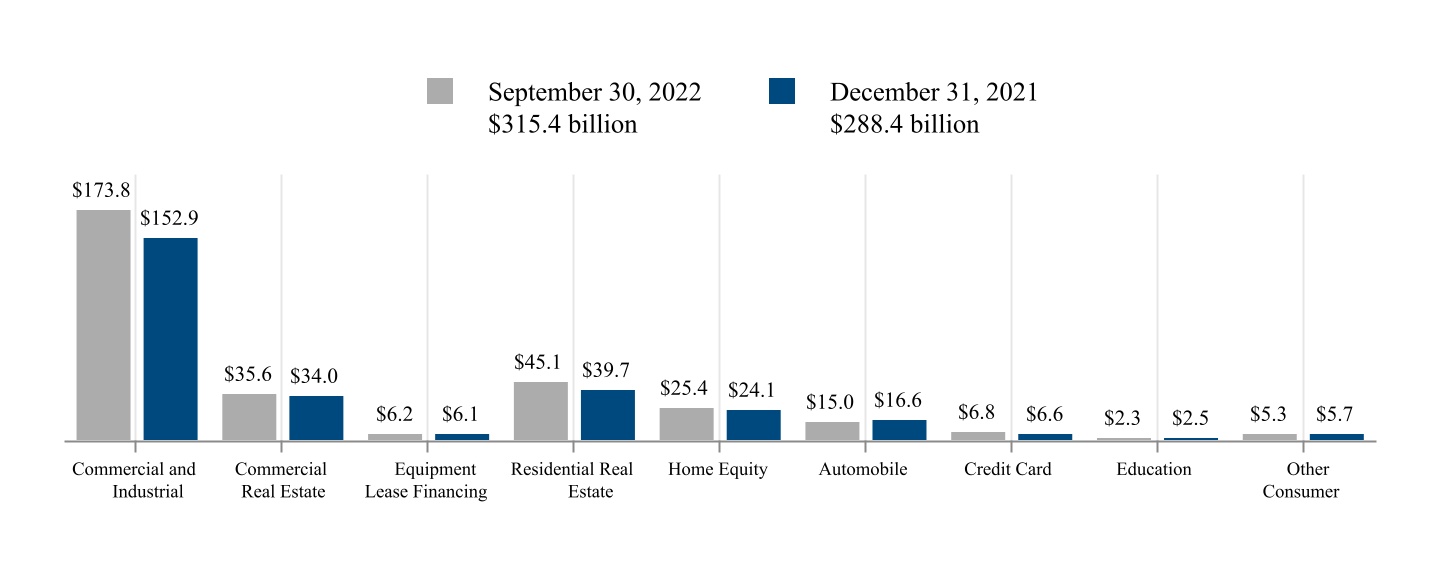
We use several credit quality indicators, as further detailed in Note 4 Loans and Related Allowance for Credit Losses in the Notes To Consolidated Financial Statements included in Item 1 of this Report, to monitor and measure our exposure to credit risk within our loan portfolio. The following provides additional information about the significant loan classes that comprise our Commercial and Consumer portfolio segments.
The PNC Financial Services Group, Inc. –
Form 10-Q
21
Commercial
Commercial and Industrial
Commercial and industrial loans comprised 55% and 53% of our total loan portfolio at September 30, 2022 and December 31, 2021, respectively. The majority of our commercial and industrial loans are secured by collateral that provides a secondary source of repayment for the loan should the borrower experience cash generation difficulties. Examples of this collateral include short-term assets, such as accounts receivable, inventory and securities; and long-lived assets, such as equipment, owner-occupied real estate and other business assets.
We actively manage our commercial and industrial loans to assess any changes (both positive and negative) in the level of credit risk at both the borrower and portfolio level. To evaluate the level of credit risk, we assign internal risk ratings reflecting our estimates of the borrower’s PD and LGD for each related credit facility. This two-dimensional credit risk rating methodology provides granularity in the risk monitoring process and is updated on an ongoing basis through our credit risk management processes. In addition to monitoring the level of credit risk, we also monitor concentrations of credit risk pertaining to both specific industries and geographies that may exist in our portfolio. Our commercial and industrial portfolio is well-diversified as shown in the following table which provides a breakout by industry classification (classified based on the North American Industry Classification System).
Table 15: Commercial and Industrial Loans by Industry
| September 30, 2022 | December 31, 2021 | ||||||||||||||||||||||||||||
| Dollars in millions | Amount | % of Total | Amount | % of Total | |||||||||||||||||||||||||
| Commercial and industrial | |||||||||||||||||||||||||||||
| Manufacturing | $ | 28,629 | 16 | % | $ | 22,597 | 15 | % | |||||||||||||||||||||
| Retail/wholesale trade | 27,532 | 16 | 22,803 | 15 | |||||||||||||||||||||||||
| Service providers | 22,043 | 13 | 20,750 | 14 | |||||||||||||||||||||||||
| Financial services | 21,590 | 12 | 17,950 | 12 | |||||||||||||||||||||||||
| Real estate related (a) | 17,513 | 10 | 15,123 | 10 | |||||||||||||||||||||||||
| Technology, media & telecommunications | 11,366 | 7 | 10,070 | 7 | |||||||||||||||||||||||||
| Health care | 10,420 | 6 | 9,944 | 7 | |||||||||||||||||||||||||
| Transportation and warehousing | 7,977 | 5 | 7,136 | 5 | |||||||||||||||||||||||||
| Other industries | 26,743 | 15 | 26,560 | 15 | |||||||||||||||||||||||||
| Total commercial and industrial loans | $ | 173,813 | 100 | % | $ | 152,933 | 100 | % | |||||||||||||||||||||
(a) Represents loans to customers in the real estate and construction industries.
Commercial and industrial loan growth from December 31, 2021 was driven by new production and higher utilization of loan commitments, partially offset by PPP loan forgiveness. PPP loans outstanding totaled $0.6 billion and $3.4 billion at September 30, 2022 and December 31, 2021, respectively.
Commercial Real Estate
Commercial real estate loans comprised $21.6 billion related to commercial mortgages on income-producing properties, $6.2 billion of real estate construction project loans and $7.8 billion of intermediate-term financing loans as of September 30, 2022. Comparable amounts as of December 31, 2021 were $18.6 billion, $7.3 billion and $8.1 billion, respectively.
We monitor credit risk associated with our commercial real estate loans similar to commercial and industrial loans by analyzing PD and LGD. Additionally, risks associated with these types of credit activities tend to be correlated to the loan structure, collateral location and quality, project progress and business environment. These attributes are also monitored and utilized in assessing credit risk. The portfolio is geographically diverse due to the nature of our business involving clients throughout the U.S.
22
The PNC Financial Services Group, Inc. –
Form 10-Q
The following table presents our commercial real estate loans by geography and property type:
Table 16: Commercial Real Estate Loans by Geography and Property Type
| September 30, 2022 | December 31, 2021 | ||||||||||||||||||||||||||||
| Dollars in millions | Amount | % of Total | Amount | % of Total | |||||||||||||||||||||||||
| Geography (a) | |||||||||||||||||||||||||||||
| California | $ | 5,908 | 17 | % | $ | 5,561 | 16 | % | |||||||||||||||||||||
| Texas | 3,761 | 11 | 3,458 | 10 | |||||||||||||||||||||||||
| Florida | 3,085 | 9 | 2,987 | 9 | |||||||||||||||||||||||||
| Virginia | 1,733 | 5 | 1,720 | 5 | |||||||||||||||||||||||||
| Pennsylvania | 1,594 | 4 | 1,482 | 4 | |||||||||||||||||||||||||
| Maryland | 1,527 | 4 | 1,557 | 5 | |||||||||||||||||||||||||
| Illinois | 1,413 | 4 | 970 | 3 | |||||||||||||||||||||||||
| Colorado | 1,239 | 3 | 1,126 | 3 | |||||||||||||||||||||||||
| Ohio | 1,212 | 3 | 1,219 | 4 | |||||||||||||||||||||||||
| Arizona | 1,114 | 3 | 855 | 3 | |||||||||||||||||||||||||
| Other | 13,006 | 37 | 13,080 | 38 | |||||||||||||||||||||||||
| Total commercial real estate loans | $ | 35,592 | 100 | % | $ | 34,015 | 100 | % | |||||||||||||||||||||
| Property Type (a) | |||||||||||||||||||||||||||||
| Multifamily | $ | 13,272 | 37 | % | $ | 10,581 | 31 | % | |||||||||||||||||||||
| Office | 9,268 | 26 | 9,547 | 28 | |||||||||||||||||||||||||
| Industrial/warehouse | 3,509 | 10 | 2,413 | 7 | |||||||||||||||||||||||||
| Retail | 2,857 | 8 | 3,570 | 10 | |||||||||||||||||||||||||
| Seniors housing | 2,289 | 6 | 2,602 | 8 | |||||||||||||||||||||||||
| Hotel/motel | 1,950 | 5 | 2,008 | 6 | |||||||||||||||||||||||||
| Mixed use | 704 | 2 | 724 | 2 | |||||||||||||||||||||||||
| Other | 1,743 | 6 | 2,570 | 8 | |||||||||||||||||||||||||
| Total commercial real estate loans | $ | 35,592 | 100 | % | $ | 34,015 | 100 | % | |||||||||||||||||||||
(a) Presented in descending order based on loan balances at September 30, 2022.
As remote work continues to be a feasible alternative and notable portions of leased space remain unoccupied, real estate related to the office sector is an area of continuing uncertainty. Evolving conditions suggest a structural change for office demand moving forward; however, the change is anticipated to develop over time. PNC continues to closely monitor our exposure in the office sector as these concerns develop, and while internal risk and regulatory classification assessments have moved higher, we have not seen a notable change in loan performance at this time.
Consumer
Residential Real Estate
Residential real estate loans primarily consisted of residential mortgage loans at both September 30, 2022 and December 31, 2021.
We obtain loan attributes at origination, including FICO scores and LTVs, and we update these and other credit metrics at least quarterly. We track borrower performance monthly. We also segment the mortgage portfolio into pools based on product type (
e.g.
, nonconforming, conforming). This information is used for internal reporting and risk management. As part of our overall risk analysis and monitoring, we also segment the portfolio based upon loan delinquency, nonperforming status, modification and bankruptcy status, FICO scores, LTV and geographic concentrations. Loan performance is evaluated by source originators and loan servicers.
The PNC Financial Services Group, Inc. –
Form 10-Q
23
The following table presents certain key statistics related to our residential real estate portfolio:
Table 17: Residential Real Estate Loan Statistics
| September 30, 2022 | December 31, 2021 | ||||||||||||||||||||||||||||
| Dollars in millions | Amount | % of Total | Amount | % of Total | |||||||||||||||||||||||||
| Geography (a) | |||||||||||||||||||||||||||||
| California | $ | 18,121 | 40 | % | $ | 15,041 | 38 | % | |||||||||||||||||||||
| Texas | 4,224 | 9 | 4,397 | 11 | |||||||||||||||||||||||||
| Florida | 3,337 | 7 | 3,124 | 8 | |||||||||||||||||||||||||
| Washington | 2,842 | 6 | 1,909 | 5 | |||||||||||||||||||||||||
| New Jersey | 1,893 | 4 | 1,660 | 4 | |||||||||||||||||||||||||
| New York | 1,514 | 3 | 1,279 | 3 | |||||||||||||||||||||||||
| Arizona | 1,431 | 3 | 1,435 | 4 | |||||||||||||||||||||||||
| Colorado | 1,174 | 3 | 1,145 | 3 | |||||||||||||||||||||||||
| Pennsylvania | 1,173 | 3 | 1,069 | 3 | |||||||||||||||||||||||||
| Illinois | 959 | 2 | 957 | 2 | |||||||||||||||||||||||||
| Other | 8,389 | 20 | 7,696 | 19 | |||||||||||||||||||||||||
|
Total residential real estate loans
|
$ | 45,057 | 100 | % | $ | 39,712 | 100 | % | |||||||||||||||||||||
| September 30, 2022 | December 31, 2021 | ||||||||||||||||||||||||||||
| Weighted-average loan origination statistics (b) | |||||||||||||||||||||||||||||
| Loan origination FICO score | 771 | 775 | |||||||||||||||||||||||||||
| LTV of loan originations | 69 | % | 67 | % | |||||||||||||||||||||||||
(a)
Presented in descending order based on loan balances at September 30, 2022.
(b)
Weighted-averages calculated for the twelve months ended September 30, 2022 and December 31, 2021, respectively.
We originate residential mortgage loans nationwide through our national mortgage business as well as within our branch network. Residential mortgage loans underwritten to agency standards, including conforming loan amount limits, are typically sold with servicing retained by us. We also originate nonconforming residential mortgage loans that do not meet agency standards, which we retain on our balance sheet. Our portfolio of originated nonconforming residential mortgage loans totaled $39.8 billion at September 30, 2022 with 44% located in California. Comparable amounts at December 31, 2021 were $34.9 billion and 42%, respectively.
Home Equity
Home equity loans comprised $18.6 billion of primarily variable-rate home equity lines of credit and $6.8 billion of closed-end home equity installment loans at September 30, 2022. Comparable amounts were $15.8 billion and $8.3 billion as of December 31, 2021, respectively.
We track borrower performance of this portfolio monthly similarly to residential real estate loans. We also segment the population into pools based on product type (
e.g.
, home equity loans, brokered home equity loans, home equity lines of credit, brokered home equity lines of credit) and track the historical performance of any related mortgage loans regardless of whether we hold the lien. This information is used for internal reporting and risk management. As part of our overall risk analysis and monitoring, we also segment the portfolio based upon the loan delinquency, nonperforming status, modification and bankruptcy status, FICO scores, LTV, lien position and geographic concentration.
The credit performance of the majority of the home equity portfolio where we hold the first lien position is superior to the portion of the portfolio where we hold the second lien position, but do not hold the first lien. Lien position information is generally determined at the time of origination and monitored on an ongoing basis for risk management purposes. We use a third-party service provider to obtain updated loan information, including lien and collateral data that is aggregated from public and private sources.
24
The PNC Financial Services Group, Inc. –
Form 10-Q
The following table presents certain key statistics related to our home equity portfolio:
Table 18: Home Equity Loan Statistics
| September 30, 2022 | December 31, 2021 | ||||||||||||||||||||||||||||
| Dollars in millions | Amount | % of Total | Amount | % of Total | |||||||||||||||||||||||||
| Geography (a) | |||||||||||||||||||||||||||||
| Pennsylvania | $ | 5,093 | 20 | % | $ | 5,108 | 21 | % | |||||||||||||||||||||
| New Jersey | 3,230 | 13 | 3,117 | 13 | |||||||||||||||||||||||||
| Ohio | 2,370 | 9 | 2,398 | 10 | |||||||||||||||||||||||||
| Florida | 1,972 | 8 | 1,701 | 7 | |||||||||||||||||||||||||
| Michigan | 1,263 | 5 | 1,246 | 5 | |||||||||||||||||||||||||
| Maryland | 1,239 | 5 | 1,206 | 5 | |||||||||||||||||||||||||
| Illinois | 1,130 | 4 | 1,154 | 5 | |||||||||||||||||||||||||
| Texas | 1,061 | 4 | 978 | 4 | |||||||||||||||||||||||||
| California | 1,054 | 4 | 705 | 3 | |||||||||||||||||||||||||
| North Carolina | 965 | 4 | 918 | 4 | |||||||||||||||||||||||||
| Other | 5,990 | 24 | 5,530 | 23 | |||||||||||||||||||||||||
| Total home equity loans | $ | 25,367 | 100 | % | $ | 24,061 | 100 | % | |||||||||||||||||||||
| Lien type | |||||||||||||||||||||||||||||
| 1st lien | 60 | % | 62 | % | |||||||||||||||||||||||||
| 2nd lien | 40 | 38 | |||||||||||||||||||||||||||
| Total | 100 | % | 100 | % | |||||||||||||||||||||||||
| Weighted-average loan origination statistics (b) | September 30, 2022 | December 31, 2021 | |||||||||||||||||||||||||||
| Loan origination FICO score | 775 | 782 | |||||||||||||||||||||||||||
| LTV of loan originations | 67 | % | 66 | % | |||||||||||||||||||||||||
(a)
Presented in descending order based on loan balances at September 30, 2022.
(b)
Weighted-averages calculated for the twelve months ended September 30, 2022 and December 31, 2021, respectively.
Automobile
Auto loans comprised $13.9 billion in the indirect auto portfolio and $1.1 billion in the direct auto portfolio as of September 30, 2022. Comparable amounts as of December 31, 2021 were $15.4 billion and $1.2 billion, respectively. The indirect auto portfolio consists of loans originated primarily through franchised dealers, including from expansion into new markets. This business is strategically aligned with our core retail banking business.
The following table presents certain key statistics related to our indirect and direct auto portfolios:
Table 19: Auto Loan Statistics (a)
| September 30, 2022 | December 31, 2021 | |||||||
| Weighted-average loan origination FICO score (b) | ||||||||
| Indirect auto | 787 | 791 | ||||||
| Direct auto | 777 | 775 | ||||||
| Weighted-average term of loan originations - in months | ||||||||
| Indirect auto | 73 | 72 | ||||||
| Direct auto | 63 | 62 | ||||||
(a)
Weighted-averages calculated for the twelve months ended September 30, 2022 and December 31, 2021, respectively.
(b)
Calculated using the auto enhanced FICO scale.
We continue to focus on borrowers with strong credit profiles as evidenced by the weighted-average loan origination FICO scores noted in Table 19. We offer both new and used auto financing to customers through our various channels. At September 30, 2022, the portfolio balance was composed of 51% new vehicle loans and 49% used vehicle loans. Comparable amounts at December 31, 2021 were 53% and 47%, respectively.
The auto loan portfolio’s performance is measured monthly, including updated collateral values that are obtained monthly and updated FICO scores that are obtained at least quarterly. For internal reporting and risk management, we analyze the portfolio by product channel and product type and regularly evaluate default and delinquency experience. As part of our overall risk analysis and monitoring, we segment the portfolio by geography, channel, collateral attributes and credit metrics which include FICO score, LTV and term.
The PNC Financial Services Group, Inc. –
Form 10-Q
25
Nonperforming Assets and Loan Delinquencies
Nonperforming Assets
Nonperforming assets include nonperforming loans and leases for which ultimate collectability of the full amount of contractual principal and interest is not probable and include nonperforming TDRs and PCD loans, OREO and foreclosed assets. Loans held for sale, certain government insured or guaranteed loans and loans accounted for under the fair value option are excluded from nonperforming loans. See Note 1 Accounting Policies in the Notes To Consolidated Financial Statements included in Item 8 of our 2021 Form 10-K for details on our nonaccrual policies.
The following table presents a summary of nonperforming assets by major category:
Table 20: Nonperforming Assets by Type
| September 30, 2022 | December 31, 2021 | Change | ||||||||||||||||||
| Dollars in millions | $ | % | ||||||||||||||||||
| Nonperforming loans | ||||||||||||||||||||
| Commercial | $ | 903 | $ | 1,168 | $ | (265) | (23) | % | ||||||||||||
| Consumer (a) | 1,165 | 1,312 | (147) | (11) | % | |||||||||||||||
| Total nonperforming loans | 2,068 | 2,480 | (412) | (17) | % | |||||||||||||||
| OREO and foreclosed assets | 33 | 26 | 7 | 27 | % | |||||||||||||||
| Total nonperforming assets | $ | 2,101 | $ | 2,506 | $ | (405) | (16) | % | ||||||||||||
| TDRs included in nonperforming loans | $ | 676 | $ | 988 | $ | (312) | (32) | % | ||||||||||||
| Percentage of total nonperforming loans | 33 | % | 40 | % | ||||||||||||||||
| Nonperforming loans to total loans | 0.66 | % | 0.86 | % | ||||||||||||||||
| Nonperforming assets to total loans, OREO and foreclosed assets | 0.67 | % | 0.87 | % | ||||||||||||||||
| Nonperforming assets to total assets | 0.38 | % | 0.45 | % | ||||||||||||||||
| Allowance for loan and lease losses to nonperforming loans | 222 | % | 196 | % | ||||||||||||||||
| Allowance for credit losses to nonperforming loans (b) | 254 | % | 223 | % | ||||||||||||||||
(a)
Excludes most unsecured consumer loans and lines of credit, which are charged off after 120 to 180 days past due and are not placed on nonperforming status.
(b)
Calculated excluding allowances for investment securities and other financial assets.
The following table provides details on the change in nonperforming assets for the nine months ended September 30, 2022 and 2021:
Table 21: Change in Nonperforming Assets
| In millions | 2022 | 2021 | |||||||||||||||
| January 1 | $ | 2,506 | $ | 2,337 | |||||||||||||
| Acquired nonperforming assets (a) | 880 | ||||||||||||||||
| New nonperforming assets | 1,177 | 821 | |||||||||||||||
| Charge-offs and valuation adjustments | (196) | (202) | |||||||||||||||
| Principal activity, including paydowns and payoffs | (729) | (783) | |||||||||||||||
| Asset sales and transfers to loans held for sale | (30) | (131) | |||||||||||||||
| Returned to performing status | (627) | (363) | |||||||||||||||
| September 30 | $ | 2,101 | $ | 2,559 | |||||||||||||
(a)
Represents the June 30, 2021 balance of nonperforming assets attributable to BBVA.
As of September 30, 2022, approximately 98% of total nonperforming loans were secured by collateral which lessened reserve requirements and is expected to reduce credit losses.
Within consumer nonperforming loans, residential real estate TDRs comprised 50% of total residential real estate nonperforming loans while home equity TDRs comprised 32% of home equity nonperforming loans at September 30, 2022. Comparable amounts at December 31, 2021 were 42% and 36%, respectively. TDRs generally remain in nonperforming status until a borrower has made at least six consecutive months of both principal and interest payments under the modified terms or ultimate resolution occurs. Loans where borrowers have been discharged from personal liability through Chapter 7 bankruptcy and have not formally reaffirmed their loan obligations to us and loans to borrowers not currently obligated to make both principal and interest payments under the restructured terms are not returned to accrual status. See Troubled Debt Restructurings and Loan Modifications within this Credit Risk
26
The PNC Financial Services Group, Inc. –
Form 10-Q
Management section for more information on how certain loans to borrowers experiencing COVID-19 related difficulties were treated prior to the expiration of CARES Act TDR relief.
Loan Delinquencies
We regularly monitor the level of loan delinquencies and believe these levels may be a key indicator of credit quality in our loan portfolio. Measurement of delinquency status is based on the contractual terms of each loan. Loans that are 30 days or more past due in terms of payment are considered delinquent. Loan delinquencies include government insured or guaranteed loans, loans accounted for under the fair value option and PCD loans. Amounts exclude loans held for sale.
We manage credit risk based on the risk profile of the borrower, repayment sources, underlying collateral, and other support given current events, economic conditions and expectations. We refine our practices to meet the changing environment resulting from rising inflation levels, supply chain disruptions, higher rates, and secular changes fostered by the COVID-19 pandemic. To mitigate losses and enhance customer support, we have customer assistance, loan modification and collection programs that align with the CARES Act and subsequent interagency guidance. As a result, under the CARES Act credit reporting rules, certain loans modified due to COVID-19 related hardships are not being reported as past due as of September 30, 2022 and December 31, 2021 based on the contractual terms of the loan, even where borrowers may not be making payments on their loans during the modification period.
The following table presents a summary of accruing loans past due by delinquency status:
Table 22: Accruing Loans Past Due (a)
| Amount |
|
% of Total Loans Outstanding | |||||||||||||||||||||||||||||||||||||||
|
September 30
2022 |
December 31
2021 |
Change |
September 30
2022 |
December 31
2021 |
|||||||||||||||||||||||||||||||||||||
| Dollars in millions | $ | % | |||||||||||||||||||||||||||||||||||||||
| Early stage loan delinquencies | |||||||||||||||||||||||||||||||||||||||||
| Accruing loans past due 30 to 59 days | $ | 879 | $ | 1,011 | $ | (132) | (13) | % | 0.28 | % | 0.35 | % | |||||||||||||||||||||||||||||
| Accruing loans past due 60 to 89 days | 268 | 355 | (87) | (25) | % | 0.08 | % | 0.12 | % | ||||||||||||||||||||||||||||||||
| Total early stage loan delinquencies | 1,147 | 1,366 | (219) | (16) | % | 0.36 | % | 0.47 | % | ||||||||||||||||||||||||||||||||
| Late stage loan delinquencies | |||||||||||||||||||||||||||||||||||||||||
| Accruing loans past due 90 days or more | 479 | 619 | (140) | (23) | % | 0.15 | % | 0.21 | % | ||||||||||||||||||||||||||||||||
| Total accruing loans past due | $ | 1,626 | $ | 1,985 | $ | (359) | (18) | % | 0.52 | % | 0.69 | % | |||||||||||||||||||||||||||||
(a)
Past due loan amounts include government insured or guaranteed loans of $0.4 billion and $0.5 billion at September 30, 2022 and December 31, 2021, respectively.
The decline in accruing loans past due from December 31, 2021 was driven by lower consumer delinquencies, which included the resolution of BBVA USA conversion-related administrative and operational delays.
Accruing loans past due 90 days or more continue to accrue interest because they are (i) well secured by collateral and are in the process of collection, (ii) managed in homogeneous portfolios with specified charge-off timeframes adhering to regulatory guidelines, or (iii) certain government insured or guaranteed loans. As such, they are excluded from nonperforming loans.
Troubled Debt Restructurings and Loan Modifications
Troubled Debt Restructurings
A TDR is a loan whose terms have been restructured in a manner that grants a concession to a borrower experiencing financial difficulties. TDRs result from our loss mitigation activities and include rate reductions, principal forgiveness, postponement/reduction of scheduled amortization and extensions, which are intended to minimize economic loss and to avoid foreclosure or repossession of collateral. Additionally, TDRs also result from court-imposed concessions (
e.g.
, a Chapter 7 bankruptcy where the debtor is discharged from personal liability to us and a court approved Chapter 13 bankruptcy repayment plan). Loans to borrowers experiencing COVID-19 related hardships that met certain criteria under the CARES Act were not categorized as TDRs during the relief period, which expired on January 1, 2022. Consistent with the expiration of the CARES Act TDR relief (and as amended by the Consolidated Appropriations Act), loans that experience a COVID-19 related hardship and are restructured after January 1, 2022 are subject to existing GAAP guidance related to TDRs.
The PNC Financial Services Group, Inc. –
Form 10-Q
27
The following table provides a summary of troubled debt restructurings at September 30, 2022 and December 31, 2021, respectively:
Table 23: Summary of Troubled Debt Restructurings (a)
|
September 30
2022 |
December 31
2021 |
Change | |||||||||||||||||||||||||||
| Dollars in millions | $ | % | |||||||||||||||||||||||||||
| Commercial | $ | 533 | $ | 672 | $ | (139) | (21) | % | |||||||||||||||||||||
| Consumer | 854 | 919 | (65) | (7) | % | ||||||||||||||||||||||||
| Total TDRs | $ | 1,387 | $ | 1,591 | $ | (204) | (13) | % | |||||||||||||||||||||
| Nonperforming | $ | 676 | $ | 988 | $ | (312) | (32) | % | |||||||||||||||||||||
| Accruing (b) | 711 | 603 | 108 | 18 | % | ||||||||||||||||||||||||
| Total TDRs | $ | 1,387 | $ | 1,591 | $ | (204) | (13) | % | |||||||||||||||||||||
(a)
Amounts in table do not include associated valuation allowances.
(b)
Accruing loans include consumer credit card loans and certain loans that have demonstrated a period of at least six months of performance under the restructured terms and are excluded from nonperforming loans.
Nonperforming TDRs represented approximately 33% of total nonperforming loans and 49% of total TDRs at September 30, 2022. Comparable amounts at December 31, 2021 were 40% and 62%, respectively. The remaining portion of TDRs represents TDRs that have been returned to accrual status after performing under the restructured terms for at least six consecutive months.
See Note 4 Loans and Related Allowance for Credit Losses in the Notes To Consolidated Financial Statements included in Item 1 of this Report for additional information on TDRs.
Loan Modifications
PNC provides relief to our customers through a variety of solutions. Commercial loan and lease modifications are based on each individual borrower’s situation and may involve reduction of the interest rate, extension of the loan term and/or forgiveness of principal. Consumer loan modifications are evaluated under our hardship relief programs, including COVID-19 related hardships that extended beyond the initial relief period.
See Troubled Debt Restructurings within this Credit Risk Management section for more information on how certain loans to borrowers experiencing COVID-19 related difficulties were treated prior to the expiration of CARES Act TDR relief.
For additional information related to loan modifications granted in response to the economic impacts of COVID-19, see the Credit Risk Management portion of the Risk Management section of our 2021 Form 10-K.
Allowance for Credit Losses
Our determination of the ACL is based on historical loss and performance experience, current economic conditions, reasonable and supportable forecasts of future conditions and other relevant factors, including current borrower and/or transaction characteristics. We maintain the ACL at an appropriate level for expected losses on our existing investment securities, loans, equipment finance leases, trade receivables and other financial assets and off-balance sheet credit exposures and determine this allowance based on quarterly assessments of the remaining estimated contractual term of the assets or exposures as of the balance sheet date.
See Note 1 Accounting Policies in the Notes To Consolidated Financial Statements included in Item 8 of our 2021 Form 10-K and the Credit Risk Management section within Item 7 of our 2021 Form 10-K for additional discussion of our ACL, including details of our methodologies. See also the Critical Accounting Estimates and Judgments section of this Financial Review for further discussion of the assumptions used in the determination of the ACL as of September 30, 2022.
28
The PNC Financial Services Group, Inc. –
Form 10-Q
The following table summarizes our ACL related to loans:
Table 24: Allowance for Credit Losses by Loan Class (a)
| September 30, 2022 | December 31, 2021 | ||||||||||||||||||||||||||||
|
Dollars in millions |
Allowance Amount | Total Loans | % of Total Loans | Allowance Amount | Total Loans | % of Total Loans | |||||||||||||||||||||||
| Allowance for loans and lease losses | |||||||||||||||||||||||||||||
| Commercial | |||||||||||||||||||||||||||||
| Commercial and industrial | $ | 1,974 | $ | 173,813 | 1.14 | % | $ | 1,879 | $ | 152,933 | 1.23 | % | |||||||||||||||||
| Commercial real estate | 994 | 35,592 | 2.79 | % | 1,216 | 34,015 | 3.57 | % | |||||||||||||||||||||
| Equipment lease financing | 93 | 6,192 | 1.50 | % | 90 | 6,130 | 1.47 | % | |||||||||||||||||||||
| Total commercial | 3,061 | 215,597 | 1.42 | % | 3,185 | 193,078 | 1.65 | % | |||||||||||||||||||||
| Consumer | |||||||||||||||||||||||||||||
| Residential real estate | 50 | 45,057 | 0.11 | % | 21 | 39,712 | 0.05 | % | |||||||||||||||||||||
| Home equity | 215 | 25,367 | 0.85 | % | 149 | 24,061 | 0.62 | % | |||||||||||||||||||||
| Automobile | 214 | 15,025 | 1.42 | % | 372 | 16,635 | 2.24 | % | |||||||||||||||||||||
| Credit card | 732 | 6,774 | 10.81 | % | 712 | 6,626 | 10.75 | % | |||||||||||||||||||||
| Education | 64 | 2,287 | 2.80 | % | 71 | 2,533 | 2.80 | % | |||||||||||||||||||||
| Other consumer | 245 | 5,293 | 4.63 | % | 358 | 5,727 | 6.25 | % | |||||||||||||||||||||
| Total consumer | 1,520 | 99,803 | 1.52 | % | 1,683 | 95,294 | 1.77 | % | |||||||||||||||||||||
| Total | 4,581 | $ | 315,400 | 1.45 | % | 4,868 | $ | 288,372 | 1.69 | % | |||||||||||||||||||
|
Allowance for unfunded lending related commitments
|
682 | 662 | |||||||||||||||||||||||||||
|
Allowance for credit losses
|
$ | 5,263 | $ | 5,530 | |||||||||||||||||||||||||
| Allowance for credit losses to total loans | 1.67 | % | 1.92 | % | |||||||||||||||||||||||||
| Commercial | 1.70 | % | 1.94 | % | |||||||||||||||||||||||||
| Consumer | 1.60 | % | 1.87 | % | |||||||||||||||||||||||||
(a) Excludes allowances for investment securities and other financial assets, which together totaled $162 million and $171 million at September 30, 2022 and December 31, 2021, respectively.
The PNC Financial Services Group, Inc. –
Form 10-Q
29
The following table summarizes our loan charge-offs and recoveries:
Table 25: Loan Charge-Offs and Recoveries
| Nine months ended September 30 |
Gross
Charge-offs |
Recoveries |
Net Charge-offs /
(Recoveries) |
% of Average
Loans (Annualized) |
|||||||||||||||||||||||||
| Dollars in millions | |||||||||||||||||||||||||||||
| 2022 | |||||||||||||||||||||||||||||
| Commercial | |||||||||||||||||||||||||||||
| Commercial and industrial | $ | 136 | $ | 68 | $ | 68 | 0.06 | % | |||||||||||||||||||||
| Commercial real estate | 22 | 3 | 19 | 0.07 | % | ||||||||||||||||||||||||
| Equipment lease financing | 4 | 7 | (3) | (0.07) | % | ||||||||||||||||||||||||
| Total commercial | 162 | 78 | 84 | 0.05 | % | ||||||||||||||||||||||||
| Consumer | |||||||||||||||||||||||||||||
| Residential real estate | 9 | 15 | (6) | (0.02) | % | ||||||||||||||||||||||||
| Home equity | 9 | 58 | (49) | (0.27) | % | ||||||||||||||||||||||||
| Automobile | 118 | 100 | 18 | 0.15 | % | ||||||||||||||||||||||||
| Credit card | 194 | 43 | 151 | 3.09 | % | ||||||||||||||||||||||||
| Education | 12 | 4 | 8 | 0.44 | % | ||||||||||||||||||||||||
| Other consumer | 164 | 31 | 133 | 3.20 | % | ||||||||||||||||||||||||
| Total consumer | 506 | 251 | 255 | 0.35 | % | ||||||||||||||||||||||||
| Total | $ | 668 | $ | 329 | $ | 339 | 0.15 | % | |||||||||||||||||||||
| 2021 | |||||||||||||||||||||||||||||
| Commercial | |||||||||||||||||||||||||||||
| Commercial and industrial | $ | 350 | $ | 68 | $ | 282 | 0.27 | % | |||||||||||||||||||||
| Commercial real estate | 34 | 5 | 29 | 0.12 | % | ||||||||||||||||||||||||
| Equipment lease financing | 9 | 8 | 1 | 0.02 | % | ||||||||||||||||||||||||
| Total commercial | 393 | 81 | 312 | 0.23 | % | ||||||||||||||||||||||||
| Consumer | |||||||||||||||||||||||||||||
| Residential real estate | 11 | 20 | (9) | (0.04) | % | ||||||||||||||||||||||||
| Home equity | 16 | 63 | (47) | (0.26) | % | ||||||||||||||||||||||||
| Automobile | 120 | 117 | 3 | 0.03 | % | ||||||||||||||||||||||||
| Credit card | 196 | 36 | 160 | 3.52 | % | ||||||||||||||||||||||||
| Education | 11 | 6 | 5 | 0.24 | % | ||||||||||||||||||||||||
| Other consumer | 130 | 21 | 109 | 2.77 | % | ||||||||||||||||||||||||
| Total consumer | 484 | 263 | 221 | 0.36 | % | ||||||||||||||||||||||||
| Total | $ | 877 | $ | 344 | $ | 533 | 0.27 | % | |||||||||||||||||||||
Total net charge-offs decreased $194 million, or 36%, for the first nine months of 2022 compared to the same period in 2021. Declines were driven by fewer commercial net charge-offs, which in the comparative period included charge-offs attributable to BBVA that were largely the result of required purchase accounting treatment for the acquisition.
See Note 1 Accounting Policies in the Notes To Consolidated Financial Statements included in Item 8 of our 2021 Form 10-K and Note 4 Loans and Related Allowance for Credit Losses in the Notes To Consolidated Financial Statements included in this Report for additional information.
Liquidity and Capital Management
Liquidity risk, including our liquidity monitoring measures and tools, is described in further detail in the Liquidity and Capital Management section of our 2021 Form 10-K.
One of the ways we monitor our liquidity is by reference to the LCR, a regulatory minimum liquidity requirement designed to ensure that covered banking organizations maintain an adequate level of liquidity to meet net liquidity needs over the course of a hypothetical 30-day stress scenario. PNC and PNC Bank calculate the LCR daily, and as of September 30, 2022, the LCR for PNC and PNC Bank exceeded the minimum requirement of 100%.
The NSFR is designed to measure the stability of the maturity structure of assets and liabilities of banking organizations over a one-year time horizon. PNC and PNC Bank are required to calculate the NSFR on an ongoing basis, and as of September 30, 2022, the NSFR for PNC and PNC Bank exceeded the minimum requirement of 100%.
30
The PNC Financial Services Group, Inc. –
Form 10-Q
We provide additional information regarding regulatory liquidity requirements and their potential impact on us in the Supervision and Regulation section of Item 1 Business and Item 1A Risk Factors of our 2021 Form 10-K.
Sources of Liquidity
Our largest source of liquidity on a consolidated basis is the customer deposit base generated by our banking businesses. These deposits provide relatively stable and low-cost funding. Total deposits decreased to $438.2 billion at September 30, 2022 from $457.3 billion at December 31, 2021, driven by decreases in both noninterest-bearing and interest-bearing deposits. See the Funding Sources portion of the Consolidated Balance Sheet Review section of this Financial Review for additional information related to our deposits. Additionally, certain assets determined by us to be liquid as well as unused borrowing capacity from a number of sources are also available to manage our liquidity position.
At September 30, 2022, our liquid assets consisted of cash and due from banks and short-term investments (federal funds sold, resale agreements, trading securities and interest-earning deposits with banks) totaling $51.0 billion and securities available for sale totaling $45.8 billion. The level of liquid assets fluctuates over time based on many factors, including market conditions, loan and deposit growth and balance sheet management activities. PNC pledges securities as collateral to secure public and trust deposits, repurchase agreements and for other purposes. Pledged securities included $20.0 billion of securities held to maturity and an immaterial amount of available for sale and trading securities.
We also obtain liquidity through various forms of funding, including long-term debt (senior notes, subordinated debt and FHLB borrowings) and short-term borrowings (securities sold under repurchase agreements, commercial paper and other short-term borrowings). See the Funding Sources section of the Consolidated Balance Sheet Review in this Financial Review, Note 8 Borrowed Funds in the Notes To Consolidated Financial Statements included in this Report and Note 10 Borrowed Funds in the Notes To Consolidated Financial Statements included in Item 8 of our 2021 Form 10-K for additional information related to our borrowings.
Total senior and subordinated debt, on a consolidated basis, decreased due to the following activity:
Table 26: Senior and Subordinated Debt
| In billions | 2022 | |||||||
| January 1 | $ | 27.7 | ||||||
| Issuances | 0.9 | |||||||
| Calls and maturities | (5.8) | |||||||
| Other | (2.2) | |||||||
| September 30 | $ | 20.6 | ||||||
Bank Liquidity
Under PNC Bank’s 2014 bank note program, as amended, PNC Bank may from time to time offer up to $40.0 billion aggregate principal amount outstanding at any one time of its unsecured senior and subordinated notes with maturity dates more than nine months (in the case of senior notes) and five years or more (in the case of subordinated notes) from their date of issue. At September 30, 2022, PNC Bank had $9.3 billion of notes outstanding under this program of which $4.5 billion were senior bank notes and $4.8 billion were subordinated bank notes.
PNC Bank maintains additional secured borrowing capacity with the FHLB-Pittsburgh and through the Federal Reserve Bank discount window. The Federal Reserve Bank, however, is not viewed as a primary means of funding our routine business activities, but rather as a potential source of liquidity in a stressed environment or during a market disruption. At September 30, 2022, our unused secured borrowing capacity at the FHLB-Pittsburgh and the Federal Reserve Bank totaled $63.9 billion.
PNC Bank has the ability to offer up to $10.0 billion of its commercial paper to provide additional liquidity. At September 30, 2022, there were no issuances outstanding under this program.
Additionally, PNC Bank may also access funding from the parent company through deposits placed at the bank, or through issuing its senior unsecured notes.
Parent Company Liquidity
In addition to managing liquidity risk at the bank level, we monitor the parent company’s liquidity. The parent company’s contractual obligations consist primarily of debt service related to parent company borrowings and funding non-bank affiliates. Additionally, the parent company maintains liquidity to fund discretionary activities such as paying dividends to our shareholders, share repurchases and acquisitions.
The PNC Financial Services Group, Inc. –
Form 10-Q
31
At September 30, 2022, available parent company liquidity totaled $8.8 billion. Parent company liquidity is held in intercompany cash and investments. For investments with longer durations, the related maturities are aligned with scheduled cash needs, such as the maturity of parent company debt obligations.
The principal source of parent company liquidity is the dividends or other capital distributions it receives from PNC Bank, which may be impacted by the following:
•
Bank-level capital needs,
•
Laws, regulations and the results of supervisory activities,
•
Corporate policies,
•
Contractual restrictions, and
•
Other factors.
There are statutory and regulatory limitations on the ability of a national bank to pay dividends or make other capital distributions or to extend credit to the parent company or its non-bank subsidiaries. The amount available for dividend payments by PNC Bank to the parent company without prior regulatory approval was $2.4 billion at September 30, 2022. See Note 20 Regulatory Matters in the Notes To Consolidated Financial Statements included in Item 8 of our 2021 Form 10-K for further discussion of these limitations.
In addition to dividends from PNC Bank, other sources of parent company liquidity include cash and investments, as well as dividends and loan repayments from other subsidiaries and dividends or distributions from equity investments. We can also generate liquidity for the parent company and PNC’s non-bank subsidiaries through the issuance of debt and equity securities, including certain capital instruments, in public or private markets and commercial paper. Authorized by the Board of Directors, the parent company has the ability to offer up to $5.0 billion of commercial paper to provide additional liquidity. At September 30, 2022, there were no commercial paper issuances outstanding.
Parent company senior and subordinated debt outstanding totaled $10.0 billion and $11.4 billion at September 30, 2022 and December 31, 2021, respectively.
See Note 17 Subsequent Events in the Notes To Consolidated Financial Statements of this Report for details on the parent company's issuance of $1.0 billion of its 5.671% senior fixed-to-floating rate notes that mature on October 28, 2025, and $1.5 billion of its 6.037% senior fixed-to-floating rate notes that mature on October 28, 2033.
Contractual Obligations and Commitments
We have contractual obligations representing required future payments on borrowed funds, time deposits, leases, pension and postretirement benefits and purchase obligations. See the Liquidity and Capital Management portion of the Risk Management section of our 2021 Form 10-K for more information on these future cash outflows. Additionally, in the normal course of business we have various commitments outstanding, certain of which are not included on our Consolidated Balance Sheet. We provide information on our commitments in Note 9 Commitments in the Notes To Consolidated Financial Statements of this Report.
Credit Ratings
PNC’s credit ratings affect the cost and availability of short and long-term funding, collateral requirements for certain derivative instruments and the ability to offer certain products.
In general, rating agencies base their ratings on many quantitative and qualitative factors, including capital adequacy, liquidity, asset quality, business mix, level and quality of earnings, and the current legislative and regulatory environment, including implied government support. A decrease, or potential decrease, in credit ratings could impact access to the capital markets and/or increase the cost of debt, and thereby adversely affect liquidity and financial condition.
32
The PNC Financial Services Group, Inc. –
Form 10-Q
The following table presents credit ratings for PNC and PNC Bank as of September 30, 2022:
Table 27: Credit Ratings for PNC and PNC Bank
| September 30, 2022 | |||||||||||
|
|
Moody’s | Standard & Poor’s | Fitch | ||||||||
| PNC | |||||||||||
| Senior debt | A3 | A- | A | ||||||||
| Subordinated debt | A3 | BBB+ | A- | ||||||||
| Preferred stock | Baa2 | BBB- | BBB | ||||||||
| PNC Bank | |||||||||||
| Senior debt | A2 | A | A+ | ||||||||
| Subordinated debt | A3 | A- | A | ||||||||
| Long-term deposits | Aa3 | A | AA- | ||||||||
| Short-term deposits | P-1 | A-1 | F1+ | ||||||||
| Short-term notes | P-1 | A-1 | F1 | ||||||||
Capital Management
Detailed information on our capital management processes and activities is included in the Supervision and Regulation section of Item 1 of our 2021 Form 10-K.
We manage our funding and capital positions by making adjustments to our balance sheet size and composition, issuing or redeeming debt, issuing equity or other capital instruments, executing treasury stock transactions and capital redemptions or repurchases, and managing dividend policies and retaining earnings.
On August 19, 2022, PNC issued 1,250,000 depositary shares each representing 1/100th ownership in a share of 6.200% fixed-rate reset non-cumulative perpetual preferred stock, Series V, with a par value of $1 per share.
See Note 17 Subsequent Events in the Notes To Consolidated Financial Statements of this Report for details on the redemption of $1.5 billion Series P preferred stock on November 1, 2022.
In the third quarter of 2022, PNC returned $1.7 billion of capital to shareholders, an increase of $0.3 billion from the second quarter of 2022, due to higher share repurchases. Capital return in the third quarter of 2022 was comprised of $1.1 billion of common share repurchases, representing 6.7 million shares, and $0.6 billion of dividends on common shares. Consistent with the SCB framework, which allows for capital return in amounts in excess of the SCB minimum levels, our Board of Directors has authorized a repurchase framework under the previously approved repurchase program of up to 100 million common shares, of which approximately 53% were still available for repurchase at September 30, 2022. Under this framework, PNC expects its quarterly repurchases to approximate $700 million to $750 million with the ability to adjust those levels as conditions warrant. PNC's SCB for the four-quarter period beginning October 1, 2022 is 2.9%.
On October 3, 2022, the PNC Board of Directors declared a quarterly cash dividend on common stock of $1.50 per share payable on November 5, 2022.
The PNC Financial Services Group, Inc. –
Form 10-Q
33
Table 28: Basel III Capital
| September 30, 2022 | ||||||||
| Dollars in millions | Basel III (a) |
Fully Implemented
(estimated) (b) |
||||||
| Common equity Tier 1 capital | ||||||||
| Common stock plus related surplus, net of treasury stock | (2,847) | (2,847) | ||||||
| Retained earnings | 53,501 | 52,777 | ||||||
| Goodwill, net of associated deferred tax liabilities | (10,761) | (10,761) | ||||||
| Other disallowed intangibles, net of deferred tax liabilities | (398) | (398) | ||||||
| Other adjustments/(deductions) | (123) | (127) | ||||||
| Common equity Tier 1 capital (c) | 39,372 | 38,644 | ||||||
| Additional Tier 1 capital | ||||||||
| Preferred stock plus related surplus | 7,245 | 7,245 | ||||||
| Tier 1 capital | 46,617 | 45,889 | ||||||
| Additional Tier 2 capital | ||||||||
| Qualifying subordinated debt | 3,646 | 3,646 | ||||||
| Eligible credit reserves includable in Tier 2 capital | 4,252 | 4,968 | ||||||
| Total Basel III capital | $ | 54,515 | $ | 54,503 | ||||
| Risk-weighted assets | ||||||||
| Basel III standardized approach risk-weighted assets (d) | $ | 423,446 | $ | 423,593 | ||||
| Average quarterly adjusted total assets | $ | 539,869 | $ | 539,141 | ||||
| Supplementary leverage exposure (e) | $ | 639,250 | $ | 639,246 | ||||
| Basel III risk-based capital and leverage ratios (f) | ||||||||
| Common equity Tier 1 | 9.3 | % | 9.1 | % | ||||
| Tier 1 | 11.0 | % | 10.8 | % | ||||
| Total | 12.9 | % | 12.9 | % | ||||
| Leverage (g) | 8.6 | % | 8.5 | % | ||||
| Supplementary leverage ratio (e) | 7.3 | % | 7.2 | % | ||||
(a)
The ratios are calculated to reflect PNC’s election to adopt the CECL five-year transition provisions. Effective for the first quarter 2022, PNC is now in the three-year transition period and the full impact of the CECL standard is being phased-in to regulatory capital through December 31, 2024.
(b)
The ratios are calculated to reflect the full impact of CECL and excludes the benefits of the optional five-year transition.
(c)
As permitted, PNC and PNC Bank have elected to exclude AOCI related to both available for sale securities and pension and other post-retirement plans from CET1 capital.
(d)
Basel III standardized approach risk-weighted assets are based on the Basel III standardized approach rules and include credit and market risk-weighted assets.
(e)
The Supplementary leverage ratio is calculated based on Tier 1 capital divided by Supplementary leverage exposure, which takes into account the quarterly average of both on balance sheet assets as well as certain off-balance sheet items, including loan commitments and potential future exposure under derivative contracts.
(f)
All ratios are calculated using the regulatory capital methodology applicable to PNC and calculated based on the standardized approach.
(g)
Leverage ratio is calculated based on Tier 1 capital divided by Average quarterly adjusted total assets.
PNC’s regulatory risk-based capital ratios are calculated using the standardized approach for determining risk-weighted assets. Under the standardized approach for determining credit risk-weighted assets, exposures are generally assigned a pre-defined risk weight. Exposures to high volatility commercial real estate, nonaccruals, TDRs, past due exposures and equity exposures are generally subject to higher risk weights than other types of exposures.
The regulatory agencies have adopted a rule permitting certain banks, including PNC, to delay the estimated impact on regulatory capital stemming from implementing CECL. CECL’s estimated impact on CET1 capital, as defined by the rule, is the change in retained earnings at adoption plus or minus 25% of the change in CECL ACL at the balance sheet date, excluding the initial allowance for PCD loans from BBVA, compared to CECL ACL at adoption. Effective for the first quarter of 2022, PNC is now in the three-year transition period, and the full impact of the CECL standard is being phased-in to regulatory capital through December 31, 2024. See additional discussion of this rule in the Supervision and Regulation section of Item 1 Business and Item 1A Risk Factors of our 2021 Form 10-K.
At September 30, 2022, PNC and PNC Bank were considered “well capitalized,” based on applicable U.S. regulatory capital ratio requirements. To qualify as “well capitalized”, PNC must have Basel III capital ratios of at least 6% for Tier 1 risk-based capital and 10% for Total risk-based capital, and PNC Bank must have Basel III capital ratios of at least 6.5% for Common equity Tier 1 risk-based capital, 8% for Tier 1 risk-based capital, 10% for Total risk-based capital and a Leverage ratio of at least 5%.
Federal banking regulators have stated that they expect the largest U.S. BHCs, including PNC, to have a level of regulatory capital well in excess of the regulatory minimum and have required the largest U.S. BHCs, including PNC, to have a capital buffer sufficient
34
The PNC Financial Services Group, Inc. –
Form 10-Q
to withstand losses and allow them to meet the credit needs of their customers through estimated stress scenarios. We seek to manage our capital consistent with these regulatory principles, and believe that our September 30, 2022 capital levels were aligned with them.
We provide additional information regarding regulatory capital requirements and some of their potential impacts on us in the Supervision and Regulation section of Item 1 Business, Item 1A Risk Factors and Note 20 Regulatory Matters in the Notes To Consolidated Financial Statements in Item 8 of our 2021 Form 10-K.
Market Risk Management
See the Market Risk Management portion of the Risk Management Section in our 2021 Form 10-K for additional discussion regarding market risk.
Market Risk Management – Interest Rate Risk
Interest rate risk results primarily from our traditional banking activities of gathering deposits and extending loans. Many factors, including economic and financial conditions, movements in interest rates and consumer preferences, affect the difference between the interest that we earn on assets and the interest that we pay on liabilities and the level of our noninterest-bearing funding sources. Due to the repricing term mismatches and embedded options inherent in certain of these products, changes in market interest rates not only affect expected near-term earnings, but also the economic values of these assets and liabilities.
Our Asset and Liability Management group centrally manages interest rate risk as prescribed in our risk management policies, which are approved by management’s Asset and Liability Committee and the Risk Committee of the Board of Directors.
Sensitivity results and market interest rate benchmarks for the third quarters of 2022 and 2021 follow:
Table 29: Interest Sensitivity Analysis
| Third Quarter 2022 | Third Quarter 2021 | |||||||||||||
| Net Interest Income Sensitivity Simulation | ||||||||||||||
|
Effect on net interest income in first year from gradual interest rate change over the
following 12 months of: |
||||||||||||||
| 100 basis point increase | 2.5 | % | 4.5 | % | ||||||||||
| 100 basis point decrease (a) | (2.5) | % | N/A | |||||||||||
|
Effect on net interest income in second year from gradual interest rate change over the
preceding 12 months of: |
||||||||||||||
| 100 basis point increase | 4.5 | % | 11.3 | % | ||||||||||
| 100 basis point decrease (a) | (4.8) | % | N/A | |||||||||||
(a)
Due to the prevailing low interest rate environment post pandemic, the reporting of Net interest income sensitivities for the 100 basis point decrease scenario was suspended from the first quarter of 2020 to the first quarter of 2022.
In addition to measuring the effect on net interest income assuming parallel changes in current interest rates, we routinely simulate the effects of a number of nonparallel interest rate environments. Table 30 reflects the percentage change in net interest income over the next two 12-month periods, assuming (i) the PNC Economist’s most likely rate forecast, (ii) implied market forward rates and (iii) yield curve slope flattening (a 100 basis point yield curve slope flattening between one-month and ten-year rates superimposed on current base rates) scenario.
All changes in forecasted net interest income are relative to results in a base rate scenario where current market rates are assumed to remain unchanged over the forecast horizon.
Table 30: Net Interest Income Sensitivity to Alternative Rate Scenarios
| September 30, 2022 | ||||||||||||||
|
PNC
Economist |
Market
Forward |
Slope
Flattening |
||||||||||||
| First year sensitivity | 3.5 | % | 4.2 | % | (0.5) | % | ||||||||
| Second year sensitivity | (4.3) | % | (3.0) | % | (2.7) | % | ||||||||
When forecasting net interest income, we make assumptions about interest rates and the shape of the yield curve, the volume and characteristics of new business and the behavior of existing on- and off-balance sheet positions. These assumptions determine the future level of simulated net interest income in the base interest rate scenario and the other interest rate scenarios presented in Tables 29 and 30. These simulations assume that as assets and liabilities mature, they are replaced or repriced at then current market rates.
The PNC Financial Services Group, Inc. –
Form 10-Q
35
The following graph presents the SOFR curves for the base rate scenario and each of the alternate scenarios one year forward:
Table 31: Alternate Interest Rate Scenarios: One Year Forward
The third quarter 2022 interest sensitivity analyses indicate that our Consolidated Balance Sheet is positioned to benefit from an increase in interest rates and an upward sloping interest rate yield curve. We believe that we have the deposit funding base and balance sheet flexibility to adjust, where appropriate and permissible, to changing interest rates and market conditions.
LIBOR Transition
The scheduled discontinuance of the requirement that banks submit rates for the calculation of LIBOR after June 30, 2023 presents risks to the financial instruments originated, held or serviced by PNC that use LIBOR as a reference rate. For more discussion regarding the transition from LIBOR, see the Risk Management section in Item 7 of our 2021 Form 10-K.
Key efforts related to our transition plan to date have included:
•
Enhancing fallback language in new contracts and reviewing existing legal contracts/agreements to assess fallback language impacts,
•
Making preparations for internal operational readiness,
•
Making necessary enhancements to PNC's infrastructure, including systems, models, valuation tools and processes,
•
Developing and delivering on internal and external LIBOR cessation communication plans,
•
Engaging with PNC clients, industry working groups and regulators,
•
Monitoring developments associated with LIBOR alternatives and industry practices related to LIBOR-indexed instruments,
•
Incorporating BBVA into PNC’s LIBOR transition effort, and
•
Initiating the offering of instruments referencing alternative rates in order to align with regulatory guidance encouraging the transition away from the use of USD LIBOR in new contracts after December 31, 2021.
As of December 31, 2021, PNC Bank ceased entering into new contracts with a LIBOR reference rate, except on a limited basis, as permissible. PNC is offering conforming adjustable rate mortgages using SOFR instead of USD LIBOR, in line with Fannie Mae and Freddie Mac requirements, and nonconforming adjustable rate residential mortgages using SOFR and private education loans using Prime. Alternative rates, primarily SOFR, are currently offered to our corporate and commercial customers. The focus for 2022 is planning for the cessation event in 2023 for all lines of business. Corporate & Institutional Banking has initiated amending contracts with inadequate fallback language, working on systems enhancements and continuing with client outreach and education. PNC has provided regular updates to Federal Reserve, OCC and FDIC examination staff regarding its LIBOR cessation and transition plans.
36
The PNC Financial Services Group, Inc. –
Form 10-Q
Market Risk Management – Customer-Related Trading Risk
We engage in fixed income securities, derivatives and foreign exchange transactions to support our customers’ investing and hedging activities. These transactions, related hedges and the credit valuation adjustment related to our customer derivatives portfolio are marked-to-market daily and reported as customer-related trading activities.We do not engage in proprietary trading of these products.
We use VaR as the primary means to measure and monitor market risk in customer-related trading activities. VaR is used to estimate the probability of portfolio losses based on the statistical analysis of historical market risk factors. VaR is calculated for each of the portfolios that comprise our customer-related trading activities of which the majority are covered positions as defined by the Market Risk Rule. VaR is computed with positions and market risk factors updated daily to ensure each portfolio is operating within its acceptable limits.
See the Market Risk Management – Customer-Related Trading Risk section of our 2021 Form 10-K for more information on our models used to calculate VaR and our backtesting process.
Customer-related trading revenue was $291 million for the nine months ended September 30, 2022, compared to $278 million for the nine months ended September 30, 2021. The increase was primarily due to improved interest rate derivative and foreign exchange client sales revenues, partially offset by the impact of changes in credit valuations for customer-related derivative activities.
Market Risk Management – Equity And Other Investment Risk
Equity investment risk is the risk of potential losses associated with investing in both private and public equity markets. In addition to extending credit, taking deposits, underwriting securities and trading financial instruments, we make and manage direct investments in a variety of transactions, including management buyouts, recapitalizations and growth financings in a variety of industries. We also have investments in affiliated and non-affiliated funds that make similar investments in private equity, consistent with regulatory limitations. The economic and/or book value of these investments and other assets are directly affected by changes in market factors.
Various PNC business units manage our equity and other investment activities. Our businesses are responsible for making investment decisions within the approved policy limits and associated guidelines.
A summary of our equity investments follows:
Table 32: Equity Investments Summary
|
September 30
2022 |
December 31
2021 |
Change | ||||||||||||||||||||||||
| Dollars in millions | $ | % | ||||||||||||||||||||||||
| Tax credit investments | $ | 3,993 | $ | 3,954 | $ | 39 | 1 | % | ||||||||||||||||||
| Private equity and other | 4,137 | 4,226 | (89) | (2) | % | |||||||||||||||||||||
| Total | $ | 8,130 | $ | 8,180 | $ | (50) | (1) | % | ||||||||||||||||||
Tax Credit Investments
Included in our equity investments are direct tax credit investments and equity investments held by consolidated entities. These tax credit investment balances included unfunded commitments totaling $2.3 billion and $2.2 billion at September 30, 2022 and December 31, 2021, respectively. These unfunded commitments are included in Other liabilities on our Consolidated Balance Sheet.
Note 5 Loan Sale and Servicing Activities and Variable Interest Entities in the Notes To Consolidated Financial Statements in Item 8 of our 2021 Form 10-K has further information on tax credit investments.
Private Equity and Other
The largest component of our other equity investments is our private equity portfolio. The private equity portfolio is an illiquid portfolio consisting of mezzanine and equity investments that vary by industry, stage and type of investment. Private equity investments carried at estimated fair value totaled $2.0 billion and $1.8 billion at September 30, 2022 and December 31, 2021, respectively. As of September 30, 2022, $1.8 billion
was invested directly in a variety of companies and $0.2 billion was invested indirectly through various private equity funds.
Included in our other equity investments are Visa Class B common shares, which are recorded at cost. Visa Class B common shares that we own are transferable only under limited circumstances until they can be converted into shares of the publicly-traded Class A common shares, which cannot happen until the resolution of the pending interchange litigation. Based upon the September 30, 2022 per share closing price of $177.65
for a Visa Class A common share, the estimated value of our total investment in the Class B common shares was approximately $1.0 billion at the current conversion rate of Visa B shares to Visa A shares, while our cost basis was insignificant. See Note 15 Fair Value and Note 21 Legal Proceedings in the Notes To Consolidated Financial Statements in Item 8 of our 2021 Form 10-K for additional information regarding our Visa agreements. The estimated value does not represent fair value of the Visa B common shares given the shares' limited transferability and the lack of observable transactions in the marketplace.
The PNC Financial Services Group, Inc. –
Form 10-Q
37
We also have certain other equity investments, the majority of which represent investments in affiliated and non-affiliated funds with both traditional and alternative investment strategies. Net gains related to these investments were $26 million for the nine months ended September 30, 2022 and $44 million for the nine months ended September 30, 2021.
Financial Derivatives
We use a variety of financial derivatives as part of the overall asset and liability risk management process to help manage exposure to market (primarily interest rate) and credit risk inherent in our business activities. We also enter into derivatives with customers to facilitate their risk management activities.
Financial derivatives involve, to varying degrees, market and credit risk. Derivatives represent contracts between parties that usually require little or no initial net investment and result in one party delivering cash or another type of asset to the other party based on a notional and an underlying as specified in the contract. Therefore, cash requirements and exposure to credit risk are significantly less than the notional amount on these instruments.
Further information on our financial derivatives is presented in Note 1 Accounting Policies, Note 15 Fair Value and Note 16 Financial Derivatives in our Notes To Consolidated Financial Statements in Item 8 of our 2021 Form 10-K and in Note 12 Fair Value and Note 13 Financial Derivatives in the Notes To Consolidated Financial Statements in Item 1 of this Report.
Not all elements of market and credit risk are addressed through the use of financial derivatives, and such instruments may be ineffective for their intended purposes due to unanticipated market changes, among other reasons.
R
ECENT
R
EGULATORY
D
EVELOPMENTS
In August 2022, the President signed into law the Inflation Reduction Act of 2022 (the “Act”). Among other things, including the allocation of $369.0 billion for climate-related spending such as clean energy tax credits and investments, the Act imposes a 15% minimum tax on the adjusted financial statement income of taxpayers like PNC with more than $1.0 billion of such income. The Act also imposes a 1% excise tax on corporate stock repurchases. The minimum tax and excise tax requirements, as written, could impact PNC's cash tax liability.
In October 2022, the Federal Reserve and FDIC jointly issued an advance notice of proposed rulemaking to solicit input on potential changes to the resolution-related requirements applicable to large banking organizations like PNC that are not GSIBs. The advance notice of proposed rulemaking solicits comments and poses specific questions on whether to impose GSIB-like resolution requirements on large banking organizations that are not GSIBs, including a requirement to maintain loss-absorbing capacity at the insured depository institution or holding company in the form of long-term debt, a “clean holding company” requirement that would prohibit top-tier holding companies from entering certain financial arrangements (such as short-term borrowing or derivative contracts), the Federal Reserve’s supervisory guidance on recovery planning, separability requirements and certain disclosure requirements currently applicable to GSIBs. Such requirements could, among other things, increase PNC’s borrowing costs, require the implementation of new operational capabilities, and require changes to PNC’s resolution strategies at the holding company and bank level.
C
RITICAL
A
CCOUNTING
E
STIMATES
AND
J
UDGMENTS
Note 1 Accounting Policies in our 2021 Form 10-K describes the most significant accounting policies that we use to prepare our consolidated financial statements. Certain of these policies require us to make estimates or economic assumptions that may vary under different assumptions or conditions, and such variations may significantly affect our reported results and financial position for the period or in future periods. The policies and judgments related to residential and commercial MSRs and level 3 fair value measurements are described in Critical Accounting Estimates and Judgments in Item 7 of our 2021 Form 10-K. The following details the critical estimates and judgments around the ACL.
Allowance for Credit Losses
We maintain the ACL at levels that we believe to be appropriate as of the balance sheet date to absorb expected credit losses on our existing investment securities, loans, equipment finance leases, other financial assets and unfunded lending related commitments, for the remaining contractual term of the assets or exposures, taking into consideration expected prepayments. Our determination of the ACL is based on historical loss and performance experience, as well as current borrower and transaction characteristics including collateral type and quality, current economic conditions, reasonable and supportable forecasts of future conditions and other relevant factors. We use methods sensitive to changes in economic conditions to interpret these factors and to estimate expected credit losses. We evaluate and, when appropriate, enhance the quality of our data and models and other methods used to estimate the ACL on an ongoing basis. We apply qualitative factors to reflect in the ACL our best estimate of amounts that we do not expect to collect because
38
The PNC Financial Services Group, Inc. –
Form 10-Q
of, among other things, idiosyncratic risk factors, changes in economic conditions that may not be reflected in forecasted results, or other potential methodology limitations. The major drivers of ACL estimates include:
•
Current economic conditions: Our forecast of expected losses depends on economic conditions as of the estimation date. As current economic conditions evolve, forecasted losses could be materially affected.
•
Scenario weights and design: Our loss estimates are sensitive to the shape, direction and rate of change of macroeconomic forecasts and thus vary significantly between upside and downside scenarios. Changes to probability weights assigned to these scenarios and timing of peak business cycles reflected by the scenarios could materially affect our loss estimates.
•
Current borrower quality: Our forecast of expected losses depends on current borrower and transaction characteristics, including credit metrics and collateral type/quality. As borrower quality changes, forecasted losses could be materially affected.
•
Portfolio volume and mix: Changes to portfolio volume and mix could materially affect our estimates, as CECL reserves
would be recognized upon origination or acquisition.
For all assets and unfunded lending related commitments within the scope of the CECL standard, the applicable ACL is composed of one or a combination of the following components: (i) collectively assessed or pooled reserves, (ii) individually assessed reserves, and
(iii) qualitative (judgmental) reserves. Our methodologies and key assumptions for each of these components are discussed in Note 1
Accounting Policies in our 2021 Form 10-K.
Reasonable and Supportable Economic Forecast
Under CECL, we are required to consider reasonable and supportable forecasts in estimating expected credit losses. For this purpose,
we have established a framework which includes a three year forecast period and the use of four economic scenarios with associated probability weights, which in combination create a forecast of expected economic outcomes over our reasonable and supportable forecast period. Credit losses estimated in our reasonable and supportable forecast period are sensitive to the shape and severity of the scenarios used and weights assigned to them.
To generate the four economic forecast scenarios we use a combination of quantitative macroeconomic models, other measures of economic activity and forward-looking expert judgment to forecast the distribution of economic outcomes over the reasonable and supportable forecast period. Each scenario is then given an associated probability (weight) in order to represent our current expectation within that distribution over the forecast period. This process is informed by current economic conditions, expected business cycle evolution and the expert judgment of PNC’s RAC. This approach seeks to provide a reasonable representation of the forecast of expected economic outcomes and is used to estimate expected credit losses across a variety of loans and securities. Each quarter the scenarios are presented for approval to PNC’s RAC, which also determines and approves CECL scenarios' weights for use for the current reporting period.
The scenarios used for the period ended September 30, 2022 reflect an increase in downside risk compared to December 31, 2021. The current outlook considers the inflationary pressures that have broadened and intensified since the start of the year, along with the fact that the FOMC raised interest rates more aggressively than what was expected at December 31, 2021, increasing the risk of a broader-ranged economic slowdown. Though the most-likely expectation continues to be that the U.S. economy narrowly avoids recession, growth is expected to slow and the primary downside risk to the outlook has shifted from the pandemic to monetary policy tightening and inflation.
We used a number of economic variables in our scenarios, with two of the most significant drivers being Real GDP and the U.S. unemployment rate. The following table presents a comparison of these two economic variables based on the weighted-average scenario forecasts used in determining our ACL at September 30, 2022 and December 31, 2021.
Table 33: Key Macroeconomic Variables in CECL Weighted-Average Scenarios
| Assumptions as of September 30, 2022 | |||||||||||
| 2022 | 2023 | 2024 | |||||||||
| U.S. Real GDP (a) | 0.2% | 0.1% | 1.5% | ||||||||
| U.S. Unemployment Rate (b) | 3.8% | 4.8% | 4.7% | ||||||||
| Assumptions as of December 31, 2021 | |||||||||||
| 2022 | 2023 | 2024 | |||||||||
| U.S. Real GDP (a) | 2.8% | 1.4% | 1.3% | ||||||||
| U.S. Unemployment Rate (b) | 4.4% | 4.1% | 3.9% | ||||||||
(a)
Represents year-over-year growth rates.
(b)
Represents quarterly average rate at December 31, 2022, 2023 and 2024, respectively.
Real GDP growth is expected to end 2022 at 0.2% on a weighted average basis, down from the 2.8% assumed at December 31, 2021 due primarily to weaker expected growth in the second half of 2022, along with the unexpected contraction of GDP in the first and second quarter of 2022. Growth drops to 0.1% in 2023, before growing to 1.5% in 2024. In line with the slowing in overall economic
The PNC Financial Services Group, Inc. –
Form 10-Q
39
activity, the weighted average unemployment rate is expected to increase modestly to 4.8% in 2023, with unemployment narrowly improving to 4.7% in 2024.
The current state of the economy reflects an environment with receding COVID-19 related risks but heightened uncertainty remains in terms of losses due to structural and secular changes fostered by the pandemic for certain sectors of the economy combined with inflation, rising interest rates and ongoing supply chain pressures. As such, for both our commercial and consumer loan portfolios, PNC identified and performed significant analysis around segments impacted by such uncertainties to ensure our reserves are adequate, given our current macroeconomic expectations.
We believe the economic scenarios effectively reflect the distribution of potential economic outcomes. Additionally, through in-depth and granular analysis we have addressed reserve requirements for the specific populations most affected in the current environment. Through this approach, we believe the reserve levels appropriately reflect the expected credit losses in the portfolio as of the balance sheet date.
See the following for additional details on the components of our ACL:
•
Allowance For Credit Losses in the Credit Risk Management section of this Financial Review, and
•
Note 3 Investment Securities and Note 4 Loans and Related Allowance for Credit Losses in the Notes To Consolidated Financial Statements included in this Report.
40
The PNC Financial Services Group, Inc. –
Form 10-Q
Recently Issued Accounting Standards
| Accounting Standards Update | Description | Financial Statement Impact | ||||||
|
Portfolio Layer Hedging -
ASU 2022-01
Issued March 2022
|
• Required effective date of January 1, 2023; early adoption is permitted.
• Permits entities to expand their use of the portfolio layer method (previously the last-of-layer method) for fair value hedges of interest rate risk.
• Expands the scope to allow nonprepayable financial assets to be included in a closed portfolio hedge using the portfolio layer method.
• Allows multiple hedged layers to be designated for a single closed portfolio of financial assets or one or more beneficial interests secured by a portfolio of financial instruments.
• Provides additional guidance on accounting for fair value hedge basis adjustments associated with portfolio layer hedges, generally requiring these adjustments to be maintained at the closed portfolio level and clarifying how these amounts should be disclosed.
• Requires a prospective transition approach for designation of multiple hedged layers of a single closed portfolio, a modified retrospective transition approach for hedge basis adjustments under the portfolio layer method, and the option of a prospective or retrospective transition approach for disclosures.
• Allows for an election to transfer debt securities classified as held to maturity to available for sale if the portfolio layer hedging method is applied to those securities; the election must be made within 30 days of adoption.
|
• We are currently evaluating when to adopt the amendments in ASU 2022-01 and the impact of the ASU on our consolidated results of operations and our consolidated financial position. | ||||||
|
Troubled Debt Restructurings and Vintage Disclosures - ASU 2022-02
Issued March 2022
|
•
Required effective date of January 1, 2023; early adoption is permitted.
•
Eliminates the accounting guidance for TDRs and requires an entity to apply the loan refinancing and restructuring guidance to determine whether a modification results in a new loan or a continuation of an existing loan.
•
Eliminates the requirement to use a discounted cash flow approach to measure the allowance for credit losses for TDRs.
•
Enhances disclosure requirements for certain loan refinancings and restructurings by creditors when a borrower is experiencing financial difficulty.
•
Requires disclosure of current-period gross charge-offs by year of origination for financing receivables and net investments in leases within the scope of CECL.
•
Requires a prospective transition approach to all amendments except those related to the recognition and measurement of TDRs (which allow a modified retrospective transition approach through a cumulative-effect adjustment to retained earnings in the period of adoption).
|
•
We do not plan to early adopt ASU 2022-02.
•
We do not expect the adoption of this standard to materially impact our consolidated results of operations or our consolidated financial position. The amendments will require changes to disclosures on information related to loan modifications to borrowers experiencing financial difficulty and current-period gross charge-offs.
|
||||||
Recently Adopted Accounting Pronouncements
See Note 1 Accounting Policies in the Notes To Consolidated Financial Statements included in this Report regarding the impact of new accounting pronouncements which we have adopted.
The PNC Financial Services Group, Inc. –
Form 10-Q
41
I
NTERNAL
C
ONTROLS
A
ND
D
ISCLOSURE
C
ONTROLS
A
ND
P
ROCEDURES
As of September 30, 2022, we performed an evaluation under the supervision of and with the participation of our management, including the Chairman, President and Chief Executive Officer and the Executive Vice President and Chief Financial Officer, of the effectiveness of the design and operation of our disclosure controls and procedures and of changes in our internal control over financial reporting.
Based on that evaluation, our Chairman, President and Chief Executive Officer and our Executive Vice President and Chief Financial Officer concluded that our disclosure controls and procedures (as defined in Rule 13a-15(e) under the Securities Exchange Act of 1934) were effective as of September 30, 2022, and that there has been no change in PNC’s internal control over financial reporting that occurred during the third quarter of 2022 that has materially affected, or is reasonably likely to materially affect, our internal control over financial reporting.
C
AUTIONARY
S
TATEMENT
R
EGARDING
F
ORWARD
-L
OOKING
I
NFORMATION
We make statements in this Report, and we may from time to time make other statements, regarding our outlook for financial performance, such as earnings, revenues, expenses, tax rates, capital and liquidity levels and ratios, asset levels, asset quality, financial position, and other matters regarding or affecting us and our future business and operations, including our sustainability strategy, that are forward-looking statements within the meaning of the Private Securities Litigation Reform Act. Forward-looking statements are typically identified by words such as “believe,” “plan,” “expect,” “anticipate,” “see,” “look,” “intend,” “outlook,” “project,” “forecast,” “estimate,” “goal,” “will,” “should” and other similar words and expressions.
Forward-looking statements are necessarily subject to numerous assumptions, risks and uncertainties, which change over time. Future events or circumstances may change our outlook and may also affect the nature of the assumptions, risks and uncertainties to which our forward-looking statements are subject. Forward-looking statements speak only as of the date made. We do not assume any duty and do not undertake any obligation to update forward-looking statements. Actual results or future events could differ, possibly materially, from those anticipated in forward-looking statements, as well as from historical performance. As a result, we caution against placing undue reliance on any forward-looking statements.
Our forward-looking statements are subject to the following principal risks and uncertainties.
•
Our businesses, financial results and balance sheet values are affected by business and economic conditions, including:
–
Changes in interest rates and valuations in debt, equity and other financial markets,
–
Disruptions in the U.S. and global financial markets,
–
Actions by the Federal Reserve Board, U.S. Treasury and other government agencies, including those that impact money supply, market interest rates and inflation,
–
Changes in customer behavior due to changing business and economic conditions or legislative or regulatory initiatives,
–
Changes in customers’, suppliers’ and other counterparties’ performance and creditworthiness,
–
Impacts of tariffs and other trade policies of the U.S. and its global trading partners,
–
The impact of the Russia-Ukraine conflict, and associated sanctions or other actions in response, on the global and U.S. economy,
–
The length and extent of the economic impacts of the COVID-19 pandemic,
–
Impacts of changes in federal, state and local governmental policy, including on the regulatory landscape, capital markets, taxes, infrastructure spending and social programs,
–
PNC’s ability to attract, recruit and retain skilled employees, and
–
Commodity price volatility.
•
Our forward-looking financial statements are subject to the risk that economic and financial market conditions will be substantially different than those we are currently expecting and do not take into account potential legal and regulatory contingencies. These statements are based on our views that:
–
Although real GDP contracted in the first and second quarters of 2022, the U.S. economy is not in a recession. In particular, the labor market remains extremely strong, with average monthly job growth well above the pre-pandemic pace, and the unemployment rate at a 50-year low. Supply-chain difficulties will continue to ease into 2023. Labor shortages will remain a constraint into 2023, although strong wage growth and high levels of household saving will support consumer spending.
–
PNC expects economic growth will be below its long-term trend in the near term as the Federal Reserve continues to tighten monetary policy in an attempt to reduce inflationary pressures, but does not expect a near-term recession. Recession risks over the next few years are elevated, however, because of tighter monetary policy.
–
Inflation has started to slow, but remains near the strongest pace in decades. Inflation should slow further due to softer economic growth and a continued easing in supply-chain difficulties and will return to the Federal Reserve's 2% long-run objective in 2024.
42
The PNC Financial Services Group, Inc. –
Form 10-Q
–
The FOMC raised the federal funds rate by 0.75% in September, to a range of 3.00% to 3.25%. PNC expects further increases in the federal funds rate through the rest of this year, to a range of 4.25% to 4.50% at the end of 2022. PNC expects the federal funds rate to peak between 4.50% and 4.75% in early 2023, before falling in early 2024 as inflation ebbs and economic growth slows.
•
PNC’s ability to take certain capital actions, including returning capital to shareholders, is subject to PNC meeting or exceeding an SCB established by the Federal Reserve Board in connection with the Federal Reserve Board's CCAR process.
•
PNC’s regulatory capital ratios in the future will depend on, among other things, the company’s financial performance, the scope and terms of final capital regulations then in effect and management actions affecting the composition of PNC’s balance sheet. In addition, PNC’s ability to determine, evaluate and forecast regulatory capital ratios, and to take actions (such as capital distributions) based on actual or forecasted capital ratios, will be dependent at least in part on the development, validation and regulatory review of related models and the reliability of and risks resulting from extensive use of such models.
•
Legal and regulatory developments could have an impact on our ability to operate our businesses, financial condition, results of operations, competitive position, reputation, or pursuit of attractive acquisition opportunities. Reputational impacts could affect matters such as business generation and retention, liquidity, funding, and ability to attract and retain employees. These developments could include:
–
Changes to laws and regulations, including changes affecting oversight of the financial services industry, changes in the enforcement and interpretation of such laws and regulations, and changes in accounting and reporting standards.
–
Unfavorable resolution of legal proceedings or other claims and regulatory and other governmental investigations or other inquiries resulting in monetary losses, costs, or alterations in our business practices and potentially causing reputational harm to PNC.
–
Results of the regulatory examination and supervision process, including our failure to satisfy requirements of agreements with governmental agencies.
–
Costs associated with obtaining rights in intellectual property claimed by others and of adequacy of our intellectual property protection in general.
•
Business and operating results are affected by our ability to identify and effectively manage risks inherent in our businesses, including, where appropriate, through effective use of systems and controls, third-party insurance, derivatives, and capital management techniques, and to meet evolving regulatory capital and liquidity standards.
•
Our reputation and business and operating results may be affected by our ability to appropriately meet or address environmental, social or governance targets, goals, commitments or concerns that may arise.
•
We grow our business in part through acquisitions and new strategic initiatives. Risks and uncertainties include those presented by the nature of the business acquired and strategic initiative, including in some cases those associated with our entry into new businesses or new geographic or other markets and risks resulting from our inexperience in those new areas, as well as risks and uncertainties related to the acquisition transactions themselves, regulatory issues, the integration of the acquired businesses into PNC after closing or any failure to execute strategic or operational plans.
•
Competition can have an impact on customer acquisition, growth and retention and on credit spreads and product pricing, which can affect market share, deposits and revenues. Our ability to anticipate and respond to technological changes can also impact our ability to respond to customer needs and meet competitive demands.
•
Business and operating results can also be affected by widespread manmade, natural and other disasters (including severe weather events), health emergencies, dislocations, geopolitical instabilities or events, terrorist activities, system failures or disruptions, security breaches, cyberattacks, international hostilities, or other extraordinary events beyond PNC's control through impacts on the economy and financial markets generally or on us or our counterparties, customers or third-party vendors and service providers specifically.
We provide greater detail regarding these as well as other factors in our 2021 Form 10-K and subsequent Form 10-Qs and elsewhere in this Report, including in the Risk Factors and Risk Management sections and the Legal Proceedings and Commitments Notes of the Notes To Consolidated Financial Statements in these reports. Our forward-looking statements may also be subject to other risks and uncertainties, including those discussed elsewhere in this Report or in our other filings with the SEC.
The PNC Financial Services Group, Inc. –
Form 10-Q
43
CONSOLIDATED INCOME STATEMENT
THE PNC FINANCIAL SERVICES GROUP, INC.
| Unaudited |
Three months ended
September 30 |
Nine months ended
September 30 |
|||||||||||||||||||||
| In millions, except per share data | 2022 | 2021 | 2022 | 2021 | |||||||||||||||||||
| Interest Income | |||||||||||||||||||||||
| Loans | $ |
|
$ |
|
$ |
|
$ |
|
|||||||||||||||
| Investment securities |
|
|
|
|
|||||||||||||||||||
| Other |
|
|
|
|
|||||||||||||||||||
| Total interest income |
|
|
|
|
|||||||||||||||||||
| Interest Expense | |||||||||||||||||||||||
| Deposits |
|
|
|
|
|||||||||||||||||||
| Borrowed funds |
|
|
|
|
|||||||||||||||||||
| Total interest expense |
|
|
|
|
|||||||||||||||||||
| Net interest income |
|
|
|
|
|||||||||||||||||||
| Noninterest Income | |||||||||||||||||||||||
| Asset management and brokerage |
|
|
|
|
|||||||||||||||||||
| Capital markets related |
|
|
|
|
|||||||||||||||||||
| Card and cash management |
|
|
|
|
|||||||||||||||||||
| Lending and deposit services |
|
|
|
|
|||||||||||||||||||
| Residential and commercial mortgage |
|
|
|
|
|||||||||||||||||||
| Other |
|
|
|
|
|||||||||||||||||||
| Total noninterest income |
|
|
|
|
|||||||||||||||||||
| Total revenue |
|
|
|
|
|||||||||||||||||||
| Provision For (Recapture of) Credit Losses |
|
(
|
|
(
|
|||||||||||||||||||
| Noninterest Expense | |||||||||||||||||||||||
| Personnel |
|
|
|
|
|||||||||||||||||||
| Occupancy |
|
|
|
|
|||||||||||||||||||
| Equipment |
|
|
|
|
|||||||||||||||||||
| Marketing |
|
|
|
|
|||||||||||||||||||
| Other |
|
|
|
|
|||||||||||||||||||
| Total noninterest expense |
|
|
|
|
|||||||||||||||||||
| Income before income taxes and noncontrolling interests |
|
|
|
|
|||||||||||||||||||
| Income taxes |
|
|
|
|
|||||||||||||||||||
| Net income |
|
|
|
|
|||||||||||||||||||
| Less: Net income attributable to noncontrolling interests |
|
|
|
|
|||||||||||||||||||
| Preferred stock dividends |
|
|
|
|
|||||||||||||||||||
| Preferred stock discount accretion and redemptions |
|
|
|
|
|||||||||||||||||||
| Net income attributable to common shareholders | $ |
|
$ |
|
$ |
|
$ |
|
|||||||||||||||
| Earnings Per Common Share | |||||||||||||||||||||||
| Basic | $ |
|
$ |
|
$ |
|
$ |
|
|||||||||||||||
| Diluted | $ |
|
$ |
|
$ |
|
$ |
|
|||||||||||||||
| Average Common Shares Outstanding | |||||||||||||||||||||||
| Basic |
|
|
|
|
|||||||||||||||||||
| Diluted |
|
|
|
|
|||||||||||||||||||
See accompanying Notes To Consolidated Financial Statements.
44
The PNC Financial Services Group, Inc. –
Form 10-Q
CONSOLIDATED STATEMENT OF COMPREHENSIVE INCOME
THE PNC FINANCIAL SERVICES GROUP, INC.
|
Unaudited
In millions |
Three months ended
September 30 |
Nine months ended
September 30 |
|||||||||||||||||||||
| 2022 | 2021 | 2022 | 2021 | ||||||||||||||||||||
| Net income | $ |
|
$ |
|
$ |
|
$ |
|
|||||||||||||||
| Other comprehensive income (loss), before tax and net of reclassifications into Net income | |||||||||||||||||||||||
| Net change in debt securities |
(
|
(
|
(
|
(
|
|||||||||||||||||||
| Net change in cash flow hedge derivatives |
(
|
(
|
(
|
(
|
|||||||||||||||||||
| Pension and other postretirement benefit plan adjustments |
|
|
|
(
|
|||||||||||||||||||
| Net change in Other |
|
|
(
|
|
|||||||||||||||||||
| Other comprehensive income (loss), before tax and net of reclassifications into Net income |
(
|
(
|
(
|
(
|
|||||||||||||||||||
| Income tax benefit (expense) related to items of other comprehensive income |
|
|
|
|
|||||||||||||||||||
| Other comprehensive income (loss), after tax and net of reclassifications into Net income |
(
|
(
|
(
|
(
|
|||||||||||||||||||
| Comprehensive income (loss) |
(
|
|
(
|
|
|||||||||||||||||||
| Less: Comprehensive income attributable to noncontrolling interests |
|
|
|
|
|||||||||||||||||||
| Comprehensive income (loss) attributable to PNC | $ |
(
|
$ |
|
$ |
(
|
$ |
|
|||||||||||||||
See accompanying Notes To Consolidated Financial Statements.
The PNC Financial Services Group, Inc. –
Form 10-Q
45
CONSOLIDATED BALANCE SHEET
THE PNC FINANCIAL SERVICES GROUP, INC.
| Unaudited |
September 30
2022 |
December 31
2021 |
|||||||||
| In millions, except par value | |||||||||||
| Assets | |||||||||||
| Cash and due from banks | $ |
|
$ |
|
|||||||
| Interest-earning deposits with banks |
|
|
|||||||||
| Loans held for sale (a) |
|
|
|||||||||
| Investment securities – available for sale |
|
|
|||||||||
| Investment securities – held to maturity |
|
|
|||||||||
| Loans (a) |
|
|
|||||||||
| Allowance for loan and lease losses |
(
|
(
|
|||||||||
| Net loans |
|
|
|||||||||
| Equity investments |
|
|
|||||||||
| Mortgage servicing rights |
|
|
|||||||||
| Goodwill |
|
|
|||||||||
| Other (a) |
|
|
|||||||||
| Total assets | $ |
|
$ |
|
|||||||
| Liabilities | |||||||||||
| Deposits | |||||||||||
| Noninterest-bearing | $ |
|
$ |
|
|||||||
| Interest-bearing |
|
|
|||||||||
| Total deposits |
|
|
|||||||||
| Borrowed funds | |||||||||||
| Federal Home Loan Bank borrowings |
|
|
|||||||||
| Bank notes and senior debt |
|
|
|||||||||
| Subordinated debt |
|
|
|||||||||
| Other (b) |
|
|
|||||||||
| Total borrowed funds |
|
|
|||||||||
| Allowance for unfunded lending related commitments |
|
|
|||||||||
| Accrued expenses and other liabilities |
|
|
|||||||||
| Total liabilities |
|
|
|||||||||
| Equity | |||||||||||
| Preferred stock (c) |
|
|
|||||||||
|
Common stock ($
|
|
|
|||||||||
| Capital surplus |
|
|
|||||||||
| Retained earnings |
|
|
|||||||||
| Accumulated other comprehensive income (loss) |
(
|
|
|||||||||
|
Common stock held in treasury at cost:
|
(
|
(
|
|||||||||
| Total shareholders’ equity |
|
|
|||||||||
| Noncontrolling interests |
|
|
|||||||||
| Total equity |
|
|
|||||||||
| Total liabilities and equity | $ |
|
$ |
|
|||||||
(a)
Our consolidated assets included the following for which we have elected the fair value option: Loans held for sale of $
1.1
billion, Loans held for investment of $
1.3
billion and Other assets of $
0.1
billion at September 30, 2022. Comparable amounts at December 31, 2021 were $
1.9
billion, $
1.5
billion and $
0.1
billion, respectively.
(b)
Our consolidated liabilities included the following for which we have elected the fair value option: Other borrowed funds of less than $
0.1
billion and Other liabilities of $
0.2
billion at September 30, 2022. Comparable amounts at December 31, 2021 were less than $
0.1
billion and
zero
.
(c)
Par value less than $
0.5
million at each date.
See accompanying Notes To Consolidated Financial Statements.
46
The PNC Financial Services Group, Inc. –
Form 10-Q
CONSOLIDATED STATEMENT OF CASH FLOWS
THE PNC FINANCIAL SERVICES GROUP, INC.
|
Unaudited
In millions |
Nine months ended September 30 | ||||||||||||||||
| 2022 | 2021 | ||||||||||||||||
| Operating Activities | |||||||||||||||||
| Net income | $ |
|
$ |
|
|||||||||||||
| Adjustments to reconcile net income to net cash provided (used) by operating activities | |||||||||||||||||
| Provision for (recapture of) credit losses |
|
(
|
|||||||||||||||
| Depreciation and amortization |
|
|
|||||||||||||||
| Deferred income taxes (benefit) |
|
(
|
|||||||||||||||
| Net losses (gains) on sales of securities |
|
(
|
|||||||||||||||
| Changes in fair value of mortgage servicing rights |
(
|
(
|
|||||||||||||||
| Net change in | |||||||||||||||||
| Trading securities and other short-term investments |
(
|
|
|||||||||||||||
| Loans held for sale and related securitization activity |
|
(
|
|||||||||||||||
| Other assets |
(
|
(
|
|||||||||||||||
| Accrued expenses and other liabilities |
|
|
|||||||||||||||
| Other |
|
(
|
|||||||||||||||
| Net cash provided (used) by operating activities | $ |
|
$ |
|
|||||||||||||
| Investing Activities | |||||||||||||||||
| Sales | |||||||||||||||||
| Securities available for sale | $ |
|
$ |
|
|||||||||||||
| Loans |
|
|
|||||||||||||||
| Repayments/maturities | |||||||||||||||||
| Securities available for sale |
|
|
|||||||||||||||
| Securities held to maturity |
|
|
|||||||||||||||
| Purchases | |||||||||||||||||
| Securities available for sale |
(
|
(
|
|||||||||||||||
| Securities held to maturity |
(
|
(
|
|||||||||||||||
| Loans |
(
|
(
|
|||||||||||||||
| Net change in | |||||||||||||||||
| Federal funds sold and resale agreements |
(
|
(
|
|||||||||||||||
| Interest-earning deposits with banks |
|
|
|||||||||||||||
| Loans |
(
|
|
|||||||||||||||
| Net cash paid for acquisition |
(
|
||||||||||||||||
| Other |
(
|
(
|
|||||||||||||||
| Net cash provided (used) by investing activities | $ |
(
|
$ |
|
|||||||||||||
The PNC Financial Services Group, Inc. –
Form 10-Q
47
CONSOLIDATED STATEMENT OF CASH FLOWS
THE PNC FINANCIAL SERVICES GROUP, INC.
(Continued from previous page)
|
Unaudited
In millions |
Nine months ended September 30 | ||||||||||||||||
| 2022 | 2021 | ||||||||||||||||
| Financing Activities | |||||||||||||||||
| Net change in | |||||||||||||||||
| Noninterest-bearing deposits | $ |
(
|
$ |
|
|||||||||||||
| Interest-bearing deposits |
(
|
(
|
|||||||||||||||
| Federal funds purchased and repurchase agreements |
(
|
|
|||||||||||||||
| Other borrowed funds |
|
|
|||||||||||||||
| Sales/issuances | |||||||||||||||||
| Federal Home Loan Bank borrowings |
|
|
|||||||||||||||
| Bank notes and senior debt |
|
|
|||||||||||||||
| Subordinated debt |
|
|
|||||||||||||||
| Other borrowed funds |
|
|
|||||||||||||||
| Preferred stock |
|
|
|||||||||||||||
| Common and treasury stock |
|
|
|||||||||||||||
| Repayments/maturities | |||||||||||||||||
| Federal Home Loan Bank borrowings |
|
(
|
|||||||||||||||
| Bank notes and senior debt |
(
|
(
|
|||||||||||||||
| Other borrowed funds |
(
|
(
|
|||||||||||||||
| Acquisition of treasury stock |
(
|
(
|
|||||||||||||||
| Preferred stock cash dividends paid |
(
|
(
|
|||||||||||||||
| Common stock cash dividends paid |
(
|
(
|
|||||||||||||||
| Net cash provided (used) by financing activities | $ |
|
$ |
(
|
|||||||||||||
| Net Increase (Decrease) In Cash And Due From Banks And Restricted Cash | $ |
(
|
$ |
|
|||||||||||||
| Cash and due from banks and restricted cash at beginning of period |
|
|
|||||||||||||||
| Cash and due from banks and restricted cash at end of period | $ |
|
$ |
|
|||||||||||||
| Cash and due from banks and restricted cash | |||||||||||||||||
| Cash and due from banks at end of period (unrestricted cash) | $ |
|
$ |
|
|||||||||||||
| Restricted cash |
|
|
|||||||||||||||
| Cash and due from banks and restricted cash at end of period | $ |
|
$ |
|
|||||||||||||
| Supplemental Disclosures | |||||||||||||||||
| Interest paid | $ |
|
$ |
|
|||||||||||||
| Income taxes paid | $ |
|
$ |
|
|||||||||||||
| Income taxes refunded | $ |
|
$ |
|
|||||||||||||
| Leased assets obtained in exchange for new operating lease liabilities | $ |
|
$ |
|
|||||||||||||
| Non-cash Investing and Financing Items | |||||||||||||||||
| Transfer from securities available for sale to securities held to maturity (a) | $ |
|
|
||||||||||||||
| Transfer from loans to loans held for sale, net | $ |
|
$ |
|
|||||||||||||
| Transfer from loans to foreclosed assets | $ |
|
$ |
|
|||||||||||||
(a)
During the first nine months of 2022, we transferred securities from available for sale to held to maturity in non-cash transactions. The amount of $
88.6
billion includes the aggregate fair value of the securities of $
82.7
billion and aggregate net pretax unrealized losses of $
5.9
billion included in AOCI at transfer. See Note 3 Investment Securities for more detailed information on the transfers.
See accompanying Notes To Consolidated Financial Statements.
48
The PNC Financial Services Group, Inc. –
Form 10-Q
NOTES TO CONSOLIDATED FINANCIAL STATEMENTS
T
HE
PNC F
INANCIAL
S
ERVICES
G
ROUP
, I
NC
.
Unaudited
See page 99 for a glossary of certain terms and acronyms used in this Report.
B
USINESS
PNC is one of the largest diversified financial services companies in the U.S. and is headquartered in Pittsburgh, Pennsylvania.
N
OTE
1
A
CCOUNTING
P
OLICIES
Basis of Financial Statement Presentation
Our consolidated financial statements include the accounts of the parent company and its subsidiaries, most of which are wholly-owned, certain partnership interests and VIEs.
On June 1, 2021, we acquired BBVA, a U.S. financial holding company conducting its business operations primarily through its U.S. banking subsidiary, BBVA USA. Our results of operations and balance sheets for all periods presented in this Report reflect the benefit of BBVA's acquired businesses for the period since the acquisition closed on June 1, 2021. See Note 2 Acquisition Activity for additional information related to this acquisition.
We prepared these consolidated financial statements in accordance with GAAP. We have eliminated intercompany accounts and transactions. We have also reclassified certain prior year amounts to conform to the current period presentation, which did not have a material impact on our consolidated financial condition or results of operations.
In our opinion, the unaudited interim consolidated financial statements reflect all normal, recurring adjustments needed to state fairly our results for the interim periods. The results of operations for interim periods are not necessarily indicative of the results that may be expected for the full year or any other interim period.
We have also considered the impact of subsequent events on these consolidated financial statements.
When preparing these unaudited interim consolidated financial statements, we have assumed that you have read the audited consolidated financial statements included in our 2021 Form 10-K. Reference is made to Note 1 Accounting Policies in our 2021 Form 10-K for a detailed description of significant accounting policies. These interim consolidated financial statements serve to update our 2021 Form 10-K and may not include all information and Notes necessary to constitute a complete set of financial statements. There have been no significant changes to our accounting policies as disclosed in our 2021 Form 10-K.
Noninterest Income Presentation
Effective for the first quarter of 2022, PNC updated the presentation of its noninterest income categorization to be based on product and service type, and accordingly, has changed the basis of presentation of its noninterest income revenue streams to: (i) Asset management and brokerage, (ii) Capital markets related, (iii) Card and cash management, (iv) Lending and deposit services, (v) Residential and commercial mortgage and (vi) Other noninterest income. A description of each revenue stream follows:
Asset management and brokerage
includes revenue from our asset management and retail brokerage businesses. Asset management services include investment management, custody, retirement planning, family planning, trust management and retirement administration. Brokerage services offer retail customers a wide range of investment options, including mutual funds, annuities, stock, bonds and managed accounts.
Capital markets related
includes revenue from services and activities primarily related to merger and acquisition advisory, equity capital markets advisory, asset-backed financing, loan syndication, securities underwriting, credit valuation adjustments related to the derivatives portfolio and customer-related trading.
Card and cash management
includes revenue primarily from debit and credit card activities, inclusive of credit card points and rewards, treasury management services and ATM fees. Debit and credit card activities include interchange revenue and merchant
The PNC Financial Services Group, Inc. –
Form 10-Q
49
service fees. Treasury management services include cash and investment management, receivables and disbursement management, funds transfer, international payment and access to online/mobile information management and reporting.
Lending and deposit services
includes revenue primarily related to service charges on deposits, loan commitment and usage fees, the issuance of standby letters of credit, operating lease income and long-term care and insurance products.
Residential and commercial mortgage
includes the gain and loss on sale of mortgages, revenue related to our mortgage servicing responsibilities, mortgage servicing rights valuation adjustments and net gains on originations and sales of loans held for sale.
Other noninterest income
is primarily composed of private equity revenue, net securities gains and losses, activity related to our equity investment in Visa and gains and losses on asset sales.
See Note 16 Fee-based Revenue from Contracts with Customers for additional details related to these revenue streams within the scope of ASC 606 - Revenue from Contracts with Customers.
Use of Estimates
We prepared these consolidated financial statements using financial information available at the time of preparation, which requires us to make estimates and assumptions that affect the amounts reported. Our most significant estimates pertain to the ACL and our fair value measurements, including for the BBVA acquisition. Actual results may differ from the estimates and the differences may be material to the consolidated financial statements.
Recently Adopted Accounting Standards
| Accounting Standards Update | Description | Financial Statement Impact | ||||||
|
Reference Rate Reform - ASU 2020-04
Issued March 2020
Reference Rate Reform Scope - ASU 2021-01
Issued January 2021
|
• Provides optional expedients and exceptions for applying generally accepted accounting principles to contracts, hedging relationships and other transactions that reference LIBOR or another reference rate expected to be discontinued because of reference rate reform (codified in ASC 848).
• Includes optional expedients related to contract modifications that allow an entity to account for modifications (if certain criteria are met) as if the modifications were only minor (assets within the scope of ASC 310,
Receivables
), were not substantial (assets within the scope of ASC 470,
Debt
) and/or did not result in remeasurements or reclassifications (assets within the scope of ASC 842,
Leases
, and other Topics) of the existing contract.
• Includes optional expedients related to hedging relationships within the scope of ASC 815,
Derivatives & Hedging
, whereby changes to the critical terms of a hedging relationship do not require dedesignation if certain criteria are met. In addition, potential sources of ineffectiveness as a result of reference rate reform may be disregarded when performing some effectiveness assessments.
• Includes optional expedients and exceptions for contract modifications and hedge accounting that apply to derivative instruments impacted by the market-wide discounting transition.
• Guidance in these ASUs are currently effective as of March 12, 2020 through December 31, 2022. We expect the FASB to extend the relief to December 31, 2024 in a future ASU.
|
• ASU 2020-04 was adopted March 12, 2020. ASU 2021-01 was retrospectively adopted October 1, 2020.
• Refer to Note 1 Accounting Policies in the 2021 Form 10-K for more information on elections of optional expedients that occurred in 2020 and 2021.
• We did not make any additional elections for the third quarter of 2022. We expect to continue to elect various optional expedients for contract modifications and hedge relationships affected by reference rate reform through the effective date of this guidance.
|
||||||
50
The PNC Financial Services Group, Inc. –
Form 10-Q
N
OTE
2
A
CQUISITION
A
CTIVITY
Acquisition of BBVA USA Bancshares, Inc.
On June 1, 2021, PNC acquired BBVA including its U.S. banking subsidiary, BBVA USA, for $
11.5
billion in cash. PNC did not acquire the following entities as part of the acquisition: BBVA Securities, Inc., Propel Venture Partners Fund I, L.P. and BBVA Processing Services, Inc. This transaction has been accounted for as a business combination. Accordingly, the assets and liabilities from BBVA were recorded at fair value as of the acquisition date. The determination of fair value requires management to make estimates about discount rates, future expected cash flows, market conditions and other future events that are highly subjective in nature and subject to change. Fair value estimates related to the assets and liabilities from BBVA were subject to adjustment for up to one year after the closing date of the acquisition as additional information became available. Valuations subject to adjustment included, but were not limited to, loans, certain deposits, certain other assets, customer relationships and the core deposit intangibles.
On October 12, 2021, PNC converted approximately
2.6
million customers,
9,000
employees and over
600
branches across
seven
states, merging BBVA USA into PNC Bank.
PNC incurred an insignificant amount of merger and integration costs for the three month ended September 30, 2022 and $
46
million for the nine months ended September 30, 2022, in connection with the transaction. These costs are recorded as contra-revenue and expense on the Consolidated Income Statement. The integration expenses are primarily related to retail services and realty expenses. Cumulative costs through September 30, 2022 were $
851
million.
Table 34: Acquisition Consideration
| June 1, 2021 | |||||
| In millions | Fair Value | ||||
| Fair value of acquisition consideration | $ |
|
|||
| Assets | |||||
| Cash and due from banks | $ |
|
|||
| Interest-earning deposits with banks |
|
||||
| Loans held for sale |
|
||||
| Investment securities – available for sale |
|
||||
| Net loans |
|
||||
| Equity investments |
|
||||
| Mortgage servicing rights |
|
||||
| Core deposit intangibles and other intangible assets |
|
||||
| Other |
|
||||
| Total assets | $ |
|
|||
| Liabilities | |||||
| Deposits | $ |
|
|||
| Borrowed funds |
|
||||
| Accrued expenses and other liabilities |
|
||||
| Total liabilities | $ |
|
|||
| Noncontrolling interests |
|
||||
| Less: Net assets | $ |
|
|||
| Goodwill | $ |
|
|||
Goodwill of $
1.6
billion recorded in connection with the transaction resulted from the reputation, operating model and expertise of BBVA. The amount of goodwill recorded reflected the increased market share and related synergies that resulted from the acquisition, and represents the excess purchase price over the estimated fair value of the net assets from BBVA. The goodwill was allocated to each of our
three
business segments and is not deductible for income tax purposes. See Note 6 Goodwill and Mortgage Servicing Rights in Item 8 of our 2021 Form 10-K for additional information on the allocation of goodwill to the segments.
For a description of the fair value and unpaid principal balance of loans from the BBVA acquisition, as well as the methods used to determine the fair values of significant assets and liabilities, see Note 2 Acquisition and Divestiture Activity in Item 8 of our 2021 Form 10-K.
The PNC Financial Services Group, Inc. –
Form 10-Q
51
N
OTE
3
I
NVESTMENT
S
ECURITIES
Table 35: Investment Securities Summary (a)
| September 30, 2022 | December 31, 2021 | ||||||||||||||||||||||||||||||||||||||||||||||||||||
| In millions |
Amortized
Cost (b) |
Unrealized |
Fair
Value |
Amortized
Cost (b) |
Unrealized |
Fair
Value |
|||||||||||||||||||||||||||||||||||||||||||||||
| Gains | Losses | Gains | Losses | ||||||||||||||||||||||||||||||||||||||||||||||||||
| Securities Available for Sale | |||||||||||||||||||||||||||||||||||||||||||||||||||||
| U.S. Treasury and government agencies | $ |
|
$ |
|
$ |
(
|
$ |
|
$ |
|
$ |
|
$ |
(
|
$ |
|
|||||||||||||||||||||||||||||||||||||
| Residential mortgage-backed | |||||||||||||||||||||||||||||||||||||||||||||||||||||
| Agency |
|
|
(
|
|
|
|
(
|
|
|||||||||||||||||||||||||||||||||||||||||||||
| Non-agency |
|
|
(
|
|
|
|
|
||||||||||||||||||||||||||||||||||||||||||||||
| Commercial mortgage-backed | |||||||||||||||||||||||||||||||||||||||||||||||||||||
| Agency |
|
|
(
|
|
|
|
(
|
|
|||||||||||||||||||||||||||||||||||||||||||||
| Non-agency |
|
|
(
|
|
|
|
(
|
|
|||||||||||||||||||||||||||||||||||||||||||||
| Asset-backed |
|
|
(
|
|
|
|
(
|
|
|||||||||||||||||||||||||||||||||||||||||||||
| Other |
|
|
(
|
|
|
|
(
|
|
|||||||||||||||||||||||||||||||||||||||||||||
| Total securities available for sale | $ |
|
$ |
|
$ |
(
|
$ |
|
$ |
|
$ |
|
$ |
(
|
$ |
|
|||||||||||||||||||||||||||||||||||||
| Securities Held to Maturity | |||||||||||||||||||||||||||||||||||||||||||||||||||||
| U.S. Treasury and government agencies | $ |
|
$ |
|
$ |
(
|
$ |
|
$ |
|
$ |
|
$ |
|
|||||||||||||||||||||||||||||||||||||||
| Residential mortgage-backed | |||||||||||||||||||||||||||||||||||||||||||||||||||||
| Agency |
|
|
(
|
|
|||||||||||||||||||||||||||||||||||||||||||||||||
| Non-agency |
|
(
|
|
||||||||||||||||||||||||||||||||||||||||||||||||||
| Commercial mortgage-backed | |||||||||||||||||||||||||||||||||||||||||||||||||||||
| Agency |
|
(
|
|
||||||||||||||||||||||||||||||||||||||||||||||||||
| Non-agency |
|
|
(
|
|
|||||||||||||||||||||||||||||||||||||||||||||||||
| Asset-backed |
|
|
(
|
|
|||||||||||||||||||||||||||||||||||||||||||||||||
| Other |
|
|
(
|
|
|
|
$ |
(
|
|
||||||||||||||||||||||||||||||||||||||||||||
| Total securities held to maturity (c) (d) | $ |
|
$ |
|
$ |
(
|
$ |
|
$ |
|
$ |
|
$ |
(
|
$ |
|
|||||||||||||||||||||||||||||||||||||
(a) At September 30, 2022, the accrued interest associated with our held to maturity and available for sale portfolios totaled $
211
million and $
140
million, respectively. The comparable amounts at December 31, 2021 were $
5
million and $
322
million, respectively. These amounts are included in Other assets on the Consolidated Balance Sheet.
(b) Amortized cost is presented net of allowance of $
133
million for securities available for sale and $
7
million for securities held to maturity at September 30, 2022. The comparable amounts at December 31, 2021 were $
130
million and $
3
million, respectively.
(c) Credit ratings represent a primary credit quality indicator used to monitor and manage credit risk.
99
% and
86
% of our securities held to maturity were rated AAA/AA at September 30, 2022 and December 31, 2021, respectively.
The fair value of investment securities is impacted by interest rates, credit spreads, market volatility and liquidity conditions. Securities available for sale are carried at fair value with net unrealized gains and losses included in Total shareholders’ equity as AOCI, unless credit related. Net unrealized gains and losses are determined by taking the difference between the fair value of a security and its amortized cost, net of any allowance. Securities held to maturity are carried at amortized cost less any allowance. Investment securities at September 30, 2022 included $
2.0
billion of net unsettled purchases which represent non-cash investing activity, and accordingly, are not reflected on the Consolidated Statement of Cash Flows. The comparable amount for September 30, 2021 was $
2.4
billion.
In the third quarter of 2022, we transferred an additional $
4.9
billion of securities, at fair value, from available for sale to held to maturity. The securities transferred included $
3.3
billion of U.S. Treasury and government agency securities and $
1.6
billion of agency residential mortgage-backed securities. During the first nine months of 2022, we transferred securities with a fair value of $
82.7
billion from available for sale to held to maturity. The securities transferred included $
34.0
billion of U.S. Treasury and government agency securities, $
39.0
billion of agency residential mortgage-backed securities, $
6.3
billion of asset-backed securities and $
3.4
billion of other securities. The securities were reclassified at fair value at the time of the transfer and the transfers represented non-cash transactions. AOCI at September 30, 2022 included pretax unrealized losses of $
5.4
billion related to the transfers. These unrealized losses will be amortized, consistent with the amortization of the discount on these securities, over the remaining life as an adjustment of yield, resulting in no impact to net interest income or net income.
We maintain the allowance for investment securities at levels that we believe to be appropriate as of the balance sheet date to absorb expected credit losses on our portfolio. At September 30, 2022, the allowance for investment securities was $
140
million and primarily related to non-agency commercial mortgage-backed securities in the available for sale portfolio. The comparable amount at
52
The PNC Financial Services Group, Inc. –
Form 10-Q
December 31, 2021 was $
133
million. See Note 1 Accounting Policies included in Item 8 of our 2021 Form 10-K for a discussion of the methodologies used to determine the allowance for investment securities.
At September 30, 2022, AOCI included pretax losses of $
132
million from derivatives that hedged the purchase of investment securities classified as held to maturity. The losses will be accreted to interest income as an adjustment of yield on the securities.
Table 36 presents the gross unrealized losses and fair value of securities available for sale that do not have an associated allowance for investment securities at September 30, 2022 and December 31, 2021. These securities are segregated between investments that had been in a continuous unrealized loss position for less than twelve months and twelve months or more, based on the point in time that the fair value declined below the amortized cost basis. All securities included in the table have been evaluated to determine if a credit loss exists. As part of that assessment, as of September 30, 2022, we concluded that we do not intend to sell and believe we will not be required to sell these securities prior to recovery of the amortized cost basis.
Table 36: Gross Unrealized Loss and Fair Value of Securities Available for Sale Without an Allowance for Credit Losses
|
Unrealized loss position
less than 12 months |
Unrealized loss position
12 months or more |
Total | ||||||||||||||||||||||||||||||||||||
| In millions |
Unrealized
Loss |
Fair
Value |
Unrealized
Loss |
Fair
Value |
Unrealized
Loss |
Fair
Value |
||||||||||||||||||||||||||||||||
| September 30, 2022 | ||||||||||||||||||||||||||||||||||||||
| U.S. Treasury and government agencies | $ |
(
|
$ |
|
$ |
(
|
$ |
|
$ |
(
|
$ |
|
||||||||||||||||||||||||||
| Residential mortgage-backed | ||||||||||||||||||||||||||||||||||||||
| Agency |
(
|
|
(
|
|
(
|
|
||||||||||||||||||||||||||||||||
| Non-agency |
(
|
|
(
|
|
(
|
|
||||||||||||||||||||||||||||||||
| Commercial mortgage-backed | ||||||||||||||||||||||||||||||||||||||
| Agency |
(
|
|
(
|
|
(
|
|
||||||||||||||||||||||||||||||||
| Non-agency |
(
|
|
(
|
|
(
|
|
||||||||||||||||||||||||||||||||
| Asset-backed |
(
|
|
(
|
|
||||||||||||||||||||||||||||||||||
| Other |
(
|
|
(
|
|
(
|
|
||||||||||||||||||||||||||||||||
| Total securities available for sale | $ |
(
|
$ |
|
$ |
(
|
$ |
|
$ |
(
|
$ |
|
||||||||||||||||||||||||||
| December 31, 2021 | ||||||||||||||||||||||||||||||||||||||
| U.S. Treasury and government agencies | $ |
(
|
$ |
|
$ |
(
|
$ |
|
||||||||||||||||||||||||||||||
| Agency residential mortgage-backed |
(
|
|
$ |
(
|
$ |
|
(
|
|
||||||||||||||||||||||||||||||
| Commercial mortgage-backed | ||||||||||||||||||||||||||||||||||||||
| Agency |
(
|
|
(
|
|
(
|
|
||||||||||||||||||||||||||||||||
| Non-agency |
(
|
|
(
|
|
(
|
|
||||||||||||||||||||||||||||||||
| Asset-backed |
(
|
|
(
|
|
(
|
|
||||||||||||||||||||||||||||||||
| Other |
(
|
|
(
|
|
||||||||||||||||||||||||||||||||||
| Total securities available for sale | $ |
(
|
$ |
|
$ |
(
|
$ |
|
$ |
(
|
$ |
|
||||||||||||||||||||||||||
Information relating to gross realized securities gains and losses from the sales of securities is set forth in the following table:
Table 37: Gains (Losses) on Sales of Securities Available for Sale
|
Nine months ended September 30
In millions |
Gross Gains | Gross Losses | Net Gains (Losses) | Tax Expense (Benefit) | |||||||||||||
| 2022 | $ |
|
$ |
(
|
$ |
(
|
$ |
(
|
|||||||||
| 2021 | $ |
|
$ |
(
|
$ |
|
$ |
|
|||||||||
The PNC Financial Services Group, Inc. –
Form 10-Q
53
The following table presents, by remaining contractual maturity, the amortized cost, fair value and weighted-average yield of debt securities at September 30, 2022:
Table 38: Contractual Maturity of Debt Securities
|
September 30, 2022
Dollars in millions |
1 Year or Less |
After 1 Year
through 5 Years |
After 5 Years
through 10 Years |
After 10
Years |
Total | ||||||||||||||||||||||||||||||
| Securities Available for Sale | |||||||||||||||||||||||||||||||||||
| U.S. Treasury and government agencies | $ |
|
$ |
|
$ |
|
$ |
|
$ |
|
|||||||||||||||||||||||||
| Residential mortgage-backed | |||||||||||||||||||||||||||||||||||
| Agency |
|
|
|
|
|
||||||||||||||||||||||||||||||
| Non-agency |
|
|
|
||||||||||||||||||||||||||||||||
| Commercial mortgage-backed | |||||||||||||||||||||||||||||||||||
| Agency |
|
|
|
|
|
||||||||||||||||||||||||||||||
| Non-agency |
|
|
|
|
|||||||||||||||||||||||||||||||
| Asset-backed |
|
|
|
||||||||||||||||||||||||||||||||
| Other |
|
|
|
|
|
||||||||||||||||||||||||||||||
| Total securities available for sale at amortized cost | $ |
|
$ |
|
$ |
|
$ |
|
$ |
|
|||||||||||||||||||||||||
| Fair value | $ |
|
$ |
|
$ |
|
$ |
|
$ |
|
|||||||||||||||||||||||||
| Weighted-average yield, GAAP basis (a) |
|
% |
|
% |
|
% |
|
% |
|
% | |||||||||||||||||||||||||
| Securities Held to Maturity | |||||||||||||||||||||||||||||||||||
| U.S. Treasury and government agencies | $ |
|
$ |
|
$ |
|
$ |
|
$ |
|
|||||||||||||||||||||||||
| Residential mortgage-backed | |||||||||||||||||||||||||||||||||||
| Agency |
|
|
|
|
|||||||||||||||||||||||||||||||
| Non-agency |
|
|
|||||||||||||||||||||||||||||||||
| Commercial mortgage-backed | |||||||||||||||||||||||||||||||||||
| Agency |
|
|
|
||||||||||||||||||||||||||||||||
| Non-agency |
|
|
|
|
|||||||||||||||||||||||||||||||
| Asset-backed |
|
|
|
|
|
||||||||||||||||||||||||||||||
| Other |
|
|
|
|
|
||||||||||||||||||||||||||||||
| Total securities held to maturity at amortized cost | $ |
|
$ |
|
$ |
|
$ |
|
$ |
|
|||||||||||||||||||||||||
| Fair value | $ |
|
$ |
|
$ |
|
$ |
|
$ |
|
|||||||||||||||||||||||||
| Weighted-average yield, GAAP basis (a) |
|
% |
|
% |
|
% |
|
% |
|
% | |||||||||||||||||||||||||
(a)
Weighted-average yields are based on amortized cost with effective yields weighted for the contractual maturity of each security. Actual maturities and yields may differ as certain securities may be prepaid.
At September 30, 2022, there were no securities of a single issuer, other than FNMA and FHLMC, that exceeded 10% of Total shareholders’ equity. The FNMA and FHLMC investments had a total amortized cost of $
38.3
billion and $
30.7
billion and fair value of $
34.6
billion and $
27.9
billion, respectively.
The following table presents the fair value of securities that have been either pledged to or accepted from others to collateralize outstanding borrowings:
Table 39: Fair Value of Securities Pledged and Accepted as Collateral
| In millions |
September 30
2022 |
December 31
2021 |
||||||
| Pledged to others | $ |
|
$ |
|
||||
| Accepted from others: | ||||||||
| Permitted by contract or custom to sell or repledge | $ |
|
$ |
|
||||
| Permitted amount repledged to others | $ |
|
$ |
|
||||
54
The PNC Financial Services Group, Inc. –
Form 10-Q
N
OTE
4
L
OANS
A
ND
R
ELATED
A
LLOWANCE
F
OR
C
REDIT
L
OSSES
Loan Portfolio
Our loan portfolio consists of
two
portfolio segments – Commercial and Consumer. Each of these segments comprises multiple loan classes. Classes are characterized by similarities in risk attributes and the manner in which we monitor and assess credit risk.
| Commercial | Consumer | |||||||
|
•
Commercial and industrial
|
• Residential real estate | |||||||
|
•
Commercial real estate
|
• Home equity | |||||||
|
•
Equipment lease financing
|
• Automobile | |||||||
| • Credit card | ||||||||
| • Education | ||||||||
| • Other consumer | ||||||||
See Note 1 Accounting Policies included in Item 8 of our 2021 Form 10-K for additional information on our loan related policies.
Credit Quality
We closely monitor economic conditions and loan performance trends to manage and evaluate our exposure to credit risk within the loan portfolio based on our defined loan classes. In doing so, we use several credit quality indicators, including trends in delinquency rates, nonperforming status, analysis of PD and LGD ratings, updated credit scores and originated and updated LTV ratios.
The measurement of delinquency status is based on the contractual terms of each loan. Loans that are 30 days or more past due in terms of payment are considered delinquent. Loan delinquencies include government insured or guaranteed loans, loans accounted for under the fair value option and PCD loans.
Table 40 presents the composition and delinquency status of our loan portfolio at September 30, 2022 and December 31, 2021. We manage credit risk based on the risk profile of the borrower, repayment sources, underlying collateral and other support given current events, economic conditions and expectations. We refine our practices to meet the changing environment resulting from rising inflation levels, supply chain disruptions, higher rates, and secular changes fostered by the COVID-19 pandemic. To mitigate losses and enhance customer support, we have customer assistance, loan modification and collection programs that align with the CARES Act and subsequent interagency guidance. As a result, under the CARES Act credit reporting rules, certain loans modified due to COVID-19 related hardships are not being reported as past due as of September 30, 2022 and December 31, 2021 based on the contractual terms of the loan, even where borrowers may not be making payments on their loans during the modification period.
The PNC Financial Services Group, Inc. –
Form 10-Q
55
Table 40: Analysis of Loan Portfolio (a) (b)
| Accruing | ||||||||||||||||||||||||||||||||
| Dollars in millions |
Current or Less
Than 30 Days Past Due |
30-59
Days Past Due |
60-89
Days Past Due |
90 Days
Or More Past Due |
Total
Past Due (c) |
Nonperforming
Loans |
Fair Value
Option Nonaccrual Loans (d) |
Total Loans
(e)(f) |
||||||||||||||||||||||||
| September 30, 2022 | ||||||||||||||||||||||||||||||||
| Commercial | ||||||||||||||||||||||||||||||||
| Commercial and industrial | $ |
|
$ |
|
$ |
|
$ |
|
$ |
|
$ |
|
$ |
|
||||||||||||||||||
| Commercial real estate |
|
|
|
|
|
|
|
|||||||||||||||||||||||||
| Equipment lease financing |
|
|
|
|
|
|
||||||||||||||||||||||||||
| Total commercial |
|
|
|
|
|
|
|
|||||||||||||||||||||||||
| Consumer | ||||||||||||||||||||||||||||||||
| Residential real estate |
|
|
|
|
|
(c) |
|
$ |
|
|
||||||||||||||||||||||
| Home equity |
|
|
|
|
|
|
|
|||||||||||||||||||||||||
|
Automobile
|
|
|
|
|
|
|
|
|||||||||||||||||||||||||
| Credit card |
|
|
|
|
|
|
|
|||||||||||||||||||||||||
|
Education
|
|
|
|
|
|
(c) |
|
|||||||||||||||||||||||||
|
Other consumer
|
|
|
|
|
|
|
|
|||||||||||||||||||||||||
| Total consumer |
|
|
|
|
|
|
|
|
||||||||||||||||||||||||
| Total | $ |
|
$ |
|
$ |
|
$ |
|
$ |
|
$ |
|
$ |
|
$ |
|
||||||||||||||||
| Percentage of total loans |
|
% |
|
% |
|
% |
|
% |
|
% |
|
% |
|
% |
|
% | ||||||||||||||||
| December 31, 2021 | ||||||||||||||||||||||||||||||||
| Commercial | ||||||||||||||||||||||||||||||||
| Commercial and industrial | $ |
|
$ |
|
$ |
|
$ |
|
$ |
|
$ |
|
$ |
|
||||||||||||||||||
| Commercial real estate |
|
|
|
|
|
|
|
|||||||||||||||||||||||||
| Equipment lease financing |
|
|
|
|
|
|
||||||||||||||||||||||||||
| Total commercial |
|
|
|
|
|
|
|
|||||||||||||||||||||||||
| Consumer | ||||||||||||||||||||||||||||||||
| Residential real estate |
|
|
|
|
|
(c) |
|
$ |
|
|
||||||||||||||||||||||
| Home equity |
|
|
|
|
|
|
|
|||||||||||||||||||||||||
|
Automobile
|
|
|
|
|
|
|
|
|||||||||||||||||||||||||
| Credit card |
|
|
|
|
|
|
|
|||||||||||||||||||||||||
|
Education
|
|
|
|
|
|
(c) |
|
|||||||||||||||||||||||||
|
Other consumer
|
|
|
|
|
|
|
|
|||||||||||||||||||||||||
| Total consumer |
|
|
|
|
|
|
|
|
||||||||||||||||||||||||
| Total | $ |
|
$ |
|
$ |
|
$ |
|
$ |
|
$ |
|
$ |
|
$ |
|
||||||||||||||||
| Percentage of total loans |
|
% |
|
% |
|
% |
|
% |
|
% |
|
% |
|
% |
|
% | ||||||||||||||||
(a)
Amounts in table represent loans held for investment and do not include any associated ALLL.
(b)
The accrued interest associated with our loan portfolio totaled $
1.0
billion and $
0.7
billion at September 30, 2022 and December 31, 2021, respectively. These amounts are included in Other assets on the Consolidated Balance Sheet.
(c)
Past due loan amounts include government insured or guaranteed Residential real estate loans and Education loans totaling $
0.3
billion and $
0.1
billion at September 30, 2022. Comparable amounts at December 31, 2021 were $
0.4
billion and $
0.1
billion.
(d)
Consumer loans accounted for under the fair value option for which we do not expect to collect substantially all principal and interest are subject to nonaccrual accounting and classification upon meeting any of our nonaccrual policies. Given that these loans are not accounted for at amortized cost, these loans have been excluded from the nonperforming loan population.
(e)
Includes unearned income, unamortized deferred fees and costs on originated loans and premiums or discounts on purchased loans totaling $
0.7
billion at both September 30, 2022 and December 31, 2021.
(f)
Collateral dependent loans totaled $
1.3
billion and $
1.7
billion at September 30, 2022 and December 31, 2021, respectively.
At September 30, 2022, we pledged $
26.0
billion of commercial and other loans to the Federal Reserve Bank and $
90.7
billion of residential real estate and other loans to the FHLB as collateral for the ability to borrow, if necessary. The comparable amounts at December 31, 2021 were $
25.7
billion and $
66.2
billion, respectively. Amounts pledged reflect the unpaid principal balances.
Nonperforming Assets
Nonperforming assets include nonperforming loans and leases, OREO and foreclosed assets. Nonperforming loans are those loans accounted for at amortized cost whose credit quality has deteriorated to the extent that full collection of contractual principal and interest is not probable and include nonperforming TDRs and PCD loans. Interest income is not recognized on these loans. Loans accounted for under the fair value option are reported as performing loans; however, when nonaccrual criteria is met, interest income is not recognized on these loans. Additionally, certain government insured or guaranteed loans for which we expect to collect
56
The PNC Financial Services Group, Inc. –
Form 10-Q
The following table presents our nonperforming assets as of September 30, 2022 and December 31, 2021, respectively:
Table 41: Nonperforming Assets
| Dollars in millions |
September 30
2022 |
December 31
2021 |
|||||||||||||||
| Nonperforming loans | |||||||||||||||||
| Commercial | $ |
|
$ |
|
|||||||||||||
| Consumer (a) |
|
|
|||||||||||||||
| Total nonperforming loans (b) |
|
|
|||||||||||||||
| OREO and foreclosed assets |
|
|
|||||||||||||||
| Total nonperforming assets | $ |
|
$ |
|
|||||||||||||
| Nonperforming loans to total loans |
|
% |
|
% | |||||||||||||
| Nonperforming assets to total loans, OREO and foreclosed assets |
|
% |
|
% | |||||||||||||
| Nonperforming assets to total assets |
|
% |
|
% | |||||||||||||
(a)
Excludes most unsecured consumer loans and lines of credit, which are charged off after
120
to
180
days past due and are not placed on nonperforming status.
(b)
Nonperforming loans for which there is no related ALLL totaled $
0.9
billion at September 30, 2022 and primarily include loans with a fair value of collateral that exceeds the amortized cost basis. The comparable amount at December 31, 2021 was $
1.0
billion.
Nonperforming loans include certain loans whose terms have been restructured in a manner that grants a concession to a borrower experiencing financial difficulties. In accordance with applicable accounting guidance, these loans are considered TDRs. See Note 1 Accounting Policies included in Item 8 of our 2021 Form 10-K and the Troubled Debt Restructurings section of this Note 4 for additional information on TDRs.
Total nonperforming loans in Table 41 include TDRs of $
0.7
billion and $
1.0
billion at September 30, 2022 and December 31, 2021, respectively. TDRs that are performing, including consumer credit card TDR loans, are excluded from nonperforming loans and totaled $
0.7
billion and $
0.6
billion at September 30, 2022 and December 31, 2021, respectively.
Additional Credit Quality Indicators by Loan Class
Commercial Loan Classes
See Note 4 Loans and Related Allowance for Credit Losses included in Item 8 of our 2021 Form 10-K for additional information related to these loan classes, including discussion around the credit quality indicators that we use to monitor and manage the credit risk associated with each loan class.
The PNC Financial Services Group, Inc. –
Form 10-Q
57
The following table presents credit quality indicators for the commercial loan classes:
Table 42: Commercial Credit Quality Indicators (a)
| Term Loans by Origination Year | |||||||||||||||||||||||||||||
|
September 30, 2022
In millions
|
2022 | 2021 | 2020 | 2019 | 2018 | Prior | Revolving Loans | Revolving Loans Converted to Term |
Total
Loans |
||||||||||||||||||||
| Commercial and industrial | |||||||||||||||||||||||||||||
| Pass Rated | $ |
|
$ |
|
$ |
|
$ |
|
$ |
|
$ |
|
$ |
|
$ |
|
$ |
|
|||||||||||
| Criticized |
|
|
|
|
|
|
|
|
|
||||||||||||||||||||
| Total commercial and industrial |
|
|
|
|
|
|
|
|
|
||||||||||||||||||||
| Commercial real estate | |||||||||||||||||||||||||||||
| Pass Rated |
|
|
|
|
|
|
|
|
|||||||||||||||||||||
| Criticized |
|
|
|
|
|
|
|
|
|||||||||||||||||||||
| Total commercial real estate |
|
|
|
|
|
|
|
|
|||||||||||||||||||||
| Equipment lease financing | |||||||||||||||||||||||||||||
| Pass Rated |
|
|
|
|
|
|
|
||||||||||||||||||||||
| Criticized |
|
|
|
|
|
|
|
||||||||||||||||||||||
| Total equipment lease financing |
|
|
|
|
|
|
|
||||||||||||||||||||||
| Total commercial | $ |
|
$ |
|
$ |
|
$ |
|
$ |
|
$ |
|
$ |
|
$ |
|
$ |
|
|||||||||||
| Term Loans by Origination Year | |||||||||||||||||||||||||||||
|
December 31, 2021
In millions
|
2021 | 2020 | 2019 | 2018 | 2017 | Prior | Revolving Loans | Revolving Loans Converted to Term |
Total
Loans |
||||||||||||||||||||
| Commercial and industrial | |||||||||||||||||||||||||||||
| Pass Rated | $ |
|
$ |
|
$ |
|
$ |
|
$ |
|
$ |
|
$ |
|
$ |
|
$ |
|
|||||||||||
| Criticized |
|
|
|
|
|
|
|
|
|
||||||||||||||||||||
| Total commercial and industrial |
|
|
|
|
|
|
|
|
|
||||||||||||||||||||
| Commercial real estate | |||||||||||||||||||||||||||||
| Pass Rated |
|
|
|
|
|
|
|
|
|||||||||||||||||||||
| Criticized |
|
|
|
|
|
|
|
|
|||||||||||||||||||||
|
Total commercial real estate
|
|
|
|
|
|
|
|
|
|||||||||||||||||||||
|
Equipment lease financing
|
|||||||||||||||||||||||||||||
| Pass Rated |
|
|
|
|
|
|
|
||||||||||||||||||||||
| Criticized |
|
|
|
|
|
|
|
||||||||||||||||||||||
|
Total equipment lease financing
|
|
|
|
|
|
|
|
||||||||||||||||||||||
| Total commercial | $ |
|
$ |
|
$ |
|
$ |
|
$ |
|
$ |
|
$ |
|
$ |
|
$ |
|
|||||||||||
(a)
Loans in our commercial portfolio are classified as Pass Rated or Criticized based on the regulatory definitions, which are driven by the PD and LGD ratings that we assign. The Criticized classification includes loans that were rated special mention, substandard or doubtful as of September 30, 2022 and December 31, 2021.
Consumer Loan Classes
See Note 4 Loans and Related Allowance for Credit Losses included in Item 8 of our 2021 Form 10-K for additional information related to these loan classes, including discussion around the credit quality indicators that we use to monitor and manage the credit risk
associated with each loan class.
58
The PNC Financial Services Group, Inc. –
Form 10-Q
Residential Real Estate and Home Equity
The following table presents credit quality indicators for the residential real estate and home equity loan classes:
Table 43: Credit Quality Indicators for Residential Real Estate and Home Equity Loan Classes
| Term Loans by Origination Year | |||||||||||||||||||||||||||||
|
September 30, 2022
In millions
|
2022 | 2021 | 2020 | 2019 | 2018 | Prior | Revolving Loans | Revolving Loans Converted to Term | Total Loans | ||||||||||||||||||||
| Residential real estate | |||||||||||||||||||||||||||||
| Current estimated LTV ratios | |||||||||||||||||||||||||||||
| Greater than 100% | $ |
|
$ |
|
$ |
|
$ |
|
$ |
|
$ |
|
|||||||||||||||||
| Greater than or equal to 80% to 100% | $ |
|
|
|
|
|
|
|
|||||||||||||||||||||
| Less than 80% |
|
|
|
|
|
|
|
||||||||||||||||||||||
| No LTV available |
|
|
|
|
|||||||||||||||||||||||||
| Government insured or guaranteed loans |
|
|
|
|
|
|
|
||||||||||||||||||||||
| Total residential real estate | $ |
|
$ |
|
$ |
|
$ |
|
$ |
|
$ |
|
$ |
|
|||||||||||||||
| Updated FICO scores | |||||||||||||||||||||||||||||
| Greater than or equal to 780 | $ |
|
$ |
|
$ |
|
$ |
|
$ |
|
$ |
|
$ |
|
|||||||||||||||
| 720 to 779 |
|
|
|
|
|
|
|
||||||||||||||||||||||
| 660 to 719 |
|
|
|
|
|
|
|
||||||||||||||||||||||
| Less than 660 |
|
|
|
|
|
|
|
||||||||||||||||||||||
| No FICO score available |
|
|
|
|
|
|
|
||||||||||||||||||||||
| Government insured or guaranteed loans |
|
|
|
|
|
|
|
||||||||||||||||||||||
| Total residential real estate | $ |
|
$ |
|
$ |
|
$ |
|
$ |
|
$ |
|
$ |
|
|||||||||||||||
| Home equity | |||||||||||||||||||||||||||||
| Current estimated LTV ratios | |||||||||||||||||||||||||||||
| Greater than 100% | $ |
|
$ |
|
$ |
|
$ |
|
$ |
|
$ |
|
$ |
|
$ |
|
|||||||||||||
| Greater than or equal to 80% to 100% |
|
|
|
|
|
|
|
|
|||||||||||||||||||||
| Less than 80% |
|
|
|
|
|
|
|
|
|||||||||||||||||||||
| Total home equity | $ |
|
$ |
|
$ |
|
$ |
|
$ |
|
$ |
|
$ |
|
$ |
|
|||||||||||||
| Updated FICO scores | |||||||||||||||||||||||||||||
| Greater than or equal to 780 | $ |
|
$ |
|
$ |
|
$ |
|
$ |
|
$ |
|
$ |
|
$ |
|
|||||||||||||
| 720 to 779 |
|
|
|
|
|
|
|
|
|||||||||||||||||||||
| 660 to 719 |
|
|
|
|
|
|
|
|
|||||||||||||||||||||
| Less than 660 |
|
|
|
|
|
|
|
|
|||||||||||||||||||||
| No FICO score available |
|
|
|
|
|
|
|
|
|||||||||||||||||||||
| Total home equity | $ |
|
$ |
|
$ |
|
$ |
|
$ |
|
$ |
|
$ |
|
$ |
|
|||||||||||||
The PNC Financial Services Group, Inc. –
Form 10-Q
59
| (Continued from previous page) | Term Loans by Origination Year | ||||||||||||||||||||||||||||
|
December 31, 2021
In millions
|
2021 | 2020 | 2019 | 2018 | 2017 | Prior | Revolving Loans | Revolving Loans Converted to Term | Total Loans | ||||||||||||||||||||
| Residential real estate | |||||||||||||||||||||||||||||
| Current estimated LTV ratios | |||||||||||||||||||||||||||||
| Greater than 100% | $ |
|
$ |
|
$ |
|
$ |
|
$ |
|
$ |
|
$ |
|
|||||||||||||||
| Greater than or equal to 80% to 100% |
|
|
|
|
|
|
|
||||||||||||||||||||||
| Less than 80% |
|
|
|
|
|
|
|
||||||||||||||||||||||
| No LTV available |
|
|
|
|
|
|
|||||||||||||||||||||||
| Government insured or guaranteed loans |
|
|
|
|
|
|
|
||||||||||||||||||||||
| Total residential real estate | $ |
|
$ |
|
$ |
|
$ |
|
$ |
|
$ |
|
$ |
|
|||||||||||||||
| Updated FICO scores | |||||||||||||||||||||||||||||
| Greater than or equal to 780 | $ |
|
$ |
|
$ |
|
$ |
|
$ |
|
$ |
|
$ |
|
|||||||||||||||
| 720 to 779 |
|
|
|
|
|
|
|
||||||||||||||||||||||
| 660 to 719 |
|
|
|
|
|
|
|
||||||||||||||||||||||
| Less than 660 |
|
|
|
|
|
|
|
||||||||||||||||||||||
| No FICO score available |
|
|
|
|
|
|
|
||||||||||||||||||||||
| Government insured or guaranteed loans |
|
|
|
|
|
|
|
||||||||||||||||||||||
| Total residential real estate | $ |
|
$ |
|
$ |
|
$ |
|
$ |
|
$ |
|
$ |
|
|||||||||||||||
| Home equity | |||||||||||||||||||||||||||||
| Current estimated LTV ratios | |||||||||||||||||||||||||||||
| Greater than 100% | $ |
|
$ |
|
$ |
|
$ |
|
$ |
|
$ |
|
$ |
|
$ |
|
$ |
|
|||||||||||
| Greater than or equal to 80% to 100% |
|
|
|
|
|
|
|
|
|
||||||||||||||||||||
| Less than 80% |
|
|
|
|
|
|
|
|
|
||||||||||||||||||||
| Total home equity | $ |
|
$ |
|
$ |
|
$ |
|
$ |
|
$ |
|
$ |
|
$ |
|
$ |
|
|||||||||||
| Updated FICO scores | |||||||||||||||||||||||||||||
| Greater than or equal to 780 | $ |
|
$ |
|
$ |
|
$ |
|
$ |
|
$ |
|
$ |
|
$ |
|
$ |
|
|||||||||||
| 720 to 779 |
|
|
|
|
|
|
|
|
|
||||||||||||||||||||
| 660 to 719 |
|
|
|
|
|
|
|
|
|
||||||||||||||||||||
| Less than 660 |
|
|
|
|
|
|
|
|
|
||||||||||||||||||||
| No FICO score available |
|
|
|
|
|
|
|
|
|||||||||||||||||||||
| Total home equity | $ |
|
$ |
|
$ |
|
$ |
|
$ |
|
$ |
|
$ |
|
$ |
|
$ |
|
|||||||||||
60
The PNC Financial Services Group, Inc. –
Form 10-Q
Automobile, Credit Card, Education and Other Consumer
The following table presents credit quality indicators for the automobile, credit card, education and other consumer loan classes:
Table 44: Credit Quality Indicators for Automobile, Credit Card, Education and Other Consumer Loan Classes
| Term Loans by Origination Year | |||||||||||||||||||||||||||||
|
September 30, 2022
In millions
|
2022 | 2021 | 2020 | 2019 | 2018 | Prior | Revolving Loans | Revolving Loans Converted to Term | Total Loans | ||||||||||||||||||||
| Updated FICO Scores | |||||||||||||||||||||||||||||
| Automobile | |||||||||||||||||||||||||||||
| FICO score greater than or equal to 780 | $ |
|
$ |
|
$ |
|
$ |
|
$ |
|
$ |
|
$ |
|
|||||||||||||||
| 720 to 779 |
|
|
|
|
|
|
|
||||||||||||||||||||||
| 660 to 719 |
|
|
|
|
|
|
|
||||||||||||||||||||||
| Less than 660 |
|
|
|
|
|
|
|
||||||||||||||||||||||
| Total automobile | $ |
|
$ |
|
$ |
|
$ |
|
$ |
|
$ |
|
$ |
|
|||||||||||||||
| Credit card | |||||||||||||||||||||||||||||
| FICO score greater than or equal to 780 | $ |
|
$ |
|
$ |
|
|||||||||||||||||||||||
| 720 to 779 |
|
|
|
||||||||||||||||||||||||||
| 660 to 719 |
|
|
|
||||||||||||||||||||||||||
| Less than 660 |
|
|
|
||||||||||||||||||||||||||
| No FICO score available or required (a) |
|
|
|
||||||||||||||||||||||||||
| Total credit card | $ |
|
$ |
|
$ |
|
|||||||||||||||||||||||
| Education | |||||||||||||||||||||||||||||
| FICO score greater than or equal to 780 | $ |
|
$ |
|
$ |
|
$ |
|
$ |
|
$ |
|
$ |
|
|||||||||||||||
| 720 to 779 |
|
|
|
|
|
|
|
||||||||||||||||||||||
| 660 to 719 |
|
|
|
|
|
|
|
||||||||||||||||||||||
| Less than 660 |
|
|
|
|
|
|
|
||||||||||||||||||||||
| No FICO score available or required (a) |
|
|
|
|
|
|
|
||||||||||||||||||||||
| Education loans using FICO credit metric |
|
|
|
|
|
|
|
||||||||||||||||||||||
| Other internal credit metrics |
|
|
|||||||||||||||||||||||||||
| Total education | $ |
|
$ |
|
$ |
|
$ |
|
$ |
|
$ |
|
$ |
|
|||||||||||||||
| Other consumer | |||||||||||||||||||||||||||||
| FICO score greater than or equal to 780 | $ |
|
$ |
|
$ |
|
$ |
|
$ |
|
$ |
|
$ |
|
$ |
|
$ |
|
|||||||||||
| 720 to 779 |
|
|
|
|
|
|
|
|
|
||||||||||||||||||||
| 660 to 719 |
|
|
|
|
|
|
|
|
|
||||||||||||||||||||
| Less than 660 |
|
|
|
|
|
|
|
|
|
||||||||||||||||||||
| Other consumer loans using FICO credit metric |
|
|
|
|
|
|
|
|
|
||||||||||||||||||||
| Other internal credit metrics |
|
|
|
|
|
|
|
|
|
||||||||||||||||||||
| Total other consumer | $ |
|
$ |
|
$ |
|
$ |
|
$ |
|
$ |
|
$ |
|
$ |
|
$ |
|
|||||||||||
The PNC Financial Services Group, Inc. –
Form 10-Q
61
| (Continued from previous page) | Term Loans by Origination Year | ||||||||||||||||||||||||||||
|
December 31, 2021
In millions
|
2021 | 2020 | 2019 | 2018 | 2017 | Prior | Revolving Loans | Revolving Loans Converted to Term | Total Loans | ||||||||||||||||||||
| Updated FICO Scores | |||||||||||||||||||||||||||||
| Automobile | |||||||||||||||||||||||||||||
| FICO score greater than or equal to 780 | $ |
|
$ |
|
$ |
|
$ |
|
$ |
|
$ |
|
$ |
|
|||||||||||||||
| 720 to 779 |
|
|
|
|
|
|
|
||||||||||||||||||||||
| 660 to 719 |
|
|
|
|
|
|
|
||||||||||||||||||||||
| Less than 660 |
|
|
|
|
|
|
|
||||||||||||||||||||||
| Total automobile | $ |
|
$ |
|
$ |
|
$ |
|
$ |
|
$ |
|
$ |
|
|||||||||||||||
| Credit card | |||||||||||||||||||||||||||||
| FICO score greater than or equal to 780 | $ |
|
$ |
|
$ |
|
|||||||||||||||||||||||
| 720 to 779 |
|
|
|
||||||||||||||||||||||||||
| 660 to 719 |
|
|
|
||||||||||||||||||||||||||
| Less than 660 |
|
|
|
||||||||||||||||||||||||||
| No FICO score available or required (a) |
|
|
|
||||||||||||||||||||||||||
| Total credit card | $ |
|
$ |
|
$ |
|
|||||||||||||||||||||||
| Education | |||||||||||||||||||||||||||||
| FICO score greater than or equal to 780 | $ |
|
$ |
|
$ |
|
$ |
|
$ |
|
$ |
|
$ |
|
|||||||||||||||
| 720 to 779 |
|
|
|
|
|
|
|
||||||||||||||||||||||
| 660 to 719 |
|
|
|
|
|
|
|
||||||||||||||||||||||
| Less than 660 |
|
|
|
|
|
|
|
||||||||||||||||||||||
| No FICO score available or required (a) |
|
|
|
|
|
|
|||||||||||||||||||||||
| Education loans using FICO credit metric |
|
|
|
|
|
|
|
||||||||||||||||||||||
| Other internal credit metrics |
|
|
|||||||||||||||||||||||||||
| Total education | $ |
|
$ |
|
$ |
|
$ |
|
$ |
|
$ |
|
$ |
|
|||||||||||||||
| Other consumer | |||||||||||||||||||||||||||||
| FICO score greater than or equal to 780 | $ |
|
$ |
|
$ |
|
$ |
|
$ |
|
$ |
|
$ |
|
$ |
|
$ |
|
|||||||||||
| 720 to 779 |
|
|
|
|
|
|
|
|
|||||||||||||||||||||
| 660 to 719 |
|
|
|
|
|
|
|
|
|||||||||||||||||||||
| Less than 660 |
|
|
|
|
|
|
|
|
|
||||||||||||||||||||
| Other consumer loans using FICO credit metric |
|
|
|
|
|
|
|
|
|
||||||||||||||||||||
| Other internal credit metrics |
|
|
|
|
|
|
|
|
|
||||||||||||||||||||
| Total other consumer | $ |
|
$ |
|
$ |
|
$ |
|
$ |
|
$ |
|
$ |
|
$ |
|
$ |
|
|||||||||||
(a)
Loans with no FICO score available or required generally refers to new accounts issued to borrowers with limited credit history, accounts for which we cannot obtain an updated FICO score (
e.g.
, recent profile changes), cards issued with a business name and/or cards secured by collateral. Management proactively assesses the risk and size of this loan category and, when necessary, takes actions to mitigate the credit risk.
62
The PNC Financial Services Group, Inc. –
Form 10-Q
Troubled Debt Restructurings
Table 45 quantifies the number of loans that were classified as TDRs as well as the change in the loans’ balance as a result of becoming a TDR during the three and nine months ended September 30, 2022 and September 30, 2021. Additionally, the table provides information about the types of TDR concessions. See Note 1 Accounting Policies and Note 4 Loans and Related Allowance for Credit Losses included in Item 8 of our 2021 Form 10-K for additional discussion of TDRs.
Table 45: Financial Impact and TDRs by Concession Type (a)
|
Pre-TDR
Amortized Cost Basis (b) |
Post-TDR Amortized Cost Basis (c) | ||||||||||||||||||||||||||||||||||||||||
|
During the three months ended September 30, 2022
Dollars in millions
|
Number
of Loans |
Principal
Forgiveness |
Rate
Reduction |
Other | Total | ||||||||||||||||||||||||||||||||||||
| Commercial |
|
$ |
|
$ |
|
$ |
|
$ |
|
||||||||||||||||||||||||||||||||
| Consumer |
|
|
|
|
|
||||||||||||||||||||||||||||||||||||
| Total TDRs |
|
$ |
|
|
$ |
|
$ |
|
$ |
|
|||||||||||||||||||||||||||||||
|
During the nine months ended September 30, 2022
Dollars in millions
|
|||||||||||||||||||||||||||||||||||||||||
| Commercial |
|
$ |
|
$ |
|
$ |
|
$ |
|
$ |
|
||||||||||||||||||||||||||||||
| Consumer |
|
|
|
|
|
||||||||||||||||||||||||||||||||||||
| Total TDRs |
|
$ |
|
$ |
|
$ |
|
$ |
|
$ |
|
||||||||||||||||||||||||||||||
|
Pre-TDR
Amortized Cost Basis (b) |
Post-TDR Amortized Cost Basis (c) | ||||||||||||||||||||||||||||||||||||||||
|
During the three months ended September 30, 2021
Dollars in millions
|
Number
of Loans |
Principal
Forgiveness |
Rate
Reduction |
Other | Total | ||||||||||||||||||||||||||||||||||||
| Commercial |
|
$ |
|
$ |
|
$ |
|
||||||||||||||||||||||||||||||||||
| Consumer |
|
|
$ |
|
|
|
|||||||||||||||||||||||||||||||||||
| Total TDRs |
|
$ |
|
$ |
|
$ |
|
$ |
|
||||||||||||||||||||||||||||||||
|
During the nine months ended September 30, 2021
Dollars in millions
|
|||||||||||||||||||||||||||||||||||||||||
| Commercial |
|
$ |
|
$ |
|
$ |
|
||||||||||||||||||||||||||||||||||
| Consumer |
|
|
$ |
|
|
|
|||||||||||||||||||||||||||||||||||
| Total TDRs |
|
$ |
|
$ |
|
$ |
|
$ |
|
||||||||||||||||||||||||||||||||
(a) Impact of partial charge-offs at TDR date is included in this table.
(b) Represents the amortized cost basis of the loans as of the quarter end prior to TDR designation.
(c) Represents the amortized cost basis of the TDRs as of the end of the quarter in which the TDR occurs.
After a loan is determined to be a TDR, we continue to track its performance under its most recent restructured terms. We consider a TDR to have subsequently defaulted when it becomes
60
days past due after the most recent date the loan was restructured. The following table provides a summary of TDRs that subsequently defaulted during the periods presented and were classified as TDRs during the applicable 12-month period preceding September 30, 2022 and September 30, 2021.
Table 46: Subsequently Defaulted TDRs
| In millions | 2022 | 2021 | ||||||||||||
| Three months ended September 30 | $ |
|
$ |
|
||||||||||
| Nine months ended September 30 | $ |
|
$ |
|
||||||||||
Allowance for Credit Losses
We maintain the ACL related to loans at levels that we believe to be appropriate to absorb expected credit losses in the portfolios as of the balance sheet date. See Note 1 Accounting Policies included in Item 8 of our 2021 Form 10-K for a discussion of the methodologies used to determine this allowance. A rollforward of the ACL related to loans follows:
The PNC Financial Services Group, Inc. –
Form 10-Q
63
Table 47: Rollforward of Allowance for Credit Losses
| Three months ended September 30 | Nine months ended September 30 | ||||||||||||||||||||||||||||||||||||||||||||||
| 2022 | 2021 | 2022 | 2021 | ||||||||||||||||||||||||||||||||||||||||||||
| In millions | Commercial | Consumer | Total | Commercial | Consumer | Total | Commercial | Consumer | Total | Commercial | Consumer | Total | |||||||||||||||||||||||||||||||||||
| Allowance for loan and lease losses | |||||||||||||||||||||||||||||||||||||||||||||||
| Beginning balance | $ |
|
$ |
|
$ |
|
$ |
|
$ |
|
$ |
|
$ |
|
$ |
|
$ |
|
$ |
|
$ |
|
$ |
|
|||||||||||||||||||||||
| Acquisition PCD reserves |
(
|
(
|
(
|
|
|
|
|||||||||||||||||||||||||||||||||||||||||
| Charge-offs |
(
|
(
|
(
|
(
|
(
|
(
|
(
|
(
|
(
|
(
|
(
|
(
|
|||||||||||||||||||||||||||||||||||
| Recoveries |
|
|
|
|
|
|
|
|
|
|
|
|
|||||||||||||||||||||||||||||||||||
| Net (charge-offs) |
(
|
(
|
(
|
(
|
(
|
(
|
(
|
(
|
(
|
(
|
(
|
(
|
|||||||||||||||||||||||||||||||||||
| Provision for (recapture of) credit losses |
|
|
|
(
|
(
|
(
|
(
|
|
|
(
|
(
|
(
|
|||||||||||||||||||||||||||||||||||
| Other |
(
|
(
|
(
|
(
|
(
|
(
|
(
|
$ |
(
|
(
|
(
|
(
|
(
|
||||||||||||||||||||||||||||||||||
| Ending balance | $ |
|
$ |
|
$ |
|
$ |
|
$ |
|
$ |
|
$ |
|
$ |
|
$ |
|
$ |
|
$ |
|
$ |
|
|||||||||||||||||||||||
| Allowance for unfunded lending related commitments (a) | |||||||||||||||||||||||||||||||||||||||||||||||
| Beginning balance | $ |
|
$ |
|
$ |
|
$ |
|
$ |
|
$ |
|
$ |
|
$ |
|
$ |
|
$ |
|
$ |
|
$ |
|
|||||||||||||||||||||||
| Acquisition PCD reserves |
|
|
|
|
|
|
|||||||||||||||||||||||||||||||||||||||||
| Provision for (recapture of) credit losses |
(
|
|
|
|
(
|
|
|
(
|
|
|
|
|
|||||||||||||||||||||||||||||||||||
| Ending balance | $ |
|
$ |
|
$ |
|
$ |
|
$ |
|
$ |
|
$ |
|
$ |
|
$ |
|
$ |
|
$ |
|
$ |
|
|||||||||||||||||||||||
|
Allowance for credit losses at
September 30 (b)
|
$ |
|
$ |
|
$ |
|
$ |
|
$ |
|
$ |
|
$ |
|
$ |
|
$ |
|
$ |
|
$ |
|
$ |
|
|||||||||||||||||||||||
(a) See Note 9 Commitments for additional information about the underlying commitments related to this allowance.
(b) Represents the ALLL plus allowance for unfunded lending related commitments and excludes allowances for investment securities and other financial assets, which together totaled $
162
million at both September 30, 2022 and 2021.
The ACL related to loans at September 30, 2022 totaled $
5.3
billion, a decrease of $
0.2
billion since December 31, 2021. The following summarizes the changes in factors that influenced the ACL decline during the nine months ended September 30, 2022.
•
The reassessment of pandemic-related risks drove reduced reserves at September 30, 2022, partially offset by the heightened economic stress which impacted our macroeconomic scenarios and related weightings.
64
The PNC Financial Services Group, Inc. –
Form 10-Q
N
OTE
5
L
OAN
S
ALE AND
S
ERVICING
A
CTIVITIES AND
V
ARIABLE
I
NTEREST
E
NTITIES
Loan Sale and Servicing Activities
As more fully described in Note 5 Loan Sale and Servicing Activities and Variable Interest Entities in Item 8 of our 2021 Form 10-K, we have transferred residential and commercial mortgage loans in securitization or sales transactions in which we have continuing involvement. Our continuing involvement in the FNMA, FHLMC and GNMA securitizations, Non-agency securitizations and loan sale transactions generally consists of servicing, repurchasing previously transferred loans under certain conditions and loss share arrangements, and, in limited circumstances, holding of mortgage-backed securities issued by the securitization SPEs.
We earn servicing and other ancillary fees for our role as servicer and, depending on the contractual terms of the servicing arrangement, we can be terminated as servicer with or without cause. At the consummation date of each type of loan transfer where we retain the servicing, we recognize a servicing right at fair value. See Note 9 Commitments and Note 12 Fair Value for information on our servicing rights, including the carrying value of servicing assets.
The following table provides our loan sale and servicing activities:
Table 48: Loan Sale and Servicing Activities
| In millions |
Residential
Mortgages |
Commercial
Mortgages (a) |
|||||||||||||||||||||
| Cash Flows - Three months ended September 30, 2022 | |||||||||||||||||||||||
| Sales of loans and related securitization activity (b) | $ |
|
$ |
|
|||||||||||||||||||
| Repurchases of previously transferred loans (c) | $ |
|
|||||||||||||||||||||
| Servicing fees (d) | $ |
|
$ |
|
|||||||||||||||||||
| Servicing advances recovered/(funded), net | $ |
|
$ |
|
|||||||||||||||||||
| Cash flows on mortgage-backed securities held (e) | $ |
|
$ |
|
|||||||||||||||||||
| Cash Flows - Three months ended September 30, 2021 | |||||||||||||||||||||||
| Sales of loans and related securitization activity (b) | $ |
|
$ |
|
|||||||||||||||||||
| Repurchases of previously transferred loans (c) | $ |
|
$ |
|
|||||||||||||||||||
| Servicing fees (d) | $ |
|
$ |
|
|||||||||||||||||||
| Servicing advances recovered/(funded), net | $ |
(
|
$ |
|
|||||||||||||||||||
| Cash flows on mortgage-backed securities held (e) | $ |
|
$ |
|
|||||||||||||||||||
| Cash Flows - Nine months ended September 30, 2022 | |||||||||||||||||||||||
| Sales of loans and related securitization activity (b) | $ |
|
$ |
|
|||||||||||||||||||
| Repurchases of previously transferred loans (c) | $ |
|
$ |
|
|||||||||||||||||||
| Servicing fees (d) | $ |
|
$ |
|
|||||||||||||||||||
| Servicing advances recovered/(funded), net | $ |
|
$ |
|
|||||||||||||||||||
| Cash flows on mortgage-backed securities held (e) | $ |
|
$ |
|
|||||||||||||||||||
| Cash Flows - Nine months ended September 30, 2021 | |||||||||||||||||||||||
| Sales of loans and related securitization activity (b) | $ |
|
$ |
|
|||||||||||||||||||
| Repurchases of previously transferred loans (c) | $ |
|
$ |
|
|||||||||||||||||||
| Servicing fees (d) | $ |
|
$ |
|
|||||||||||||||||||
| Servicing advances recovered/(funded), net | $ |
|
$ |
(
|
|||||||||||||||||||
| Cash flows on mortgage-backed securities held (e) | $ |
|
$ |
|
|||||||||||||||||||
(a)
Represents both commercial mortgage loan transfers and servicing activities.
(b)
Gains/losses recognized on sales of loans were insignificant for the periods presented.
(c)
Includes both residential and commercial mortgage government insured or guaranteed loans eligible for repurchase through the exercise of our ROAP option, as well as residential mortgage loans repurchased due to alleged breaches of origination covenants or representations and warranties made to purchasers.
(d)
Includes contractually specified servicing fees, late charges and ancillary fees.
The PNC Financial Services Group, Inc. –
Form 10-Q
65
Table 49: Principal Balance, Delinquent Loans and Net Charge-offs Related to Serviced Loans For Others
| In millions | Residential Mortgages | Commercial Mortgages (a) | |||||||||||||||
| September 30, 2022 | |||||||||||||||||
| Total principal balance | $ |
|
$ |
|
|||||||||||||
| Delinquent loans (b) | $ |
|
$ |
|
|||||||||||||
| December 31, 2021 | |||||||||||||||||
| Total principal balance | $ |
|
$ |
|
|||||||||||||
| Delinquent loans (b) | $ |
|
$ |
|
|||||||||||||
| Three months ended September 30, 2022 | |||||||||||||||||
| Net charge-offs (c) | $ |
|
$ |
|
|||||||||||||
| Three months ended September 30, 2021 | |||||||||||||||||
| Net charge-offs (c) | $ |
|
$ |
|
|||||||||||||
| Nine months ended September 30, 2022 | |||||||||||||||||
| Net charge-offs (c) | $ |
|
$ |
|
|||||||||||||
| Nine months ended September 30, 2021 | |||||||||||||||||
| Net charge-offs (c) | $ |
|
$ |
|
|||||||||||||
(a)
Represents information at the securitization level in which we have sold loans and we are the servicer for the securitization.
(b)
Serviced delinquent loans are 90 days or more past due or are in the process of foreclosure.
(c)
Net charge-offs for residential mortgages represent credit losses less recoveries distributed and as reported to investors during the period. Net charge-offs for commercial mortgages represent credit losses less recoveries distributed and as reported by the trustee for commercial mortgage-backed securitizations. Realized losses for Agency securitizations are not reflected as we do not manage the underlying real estate upon foreclosure and, as such, do not have access to loss information.
Variable Interest Entities (VIEs)
As discussed in Note 5 Loan Sale and Servicing Activities and Variable Interest Entities included in Item 8 of our 2021 Form 10-K, we are involved with various entities in the normal course of business that are deemed to be VIEs.
The following table provides a summary of non-consolidated VIEs with which we have significant continuing involvement but are not the primary beneficiary. We have excluded certain transactions with non-consolidated VIEs from the balances presented in Table 50 where we have determined that our continuing involvement is insignificant. We do not consider our continuing involvement to be significant when it relates to a VIE where we only invest in securities issued by the VIE and were not involved in the design of the VIE or where no transfers have occurred between us and the VIE. In addition, where we only have lending arrangements in the normal course of business with entities that could be VIEs, we have excluded these transactions with non-consolidated entities from the balances presented in Table 50. These loans are included as part of the asset quality disclosures that we make in Note 4 Loans and Related Allowance for Credit Losses.
Table 50 : Non-Consolidated VIEs
| In millions | PNC Risk of Loss (a) |
Carrying Value of Assets
Owned by PNC |
Carrying Value of Liabilities
Owned by PNC |
||||||||||||||||||||||||||
| September 30, 2022 | |||||||||||||||||||||||||||||
| Mortgage-backed securitizations (b) | $ |
|
$ |
|
(c) | $ |
|
||||||||||||||||||||||
| Tax credit investments and other |
|
|
(d) |
|
(e) | ||||||||||||||||||||||||
| Total | $ |
|
$ |
|
$ |
|
|||||||||||||||||||||||
| December 31, 2021 | |||||||||||||||||||||||||||||
| Mortgage-backed securitizations (b) | $ |
|
$ |
|
(c) | $ |
|
||||||||||||||||||||||
| Tax credit investments and other |
|
|
(d) |
|
(e) | ||||||||||||||||||||||||
| Total | $ |
|
$ |
|
$ |
|
|||||||||||||||||||||||
(a)
Represents loans, investments and other assets related to non-consolidated VIEs, net of collateral (if applicable). The risk of loss excludes any potential tax recapture associated with tax credit investments.
(b)
Amounts reflect involvement with securitization SPEs where we transferred to and/or service loans for an SPE and we hold securities issued by that SPE. Values disclosed in the PNC Risk of Loss column represent our maximum exposure to loss for those securities’ holdings.
(c)
Included in Investment securities, Mortgage servicing rights and Other assets on our Consolidated Balance Sheet.
(d)
Included in Investment securities, Loans, Equity investments and Other assets on our Consolidated Balance Sheet.
(e)
Included in Deposits and Other liabilities on our Consolidated Balance Sheet.
66
The PNC Financial Services Group, Inc. –
Form 10-Q
N
OTE
6
G
OODWILL
AND
M
ORTGAGE
S
ERVICING
R
IGHTS
Goodwill
See Note 6 Goodwill and Mortgage Servicing Rights in the Notes To Consolidated Financial Statements included in Item 8 of our 2021 Form 10-K for more information regarding our goodwill.
Mortgage Servicing Rights
We recognize the right to service mortgage loans for others as an intangible asset when the servicing income we receive is more than our projected servicing costs. MSRs are recognized either when purchased or when originated loans are sold with servicing retained. MSRs totaled $
3.2
billion at September 30, 2022 and $
1.8
billion at December 31, 2021, and consisted of loan servicing contracts for commercial and residential mortgages measured at fair value.
MSRs are subject to changes in value from actual or expected prepayment of the underlying loans and defaults, as well as market driven changes in interest rates. We manage this risk by economically hedging the fair value of MSRs with securities, derivative instruments and resale agreements which are expected to increase (or decrease) in value when the value of MSRs decreases (or increases).
See the Sensitivity Analysis section of this Note 6 for more detail on our fair value measurement of MSRs. See Note 6 Goodwill and Mortgage Servicing Rights and Note 15 Fair Value in the Notes To Consolidated Financial Statements included in Item 8 of our 2021 Form 10-K for more detail on our fair value measurement and our accounting of MSRs.
Changes in the commercial and residential MSRs follow:
Table 51: Mortgage Servicing Rights
| Commercial MSRs | Residential MSRs | |||||||||||||||||||
| In millions | 2022 | 2021 | 2022 | 2021 | ||||||||||||||||
| January 1 | $ |
|
$ |
|
$ |
|
$ |
|
||||||||||||
| Additions: | ||||||||||||||||||||
| BBVA Acquisition |
|
|||||||||||||||||||
| From loans sold with servicing retained |
|
|
|
|
||||||||||||||||
| Purchases |
|
|
|
|
||||||||||||||||
| Changes in fair value due to: | ||||||||||||||||||||
| Time and payoffs (a) |
(
|
(
|
(
|
(
|
||||||||||||||||
| Other (b) |
|
|
|
|
||||||||||||||||
| September 30 | $ |
|
$ |
|
$ |
|
$ |
|
||||||||||||
| Related unpaid principal balance at September 30 | $ |
|
$ |
|
$ |
|
$ |
|
||||||||||||
| Servicing advances at September 30 | $ |
|
$ |
|
$ |
|
$ |
|
||||||||||||
(a)
Represents decrease in MSR value due to passage of time, including the impact from both regularly scheduled loan principal payments and loans that were paid down or paid off during the period.
(b)
Represents MSR value changes resulting primarily from market-driven changes in interest rates.
Sensitivity Analysis
The fair value of commercial and residential MSRs and significant inputs to the valuation models as of September 30, 2022 and December 31, 2021 are shown in Tables 52 and 53. The expected and actual rates of mortgage loan prepayments are significant factors driving the fair value. Management uses both internal proprietary models and a third-party model to estimate future commercial mortgage loan prepayments and a third-party model to estimate future residential mortgage loan prepayments. These models have been refined based on current market conditions and management judgment. Future interest rates are another important factor in the valuation of MSRs. Management utilizes market implied forward interest rates to estimate the future direction of mortgage and discount rates. The forward rates utilized are derived from the current yield curve for U.S. dollar interest rate swaps and are consistent with pricing of capital markets instruments. Changes in the shape and slope of the forward curve in future periods may result in volatility in the fair value estimate.
The PNC Financial Services Group, Inc. –
Form 10-Q
67
A sensitivity analysis of the hypothetical effect on the fair value of MSRs to adverse changes in key assumptions is presented in Tables 52 and 53. These sensitivities do not include the impact of the related hedging activities. Changes in fair value generally cannot be extrapolated because the relationship of the change in the assumption to the change in fair value may not be linear. Also, the effect of a variation in a particular assumption on the fair value of the MSRs is calculated independently without changing any other assumption. In reality, changes in one factor may result in changes in another (
e.g.
, changes in mortgage interest rates, which drive changes in prepayment rate estimates, could result in changes in the interest rate spread), which could either magnify or counteract the sensitivities.
Table 52: Commercial Mortgage Servicing Rights – Key Valuation Assumptions
| Dollars in millions |
September 30
2022 |
December 31
2021 |
||||||||||||
| Fair value | $ |
|
$ |
|
||||||||||
| Weighted-average life (years) |
|
|
||||||||||||
| Weighted-average constant prepayment rate |
|
% |
|
% | ||||||||||
| Decline in fair value from 10% adverse change | $ |
|
$ |
|
||||||||||
| Decline in fair value from 20% adverse change | $ |
|
$ |
|
||||||||||
| Effective discount rate |
|
% |
|
% | ||||||||||
| Decline in fair value from 10% adverse change | $ |
|
$ |
|
||||||||||
| Decline in fair value from 20% adverse change | $ |
|
$ |
|
||||||||||
Table 53: Residential Mortgage Servicing Rights – Key Valuation Assumptions
|
Dollars in millions
|
September 30
2022 |
December 31
2021 |
||||||||||||
| Fair value | $ |
|
$ |
|
||||||||||
| Weighted-average life (years) |
|
|
||||||||||||
| Weighted-average constant prepayment rate |
|
% |
|
% | ||||||||||
| Decline in fair value from 10% adverse change | $ |
|
$ |
|
||||||||||
| Decline in fair value from 20% adverse change | $ |
|
$ |
|
||||||||||
| Weighted-average option adjusted spread |
|
bps |
|
bps | ||||||||||
| Decline in fair value from 10% adverse change | $ |
|
$ |
|
||||||||||
| Decline in fair value from 20% adverse change | $ |
|
$ |
|
||||||||||
Fees from mortgage loan servicing, which include contractually specified servicing fees, late fees and ancillary fees were $
0.1
billion and $
0.2
billion for the three months ended September 30, 2022 and 2021, respectively, and $
0.4
billion for both the nine months ended September 30, 2022 and 2021. We also generate servicing fees from fee-based activities provided to others for which we do not have an associated servicing asset. Fees from commercial and residential MSRs are reported within Noninterest income on our Consolidated Income Statement in Residential and commercial mortgage.
N
OTE
7
L
EASES
Table 54: Lessor Income
|
Three months ended
September 30 |
Nine months ended
September 30 |
|||||||||||||
| In millions | 2022 | 2021 | 2022 | 2021 | ||||||||||
| Sales-type and direct financing leases (a) | $ |
|
$ |
|
$ |
|
$ |
|
||||||
| Operating leases (b) |
|
|
|
|
||||||||||
| Lease income | $ |
|
$ |
|
$ |
|
$ |
|
||||||
(a)
Included in Loans interest income on the Consolidated Income Statement.
(b)
Included in Lending and deposit services on the Consolidated Income Statement.
68
The PNC Financial Services Group, Inc. –
Form 10-Q
N
OTE
8
B
ORROWED
F
UNDS
Table 55: Borrowed Funds
| In billions | ||||||||
| Less than 1 year | $ |
|
||||||
| 1 to 2 years | $ |
|
||||||
| 2 to 3 years | $ |
|
||||||
| 3 to 4 years | $ |
|
||||||
| 4 to 5 years | $ |
|
||||||
| Over 5 years | $ |
|
||||||
The following table presents the contractual rates and maturity dates of our FHLB borrowings, senior debt and subordinated debt as of September 30, 2022, and the carrying values as of September 30, 2022 and December 31, 2021.
Table 56: FHLB Borrowings, Senior Debt and Subordinated Debt
| Stated Rate | Maturity | Carrying Value | ||||||||||||||||||||||||
| Dollars in millions | 2022 | 2022 | 2022 | 2021 | ||||||||||||||||||||||
| Parent Company | ||||||||||||||||||||||||||
| Senior debt |
|
2022 - 2032 | $ |
|
$ |
|
||||||||||||||||||||
| Subordinated debt |
|
2024 - 2033 |
|
|
||||||||||||||||||||||
| Junior subordinated debt |
|
% | 2028 |
|
|
|||||||||||||||||||||
| Subtotal |
|
|
||||||||||||||||||||||||
| Bank | ||||||||||||||||||||||||||
| Federal Home Loan Bank borrowings (a) |
|
2023 - 2026 |
|
|
||||||||||||||||||||||
| Senior debt |
|
2023 - 2043 |
|
|
||||||||||||||||||||||
| Subordinated debt |
|
2022 - 2029 |
|
|
||||||||||||||||||||||
| Subtotal |
|
|
||||||||||||||||||||||||
| Total | $ |
|
$ |
|
||||||||||||||||||||||
(a)
FHLB borrowings are generally collateralized by residential mortgage loans, other mortgage-related loans and investment securities.
In Table 56, the carrying values for Parent Company senior and subordinated debt include basis adjustments of $(
810
) million and $(
75
) million, respectively, whereas Bank senior and subordinated debt include basis adjustments of $(
272
) million and $(
254
) million, respectively, related to fair value accounting hedges as of September 30, 2022.
Certain borrowings are reported at fair value. Refer to Note 12 Fair Value for more information on those borrowings.
The PNC Financial Services Group, Inc. –
Form 10-Q
69
N
OTE
9
C
OMMITMENTS
| In millions |
September 30
2022 |
December 31
2021 |
||||||||||||
| Commitments to extend credit | ||||||||||||||
| Commercial | $ |
|
$ |
|
||||||||||
| Home equity |
|
|
||||||||||||
| Credit card |
|
|
||||||||||||
| Other |
|
|
||||||||||||
| Total commitments to extend credit |
|
|
||||||||||||
| Net outstanding standby letters of credit (a) |
|
|
||||||||||||
| Standby bond purchase agreements (b) |
|
|
||||||||||||
| Other commitments (c) |
|
|
||||||||||||
| Total commitments to extend credit and other commitments | $ |
|
$ |
|
||||||||||
(a)
Net outstanding standby letters of credit include $
3.8
billion and $
3.3
billion at September 30, 2022 and December 31, 2021, respectively, which support remarketing programs.
(b)
We enter into standby bond purchase agreements to support municipal bond obligations.
Commitments to Extend Credit
Commitments to extend credit, or net unfunded loan commitments, represent arrangements to lend funds or provide liquidity subject to specified contractual conditions. These commitments generally have fixed expiration dates, may require payment of a fee, and generally contain termination clauses in the event the customer’s credit quality deteriorates.
Net Outstanding Standby Letters of Credit
We issue standby letters of credit and share in the risk of standby letters of credit issued by other financial institutions, in each case to support obligations of our customers to third parties, such as insurance requirements and the facilitation of transactions involving capital markets product execution. Approximately
98
% of our net outstanding standby letters of credit were rated as Pass as of September 30, 2022, with the remainder rated as Criticized. An internal credit rating of Pass indicates the expected risk of loss is currently low, while a rating of Criticized indicates a higher degree of risk.
If the customer fails to meet its financial or performance obligation to the third party under the terms of the contract or there is a need to support a remarketing program, then upon a draw by a beneficiary, subject to the terms of the letter of credit, we would be obligated to make payment to them. The standby letters of credit outstanding on September 30, 2022 had terms ranging from less than
one year
to
seven years
.
As of September 30, 2022, assets of $
1.3
billion secured certain specifically identified standby letters of credit. In addition, a portion of the remaining standby letters of credit issued on behalf of specific customers is also secured by collateral or guarantees that secure the customers’ other obligations to us. The carrying amount of the liability for our obligations related to standby letters of credit and participations in standby letters of credit was $
0.1
billion at September 30, 2022 and is included in Other liabilities on our Consolidated Balance Sheet.
70
The PNC Financial Services Group, Inc. –
Form 10-Q
N
OTE
10
T
OTAL
E
QUITY
A
ND
O
THER
C
OMPREHENSIVE
I
NCOME
Table 58: Rollforward of Total Equity
| Shareholders’ Equity | ||||||||||||||||||||||||||||||||||||||
| In millions |
Shares
Outstanding Common Stock |
Common
Stock |
Capital
Surplus - Preferred Stock |
Capital
Surplus - Common Stock and Other |
Retained
Earnings |
Accumulated
Other Comprehensive Income (Loss) |
Treasury
Stock |
Non-
controlling Interests |
Total Equity | |||||||||||||||||||||||||||||
| Three months ended | ||||||||||||||||||||||||||||||||||||||
| Balance at June 30, 2021 (a) |
|
$ |
|
$ |
|
$ |
|
$ |
|
$ |
|
$ |
(
|
$ |
|
$ |
|
|||||||||||||||||||||
| Net income |
|
|
|
|||||||||||||||||||||||||||||||||||
| Other comprehensive income (loss), net of tax |
(
|
(
|
||||||||||||||||||||||||||||||||||||
| Cash dividends declared - Common |
(
|
(
|
||||||||||||||||||||||||||||||||||||
| Cash dividends declared - Preferred |
(
|
(
|
||||||||||||||||||||||||||||||||||||
| Preferred stock discount accretion |
|
(
|
||||||||||||||||||||||||||||||||||||
| Preferred stock issuance (b) |
|
|
||||||||||||||||||||||||||||||||||||
| Treasury stock activity |
(
|
|
(
|
(
|
||||||||||||||||||||||||||||||||||
| Other |
|
(
|
(
|
|||||||||||||||||||||||||||||||||||
| Balance at September 30, 2021 (a) |
|
$ |
|
$ |
|
$ |
|
$ |
|
$ |
|
$ |
(
|
$ |
|
$ |
|
|||||||||||||||||||||
| Balance at June 30, 2022 (a) |
|
$ |
|
$ |
|
$ |
|
$ |
|
$ |
(
|
$ |
(
|
$ |
|
$ |
|
|||||||||||||||||||||
| Net income |
|
|
|
|||||||||||||||||||||||||||||||||||
| Other comprehensive income (loss), net of tax |
(
|
(
|
||||||||||||||||||||||||||||||||||||
| Cash dividends declared - Common |
(
|
(
|
||||||||||||||||||||||||||||||||||||
| Cash dividends declared - Preferred |
(
|
(
|
||||||||||||||||||||||||||||||||||||
| Preferred stock discount accretion |
|
(
|
|
|||||||||||||||||||||||||||||||||||
| Preferred stock issuance (c) |
|
|
||||||||||||||||||||||||||||||||||||
| Treasury stock activity |
(
|
|
(
|
(
|
||||||||||||||||||||||||||||||||||
| Other |
|
(
|
|
|||||||||||||||||||||||||||||||||||
| Balance at September 30, 2022 (a) |
|
$ |
|
$ |
|
$ |
|
$ |
|
$ |
(
|
$ |
(
|
$ |
|
$ |
|
|||||||||||||||||||||
| Nine months ended | ||||||||||||||||||||||||||||||||||||||
| Balance at December 31, 2020 (a) |
|
$ |
|
$ |
|
$ |
|
$ |
|
$ |
|
$ |
(
|
$ |
|
$ |
|
|||||||||||||||||||||
| Net income |
|
|
|
|||||||||||||||||||||||||||||||||||
| Other comprehensive income (loss), net of tax |
(
|
(
|
||||||||||||||||||||||||||||||||||||
| Cash dividends declared - Common |
(
|
(
|
||||||||||||||||||||||||||||||||||||
| Cash dividends declared - Preferred |
(
|
(
|
||||||||||||||||||||||||||||||||||||
| Preferred stock discount accretion |
|
(
|
||||||||||||||||||||||||||||||||||||
| Preferred stock issuance (b) |
|
|
||||||||||||||||||||||||||||||||||||
| Common stock activity |
|
|
||||||||||||||||||||||||||||||||||||
| Treasury stock activity |
(
|
|
(
|
(
|
||||||||||||||||||||||||||||||||||
| Other |
(
|
(
|
(
|
|||||||||||||||||||||||||||||||||||
| Balance at September 30, 2021 (a) |
|
$ |
|
$ |
|
$ |
|
$ |
|
$ |
|
$ |
(
|
$ |
|
$ |
|
|||||||||||||||||||||
| Balance at December 31, 2021 (a) |
|
$ |
|
$ |
|
$ |
|
$ |
|
$ |
|
$ |
(
|
$ |
|
$ |
|
|||||||||||||||||||||
| Net income |
|
|
|
|||||||||||||||||||||||||||||||||||
| Other comprehensive income (loss), net of tax |
(
|
(
|
||||||||||||||||||||||||||||||||||||
| Cash dividends declared - Common |
(
|
(
|
||||||||||||||||||||||||||||||||||||
| Cash dividends declared - Preferred |
(
|
(
|
||||||||||||||||||||||||||||||||||||
| Preferred stock discount accretion |
|
(
|
||||||||||||||||||||||||||||||||||||
| Preferred stock issuance (c) (d) |
|
|
||||||||||||||||||||||||||||||||||||
| Common stock activity |
|
|
|
|||||||||||||||||||||||||||||||||||
| Treasury stock activity |
(
|
|
(
|
(
|
||||||||||||||||||||||||||||||||||
| Other |
|
(
|
|
|||||||||||||||||||||||||||||||||||
| Balance at September 30, 2022 (a) |
|
$ |
|
$ |
|
$ |
|
$ |
|
$ |
(
|
$ |
(
|
$ |
|
$ |
|
|||||||||||||||||||||
(a)
The par value of our preferred stock outstanding was less than $
0.5
million at each date and, therefore, is excluded from this presentation.
(b)
On September 13, 2021, PNC issued
1,500,000
depositary shares each representing 1/100th ownership in a share of
3.400
% fixed-rate reset non-cumulative perpetual preferred stock, Series T, with a par value of $
1
per share.
(c)
On August 19, 2022, PNC issued
1,250,000
depositary shares each representing 1/100th ownership in a share of
6.200
% fixed-rate reset non-cumulative perpetual preferred stock, Series V, with a par value of $
1
per share.
(d)
On April 26, 2022, PNC issued
1,000,000
depositary shares each representing 1/100th ownership in a share of
6.000
% fixed-rate reset non-cumulative perpetual preferred stock, Series U, with a par value of $
1
per share.
.
The PNC Financial Services Group, Inc. –
Form 10-Q
71
Details of other comprehensive income (loss) are as follows:
Table 59: Other Comprehensive Income (Loss)
| Three months ended September 30 | Nine months ended September 30 | |||||||||||||||||||||||||||||||||||||||||||||||||
| 2022 | 2021 | 2022 | 2021 | |||||||||||||||||||||||||||||||||||||||||||||||
| In millions | Pre-tax | Tax effect |
After-
tax |
Pre-tax | Tax effect | After-tax | Pre-tax | Tax effect | After-tax | Pre-tax | Tax effect | After-tax | ||||||||||||||||||||||||||||||||||||||
| Debt securities | ||||||||||||||||||||||||||||||||||||||||||||||||||
| Net unrealized gains (losses) on securities | $ |
(
|
$ |
|
$ |
(
|
$ |
(
|
$ |
|
$ |
(
|
$ |
(
|
$ |
|
$ |
(
|
$ |
(
|
$ |
|
$ |
(
|
||||||||||||||||||||||||||
|
Less: Net realized gains (losses) reclassified to
earnings (a) |
(
|
|
(
|
|
(
|
|
(
|
|
(
|
|
(
|
|
||||||||||||||||||||||||||||||||||||||
| Net change |
(
|
|
(
|
(
|
|
(
|
(
|
|
(
|
(
|
|
(
|
||||||||||||||||||||||||||||||||||||||
| Cash flow hedge derivatives | ||||||||||||||||||||||||||||||||||||||||||||||||||
| Net unrealized gains (losses) on cash flow hedge derivatives |
(
|
|
(
|
(
|
|
(
|
(
|
|
(
|
(
|
|
(
|
||||||||||||||||||||||||||||||||||||||
| Less: Net realized gains (losses) reclassified to earnings (a) |
(
|
|
(
|
|
(
|
|
(
|
(
|
|
(
|
|
|||||||||||||||||||||||||||||||||||||||
| Net change |
(
|
|
(
|
(
|
|
(
|
(
|
|
(
|
(
|
|
(
|
||||||||||||||||||||||||||||||||||||||
| Pension and other postretirement benefit plan adjustments | ||||||||||||||||||||||||||||||||||||||||||||||||||
| Net pension and other postretirement benefit plan activity and other reclassified to earnings (b) |
|
(
|
|
|
|
|
|
(
|
|
(
|
|
(
|
||||||||||||||||||||||||||||||||||||||
| Net change |
|
(
|
|
|
|
|
|
(
|
|
(
|
|
(
|
||||||||||||||||||||||||||||||||||||||
| Other | ||||||||||||||||||||||||||||||||||||||||||||||||||
| Net unrealized gains (losses) on other transactions |
|
(
|
(
|
|
(
|
(
|
(
|
(
|
(
|
|
(
|
(
|
||||||||||||||||||||||||||||||||||||||
| Net change |
|
(
|
(
|
|
(
|
(
|
(
|
(
|
(
|
|
(
|
(
|
||||||||||||||||||||||||||||||||||||||
| Total other comprehensive income (loss) | $ |
(
|
$ |
|
$ |
(
|
$ |
(
|
$ |
|
$ |
(
|
$ |
(
|
$ |
|
$ |
(
|
$ |
(
|
$ |
|
$ |
(
|
||||||||||||||||||||||||||
(a)
Reclassifications for pre-tax debt securities and cash flow hedges are recorded in Interest income and Noninterest income on the Consolidated Income Statement.
(b)
Reclassifications include amortization of actuarial losses (gains) and amortization of prior period services costs (credits) which are recorded in noninterest expense on the Consolidated Income Statement.
Table 60: Accumulated Other Comprehensive Income (Loss) Components
| In millions, after-tax | Debt securities | Cash flow hedge derivatives | Pension and other postretirement benefit plan adjustments | Other | Total | |||||||||||||||||||||||||||
| Three months ended | ||||||||||||||||||||||||||||||||
| Balance at June 30, 2021 | $ |
|
$ |
|
$ |
(
|
$ |
(
|
$ |
|
||||||||||||||||||||||
| Net activity |
(
|
(
|
|
(
|
(
|
|||||||||||||||||||||||||||
| Balance at September 30, 2021 | $ |
|
$ |
|
$ |
(
|
$ |
(
|
$ |
|
||||||||||||||||||||||
| Balance at June 30, 2022 | $ |
(
|
$ |
(
|
$ |
|
$ |
(
|
$ |
(
|
||||||||||||||||||||||
| Net activity |
(
|
(
|
|
(
|
(
|
|||||||||||||||||||||||||||
| Balance at September 30, 2022 (a) | $ |
(
|
$ |
(
|
$ |
|
$ |
(
|
$ |
(
|
||||||||||||||||||||||
| Nine months ended | ||||||||||||||||||||||||||||||||
| Balance at December 31, 2020 | $ |
|
$ |
|
$ |
(
|
$ |
(
|
$ |
|
||||||||||||||||||||||
| Net activity |
(
|
(
|
(
|
(
|
(
|
|||||||||||||||||||||||||||
| Balance at September 30, 2021 | $ |
|
$ |
|
$ |
(
|
$ |
(
|
$ |
|
||||||||||||||||||||||
| Balance at December 31, 2021 | $ |
|
$ |
(
|
$ |
|
$ |
(
|
$ |
|
||||||||||||||||||||||
| Net activity |
(
|
(
|
|
(
|
(
|
|||||||||||||||||||||||||||
| Balance at September 30, 2022 (a) | $ |
(
|
$ |
(
|
$ |
|
$ |
(
|
$ |
(
|
||||||||||||||||||||||
(a)
At September 30, 2022, AOCI included pretax losses of $
132
million from derivatives that hedged the purchase of investment securities classified as held to maturity.
72
The PNC Financial Services Group, Inc. –
Form 10-Q
The following table provides the dividends per share for PNC's common and preferred stock:
Table 61: Dividends Per Share (a)
| Three months ended September 30 | Nine months ended September 30 | |||||||||||||
| 2022 | 2021 | 2022 | 2021 | |||||||||||
| Common Stock | $ |
|
$ |
|
$ |
|
$ |
|
||||||
| Preferred Stock | ||||||||||||||
| Series B | $ |
|
$ |
|
$ |
|
$ |
|
||||||
| Series O | $ |
|
$ |
|
$ |
|
$ |
|
||||||
| Series P | $ |
|
$ |
|
$ |
|
$ |
|
||||||
| Series R |
|
|
$ |
|
$ |
|
||||||||
| Series S |
|
|
$ |
|
$ |
|
||||||||
| Series T | $ |
|
|
$ |
|
|
||||||||
| Series U | $ |
|
|
$ |
|
|
||||||||
(a)
Dividends are payable quarterly other than Series R and Series S preferred stock, which are payable semiannually. On August 19, 2022, PNC issued
1,250,000
depositary shares each representing 1/100th ownership in a share of
6.200
% fixed-rate reset non-cumulative perpetual preferred stock, Series V, with a par value of $
1
per share. Beginning on December 15, 2022, dividends will be paid on the Series V on a quarterly basis (March 15, June 15, September 15, and December 15 of each year).
On October 3, 2022, the PNC Board of Directors declared a quarterly cash dividend on common stock of $
1.50
per share payable on November 5, 2022.
N
OTE
11
E
ARNINGS
P
ER
S
HARE
Table 62: Basic and Diluted Earnings Per Common Share
| Three months ended September 30 | Nine months ended September 30 | ||||||||||||||||||||||
| In millions, except per share data | 2022 | 2021 | 2022 | 2021 | |||||||||||||||||||
| Basic | |||||||||||||||||||||||
| Net income | $ |
|
$ |
|
$ |
|
$ |
|
|||||||||||||||
| Less: | |||||||||||||||||||||||
| Net income attributable to noncontrolling interests |
|
|
|
|
|||||||||||||||||||
| Preferred stock dividends |
|
|
|
|
|||||||||||||||||||
| Preferred stock discount accretion and redemptions |
|
|
|
|
|||||||||||||||||||
| Net income attributable to common shareholders |
|
|
|
|
|||||||||||||||||||
|
Less: Dividends and undistributed earnings allocated to nonvested restricted
shares |
|
|
|
|
|||||||||||||||||||
| Net income attributable to basic common shareholders | $ |
|
$ |
|
$ |
|
$ |
|
|||||||||||||||
| Basic weighted-average common shares outstanding |
|
|
|
|
|||||||||||||||||||
| Basic earnings per common share (a) | $ |
|
$ |
|
$ |
|
$ |
|
|||||||||||||||
| Diluted | |||||||||||||||||||||||
|
Net income attributable to diluted common shareholders
|
$ |
|
$ |
|
$ |
|
$ |
|
|||||||||||||||
| Basic weighted-average common shares outstanding |
|
|
|
|
|||||||||||||||||||
| Dilutive potential common shares |
|
|
|||||||||||||||||||||
| Diluted weighted-average common shares outstanding |
|
|
|
|
|||||||||||||||||||
| Diluted earnings per common share (a) | $ |
|
$ |
|
$ |
|
$ |
|
|||||||||||||||
(a)
Basic and diluted earnings per share under the two-class method are determined on net income reported on the income statement less earnings allocated to nonvested restricted shares and restricted share units with nonforfeitable dividends and dividend rights (participating securities).
The PNC Financial Services Group, Inc. –
Form 10-Q
73
N
OTE
12
F
AIR
V
ALUE
Fair Value Measurement
We measure certain financial assets and liabilities at fair value. Fair value is defined as the price that would be received to sell an asset or the price that would be paid to transfer a liability on the measurement date, and is determined using an exit price in the principal or most advantageous market for the asset or liability in an orderly transaction between market participants. The fair value hierarchy established by GAAP requires us to maximize the use of observable inputs when measuring fair value. For more information regarding the fair value hierarchy, see Note 15 Fair Value in the Notes To Consolidated Financial Statements included in Item 8 of our 2021 Form 10-K. Additionally, for more information regarding the fair value of assets and liabilities from our BBVA acquisition, see Note 2 Acquisition and Divestiture Activity in the Notes To Consolidated Financial Statements included in Item 8 of our 2021 Form 10-K.
Assets and Liabilities Measured at Fair Value on a Recurring Basis
For more information on the valuation methodologies used to measure assets and liabilities at fair value on a recurring basis, see Note 15 Fair Value in the Notes To Consolidated Financial Statements included in Item 8 of our 2021 Form 10-K.
The following table summarizes our assets and liabilities measured at fair value on a recurring basis, including instruments for which we have elected the fair value option.
Table 63: Fair Value Measurements – Recurring Basis Summary
| September 30, 2022 | December 31, 2021 | ||||||||||||||||||||||||||||||||||||||||||||||||||||
| In millions | Level 1 | Level 2 | Level 3 |
Total
Fair Value |
Level 1 | Level 2 | Level 3 |
Total
Fair Value |
|||||||||||||||||||||||||||||||||||||||||||||
| Assets | |||||||||||||||||||||||||||||||||||||||||||||||||||||
| Residential mortgage loans held for sale | $ |
|
$ |
|
$ |
|
$ |
|
$ |
|
$ |
|
|||||||||||||||||||||||||||||||||||||||||
| Commercial mortgage loans held for sale |
|
|
|
|
|
|
|||||||||||||||||||||||||||||||||||||||||||||||
| Securities available for sale | |||||||||||||||||||||||||||||||||||||||||||||||||||||
| U.S. Treasury and government agencies | $ |
|
|
|
$ |
|
|
|
|||||||||||||||||||||||||||||||||||||||||||||
| Residential mortgage-backed | |||||||||||||||||||||||||||||||||||||||||||||||||||||
| Agency |
|
|
|
|
|||||||||||||||||||||||||||||||||||||||||||||||||
| Non-agency |
|
|
|
|
|
||||||||||||||||||||||||||||||||||||||||||||||||
| Commercial mortgage-backed | |||||||||||||||||||||||||||||||||||||||||||||||||||||
| Agency |
|
|
|
|
|||||||||||||||||||||||||||||||||||||||||||||||||
| Non-agency |
|
|
|
|
|
|
|||||||||||||||||||||||||||||||||||||||||||||||
| Asset-backed |
|
|
|
|
|
|
|||||||||||||||||||||||||||||||||||||||||||||||
| Other |
|
|
|
|
|
|
|||||||||||||||||||||||||||||||||||||||||||||||
| Total securities available for sale |
|
|
|
|
|
|
|
|
|||||||||||||||||||||||||||||||||||||||||||||
| Loans |
|
|
|
|
|
|
|||||||||||||||||||||||||||||||||||||||||||||||
| Equity investments (a) |
|
|
|
|
|
|
|||||||||||||||||||||||||||||||||||||||||||||||
| Residential mortgage servicing rights |
|
|
|
|
|||||||||||||||||||||||||||||||||||||||||||||||||
| Commercial mortgage servicing rights |
|
|
|
|
|||||||||||||||||||||||||||||||||||||||||||||||||
| Trading securities (b) |
|
|
|
|
|
|
|||||||||||||||||||||||||||||||||||||||||||||||
| Financial derivatives (b) (c) |
|
|
|
|
|
|
|
|
|||||||||||||||||||||||||||||||||||||||||||||
| Other assets |
|
|
|
|
|
|
|||||||||||||||||||||||||||||||||||||||||||||||
| Total assets (d) | $ |
|
$ |
|
$ |
|
$ |
|
$ |
|
$ |
|
$ |
|
$ |
|
|||||||||||||||||||||||||||||||||||||
| Liabilities | |||||||||||||||||||||||||||||||||||||||||||||||||||||
| Other borrowed funds | $ |
|
$ |
|
$ |
|
$ |
|
$ |
|
$ |
|
$ |
|
$ |
|
|||||||||||||||||||||||||||||||||||||
| Financial derivatives (c) (e) |
|
|
|
|
|
|
|
||||||||||||||||||||||||||||||||||||||||||||||
| Other liabilities |
|
|
|
|
|||||||||||||||||||||||||||||||||||||||||||||||||
| Total liabilities (f) | $ |
|
$ |
|
$ |
|
$ |
|
$ |
|
$ |
|
$ |
|
$ |
|
|||||||||||||||||||||||||||||||||||||
(a)
Certain investments that are measured at fair value using the net asset value per share (or its equivalent) practical expedient have not been classified in the fair value hierarchy.
(b)
Included in Other assets on the Consolidated Balance Sheet.
(c)
Amounts at September 30, 2022 and December 31, 2021 are presented gross and are not reduced by the impact of legally enforceable master netting agreements that allow us to net positive and negative positions and cash collateral held or placed with the same counterparty. See Note 13 Financial Derivatives for additional information related to derivative offsetting.
(d)
Total assets at fair value as a percentage of total consolidated assets was
11
% and
26
% as of September 30, 2022 and December 31, 2021, respectively. Level 3 assets as a percentage of total assets at fair value was
11
% and
4
% at September 30, 2022 and December 31, 2021, respectively. Level 3 assets as a percentage of total consolidated assets was
1
% at both September 30, 2022 and December 31, 2021.
(e)
Included in Other liabilities on the Consolidated Balance Sheet.
74
The PNC Financial Services Group, Inc. –
Form 10-Q
Reconciliations of assets and liabilities measured at fair value on a recurring basis using Level 3 inputs for the three and nine months ended September 30, 2022 and 2021 follow:
Table 64: Reconciliation of Level 3 Assets and Liabilities
Three Months Ended September 30, 2022
|
Total realized / unrealized
gains or losses for the period (a) |
Unrealized
gains / losses for the period on assets and liabilities held on Consolidated Balance Sheet at Sept. 30, 2022 (a) (c) |
|||||||||||||||||||||||||||||||||||||||||||
|
Level 3 Instruments Only
In millions |
Fair Value June 30, 2022 |
Included in
Earnings |
Included
in Other comprehensive income (b) |
Purchases | Sales | Issuances | Settlements |
Transfers
into Level 3 |
Transfers
out of Level 3 |
Fair
Value Sept. 30, 2022 |
||||||||||||||||||||||||||||||||||
| Assets | ||||||||||||||||||||||||||||||||||||||||||||
|
Residential mortgage
loans held for sale |
$ |
|
$ |
(
|
$ |
|
$ |
(
|
$ |
(
|
$ |
|
$ |
(
|
(d) | $ |
|
$ |
(
|
|||||||||||||||||||||||||
|
Commercial mortgage
loans held for sale |
|
(
|
|
|||||||||||||||||||||||||||||||||||||||||
| Securities available for sale | ||||||||||||||||||||||||||||||||||||||||||||
|
Residential mortgage-
backed non-agency |
|
|
$ |
(
|
(
|
|
||||||||||||||||||||||||||||||||||||||
|
Commercial mortgage-
backed non-agency |
|
|
||||||||||||||||||||||||||||||||||||||||||
| Asset-backed |
|
|
(
|
(
|
|
|||||||||||||||||||||||||||||||||||||||
| Other |
|
|
|
|
||||||||||||||||||||||||||||||||||||||||
|
Total securities
available for sale |
|
|
(
|
|
|
(
|
|
|||||||||||||||||||||||||||||||||||||
| Loans |
|
(
|
|
(
|
(
|
(
|
(d) |
|
|
|||||||||||||||||||||||||||||||||||
| Equity investments |
|
|
|
(
|
|
|
||||||||||||||||||||||||||||||||||||||
|
Residential mortgage
servicing rights |
|
|
|
$ |
|
(
|
|
|
||||||||||||||||||||||||||||||||||||
|
Commercial mortgage
servicing rights |
|
|
|
|
(
|
|
|
|||||||||||||||||||||||||||||||||||||
| Financial derivatives |
|
|
|
(
|
|
|
||||||||||||||||||||||||||||||||||||||
| Total assets | $ |
|
$ |
|
$ |
(
|
$ |
|
$ |
(
|
$ |
|
$ |
(
|
$ |
|
$ |
(
|
$ |
|
$ |
|
||||||||||||||||||||||
| Liabilities | ||||||||||||||||||||||||||||||||||||||||||||
| Other borrowed funds | $ |
|
|
$ |
(
|
$ |
|
|||||||||||||||||||||||||||||||||||||
| Financial derivatives |
|
$ |
(
|
$ |
|
(
|
|
$ |
(
|
|||||||||||||||||||||||||||||||||||
| Other liabilities |
|
|
$ |
|
$ |
|
(
|
|
|
|||||||||||||||||||||||||||||||||||
| Total liabilities | $ |
|
$ |
|
$ |
|
$ |
|
$ |
|
$ |
(
|
$ |
|
$ |
|
||||||||||||||||||||||||||||
| Net gains (losses) | $ |
|
(e) | $ |
|
(f) | ||||||||||||||||||||||||||||||||||||||
The PNC Financial Services Group, Inc. –
Form 10-Q
75
(Continued from previous page)
Three Months Ended September 30, 2021
|
Total realized / unrealized
gains or losses for the period (a) |
Unrealized gains/losses for the period on assets and liabilities held on Consolidated Balance Sheet at Sept. 30, 2021
(a) (c) |
||||||||||||||||||||||||||||||||||||||||||||||
|
Level 3 Instruments Only
In millions |
Fair Value June 30, 2021 | Included in Earnings | Included in Other comprehensive income (b) | Purchases | Sales | Issuances | Settlements | Transfers into Level 3 | Transfers out of Level 3 | Impact from BBVA Acquisition | Fair Value Sept. 30, 2021 | ||||||||||||||||||||||||||||||||||||
| Assets | |||||||||||||||||||||||||||||||||||||||||||||||
|
Residential mortgage
loans held for sale |
$ |
|
$ |
(
|
$ |
|
$ |
(
|
$ |
(
|
$ |
|
$ |
(
|
(d) | $ |
|
$ |
(
|
||||||||||||||||||||||||||||
|
Commercial mortgage
loans held for sale |
|
(
|
|
||||||||||||||||||||||||||||||||||||||||||||
| Other consumer loans held for sale |
|
(
|
$ |
|
|||||||||||||||||||||||||||||||||||||||||||
| Securities available for sale | |||||||||||||||||||||||||||||||||||||||||||||||
|
Residential mortgage-
backed non-agency |
|
|
$ |
(
|
(
|
|
|||||||||||||||||||||||||||||||||||||||||
| Commercial mortgage-backed non-agency |
|
(
|
|
||||||||||||||||||||||||||||||||||||||||||||
| Asset-backed |
|
|
|
(
|
|
||||||||||||||||||||||||||||||||||||||||||
| Other |
|
|
(
|
|
|
||||||||||||||||||||||||||||||||||||||||||
|
Total securities
available for sale |
|
|
(
|
|
(
|
(
|
|
||||||||||||||||||||||||||||||||||||||||
| Loans |
|
|
|
(
|
(
|
(
|
(d) |
|
|
|
|||||||||||||||||||||||||||||||||||||
| Equity investments |
|
|
|
(
|
|
|
|||||||||||||||||||||||||||||||||||||||||
|
Residential mortgage
servicing rights |
|
|
|
$ |
|
(
|
|
|
|||||||||||||||||||||||||||||||||||||||
|
Commercial mortgage
servicing rights |
|
|
|
|
(
|
|
|
||||||||||||||||||||||||||||||||||||||||
| Financial derivatives |
|
|
|
(
|
|
|
|||||||||||||||||||||||||||||||||||||||||
| Total assets | $ |
|
$ |
|
$ |
(
|
$ |
|
$ |
(
|
$ |
|
$ |
(
|
$ |
|
$ |
(
|
$ |
|
$ |
|
$ |
|
|||||||||||||||||||||||
| Liabilities | |||||||||||||||||||||||||||||||||||||||||||||||
| Other borrowed funds | $ |
|
$ |
|
$ |
(
|
$ |
|
|||||||||||||||||||||||||||||||||||||||
| Financial derivatives |
|
$ |
|
$ |
|
(
|
|
$ |
|
||||||||||||||||||||||||||||||||||||||
| Other liabilities |
|
|
|
(
|
|
|
|||||||||||||||||||||||||||||||||||||||||
| Total liabilities | $ |
|
$ |
|
$ |
|
$ |
|
$ |
(
|
|
$ |
|
$ |
|
||||||||||||||||||||||||||||||||
| Net gains (losses) | $ |
|
(e) | $ |
|
(f) | |||||||||||||||||||||||||||||||||||||||||
76
The PNC Financial Services Group, Inc. –
Form 10-Q
(Continued from previous page)
Nine Months Ended September 30, 2022
|
Total realized / unrealized
gains or losses for the period (a) |
Unrealized
gains / losses for the period on assets and liabilities held on Consolidated Balance Sheet at Sept. 30, 2022 (a) (c) |
|||||||||||||||||||||||||||||||||||||||||||
|
Level 3 Instruments Only
In millions |
Fair
Value Dec. 31, 2021 |
Included in
Earnings |
Included
in Other comprehensive income (b) |
Purchases | Sales | Issuances | Settlements |
Transfers
into Level 3 |
Transfers
out of Level 3 |
Fair
Value Sept. 30, 2022 |
||||||||||||||||||||||||||||||||||
| Assets | ||||||||||||||||||||||||||||||||||||||||||||
|
Residential mortgage
loans held for sale |
$ |
|
$ |
(
|
$ |
|
$ |
(
|
$ |
(
|
$ |
|
$ |
(
|
(d) | $ |
|
$ |
(
|
|||||||||||||||||||||||||
|
Commercial mortgage
loans held for sale |
|
(
|
(
|
|
(
|
|||||||||||||||||||||||||||||||||||||||
| Securities available for sale | ||||||||||||||||||||||||||||||||||||||||||||
|
Residential mortgage-
backed non-agency |
|
|
$ |
(
|
(
|
|
||||||||||||||||||||||||||||||||||||||
|
Commercial mortgage-
backed non-agency |
|
|
||||||||||||||||||||||||||||||||||||||||||
| Asset-backed |
|
|
(
|
(
|
|
|||||||||||||||||||||||||||||||||||||||
| Other |
|
|
|
(
|
|
|||||||||||||||||||||||||||||||||||||||
|
Total securities
available for sale |
|
|
(
|
|
|
(
|
|
|||||||||||||||||||||||||||||||||||||
| Loans |
|
|
|
(
|
(
|
(
|
(d) |
|
|
|||||||||||||||||||||||||||||||||||
| Equity investments |
|
|
|
(
|
|
|
||||||||||||||||||||||||||||||||||||||
|
Residential mortgage
servicing rights |
|
|
|
$ |
|
(
|
|
|
||||||||||||||||||||||||||||||||||||
|
Commercial mortgage
servicing rights |
|
|
|
|
(
|
|
|
|||||||||||||||||||||||||||||||||||||
| Financial derivatives |
|
(
|
|
(
|
|
|
||||||||||||||||||||||||||||||||||||||
| Total assets | $ |
|
$ |
|
$ |
(
|
$ |
|
$ |
(
|
$ |
|
$ |
(
|
$ |
|
$ |
(
|
$ |
|
$ |
|
||||||||||||||||||||||
| Liabilities | ||||||||||||||||||||||||||||||||||||||||||||
| Other borrowed funds | $ |
|
$ |
|
$ |
(
|
$ |
|
||||||||||||||||||||||||||||||||||||
| Financial derivatives |
|
$ |
|
$ |
|
(
|
|
$ |
|
|||||||||||||||||||||||||||||||||||
| Other liabilities |
|
|
$ |
|
|
(
|
|
|
||||||||||||||||||||||||||||||||||||
| Total liabilities | $ |
|
$ |
|
$ |
|
$ |
|
$ |
|
$ |
(
|
$ |
|
$ |
|
||||||||||||||||||||||||||||
| Net gains (losses) | $ |
|
(e) | $ |
|
(f) | ||||||||||||||||||||||||||||||||||||||
The PNC Financial Services Group, Inc. –
Form 10-Q
77
(Continued from previous page)
Nine Months Ended September 30, 2021
|
Total realized / unrealized
gains or losses for the period (a) |
Unrealized
gains / losses for the period on assets and liabilities held on Consolidated Balance Sheet at Sept. 30, 2021 (a) (c) |
||||||||||||||||||||||||||||||||||||||||||||||
|
Level 3 Instruments Only
In millions |
Fair
Value Dec. 31, 2020 |
Included in
Earnings |
Included
in Other comprehensive income (b) |
Purchases | Sales | Issuances | Settlements |
Transfers
into Level 3 |
Transfers
out of Level 3 |
Impact from BBVA Acquisition | Fair Value Sept. 30, 2021 | ||||||||||||||||||||||||||||||||||||
| Assets | |||||||||||||||||||||||||||||||||||||||||||||||
|
Residential mortgage
loans held for sale |
$ |
|
$ |
(
|
$ |
|
$ |
(
|
$ |
(
|
$ |
|
$ |
(
|
(d) | $ |
|
$ |
(
|
||||||||||||||||||||||||||||
|
Commercial mortgage
loans held for sale |
|
(
|
(
|
|
|
|
|||||||||||||||||||||||||||||||||||||||||
| Other consumer loans held for sale |
(
|
$ |
|
||||||||||||||||||||||||||||||||||||||||||||
| Securities available for sale | |||||||||||||||||||||||||||||||||||||||||||||||
|
Residential mortgage-
backed non-agency |
|
|
$ |
|
(
|
|
|||||||||||||||||||||||||||||||||||||||||
|
Commercial mortgage-
backed non-agency |
|
(
|
|
||||||||||||||||||||||||||||||||||||||||||||
| Asset-backed |
|
|
|
(
|
|
||||||||||||||||||||||||||||||||||||||||||
| Other |
|
|
|
(
|
|
||||||||||||||||||||||||||||||||||||||||||
|
Total securities
available for sale |
|
|
|
|
(
|
(
|
|
||||||||||||||||||||||||||||||||||||||||
| Loans |
|
|
|
(
|
(
|
(
|
(d) |
|
|
|
|||||||||||||||||||||||||||||||||||||
| Equity investments |
|
|
|
(
|
|
|
|||||||||||||||||||||||||||||||||||||||||
|
Residential mortgage
servicing rights |
|
|
|
$ |
|
(
|
|
|
|
||||||||||||||||||||||||||||||||||||||
|
Commercial mortgage
servicing rights |
|
|
|
|
(
|
|
|
||||||||||||||||||||||||||||||||||||||||
| Financial derivatives |
|
|
|
(
|
|
|
|
||||||||||||||||||||||||||||||||||||||||
| Total assets | $ |
|
$ |
|
$ |
|
$ |
|
$ |
(
|
$ |
|
$ |
(
|
$ |
|
$ |
(
|
$ |
|
$ |
|
$ |
|
|||||||||||||||||||||||
| Liabilities | |||||||||||||||||||||||||||||||||||||||||||||||
| Other borrowed funds | $ |
|
$ |
|
$ |
(
|
$ |
|
|||||||||||||||||||||||||||||||||||||||
| Financial derivatives |
|
$ |
|
$ |
|
(
|
$ |
|
|
$ |
|
||||||||||||||||||||||||||||||||||||
| Other liabilities |
|
|
|
(
|
|
|
|||||||||||||||||||||||||||||||||||||||||
| Total liabilities | $ |
|
$ |
|
$ |
|
$ |
|
$ |
(
|
$ |
|
$ |
|
$ |
|
|||||||||||||||||||||||||||||||
| Net gains (losses) | $ |
|
(e) | $ |
|
(f) | |||||||||||||||||||||||||||||||||||||||||
(a)
Losses for assets are bracketed while losses for liabilities are not.
(b)
The difference in unrealized gains and losses for the period included in Other comprehensive income and changes in unrealized gains and losses for the period included in Other comprehensive income for securities available for sale held at the end of the reporting period were insignificant.
(c)
The amount of the total gains or losses for the period included in earnings that is attributable to the change in unrealized gains or losses related to those assets and liabilities held at the end of the reporting period.
(d)
Residential mortgage loan transfers out of Level 3 are primarily driven by residential mortgage loans transferring to OREO as well as reclassification of mortgage loans held for sale to held for investment.
(e)
Net gains (losses) realized and unrealized included in earnings related to Level 3 assets and liabilities included amortization and accretion. The amortization and accretion amounts were included in Interest income on the Consolidated Income Statement and the remaining net gains (losses) realized and unrealized were included in Noninterest income on the Consolidated Income Statement.
(f)
Net unrealized gains (losses) related to assets and liabilities held at the end of the reporting period were included in Noninterest income on the Consolidated Income Statement.
An instrument’s categorization within the hierarchy is based on the lowest level of input that is significant to the fair value measurement. Changes from one quarter to the next related to the observability of inputs to a fair value measurement may result in a reclassification (transfer) of assets or liabilities between hierarchy levels.
78
The PNC Financial Services Group, Inc. –
Form 10-Q
Quantitative information about the significant unobservable inputs within Level 3 recurring assets and liabilities follows:
Table 65: Fair Value Measurements – Recurring Quantitative Information
September 30, 2022
|
Level 3 Instruments Only
Dollars in millions |
Fair Value | Valuation Techniques | Unobservable Inputs | Range (Weighted-Average) (a) | ||||||||||
| Commercial mortgage loans held for sale | $ |
|
Discounted cash flow | Spread over the benchmark curve (b) |
|
|||||||||
|
Residential mortgage-backed
non-agency securities |
|
Priced by a third-party vendor using a discounted cash flow pricing model | Constant prepayment rate |
|
||||||||||
| Constant default rate |
|
|||||||||||||
| Loss severity |
|
|||||||||||||
| Spread over the benchmark curve (b) |
|
|||||||||||||
| Asset-backed securities |
|
Priced by a third-party vendor using a discounted cash flow pricing model | Constant prepayment rate |
|
||||||||||
| Constant default rate |
|
|||||||||||||
| Loss severity |
|
|||||||||||||
| Spread over the benchmark curve (b) |
|
|||||||||||||
| Loans - Residential real estate |
|
Consensus pricing (c) | Cumulative default rate |
|
||||||||||
| Loss severity |
|
|||||||||||||
| Discount rate |
|
|||||||||||||
| Loans - Residential real estate |
|
Discounted cash flow | Loss severity |
|
||||||||||
| Discount rate |
|
|||||||||||||
| Loans - Home equity |
|
Consensus pricing (c) | Cumulative default rate |
|
||||||||||
| Loss severity |
|
|||||||||||||
| Discount rate |
|
|||||||||||||
| Loans - Home equity |
|
Consensus pricing (c) | Credit and liquidity discount |
|
||||||||||
| Equity investments |
|
Multiple of adjusted earnings | Multiple of earnings |
|
||||||||||
| Residential mortgage servicing rights |
|
Discounted cash flow | Constant prepayment rate |
|
||||||||||
| Spread over the benchmark curve (b) |
|
|||||||||||||
| Commercial mortgage servicing rights |
|
Discounted cash flow | Constant prepayment rate |
|
||||||||||
| Discount rate |
|
|||||||||||||
|
Financial derivatives - Swaps related to
sales of certain Visa Class B common shares |
(
|
Discounted cash flow | Estimated conversion factor of Visa Class B shares into Class A shares |
|
||||||||||
| Estimated annual growth rate of Visa Class A share price |
|
|||||||||||||
| Estimated length of litigation resolution date |
Q2 2023
|
|||||||||||||
|
Insignificant Level 3 assets, net of
liabilities (d) |
(
|
|||||||||||||
| Total Level 3 assets, net of liabilities (e) | $ |
|
||||||||||||
The PNC Financial Services Group, Inc. –
Form 10-Q
79
(Continued from previous page)
December 31, 2021
|
Level 3 Instruments Only
Dollars in millions |
Fair Value | Valuation Techniques | Unobservable Inputs | Range (Weighted-Average) (a) | ||||||||||
| Commercial mortgage loans held for sale | $ |
|
Discounted cash flow | Spread over the benchmark curve (b) |
|
|||||||||
|
Residential mortgage-backed
non-agency securities |
|
Priced by a third-party vendor using a discounted cash flow pricing model | Constant prepayment rate |
|
||||||||||
| Constant default rate |
|
|||||||||||||
| Loss severity |
|
|||||||||||||
| Spread over the benchmark curve (b) |
|
|||||||||||||
| Asset-backed securities |
|
Priced by a third-party vendor using a discounted cash flow pricing model | Constant prepayment rate |
|
||||||||||
| Constant default rate |
|
|||||||||||||
| Loss severity |
|
|||||||||||||
| Spread over the benchmark curve (b) |
|
|||||||||||||
| Loans - Residential real estate |
|
Consensus pricing (c) | Cumulative default rate |
|
||||||||||
| Loss severity |
|
|||||||||||||
| Discount rate |
|
|||||||||||||
| Loans - Residential real estate |
|
Discounted cash flow | Loss severity |
|
||||||||||
| Discount rate |
|
|||||||||||||
| Loans - Home equity |
|
Consensus pricing (c) | Cumulative default rate |
|
||||||||||
| Loss severity |
|
|||||||||||||
| Discount rate |
|
|||||||||||||
| Loans - Home equity |
|
Consensus pricing (c) | Credit and Liquidity discount |
|
||||||||||
| Equity investments |
|
Multiple of adjusted earnings | Multiple of earnings |
|
||||||||||
| Residential mortgage servicing rights |
|
Discounted cash flow | Constant prepayment rate |
|
||||||||||
| Spread over the benchmark curve (b) |
|
|||||||||||||
| Commercial mortgage servicing rights |
|
Discounted cash flow | Constant prepayment rate |
|
||||||||||
| Discount rate |
|
|||||||||||||
|
Financial derivatives - Swaps related to
sales of certain Visa Class B common shares |
(
|
Discounted cash flow | Estimated conversion factor of Visa Class B shares into Class A shares |
|
||||||||||
| Estimated annual growth rate of Visa Class A share price |
|
|||||||||||||
|
Estimated length of litigation
resolution date |
Q2 2023
|
|||||||||||||
|
Insignificant Level 3 assets, net of
liabilities (d) |
|
|||||||||||||
| Total Level 3 assets, net of liabilities (e) | $ |
|
||||||||||||
(a)
Unobservable inputs were weighted by the relative fair value of the instruments.
(b)
The assumed yield spread over the benchmark curve for each instrument is generally intended to incorporate non-interest rate risks, such as credit and liquidity risks.
(c)
Consensus pricing refers to fair value estimates that are generally internally developed using information such as dealer quotes or other third-party provided valuations or comparable asset prices.
(d)
Represents the aggregate amount of Level 3 assets and liabilities measured at fair value on a recurring basis that are individually and in the aggregate insignificant. The amount includes certain financial derivative assets and liabilities, trading securities, other securities, residential mortgage loans held for sale, other assets, other borrowed funds and other liabilities.
Financial Assets Accounted for at Fair Value on a Nonrecurring Basis
We may be required to measure certain financial assets at fair value on a nonrecurring basis. These adjustments to fair value usually result from the application of lower of amortized cost or fair value accounting or write-downs of individual assets due to impairment and are included in Table 66. For more information regarding the valuation methodologies of our financial assets measured at fair value on a nonrecurring basis, see Note 15 Fair Value in the Notes To Consolidated Financial Statements included in Item 8 of our 2021 Form 10-K.
80
The PNC Financial Services Group, Inc. –
Form 10-Q
Assets measured at fair value on a nonrecurring basis follow:
Table 66: Fair Value Measurements – Nonrecurring (a) (b) (c)
| Fair Value |
Gains (Losses)
Three months ended |
Gains (Losses)
Nine months ended |
||||||||||||||||||||||||||||||||||||
| In millions |
September 30
2022 |
December 31
2021 |
September 30
2022 |
September 30
2021 |
September 30
2022 |
September 30
2021 |
||||||||||||||||||||||||||||||||
| Assets | ||||||||||||||||||||||||||||||||||||||
| Nonaccrual loans | $ |
|
$ |
|
$ |
(
|
$ |
(
|
$ |
(
|
$ |
(
|
||||||||||||||||||||||||||
| Equity investments |
|
|
||||||||||||||||||||||||||||||||||||
| Loans held for sale |
(
|
|
(
|
|||||||||||||||||||||||||||||||||||
| OREO and foreclosed assets |
|
|
|
|
||||||||||||||||||||||||||||||||||
| Long-lived assets |
|
|
(
|
(
|
(
|
(
|
||||||||||||||||||||||||||||||||
| Total assets | $ |
|
$ |
|
$ |
(
|
$ |
(
|
$ |
(
|
$ |
(
|
||||||||||||||||||||||||||
(a)
All Level 3 for the periods presented.
(b)
Valuation techniques applied were fair value of property or collateral.
(c)
Unobservable inputs used were appraised value/sales price, broker opinions or projected income/required improvement costs. Additional quantitative information was not meaningful for the periods presented.
Financial Instruments Accounted for under Fair Value Option
We elect the fair value option to account for certain financial instruments. For more information on these financial instruments for which the fair value option election has been made, see Note 15 Fair Value in the Notes To Consolidated Financial Statements included in Item 8 of our 2021 Form 10-K.
Table 67: Fair Value Option – Fair Value and Principal Balances
| September 30, 2022 | December 31, 2021 | |||||||||||||||||||||||||||||||||||||
| In millions | Fair Value |
Aggregate Unpaid
Principal Balance |
Difference | Fair Value |
Aggregate Unpaid
Principal Balance |
Difference | ||||||||||||||||||||||||||||||||
| Assets | ||||||||||||||||||||||||||||||||||||||
| Residential mortgage loans held for sale | ||||||||||||||||||||||||||||||||||||||
| Accruing loans less than 90 days past due | $ |
|
$ |
|
$ |
(
|
$ |
|
$ |
|
$ |
|
||||||||||||||||||||||||||
| Accruing loans 90 days or more past due |
|
|
|
|
||||||||||||||||||||||||||||||||||
| Nonaccrual loans |
|
|
(
|
|
|
(
|
||||||||||||||||||||||||||||||||
| Total | $ |
|
$ |
|
$ |
(
|
$ |
|
$ |
|
$ |
|
||||||||||||||||||||||||||
| Commercial mortgage loans held for sale (a) | ||||||||||||||||||||||||||||||||||||||
| Accruing loans less than 90 days past due | $ |
|
$ |
|
$ |
(
|
$ |
|
$ |
|
$ |
(
|
||||||||||||||||||||||||||
| Nonaccrual loans |
|
|
(
|
|
|
|
||||||||||||||||||||||||||||||||
| Total | $ |
|
$ |
|
$ |
(
|
$ |
|
$ |
|
$ |
(
|
||||||||||||||||||||||||||
| Loans | ||||||||||||||||||||||||||||||||||||||
| Accruing loans less than 90 days past due | $ |
|
$ |
|
$ |
(
|
$ |
|
$ |
|
$ |
(
|
||||||||||||||||||||||||||
| Accruing loans 90 days or more past due |
|
|
(
|
|
|
(
|
||||||||||||||||||||||||||||||||
| Nonaccrual loans |
|
|
(
|
|
|
(
|
||||||||||||||||||||||||||||||||
| Total | $ |
|
$ |
|
$ |
(
|
$ |
|
$ |
|
$ |
(
|
||||||||||||||||||||||||||
| Other assets | $ |
|
$ |
|
$ |
(
|
$ |
|
$ |
|
$ |
(
|
||||||||||||||||||||||||||
| Liabilities | ||||||||||||||||||||||||||||||||||||||
| Other borrowed funds | $ |
|
$ |
|
|
$ |
|
$ |
|
|
||||||||||||||||||||||||||||
| Other liabilities | $ |
|
$ |
|
||||||||||||||||||||||||||||||||||
(a)
There were no accruing loans 90 days or more past due within this category at September 30, 2022 or December 31, 2021.
The PNC Financial Services Group, Inc. –
Form 10-Q
81
The changes in fair value for items for which we elected the fair value option are as follows:
Table 68: Fair Value Option – Changes in Fair Value (a)
| Gains (Losses) | Gains (Losses) | |||||||||||||||||||||||||
| Three months ended | Nine months ended | |||||||||||||||||||||||||
| September 30 | September 30 | September 30 | September 30 | |||||||||||||||||||||||
| In millions | 2022 | 2021 | 2022 | 2021 | ||||||||||||||||||||||
| Assets | ||||||||||||||||||||||||||
| Residential mortgage loans held for sale | $ |
(
|
$ |
|
$ |
(
|
$ |
|
||||||||||||||||||
| Commercial mortgage loans held for sale | $ |
|
$ |
|
$ |
|
$ |
|
||||||||||||||||||
| Loans | $ |
|
$ |
|
$ |
|
$ |
|
||||||||||||||||||
| Other assets | $ |
(
|
$ |
|
$ |
(
|
$ |
|
||||||||||||||||||
| Liabilities | ||||||||||||||||||||||||||
| Other liabilities | $ |
(
|
$ |
(
|
||||||||||||||||||||||
(a)
The impact on earnings of offsetting hedged items or hedging instruments is not reflected in these amounts.
Additional Fair Value Information Related to Financial Instruments Not Recorded at Fair Value
| Carrying | Fair Value | |||||||||||||||||||||||||||||||
| In millions | Amount | Total | Level 1 | Level 2 | Level 3 | |||||||||||||||||||||||||||
| September 30, 2022 | ||||||||||||||||||||||||||||||||
| Assets | ||||||||||||||||||||||||||||||||
| Cash and due from banks | $ |
|
$ |
|
$ |
|
||||||||||||||||||||||||||
| Interest-earning deposits with banks |
|
|
$ |
|
||||||||||||||||||||||||||||
| Securities held to maturity |
|
|
|
|
$ |
|
||||||||||||||||||||||||||
| Net loans (excludes leases) |
|
|
|
|||||||||||||||||||||||||||||
| Other assets |
|
|
|
|
||||||||||||||||||||||||||||
| Total assets | $ |
|
$ |
|
$ |
|
$ |
|
$ |
|
||||||||||||||||||||||
| Liabilities | ||||||||||||||||||||||||||||||||
| Time deposits | $ |
|
$ |
|
$ |
|
||||||||||||||||||||||||||
| Borrowed funds |
|
|
|
$ |
|
|||||||||||||||||||||||||||
| Unfunded lending related commitments |
|
|
|
|||||||||||||||||||||||||||||
| Other liabilities |
|
|
|
|||||||||||||||||||||||||||||
| Total liabilities | $ |
|
$ |
|
$ |
|
$ |
|
||||||||||||||||||||||||
| December 31, 2021 | ||||||||||||||||||||||||||||||||
| Assets | ||||||||||||||||||||||||||||||||
| Cash and due from banks | $ |
|
$ |
|
$ |
|
||||||||||||||||||||||||||
| Interest-earning deposits with banks |
|
|
$ |
|
||||||||||||||||||||||||||||
| Securities held to maturity |
|
|
|
|
$ |
|
||||||||||||||||||||||||||
| Net loans (excludes leases) |
|
|
|
|||||||||||||||||||||||||||||
| Other assets |
|
|
|
|
||||||||||||||||||||||||||||
| Total assets | $ |
|
$ |
|
$ |
|
$ |
|
$ |
|
||||||||||||||||||||||
| Liabilities | ||||||||||||||||||||||||||||||||
| Time deposits | $ |
|
$ |
|
$ |
|
||||||||||||||||||||||||||
| Borrowed funds |
|
|
|
$ |
|
|||||||||||||||||||||||||||
| Unfunded lending related commitments |
|
|
|
|||||||||||||||||||||||||||||
| Other liabilities |
|
|
|
|||||||||||||||||||||||||||||
| Total liabilities | $ |
|
$ |
|
$ |
|
$ |
|
||||||||||||||||||||||||
82
The PNC Financial Services Group, Inc. –
Form 10-Q
The aggregate fair values in Table 69 represent only a portion of the total market value of our assets and liabilities as, in accordance with the guidance related to fair values about financial instruments, we exclude the following:
•
financial instruments recorded at fair value on a recurring basis (as they are disclosed in Table 63),
•
investments accounted for under the equity method,
•
equity securities without a readily determinable fair value that apply for the alternative measurement approach to fair value under ASU 2016-01,
•
real and personal property,
•
lease financing,
•
loan customer relationships,
•
deposit customer intangibles,
•
mortgage servicing rights (MSRs),
•
retail branch networks,
•
fee-based businesses, such as asset management and brokerage,
•
trademarks and brand names,
•
trade receivables and payables due in one year or less,
•
deposit liabilities with no defined or contractual maturities under ASU 2016-01, and
•
insurance contracts.
N
OTE
13
F
INANCIAL
D
ERIVATIVES
We use a variety of financial derivatives to both mitigate exposure to market (primarily interest rate) and credit risks inherent in our business activities, as well as to facilitate customer risk management activities. We manage these risks as part of our overall asset and liability management process and through our credit policies and procedures. Derivatives represent contracts between parties that usually require little or no initial net investment and result in one party delivering cash or another type of asset to the other party based on a notional amount and an underlying as specified in the contract.
Derivative transactions are often measured in terms of notional amount, but this amount is generally not exchanged and it is not recorded on the balance sheet. The notional amount is the basis to which the underlying is applied to determine required payments under the derivative contract. The underlying is a referenced interest rate, security price, credit spread or other index. Residential and commercial real estate loan commitments associated with loans to be sold also qualify as derivative instruments.
For more information regarding derivatives see Note 1 Accounting Policies and Note 16 Financial Derivatives in the Notes To Consolidated Financial Statements included in Item 8 of our 2021 Form 10-K.
The PNC Financial Services Group, Inc. –
Form 10-Q
83
The following table presents the notional and gross fair value amounts of all derivative assets and liabilities held by us:
Table 70: Total Gross Derivatives (a)
| September 30, 2022 | December 31, 2021 | |||||||||||||||||||
| In millions |
Notional /
Contract Amount |
Asset Fair
Value (b) |
Liability Fair
Value (c) |
Notional /
Contract Amount |
Asset Fair
Value (b) |
Liability Fair
Value (c) |
||||||||||||||
| Derivatives used for hedging | ||||||||||||||||||||
| Interest rate contracts (d): | ||||||||||||||||||||
| Fair value hedges | $ |
|
$ |
|
||||||||||||||||
| Cash flow hedges |
|
$ |
|
|
$ |
|
$ |
|
||||||||||||
| Foreign exchange contracts: | ||||||||||||||||||||
| Net investment hedges |
|
$ |
|
|
|
|
|
|||||||||||||
| Total derivatives designated for hedging | $ |
|
$ |
|
$ |
|
$ |
|
$ |
|
$ |
|
||||||||
| Derivatives not used for hedging | ||||||||||||||||||||
| Derivatives used for mortgage banking activities (e): | ||||||||||||||||||||
| Interest rate contracts: | ||||||||||||||||||||
| Swaps | $ |
|
$ |
|
$ |
|
||||||||||||||
| Futures (f) |
|
|
||||||||||||||||||
| Mortgage-backed commitments |
|
$ |
|
|
|
$ |
|
$ |
|
|||||||||||
| Other |
|
|
|
|
|
|
||||||||||||||
| Total interest rate contracts |
|
|
|
|
|
|
||||||||||||||
| Derivatives used for customer-related activities: | ||||||||||||||||||||
| Interest rate contracts: | ||||||||||||||||||||
| Swaps |
|
|
|
|
|
|
||||||||||||||
| Futures (f) |
|
|
||||||||||||||||||
| Mortgage-backed commitments |
|
|
|
|
|
|
||||||||||||||
| Other |
|
|
|
|
|
|
||||||||||||||
| Total interest rate contracts |
|
|
|
|
|
|
||||||||||||||
| Commodity contracts: | ||||||||||||||||||||
| Swaps |
|
|
|
|
|
|
||||||||||||||
| Other |
|
|
|
|
|
|
||||||||||||||
| Total commodity contracts |
|
|
|
|
|
|
||||||||||||||
| Foreign exchange contracts and other |
|
|
|
|
|
|
||||||||||||||
| Total derivatives for customer-related activities |
|
|
|
|
|
|
||||||||||||||
| Derivatives used for other risk management activities: | ||||||||||||||||||||
| Foreign exchange contracts and other |
|
|
|
|
|
|
||||||||||||||
| Total derivatives not designated for hedging | $ |
|
$ |
|
$ |
|
$ |
|
$ |
|
$ |
|
||||||||
| Total gross derivatives | $ |
|
$ |
|
$ |
|
$ |
|
$ |
|
$ |
|
||||||||
| Less: Impact of legally enforceable master netting agreements |
|
|
|
|
||||||||||||||||
| Less: Cash collateral received/paid |
|
|
|
|
||||||||||||||||
| Total derivatives | $ |
|
$ |
|
$ |
|
$ |
|
||||||||||||
(a)
Centrally cleared derivatives are settled in cash daily and result in no derivative asset or derivative liability being recognized on our Consolidated Balance Sheet
.
(b)
Included in Other assets on our Consolidated Balance Sheet.
(c)
Included in Other liabilities on our Consolidated Balance Sheet.
(d)
Represents primarily swaps.
(e)
Includes both residential and commercial mortgage banking activities.
All derivatives are carried on our Consolidated Balance Sheet at fair value. Derivative balances are presented on the Consolidated Balance Sheet on a net basis taking into consideration the effects of legally enforceable master netting agreements and, when appropriate, any related cash collateral exchanged with counterparties. Further discussion regarding the offsetting rights associated with these legally enforceable master netting agreements is included in the Offsetting and Counterparty Credit Risk section of this Note 13. Any nonperformance risk, including credit risk, is included in the determination of the estimated net fair value of the derivatives.
84
The PNC Financial Services Group, Inc. –
Form 10-Q
Derivatives Designated As Hedging Instruments
Certain derivatives used to manage interest rate and foreign exchange risk as part of our asset and liability risk management activities are designated as accounting hedges. Derivatives hedging the risks associated with changes in the fair value of assets or liabilities are considered fair value hedges, derivatives hedging the variability of expected future cash flows are considered cash flow hedges and derivatives hedging a net investment in a foreign subsidiary are considered net investment hedges. Designating derivatives as accounting hedges allows for gains and losses on those derivatives to be recognized in the same period and in the same income statement line item as the earnings impact of the hedged items.
Fair Value Hedges
We enter into receive-fixed, pay-variable interest rate swaps to hedge changes in the fair value of outstanding fixed-rate debt caused by fluctuations in market interest rates. We also enter into pay-fixed, receive-variable interest rate swaps and zero-coupon swaps to hedge changes in the fair value of fixed rate and zero-coupon investment securities caused by fluctuations in market interest rates. Gains and losses on the interest rate swaps designated in these hedge relationships, along with the offsetting gains and losses on the hedged items attributable to the hedged risk, are recognized in current earnings within the same income statement line item.
Cash Flow Hedges
We enter into receive-fixed, pay-variable interest rate swaps and interest rate caps and floors to modify the interest rate characteristics of designated commercial loans from variable to fixed in order to reduce the impact of changes in future cash flows due to market interest rate changes. We also periodically enter into forward purchase and sale contracts to hedge the variability of the consideration that will be paid or received related to the purchase or sale of investment securities. The forecasted purchase or sale is consummated upon gross settlement of the forward contract itself. For these cash flow hedges, gains and losses on the hedging instruments are recorded in AOCI and are then reclassified into earnings in the same period the hedged cash flows affect earnings and within the same income statement line as the hedged cash flows.
In the 12 months that follow September 30, 2022, we expect to reclassify net derivative losses of $
1.2
billion pretax, or $
1.0
billion after-tax, from AOCI to interest income for these cash flow hedge strategies. This reclassified amount could differ from amounts actually recognized due to changes in interest rates, hedge de-designations and the addition of other hedges subsequent to September 30, 2022. As of September 30, 2022, the maximum length of time over which forecasted transactions are hedged is
ten years
.
The PNC Financial Services Group, Inc. –
Form 10-Q
85
Further detail regarding gains (losses) related to our fair value and cash flow hedge derivatives is presented in the following table:
Table 71: Gains (Losses) Recognized on Fair Value and Cash Flow Hedges in the Consolidated Income Statement (a) (b)
| Location and Amount of Gains (Losses) Recognized in Income | ||||||||||||||
| Interest Income | Interest Expense | Noninterest Income | ||||||||||||
| In millions | Loans | Investment Securities | Borrowed Funds | Other | ||||||||||
| For the three months ended September 30, 2022 | ||||||||||||||
| Total amounts in the Consolidated Income Statement | $ |
|
$ |
|
$ |
|
$ |
|
||||||
| Gains (losses) on fair value hedges recognized on: | ||||||||||||||
| Hedged items (c) | $ |
(
|
$ |
|
||||||||||
| Derivatives | $ |
|
$ |
(
|
||||||||||
| Amounts related to interest settlements on derivatives | $ |
(
|
$ |
|
||||||||||
| Gains (losses) on cash flow hedges (d): | ||||||||||||||
|
Amount of derivative gains (losses) reclassified from accumulated
other comprehensive income |
$ |
(
|
$ |
(
|
||||||||||
| For the three months ended September 30, 2021 | ||||||||||||||
| Total amounts in the Consolidated Income Statement | $ |
|
$ |
|
$ |
|
$ |
|
||||||
| Gains (losses) on fair value hedges recognized on: | ||||||||||||||
| Hedged items (c) | $ |
|
$ |
|
||||||||||
| Derivatives |
|
$ |
(
|
|||||||||||
| Amounts related to interest settlements on derivatives | $ |
(
|
$ |
|
||||||||||
| Gains (losses) on cash flow hedges (d): | ||||||||||||||
|
Amount of derivative gains (losses) reclassified from accumulated
other comprehensive income |
$ |
|
$ |
|
$ |
|
||||||||
| For the nine months ended September 30, 2022 | ||||||||||||||
| Total amounts on the Consolidated Income Statement | $ |
|
$ |
|
$ |
|
$ |
|
||||||
| Gains (losses) on fair value hedges recognized on: | ||||||||||||||
| Hedged items (c) | $ |
(
|
$ |
|
||||||||||
| Derivatives | $ |
|
$ |
(
|
||||||||||
| Amounts related to interest settlements on derivatives | $ |
(
|
$ |
|
||||||||||
| Gains (losses) on cash flow hedges (d): | ||||||||||||||
|
Amount of derivative gains (losses) reclassified from accumulated
other comprehensive income |
$ |
(
|
$ |
|
||||||||||
| For the nine months ended September 30, 2021 | ||||||||||||||
| Total amounts on the Consolidated Income Statement | $ |
|
$ |
|
$ |
|
$ |
|
||||||
| Gains (losses) on fair value hedges recognized on: | ||||||||||||||
| Hedged items (c) | $ |
(
|
$ |
|
||||||||||
| Derivatives | $ |
|
$ |
(
|
||||||||||
| Amounts related to interest settlements on derivatives | $ |
(
|
$ |
|
||||||||||
| Gains (losses) on cash flow hedges (d): | ||||||||||||||
|
Amount of derivative gains (losses) reclassified from accumulated
other comprehensive income |
$ |
|
$ |
|
$ |
|
||||||||
(a)
For all periods presented, there were no components of derivative gains or losses excluded from the assessment of hedge effectiveness for any of the fair value or cash flow hedge strategies.
(b)
All cash flow and fair value hedge derivatives were interest rate contracts for the periods presented.
(c)
Includes an insignificant amount of fair value hedge adjustments related to discontinued hedge relationships.
86
The PNC Financial Services Group, Inc. –
Form 10-Q
Detail regarding the impact of fair value hedge accounting on the carrying value of the hedged items is presented in the following table:
Table 72: Hedged Items - Fair Value Hedges
| September 30, 2022 | December 31, 2021 | |||||||||||||||||||||||||
| In millions | Carrying Value of the Hedged Items | Cumulative Fair Value Hedge Adjustment included in the Carrying Value of Hedged Items (a) | Carrying Value of the Hedged Items | Cumulative Fair Value Hedge Adjustment included in the Carrying Value of Hedged Items (a) | ||||||||||||||||||||||
| Investment securities - available for sale (b) | $ |
|
$ |
(
|
$ |
|
$ |
|
||||||||||||||||||
| Borrowed funds | $ |
|
$ |
(
|
$ |
|
$ |
|
||||||||||||||||||
(a)
Includes less than $(
0.1
) billion and $(
0.1
) billion of fair value hedge adjustments primarily related to discontinued borrowed funds hedge relationships at September 30, 2022 and December 31, 2021, respectively.
(b)
Carrying value shown represents amortized cost.
Net Investment Hedges
We enter into foreign currency forward contracts to hedge non-U.S. dollar net investments in foreign subsidiaries against adverse changes in foreign exchange rates. We assess whether the hedging relationship is highly effective in achieving offsetting changes in the value of the hedge and hedged item by qualitatively verifying that the critical terms of the hedge and hedged item match at the inception of the hedging relationship and on an ongoing basis. Net investment hedge derivatives are classified as foreign exchange contracts. There were
no
components of derivative gains or losses excluded from the assessment of the hedge effectiveness for the periods presented.
Derivatives Not Designated As Hedging Instruments
For additional information on derivatives not designated as hedging instruments under GAAP, see Note 16 Financial Derivatives in the Notes To Consolidated Financial Statements included in Item 8 of our 2021 Form 10-K.
Further detail regarding the gains (losses) on derivatives not designated in hedging relationships is presented in the following table:
Table 73: Gains (Losses) on Derivatives Not Designated for Hedging
|
Three months ended
September 30 |
Nine months ended
September 30 |
|||||||||||||||||||
| In millions | 2022 | 2021 | 2022 | 2021 | ||||||||||||||||
| Derivatives used for mortgage banking activities: | ||||||||||||||||||||
| Interest rate contracts (a) | $ |
(
|
$ |
|
$ |
(
|
$ |
(
|
||||||||||||
| Derivatives used for customer-related activities: | ||||||||||||||||||||
| Interest rate contracts |
|
(
|
|
|
||||||||||||||||
| Foreign exchange contracts and other |
(
|
|
|
|
||||||||||||||||
| Gains (losses) from customer-related activities (b) |
|
|
|
|
||||||||||||||||
| Derivatives used for other risk management activities: | ||||||||||||||||||||
| Foreign exchange contracts and other (b) |
|
(
|
|
(
|
||||||||||||||||
| Total gains (losses) from derivatives not designated as hedging instruments | $ |
|
$ |
(
|
$ |
|
$ |
|
||||||||||||
(a)
Included in Residential and commercial mortgage noninterest income on our Consolidated Income Statement.
(b)
Included in Capital markets related and Other noninterest income on our Consolidated Income Statement.
Offsetting and Counterparty Credit Risk
We generally utilize a net presentation on the Consolidated Balance Sheet for those derivative financial instruments entered into with counterparties under legally enforceable master netting agreements. The master netting agreements reduce credit risk by permitting the closeout netting of all outstanding derivative instruments under the master netting agreement with the same counterparty upon the occurrence of an event of default. The master netting agreement also may require the exchange of cash or marketable securities to collateralize either party’s net position. For additional information on derivative offsetting and counterparty credit risk, see Note 16 Financial Derivatives in the Notes To Consolidated Financial Statements included in Item 8 of our 2021 Form 10-K.
Table 74 shows the impact legally enforceable master netting agreements had on our derivative assets and derivative liabilities at September 30, 2022 and December 31, 2021. The table includes cash collateral held or pledged under legally enforceable master netting agreements. The table also includes the fair value of any securities collateral held or pledged under legally enforceable master netting agreements. Cash and securities collateral amounts are included in the table only to the extent of the related net derivative fair values.
The PNC Financial Services Group, Inc. –
Form 10-Q
87
Table 74: Derivative Assets and Liabilities Offsetting
| In millions |
Amounts Offset on the
Consolidated Balance Sheet |
Securities Collateral Held/Pledged Under Master Netting Agreements | |||||||||||||||||||||||||||||||||||||||||||||
|
Gross
Fair Value |
Fair Value
Offset Amount |
Cash
Collateral |
Net
Fair Value |
Net Amounts | |||||||||||||||||||||||||||||||||||||||||||
| September 30, 2022 | |||||||||||||||||||||||||||||||||||||||||||||||
| Derivative assets | |||||||||||||||||||||||||||||||||||||||||||||||
| Interest rate contracts: | |||||||||||||||||||||||||||||||||||||||||||||||
| Over-the-counter cleared | $ |
|
$ |
|
$ |
|
|||||||||||||||||||||||||||||||||||||||||
| Over-the-counter |
|
$ |
|
$ |
|
|
$ |
|
|
||||||||||||||||||||||||||||||||||||||
| Commodity contracts |
|
|
|
|
|
||||||||||||||||||||||||||||||||||||||||||
| Foreign exchange and other contracts |
|
|
|
|
|
||||||||||||||||||||||||||||||||||||||||||
| Total derivative assets | $ |
|
$ |
|
$ |
|
$ |
|
(a) | $ |
|
$ |
|
||||||||||||||||||||||||||||||||||
| Derivative liabilities | |||||||||||||||||||||||||||||||||||||||||||||||
| Interest rate contracts: | |||||||||||||||||||||||||||||||||||||||||||||||
| Over-the-counter cleared | $ |
|
$ |
|
$ |
|
|||||||||||||||||||||||||||||||||||||||||
| Over-the-counter |
|
$ |
|
$ |
|
|
$ |
|
|
||||||||||||||||||||||||||||||||||||||
| Commodity contracts |
|
|
|
|
|
||||||||||||||||||||||||||||||||||||||||||
| Foreign exchange and other contracts |
|
|
|
|
|
||||||||||||||||||||||||||||||||||||||||||
| Total derivative liabilities | $ |
|
$ |
|
$ |
|
$ |
|
(b) | $ |
|
$ |
|
||||||||||||||||||||||||||||||||||
| December 31, 2021 | |||||||||||||||||||||||||||||||||||||||||||||||
| Derivative assets | |||||||||||||||||||||||||||||||||||||||||||||||
| Interest rate contracts: | |||||||||||||||||||||||||||||||||||||||||||||||
| Over-the-counter cleared | $ |
|
$ |
|
$ |
|
|||||||||||||||||||||||||||||||||||||||||
| Over-the-counter |
|
$ |
|
$ |
|
|
$ |
|
|
||||||||||||||||||||||||||||||||||||||
| Commodity contracts |
|
|
|
|
|
||||||||||||||||||||||||||||||||||||||||||
| Foreign exchange and other contracts |
|
|
|
|
|
||||||||||||||||||||||||||||||||||||||||||
| Total derivative assets | $ |
|
$ |
|
$ |
|
$ |
|
(a) | $ |
|
$ |
|
||||||||||||||||||||||||||||||||||
| Derivative liabilities | |||||||||||||||||||||||||||||||||||||||||||||||
| Interest rate contracts: | |||||||||||||||||||||||||||||||||||||||||||||||
| Over-the-counter cleared | $ |
|
$ |
|
$ |
|
|||||||||||||||||||||||||||||||||||||||||
| Over-the-counter |
|
$ |
|
$ |
|
|
|
||||||||||||||||||||||||||||||||||||||||
| Commodity contracts |
|
|
|
|
|
||||||||||||||||||||||||||||||||||||||||||
| Foreign exchange and other contracts |
|
|
|
|
|
||||||||||||||||||||||||||||||||||||||||||
| Total derivative liabilities | $ |
|
$ |
|
$ |
|
$ |
|
(b) | $ |
|
||||||||||||||||||||||||||||||||||||
(a)
Represents the net amount of derivative assets included in Other assets on our Consolidated Balance Sheet.
(b)
Represents the net amount of derivative liabilities included in Other liabilities on our Consolidated Balance Sheet.
In addition to using master netting agreements and other collateral agreements to reduce credit risk associated with derivative instruments, we also seek to manage credit risk by evaluating credit ratings of counterparties and by using internal credit analysis, limits and monitoring procedures.
At September 30, 2022, cash and debt securities (primarily agency mortgage-backed securities) totaling $
2.2
billion were pledged to us under master netting agreements and other collateral agreements to collateralize net derivative assets due from counterparties and to meet initial margin requirements, and we pledged cash and debt securities (primarily agency mortgage-backed securities) totaling $
3.9
billion under these agreements to collateralize net derivative liabilities owed to counterparties and to meet initial margin requirements. These totals may differ from the amounts presented in the preceding offsetting table because these totals may include collateral
88
The PNC Financial Services Group, Inc. –
Form 10-Q
exchanged under an agreement that does not qualify as a master netting agreement or because the total amount of collateral pledged exceeds the net derivative fair values with the counterparty as of the balance sheet date due to timing or other factors, such as initial margin. To the extent not netted against the derivative fair values under a master netting agreement, the receivable for cash pledged is included in Other assets and the obligation for cash held is included in Other liabilities on our Consolidated Balance Sheet. Securities pledged to us by counterparties are not recognized on our balance sheet. Likewise, securities we have pledged to counterparties remain on our balance sheet.
Credit-Risk Contingent Features
Certain derivative agreements contain various credit-risk related contingent provisions, such as those that require our debt to maintain a specified credit rating from one or more of the major credit rating agencies. If our debt ratings were to fall below such specified ratings, the counterparties to the derivative instruments could request immediate payment or demand immediate and ongoing full collateralization on derivative instruments in net liability positions. The following table presents the aggregate fair value of derivative instruments with credit-risk-related contingent features, the associated collateral posted in the normal course of business and the maximum amount of collateral we would be required to post if the credit-risk-related contingent features underlying these agreements had been triggered on September 30, 2022 and December 31, 2021.
Table 75: Credit-Risk Contingent Features
| In billions |
September 30
2022 |
December 31
2021 |
||||||||||||
| Net derivative liabilities with credit-risk contingent features | $ |
|
$ |
|
||||||||||
| Collateral posted |
|
|
||||||||||||
| Maximum additional amount of collateral exposure | $ |
|
$ |
|
||||||||||
N
OTE
14
L
EGAL
P
ROCEEDINGS
We establish accruals for legal proceedings, including litigation and regulatory and governmental investigations and inquiries, when information related to the loss contingencies represented by those matters indicates both that a loss is probable and that the amount of loss can be reasonably estimated. Any such accruals are adjusted thereafter as appropriate to reflect changed circumstances. When we are able to do so, we also determine estimates of possible losses or ranges of possible losses, whether in excess of any related accrued liability or where there is no accrued liability, for disclosed legal proceedings (“Disclosed Matters,” which are those matters disclosed in this Note 14 as well as those matters disclosed in Note 21 Legal Proceedings in Item 8 of our 2021 Form 10-K, in Note 13 Legal Proceedings in Item 1 of our first quarter 2022 Form 10-Q and in Note 14 Legal Proceedings in Item 1 of our second quarter 2022 Form 10-Q
(such prior disclosure referred to as “Prior Disclosure”)). For Disclosed Matters where we are able to estimate such possible losses or ranges of possible losses, as of September 30, 2022, we estimate that it is reasonably possible that we could incur losses in excess of related accrued liabilities, if any, in an aggregate amount less than $
300
million. The estimates included in this amount are based on our analysis of currently available information and are subject to significant judgment and a variety of assumptions and uncertainties. As new information is obtained we may change our estimates. Due to the inherent subjectivity of the assessments and unpredictability of outcomes of legal proceedings, any amounts accrued or included in this aggregate amount may not represent the ultimate loss to us from the legal proceedings in question. Thus, our exposure and ultimate losses may be higher, and possibly significantly so, than the amounts accrued or this aggregate amount.
As a result of the types of factors described in Note 21 Legal Proceedings in Item 8 of our 2021 Form 10-K, we are unable, at this time, to estimate the losses that are reasonably possible to be incurred or ranges of such losses with respect to some of the matters disclosed, and the aggregate estimated amount provided above does not include an estimate for every Disclosed Matter. Therefore, as the estimated aggregate amount disclosed above does not include all of the Disclosed Matters, the amount disclosed above does not represent our maximum reasonably possible loss exposure for all of the Disclosed Matters. The estimated aggregate amount also does not reflect any of our exposure to matters not so disclosed, as discussed below under “Other.”
We include in some of the descriptions of individual Disclosed Matters certain quantitative information related to the plaintiff’s claim against us as alleged in the plaintiff’s pleadings or other public filings or otherwise publicly available information. While information of this type may provide insight into the potential magnitude of a matter, it does not necessarily represent our estimate of reasonably possible loss or our judgment as to any currently appropriate accrual.
Some of our exposure in Disclosed Matters may be offset by applicable insurance coverage. We do not consider the possible availability of insurance coverage in determining the amounts of any accruals (although we record the amount of related insurance recoveries that are deemed probable up to the amount of the accrual) or in determining any estimates of possible losses or ranges of possible losses.
The PNC Financial Services Group, Inc. –
Form 10-Q
89
USAA Patent Infringement Litigation
In July 2022, following a jury verdict in
United Services Automobile Association v. PNC Bank N.A.
(Case No. 2:20-cv-319) (the “first Texas case”) and
United Services Automobile Association v. PNC Bank N.A.
(Case No. 2:21-cv-110) (together, “the first consolidated cases”), the parties submitted briefs on PNC’s remaining equitable defenses. In August 2022, the court denied our request for relief, entered final judgment, declined to award enhanced damages for willfulness and awarded USAA pre-judgment and applicable post-judgment interest. In September 2022, PNC filed its post-trial motions for judgment as a matter of law and for a new trial.
In September 2022, following a jury trial in the second consolidated cases (representing the case for PNC’s patent infringement counterclaims (originally asserted in the first Texas case) which was previously consolidated into USAA’s third lawsuit filed in July 2021 in the United States District Court for the Eastern District of Texas against PNC Bank for patent infringement (
United Services Automobile Association v. PNC Bank N.A.
(Case No. 2:21-cv-246)) (“the third Texas case”)), a jury found against PNC for infringement of at least one of the two asserted patents and awarded $
4.3
million, and determined that PNC did not willfully infringe the patents. The jury further found that USAA did not infringe any of PNC’s asserted patents.
Because of USAA’s case narrowing in the first consolidated cases, only one of the three patents granted inter partes review (“IPR”) by the Patent Trial and Appeal Board was presented to the jury in the first consolidated cases. In addition, because of USAA’s case narrowing in the third Texas case, only one of the two patents granted IPR by the Patent Trial and Appeal Board was presented to the jury in the third Texas case.
Regulatory and Governmental Inquiries
We are the subject of investigations, audits, examinations and other forms of regulatory and governmental inquiry covering a broad
range of issues in our consumer, mortgage, brokerage, securities and other financial services businesses, as well as other aspects of our operations. In some cases, these inquiries are part of reviews of specified activities at multiple industry participants; in others, they are directed at PNC individually. From time to time, these inquiries have involved and may in the future involve or lead to regulatory enforcement actions and other administrative proceedings. These inquiries have also led to and may in the future lead to civil or criminal judicial proceedings. Some of these inquiries result in remedies including fines, penalties, restitution, or alterations in our business practices, and in additional expenses and collateral costs and other consequences. Such remedies and other consequences typically have not been material to us from a financial standpoint, but could be in the future. Even if not financially material, they may result in significant reputational harm or other adverse consequences.
Our practice is to cooperate fully with regulatory and governmental investigations, audits and other inquiries.
Other
In addition to the proceedings or other matters described in Prior Disclosure, PNC and persons to whom we may have indemnification obligations, in the normal course of business, are subject to various other pending and threatened legal proceedings in which claims for monetary damages and other relief are asserted. We do not anticipate, at the present time, that the ultimate aggregate liability, if any, arising out of such other legal proceedings will have a material adverse effect on our financial position. However, we cannot now determine whether or not any claims asserted against us or others to whom we may have indemnification obligations, whether in the proceedings or other matters described above or otherwise, will have a material adverse effect on our results of operations in any future reporting period, which will depend on, among other things, the amount of the loss resulting from the claim and the amount of income otherwise reported for the reporting period.
90
The PNC Financial Services Group, Inc. –
Form 10-Q
N
OTE
15
S
EGMENT
R
EPORTING
We have
three
reportable business segments:
•
Retail Banking
•
Corporate & Institutional Banking
•
Asset Management Group
Results of individual businesses are presented based on our internal management reporting practices. There is no comprehensive, authoritative body of guidance for management accounting equivalent to GAAP; therefore, the financial results of our individual businesses are not necessarily comparable with similar information for any other company. We periodically refine our internal methodologies as management reporting practices are enhanced. To the extent significant and practicable, retrospective application of new methodologies is made to prior period reportable business segment results and disclosures to create comparability with the current period.
Total business segment financial results differ from total consolidated net income. These differences are reflected in the “Other” category in Table 76. “Other” includes residual activities that do not meet the criteria for disclosure as a separate reportable business, such as asset and liability management activities, including net securities gains or losses, ACL for investment securities, certain trading activities, certain runoff consumer loan portfolios, private equity investments, intercompany eliminations, certain corporate overhead, tax adjustments that are not allocated to business segments, exited businesses and differences between business segment performance reporting and financial statement reporting (GAAP). Assets, revenue and earnings attributable to foreign activities were not material in the periods presented for comparison.
Financial results are presented, to the extent practicable, as if each business operated on a stand-alone basis. Additionally, we have aggregated the results for corporate support functions within “Other” for financial reporting purposes.
Net interest income in business segment results reflects our internal funds transfer pricing methodology. Assets receive a funding charge and liabilities and capital receive a funding credit based on a transfer pricing methodology that incorporates product repricing characteristics, tenor and other factors.
We have allocated the ALLL and the allowance for unfunded lending related commitments based on the loan exposures within each business segment’s portfolio. Key reserve assumptions and estimation processes react to and are influenced by observed changes in loan portfolio performance experience, the financial strength of the borrower and economic conditions. Key reserve assumptions are periodically updated.
The PNC Financial Services Group, Inc. –
Form 10-Q
91
Business Segment Results
|
Three months ended September 30
In millions |
Retail Banking |
Corporate &
Institutional Banking |
Asset
Management Group |
Other | Consolidated (a) | |||||||||||||||||||||||||||
| 2022 | ||||||||||||||||||||||||||||||||
| Income Statement | ||||||||||||||||||||||||||||||||
| Net interest income | $ |
|
$ |
|
$ |
|
$ |
(
|
$ |
|
||||||||||||||||||||||
| Noninterest income |
|
|
|
|
|
|||||||||||||||||||||||||||
| Total revenue |
|
|
|
|
|
|||||||||||||||||||||||||||
| Provision for (recapture of) credit losses |
|
|
|
(
|
|
|||||||||||||||||||||||||||
| Depreciation and amortization |
|
|
|
|
|
|||||||||||||||||||||||||||
| Other noninterest expense |
|
|
|
|
|
|||||||||||||||||||||||||||
| Income (loss) before income taxes (benefit) and noncontrolling interests |
|
|
|
(
|
|
|||||||||||||||||||||||||||
| Income taxes (benefit) |
|
|
|
(
|
|
|||||||||||||||||||||||||||
| Net income |
|
|
|
|
|
|||||||||||||||||||||||||||
| Less: Net income (loss) attributable to noncontrolling interests |
|
|
(
|
|
||||||||||||||||||||||||||||
| Net income excluding noncontrolling interests | $ |
|
$ |
|
$ |
|
$ |
|
$ |
|
||||||||||||||||||||||
| Average Assets | $ |
|
$ |
|
$ |
|
$ |
|
$ |
|
||||||||||||||||||||||
| 2021 | ||||||||||||||||||||||||||||||||
| Income Statement | ||||||||||||||||||||||||||||||||
| Net interest income | $ |
|
$ |
|
$ |
|
$ |
(
|
$ |
|
||||||||||||||||||||||
| Noninterest income |
|
|
|
|
|
|||||||||||||||||||||||||||
| Total revenue |
|
|
|
|
|
|||||||||||||||||||||||||||
| Provision for (recapture of) credit losses |
(
|
(
|
(
|
|
(
|
|||||||||||||||||||||||||||
| Depreciation and amortization |
|
|
|
|
|
|||||||||||||||||||||||||||
| Other noninterest expense |
|
|
|
|
|
|||||||||||||||||||||||||||
| Income (loss) before income taxes (benefit) and noncontrolling interests |
|
|
|
(
|
|
|||||||||||||||||||||||||||
| Income taxes (benefit) |
|
|
|
(
|
|
|||||||||||||||||||||||||||
| Net income (loss) |
|
|
|
(
|
|
|||||||||||||||||||||||||||
| Less: Net income attributable to noncontrolling interests |
|
|
|
|
||||||||||||||||||||||||||||
| Net income (loss) excluding noncontrolling interests | $ |
|
$ |
|
$ |
|
$ |
(
|
$ |
|
||||||||||||||||||||||
| Average Assets | $ |
|
$ |
|
$ |
|
$ |
|
$ |
|
||||||||||||||||||||||
92
The PNC Financial Services Group, Inc. –
Form 10-Q
| (Continued from previous page) | ||||||||||||||||||||||||||||||||
|
Nine months ended September 30
In millions |
Retail
Banking |
Corporate &
Institutional Banking |
Asset
Management Group |
Other | Consolidated (a) | |||||||||||||||||||||||||||
| 2022 | ||||||||||||||||||||||||||||||||
| Income Statement | ||||||||||||||||||||||||||||||||
| Net interest income | $ |
|
$ |
|
$ |
|
$ |
(
|
$ |
|
||||||||||||||||||||||
| Noninterest income |
|
|
|
|
|
|||||||||||||||||||||||||||
| Total revenue |
|
|
|
|
|
|||||||||||||||||||||||||||
| Provision for (recapture of) credit losses |
|
|
|
(
|
|
|||||||||||||||||||||||||||
| Depreciation and amortization |
|
|
|
|
|
|||||||||||||||||||||||||||
| Other noninterest expense |
|
|
|
|
|
|||||||||||||||||||||||||||
| Income (loss) before income taxes (benefit) and noncontrolling interests |
|
|
|
(
|
|
|||||||||||||||||||||||||||
| Income taxes (benefit) |
|
|
|
(
|
|
|||||||||||||||||||||||||||
| Net income |
|
|
|
|
|
|||||||||||||||||||||||||||
| Less: Net income (loss) attributable to noncontrolling interests |
|
|
(
|
|
||||||||||||||||||||||||||||
| Net income excluding noncontrolling interests | $ |
|
$ |
|
$ |
|
$ |
|
$ |
|
||||||||||||||||||||||
| Average Assets | $ |
|
$ |
|
$ |
|
$ |
|
$ |
|
||||||||||||||||||||||
| 2021 | ||||||||||||||||||||||||||||||||
| Income Statement | ||||||||||||||||||||||||||||||||
| Net interest income | $ |
|
$ |
|
$ |
|
$ |
(
|
$ |
|
||||||||||||||||||||||
| Noninterest income |
|
|
|
|
|
|||||||||||||||||||||||||||
| Total revenue |
|
|
|
|
|
|||||||||||||||||||||||||||
| Provision for (recapture of) credit losses |
(
|
(
|
|
(
|
(
|
|||||||||||||||||||||||||||
| Depreciation and amortization |
|
|
|
|
|
|||||||||||||||||||||||||||
| Other noninterest expense |
|
|
|
|
|
|||||||||||||||||||||||||||
| Income (loss) before income taxes (benefit) and noncontrolling interests |
|
|
|
(
|
|
|||||||||||||||||||||||||||
| Income taxes (benefit) |
|
|
|
(
|
|
|||||||||||||||||||||||||||
| Net income (loss) |
|
|
|
(
|
|
|||||||||||||||||||||||||||
| Less: Net income attributable to noncontrolling interests |
|
|
|
|
||||||||||||||||||||||||||||
| Net income (loss) excluding noncontrolling interests | $ |
|
$ |
|
$ |
|
$ |
(
|
$ |
|
||||||||||||||||||||||
| Average Assets | $ |
|
$ |
|
$ |
|
$ |
|
$ |
|
||||||||||||||||||||||
(a)
There were no material intersegment revenues for the three and nine months ended September 30, 2022 and 2021.
Business Segment Products and Services
Retail Banking
provides deposit, lending, brokerage, insurance services, investment management and cash management products and services to consumer and small business customers. Our customers are serviced through our branch network, ATMs, call centers, online banking and mobile channels. As a result of the BBVA acquisition, we have become a coast-to-coast retail bank. Our national expansion strategy is designed to grow customers with digitally-led banking and a thin branch network as we expand into new markets. Deposit products include checking, savings and money market accounts and certificates of deposit. Lending products include residential mortgages, home equity loans and lines of credit, auto loans, credit cards, education loans and personal and small business loans and lines of credit. The residential mortgage loans are directly originated within our branch network and nationwide, and are typically underwritten to agency and/or third-party standards, and either sold, servicing retained or held on our balance sheet. Brokerage, investment management and cash management products and services include managed, education, retirement and trust accounts.
Corporate & Institutional Banking
provides lending, treasury management and capital markets related products and services to mid-sized and large corporations, and government and not-for-profit entities. Lending products include secured and unsecured loans, letters of credit and equipment leases. The Treasury Management business provides corporations with cash and investment management services, receivables and disbursement management services, funds transfer services, international payment services and access to online/mobile information management and reporting services. Within Treasury Management, PNC Global Transfers provides wholesale money transfer processing capabilities between the U.S., Mexico and other countries primarily in Central and South America. Capital markets related products and services include foreign exchange, derivatives, fixed income, securities underwriting, loan syndications, mergers and acquisitions advisory and equity capital markets advisory related services. We also provide commercial loan servicing and technology solutions for the commercial real estate finance industry. Products and services are provided nationally.
Asset Management Group
provides private banking for high net worth and ultra high net worth clients and institutional asset management. The Asset Management group is composed of
two
distinct operating units:
•
PNC Private Bank provides products and services to emerging affluent, high net worth and ultra high net worth individuals and their families including investment and retirement planning, customized investment management, credit and cash
The PNC Financial Services Group, Inc. –
Form 10-Q
93
management solutions, trust management and administration. In addition, multi-generational family planning services are also provided to ultra high net worth individuals and their families which include estate, financial, tax, fiduciary and customized performance reporting through PNC Private Bank Hawthorn.
•
Institutional Asset Management provides outsourced chief investment officer, custody, private real estate, cash and fixed income client solutions, retirement plan fiduciary investment services to institutional clients including corporations, healthcare systems, insurance companies, unions, municipalities and non-profits.
N
OTE
16
F
EE
-
BASED
R
EVENUE
FROM
C
ONTRACTS
WITH
C
USTOMERS
As more fully described in Note 24 Fee-based Revenue from Contracts with Customers in Item 8 of our 2021 Form 10-K, a subset of our noninterest income relates to certain fee-based revenue within the scope of ASC Topic 606 -
Revenue from Contracts with Customers
(Topic 606).
Fee-based revenue within the scope of Topic 606 is recognized within our
three
reportable business segments: Retail Banking, Corporate & Institutional Banking and Asset Management Group. Interest income, income from lease contracts, fair value gains from financial instruments (including derivatives), income from mortgage servicing rights and guarantee products, letter of credit fees, non-refundable fees associated with acquiring or originating a loan and gains from the sale of financial assets are outside of the scope of Topic 606.
Effective for the first quarter of 2022, PNC updated the presentation of its noninterest income categorization to be based on product and service type, and accordingly, has changed the basis of presentation of its noninterest income revenue streams to: (i) Asset management and brokerage, (ii) Capital markets related, (iii) Card and cash management, (iv) Lending and deposit services, (v) Residential and commercial mortgage and (vi) Other noninterest income. For a description of each updated noninterest income revenue stream, see Note 1 Accounting Policies.
94
The PNC Financial Services Group, Inc. –
Form 10-Q
|
Three Months Ended
September 30, 2022 |
Three Months Ended
September 30, 2021 |
||||||||||||||||||||||||||||||||||
|
In millions |
Retail Banking |
Corporate &
Institutional Banking |
Asset
Management Group |
Retail Banking |
Corporate &
Institutional Banking |
Asset
Management Group |
|||||||||||||||||||||||||||||
| Asset management and brokerage | |||||||||||||||||||||||||||||||||||
| Asset management fees | $ |
|
$ |
|
|||||||||||||||||||||||||||||||
| Brokerage fees | $ |
|
|
$ |
|
|
|||||||||||||||||||||||||||||
| Total asset management and brokerage |
|
|
|
|
|||||||||||||||||||||||||||||||
| Card and cash management | |||||||||||||||||||||||||||||||||||
| Treasury management fees |
|
$ |
|
|
$ |
|
|||||||||||||||||||||||||||||
| Debit card fees |
|
|
|||||||||||||||||||||||||||||||||
| Net credit card fees (a) |
|
|
|||||||||||||||||||||||||||||||||
| Merchant services |
|
|
|
|
|||||||||||||||||||||||||||||||
| Other |
|
|
|||||||||||||||||||||||||||||||||
| Total card and cash management |
|
|
|
|
|||||||||||||||||||||||||||||||
| Lending and deposit services | |||||||||||||||||||||||||||||||||||
| Deposit account fees |
|
|
|||||||||||||||||||||||||||||||||
| Other |
|
|
|
|
|||||||||||||||||||||||||||||||
| Total lending and deposit services |
|
|
|
|
|||||||||||||||||||||||||||||||
| Residential and commercial mortgage (b) |
|
|
|||||||||||||||||||||||||||||||||
| Capital markets related |
|
|
|||||||||||||||||||||||||||||||||
| Other |
|
|
|||||||||||||||||||||||||||||||||
| Total in-scope noninterest income |
|
|
|
|
|
|
|||||||||||||||||||||||||||||
| Out-of-scope noninterest income (c) |
|
|
|
|
|
|
|||||||||||||||||||||||||||||
| Noninterest income by business segment | $ |
|
$ |
|
$ |
|
$ |
|
$ |
|
$ |
|
|||||||||||||||||||||||
| Reconciliation to consolidated noninterest income | |||||||||||||||||||||||||||||||||||
| Total in-scope business segment noninterest income | $ |
|
$ |
|
|||||||||||||||||||||||||||||||
| Out-of-scope business segment noninterest income (c) |
|
|
|||||||||||||||||||||||||||||||||
| Noninterest income from other segments |
|
|
|||||||||||||||||||||||||||||||||
| Noninterest income as shown on the Consolidated Income Statement | $ |
|
$ |
|
|||||||||||||||||||||||||||||||
The PNC Financial Services Group, Inc. –
Form 10-Q
95
| (Continued from previous page) | |||||||||||||||||||||||||||||||||||
|
Nine Months Ended
September 30, 2022 |
Nine Months Ended
September 30, 2021 |
||||||||||||||||||||||||||||||||||
|
In millions |
Retail Banking |
Corporate &
Institutional Banking |
Asset
Management Group |
Retail Banking |
Corporate &
Institutional Banking |
Asset
Management Group |
|||||||||||||||||||||||||||||
| Asset management and brokerage | |||||||||||||||||||||||||||||||||||
| Asset management fees | $ |
|
$ |
|
|||||||||||||||||||||||||||||||
| Brokerage fees | $ |
|
|
$ |
|
|
|||||||||||||||||||||||||||||
| Total asset management and brokerage |
|
|
|
|
|||||||||||||||||||||||||||||||
| Card and cash management | |||||||||||||||||||||||||||||||||||
| Treasury management fees |
|
$ |
|
|
$ |
|
|||||||||||||||||||||||||||||
| Debit card fees |
|
|
|||||||||||||||||||||||||||||||||
| Net credit card fees (a) |
|
|
|||||||||||||||||||||||||||||||||
| Merchant services |
|
|
|
|
|||||||||||||||||||||||||||||||
| Other |
|
|
|||||||||||||||||||||||||||||||||
| Total card and cash management |
|
|
|
|
|||||||||||||||||||||||||||||||
| Lending and deposit services | |||||||||||||||||||||||||||||||||||
| Deposit account fees |
|
|
|||||||||||||||||||||||||||||||||
| Other |
|
|
|
|
|||||||||||||||||||||||||||||||
| Total lending and deposit services |
|
|
|
|
|||||||||||||||||||||||||||||||
| Residential and commercial mortgage (b) |
|
|
|||||||||||||||||||||||||||||||||
| Capital markets related |
|
|
|||||||||||||||||||||||||||||||||
| Other |
|
|
|||||||||||||||||||||||||||||||||
| Total in-scope noninterest income |
|
|
|
|
|
|
|||||||||||||||||||||||||||||
| Out-of-scope noninterest income (c) |
|
|
|
|
|
|
|||||||||||||||||||||||||||||
| Noninterest income by business segment | $ |
|
$ |
|
$ |
|
$ |
|
$ |
|
$ |
|
|||||||||||||||||||||||
| Reconciliation to consolidated noninterest income | |||||||||||||||||||||||||||||||||||
| Total in-scope business segment noninterest income | $ |
|
$ |
|
|||||||||||||||||||||||||||||||
| Out-of-scope business segment noninterest income (c) |
|
|
|||||||||||||||||||||||||||||||||
| Noninterest income from other segments |
|
|
|||||||||||||||||||||||||||||||||
| Noninterest income as shown on the Consolidated Income Statement | $ |
|
$ |
|
|||||||||||||||||||||||||||||||
(a)
Net credit card fees consists of interchange fees of $
169
million and $
155
million and credit card reward costs of $
109
million and $
102
million for the three months ended September 30, 2022 and 2021, respectively. Net credit card fees consists of interchange fees of $
489
million and $
421
million and credit card reward costs of $
311
million and $
264
million for the nine months ended September 30, 2022 and 2021, respectively.
(b)
Residential mortgage noninterest income falls under the scope of other accounting and disclosure requirements outside of Topic 606 and is included within the out-of-scope noninterest income line for the Retail Banking segment.
N
OTE
17
S
UBSEQUENT
E
VENTS
On October 28, 2022, the parent company issued $
1.0
billion of senior fixed-to-floating rate notes with a maturity date of October 28, 2025 (the “2025 Senior Notes”) and $
1.5
billion of senior fixed-to-floating rate notes with a maturity date of October 28, 2033 (the “2033 Senior Notes”). Interest is payable on the 2025 Senior Notes semi-annually in arrears at a fixed rate of
5.671
% per annum, on April 28 and October 28 of each year, beginning on April 28, 2023. Beginning on October 28, 2024, interest is payable on the 2025 Senior Notes quarterly in arrears at a floating rate per annum equal to Compounded SOFR (determined with respect to each quarterly interest period using the SOFR Index as described in the Prospectus Supplement), plus
1.09
%, on January 28, 2025, April 28, 2025, July 28, 2025 and at the maturity date. Interest is payable on the 2033 Senior Notes semi-annually in arrears at a fixed rate of
6.037
% per annum, on April 28 and October 28 of each year, beginning on April 28, 2023. Beginning on October 28, 2032, interest is payable on the 2033 Senior Notes quarterly in arrears at a floating rate per annum equal to Compounded SOFR (determined with respect to each quarterly interest period using the SOFR Index as described in the Prospectus Supplement), plus
2.14
%, on January 28, 2033, April 28, 2033, July 28, 2033 and at the maturity date.
On November 1, 2022, PNC redeemed $
1.5
billion of depositary shares representing interests in PNC’s fixed-to-floating rate non-cumulative perpetual preferred stock, Series P. Each depositary share represents a 1/4,000th interest in a share of the Series P preferred stock. The depositary shares were redeemed at a redemption price of $
25.00
per depositary share plus declared and unpaid dividends of $
0.43763
per depositary share, representing the dividend for the period from August 1, 2022 to, but excluding, November 1, 2022. All
60
million depositary shares outstanding were redeemed.
96
The PNC Financial Services Group, Inc. –
Form 10-Q
STATISTICAL INFORMATION (UNAUDITED)
THE PNC FINANCIAL SERVICES GROUP, INC.
Average Consolidated Balance Sheet And Net Interest Analysis (a) (b) (c)
| Nine months ended September 30 | ||||||||||||||||||||||||||||||||||||||
| 2022 | 2021 | |||||||||||||||||||||||||||||||||||||
|
Taxable-equivalent basis
Dollars in millions |
Average
Balances |
Interest Income/Expense | Average Yields/Rates |
Average
Balances |
Interest Income/
Expense |
Average Yields/
Rates |
||||||||||||||||||||||||||||||||
| Assets | ||||||||||||||||||||||||||||||||||||||
| Interest-earning assets: | ||||||||||||||||||||||||||||||||||||||
| Investment securities | ||||||||||||||||||||||||||||||||||||||
| Securities available for sale | ||||||||||||||||||||||||||||||||||||||
| Residential mortgage-backed | ||||||||||||||||||||||||||||||||||||||
| Agency | $ | 45,633 | $ | 687 | 2.01 | % | $ | 54,900 | $ | 644 | 1.56 | % | ||||||||||||||||||||||||||
| Non-agency | 885 | 50 | 7.57 | % | 1,142 | 66 | 7.70 | % | ||||||||||||||||||||||||||||||
| Commercial mortgage-backed | 4,354 | 81 | 2.49 | % | 6,280 | 116 | 2.47 | % | ||||||||||||||||||||||||||||||
| Asset-backed | 2,885 | 34 | 1.56 | % | 5,590 | 76 | 1.80 | % | ||||||||||||||||||||||||||||||
| U.S. Treasury and government agencies | 25,448 | 262 | 1.36 | % | 31,017 | 315 | 1.34 | % | ||||||||||||||||||||||||||||||
| Other | 4,189 | 82 | 2.61 | % | 4,889 | 112 | 3.05 | % | ||||||||||||||||||||||||||||||
| Total securities available for sale | 83,394 | 1,196 | 1.91 | % | 103,818 | 1,329 | 1.70 | % | ||||||||||||||||||||||||||||||
| Securities held to maturity | ||||||||||||||||||||||||||||||||||||||
| Residential mortgage-backed | 24,317 | 390 | 2.14 | % | ||||||||||||||||||||||||||||||||||
| Commercial mortgage-backed | 1,089 | 25 | 3.04 | % | ||||||||||||||||||||||||||||||||||
| Asset-backed | 3,587 | 62 | 2.31 | % | ||||||||||||||||||||||||||||||||||
| U.S. Treasury and government agencies | 21,243 | 182 | 1.14 | % | 802 | 17 | 2.86 | % | ||||||||||||||||||||||||||||||
| Other | 1,585 | 49 | 4.12 | % | 667 | 20 | 4.05 | % | ||||||||||||||||||||||||||||||
| Total securities held to maturity | 51,821 | 708 | 1.82 | % | 1,469 | 37 | 3.40 | % | ||||||||||||||||||||||||||||||
| Total investment securities | 135,215 | 1,904 | 1.88 | % | 105,287 | 1,366 | 1.73 | % | ||||||||||||||||||||||||||||||
| Loans | ||||||||||||||||||||||||||||||||||||||
| Commercial and industrial | 165,142 | 3,929 | 3.14 | % | 140,368 | 3,049 | 2.87 | % | ||||||||||||||||||||||||||||||
| Commercial real estate | 34,541 | 901 | 3.44 | % | 32,452 | 734 | 2.98 | % | ||||||||||||||||||||||||||||||
| Equipment lease financing | 6,168 | 173 | 3.73 | % | 6,321 | 182 | 3.83 | % | ||||||||||||||||||||||||||||||
| Consumer | 54,692 | 2,002 | 4.89 | % | 53,695 | 1,934 | 4.82 | % | ||||||||||||||||||||||||||||||
| Residential real estate | 42,378 | 992 | 3.12 | % | 29,048 | 730 | 3.35 | % | ||||||||||||||||||||||||||||||
| Total loans | 302,921 | 7,997 | 3.50 | % | 261,884 | 6,629 | 3.36 | % | ||||||||||||||||||||||||||||||
| Interest-earning deposits with banks | 44,641 | 292 | 0.87 | % | 81,383 | 74 | 0.12 | % | ||||||||||||||||||||||||||||||
| Other interest-earning assets | 9,637 | 210 | 2.92 | % | 8,345 | 142 | 2.27 | % | ||||||||||||||||||||||||||||||
| Total interest-earning assets/interest income | 492,414 | 10,403 | 2.80 | % | 456,899 | 8,211 | 2.38 | % | ||||||||||||||||||||||||||||||
| Noninterest-earning assets | 56,029 | 54,065 | ||||||||||||||||||||||||||||||||||||
| Total assets | $ | 548,443 | $ | 510,964 | ||||||||||||||||||||||||||||||||||
| Liabilities and Equity | ||||||||||||||||||||||||||||||||||||||
| Interest-bearing liabilities: | ||||||||||||||||||||||||||||||||||||||
| Interest-bearing deposits | ||||||||||||||||||||||||||||||||||||||
| Money market | $ | 60,510 | $ | 161 | 0.36 | % | $ | 69,105 | $ | 15 | 0.03 | % | ||||||||||||||||||||||||||
| Demand | 117,485 | 231 | 0.26 | % | 99,154 | 23 | 0.03 | % | ||||||||||||||||||||||||||||||
| Savings | 108,112 | 47 | 0.06 | % | 86,662 | 32 | 0.05 | % | ||||||||||||||||||||||||||||||
| Time deposits | 12,125 | 16 | 0.18 | % | 18,577 | 29 | 0.21 | % | ||||||||||||||||||||||||||||||
| Total interest-bearing deposits | 298,232 | 455 | 0.20 | % | 273,498 | 99 | 0.05 | % | ||||||||||||||||||||||||||||||
| Borrowed funds | ||||||||||||||||||||||||||||||||||||||
| Federal Home Loan Bank borrowings | 7,957 | 133 | 2.20 | % | 883 | 3 | 0.42 | % | ||||||||||||||||||||||||||||||
| Bank notes and senior debt | 16,249 | 222 | 1.80 | % | 22,663 | 172 | 1.00 | % | ||||||||||||||||||||||||||||||
| Subordinated debt | 7,131 | 123 | 2.30 | % | 6,315 | 64 | 1.35 | % | ||||||||||||||||||||||||||||||
| Other | 5,457 | 64 | 1.54 | % | 4,701 | 36 | 1.02 | % | ||||||||||||||||||||||||||||||
| Total borrowed funds | 36,794 | 542 | 1.95 | % | 34,562 | 275 | 1.05 | % | ||||||||||||||||||||||||||||||
| Total interest-bearing liabilities/interest expense | 335,026 | 997 | 0.39 | % | 308,060 | 374 | 0.16 | % | ||||||||||||||||||||||||||||||
| Noninterest-bearing liabilities and equity: | ||||||||||||||||||||||||||||||||||||||
| Noninterest-bearing deposits | 148,062 | 133,999 | ||||||||||||||||||||||||||||||||||||
| Accrued expenses and other liabilities | 16,061 | 14,787 | ||||||||||||||||||||||||||||||||||||
| Equity | 49,294 | 54,118 | ||||||||||||||||||||||||||||||||||||
| Total liabilities and equity | $ | 548,443 | $ | 510,964 | ||||||||||||||||||||||||||||||||||
| Interest rate spread | 2.41 | % | 2.22 | % | ||||||||||||||||||||||||||||||||||
| Impact of noninterest-bearing sources | 0.13 | 0.06 | ||||||||||||||||||||||||||||||||||||
| Net interest income/margin | $ | 9,406 | 2.54 | % | $ | 7,837 | 2.28 | % | ||||||||||||||||||||||||||||||
The PNC Financial Services Group, Inc. –
Form 10-Q
97
STATISTICAL INFORMATION (UNAUDITED)
THE PNC FINANCIAL SERVICES GROUP, INC.
Average Consolidated Balance Sheet And Net Interest Analysis (a) (b) (c)
| (Continued from previous page) | Three months ended September 30 | |||||||||||||||||||||||||||||||||||||
| 2022 | 2021 | |||||||||||||||||||||||||||||||||||||
|
Taxable-equivalent basis
Dollars in millions |
Average
Balances |
Interest Income/Expense | Average Yields/Rates |
Average
Balances |
Interest Income/
Expense |
Average Yields/
Rates |
||||||||||||||||||||||||||||||||
| Assets | ||||||||||||||||||||||||||||||||||||||
| Interest-earning assets: | ||||||||||||||||||||||||||||||||||||||
| Investment securities | ||||||||||||||||||||||||||||||||||||||
| Securities available for sale | ||||||||||||||||||||||||||||||||||||||
| Residential mortgage-backed | ||||||||||||||||||||||||||||||||||||||
| Agency | $ | 32,500 | $ | 192 | 2.36 | % | $ | 63,163 | $ | 223 | 1.41 | % | ||||||||||||||||||||||||||
| Non-agency | 748 | 14 | 7.62 | % | 1,051 | 21 | 8.07 | % | ||||||||||||||||||||||||||||||
| Commercial mortgage-backed | 3,489 | 23 | 2.70 | % | 6,134 | 35 | 2.34 | % | ||||||||||||||||||||||||||||||
| Asset-backed | 110 | 2 | 6.31 | % | 5,608 | 21 | 1.50 | % | ||||||||||||||||||||||||||||||
| U.S. Treasury and government agencies | 11,789 | 52 | 1.73 | % | 38,149 | 115 | 1.18 | % | ||||||||||||||||||||||||||||||
| Other | 3,506 | 22 | 2.47 | % | 4,994 | 37 | 2.90 | % | ||||||||||||||||||||||||||||||
| Total securities available for sale | 52,142 | 305 | 2.33 | % | 119,099 | 452 | 1.51 | % | ||||||||||||||||||||||||||||||
| Securities held to maturity | ||||||||||||||||||||||||||||||||||||||
| Residential mortgage-backed | 39,329 | 226 | 2.30 | % | ||||||||||||||||||||||||||||||||||
| Commercial mortgage-backed | 2,069 | 18 | 3.50 | % | ||||||||||||||||||||||||||||||||||
| Asset-backed | 6,571 | 42 | 2.58 | % | ||||||||||||||||||||||||||||||||||
| U.S. Treasury and government agencies | 34,279 | 102 | 1.19 | % | 807 | 6 | 2.88 | % | ||||||||||||||||||||||||||||||
| Other | 2,600 | 27 | 4.10 | % | 680 | 7 | 4.33 | % | ||||||||||||||||||||||||||||||
| Total securities held to maturity | 84,848 | 415 | 1.96 | % | 1,487 | 13 | 3.54 | % | ||||||||||||||||||||||||||||||
| Total investment securities | 136,990 | 720 | 2.10 | % | 120,586 | 465 | 1.54 | % | ||||||||||||||||||||||||||||||
| Loans | ||||||||||||||||||||||||||||||||||||||
| Commercial and industrial | 172,788 | 1,632 | 3.69 | % | 152,964 | 1,095 | 2.80 | % | ||||||||||||||||||||||||||||||
| Commercial real estate | 35,140 | 383 | 4.27 | % | 37,054 | 300 | 3.17 | % | ||||||||||||||||||||||||||||||
| Equipment lease financing | 6,202 | 60 | 3.85 | % | 6,300 | 61 | 3.83 | % | ||||||||||||||||||||||||||||||
| Consumer | 54,563 | 731 | 5.32 | % | 57,533 | 703 | 4.85 | % | ||||||||||||||||||||||||||||||
| Residential real estate | 44,333 | 356 | 3.21 | % | 37,475 | 295 | 3.15 | % | ||||||||||||||||||||||||||||||
| Total loans | 313,026 | 3,162 | 3.98 | % | 291,326 | 2,454 | 3.32 | % | ||||||||||||||||||||||||||||||
| Interest-earning deposits with banks | 31,892 | 185 | 2.32 | % | 80,274 | 31 | 0.16 | % | ||||||||||||||||||||||||||||||
| Other interest-earning assets | 9,560 | 94 | 3.94 | % | 9,113 | 47 | 2.03 | % | ||||||||||||||||||||||||||||||
| Total interest-earning assets/interest income | 491,468 | 4,161 | 3.35 | % | 501,299 | 2,997 | 2.36 | % | ||||||||||||||||||||||||||||||
| Noninterest-earning assets | 55,629 | 57,943 | ||||||||||||||||||||||||||||||||||||
| Total assets | $ | 547,097 | $ | 559,242 | ||||||||||||||||||||||||||||||||||
| Liabilities and Equity | ||||||||||||||||||||||||||||||||||||||
| Interest-bearing liabilities: | ||||||||||||||||||||||||||||||||||||||
| Interest-bearing deposits | ||||||||||||||||||||||||||||||||||||||
| Money market | $ | 60,934 | $ | 130 | 0.85 | % | $ | 82,911 | $ | 6 | 0.03 | % | ||||||||||||||||||||||||||
| Demand | 120,358 | 180 | 0.59 | % | 106,588 | 7 | 0.03 | % | ||||||||||||||||||||||||||||||
| Savings | 106,761 | 25 | 0.09 | % | 89,679 | 10 | 0.04 | % | ||||||||||||||||||||||||||||||
| Time deposits | 10,020 | 5 | 0.26 | % | 19,293 | 6 | 0.12 | % | ||||||||||||||||||||||||||||||
| Total interest-bearing deposits | 298,073 | 340 | 0.45 | % | 298,471 | 29 | 0.04 | % | ||||||||||||||||||||||||||||||
| Borrowed funds | ||||||||||||||||||||||||||||||||||||||
| Federal Home Loan Bank borrowings | 16,708 | 111 | 2.60 | % | ||||||||||||||||||||||||||||||||||
| Bank notes and senior debt | 14,597 | 110 | 2.96 | % | 22,573 | 56 | 0.97 | % | ||||||||||||||||||||||||||||||
| Subordinated debt | 7,614 | 65 | 3.43 | % | 6,787 | 22 | 1.28 | % | ||||||||||||||||||||||||||||||
| Other | 5,342 | 31 | 2.20 | % | 4,992 | 12 | 0.93 | % | ||||||||||||||||||||||||||||||
| Total borrowed funds | 44,261 | 317 | 2.81 | % | 34,352 | 90 | 1.03 | % | ||||||||||||||||||||||||||||||
| Total interest-bearing liabilities/interest expense | 342,334 | 657 | 0.75 | % | 332,823 | 119 | 0.14 | % | ||||||||||||||||||||||||||||||
| Noninterest-bearing liabilities and equity: | ||||||||||||||||||||||||||||||||||||||
| Noninterest-bearing deposits | 141,167 | 155,948 | ||||||||||||||||||||||||||||||||||||
| Accrued expenses and other liabilities | 15,699 | 15,332 | ||||||||||||||||||||||||||||||||||||
| Equity | 47,897 | 55,139 | ||||||||||||||||||||||||||||||||||||
| Total liabilities and equity | $ | 547,097 | $ | 559,242 | ||||||||||||||||||||||||||||||||||
| Interest rate spread | 2.60 | % | 2.22 | % | ||||||||||||||||||||||||||||||||||
| Impact of noninterest-bearing sources | 0.22 | 0.05 | ||||||||||||||||||||||||||||||||||||
| Net interest income/margin | $ | 3,504 | 2.82 | % | $ | 2,878 | 2.27 | % | ||||||||||||||||||||||||||||||
(a)
Nonaccrual loans are included in loans, net of unearned income. The impact of financial derivatives used in interest rate risk management is included in the interest income/expense and average yields/rates of the related assets and liabilities. Basis adjustments related to hedged items are included in noninterest-earning assets and noninterest-bearing liabilities. Average balances of securities are based on amortized historical cost (excluding adjustments to fair value, which are included in other assets). Average balances for certain loans and borrowed funds accounted for at fair value are included in noninterest-earning assets and noninterest-bearing liabilities, with changes in fair value recorded in Noninterest income.
(b)
Loan fees for the three months ended September 30, 2022 and September 30, 2021 were $48 million and $54 million, respectively. Loan fees for the nine months ended September 30, 2022 and September 30, 2021 were $146 million and $151 million, respectively.
(c)
Interest income calculated as taxable-equivalent interest income. To provide more meaningful comparisons of interest income and yields for all interest-earning assets, as well as net interest margins, we use interest income on a taxable-equivalent basis in calculating average yields and net interest margin by increasing the interest income earned on tax-exempt assets to make it fully equivalent to interest income earned on taxable investments. This adjustment is not permitted under GAAP. See Reconciliation of Taxable-Equivalent Net Interest Income in this Statistical Information section for more information.
98
The PNC Financial Services Group, Inc. –
Form 10-Q
R
ECONCILIATION
O
F
T
AXABLE
-E
QUIVALENT
N
ET
I
NTEREST
I
NCOME
(non-GAAP) (a)
| Nine months ended | Three months ended | |||||||||||||||||||
| In millions | September 30, 2022 | September 30, 2021 | September 30, 2022 | September 30, 2021 | ||||||||||||||||
| Net interest income (GAAP) | $ | 9,330 | $ | 7,785 | $ | 3,475 | $ | 2,856 | ||||||||||||
| Taxable-equivalent adjustments | 76 | 52 | 29 | 22 | ||||||||||||||||
| Net interest income (non-GAAP) | $ | 9,406 | $ | 7,837 | $ | 3,504 | $ | 2,878 | ||||||||||||
(a)
The interest income earned on certain interest-earning assets is completely or partially exempt from federal income tax. As such, these tax-exempt instruments typically yield lower returns than taxable investments. To provide more meaningful comparisons of net interest income, we use interest income on a taxable-equivalent basis by increasing the interest income earned on tax-exempt assets to make it fully equivalent to interest income earned on taxable investments. This adjustment is not permitted under GAAP.
G
LOSSARY
D
EFINED
T
ERMS
For a glossary of terms commonly used in our filings, please see the glossary of terms included in
our
2021 Form 10-K.
A
CRONYMS
| ACL | Allowance for credit losses | LIBOR | London Interbank Offered Rate | |||||||||||
| ALLL | Allowance for loan and lease losses | LIHTC | Low income housing tax credit | |||||||||||
| AOCI | Accumulated other comprehensive income | LLC | Limited liability company | |||||||||||
| ASC | Accounting Standards Codification | LTV | Loan-to-value ratio | |||||||||||
| ASU | Accounting Standards Update | MD&A | Management’s Discussion and Analysis of Financial Condition and Results of Operations | |||||||||||
| BBVA | BBVA USA Bancshares, Inc. | MSR | Mortgage servicing right | |||||||||||
| BBVA USA | BBVA USA, the Alabama-chartered bank subsidiary of BBVA USA Bancshares, Inc. | NSFR | Net Stable Funding Ratio | |||||||||||
| BHC | Bank holding company | OCC | Office of the Comptroller of the Currency | |||||||||||
| bps | Basis points | OREO | Other real estate owned | |||||||||||
| CARES Act | Coronavirus Aid, Relief and Economic Security Act | OTC | Over-the-counter | |||||||||||
| CCAR | Comprehensive Capital Analysis and Review | PCD | Purchased credit deteriorated | |||||||||||
| CECL | Current expected credit losses | PD | Probability of default | |||||||||||
| CET1 | Common equity tier 1 | PPP | Paycheck Protection Program | |||||||||||
| FHLB | Federal Home Loan Bank | RAC | PNC’s Reserve Adequacy Committee | |||||||||||
| FHLMC | Federal Home Loan Mortgage Corporation | ROAP | Removal of account provisions | |||||||||||
| FICO | Fair Isaac Corporation (credit score) | SCB | Stress capital buffer | |||||||||||
| FNMA | Federal National Mortgage Association | SEC | Securities and Exchange Commission | |||||||||||
| FOMC | Federal Open Market Committee | SOFR | Secured Overnight Financing Rate | |||||||||||
| GAAP | Accounting principles generally accepted in the United States of America | SPE | Special purpose entity | |||||||||||
| GDP | Gross Domestic Product | TDR | Troubled debt restructuring | |||||||||||
| GSIB | Globally systemically important bank | U.S. | United States of America | |||||||||||
| ISDA | International Swaps and Derivatives Association | VaR | Value-at-risk | |||||||||||
| LCR | Liquidity Coverage Ratio | VIE | Variable interest entity | |||||||||||
| LGD | Loss given default | |||||||||||||
PART II – OTHER INFORMATION
ITEM 1. LEGAL PROCEEDINGS
See the information set forth in Note 14 Legal Proceedings in the Notes To Consolidated Financial Statements under Part I, Item 1 of this Report, which is incorporated by reference in response to this item.
ITEM 1A. RISK FACTORS
There are no material changes from any of the risk factors previously disclosed in our 2021 Form 10-K in response to Part II, Item 1A and Part I, Item 1A, respectively.
The PNC Financial Services Group, Inc. –
Form 10-Q
99
ITEM 2. UNREGISTERED SALES OF EQUITY SECURITIES AND USE OF PROCEEDS
Unregistered Sales of Equity Securities
None.
Equity Security Repurchases
Details of our repurchases of PNC common stock during the third quarter of 2022 are included in the following table.
|
2022 period
In thousands, except per share data |
Total shares purchased (a) | Average price paid per share | Total shares purchased as part of publicly announced programs (b) | Maximum number of shares that may yet be purchased under the programs (b) | ||||||||||
| July 1 – 31 | 1,551 | $ | 158.64 | 1,544 | 57,912 | |||||||||
| August 1 – 31 | 1,194 | $ | 166.65 | 1,188 | 56,724 | |||||||||
| September 1 – 30 | 3,921 | $ | 156.73 | 3,921 | 52,803 | |||||||||
| Total | 6,666 | $ | 158.95 | 6,653 | ||||||||||
(a)
Includes PNC common stock purchased in connection with our various employee benefit plans generally related to shares used to cover employee payroll tax withholding requirements. See Note 17 Employee Benefit Plans and Note 18 Stock Based Compensation Plans in the Notes To Consolidated Financial Statements included in Item 8 of our 2021 Form 10-K which include additional information regarding our employee benefit and equity compensation plans that use PNC common stock.
(b)
On April 4, 2019, our Board of Directors approved the establishment of a stock repurchase program authorization in the amount of 100 million shares of PNC common
stock, effective July 1, 2019. Under this authorization, repurchases may be made in open market or privately negotiated transactions, with the timing and exact amount of
common stock repurchases depending on a number of factors including, among others, market and general economic conditions, regulatory capital considerations, alternative
uses of capital, the potential impact on our credit ratings, and contractual and regulatory limitations, including the results of the supervisory assessment of capital adequacy
and capital planning processes undertaken by the Federal Reserve as part of the CCAR process, which includes setting PNC's SCB. The SCB framework allows for capital returns in amounts up to the level of capital in excess of the SCB minimum. Consistent with the flexibility provided under the SCB framework, our Board of Directors has authorized a repurchase structure program of up to 100 million common shares, of which approximately 53% were still available at September 30, 2022. Under this framework, PNC expects its quarterly repurchases to approximate $700 million to $750 million with the ability to adjust those levels as conditions warrant.
100
The PNC Financial Services Group, Inc. –
Form 10-Q
ITEM 6. EXHIBITS
The following exhibit index lists Exhibits filed or furnished with this Quarterly Report on Form 10-Q:
|
E
XHIBIT
I
NDEX
|
||||||||
| 3.1.10 | ||||||||
| 4.13 |
Deposit Agreement, dated as
of
August 19, 2022, between the Corporation, Computershare Trust Company, N.A. and Computershare Inc., as depositary, and the holders from time to time of the Depositary Receipts described therein (incorporated herein by reference to Exhibit 4.1 of the Corporation’s Current Report on Form 8-K filed August 19, 2022)
|
|||||||
| 22 | ||||||||
| 31.1 | ||||||||
| 31.2 | ||||||||
| 32.1 | ||||||||
| 32.2 | ||||||||
| 101.INS | Inline XBRL Instance Document * | |||||||
| 101.SCH | Inline XBRL Taxonomy Extension Schema Document | |||||||
| 101.CAL | Inline XBRL Taxonomy Extension Calculation Linkbase Document | |||||||
| 101.LAB | Inline XBRL Taxonomy Extension Label Linkbase Document | |||||||
| 101.PRE | Inline XBRL Taxonomy Extension Presentation Linkbase Document | |||||||
| 101.DEF | Inline XBRL Taxonomy Extension Definition Linkbase Document | |||||||
| 104 | Cover Page Interactive Data File (formatted as inline XBRL and contained in Exhibit 101) | |||||||
*The instance document does not appear in the interactive data file because its XBRL tags are embedded within the inline XBRL.
You can obtain copies of these Exhibits electronically at the SEC’s website at www.sec.gov. The Exhibits are also available as part of this Form 10-Q on PNC’s corporate website at www.pnc.com/secfilings. Shareholders and bondholders may also obtain copies of Exhibits, without charge, by contacting Shareholder Relations at 800-843-2206 or via e-mail at investor.relations@pnc.com.
CORPORATE INFORMATION
The PNC Financial Services Group, Inc.
Corporate Headquarters
The PNC Financial Services Group, Inc.
The Tower at PNC Plaza
300 Fifth Avenue
Pittsburgh, Pennsylvania 15222-2401
Internet Information
The PNC Financial Services Group, Inc.'s financial reports and information about its products and services are available on the internet at www.pnc.com. We provide information for investors on our corporate website under “About Us – Investor Relations.” We use our Twitter account, @pncnews, as an additional way of disseminating to the public information that may be relevant to investors.
We generally post the following under “About Us – Investor Relations” shortly before or promptly following its first use or release: financially-related press releases, including earnings releases and supplemental financial information, various SEC filings, including annual, quarterly and current reports and proxy statements, presentation materials associated with earnings and other investor conference calls or events, and access to live and recorded audio from earnings and other investor conference calls or events. In some cases, we may post the presentation materials for other investor conference calls or events several days prior to the call or event. For earnings and other conference calls or events, we generally include in our posted materials a cautionary statement regarding forward-looking and non-GAAP financial information, and we provide GAAP reconciliations when we include non-GAAP financial information. Such GAAP reconciliations may be in materials for the applicable presentation, in materials for prior presentations or in our annual, quarterly or current reports.
The PNC Financial Services Group, Inc. –
Form 10-Q
101
When warranted, we will also use our website to expedite public access to time-critical information regarding PNC instead of using a press release or a filing with the SEC for first disclosure of the information. In some circumstances, the information may be relevant to investors but directed at customers, in which case it may be accessed directly through the home page rather than at “About Us – Investor Relations.”
We are required to provide additional public disclosure regarding estimated income, losses and pro forma regulatory capital ratios under supervisory and PNC-developed hypothetical severely adverse economic scenarios, as well as information concerning our capital stress testing processes, pursuant to the stress testing regulations adopted by the Federal Reserve and the OCC. We are also required to make certain additional regulatory capital-related public disclosures about our capital structure, risk exposures, risk assessment processes, risk-weighted assets and overall capital adequacy, including market risk-related disclosures, under the regulatory capital rules adopted by the Federal banking agencies. Similarly, the Federal Reserve's rules require quantitative and qualitative disclosures about LCR and, beginning in 2023, our NSFR. Under these regulations, we may satisfy these requirements through postings on our website, and we have done so and expect to continue to do so without also providing disclosure of all of this information through filings with the SEC.
Other information posted on our corporate website that may not be available in our filings with the SEC includes information relating to our corporate governance and annual communications from our chairman to shareholders.
Where we have included internet addresses in this Report, such as our internet address and the internet address of the SEC, we have included those internet addresses as inactive textual references only. Except as specifically incorporated by reference into this Report, information on those websites is not part hereof.
Financial Information
We are subject to the informational requirements of the Exchange Act and, in accordance with the Exchange Act, we file annual, quarterly and current reports, proxy statements and other information with the SEC. Our SEC File Number is 001-09718. You can obtain copies of these and other filings, including exhibits, electronically at the SEC’s internet website at www.sec.gov or on our corporate internet website at www.pnc.com/secfilings. Shareholders and bond holders may also obtain copies of these filings without charge by contacting PNC Investor Relations at 800-843-2206, via the request financial information form at www.pnc.com/investorrelations or via email to investor.relations@pnc.com.
Corporate Governance at PNC
Information about our Board of Directors and its committees and corporate governance, including our PNC Code of Business Conduct and Ethics (as amended from time to time), is available on our corporate website at www.pnc.com/corporategovernance. In addition, any future waivers from a provision of the PNC Code of Business Conduct and Ethics covering any of our directors or executive officers (including our principal executive officer, principal financial officer and principal accounting officer or controller) will be posted at this internet address.
Shareholders who would like to request printed copies of the PNC Code of Business Conduct and Ethics or our Corporate Governance Guidelines or the charters of our Board’s Audit, Nominating and Governance, Human Resources, or Risk Committees (all of which are posted on our corporate website at www.pnc.com/corporategovernance) may do so by sending their requests to our Corporate Secretary at corporate headquarters at the above address. Copies will be provided without charge.
Inquiries
For financial services, call 888-762-2265.
Registered shareholders should contact Shareholder Services at 800-982-7652.
Analysts and institutional investors should contact Bryan Gill, Executive Vice President, Director of Investor Relations, at 412-768-4143 or via email at investor.relations@pnc.com.
News media representatives should contact PNC Media Relations at 412-762-4550 or via email at media.relations@pnc.com.
Dividend Policy
Holders of PNC common stock are entitled to receive dividends when declared by our Board of Directors out of funds legally available for this purpose. Our Board of Directors may not pay or set apart dividends on the common stock until dividends for all past dividend periods on any series of outstanding preferred stock and certain outstanding capital securities issued by the parent company
have been paid or declared and set apart for payment. The Board of Directors presently intends to continue the policy of paying quarterly cash dividends. The amount of any future dividends will depend on economic and market conditions, our financial condition and operating results, and other factors, including contractual restrictions and applicable government regulations and policies (such as those relating to the ability of bank and non-bank subsidiaries to pay dividends to the parent company and regulatory capital
102
The PNC Financial Services Group, Inc. –
Form 10-Q
limitations). The amount of our dividend is also currently subject to the results of the supervisory assessment of capital adequacy and capital planning processes undertaken by the Federal Reserve as part of the CCAR process, which includes setting PNC's SCB, as described in the Capital Management portion of the Risk Management section of the Financial Review of this Report and in the Supervision and Regulation section in Item 1 of our 2021 Form 10-K.
Dividend Reinvestment and Stock Purchase Plan
The PNC Financial Services Group, Inc. Dividend Reinvestment and Stock Purchase Plan enables holders of our common stock to conveniently purchase additional shares of common stock. You can obtain a prospectus and enrollment form by contacting Shareholder Services at 800-982-7652. Registered shareholders may also contact this phone number regarding dividends and other shareholder services.
Stock Transfer Agent and Registrar
Computershare
462 South 4th Street, Suite 1600
Louisville, KY 40202
800-982-7652
www.computershare.com/pnc
SIGNATURE
Pursuant to the requirements of the Securities Exchange Act of 1934, the registrant has duly caused this report to be signed on November 2, 2022 on its behalf by the undersigned thereunto duly authorized.
| /s/ Robert Q. Reilly | ||
| Robert Q. Reilly | ||
| Executive Vice President and Chief Financial Officer | ||
| (Principal Financial Officer) | ||
The PNC Financial Services Group, Inc. –
Form 10-Q
103
TABLE OF CONTENTS
Note 4 Loans and Related Allowance For Credit Losses in The Notes To Consolidated Financial Statements Included in This ReportNote 1 Accounting PoliciesNote 2 Acquisition ActivityNote 3 Investment SecuritiesNote 4 Loans and Related Allowance For Credit LossesNote 5 Loan Sale and Servicing Activities and Variable Interest EntitiesNote 6 Goodwill and Mortgage Servicing RightsNote 7 LeasesNote 8 Borrowed FundsNote 9 CommitmentsNote 10 Total Equity and Other Comprehensive IncomeNote 11 Earnings Per ShareNote 12 Fair ValueNote 13 Financial DerivativesNote 14 Legal ProceedingsNote 15 Segment ReportingNote 16 Fee-based Revenue From Contracts with CustomersNote 17 Subsequent EventsPart II Other InformationItem 1. Legal ProceedingsItem 1A. Risk FactorsItem 2. Unregistered Sales Of Equity Securities and Use Of ProceedsItem 6. Exhibits