PENTAIR PLC
10-Ks and 10-Qs
|
|
|
|
|
|
|
|
|
|
|
|
|
|
|
|
|
|
|
|
|
|
|
|
|
|
|
|
|
|
|
|
|
|
|
|
|
|
|
|
|
|
|
|
|
|
|
|
|
|
|
|
|
|
|
|
UNITED STATES SECURITIES AND EXCHANGE COMMISSION
Washington, D.C. 20549
FORM 10-K
|
þ
|
ANNUAL REPORT PURSUANT TO SECTION 13 OR 15(d) OF THE SECURITIES EXCHANGE ACT OF 1934
|
For the Fiscal Year Ended
December 31, 2017
OR
|
¨
|
TRANSITION REPORT PURSUANT TO SECTION 13 OR 15(d) OF THE SECURITIES EXCHANGE ACT OF 1934
|
Commission file number 001-11625
Pentair plc
(Exact name of Registrant as specified in its charter)
|
Ireland
|
|
98-1141328
|
|
(State or other jurisdiction of
incorporation or organization)
|
|
(I.R.S. Employer
Identification number)
|
|
43 London Wall, London, EC2M 5TF, United Kingdom
|
||
|
(Address of principal executive offices)
|
||
Registrant's telephone number, including area code: 44-20-7347-8925
Securities registered pursuant to Section 12(b) of the Act:
|
Title of each class
|
|
Name of each exchange on which registered
|
|
Ordinary Shares, nominal value $0.01 per share
|
|
New York Stock Exchange
|
Securities registered pursuant to Section 12(g) of the Act: None
Indicate by check mark if the registrant is a well-known seasoned issuer, as defined in Rule 405 of the Securities Act. Yes
þ
No
¨
Indicate by check mark if the registrant is not required to file reports pursuant to Section 13 or Section 15(d) of the Act. Yes
¨
No
þ
Indicate by check mark whether the registrant (1) has filed all reports required to be filed by Section 13 or 15(d) of the Securities Exchange Act of 1934 during the preceding 12 months (or for such shorter period that the Registrant was required to file such reports) and (2) has been subject to such filing requirements for the past 90 days. Yes
þ
No
¨
Indicate by check mark whether the registrant has submitted electronically and posted on its corporate Website, if any, every Interactive Data File required to be submitted and posted pursuant to Rule 405 of Regulation S-T during the preceding 12 months (or for such shorter period that the Registrant was required to submit and post such files). Yes
þ
No
¨
Indicate by check mark if disclosure of delinquent filers pursuant to Item 405 of Regulation S-K is not contained herein and will not be contained, to the best of registrant's knowledge, in definitive proxy or information statements incorporated by reference in PART III of this Form 10-K or any amendment to this Form 10-K.
þ
Indicate by check mark whether the registrant is a large accelerated filer, an accelerated filer, a non-accelerated filer, a smaller reporting company or an emerging growth company. See the definitions of "large accelerated filer," "accelerated filer", "smaller reporting company" and "emerging growth company" in Rule 12b-2 of the Exchange Act.:
|
Large accelerated filer
þ
|
|
Accelerated filer
o
|
|
Non-accelerated filer
o
|
|
Smaller reporting
company
o
|
Emerging growth company
o
|
|
|
|
|
(Do not check if a smaller reporting company)
|
||||||
If an emerging growth company, indicate by check mark if the registrant has elected not to use the extended transition period for complying with any new or revised financial accounting standards provided pursuant to Section 13(a) of the Exchange Act.
¨
Indicate by check mark whether the registrant is a shell company (as defined in Rule 12b-2 of the Act). Yes
¨
No
þ
Aggregate market value of voting and non-voting common equity held by non-affiliates of the Registrant,
based on the closing
price of
$66.54
per share as reported on the New York Stock Exchange on June 30, 2017 (the last business day of Registrant's most recently completed second quarter):
$10,849,958,298
.
The number of shares outstanding of Registrant's only class of common stock on
December 31, 2017
was
180,306,617
.
DOCUMENTS INCORPORATED BY REFERENCE
Parts of the Registrant's definitive proxy statement for its annual general meeting to be held on
May 8, 2018
, are incorporated by reference in this Form 10-K in response to Part III, ITEM 10, 11, 12, 13 and 14.
Pentair plc
Annual Report on Form 10-K
For the Year Ended
December 31, 2017
|
|
|
|
|
Page
|
|
PART I
|
||||
|
ITEM 1.
|
|
|
||
|
ITEM 1A.
|
|
|
||
|
ITEM 1B.
|
|
|
||
|
ITEM 2.
|
|
|
||
|
ITEM 3.
|
|
|
||
|
ITEM 4.
|
|
|
||
|
PART II
|
||||
|
ITEM 5.
|
|
|
||
|
ITEM 6.
|
|
|
||
|
ITEM 7.
|
|
|
||
|
ITEM 7A.
|
|
|
||
|
ITEM 8.
|
|
|
||
|
ITEM 9.
|
|
|
||
|
ITEM 9A.
|
|
|
||
|
ITEM 9B.
|
|
|
||
|
PART III
|
||||
|
ITEM 10.
|
|
|
||
|
ITEM 11.
|
|
|
||
|
ITEM 12.
|
|
|
||
|
ITEM 13.
|
|
|
||
|
ITEM 14.
|
|
|
||
|
PART IV
|
||||
|
ITEM 15.
|
|
|
||
|
ITEM 16.
|
|
|
||
|
|
|
|||
GENERAL
Pentair plc is a focused diversified industrial manufacturing company comprising two reporting segments: Water and Electrical.
Water designs, manufactures, markets and services innovative products and solutions to meet filtration, separation, flow and water management challenges in agriculture, aquaculture, foodservice, food and beverage processing, swimming pools, water supply and disposal and a variety of industrial applications. Electrical designs, manufactures, markets, installs and services high performance products and solutions that connect and protect some of the world's most sensitive equipment, buildings and critical processes.
Pentair strategy
Our strategy is to drive sustainable, profitable growth and return on invested capital improvements through:
|
•
|
building operational excellence through the Pentair Integrated Management System ("PIMS") consisting of lean enterprise, growth and talent management;
|
|
•
|
driving long-term growth in sales, operating income and cash flows, through growth and productivity initiatives along with acquisitions;
|
|
•
|
developing new products and enhancing existing products;
|
|
•
|
penetrating attractive growth markets, particularly outside of the United States;
|
|
•
|
expanding multi-channel distribution; and
|
|
•
|
proactively managing our business portfolio for optimal value creation, including consideration of new business platforms.
|
Unless the context otherwise indicates, references herein to "Pentair," the "Company," and such words as "we," "us," and "our" include Pentair plc and its consolidated subsidiaries. We are an Irish public limited company that was formed in 2014. We are the successor to Pentair Ltd., a Swiss corporation formed in 2012, and Pentair, Inc., a Minnesota corporation formed in 1966 and our wholly-owned subsidiary, under the Securities Exchange Act of 1934, as amended (the "Exchange Act").
HISTORY AND DEVELOPMENT
In December 2013, the Company's Board of Directors approved changing the Company's jurisdiction of organization from Switzerland to Ireland. At an extraordinary meeting of shareholders on May 20, 2014, Pentair Ltd. shareholders voted in favor of a reorganization proposal pursuant to which Pentair Ltd. would merge into Pentair plc and all Pentair Ltd. common shares would be cancelled and all holders of such shares would receive ordinary shares of Pentair plc on a one-to-one basis. The reorganization transaction was completed on June 3, 2014, at which time Pentair plc replaced Pentair Ltd. as the ultimate parent company (the "Redomicile"). Shares of Pentair plc began trading on the New York Stock Exchange ("NYSE") on June 3, 2014 under the symbol "PNR," the same symbol under which Pentair Ltd. shares were previously traded.
Although our jurisdiction of organization is Ireland, we manage our affairs so that we are centrally managed and controlled in the United Kingdom (the "U.K.") and therefore have our tax residency in the U.K.
Our former parent company, Pentair Ltd., took its form on September 28, 2012 as a result of a reverse acquisition (the "Merger") involving Pentair, Inc. and an indirect, wholly-owned subsidiary of Flow Control (defined below), with Pentair, Inc. surviving as an indirect, wholly-owned subsidiary of ours. "Flow Control" refers to Pentair Ltd. prior to the Merger. Prior to the Merger, Tyco International Ltd. ("Tyco") engaged in an internal restructuring whereby it transferred to Flow Control certain assets related to the flow control business of Tyco, and Flow Control assumed from Tyco certain liabilities related to the flow control business of Tyco. On September 28, 2012 prior to the Merger, Tyco effected a spin-off of Flow Control through the pro-rata distribution of
100%
of the outstanding ordinary shares of Flow Control to Tyco's shareholders (the "Distribution"), resulting in the distribution of approximately
110.9 million
of our ordinary shares to Tyco's shareholders. The Merger was accounted for as a reverse acquisition under the purchase method of accounting with Pentair, Inc. treated as the acquirer.
On September 18, 2015, we acquired, as part of Electrical, all of the outstanding shares of capital stock of ERICO Global Company ("ERICO") for approximately
$1.8 billion
in cash (the "ERICO Acquisition"). ERICO is a leading global manufacturer and marketer of engineered electrical and fastening products for electrical, mechanical and civil applications. ERICO has employees in 30 countries across the world with recognized brands including CADDY fixing, fastening and support products; ERICO electrical grounding, bonding and connectivity products and LENTON engineered systems.
1
On April 28, 2017 we completed the sale of the Valves & Controls business to Emerson Electric Co. for
$3.15 billion
in cash. The sale resulted in a gain of
$181.1 million
, net of tax. The results of the Valves & Controls business have been presented as discontinued operations and the related assets and liabilities have been reclassified as held for sale for all periods presented. The Valves & Controls business was previously disclosed as a stand-alone reporting segment.
On May 9, 2017, we announced that our Board of Directors approved a plan to separate our Water business and Electrical business into two independent, publicly-traded companies (the "Proposed Separation"). The Proposed Separation is expected to occur through a tax-free spin-off of the Electrical business to Pentair shareholders.
Completion of the Proposed Separation is subject to certain customary conditions, including, among other things, final approval of the transaction by Pentair's Board of Directors, receipt of tax opinions and rulings and effectiveness of appropriate filings with the U.S. Securities and Exchange Commission (the “SEC"). Upon completion of the Proposed Separation, it is anticipated that Electrical's jurisdiction of organization will be Ireland, but that it will manage its affairs so that it will be centrally managed and controlled in the United Kingdom (the "U.K.") and therefore will have its tax residency in the U.K.
We are targeting April 30, 2018 for the completion of the Proposed Separation; however, there can be no assurance regarding the ultimate timing of the Proposed Separation or that the Proposed Separation will be completed.
Our registered principal office is located at 43 London Wall, London, EC2M 5TF, United Kingdom. Our management office in the United States ("U.S.") is located at 5500 Wayzata Boulevard, Suite 600, Minneapolis, Minnesota.
BUSINESS AND PRODUCTS
Reporting segment and geographical financial information is contained in ITEM 8, Note 16 of the Notes to Consolidated Financial Statements, included in this Form 10-K. The following is a brief description of each of the Company's reportable segments and business activities.
During the first quarter of 2017, we reorganized our business segments to reflect a new operating structure, resulting in a change to our reporting segments. All prior period amounts related to the segment change have been retrospectively reclassified throughout this Annual Report on Form 10-K to conform to the new presentation. As part of this reorganization, the legacy Water Quality Systems business segment was combined with the legacy Flow & Filtration Solutions business segment to form the Water reporting segment and now operates as a stand-alone business segment. In addition, the legacy Technical Solutions business segment was renamed the Electrical reporting segment.
Water
The Water segment designs, manufactures, markets and services innovative water solutions for the filtration, separation, flow and water management challenges in agriculture, foodservice, food and beverage processing, swimming pools, water supply and disposal and a variety of industrial applications.
Water provides a comprehensive portfolio of products and services to address customers’ needs for reliable and efficient movement and control of water and other fluids. This includes a full range of water treatment equipment including energy-efficient pumps, point-of-entry/point-of-use filtration, valves, UV sanitization and automation controls for residential and commercial applications, as well as engineered solutions in advanced filtration, desalination, water supply and disposal, process and control for industrial and infrastructure applications. We offer design and consulting services and our advanced water technologies are used across a wide number of industries including residential, commercial, foodservice, industrial, aquaculture, irrigation and flood control, wastewater and more. Our equipment and solutions are found in swimming pools and spas, water purification and sanitation systems, foodservice operations, food and beverage processing plants, wastewater treatment plants, flood control and storm water management facilities and in other applications across the globe.
Brand names for Water include Aurora, Berkeley, Codeline, Everpure, Fairbanks-Nijhuis, Kreepy Krauly, Haffmans, Hydromatic, Hypro, Pentair, Pentair Aquatic Eco-Systems, Sta-Rite, Shurflo, Südmo and X-Flow.
Customers
Water customers include businesses engaged in wholesale and retail distribution in the residential & commercial, food & beverage, infrastructure, and industrial verticals. Customers also include end-user and consumers in the residential & commercial vertical as well as engineering procurement contractors, and original equipment manufacturers.
Seasonality
We experience increased demand for residential water supply and pool equipment products, infrastructure and agricultural products following warm weather trends, which are at season highs from April to August. The magnitude of the sales increase is mitigated by employing some advance sale “early buy” programs (generally including extended payment terms and/or
2
additional discounts). Seasonal effects may vary from year to year and are impacted by weather patterns, particularly by temperatures, heavy flooding and droughts.
Competition
Water faces numerous domestic and international competitors, some of which have substantially greater resources directed to the verticals in which we compete. Competition focuses on brand names, product performance (including energy-efficient offerings and required specifications), quality, service and price. We compete by offering a wide variety of innovative and high-quality products, which are competitively priced. We believe our distribution channels and reputation for quality also provide us a competitive advantage.
Electrical
The Electrical segment designs, manufactures, markets, installs and services high performance products and solutions that connect and protect some of the world's most sensitive equipment, buildings and critical processes.
Electrical products include mild steel, stainless steel, aluminum and non-metallic enclosures, cabinets, cases, subracks, backplanes, engineered fastening solutions across a wide range of industries and verticals and thermal management systems including heat tracing, floor heating, fire-rated and specialty wiring, sensing, and snow melting and de-icing solutions for industrial, commercial and residential use.
The portfolio of products serves a range of industries, including use in the commercial, communications, energy, electronics, industrial, infrastructure, medical, and security & defense verticals. Brand names for Electrical offerings include CADDY, ERICO, Hoffman, LENTON, Raychem, Schroff and Tracer.
Customers
Electrical customers include electrical distributors, data center contractors, original equipment manufacturers, greenfield development contractors and maintenance contractors. Electrical has a globally installed base of customers.
Seasonality
Electrical generally experiences increased demand for thermal protection products and services during the fall and winter months in the Northern Hemisphere and increased demand for electrical fastening products during the spring and summer months in the Northern Hemisphere.
Competition
Within Electrical, the equipment protection business faces significant competition in the verticals it serves, particularly within the communications industry, where product design, prototyping, global supply, price competition and customer service are significant factors. The industries and verticals served by the thermal management business are highly fragmented, comprising local markets and niches. The industries and verticals served by the engineered fastening solutions business is relatively fragmented, with a small number of large competitors and a large number of smaller suppliers. We compete by offering a wide variety of innovative and compatible products, which are competitively priced.
INFORMATION REGARDING ALL REPORTABLE SEGMENTS
Backlog of orders by segment
|
|
December 31
|
||||||||||
|
In millions
|
2017
|
2016
|
$ change
|
% change
|
|||||||
|
Water
|
$
|
406.9
|
|
$
|
375.8
|
|
$
|
31.1
|
|
8.3
|
%
|
|
Electrical
|
280.4
|
|
266.3
|
|
14.1
|
|
5.3
|
|
|||
|
Total
|
$
|
687.3
|
|
$
|
642.1
|
|
$
|
45.2
|
|
7.0
|
%
|
A substantial portion of our revenues result from orders received and products delivered in the same month. Our backlog typically has a short manufacturing cycle and products generally ship within 90 days of the date on which a customer places an order. However, a portion of our backlog, particularly from orders for major capital projects, can take more than one year depending on the size and type of order. We record as part of our backlog all orders from external customers, which represent firm commitments, and are supported by a purchase order or other legitimate contract. We expect the majority of our backlog at
December 31, 2017
will be shipped in
2018
.
3
Research and development
We conduct research and development activities primarily in our own facilities. These efforts consist primarily of the development of new products, product applications and manufacturing processes. Research and development expenditures during
2017
,
2016
and
2015
were
$115.8 million
,
$114.1 million
and
$98.7 million
, respectively.
Raw materials
The principal materials we use in manufacturing our products are electric motors, mild steel, stainless steel, electronic components, plastics (resins, fiberglass, epoxies), copper and paint (powder and liquid). In addition to the purchase of raw materials, we purchase some finished goods for distribution through our sales channels.
We purchase the materials we use in various manufacturing processes on the open market and the majority is available through multiple sources which are in adequate supply. We have not experienced any significant work stoppages to date due to shortages of materials. We have certain long-term commitments, principally price commitments, for the purchase of various component parts and raw materials and believe that it is unlikely that any of these agreements would be terminated prematurely. Alternate sources of supply at competitive prices are available for most materials for which long-term commitments exist and we believe that the termination of any of these commitments would not have a material adverse effect on our financial position, results of operations or cash flows.
Certain commodities, such as metals and resin, are subject to market and duty-driven price fluctuations. We manage these fluctuations through several mechanisms, including long-term agreements with price adjustment clauses for significant commodity market movements in certain circumstances. Prices for raw materials, such as metals and resins, may trend higher in the future.
Intellectual property
Patents, non-compete agreements, proprietary technologies, customer relationships, trademarks, trade names and brand names are important to our business. However, we do not regard our business as being materially dependent upon any single patent, non-compete agreement, proprietary technology, customer relationship, trademark, trade name or brand name.
Patents, patent applications and license agreements will expire or terminate over time by operation of law, in accordance with their terms or otherwise. We do not expect the termination of patents, patent applications or license agreements to have a material adverse effect on our financial position, results of operations or cash flows.
Employees
As of
December 31, 2017
, we employed
18,400
people worldwide.
Captive insurance subsidiary
We insure certain general and product liability, property, workers' compensation and automobile liability risks through our regulated wholly-owned captive insurance subsidiary, Penwald Insurance Company ("Penwald"). Reserves for policy claims are established based on actuarial projections of ultimate losses. Accruals with respect to liabilities insured by third parties, such as liabilities arising from acquired businesses, pre-Penwald liabilities and those of certain non-U.S. operations are established.
Matters pertaining to Penwald are discussed in ITEM 3 and ITEM 8, Note 1 of the Notes to Consolidated Financial Statements – Insurance subsidiary, included in this Form 10-K.
Available information
We make available free of charge (other than an investor's own Internet access charges) through our Internet website (
http://www.pentair.com
) our Annual Report on Form 10-K, Quarterly Reports on Form 10-Q, Current Reports on Form 8-K, and if applicable, amendments to those reports filed or furnished pursuant to Section 13(a) or 15(d) of the Exchange Act as soon as reasonably practicable after we electronically file such material with, or furnish it to, the SEC. Reports of beneficial ownership filed by our directors and executive officers pursuant to Section 16(a) of the Exchange Act are also available on our website. We are not including the information contained on our website as part of or incorporating it by reference into, this Annual Report on Form 10-K.
4
You should carefully consider all of the information in this document and the following risk factors before making an investment decision regarding our securities. Any of the following risks could materially and adversely affect our business, financial condition, results of operations, cash flows and the actual outcome of matters as to which forward-looking statements are made in this document.
Risks Relating to Our Proposed Separation of Our Water Business and Electrical Business by Spin-off
The proposed separation of our Water business and Electrical business is contingent upon the satisfaction of a number of conditions, may require significant time and attention of our management and may have an adverse effect on us whether or not it is completed.
On May 9, 2017, we announced that our Board of Directors approved a plan to separate our Water business and Electrical business into two independent, publicly-traded companies through a spin-off. Completion of the spin-off will be contingent upon customary conditions, including obtaining final approval from our Board of Directors, receipt of tax opinions and rulings and effectiveness of appropriate filings with the SEC. In addition, the proposed spin-off is complex in nature and may be affected by unanticipated developments or changes in market conditions. For these and other reasons, the spin-off may not be completed on April 30, 2018, as we are targeting, if at all.
Whether or not we complete the spin-off, our ongoing businesses may be adversely affected and we may be subject to certain risks and consequences as a result of pursuing the spin-off, including the following:
|
•
|
execution of the proposed spin-off will require significant time and attention from management, which may distract management from the operation of our businesses and the execution of other initiatives that may have been beneficial to us;
|
|
•
|
our employees may also be distracted due to uncertainty about their future roles with each of the separate companies pending the completion of the spin-off;
|
|
•
|
some of our suppliers or customers may delay or defer decisions or may end their relationships with us;
|
|
•
|
we will be required to pay certain costs and expenses relating to the spin-off, such as legal, accounting and other professional fees, whether or not it is completed; and
|
|
•
|
we may experience negative reactions from the financial markets if we fail to complete the spin-off or fail to complete it on a timely basis.
|
Any of these factors could have a material adverse effect on our business, financial condition, results of operations, cash flows and trading prices.
We may be unable to achieve some or all of the benefits that we expect to achieve from the spin-off.
Although we believe that separating our Electrical business from our Water business by means of the spin-off will provide financial, operational, managerial and other benefits to us and our shareholders, the spin-off may not provide the results on the scope or on the scale we anticipate, and we may not realize any or all of the intended benefits. In addition, we will incur one-time costs and ongoing costs in connection with, or as a result of, the spin-off, including costs of operating as independent, publicly-traded companies that the two businesses will no longer be able to share. Those costs may exceed our estimates or could negate some of the benefits we expect to realize. If we do not realize the intended benefits or if our costs exceed our estimates, we could suffer a material adverse effect on the business, financial condition, results of operations, cash flows and trading prices.
If the proposed spin-off of our Electrical business is completed, the trading price of our ordinary shares will likely decline and may experience greater volatility.
We expect the trading price of our ordinary shares immediately following the spin-off to be significantly lower than immediately prior to the spin-off because the trading price for our shares will no longer reflect the value of our Electrical business. In addition, until the market has fully analyzed our value without our Electrical business, the price of our shares may experience greater volatility.
If the proposed spin-off is completed, our shares may not match some holders' investment strategies or meet minimum criteria for inclusion in stock market indices or portfolios, which could cause investors to sell their shares. Excessive selling pressure could cause the market price of our shares to decrease further following the completion of the proposed spin-off.
5
Following the spin-off, the value of our ordinary shares and the ordinary shares of the Electrical business that is spun off may collectively trade at an aggregate price less than that at which the Company's ordinary shares might trade had the spin-off not occurred.
For a number of reasons, our ordinary shares and the ordinary shares of the Electrical business that is spun off that you may hold following the spin-off may collectively trade at a value less than the price at which our ordinary shares might have traded had the spin-off not occurred and we continued to own the Electrical business. These reasons include the future performance of either us or the Electrical business as separate, independent companies and the future shareholder base and market for our ordinary shares and the ordinary shares of the Electrical business and the prices at which these shares individually trade.
The proposed spin-off transaction could result in substantial tax liability to us and our shareholders.
The spin-off is conditioned on our receipt of opinions of tax counsel and tax rulings from taxing authorities. However, these tax opinions will not be binding on taxing authorities. Accordingly, taxing authorities or the courts may reach conclusions with respect to the spin-off that are different from the conclusions reached in the opinions of counsel. Moreover, the opinions of counsel will be based on certain statements and representations made by us, which, if incomplete or inaccurate in any material respect, could invalidate the opinion of counsel. Additionally, certain internal restructuring transactions necessary to accomplish the spin-off may result in adverse tax consequences to us.
If the spin-off and certain related transactions were determined to be taxable, we could be subject to a substantial tax liability that could have a material adverse effect on our financial condition, results of operations and cash flows. In addition, if the spin-off were taxable, each holder of our ordinary shares who receives shares of the Electrical business in the spin-off would generally be treated as receiving a taxable distribution of property in an amount equal to the fair market value of the shares received.
Risks Relating to Our Business
General global economic and business conditions affect demand for our products.
We compete in various geographic regions and product markets around the world. Among these, the most significant are global industrial markets and residential markets. We have experienced, and expect to continue to experience, fluctuations in revenues and results of operations due to economic and business cycles. Important factors for our businesses and the businesses of our customers include the overall strength of the economy and our customers' confidence in the economy, industrial and governmental capital spending, the strength of the residential and commercial real estate markets, unemployment rates, availability of consumer and commercial financing, interest rates, and energy and commodity prices. The businesses of many of our industrial customers are to varying degrees cyclical and have experienced periodic downturns. While we attempt to minimize our exposure to economic or market fluctuations by serving a balanced mix of end markets and geographic regions, any of the above factors, individually or in the aggregate, or a significant or sustained downturn in a specific end market or geographic region could reduce demand for our products and services, which could have a material adverse effect on our business, financial condition, results of operations and cash flows.
We compete in attractive markets with a high level of competition, which may result in pressure on our profit margins and limit our ability to maintain or increase the market share of our products.
The markets for our products and services are geographically diverse and highly competitive. We compete against large and well-established national and global companies, as well as regional and local companies and lower cost manufacturers. We compete based on technical expertise, reputation for quality and reliability, timeliness of delivery, previous installation history, contractual terms and price. Some of our competitors, in particular smaller companies, attempt to compete based primarily on price, localized expertise and local relationships, especially with respect to products and applications that do not require a great deal of engineering or technical expertise. In addition, during economic downturns average selling prices tend to decrease as market participants compete more aggressively on price. If we are unable to continue to differentiate our products, services and solutions, or if we are forced to cut prices or to incur additional costs to remain competitive, it could have a material adverse effect on our business, financial condition, results of operations and cash flows.
Volatility in currency exchange rates could have a material adverse effect on our financial condition, results of operations and cash flows.
Sales outside of the U.S. for the year ended
December 31, 2017
accounted for
40%
of our net sales. Our financial statements reflect translation of items denominated in non-U.S. currencies to U.S. dollars. Therefore, if the U.S. dollar strengthens in relation to the principal non-U.S. currencies from which we derive revenue as compared to a prior period, our U.S. dollar reported revenue and income will effectively be decreased to the extent of the change in currency valuations, and vice-versa. Fluctuations in foreign currency exchange rates, most notably the strengthening of the U.S. dollar against the euro, could have a material adverse effect on our reported revenue in future periods. In addition, currency variations could have a material adverse effect on margins on sales of our products in countries outside of the U.S. and margins on sales of products that include components obtained from suppliers located outside of the U.S.
6
Our future growth is dependent upon our ability to continue to adapt our products, services and organization to meet the demands of local markets in both developed and emerging economies and by developing or acquiring new technologies that achieve market acceptance with acceptable margins.
We operate in global markets that are characterized by customer demand that is often global in scope but localized in delivery. We compete with thousands of smaller regional and local companies that may be positioned to offer products produced at lower cost than ours, or to capitalize on highly localized relationships and knowledge that are difficult for us to replicate. Also, in several emerging markets potential customers prefer local suppliers, in some cases because of existing relationships and in other cases because of local legal restrictions or incentives that favor local businesses. Accordingly, our future success depends upon a number of factors, including our ability to adapt our products, services, organization, workforce and sales strategies to fit localities throughout the world, particularly in high growth emerging markets; identify emerging technological and other trends in our target end-markets; and develop or acquire competitive products and services and bring them to market quickly and cost-effectively. The failure to effectively adapt our products or services could have a material adverse effect on our business, financial condition, results of operations and cash flows.
We may not be able to identify, finance and complete suitable acquisitions and investments, and any completed acquisitions and investments could be unsuccessful or consume significant resources.
Our business strategy includes acquiring businesses and making investments that complement our existing businesses. We continue to analyze and evaluate the acquisition of strategic businesses or product lines with the potential to strengthen our industry position or enhance our existing set of product and service offerings. We may not be able to identify suitable acquisition candidates, obtain financing or have sufficient cash necessary for acquisitions or successfully complete acquisitions in the future or that completed acquisitions will be successful. Acquisitions and investments may involve significant cash expenditures, debt incurrences, equity issuances, operating losses and expenses. Acquisitions involve numerous other risks, including:
|
•
|
diversion of management time and attention from daily operations;
|
|
•
|
difficulties integrating acquired businesses, technologies and personnel into our business;
|
|
•
|
difficulties in obtaining and verifying the financial statements and other business information of acquired businesses;
|
|
•
|
inability to obtain required regulatory approvals;
|
|
•
|
potential loss of key employees, key contractual relationships or key customers of acquired companies or of ours;
|
|
•
|
assumption of the liabilities and exposure to unforeseen liabilities of acquired companies, including risks relating to the U.S. Foreign Corrupt Practices Act (the "FCPA"); and
|
|
•
|
dilution of interests of holders of our shares through the issuance of equity securities or equity-linked securities.
|
It may be difficult for us to complete transactions quickly and to integrate acquired operations efficiently into our business operations. Any acquisitions or investments may not be successful and may ultimately result in impairment charges and have a material adverse effect on our business, financial condition, results of operations and cash flows.
We may not achieve some or all of the expected benefits of our business initiatives.
During
2017
,
2016
and
2015
, we initiated and continued execution of certain business initiatives aimed at reducing our fixed cost structure and realigning our business. As a result, we have incurred substantial expense, including restructuring charges. We may not be able to achieve the operating efficiencies to reduce costs or realize benefits that were anticipated in connection with these initiatives. If we are unable to execute these initiatives as planned, we may not realize all or any of the anticipated benefits, which could have a material adverse effect on our business, financial condition, results of operations and cash flows
.
We are exposed to political, regulatory, economic and other risks that arise from operating a multinational business.
Sales outside of the U.S. for the year ended
December 31, 2017
accounted for
40%
of our net sales. Further, most of our businesses obtain some products, components and raw materials from non-U.S. suppliers. Accordingly, our business is subject to the political, regulatory, economic and other risks that are inherent in operating in numerous countries. These risks include:
|
•
|
changes in general economic and political conditions in countries where we operate, particularly in emerging markets;
|
|
•
|
relatively more severe economic conditions in some international markets than in the U.S.;
|
|
•
|
the difficulty of enforcing agreements and collecting receivables through non-U.S. legal systems;
|
|
•
|
the difficulty of communicating and monitoring standards and directives across our global facilities;
|
|
•
|
trade protection measures and import or export licensing requirements and restrictions;
|
|
•
|
the possibility of terrorist action affecting us or our operations;
|
7
|
•
|
the threat of nationalization and expropriation;
|
|
•
|
the imposition of tariffs, exchange controls or other trade restrictions;
|
|
•
|
difficulty in staffing and managing widespread operations in non-U.S. labor markets;
|
|
•
|
changes in tax treaties, laws or rulings that could have a material adverse impact on our effective tax rate;
|
|
•
|
limitations on repatriation of earnings;
|
|
•
|
the difficulty of protecting intellectual property in non-U.S. countries; and
|
|
•
|
changes in and required compliance with a variety of non-U.S. laws and regulations.
|
Our success depends in part on our ability to anticipate and effectively manage these and other risks. We cannot assure you that these and other factors will not have a material adverse effect on our international operations or on our business as a whole.
We may experience cost and other inflation.
In the past, we have experienced material cost and other inflation in a number of our businesses. We strive for productivity improvements and implement increases in selling prices to help mitigate cost increases in raw materials (especially metals and resins), energy and other costs such as pension, health care and insurance. We continue to implement operational initiatives in order to mitigate the impacts of this inflation and continuously reduce our costs. However, these actions may not be successful in managing our costs or increasing our productivity. Continued cost inflation or failure of our initiatives to generate cost savings or improve productivity could have a material adverse effect on our business, financial condition, results of operations and cash flows.
Intellectual property challenges may hinder our ability to develop, engineer and market our products.
Patents, non-compete agreements, proprietary technologies, customer relationships, trademarks, trade names and brand names are important to our business. Intellectual property protection, however, may not preclude competitors from developing products similar to ours or from challenging our names or products. Our pending patent applications, and our pending copyright and trademark registration applications, may not be allowed or competitors may challenge the validity or scope of our patents, copyrights or trademarks. In addition, our patents, copyrights, trademarks and other intellectual property rights may not provide us a significant competitive advantage. Over the past few years, we have noticed an increasing tendency for participants in our markets to use challenges to intellectual property as a means to compete. Patent and trademark challenges increase our costs to develop, engineer and market our products. We may need to spend significant resources monitoring our intellectual property rights and we may or may not be able to detect infringement by third parties. If we fail to successfully enforce our intellectual property rights or register new patents, our competitive position could suffer, which could have a material adverse effect on our business, financial condition, results of operations and cash flows.
We have significant goodwill and intangible assets and future impairment of our goodwill and intangible assets could have a material adverse effect on our results of operations.
We test goodwill and other indefinite-lived intangible assets for impairment on at least an annual basis, and more frequently if circumstances warrant, by comparing the estimated fair value of each of our reporting units to their respective carrying values on their balance sheets. As of
December 31, 2017
our goodwill and intangible assets were
$5,909.5 million
and represented
68%
of our total assets. Long-term declines in projected future cash flows could result in future goodwill and intangible asset impairment charges.
A material disruption at any of our manufacturing facilities could cause us to be unable to meet customer demands or increase our costs.
If operations at any of our manufacturing facilities were to be disrupted as a result of significant equipment failures, natural disasters, earthquakes, power outages, fires, explosions, terrorism, adverse weather conditions, labor disputes or other reasons, we may be unable to fill customer orders and otherwise meet customer demand for our products, which could have a material adverse effect our business, financial condition, results of operations and cash flows. Interruptions in production, in particular at our manufacturing facilities, could increase our costs and reduce our sales. Any interruption in production capability could require us to make substantial capital expenditures to fill customer orders. We maintain property damage insurance that we believe to be adequate to provide for reconstruction of facilities and equipment, as well as business interruption insurance to mitigate losses resulting from any production interruption or shutdown caused by an insured loss. However, any recovery under our insurance policies may not offset the lost sales or increased costs that may be experienced during the disruption of operations, which could have a material adverse effect our business, financial condition, results of operations and cash flows.
8
Seasonality of sales and weather conditions could have a material adverse effect on our financial results.
We experience seasonal demand in a number of markets within both of our business segments. In Water, demand for residential water supply products, infrastructure, agricultural products and end-user demand for pool equipment in our primary markets follow warm weather trends and are at seasonal highs from April to August. The magnitude of the sales increase in Water is partially mitigated by employing some advance sale or "early buy" programs (generally including extended payment terms and/or additional discounts). Seasonal effects may vary from year to year and are impacted by weather patterns, particularly by temperatures, heavy flooding and droughts. Electrical generally experiences increased demand for thermal protection products and services during the fall and winter months in the Northern Hemisphere and increased demand for electrical fastening products during the spring and summer months in the Northern Hemisphere. Seasonality and weather conditions could have a material adverse effect on our results of operations.
Our share price may fluctuate significantly.
We cannot predict the prices at which our shares may trade. The market price of our shares may fluctuate widely, depending on many factors, some of which may be beyond our control, including:
|
•
|
actual or anticipated fluctuations in our results of operations due to factors related to our business;
|
|
•
|
success or failure of our business strategy;
|
|
•
|
our quarterly or annual earnings, or those of other companies in our industry;
|
|
•
|
our ability to obtain third-party financing as needed;
|
|
•
|
announcements by us or our competitors of significant acquisitions or dispositions;
|
|
•
|
changes in accounting standards, policies, guidance, interpretations or principles;
|
|
•
|
changes in earnings estimates by us or securities analysts or our ability to meet those estimates;
|
|
•
|
the operating and share price performance of other comparable companies;
|
|
•
|
investor perception of us;
|
|
•
|
natural or other environmental disasters that investors believe may affect us;
|
|
•
|
overall market fluctuations;
|
|
•
|
results from any material litigation, including asbestos claims, government investigations or environmental liabilities;
|
|
•
|
changes in laws and regulations affecting our business; and
|
|
•
|
general economic conditions and other external factors.
|
Stock markets in general have experienced volatility that has often been unrelated to the operating performance of a particular company. These broad market fluctuations could have a material adverse effect on our share price.
Risks Relating to Legal, Regulatory and Compliance Matters
Violations of the U.S. Foreign Corrupt Practices Act and similar anti-corruption laws outside the U.S. could have a material adverse effect on us.
The FCPA and similar anti-corruption laws in other jurisdictions generally prohibit companies and their intermediaries from making improper payments to government officials or other persons for the purpose of obtaining or retaining business. Recent years have seen a substantial increase in anti-bribery law enforcement activity, with more frequent and aggressive investigations and enforcement proceedings by both the U.S. Department of Justice and the SEC, increased enforcement activity by non-U.S. regulators and increases in criminal and civil proceedings brought against companies and individuals. Our policies mandate compliance with these anti-bribery laws. We operate in many parts of the world that are recognized as having governmental and commercial corruption and in certain circumstances, strict compliance with anti-bribery laws may conflict with local customs and practices. Because many of our customers and end users are involved in infrastructure construction and energy production, they are often subject to increased scrutiny by regulators. We cannot assure you that our internal control policies and procedures will always protect us from reckless or criminal acts committed by our employees or third-party intermediaries. In the event that we believe or have reason to believe that our employees or agents have or may have violated applicable anti-corruption laws, including the FCPA we may be required to investigate or have outside counsel investigate the relevant facts and circumstances, which can be expensive and require significant time and attention from senior management. Violations of these laws may require self-disclosure to government agencies and result in criminal or civil sanctions, which could disrupt our business and result in a material adverse effect on our reputation, business, financial condition, results of operations and cash flows.
9
Our failure to satisfy international trade compliance regulations, and changes in U.S. government sanctions, could have a material adverse effect on us.
Our global operations require importing and exporting goods and technology across international borders on a regular basis. Certain of the products we manufacture are "dual use" products, which are products that may have both civil and military applications, or may otherwise be involved in weapons proliferation, and are often subject to more stringent export controls. From time to time, we obtain or receive information alleging improper activity in connection with imports or exports. Our policy mandates strict compliance with U.S. and non-U.S. trade laws applicable to our products. However, even when we are in strict compliance with law and our policies, we may suffer reputational damage if certain of our products are sold through various intermediaries to entities operating in sanctioned countries. When we receive information alleging improper activity, our policy is to investigate that information and respond appropriately, including, if warranted, reporting our findings to relevant government authorities. Nonetheless, our policies and procedures may not always protect us from actions that would violate U.S. and/or non-U.S. laws. Any improper actions could subject us to civil or criminal penalties, including material monetary fines, or other adverse actions including denial of import or export privileges, and could damage our reputation and business prospects.
Changes in U.S. administrative policy, including changes to existing trade agreements, could have a material adverse effect on us.
As a result of changes to U.S. administrative policy, there may be changes to existing trade agreements, like the North American Free Trade Agreement, greater restrictions on free trade generally, significant increases in tariffs on goods imported into the U.S. particularly tariffs on products manufactured in Mexico, among other possible changes. Changes in U.S. social, political, regulatory and economic conditions or in laws and policies governing foreign trade, manufacturing, development and investment in the territories and countries where we currently manufacture and sell products, and any resulting negative sentiments towards the U.S. as a result of such changes, could have a material adverse effect on our business, financial condition, results of operations and cash flows.
We are exposed to potential environmental laws, liabilities and litigation.
We are subject to U.S. federal, state, local and non-U.S. laws and regulations governing our environmental practices, public and worker health and safety, and the indoor and outdoor environment. Compliance with these environmental, health and safety regulations could require us to satisfy environmental liabilities, increase the cost of manufacturing our products or otherwise have a material adverse effect on our business, financial condition, results of operations and cash flows. Any violations of these laws by us could cause us to incur unanticipated liabilities. We are also required to comply with various environmental laws and maintain permits, some of which are subject to renewal from time to time, for many of our businesses and we could suffer if we are unable to renew existing permits or to obtain any additional permits that we may require. Compliance with environmental requirements also could require significant operating or capital expenditures or result in significant operational restrictions. We cannot assure you that we have been or will be at all times in compliance with environmental and health and safety laws. If we violate these laws, we could be fined, criminally charged or otherwise sanctioned by regulators.
We have been named as defendant, target or a potentially responsible party ("PRP") in a number of environmental clean-ups relating to our current or former business units. We have disposed of a number of businesses in recent years and in certain cases, we have retained responsibility and potential liability for certain environmental obligations. We have received claims for indemnification from certain purchasers. We may be named as a PRP at other sites in the future for existing business units, as well as both divested and acquired businesses. In addition to clean-up actions brought by governmental authorities, private parties could bring personal injury or other claims due to the presence of, or exposure to, hazardous substances.
Certain environmental laws impose liability on current or previous owners or operators of real property for the cost of removal or remediation of hazardous substances at their properties or at properties at which they have disposed of hazardous substances. We have projects underway at several current and former manufacturing facilities to investigate and remediate environmental contamination resulting from our past operations or by other businesses that previously owned or used the properties. The cost of clean-up and other environmental liabilities can be difficult to accurately predict. In addition, environmental requirements change and tend to become more stringent over time. Our eventual environmental clean-up costs and liabilities could exceed the amount of our current reserves.
Our subsidiaries are party to asbestos-related product litigation that could adversely affect our financial condition, results of operations and cash flows.
Our subsidiaries, along with numerous other companies, are named as defendants in a substantial number of lawsuits based on alleged exposure to asbestos-containing materials. These cases typically involve product liability claims based primarily on allegations of manufacture, sale or distribution of industrial products that either contained asbestos or were attached to or used with asbestos-containing components manufactured by third parties. Each case typically names between dozens to hundreds of corporate defendants. Historically, our subsidiaries have been identified as defendants in asbestos-related claims. We have experienced an increase in the number of asbestos-related lawsuits over the past several years, including lawsuits by plaintiffs
10
with mesothelioma-related claims. A large percentage of these suits have not presented viable legal claims and, as a result, have been dismissed or withdrawn. Our strategy has been, and continues to be, to mount a vigorous defense aimed at having unsubstantiated suits dismissed, and, only where appropriate, settling claims before trial. As of
December 31, 2017
, there were approximately
600
claims pending against our subsidiaries. We cannot predict with certainty the extent to which we will be successful in litigating or otherwise resolving lawsuits in the future and we continue to evaluate different strategies related to asbestos claims filed against us including entity restructuring and judicial relief. Unfavorable rulings, judgments or settlement terms could have a material adverse impact on our business and financial condition, results of operations and cash flows.
We are exposed to certain regulatory and financial risks related to climate change.
Climate change is receiving ever increasing attention worldwide. Many scientists, legislators and others attribute global warming to increased levels of greenhouse gases, which has led to significant legislative and regulatory efforts to limit greenhouse gas emissions. The U.S. Environmental Protection Agency ("EPA") has published findings that emissions of carbon dioxide, methane, and other greenhouse gases ("GHGs") present an endangerment to public health and the environment because emissions of such gases are, according to the EPA, contributing to the warming of the earth's atmosphere and other climate changes. Based on these findings, the EPA has implemented regulations that require reporting of GHG emissions, or that limit emissions of GHGs from certain mobile or stationary sources. In addition, the U.S. Congress and federal and state regulatory agencies have considered other legislation and regulatory proposals to reduce emissions of GHGs, and many states have already taken legal measures to reduce emissions of GHGs, primarily through the development of GHG inventories, GHG permitting and/or regional GHG cap-and-trade programs. It is uncertain whether, when and in what form a federal mandatory carbon dioxide emissions reduction program, or other state programs, may be adopted. Similarly, certain countries have adopted the Kyoto Protocol and/or the Paris Accord, and these and other existing international initiatives or those under consideration could affect our international operations. To the extent our customers, particularly our energy and industrial customers , are subject to any of these or other similar proposed or newly enacted laws and regulations, we are exposed to risks that the additional costs by customers to comply with such laws and regulations could impact their ability or desire to continue to operate at similar levels in certain jurisdictions as historically seen or as currently anticipated, which could negatively impact their demand for our products and services. These actions could also increase costs associated with our operations, including costs for raw materials and transportation. Because it is uncertain what laws will be enacted, we cannot predict the potential impact of such laws on our future financial condition, results of operations and cash flows.
Increased information technology security threats and computer crime pose a risk to our systems, networks, products and services, and we are exposed to potential regulatory, financial and reputational risks relating to the protection of our data.
We rely upon information technology systems and networks in connection with a variety of business activities, some of which are managed by third parties. Additionally, we collect and store data that is sensitive to Pentair and its employees, customers, dealers and suppliers. As our business increasingly interfaces with employees, customers, dealers and suppliers using information technology systems and networks, we are subject to an increased risk to the secure operation of these systems and networks and to additional laws and regulatory requirements regarding data privacy, including the European Union General Data Protection Regulation. The secure operation of these information technology systems and networks, and the processing and maintenance of this data is critical to our business operations and strategy. Information technology security threats -- from user error to attacks designed to gain unauthorized access to our systems, networks and data -- are increasing in frequency and sophistication. Attacks may range from random attempts to coordinated and targeted attacks, including sophisticated computer crime and advanced persistent threats. These threats pose a risk to the security of our systems and networks and the confidentiality, availability and integrity of the data we process and maintain. Establishing systems and processes to address these threats and changes in legal requirements relating to data collection and storage may increase our costs. We have experienced data breaches, and, although we have determined such data breaches to be immaterial and such data breaches have not had a material adverse effect on our financial condition, results of operations or cash flows, there can be no assurance of similar results in the future. Should future attacks succeed in the theft of assets, exporting sensitive data or financial information or controlling sensitive systems or networks, it could expose us and our employees, customers, dealers and suppliers to the theft of assets, misuse of information or systems, the compromising of confidential information, manipulation and destruction of data, defective products, production downtimes and operations disruptions, and breach of privacy, which may require notification under data privacy and other applicable laws. The occurrence of any of these events could have a material adverse effect on our reputation, business, financial condition, results of operations and cash flows. In addition, such breaches in security could result in litigation, regulatory action and potential liability and the costs and operational consequences of implementing further data protection measures.
11
We may be negatively impacted by litigation, including product liability claims.
Our businesses expose us to potential litigation, such as product liability claims relating to the design, manufacture and sale of our products. While we currently maintain what we believe to be suitable product liability insurance, we may not be able to maintain this insurance on acceptable terms and this insurance may not provide adequate protection against potential or previously existing liabilities. In addition, we self-insure a portion of product liability claims. Successful claims against us for significant amounts could have a material adverse effect on our product reputation, business, financial condition, results of operations and cash flows.
We share responsibility for certain income tax liabilities for tax periods prior to and including the date of the Distribution.
In connection with the Distribution, we entered into a tax sharing agreement (the "2012 Tax Sharing Agreement") with Tyco (now known as Johnson Controls International plc, "Johnson Controls") and The ADT Corporation ("ADT"), which governs the rights and obligations of ADT, Johnson Controls and us for certain pre-Distribution tax liabilities, including Johnson Controls' obligations under a separate tax sharing agreement (the "2007 Tax Sharing Agreement") entered into by Johnson Controls, Covidien Ltd. (now known as Medtronic plc, "Medtronic") and TE Connectivity Ltd. ("TE Connectivity") in connection with the 2007 distributions of Medtronic and TE Connectivity by Johnson Controls.
The 2012 Tax Sharing Agreement provides that we, Johnson Controls and ADT will share (i) certain pre-Distribution income tax liabilities that arise from adjustments made by tax authorities to our, Johnson Controls' and ADT's U.S. income tax returns, including withholding tax, income tax, or other tax liabilities that could arise if the Merger, Distribution or certain internal transactions undertaken in anticipation of the Distribution are determined to be taxable for U.S. federal or Swiss tax purposes, and (ii) payments required to be made by Johnson Controls with respect to the 2007 Tax Sharing Agreement (the liabilities in clauses (i) and (ii) collectively, "Shared Tax Liabilities"). Johnson Controls is responsible for the first $500 million of Shared Tax Liabilities. As of December 31, 2017, Johnson Controls has paid $210.0 million of Shared Tax Liabilities. We and ADT will share 42% and 58%, respectively, of the next $225 million of Shared Tax Liabilities. We, ADT and Johnson Controls will share 20%, 27.5% and 52.5%, respectively, of Shared Tax Liabilities above $725 million. Costs and expenses associated with the management of Shared Tax Liabilities will generally be shared 20% by us, 27.5% by ADT and 52.5% by Johnson Controls. The ultimate resolution of these matters, and the impact of that resolution, are uncertain. To the extent we are responsible for any liability under the 2012 Tax Sharing Agreement, and indirectly the 2007 Tax Sharing Agreement, there could be a material adverse impact on our financial condition, results of operations, cash flows or our effective tax rate in future reporting periods.
In addition, under the terms of the 2012 Tax Sharing Agreement, in the event the Distribution, the ADT distribution, the internal transactions or the Merger were determined to be taxable as a result of actions taken after the Distribution by us, ADT or Johnson Controls, the party responsible for such failure would be responsible for all taxes imposed as a result thereof. If such failure is not the result of actions taken after the Distribution by us, ADT or Johnson Controls, then we, ADT and Johnson Controls would be responsible for any taxes imposed as a result of such determination in the same manner and in the same proportions as we, ADT and Johnson Controls are responsible for Shared Tax Liabilities. Such tax amounts could be significant.
Risks Relating to Our Liquidity
Disruptions in the financial markets could adversely affect us, our customers and our suppliers by increasing funding costs or reducing availability of credit.
In the normal course of our business, we may access credit markets for general corporate purposes, which may include repayment of indebtedness, acquisitions, additions to working capital, repurchase of shares, capital expenditures and investments in our subsidiaries. Although we expect to have sufficient liquidity to meet our foreseeable needs, our access to and the cost of capital could be negatively impacted by disruptions in the credit markets, which have occurred in the past and made financing terms for borrowers unattractive or unavailable. These factors may make it more difficult or expensive for us to access credit markets if the need arises. In addition, these factors may make it more difficult for our suppliers to meet demand for their products or for prospective customers to commence new projects, as customers and suppliers may experience increased costs of debt financing or difficulties in obtaining debt financing. Disruptions in the financial markets have had adverse effects on other areas of the economy and have led to a slowdown in general economic activity that may continue to adversely affect our businesses. These disruptions may have other unknown adverse effects. One or more of these factors could adversely affect our business, financial condition, results of operations or cash flows.
Covenants in our debt instruments may adversely affect us.
Our credit agreements and indentures contain customary financial covenants, including those that limit the amount of our debt, which may restrict the operations of our business and our ability to incur additional debt to finance acquisitions. Our ability to meet the financial covenants can be affected by events beyond our control, and we cannot provide assurance that we will meet those tests. A breach of any of these covenants could result in a default under our credit agreements or indentures. Upon the occurrence of an event of default under any of our credit facilities or indentures, the lenders or trustees could elect to declare all
12
amounts outstanding thereunder to be immediately due and payable and, in the case of credit facility lenders, terminate all commitments to extend further credit. If the lenders or trustees accelerate the repayment of borrowings, we cannot provide assurance that we will have sufficient assets to repay our credit facilities and our other indebtedness. Furthermore, acceleration of any obligation under any of our material debt instruments will permit the holders of our other material debt to accelerate their obligations, which could have a material adverse effect on our financial condition.
We may increase our debt or raise additional capital in the future, which could affect our financial condition, and may decrease our profitability.
As of
December 31, 2017
, we had
$1.4 billion
of total debt outstanding. We may increase our debt or raise additional capital in the future, subject to restrictions in our debt agreements. If our cash flow from operations is less than we anticipate, if our cash requirements are more than we expect, or if we intend to finance acquisitions, we may require more financing. However, debt or equity financing may not be available to us on acceptable terms, if at all. If we incur additional debt or raise equity through the issuance of additional capital shares, the terms of the debt or capital shares issued may give the holders rights, preferences and privileges senior to those of holders of our ordinary shares, particularly in the event of liquidation. The terms of the debt may also impose additional and more stringent restrictions on our operations than we currently have. If we raise funds through the issuance of additional equity, the percentage ownership of existing shareholders in our company would decline. If we are unable to raise additional capital when needed, our financial condition could be adversely affected.
Our leverage could have a material adverse effect on our business, financial condition or results of operations.
Our ability to make payments on and to refinance our indebtedness, including our existing debt as well as any future debt that we may incur, will depend on our ability to generate cash in the future from operations, financings or asset sales. Our ability to generate cash is subject to general economic, financial, competitive, legislative, regulatory and other factors that are beyond our control. If we are not able to repay or refinance our debt as it becomes due, we may be forced to sell assets or take other disadvantageous actions, including (i) reducing financing in the future for working capital, capital expenditures and general corporate purposes or (ii) dedicating an unsustainable level of our cash flow from operations to the payment of principal and interest on our indebtedness. The lenders who hold such debt could also accelerate amounts due, which could potentially trigger a default or acceleration of any of our other debt.
Risks Relating to Our Jurisdiction of Incorporation in Ireland and Tax Residency in the U.K.
We are subject to changes in law and other factors that may not allow us to maintain a worldwide effective corporate tax rate that is competitive in our industry.
While we believe that we should be able to maintain a worldwide effective corporate tax rate that is competitive in our industry, we cannot give any assurance as to what our effective tax rate will be in the future because of, among other things, uncertainty regarding tax policies of the jurisdictions where we operate. Also, the tax laws of the U.S., the U.K., Ireland and other jurisdictions could change in the future, and such changes could cause a material change in our worldwide effective corporate tax rate. In particular, legislative action could be taken by the U.S., the U.K., Ireland or the European Union which could override tax treaties or modify tax statutes or regulations upon which we expect to rely and adversely affect our effective tax rate. We cannot predict the outcome of any specific legislative proposals. If proposals were enacted that had the effect of disregarding our incorporation in Ireland or limiting our ability as an Irish company to maintain tax residency in the U.K. and take advantage of the tax treaties among the U.S., the U.K. and Ireland, we could be subject to increased taxation, which could materially adversely affect our financial condition, results of operations, cash flows or our effective tax rate in future reporting periods.
A change in our tax residency could have a negative effect on our future profitability, and may trigger taxes on dividends or exit charges.
Under current Irish legislation, a company is regarded as resident for tax purposes in Ireland if it is centrally managed and controlled in Ireland, or, in certain circumstances, if it is incorporated in Ireland. Under current U.K. legislation, a company that is centrally managed and controlled in the U.K. is regarded as resident in the U.K. for taxation purposes unless it is treated as resident in another jurisdiction pursuant to any appropriate double tax treaty with the U.K. Other jurisdictions may also seek to assert taxing jurisdiction over Pentair.
Where a company is treated as tax resident under the domestic laws of both the U.K. and Ireland, article 4(3) of the Double Tax Convention between Ireland and the U.K. (the "residence tie-breaker") currently provides that the company shall be treated as resident only in one of those two jurisdictions if its place of effective management is situated in that jurisdiction.
The Organisation for Economic Co-operation and Development has proposed a number of measures relating to the tax treatment of multinationals, some of which are to be implemented by amending double tax treaties through a multilateral instrument (the "MLI"). The MLI has been signed by a number of countries, including Ireland and the U.K. The MLI allows signatories to opt into or out of certain changes: the effect for a given double tax convention depends on the options chosen by
13
the two contracting states. Ireland and the U.K. have indicated they intend to change the residence tie-breaker so that it will depend on a ruling by the tax authorities of the two contracting states, instead of an objective application of the place of effective management test. Accordingly, if Ireland and the U.K. maintain their position and enough other countries ratify the MLI, the residence tie-breaker would be amended to depend on a determination by Irish Revenue Commissioners and the U.K. HM Revenue and Customs. It is not certain when this will take place nor what factors will be taken into account in making the determination, but we do not expect such a determination to alter our tax residency.
It is possible that in the future, whether as a result of a change in law (including the entry into force of the MLI or a change to the intention of Ireland or the U.K. in relation to the MLI) or the practice of any relevant tax authority or as a result of any change in the conduct of our affairs, we could become, or be regarded as having become, resident in a jurisdiction other than the U.K. If Pentair ceases to be resident in the U.K. and becomes resident in another jurisdiction, it may be subject to U.K. exit charges, and could become liable for additional tax charges in the other jurisdiction (including dividend withholding taxes or corporate income tax charges). If Pentair were to be treated as resident in more than one jurisdiction, it could be subject to taxation in multiple jurisdictions. If, for example, Pentair were considered to be a tax resident of Ireland, we could become liable for Irish corporation tax and any dividends paid by it could be subject to Irish dividend withholding tax.
Irish law differs from the laws in effect in the United States and may afford less protection to holders of our securities.
It may not be possible to enforce court judgments obtained in the U.S. against us in Ireland based on the civil liability provisions of the U.S. federal or state securities laws. In addition, there is some uncertainty as to whether the courts of Ireland would recognize or enforce judgments of U.S. courts obtained against us or our directors or officers based on the civil liabilities provisions of the U.S. federal or state securities laws or hear actions against us or those persons based on those laws. We have been advised that the U.S. currently does not have a treaty with Ireland providing for the reciprocal recognition and enforcement of judgments in civil and commercial matters. Therefore, a final judgment for the payment of money rendered by any U.S. federal or state court based on civil liability, whether or not based solely on U.S. federal or state securities laws, would not automatically be enforceable in Ireland.
As an Irish company, we are governed by the Irish Companies Act, which differs in some material respects from laws generally applicable to U.S. corporations and shareholders, including, among others, differences relating to interested director and officer transactions and shareholder lawsuits. Likewise, the duties of directors and officers of an Irish company generally are owed to the company only. Shareholders of Irish companies generally do not have a personal right of action against directors or officers of the company and may exercise such rights of action on behalf of the company only in limited circumstances. Accordingly, holders of our securities may have more difficulty protecting their interests than would holders of securities of a corporation incorporated in a jurisdiction of the U.S.
Transfers of our ordinary shares may be subject to Irish stamp duty.
Transfers of our ordinary shares effected by means of the transfer of book entry interests in the Depository Trust Company ("DTC") will not be subject to Irish stamp duty. However, if you hold your ordinary shares directly rather than beneficially through DTC, any transfer of your ordinary shares could be subject to Irish stamp duty (currently at the rate of 1 percent of the higher of the price paid or the market value of the shares acquired). Payment of Irish stamp duty is generally a legal obligation of the transferee.
We currently intend to pay, or cause one of our affiliates to pay, stamp duty in connection with share transfers made in the ordinary course of trading by a seller who holds shares directly to a buyer who holds the acquired shares beneficially. In other cases we may, in our absolute discretion, pay or cause one of our affiliates to pay any stamp duty. Our articles of association provide that, in the event of any such payment, we (i) may seek reimbursement from the buyer, (ii) will have a lien against the shares acquired by such buyer and any dividends paid on such shares and (iii) may set-off the amount of the stamp duty against future dividends on such shares. Parties to a share transfer may assume that any stamp duty arising in respect of a transaction in our shares has been paid unless one or both of such parties is otherwise notified by us.
Our ordinary shares, received by means of a gift or inheritance could be subject to Irish capital acquisitions tax.
Irish capital acquisitions tax ("CAT") could apply to a gift or inheritance of our ordinary shares irrespective of the place of residence, ordinary residence or domicile of the parties. This is because our shares will be regarded as property situated in Ireland. The person who receives the gift or inheritance has primary liability for CAT. Gifts and inheritances passing between spouses are exempt from CAT. Children have a tax-free threshold of €310,000 per lifetime in respect of taxable gifts or inheritances received from their parents for periods on or after October 12, 2016.
None.
14
Our principal office is located in leased premises in London, United Kingdom, and our management office in the United States is located in leased premises in Minneapolis, Minnesota. Our operations are conducted in facilities throughout the world. These facilities house manufacturing and distribution operations, as well as sales and marketing, engineering and administrative offices.
We carry out our Water manufacturing operations at
21
plants located throughout the United States and at
27
plants located in
14
other countries. In addition, Water has
33
distribution facilities,
48
sales offices and
11
service centers located in numerous countries throughout the world.
We carry out our Electrical manufacturing operations at
8
plants located throughout the United States and at
13
plants located in
11
other countries. In addition, Electrical has
24
distribution facilities,
53
sales offices and
2
service centers located in numerous countries throughout the world.
We believe that our production facilities are suitable for their purpose and are adequate to support our businesses.
We have been made parties to a number of actions filed or have been given notice of potential claims relating to the conduct of our business, including those pertaining to commercial disputes, product liability, asbestos, environmental, safety and health, patent infringement and employment matters.
While we believe that a material impact on our consolidated financial position, results of operations or cash flows from any such future claims or potential claims is unlikely, given the inherent uncertainty of litigation, a remote possibility exists that a future adverse ruling or unfavorable development could result in future charges that could have a material adverse impact. We do and will continue to periodically reexamine our estimates of probable liabilities and any associated expenses and receivables and make appropriate adjustments to such estimates based on experience and developments in litigation. As a result, the current estimates of the potential impact on our consolidated financial position, results of operations and cash flows for the proceedings and claims described in the notes to our consolidated financial statements could change in the future.
Asbestos matters
Our subsidiaries and numerous other unaffiliated companies are named as defendants in personal injury lawsuits based on alleged exposure to asbestos-containing materials. These cases typically involve product liability claims based primarily on allegations of manufacture, sale or distribution of industrial products that either contained asbestos or were attached to or used with asbestos-containing components manufactured by third-parties. Each case typically names between dozens to hundreds of corporate defendants. While we have observed an increase in the number of these lawsuits over the past several years, including lawsuits by plaintiffs with mesothelioma-related claims, a large percentage of these suits have not presented viable legal claims and, as a result, have been dismissed by the courts. Our historical strategy has been to mount a vigorous defense aimed at having unsubstantiated suits dismissed, and, where appropriate, settling suits before trial. Although a large percentage of litigated suits have been dismissed, we cannot predict the extent to which we will be successful in resolving lawsuits in the future.
As of December 31, 2017, there were approximately
600
claims outstanding against our subsidiaries. This amount is not adjusted for claims that are not actively being prosecuted, identified incorrect defendants, or duplicated other actions, which would ultimately reflect our current estimate of the number of viable claims made against us, our affiliates, or entities for which we assumed responsibility in connection with acquisitions or divestitures. In addition, the amount does not include certain claims pending against third parties for which we have been provided an indemnification.
Environmental matters
We have been named as defendant, target or a potentially responsible party ("PRP") in a number of environmental clean-ups relating to our current or former business units. We have disposed of a number of businesses in recent years and in certain cases, we have retained responsibility and potential liability for certain environmental obligations. We have received claims for indemnification from certain purchasers. We may be named as a PRP at other sites in the future for existing business units, as well as both divested and acquired businesses. In addition to cleanup actions brought by governmental authorities, private parties could bring personal injury or other claims due to the presence of, or exposure to, hazardous substances.
Certain environmental laws impose liability on current or previous owners or operators of real property for the cost of removal or remediation of hazardous substances at their properties or at properties at which they have disposed of hazardous substances. We have projects underway at several current and former manufacturing facilities to investigate and remediate environmental contamination resulting from our past operations or by other businesses that previously owned or used the properties.
15
Our accruals for environmental matters are recorded on a site-by-site basis when it is probable that a liability has been incurred and the amount of the liability can be reasonably estimated, based on current law and existing technologies. It can be difficult to estimate reliably the final costs of investigation and remediation due to various factors. In our opinion, the amounts accrued are appropriate based on facts and circumstances as currently known. As of December 31, 2017, our recorded reserves for environmental matters were not material. We do not anticipate our remaining environmental conditions will have a material adverse effect on our financial position, results of operations or cash flows. However, unknown conditions, new details about existing conditions or changes in environmental requirements may give rise to environmental liabilities that will exceed the amount of our current reserves and could have a material adverse effect in the future.
Product liability claims
We are subject to various product liability lawsuits and personal injury claims. A substantial number of these lawsuits and claims are insured and accrued for by Penwald, our captive insurance subsidiary. See discussion in ITEM 1 and ITEM 8, Note 1 of the Notes to Consolidated Financial Statements — Insurance subsidiary. Penwald records a liability for these claims based on actuarial projections of ultimate losses. For all other claims, accruals covering the claims are recorded, on an undiscounted basis, when it is probable that a liability has been incurred and the amount of the liability can be reasonably estimated based on existing information. The accruals are adjusted periodically as additional information becomes available. We have not experienced significant unfavorable trends in either the severity or frequency of product liability lawsuits or personal injury claims.
Not applicable.
16
EXECUTIVE OFFICERS OF THE REGISTRANT
Current executive officers of Pentair plc, their ages, current position and their business experience during at least the past five years are as follows:
|
Name
|
Age
|
Current Position and Business Experience
|
|||
|
Randall J. Hogan
|
62
|
|
Chief Executive Officer since 2001 and Chairman of the Board since 2002; President and Chief Operating Officer, 1999 — 2000; Executive Vice President and President of Pentair's Electrical and Electronic Enclosures Group, 1998 — 1999; United Technologies Carrier Transicold President, 1995 — 1997; Pratt & Whitney Industrial Turbines Vice President and General Manager, 1994 — 1995; General Electric various executive positions, 1988 — 1994; McKinsey & Company consultant, 1981 — 1987. It is expected that Mr. Hogan will retire from his positions as Chairman and Chief Executive Officer of the Company and become the Chairman of nVent Electric plc, effective upon the completion of the Proposed Separation.
|
||
|
John L. Stauch
|
53
|
|
Executive Vice President and Chief Financial Officer since 2007; Chief Financial Officer of the Automation and Control Systems unit of Honeywell International Inc., 2005 — 2007; Vice President, Finance and Chief Financial Officer of the Sensing and Controls unit of Honeywell International Inc., 2004 — 2005; Vice President, Finance and Chief Financial Officer of the Automation & Control Products unit of Honeywell International Inc., 2002 — 2004; Chief Financial Officer and IT Director of PerkinElmer Optoelectronics, a unit of PerkinElmer, Inc., 2000 — 2002; Various executive, investor relations and managerial finance positions with Honeywell International Inc. and its predecessor AlliedSignal Inc., 1994 — 2000. It is expected that Mr. Stauch will become the Company’s Chief Executive Officer, effective upon the completion of the Proposed Separation.
|
||
|
Angela D. Jilek
|
49
|
|
Senior Vice President, General Counsel and Secretary since 2010; Assistant General Counsel, 2002 — 2010; Shareholder and Officer of the law firm of Henson & Efron, P.A., 2000 — 2002; Associate Attorney in the law firm of Henson & Efron, P.A. 1996 — 2000 and in the law firm of Felhaber Larson Fenlon & Vogt, P.A., 1992 — 1996. It is expected that Ms. Jilek will retire from the Company effective May 1, 2018.
|
||
|
John H. Jacko
|
60
|
|
Senior Vice President and Chief Marketing Officer since 2017; Vice President and Chief Marketing Officer of Kennametal Corporation, 2007 — 2016; Senior Vice President and Chief Marketing Officer of Flowserve Corporation, 2002 — 2007; Vice President of Marketing and Customer Management of Flowserve Corporation, 2001 — 2002; Various business leadership positions of Honeywell Aerospace, 1995 — 2001.
It is expected that Mr. Jacko will become the Company’s Chief Growth Officer, effective upon the completion of the Proposed Separation.
|
||
|
Mark C. Borin
|
50
|
|
Senior Vice President and Chief Accounting Officer since 2008 and Treasurer since 2015; Partner in the audit practice of the public accounting firm KPMG LLP, 2000 — 2008; Various positions in the audit practice of KPMG LLP, 1989 — 2000. It is expected that Mr. Borin will become the Company’s Chief Financial Officer, effective upon the completion of the Proposed Separation.
|
||
|
Karl R. Frykman
|
57
|
|
President, Water segment since 2017; President, Water Quality Systems Global Business Unit, 2007 — 2016; President of Aquatic Systems' National Pool Tile group, 1998— 2007; Vice President of Operations for American Products, 1995 — 1998; Vice President of Anthony Pools, 1990 — 1995; Vice President of Poolsaver, 1988 — 1990. It is expected that Mr. Frykman will become the Company’s Chief Operating Officer, effective upon the completion of the Proposed Separation.
|
||
|
Beth A. Wozniak
|
53
|
|
President, Electrical segment since 2017; President, Flow & Filtration Solutions Global Business Unit, 2015 — 2016; President of Environmental and Combustion Controls unit of Honeywell International Inc., 2011 — 2015; President of Sensing and Controls unit of Honeywell International Inc., 2006 — 2011; Various leadership positions at Honeywell International Inc. and its predecessor AlliedSignal Inc., 1990 — 2006. It is expected that Ms. Wozniak will resign from her position with the Company and become the Chief Executive Officer of nVent Electric plc, effective upon the completion of the Proposed Separation.
|
||
17
Our ordinary shares are listed for trading on the New York Stock Exchange and trade under the symbol "PNR." As of
December 31, 2017
, there were
16,011
shareholders of record.
The high, low and closing sales price for our ordinary shares and the dividends paid for each of the quarterly periods for
2017
and
2016
were as follows:
|
|
2017
|
2016
|
|||||||||||||||||||||||
|
|
First
|
Second
|
Third
|
Fourth
|
First
|
Second
|
Third
|
Fourth
|
|||||||||||||||||
|
High
|
$
|
63.45
|
|
$
|
69.03
|
|
$
|
68.50
|
|
$
|
71.76
|
|
$
|
54.54
|
|
$
|
63.39
|
|
$
|
66.99
|
|
$
|
64.39
|
|
|
|
Low
|
56.53
|
|
61.61
|
|
59.13
|
|
67.27
|
|
41.57
|
|
50.37
|
|
57.20
|
|
53.80
|
|
|||||||||
|
Close
|
62.78
|
|
66.54
|
|
67.96
|
|
70.62
|
|
54.26
|
|
58.29
|
|
64.24
|
|
56.07
|
|
|||||||||
|
Dividends paid
|
0.345
|
|
0.345
|
|
0.345
|
|
0.345
|
|
0.33
|
|
0.33
|
|
0.34
|
|
0.34
|
|
|||||||||
Pentair has paid 168 consecutive quarterly dividends. The Board of Directors has approved a plan to increase the dividend for 2018, which will mark the 42
nd
consecutive year we have increased dividends.
Future dividends on our ordinary shares or reductions of share capital for distribution to shareholders, if any, must be approved by our Board of Directors for payment out of distributable reserves on our statutory balance sheet. We are not permitted to pay dividends out of share capital, which includes share premiums. Distributable reserves may be created through the earnings of the Irish parent company and through a reduction in share capital approved by the Irish High Court. Distributable reserves are not linked to a U.S. generally accepted accounting principles ("GAAP") reported amount (e.g., retained earnings). On July 22, 2014, the Irish High Court approved Pentair plc's conversion of approximately $14.4 billion of share premium to distributable reserves. On July 29, 2014, following the approval of the Irish High Court, we made the required filing of Pentair plc's initial accounts with the Irish Companies Registration Office, which completed the process to allow us to pay future cash dividends and redeem and repurchase shares out of Pentair plc's "distributable reserves." Our distributable reserve balance was
$9.0 billion
and
$9.4 billion
as of
December 31, 2017
and
2016
, respectively.
The timing, declaration and payment of future dividends to holders of our ordinary shares will depend upon many factors, including our financial condition and results of operations, the capital requirements of our businesses, industry practice and any other relevant factors.
United Kingdom tax considerations
Although our jurisdiction of organization is Ireland, we manage our affairs so that we are centrally managed and controlled in the U.K. and therefore have our tax residency in the U.K.
As a result of its U.K. tax status, dividend distributions by Pentair plc to its shareholders are not subject to withholding tax, as the U.K. currently does not levy a withholding tax on dividend distributions.
See the discussion of "
Dividends"
under "Liquidity and Capital Resources—Financing Activities" in ITEM 7 of this annual report on Form 10-K for additional information required by this item.
18
Share Performance Graph
The following information under the caption "Share Performance Graph" in this ITEM 5 of this Annual Report on Form 10-K is not deemed to be "soliciting material" or to be "filed" with the SEC or subject to Regulation 14A or 14C under the Securities Exchange Act of 1934, as amended (the "Exchange Act"), or to the liabilities of Section 18 of the Exchange Act and will not be deemed to be incorporated by reference into any filing under the Securities Act of 1933, as amended, or the Exchange Act, except to the extent we specifically incorporate it by reference into such a filing.
The following graph sets forth the cumulative total shareholder return on our ordinary shares for the last five years, assuming the investment of $100 on
December 31, 2012
and the reinvestment of all dividends since that date to
December 31, 2017
. The graph also contains for comparison purposes the S&P 500 Index and the S&P 500 Industrials Index, assuming the same investment level and reinvestment of dividends.
By virtue of our market capitalization, we are a component of the S&P 500 Index. On the basis of our size and diversity of businesses, we believe the S&P 500 Industrials Index is an appropriate published industry index for comparison purposes.
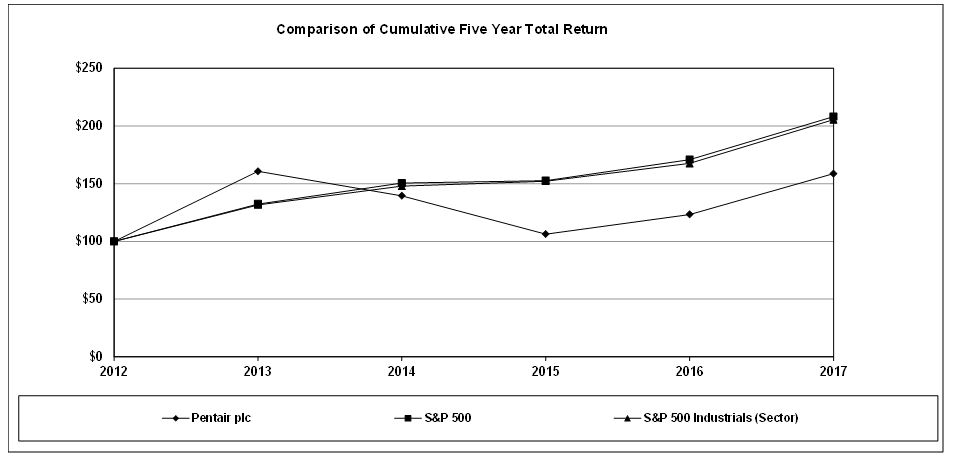
|
|
Base Period
December
|
INDEXED RETURNS
Years ended December 31
|
||||||||||
|
Company / Index
|
2012
|
2013
|
2014
|
2015
|
2016
|
2017
|
||||||
|
Pentair plc
|
100
|
160.70
|
|
139.55
|
|
106.31
|
|
123.32
|
|
158.68
|
|
|
|
S&P 500 Index
|
100
|
132.39
|
|
150.51
|
|
152.59
|
|
170.84
|
|
208.14
|
|
|
|
S&P 500 Industrials Index
|
100
|
131.64
|
|
147.91
|
|
152.19
|
|
167.59
|
|
205.41
|
|
|
19
Purchases of Equity Securities
The following table provides information with respect to purchases we made of our ordinary shares during the fourth quarter of
2017
:
|
(a)
|
(b)
|
(c)
|
(d)
|
|||||||
|
Total number of
shares
purchased
|
Average price
paid per share
|
Total number of
shares
purchased as
part of publicly
announced
plans or
programs
|
Dollar value
of
shares that may
yet be purchased
under the plans or
programs
|
|||||||
|
October 1 – October 28, 2017
|
1,146
|
|
$
|
67.96
|
|
—
|
|
$
|
700,000,054
|
|
|
October 29 – November 25, 2017
|
17,792
|
|
69.28
|
|
—
|
|
700,000,054
|
|
||
|
November 26 – December 31, 2017
|
1,432,297
|
|
69.80
|
|
1,432,297
|
|
600,000,119
|
|
||
|
Total
|
1,451,235
|
|
1,432,297
|
|
||||||
|
(a)
|
The purchases in this column include
1,146
shares for the period
October 1 – October 28, 2017
,
17,792
shares for the period
October 29 – November 25, 2017
, and
no
shares for the period
November 26 – December 31, 2017
deemed surrendered to us by participants in our 2012 Stock and Incentive Plan (the "2012 Plan") and earlier stock incentive plans that are now outstanding under the 2012 Plan (collectively the "Plans") to satisfy the exercise price or withholding of tax obligations related to the exercise of stock options and vesting of restricted shares.
|
|
(b)
|
The average price paid in this column includes shares repurchased as part of our publicly announced plans and shares deemed surrendered to us by participants in the Plans to satisfy the exercise price of stock options and withholding tax obligations due upon stock option exercises and vesting of restricted shares.
|
|
(c)
|
The number of shares in this column represents the number of shares repurchased as part of our publicly announced plans to repurchase our ordinary shares up to a maximum dollar limit of $1.0 billion.
|
|
(d)
|
In December 2014, our Board of Directors authorized the repurchase of our ordinary shares up to a maximum dollar limit of
$1.0 billion
. This authorization expires on
December 31, 2019
. We have
$600.0 million
remaining availability for repurchases under the 2014 authorization.
|
20
The following table sets forth our selected historical financial data for the five years ended
December 31, 2017
.
|
|
Years ended December 31
|
||||||||||||||
|
In millions, except per-share data
|
2017
|
2016
|
2015
|
2014
|
2013
|
||||||||||
|
Consolidated statements of operations and comprehensive income data
|
|||||||||||||||
|
Net sales
|
$
|
4,936.5
|
|
$
|
4,890.0
|
|
$
|
4,616.4
|
|
$
|
4,666.8
|
|
$
|
4,553.7
|
|
|
Operating income
|
680.8
|
|
700.7
|
|
616.1
|
|
538.5
|
|
529.2
|
|
|||||
|
Net income from continuing operations attributable to Pentair plc
|
480.0
|
|
451.6
|
|
397.1
|
|
356.6
|
|
354.8
|
|
|||||
|
Per-share data
|
|
||||||||||||||
|
Basic:
|
|
||||||||||||||
|
Earnings per ordinary share from continuing operations attributable to Pentair plc
|
$
|
2.64
|
|
$
|
2.49
|
|
$
|
2.20
|
|
$
|
1.87
|
|
$
|
1.76
|
|
|
Weighted average shares
|
181.7
|
|
181.3
|
|
180.3
|
|
190.6
|
|
201.1
|
|
|||||
|
Diluted:
|
|
||||||||||||||
|
Earnings per ordinary share from continuing operations attributable to Pentair plc
|
$
|
2.61
|
|
$
|
2.47
|
|
$
|
2.17
|
|
$
|
1.84
|
|
$
|
1.73
|
|
|
Weighted average shares
|
183.7
|
|
183.1
|
|
182.6
|
|
193.7
|
|
204.6
|
|
|||||
|
Cash dividends declared and paid per ordinary share
|
$
|
1.38
|
|
$
|
1.34
|
|
$
|
1.28
|
|
$
|
1.10
|
|
$
|
0.96
|
|
|
Cash dividends declared and unpaid per ordinary share
|
0.35
|
|
0.345
|
|
0.33
|
|
0.64
|
|
0.50
|
|
|||||
|
Consolidated balance sheets data
|
|
||||||||||||||
|
Total assets
|
$
|
8,633.7
|
|
$
|
11,534.8
|
|
$
|
11,833.4
|
|
$
|
10,643.8
|
|
$
|
11,732.5
|
|
|
Total debt
|
1,440.7
|
|
4,279.2
|
|
4,685.8
|
|
2,988.4
|
|
2,532.6
|
|
|||||
|
Total equity
|
5,037.8
|
|
4,254.4
|
|
4,008.8
|
|
4,663.8
|
|
6,217.7
|
|
|||||
21
Forward-looking statements
This report contains statements that we believe to be "forward-looking statements" within the meaning of the Private Securities Litigation Reform Act of 1995. All statements, other than statements of historical fact are forward-looking statements. Without limitation, any statements preceded or followed by or that include the words "targets," "plans," "believes," "expects," "intends," "will," "likely," "may," "anticipates," "estimates," "projects," "should," "would," "positioned," "strategy," "future" or words, phrases or terms of similar substance or the negative thereof, are forward-looking statements. These forward-looking statements are not guarantees of future performance and are subject to risks, uncertainties, assumptions and other factors, some of which are beyond our control, which could cause actual results to differ materially from those expressed or implied by such forward-looking statements. These factors include the ability to satisfy the necessary conditions to consummate the Proposed Separation (as defined below) on a timely basis or at all; the ability to successfully separate the Water and Electrical businesses and realize the anticipated benefits from the Proposed Separation; adverse effects on the Water and Electrical business operations or financial results and the market price of our shares as a result of the announcement or consummation of the Proposed Separation; unanticipated transaction expenses, such as litigation or legal settlement expenses; failure to obtain tax rulings or changes in tax laws; changes in capital market conditions; the impact of the Proposed Separation on our employees, customers and suppliers; overall global economic and business conditions impacting the Water and Electrical businesses; future opportunities that our board may determine present greater potential to increase shareholder value; the ability of the Water and Electrical businesses to operate independently following the Proposed Separation; the ability to achieve the benefits of our restructuring plans; the ability to successfully identify, finance, complete and integrate acquisitions; competition and pricing pressures in the markets we serve; the strength of housing and related markets; volatility in currency exchange rates and commodity prices; inability to generate savings from excellence in operations initiatives consisting of lean enterprise, supply management and cash flow practices; increased risks associated with operating foreign businesses; the ability to deliver backlog and win future project work; failure of markets to accept new product introductions and enhancements; the impact of changes in laws and regulations, including those that limit U.S. tax benefits; the outcome of litigation and governmental proceedings; and the ability to achieve our long-term strategic operating goals. Additional information concerning these and other factors is contained in our filings with the U.S. Securities and Exchange Commission (the "SEC"), including this Annual Report on Form 10-K. All forward-looking statements speak only as of the date of this report. Pentair plc assumes no obligation, and disclaims any obligation, to update the information contained in this report.
Overview
Pentair plc is a focused diversified industrial manufacturing company comprising two reporting segments: Water and Electrical. We classify our operations into business segments based primarily on types of products offered and markets served. For the year ended
December 31, 2017
, Water and Electrical accounted for
58%
and
42%
of total revenues, respectively.
Although our jurisdiction of organization is Ireland, we manage our affairs so that we are centrally managed and controlled in the United Kingdom (the "U.K.") and therefore have our tax residency in the U.K.
On September 18, 2015, we acquired, as part of Electrical, all of the outstanding shares of capital stock of ERICO Global Company ("ERICO") for approximately
$1.8 billion
in cash (the "ERICO Acquisition"). ERICO is a leading global manufacturer and marketer of engineered electrical and fastening products for electrical, mechanical and civil applications. ERICO has employees in 30 countries across the world with recognized brands including CADDY fixing, fastening and support products; ERICO electrical grounding, bonding and connectivity products and LENTON engineered systems.
On April 28, 2017 we completed the sale of the Valves & Controls business to Emerson Electric Co. for
$3.15 billion
in cash. The sale resulted in a gain of
$181.1 million
, net of tax. The results of the Valves & Controls business have been presented as discontinued operations and the related assets and liabilities have been reclassified as held for sale for all periods presented. The Valves & Controls business was previously disclosed as a stand-alone reporting segment.
On May 9, 2017, we announced that our Board of Directors approved a plan to separate our Water business and Electrical business into two independent, publicly-traded companies (the "Proposed Separation"). The Proposed Separation is expected to occur through a tax-free spin-off of the Electrical business to Pentair shareholders.
Completion of the Proposed Separation is subject to certain customary conditions, including, among other things, final approval of the transaction by Pentair's Board of Directors, receipt of tax opinions and rulings and effectiveness of appropriate filings with the SEC. Upon completion of the Proposed Separation, it is anticipated that Electrical's jurisdiction of organization will be Ireland, but that it will manage its affairs so that it will be centrally managed and controlled in the U.K. and therefore will have its tax residency in the U.K.
22
We are targeting April 30, 2018 for the completion of the Proposed Separation; however, there can be no assurance regarding the ultimate timing of the Proposed Separation or that the Proposed Separation will be completed.
Key trends and uncertainties regarding our existing business
The following trends and uncertainties affected our financial performance in
2017
and
2016
, and will likely impact our results in the future:
|
•
|
During 2017 and 2016, we continued execution of certain business restructuring initiatives aimed at reducing our fixed cost structure and, during 2017, began realigning our business in contemplation of the Proposed Separation. We expect that these actions will contribute to margin growth in 2018.
|
|
•
|
We have identified specific product and geographic market opportunities that we find attractive and continue to pursue, both within and outside the United States. We are reinforcing our businesses to more effectively address these opportunities through research and development and additional sales and marketing resources. Unless we successfully penetrate these markets, our core sales growth will likely be limited or may decline.
|
|
•
|
We have experienced material and other cost inflation. We strive for productivity improvements, and we implement increases in selling prices to help mitigate this inflation. We expect the current economic environment will result in continuing price volatility for many of our raw materials, and we are uncertain as to the timing and impact of these market changes.
|
In
2018
, our operating objectives include the following:
|
•
|
Complete the execution of the Proposed Separation to create two industry-leading pure-play companies in Water and Electrical.
|
|
•
|
Driving operating excellence through PIMS, with specific focus on sourcing and supply management, cash flow management and lean operations;
|
|
•
|
Achieving differentiated revenue growth through new products and global and market expansion;
|
|
•
|
Optimizing our technological capabilities to increasingly generate innovative new products; and
|
|
•
|
Focusing on developing global talent in light of our global presence.
|
23
CONSOLIDATED RESULTS OF OPERATIONS
The consolidated results of operations were as follows:
|
Years ended December 31
|
% / point change
|
|||||||||||||
|
In millions
|
2017
|
2016
|
2015
|
2017 vs 2016
|
2016 vs 2015
|
|||||||||
|
Net sales
|
$
|
4,936.5
|
|
$
|
4,890.0
|
|
$
|
4,616.4
|
|
1.0
|
%
|
5.9
|
%
|
|
|
Cost of goods sold
|
3,107.4
|
|
3,095.9
|
|
3,017.6
|
|
0.4
|
%
|
2.6
|
%
|
||||
|
Gross profit
|
1,829.1
|
|
1,794.1
|
|
1,598.8
|
|
2.0
|
%
|
12.2
|
%
|
||||
|
% of net sales
|
37.1
|
%
|
36.7
|
%
|
34.6
|
%
|
0.4
|
pts
|
2.1
|
pts
|
||||
|
Selling, general and administrative
|
1,032.5
|
|
979.3
|
|
884.0
|
|
5.4
|
%
|
10.8
|
%
|
||||
|
% of net sales
|
20.9
|
%
|
20.0
|
%
|
19.1
|
%
|
0.9
|
pts
|
0.9
|
pts
|
||||
|
Research and development
|
115.8
|
|
114.1
|
|
98.7
|
|
1.5
|
%
|
15.6
|
%
|
||||
|
% of net sales
|
2.3
|
%
|
2.3
|
%
|
2.1
|
%
|
—
|
|
0.2
|
pts
|
||||
|
Operating income
|
680.8
|
|
700.7
|
|
616.1
|
|
(2.8
|
)%
|
13.7
|
%
|
||||
|
% of net sales
|
13.8
|
%
|
14.3
|
%
|
13.3
|
%
|
(0.5
|
) pts
|
1.0
|
pts
|
||||
|
Other (income) expense
|
||||||||||||||
|
Loss on sale of businesses
|
4.2
|
|
3.9
|
|
3.2
|
|
7.7
|
%
|
21.9
|
%
|
||||
|
Loss on early extinguishment of debt
|
101.4
|
|
—
|
|
—
|
|
N.M.
|
|
N.M.
|
|
||||
|
Net interest expense
|
87.3
|
|
140.1
|
|
101.9
|
|
(37.7
|
)%
|
37.5
|
%
|
||||
|
Income from continuing operations before income taxes
|
489.2
|
|
561.0
|
|
512.5
|
|
(12.8
|
)%
|
9.5
|
%
|
||||
|
Provision for income taxes
|
9.2
|
|
109.4
|
|
115.4
|
|
(91.6
|
)%
|
(5.2
|
) %
|
||||
|
Effective tax rate
|
1.9
|
%
|
19.5
|
%
|
22.5
|
%
|
(17.6
|
) pts
|
(3.0
|
) pts
|
||||
N.M. Not Meaningful
Net sales
The components of the consolidated net sales change were as follows:
|
2017 vs 2016
|
2016 vs 2015
|
||||
|
Volume
|
(1.0
|
)%
|
(1.7
|
)%
|
|
|
Price
|
0.5
|
|
0.3
|
|
|
|
Core growth
|
(0.5
|
)
|
(1.4
|
)
|
|
|
Acquisition
|
0.9
|
|
8.1
|
|
|
|
Currency
|
0.6
|
|
(0.8
|
)
|
|
|
Total
|
1.0
|
%
|
5.9
|
%
|
|
The
1.0
percent
increase
in consolidated net sales in
2017
from
2016
was primarily the result of:
|
•
|
increased sales volume in our industrial business primarily in the U.S.;
|
|
•
|
increased sales related to business acquisitions that occurred in the fourth quarter of 2016 and the first quarter of 2017; and
|
|
•
|
favorable foreign currency effects during the year ended December 31, 2017.
|
These
increase
s were partially offset by:
|
•
|
continued lower project sales volume particularly in the energy and industrial businesses;
|
24
|
•
|
large job adjustments to net sales of $9.7 million in 2017.
|
The
5.9
percent
increase
in consolidated net sales in
2016
from
2015
was primarily the result of:
|
•
|
sales of
$516.1 million
in
2016
as a result of the ERICO Acquisition, compared to sales of
$147.0 million
in
2015
; and
|
|
•
|
increased volume driving core sales growth in our North America pool business.
|
These
increase
s were partially offset by:
|
•
|
continued slowdown in capital spending, driving core sales declines in our industrial and energy businesses;
|
|
•
|
slowing economic activity in certain developing regions, including China and Brazil; and
|
|
•
|
a strong U.S. dollar causing unfavorable foreign currency effects.
|
Gross profit
The
0.4
percentage point
increase
in gross profit as a percentage of sales in
2017
from
2016
was primarily the result of:
|
•
|
selective increases in selling prices to mitigate inflationary cost increases;
|
|
•
|
favorable mix as a result of the decline in lower margin project sales and growth in higher margin product sales; and
|
|
•
|
higher contribution margin as a result of savings generated from our Pentair Integrated Management System ("PIMS") initiatives including lean and supply management practices.
|
These
increase
s were partially offset by:
|
•
|
inflationary increases related to raw materials and labor costs; and
|
|
•
|
large job adjustments negatively impacting gross profit by $16.4 million in 2017.
|
The
2.1
percentage point
increase
in gross profit as a percentage of sales in
2016
from
2015
was primarily the result of:
|
•
|
higher sales volumes, which resulted in increased leverage on fixed expenses included in cost of goods sold;
|
|
•
|
higher contribution margin as a result of savings generated from our Pentair Integrated Management System ("PIMS") initiatives including lean and supply management practices; and
|
|
•
|
a decrease in cost of goods sold of $35.7 million in 2016 compared to 2015 as a result of inventory fair value step-up recorded as part of the Electrical acquisitions in 2015.
|
These
increase
s were partially offset by:
|
•
|
inflationary increases related to raw materials and labor costs.
|
Selling, general and administrative ("SG&A")
The
0.9
percentage point
increase
in SG&A expense as a percentage of sales in
2017
from
2016
and was driven by:
|
•
|
restructuring costs of
$30.7 million
in
2017
, compared to
$20.6 million
in
2016
;
|
|
•
|
costs incurred in anticipation of the Proposed Separation of
$53.1 million
in 2017;
|
|
•
|
non-cash charges of
$32.0 million
related to trade name and other impairments; and
|
|
•
|
increased investment in sales and marketing to drive growth.
|
These
increase
s were partially offset by:
|
•
|
savings generated from back-office consolidation, reduction in personnel and other lean initiatives;
|
|
•
|
a benefit from the reversal of a $13.3 million indemnification liability in 2017 related to our 2012 transaction with Tyco (now known as Johnson Controls International plc); and
|
|
•
|
"mark-to-market" actuarial losses related to pension and other post-retirement benefit plans of
$1.6 million
in 2017, compared to
$4.2 million
in 2016.
|
25
The
0.9
percentage point
increase
in SG&A expense as a percentage of sales in
2016
from
2015
and was driven by the following:
|
•
|
"mark-to-market" actuarial losses related to pension and other post-retirement benefit plans of
$4.2 million
in 2016, compared to "mark-to-market" actuarial gains of $23.0 million in 2015;
|
|
•
|
an increase in intangible asset amortization as a result of the ERICO Acquisition that occurred at the end of the third quarter in 2015;
|
|
•
|
a non-cash impairment charge of
$13.3 million
related to a trade name intangible asset in Electrical; and
|
|
•
|
increased investment in sales and marketing to drive growth.
|
These
increase
s were partially offset by:
|
•
|
restructuring costs of
$24.5 million
in
2016
, compared to $41.3 million in 2015;
|
|
•
|
deal related costs and expenses of $14.3 million in 2015, which did not occur in 2016; and
|
|
•
|
savings generated from back-office consolidation, reduction in personnel and other lean initiatives.
|
Net interest expense
The
37.7
percent
decrease
in net interest expense in
2017
from
2016
was primarily the result of:
|
•
|
the impact of lower debt levels during 2017 compared to 2016. In May 2017, a portion of the proceeds from the sale of the Valves & Controls business was utilized to repay all commercial paper and revolving long term debt and for the early extinguishment of $1,659.3 million aggregate principal amount of certain series of fixed rate outstanding notes.
|
This
decrease
was partially offset by:
|
•
|
increased overall interest rates in effect on our outstanding debt during 2017 compared to 2016.
|
The
37.5
percent
increase
in net interest expense in
2016
from
2015
was primarily the result of:
|
•
|
the impact of higher debt levels during 2016, compared to 2015, primarily as the result of the September 2015 issuance of senior notes used to finance the ERICO Acquisition; and
|
|
•
|
increased overall interest rates in effect on our outstanding debt.
|
In May 2017, we repurchased aggregate principal of certain series of outstanding fixed rate debt totaling $1,659.3 million. Total costs of $101.4 million associated with the repurchases were recorded as
Loss on early extinguishment of debt
.
Provision for income taxes
The
17.6
percentage point
decrease
in the effective tax rate in
2017
from
2016
was primarily due to:
|
•
|
a net provisional tax benefit of $84.8 million recognized in 2017 as a result of the enactment of U.S. tax reform legislation. We expect our effective tax rate to approximate 18% in future periods, which is an improvement from our historical rate of 20%; and
|
|
•
|
the unfavorable tax impact of restructuring costs in 2016 in jurisdictions with low tax benefits.
|
The
3.0
percentage point
decrease
in the effective tax rate in
2016
from
2015
was primarily due to:
|
•
|
the mix of global earnings toward lower tax jurisdictions; and
|
|
•
|
the unfavorable tax impact of transaction costs in 2015 related to the ERICO Acquisition.
|
SEGMENT RESULTS OF OPERATIONS
This summary that follows provides a discussion of the results of operations of each of our two reportable segments (Water and Electrical). Each of these segments comprises various product offerings that serve multiple end markets.
We evaluate performance based on sales and segment income and use a variety of ratios to measure performance of our reporting segments. Segment income represents equity income of unconsolidated subsidiaries and operating income exclusive
26
of intangible amortization, certain acquisition related expenses, costs of restructuring activities, "mark-to-market" gain/loss for pension and other post-retirement plans, impairments and other unusual non-operating items.
Water
The net sales and segment income for Water were as follows:
|
Years ended December 31
|
% / point change
|
|||||||||||||
|
In millions
|
2017
|
2016
|
2015
|
2017 vs 2016
|
2016 vs 2015
|
|||||||||
|
Net sales
|
$
|
2,844.4
|
|
$
|
2,777.7
|
|
$
|
2,808.3
|
|
2.4
|
%
|
(1.1
|
)%
|
|
|
Segment income
|
546.0
|
|
494.0
|
|
469.0
|
|
10.5
|
%
|
5.3
|
%
|
||||
|
% of net sales
|
19.2
|
%
|
17.8
|
%
|
16.7
|
%
|
1.4
|
pts
|
1.1
|
pts
|
||||
Net sales
The components of the change in Water net sales were as follows:
|
2017 vs 2016
|
2016 vs 2015
|
||||
|
Volume
|
—
|
%
|
(1.0
|
)%
|
|
|
Price
|
0.8
|
|
0.9
|
|
|
|
Core growth
|
0.8
|
|
(0.1
|
)
|
|
|
Acquisition (divestiture)
|
1.1
|
|
(0.5
|
)
|
|
|
Currency
|
0.5
|
|
(0.5
|
)
|
|
|
Total
|
2.4
|
%
|
(1.1
|
)%
|
|
The
2.4
percent
increase
in Water sales in
2017
from
2016
was primarily the result of:
|
•
|
increased sales volume in our industrial and residential & commercial businesses primarily in the U.S.;
|
|
•
|
selective increases in selling prices to mitigate inflationary cost increases; and
|
|
•
|
increased sales related to business acquisitions that occurred in the fourth quarter of 2016 and first quarter of 2017.
|
These
increase
s were partially offset by:
|
•
|
sales volume declines in our infrastructure and food & beverage verticals due to customer delays in capital spending; and
|
|
•
|
large job adjustments to net sales of $9.7 million in 2017.
|
The
1.1
percent
decrease
in Water sales in
2016
from
2015
was primarily the result of:
|
•
|
continued slowdown in industrial capital spending, driving core sales declines in our industrial business;
|
|
•
|
core sales declines in the food & beverage business due mainly to weak irrigation sales and lower project sales;
|
|
•
|
continued sales declines in China, Southeast Asia and Brazil as the result of economic uncertainty; and
|
|
•
|
a strong U.S. dollar causing unfavorable foreign currency effects.
|
These
decrease
s were partially offset by:
|
•
|
core sales growth related to higher sales of certain pool products primarily serving North American residential housing in 2016 and higher sales of pump and filtration solutions serving the infrastructure business; and
|
|
•
|
selective increases in selling prices to mitigate inflationary cost increases.
|
27
Segment income
The components of the change in Water segment income from the prior period were as follows:
|
2017
|
2016
|
|||
|
Growth
|
(0.2
|
) pts
|
0.1
|
pts
|
|
Acquisition
|
(0.1
|
)
|
—
|
|
|
Inflation
|
(1.2
|
)
|
(1.2
|
)
|
|
Productivity/Price
|
2.9
|
|
2.2
|
|
|
Total
|
1.4
|
pts
|
1.1
|
pts
|
The
1.4
percentage point
increase
in segment income for Water as a percentage of net sales in
2017
from
2016
was primarily the result of:
|
•
|
favorable material savings for certain raw materials and product mix offsetting inflation;
|
|
•
|
selective increases in selling prices to mitigate inflationary cost increases; and
|
|
•
|
cost savings generated from PIMS initiatives including lean and supply management practices.
|
These
increase
s were partially offset by:
|
•
|
inflationary increases related to labor costs and certain raw materials; and
|
|
•
|
continued growth investments in research & development and sales & marketing.
|
The
1.1
percentage point
increase
in segment income for Water as a percentage of net sales in
2016
from
2015
was primarily the result of:
|
•
|
price increases more than offsetting inflationary cost increases; and
|
|
•
|
cost savings generated from back-office consolidation, reduction in personnel and other lean initiatives.
|
These
increase
s were partially offset by:
|
•
|
inflationary increases related to labor costs and certain raw materials.
|
Electrical
The net sales and segment income for Electrical were as follows:
|
Years ended December 31
|
% / point change
|
|||||||||||||
|
In millions
|
2017
|
2016
|
2015
|
2017 vs 2016
|
2016 vs 2015
|
|||||||||
|
Net sales
|
$
|
2,097.9
|
|
$
|
2,116.0
|
|
$
|
1,809.3
|
|
(0.9
|
)%
|
17.0
|
%
|
|
|
Segment income
|
447.0
|
|
447.2
|
|
395.0
|
|
—
|
%
|
13.2
|
%
|
||||
|
% of net sales
|
21.3
|
%
|
21.1
|
%
|
21.8
|
%
|
0.2
|
pts
|
(0.7
|
) pts
|
||||
Net sales
The components of the change in Electrical net sales were as follows:
|
2017 vs 2016
|
2016 vs 2015
|
||||
|
Volume
|
(2.2
|
)%
|
(2.1
|
)%
|
|
|
Price
|
0.1
|
|
(0.4
|
)
|
|
|
Core growth
|
(2.1
|
)
|
(2.5
|
)
|
|
|
Acquisition
|
0.7
|
|
20.6
|
|
|
|
Currency
|
0.5
|
|
(1.1
|
)
|
|
|
Total
|
(0.9
|
)%
|
17.0
|
%
|
|
The
0.9
percent
decrease
in Electrical sales in
2017
from
2016
was primarily the result of:
28
|
•
|
lower project sales volume as a result of the impact of three large Canadian Oil Sands projects in 2016 that did not recur in 2017.
|
This
decrease
was partially offset by:
|
•
|
sales volume growth in our industrial business primarily in the U.S.;
|
|
•
|
favorable foreign currency effect during 2017;
|
|
•
|
selective increases in selling prices to mitigate inflationary cost increases; and
|
|
•
|
increased sales related to a business acquisition that occurred in the first quarter of 2017.
|
The
17.0
percent
increase
in Electrical sales in
2016
from
2015
was primarily the result of:
|
•
|
sales of
$516.1 million
in
2016
as a result of the ERICO Acquisition, compared to sales of
$147.0 million
in
2015
; and
|
|
•
|
core growth in our industrial and residential & commercial businesses.
|
These
increase
s were partially offset by:
|
•
|
continued slowdown in capital spending, particularly in the energy and infrastructure businesses, driving core sales declines; and
|
|
•
|
a strong U.S. dollar causing unfavorable foreign currency effects.
|
Segment income
The components of the change in Electrical segment income from the prior period were as follows:
|
2017
|
2016
|
|||
|
Growth
|
1.2
|
pts
|
(1.5
|
) pts
|
|
Acquisition
|
(0.1
|
)
|
0.6
|
|
|
Inflation
|
(2.0
|
)
|
(1.2
|
)
|
|
Productivity/Price
|
1.1
|
|
1.4
|
|
|
Total
|
0.2
|
pts
|
(0.7
|
) pts
|
The
0.2
percentage point
increase
in segment income for Electrical as a percentage of net sales in
2017
from
2016
was primarily the result of:
|
•
|
favorable mix as a result of the decline in lower margin project sales and growth in higher margin product sales in 2017, compared to 2016;
|
|
•
|
higher core sales in our industrial business, which resulted in increased leverage on fixed operating expenses; and
|
|
•
|
cost control and savings generated from back-office consolidation, reduction in personnel and other lean initiatives.
|
These
increase
s were partially offset by:
|
•
|
inflationary increases related to labor costs and certain raw materials;
|
|
•
|
lower core sales volumes in our energy and infrastructure businesses, which resulted in decreased leverage on operating expenses; and
|
|
•
|
higher cost of sales during 2017 due to manufacturing footprint rationalization and a new U.S. distribution center. We expect these investments will result in increased productivity and operating leverage in future periods.
|
The
0.7
percentage point
decrease
in segment income for Electrical as a percentage of sales in
2016
from
2015
was primarily the result of:
|
•
|
lower margin project sales not offsetting the decline in higher margin product sales; and
|
|
•
|
inflationary increases related to labor costs and certain raw materials.
|
29
These
decrease
s were partially offset by:
|
•
|
higher core sales in our industrial and residential & commercial businesses, which resulted in increased leverage on fixed operating expenses; and
|
|
•
|
strong contribution and integration synergies as a result of the ERICO Acquisition.
|
LIQUIDITY AND CAPITAL RESOURCES
We generally fund cash requirements for working capital, capital expenditures, equity investments, acquisitions, debt repayments, dividend payments and share repurchases from cash generated from operations, availability under existing committed revolving credit facilities and in certain instances, public and private debt and equity offerings. Our primary revolving credit facilities have generally been adequate for these purposes, although we have negotiated additional credit facilities or completed debt and equity offerings as needed to allow us to complete acquisitions. We generally issue commercial paper to fund our financing needs on a short-term basis and use our revolving credit facility as back-up liquidity to support commercial paper.
We are focusing on increasing our cash flow and repaying existing debt, while continuing to fund our research and development, marketing and capital investment initiatives. Our intent is to maintain investment grade credit ratings and a solid liquidity position.
We experience seasonal cash flows primarily due to seasonal demand in a number of markets within both our Water and Electrical segments. We generally borrow in the first quarter of our fiscal year for operational purposes, which usage reverses in the second quarter as the seasonality of our businesses peaks. End-user demand for pool and certain pumping equipment follows warm weather trends and is at seasonal highs from April to August. The magnitude of the sales spike is partially mitigated by employing some advance sale "early buy" programs (generally including extended payment terms and/or additional discounts). Demand for residential and agricultural water systems is also impacted by weather patterns, particularly by heavy flooding and droughts. Additionally, Electrical generally experiences increased demand for thermal protection products and services during the fall and winter months in the Northern Hemisphere and increased demand for electrical fastening products during the spring and summer months in the Northern Hemisphere.
Operating activities
Cash provided by operating activities of continuing operations was
$674.0 million
in
2017
. It was primarily related to
Net income from continuing operations
, net of the following non-cash items: depreciations and amortization, loss on sale of businesses, trade name and other impairment, loss on early extinguishment of debt and pension and other post-retirement expense.
Cash provided by operating activities of continuing operations was
$702.4 million
in
2016
, or
$104.7 million
higher
than in
2015
. The
increase
in cash provided by operating activities from continuing operations was due primarily to a
$122.6 million
increase
in
Net income from continuing operations
, net of the following non-cash items: depreciations and amortization, loss on sale of businesses, trade name impairment and pension and other post-retirement expense.
Investing activities
Net cash
provided by
investing activities of continuing operations was
$2,636.9 million
in
2017
, compared to net cash used for investing activities of
$123.3 million
and
$2,003.6 million
in
2016
and
2015
, respectively. The following investing activities impacted our cash flow:
Sale of Businesses
On April 28, 2017 we completed the sale of the Valves & Controls business to Emerson Electric Co. for
$3.15 billion
in cash.
30
Acquisitions
During
2017
, we completed acquisitions with purchase prices totaling
$59.5 million
in cash, net of cash acquired.
In November 2016, we paid cash of
$25.0 million
to acquire a business as part of Water.
In 2015, we paid cash of $1,806.3 million, net of cash acquired, to acquire ERICO Global Company during the third quarter and cash of $96.0 million, net of cash acquired, to acquire Nuheat Industries Limited ("Nuheat") during the second quarter, both as part of Electrical. During the fourth quarter, we paid an additional $0.9 million related to the Nuheat acquisition in settlement of a working capital adjustment.
Capital expenditures
Capital expenditures in
2017
,
2016
and
2015
were
$70.9 million
,
$117.8 million
and
$91.3 million
, respectively. We anticipate capital expenditures for fiscal
2018
to be approximately $85.0 million, primarily for capacity expansions of manufacturing facilities located in our low-cost countries, developing new products and general maintenance.
Financing activities
Net cash
used for
financing activities was
$3,432.6 million
in
2017
. As described further below, we utilized a portion of the proceeds from the sale of the Valves & Controls business to repay our commercial paper and revolving long term debt and for the early extinguishment of certain series of fixed rate debt. Additionally, we repurchased
$200.0 million
of shares during 2017 and paid
$251.7 million
of dividends.
Net cash
used for
financing activities was
$600.1 million
in
2016
. Cash used for financing activities in
2016
was primarily due to net repayments of commercial paper and revolving long-term debt and payments of dividends.
Net cash
provided by
financing activities was
$1,286.3 million
in
2015
. Cash provided by financing activities in 2016 was primarily due to cash proceeds received from the September 2015 issuance of senior notes (discussed below), partially offset by share repurchases, repayment of $350 million of senior notes due 2015 and payment of dividends.
In October 2014, Pentair plc, Pentair Investments Switzerland GmbH ("PISG"), Pentair Finance S.à r.l. ("PFSA") and Pentair, Inc. entered into an amended and restated credit agreement (the "Credit Facility"), with Pentair plc and PISG as guarantors and PFSA and Pentair, Inc. as borrowers. The Credit Facility had a maximum aggregate availability of
$2,100.0 million
and a maturity date of October 3, 2019. Borrowings under the Credit Facility generally bear interest at a variable rate equal to the London Interbank Offered Rate ("LIBOR") plus a specified margin based upon PFSA's credit ratings. PFSA must pay a facility fee ranging from
9.0
to
25.0
basis points per annum (based upon PFSA's credit ratings) on the amount of each lender's commitment and letter of credit fee for each letter of credit issued and outstanding under the Credit Facility.
In August 2015, Pentair plc, PISG and PFSA entered into a First Amendment to the Credit Facility (the "First Amendment"), which, among other things, increased the Leverage Ratio (as defined below). In September 2015, Pentair plc, PISG and PFSA entered into a Second Amendment to the Credit Facility (the "Second Amendment"), which, among other things, increased the maximum aggregate availability to
$2,500.0 million
. Additionally, in September 2016, Pentair plc, PISG and PFSA entered into a Third Amendment to the Credit Facility (the "Third Amendment," and collectively with the First Amendment and Second Amendment, the "Amendments"), which, among other things, increased the maximum Leverage Ratio to the amounts specified below, and amended the definition of EBITDA to include earnings from discontinued operations subject to a sale agreement until such disposition actually occurs.
In May 2017, we repurchased aggregate principal of certain series of outstanding notes totaling
$1,659.3 million
. All costs associated with the repurchases were recorded as
Loss on early extinguishment of debt,
including
$6.5 million
of unamortized deferred financing costs.
PFSA is authorized to sell short-term commercial paper notes to the extent availability exists under the Credit Facility. PFSA uses the Credit Facility as back-up liquidity to support 100% of commercial paper outstanding. As of
December 31, 2017
and
2016
, we had
$34.0 million
and
$398.7 million
, respectively, of commercial paper outstanding, all of which was classified as long-term as we have the intent and the ability to refinance such obligations on a long-term basis under the Credit Facility.
Our debt agreements contain certain financial covenants, the most restrictive of which are in the Credit Facility (as updated for the Amendments), including that we may not permit (i) the ratio of our consolidated debt plus synthetic lease obligations to our consolidated net income (excluding, among other things, non-cash gains and losses) before interest, taxes, depreciation, amortization, non-cash share-based compensation expense, and up to a lifetime maximum
$25.0 million
of costs, fees and expenses incurred in connection with certain acquisitions, investments, dispositions and the issuance, repayment or refinancing of debt, ("EBITDA") for the four consecutive fiscal quarters then ended (the "Leverage Ratio") to exceed
3.50
to
1.00
as of the last day of the period of four consecutive fiscal quarters and (ii) the ratio of our EBITDA for the four consecutive fiscal quarters
31
then ended to our consolidated interest expense, including consolidated yield or discount accrued as to outstanding securitization obligations (if any), for the same period to be less than
3.00
to
1.00
as of the end of each fiscal quarter. For purposes of the Leverage Ratio, the Credit Facility provides for the calculation of EBITDA giving pro forma effect to certain acquisitions, divestitures and liquidations during the period to which such calculation relates. As of
December 31, 2017
, we were in compliance with all financial covenants in our debt agreements.
Total availability under the Credit Facility was
$2,437.6 million
as of
December 31, 2017
, which was limited to
$1,897.5 million
by the Leverage Ratio in the Credit Facility's credit agreement.
In addition to the Credit Facility, we have various other credit facilities with an aggregate availability of
$30.0 million
, of which there were
no
outstanding borrowings at
December 31, 2017
. Borrowings under these credit facilities bear interest at variable rates.
As of
December 31, 2017
, we had
$65.1 million
of cash held in certain countries in which the ability to repatriate is limited due to local regulations or significant potential tax consequences.
We expect to continue to have cash requirements to support working capital needs and capital expenditures, to pay interest and service debt and to pay dividends to shareholders quarterly. We believe we have the ability and sufficient capacity to meet these cash requirements by using available cash and internally generated funds and to borrow under our committed and uncommitted credit facilities.
Dividends
On December 5, 2017, the Board of Directors declared a quarterly cash dividend of
$0.35
that was paid on February 9, 2018 to shareholders of record at the close of business on January 26, 2018. Additionally, the Board of Director's approved a plan to increase the 2018 annual cash dividend to
$1.40
, which is intended to paid in four quarterly installments. The 2018 increase will mark the 42
nd
consecutive year we have increased dividends.
We paid dividends in
2017
of
$251.7 million
, or
$1.38
per ordinary share, compared with
$243.6 million
, or
$1.34
per ordinary share, in
2016
and
$231.7 million
, or
$1.28
per ordinary share, in
2015
.
Under Irish law, the payment of future cash dividends and repurchases of shares may be paid only out of Pentair plc's "distributable reserves" on its statutory balance sheet. Pentair plc is not permitted to pay dividends out of share capital, which includes share premiums. Distributable reserves may be created through the earnings of the Irish parent company and through a reduction in share capital approved by the Irish High Court. Distributable reserves are not linked to a U.S. generally accepted accounting principles ("GAAP") reported amount (e.g., retained earnings). On July 22, 2014, the Irish High Court approved Pentair plc's conversion of approximately $14.4 billion of share premium to distributable reserves. On July 29, 2014, following the approval of the Irish High Court, we made the required filing of Pentair plc's initial accounts with the Irish Companies Registration Office, which completed the process to allow us to pay future cash dividends and redeem and repurchase shares out of Pentair plc's "distributable reserves." Our distributable reserve balance was
$9.0 billion
and
$9.4 billion
as of
December 31, 2017
and
2016
, respectively.
Authorized shares
Our authorized share capital consists of
426.0 million
ordinary shares with a par value of
$0.01
per share.
Ordinary shares held in treasury
In August 2015, we canceled all of our ordinary shares held in treasury. At the time of the cancellation, we held
19.1 million
ordinary shares in treasury at a cost of
$1.2 billion
.
Share repurchases
In December 2014, the Board of directors authorized the repurchase of our ordinary shares up to a maximum dollar limit of
$1.0 billion
. The authorization expires on
December 31, 2019
.
In December 2015, we repurchased
3.1 million
of our ordinary shares for
$200.0 million
under the 2014 authorization.
During the year ended
December 31, 2017
, we repurchased
3.0 million
of our ordinary shares for
$200.0 million
under the 2014 authorization. We have
$600.0 million
remaining availability for repurchases under the under the 2014 authorization.
32
Contractual obligations
The following summarizes our significant contractual obligations that impact our liquidity:
|
|
Years ended December 31
|
||||||||||||||||||||
|
In millions
|
2018
|
2019
|
2020
|
2021
|
2022
|
Thereafter
|
Total
|
||||||||||||||
|
Debt obligations
|
$
|
—
|
|
$
|
1,162.1
|
|
$
|
74.0
|
|
$
|
103.8
|
|
$
|
88.3
|
|
$
|
19.3
|
|
$
|
1,447.5
|
|
|
Interest obligations on fixed-rate debt
|
39.8
|
|
32.4
|
|
11.4
|
|
6.2
|
|
3.6
|
|
1.6
|
|
95.0
|
|
|||||||
|
Operating lease obligations, net of sublease rentals
|
34.0
|
|
29.1
|
|
21.2
|
|
15.6
|
|
13.1
|
|
15.1
|
|
128.1
|
|
|||||||
|
Purchase and marketing obligations
|
56.8
|
|
3.9
|
|
3.1
|
|
3.2
|
|
2.4
|
|
7.1
|
|
76.5
|
|
|||||||
|
Pension and other post-retirement plan contributions
|
13.7
|
|
12.8
|
|
6.7
|
|
6.7
|
|
6.8
|
|
33.6
|
|
80.3
|
|
|||||||
|
Total contractual obligations, net
|
$
|
144.3
|
|
$
|
1,240.3
|
|
$
|
116.4
|
|
$
|
135.5
|
|
$
|
114.2
|
|
$
|
76.7
|
|
$
|
1,827.4
|
|
The majority of the purchase obligations represent commitments for raw materials to be utilized in the normal course of business. For purposes of the above table, arrangements are considered purchase obligations if a contract specifies all significant terms, including fixed or minimum quantities to be purchased, a pricing structure and approximate timing of the transaction.
In addition to the summary of significant contractual obligations, we will incur annual interest expense on outstanding variable rate debt. As of
December 31, 2017
, variable interest rate debt was
$62.4 million
at a weighted average interest rate of
2.67%
.
The total gross liability for uncertain tax positions at
December 31, 2017
was estimated to be
$36.6 million
. We record penalties and interest related to unrecognized tax benefits in
Provision for income taxes
and
Interest expense
, respectively, which is consistent with our past practices. As of
December 31, 2017
, we had recorded
$2.3 million
for the possible payment of penalties and
$9.4 million
related to the possible payment of interest.
Other financial measures
In addition to measuring our cash flow generation or usage based upon operating, investing and financing classifications included in the Consolidated Statements of Cash Flows, we also measure our free cash flow. We have a long-term goal to consistently generate free cash flow that equals or exceeds 100 percent conversion of adjusted net income. Free cash flow is a non-GAAP financial measure that we use to assess our cash flow performance. We believe free cash flow is an important measure of liquidity because it provides us and our investors a measurement of cash generated from operations that is available to pay dividends, make acquisitions, repay debt and repurchase shares. In addition, free cash flow is used as a criterion to measure and pay compensation-based incentives. Our measure of free cash flow may not be comparable to similarly titled measures reported by other companies.
The following table is a reconciliation of free cash flow:
|
|
Years ended December 31
|
||||||||
|
In millions
|
2017
|
2016
|
2015
|
||||||
|
Net cash provided by (used for) operating activities of continuing operations
|
$
|
674.0
|
|
$
|
702.4
|
|
$
|
597.7
|
|
|
Capital expenditures
|
(70.9
|
)
|
(117.8
|
)
|
(91.3
|
)
|
|||
|
Proceeds from sale of property and equipment
|
7.9
|
|
24.7
|
|
4.6
|
|
|||
|
Free cash flow from continuing operations
|
$
|
611.0
|
|
$
|
609.3
|
|
$
|
511.0
|
|
|
Net cash provided by (used for) operating activities of discontinued operations
|
(53.8
|
)
|
159.0
|
|
141.6
|
|
|||
|
Capital expenditures of discontinued operations
|
(6.8
|
)
|
(20.4
|
)
|
(43.0
|
)
|
|||
|
Proceeds from sale of property and equipment of discontinued operations
|
0.3
|
|
21.9
|
|
22.7
|
|
|||
|
Free cash flow
|
$
|
550.7
|
|
$
|
769.8
|
|
$
|
632.3
|
|
Off-balance sheet arrangements
At
December 31, 2017
, we had no off-balance sheet financing arrangements.
33
COMMITMENTS AND CONTINGENCIES
We have been made parties to a number of actions filed or have been given notice of potential claims relating to the conduct of our business, including those pertaining to commercial disputes, product liability, asbestos, environmental, safety and health, patent infringement and employment matters.
While we believe that a material impact on our consolidated financial position, results of operations or cash flows from any such future claims or potential claims is unlikely, given the inherent uncertainty of litigation, a remote possibility exists that a future adverse ruling or unfavorable development could result in future charges that could have a material impact. We do and will continue to periodically reexamine our estimates of probable liabilities and any associated expenses and receivables and make appropriate adjustments to such estimates based on experience and developments in litigation. As a result, the current estimates of the potential impact on our consolidated financial position, results of operations and cash flows for the proceedings and claims described in ITEM 8, Note 17 of the Notes to Consolidated Financial Statements could change in the future.
Product liability claims
We are subject to various product liability lawsuits and personal injury claims. A substantial number of these lawsuits and claims are insured and accrued for by Penwald, our captive insurance subsidiary. See discussion in ITEM 1 and ITEM 8, Note 1 of the Notes to Consolidated Financial Statements — Insurance subsidiary. Penwald records a liability for these claims based on actuarial projections of ultimate losses. For all other claims, accruals covering the claims are recorded, on an undiscounted basis, when it is probable that a liability has been incurred and the amount of the liability can be reasonably estimated based on existing information. The accruals are adjusted periodically as additional information becomes available. We have not experienced significant unfavorable trends in either the severity or frequency of product liability lawsuits or personal injury claims.
Stand-by letters of credit, bank guarantees and bonds
In certain situations, Tyco guaranteed Flow Control's performance to third parties or provided financial guarantees for financial commitments of Flow Control. In situations where Flow Control and Tyco were unable to obtain a release from these guarantees in connection with the spin-off, we will indemnify Tyco for any losses it suffers as a result of such guarantees.
In disposing of assets or businesses, we often provide representations, warranties and indemnities to cover various risks including unknown damage to the assets, environmental risks involved in the sale of real estate, liability to investigate and remediate environmental contamination at waste disposal sites and manufacturing facilities and unidentified tax liabilities and legal fees related to periods prior to disposition. We do not have the ability to reasonably estimate the potential liability due to the inchoate and unknown nature of these potential liabilities. However, we have no reason to believe that these uncertainties would have a material adverse effect on our financial position, results of operations or cash flows.
In the ordinary course of business, we are required to commit to bonds, letters of credit and bank guarantees that require payments to our customers for any non-performance. The outstanding face value of these instruments fluctuates with the value of our projects in process and in our backlog. In addition, we issue financial stand-by letters of credit primarily to secure our performance to third parties under self-insurance programs.
As of
December 31, 2017
and
2016
, the outstanding value of bonds, letters of credit and bank guarantees totaled
$201.5 million
and
$331.0 million
, respectively.
NEW ACCOUNTING STANDARDS
See ITEM 8, Note 1 of the Notes to Consolidated Financial Statements, included in this Form 10-K, for information pertaining to recently adopted accounting standards or accounting standards to be adopted in the future.
CRITICAL ACCOUNTING POLICIES
We have adopted various accounting policies to prepare the consolidated financial statements in accordance with GAAP. Our significant accounting policies are more fully described in ITEM 8, Note 1 of the Notes to Consolidated Financial Statements. Certain of our accounting policies require the application of significant judgment by management in selecting the appropriate assumptions for calculating financial estimates. By their nature, these judgments are subject to an inherent degree of uncertainty. These judgments are based on our historical experience, terms of existing contracts, our observance of trends in the industry and information available from other outside sources, as appropriate. We consider an accounting estimate to be critical if:
|
•
|
it requires us to make assumptions about matters that were uncertain at the time we were making the estimate; and
|
34
|
•
|
changes in the estimate or different estimates that we could have selected would have had a material impact on our financial condition or results of operations.
|
Our critical accounting estimates include the following:
Impairment of goodwill and indefinite-lived intangibles
Goodwill
Goodwill represents the excess of the cost of acquired businesses over the net of the fair value of identifiable tangible net assets and identifiable intangible assets purchased and liabilities assumed.
Goodwill is tested at least annually for impairment and is tested for impairment more frequently if events or changes in circumstances indicate that the asset might be impaired. The impairment test is performed using a two-step process. In the first step, the fair value of each reporting unit is compared with the carrying amount of the reporting unit, including goodwill. If the estimated fair value is less than the carrying amount of the reporting unit there is an indication that goodwill impairment exists and a second step must be completed in order to determine the amount of the goodwill impairment, if any that should be recorded. In the second step, an impairment loss is recognized for any excess of the carrying amount of the reporting unit's goodwill over the implied fair value of that goodwill. The implied fair value of goodwill is determined by allocating the fair value of the reporting unit in a manner similar to a purchase price allocation.
The fair value of each reporting unit is determined using a discounted cash flow analysis and market approach. Projecting discounted future cash flows requires us to make significant estimates regarding future revenues and expenses, projected capital expenditures, changes in working capital and the appropriate discount rate. Use of the market approach consists of comparisons to comparable publicly-traded companies that are similar in size and industry. Actual results may differ from those used in our valuations. This non-recurring fair value measurement is a "Level 3" measurement under the fair value hierarchy described below.
In developing our discounted cash flow analysis, assumptions about future revenues and expenses, capital expenditures and changes in working capital are based on our annual operating plan and long-term business plan for each of our reporting units. These plans take into consideration numerous factors including historical experience, anticipated future economic conditions, changes in raw material prices and growth expectations for the industries and end markets we participate in. These assumptions are determined over a six year long-term planning period. The six year growth rates for revenues and operating profits vary for each reporting unit being evaluated. Revenues and operating profit beyond
2023
are projected to grow at a perpetual growth rate of
3.0%
.
Discount rate assumptions for each reporting unit take into consideration our assessment of risks inherent in the future cash flows of the respective reporting unit and our weighted-average cost of capital. We utilized discount rates ranging from
9.0%
to
9.5%
in determining the discounted cash flows in our fair value analysis.
In estimating fair value using the market approach, we identify a group of comparable publicly-traded companies for each reporting unit that are similar in terms of size and product offering. These groups of comparable companies are used to develop multiples based on total market-based invested capital as a multiple of earnings before interest, taxes, depreciation and amortization ("EBITDA"). We determine our estimated values by applying these comparable EBITDA multiples to the operating results of our reporting units. The ultimate fair value of each reporting unit is determined considering the results of both valuation methods.
We completed step one of our annual goodwill impairment evaluation as of the first day of the fourth quarter of
2017
,
2016
and
2015
with each of our reporting units' fair value in excess of its carrying value.
During the latter part of the fourth quarter of 2015, the oil and gas industry continued to deteriorate, leading management to reconsider its estimates for future profitability of the reporting unit and thereby increasing the likelihood that the associated goodwill could be impaired. As such, we concluded that a triggering event occurred during the fourth quarter of 2015 requiring that we test the goodwill of our former Valves & Controls business for impairment. As a result, we reperformed our step one analysis as of December 31, 2015. Consistent with our annual test, the fair value was estimated using both a discounted cash flow analysis and market approach.
The results of our step one goodwill impairment testing as of December 31, 2015 indicated that the fair value of our former Valves & Controls business was below its carrying value. Accordingly, we performed the step two test and concluded the goodwill of our former Valves & Controls business was impaired. As a result, we recorded a non-cash goodwill impairment charge of
$515.2 million
for the year ended December 31, 2015. The impairment charge was recorded in
Income (loss) from discontinued operations, net of tax
in our Consolidated Statements of Operations and Comprehensive Income (Loss).
35
Identifiable intangible assets
Our primary identifiable intangible assets include: customer relationships, trade names and trademarks, proprietary technology, backlog and patents. Identifiable intangibles with finite lives are amortized and those identifiable intangibles with indefinite lives are not amortized. Identifiable intangible assets that are subject to amortization are evaluated for impairment whenever events or changes in circumstances indicate that the carrying amount may not be recoverable. Identifiable intangible assets not subject to amortization are tested for impairment annually or more frequently if events warrant. We complete our annual impairment test during the fourth quarter each year for those identifiable assets not subject to amortization.
The impairment test consists of a comparison of the fair value of the trade name with its carrying value. Fair value is measured using the relief-from-royalty method. This method assumes the trade name has value to the extent that the owner is relieved of the obligation to pay royalties for the benefits received from them. This method requires us to estimate the future revenue for the related brands, the appropriate royalty rate and the weighted average cost of capital.
An impairment charge of
$25.2 million
was recorded in 2017 related to certain trade names in both Water and Electrical as a result of either lower forecasted sales volume or rebranding strategies implemented in the fourth quarter of 2017. An impairment charge of
$13.3 million
was recorded in 2016 related to a trade name in Electrical as the result of a rebranding strategy implemented in the fourth quarter of 2016. The trade name impairment charges were recorded in
Selling, general and administrative
in our Consolidated Statements of Operations and Comprehensive Income (Loss).
As noted above, during the latter part of the fourth quarter of 2015, the oil and gas industry continued to deteriorate, leading management to reconsider its estimates for future profitability of our former Valves & Controls business and thereby increasing the likelihood that the associated intangible assets could be impaired. As such, we concluded that a triggering event occurred during the fourth quarter of 2015 requiring that we test Valves & Controls trade names for impairment. As a result of this test, an impairment charge of
$39.5 million
was recorded in 2015 related to trade names in the Valves & Controls business that was sold in 2017. The impairment charge was recorded in
Income (loss) from discontinued operations, net of tax
in our Consolidated Statements of Operations and Comprehensive Income (Loss).
Pension and other post-retirement plans
We sponsor U.S. and non-U.S. defined-benefit pension and other post-retirement plans. The amounts recognized in our consolidated financial statements related to our defined-benefit pension and other post-retirement plans are determined from actuarial valuations. Inherent in these valuations are assumptions, including: expected return on plan assets, discount rates, rate of increase in future compensation levels and health care cost trend rates. These assumptions are updated annually and are disclosed in ITEM 8, Note 13 to the Notes to Consolidated Financial Statements. Differences in actual experience or changes in assumptions may affect our pension and other post-retirement obligations and future expense.
We recognize changes in the fair value of plan assets and net actuarial gains or losses for pension and other post-retirement benefits annually in the fourth quarter each year ("mark-to-market adjustment") and, if applicable, in any quarter in which an interim remeasurement is triggered. Net actuarial gains and losses occur when the actual experience differs from any of the various assumptions used to value our pension and other post-retirement plans or when assumptions change as they may each year. The primary factors contributing to actuarial gains and losses each year are (1) changes in the discount rate used to value pension and other post-retirement benefit obligations as of the measurement date and (2) differences between the expected and the actual return on plan assets. This accounting method also results in the potential for volatile and difficult to forecast mark-to-market adjustments. Mark-to-market adjustments resulted in pre-tax charges of
$1.6 million
and
$4.2 million
in
2017
and
2016
, respectively, and pre-tax income of
$23.0 million
in
2015
. The remaining components of pension expense, including service and interest costs and the expected return on plan assets, are recorded on a quarterly basis as ongoing pension expense.
Discount rate
The discount rate reflects the current rate at which the pension liabilities could be effectively settled at the end of the year based on our December 31 measurement date. The discount rate was determined by matching our expected benefit payments to payments from a stream of bonds available in the marketplace rated AA or higher, adjusted to eliminate the effects of call provisions. This produced a weighted-average discount rate for our U.S. plans of
3.39%
in
2017
,
4.02%
in
2016
and
4.21%
in
2015
. The discount rates on our non-U.S. plans ranged from
0.50%
to
3.50%
in
2017
,
0.50%
to
4.00%
in
2016
and
0.50%
to
4.25%
in
2015
. There are no known or anticipated changes in our discount rate assumption that will impact our pension expense in
2018
.
Expected rate of return
Our expected rate of return on plan assets for our U.S. plans was
4.11%
for
2017
,
4.28%
in
2016
and
3.65%
in
2015
. The expected rate of return on our non-U.S. plans ranged from
1.00%
to
5.50%
in
2017
,
1.00%
to
5.50%
in
2016
and
1.00%
to
6.00%
in
2015
. The expected rate of return is designed to be a long-term assumption that may be subject to considerable year-to-year variance from actual returns. In developing the expected long-term rate of return, we considered our historical returns,
36
with consideration given to forecasted economic conditions, our asset allocations, input from external consultants and broader longer-term market indices.
In November 2017, our Board of Directors approved amendments to terminate the Pentair Salaried Plan (the "Salaried Plan"), a U.S. qualified pension plan. The Salaried Plan discontinued accruing benefits on
December 31, 2017
and the termination was effective December 31, 2017. It is expected to take 18 to 24 months from the date of the approved amendment to complete the termination of the Salaried Plan.
See ITEM 8, Note 13 of the Notes to Consolidated Financial Statements for further information regarding pension and other post-retirement plans.
Loss contingencies
Accruals are recorded for various contingencies including legal proceedings, self-insurance and other claims that arise in the normal course of business. The accruals are based on judgment, the probability of losses and, where applicable, the consideration of opinions of internal and/or external legal counsel and actuarially determined estimates. Additionally, we record receivables from third party insurers when recovery has been determined to be probable.
Income taxes
In determining taxable income for financial statement purposes, we must make certain estimates and judgments. These estimates and judgments affect the calculation of certain tax liabilities and the determination of the recoverability of certain of the deferred tax assets, which arise from temporary differences between the tax and financial statement recognition of revenue and expense. In evaluating our ability to recover our deferred tax assets we consider all available positive and negative evidence including our past operating results, the existence of cumulative losses in the most recent years and our forecast of future taxable income. In estimating future taxable income, we develop assumptions including the amount of future pre-tax operating income, the reversal of temporary differences and the implementation of feasible and prudent tax planning strategies. These assumptions require significant judgment about the forecasts of future taxable income and are consistent with the plans and estimates we are using to manage the underlying businesses.
We currently have recorded valuation allowances that we will maintain until when, in the opinion of management, it is more likely than not that some portion or all of the deferred tax assets will be realized. Our income tax expense recorded in the future may be reduced to the extent of decreases in our valuation allowances. The realization of our remaining deferred tax assets is primarily dependent on future taxable income in the appropriate jurisdiction. Any reduction in future taxable income including but not limited to any future restructuring activities may require that we record an additional valuation allowance against our deferred tax assets. An increase in the valuation allowance could result in additional income tax expense in such period and could have a significant impact on our future earnings.
Changes in tax laws and rates could also affect recorded deferred tax assets and liabilities in the future. Management records the effect of a tax rate or law change on the Company's deferred tax assets and liabilities in the period of enactment. Future tax rate or law changes could have a material effect on the Company's financial condition, results of operations or cash flows.
In addition, the calculation of our tax liabilities involves dealing with uncertainties in the application of complex tax regulations in a multitude of jurisdictions across our global operations. We perform reviews of our income tax positions on a quarterly basis and accrue for uncertain tax positions. We recognize potential liabilities and record tax liabilities for anticipated tax audit issues in the tax jurisdictions in which we operate based on our estimate of whether, and the extent to which, additional taxes will be due. These tax liabilities are reflected net of related tax loss carryforwards. As events change or resolution occurs, these liabilities are adjusted, such as in the case of audit settlements with taxing authorities. The ultimate resolution may result in a payment that is materially different from our current estimate of the tax liabilities. If our estimate of tax liabilities proves to be less than the ultimate assessment, an additional charge to expense would result. If payment of these amounts ultimately proves to be less than the recorded amounts, the reversal of the liabilities would result in tax benefits being recognized in the period when we determine the liabilities are no longer necessary.
37
Market risk is the potential economic loss that may result from adverse changes in the fair value of financial instruments. We are exposed to various market risks, including changes in interest rates and foreign currency rates. Periodically, we use derivative financial instruments to manage or reduce the impact of changes in interest rates. Counterparties to all derivative contracts are major financial institutions. All instruments are entered into for other than trading purposes. The major accounting policies and utilization of these instruments is described more fully in ITEM 8, Note 1 of the Notes to Consolidated Financial Statements.
Interest rate risk
Our debt portfolio as of
December 31, 2017
, was comprised of debt predominantly denominated in U.S. dollars. This debt portfolio is comprised of
96%
fixed-rate debt and
4%
variable-rate debt. Changes in interest rates have different impacts on the fixed and variable-rate portions of our debt portfolio. A change in interest rates on the fixed portion of the debt portfolio impacts the fair value, but has no impact on interest incurred or cash flows. A change in interest rates on the variable portion of the debt portfolio impacts the interest incurred and cash flows but does not impact the net financial instrument position.
Based on the fixed-rate debt included in our debt portfolio, as of
December 31, 2017
, a 100 basis point increase or decrease in interest rates would result in a
$28.6 million
decrease or a
$29.3 million
increase in fair value, respectively.
Based on the variable-rate debt included in our debt portfolio as of
December 31, 2017
, a 100 basis point increase or decrease in interest rates would result in a
$0.6 million
increase or decrease in interest incurred.
Foreign currency risk
We conduct business in various locations throughout the world and are subject to market risk due to changes in the value of foreign currencies in relation to our reporting currency, the U.S. dollar. Periodically, we use derivative financial instruments to manage these risks. The functional currencies of our foreign operating locations are generally the local currency in the country of domicile. We manage these operating activities at the local level and revenues, costs, assets and liabilities are generally denominated in local currencies, thereby mitigating the risk associated with changes in foreign exchange. However, our results of operations and assets and liabilities are reported in U.S. dollars and thus will fluctuate with changes in exchange rates between such local currencies and the U.S. dollar.
From time to time, we may enter into short duration foreign currency contracts to hedge foreign currency risks. As the majority of our foreign currency contracts have an original maturity date of less than one year, there is no material foreign currency risk. At
December 31, 2017
and
2016
, we had outstanding foreign currency derivative contracts with gross notional U.S. dollar equivalent amounts of
$481.4 million
and
$475.6 million
, respectively. Changes in the fair value of all derivatives are recognized immediately in income unless the derivative qualifies as a hedge of future cash flows. Gains and losses related to a hedge are deferred and recorded in the Consolidated Balance Sheets as a component of AOCI and subsequently recognized in the Consolidated Statements of Operations and Comprehensive Income (Loss) when the hedged item affects earnings.
In September 2015, we designated the €500.0 million 2.45% Senior Notes due 2019 (the "2019 Euro Notes") as a net investment hedge of our investments in certain international subsidiaries that use the Euro as their functional currency. The hedge is intended to reduce, but will not eliminate, the impact on our financial results of changes in the exchange rate between the Euro and the U.S. dollar. The currency risk related to the net investment hedge is measured by estimating the potential impact of a 10% change in the value of the U.S. dollar relative to the Euro. The rates used to perform this analysis were based on the market exchange rates in effect on
December 31, 2017
. A 10% appreciation of the U.S. dollar relative to the Euro would result in a
$54.0
million net increase in Other comprehensive income. Conversely, a 10% depreciation of the U.S. dollar relative to the Euro would result in a
$66.0
million net decrease in Other comprehensive income. However, these increases and decreases in Other comprehensive income would be offset by decreases or increases in the hedged net investments on our balance sheet due to currency translation.
38
MANAGEMENT'S REPORT ON INTERNAL CONTROL OVER FINANCIAL REPORTING
Management of Pentair plc and its subsidiaries (the "Company") is responsible for establishing and maintaining adequate internal control over financial reporting, as such term is defined in Rules 13a-15(f) and 15d-15(f) of the Securities Exchange Act of 1934. The Company's internal control over financial reporting is designed to provide reasonable assurance regarding the reliability of financial reporting and the preparation of financial statements for external purposes in accordance with generally accepted accounting principles. The Company's internal control over financial reporting includes those policies and procedures that (1) pertain to maintenance of records that, in reasonable detail, accurately and fairly reflect the transactions and dispositions of the assets of the Company; (2) provide reasonable assurance that transactions are recorded as necessary to permit preparation of the financial statements in accordance with generally accepted accounting principles and that receipts and expenditures of the Company are being made only in accordance with authorizations of management and directors of the Company; and (3) provide reasonable assurance regarding prevention or timely detection of unauthorized acquisition, use or disposition of the Company's assets that could have a material effect on the financial statements.
Because of its inherent limitations, internal control over financial reporting may not prevent or detect misstatements. Also, projections of any evaluation of the effectiveness of internal control over financial reporting to future periods are subject to the risk that the controls may become inadequate because of changes in conditions or that the degree of compliance with the policies or procedures may deteriorate.
Management assessed the effectiveness of the Company's internal control over financial reporting as of
December 31, 2017
. In making this assessment, management used the criteria for effective internal control over financial reporting described in
Internal Control-Integrated Framework (2013)
issued by the Committee of Sponsoring Organizations of the Treadway Commission. Based on this assessment, management believes that, as of
December 31, 2017
, the Company's internal control over financial reporting was effective based on those criteria.
Our independent registered public accounting firm, Deloitte & Touche LLP, has issued an attestation report on the Company's internal control over financial reporting as of
December 31, 2017
. That attestation report is set forth immediately following this management report.
|
Randall J. Hogan
|
|
John L. Stauch
|
|
Chairman and Chief Executive Officer
|
|
Executive Vice President and Chief Financial Officer
|
39
REPORT OF INDEPENDENT REGISTERED PUBLIC ACCOUNTING FIRM
To the Board of Directors and Shareholders of
Pentair plc
London, United Kingdom
Opinion on Internal Control over Financial Reporting
We have audited the internal control over financial reporting of Pentair plc and subsidiaries (the "Company") as of
December 31, 2017
, based on criteria established in
Internal Control — Integrated Framework (2013)
issued by the Committee of Sponsoring Organizations of the Treadway Commission (COSO). In our opinion, the Company maintained, in all material respects, effective internal control over financial reporting as of December 31, 2017, based on the criteria established in
Internal Control - Integrated Framework (2013)
issued by COSO.
We have also audited, in accordance with the standards of the Public Company Accounting Oversight Board (United States), the consolidated financial statements and financial statement schedule listed in the Index at Item 15 as of and for the year ended
December 31, 2017
, of the Company and our report dated
February 27, 2018
expressed an unqualified opinion on those financial statements and financial statement schedule.
Basis for Opinion
The Company’s management is responsible for maintaining effective internal control over financial reporting and for its assessment of the effectiveness of internal control over financial reporting, included in the accompanying Management’s Report on Internal Control over Financial Reporting. Our responsibility is to express an opinion on the Company’s internal control over financial reporting based on our audit. We are a public accounting firm registered with the PCAOB and are required to be independent with respect to the Company in accordance with the U.S. federal securities laws and the applicable rules and regulations of the Securities and Exchange Commission and the PCAOB.
We conducted our audit in accordance with the standards of the PCAOB. Those standards require that we plan and perform the audit to obtain reasonable assurance about whether effective internal control over financial reporting was maintained in all material respects. Our audit included obtaining an understanding of internal control over financial reporting, assessing the risk that a material weakness exists, testing and evaluating the design and operating effectiveness of internal control based on the assessed risk, and performing such other procedures as we considered necessary in the circumstances. We believe that our audit provides a reasonable basis for our opinion.
Definition and Limitations of Internal Control over Financial Reporting
A company’s internal control over financial reporting is a process designed to provide reasonable assurance regarding the reliability of financial reporting and the preparation of financial statements for external purposes in accordance with generally accepted accounting principles. A company’s internal control over financial reporting includes those policies and procedures that (1) pertain to the maintenance of records that, in reasonable detail, accurately and fairly reflect the transactions and dispositions of the assets of the company; (2) provide reasonable assurance that transactions are recorded as necessary to permit preparation of financial statements in accordance with generally accepted accounting principles, and that receipts and expenditures of the company are being made only in accordance with authorizations of management and directors of the company; and (3) provide reasonable assurance regarding prevention or timely detection of unauthorized acquisition, use, or disposition of the company’s assets that could have a material effect on the financial statements.
Because of its inherent limitations, internal control over financial reporting may not prevent or detect misstatements. Also, projections of any evaluation of effectiveness to future periods are subject to the risk that controls may become inadequate because of changes in conditions, or that the degree of compliance with the policies or procedures may deteriorate.
/s/ Deloitte & Touche LLP
Minneapolis, Minnesota
February 27, 2018
40
REPORT OF INDEPENDENT REGISTERED PUBLIC ACCOUNTING FIRM
To the Board of Directors and Shareholders of
Pentair plc
London, United Kingdom
Opinion on the Financial Statements
We have audited the accompanying consolidated balance sheets of Pentair plc and subsidiaries (the "Company") as of
December 31, 2017
and
2016
, the related consolidated statements of operations and comprehensive income (loss), changes in equity, and cash flows for each of the three years in the period ended
December 31, 2017
, the related notes, and the schedule listed in the Index at Item 15 (collectively referred to as the "financial statements"). In our opinion, the financial statements present fairly, in all material respects, the financial position of the Company as of December 31, 2017 and 2016, and the results of its operations and its cash flows for each of the three years in the period ended December 31, 2017, in conformity with accounting principles generally accepted in the United States of America.
We have also audited, in accordance with the standards of the Public Company Accounting Oversight Board (United States) (PCAOB), the Company’s internal control over financial reporting as of December 31, 2017, based on criteria established in
Internal Control-Integrated Framework
(2013)
issued by the Committee of Sponsoring Organizations of the Treadway Commission and our report dated February 20, 2018 expressed an unqualified opinion on the Company’s internal control over financial reporting.
Basis for Opinion
These financial statements are the responsibility of the Company's management. Our responsibility is to express an opinion on the financial statements based on our audits. We are a public accounting firm registered with the PCAOB and are required to be independent with respect to the Company in accordance with the U.S. federal securities laws and the applicable rules and regulations of the Securities and Exchange Commission and the PCAOB.
We conducted our audits in accordance with the standards of the PCAOB. Those standards require that we plan and perform the audit to obtain reasonable assurance about whether the financial statements are free of material misstatement,
whether due to error or fraud. Our audits included performing procedures to assess the risks of material misstatement of the financial statements, whether due to error or fraud, and performing procedures that respond to those risks. Such procedures included examining, on a test basis, evidence regarding the amounts and disclosures in the financial statements. Our audits also included evaluating the accounting principles used and significant estimates made by management, as well as evaluating the overall presentation of the financial statements. We believe that our audits provide a reasonable basis for our opinion.
/s/ Deloitte & Touche LLP
Minneapolis, Minnesota
February 27, 2018
We have served as the Company's auditor since 1977.
41
Pentair plc and Subsidiaries
|
|
Years ended December 31
|
||||||||
|
In millions, except per-share data
|
2017
|
2016
|
2015
|
||||||
|
Net sales
|
$
|
4,936.5
|
|
$
|
4,890.0
|
|
$
|
4,616.4
|
|
|
Cost of goods sold
|
3,107.4
|
|
3,095.9
|
|
3,017.6
|
|
|||
|
Gross profit
|
1,829.1
|
|
1,794.1
|
|
1,598.8
|
|
|||
|
Selling, general and administrative
|
1,032.5
|
|
979.3
|
|
884.0
|
|
|||
|
Research and development
|
115.8
|
|
114.1
|
|
98.7
|
|
|||
|
Operating income
|
680.8
|
|
700.7
|
|
616.1
|
|
|||
|
Other (income) expense
|
|||||||||
|
Loss on sale of businesses
|
4.2
|
|
3.9
|
|
3.2
|
|
|||
|
Loss on early extinguishment of debt
|
101.4
|
|
—
|
|
—
|
|
|||
|
Equity income of unconsolidated subsidiaries
|
(1.3
|
)
|
(4.3
|
)
|
(1.5
|
)
|
|||
|
Interest income
|
(9.9
|
)
|
(8.3
|
)
|
(4.7
|
)
|
|||
|
Interest expense
|
97.2
|
|
148.4
|
|
106.6
|
|
|||
|
Income from continuing operations before income taxes
|
489.2
|
|
561.0
|
|
512.5
|
|
|||
|
Provision for income taxes
|
9.2
|
|
109.4
|
|
115.4
|
|
|||
|
Net income from continuing operations
|
480.0
|
|
451.6
|
|
397.1
|
|
|||
|
Income (loss) from discontinued operations, net of tax
|
5.4
|
|
70.0
|
|
(466.8
|
)
|
|||
|
Gain (loss) from sale / impairment of discontinued operations, net of tax
|
181.1
|
|
0.6
|
|
(6.7
|
)
|
|||
|
Net income (loss)
|
$
|
666.5
|
|
$
|
522.2
|
|
$
|
(76.4
|
)
|
|
Comprehensive income (loss), net of tax
|
|||||||||
|
Net income (loss)
|
$
|
666.5
|
|
$
|
522.2
|
|
$
|
(76.4
|
)
|
|
Changes in cumulative translation adjustment (inclusive of divestiture of business reclassified to gain from sale of $374.2 for the year ended December 31, 2017)
|
497.5
|
|
(83.0
|
)
|
(264.9
|
)
|
|||
|
Changes in market value of derivative financial instruments, net of tax
|
(4.6
|
)
|
(8.3
|
)
|
0.2
|
|
|||
|
Comprehensive income (loss)
|
$
|
1,159.4
|
|
$
|
430.9
|
|
$
|
(341.1
|
)
|
|
Earnings (loss) per ordinary share
|
|||||||||
|
Basic
|
|||||||||
|
Continuing operations
|
$
|
2.64
|
|
$
|
2.49
|
|
$
|
2.20
|
|
|
Discontinued operations
|
1.03
|
|
0.39
|
|
(2.62
|
)
|
|||
|
Basic earnings (loss) per ordinary share
|
$
|
3.67
|
|
$
|
2.88
|
|
$
|
(0.42
|
)
|
|
Diluted
|
|||||||||
|
Continuing operations
|
$
|
2.61
|
|
$
|
2.47
|
|
$
|
2.17
|
|
|
Discontinued operations
|
1.02
|
|
0.38
|
|
(2.59
|
)
|
|||
|
Diluted earnings (loss) per ordinary share
|
$
|
3.63
|
|
$
|
2.85
|
|
$
|
(0.42
|
)
|
|
Weighted average ordinary shares outstanding
|
|||||||||
|
Basic
|
181.7
|
|
181.3
|
|
180.3
|
|
|||
|
Diluted
|
183.7
|
|
183.1
|
|
182.6
|
|
|||
See accompanying notes to consolidated financial statements.
42
Pentair plc and Subsidiaries
|
|
December 31
|
|||||
|
In millions, except per-share data
|
2017
|
2016
|
||||
|
Assets
|
||||||
|
Current assets
|
||||||
|
Cash and cash equivalents
|
$
|
113.3
|
|
$
|
238.5
|
|
|
Accounts and notes receivable, net of allowances of $22.6 and $25.6, respectively
|
831.6
|
|
764.0
|
|
||
|
Inventories
|
581.0
|
|
524.2
|
|
||
|
Other current assets
|
222.9
|
|
253.4
|
|
||
|
Current assets held for sale
|
—
|
|
891.9
|
|
||
|
Total current assets
|
1,748.8
|
|
2,672.0
|
|
||
|
Property, plant and equipment, net
|
545.5
|
|
538.6
|
|
||
|
Other assets
|
||||||
|
Goodwill
|
4,351.1
|
|
4,217.4
|
|
||
|
Intangibles, net
|
1,558.4
|
|
1,631.8
|
|
||
|
Other non-current assets
|
429.9
|
|
182.1
|
|
||
|
Non-current assets held for sale
|
—
|
|
2,292.9
|
|
||
|
Total other assets
|
6,339.4
|
|
8,324.2
|
|
||
|
Total assets
|
$
|
8,633.7
|
|
$
|
11,534.8
|
|
|
Liabilities and Equity
|
||||||
|
Current liabilities
|
||||||
|
Current maturities of long-term debt and short-term borrowings
|
$
|
—
|
|
$
|
0.8
|
|
|
Accounts payable
|
495.7
|
|
436.6
|
|
||
|
Employee compensation and benefits
|
186.6
|
|
166.1
|
|
||
|
Other current liabilities
|
517.1
|
|
511.5
|
|
||
|
Current liabilities held for sale
|
—
|
|
356.2
|
|
||
|
Total current liabilities
|
1,199.4
|
|
1,471.2
|
|
||
|
Other liabilities
|
||||||
|
Long-term debt
|
1,440.7
|
|
4,278.4
|
|
||
|
Pension and other post-retirement compensation and benefits
|
285.6
|
|
253.4
|
|
||
|
Deferred tax liabilities
|
394.8
|
|
609.5
|
|
||
|
Other non-current liabilities
|
275.4
|
|
162.0
|
|
||
|
Non-current liabilities held for sale
|
—
|
|
505.9
|
|
||
|
Total liabilities
|
3,595.9
|
|
7,280.4
|
|
||
|
Equity
|
||||||
|
Ordinary shares $0.01 par value, 426.0 authorized, 180.3 and 181.8 issued at December 31, 2017 and December 31, 2016, respectively
|
1.8
|
|
1.8
|
|
||
|
Additional paid-in capital
|
2,797.7
|
|
2,920.8
|
|
||
|
Retained earnings
|
2,481.7
|
|
2,068.1
|
|
||
|
Accumulated other comprehensive loss
|
(243.4
|
)
|
(736.3
|
)
|
||
|
Total equity
|
5,037.8
|
|
4,254.4
|
|
||
|
Total liabilities and equity
|
$
|
8,633.7
|
|
$
|
11,534.8
|
|
See accompanying notes to consolidated financial statements.
43
Pentair plc and Subsidiaries
|
|
Years ended December 31
|
||||||||
|
In millions
|
2017
|
2016
|
2015
|
||||||
|
Operating activities
|
|||||||||
|
Net income (loss)
|
$
|
666.5
|
|
$
|
522.2
|
|
$
|
(76.4
|
)
|
|
(Income) loss from discontinued operations, net of tax
|
(5.4
|
)
|
(70.0
|
)
|
466.8
|
|
|||
|
(Gain) loss from sale / impairment of discontinued operations, net of tax
|
(181.1
|
)
|
(0.6
|
)
|
6.7
|
|
|||
|
Adjustments to reconcile net income (loss) from continuing operations to net cash provided by (used for) operating activities of continuing operations
|
|||||||||
|
Equity income of unconsolidated subsidiaries
|
(1.3
|
)
|
(4.3
|
)
|
(1.5
|
)
|
|||
|
Depreciation
|
85.2
|
|
84.6
|
|
81.2
|
|
|||
|
Amortization
|
97.7
|
|
96.4
|
|
68.1
|
|
|||
|
Loss on sale of businesses
|
4.2
|
|
3.9
|
|
3.2
|
|
|||
|
Deferred income taxes
|
(159.7
|
)
|
(16.1
|
)
|
(2.3
|
)
|
|||
|
Share-based compensation
|
39.6
|
|
34.2
|
|
33.0
|
|
|||
|
Trade name and other impairment
|
32.0
|
|
13.3
|
|
—
|
|
|||
|
Loss on early extinguishment of debt
|
101.4
|
|
—
|
|
—
|
|
|||
|
Excess tax benefits from share-based compensation
|
—
|
|
(8.0
|
)
|
(6.0
|
)
|
|||
|
Amortization of bridge financing debt issuance costs
|
—
|
|
—
|
|
10.8
|
|
|||
|
Pension and other post-retirement expense
|
29.2
|
|
31.8
|
|
9.4
|
|
|||
|
Pension and other post-retirement contributions
|
(15.7
|
)
|
(13.5
|
)
|
(12.7
|
)
|
|||
|
Changes in assets and liabilities, net of effects of business acquisitions
|
|||||||||
|
Accounts and notes receivable
|
(30.9
|
)
|
21.3
|
|
(6.2
|
)
|
|||
|
Inventories
|
(29.4
|
)
|
34.3
|
|
54.7
|
|
|||
|
Other current assets
|
(5.9
|
)
|
(15.8
|
)
|
(27.3
|
)
|
|||
|
Accounts payable
|
32.6
|
|
38.0
|
|
10.6
|
|
|||
|
Employee compensation and benefits
|
10.2
|
|
7.0
|
|
(15.6
|
)
|
|||
|
Other current liabilities
|
(29.3
|
)
|
51.6
|
|
(16.6
|
)
|
|||
|
Other non-current assets and liabilities
|
34.1
|
|
(107.9
|
)
|
17.8
|
|
|||
|
Net cash provided by (used for) operating activities of continuing operations
|
674.0
|
|
702.4
|
|
597.7
|
|
|||
|
Net cash provided by (used for) operating activities of discontinued operations
|
(53.8
|
)
|
159.0
|
|
141.6
|
|
|||
|
Net cash provided by (used for) operating activities
|
620.2
|
|
861.4
|
|
739.3
|
|
|||
|
Investing activities
|
|||||||||
|
Capital expenditures
|
(70.9
|
)
|
(117.8
|
)
|
(91.3
|
)
|
|||
|
Proceeds from sale of property and equipment
|
7.9
|
|
24.7
|
|
4.6
|
|
|||
|
Proceeds from sale of businesses and other
|
2,759.4
|
|
(5.2
|
)
|
(3.0
|
)
|
|||
|
Acquisitions, net of cash acquired
|
(59.5
|
)
|
(25.0
|
)
|
(1,913.9
|
)
|
|||
|
Net cash provided by (used for) investing activities of continuing operations
|
2,636.9
|
|
(123.3
|
)
|
(2,003.6
|
)
|
|||
|
Net cash provided by (used for) investing activities of discontinued operations
|
(6.5
|
)
|
1.5
|
|
38.1
|
|
|||
|
Net cash provided by (used for) investing activities
|
2,630.4
|
|
(121.8
|
)
|
(1,965.5
|
)
|
|||
|
Financing activities
|
|||||||||
|
Net receipts (repayments) of short-term borrowings
|
(0.8
|
)
|
0.8
|
|
(2.3
|
)
|
|||
|
Net receipts (repayments) of commercial paper and revolving long-term debt
|
(913.1
|
)
|
(385.3
|
)
|
363.5
|
|
|||
|
Proceeds from long-term debt
|
—
|
|
—
|
|
1,714.8
|
|
|||
|
Repayment of long-term debt
|
(2,009.3
|
)
|
(0.7
|
)
|
(356.6
|
)
|
|||
|
Debt issuance costs
|
—
|
|
—
|
|
(26.8
|
)
|
|||
|
Premium paid on early extinguishment of debt
|
(94.9
|
)
|
—
|
|
—
|
|
|||
|
Excess tax benefits from share-based compensation
|
—
|
|
8.0
|
|
6.0
|
|
|||
|
Shares issued to employees, net of shares withheld
|
37.2
|
|
20.7
|
|
19.4
|
|
|||
|
Repurchases of ordinary shares
|
(200.0
|
)
|
—
|
|
(200.0
|
)
|
|||
|
Dividends paid
|
(251.7
|
)
|
(243.6
|
)
|
(231.7
|
)
|
|||
|
Net cash provided by (used for) financing activities
|
(3,432.6
|
)
|
(600.1
|
)
|
1,286.3
|
|
|||
|
Effect of exchange rate changes on cash and cash equivalents
|
56.8
|
|
(27.3
|
)
|
(44.2
|
)
|
|||
|
Change in cash and cash equivalents
|
(125.2
|
)
|
112.2
|
|
15.9
|
|
|||
|
Cash and cash equivalents, beginning of year
|
238.5
|
|
126.3
|
|
110.4
|
|
|||
|
Cash and cash equivalents, end of year
|
$
|
113.3
|
|
$
|
238.5
|
|
$
|
126.3
|
|
See accompanying notes to consolidated financial statements.
44
Pentair plc and Subsidiaries
Consolidated Statements of Changes in Equity
|
In millions
|
Ordinary shares
|
Treasury shares
|
Additional paid-in capital
|
Retained earnings
|
Accumulated other comprehensive loss
|
Total
|
|||||||||||||||||
|
Number
|
Amount
|
Number
|
Amount
|
||||||||||||||||||||
|
Balance - December 31, 2014
|
202.4
|
|
$
|
2.0
|
|
(19.9
|
)
|
$
|
(1,251.9
|
)
|
$
|
4,250.0
|
|
$
|
2,044.0
|
|
$
|
(380.3
|
)
|
$
|
4,663.8
|
|
|
|
Net loss
|
—
|
|
—
|
|
—
|
|
—
|
|
—
|
|
(76.4
|
)
|
—
|
|
(76.4
|
)
|
|||||||
|
Other comprehensive loss, net of tax
|
—
|
|
—
|
|
—
|
|
—
|
|
—
|
|
—
|
|
(264.7
|
)
|
(264.7
|
)
|
|||||||
|
Tax benefit of share-based compensation
|
—
|
|
—
|
|
—
|
|
—
|
|
5.7
|
|
—
|
|
—
|
|
5.7
|
|
|||||||
|
Dividends declared
|
—
|
|
—
|
|
—
|
|
—
|
|
1.5
|
|
(175.9
|
)
|
—
|
|
(174.4
|
)
|
|||||||
|
Share repurchase
|
(3.1
|
)
|
—
|
|
—
|
|
—
|
|
(200.0
|
)
|
—
|
|
—
|
|
(200.0
|
)
|
|||||||
|
Cancellation of treasury shares
|
(19.1
|
)
|
(0.2
|
)
|
19.1
|
|
1,210.9
|
|
(1,210.7
|
)
|
—
|
|
—
|
|
—
|
|
|||||||
|
Exercise of options, net of shares tendered for payment
|
0.1
|
|
—
|
|
0.7
|
|
34.6
|
|
(3.5
|
)
|
—
|
|
—
|
|
31.1
|
|
|||||||
|
Issuance of restricted shares, net of cancellations
|
0.3
|
|
—
|
|
0.2
|
|
9.4
|
|
(9.4
|
)
|
—
|
|
—
|
|
—
|
|
|||||||
|
Shares surrendered by employees to pay taxes
|
(0.1
|
)
|
—
|
|
(0.1
|
)
|
(3.0
|
)
|
(6.3
|
)
|
—
|
|
—
|
|
(9.3
|
)
|
|||||||
|
Share-based compensation
|
—
|
|
—
|
|
—
|
|
—
|
|
33.0
|
|
—
|
|
—
|
|
33.0
|
|
|||||||
|
Balance - December 31, 2015
|
180.5
|
|
$
|
1.8
|
|
—
|
|
$
|
—
|
|
$
|
2,860.3
|
|
$
|
1,791.7
|
|
$
|
(645.0
|
)
|
$
|
4,008.8
|
|
|
|
Net income
|
—
|
|
—
|
|
—
|
|
—
|
|
—
|
|
522.2
|
|
—
|
|
522.2
|
|
|||||||
|
Other comprehensive loss, net of tax
|
—
|
|
—
|
|
—
|
|
—
|
|
—
|
|
—
|
|
(91.3
|
)
|
(91.3
|
)
|
|||||||
|
Tax benefit of share-based compensation
|
—
|
|
—
|
|
—
|
|
—
|
|
5.5
|
|
—
|
|
—
|
|
5.5
|
|
|||||||
|
Dividends declared
|
—
|
|
—
|
|
—
|
|
—
|
|
—
|
|
(245.8
|
)
|
—
|
|
(245.8
|
)
|
|||||||
|
Exercise of options, net of shares tendered for payment
|
1.0
|
|
—
|
|
—
|
|
—
|
|
31.6
|
|
—
|
|
—
|
|
31.6
|
|
|||||||
|
Issuance of restricted shares, net of cancellations
|
0.5
|
|
—
|
|
—
|
|
—
|
|
—
|
|
—
|
|
—
|
|
—
|
|
|||||||
|
Shares surrendered by employees to pay taxes
|
(0.2
|
)
|
—
|
|
—
|
|
—
|
|
(10.8
|
)
|
—
|
|
—
|
|
(10.8
|
)
|
|||||||
|
Share-based compensation
|
—
|
|
—
|
|
—
|
|
—
|
|
34.2
|
|
—
|
|
—
|
|
34.2
|
|
|||||||
|
Balance - December 31, 2016
|
181.8
|
|
$
|
1.8
|
|
—
|
|
$
|
—
|
|
$
|
2,920.8
|
|
$
|
2,068.1
|
|
$
|
(736.3
|
)
|
$
|
4,254.4
|
|
|
|
Net income
|
—
|
|
—
|
|
—
|
|
—
|
|
—
|
|
666.5
|
|
—
|
|
666.5
|
|
|||||||
|
Other comprehensive income, net of tax
|
—
|
|
—
|
|
—
|
|
—
|
|
—
|
|
—
|
|
492.9
|
|
492.9
|
|
|||||||
|
Dividends declared
|
—
|
|
—
|
|
—
|
|
—
|
|
—
|
|
(252.9
|
)
|
—
|
|
(252.9
|
)
|
|||||||
|
Share repurchases
|
(3.0
|
)
|
—
|
|
—
|
|
—
|
|
(200.0
|
)
|
—
|
|
—
|
|
(200.0
|
)
|
|||||||
|
Exercise of options, net of shares tendered for payment
|
1.2
|
|
—
|
|
—
|
|
—
|
|
45.6
|
|
—
|
|
—
|
|
45.6
|
|
|||||||
|
Issuance of restricted shares, net of cancellations
|
0.4
|
|
—
|
|
—
|
|
—
|
|
—
|
|
—
|
|
—
|
|
—
|
|
|||||||
|
Shares surrendered by employees to pay taxes
|
(0.1
|
)
|
—
|
|
—
|
|
—
|
|
(8.3
|
)
|
—
|
|
—
|
|
(8.3
|
)
|
|||||||
|
Share-based compensation
|
—
|
|
—
|
|
—
|
|
—
|
|
39.6
|
|
—
|
|
—
|
|
39.6
|
|
|||||||
|
Balance - December 31, 2017
|
180.3
|
|
$
|
1.8
|
|
—
|
|
$
|
—
|
|
$
|
2,797.7
|
|
$
|
2,481.7
|
|
$
|
(243.4
|
)
|
$
|
5,037.8
|
|
|
See accompanying notes to consolidated financial statements.
45
Pentair plc and Subsidiaries
Notes to consolidated financial statements
|
1.
|
Basis of Presentation and Summary of Significant Accounting Policies
|
Business
Pentair plc and its consolidated subsidiaries (the "Company" or "Pentair") is a focused diversified industrial manufacturing company comprising two reporting segments: Water and Electrical.
Proposed separation
On May 9, 2017, we announced that our Board of Directors approved a plan to separate our Water business and Electrical business into two independent, publicly-traded companies (the "Proposed Separation"). The Proposed Separation is expected to occur through a tax-free spin-off of the Electrical business to Pentair shareholders.
Completion of the Proposed Separation is subject to certain customary conditions, including, among other things, final approval of the transaction by Pentair's Board of Directors, receipt of tax opinions and rulings and effectiveness of appropriate filings with the SEC. Upon completion of the Proposed Separation, it is anticipated that Electrical's jurisdiction of organization will be Ireland, but that it will manage its affairs so that it will be centrally managed and controlled in the United Kingdom (the "U.K.") and therefore will have its tax residency in the U.K.
We are targeting April 30, 2018 for the completion of the Proposed Separation; however, there can be no assurance regarding the ultimate timing of the Proposed Separation or that the Proposed Separation will be completed.
Basis of presentation
The accompanying consolidated financial statements include the accounts of Pentair and all subsidiaries, both the United States ("U.S.") and non-U.S., which we control. Intercompany accounts and transactions have been eliminated. Investments in companies of which we own
20%
to
50%
of the voting stock or have the ability to exercise significant influence over operating and financial policies of the investee are accounted for using the equity method of accounting and as a result, our share of the earnings or losses of such equity affiliates is included in the Consolidated Statements of Operations and Comprehensive Income (Loss).
The consolidated financial statements have been prepared in U.S. dollars ("USD") and in accordance with accounting principles generally accepted in the United States of America ("GAAP").
Fiscal year
Our fiscal year ends on December 31. Beginning with the first quarter of 2016, we report our interim quarterly periods on a calendar quarter basis. Prior to the first quarter of 2016, we reported our interim quarterly periods on a 13-week basis ending on a Saturday.
Use of estimates
The preparation of our consolidated financial statements in conformity with GAAP requires us to make estimates and assumptions that affect the amounts reported in these consolidated financial statements and accompanying notes, disclosures of contingent assets and liabilities at the date of the financial statements and the reported amounts of revenues and expenses during the reporting period. These estimates include our accounting for valuation of goodwill and indefinite lived intangible assets, estimated losses on accounts receivable, estimated realizable value on excess and obsolete inventory, percentage of completion revenue recognition, assets acquired and liabilities assumed in acquisitions, estimated selling proceeds from assets held for sale, contingent liabilities, income taxes and pension and other post-retirement benefits. Actual results could differ from our estimates.
Revenue recognition
We recognize revenue when it is realized or realizable and has been earned. Revenue is recognized when persuasive evidence of an arrangement exists, shipment or delivery has occurred (depending on the terms of the sale), our price to the buyer is fixed or determinable, and collectability is reasonably assured.
Generally, there is no post-shipment obligation on product sold other than warranty obligations in the normal and ordinary course of business. In the event significant post-shipment obligations were to exist, revenue recognition would be deferred until substantially all obligations were satisfied.
46
Pentair plc and Subsidiaries
Notes to consolidated financial statements
Percentage of completion
Revenue from certain long-term contracts is recognized over the contractual period under the percentage of completion method of accounting. Under this method, sales and gross profit are recognized as work is performed either based on the relationship between the actual costs incurred and the total estimated costs at completion ("the cost-to-cost method") or based on efforts for measuring progress towards completion in situations in which this approach is more representative of the progress on the contract than the cost-to-cost method. Changes to the original estimates may be required during the life of the contract and such estimates are reviewed on a regular basis. Sales and gross profit are adjusted using the cumulative catch-up method for revisions in estimated total contract costs. These reviews have not resulted in adjustments that were significant to our results of operations. Estimated losses are recorded when identified. Claims against customers are recognized as revenue upon settlement.
We record costs and earnings in excess of billings on uncompleted contracts within
Other current assets
and billings in excess of costs and earnings on uncompleted contracts within
Other current liabilities
in the Consolidated Balance Sheets.
Sales returns
The right of return may exist explicitly or implicitly with our customers. Our return policy allows for customer returns only upon our authorization. Goods returned must be product we continue to market and must be in salable condition. At the time of sale, we reduce revenue for the estimated effect of returns. Estimated sales returns include consideration of historical sales levels, the timing and magnitude of historical sales return levels as a percent of sales, type of product, type of customer and a projection of this experience into the future.
Pricing and sales incentives
We record estimated reductions to revenue for customer programs and incentive offerings including pricing arrangements, promotions and other volume-based incentives at the later of the date revenue is recognized or the incentive is offered. Sales incentives given to our customers are recorded as a reduction of revenue unless we (1) receive an identifiable benefit for the goods or services in exchange for the consideration and (2) we can reasonably estimate the fair value of the benefit received.
Pricing is established at or prior to the time of sale with our customers and we record sales at the agreed-upon net selling price. However, we allow customers to apply for a refund of a percentage of the original purchase price if they can demonstrate sales to a qualifying end customer. At the time of sale, we estimate the anticipated refund to be paid based on historical experience and reduce sales for the probable cost of the discount. The cost of these refunds is recorded as a reduction in gross sales.
Volume-based incentives involve rebates that are negotiated at or prior to the time of sale with the customer and are redeemable only if the customer achieves a specified cumulative level of sales or sales increase. Under these incentive programs, at the time of sale, we estimate the anticipated rebate to be paid based on forecasted sales levels. These forecasts are updated at least quarterly for each customer and sales are reduced for the anticipated cost of the rebate. If the forecasted sales for a customer changes, the accrual for rebates is adjusted to reflect the new amount of rebates expected to be earned by the customer.
Shipping and handling costs
Amounts billed to customers for shipping and handling are recorded in
Net sales
in the accompanying Consolidated Statements of Operations and Comprehensive Income (Loss). Shipping and handling costs incurred by Pentair for the delivery of goods to customers are included in
Cost of goods sold
in the accompanying Consolidated Statements of Operations and Comprehensive Income (Loss).
Research and development
We conduct research and development ("R&D") activities primarily in our own facilities, which consist primarily of the development of new products, product applications and manufacturing processes. We expense R&D costs as incurred. R&D expenditures during
2017
,
2016
and
2015
were
$115.8 million
,
$114.1 million
and
$98.7 million
, respectively.
Cash equivalents
We consider highly liquid investments with original maturities of three months or less at the date of acquisition to be cash equivalents.
Trade receivables and concentration of credit risk
We record an allowance for doubtful accounts, reducing our receivables balance to an amount we estimate is collectible from our customers. Estimates used in determining the allowance for doubtful accounts are based on current trends, aging of accounts receivable, periodic credit evaluations of our customers' financial condition, and historical collection experience. We generally do not require collateral.
No
customer receivable balances exceeded
10%
of total net receivable balances as of
December 31, 2017
or
December 31, 2016
.
47
Pentair plc and Subsidiaries
Notes to consolidated financial statements
Inventories
Inventories are stated at the lower of cost or market with substantially all inventories recorded using the first-in, first-out ("FIFO") cost method.
Property, plant and equipment, net
Property, plant and equipment is stated at historical cost. We compute depreciation by the straight-line method based on the following estimated useful lives:
|
|
Years
|
|
Land improvements
|
5 to 20
|
|
Buildings and leasehold improvements
|
5 to 50
|
|
Machinery and equipment
|
3 to 15
|
Significant improvements that add to productive capacity or extend the lives of properties are capitalized. Costs for repairs and maintenance are charged to expense as incurred. When property is retired or otherwise disposed of, the recorded cost of the assets and their related accumulated depreciation are removed from the Consolidated Balance Sheets and any related gains or losses are included in income.
We review the recoverability of long-lived assets to be held and used, such as property, plant and equipment, when events or changes in circumstances occur that indicate the carrying value of the asset or asset group may not be recoverable. The assessment of possible impairment is based on our ability to recover the carrying value of the asset or asset group from the expected future pre-tax cash flows (undiscounted and without interest charges) of the related operations. If these cash flows are less than the carrying value of such asset or asset group, an impairment loss is recognized for the difference between estimated fair value and carrying value. Impairment losses on long-lived assets held for sale are determined in a similar manner, except that fair values are reduced for the cost to dispose of the assets. The measurement of impairment requires us to estimate future cash flows and the fair value of long-lived assets. We recorded
no
impairment charges in
2017
or
2016
in conjunction with restructuring activities. During
2015
we recorded
$5.1 million
of asset impairment in conjunction with restructuring activities.
Goodwill and identifiable intangible assets
Goodwill
Goodwill represents the excess of the cost of acquired businesses over the net of the fair value of identifiable tangible net assets and identifiable intangible assets purchased and liabilities assumed.
Goodwill is tested at least annually for impairment and is tested for impairment more frequently if events or changes in circumstances indicate that the asset might be impaired. The impairment test is performed using a two-step process. In the first step, the fair value of each reporting unit is compared with the carrying amount of the reporting unit, including goodwill. If the estimated fair value is less than the carrying amount of the reporting unit there is an indication that goodwill impairment exists and a second step must be completed in order to determine the amount of the goodwill impairment, if any, that should be recorded. In the second step, an impairment loss is recognized for any excess of the carrying amount of the reporting unit's goodwill over the implied fair value of that goodwill. The implied fair value of goodwill is determined by allocating the fair value of the reporting unit in a manner similar to a purchase price allocation.
The fair value of each reporting unit is determined using a discounted cash flow analysis and market approach. Projecting discounted future cash flows requires us to make significant estimates regarding future revenues and expenses, projected capital expenditures, changes in working capital and the appropriate discount rate. Use of the market approach consists of comparisons to comparable publicly-traded companies that are similar in size and industry. Actual results may differ from those used in our valuations. This non-recurring fair value measurement is a "Level 3" measurement under the fair value hierarchy described below.
In developing our discounted cash flow analysis, assumptions about future revenues and expenses, capital expenditures and changes in working capital, are based on our annual operating plan and long-term business plan for each of our reporting units. These plans take into consideration numerous factors including historical experience, anticipated future economic conditions, changes in raw material prices and growth expectations for the industries and end markets we participate in. These assumptions are determined over a
six
year long-term planning period. The
six
year growth rates for revenues and operating profits vary for each reporting unit being evaluated. Revenues and operating profit beyond
2023
are projected to grow at a perpetual growth rate of
3.0%
.
Discount rate assumptions for each reporting unit take into consideration our assessment of risks inherent in the future cash flows of the respective reporting unit and our weighted-average cost of capital. We utilized discount rates ranging from
9.0%
to
9.5%
in determining the discounted cash flows in our fair value analysis.
48
Pentair plc and Subsidiaries
Notes to consolidated financial statements
In estimating fair value using the market approach, we identify a group of comparable publicly-traded companies for each reporting unit that are similar in terms of size and product offering. These groups of comparable companies are used to develop multiples based on total market-based invested capital as a multiple of earnings before interest, taxes, depreciation and amortization ("EBITDA"). We determine our estimated values by applying these comparable EBITDA multiples to the operating results of our reporting units. The ultimate fair value of each reporting unit is determined considering the results of both valuation methods.
We completed step one of our annual goodwill impairment evaluation as of the first day of the fourth quarter of
2017
,
2016
and
2015
with each reporting unit's fair value in excess of its carrying value.
During the latter part of the fourth quarter of 2015, the oil and gas industry continued to deteriorate, leading management to reconsider its estimates for future profitability of our former Valves & Controls business and thereby increasing the likelihood that the associated goodwill could be impaired. As such, we concluded that a triggering event occurred during the fourth quarter of 2015 requiring that we test Valves & Controls goodwill for impairment. As a result, we reperformed our step one analysis as of December 31, 2015. Consistent with our annual test, the fair value was estimated using both a discounted cash flow analysis and market approach.
The results of our step one goodwill impairment testing as of December 31, 2015 indicated that the fair value of Valves & Controls was below its carrying value. Accordingly, we performed the step two test and concluded the goodwill of Valves & Controls was impaired. As a result, we recorded a non-cash goodwill impairment charge of
$515.2 million
for the year ended December 31, 2015. The impairment is included in
Income (loss) from discontinued operations, net of tax
in our Consolidated Statements of Operations and Comprehensive Income (Loss).
Identifiable intangible assets
Our primary identifiable intangible assets include: customer relationships, trade names, proprietary technology and patents. Identifiable intangibles with finite lives are amortized and those identifiable intangibles with indefinite lives are not amortized. Identifiable intangible assets that are subject to amortization are evaluated for impairment whenever events or changes in circumstances indicate that the carrying amount may not be recoverable. Identifiable intangible assets not subject to amortization are tested for impairment annually or more frequently if events warrant. We complete our annual impairment test during the fourth quarter each year for those identifiable assets not subject to amortization.
The impairment test for trade names consists of a comparison of the fair value of the trade name with its carrying value. Fair value is measured using the relief-from-royalty method. This method assumes the trade name has value to the extent that the owner is relieved of the obligation to pay royalties for the benefits received from them. This method requires us to estimate the future revenue for the related brands, the appropriate royalty rate and the weighted average cost of capital. The non-recurring fair value measurement is a "Level 3" measurement under the fair value hierarchy described below.
An impairment charge of
$25.2 million
was recorded in 2017 related to certain trade names in Water and Electrical as a result of lower forecasted sales volume or rebranding strategies implemented in the fourth quarter of 2017. An impairment charge of
$13.3 million
was recorded in 2016 related to a trade name in Electrical as a result of a rebranding strategy implemented in the fourth quarter of 2016. The trade name impairment charges were recorded in
Selling, general and administrative
in our Consolidated Statements of Operations and Comprehensive Income (Loss).
As noted above, during the latter part of the fourth quarter of 2015, the oil and gas industry continued to deteriorate, leading management to reconsider its estimates for future profitability of our former Valves & Controls business and thereby increasing the likelihood that the associated intangible assets could be impaired. As such, we concluded that a triggering event occurred during the fourth quarter of 2015 requiring that we test Valves & Controls trade names for impairment. As a result of this test, an impairment charge of
$39.5 million
was recorded in 2015 related to trade names in the Valves & Controls business classified as held for sale. The impairment is included in
Income (loss) from discontinued operations, net of tax
in our Consolidated Statements of Operations and Comprehensive Income (Loss).
Income taxes
We use the asset and liability approach to account for income taxes. Under this method, deferred tax assets and liabilities are recognized for the expected future tax consequences of differences between the carrying amounts of assets and liabilities and their respective tax bases using enacted tax rates in effect for the year in which the differences are expected to reverse. The effect on deferred tax assets and liabilities of a change in tax rates is recognized in income in the period when the change is enacted. We maintain valuation allowances unless it is more likely than not that all or a portion of the deferred tax assets will be realized. Changes in valuation allowances from period to period are included in our tax provision in the period of change. We recognize the effect of income tax positions only if those positions are more likely than not of being sustained. Recognized income tax positions are measured at the largest amount that is greater than
50%
likely of being realized. Changes in recognition or measurement are reflected in the period in which the change in judgment occurs.
49
Pentair plc and Subsidiaries
Notes to consolidated financial statements
Pension and other post-retirement plans
We sponsor U.S. and non-U.S. defined-benefit pension and other post-retirement plans. The pension and other post-retirement benefit costs for company-sponsored benefit plans are determined from actuarial assumptions and methodologies, including discount rates and expected returns on plan assets. These assumptions are updated annually and are disclosed in Note 13.
We recognize changes in the fair value of plan assets and net actuarial gains or losses for pension and other post-retirement benefits annually in the fourth quarter each year ("mark-to-market adjustment") and, if applicable, in any quarter in which an interim remeasurement is triggered. Net actuarial gains and losses occur when the actual experience differs from any of the various assumptions used to value our pension and other post-retirement plans or when assumptions change, as they may each year. The remaining components of pension expense, including service and interest costs and estimated return on plan assets, are recorded on a quarterly basis.
Insurance subsidiary
We insure certain general and product liability, property, workers' compensation and automobile liability risks through our regulated wholly-owned captive insurance subsidiary, Penwald Insurance Company ("Penwald"). Reserves for policy claims are established based on actuarial projections of ultimate losses. As of
December 31, 2017
and
2016
, reserves for policy claims were
$61.5 million
(
$13.2 million
included in
Other current liabilities
and
$48.3 million
included in
Other non-current liabilities
) and
$63.0 million
(
$13.2 million
included in
Other current liabilities
and
$49.8 million
included in
Other non-current liabilities
), respectively.
Share-based compensation
We account for share-based compensation awards on a fair value basis. The estimated grant date fair value of each option award is recognized in income on an accelerated basis over the requisite service period (generally the vesting period). The estimated fair value of each option award is calculated using the Black-Scholes option-pricing model. From time to time, we have elected to modify the terms of the original grant. These modified grants are accounted for as a new award and measured using the fair value method, resulting in the inclusion of additional compensation expense in our Consolidated Statements of Operations and Comprehensive Income (Loss). Restricted share awards and units are recorded as compensation cost on an accelerated basis over the requisite service periods based on the market value on the date of grant.
Performance share units ("PSUs") are stock awards where the ultimate number of shares issued will be contingent on the Company's performance against certain financial performance targets. The fair value of each PSU is based on the market value on the date of grant. We recognize expense related to the estimated vesting of our PSUs granted. The estimated vesting of the PSUs is based on the probability of achieving certain financial performance thresholds over the specified performance period.
Earnings (loss) per ordinary share
Basic earnings (loss) per share are computed by dividing net income (loss) attributable to Pentair plc by the weighted-average number of ordinary shares outstanding. Diluted earnings (loss) per share are computed by dividing net income (loss) attributable to Pentair plc by the weighted-average number of ordinary shares outstanding including the dilutive effects of ordinary share equivalents.
Derivative financial instruments
We recognize all derivatives, including those embedded in other contracts, as either assets or liabilities at fair value in our Consolidated Balance Sheets. If the derivative is designated and is effective as a cash-flow hedge, the effective portion of changes in the fair value of the derivative are recorded in
Accumulated other comprehensive income (loss)
("AOCI") as a separate component of equity in the Consolidated Balance Sheets and are recognized in the Consolidated Statements of Operations and Comprehensive Income (Loss) when the hedged item affects earnings. If the underlying hedged transaction ceases to exist or if the hedge becomes ineffective, all changes in fair value of the related derivatives that have not been settled are recognized in current earnings. For a derivative that is not designated as or does not qualify as a hedge, changes in fair value are reported in earnings immediately.
Gains and losses on net investment hedges are included in AOCI as a separate component of equity in the Consolidated Balance Sheets.
We use derivative instruments for the purpose of hedging interest rate and currency exposures, which exist as part of ongoing business operations. We do not hold or issue derivative financial instruments for trading or speculative purposes. All other contracts that contain provisions meeting the definition of a derivative also meet the requirements of and have been designated as, normal purchases or sales. Our policy is not to enter into contracts with terms that cannot be designated as normal purchases or sales. From time to time, we may enter into short duration foreign currency contracts to hedge foreign currency risks.
50
Pentair plc and Subsidiaries
Notes to consolidated financial statements
Fair value measurements
Fair value is defined as the price that would be received to sell an asset or paid to transfer a liability in an orderly transaction between market participants at the measurement date. Assets and liabilities measured at fair value are classified using the following hierarchy, which is based upon the transparency of inputs to the valuation as of the measurement date:
Level 1:
Valuation is based on observable inputs such as quoted market prices (unadjusted) for identical assets or liabilities in active markets.
Level 2:
Valuation is based on inputs such as quoted market prices for similar assets or liabilities in active markets or other inputs that are observable for the asset or liability, either directly or indirectly, for substantially the full term of the financial instrument.
Level 3:
Valuation is based upon other unobservable inputs that are significant to the fair value measurement.
In making fair value measurements, observable market data must be used when available. When inputs used to measure fair value fall within different levels of the hierarchy, the level within which the fair value measurement is categorized is based on the lowest level input that is significant to the fair value measurement.
Foreign currency translation
The financial statements of subsidiaries located outside of the U.S. are generally measured using the local currency as the functional currency, except for certain corporate entities outside of the U.S. which are measured using USD. Assets and liabilities of these subsidiaries are translated at the rates of exchange at the balance sheet date. Income and expense items are translated at average monthly rates of exchange. The resultant translation adjustments are included in AOCI, a separate component of equity.
New accounting standards
In March 2017, the Financial Accounting Standards Board ("FASB") issued a new accounting standard which requires the presentation of all components of net periodic benefit cost other than service costs outside of operating income. Only the service cost component will be included in operating income and eligible for capitalization in assets. The new guidance related to the presentation of the components of net periodic benefit cost within the Consolidated Statement of Operations will be applied retrospectively. The new guidance limiting the capitalization of net periodic benefit cost in assets to the service cost component will be applied prospectively. The new standard is effective for fiscal years beginning after December 15, 2017, and interim periods within that reporting period. We adopted this standard on January 1, 2018. As a result of adoption,
$10.7 million
and
$13.3 million
of pension and post-retirement expense and $
12.7 million
of pension and post-retirement benefit will be reclassified out of operating income for the years ended December 31, 2017, 2016 and 2015, respectively.
In March 2016, the FASB issued a new accounting standard for share-based payments. The guidance simplifies several aspects of the accounting for employee share-based payment transactions, including the accounting for income taxes, forfeitures, and statutory tax withholding requirements, as well as classification of excess tax benefits in the Consolidated Statements of Cash Flows. We adopted the new standard in the first quarter of 2017. The impact of the adoption resulted in the following:
|
•
|
All excess tax benefits and deficiencies arising from employee share-based payment awards, and dividends on those awards, will be recognized within income taxes in the period in which they occur rather than within additional paid-in-capital. Our adoption of this requirement under the new standard had no material impact for the year ended December 31, 2017.
|
|
•
|
The Company no longer presents excess tax benefits within cash flows from financing activities in the Consolidated Statements of Cash Flows; instead these are now reflected within cash flows from operating activities. The Company elected to apply this change prospectively.
|
|
•
|
The Company elected not to change its policy on accounting for forfeitures and continues to estimate the total number of awards for which the requisite service period will not be rendered.
|
|
•
|
The Company excluded the excess tax benefits from the assumed proceeds available to repurchase shares in the computation of our diluted earnings per share for the year ended December 31, 2017. This increased diluted weighted average common shares outstanding by less than
300,000
shares for the year ended December 31, 2017.
|
In February 2016, the FASB issued new accounting requirements regarding accounting for leases, which require an entity to recognize both assets and liabilities arising from financing and operating leases, along with additional qualitative and quantitative disclosures. The new requirements are effective for annual reporting periods beginning after December 15, 2018, including interim periods within that reporting period, and early adoption is permitted. We have not yet determined the potential effects on our financial condition or results of operations.
51
Pentair plc and Subsidiaries
Notes to consolidated financial statements
In May 2014, the FASB issued new accounting requirements for the recognition of revenue from contracts with customers. The new rules require entities to recognize revenue when they transfer control of promised goods or services in an amount that reflects the consideration to which the entity expects to be entitled to in exchange for those goods or services. The new requirements also include additional disclosure about the nature, amount, timing and uncertainty of revenue and cash flows arising from customer contracts, including significant judgments and changes in judgments and assets recognized from costs incurred to obtain or fulfill a contract. The requirements are effective for annual reporting periods beginning after December 15, 2017, including interim periods within that reporting period. We adopted the new revenue guidance as of January 1, 2018, using the modified retrospective transition method of adoption applied to those contracts which were not completed as of that date. An adjustment will be recorded to our 2018 beginning retained earnings for the cumulative effect of the change. In preparation for adoption of the new guidance, we have implemented appropriate changes to our business processes, systems and controls to support preparation of financial information and have reached conclusions on key accounting assessments related to the standard. As a result of these assessments, the adoption of the new standard will not have a material impact on our consolidated financial statements, including the presentation of revenues in our consolidated statements of operations.
|
2.
|
Acquisitions
|
Material acquisition
On September 18, 2015, we acquired, as part of Electrical, all of the outstanding shares of capital stock of ERICO Global Company ("ERICO") for approximately
$1.8 billion
of cash (the "ERICO Acquisition"). ERICO is a leading global manufacturer and marketer of engineered electrical and fastening products for electrical, mechanical and civil applications. ERICO has employees in 30 countries across the world with recognized brands including CADDY fixing, fastening and support products and ERICO electrical grounding, bonding and connectivity products.
The purchase price has been allocated based on the fair value of assets acquired and liabilities assumed at the date of the ERICO Acquisition. The purchase price allocation was completed in the third quarter of 2016.
The following table summarizes our estimates of the fair values of the assets acquired and liabilities assumed in the ERICO Acquisition as previously reported at December 31, 2015 and as revised for adjustments made during 2016:
|
In millions
|
As Originally Reported
|
As Revised
|
||||
|
Cash
|
$
|
11.8
|
|
$
|
11.8
|
|
|
Accounts receivable
|
75.9
|
|
75.9
|
|
||
|
Inventories
|
102.4
|
|
101.8
|
|
||
|
Other current assets
|
2.9
|
|
2.8
|
|
||
|
Property, plant and equipment
|
53.4
|
|
53.1
|
|
||
|
Identifiable intangible assets
|
1,033.8
|
|
1,033.8
|
|
||
|
Goodwill
|
1,061.9
|
|
1,031.0
|
|
||
|
Current liabilities
|
(97.2
|
)
|
(94.7
|
)
|
||
|
Deferred income taxes, including current
|
(418.8
|
)
|
(382.3
|
)
|
||
|
Other liabilities
|
(8.0
|
)
|
(15.1
|
)
|
||
|
Purchase price
|
$
|
1,818.1
|
|
$
|
1,818.1
|
|
The excess of purchase price over tangible net assets and identified intangible assets acquired was allocated to goodwill in the amount of
$1,031.0 million
, none of which is deductible for income tax purposes. Identifiable intangible assets acquired as part of the ERICO Acquisition included
$228.4 million
of indefinite-lived trade name intangible assets and
$805.4 million
of definite-lived customer relationships with an estimated useful life of
21
years.
52
Pentair plc and Subsidiaries
Notes to consolidated financial statements
The following unaudited pro forma consolidated condensed financial results of operations for the year ended December 31, 2015 is presented as if the ERICO Acquisition was consummated on January 1, 2015, the beginning of the comparable prior annual reporting period:
|
Year ended December 31
|
|||
|
In millions, except share and per-share data
|
2015
|
||
|
Pro forma net sales
|
$
|
5,002.6
|
|
|
Pro forma net income from continuing operations
|
460.4
|
|
|
|
Pro forma earnings per ordinary share - continuing operations
|
|||
|
Basic
|
$
|
2.55
|
|
|
Diluted
|
2.52
|
|
|
The unaudited pro forma net income from continuing operations for the year ended
December 31, 2015
excludes the impact of
$24.6 million
of non-recurring transaction related and bridge financing costs.
The pro forma condensed consolidated financial information has been prepared for comparative purposes only and includes certain adjustments, as noted above. The adjustments are estimates based on currently available information and actual amounts may differ materially from these estimates. They do not reflect the effect of costs or synergies that would have been expected to result from the integration of the ERICO Acquisition. The pro forma information does not purport to be indicative of the results of operations that actually would have resulted had the ERICO Acquisition occurred on January 1, 2015.
Other acquisitions
During
2017
, we completed acquisitions with purchase prices totaling
$59.5 million
in cash, net of cash acquired. Identifiable intangible assets acquired included
$19.1 million
of definite-lived customer relationships with an estimated useful life of
11
years.
In November 2016, we completed an acquisition as part of Water with a purchase price of
$25.0 million
in cash, net of cash acquired.
In April 2015, we acquired, as part of Electrical, all of the outstanding shares of capital stock of Nuheat Industries Limited ("Nuheat") for
$96.0 million
in cash (
120.5 million
Canadian dollars translated at the April 2, 2015 exchange rate), net of cash acquired. In November 2015, cash of
$0.9 million
(
1.2 million
Canadian dollars translated at the average monthly exchange rate) was paid to Nuheat in settlement of a working capital adjustment. Based in Canada, Nuheat is a leading manufacturer of electric floor heating systems that are distributed across North America. Total goodwill recorded as part of the purchase allocation was
$43.2 million
, none of which is tax deductible. Definite-lived intangible assets acquired consisted of customer relationships of
$53.3 million
, with an estimated useful life of
17 years
.
The pro forma impact of these acquisitions was not material.
|
3.
|
Discontinued Operations
|
On April 28, 2017 we completed the sale of the Valves & Controls business to Emerson Electric Co. for
$3.15 billion
in cash. The sale resulted in a gain of
$181.1 million
, net of tax.
The results of the Valves & Controls business have been presented as discontinued operations and the related assets and liabilities have been reclassified as held for sale for all periods presented. The Valves & Controls business was previously disclosed as a stand-alone reporting segment. Transaction costs of
$56.4 million
related to the sale of Valves & Controls were incurred during the
year ended
December 31, 2017
and were recorded within
Gain (loss) from sale/impairment of discontinued operations before income taxes
presented below.
53
Pentair plc and Subsidiaries
Notes to consolidated financial statements
During 2015, we sold the remainder of our Water Transport business, of which a portion was sold in 2014, and received cash proceeds of
$59.0 million
. The results of the Water Transport business have been presented as discontinued operations.
Operating results of discontinued operations are summarized below:
|
Years ended December 31
|
|||||||||
|
In millions
|
2017
|
2016
|
2015
|
||||||
|
Net sales
|
$
|
450.3
|
|
$
|
1,639.4
|
|
$
|
1,858.6
|
|
|
Cost of goods sold
|
339.7
|
|
1,177.1
|
|
1,271.2
|
|
|||
|
Gross profit
|
110.6
|
|
462.3
|
|
587.4
|
|
|||
|
Selling, general and administrative
|
103.3
|
|
367.6
|
|
457.8
|
|
|||
|
Research and development
|
5.7
|
|
18.2
|
|
21.2
|
|
|||
|
Impairment of goodwill and trade names
|
—
|
|
—
|
|
554.7
|
|
|||
|
Operating Income (loss)
|
$
|
1.6
|
|
$
|
76.5
|
|
$
|
(446.3
|
)
|
|
Income (loss) from discontinued operations before income taxes
|
$
|
2.4
|
|
$
|
77.2
|
|
$
|
(445.5
|
)
|
|
Provision for income taxes
|
(3.0
|
)
|
7.2
|
|
21.3
|
|
|||
|
Income (loss) from discontinued operations, net of tax
|
$
|
5.4
|
|
$
|
70.0
|
|
$
|
(466.8
|
)
|
|
Gain (loss) from sale / impairment of discontinued operations before income taxes
|
$
|
183.5
|
|
$
|
0.6
|
|
$
|
(6.7
|
)
|
|
Provision for income taxes
|
2.4
|
|
—
|
|
—
|
|
|||
|
Gain (loss) from sale / impairment of discontinued operations, net of tax
|
$
|
181.1
|
|
$
|
0.6
|
|
$
|
(6.7
|
)
|
The carrying amounts of major classes of assets and liabilities that were classified as held for sale on the Consolidated Balance Sheets were as follows:
|
December 31
|
||||||
|
In millions
|
2017
|
2016
|
||||
|
Accounts and notes receivable, net
|
$
|
—
|
|
$
|
365.4
|
|
|
Inventories
|
—
|
|
491.5
|
|
||
|
Other current assets
|
—
|
|
35.0
|
|
||
|
Current assets held for sale
|
$
|
—
|
|
$
|
891.9
|
|
|
Property, plant and equipment, net
|
$
|
—
|
|
$
|
361.5
|
|
|
Goodwill
|
—
|
|
996.4
|
|
||
|
Intangibles, net
|
—
|
|
703.5
|
|
||
|
Asbestos-related insurance receivable
|
—
|
|
108.5
|
|
||
|
Other non-current assets
|
—
|
|
123.0
|
|
||
|
Non-current assets held for sale
|
$
|
—
|
|
$
|
2,292.9
|
|
|
Accounts payable
|
$
|
—
|
|
$
|
151.4
|
|
|
Employee compensation and benefits
|
—
|
|
61.5
|
|
||
|
Other current liabilities
|
—
|
|
143.3
|
|
||
|
Current liabilities held for sale
|
$
|
—
|
|
$
|
356.2
|
|
|
Pension and other post-retirement compensation and benefits
|
$
|
—
|
|
$
|
32.2
|
|
|
Deferred tax liabilities
|
—
|
|
162.8
|
|
||
|
Asbestos-related liabilities
|
—
|
|
228.3
|
|
||
|
Other non-current liabilities
|
—
|
|
82.6
|
|
||
|
Non-current liabilities held for sale
|
$
|
—
|
|
$
|
505.9
|
|
54
Pentair plc and Subsidiaries
Notes to consolidated financial statements
|
4.
|
Earnings (Loss) Per Share
|
Basic and diluted earnings (loss) per share were calculated as follows:
|
|
Years ended December 31
|
||||||||
|
In millions, except per share data
|
2017
|
2016
|
2015
|
||||||
|
Net income (loss)
|
$
|
666.5
|
|
$
|
522.2
|
|
$
|
(76.4
|
)
|
|
Net income from continuing operations
|
$
|
480.0
|
|
$
|
451.6
|
|
$
|
397.1
|
|
|
Weighted average ordinary shares outstanding
|
|||||||||
|
Basic
|
181.7
|
|
181.3
|
|
180.3
|
|
|||
|
Dilutive impact of stock options and restricted stock awards
|
2.0
|
|
1.8
|
|
2.3
|
|
|||
|
Diluted
|
183.7
|
|
183.1
|
|
182.6
|
|
|||
|
Earnings (loss) per ordinary share
|
|||||||||
|
Basic
|
|||||||||
|
Continuing operations
|
$
|
2.64
|
|
$
|
2.49
|
|
$
|
2.20
|
|
|
Discontinued operations
|
1.03
|
|
0.39
|
|
(2.62
|
)
|
|||
|
Basic earnings (loss) per ordinary share
|
$
|
3.67
|
|
$
|
2.88
|
|
$
|
(0.42
|
)
|
|
Diluted
|
|||||||||
|
Continuing operations
|
$
|
2.61
|
|
$
|
2.47
|
|
$
|
2.17
|
|
|
Discontinued operations
|
1.02
|
|
0.38
|
|
(2.59
|
)
|
|||
|
Diluted earnings (loss) per ordinary share
|
$
|
3.63
|
|
$
|
2.85
|
|
$
|
(0.42
|
)
|
|
Anti-dilutive stock options excluded from the calculation of diluted earnings per share
|
1.8
|
|
1.2
|
|
1.3
|
|
|||
|
5.
|
Restructuring
|
During
2017
,
2016
and
2015
, we initiated and continued execution of certain business restructuring initiatives aimed at reducing our fixed cost structure and realigning our business, specifically in 2017 as part of the contemplation of the Proposed Separation. The
2017
initiatives included a reduction in hourly and salaried headcount of approximately
500
employees, which included
250
in Water and
250
in Electrical. The
2016
initiatives included the reduction in hourly and salaried headcount of approximately
650
employees, which included
300
in Water and
350
in Electrical. The
2015
initiatives included the reduction in hourly and salaried headcount of approximately
500
employees, which included
300
in Water and
200
in Electrical.
Restructuring related costs included in
Selling, general and administrative
expenses in the Consolidated Statements of Operations and Comprehensive Income (Loss) included costs for severance and other restructuring costs as follows:
|
|
Years ended December 31
|
||||||||
|
In millions
|
2017
|
2016
|
2015
|
||||||
|
Severance and related costs
|
$
|
57.1
|
|
$
|
24.5
|
|
$
|
34.5
|
|
|
Other
|
1.6
|
|
—
|
|
6.8
|
|
|||
|
Total restructuring costs
|
$
|
58.7
|
|
$
|
24.5
|
|
$
|
41.3
|
|
Other restructuring costs primarily consist of asset impairment and various contract termination costs.
Restructuring costs by reportable segment were as follows:
|
Years ended December 31
|
|||||||||
|
In millions
|
2017
|
2016
|
2015
|
||||||
|
Water
|
$
|
23.6
|
|
$
|
10.5
|
|
$
|
17.4
|
|
|
Electrical
|
16.8
|
|
12.3
|
|
15.7
|
|
|||
|
Other
|
18.3
|
|
1.7
|
|
8.2
|
|
|||
|
Consolidated
|
$
|
58.7
|
|
$
|
24.5
|
|
$
|
41.3
|
|
55
Pentair plc and Subsidiaries
Notes to consolidated financial statements
Activity related to accrued severance and related costs recorded in
Other current liabilities
in the Consolidated Balance Sheets is summarized as follows:
|
|
Years ended December 31
|
|||||
|
In millions
|
2017
|
2016
|
||||
|
Beginning balance
|
$
|
25.4
|
|
$
|
37.1
|
|
|
Costs incurred
|
57.1
|
|
24.5
|
|
||
|
Cash payments and other
|
(42.7
|
)
|
(36.2
|
)
|
||
|
Ending balance
|
$
|
39.8
|
|
$
|
25.4
|
|
|
6.
|
Goodwill and Other Identifiable Intangible Assets
|
The changes in the carrying amount of goodwill for the years ended
December 31, 2017
and
2016
by reportable segment were as follows:
|
In millions
|
December 31, 2016
|
Acquisitions/
divestitures |
Foreign currency
translation/other |
December 31, 2017
|
||||||||
|
Water
|
$
|
1,994.6
|
|
$
|
27.3
|
|
$
|
91.0
|
|
$
|
2,112.9
|
|
|
Electrical
|
2,222.8
|
|
5.3
|
|
10.1
|
|
2,238.2
|
|
||||
|
Total goodwill
|
$
|
4,217.4
|
|
$
|
32.6
|
|
$
|
101.1
|
|
$
|
4,351.1
|
|
|
In millions
|
December 31, 2015
|
Acquisitions/
divestitures |
Purchase accounting adjustments
|
Foreign currency
translation/other |
December 31, 2016
|
||||||||||
|
Water
|
$
|
2,003.8
|
|
$
|
20.8
|
|
$
|
—
|
|
$
|
(30.0
|
)
|
$
|
1,994.6
|
|
|
Electrical
|
2,255.2
|
|
—
|
|
(30.9
|
)
|
(1.5
|
)
|
2,222.8
|
|
|||||
|
Total goodwill
|
$
|
4,259.0
|
|
$
|
20.8
|
|
$
|
(30.9
|
)
|
$
|
(31.5
|
)
|
$
|
4,217.4
|
|
Accumulated goodwill impairment losses were
$200.5 million
as of
December 31, 2017
and
2016
.
Identifiable intangible assets consisted of the following at December 31:
|
|
2017
|
2016
|
|||||||||||||||||
|
In millions
|
Cost
|
Accumulated
amortization
|
Net
|
Cost
|
Accumulated
amortization
|
Net
|
|||||||||||||
|
Definite-life intangibles
|
|||||||||||||||||||
|
Customer relationships
|
$
|
1,513.9
|
|
$
|
(437.5
|
)
|
$
|
1,076.4
|
|
$
|
1,478.0
|
|
$
|
(346.7
|
)
|
$
|
1,131.3
|
|
|
|
Trade names
|
1.5
|
|
(1.4
|
)
|
0.1
|
|
1.8
|
|
(1.4
|
)
|
0.4
|
|
|||||||
|
Proprietary technology and patents
|
131.9
|
|
(94.2
|
)
|
37.7
|
|
141.3
|
|
(100.3
|
)
|
41.0
|
|
|||||||
|
Total finite-life intangibles
|
1,647.3
|
|
(533.1
|
)
|
1,114.2
|
|
1,621.1
|
|
(448.4
|
)
|
1,172.7
|
|
|||||||
|
Indefinite-life intangibles
|
|||||||||||||||||||
|
Trade names
|
444.2
|
|
—
|
|
444.2
|
|
459.1
|
|
—
|
|
459.1
|
|
|||||||
|
Total intangibles
|
$
|
2,091.5
|
|
$
|
(533.1
|
)
|
$
|
1,558.4
|
|
$
|
2,080.2
|
|
$
|
(448.4
|
)
|
$
|
1,631.8
|
|
|
Identifiable intangible asset amortization expense in
2017
,
2016
and
2015
was
$97.7 million
,
$96.4 million
and
$68.1 million
, respectively.
In
2017
, we recorded an impairment charge for trade name intangible assets of
$25.2 million
in Water and Electrical. In
2016
, we recorded an impairment charge for trade name intangible assets of
$13.3 million
in Electrical.
Estimated future amortization expense for identifiable intangible assets during the next five years is as follows:
|
In millions
|
2018
|
2019
|
2020
|
2021
|
2022
|
||||||||||
|
Estimated amortization expense
|
$
|
96.3
|
|
$
|
89.2
|
|
$
|
84.0
|
|
$
|
77.5
|
|
$
|
70.0
|
|
56
Pentair plc and Subsidiaries
Notes to consolidated financial statements
|
7.
|
Supplemental Balance Sheet Information
|
|
|
December 31
|
|||||
|
In millions
|
2017
|
2016
|
||||
|
Inventories
|
||||||
|
Raw materials and supplies
|
$
|
255.1
|
|
$
|
223.5
|
|
|
Work-in-process
|
83.0
|
|
67.3
|
|
||
|
Finished goods
|
242.9
|
|
233.4
|
|
||
|
Total inventories
|
$
|
581.0
|
|
$
|
524.2
|
|
|
Other current assets
|
||||||
|
Cost in excess of billings
|
$
|
121.4
|
|
$
|
107.7
|
|
|
Prepaid expenses
|
80.7
|
|
68.7
|
|
||
|
Prepaid income taxes
|
15.3
|
|
67.2
|
|
||
|
Other current assets
|
5.5
|
|
9.8
|
|
||
|
Total other current assets
|
$
|
222.9
|
|
$
|
253.4
|
|
|
Property, plant and equipment, net
|
||||||
|
Land and land improvements
|
$
|
72.6
|
|
$
|
66.2
|
|
|
Buildings and leasehold improvements
|
354.5
|
|
335.0
|
|
||
|
Machinery and equipment
|
1,011.6
|
|
932.5
|
|
||
|
Construction in progress
|
35.1
|
|
68.6
|
|
||
|
Total property, plant and equipment
|
1,473.8
|
|
1,402.3
|
|
||
|
Accumulated depreciation and amortization
|
928.3
|
|
863.7
|
|
||
|
Total property, plant and equipment, net
|
$
|
545.5
|
|
$
|
538.6
|
|
|
Other non-current assets
|
||||||
|
Prepaid income taxes
|
$
|
254.3
|
|
$
|
—
|
|
|
Deferred income taxes
|
43.0
|
|
39.0
|
|
||
|
Deferred compensation plan assets
|
49.4
|
|
47.9
|
|
||
|
Other non-current assets
|
83.2
|
|
95.2
|
|
||
|
Total other non-current assets
|
$
|
429.9
|
|
$
|
182.1
|
|
|
Other current liabilities
|
||||||
|
Dividends payable
|
$
|
63.1
|
|
$
|
61.8
|
|
|
Accrued warranty
|
41.0
|
|
38.9
|
|
||
|
Accrued rebates
|
92.7
|
|
78.2
|
|
||
|
Billings in excess of cost
|
29.9
|
|
22.5
|
|
||
|
Income taxes payable
|
31.1
|
|
87.3
|
|
||
|
Accrued restructuring
|
39.8
|
|
25.4
|
|
||
|
Other current liabilities
|
219.5
|
|
197.4
|
|
||
|
Total other current liabilities
|
$
|
517.1
|
|
$
|
511.5
|
|
|
Other non-current liabilities
|
||||||
|
Income taxes payable
|
$
|
92.7
|
|
$
|
36.1
|
|
|
Self-insurance liabilities
|
48.3
|
|
49.8
|
|
||
|
Deferred compensation plan liabilities
|
49.4
|
|
47.9
|
|
||
|
Foreign currency contract liabilities
|
47.2
|
|
5.4
|
|
||
|
Other non-current liabilities
|
37.8
|
|
22.8
|
|
||
|
Total other non-current liabilities
|
$
|
275.4
|
|
$
|
162.0
|
|
57
Pentair plc and Subsidiaries
Notes to consolidated financial statements
|
8.
|
Supplemental Cash Flow Information
|
|
|
Years ended December 31
|
||||||||
|
In millions
|
2017
|
2016
|
2015
|
||||||
|
Cash paid for interest, net
|
$
|
107.2
|
|
$
|
143.4
|
|
$
|
76.9
|
|
|
Cash paid for income taxes, net
|
362.1
|
|
145.1
|
|
182.8
|
|
|||
|
9.
|
Accumulated Other Comprehensive Income (Loss)
|
Components of AOCI consist of the following:
|
|
December 31
|
|||||
|
In millions
|
2017
|
2016
|
||||
|
Cumulative translation adjustments
|
$
|
(221.4
|
)
|
$
|
(718.9
|
)
|
|
Change in market value of derivative financial instruments, net of tax
|
(22.0
|
)
|
(17.4
|
)
|
||
|
Accumulated other comprehensive loss
|
$
|
(243.4
|
)
|
$
|
(736.3
|
)
|
|
10.
|
Debt
|
Debt and the average interest rates on debt outstanding were as follows:
|
In millions
|
Average
interest rate at |
Maturity
year
|
December 31
|
|||||
|
December 31, 2017
|
2017
|
2016
|
||||||
|
Commercial paper
|
2.340%
|
2019
|
$
|
34.0
|
|
$
|
398.7
|
|
|
Revolving credit facilities
|
3.064%
|
2019
|
28.4
|
|
576.8
|
|
||
|
Senior notes - fixed rate
(1)
|
1.875%
|
2017
|
—
|
|
350.0
|
|
||
|
Senior notes - fixed rate
(1)
|
2.900%
|
2018
|
255.3
|
|
500.0
|
|
||
|
Senior notes - fixed rate
(1)
|
2.650%
|
2019
|
250.0
|
|
250.0
|
|
||
|
Senior notes - fixed rate - Euro
(1)
|
2.450%
|
2019
|
594.4
|
|
520.7
|
|
||
|
Senior notes - fixed rate
(1)
|
3.625%
|
2020
|
74.0
|
|
400.0
|
|
||
|
Senior notes - fixed rate
(1)
|
5.000%
|
2021
|
103.8
|
|
500.0
|
|
||
|
Senior notes - fixed rate
(1)
|
3.150%
|
2022
|
88.3
|
|
550.0
|
|
||
|
Senior notes - fixed rate
(1)
|
4.650%
|
2025
|
19.3
|
|
250.0
|
|
||
|
Other
|
N/A
|
N/A
|
—
|
|
0.8
|
|
||
|
Unamortized issuance costs and discounts
|
N/A
|
N/A
|
(6.8
|
)
|
(17.8
|
)
|
||
|
Total debt
|
1,440.7
|
|
4,279.2
|
|
||||
|
Less: Current maturities and short-term borrowings
|
—
|
|
(0.8
|
)
|
||||
|
Long-term debt
|
$
|
1,440.7
|
|
$
|
4,278.4
|
|
||
|
(1)
Senior notes guaranteed as to payment by Pentair plc and PISG ("the Notes")
|
||||||||
In October 2014, Pentair plc, Pentair Investments Switzerland GmbH ("PISG"), Pentair Finance S.à r.l. ("PFSA") and Pentair, Inc. entered into an amended and restated credit agreement (the "Credit Facility"), with Pentair plc and PISG as guarantors and PFSA and Pentair, Inc. as borrowers. The Credit Facility had a maximum aggregate availability of
$2,100.0 million
and a maturity date of October 3, 2019. Borrowings under the Credit Facility generally bear interest at a variable rate equal to the London Interbank Offered Rate ("LIBOR") plus a specified margin based upon PFSA's credit ratings. PFSA must pay a facility fee ranging from
9.0
to
25.0
basis points per annum (based upon PFSA's credit ratings) on the amount of each lender's commitment and letter of credit fee for each letter of credit issued and outstanding under the Credit Facility.
In August 2015, Pentair plc, PISG and PFSA entered into a First Amendment to the Credit Facility (the "First Amendment"), which, among other things, increased the Leverage Ratio (as defined below). In September 2015, Pentair plc, PISG and PFSA entered into a Second Amendment to the Credit Facility (the "Second Amendment"), which, among other things, increased the maximum aggregate availability to
$2,500.0 million
. Additionally, in September 2016, Pentair plc, PISG and PFSA entered into
58
Pentair plc and Subsidiaries
Notes to consolidated financial statements
a Third Amendment to the Credit Facility (the "Third Amendment," and collectively with the First Amendment and Second Amendment, the "Amendments"), which, among other things, increased the Leverage Ratio to the amounts specified below, and amended the definition of EBITDA to include earnings from discontinued operations subject to a sale agreement until such disposition actually occurs.
In May 2017, we repurchased aggregate principal of certain series of outstanding notes totaling
$1,659.3 million
. All costs associated with the repurchases were recorded as
Loss on early extinguishment of debt,
including
$6.5 million
of unamortized deferred financing costs.
PFSA is authorized to sell short-term commercial paper notes to the extent availability exists under the Credit Facility. PFSA uses the Credit Facility as back-up liquidity to support 100% of commercial paper outstanding. As of
December 31, 2017
and
2016
, we had
$34.0 million
and
$398.7 million
, respectively, of commercial paper outstanding, all of which was classified as long-term as we have the intent and ability to refinance such obligations on a long-term basis under the Credit Facility.
Our debt agreements contain certain financial covenants, the most restrictive of which are in the Credit Facility (as updated for the Amendments), including that we may not permit (i) the ratio of our consolidated debt plus synthetic lease obligations to our consolidated net income (excluding, among other things, non-cash gains and losses) before interest, taxes, depreciation, amortization, non-cash share-based compensation expense, up to a lifetime maximum
$25.0 million
of costs, fees and expenses incurred in connection with certain acquisitions, investments, dispositions and the issuance, repayment or refinancing of debt, ("EBITDA") for the four consecutive fiscal quarters then ended (the "Leverage Ratio") to exceed
3.50
to
1.00
as of the last day of the period of four consecutive fiscal quarters and (ii) the ratio of our EBITDA for the four consecutive fiscal quarters then ended to our consolidated interest expense, including consolidated yield or discount accrued as to outstanding securitization obligations (if any), for the same period to be less than
3.00
to
1.00
as of the end of each fiscal quarter. For purposes of the Leverage Ratio, the Credit Facility provides for the calculation of EBITDA giving pro forma effect to certain acquisitions, divestitures and liquidations during the period to which such calculation relates. As of
December 31, 2017
,
we were in compliance with all financial covenants in our debt agreements.
Total availability under the Credit Facility was
$2,437.6 million
as of
December 31, 2017
, which was limited to
$1,897.5 million
by the Leverage Ratio in the Credit Facility's credit agreement.
In addition to the Credit Facility, we have various other credit facilities with an aggregate availability of
$30.0 million
, of which there were
no
outstanding borrowings at
December 31, 2017
. Borrowings under these credit facilities bear interest at variable rates.
We have
$255.3 million
of fixed rate senior notes maturing in September
2018
. We classified this debt as long-term as of
December 31, 2017
as we have the intent and ability to refinance such obligation on a long-term basis under the Credit Facility.
Debt outstanding, excluding unamortized issuance costs and discounts
,
at
December 31, 2017
matures on a calendar year basis as follows:
|
In millions
|
2018
|
2019
|
2020
|
2021
|
2022
|
Thereafter
|
Total
|
||||||||||||||
|
Contractual debt obligation maturities
|
$
|
—
|
|
$
|
1,162.1
|
|
$
|
74.0
|
|
$
|
103.8
|
|
$
|
88.3
|
|
$
|
19.3
|
|
$
|
1,447.5
|
|
|
11.
|
Derivatives and Financial Instruments
|
Derivative financial instruments
We are exposed to market risk related to changes in foreign currency exchange rates. To manage the volatility related to this exposure, we periodically enter into a variety of derivative financial instruments. Our objective is to reduce, where it is deemed appropriate to do so, fluctuations in earnings and cash flows associated with changes in foreign currency rates. The derivative contracts contain credit risk to the extent that our bank counterparties may be unable to meet the terms of the agreements. The amount of such credit risk is generally limited to the unrealized gains, if any, in such contracts. Such risk is minimized by limiting those counterparties to major financial institutions of high credit quality.
Foreign currency contracts
We conduct business in various locations throughout the world and are subject to market risk due to changes in the value of foreign currencies in relation to our reporting currency, the U.S. dollar. We manage our economic and transaction exposure to certain market-based risks through the use of foreign currency derivative financial instruments. Our objective in holding these derivatives is to reduce the volatility of net earnings and cash flows associated with changes in foreign currency exchange rates. The majority of our foreign currency contracts have an original maturity date of less than one year. The derivative contracts contain credit risk to the extent that our bank counterparties may be unable to meet the terms of the agreements. The amount of
59
Pentair plc and Subsidiaries
Notes to consolidated financial statements
such credit risk is generally limited to the unrealized gains, if any, in such contracts. Such risk is minimized by limiting those counterparties to major financial institutions of high credit quality.
At
December 31, 2017
and
2016
, we had outstanding foreign currency derivative contracts with gross notional U.S. dollar equivalent amounts of
$481.4 million
and
$475.6 million
, respectively. The impact of these contracts on the Consolidated Statements of Operations and Comprehensive Income (Loss) was not material for any period presented.
Gains or losses on foreign currency contracts designated as hedges are reclassified out of AOCI and into
Selling, general and administrative expense
in the Consolidated Statements of Operations and Comprehensive Income (Loss) when the hedged item affects earnings. Such reclassifications during
2017
,
2016
and
2015
were not material.
Net investment hedge
We have net investments in foreign subsidiaries that are subject to changes in the foreign currency exchange rate. In September 2015,
we designated the €500 million 2.45% Senior Notes due 2019 (the "2019 Euro Notes") as a net investment hedge for a portion of our net investment in our Euro denominated subsidiaries
. The gains/losses on the 2019 Euro Notes have been included as a component of the cumulative translation adjustment account within AOCI. As of
December 31, 2017
and
2016
, we had a deferred foreign currency loss of
$29.6 million
and a gain of
$44.2 million
, respectively, in AOCI associated with the net investment hedge activity.
Fair value measurements
Fair value is defined as the price that would be received to sell an asset or paid to transfer a liability in an orderly transaction between market participants at the measurement date. Assets and liabilities measured at fair value are classified using the following hierarchy, which is based upon the transparency of inputs to the valuation as of the measurement date:
|
Level 1:
|
Valuation is based on observable inputs such as quoted market prices (unadjusted) for identical assets or liabilities in active markets.
|
|
|
Level 2:
|
Valuation is based on inputs such as quoted market prices for similar assets or liabilities in active markets or other inputs that are observable for the asset or liability, either directly or indirectly, for substantially the full term of the financial instrument.
|
|
|
Level 3:
|
Valuation is based upon other unobservable inputs that are significant to the fair value measurement.
|
|
In making fair value measurements, observable market data must be used when available. When inputs used to measure fair value fall within different levels of the hierarchy, the level within which the fair value measurement is categorized is based on the lowest level input that is significant to the fair value measurement.
Fair value of financial instruments
The following methods were used to estimate the fair values of each class of financial instrument:
|
•
|
short-term financial instruments (cash and cash equivalents, accounts and notes receivable, accounts and notes payable and variable-rate debt) — recorded amount approximates fair value because of the short maturity period;
|
|
•
|
long-term fixed-rate debt, including current maturities — fair value is based on market quotes available for issuance of debt with similar terms, which are inputs that are classified as Level 2 in the valuation hierarchy defined by the accounting guidance;
|
|
•
|
foreign currency contract agreements — fair values are determined through the use of models that consider various assumptions, including time value, yield curves, as well as other relevant economic measures, which are inputs that are classified as Level 2 in the valuation hierarchy defined by the accounting guidance; and
|
|
•
|
deferred compensation plan assets (mutual funds, common/collective trusts and cash equivalents for payment of certain non-qualified benefits for retired, terminated and active employees) — fair value of mutual funds and cash equivalents are based on quoted market prices in active markets that are classified as Level 1 in the valuation hierarchy defined by the accounting guidance; fair value of common/collective trusts are based on observable inputs that are classified as Level 2 in the valuation hierarchy defined by the accounting guidance.
|
60
Pentair plc and Subsidiaries
Notes to consolidated financial statements
The recorded amounts and estimated fair values of total debt, excluding unamortized issuance costs and discounts
,
at December 31 were as follows:
|
|
2017
|
2016
|
|||||||||||
|
In millions
|
Recorded
Amount |
Fair Value
|
Recorded
Amount |
Fair Value
|
|||||||||
|
Variable rate debt
|
$
|
62.4
|
|
$
|
62.4
|
|
$
|
976.3
|
|
$
|
976.3
|
|
|
|
Fixed rate debt
|
1,385.1
|
|
1,424.0
|
|
3,320.7
|
|
3,427.1
|
|
|||||
|
Total debt
|
$
|
1,447.5
|
|
$
|
1,486.4
|
|
$
|
4,297.0
|
|
$
|
4,403.4
|
|
|
Financial assets and liabilities measured at fair value on a recurring and nonrecurring basis were as follows:
|
Recurring fair value measurements
|
December 31, 2017
|
|||||||||||
|
In millions
|
Level 1
|
Level 2
|
Level 3
|
Total
|
||||||||
|
Foreign currency contract assets
|
$
|
—
|
|
$
|
0.6
|
|
$
|
—
|
|
$
|
0.6
|
|
|
Foreign currency contract liabilities
|
—
|
|
(47.2
|
)
|
—
|
|
(47.2
|
)
|
||||
|
Deferred compensation plan assets
|
42.8
|
|
6.6
|
|
—
|
|
49.4
|
|
||||
|
Total recurring fair value measurements
|
$
|
42.8
|
|
$
|
(40.0
|
)
|
$
|
—
|
|
$
|
2.8
|
|
|
Nonrecurring fair value measurements
(1)
|
|
|
|
|
||||||||
|
Recurring fair value measurements
|
December 31, 2016
|
|||||||||||
|
In millions
|
Level 1
|
Level 2
|
Level 3
|
Total
|
||||||||
|
Foreign currency contract assets
|
$
|
—
|
|
$
|
5.5
|
|
$
|
—
|
|
$
|
5.5
|
|
|
Foreign currency contract liabilities
|
—
|
|
(5.4
|
)
|
—
|
|
(5.4
|
)
|
||||
|
Deferred compensation plan assets
|
41.6
|
|
6.3
|
|
—
|
|
47.9
|
|
||||
|
Total recurring fair value measurements
|
$
|
41.6
|
|
$
|
6.4
|
|
$
|
—
|
|
$
|
48.0
|
|
|
Nonrecurring fair value measurements
(1)
|
|
|
|
|
||||||||
|
(1)
|
During the fourth quarter of 2017, we completed our annual intangible assets impairment review. As a result, we recorded a pre-tax non-cash impairment charge of
$25.2 million
for trade name intangibles in 2017. The impairment charge reduced the total carrying value of the impacted trade name intangibles to
$27.0 million
. During the fourth quarter of 2016, we completed our annual intangible assets impairment review. As a result, we recorded a pre-tax non-cash impairment charge of
$13.3 million
for a trade name intangible in 2016. The impairment charge reduced the carrying value of the impacted trade name intangible to
zero
. The fair value of trade names is measured using the relief-from-royalty method. This method assumes the trade name has value to the extent that the owner is relieved of the obligation to pay royalties for the benefits received from them. This method requires us to estimate the future revenue for the related brands, the appropriate royalty rate and the weighted average cost of capital.
|
|
12.
|
Income Taxes
|
Income from continuing operations before income taxes consisted of the following:
|
Years ended December 31
|
|||||||||
|
In millions
|
2017
|
2016
|
2015
|
||||||
|
Federal
(1)
|
$
|
(32.8
|
)
|
$
|
(25.6
|
)
|
$
|
(21.8
|
)
|
|
International
(2)
|
522.0
|
|
586.6
|
|
534.3
|
|
|||
|
Income from continuing operations before income taxes
|
$
|
489.2
|
|
$
|
561.0
|
|
$
|
512.5
|
|
|
(1)
|
"Federal" reflects United Kingdom ("U.K.") income from continuing operations before income taxes.
|
|
(2)
|
"International" reflects non-U.K. income from continuing operations before income taxes.
|
61
Pentair plc and Subsidiaries
Notes to consolidated financial statements
The provision for income taxes consisted of the following:
|
|
Years ended December 31
|
||||||||
|
In millions
|
2017
|
2016
|
2015
|
||||||
|
Currently payable
|
|||||||||
|
Federal
(1)
|
$
|
0.5
|
|
$
|
(0.1
|
)
|
$
|
—
|
|
|
International
(2)
|
183.8
|
|
125.6
|
|
117.7
|
|
|||
|
Total current taxes
|
184.3
|
|
125.5
|
|
117.7
|
|
|||
|
Deferred
|
|||||||||
|
Federal
(1)
|
—
|
|
(0.4
|
)
|
1.2
|
|
|||
|
International
(2)
|
(175.1
|
)
|
(15.7
|
)
|
(3.5
|
)
|
|||
|
Total deferred taxes
|
(175.1
|
)
|
(16.1
|
)
|
(2.3
|
)
|
|||
|
Total provision for income taxes
|
$
|
9.2
|
|
$
|
109.4
|
|
$
|
115.4
|
|
|
(1)
|
"Federal" represents U.K. taxes.
|
|
(2)
|
"International" represents non-U.K. taxes.
|
Reconciliations of the federal statutory income tax rate to our effective tax rate were as follows:
|
|
Years ended December 31
|
|||||
|
Percentages
|
2017
|
2016
|
2015
|
|||
|
Federal statutory income tax rate
(1)
|
19.3
|
|
20.0
|
|
20.3
|
|
|
Tax effect of international operations
(2)
|
(11.3
|
)
|
(11.8
|
)
|
(6.5
|
)
|
|
Change in valuation allowances
|
8.0
|
|
9.7
|
|
6.9
|
|
|
Withholding taxes
|
0.4
|
|
0.9
|
|
0.6
|
|
|
Interest limitations
|
0.6
|
|
0.6
|
|
0.7
|
|
|
Non-deductible transaction costs
|
0.7
|
|
0.1
|
|
0.5
|
|
|
Excess tax benefits on stock-based compensation
|
(1.7
|
)
|
—
|
|
—
|
|
|
Tax effect of U.S. tax reform
|
(17.3
|
)
|
—
|
|
—
|
|
|
Tax effect of early extinguishment of debt
|
3.2
|
|
—
|
|
—
|
|
|
Effective tax rate
|
1.9
|
|
19.5
|
|
22.5
|
|
|
(1)
|
The statutory rate for
2017
,
2016
and
2015
reflects the U.K. statutory rate of
19.3%
,
20.0%
and
20.3%
, respectively.
|
|
(2)
|
The tax effect of international operations consists of non-U.K. jurisdictions.
|
Reconciliations of the beginning and ending gross unrecognized tax benefits were as follows:
|
|
Years ended December 31
|
||||||||
|
In millions
|
2017
|
2016
|
2015
|
||||||
|
Beginning balance
|
$
|
71.1
|
|
$
|
45.6
|
|
$
|
40.3
|
|
|
Gross increases for tax positions in prior periods
|
5.3
|
|
27.4
|
|
4.7
|
|
|||
|
Gross decreases for tax positions in prior periods
|
(5.0
|
)
|
(4.8
|
)
|
(1.5
|
)
|
|||
|
Gross increases based on tax positions related to the current year
|
1.8
|
|
2.0
|
|
1.3
|
|
|||
|
Gross decreases related to settlements with taxing authorities
|
(35.7
|
)
|
(3.4
|
)
|
(1.9
|
)
|
|||
|
Reductions due to statute expiration
|
(2.2
|
)
|
(0.8
|
)
|
(1.4
|
)
|
|||
|
Gross (decreases) increases due to currency fluctuations
|
1.3
|
|
(0.2
|
)
|
(2.5
|
)
|
|||
|
Gross increases due to acquisitions
|
—
|
|
5.3
|
|
6.6
|
|
|||
|
Ending balance
|
$
|
36.6
|
|
$
|
71.1
|
|
$
|
45.6
|
|
We record gross unrecognized tax benefits in
Other current liabilities
and
Other non-current liabilities
in the Consolidated Balance Sheets. Included in the
$36.6 million
of total gross unrecognized tax benefits as of
December 31, 2017
was
$34.9 million
of tax benefits that, if recognized, would impact the effective tax rate. It is reasonably possible that the gross unrecognized tax benefits as of
December 31, 2017
may decrease by a range of
zero
to
$16.9 million
during
2018
, primarily as
62
Pentair plc and Subsidiaries
Notes to consolidated financial statements
a result of the resolution of non-U.K. examinations, including U.S. federal and state examinations, and the expiration of various statutes of limitations. The
$35.7 million
gross decrease during 2017 for settlements with taxing authorities consists primarily of a settlement with the Internal Revenue Service ("IRS") related to the value of certain intellectual property sold from the U.S. to a non-U.S. affiliate. The decrease related to settlements with taxing authorities had no impact on our effective tax rate.
Based on the outcome of these examinations, or as a result of the expiration of statute of limitations for specific jurisdictions, it is reasonably possible that certain unrecognized tax benefits for tax positions taken on previously filed tax returns will materially change from those recorded as liabilities in our financial statements. During 2017, the IRS completed their examination of the Panthro Acquisition Co. U.S. federal income tax returns for tax years ending December 31, 2012 and December 31, 2013. A number of tax periods from 2003 to present are under audit by tax authorities in various jurisdictions, including Canada, China, Germany, India, the Netherlands and New Zealand. We anticipate that several of these audits may be concluded in the foreseeable future.
We record penalties and interest related to unrecognized tax benefits in
Provision for income taxes
and
Interest expense
, respectively, in the Consolidated Statements of Operations and Comprehensive Income (Loss). As of
December 31, 2017
and
2016
, we have liabilities of
$2.3 million
and
$2.4 million
, respectively, for the possible payment of penalties and
$9.4 million
and
$11.0 million
, respectively, for the possible payment of interest expense, which are recorded in
Other current liabilities
in the Consolidated Balance Sheets.
Deferred taxes arise because of different treatment between financial statement accounting and tax accounting, known as "temporary differences." We record the tax effect of these temporary differences as "deferred tax assets" (generally items that can be used as a tax deduction or credit in future periods) and "deferred tax liabilities" (generally items for which we received a tax deduction but the tax impact has not yet been recorded in the Consolidated Statements of Operations and Comprehensive Income (Loss)).
Deferred taxes were recorded in the Consolidated Balance Sheets as follows:
|
|
December 31
|
|||||
|
In millions
|
2017
|
2016
|
||||
|
Other non-current assets
|
43.0
|
|
39.0
|
|
||
|
Deferred tax liabilities
|
394.8
|
|
609.5
|
|
||
|
Net deferred tax liabilities
|
$
|
351.8
|
|
$
|
570.5
|
|
The tax effects of the major items recorded as deferred tax assets and liabilities were as follows:
|
|
December 31
|
|||||
|
In millions
|
2017
|
2016
|
||||
|
Deferred tax assets
|
|
|
||||
|
Accrued liabilities and reserves
|
$
|
55.2
|
|
$
|
83.2
|
|
|
Pension and other post-retirement compensation and benefits
|
53.8
|
|
48.9
|
|
||
|
Employee compensation and benefits
|
43.5
|
|
76.6
|
|
||
|
Tax loss and credit carryforwards
|
811.7
|
|
391.0
|
|
||
|
Total deferred tax assets
|
964.2
|
|
599.7
|
|
||
|
Valuation allowance
|
792.4
|
|
380.8
|
|
||
|
Deferred tax assets, net of valuation allowance
|
171.8
|
|
218.9
|
|
||
|
Deferred tax liabilities
|
|
|
||||
|
Property, plant and equipment
|
16.5
|
|
23.6
|
|
||
|
Goodwill and other intangibles
|
484.7
|
|
733.7
|
|
||
|
Other liabilities
|
22.4
|
|
32.1
|
|
||
|
Total deferred tax liabilities
|
523.6
|
|
789.4
|
|
||
|
Net deferred tax liabilities
|
$
|
351.8
|
|
$
|
570.5
|
|
Included in tax loss and credit carryforwards in the table above is a deferred tax asset of
$28.7 million
as of December 31, 2017 related to foreign tax credit carryover from the tax period ended December 31, 2017 and related to transition taxes. The entire amount is subject to a valuation allowance. The foreign tax credit is eligible for carryforward until the tax period ending December 31, 2027.
63
Pentair plc and Subsidiaries
Notes to consolidated financial statements
As of
December 31, 2017
, tax loss carryforwards of
$4,052.9 million
were available to offset future income. A valuation allowance of
$762.2 million
exists for deferred income tax benefits related to the tax loss carryforwards which may not be realized. The increase in tax loss carryforwards and valuation allowance from
2016
to
2017
were primarily related to internal restructuring transactions and interest expense. We believe sufficient taxable income will be generated in the respective jurisdictions to allow us to fully recover the remainder of the tax losses. The tax losses primarily relate to non-U.S. carryforwards of
$3,961.0 million
which are subject to varying expiration periods. Non-U.S. carryforwards of
$2,253.0 million
are located in jurisdictions with unlimited tax loss carryforward periods, while the remainder will begin to expire in
2018
. In addition, there were
$91.9 million
of state tax loss carryforwards as of
December 31, 2017
, which will expire in future years through
2037
.
On December 22, 2017, the Tax Cuts and Jobs Act of 2017 (the “Act”) was signed into law making significant changes to the Internal Revenue Code. Changes include, but are not limited to, a corporate tax rate decrease from
35%
to
21%
effective for tax years beginning after December 31, 2017, the transition of U.S international taxation from a worldwide tax system to a territorial system, and a one-time transition tax on the mandatory deemed repatriation of cumulative foreign earnings as of December 31, 2017.
Given the significance of the Act, Staff Accounting Bulletin No. 118 ("SAB 118") was issued to address the application of U.S. GAAP in situations when a registrant does not have the necessary information available, prepared, or analyzed (including computations) in reasonable detail to complete the accounting for certain income tax effects of the Act. SAB 118 allows registrants to record provisional amounts during a one year “measurement period.” The measurement period is deemed to have ended earlier when the registrant has obtained, prepared, and analyzed the information necessary to finalize its accounting. During the measurement period, impacts of the law are expected to be recorded at the time a reasonable estimate for all or a portion of the effects can be made, and provisional amounts can be recognized and adjusted as information becomes available, prepared, or analyzed.
The Company has calculated its best estimate of the impact of the Act in its year end income tax provision in accordance with its understanding of the Act and guidance available as of the date of this filing and as a result has recorded a provisional income tax benefit of
$84.8 million
in the fourth quarter of 2017, the period in which the legislation was enacted. The provisional amount related to the remeasurement of certain deferred tax assets and liabilities based on the rates at which they are expected to reverse in the future was a decrease to income tax expense of
$147.7 million
. The remeasurement of deferred taxes requires further analysis regarding the state tax impacts of the remeasurement, the impact of the Act on the taxation of executive compensation arrangements, changes to tax capitalization provisions and other aspects of the Act that may impact our tax balances.
The amount related to the one-time transition tax on the mandatory deemed repatriation of foreign earnings was an increase to income tax expense of
$62.9 million
. The determination of the transition tax requires additional analysis regarding the amount and composition of the company’s historical foreign earnings and foreign tax credit position, which is expected to be completed in the second half of 2018. No additional income taxes have been provided for any remaining undistributed foreign earnings not subject to the transition tax, or any additional outside basis difference inherent in these entities, as these amounts continue to be indefinitely reinvested in foreign operations.
|
13.
|
Benefit Plans
|
Pension and other post-retirement plans
We sponsor U.S. and non-U.S. defined-benefit pension and other post-retirement plans. Pension benefits are based principally on an employee's years of service and/or compensation levels near retirement. In addition, we provide certain post-retirement health care and life insurance benefits. Generally, the post-retirement health care and life insurance plans require contributions from retirees. In December 2007, we announced that we would freeze certain U.S. pension plans as of December 31, 2017. As such, employees in these U.S. pension plans will no longer earn service credits and the Company will no longer incur service cost related to these plans.
In November 2017, our Board of Directors approved amendments to terminate the Pentair Salaried Plan (the "Salaried Plan"), a U.S. qualified pension plan. The Salaried Plan discontinued accruing benefits on
December 31, 2017
and the termination was effective December 31, 2017. It is expected to take
18
to
24 months
from the date of the approved amendment to complete the termination of the Salaried Plan.
64
Pentair plc and Subsidiaries
Notes to consolidated financial statements
At December 31, 2017, the projected benefit obligation of the Salaried Plan was
$369.0 million
and the plan assets were
$355.4 million
. There were approximately
2,610
active participants in the Salaried Plan, of which
2,048
were either active employees or terminated vested participants who had not yet begun to receive their benefits as of December 31, 2017. The Salaried Plan participants will not be adversely affected by the plan termination. Those participants whose plan benefits are not in pay status by July 1, 2018 will be given the opportunity to elect a lump sum (or monthly annuity) during a special election window. For all participants whose Salaried Plan benefits are not paid in a lump sum, Pentair will purchase an annuity for them with an annuity provider after the special election window and after all required government approvals for the termination of the pension plan are received.
The information herein relates to defined-benefit pension and other post-retirement plans of our continuing operations only.
Obligations and funded status
The following tables present reconciliations of plan benefit obligations, fair value of plan assets and the funded status of pension plans and other post-retirement plans as of and for the years ended
December 31, 2017
and
2016
:
|
|
U.S. pension plans
|
Non-U.S. pension plans
|
Other post-retirement
plans
|
|||||||||||||||||
|
In millions
|
2017
|
2016
|
2017
|
2016
|
2017
|
2016
|
||||||||||||||
|
Change in benefit obligations
|
||||||||||||||||||||
|
Benefit obligation beginning of year
|
$
|
413.3
|
|
$
|
396.9
|
|
$
|
186.8
|
|
$
|
173.4
|
|
$
|
36.9
|
|
$
|
38.8
|
|
||
|
Service cost
|
10.3
|
|
11.2
|
|
8.0
|
|
6.6
|
|
0.2
|
|
0.2
|
|
||||||||
|
Interest cost
|
16.3
|
|
16.4
|
|
4.2
|
|
4.1
|
|
1.3
|
|
1.5
|
|
||||||||
|
Actuarial loss (gain)
|
40.0
|
|
0.9
|
|
(8.5
|
)
|
16.8
|
|
0.2
|
|
(0.5
|
)
|
||||||||
|
Foreign currency translation
|
—
|
|
—
|
|
23.7
|
|
(9.2
|
)
|
—
|
|
—
|
|
||||||||
|
Benefits paid
|
(16.9
|
)
|
(12.1
|
)
|
(7.0
|
)
|
(4.9
|
)
|
(3.0
|
)
|
(3.1
|
)
|
||||||||
|
Benefit obligation end of year
|
$
|
463.0
|
|
$
|
413.3
|
|
$
|
207.2
|
|
$
|
186.8
|
|
$
|
35.6
|
|
$
|
36.9
|
|
||
|
Change in plan assets
|
||||||||||||||||||||
|
Fair value of plan assets beginning of year
|
$
|
344.4
|
|
$
|
327.7
|
|
$
|
45.7
|
|
$
|
46.6
|
|
$
|
—
|
|
$
|
—
|
|
||
|
Actual return on plan assets
|
42.4
|
|
24.6
|
|
2.1
|
|
3.0
|
|
—
|
|
—
|
|
||||||||
|
Company contributions
|
4.6
|
|
4.2
|
|
8.2
|
|
5.8
|
|
2.9
|
|
3.1
|
|
||||||||
|
Foreign currency translation
|
—
|
|
—
|
|
3.7
|
|
(4.8
|
)
|
—
|
|
—
|
|
||||||||
|
Benefits paid
|
(16.9
|
)
|
(12.1
|
)
|
(8.5
|
)
|
(4.9
|
)
|
(2.9
|
)
|
(3.1
|
)
|
||||||||
|
Fair value of plan assets end of year
|
$
|
374.5
|
|
$
|
344.4
|
|
$
|
51.2
|
|
$
|
45.7
|
|
$
|
—
|
|
$
|
—
|
|
||
|
Funded status
|
||||||||||||||||||||
|
Benefit obligations in excess of the fair value of plan assets
|
$
|
(88.5
|
)
|
$
|
(68.9
|
)
|
$
|
(156.0
|
)
|
$
|
(141.1
|
)
|
$
|
(35.6
|
)
|
$
|
(36.9
|
)
|
||
Amounts recorded in the Consolidated Balance Sheets were as follows:
|
|
U.S. pension plans
|
Non-U.S. pension plans
|
Other post-retirement
plans
|
|||||||||||||||||
|
In millions
|
2017
|
2016
|
2017
|
2016
|
2017
|
2016
|
||||||||||||||
|
Other non-current assets
|
$
|
—
|
|
$
|
0.8
|
|
$
|
3.8
|
|
$
|
3.2
|
|
$
|
—
|
|
$
|
—
|
|
||
|
Current liabilities
|
(6.0
|
)
|
(4.4
|
)
|
(3.6
|
)
|
(2.9
|
)
|
(3.1
|
)
|
(3.2
|
)
|
||||||||
|
Non-current liabilities
|
(82.5
|
)
|
(65.3
|
)
|
(156.2
|
)
|
(141.4
|
)
|
(32.5
|
)
|
(33.7
|
)
|
||||||||
|
Benefit obligations in excess of the fair value of plan assets
|
$
|
(88.5
|
)
|
$
|
(68.9
|
)
|
$
|
(156.0
|
)
|
$
|
(141.1
|
)
|
$
|
(35.6
|
)
|
$
|
(36.9
|
)
|
||
The accumulated benefit obligation for all defined benefit plans was
$656.7 million
and
$585.9 million
at
December 31, 2017
and
2016
, respectively.
65
Pentair plc and Subsidiaries
Notes to consolidated financial statements
Information for pension plans with an accumulated benefit obligation or projected benefit obligation in excess of plan assets as of December 31 was as follows:
|
|
Projected benefit obligation
exceeds the fair value
of plan assets
|
Accumulated benefit obligation
exceeds the fair value of
plan assets
|
|||||||||||
|
In millions
|
2017
|
2016
|
|
2017
|
2016
|
||||||||
|
U.S. pension plans
|
|
|
|
|
|
||||||||
|
Projected benefit obligation
|
$
|
463.0
|
|
$
|
87.2
|
|
|
$
|
463.0
|
|
$
|
87.2
|
|
|
Fair value of plan assets
|
374.5
|
|
17.5
|
|
|
374.5
|
|
17.5
|
|
||||
|
Accumulated benefit obligation
|
N/A
|
|
N/A
|
|
|
460.3
|
|
86.3
|
|
||||
|
Non-U.S. pension plans
|
|
|
|
|
|
||||||||
|
Projected benefit obligation
|
$
|
182.4
|
|
$
|
165.2
|
|
|
$
|
170.3
|
|
$
|
165.2
|
|
|
Fair value of plan assets
|
22.6
|
|
20.9
|
|
|
11.4
|
|
20.9
|
|
||||
|
Accumulated benefit obligation
|
NA
|
|
NA
|
|
|
160.5
|
|
155.7
|
|
||||
Components of net periodic benefit expense for our pension plans for the years ended December 31 were as follows:
|
|
U.S. pension plans
|
|
Non-U.S. pension plans
|
||||||||||||||||
|
In millions
|
2017
|
2016
|
2015
|
|
2017
|
2016
|
2015
|
||||||||||||
|
Service cost
|
$
|
10.3
|
|
$
|
11.2
|
|
$
|
14.0
|
|
|
$
|
8.0
|
|
$
|
6.6
|
|
$
|
7.8
|
|
|
Interest cost
|
16.3
|
|
16.4
|
|
14.9
|
|
|
4.2
|
|
4.1
|
|
3.9
|
|
||||||
|
Expected return on plan assets
|
(11.5
|
)
|
(11.4
|
)
|
(10.0
|
)
|
|
(1.5
|
)
|
(1.5
|
)
|
(1.6
|
)
|
||||||
|
Net actuarial (gain) loss
|
9.1
|
|
(12.4
|
)
|
(18.0
|
)
|
|
(7.4
|
)
|
17.2
|
|
(2.4
|
)
|
||||||
|
Net periodic benefit expense
|
$
|
24.2
|
|
$
|
3.8
|
|
$
|
0.9
|
|
|
$
|
3.3
|
|
$
|
26.4
|
|
$
|
7.7
|
|
Components of net periodic benefit expense for our other post-retirement plans for the years ended December 31
2017
,
2016
and
2015
, were not material.
Assumptions
Weighted-average assumptions used to determine benefit obligations as of December 31 were as follows:
|
|
U.S. pension plans
|
|
Non-U.S. pension plans
|
|
Other post-retirement
plans |
|||||||||||||||
|
Percentages
|
2017
(1)
|
2016
|
2015
|
|
2017
|
2016
|
2015
|
|
2017
|
2016
|
2015
|
|||||||||
|
Discount rate
|
3.39
|
%
|
4.02
|
%
|
4.21
|
%
|
|
2.18
|
%
|
2.00
|
%
|
2.52
|
%
|
|
3.40
|
%
|
3.80
|
%
|
3.95
|
%
|
|
Rate of compensation increase
|
4.00
|
%
|
4.00
|
%
|
4.00
|
%
|
|
2.93
|
%
|
2.91
|
%
|
2.90
|
%
|
|
—
|
—
|
—
|
|||
|
(1)
|
The benefit obligation for the Salaried Plan as of December 31, 2017 was determined using assumptions reflecting the termination of the plan. As a result, the weighted-average assumptions for U.S. pension plans as December 31, 2017 reflected in the table above do not include the Salaried Plan.
|
66
Pentair plc and Subsidiaries
Notes to consolidated financial statements
Weighted-average assumptions used to determine net periodic benefit expense (income) for years ended December 31 were as follows:
|
|
U.S. pension plans
|
|
Non-U.S. pension plans
|
|
Other post-retirement
plans |
|||||||||||||||
|
Percentages
|
2017
|
2016
|
2015
|
|
2017
|
2016
|
2015
|
|
2017
|
2016
|
2015
|
|||||||||
|
Discount rate
|
4.02
|
%
|
4.21
|
%
|
3.63
|
%
|
|
2.00
|
%
|
2.52
|
%
|
2.30
|
%
|
|
3.80
|
%
|
3.95
|
%
|
3.60
|
%
|
|
Expected long-term return on plan assets
|
4.11
|
%
|
4.28
|
%
|
3.65
|
%
|
|
3.02
|
%
|
3.29
|
%
|
3.57
|
%
|
|
—
|
—
|
—
|
|||
|
Rate of compensation increase
|
4.00
|
%
|
4.00
|
%
|
4.00
|
%
|
|
2.91
|
%
|
2.90
|
%
|
2.89
|
%
|
|
—
|
—
|
—
|
|||
Uncertainty in the securities markets and U.S. economy could result in investment returns less than those assumed. Should the securities markets decline or medical and prescription drug costs increase at a rate greater than assumed, we would expect increasing annual combined net pension and other post-retirement costs for the next several years. Should actual experience differ from actuarial assumptions, the projected pension benefit obligation and net pension cost and accumulated other post-retirement benefit obligation and other post-retirement benefit cost would be affected in future years.
Discount rates
The discount rate reflects the current rate at which the pension liabilities could be effectively settled at the end of the year based on our December 31 measurement date. The discount rate was determined by matching our expected benefit payments to payments from a stream of bonds rated AA or higher available in the marketplace, adjusted to eliminate the effects of call provisions. This produced a weighted-average discount rate for our U.S. pension plans of
3.39%
,
4.02%
and
4.21%
in
2017
,
2016
and
2015
, respectively. The discount rates on our non-U.S. pension plans ranged from
0.50%
to
3.50%
,
0.50%
to
4.00%
and
0.50%
to
4.25%
in
2017
,
2016
and
2015
, respectively. There are no known or anticipated changes in our discount rate assumptions that will impact our pension expense in
2018
.
Expected rates of return
Our expected rates of return on U.S. pension plan assets were
4.11%
,
4.28%
and
3.65%
for
2017
,
2016
and
2015
, respectively. The expected rates of return on non-U.S. pension plan assets ranged from
1.00%
to
5.50%
,
1.00%
to
5.50%
and
1.00%
to
6.00%
in
2017
,
2016
and
2015
, respectively. The expected rate of return is designed to be a long-term assumption that may be subject to considerable year-to-year variance from actual returns. In developing the expected long-term rate of return, we considered our historical returns, with consideration given to forecasted economic conditions, our asset allocations, input from external consultants and broader longer-term market indices. U.S. pension plan assets yielded returns of
12.30%
,
7.50%
and
(3.20)%
in
2017
,
2016
and
2015
, respectively. As a result of our de-risking strategy to reduce U.S. pension plan liability, we anticipate the expected rate of return on our U.S. funded pension plans will continue to be consistent with the discount rate utilized. Any difference in the expected rate and actual returns will be included with the actuarial gain or loss recorded in the fourth quarter when our plans are remeasured.
Healthcare cost trend rates
The assumed healthcare cost trend rates for other post-retirement plans as of December 31 were as follows:
|
2017
|
2016
|
|||
|
Healthcare cost trend rate assumed for following year
|
6.6
|
%
|
7.0
|
%
|
|
Rate to which the cost trend rate is assumed to decline (the ultimate trend rate)
|
4.4
|
%
|
4.4
|
%
|
|
Year the cost trend rate reaches the ultimate trend rate
|
2038
|
|
2038
|
|
The assumed healthcare cost trend rates can have a significant effect on the amounts reported for healthcare plans. A one-percentage-point change in the assumed healthcare cost trend rates would have the following effects as of and for the year ended
December 31, 2017
:
|
|
One Percentage Point
|
|||||
|
In millions
|
Increase
|
Decrease
|
||||
|
Increase (decrease) in annual service and interest cost
|
$
|
0.1
|
|
$
|
(0.1
|
)
|
|
Increase (decrease) in other post-retirement benefit obligations
|
0.7
|
|
(0.6
|
)
|
||
67
Pentair plc and Subsidiaries
Notes to consolidated financial statements
Pension plans assets
Objective
The primary objective of our investment strategy is to meet the pension obligation to our employees at a reasonable cost to us. This is primarily accomplished through growth of capital and safety of the funds invested.
Asset allocation
Our actual overall asset allocation for our U.S. and non-U.S. pension plans as compared to our investment policy goals as of December 31 was as follows:
|
|
U.S. pension plans
|
||||||||
|
|
Actual
|
Target
|
|||||||
|
Percentages
|
2017
|
2016
|
2017
|
2016
|
|||||
|
Fixed income
|
99
|
%
|
99
|
%
|
100
|
%
|
100
|
%
|
|
|
Alternative
|
1
|
%
|
1
|
%
|
—
|
%
|
—
|
%
|
|
|
|
Non-U.S. pension plans
|
||||||||
|
|
Actual
|
Target
|
|||||||
|
Percentages
|
2017
|
2016
|
|
2017
|
2016
|
||||
|
Equity securities
|
22
|
%
|
23
|
%
|
|
24
|
%
|
23
|
%
|
|
Fixed income
|
53
|
%
|
46
|
%
|
|
51
|
%
|
48
|
%
|
|
Alternative
|
22
|
%
|
26
|
%
|
|
23
|
%
|
27
|
%
|
|
Cash
|
3
|
%
|
5
|
%
|
|
2
|
%
|
2
|
%
|
68
Pentair plc and Subsidiaries
Notes to consolidated financial statements
Fair value measurement
The fair values of our pension plan assets and their respective levels in the fair value hierarchy as of
December 31, 2017
and
December 31, 2016
were as follows:
|
|
December 31, 2017
|
|||||||||||
|
In millions
|
Level 1
|
Level 2
|
Level 3
|
Total
|
||||||||
|
Cash and cash equivalents
|
$
|
—
|
|
$
|
2.8
|
|
$
|
—
|
|
$
|
2.8
|
|
|
Fixed income:
|
||||||||||||
|
Corporate and non U.S. government
|
—
|
|
289.5
|
|
—
|
|
289.5
|
|
||||
|
U.S. treasuries
|
—
|
|
43.2
|
|
—
|
|
43.2
|
|
||||
|
Mortgage-backed securities
|
—
|
|
3.3
|
|
—
|
|
3.3
|
|
||||
|
Other
|
—
|
|
63.1
|
|
—
|
|
63.1
|
|
||||
|
Global equity securities:
|
|
|
|
|
||||||||
|
Small cap equity
|
—
|
|
1.2
|
|
—
|
|
1.2
|
|
||||
|
International equity
|
—
|
|
10.2
|
|
—
|
|
10.2
|
|
||||
|
Other investments
|
—
|
|
11.3
|
|
1.1
|
|
12.4
|
|
||||
|
Total fair value of plan assets
|
$
|
—
|
|
$
|
424.6
|
|
$
|
1.1
|
|
$
|
425.7
|
|
|
|
December 31, 2016
|
|||||||||||
|
In millions
|
Level 1
|
Level 2
|
Level 3
|
Total
|
||||||||
|
Cash and cash equivalents
|
$
|
—
|
|
$
|
3.4
|
|
$
|
—
|
|
$
|
3.4
|
|
|
Fixed income:
|
||||||||||||
|
Corporate and non U.S. government
|
—
|
|
290.5
|
|
—
|
|
290.5
|
|
||||
|
U.S. treasuries
|
—
|
|
30.5
|
|
—
|
|
30.5
|
|
||||
|
Mortgage-backed securities
|
—
|
|
4.5
|
|
—
|
|
4.5
|
|
||||
|
Other
|
—
|
|
37.0
|
|
—
|
|
37.0
|
|
||||
|
Global equity securities:
|
||||||||||||
|
Large cap equity
|
—
|
|
2.2
|
|
—
|
|
2.2
|
|
||||
|
International equity
|
—
|
|
8.3
|
|
—
|
|
8.3
|
|
||||
|
Other investments
|
—
|
|
11.7
|
|
2.0
|
|
13.7
|
|
||||
|
Total fair value of plan assets
|
$
|
—
|
|
$
|
388.1
|
|
$
|
2.0
|
|
$
|
390.1
|
|
Valuation methodologies used for investments measured at fair value were as follows:
|
•
|
Cash and cash equivalents:
Cash consists of cash held in bank accounts and was classified as Level 1. Cash equivalents consist of investments in commingled funds valued based on observable market data. Such investments were classified as Level 2.
|
|
•
|
Fixed income:
Investments in corporate bonds, government securities, mortgages and asset backed securities were valued based upon quoted market prices for similar securities and other observable market data. Investments in commingled funds were generally valued at the net asset value of units held at the end of the period based upon the value of the underlying investments as determined by quoted market prices or by a pricing service. Such investments were classified as Level 2.
|
|
•
|
Global equity securities:
Investments in commingled funds were valued at the net asset value of units held at the end of the period based upon the value of the underlying investments as determined by quoted market prices or by a pricing service. Such investments were classified as Level 2.
|
|
•
|
Other investments:
Other investments include investments in commingled funds with diversified investment strategies. Investments in commingled funds that were valued at the net asset value of units held at the end of the period based upon the value of the underlying investments as determined by quoted market prices or by a pricing service were classified as Level 2. Investments in commingled funds that were valued based on unobservable inputs due to liquidation restrictions were classified as Level 3.
|
69
Pentair plc and Subsidiaries
Notes to consolidated financial statements
Activity for our Level 3 pension plan assets held during the years ended
December 31, 2017
and
2016
was not material.
Cash flows
Contributions
Pension contributions totaled
$12.8 million
and
$10.0 million
in
2017
and
2016
, respectively. Our
2018
pension contributions are expected to be approximately
$18.0 million
to
$21.0 million
. The
2018
expected contributions will equal or exceed our minimum funding requirements.
Estimated future benefit payments
The following benefit payments, which reflect expected future service or payout from termination, as appropriate, are expected to be paid by the plans for the years ended December 31 as follows:
|
In millions
|
U.S. pension
plans
|
Non-U.S.
pension plans
|
Other post-
retirement
plans
|
||||||
|
2018
|
$
|
203.7
|
|
$
|
5.2
|
|
$
|
3.1
|
|
|
2019
|
178.3
|
|
5.8
|
|
3.0
|
|
|||
|
2020
|
6.7
|
|
5.5
|
|
2.9
|
|
|||
|
2021
|
6.7
|
|
6.1
|
|
2.8
|
|
|||
|
2022
|
6.8
|
|
6.3
|
|
2.7
|
|
|||
|
Thereafter
|
33.6
|
|
41.1
|
|
11.7
|
|
|||
Savings plan
We have a 401(k) plan (the "401(k) plan") with an employee share ownership ("ESOP") bonus component, which covers certain union and all non-union U.S. employees who met certain age requirements. Under the 401(k) plan, eligible U.S. employees could voluntarily contribute a percentage of their eligible compensation. We matched contributions made by employees who met certain eligibility and service requirements. During 2017, 2016 and 2015, our matching contribution was
100%
of eligible employee contributions for the first
1%
of eligible compensation and
50%
of the next
5%
of eligible compensation.
In addition to the matching contribution, all employees who met certain service requirements received a discretionary ESOP contribution equal to
1.5%
of annual eligible compensation.
As of January 1, 2018, the 401(k) company match contribution was changed to a dollar-for-dollar (
100%
) matching contribution on up to
5%
of employee eligible earnings, contributed as before-tax contributions. This change will replace the ESOP component discussed above and offers the same
5%
total company match.
Our combined expense for the 401(k) plan and the ESOP was
$27.9 million
,
$27.1 million
and
$26.5 million
in
2017
,
2016
and
2015
, respectively.
Other retirement compensation
Total other accrued retirement compensation, primarily related to deferred compensation and supplemental retirement plans, was
$62.9 million
and
$61.0 million
as of
December 31, 2017
and
2016
, respectively, and is included in
Pension and other post-retirement compensation and benefits
and
Other non-current liabilities
in the Consolidated Balance Sheets.
|
14.
|
Shareholders' Equity
|
Authorized shares
Our authorized share capital consists of
426.0 million
ordinary shares with a par value of
$0.01
per share.
Ordinary shares held in treasury
In August 2015, we canceled all of our ordinary shares held in treasury. At the time of the cancellation, we held
$19.1 million
ordinary shares in treasury at a cost of
$1.2 billion
.
Share repurchases
In December 2014, the Board of Directors authorized the repurchase of our ordinary shares up to a maximum dollar limit of
$1.0 billion
. The authorization expires on
December 31, 2019
.
In December 2015, we repurchased
3.1 million
of our ordinary shares for
$200 million
under the 2014 authorization.
70
Pentair plc and Subsidiaries
Notes to consolidated financial statements
During the year ended
December 31, 2017
, we repurchased
3.0 million
of our ordinary shares for
$200.0 million
under the 2014 authorization. We have
$600.0 million
remaining availability for repurchases under the 2014 authorization.
Dividends payable
On December 5, 2017, the Board of Directors declared a quarterly cash dividend of
$0.35
that was paid on February 9, 2018 to shareholders of record at the close of business on January 26, 2018. Additionally, the Board of Directors approved a plan to increase the 2018 annual cash dividend to
$1.40
, which is intended to be paid in four quarterly installments. As a result, the balance of dividends payable included in
Other current liabilities
on our Consolidated Balance Sheets was
$63.1 million
at
December 31, 2017
. Dividends paid per ordinary share were
$1.38
,
$1.34
and
$1.28
for the years ended
December 31, 2017
,
2016
and
2015
, respectively.
|
15.
|
Share Plans
|
Share-based compensation expense
Total share-based compensation expense for
2017
,
2016
and
2015
was as follows:
|
December 31
|
|||||||||
|
In millions
|
2017
|
2016
|
2015
|
||||||
|
Restricted stock units
|
$
|
17.5
|
|
$
|
17.3
|
|
$
|
21.6
|
|
|
Stock options
|
10.5
|
|
10.4
|
|
11.4
|
|
|||
|
Performance share units
|
11.6
|
|
6.5
|
|
—
|
|
|||
|
Total share-based compensation expense
|
$
|
39.6
|
|
$
|
34.2
|
|
$
|
33.0
|
|
Share incentive plans
In 2012, our Board of Directors, and Tyco International Ltd. ("Tyco") as our sole shareholder at the time, approved the Pentair plc 2012 Stock and Incentive Plan (the "2012 Plan"). The 2012 Plan became effective on September 28, 2012 and authorizes the issuance of
9.0 million
of our ordinary shares. The shares may be issued as new shares or from shares held in treasury. Prior to the cancellation of our shares held in treasury in August 2015, our practice was to settle equity-based awards from shares held in treasury. Subsequent to the cancellation, our practice is to settle equity-based awards by issuing new shares. The 2012 Plan terminates in September 2022. The 2012 Plan allows for the granting to our officers, directors, employees and consultants of non-qualified stock options, incentive stock options, stock appreciation rights, performance shares, performance units, restricted shares, restricted stock units, deferred stock rights, annual incentive awards, dividend equivalent units and other equity-based awards.
The 2012 Plan is administered by our compensation committee (the "Committee"), which is made up of independent members of our Board of Directors. Employees eligible to receive awards under the 2012 Plan are managerial, administrative or other key employees who are in a position to make a material contribution to the continued profitable growth and long-term success of our company. The Committee has the authority to select the recipients of awards, determine the type and size of awards, establish certain terms and conditions of award grants and take certain other actions as permitted under the 2012 Plan. The 2012 Plan prohibits the Committee from re-pricing awards or canceling and reissuing awards at lower prices.
The 2008 Omnibus Stock Incentive Plan as Amended and Restated (the "2008 Plan") terminated in 2012. Prior grants of restricted stock units and stock options made under the 2008 Plan and earlier stock incentive plans outstanding at the time of termination were converted into equity-based awards with respect to our ordinary shares and were assumed by us on the terms in effect at the time of grant and are outstanding under the 2012 Plan.
Non-qualified and incentive stock options
Under the 2012 Plan, we may grant stock options to any eligible employee with an exercise price equal to the market value of the shares on the dates the options were granted. Options generally vest
one-third
each year over a
three
-year period commencing on the grant date and expire
10
years after the grant date.
Restricted shares and restricted stock units
Under the 2012 Plan, eligible employees may be awarded restricted shares or restricted stock units of our common stock. Restricted shares and restricted stock units generally vest
one-third
each year over a
three
-year period commencing on the grant date, subject to continuous employment and certain other conditions. Restricted shares and restricted stock units are valued at market value on the date of grant and are expensed over the vesting period.
71
Pentair plc and Subsidiaries
Notes to consolidated financial statements
Stock appreciation rights, performance shares and performance units
Under the 2012 Plan, the Committee is permitted to issue these awards which are generally earned over a
three
-year vesting period and tied to specific financial metrics. In December 2015, the Committee approved the granting of performance share units to certain employees that vest based on the satisfaction of a three-year service period and the achievement of certain performance metrics over that same period. Upon vesting, PSU holders receive dividends that accumulate during the vesting period. The fair value of these PSUs is determined based on the closing market price of the Company's ordinary shares at the date of grant. Compensation expense is recognized over the period an employee is required to provide service based on the estimated vesting of the PSUs granted. The estimated vesting of the PSUs is based on the probability of achieving certain financial performance metrics during the three year vesting period.
Stock options
The following table summarizes stock option activity under all plans for the year ended
December 31, 2017
:
|
Shares and intrinsic value in millions
|
Number of shares
|
Weighted-
average
exercise
price
|
Weighted-
average
remaining
contractual life
(years)
|
Aggregate
intrinsic
value
|
|||||
|
Outstanding as of January 1, 2017
|
5.7
|
|
$
|
45.72
|
|
|
|
||
|
Granted
|
0.9
|
|
59.09
|
|
|
|
|||
|
Exercised
|
(1.2
|
)
|
37.00
|
|
|
|
|||
|
Forfeited
|
(0.2
|
)
|
60.03
|
|
|
|
|||
|
Expired
|
—
|
|
—
|
|
|
|
|||
|
Outstanding as of December 31, 2017
|
5.2
|
|
$
|
49.49
|
|
5.5
|
$
|
113.7
|
|
|
Options exercisable as of December 31, 2017
|
3.4
|
|
$
|
46.00
|
|
4.0
|
$
|
87.5
|
|
|
Options expected to vest as of December 31, 2017
|
1.8
|
|
$
|
56.13
|
|
8.3
|
$
|
25.8
|
|
Fair value of options granted
The weighted average grant date fair value of options granted under Pentair plans in
2017
,
2016
and
2015
was estimated to be
$12.59
,
$9.74
and
$16.40
per share, respectively. The total intrinsic value of options that were exercised during
2017
,
2016
and
2015
was
$34.3 million
,
$27.1 million
and
$20.8 million
, respectively. At
December 31, 2017
, the total unrecognized compensation cost related to stock options was
$9.8 million
. This cost is expected to be recognized over a weighted average period of
2.0 years
.
We estimated the fair value of each stock option award on the date of grant using a Black-Scholes option pricing model, modified for dividends and using the following weighted average assumptions:
|
|
December 31
|
|||||||
|
|
2017
|
|
2016
|
2015
|
||||
|
Risk-free interest rate
|
1.65
|
%
|
|
1.56
|
%
|
1.60
|
%
|
|
|
Expected dividend yield
|
2.35
|
%
|
|
2.49
|
%
|
1.97
|
%
|
|
|
Expected share price volatility
|
26.9
|
%
|
|
27.3
|
%
|
30.4
|
%
|
|
|
Expected term (years)
|
6.3
|
|
|
5.9
|
|
6.0
|
|
|
These estimates require us to make assumptions based on historical results, observance of trends in our share price, changes in option exercise behavior, future expectations and other relevant factors. If other assumptions had been used, share-based compensation expense, as calculated and recorded under the accounting guidance, could have been affected.
We based the expected life assumption on historical experience as well as the terms and vesting periods of the options granted. For purposes of determining expected volatility, we considered a rolling average of historical volatility measured over a period approximately equal to the expected option term. The risk-free rate for periods that coincide with the expected life of the options is based on the U.S. Treasury Department yield curve in effect at the time of grant.
Cash received from option exercises for the years ended
December 31, 2017
,
2016
and
2015
was
$46.0 million
,
$31.6 million
and
$28.7 million
, respectively. The actual tax benefit realized for the tax deductions from option exercises totaled
$7.8 million
,
$5.5 million
and
$4.8 million
for the years ended
December 31, 2017
,
2016
and
2015
, respectively.
72
Pentair plc and Subsidiaries
Notes to consolidated financial statements
Restricted stock units
The following table summarizes restricted stock unit activity under all plans for the year ended
December 31, 2017
:
|
Shares in millions
|
Number of
shares
|
Weighted
average
grant date
fair value
|
|||
|
Outstanding as of January 1, 2017
|
0.7
|
|
$
|
55.31
|
|
|
Granted
|
0.4
|
|
61.27
|
|
|
|
Vested
|
(0.4
|
)
|
56.73
|
|
|
|
Forfeited
|
(0.1
|
)
|
54.35
|
|
|
|
Outstanding as of December 31, 2017
|
0.6
|
|
$
|
57.96
|
|
As of
December 31, 2017
, there was
$39.6 million
of unrecognized compensation cost related to restricted share compensation arrangements granted under the 2012 Plan and previous plans. That cost is expected to be recognized over a weighted-average period of
2.8
years. The total fair value of shares vested during the years ended
December 31, 2017
,
2016
and
2015
, was
$21.7 million
,
$27.2 million
and
$26.0 million
, respectively. For the years ended
December 31, 2017
and
2016
, there was
no
actual tax benefit realized. The actual tax benefit realized for the years ended December 31,
2015
was
$2.4 million
.
Performance share units
The following table summarizes performance share unit activity under all plans for the year ended
December 31, 2017
:
|
Shares in millions
|
Number of
shares
|
Weighted
average
grant date
fair value
|
|||
|
Outstanding as of January 1, 2017
|
0.3
|
|
$
|
49.54
|
|
|
Granted
|
0.2
|
|
58.40
|
|
|
|
Vested
|
—
|
|
—
|
|
|
|
Forfeited
|
—
|
|
—
|
|
|
|
Outstanding as of December 31, 2017
|
0.5
|
|
$
|
53.56
|
|
The expense recognized each period is dependent upon our estimate of the number of shares that will ultimately be issued. As of
December 31, 2017
, there was
$10.5 million
of unrecognized compensation cost related to performance share compensation arrangements granted under the 2012 Plan and previous plans. That cost is expected to be recognized over a weighted-average period of
1.6
years. There were
no
actual tax benefits realized related to performance share compensation arrangements for the year ended
December 31, 2017
.
|
16.
|
Segment Information
|
We classify our operations into the following business segments based primarily on types of products offered and markets served:
|
•
|
Water
— The Water segment designs, manufactures, markets and services innovative water solutions for the filtration, separation, flow and water management challenges in agriculture, foodservice, food and beverage processing, swimming pools, water supply and disposal and a variety of industrial applications.
|
|
•
|
Electrical
— The Electrical segment designs, manufactures, markets, installs and services high performance products and solutions that connect and protect some of the world's most sensitive equipment, buildings, and critical processes.
|
|
•
|
Other
— Other is primarily composed of unallocated corporate expenses, our captive insurance subsidiary and intermediate finance companies.
|
The accounting policies of our reporting segments are the same as those described in the summary of significant accounting policies. We evaluate performance based on the net sales and segment income (loss) and use a variety of ratios to measure performance of our reporting segments. These results are not necessarily indicative of the results of operations that would have occurred had each segment been an independent, stand-alone entity during the periods presented. Segment income (loss) represents equity income of unconsolidated subsidiaries and operating income exclusive of intangible amortization, certain
73
Pentair plc and Subsidiaries
Notes to consolidated financial statements
acquisition related expenses, costs of restructuring activities, "mark-to-market" gain/loss for pension and other post-retirement plans, impairments and other unusual non-operating items.
Financial information by reportable segment is included in the following summary:
|
2017
|
2016
|
2015
|
2017
|
2016
|
2015
|
||||||||||||||
|
In millions
|
Net sales
|
Segment income (loss)
|
|||||||||||||||||
|
Water
|
$
|
2,844.4
|
|
$
|
2,777.7
|
|
$
|
2,808.3
|
|
$
|
546.0
|
|
$
|
494.0
|
|
$
|
469.0
|
|
|
|
Electrical
|
2,097.9
|
|
2,116.0
|
|
1,809.3
|
|
447.0
|
|
447.2
|
|
395.0
|
|
|||||||
|
Other
|
(5.8
|
)
|
(3.7
|
)
|
(1.2
|
)
|
(95.8
|
)
|
(101.7
|
)
|
(108.8
|
)
|
|||||||
|
Consolidated
|
$
|
4,936.5
|
|
$
|
4,890.0
|
|
$
|
4,616.4
|
|
$
|
897.2
|
|
$
|
839.5
|
|
$
|
755.2
|
|
|
|
2017
|
2016
|
2015
|
2017
|
2016
|
2015
|
||||||||||||||
|
In millions
|
Identifiable assets
(1)
|
Depreciation
|
|||||||||||||||||
|
Water
|
$
|
3,667.1
|
|
$
|
3,465.5
|
|
$
|
3,624.5
|
|
$
|
45.6
|
|
$
|
46.8
|
|
$
|
45.3
|
|
|
|
Electrical
|
4,634.1
|
|
4,419.3
|
|
4,488.4
|
|
34.3
|
|
31.6
|
|
27.6
|
|
|||||||
|
Other
|
332.5
|
|
3,650.0
|
|
3,720.6
|
|
5.3
|
|
6.2
|
|
8.3
|
|
|||||||
|
Consolidated
|
$
|
8,633.7
|
|
$
|
11,534.8
|
|
$
|
11,833.5
|
|
$
|
85.2
|
|
$
|
84.6
|
|
$
|
81.2
|
|
|
|
2017
|
2016
|
2015
|
||||||||
|
In millions
|
Capital expenditures
|
|||||||||
|
Water
|
$
|
36.1
|
|
$
|
40.8
|
|
$
|
41.5
|
|
|
|
Electrical
|
31.8
|
|
74.5
|
|
47.4
|
|
||||
|
Other
|
3.0
|
|
2.5
|
|
2.4
|
|
||||
|
Consolidated
|
$
|
70.9
|
|
$
|
117.8
|
|
$
|
91.3
|
|
|
|
(1)
|
All cash and cash equivalents and assets held for sale are included in "Other."
|
The following table presents a reconciliation of consolidated segment income to consolidated
i
ncome from continuing operations before income taxes:
|
In millions
|
2017
|
2016
|
2015
|
||||||
|
Segment income
|
$
|
897.2
|
|
$
|
839.5
|
|
$
|
755.2
|
|
|
Deal related costs and expenses
|
—
|
|
—
|
|
(14.3
|
)
|
|||
|
Inventory step-up
|
—
|
|
—
|
|
(35.7
|
)
|
|||
|
Restructuring and other
|
(30.7
|
)
|
(20.6
|
)
|
(42.5
|
)
|
|||
|
Separation costs
|
(53.1
|
)
|
—
|
|
—
|
|
|||
|
Intangible amortization
|
(97.7
|
)
|
(96.4
|
)
|
(68.1
|
)
|
|||
|
Pension and other post-retirement mark-to-market (loss) gain
|
(1.6
|
)
|
(4.2
|
)
|
23.0
|
|
|||
|
Trade name and other impairment
|
(32.0
|
)
|
(13.3
|
)
|
—
|
|
|||
|
Loss on sale of businesses
|
(4.2
|
)
|
(3.9
|
)
|
(3.2
|
)
|
|||
|
Loss on early extinguishment of debt
|
(101.4
|
)
|
—
|
|
—
|
|
|||
|
Interest expense, net
|
(87.3
|
)
|
(140.1
|
)
|
(101.9
|
)
|
|||
|
Income from continuing operations before income taxes
|
$
|
489.2
|
|
$
|
561.0
|
|
$
|
512.5
|
|
74
Pentair plc and Subsidiaries
Notes to consolidated financial statements
The following tables present certain geographic information by region:
|
2017
|
2016
|
2015
|
2017
|
2016
|
2015
|
||||||||||||||
|
In millions
|
Net sales
|
Long-lived assets
|
|||||||||||||||||
|
U.S.
|
$
|
2,973.7
|
|
$
|
2,897.1
|
|
$
|
2,634.0
|
|
$
|
301.4
|
|
$
|
309.5
|
|
$
|
285.9
|
|
|
|
Western Europe
|
827.2
|
|
796.0
|
|
727.6
|
|
61.7
|
|
138.6
|
|
150.7
|
|
|||||||
|
Developing
(1)
|
723.7
|
|
704.0
|
|
731.6
|
|
157.1
|
|
65.2
|
|
60.3
|
|
|||||||
|
Other Developed
(2)
|
411.9
|
|
492.9
|
|
523.2
|
|
25.3
|
|
25.3
|
|
42.9
|
|
|||||||
|
Consolidated
|
$
|
4,936.5
|
|
$
|
4,890.0
|
|
$
|
4,616.4
|
|
$
|
545.5
|
|
$
|
538.6
|
|
$
|
539.8
|
|
|
|
(1) - Developing includes China, Eastern Europe, Latin America, the Middle East and Southeast Asia.
|
|||||||||||||||||||
|
(2) - Other Developed includes Australia, Canada and Japan.
|
|||||||||||||||||||
Net sales are based on the geographic destination of the sale. Long-lived assets represent property, plant and equipment, net of related depreciation. Net sales shipped to and long-lived assets held in Ireland for each year presented above were not material.
We offer a broad array of products and systems to multiple markets and customers for which we do not have the information systems to track revenues by primary product category. However, our net sales by segment are representative of our sales by major product category. We sell our products through various distribution channels including wholesale and retail distributors, original equipment manufacturers and home centers.
No
customer accounted for more than 10% of net sales in
2017
,
2016
, or
2015
.
|
17.
|
Commitments and Contingencies
|
Operating lease commitments
Net rental expense under operating leases was as follows:
|
Years ended December 31
|
|||||||||
|
In millions
|
2017
|
2016
|
2015
|
||||||
|
Gross rental expense
|
$
|
40.4
|
|
$
|
37.5
|
|
$
|
26.4
|
|
|
Sublease rental income
|
(0.3
|
)
|
(0.7
|
)
|
(0.4
|
)
|
|||
|
Net rental expense
|
$
|
40.1
|
|
$
|
36.8
|
|
$
|
26.0
|
|
Future minimum lease commitments under non-cancelable operating leases, principally related to facilities, machinery, equipment and vehicles as of
December 31, 2017
were as follows:
|
In millions
|
2018
|
2019
|
2020
|
2021
|
2022
|
Thereafter
|
Total
|
||||||||||||||
|
Minimum lease payments
|
$
|
34.3
|
|
$
|
29.1
|
|
$
|
21.2
|
|
$
|
15.6
|
|
$
|
13.1
|
|
$
|
15.1
|
|
$
|
128.4
|
|
|
Minimum sublease rentals
|
(0.3
|
)
|
—
|
|
—
|
|
—
|
|
—
|
|
—
|
|
(0.3
|
)
|
|||||||
|
Net future minimum lease commitments
|
$
|
34.0
|
|
$
|
29.1
|
|
$
|
21.2
|
|
$
|
15.6
|
|
$
|
13.1
|
|
$
|
15.1
|
|
$
|
128.1
|
|
Other matters
In addition to the matters described above, from time to time, we are subject to disputes, administrative proceedings and other claims arising out of the normal conduct of our business. These matters generally relate to disputes arising out of the use or installation of our products, product liability litigation, personal injury claims, commercial and contract disputes and employment related matters. On the basis of information currently available to it, management does not believe that existing proceedings and claims will have a material impact on our Consolidated Financial Statements. However, litigation is unpredictable, and we could incur judgments or enter into settlements for current or future claims that could adversely affect our financial statements.
Warranties and guarantees
In connection with the disposition of our businesses or product lines, we may agree to indemnify purchasers for various potential liabilities relating to the sold business, such as pre-closing tax, product liability, warranty, environmental, or other obligations. The subject matter, amounts and duration of any such indemnification obligations vary for each type of liability indemnified and may vary widely from transaction to transaction.
75
Pentair plc and Subsidiaries
Notes to consolidated financial statements
Generally, the maximum obligation under such indemnifications is not explicitly stated and as a result, the overall amount of these obligations cannot be reasonably estimated. Historically, we have not made significant payments for these indemnifications. We believe that if we were to incur a loss in any of these matters, the loss would not have a material effect on our financial position, results of operations or cash flows.
We recognize, at the inception of a guarantee, a liability for the fair value of the obligation undertaken in issuing the guarantee. In connection with the disposition of the Valves & Controls business, we agreed to indemnify Emerson Electric Co. for certain pre-closing tax liabilities. During the second quarter of 2017, we recorded a liability representing the fair value of our expected future obligation for this matter.
We provide service and warranty policies on our products. Liability under service and warranty policies is based upon a review of historical warranty and service claim experience. Adjustments are made to accruals as claim data and historical experience warrant.
The changes in the carrying amount of service and product warranties for the years ended
December 31, 2017
and
2016
were as follows:
|
Years ended December 31
|
||||||
|
In millions
|
2017
|
2016
|
||||
|
Beginning balance
|
$
|
38.9
|
|
$
|
47.0
|
|
|
Service and product warranty provision
|
64.1
|
|
59.7
|
|
||
|
Payments
|
(62.7
|
)
|
(67.3
|
)
|
||
|
Foreign currency translation
|
0.7
|
|
(0.5
|
)
|
||
|
Ending balance
|
$
|
41.0
|
|
$
|
38.9
|
|
Stand-by letters of credit, bank guarantees and bonds
In certain situations, Tyco guaranteed Flow Control's performance to third parties or provided financial guarantees for financial commitments of Flow Control. "Flow Control" refers to Pentair Ltd. prior to the Merger. In situations where Flow Control and Tyco were unable to obtain a release from these guarantees in connection with the spin-off of Flow Control from Tyco, we will indemnify Tyco for any losses it suffers as a result of such guarantees.
In disposing of assets or businesses, we often provide representations, warranties and indemnities to cover various risks including unknown damage to the assets, environmental risks involved in the sale of real estate, liability to investigate and remediate environmental contamination at waste disposal sites and manufacturing facilities and unidentified tax liabilities and legal fees related to periods prior to disposition. We do not have the ability to reasonably estimate the potential liability due to the inchoate and unknown nature of these potential liabilities. However, we have no reason to believe that these uncertainties would have a material adverse effect on our financial position, results of operations or cash flows.
In the ordinary course of business, we are required to commit to bonds, letters of credit and bank guarantees that require payments to our customers for any non-performance. The outstanding face value of these instruments fluctuates with the value of our projects in process and in our backlog. In addition, we issue financial stand-by letters of credit primarily to secure our performance to third parties under self-insurance programs.
As of
December 31, 2017
and
2016
, the outstanding value of bonds, letters of credit and bank guarantees totaled
$201.5 million
and
$331.0 million
, respectively.
76
Pentair plc and Subsidiaries
Notes to consolidated financial statements
|
18.
|
Selected Quarterly Data (Unaudited)
|
The following tables present
2017
and
2016
quarterly financial information:
|
|
2017
|
||||||||||||||
|
In millions, except per-share data
|
First
Quarter
|
Second
Quarter
|
Third
Quarter
|
Fourth
Quarter
|
Full
Year
|
||||||||||
|
Net sales
|
$
|
1,183.5
|
|
$
|
1,265.3
|
|
$
|
1,226.8
|
|
$
|
1,260.9
|
|
$
|
4,936.5
|
|
|
Gross profit
|
422.3
|
|
483.2
|
|
455.3
|
|
468.3
|
|
1,829.1
|
|
|||||
|
Operating income
|
138.4
|
|
212.8
|
|
192.2
|
|
137.4
|
|
680.8
|
|
|||||
|
Net income from continuing operations
|
80.7
|
|
68.3
|
|
127.1
|
|
203.9
|
|
480.0
|
|
|||||
|
Income (loss) from discontinued operations, net of tax
|
7.1
|
|
(5.2
|
)
|
—
|
|
3.5
|
|
5.4
|
|
|||||
|
Gain (loss) from sale of discontinued operations, net of tax
|
—
|
|
200.6
|
|
(1.7
|
)
|
(17.8
|
)
|
181.1
|
|
|||||
|
Net income
|
87.8
|
|
263.7
|
|
125.4
|
|
189.6
|
|
666.5
|
|
|||||
|
Earnings per ordinary share
(1)
|
|||||||||||||||
|
Basic
|
|||||||||||||||
|
Continuing operations
|
$
|
0.44
|
|
$
|
0.38
|
|
$
|
0.70
|
|
$
|
1.12
|
|
$
|
2.64
|
|
|
Discontinued operations
|
0.04
|
|
1.07
|
|
(0.01
|
)
|
(0.07
|
)
|
1.03
|
|
|||||
|
Basic earnings per ordinary share
|
$
|
0.48
|
|
$
|
1.45
|
|
$
|
0.69
|
|
$
|
1.05
|
|
$
|
3.67
|
|
|
Diluted
|
|||||||||||||||
|
Continuing operations
|
$
|
0.44
|
|
$
|
0.37
|
|
$
|
0.69
|
|
$
|
1.11
|
|
$
|
2.61
|
|
|
Discontinued operations
|
0.04
|
|
1.06
|
|
(0.01
|
)
|
(0.07
|
)
|
1.02
|
|
|||||
|
Diluted earnings per ordinary share
|
$
|
0.48
|
|
$
|
1.43
|
|
$
|
0.68
|
|
$
|
1.04
|
|
$
|
3.63
|
|
|
|
2016
|
||||||||||||||
|
In millions, except per-share data
|
First
Quarter
|
Second
Quarter
|
Third
Quarter
|
Fourth
Quarter
|
Full
Year
|
||||||||||
|
Net sales
|
$
|
1,190.0
|
|
$
|
1,301.2
|
|
$
|
1,210.7
|
|
$
|
1,188.1
|
|
$
|
4,890.0
|
|
|
Gross profit
|
431.3
|
|
481.8
|
|
440.9
|
|
440.1
|
|
1,794.1
|
|
|||||
|
Operating income
|
152.7
|
|
203.4
|
|
182.8
|
|
161.8
|
|
700.7
|
|
|||||
|
Net income from continuing operations
|
91.8
|
|
132.7
|
|
117.5
|
|
109.6
|
|
451.6
|
|
|||||
|
Income from discontinued operations, net of tax
|
15.6
|
|
10.1
|
|
22.9
|
|
21.4
|
|
70.0
|
|
|||||
|
Gain from sale of discontinued operations, net of tax
|
—
|
|
—
|
|
0.6
|
|
—
|
|
0.6
|
|
|||||
|
Net income
|
107.4
|
|
142.8
|
|
141.0
|
|
131.0
|
|
522.2
|
|
|||||
|
Earnings per ordinary share
(1)
|
|||||||||||||||
|
Basic
|
|||||||||||||||
|
Continuing operations
|
$
|
0.50
|
|
$
|
0.73
|
|
$
|
0.65
|
|
$
|
0.60
|
|
$
|
2.49
|
|
|
Discontinued operations
|
0.09
|
|
0.06
|
|
0.13
|
|
0.12
|
|
0.39
|
|
|||||
|
Basic earnings per ordinary share
|
$
|
0.59
|
|
$
|
0.79
|
|
$
|
0.78
|
|
$
|
0.72
|
|
$
|
2.88
|
|
|
Diluted
|
|||||||||||||||
|
Continuing operations
|
$
|
0.50
|
|
$
|
0.73
|
|
$
|
0.64
|
|
$
|
0.60
|
|
$
|
2.47
|
|
|
Discontinued operations
|
0.09
|
|
0.05
|
|
0.13
|
|
0.11
|
|
0.38
|
|
|||||
|
Diluted earnings per ordinary share
|
$
|
0.59
|
|
$
|
0.78
|
|
$
|
0.77
|
|
$
|
0.71
|
|
$
|
2.85
|
|
|
(1)
|
Amounts may not total to annual earnings because each quarter and year are calculated separately based on basic and diluted weighted-average ordinary shares outstanding during that period.
|
Fourth quarter 2017 includes decreases in operating income due to
$30.7 million
of separation costs,
$25.2 million
of trade name and other impairment charges and
$1.6 million
of "mark-to-market" actuarial losses on pension and other post-retirement benefit plans. Second quarter 2017 includes decreases in net income from continuing operations due to a
$101.4 million
loss on early extinguishment of debt. First quarter 2017 includes decreases in operating income due to
$20.9 million
of restructuring
77
Pentair plc and Subsidiaries
Notes to consolidated financial statements
and other costs. Fourth quarter 2016 includes decreases in operating income due to trade name impairment charges of
$13.3 million
in Electrical and "mark-to-market" actuarial losses on pension and other post-retirement benefit plans of
$4.2 million
.
|
19.
|
Supplemental Guarantor Information
|
Pentair plc (the "Parent Company Guarantor") and Pentair Investments Switzerland GmbH (the "Subsidiary Guarantor"), fully and unconditionally, guarantee the Notes of Pentair Finance S.à r.l. (the "Subsidiary Issuer"). The Subsidiary Guarantor is a Switzerland limited liability company formed in April 2014 and
100 percent
-owned subsidiary of the Parent Company Guarantor. The Subsidiary Issuer is a Luxembourg public limited liability company formed in January 2012 and
100 percent
-owned subsidiary of the Subsidiary Guarantor. The guarantees provided by the Parent Company Guarantor and Subsidiary Guarantor are joint and several.
The following supplemental financial information sets forth the Company's Condensed Consolidating Statement of Operations and Comprehensive Income (Loss) and Condensed Consolidating Statement of Cash Flows for the years ended
December 31, 2017
,
2016
and
2015
and Condensed Consolidating Balance Sheet as of
December 31, 2017
and
2016
. Condensed Consolidating financial information for Pentair plc, Pentair Investments Switzerland GmbH and Pentair Finance S.à r.l. on a stand-alone basis is presented using the equity method of accounting for subsidiaries.
78
Pentair plc and Subsidiaries
Notes to consolidated financial statements
Pentair plc and Subsidiaries
Condensed Consolidating Statement of Operations and Comprehensive Income (Loss)
Year Ended December 31, 2017
|
In millions
|
Parent
Company
Guarantor
|
Subsidiary
Guarantor
|
Subsidiary
Issuer
|
Non-guarantor
Subsidiaries
|
Eliminations
|
Consolidated
Total
|
||||||||||||
|
Net sales
|
$
|
—
|
|
$
|
—
|
|
$
|
—
|
|
$
|
4,936.5
|
|
$
|
—
|
|
$
|
4,936.5
|
|
|
Cost of goods sold
|
—
|
|
—
|
|
—
|
|
3,107.4
|
|
—
|
|
3,107.4
|
|
||||||
|
Gross profit
|
—
|
|
—
|
|
—
|
|
1,829.1
|
|
—
|
|
1,829.1
|
|
||||||
|
Selling, general and administrative
|
4.1
|
|
0.6
|
|
—
|
|
1,027.8
|
|
—
|
|
1,032.5
|
|
||||||
|
Research and development
|
—
|
|
—
|
|
—
|
|
115.8
|
|
—
|
|
115.8
|
|
||||||
|
Operating (loss) income
|
(4.1
|
)
|
(0.6
|
)
|
—
|
|
685.5
|
|
—
|
|
680.8
|
|
||||||
|
Loss (earnings) from continuing operations of investment in subsidiaries
|
(483.2
|
)
|
(482.6
|
)
|
(644.4
|
)
|
—
|
|
1,610.2
|
|
—
|
|
||||||
|
Other (income) expense:
|
||||||||||||||||||
|
Loss on sale of businesses
|
—
|
|
—
|
|
—
|
|
4.2
|
|
—
|
|
4.2
|
|
||||||
|
Loss on early extinguishment of debt
|
—
|
|
—
|
|
91.0
|
|
10.4
|
|
—
|
|
101.4
|
|
||||||
|
Equity income of unconsolidated subsidiaries
|
—
|
|
—
|
|
—
|
|
(1.3
|
)
|
—
|
|
(1.3
|
)
|
||||||
|
Interest income
|
—
|
|
(0.6
|
)
|
(69.2
|
)
|
(63.7
|
)
|
123.6
|
|
(9.9
|
)
|
||||||
|
Interest expense
|
—
|
|
—
|
|
139.9
|
|
80.9
|
|
(123.6
|
)
|
97.2
|
|
||||||
|
Income (loss) from continuing operations before income taxes
|
479.1
|
|
482.6
|
|
482.7
|
|
655.0
|
|
(1,610.2
|
)
|
489.2
|
|
||||||
|
Provision (benefit) for income taxes
|
(0.9
|
)
|
—
|
|
—
|
|
10.1
|
|
—
|
|
9.2
|
|
||||||
|
Net income (loss) from continuing operations
|
480.0
|
|
482.6
|
|
482.7
|
|
644.9
|
|
(1,610.2
|
)
|
480.0
|
|
||||||
|
Income from discontinued operations, net of tax
|
—
|
|
—
|
|
—
|
|
5.4
|
|
—
|
|
5.4
|
|
||||||
|
Gain from sale of discontinued operations, net of tax
|
—
|
|
—
|
|
—
|
|
181.1
|
|
—
|
|
181.1
|
|
||||||
|
Earnings (loss) from discontinued operations of investment in subsidiaries
|
186.5
|
|
186.5
|
|
186.5
|
|
—
|
|
(559.5
|
)
|
—
|
|
||||||
|
Net income (loss)
|
$
|
666.5
|
|
$
|
669.1
|
|
$
|
669.2
|
|
$
|
831.4
|
|
$
|
(2,169.7
|
)
|
$
|
666.5
|
|
|
Comprehensive income (loss), net of tax
|
||||||||||||||||||
|
Net income (loss)
|
$
|
666.5
|
|
$
|
669.1
|
|
$
|
669.2
|
|
$
|
831.4
|
|
$
|
(2,169.7
|
)
|
$
|
666.5
|
|
|
Changes in cumulative translation adjustment
|
497.5
|
|
497.5
|
|
497.5
|
|
497.5
|
|
(1,492.5
|
)
|
497.5
|
|
||||||
|
Changes in market value of derivative financial instruments, net of tax
|
(4.6
|
)
|
(4.6
|
)
|
(4.6
|
)
|
(4.6
|
)
|
13.8
|
|
(4.6
|
)
|
||||||
|
Comprehensive income (loss)
|
$
|
1,159.4
|
|
$
|
1,162.0
|
|
$
|
1,162.1
|
|
$
|
1,324.3
|
|
$
|
(3,648.4
|
)
|
$
|
1,159.4
|
|
79
Pentair plc and Subsidiaries
Notes to consolidated financial statements
Pentair plc and Subsidiaries
Condensed Consolidating Balance Sheet
December 31, 2017
|
In millions
|
Parent
Company
Guarantor
|
Subsidiary
Guarantor
|
Subsidiary
Issuer
|
Non-guarantor
Subsidiaries
|
Eliminations
|
Consolidated
Total
|
||||||||||||
|
Assets
|
||||||||||||||||||
|
Current assets
|
||||||||||||||||||
|
Cash and cash equivalents
|
$
|
—
|
|
$
|
—
|
|
$
|
—
|
|
$
|
113.3
|
|
$
|
—
|
|
$
|
113.3
|
|
|
Accounts and notes receivable, net
|
—
|
|
—
|
|
—
|
|
831.6
|
|
—
|
|
831.6
|
|
||||||
|
Inventories
|
—
|
|
—
|
|
—
|
|
581.0
|
|
—
|
|
581.0
|
|
||||||
|
Other current assets
|
10.8
|
|
1.8
|
|
1.5
|
|
239.3
|
|
(30.5
|
)
|
222.9
|
|
||||||
|
Total current assets
|
10.8
|
|
1.8
|
|
1.5
|
|
1,765.2
|
|
(30.5
|
)
|
1,748.8
|
|
||||||
|
Property, plant and equipment, net
|
—
|
|
—
|
|
—
|
|
545.5
|
|
—
|
|
545.5
|
|
||||||
|
Other assets
|
||||||||||||||||||
|
Investments in subsidiaries
|
5,205.1
|
|
5,109.6
|
|
7,156.1
|
|
—
|
|
(17,470.8
|
)
|
—
|
|
||||||
|
Goodwill
|
—
|
|
—
|
|
—
|
|
4,351.1
|
|
—
|
|
4,351.1
|
|
||||||
|
Intangibles, net
|
—
|
|
—
|
|
—
|
|
1,558.4
|
|
—
|
|
1,558.4
|
|
||||||
|
Long-term intercompany debt
|
—
|
|
94.1
|
|
614.0
|
|
(708.1
|
)
|
—
|
|
—
|
|
||||||
|
Other non-current assets
|
2.2
|
|
—
|
|
—
|
|
2,317.1
|
|
(1,889.4
|
)
|
429.9
|
|
||||||
|
Total other assets
|
5,207.3
|
|
5,203.7
|
|
7,770.1
|
|
7,518.5
|
|
(19,360.2
|
)
|
6,339.4
|
|
||||||
|
Total assets
|
$
|
5,218.1
|
|
$
|
5,205.5
|
|
$
|
7,771.6
|
|
$
|
9,829.2
|
|
$
|
(19,390.7
|
)
|
$
|
8,633.7
|
|
|
Liabilities and Equity
|
||||||||||||||||||
|
Current liabilities
|
||||||||||||||||||
|
Accounts payable
|
1.4
|
|
—
|
|
—
|
|
494.3
|
|
—
|
|
495.7
|
|
||||||
|
Employee compensation and benefits
|
0.4
|
|
—
|
|
—
|
|
186.2
|
|
—
|
|
186.6
|
|
||||||
|
Other current liabilities
|
99.6
|
|
0.4
|
|
9.4
|
|
438.2
|
|
(30.5
|
)
|
517.1
|
|
||||||
|
Total current liabilities
|
101.4
|
|
0.4
|
|
9.4
|
|
1,118.7
|
|
(30.5
|
)
|
1,199.4
|
|
||||||
|
Other liabilities
|
||||||||||||||||||
|
Long-term debt
|
48.4
|
|
—
|
|
2,652.8
|
|
628.9
|
|
(1,889.4
|
)
|
1,440.7
|
|
||||||
|
Pension and other post-retirement compensation and benefits
|
—
|
|
—
|
|
—
|
|
285.6
|
|
—
|
|
285.6
|
|
||||||
|
Deferred tax liabilities
|
—
|
|
—
|
|
—
|
|
394.8
|
|
—
|
|
394.8
|
|
||||||
|
Other non-current liabilities
|
30.5
|
|
—
|
|
—
|
|
244.9
|
|
—
|
|
275.4
|
|
||||||
|
Total liabilities
|
180.3
|
|
0.4
|
|
2,662.2
|
|
2,672.9
|
|
(1,919.9
|
)
|
3,595.9
|
|
||||||
|
Equity
|
5,037.8
|
|
5,205.1
|
|
5,109.4
|
|
7,156.3
|
|
(17,470.8
|
)
|
5,037.8
|
|
||||||
|
Total liabilities and equity
|
$
|
5,218.1
|
|
$
|
5,205.5
|
|
$
|
7,771.6
|
|
$
|
9,829.2
|
|
$
|
(19,390.7
|
)
|
$
|
8,633.7
|
|
80
Pentair plc and Subsidiaries
Notes to consolidated financial statements
Pentair plc and Subsidiaries
Condensed Consolidating Statement of Cash Flows
Year Ended December 31, 2017
|
In millions
|
Parent
Company
Guarantor
|
Subsidiary
Guarantor
|
Subsidiary
Issuer
|
Non-guarantor
Subsidiaries
|
Eliminations
|
Consolidated
Total
|
||||||||||||
|
Operating activities
|
||||||||||||||||||
|
Net cash provided by (used for) operating activities
|
$
|
677.0
|
|
$
|
670.6
|
|
$
|
661.3
|
|
$
|
781.0
|
|
$
|
(2,169.7
|
)
|
$
|
620.2
|
|
|
Investing activities
|
||||||||||||||||||
|
Capital expenditures
|
—
|
|
—
|
|
—
|
|
(70.9
|
)
|
—
|
|
(70.9
|
)
|
||||||
|
Proceeds from sale of property and equipment
|
—
|
|
—
|
|
—
|
|
7.9
|
|
—
|
|
7.9
|
|
||||||
|
Proceeds from sale of businesses
|
—
|
|
—
|
|
2,765.6
|
|
(6.2
|
)
|
—
|
|
2,759.4
|
|
||||||
|
Acquisitions, net of cash acquired
|
—
|
|
—
|
|
—
|
|
(59.5
|
)
|
—
|
|
(59.5
|
)
|
||||||
|
Net intercompany loan activity
|
—
|
|
(58.9
|
)
|
103.7
|
|
172.6
|
|
(217.4
|
)
|
—
|
|
||||||
|
Net cash provided by (used for) investing activities of continuing operations
|
—
|
|
(58.9
|
)
|
2,869.3
|
|
43.9
|
|
(217.4
|
)
|
2,636.9
|
|
||||||
|
Net cash provided by (used for) investing activities of discontinued operations
|
—
|
|
—
|
|
—
|
|
(6.5
|
)
|
—
|
|
(6.5
|
)
|
||||||
|
Net cash provided by (used for) investing activities
|
—
|
|
(58.9
|
)
|
2,869.3
|
|
37.4
|
|
(217.4
|
)
|
2,630.4
|
|
||||||
|
Financing activities
|
||||||||||||||||||
|
Net repayments of short-term borrowings
|
—
|
|
—
|
|
—
|
|
(0.8
|
)
|
—
|
|
(0.8
|
)
|
||||||
|
Net receipts (repayments) of commercial paper and revolving long-term debt
|
—
|
|
—
|
|
(914.7
|
)
|
1.6
|
|
—
|
|
(913.1
|
)
|
||||||
|
Repayment of long-term debt
|
—
|
|
—
|
|
(1,917.8
|
)
|
(91.5
|
)
|
—
|
|
(2,009.3
|
)
|
||||||
|
Premium paid on early extinguishment of debt
|
—
|
|
—
|
|
(86.0
|
)
|
(8.9
|
)
|
—
|
|
(94.9
|
)
|
||||||
|
Net change in advances to subsidiaries
|
(262.5
|
)
|
(611.7
|
)
|
(685.9
|
)
|
(827.0
|
)
|
2,387.1
|
|
—
|
|
||||||
|
Shares issued to employees, net of shares withheld
|
37.2
|
|
—
|
|
—
|
|
—
|
|
—
|
|
37.2
|
|
||||||
|
Repurchases of ordinary shares
|
(200.0
|
)
|
—
|
|
—
|
|
—
|
|
—
|
|
(200.0
|
)
|
||||||
|
Dividends paid
|
(251.7
|
)
|
—
|
|
—
|
|
—
|
|
—
|
|
(251.7
|
)
|
||||||
|
Net cash provided by (used for) financing activities
|
(677.0
|
)
|
(611.7
|
)
|
(3,604.4
|
)
|
(926.6
|
)
|
2,387.1
|
|
(3,432.6
|
)
|
||||||
|
Effect of exchange rate changes on cash and cash equivalents
|
—
|
|
—
|
|
73.8
|
|
(17.0
|
)
|
—
|
|
56.8
|
|
||||||
|
Change in cash and cash equivalents
|
—
|
|
—
|
|
—
|
|
(125.2
|
)
|
—
|
|
(125.2
|
)
|
||||||
|
Cash and cash equivalents, beginning of year
|
—
|
|
—
|
|
—
|
|
238.5
|
|
—
|
|
238.5
|
|
||||||
|
Cash and cash equivalents, end of year
|
$
|
—
|
|
$
|
—
|
|
$
|
—
|
|
$
|
113.3
|
|
$
|
—
|
|
$
|
113.3
|
|
81
Pentair plc and Subsidiaries
Notes to consolidated financial statements
Pentair plc and Subsidiaries
Condensed Consolidating Statement of Operations and Comprehensive Income (Loss)
Year Ended
December 31, 2016
|
In millions
|
Parent
Company
Guarantor
|
Subsidiary
Guarantor
|
Subsidiary
Issuer
|
Non-guarantor
Subsidiaries
|
Eliminations
|
Consolidated
Total
|
||||||||||||
|
Net sales
|
$
|
—
|
|
$
|
—
|
|
$
|
—
|
|
$
|
4,890.0
|
|
$
|
—
|
|
$
|
4,890.0
|
|
|
Cost of goods sold
|
—
|
|
—
|
|
—
|
|
3,095.9
|
|
—
|
|
3,095.9
|
|
||||||
|
Gross profit
|
—
|
|
—
|
|
—
|
|
1,794.1
|
|
—
|
|
1,794.1
|
|
||||||
|
Selling, general and administrative
|
15.8
|
|
—
|
|
1.2
|
|
962.3
|
|
—
|
|
979.3
|
|
||||||
|
Research and development
|
—
|
|
—
|
|
—
|
|
114.1
|
|
—
|
|
114.1
|
|
||||||
|
Operating (loss) income
|
(15.8
|
)
|
—
|
|
(1.2
|
)
|
717.7
|
|
—
|
|
700.7
|
|
||||||
|
Loss (earnings) from continuing operations of investment in subsidiaries
|
(466.0
|
)
|
(466.0
|
)
|
(578.1
|
)
|
—
|
|
1,510.1
|
|
—
|
|
||||||
|
Other (income) expense:
|
||||||||||||||||||
|
Loss on sale of businesses
|
—
|
|
—
|
|
—
|
|
3.9
|
|
—
|
|
3.9
|
|
||||||
|
Equity income of unconsolidated subsidiaries
|
—
|
|
—
|
|
—
|
|
(4.3
|
)
|
—
|
|
(4.3
|
)
|
||||||
|
Interest income
|
—
|
|
—
|
|
(70.3
|
)
|
(54.5
|
)
|
116.5
|
|
(8.3
|
)
|
||||||
|
Interest expense
|
—
|
|
—
|
|
181.2
|
|
83.7
|
|
(116.5
|
)
|
148.4
|
|
||||||
|
Income (loss) from continuing operations before income taxes
|
450.2
|
|
466.0
|
|
466.0
|
|
688.9
|
|
(1,510.1
|
)
|
561.0
|
|
||||||
|
Provision (benefit) for income taxes
|
(1.4
|
)
|
—
|
|
—
|
|
110.8
|
|
—
|
|
109.4
|
|
||||||
|
Net income (loss) from continuing operations
|
451.6
|
|
466.0
|
|
466.0
|
|
578.1
|
|
(1,510.1
|
)
|
451.6
|
|
||||||
|
Income from discontinued operations, net of tax
|
—
|
|
—
|
|
—
|
|
70.0
|
|
—
|
|
70.0
|
|
||||||
|
Gain from sale of discontinued operations, net of tax
|
—
|
|
—
|
|
—
|
|
0.6
|
|
—
|
|
0.6
|
|
||||||
|
Earnings (loss) from discontinued operations of investment in subsidiaries
|
70.6
|
|
70.6
|
|
70.6
|
|
—
|
|
(211.8
|
)
|
—
|
|
||||||
|
Net income (loss)
|
$
|
522.2
|
|
$
|
536.6
|
|
$
|
536.6
|
|
$
|
648.7
|
|
$
|
(1,721.9
|
)
|
$
|
522.2
|
|
|
Comprehensive income (loss), net of tax
|
||||||||||||||||||
|
Net income (loss)
|
$
|
522.2
|
|
$
|
536.6
|
|
$
|
536.6
|
|
$
|
648.7
|
|
$
|
(1,721.9
|
)
|
$
|
522.2
|
|
|
Changes in cumulative translation adjustment
|
(83.0
|
)
|
(83.0
|
)
|
(83.0
|
)
|
(83.0
|
)
|
249.0
|
|
(83.0
|
)
|
||||||
|
Changes in market value of derivative financial instruments, net of tax
|
(8.3
|
)
|
(8.3
|
)
|
(8.3
|
)
|
(8.3
|
)
|
24.9
|
|
(8.3
|
)
|
||||||
|
Comprehensive income (loss)
|
$
|
430.9
|
|
$
|
445.3
|
|
$
|
445.3
|
|
$
|
557.4
|
|
$
|
(1,448.0
|
)
|
$
|
430.9
|
|
82
Pentair plc and Subsidiaries
Notes to consolidated financial statements
Pentair plc and Subsidiaries
Condensed Consolidating Balance Sheet
December 31, 2016
|
In millions
|
Parent
Company
Guarantor
|
Subsidiary
Guarantor
|
Subsidiary
Issuer
|
Non-guarantor
Subsidiaries
|
Eliminations
|
Consolidated
Total
|
||||||||||||
|
Assets
|
||||||||||||||||||
|
Current assets
|
||||||||||||||||||
|
Cash and cash equivalents
|
$
|
—
|
|
$
|
—
|
|
$
|
—
|
|
$
|
238.5
|
|
$
|
—
|
|
$
|
238.5
|
|
|
Accounts and notes receivable, net
|
0.1
|
|
—
|
|
—
|
|
763.9
|
|
—
|
|
764.0
|
|
||||||
|
Inventories
|
—
|
|
—
|
|
—
|
|
524.2
|
|
—
|
|
524.2
|
|
||||||
|
Other current assets
|
1.2
|
|
4.1
|
|
1.1
|
|
237.8
|
|
9.2
|
|
253.4
|
|
||||||
|
Current assets held for sale
|
—
|
|
—
|
|
—
|
|
891.9
|
|
—
|
|
891.9
|
|
||||||
|
Total current assets
|
1.3
|
|
4.1
|
|
1.1
|
|
2,656.3
|
|
9.2
|
|
2,672.0
|
|
||||||
|
Property, plant and equipment, net
|
—
|
|
—
|
|
—
|
|
538.6
|
|
—
|
|
538.6
|
|
||||||
|
Other assets
|
||||||||||||||||||
|
Investments in subsidiaries
|
4,509.5
|
|
4,471.4
|
|
9,295.5
|
|
—
|
|
(18,276.4
|
)
|
—
|
|
||||||
|
Goodwill
|
—
|
|
—
|
|
—
|
|
4,217.4
|
|
—
|
|
4,217.4
|
|
||||||
|
Intangibles, net
|
—
|
|
—
|
|
—
|
|
1,631.8
|
|
—
|
|
1,631.8
|
|
||||||
|
Other non-current assets
|
2.2
|
|
35.2
|
|
717.8
|
|
1,568.9
|
|
(2,142.0
|
)
|
182.1
|
|
||||||
|
Non-current assets held for sale
|
—
|
|
—
|
|
—
|
|
2,292.9
|
|
—
|
|
2,292.9
|
|
||||||
|
Total other assets
|
4,511.7
|
|
4,506.6
|
|
10,013.3
|
|
9,711.0
|
|
(20,418.4
|
)
|
8,324.2
|
|
||||||
|
Total assets
|
$
|
4,513.0
|
|
$
|
4,510.7
|
|
$
|
10,014.4
|
|
$
|
12,905.9
|
|
$
|
(20,409.2
|
)
|
$
|
11,534.8
|
|
|
Liabilities and Equity
|
||||||||||||||||||
|
Current liabilities
|
||||||||||||||||||
|
Current maturities of long-term debt and short-term borrowings
|
$
|
—
|
|
$
|
—
|
|
$
|
—
|
|
$
|
0.8
|
|
$
|
—
|
|
$
|
0.8
|
|
|
Accounts payable
|
$
|
0.7
|
|
$
|
—
|
|
$
|
0.1
|
|
$
|
435.8
|
|
$
|
—
|
|
$
|
436.6
|
|
|
Employee compensation and benefits
|
0.8
|
|
—
|
|
—
|
|
165.3
|
|
—
|
|
166.1
|
|
||||||
|
Other current liabilities
|
95.2
|
|
1.2
|
|
26.7
|
|
379.2
|
|
9.2
|
|
511.5
|
|
||||||
|
Current liabilities held for sale
|
—
|
|
—
|
|
—
|
|
356.2
|
|
—
|
|
356.2
|
|
||||||
|
Total current liabilities
|
96.7
|
|
1.2
|
|
26.8
|
|
1,337.3
|
|
9.2
|
|
1,471.2
|
|
||||||
|
Other liabilities
|
||||||||||||||||||
|
Long-term debt
|
148.1
|
|
—
|
|
5,515.9
|
|
756.4
|
|
(2,142.0
|
)
|
4,278.4
|
|
||||||
|
Pension and other post-retirement compensation and benefits
|
—
|
|
—
|
|
—
|
|
253.4
|
|
—
|
|
253.4
|
|
||||||
|
Deferred tax liabilities
|
—
|
|
—
|
|
—
|
|
609.5
|
|
—
|
|
609.5
|
|
||||||
|
Other non-current liabilities
|
13.8
|
|
—
|
|
—
|
|
148.2
|
|
—
|
|
162.0
|
|
||||||
|
Non-current liabilities held for sale
|
—
|
|
—
|
|
—
|
|
505.9
|
|
—
|
|
505.9
|
|
||||||
|
Total liabilities
|
258.6
|
|
1.2
|
|
5,542.7
|
|
3,610.7
|
|
(2,132.8
|
)
|
7,280.4
|
|
||||||
|
Equity
|
4,254.4
|
|
4,509.5
|
|
4,471.7
|
|
9,295.2
|
|
(18,276.4
|
)
|
4,254.4
|
|
||||||
|
Total liabilities and equity
|
$
|
4,513.0
|
|
$
|
4,510.7
|
|
$
|
10,014.4
|
|
$
|
12,905.9
|
|
$
|
(20,409.2
|
)
|
$
|
11,534.8
|
|
83
Pentair plc and Subsidiaries
Notes to consolidated financial statements
Pentair plc and Subsidiaries
Condensed Consolidating Statement of Cash Flows
Year Ended
December 31, 2016
|
In millions
|
Parent
Company
Guarantor
|
Subsidiary
Guarantor
|
Subsidiary
Issuer
|
Non-guarantor
Subsidiaries
|
Eliminations
|
Consolidated
Total
|
||||||||||||
|
Operating activities
|
||||||||||||||||||
|
Net cash provided by (used for) operating activities
|
$
|
522.7
|
|
$
|
463.1
|
|
$
|
469.5
|
|
$
|
916.2
|
|
$
|
(1,510.1
|
)
|
$
|
861.4
|
|
|
Investing activities
|
||||||||||||||||||
|
Capital expenditures
|
—
|
|
—
|
|
—
|
|
(117.8
|
)
|
—
|
|
(117.8
|
)
|
||||||
|
Proceeds from sale of property and equipment
|
—
|
|
—
|
|
—
|
|
24.7
|
|
—
|
|
24.7
|
|
||||||
|
Proceeds from sale of businesses, net
|
—
|
|
—
|
|
—
|
|
(5.2
|
)
|
—
|
|
(5.2
|
)
|
||||||
|
Acquisitions, net of cash acquired
|
—
|
|
—
|
|
—
|
|
(25.0
|
)
|
—
|
|
(25.0
|
)
|
||||||
|
Net intercompany loan activity
|
—
|
|
—
|
|
667.3
|
|
(191.0
|
)
|
(476.3
|
)
|
—
|
|
||||||
|
Net cash provided by (used for) investing activities of continuing operations
|
—
|
|
—
|
|
667.3
|
|
(314.3
|
)
|
(476.3
|
)
|
(123.3
|
)
|
||||||
|
Net cash provided by (used for) investing activities from discontinued operations
|
—
|
|
—
|
|
—
|
|
1.5
|
|
—
|
|
1.5
|
|
||||||
|
Net cash provided by (used for) investing activities
|
—
|
|
—
|
|
667.3
|
|
(312.8
|
)
|
(476.3
|
)
|
(121.8
|
)
|
||||||
|
Financing activities
|
||||||||||||||||||
|
Net receipts of short-term borrowings
|
—
|
|
—
|
|
—
|
|
0.8
|
|
—
|
|
0.8
|
|
||||||
|
Net receipts (repayments) of commercial paper and revolving long-term debt
|
—
|
|
—
|
|
(385.8
|
)
|
0.5
|
|
—
|
|
(385.3
|
)
|
||||||
|
Repayment of long-term debt
|
—
|
|
—
|
|
—
|
|
(0.7
|
)
|
—
|
|
(0.7
|
)
|
||||||
|
Net change in advances to subsidiaries
|
(299.8
|
)
|
(463.1
|
)
|
(778.9
|
)
|
(444.6
|
)
|
1,986.4
|
|
—
|
|
||||||
|
Excess tax benefits from share-based compensation
|
—
|
|
—
|
|
—
|
|
8.0
|
|
—
|
|
8.0
|
|
||||||
|
Shares issued to employees, net of shares withheld
|
20.7
|
|
—
|
|
—
|
|
—
|
|
—
|
|
20.7
|
|
||||||
|
Dividends paid
|
(243.6
|
)
|
—
|
|
—
|
|
—
|
|
—
|
|
(243.6
|
)
|
||||||
|
Net cash provided by (used for) financing activities
|
(522.7
|
)
|
(463.1
|
)
|
(1,164.7
|
)
|
(436.0
|
)
|
1,986.4
|
|
(600.1
|
)
|
||||||
|
Effect of exchange rate changes on cash and cash equivalents
|
—
|
|
—
|
|
27.8
|
|
(55.1
|
)
|
—
|
|
(27.3
|
)
|
||||||
|
Change in cash and cash equivalents
|
—
|
|
—
|
|
(0.1
|
)
|
112.3
|
|
—
|
|
112.2
|
|
||||||
|
Cash and cash equivalents, beginning of year
|
—
|
|
—
|
|
0.1
|
|
126.2
|
|
—
|
|
126.3
|
|
||||||
|
Cash and cash equivalents, end of year
|
$
|
—
|
|
$
|
—
|
|
$
|
—
|
|
$
|
238.5
|
|
$
|
—
|
|
$
|
238.5
|
|
84
Pentair plc and Subsidiaries
Notes to consolidated financial statements
Pentair plc and Subsidiaries
Condensed Consolidating Statement of Operations and Comprehensive Income (Loss)
Year Ended
December 31, 2015
|
In millions
|
Parent
Company
Guarantor
|
Subsidiary
Guarantor
|
Subsidiary
Issuer
|
Non-guarantor
Subsidiaries
|
Eliminations
|
Consolidated
Total
|
||||||||||||
|
Net sales
|
$
|
—
|
|
$
|
—
|
|
$
|
—
|
|
$
|
4,616.4
|
|
$
|
—
|
|
$
|
4,616.4
|
|
|
Cost of goods sold
|
—
|
|
—
|
|
—
|
|
3,017.6
|
|
—
|
|
3,017.6
|
|
||||||
|
Gross profit
|
—
|
|
—
|
|
—
|
|
1,598.8
|
|
—
|
|
1,598.8
|
|
||||||
|
Selling, general and administrative
|
33.7
|
|
2.2
|
|
5.3
|
|
842.8
|
|
—
|
|
884
|
|
||||||
|
Research and development
|
—
|
|
—
|
|
—
|
|
98.7
|
|
—
|
|
98.7
|
|
||||||
|
Operating (loss) income
|
(33.7
|
)
|
(2.2
|
)
|
(5.3
|
)
|
657.3
|
|
—
|
|
616.1
|
|
||||||
|
Loss (earnings) from continuing operations of investment in subsidiaries
|
(436.1
|
)
|
(439.7
|
)
|
(475.1
|
)
|
—
|
|
1,350.9
|
|
—
|
|
||||||
|
Other (income) expense:
|
||||||||||||||||||
|
Loss on sale of businesses
|
—
|
|
—
|
|
—
|
|
3.2
|
|
—
|
|
3.2
|
|
||||||
|
Equity income of unconsolidated subsidiaries
|
—
|
|
—
|
|
—
|
|
(1.5
|
)
|
—
|
|
(1.5
|
)
|
||||||
|
Interest income
|
—
|
|
—
|
|
(80.6
|
)
|
(33.8
|
)
|
109.7
|
|
(4.7
|
)
|
||||||
|
Interest expense
|
—
|
|
1.4
|
|
126.3
|
|
88.6
|
|
(109.7
|
)
|
106.6
|
|
||||||
|
Income (loss) from continuing operations before income taxes
|
402.4
|
|
436.1
|
|
424.1
|
|
600.8
|
|
(1,350.9
|
)
|
512.5
|
|
||||||
|
Provision for income taxes
|
5.3
|
|
—
|
|
—
|
|
110.1
|
|
—
|
|
115.4
|
|
||||||
|
Net income (loss) from continuing operations
|
397.1
|
|
436.1
|
|
424.1
|
|
490.7
|
|
(1,350.9
|
)
|
397.1
|
|
||||||
|
Loss from discontinued operations, net of tax
|
—
|
|
—
|
|
—
|
|
(466.8
|
)
|
—
|
|
(466.8
|
)
|
||||||
|
Loss from sale of discontinued operations, net of tax
|
—
|
|
—
|
|
—
|
|
(6.7
|
)
|
—
|
|
(6.7
|
)
|
||||||
|
Earnings (loss) from discontinued operations of investment in subsidiaries
|
(473.5
|
)
|
(473.5
|
)
|
(473.5
|
)
|
—
|
|
1,420.5
|
|
—
|
|
||||||
|
Net income (loss)
|
$
|
(76.4
|
)
|
$
|
(37.4
|
)
|
$
|
(49.4
|
)
|
$
|
17.2
|
|
$
|
69.6
|
|
$
|
(76.4
|
)
|
|
Comprehensive income (loss), net of tax
|
||||||||||||||||||
|
Net income (loss)
|
$
|
(76.4
|
)
|
$
|
(37.4
|
)
|
$
|
(49.4
|
)
|
$
|
17.2
|
|
$
|
69.6
|
|
$
|
(76.4
|
)
|
|
Changes in cumulative translation adjustment
|
(264.9
|
)
|
(264.9
|
)
|
(264.9
|
)
|
(264.9
|
)
|
794.7
|
|
(264.9
|
)
|
||||||
|
Changes in market value of derivative financial instruments, net of tax
|
0.2
|
|
0.2
|
|
0.2
|
|
0.2
|
|
(0.6
|
)
|
0.2
|
|
||||||
|
Comprehensive income (loss)
|
$
|
(341.1
|
)
|
$
|
(302.1
|
)
|
$
|
(314.1
|
)
|
$
|
(247.5
|
)
|
$
|
863.7
|
|
$
|
(341.1
|
)
|
85
Pentair plc and Subsidiaries
Notes to consolidated financial statements
Pentair plc and Subsidiaries
Condensed Consolidating Statement of Cash Flows
Year Ended
December 31, 2015
|
In millions
|
Parent
Company
Guarantor
|
Subsidiary
Guarantor
|
Subsidiary
Issuer
|
Non-guarantor
Subsidiaries
|
Eliminations
|
Consolidated
Total
|
||||||||||||
|
Operating activities
|
||||||||||||||||||
|
Net cash provided by (used for) operating activities
|
$
|
(43.0
|
)
|
$
|
(48.7
|
)
|
$
|
(5.8
|
)
|
$
|
767.1
|
|
$
|
69.7
|
|
$
|
739.3
|
|
|
Investing activities
|
||||||||||||||||||
|
Capital expenditures
|
—
|
|
—
|
|
—
|
|
(91.3
|
)
|
—
|
|
(91.3
|
)
|
||||||
|
Proceeds from sale of property and equipment
|
—
|
|
—
|
|
—
|
|
4.6
|
|
—
|
|
4.6
|
|
||||||
|
Acquisitions, net of cash acquired
|
—
|
|
—
|
|
—
|
|
(1,913.9
|
)
|
—
|
|
(1,913.9
|
)
|
||||||
|
Net intercompany loan activity
|
—
|
|
—
|
|
891.0
|
|
(295.0
|
)
|
(596.0
|
)
|
—
|
|
||||||
|
Proceeds from sale of businesses and other
|
—
|
|
—
|
|
—
|
|
(3.0
|
)
|
—
|
|
(3.0
|
)
|
||||||
|
Net cash provided by (used for) investing activities of continuing operations
|
—
|
|
—
|
|
891.0
|
|
(2,298.6
|
)
|
(596.0
|
)
|
(2,003.6
|
)
|
||||||
|
Net cash provided by (used for) investing activities of discontinued operations
|
—
|
|
—
|
|
—
|
|
38.1
|
|
—
|
|
38.1
|
|
||||||
|
Net cash provided by (used for) investing activities
|
—
|
|
—
|
|
891.0
|
|
(2,260.5
|
)
|
(596.0
|
)
|
(1,965.5
|
)
|
||||||
|
Financing activities
|
|
|||||||||||||||||
|
Net repayments on short-term borrowings
|
—
|
|
—
|
|
—
|
|
(2.3
|
)
|
—
|
|
(2.3
|
)
|
||||||
|
Net receipts of commercial paper and revolving long-term debt
|
—
|
|
—
|
|
346.9
|
|
16.6
|
|
—
|
|
363.5
|
|
||||||
|
Proceeds from long-term debt
|
—
|
|
—
|
|
1,714.8
|
|
—
|
|
—
|
|
1,714.8
|
|
||||||
|
Repayment of long-term debt
|
—
|
|
—
|
|
(350.0
|
)
|
(6.6
|
)
|
—
|
|
(356.6
|
)
|
||||||
|
Debt issuance costs
|
—
|
|
—
|
|
(26.8
|
)
|
—
|
|
—
|
|
(26.8
|
)
|
||||||
|
Net change in advances to subsidiaries
|
471.7
|
|
48.7
|
|
(2,553.7
|
)
|
1,507.0
|
|
526.3
|
|
—
|
|
||||||
|
Excess tax benefits from share-based compensation
|
—
|
|
—
|
|
—
|
|
6.0
|
|
—
|
|
6.0
|
|
||||||
|
Shares issued to employees, net of shares withheld
|
3.0
|
|
—
|
|
—
|
|
16.4
|
|
—
|
|
19.4
|
|
||||||
|
Repurchases of ordinary shares
|
(200.0
|
)
|
—
|
|
—
|
|
—
|
|
—
|
|
(200.0
|
)
|
||||||
|
Dividends paid
|
(231.7
|
)
|
—
|
|
—
|
|
—
|
|
—
|
|
(231.7
|
)
|
||||||
|
Net cash provided by (used for) financing activities
|
43.0
|
|
48.7
|
|
(868.8
|
)
|
1,537.1
|
|
526.3
|
|
1,286.3
|
|
||||||
|
Effect of exchange rate changes on cash and cash equivalents
|
—
|
|
—
|
|
(16.4
|
)
|
(27.8
|
)
|
—
|
|
(44.2
|
)
|
||||||
|
Change in cash and cash equivalents
|
—
|
|
—
|
|
—
|
|
15.9
|
|
—
|
|
15.9
|
|
||||||
|
Cash and cash equivalents, beginning of year
|
—
|
|
—
|
|
0.1
|
|
110.3
|
|
—
|
|
110.4
|
|
||||||
|
Cash and cash equivalents, end of year
|
$
|
—
|
|
$
|
—
|
|
$
|
0.1
|
|
$
|
126.2
|
|
$
|
—
|
|
$
|
126.3
|
|
86
None.
Our management, with the participation of our Chief Executive Officer and our Chief Financial Officer, evaluated the effectiveness of the design and operation of our disclosure controls and procedures as of the end of the year ended
December 31, 2017
, pursuant to Rule 13a-15(b) of the Securities Exchange Act of 1934 ("the Exchange Act"). Based upon their evaluation, our Chief Executive Officer and our Chief Financial Officer concluded that our disclosure controls and procedures were effective as of the year ended
December 31, 2017
to ensure that information required to be disclosed by us in the reports we file or submit under the Exchange Act is recorded, processed, summarized and reported, within the time periods specified in the Securities and Exchange Commission's rules and forms and to ensure that information required to be disclosed by us in the reports we file or submit under the Exchange Act is accumulated and communicated to our management, including our principal executive and principal financial officers, as appropriate to allow timely decisions regarding required disclosures.
Management's Annual Report on Internal Control Over Financial Reporting
The report of management required under this ITEM 9A is contained in ITEM 8 of this Annual Report on Form 10-K under the caption "Management's Report on Internal Control Over Financial Reporting."
Attestation Report of Independent Registered Public Accounting Firm
The attestation report required under this ITEM 9A is contained in ITEM 8 of this Annual Report on Form 10-K under the caption "Report of Independent Registered Public Accounting Firm."
Changes in Internal Control over Financial Reporting
There was no change in our internal control over financial reporting that occurred during the quarter ended
December 31, 2017
that has materially affected, or is reasonably likely to materially affect, our internal control over financial reporting.
None.
87
Information required under this item with respect to directors is contained in our Proxy Statement for our
2018
annual general meeting of shareholders under the captions "Corporate Governance Matters," "Proposal 1 Re-elect Director Nominees" and "Section 16(a) Beneficial Ownership Reporting Compliance" and is incorporated herein by reference.
Information required under this item with respect to executive officers is contained in Part I of this Form 10-K under the caption "Executive Officers of the Registrant."
Our Board of Directors has adopted Pentair's Code of Business Conduct and Ethics and designated it as the code of ethics for the Company's Chief Executive Officer and senior financial officers. The Code of Business Conduct and Ethics also applies to all employees and directors in accordance with New York Stock Exchange Listing Standards. We have posted a copy of Pentair's Code of Business Conduct and Ethics on our website at
http://pentair.com/en/about-us/leadership/corporate-governance
. We intend to satisfy the disclosure requirements under Item 5.05 of Form 8-K regarding amendments to or waivers from, Pentair's Code of Business Conduct and Ethics by posting such information on our website at
http://pentair.com/en/about-us/leadership/corporate-governance
.
We are not including the information contained on our website as part of, or incorporating it by reference into, this report.
Information required under this item is contained in our Proxy Statement for our
2018
annual general meeting of shareholders under the captions "Compensation Discussion and Analysis," "Compensation Committee Report," "Executive Compensation Tables" and "Corporate Governance Matters - Director Compensation" and is incorporated herein by reference.
88
Information required under this item with respect to security ownership is contained in our Proxy Statement for our
2018
annual general meeting of shareholders under the caption "Security Ownership" and is incorporated herein by reference.
The following table summarizes, as of
December 31, 2017
, information about compensation plans under which our equity securities are authorized for issuance:
|
Plan category
|
Number of securities to
be issued upon exercise
of outstanding options,
warrants and rights
(a)
|
Weighted-average
exercise price of
outstanding options,
warrants and rights
(b)
|
Number of securities
remaining available for
future issuance under
equity compensation
plans (excluding
securities reflected in
column (a))
(c)
|
|||||||
|
Equity compensation plans approved by security holders:
|
||||||||||
|
2012 Stock and Incentive Plan
|
4,542,732
|
|
(1)
|
$
|
57.73
|
|
(2)
|
4,166,037
|
|
(3)
|
|
2008 Omnibus Stock Incentive Plan
|
1,688,173
|
|
(4)
|
32.21
|
|
(2)
|
—
|
|
(5)
|
|
|
2004 Omnibus Stock Incentive Plan
|
6,598
|
|
33.19
|
|
—
|
|
(5)
|
|||
|
Outside Directors Non-qualified Stock Option Plan
|
—
|
|
—
|
|
—
|
|
(5)
|
|||
|
Total
|
6,237,503
|
|
$
|
49.49
|
|
(2)
|
4,166,037
|
|
||
|
(1)
|
Consists of
3,551,120
shares subject to stock options,
537,259
shares subject to restricted stock units, and
454,353
shares subject to performance share awards.
|
|
(2)
|
Represents the weighted average exercise price of outstanding stock options and does not take into account outstanding restricted stock units or performance share units.
|
|
(3)
|
Represents securities remaining available for issuance under the 2012 Stock and Incentive Plan.
|
|
(4)
|
Consists of
1,688,173
shares subject to stock options.
|
|
(5)
|
The 2008 Omnibus Stock Incentive Plan was terminated in 2012. The 2004 Omnibus Plan and the Directors Plan were terminated in 2008. Options previously granted under these plans and restricted stock units granted under the 2008 Omnibus Stock Incentive Plan remain outstanding, but no further options or shares may be granted or issued under either plan.
|
Information required under this item is contained in our Proxy Statement for our
2018
annual general meeting of shareholders under the captions "Proposal 1 Re-elect Director Nominees - Director Independence" and "Corporate Governance Matters - The Board's Role and Responsibilities - Policies and Procedures Regarding Related Person Transactions" and is incorporated herein by reference.
Information required under this item is contained in our Proxy Statement for our
2018
annual general meeting of shareholders under the caption "Proposal 3 Ratify, by Non-Binding Advisory Vote, the Appointment of Deloitte & Touche LLP as the Independent Auditors of Pentair plc and to Authorize, by Binding Vote, the Audit and Finance Committee of the Board of Directors to Set the Auditors' Remuneration" and is incorporated herein by reference.
89
(a) List of documents filed as part of this report:
(1) Financial Statements
Consolidated Statements of Operations and Comprehensive Income (Loss) for the years ended December 31,
2017
,
2016
and
2015
Consolidated Balance Sheets as of
December 31, 2017
and
2016
Consolidated Statements of Cash Flows for the years ended
December 31, 2017
,
2016
and
2015
Consolidated Statements of Changes in Equity for the years ended
December 31, 2017
,
2016
and
2015
Notes to Consolidated Financial Statements
(2) Financial Statement Schedule
Schedule II — Valuation and Qualifying Accounts
All other schedules for which provision is made in the applicable accounting regulations of the Securities and Exchange Commission have been omitted because they are not applicable or the required information is shown in the financial statements or notes thereto.
(3) Exhibits
The exhibits of this Annual Report on Form 10-K included herein are set forth below.
|
Exhibit
Number
|
Exhibit
|
|
|
Agreement and Plan of Merger, dated August 14, 2015, among Pentair plc, Pentair Lionel Acquisition Co., Pentair Lionel Merger Sub, Inc. and ERICO Global Company (Incorporated by reference to Exhibit 2.1 in the Current Report on Form 8-K of Pentair plc filed with the Commission on August 18, 2015 (File No. 001-11625)).
|
||
|
Share Purchase Agreement, dated August 18, 2016, by and between Emerson Electric Co. and Pentair plc (Incorporated by reference to Exhibit 2.1 in the Quarterly Report on Form 10-Q of Pentair plc filed with the Commission on October 25, 2016 (File No. 001-11625)).
|
||
|
Amended and Restated Memorandum and Articles of Association of Pentair plc (Incorporated by reference to Exhibit 3.1 to the Current Report on Form 8-K of Pentair plc filed with the Commission on May 9, 2017 (File No. 001-11625)).
|
||
|
Indenture, dated as of September 24, 2012, among Pentair Finance S.A. (formerly Tyco Flow Control International Finance S.A.) (as Issuer), Pentair Ltd. (as Guarantor) and Wells Fargo Bank, National Association (as Trustee) (Incorporated by reference to Exhibit 4.1 in the Current Report on Form 8-K of Pentair Ltd. filed with the Commission on September 28, 2012 (File No. 001-11625)).
|
||
|
Second Supplemental Indenture, dated as of September 24, 2012, among Pentair Finance S.A. (formerly Tyco Flow Control International Finance S.A.) (as Issuer), Pentair Ltd. (as Guarantor), Pentair, Inc. and Wells Fargo Bank, National Association (as Trustee) (Incorporated by reference to Exhibit 4.3 in the Current Report on Form 8-K of Pentair Ltd. filed with the Commission on September 28, 2012 (File No. 001-11625)).
|
||
|
Fourth Supplemental Indenture, dated as of November 26, 2012, among Pentair Finance S.A. (as Issuer), Pentair Ltd. (as Guarantor) and Wells Fargo Bank, National Association (as Trustee) (Incorporated by reference to Exhibit 4.2 in the Current Report on Form 8-K of Pentair Ltd. filed with the Commission on November 28, 2012 (File No. 001-11625)).
|
||
|
Fifth Supplemental Indenture, dated as of December 18, 2012, among Pentair Finance S.A. (as Issuer), Pentair Ltd. (as Guarantor) and Wells Fargo Bank, National Association (as Trustee) (Incorporated by reference to Exhibit 4.1 in the Current Report on Form 8-K of Pentair Ltd. filed with the Commission on December 18, 2012 (File No. 001-11625)).
|
||
90
|
Sixth Supplemental Indenture, dated as of May 20, 2014, among Pentair Finance S.A., Pentair Ltd., Pentair Investments Switzerland GmbH, Pentair plc and Wells Fargo Bank, National Association, as trustee (Incorporated by reference to Exhibit 4.3 in the Current Report on Form 8-K of Pentair plc filed with the Commission on May 20, 2014 (File No. 001-11625)).
|
||
|
Seventh Supplemental Indenture, dated as of May 26, 2017, among Pentair Finance S.A., Pentair plc, Pentair Investments Switzerland GmbH and Wells Fargo Bank, National Association as trustee (Incorporated by reference to Exhibit 4.1 to the Current Report on Form 8-K of Pentair plc filed with the Commission on May 31, 2017 (File No. 001-11625)).
|
||
|
Senior Indenture, dated May 2, 2011 by and among Pentair, Inc. and Wells Fargo Bank, National Association (Incorporated by reference to Exhibit 4.5 to Pentair, Inc.'s Registration Statement on Form S-3 (Registration 333-173829)).
|
||
|
First Supplemental Indenture, dated as of May 9, 2011, among Pentair, Inc., the guarantors named therein and Wells Fargo Bank, National Association (Incorporated by reference to Exhibit 4.2 in the Current Report on Form 8-K of Pentair, Inc. filed with the Commission on May 9, 2011 (File No. 000-04689)).
|
||
|
Third Supplemental Indenture, dated October 1, 2012, among Pentair Ltd., Pentair, Inc. and Wells Fargo Bank, National Association, as trustee (Incorporated by reference to Exhibit 4.1 in the Current Report on Form 8-K of Pentair Ltd. filed with the Commission on October 1, 2012 (File No. 001-11625)).
|
||
|
Fourth Supplemental Indenture, dated as of December 17, 2012, among Pentair, Inc. (as Issuer), Pentair Ltd. (as Guarantor) and Wells Fargo Bank, National Association (as Trustee) (Incorporated by reference to Exhibit 4.2 in the Current Report on Form 8-K of Pentair Ltd. filed with the Commission on December 18, 2012 (File No. 001-11625)).
|
||
|
Fifth Supplemental Indenture, dated as of May 20, 2014, among Pentair, Inc., Pentair Ltd., Pentair Investments Switzerland GmbH, Pentair plc and Wells Fargo Bank, National Association, as trustee (Incorporated by reference to Exhibit 4.2 in the Current Report on Form 8-K of Pentair plc filed with the Commission on May 20, 2014 (File No. 001-11625)).
|
||
|
Sixth Supplemental Indenture, dated as of May 26, 2017, among Pentair, Inc., Pentair plc, Pentair Investments Switzerland GmbH and Wells Fargo Bank, National Association, as trustee (Incorporated by reference to Exhibit 4.2 to the Current Report on Form 8-K of Pentair plc filed with the Commission on May 31, 2017 (File No. 001-11625)).
|
||
|
Amended and Restated Credit Agreement, dated as of October 3, 2014 among Pentair, plc, Pentair Investments Switzerland GmbH, Pentair Finance, S.A., Pentair, Inc. and the lenders and agents party thereto (Incorporated by reference to Exhibit 4.1 in the Current Report on Form 8-K of Pentair, plc, filed with the Commission on October 3, 2014 (File No. 001-11625)).
|
||
|
First Amendment, dated as of August 28, 2015, among Pentair, Pentair Investments Switzerland GmbH, Pentair Finance S.A. and the lenders and agents party thereto (Incorporated by reference to Exhibit 4.1 to the Current Report on Form 8-K of Pentair plc filed with the SEC on September 3, 2015 (File No. 001-11625)).
|
||
|
Second Amendment, dated as of September 2, 2015, among Pentair, Pentair Investments Switzerland GmbH, Pentair Finance S.A. and the lenders and agents party thereto (Incorporated by reference to Exhibit 4.2 to the Current Report on Form 8-K of Pentair plc filed with the Commission on September 3, 2015 (File No. 001-11625)).
|
||
|
Third Amendment, dated as of September 15, 2016, among Pentair, Pentair Investments Switzerland GmbH, Pentair Finance S.A. and the lenders and agent party thereto (Incorporated by reference to Exhibit 4.1 to the Current Report on Form 8-K of Pentair plc filed with the Commission on September 16, 2016 (File No. 001-11625)).
|
||
|
Indenture, dated as of September 16, 2015, among Pentair Finance S.A. (as Issuer), Pentair plc (as Parent and Guarantor), Pentair Investments Switzerland GmbH (as Guarantor) and U.S. Bank National Association (as Trustee) (Incorporated by reference to Exhibit 4.1 to the Current Report on Form 8-K of Pentair plc filed with the Commission on September 16, 2015 (File No. 001-11625)).
|
||
|
First Supplemental Indenture, dated as of September 16, 2015, among Pentair Finance S.A. (as Issuer), Pentair plc (as Parent and Guarantor), Pentair Investments Switzerland GmbH (as Guarantor) and U.S. Bank National Association (as Trustee) (Incorporated by reference to Exhibit 4.2 to the Current Report on Form 8-K of Pentair plc filed with the SEC on September 16, 2015 (File No. 001-11625)).
|
||
|
Second Supplemental Indenture, dated as of September 16, 2015, among Pentair Finance S.A. (as Issuer), Pentair plc (as Parent and Guarantor), Pentair Investments Switzerland GmbH (as Guarantor) and U.S. Bank National Association (as Trustee) (Incorporated by reference to Exhibit 4.3 to the Current Report on Form 8-K of Pentair plc filed with the Commission on September 16, 2015 (File No. 001-11625)).
|
||
91
|
Third Supplemental Indenture, dated as of September 16, 2015, among Pentair Finance S.A. (as Issuer), Pentair plc (as Parent and Guarantor), Pentair Investments Switzerland GmbH (as Guarantor) and U.S. Bank National Association (as Trustee) (Incorporated by reference to Exhibit 4.4 to the Current Report on Form 8-K of Pentair plc filed with the Commission on September 16, 2015 (File No. 001-11625)).
|
||
|
Fourth Supplemental Indenture, dated as of September 17, 2015, among Pentair Finance S.A. (as Issuer), Pentair plc (as Parent and Guarantor), Pentair Investments Switzerland GmbH (as Guarantor) and U.S. Bank National Association (as Trustee) (Incorporated by reference to Exhibit 4.2 to the Current Report on Form 8-K of Pentair plc filed with the Commission on September 17, 2015 (File No. 001-11625)).
|
||
|
Fifth Supplemental Indenture, dated as of May 26, 2017, among Pentair Finance S.A., Pentair plc, Pentair Investments Switzerland GmbH and U.S. Bank National Association, as trustee (Incorporated by reference to Exhibit 4.3 to the Current Report on Form 8-K of Pentair plc filed with the Commission on May 31, 2017 (File No. 001-11625)).
|
||
|
Tax Sharing Agreement, dated September 28, 2012 by and among Pentair Ltd., Tyco International Ltd. and The ADT Corporation (Incorporated by reference to Exhibit 10.1 in the Current Report on Form 8-K of Pentair Ltd. filed with the Commission on September 28, 2012 (File No. 001-11625)).
|
||
|
Pentair plc 2012 Stock and Incentive Plan, as amended and restated effective as of January 1, 2017. (Incorporated by reference to Exhibit 10.2 to the Annual Report on Form 10-K of Pentair plc for the year ended December 31, 2016 (File No. 001-11625)).*
|
||
|
Form of Executive Officer Stock Option Grant Agreement for grants made prior to January 1, 2017 (Incorporated by reference to Exhibit 10.7 in the Current Report on Form 8-K of Pentair plc filed with the Commission on June 3, 2014 (File No. 001-11625)).*
|
||
|
Form of Executive Officer Restricted Stock Unit Grant Agreement for grants made prior to January 1, 2017 (Incorporated by reference to Exhibit 10.8 in the Current Report on Form 8-K of Pentair plc filed with the Commission on June 3, 2014 (File No. 001-11625)).*
|
||
|
Form of Executive Officer Performance Unit Grant Agreement for grants made prior to January 1, 2016 (Incorporated by reference to Exhibit 10.9 in the Current Report on Form 8-K of Pentair plc filed with the Commission on June 3, 2014 (File No. 001-11625)).*
|
||
|
Form of Non-Employee Director Stock Option Grant Agreement (Incorporated by reference to Exhibit 10.10 in the Current Report on Form 8-K of Pentair plc filed with the Commission on June 3, 2014 (File No. 001-11625)).*
|
||
|
Form of Non-Employee Director Restricted Stock Unit Grant Agreement (Incorporated by reference to Exhibit 10.11 in the Current Report on Form 8-K of Pentair plc filed with the Commission on June 3, 2014 (File No. 001-11625)).*
|
||
|
Form of Performance Share Units Grant Agreement for grants made during 2016 (Incorporated by reference to Exhibit 10.8 in the Annual Report on Form 10-K of Pentair plc filed with the Commission on February 26, 2016 (File No. 001-11625)).*
|
||
|
Pentair plc 2008 Omnibus Stock Incentive Plan, as amended and restated effective as of January 1, 2017 (Incorporated by reference to Exhibit 10.9 to the Annual Report on Form 10-K of Pentair plc for the year ended December 31, 2016 (File No. 001-11625)).*
|
||
|
Pentair plc Omnibus Stock Incentive Plan, as amended and restated (Incorporated by reference to Exhibit 10.3 in the Current Report on Form 8-K of Pentair plc filed with the Commission on June 3, 2014 (File No. 001-11625)).*
|
||
|
Pentair plc Outside Directors Nonqualified Stock Option Plan, as amended and restated (Incorporated by reference to Exhibit 10.4 in the Current Report on Form 8-K of Pentair plc filed with the Commission on June 3, 2014 (File No. 001-11625)).*
|
||
|
Form of Assignment and Assumption Agreement, among Pentair, Inc., Pentair Ltd. and the executive officers of Pentair Ltd. relating to Key Executive Employment and Severance Agreement (Incorporated by reference to Exhibit 10.12 in the Current Report on Form 8-K of Pentair Ltd. filed with the Commission on October 1, 2012 (File No. 001-11625)).*
|
||
|
Form of Key Executive Employment and Severance Agreement for Randall J. Hogan (Incorporated by reference to Exhibit 10.10 in the Annual Report on Form 10-K of Pentair, Inc. for the year ended December 31, 2008 (File No. 000-04689)).*
|
||
|
Form of Key Executive Employment and Severance Agreement for John L. Stauch, Mark C. Borin and Angela D. Jilek (Incorporated by reference to Exhibit 10.12 in the Annual Report on Form 10-K of Pentair, Inc. for the year ended December 31, 2008 (File No. 000-04689)).*
|
||
92
|
Form of Key Executive Employment and Severance Agreement for Karl R. Frykman (Incorporated by reference to Exhibit 10.16 in the Annual Report on Form 10-K of Pentair Ltd. for the year ended December 31, 2013 (File No. 001-11625)).*
|
||
|
Form of Key Executive Employment and Severance Agreement for Beth A. Wozniak and John H. Jacko (Incorporated by reference to Exhibit 10.16 in the Annual Report on Form 10-K of Pentair plc filed with the Commission on February 26, 2016 (File No. 001-11625)).*
|
||
|
Pentair plc Compensation Plan for Non-Employee Directors, as amended and restated (Incorporated by reference to Exhibit 10.6 in the Current Report on Form 8-K of Pentair plc filed with the Commission on June 3, 2014 (File No. 001-11625)).*
|
||
|
Pentair plc Employee Stock Purchase and Bonus Plan, as amended and restated (Incorporated by reference to Exhibit 10.5 in the Current Report on Form 8-K of Pentair plc filed with the Commission on June 3, 2014 (File No. 001-11625)).*
|
||
|
Pentair, Inc. Non-Qualified Deferred Compensation Plan effective January 1, 1996 (Incorporated by reference to Exhibit 10.17 in the Annual Report on Form 10-K of Pentair, Inc. for the year ended December 31, 2005 (File No. 000-04689)).*
|
||
|
Trust Agreement for Pentair, Inc. Non-Qualified Deferred Compensation Plan between Pentair, Inc. and Fidelity Management Trust Company (Incorporated by reference to Exhibit 10.18 contained in the Annual Report on Form 10-K of Pentair, Inc. for the year ended December 31, 1995 (File No. 000-04689)).*
|
||
|
Amendment effective August 23, 2000 to Pentair, Inc. Non-Qualified Deferred Compensation Plan effective January 1, 1996 (Incorporated by reference to Exhibit 10.8 in the Current Report on Form 8-K of Pentair, Inc. filed with the Commission on September 21, 2000 (File No. 000-04689)).*
|
||
|
Pentair, Inc. Non-Qualified Deferred Compensation Plan effective January 1, 2009, as amended and restated (Incorporated by reference to Exhibit 10.12 in the Current Report on Form 8-K of Pentair plc filed with the Commission on June 3, 2014 (File No. 001-11625)).*
|
||
|
Pentair, Inc. 1999 Supplemental Executive Retirement Plan as Amended and Restated effective August 23, 2000 (Incorporated by reference to Exhibit 10.2 in the Current Report on Form 8-K of Pentair, Inc. filed with the Commission on September 21, 2000 (File No. 000-04689)).*
|
||
|
Pentair, Inc. Supplemental Executive Retirement Plan effective January 1, 2009, as amended and restated (Incorporated by reference to Exhibit 10.13 in the Current Report on Form 8-K of Pentair plc filed with the Commission on June 3, 2014 (File No. 001-11625)).*
|
||
|
Pentair, Inc. Restoration Plan as Amended and Restated effective August 23, 2000 (Incorporated by reference to Exhibit 10.3 in the Current Report on Form 8-K of Pentair, Inc. filed with the Commission on September 21, 2000 (File No. 000-04689)).*
|
||
|
Pentair, Inc. Restoration Plan effective January 1, 2009, as amended and restated (Incorporated by reference to Exhibit 10.14 in the Current Report on Form 8-K of Pentair plc filed with the Commission on June 3, 2014 (File No. 001-11625)).*
|
||
|
Form of Deed of Indemnification for directors and executive officers of Pentair plc (Incorporated by reference to Exhibit 10.15 in the Current Report on Form 8-K of Pentair plc filed with the Commission on June 3, 2014 (File No. 001-11625)).*
|
||
|
Form of Indemnification Agreement for directors and executive officers of Pentair plc (Incorporated by reference to Exhibit 10.16 in the Current Report on Form 8-K of Pentair plc filed with the Commission on June 3, 2014 (File No. 001-11625)).*
|
||
|
Letter agreement, dated September 7, 2015, among Pentair plc, Edward P. Garden, Matthew Peltz, Brian Baldwin and Trian Fund Management, L.P. (Incorporated by reference to Exhibit 10.1 to the Current Report on Form 8-K of Pentair plc filed with the SEC on September 8, 2015 (File No. 001-11625)).
|
||
|
Form of Executive Officer Stock Option Grant Agreement for grants made on or after January 1, 2017 (Incorporated by reference to Exhibit 10.31 to the Annual Report on Form 10-K of Pentair plc for the year ended December 31, 2016 (File No. 001-11625)).*
|
||
|
Form of Executive Officer Restricted Stock Unit Grant Agreement for grants made on or after January 2, 2017 (Incorporated by reference to Exhibit 10.32 to the Annual Report on Form 10-K of Pentair plc for the year ended December 31, 2016 (File No. 001-11625)).*
|
||
|
Form of Executive Officer Performance Unit Grant Agreement for grants made on or after January 1, 2017 (Incorporated by reference to Exhibit 10.33 to the Annual Report on Form 10-K of Pentair plc for the year ended December 31, 2016 (File No. 001-11625)).*
|
||
93
|
Separation Agreement and Release, dated as of January 5, 2018, between Pentair Management Company and Karen L. Keegans (Incorporated by reference to Exhibit 10.1 to the Current Report on Form 8-K of Pentair plc filed with the Commission on January 9, 2018 (File No. 001-11625)).*
|
||
|
Separation Agreement, dated as of May 2, 2017, between Pentair Management Company and Dennis J. Cassidy, Jr. (Incorporated by reference to Exhibit 10.1 to the Current Report on Form 8-K of Pentair plc filed with the Commission on June 5, 2017 (File No. 001-11625)).*
|
||
|
List of Pentair plc subsidiaries.
|
||
|
Consent of Independent Registered Public Accounting Firm — Deloitte & Touche LLP.
|
||
|
Power of attorney.
|
||
|
Certification of Chief Executive Officer.
|
||
|
Certification of Chief Financial Officer.
|
||
|
Certification of Chief Executive Officer, Pursuant to 18 U.S.C. Section 1350, as Adopted Pursuant to Section 906 of the Sarbanes-Oxley Act of 2002.
|
||
|
Certification of Chief Financial Officer, Pursuant to 18 U.S.C. Section 1350, as Adopted Pursuant to Section 906 of the Sarbanes-Oxley Act of 2002.
|
||
|
101
|
The following materials from Pentair plc's Annual Report on Form 10-K for the year ended December 31, 2017 are filed herewith, formatted in XBRL (Extensible Business Reporting Language): (i) the Consolidated Statements of Operations and Comprehensive Income (Loss) for the years ended December 31, 2017, 2016 and 2015, (ii) the Consolidated Balance Sheets as of December 31, 2017 and 2016, (iii) the Consolidated Statements of Cash Flows for the years ended December 31, 2017, 2016 and 2015, (iv) the Consolidated Statements of Changes in Equity for the years ended December 31, 2017, 2016 and 2015 and (v) the Notes to the Consolidated Financial Statements.
|
|
|
*
|
Denotes a management contract or compensatory plan or arrangement.
|
None.
94
SIGNATURES
Pursuant to the requirements of Section 13 or 15(d) of the Securities Exchange Act of 1934, the registrant has duly caused this report to be signed on its behalf by the undersigned, thereunto duly authorized, on
February 27, 2018
.
|
PENTAIR PLC
|
||
|
By
|
/s/ John L. Stauch
|
|
|
John L. Stauch
|
||
|
Executive Vice President and Chief Financial Officer
|
||
Pursuant to the requirements of the Securities Exchange Act of 1934, this report has been signed below by the following persons on behalf of the Registrant and in the capacities indicated, on
February 27, 2018
.
|
Signature
|
|
Title
|
|
/s/ Randall J. Hogan
|
|
Chairman and Chief Executive Officer
|
|
Randall J. Hogan
|
|
|
|
/s/ John L. Stauch
|
|
Executive Vice President and Chief Financial Officer
|
|
John L. Stauch
|
|
|
|
/s/ Mark C. Borin
|
|
Senior Vice President, Chief Accounting Officer and Treasurer
|
|
Mark C. Borin
|
|
|
|
*
|
|
Director
|
|
Glynis A. Bryan
|
|
|
|
*
|
|
Director
|
|
Jerry W. Burris
|
|
|
|
*
|
|
Director
|
|
Carol Anthony (John) Davidson
|
|
|
|
*
|
Director
|
|
|
Jacques Esculier
|
||
|
*
|
Director
|
|
|
Edward P. Garden
|
||
|
*
|
|
Director
|
|
T. Michael Glenn
|
|
|
|
*
|
|
Director
|
|
David H. Y. Ho
|
|
|
|
*
|
|
Director
|
|
David A. Jones
|
|
|
|
*
|
|
Director
|
|
Ronald L. Merriman
|
|
|
|
*
|
|
Director
|
|
William T. Monahan
|
|
|
|
*
|
|
Director
|
|
Billie I. Williamson
|
|
|
|
*By
|
/s/ Angela D. Jilek
|
|
Angela D. Jilek
|
|
|
Attorney-in-fact
|
|
95
Schedule II — Valuation and Qualifying Accounts
Pentair plc and Subsidiaries
|
In millions
|
Beginning
balance
|
Additions charged (reductions credited) to costs and expenses
|
Deductions
(1)
|
Other
changes
(2)
|
Ending
balance
|
||||||||||
|
Allowances for doubtful accounts
|
|||||||||||||||
|
Year ended December 31, 2017
|
$
|
16.4
|
|
$
|
0.8
|
|
$
|
4.5
|
|
$
|
1.1
|
|
$
|
13.8
|
|
|
Year ended December 31, 2016
|
$
|
19.0
|
|
$
|
1.2
|
|
$
|
4.1
|
|
$
|
0.3
|
|
$
|
16.4
|
|
|
Year ended December 31, 2015
|
$
|
12.1
|
|
$
|
10.1
|
|
$
|
2.4
|
|
$
|
(0.8
|
)
|
$
|
19.0
|
|
|
(1)
|
Uncollectible accounts written off, net of recoveries
|
|
(2)
|
Result of foreign currency effects
|
96
TABLE OF CONTENTS
Part IItem 1. BusinessItem 1A. Risk FactorsItem 1B. Unresolved Staff CommentsItem 2. PropertiesItem 3. Legal ProceedingsItem 4. Mine Safety DisclosuresPart IIItem 5. Market For Registrant's Common Equity, Related Stockholder Matters and Issuer Purchases Of Equity SecuritiesItem 6. Selected Financial DataItem 7. Management's Discussion and Analysis Of Financial Condition and Results Of OperationsItem 7A. Quantitative and Qualitative Disclosures About Market RiskItem 8. Financial Statements and Supplementary DataItem 9. Changes in and Disagreements with Accountants on Accounting and Financial DisclosureItem 9A. Controls and ProceduresItem 9B. Other InformationPart IIIItem 10. Directors, Executive Officers and Corporate GovernanceItem 11. Executive CompensationItem 12. Security Ownership Of Certain Beneficial Owners and Management and Related Stockholder MattersItem 13. Certain Relationships and Related Transactions and Director IndependenceItem 14. Principal Accounting Fees and ServicesPart IVItem 15. Exhibits and Financial Statement SchedulesItem 16. Form 10-k Summary