PINNACLE WEST CAPITAL CORP
10-Ks and 10-Qs
|
|
|
|
|
|
|
|
|
|
|
|
|
|
|
|
|
|
|
|
|
|
|
|
|
|
|
|
|
|
|
|
|
|
|
|
|
|
|
|
|
|
|
|
|
|
|
|
|
|
|
|
|
|
|
|
|
|
|
UNITED STATES
SECURITIES AND EXCHANGE COMMISSION
WASHINGTON, D.C. 20549
FORM 10-K
(Mark One)
x
ANNUAL REPORT PURSUANT TO SECTION 13 OR 15(d) OF THE SECURITIES EXCHANGE ACT OF 1934
For the fiscal year ended December 31, 2014
OR
o
TRANSITION REPORT PURSUANT TO SECTION 13 OR 15(d) OF THE SECURITIES EXCHANGE ACT OF 1934
For the transition period from to
|
Commission
File Number
|
|
Registrants; State of Incorporation;
Addresses; and Telephone Number
|
|
IRS Employer
Identification No.
|
|
1-8962
|
|
PINNACLE WEST CAPITAL CORPORATION
(An Arizona corporation)
400 North Fifth Street, P.O. Box 53999
Phoenix, Arizona 85072-3999
(602) 250-1000
|
|
86-0512431
|
|
1-4473
|
|
ARIZONA PUBLIC SERVICE COMPANY
(An Arizona corporation)
400 North Fifth Street, P.O. Box 53999
Phoenix, Arizona 85072-3999
(602) 250-1000
|
|
86-0011170
|
Securities registered pursuant to Section 12(b) of the Act:
|
|
|
Title Of Each Class
|
|
Name Of Each Exchange On Which Registered
|
|
PINNACLE WEST CAPITAL CORPORATION
|
|
Common Stock,
No Par Value
|
|
New York Stock Exchange
|
|
ARIZONA PUBLIC SERVICE COMPANY
|
|
None
|
|
None
|
Securities registered pursuant to Section 12(g) of the Act:
ARIZONA PUBLIC SERVICE COMPANY Common Stock, Par Value $2.50 per share
Indicate by check mark if the registrant is a well-known seasoned issuer, as defined in Rule 405 of the Securities Act
|
PINNACLE WEST CAPITAL CORPORATION
|
Yes
x
No
o
|
|
ARIZONA PUBLIC SERVICE COMPANY
|
Yes
x
No
o
|
Indicate by check mark if the registrant is not required to file reports pursuant to Section 13 or Section 15(d) of the Act.
|
PINNACLE WEST CAPITAL CORPORATION
|
Yes
o
No
x
|
|
ARIZONA PUBLIC SERVICE COMPANY
|
Yes
o
No
x
|
Indicate by check mark whether the registrant (1) has filed all reports required to be filed by Section 13 or 15(d) of the Securities Exchange Act of 1934 during the preceding 12 months (or for such shorter period that the registrant was required to file such reports), and (2) has been subject to such filing requirements for the past 90 days.
|
PINNACLE WEST CAPITAL CORPORATION
|
Yes
x
No
o
|
|
ARIZONA PUBLIC SERVICE COMPANY
|
Yes
x
No
o
|
Indicate by check mark whether the registrant has submitted electronically and posted on its corporate Web site, if any, every Interactive Data File required to be submitted and posted pursuant to Rule 405 of Regulation S-T during the preceding 12 months (or for such shorter period that the registrant was required to submit and post such files).
|
PINNACLE WEST CAPITAL CORPORATION
|
Yes
x
No
o
|
|
ARIZONA PUBLIC SERVICE COMPANY
|
Yes
x
No
o
|
Indicate by check mark if disclosure of delinquent filers pursuant to Item 405 of Regulation S-K is not contained herein, and will not be contained, to the best of registrant’s knowledge, in definitive proxy or information statements incorporated by reference in Part III of this Form 10-K or in any amendment to this Form 10-K.
x
Indicate by check mark whether the registrant is a large accelerated filer, an accelerated filer, a non-accelerated filer, or a smaller reporting company. See the definitions of “large accelerated filer,” “accelerated filer” and “smaller reporting company” in Rule 12b-2 of the Exchange Act. (Check one):
|
PINNACLE WEST CAPITAL CORPORATION
|
|
|
|
Large accelerated filer
x
|
|
Accelerated filer
o
|
|
|
|
|
|
Non-accelerated filer
o
|
|
Smaller reporting company
o
|
|
(Do not check if a smaller reporting company)
|
|
|
|
ARIZONA PUBLIC SERVICE COMPANY
|
|
|
|
Large accelerated filer
o
|
|
Accelerated filer
o
|
|
|
|
|
|
Non-accelerated filer
x
|
|
Smaller reporting company
o
|
|
(Do not check if a smaller reporting company)
|
|
|
Indicate by check mark whether each registrant is a shell company (as defined in Rule 12b-2 of the Act). Yes
o
No
x
State the aggregate market value of the voting and non-voting common equity held by non-affiliates, computed by reference to the price at which the common equity was last sold, or the average bid and asked price of such common equity, as of the last business day of each registrant’s most recently completed second fiscal quarter:
|
PINNACLE WEST CAPITAL CORPORATION
|
|
$6,356,930,539 as of June 30, 2014
|
|
ARIZONA PUBLIC SERVICE COMPANY
|
|
$0 as of June 30, 2014
|
The number of shares outstanding of each registrant’s common stock as of February 13, 2015
|
PINNACLE WEST CAPITAL CORPORATION
|
|
110,575,187 shares
|
|
ARIZONA PUBLIC SERVICE COMPANY
|
|
Common Stock, $2.50 par value, 71,264,947 shares. Pinnacle West Capital Corporation is the sole holder of Arizona Public Service Company’s Common Stock.
|
DOCUMENTS INCORPORATED BY REFERENCE
Portions of Pinnacle West Capital Corporation’s definitive Proxy Statement relating to its Annual Meeting of Shareholders to be held on May 20, 2015 are incorporated by reference into Part III hereof.
Arizona Public Service Company meets the conditions set forth in General Instruction I(1)(a) and (b) of Form 10-K and is therefore filing this form with the reduced disclosure format allowed under that General Instruction.
TABLE OF CONTENTS
|
|
|
Page
|
|
|
|
|
|
|
|
|
|
|
|
|
|
|
||
|
|
|
|
|
|
||
|
|
|
|
|
|
||
|
|
|
|
|
|
||
|
|
|
|
This combined Form 10-K is separately filed by Pinnacle West and APS. Each registrant is filing on its own behalf all of the information contained in this Form 10-K that relates to such registrant and, where required, its subsidiaries. Except as stated in the preceding sentence, neither registrant is filing any information that does not relate to such registrant, and therefore makes no representation as to any such information. The information required with respect to each company is set forth within the applicable items. Item 8 of this report includes Consolidated Financial Statements of Pinnacle West and Consolidated Financial Statements of APS. Item 8 also includes Notes to Pinnacle West’s Consolidated Financial Statements, the majority of which also relates to APS, and Supplemental Notes, which only relate to APS’s Consolidated Financial Statements.
i
GLOSSARY OF NAMES AND TECHNICAL TERMS
|
ac
|
Alternating Current
|
|
ACC
|
Arizona Corporation Commission
|
|
ADEQ
|
Arizona Department of Environmental Quality
|
|
AFUDC
|
Allowance for Funds Used During Construction
|
|
ANPP
|
Arizona Nuclear Power Project, also known as Palo Verde
|
|
APS
|
Arizona Public Service Company, a subsidiary of the Company
|
|
APSES
|
APS Energy Services Company, Inc., a subsidiary of the Company sold on August 19, 2011
|
|
ARO
|
Asset retirement obligations
|
|
Base Fuel Rate
|
The portion of APS’s retail base rates attributable to fuel and purchased power costs
|
|
BCE
|
Bright Canyon Energy Corporation, a subsidiary of the Company
|
|
BHP Billiton
|
BHP Billiton New Mexico Coal, Inc.
|
|
BNCC
|
BHP Navajo Coal Company
|
|
CAISO
|
California Independent System Operator
|
|
Cholla
|
Cholla Power Plant
|
|
dc
|
Direct Current
|
|
DOE
|
United States Department of Energy
|
|
DOI
|
United States Department of the Interior
|
|
DSM
|
Demand side management
|
|
DSMAC
|
Demand side management adjustment charge
|
|
El Dorado
|
El Dorado Investment Company, a subsidiary of the Company
|
|
El Paso
|
El Paso Electric Company
|
|
EPA
|
United States Environmental Protection Agency
|
|
FERC
|
United States Federal Energy Regulatory Commission
|
|
Four Corners
|
Four Corners Power Plant
|
|
GWh
|
Gigawatt-hour, one billion watts per hour
|
|
kV
|
Kilovolt, one thousand volts
|
|
kWh
|
Kilowatt-hour, one thousand watts per hour
|
|
LFCR
|
Lost Fixed Cost Recovery Mechanism
|
|
MMBtu
|
One million British Thermal Units
|
|
MW
|
Megawatt, one million watts
|
|
MWh
|
Megawatt-hour, one million watts per hour
|
|
Native Load
|
Retail and wholesale sales supplied under traditional cost-based rate regulation
|
|
Navajo Plant
|
Navajo Generating Station
|
|
NERC
|
North American Electric Reliability Corporation
|
|
NRC
|
United States Nuclear Regulatory Commission
|
|
NTEC
|
Navajo Transitional Energy Company, LLC
|
|
OCI
|
Other comprehensive income
|
|
Palo Verde
|
Palo Verde Nuclear Generating Station or PVNGS
|
|
Pinnacle West
|
Pinnacle West Capital Corporation (any use of the words “Company,” “we,” and “our” refer to Pinnacle West)
|
|
PSA
|
Power supply adjustor approved by the ACC to provide for recovery or refund of variations in actual fuel and purchased power costs compared with the Base Fuel Rate
|
|
RES
|
Arizona Renewable Energy Standard and Tariff
|
|
Salt River Project or SRP
|
Salt River Project Agricultural Improvement and Power District
|
|
SCE
|
Southern California Edison Company
|
|
SunCor
|
SunCor Development Company, formerly a subsidiary of the Company
|
|
TCA
|
Transmission cost adjustor
|
|
VIE
|
Variable interest entity
|
ii
FORWARD-LOOKING STATEMENTS
This document contains forward-looking statements based on current expectations. These forward-looking statements are often identified by words such as “estimate,” “predict,” “may,” “believe,” “plan,” “expect,” “require,” “intend,” “assume” and similar words. Because actual results may differ materially from expectations, we caution readers not to place undue reliance on these statements. A number of factors could cause future results to differ materially from historical results, or from outcomes currently expected or sought by Pinnacle West or APS. In addition to the Risk Factors described in Item 1A and in Item 7 — “Management’s Discussion and Analysis of Financial Condition and Results of Operations,” these factors include, but are not limited to:
|
•
|
our ability to manage capital expenditures and operations and maintenance costs while maintaining reliability and customer service levels;
|
|
•
|
variations in demand for electricity, including those due to weather, the general economy, customer and sales growth (or decline), and the effects of energy conservation measures and distributed generation;
|
|
•
|
power plant and transmission system performance and outages;
|
|
•
|
competition in retail and wholesale power markets;
|
|
•
|
regulatory and judicial decisions, developments and proceedings;
|
|
•
|
new legislation or regulation, including those relating to environmental requirements, nuclear plant operations and potential deregulation of retail electric markets;
|
|
•
|
fuel and water supply availability;
|
|
•
|
our ability to achieve timely and adequate rate recovery of our costs, including returns on debt and equity capital;
|
|
•
|
our ability to meet renewable energy and energy efficiency mandates and recover related costs;
|
|
•
|
risks inherent in the operation of nuclear facilities, including spent fuel disposal uncertainty;
|
|
•
|
current and future economic conditions in Arizona, particularly in real estate markets;
|
|
•
|
the development of new technologies which may affect electric sales or delivery;
|
|
•
|
the cost of debt and equity capital and the ability to access capital markets when required;
|
|
•
|
environmental and other concerns surrounding coal-fired generation;
|
|
•
|
volatile fuel and purchased power costs;
|
|
•
|
the investment performance of the assets of our nuclear decommissioning trust, pension, and other postretirement benefit plans and the resulting impact on future funding requirements;
|
|
•
|
the liquidity of wholesale power markets and the use of derivative contracts in our business;
|
|
•
|
potential shortfalls in insurance coverage;
|
|
•
|
new accounting requirements or new interpretations of existing requirements;
|
|
•
|
generation, transmission and distribution facility and system conditions and operating costs;
|
|
•
|
the ability to meet the anticipated future need for additional baseload generation and associated transmission facilities in our region;
|
|
•
|
the willingness or ability of our counterparties, power plant participants and power plant land owners to meet contractual or other obligations or extend the rights for continued power plant operations; and
|
|
•
|
restrictions on dividends or other provisions in our credit agreements and ACC orders.
|
These and other factors are discussed in the Risk Factors described in Item 1A of this report, which readers should review carefully before placing any reliance on our financial statements or disclosures. Neither Pinnacle West nor APS assumes any obligation to update these statements, even if our internal estimates change, except as required by law.
2
Pinnacle West
Pinnacle West is a holding company that conducts business through its subsidiaries. We derive essentially all of our revenues and earnings from our wholly-owned subsidiary, APS. APS is a vertically-integrated electric utility that provides either retail or wholesale electric service to most of the State of Arizona, with the major exceptions of about one-half of the Phoenix metropolitan area, the Tucson metropolitan area and Mohave County in northwestern Arizona.
Pinnacle West’s other subsidiaries are El Dorado and BCE. Additional information related to these subsidiaries is provided later in this report.
Our reportable business segment is our regulated electricity segment, which consists of traditional regulated retail and wholesale electricity businesses (primarily electric service to Native Load customers) and related activities, and includes electricity generation, transmission and distribution.
BUSINESS OF ARIZONA PUBLIC SERVICE COMPANY
APS currently provides electric service to approximately 1.2 million customers. We own or lease 6,426 MW of regulated generation capacity and we hold a mix of both long-term and short-term purchased power agreements for additional capacity, including a variety of agreements for the purchase of renewable energy. During 2014, no single purchaser or user of energy accounted for more than 1.4% of our electric revenues.
3
The following map shows APS’s retail service territory, including the locations of its generating facilities and principal transmission lines.
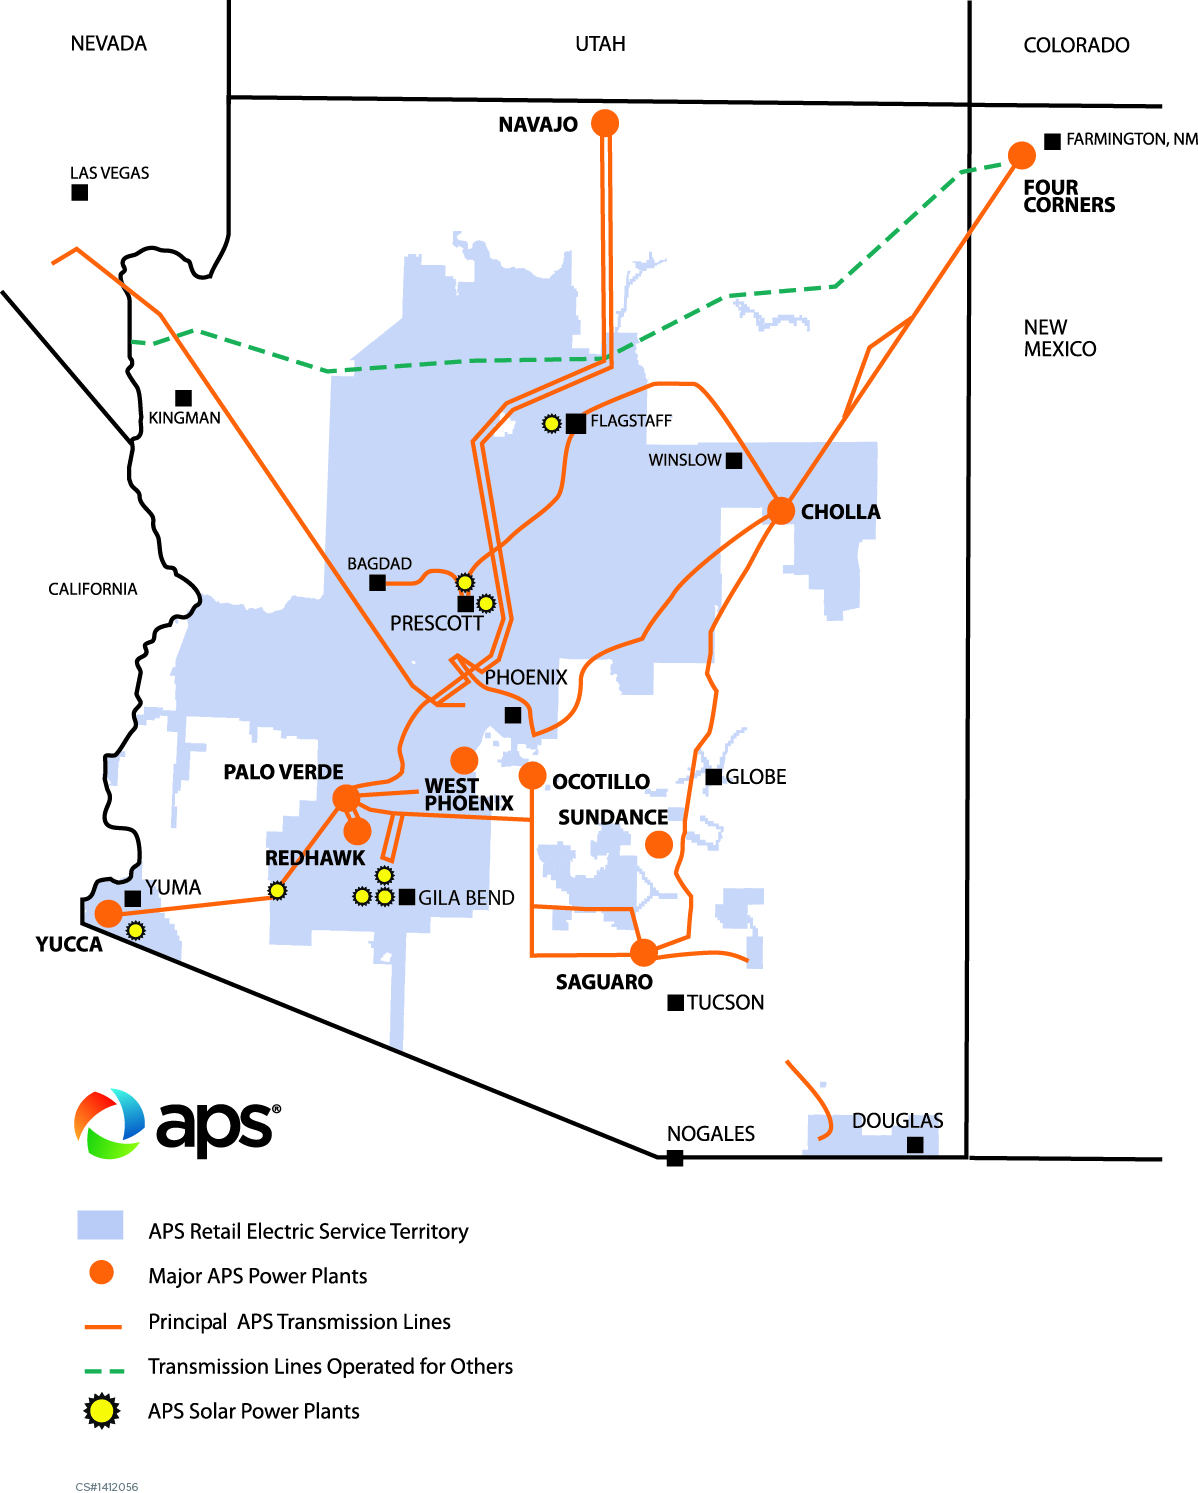
4
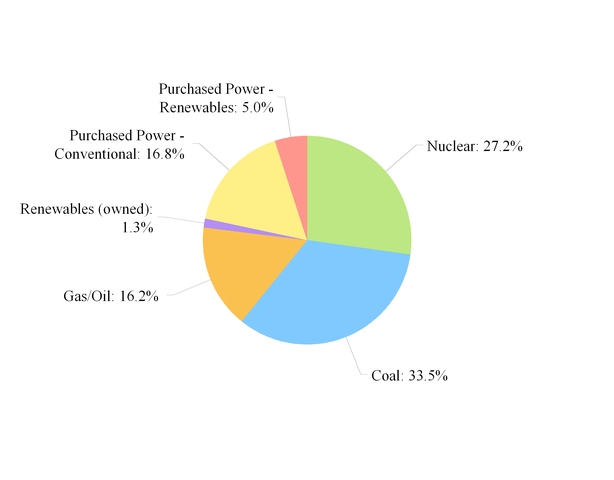
Energy Sources and Resource Planning
To serve its customers, APS obtains power through its various generation stations and through purchased power agreements. Resource planning is an important function necessary to meet Arizona’s future energy needs. APS’s sources of energy by type during 2014 were as follows:
Generation Facilities
APS has ownership interests in or leases the coal, nuclear, gas, oil and solar generating facilities described below. For additional information regarding these facilities, see Item 2.
Coal-Fueled Generating Facilities
Four Corners
— Four Corners is a 5-unit coal-fired power plant located in the northwestern corner of New Mexico. APS operates the plant and owns 100% of Four Corners Units 1, 2 and 3 and 63% of Four Corners Units 4 and 5 following the acquisition of SCE’s interest in Units 4 and 5 described below. As of December 30, 2013, APS retired Units 1, 2 and 3. APS has a total entitlement from Four Corners of 970 MW.
On November 8, 2010, APS and SCE entered into an asset purchase agreement (the “Asset Purchase Agreement”) providing for the purchase by APS of SCE’s 48% interest in each of Units 4 and 5 of Four Corners, allowing APS to acquire 739 MW from SCE. On December 30, 2013, APS and SCE closed this transaction. The final purchase price for SCE’s interest was approximately $182 million, subject to certain minor post-closing adjustments.
5
In connection with APS’s most recent retail rate case with the ACC, the ACC reserved the right to review the prudence of the Four Corners transaction for cost recovery purposes upon the closing of the transaction. On December 23, 2014, the ACC approved rate adjustments related to APS’s acquisition of SCE’s interest in Four Corners resulting in a revenue increase of $57.1 million on an annual basis.
Concurrently with the closing of the SCE transaction, BHP Billiton, the parent company of BNCC, the coal supplier and operator of the mine that serves Four Corners, transferred its ownership of BNCC to NTEC, a company formed by the Navajo Nation to own the mine and develop other energy projects. BHP Billiton will be retained by NTEC under contract as the mine manager and operator until July 2016. Also occurring concurrently with the closing, the Four Corners’ co-owners executed a long-term agreement for the supply of coal to Four Corners from July 2016, when the current coal supply agreement expires, through 2031 (the “2016 Coal Supply Agreement”). El Paso, a 7% owner in Units 4 and 5 of Four Corners, did not sign the 2016 Coal Supply Agreement. Under the 2016 Coal Supply Agreement, APS has agreed to assume the 7% shortfall obligation. On February 17, 2015, APS and El Paso entered into an asset purchase agreement providing for the purchase by APS, or an affiliate of APS, of El Paso’s 7% interest in each of Units 4 and 5 of Four Corners. The cash purchase price, which will be subject to certain adjustments at closing, is immaterial in amount, and the purchaser will assume El Paso's reclamation and decommissioning obligations associated with the 7% interest. Completion of the purchase is subject to the receipt of certain regulatory approvals and is expected to occur in July 2016.
When APS, or an affiliate of APS, ultimately acquires El Paso's interest in Four Corners, NTEC will have an option to purchase the interest within a certain timeframe pursuant to an option granted by APS to NTEC. The 2016 Coal Supply Agreement contains alternate pricing terms for the 7% shortfall obligations in the event NTEC does not exercise its option.
The Four Corners plant site is leased from the Navajo Nation and is also subject to an easement from the federal government. APS, on behalf of the Four Corners participants, negotiated amendments to an existing facility lease with the Navajo Nation which extends the Four Corners leasehold interest from 2016 to 2041. The Navajo Nation approved these amendments in March 2011. The effectiveness of the amendments also requires the approval of the DOI, as does a related federal rights-of-way grant, which the Four Corners participants are pursuing. A federal environmental review is underway as part of the DOI review process. In March 2014, APS received a draft of the environmental impact statement ("DEIS") in connection with the DOI review process. As a proponent of Four Corners and the Navajo Mine Energy Project, APS, along with other members of the public, submitted comments on the DEIS. APS cannot predict whether these federal approvals will be granted and, if so, on a timely basis, or whether any conditions that may be attached to them will be acceptable to the Four Corners owners. On December 19, 2014, APS obtained a Prevention of Significant Deterioration (“PSD”) permit from EPA allowing APS to install selective catalytic reduction (“SCR”) control technology at Four Corners, as described below under “Environmental Matters — EPA Environmental Regulation.”
Cholla
— Cholla is a 4-unit coal-fired power plant located in northeastern Arizona. APS operates the plant and owns 100% of Cholla Units 1, 2 and 3. PacifiCorp owns Cholla Unit 4, and APS operates that unit for PacifiCorp. APS has a total entitlement from Cholla of 647 MW. APS purchases all of Cholla’s coal requirements from a coal supplier that mines all of the coal under long-term leases of coal reserves with the federal and state governments and private landholders. The Cholla coal contract runs through 2024. In addition, APS has a long-term coal transportation contract that runs through 2017 with plans to extend the contract beyond 2017. See "Current and Future Resources - Future Resources and Resource Plan" below for a discussion of future plans for Cholla.
6
Navajo Generating Station
— The Navajo Plant is a 3-unit coal-fired power plant located in northern Arizona. Salt River Project operates the plant and APS owns a 14% interest in Navajo Units 1, 2 and 3. APS has a total entitlement from the Navajo Plant of 315 MW. The Navajo Plant’s coal requirements are purchased from a supplier with long-term leases from the Navajo Nation and the Hopi Tribe. The Navajo Plant is under contract with its coal supplier through 2019, with extension rights through 2026. The Navajo Plant site is leased from the Navajo Nation and is also subject to an easement from the federal government. The current lease expires in 2019. See "Environmental Matters - EPA Environmental Regulation - Regional Haze Rules - Navajo Plant" below for a discussion of potential future plans for the Navajo Plant.
These coal-fueled plants face uncertainties, including those related to existing and potential legislation and regulation, that could significantly impact their economics and operations. See “Environmental Matters” below and “Management’s Discussion and Analysis of Financial Condition and Results of Operations — Overview and Capital Expenditures” in Item 7 for developments impacting these coal-fueled facilities. See Note 10 for information regarding APS’s coal mine reclamation obligations.
Nuclear
Palo Verde Nuclear Generating Station —
Palo Verde is a 3-unit nuclear power plant located approximately 50 miles west of Phoenix, Arizona. APS operates the plant and owns 29.1% of Palo Verde Units 1 and 3 and approximately 17% of Unit 2. In addition, APS leases approximately 12.1% of Unit 2, resulting in a 29.1% combined ownership and leasehold interest in that unit. APS has a total entitlement from Palo Verde of 1,146 MW.
Palo Verde Leases —
In 1986, APS entered into agreements with three separate lessor trust entities in order to sell and lease back approximately 42% of its share of Palo Verde Unit 2 and certain common facilities. The agreements expire at the end of 2015 and contain options to renew the leases or to purchase the property for fair market value at the end of the lease terms.
On July 7, 2014, APS notified the lessor trust entities of APS’s intent to exercise the fixed rate lease renewal options. The length of the renewal options will result in APS retaining the assets through 2023 under one lease and 2033 under the other two leases. At the end of the lease renewal periods, APS will have the option to purchase the leased assets at their fair market value, extend the leases for up to two years, or return the assets to the lessors.
See Note 18 for additional information regarding the Palo Verde Unit 2 sale leaseback transactions.
Palo Verde Operating Licenses
— Operation of each of the three Palo Verde Units requires an operating license from the NRC. The NRC issued full power operating licenses for Unit 1 in June 1985, Unit 2 in April 1986 and Unit 3 in November 1987, and issued renewed operating licenses for each of the three units in April 2011, which extended the licenses for Units 1, 2 and 3 to June 2045, April 2046 and November 2047, respectively.
Palo Verde Fuel Cycle —
The Palo Verde participants are continually identifying their future nuclear fuel resource needs and negotiating arrangements to fill those needs. The fuel cycle for Palo Verde is comprised of the following stages:
•
mining and milling of uranium ore to produce uranium concentrates;
•
conversion of uranium concentrates to uranium hexafluoride;
•
enrichment of uranium hexafluoride;
•
fabrication of fuel assemblies;
•
utilization of fuel assemblies in reactors; and
•
storage and disposal of spent nuclear fuel.
The Palo Verde participants have contracted for 100% of Palo Verde’s requirements for uranium concentrates and conversion services through 2018 and 45% of its requirements in 2019-2020. The
7
participants have also contracted for 100% of Palo Verde’s enrichment services through 2020; and all of Palo Verde’s fuel assembly fabrication services through 2022.
Spent Nuclear Fuel and Waste Disposal —
The Nuclear Waste Policy Act of 1982 (“NWPA”) required the DOE to accept, transport, and dispose of spent nuclear fuel and high level waste generated
by the nation’s nuclear power plants by 1998. The DOE’s obligations are reflected in a contract for Disposal of Spent Nuclear Fuel and/or High-Level Radioactive Waste (the “Standard Contract”) with each nuclear power plant. The DOE failed to begin accepting spent nuclear fuel by 1998. APS is directly and indirectly involved in several legal proceedings related to DOE’s failure to meet its statutory and contractual obligations regarding acceptance of spent nuclear fuel and high level waste.
APS Lawsuit for Breach of Standard Contract
— In December 2003, APS, acting on behalf of itself and the participant owners of Palo Verde, filed a lawsuit against DOE in the U.S. Court of Federal Claims for damages incurred due to DOE’s breach of the Standard Contract. The Court of Federal Claims ruled in favor of APS and the Palo Verde participants in October 2010 and awarded $30.2 million in damages to APS and the Palo Verde participants for costs incurred through December 2006.
On December 19, 2012, APS, acting on behalf of itself and the participant owners of Palo Verde, filed a second breach of contract lawsuit against the DOE. This lawsuit sought to recover damages incurred due to DOE’s failure to accept Palo Verde’s spent nuclear fuel for the period beginning January 1, 2007 through June 30, 2011. On August 18, 2014, APS and DOE entered into a settlement agreement, stipulating to a dismissal of the lawsuit and payment of $57.4 million by DOE to the Palo Verde owners for certain specified costs incurred by Palo Verde during the period January 1, 2007 through June 30, 2011. APS’s share of this amount is $16.7 million. Amounts recovered in the lawsuit and settlement were recorded as adjustments to regulatory liability and had no impact on current income.
The One-Mill Fee
— In 2011, the National Association of Regulatory Utility Commissioners and the Nuclear Energy Institute challenged DOE’s 2010 determination of the adequacy of the one tenth of a cent per kWh fee (the “one-mill fee”) paid by the nation’s commercial nuclear power plant owners pursuant to their individual obligations under the Standard Contract. This fee is recovered by APS in its retail rates. In June 2012, the U.S. Court of Appeals for the District of Columbia Circuit (the “D.C. Circuit”) held that DOE failed to conduct a sufficient fee analysis in making the 2010 determination. The D.C. Circuit remanded the 2010 determination to the Secretary of the DOE (“Secretary”) with instructions to conduct a new fee adequacy determination within six months. In February 2013, upon completion of DOE’s revised one-mill fee adequacy determination, the D.C. Circuit reopened the proceedings. On November 19, 2013, the D.C. Circuit ordered the Secretary to notify Congress of his intent to suspend collecting annual fees for nuclear waste disposal from nuclear power plant operators, as he is required to do pursuant to the NWPA and the D.C. Circuit’s order. On January 3, 2014, the Secretary notified Congress of his intention to suspend collection of the one-mill fee, subject to Congress’ disapproval. On May 16, 2014, the DOE notified all commercial nuclear power plant operators who are party to a Standard Contract that it reduced the one-mill fee to zero, thus effectively terminating the one-mill fee.
DOE’s Construction Authorization Application for Yucca Mountain
— The DOE had planned to meet its NWPA and Standard Contract disposal obligations by designing, licensing, constructing, and operating a permanent geologic repository at Yucca Mountain, Nevada. In June 2008, the DOE submitted its Yucca Mountain construction authorization application to the NRC, but in March 2010, the DOE filed a motion to dismiss with prejudice the Yucca Mountain construction authorization application. Several interested parties have also intervened in the NRC proceeding. Additionally, a number of interested parties filed a variety of lawsuits in different jurisdictions around the country challenging the DOE’s authority to withdraw the Yucca Mountain construction authorization application and NRC’s cessation of its review of the Yucca Mountain
8
construction authorization application. The cases have been consolidated into one matter at the D.C. Circuit. In August 2013, the D.C. Circuit ordered the NRC to resume its review of the application with available appropriated funds.
On October 16, 2014, the NRC issued Volume 3 of the safety evaluation report developed as part of the Yucca Mountain construction authorization application. This volume addresses repository safety after permanent closure, and its issuance is a key milestone in the Yucca Mountain licensing process. Volume 3 contains the staff’s finding that the DOE’s repository design meets the requirements that apply after the repository is permanently closed, including but not limited to the post-closure performance objectives in NRC’s regulations.
On December 18, 2014, the NRC issued Volume 4 of the safety evaluation report developed as part of the Yucca Mountain construction authorization application. This volume covers administrative and programmatic requirements for the repository. It documents the staff’s evaluation of whether the DOE’s research and development and performance confirmation programs, as well as other administrative controls and systems, meet applicable NRC requirements. Volume 4 contains the staff’s finding that most administrative and programmatic requirements in NRC regulations are met, except for certain requirements relating to ownership of land and water rights.
Publication of Volumes 3 and 4 does not signal whether or when the NRC might authorize construction of the repository.
Waste Confidence
— On June 8, 2012, the D.C. Circuit issued its decision on a challenge by several states and environmental groups of the NRC’s rulemaking regarding temporary storage and
permanent disposal of high level nuclear waste and spent nuclear fuel. The petitioners had challenged the NRC’s 2010 update to the agency’s Waste Confidence Decision and temporary storage rule (“Waste Confidence Decision”).
The D.C. Circuit found that the agency’s 2010 Waste Confidence Decision update constituted a major federal action, which, consistent with the National Environmental Policy Act (“NEPA”), requires either an environmental impact statement or a finding of no significant impact from the agency’s actions. The D.C. Circuit found that the NRC’s evaluation of the environmental risks from spent nuclear fuel was deficient, and therefore remanded the 2010 Waste Confidence Decision update for further action consistent with NEPA.
On September 6, 2012, the NRC Commissioners issued a directive to the NRC staff to proceed directly with development of a generic environmental impact statement to support an updated Waste Confidence Decision. The NRC Commissioners also directed the staff to establish a schedule to publish a final rule and environmental impact study within 24 months of September 6, 2012.
In September 2013, the NRC issued its draft Generic Environmental Impact Statement (“GEIS”) to support an updated Waste Confidence Decision. On August 26, 2014, the NRC approved a final rule on the environmental effects of continued storage of spent nuclear fuel. The continued storage rule adopted the findings of the GEIS regarding the environmental impacts of storing spent fuel at any reactor site after the reactor’s licensed period of operations. As a result, those generic impacts do not need to be re-analyzed in the environmental reviews for individual licenses. Although Palo Verde had not been involved in any licensing actions affected by the D.C. Circuit’s June 8, 2012, decision, the NRC lifted its suspension on final licensing actions on all nuclear power plant licenses and renewals that went into effect when the D.C. Circuit issued its June 2012 decision. The August 26th final rule has been subject to continuing legal challenges before the NRC and the Court of Appeals.
9
Palo Verde has sufficient capacity at its on-site independent spent fuel storage installation (“ISFSI”) to store all of the nuclear fuel that will be irradiated during the initial operating license period, which ends in December 2027. Additionally, Palo Verde has sufficient capacity at its on-site ISFSI to store a portion of the fuel that will be irradiated during the period of extended operation, which ends in November 2047. If uncertainties regarding the United States government’s obligation to accept and store spent fuel are not favorably resolved, APS will evaluate alternative storage solutions that may obviate the need to expand the ISFSI to accommodate all of the fuel that will be irradiated during the period of extended operation.
Nuclear Decommissioning Costs
— APS currently relies on an external sinking fund mechanism to meet the NRC financial assurance requirements for decommissioning its interests in Palo Verde Units 1, 2 and 3. The decommissioning costs of Palo Verde Units 1, 2 and 3 are currently included in APS’s ACC jurisdictional rates. Decommissioning costs are recoverable through a non-bypassable system benefits charge (paid by all retail customers taking service from the APS system). See Note 19 for additional information about APS’s nuclear decommissioning trusts.
Palo Verde Liability and Insurance Matters
— See “Palo Verde Nuclear Generating Station — Nuclear Insurance” in Note 10 for a discussion of the insurance maintained by the Palo Verde participants, including APS, for Palo Verde.
Impact of Earthquake and Tsunami in Japan on Nuclear Energy Industry
— On March 11, 2011, an earthquake measuring 9.0 on the Richter Scale occurred off the coast of Japan causing a series of seven tsunamis. As a result, the Fukushima Daiichi Nuclear Power Station experienced damage.
Following the earthquake and tsunamis, the NRC established a task force to conduct a systematic and methodical review of NRC processes and regulations to determine whether the agency should make additional improvements to its regulatory system. On March 12, 2012, the NRC issued the first regulatory requirements based on the recommendations of the Near Term Task Force. With respect to Palo Verde, the NRC issued two orders requiring safety enhancements regarding: (1) mitigation strategies to respond to extreme natural events resulting in the loss of power at the plant; and (2) enhancement of spent fuel pool instrumentation.
The NRC has issued a number of guidance documents regarding implementation of these requirements. Due to the developing nature of these requirements, we cannot predict the ultimate financial or operational impacts on Palo Verde or APS. However, to implement these recommendations, Palo Verde expects to spend approximately $40 million for capital enhancements to the plant over the next two years in addition to the approximate $80 million that has already been spent on capital enhancements as of December 31, 2014 (APS’s share is 29.1%).
Natural Gas and Oil Fueled Generating Facilities
APS has six natural gas power plants located throughout Arizona, consisting of Redhawk, located near Palo Verde; Ocotillo, located in Tempe (discussed below); Sundance, located in Coolidge; West Phoenix, located in southwest Phoenix; Saguaro, located north of Tucson; and Yucca, located near Yuma. Several of the units at Yucca run on either gas or oil. APS has one oil-only power plant, Douglas, located in the town of Douglas, Arizona. APS owns and operates each of these plants with the exception of one oil-only combustion turbine unit and one oil and gas steam unit at Yucca that are operated by APS and owned by the Imperial Irrigation District. APS has a total entitlement from these plants of 3,179 MW. Gas for these plants is financially hedged up to three years in advance of purchasing and the gas is generally purchased one month prior to delivery. APS has long-term gas transportation agreements with three different companies, some of which are effective through 2024. Fuel oil is acquired under short-term purchases delivered primarily to West Phoenix, where it is distributed to APS’s other oil power plants by truck.
10
Ocotillo is a 330 MW 4-unit gas plant. In early 2014, APS announced a project to modernize the plant, which involves retiring two older 110 MW steam units, adding five 102 MW combustion turbines and maintaining two existing 55 MW combustion turbines. In total, this increases the capacity of the site by 290 MW, to 620 MW, with completion targeted for summer 2018. The last milestone before construction begins was raised during the ACC's Integrated Resource Planning meeting in the fall of 2014. While there was support for the first 2 units which replace the existing steam units, questions were raised on the cost effectiveness for the additional three units. To address these matters, APS issued a request for proposal in late January 2015 for the incremental capacity, equivalent to 3 of the 5 units.
Solar Facilities
To date, APS has begun operation of 150 MW of utility scale solar through its AZ Sun Program, discussed below. These facilities are owned by APS and are located in multiple locations throughout Arizona.
Additionally, APS owns and operates more than forty small solar systems around the state. Together they have the capacity to produce approximately 4 MW of renewable energy. This fleet of solar systems includes a 3 MW facility located at the Prescott Airport and 1 MW of small solar in various locations across Arizona. APS has also developed solar photovoltaic distributed energy systems installed as part of the Community Power Project in Flagstaff, Arizona. The Community Power Project, approved by the ACC on April 1, 2010, is a pilot program through which APS owns, operates and receives energy from approximately 1 MW of solar photovoltaic distributed energy systems located within a certain test area in Flagstaff, Arizona. Additionally, APS owns 12 MW of solar photovoltaic systems installed across Arizona through the ACC-approved Schools and Government Program.
In December 2014, the ACC voted that it had no objection to APS implementing a 10 MWdc (approximately 8.5 MWac) residential rooftop program. The first stage of the residential rooftop solar program is to be 8 MW followed by a 2 MW second stage that will only be deployed if coupled with distributed storage. Under this program, APS will own, operate and maintain approximately 1,500 residential systems. The program will target specific distribution feeders in an effort to maximize potential system benefits, as well as make systems available to limited-income customers who cannot easily install solar through transactions with third parties.
Purchased Power Contracts
In addition to its own available generating capacity, APS purchases electricity under various arrangements, including long-term contracts and purchases through short-term markets to supplement its owned or leased generation and hedge its energy requirements. A portion of APS’s purchased power expense is netted against wholesale sales on the Consolidated Statements of Income. (See Note 16.) APS continually assesses its need for additional capacity resources to assure system reliability.
Purchased Power Capacity —
APS’s purchased power capacity under long-term contracts, including its renewable energy portfolio, is summarized in the table below. All capacity values are based on net capacity unless otherwise noted.
11
|
Type
|
|
Dates Available
|
|
Capacity (MW)
|
|
|
Purchase Agreement (a)
|
|
Year-round through June 14, 2020
|
|
60
|
|
|
Exchange Agreement (b)
|
|
May 15 to September 15 annually through 2020
|
|
480
|
|
|
Tolling Agreement
|
|
Year-round through May 2017
|
|
514
|
|
|
Tolling Agreement
|
|
Summer seasons through October 2019
|
|
560
|
|
|
Day-Ahead Call Option Agreement
|
|
Summer seasons through September 2015
|
|
500
|
|
|
Day-Ahead Call Option Agreement
|
|
Summer seasons through summer 2016
|
|
150
|
|
|
Demand Response Agreement (c)
|
|
Summer seasons through 2024
|
|
25
|
|
|
Renewable Energy (d)
|
|
Various
|
|
629
|
|
|
(a)
|
Up to 60 MW of capacity is available; however, the amount of electricity available to APS under this agreement is based in large part on customer demand and is adjusted annually.
|
|
(b)
|
This is a seasonal capacity exchange agreement under which APS receives electricity during the summer peak season (from May 15 to September 15) and APS returns a like amount of electricity during the winter season (from October 15 to February 15).
|
|
(c)
|
The capacity under this agreement may be increased in 5 MW increments in each of 2015 and 2016 and 10 MW increments in years 2017 through 2024, up to a maximum of 50 MW.
|
|
(d)
|
Renewable energy purchased power agreements are described in detail below under “Current and Future Resources — Renewable Energy Standard — Renewable Energy Portfolio.”
|
Current and Future Resources
Current Demand and Reserve Margin
Electric power demand is generally seasonal. In Arizona, demand for power peaks during the hot summer months. APS’s 2014 peak one-hour demand on its electric system was recorded on July 23, 2014 at 7,007 MW, compared to the 2013 peak of 6,927 MW recorded on July 8, 2013. APS’s reserve margin at the time of the 2014 peak demand, calculated using system load serving capacity, was 34%. Excluding certain contractual rights to call on additional capacity on short notice, which APS may use in the event of unusual weather or unplanned outages, the 2014 reserve margin was 24%. APS anticipates the reserve margin for 2015 will be approximately 33% or 23% excluding contractual rights to call on additional capacity. APS expects that our reserve margins will decrease over the next three years and that additional conventional resources will be needed around 2017.
Future Resources and Resource Plan
Under the ACC’s resource planning rule, APS will file by April 1 of each even-numbered year its resource plans for the next fifteen-year period. The rule requires the ACC to issue an order with its acknowledgment of APS’s resource plan within approximately ten months following its submittal. The ACC’s acknowledgment of APS’s resource plan will consider factors such as the total cost of electric energy services, demand management, analysis of supply-side options, system reliability and risk management. APS filed its 2014 resource plan on April 1, 2014 and it will be filing its next resource plan by April 1, 2016. The ACC staff is exploring potential ways to improve the resource plan process.
After considering the costs to comply with environmental regulations, on September 11, 2014, APS announced that it will close Cholla Unit 2 by April 2016 and cease burning coal at the other APS-owned units (Units 1 and 3) at the plant by the mid-2020s, if EPA approves a compromise proposal offered by APS to meet required environmental and emissions standards and rules. APS filed an amendment to its resource plan with the ACC to request approval of the retirement of Cholla Unit 2. The ACC has not yet made a decision on this amendment. Previously, APS estimated Cholla Unit 2’s end of life to be 2033. APS is currently recovering
12
depreciation and a return on the net book value of the unit in base rates and plans to seek recovery of all of the unit’s retirement-related costs in its next retail rate case. If APS closes Cholla Unit 2, APS believes it will be allowed recovery of the remaining net book value of Unit 2 (
$128 million
as of December 31, 2014), in addition to a return on its investment. In accordance with GAAP, in the third quarter of 2014, Unit 2’s remaining net book value was reclassified from property, plant and equipment to a regulatory asset. If the ACC does not allow full recovery of the remaining net book value of Cholla Unit 2, all or a portion of the regulatory asset will be written off and APS’s net income, cash flows, and financial position will be negatively impacted.
Renewable Energy Standard
In 2006, the ACC adopted the RES. Under the RES, electric utilities that are regulated by the ACC must supply an increasing percentage of their retail electric energy sales from eligible renewable resources, including solar, wind, biomass, biogas and geothermal technologies. The renewable energy requirement is 5% of retail electric sales in 2015 and increases annually until it reaches 15% in 2025. In APS’s 2009 retail rate case settlement agreement (the “2009 Settlement Agreement”), APS committed to have 1,700 GWh of new renewable resources in service by year-end 2015 in addition to its 2008 renewable resource commitments. Taken together, APS’s commitment is estimated to be approximately 12% of retail sales, by year-end 2015, which is more than double the RES target of 5% for that year. A component of the RES is focused on stimulating development of distributed energy systems (generally speaking, small-scale renewable technologies that are located on customers’ properties, such as rooftop solar systems). Accordingly, under the RES, an increasing percentage of that requirement must be supplied from distributed energy resources. This distributed energy requirement is 30% of the overall RES requirement of 5% in 2015. The following table summarizes the RES requirement standard (not including the additional commitment required by the 2009 Settlement Agreement) and its timing:
|
|
2015
|
2020
|
2025
|
||
|
RES as a % of retail electric sales
|
5%
|
10%
|
15%
|
||
|
Percent of RES to be supplied from distributed energy resources
|
30%
|
30%
|
30%
|
||
Renewable Energy Portfolio.
To date, APS has a diverse portfolio of existing and planned renewable resources totaling 1,253 MW, including solar, wind, geothermal, biomass and biogas. Of this portfolio, 1,194 MW are currently in operation and 59 MW are under contract for development or are under construction. Renewable resources in operation include 169 MW of facilities owned by APS, 629 MW of long-term purchased power agreements, and an estimated 396 MW of customer-sited, third-party owned distributed energy resources.
APS’s strategy to achieve its RES requirements includes executing purchased power contracts for new facilities, ongoing development of distributed energy resources and procurement of new facilities to be owned by APS. APS is developing owned solar resources through the AZ Sun Program. Under this program to date, APS estimates its investment commitment will be approximately $674 million. See Note 3 for additional details about the AZ Sun Program.
13
The following table summarizes APS’s renewable energy sources currently in operation and under development. Agreements for the development and completion of future resources are subject to various conditions, including successful siting, permitting and interconnection of the projects to the electric grid.
|
|
Location
|
Actual/
Target
Commercial
Operation
Date
|
Term
(Years)
|
Net
Capacity
In Operation
(MW AC)
|
Net Capacity
Planned/Under
Development
(MW AC)
|
||||||||
|
APS Owned
|
|
|
|
|
|
|
|
|
|||||
|
Solar:
|
|
|
|
|
|
|
|
|
|||||
|
AZ Sun Program:
|
|
|
|
|
|
|
|
|
|||||
|
Paloma
|
Gila Bend, AZ
|
2011
|
|
|
17
|
|
|
|
|||||
|
Cotton Center
|
Gila Bend, AZ
|
2011
|
|
|
17
|
|
|
|
|||||
|
Hyder Phase 1
|
Hyder, AZ
|
2011
|
|
|
11
|
|
|
|
|||||
|
Hyder Phase 2
|
Hyder, AZ
|
2012
|
|
|
5
|
|
|
|
|||||
|
Chino Valley
|
Chino Valley, AZ
|
2012
|
|
|
19
|
|
|
|
|||||
|
Hyder II
|
Hyder, AZ
|
2013
|
|
|
14
|
|
|
|
|||||
|
Foothills
|
Yuma, AZ
|
2013
|
|
|
35
|
|
|
|
|||||
|
Gila Bend
|
Gila Bend, AZ
|
2014
|
|
|
32
|
|
|||||||
|
Luke AFB
|
Glendale, AZ
|
2015
|
10
|
|
|||||||||
|
City of Phoenix
|
Buckeye, AZ
|
2015
|
10
|
|
|||||||||
|
Subtotal AZ Sun Program
|
|
|
|
|
150
|
|
20
|
|
|||||
|
Multiple Facilities
|
AZ
|
Various
|
|
|
4
|
|
|
|
|||||
|
Distributed Energy:
|
|
|
|
|
|
|
|
|
|||||
|
APS Owned (a)
|
AZ
|
Various
|
|
|
15
|
|
9
|
|
|||||
|
Total APS Owned
|
|
|
|
|
169
|
|
29
|
|
|||||
|
Purchased Power Agreements
|
|
|
|
|
|
|
|
|
|||||
|
Solar:
|
|
|
|
|
|
|
|
|
|||||
|
Solana
|
Gila Bend, AZ
|
2013
|
30
|
|
250
|
|
|
|
|||||
|
RE Ajo
|
Ajo, AZ
|
2011
|
25
|
|
5
|
|
|
|
|||||
|
Sun E AZ 1
|
Prescott, AZ
|
2011
|
30
|
|
10
|
|
|
|
|||||
|
Saddle Mountain
|
Tonopah, AZ
|
2012
|
30
|
|
15
|
|
|
|
|||||
|
Badger
|
Tonopah, AZ
|
2013
|
30
|
|
15
|
|
|
|
|||||
|
Gillespie
|
Maricopa County, AZ
|
2013
|
30
|
|
15
|
|
|
|
|||||
|
Wind:
|
|
|
|
|
|
|
|
|
|||||
|
Aragonne Mesa
|
Santa Rosa, NM
|
2006
|
20
|
|
90
|
|
|
|
|||||
|
High Lonesome
|
Mountainair, NM
|
2009
|
30
|
|
100
|
|
|
|
|||||
|
Perrin Ranch Wind
|
Williams, AZ
|
2012
|
25
|
|
99
|
|
|
|
|||||
|
Geothermal:
|
|
|
|
|
|
|
|
|
|||||
|
Salton Sea
|
Imperial County, CA
|
2006
|
23
|
|
10
|
|
|
|
|||||
|
Biomass:
|
|
|
|
|
|
|
|
|
|||||
|
Snowflake
|
Snowflake, AZ
|
2008
|
15
|
|
14
|
|
|
|
|||||
|
Biogas:
|
|
|
|
|
|
|
|
|
|||||
|
Glendale Landfill
|
Glendale, AZ
|
2010
|
20
|
|
3
|
|
|
|
|||||
|
NW Regional Landfill
|
Surprise, AZ
|
2012
|
20
|
|
3
|
|
|
|
|||||
|
Total Purchased Power Agreements
|
|
|
|
|
629
|
|
—
|
|
|||||
|
Distributed Energy
|
|
|
|
|
|
|
|
|
|||||
|
Solar
(b)
|
|
|
|
|
|
|
|
|
|||||
|
Third-party Owned
|
AZ
|
Various
|
|
|
363
|
|
30
|
|
|||||
|
Agreement 1
|
Bagdad, AZ
|
2011
|
25
|
|
15
|
|
|
|
|||||
|
Agreement 2
|
AZ
|
2011-2012
|
20-21
|
|
18
|
|
|
|
|||||
|
Total Distributed Energy
|
|
|
|
|
396
|
|
30
|
|
|||||
|
Total Renewable Portfolio
|
|
|
|
|
1,194
|
|
59
|
|
|||||
14
|
(a)
|
Includes Flagstaff Community Power Project, APS School and Government Program and APS Solar Partner Program.
|
|
(b)
|
Distributed generation is produced in DC and is converted to AC for reporting purposes.
|
Demand Side Management
In December 2009, Arizona regulators placed an increased focus on energy efficiency and other demand side management programs to encourage customers to conserve energy, while incentivizing utilities to aid in these efforts that ultimately reduce the demand for energy. The ACC initiated its Energy Efficiency rulemaking, with a proposed Energy Efficiency Standard (“EES”) of 22% cumulative annual energy savings by 2020. This standard was adopted and became effective on January 1, 2011. This standard will likely impact Arizona’s future energy resource needs. (See Note 3 for energy efficiency and other demand side management obligations.)
Government Awards
Through various DOE initiatives, the Federal government made a number of programs available for utilities to develop renewable resources, improve reliability and create jobs. APS continues its work on a $3 million financial award for a high penetration photovoltaic generation study related to the Community Power Project in Flagstaff, Arizona. This award will conclude during 2015 and is contingent upon APS meeting certain project milestones, including DOE-established budget parameters.
Competitive Environment and Regulatory Oversight
Retail
The ACC regulates APS’s retail electric rates and its issuance of securities. The ACC must also approve any significant transfer or encumbrance of APS’s property used to provide retail electric service and approve or receive prior notification of certain transactions between Pinnacle West, APS and their respective affiliates.
APS is subject to varying degrees of competition from other investor-owned electric and gas utilities in Arizona (such as Southwest Gas Corporation), as well as cooperatives, municipalities, electrical districts and similar types of governmental or non-profit organizations. In addition, some customers, particularly industrial and large commercial customers, may own and operate generation facilities to meet some or all of their own energy requirements. This practice is becoming more popular with customers installing or having installed products such as rooftop solar panels to meet or supplement their energy needs.
On April 14, 2010, the ACC issued a decision holding that solar vendors that install and operate solar facilities for non-profit schools and governments pursuant to a specific type of contract that calculates payments based on the energy produced are not “public service corporations” under the Arizona Constitution, and are therefore not regulated by the ACC. A second matter is pending with the ACC to determine whether that ruling should extend to solar providers who serve a broader customer base under the same business model. Use of such products by customers within our territory results in an increasing level of competition. APS cannot predict when, and the extent to which, additional electric service providers will enter or re-enter APS’s service territory.
In 1999, the ACC approved rules for the introduction of retail electric competition in Arizona. As a result, as of January 1, 2001, all of APS’s retail customers were eligible to choose alternate energy suppliers.
15
Although some very limited retail competition existed in APS’s service territory in 1999 and 2000, there are currently no active retail competitors offering unbundled energy or other utility services to APS’s customers. In 2000, the Arizona Superior Court found that the rules were in part unconstitutional and in other respects unlawful, the latter finding being primarily on procedural grounds, and invalidated all ACC orders authorizing competitive electric services providers to operate in Arizona. In 2004, the Arizona Court of Appeals invalidated some, but not all of the rules and upheld the invalidation of the orders authorizing competitive electric service providers. In 2005, the Arizona Supreme Court declined to review the Court of Appeals’ decision.
In 2008, the ACC directed the ACC staff to investigate whether such retail competition was in the public interest and what legal impediments remain to competition in light of the Court of Appeals’ decision referenced above. The ACC staff’s report on the results of its investigation was issued on August 12, 2010. The report stated that additional analysis, discussion and study of all aspects of the issue are required in order to perform a proper evaluation. While the report did not make any specific recommendations other than to conduct more workshops, the report did state that the current retail electric competition rules are incomplete and in need of modification.
On May 9, 2013, the ACC voted to re-examine the facilitation of a deregulated retail electric market in Arizona. The ACC subsequently opened a docket for this matter and received comments from a number of interested parties on the considerations involved in establishing retail electric deregulation in the state. One of these considerations was whether various aspects of a deregulated market, including setting utility rates on a “market” basis, would be consistent with the requirements of the Arizona Constitution. On September 11, 2013, after receiving legal advice from the ACC staff, the ACC voted 4-1 to close the current docket and await full Arizona Constitutional authority before any further examination of this matter. The motion approved by the ACC also included opening one or more new dockets in the future to explore options to offer more rate choices to customers and innovative changes within the existing cost-of-service regulatory model that could include elements of competition. The ACC opened a docket on November 4, 2013 to explore technological advances and innovative changes within the electric utility industry. A series of workshops in this docket were held in 2014 and another is currently scheduled for February 26, 2015.
Wholesale
FERC regulates rates for wholesale power sales and transmission services. (See Note 3 for information regarding APS’s transmission rates.) During 2014, approximately 7.3% of APS’s electric operating revenues resulted from such sales and services. APS’s wholesale activity primarily consists of managing fuel and purchased power supplies to serve retail customer energy requirements. APS also sells, in the wholesale market, its generation output that is not needed for APS’s Native Load and, in doing so, competes with other utilities, power marketers and independent power producers. Additionally, subject to specified parameters, APS hedges both electricity and fuels. The majority of these activities are undertaken to mitigate risk in APS’s portfolio.
16
Environmental Matters
Climate Change
Legislative Initiatives.
There have been no recent attempts by Congress to pass legislation that would regulate greenhouse gas (“GHG”) emissions, and it is unclear if and when the 114
th
Congress will consider a climate change bill. In the event climate change legislation ultimately passes, the actual economic and operational impact of such legislation on APS depends on a variety of factors, none of which can be fully known until a law is enacted and the specifics of the resulting program are established. These factors include the terms of the legislation with regard to allowed GHG emissions; the cost to reduce emissions; in the event a cap-and-trade program is established, whether any permitted emissions allowances will be allocated to source operators free of cost or auctioned (and, if so, the cost of those allowances in the marketplace) and whether offsets and other measures to moderate the costs of compliance will be available; and, in the event of a carbon tax, the amount of the tax per pound of carbon dioxide (“CO
2
”) equivalent emitted.
In addition to federal legislative initiatives, state-specific initiatives may also impact our business. While Arizona has no pending legislation and no proposed agency rule regulating GHGs in Arizona, the California legislature enacted AB 32 and SB 1368 in 2006 to address GHG emissions. In October 2011, the California Air Resources Board approved final regulations that established a state-wide cap on GHG emissions beginning on January 1, 2013 and established a GHG allowance trading program under that cap. The first phase of the program, which applies to, among other entities, importers of electricity, commenced on January 1, 2013. Under the program, entities selling electricity into California, including APS, must hold carbon allowances to cover GHG emissions associated with electricity sales into California from outside the state. APS is authorized to recover the cost of these carbon allowances through the PSA.
Regulatory Initiatives.
In 2009, EPA determined that GHG emissions endanger public health and welfare. This determination was made in response to a 2007 United States Supreme Court ruling that GHGs fit within the Clean Air Act’s broad definition of “air pollutant” and, as a result, EPA has the authority to regulate GHG emissions of new motor vehicles under the Clean Air Act. As a result of this “endangerment finding,” EPA determined that the Clean Air Act required new regulatory requirements for new and modified major GHG emitting sources, including power plants. EPA issued a rule under the Clean Air Act, known as the “tailoring rule,” establishing new GHG emission thresholds that determine when sources, including power plants, must obtain air operating permits or New Source Review permits. “New Source Review,” or “NSR,” is a pre-construction permitting program under the Clean Air Act that requires analysis of pollution controls prior to building a new stationary source or making major modifications to an existing stationary source. The tailoring rule became applicable to power plants in January 2011 and, as a result, APS will generally be required to consider the impact of GHG emissions as part of its traditional NSR analysis for new sources and major modifications to existing plants.
Consistent with President Obama’s June 2013 Climate Action Plan addressing his plans to reduce GHG emissions in the United States, pursuant to its endangerment finding and its authority under Section 111(b) of the Clean Air Act, on September 20, 2013, EPA issued a proposed rule, which would establish New Source Performance Standards (“NSPS”) for new fossil-fired power plants. Subsequently, on June 2, 2014, EPA issued two additional proposed rules to regulate GHG emissions from modified and reconstructed electric generating units ("EGUs") pursuant to Section 111(b) of the Clean Air Act and existing fossil fuel-fired power plants pursuant to Clean Air Act Section 111(d). On January 7, 2015, EPA announced that its carbon pollution standards for new, modified and reconstructed, and existing power plants would be finalized in summer 2015.
EPA’s proposed rule applicable to modified and reconstructed power plants would require fossil fuel-fired EGUs undergoing modification or reconstruction to meet CO
2
performance standards based on a
17
combination of best operating practices and equipment upgrades. The rule would also require existing EGUs that are modified or reconstructed after becoming subject to state or federal standards of performance for existing power plants under Section 111(d) of the Clean Air Act to continue to meet those requirements. We cannot currently predict the shape of any final rules or standards for modified and reconstructed fossil-fired EGUs or assess how they might potentially impact the Company.
With respect to existing power plants, EPA’s proposed “Clean Power Plan” rule proposes state-specific goals or targets to achieve reductions in CO
2
emissions from existing EGUs measured from a 2012 baseline. EPA’s proposed emission rates would not apply directly to specific units, but must be met on a state-wide basis. As proposed, each state’s goal is an emissions rate, which is a single number for the future carbon intensity of that state. The proposed rule provides guidelines to states to help develop their plans for meeting the interim (2020-2029) and final (2030 and beyond) emission rates set forth in the proposal. States would be required to submit their plans to EPA by summer 2016, although states may be eligible for one- or two-year extensions, provided they submit detailed explanations that contain specified information required by EPA in advance of the applicable due date. EPA’s proposal for Arizona would result in in-state coal-fired generation (with the exception of coal-fired generation located in Indian country) shifting to natural gas combined cycle and renewable generation. Such a substantial change in APS’s generation portfolio could require additional capital investments and increased operating costs, and thus have a significant financial impact on the Company. APS will continue to monitor these standards as they are developed.
As for sources in Indian country (which are not subject to state plans), on October 28, 2014, EPA issued a supplemental rule proposing carbon dioxide emission rates for U.S. territories and areas of Indian country with existing fossil fuel-fired EGUs, as well as guidelines for plans to achieve those rates. The supplemental proposal applies to Four Corners and the Navajo Plant, both of which are located on the Navajo Nation. With respect to these two plants, EPA applied the four building blocks described in its June 2, 2014 Clean Air Act Section 111(d) proposal to establish interim and final goals, expressed as CO
2
emission rates. If finalized as proposed, it is unlikely the rule would require additional emission reductions as a result of the plants’ past and future actions to comply with the Best Available Retrofit Technology (“BART”) requirements of EPA’s Clean Air Visibility Rule. (See “EPA Environmental Regulation - Regional Haze Rules” discussion below.)
Company Response to Climate Change Initiatives
.
We have undertaken a number of initiatives to address emission concerns, including renewable energy procurement and development, promotion of programs and rates that promote energy conservation, renewable energy use, and energy efficiency. (See “Energy Sources and Resource Planning - Current and Future Resources” above for details of these plans and initiatives.) APS currently has a diverse portfolio of renewable resources, including solar, wind, geothermal, biogas, and biomass, and we expect the percentage of renewable energy in our resource portfolio to increase over the coming years.
APS prepares an inventory of GHG emissions from its operations. This inventory is reported to EPA under the EPA GHG Reporting Program and is voluntarily communicated to the public in Pinnacle West’s annual Corporate Responsibility Report, which is available on our website (
www.pinnaclewest.com
). The report provides information related to the Company and its approach to sustainability and its workplace and environmental performance. The information on Pinnacle West’s website, including the Corporate Responsibility Report, is not incorporated by reference into this report.
EPA Environmental Regulation
Regional Haze Rules.
In 1999, EPA announced regional haze rules to reduce visibility impairment in national parks and wilderness areas. The rules require states (or, for sources located on tribal land, EPA) to determine what pollution control technologies constitute the BART for certain older major stationary sources,
18
including fossil-fired power plants. EPA subsequently issued the Clean Air Visibility Rule, which provides guidelines on how to perform a BART analysis.
The Four Corners and Navajo Plant participants’ obligations to comply with EPA’s final BART determinations (and Cholla’s obligations to comply with ADEQ’s and EPA’s determinations), coupled with the financial impact of potential future climate change legislation, other environmental regulations, and other business considerations, could jeopardize the economic viability of these plants or the ability of individual participants to continue their participation in these plants.
Cholla.
In 2007, ADEQ required APS to perform a BART analysis for Cholla pursuant to the Clean Air Visibility Rule. APS completed the BART analysis for Cholla and submitted its BART recommendations to ADEQ in early 2008. The recommendations include the installation of certain pollution control equipment that APS believes constitutes BART. ADEQ reviewed APS’s recommendations and submitted its proposed BART State Implementation Plan (“SIP”) for Cholla and other sources in Arizona in early 2011.
On December 5, 2012, EPA issued a final BART rule applicable to Cholla. EPA approved ADEQ’s BART emissions limits for sulfur dioxide (“SO
2
”) and emissions of particulate matter (“PM”), but added a SO
2
removal efficiency requirement of 95%. In addition, EPA disapproved ADEQ’s BART determinations for oxides of nitrogen (“NO
x
”) and promulgated a Federal Implementation Plan ("FIP") establishing a new, more stringent “bubbled” NO
x
emission rate applicable to the two BART-eligible Cholla units owned by APS and the other BART-eligible unit owned by PacifiCorp. In order to comply with this new rate, APS will be required to install SCR control technology on all three of the BART-eligible Cholla units. APS’s total costs for these post-combustion NO
x
controls would be approximately $200 million. This amount is not included in our current estimates for environmental capital expenditures in “Management’s Discussion and Analysis of Financial Condition and Results of Operations - Capital Expenditures” in Item 7. Under the FIP, APS has five years from December 2012 to complete installation of the equipment and achieve the BART emission limit for NO
x
.
APS believes that EPA’s final rule as it applies to Cholla is unsupported and that EPA had no basis for disapproving Arizona’s SIP and promulgating a FIP that is inconsistent with the state’s considered BART determinations under the regional haze program. Accordingly, on February 1, 2013, APS filed a Petition for Review of the final BART rule in the United States Court of Appeals for the Ninth Circuit. Briefing in the case was completed in February 2014, and the court scheduled oral argument for March 9, 2015.
In September 2014, APS met with EPA to propose a compromise BART strategy wherein, pending certain regulatory approvals, APS would permanently close Cholla Unit 2 by April 2016 and cease burning coal at Units 1 and 3 by the mid-2020s. (See Note 3 for details related to the resulting regulatory asset.) APS made the proposal with the understanding that additional emission control equipment to reduce regional haze is unlikely to be required in the future because retiring and converting the units as contemplated in the proposal is more cost-effective than, and will result in increased visibility improvement over, the current BART requirements for NO
x
imposed on the Cholla units under EPA’s BART FIP. Because APS’s proposal involves state and federal rule-making processes, APS is unable to predict when or whether it may ultimately be approved.
Four Corners
. On August 6, 2012, EPA issued its final BART determination for Four Corners, which requires APS to install and operate SCR control technology on Units 4 and 5 by July 31, 2018. (APS retired Four Corners Units 1-3 on December 30, 2013.) APS estimates that its 63% share of the cost of these controls for Four Corners Units 4 and 5 would be at least $350 million. APS expects to incur certain of these costs during the 2015 through 2017 timeframe, which are included in our capital expenditure estimates. (See “Management’s Discussion and Analysis of Financial Condition and Results of Operations - Capital Expenditures” in Item 7 for such estimates and for a discussion of the capital expenditures related to the
19
agreement to purchase El Paso's 7% interest in Units 4 and 5.) For PM emissions, EPA is requiring Units 4 and 5 to meet an emission limit of 0.015 lb/MMBtu and a 20 percent opacity limit, both of which are achievable through operation of Four Corners' existing baghouses. Although unrelated to BART, the final BART rule also imposes a 20 percent opacity limitation on certain fugitive dust emissions from Four Corners’ coal and material handling operations.
Navajo Plant
. On January 18, 2013, EPA issued a proposed BART rule for the Navajo Plant, which would require installation of SCR technology in order to achieve a new, more stringent plant-wide NO
x
emission limit. In addition, EPA proposed a “better than BART” alternative and solicited comment on other options that could set longer time frames for installing pollution controls if the Navajo Plant can achieve additional emission reductions. On July 26, 2013, a group of stakeholders, including SRP, the operating agent for the Navajo Plant, submitted to EPA two suggested alternatives to BART, which would achieve greater NO
x
emission reductions and result in greater reasonable progress toward the national visibility goal than EPA’s proposed BART determination. On July 28, 2014, EPA issued a final Navajo Plant BART rule approving the alternative stakeholder plan. Depending on which alternate operating scenario the Navajo Plant participants ultimately select, the required NO
x
emission reductions could be achieved by either closing one of the three 750 MW units at the plant or curtailing energy production across all three units, such that the emission reductions are commensurate with the closure of approximately one of the Navajo Plant units. APS estimates that its share of costs for upgrades at the Navajo Plant could be up to approximately $200 million. These costs are not included in the capital expenditure estimates described in "Management's Discussion and Analysis of Financial Condition and Results of Operations - Capital Expenditures" in Item 7 since the majority of such costs are expected to be incurred after 2017. In October 2014, a coalition of environmental groups, an Indian tribe, and others filed petitions for review in the United States Court of Appeals for the Ninth Circuit asking the Court to review EPA’s final BART rule for the Navajo Plant. We cannot predict the outcome of this petition.
Mercury and other Hazardous Air Pollutants.
On December 16, 2011, EPA issued the final Mercury and Air Toxics Standards (“MATS”) rule, which established maximum achievable control technology (“MACT”) standards to regulate emissions of mercury and other hazardous air pollutants from fossil-fired power plants. Generally, plants will have three years after the effective date of the rule to achieve compliance. In the case of Cholla and Four Corners, APS will have until April 16, 2016, or a total of four years after the MATS rule’s effective date, to comply with the new MACT standards because the respective permitting authorities granted APS’s requests for one-year compliance date extensions. Similarly, SRP will have until April 16, 2016 to comply with MATS at the Navajo Plant, as a result of a one-year extension granted by EPA and the Navajo Nation EPA.
The MATS rule will require APS to install additional pollution control equipment. APS has installed certain of the equipment necessary to meet the anticipated standards. APS estimates that the cost for the remaining equipment necessary to meet these standards is approximately $130 million for Cholla, which would be avoided if EPA approves APS’s compromise proposal discussed under “Regional Haze Rules - Cholla” above. These costs are not included in the capital expenditure estimates described in “Management’s Discussion and Analysis of Financial Condition and Results of Operations - Capital Expenditures” in Item 7. No additional equipment is needed for Four Corners Units 4 and 5 to comply with these rules. SRP, the operating agent for the Navajo Plant, is still evaluating compliance options under the rules.
Coal Combustion Waste.
On December 19, 2014, EPA issued its final regulations governing the handling and disposal of coal combustion residuals (“CCR”), such as fly ash and bottom ash. The rule regulates CCR as a non-hazardous waste under Subtitle D of the Resource Conservation and Recovery Act (“RCRA”) and establishes national minimum criteria for existing and new CCR landfills and surface impoundments and all lateral expansions consisting of location restrictions, design and operating criteria, groundwater monitoring and corrective action, closure requirements and post closure care, and recordkeeping, notification, and Internet posting requirements. The rule generally requires any existing unlined CCR surface
20
impoundment that is contaminating groundwater above a regulated constituent’s groundwater protection standard to stop receiving CCR and either retrofit or close, and further requires the closure of any CCR landfill or surface impoundment that cannot meet the applicable performance criteria for location restrictions or structural integrity.
Because the Subtitle D rule is self-implementing, the CCR standards apply directly to the regulated facility, and facilities are directly responsible for ensuring that their operations comply with the rule’s requirements. While EPA has chosen to regulate the disposal of CCR in landfills and surface impoundments as non-hazardous waste under the final rule, the agency makes clear that it will continue to evaluate any risks associated with CCR disposal and leaves open the possibility that it may regulate CCR as a hazardous waste under RCRA Subtitle C in the future.
APS currently disposes of CCR in ash ponds and dry storage areas at Cholla and Four Corners. APS estimates that its share of incremental costs to comply with the CCR rule for Four Corners is approximately $15 million, and its share of incremental costs for Cholla is approximately $85 million. APS expects to incur certain of these costs during the 2015-2017 timeframe, which are included in the capital expenditure estimates in “Management’s Discussion and Analysis of Financial Condition and Results of Operations - Capital Expenditures” in Item 7. The amount for Cholla contemplates the closure of Unit 2 in 2016. (See “EPA Environmental Regulation - Regional Haze Rules - Cholla” discussion above.) The Navajo Plant currently disposes of CCR in a dry landfill storage area. At this time, SRP, the operating agent for the Navajo Plant, is analyzing the operations that would be covered by the rule and any resulting compliance costs.
Effluent Limitation Guidelines.
On April 19, 2013, EPA proposed revised effluent limitation guidelines establishing technology-based wastewater discharge limitations for fossil-fired EGUs. EPA’s proposal offers numerous options (four of which are “preferred alternatives”) that target metals and other pollutants in wastewater streams originating from fly ash and bottom ash handling activities, scrubber activities, and non-chemical metal cleaning wastes operations. The preferred alternatives differ with respect to the scope of requirements that would be applicable to existing discharges of pollutants found in wastestreams generated at existing power plants. All four alternatives would establish a “zero discharge” effluent limit for all pollutants in fly ash transport water. However, requirements governing bottom ash transport water differ depending on which alternative EPA ultimately chooses and could range from effluent limits based on Best Available Technology Economically Achievable to “zero discharge” effluent limits. Depending on which alternative EPA finalizes, Four Corners may be required to change equipment and operating practices affecting boilers and ash handling systems, as well as change its waste disposal techniques. We cannot currently predict the shape of EPA’s final rule or whether this action will have a material adverse impact on our financial position, results of operations, or cash flows. EPA is currently subject to a consent decree deadline to finalize the revised guidelines by September 30, 2015.
Ozone National Ambient Air Quality Standards.
On December 17, 2014, EPA published a proposal to revise the primary ground-level ozone national ambient air quality standards (“NAAQS”) currently set at a level of 75 parts per billion (“ppb”). The rule would set a new, more stringent primary standard (intended to protect human health) within the range of 65 to 70 ppb and revise the secondary standard (intended to protect human welfare) to within the same range. In addition, EPA is soliciting comment on alternative standard levels below 65 ppb, and as low as 60 ppb. EPA is accepting public comment on the proposed new ranges for the standards until March 17, 2015, and is under a court-ordered deadline of October 1, 2015 to finalize the rule. As ozone standards become more stringent, our fossil generation units may come under increasing pressure to reduce emissions of nitrogen oxides and volatile organic compounds and to generate emission offsets for new projects or facility expansions located in ozone nonattainment areas. At this time, APS is unable to predict what impact the adoption of these standards may have on its financial position, results of operations, or cash flows.
21
New Source Review
.
On April 6, 2009, APS received a request from EPA under Section 114 of the Clean Air Act seeking detailed information regarding projects at and operations of Four Corners. This request is part of a national enforcement initiative that EPA has undertaken under the Clean Air Act. EPA has taken the position that many utilities have made certain physical or operational changes at their plants that should have triggered additional regulatory requirements under the NSR provisions of the Clean Air Act. Other electric utilities have received and responded to similar Section 114 requests, and several of them have been the subject of notices of violation and lawsuits filed by EPA. APS responded to EPA’s request in August 2009 and is currently unable to predict any resulting actions the EPA may take, including any potential litigation.
Clean Air Act Citizen Lawsuit
.
On October 4, 2011, Earthjustice, on behalf of several environmental organizations, filed a lawsuit in the United States District Court for the District of New Mexico against APS and the other Four Corners participants alleging violations of the NSR provisions of the Clean Air Act. Subsequent to filing its original Complaint, on January 6, 2012, Earthjustice filed a First Amended Complaint adding claims for violations of the Clean Air Act’s NSPS program. Among other things, the environmental plaintiffs seek to have the court enjoin operations at Four Corners until APS applies for and obtains any required NSR permits and complies with the NSPS. The plaintiffs further request the court to order the payment of civil penalties, including a beneficial mitigation project. On April 2, 2012, APS and the other Four Corners participants filed motions to dismiss. The case is being held in abeyance while the parties seek to negotiate a settlement. On March 30, 2013, upon joint motion of the parties, the court issued an order deeming the motions to dismiss withdrawn without prejudice during pendency of the stay. At such time as the stay is lifted, APS and the other Four Corners participants may reinstate their motions to dismiss. We are unable to predict the outcome of this matter.
Superfund-Related Matters.
The Comprehensive Environmental Response Compensation and Liability Act (“Superfund”) establishes liability for the cleanup of hazardous substances found contaminating the soil, water or air. Those who generated, transported or disposed of hazardous substances at a contaminated site are among those who are potentially responsible parties (“PRPs”). PRPs may be strictly, and often are jointly and severally, liable for clean-up. On September 3, 2003, EPA advised APS that EPA considers APS to be a PRP in the Motorola 52
nd
Street Superfund Site, Operable Unit 3 (“OU3”) in Phoenix, Arizona. APS has facilities that are within this Superfund site. APS and Pinnacle West have agreed with EPA to perform certain investigative activities of the APS facilities within OU3. In addition, on September 23, 2009, APS agreed with EPA and one other PRP to voluntarily assist with the funding and management of the site-wide groundwater remedial investigation and feasibility study work plan. We estimate that our costs related to this investigation and study will be approximately $2 million. We anticipate incurring additional expenditures in the future, but because the overall investigation is not complete and ultimate remediation requirements are not yet finalized, at the present time expenditures related to this matter cannot be reasonably estimated.
On August 6, 2013, the Roosevelt Irrigation District (“RID”) filed a lawsuit in Arizona District Court against APS and 24 other defendants, alleging that RID’s groundwater wells were contaminated by the release of hazardous substances from facilities owned or operated by the defendants. The lawsuit also alleges that, under Superfund laws, the defendants are jointly and severally liable to RID. The allegations against APS arise out of APS’s current and former ownership of facilities in and around OU3. We are unable to predict the outcome of this matter; however, we do not expect the outcome to have a material impact on our financial position, results of operations or cash flows.
Manufactured Gas Plant
Sites.
Certain properties which APS now owns or which were previously owned by it or its corporate predecessors were at one time sites of, or sites associated with, manufactured gas plants. APS is taking action to voluntarily remediate these sites. APS does not expect these matters to have a material adverse effect on its financial position, results of operations or cash flows.
22
Navajo Nation Environmental Issues
Four Corners and the Navajo Plant are located on the Navajo Reservation and are held under easements granted by the federal government, as well as leases from the Navajo Nation. See “Energy Sources and Resource Planning - Generation Facilities - Coal-Fueled Generating Facilities” above for additional information regarding these plants.
In July 1995, the Navajo Nation enacted the Navajo Nation Air Pollution Prevention and Control Act, the Navajo Nation Safe Drinking Water Act, and the Navajo Nation Pesticide Act (collectively, the “Navajo Acts”). The Navajo Acts purport to give the Navajo Nation Environmental Protection Agency authority to promulgate regulations covering air quality, drinking water, and pesticide activities, including those activities that occur at Four Corners and the Navajo Plant. On October 17, 1995, the Four Corners participants and the Navajo Plant participants each filed a lawsuit in the District Court of the Navajo Nation, Window Rock District, challenging the applicability of the Navajo Acts as to Four Corners and the Navajo Plant. The Court has stayed these proceedings pursuant to a request by the parties, and the parties are seeking to negotiate a settlement.
In April 2000, the Navajo Nation Council approved operating permit regulations under the Navajo Nation Air Pollution Prevention and Control Act. APS believes the Navajo Nation exceeded its authority when it adopted the operating permit regulations. On July 12, 2000, the Four Corners participants and the Navajo Plant participants each filed a petition with the Navajo Supreme Court for review of these regulations. Those proceedings have been stayed, pending the settlement negotiations mentioned above. APS cannot currently predict the outcome of this matter.
On May 18, 2005, APS, Salt River Project, as the operating agent for the Navajo Plant, and the Navajo Nation executed a Voluntary Compliance Agreement to resolve their disputes regarding the Navajo Nation Air Pollution Prevention and Control Act. As a result of this agreement, APS sought, and the courts granted, dismissal of the pending litigation in the Navajo Nation Supreme Court and the Navajo Nation District Court, to the extent the claims relate to the Clean Air Act. The agreement does not address or resolve any dispute relating to other Navajo Acts. APS cannot currently predict the outcome of this matter.
Water Supply
Assured supplies of water are important for APS’s generating plants. At the present time, APS has adequate water to meet its needs. However, the Four Corners region, in which Four Corners is located, has been experiencing drought conditions that may affect the water supply for the plants if adequate moisture is not received in the watershed that supplies the area. APS is continuing to work with area stakeholders to implement agreements to minimize the effect, if any, on future operations of the plant. The effect of the drought cannot be fully assessed at this time, and APS cannot predict the ultimate outcome, if any, of the drought or whether the drought will adversely affect the amount of power available, or the price thereof, from Four Corners.
Conflicting claims to limited amounts of water in the southwestern United States have resulted in numerous court actions, which, in addition to future supply conditions, have the potential to impact APS’s operations.
San Juan River Adjudication.
Both groundwater and surface water in areas important to APS’s operations have been the subject of inquiries, claims, and legal proceedings, which will require a number of years to resolve. APS is one of a number of parties in a proceeding, filed March 13, 1975, before the Eleventh Judicial District Court in New Mexico to adjudicate rights to a stream system from which water for Four
23
Corners is derived. An agreement reached with the Navajo Nation in 1985, however, provides that if Four Corners loses a portion of its rights in the adjudication, the Navajo Nation will provide, for an agreed upon cost, sufficient water from its allocation to offset the loss. In addition, APS is a party to a water contract that allows the company to secure water for Four Corners in the event of a water shortage and is a party to a shortage sharing agreement, which provides for the apportionment of water supplies to Four Corners in the event of a water shortage in the San Juan River Basin.
Gila River Adjudication.
A summons served on APS in early 1986 required all water claimants in the Lower Gila River Watershed in Arizona to assert any claims to water on or before January 20, 1987, in an action pending in Arizona Superior Court. Palo Verde is located within the geographic area subject to the summons. APS’s rights and the rights of the other Palo Verde participants to the use of groundwater and effluent at Palo Verde are potentially at issue in this action. As operating agent of Palo Verde, APS filed claims that dispute the court’s jurisdiction over the Palo Verde participants’ groundwater rights and their contractual rights to effluent relating to Palo Verde. Alternatively, APS seeks confirmation of such rights. Several of APS’s other power plants are also located within the geographic area subject to the summons. APS’s claims dispute the court’s jurisdiction over APS’s groundwater rights with respect to these plants. Alternatively, APS seeks confirmation of such rights. In November 1999, the Arizona Supreme Court issued a decision confirming that certain groundwater rights may be available to the federal government and Indian tribes. In addition, in September 2000, the Arizona Supreme Court issued a decision affirming the lower court’s criteria for resolving groundwater claims. Litigation on both of these issues has continued in the trial court. In December 2005, APS and other parties filed a petition with the Arizona Supreme Court requesting interlocutory review of a September 2005 trial court order regarding procedures for determining whether groundwater pumping is affecting surface water rights. The Arizona Supreme Court denied the petition in May 2007, and the trial court is now proceeding with implementation of its 2005 order. No trial date concerning APS’s water rights claims has been set in this matter.
Little Colorado River Adjudication.
APS has filed claims to water in the Little Colorado River Watershed in Arizona in an action pending in the Apache County, Arizona, Superior Court, which was originally filed on September 5, 1985. APS’s groundwater resource utilized at Cholla is within the geographic area subject to the adjudication and, therefore, is potentially at issue in the case. APS’s claims dispute the court’s jurisdiction over its groundwater rights. Alternatively, APS seeks confirmation of such rights. Other claims have been identified as ready for litigation in motions filed with the court. No trial date concerning APS’s water rights claims has been set in this matter.
Although the above matters remain subject to further evaluation, APS does not expect that the described litigation will have a material adverse impact on its financial position, results of operations, or cash flows.
BUSINESS OF OTHER SUBSIDIARIES
Bright Canyon Energy
On July 31, 2014, Pinnacle West announced its creation of a wholly-owned subsidiary, BCE. BCE will focus on new growth opportunities that leverage the Company’s core expertise in the electric energy industry. BCE’s first initiative is a 50/50 joint venture with MidAmerican Transmission, LLC. The joint venture, named TransCanyon, intends to focus on transmission opportunities within the Western Electricity Coordinating Council, excluding the retail service territories of the venture partners’ utility affiliates. The joint venture submitted a bid into CAISO's competitive solicitation process to design, build and own a new 500 kV transmission line between Arizona and California, the Delaney to Colorado River Transmission Line. The winner of the bidding process is expected to be announced in 2015. This transmission line will connect a
24
planned Delaney substation near Palo Verde in Arizona to the existing Colorado River substation located just west of Blythe, California
.
El Dorado
El Dorado owns minority interests in several energy-related investments and Arizona community-based ventures. El Dorado’s short-term goal is to prudently realize the value of its existing investments. As of December 31, 2014, El Dorado had total assets of approximately $9 million. El Dorado is not expected to contribute in any material way to our future financial performance, nor will it require any material amounts of capital over the next three years.
SunCor
In February 2012, SunCor filed for protection under the United States Bankruptcy Code to complete an orderly liquidation of its business. On March 25, 2013, the bankruptcy plan submitted to the court and agreed to by SunCor and its creditors (the “Joint Plan”) became effective. The Joint Plan provides for the full release of Pinnacle West and its affiliates from any and all claims related to SunCor, SunCor’s subsidiaries, and their respective estates. SunCor and its subsidiaries have been formally dissolved.
OTHER INFORMATION
Pinnacle West, APS and El Dorado are all incorporated in the State of Arizona. BCE is incorporated in Delaware. Additional information for each of these companies is provided below:
|
|
Principal Executive Office
Address
|
Year of
Incorporation
|
Approximate
Number of
Employees at
December 31, 2014
|
||||
|
Pinnacle West
|
400 North Fifth Street
Phoenix, AZ 85004
|
1985
|
83
|
|
|||
|
APS
|
400 North Fifth Street
P.O. Box 53999
Phoenix, AZ 85072-3999
|
1920
|
6,279
|
|
|||
|
BCE
|
400 North Fifth Street
Phoenix, AZ 85004
|
2014
|
4
|
|
|||
|
El Dorado
|
400 North Fifth Street
Phoenix, AZ 85004
|
1983
|
—
|
|
|||
|
Total
|
|
|
6,366
|
|
|||
The APS number includes employees at jointly-owned generating facilities (approximately 2,830 employees) for which APS serves as the generating facility manager. Approximately 1,673 APS employees are union employees, represented by the International Brotherhood of Electrical Workers ("IBEW") or the United Security Professionals of America ("USPA"). APS is currently negotiating with IBEW representatives over the collective bargaining agreement that expires on March 31, 2015. The Company concluded negotiations with the USPA over the terms of a new collective bargaining agreement in May of 2014, and the new agreement is in place until May 31, 2017.
WHERE TO FIND MORE INFORMATION
We use our website (
www.pinnaclewest.com)
as a channel of distribution for material Company information. The following filings are available free of charge on our website as soon as reasonably practicable after they are electronically filed with, or furnished to, the Securities and Exchange Commission (“SEC”): Annual Reports on Form 10-K, definitive proxy statements for our annual shareholder meetings, Quarterly Reports on Form 10-Q, Current Reports on Form 8-K and all amendments to those reports. Our
25
board and committee charters, Code of Ethics for Financial Executives, Code of Ethics and Business Practices and other corporate governance information is also available on the Pinnacle West website. Pinnacle West will post any amendments to the Code of Ethics for Financial Executives and Code of Ethics and Business Practices, and any waivers that are required to be disclosed by the rules of either the SEC or the New York Stock Exchange, on its website. The information on Pinnacle West’s website is not incorporated by reference into this report.
You can request a copy of these documents, excluding exhibits, by contacting Pinnacle West at the following address: Pinnacle West Capital Corporation, Office of the Corporate Secretary, Mail Station 8602, P.O. Box 53999, Phoenix, Arizona 85072-3999 (telephone 602-250-4400).
In addition to the factors affecting specific business operations identified in the description of these operations contained elsewhere in this report, set forth below are risks and uncertainties that could affect our financial results. Unless otherwise indicated or the context otherwise requires, the following risks and uncertainties apply to Pinnacle West and its subsidiaries, including APS.
REGULATORY RISKS
Our financial condition depends upon APS’s ability to recover costs in a timely manner from customers through regulated rates and otherwise execute its business strategy.
APS is subject to comprehensive regulation by several federal, state and local regulatory agencies that significantly influence its business, liquidity, results of operations and its ability to fully recover costs from utility customers in a timely manner. The ACC regulates APS’s retail electric rates and FERC regulates rates for wholesale power sales and transmission services. The profitability of APS is affected by the rates it may charge and the timeliness of recovering costs incurred through its rates. Consequently, our financial condition and results of operations are dependent upon the satisfactory resolution of any APS rate proceedings and ancillary matters which may come before the ACC and FERC. Arizona, like certain other states, has a statute that allows the ACC to reopen prior decisions and modify otherwise final orders under certain circumstances. The ACC must also approve APS’s issuance of securities and any significant transfer or encumbrance of APS property used to provide retail electric service, and must approve or receive prior notification of certain transactions between us, APS and our respective affiliates. Decisions made by the ACC or FERC could have a material adverse impact on our financial condition, results of operations or cash flows.
APS’s ability to conduct its business operations and avoid fines and penalties depends upon compliance with federal, state or local statutes, regulations and ACC requirements, and obtaining and maintaining certain regulatory permits, approvals and certificates.
APS must comply in good faith with all applicable statutes, regulations, rules, tariffs, and orders of agencies that regulate APS’s business, including FERC, NRC, EPA, the ACC, and state and local governmental agencies. These agencies regulate many aspects of APS’s utility operations, including safety and performance, emissions, siting and construction of facilities, customer service and the rates that APS can charge retail and wholesale customers. Failure to comply can subject APS to, among other things, fines and penalties. For example, under the Energy Policy Act of 2005, FERC can impose penalties (up to one million dollars per day per violation) for failure to comply with mandatory electric reliability standards. APS is also required to have numerous permits, approvals and certificates from these agencies. APS believes the necessary permits, approvals and certificates have been obtained for its existing operations and that APS’s business is conducted in accordance with applicable laws in all material respects. However, changes in regulations or the imposition
26
of new or revised laws or regulations could have an adverse impact on our results of operations. We are also unable to predict the impact on our business and operating results from pending or future regulatory activities of any of these agencies
.
The operation of APS’s nuclear power plant exposes it to substantial regulatory oversight and potentially significant liabilities and capital expenditures.
The NRC has broad authority under federal law to impose safety-related, security-related and other licensing requirements for the operation of nuclear generation facilities. Events at nuclear facilities of other operators or impacting the industry generally may lead the NRC to impose additional requirements and regulations on all nuclear generation facilities, including Palo Verde. As a result of the March 2011 earthquake and tsunamis that caused significant damage to the Fukushima Daiichi Nuclear Power Plant in Japan, various industry organizations are working to analyze information from the Japan incident and develop action plans for U.S. nuclear power plants. Additionally, the NRC has been performing its own independent review of the events at Fukushima Daiichi, including a review of the agency’s processes and regulations in order to determine whether the agency should promulgate additional regulations and possibly make more fundamental changes to the NRC’s system of regulation. We cannot predict when or if the NRC will complete its formal actions as a result of its review. As a result of the Fukushima event, however, the NRC has directed nuclear power plants to implement the first tier recommendations of the NRC’s Near Term Task Force. In response to these recommendations, Palo Verde expects to spend approximately $40 million for capital enhancements to the plant over the next two years in addition to the approximate $80 million that has already been spent on capital enhancements as of December 31, 2014 (APS’s share is 29.1%). We cannot predict whether these amounts will increase or whether additional financial and/or operational requirements on Palo Verde and APS may be imposed.
In the event of noncompliance with its requirements, the NRC has the authority to impose a progressively increased inspection regime that could ultimately result in the shut-down of a unit or civil penalties, or both, depending upon the NRC’s assessment of the severity of the situation, until compliance is achieved. The increased costs resulting from penalties, a heightened level of scrutiny and implementation of plans to achieve compliance with NRC requirements may adversely affect APS’s financial condition, results of operations and cash flows.
APS is subject to numerous environmental laws and regulations, and changes in, or liabilities under, existing or new laws or regulations may increase APS’s cost of operations or impact its business plans.
APS is, or may become, subject to numerous environmental laws and regulations affecting many aspects of its present and future operations, including air emissions, water quality, discharges of wastewater and streams originating from fly ash and bottom ash handling facilities, solid waste, hazardous waste, and coal combustion products, which consist of bottom ash, fly ash, and air pollution control wastes. These laws and regulations can result in increased capital, operating, and other costs, particularly with regard to enforcement efforts focused on power plant emissions obligations. These laws and regulations generally require APS to obtain and comply with a wide variety of environmental licenses, permits, and other approvals. If there is a delay or failure to obtain any required environmental regulatory approval, or if APS fails to obtain, maintain, or comply with any such approval, operations at affected facilities could be suspended or subject to additional expenses. In addition, failure to comply with applicable environmental laws and regulations could result in civil liability as a result of government enforcement actions or private claims or criminal penalties. Both public officials and private individuals may seek to enforce applicable environmental laws and regulations. APS cannot predict the outcome (financial or operational) of any related litigation that may arise.
Environmental Clean Up.
APS has been named as a PRP for a Superfund site in Phoenix, Arizona, and it could be named a PRP in the future for other environmental clean-up at sites identified by a regulatory body.
27
APS cannot predict with certainty the amount and timing of all future expenditures related to environmental matters because of the difficulty of estimating clean-up costs. There is also uncertainty in quantifying liabilities under environmental laws that impose joint and several liability on all PRPs.
Regional Haze.
APS has received final rulemakings imposing new requirements on Four Corners, Cholla and the Navajo Plant. Pursuant to these rules, EPA and ADEQ will require these plants to install pollution control equipment that constitutes BART to lessen the impacts of emissions on visibility surrounding the plants. The financial impact of installing and operating the required pollution control equipment could jeopardize the economic viability of these plants or the ability of individual participants to continue their participation in these plants.
Coal Ash.
In December 2014, EPA issued final regulations governing the handling and disposal of CCR, which are generated as a result of burning coal and consist of, among other things, fly ash and bottom ash. The rule regulates CCR as a non-hazardous waste. APS currently disposes of CCR in ash ponds and dry storage areas at Cholla and Four Corners and in a dry landfill storage area at the Navajo Plant. To the extent the rule requires the closure or modification of these CCR units or the construction of new CCR units beyond what we currently anticipate, APS could incur significant additional costs for CCR disposal.
Effluent Limitation Guidelines.
EPA is expected to finalize revised effluent limitation guidelines establishing technology-based wastewater discharge limitations for fossil-fired EGUs in 2015. EPA has indicated that it expects the revised standards to target metals and other pollutants in wastewater streams originating from fly ash and bottom ash handling activities and scrubber-related operations. APS currently disposes of fly ash waste and bottom ash in ash ponds at Four Corners. Changes required by the rule could significantly increase ash disposal costs at Four Corners.
Ozone National Ambient Air Quality Standards.
In December 2014, EPA proposed revisions to the national ambient air quality standards, which would set new, more stringent standards intended to protect human health and human welfare. Depending on the stringency of the final standards and the implementation requirements, APS may be required to invest in new pollution control technologies and to generate emission offsets for new projects or facility expansions located in ozone nonattainment areas.
New Source Review.
EPA has taken the position that many projects electric utilities have performed are major modifications that trigger NSR requirements under the Clean Air Act. The utilities generally have taken the position that these projects are routine maintenance, repair and replacement and did not result in emissions increases, and thus are not subject to NSR. In 2009, APS received and responded to a request from EPA regarding projects and operations at Four Corners. Several environmental non-governmental organizations filed suit against the Four Corners participants for alleged violations of the Clean Air Act's NSR and NSPS programs. If EPA seeks to impose NSR requirements at Four Corners or any other APS plant, or if the citizens groups prevail in their Clean Air Act lawsuit, capital investments could be required to install new pollution control technologies. EPA could also seek civil penalties.
APS cannot assure that existing environmental regulations will not be revised or that new regulations seeking to protect the environment will not be adopted or become applicable to it. Revised or additional regulations that result in increased compliance costs or additional operating restrictions, particularly if those costs incurred by APS are not fully recoverable from APS’s customers, could have a material adverse effect on its financial condition, results of operations or cash flows. Due to current or potential future regulations or legislation, the economics of continuing to own certain resources, particularly coal facilities, may deteriorate, warranting early retirement of those plants, which may result in asset impairments. APS would seek recovery in rates for the book value of any remaining investments in the plants as well as other costs related to early retirement, but cannot predict whether it would obtain such recovery.
28
APS faces physical and operational risks related to climate effects, and potential financial risks resulting from climate change litigation and legislative and regulatory efforts to limit GHG emissions.
Concern over climate change has led to significant legislative and regulatory efforts to limit CO2, which is a major byproduct of the combustion of fossil fuel, and other GHG emissions.
Financial Risks - Potential Greenhouse Gas Regulation.
In
2014, EPA proposed a rule to limit carbon dioxide emissions from existing power plants. EPA expects to finalize the proposal in summer 2015. EPA’s proposal for Arizona would result in a shift in in-state generation from coal to natural gas and renewable generation. Such a substantial change in APS’s generation portfolio could require additional capital investments and increased operating costs, and thus have a significant financial impact on the Company.
Physical and Operational Risks.
Weather extremes such as drought and high temperature variations are common occurrences in the Southwest’s desert area, and these are risks that APS considers in the normal course of business in the engineering and construction of its electric system. Large increases in ambient temperatures could require evaluation of certain materials used within its system and represent a greater challenge.
Deregulation or restructuring of the electric industry may result in increased competition, which could have a significant adverse impact on APS’s business and its results of operations.
In 1999, the ACC approved rules for the introduction of retail electric competition in Arizona. Retail competition could have a significant adverse financial impact on APS due to an impairment of assets, a loss of retail customers, lower profit margins or increased costs of capital. Although some very limited retail competition existed in APS’s service area in 1999 and 2000, there are currently no active retail competitors offering unbundled energy or other utility services to APS’s customers. On May 9, 2013, the ACC voted to re-examine the facilitation of a deregulated retail electric market in Arizona. The ACC subsequently opened a docket for this matter and received comments from a number of interested parties on the considerations involved in establishing retail electric deregulation in the state. One of these considerations is whether various aspects of a deregulated market, including setting utility rates on a “market” basis, would be consistent with the requirements of the Arizona Constitution. On September 11, 2013, after receiving legal advice from the ACC staff, the ACC voted 4-1 to close the current docket and await full Arizona Constitutional authority before any further examination of this matter. The motion approved by the ACC also included opening one or more new dockets in the future to explore options to offer more rate choices to customers and innovative changes within the existing cost-of-service regulatory model that could include elements of competition. One of these options could be a continuation or expansion of APS’s existing AG (Alternative Generation) — 1 program, which essentially allows up to 200 MW of cumulative load to be served via a buy-through arrangement with competitive suppliers of generation. We cannot predict future regulatory or legislative action that might result in increased competition.
In 2010, the ACC issued a decision holding that solar vendors that install and operate solar facilities for non-profit schools and governments pursuant to a specific type of contract that calculates payments based on the energy produced are not “public service corporations” under the Arizona Constitution, and are therefore not regulated by the ACC. A second matter is pending with the ACC to determine whether that ruling should extend to solar providers who serve a broader customer base under the same business model. The use of such products by customers within our territory results in some level of competition. APS cannot predict whether the ACC will deem these vendors “public service corporations” subject to ACC regulation and when, and the extent to which, additional service providers will enter APS’s service territory, increasing the level of competition in the market.
29
OPERATIONAL RISKS
APS’s results of operations can be adversely affected by various factors impacting demand for electricity.
Weather Conditions.
Weather conditions directly influence the demand for electricity and affect the price of energy commodities. Electric power demand is generally a seasonal business. In Arizona, demand for power peaks during the hot summer months, with market prices also peaking at that time. As a result, APS’s overall operating results fluctuate substantially on a seasonal basis. In addition, APS has historically sold less power, and consequently earned less income, when weather conditions are milder. As a result, unusually mild weather could diminish APS’s financial condition, results of operations and cash flows.
Higher temperatures may decrease the snowpack, which might result in lowered soil moisture and an increased threat of forest fires. Forest fires could threaten APS’s communities and electric transmission lines and facilities. Any damage caused as a result of forest fires could negatively impact APS’s financial condition, results of operations or cash flows.
Effects of Energy Conservation Measures and Distributed Energy.
The ACC has enacted rules regarding energy efficiency that mandate a 22% annual energy savings requirement by 2020. This will likely increase participation by APS customers in energy efficiency and conservation programs and other demand-side management efforts, which in turn will impact the demand for electricity. The rules also include a requirement for the ACC to review and address financial disincentives, recovery of fixed costs and the recovery of net lost income/revenue that would result from lower sales due to increased energy efficiency requirements. To that end, the settlement agreement in APS’s most recent retail rate case (the “2012 Settlement Agreement”) includes a mechanism, the LFCR, to address these matters.
APS must also meet certain distributed energy requirements. A portion of APS’s total renewable energy requirement must be met with an increasing percentage of distributed energy resources (generally, small scale renewable technologies located on customers’ properties). The distributed energy requirement was 25% of the overall RES requirement of 3% in 2011 and increased to 30% of the applicable RES requirement for 2012 and subsequent years. Customer participation in distributed energy programs would result in lower demand, since customers would be meeting some or all of their own energy needs. Reduced demand due to these energy efficiency and distributed energy requirements, unless substantially offset through ratemaking mechanisms, could have a material adverse impact on APS’s financial condition, results of operations and cash flows.
Customer and Sales Growth.
For the three years 2012 through 2014, APS’s retail customer growth averaged 1.3% per year. We currently expect annual customer growth to average in the range of 2.0-3.0% for 2015 through 2017 based on our assessment of modestly improving economic conditions in Arizona. For the three years 2012 through 2014, APS experienced annual decreases in retail electricity sales averaging 0.2%, adjusted to exclude the effects of weather variations. We currently estimate that annual retail electricity sales in kWh will increase on average in the range of 0.5-1.5% during 2015 through 2017, including the effects of customer conservation and energy efficiency and distributed renewable generation initiatives, but excluding the effects of weather variations. Actual customer and sales growth may differ from our projections as a result of numerous factors, such as economic conditions, customer growth, usage patterns and energy conservation, impacts of energy efficiency programs and growth in distributed generation, and responses to retail price changes. Additionally, recovery of a substantial portion of our fixed costs of providing service is based upon the volumetric amount of our sales. If our customer growth rate does not continue to improve as projected, or if it declines, or if the Arizona economy fails to improve, we may be unable to reach our estimated demand level and sales projections, which could have a negative impact on our financial condition, results of operations and cash flows.
30
The operation of power generation facilities and transmission systems involves risks that could result in reduced output or unscheduled outages, which could materially affect APS’s results of operations
.
The operation of power generation, transmission and distribution facilities involves certain risks, including the risk of breakdown or failure of equipment, fuel interruption, and performance below expected levels of output or efficiency. Unscheduled outages, including extensions of scheduled outages due to mechanical failures or other complications, occur from time to time and are an inherent risk of APS’s business. Because our transmission facilities are interconnected with those of third parties, the operation of our facilities could be adversely affected by unexpected or uncontrollable events occurring on the larger transmission power grid, and the operation or failure of our facilities could adversely affect the operations of others. If APS’s facilities operate below expectations, especially during its peak seasons, it may lose revenue or incur additional expenses, including increased purchased power expenses. Concerns over physical security of these assets is also increasing, which may require us to incur additional capital and operating costs to address. Damage to certain of our facilities due to vandalism or other deliberate acts could lead to outages or other adverse effects.
The inability to successfully develop or acquire generation resources to meet reliability requirements, new or evolving standards or regulations could adversely impact our business.
Potential changes in regulatory standards, impacts of new and existing laws and regulations, including environmental laws and regulations, and the need to obtain certain regulatory approvals create uncertainty surrounding our generation portfolio. The current abundance of low, stably priced natural gas, together with environmental and other concerns surrounding coal-fired generation resources, create strategic questions related to the appropriate generation portfolio and fuel diversification mix. In addition, APS is required by the ACC to meet certain energy resource portfolio requirements such as the EES and the RES. The development of any generation facility is subject to many risks, including risks related to financing, siting, permitting, technology, the construction of sufficient transmission capacity to support these facilities and stresses to generation and transmission resources from intermittent generation characteristics of renewable resources. APS’s inability to adequately develop or acquire the necessary generation resources could have a material adverse impact on our business and results of operations.
The lack of access to sufficient supplies of water could have a material adverse impact on APS’s business and results of operations.
Assured supplies of water are important for APS’s generating plants. Water in the southwestern United States is limited, and various parties have made conflicting claims regarding the right to access and use such limited supply of water. Both groundwater and surface water in areas important to APS’s generating plants have been and are the subject of inquiries, claims and legal proceedings. In addition, the region in which APS’s power plants are located is prone to drought conditions, which could potentially affect the plants’ water supplies. APS’s inability to access sufficient supplies of water could have a material adverse impact on our business and results of operations.
The ownership and operation of power generation and transmission facilities on Indian lands could result in uncertainty related to continued leases, easements and rights-of-way, which could have a significant impact on our business.
Certain APS power plants, including Four Corners, and portions of the transmission lines that carry power from these plants are located on Indian lands pursuant to leases, easements or other rights-of-way that are effective for specified periods. APS is unable to predict the final outcome of pending and future approvals by applicable governing bodies with respect to renewals of these leases, easements and rights-of-way.
31
There are inherent risks in the ownership and operation of nuclear facilities, such as environmental, health, fuel supply, spent fuel disposal, regulatory and financial risks and the risk of terrorist attack.
APS has an ownership interest in and operates, on behalf of a group of participants, Palo Verde, which is the largest nuclear electric generating facility in the United States. Palo Verde constitutes approximately 18% of our owned and leased generation capacity. Palo Verde is subject to environmental, health and financial risks, such as the ability to obtain adequate supplies of nuclear fuel; the ability to dispose of spent nuclear fuel; the ability to maintain adequate reserves for decommissioning; potential liabilities arising out of the operation of these facilities; the costs of securing the facilities against possible terrorist attacks; and unscheduled outages due to equipment and other problems. APS maintains nuclear decommissioning trust funds and external insurance coverage to minimize its financial exposure to some of these risks; however, it is possible that damages could exceed the amount of insurance coverage. In addition, APS may be required under federal law to pay up to $111 million (but not more than $16.5 million per year) of liabilities arising out of a nuclear incident occurring not only at Palo Verde, but at any other nuclear power plant in the United States. Although we have no reason to anticipate a serious nuclear incident at Palo Verde, if an incident did occur, it could materially and adversely affect our results of operations and financial condition. A major incident at a nuclear facility anywhere in the world could cause the NRC to limit or prohibit the operation or licensing of any domestic nuclear unit and to promulgate new regulations that could require significant capital expenditures and/or increase operating costs.
The use of derivative contracts in the normal course of our business could result in financial losses that negatively impact our results of operations.
APS’s operations include managing market risks related to commodity prices. APS is exposed to the impact of market fluctuations in the price and transportation costs of electricity, natural gas and coal to the extent that unhedged positions exist. We have established procedures to manage risks associated with these market fluctuations by utilizing various commodity derivatives, including exchange traded futures and options and over-the-counter forwards, options, and swaps. As part of our overall risk management program, we enter into derivative transactions to hedge purchases and sales of electricity and fuels. The changes in market value of such contracts have a high correlation to price changes in the hedged commodity. To the extent that commodity markets are illiquid, we may not be able to execute our risk management strategies, which could result in greater unhedged positions than we would prefer at a given time and financial losses that negatively impact our results of operations.
The Dodd-Frank Wall Street Reform and Consumer Protection Act (“Dodd-Frank Act”) contains measures aimed at increasing the transparency and stability of the over-the counter, or OTC, derivative markets and preventing excessive speculation. The Dodd-Frank Act could restrict, among other things, trading positions in the energy futures markets, require different collateral or settlement positions, or increase regulatory reporting over derivative positions. Based on the provisions included in the Dodd-Frank Act and the implementation of regulations, these changes could, among other things, impact our ability to hedge commodity price and interest rate risk or increase the costs associated with our hedging programs.
We are exposed to losses in the event of nonperformance or nonpayment by counterparties. We use a risk management process to assess and monitor the financial exposure of all counterparties. Despite the fact that the majority of APS’s trading counterparties are rated as investment grade by the rating agencies, there is still a possibility that one or more of these companies could default, which could result in a material adverse impact on our earnings for a given period.
32
Changes in technology could create challenges for APS’s existing business.
Research and development activities are ongoing to develop and commercialize alternative technologies that produce power or reduce power consumption or emissions, including renewable technologies including photovoltaic (solar) cells, customer-sited generation, energy storage (batteries), and efficiency technologies. Advances in these, or other technologies could reduce the cost of power production, making APS’s existing generating facilities less economical. In addition, advances in technology and equipment/appliance efficiency could reduce the demand for power supply, which could adversely affect APS’s business.
APS has, and continues to pursue and implement, smart grid technologies, including advanced transmission and distribution system technologies, as well as digital meters enabling two-way communications between the utility and its customers. Many of the products and processes resulting from these and other alternative technologies have not yet been widely used or tested on a long-term basis, and their use on large-scale systems is not as established or mature as APS’s existing technologies and equipment. Widespread installation and acceptance of these technologies could enable the entry of new market participants, such as technology companies, into the interface between APS and its customers and could have other unpredictable effects on APS’s business.
We are subject to employee workforce factors that could adversely affect our business and financial condition.
Like most companies in the electric utility industry, our workforce is maturing, with approximately 37% of employees eligible to retire by the end of 2017. Although we have undertaken efforts to recruit and train new employees, we face increased competition for talent. We are subject to other employee workforce factors, such as the availability of qualified personnel, the need to negotiate collective bargaining agreements with union employees and potential work stoppages. These or other employee workforce factors could negatively impact our business, financial condition or results of operations.
We are subject to information security risks
and risks of unauthorized access to our systems.
In the regular course of our business, we handle a range of sensitive security, customer and business systems information. A security breach of our information systems such as theft or the inappropriate release of certain types of information, including confidential customer, employee, financial or system operating information, could have a material adverse impact on our financial condition, results of operations or cash flows. We operate in a highly regulated industry that requires the continued operation of sophisticated information technology systems and network infrastructure. Despite implementation of security measures, our technology systems are vulnerable to disability, failures or unauthorized access. Our generation, transmission and distribution facilities, information technology systems and other infrastructure facilities and systems and physical assets could be targets of such unauthorized access. Failures or breaches of our systems could impact the reliability of our generation, transmission and distribution systems and also subject us to financial harm. If our technology systems were to fail or be breached and if we are unable to recover in a timely way, we may not be able to fulfill critical business functions and sensitive confidential data could be compromised, which could have a material adverse impact on our financial condition, results of operations or cash flows.
We are subject to laws and rules issued by multiple government agencies concerning safeguarding and maintaining the confidentiality of our security, customer and business information. One of these agencies, NERC, has issued comprehensive regulations and standards surrounding the security of our operating systems, and is continually in the process of developing updated and additional requirements with which the utility industry must comply. The increasing promulgation of NERC rules and standards will increase our compliance costs and our exposure to the potential risk of violations of the standards.
33
While we have experienced, and expect to continue to experience, these types of threats and attempted intrusions, none of them to date has been material to the Company. The implementation of additional security measures could increase costs and have a material adverse impact on our financial results. We have obtained cyber insurance to provide coverage for a portion of the losses and damages that may result from a security breach of our information technology systems, but such insurance may not cover the total loss or damage caused by a breach. These types of events could also require significant management attention and resources, and could adversely affect Pinnacle West’s and APS’s reputation with customers and the public.
FINANCIAL RISKS
Financial market disruptions or new rules or regulations may increase our financing costs or limit our access to various financial markets, which may adversely affect our liquidity and our ability to implement our financial strategy.
Pinnacle West and APS rely on access to credit markets as a significant source of liquidity and the capital markets for capital requirements not satisfied by cash flow from our operations. We believe that we will maintain sufficient access to these financial markets. However, certain market disruptions or rules or regulations may cause our cost of borrowing to increase generally, and/or otherwise adversely affect our ability to access these financial markets.
In addition, the credit commitments of our lenders under our bank facilities may not be satisfied or continued beyond current commitment periods for a variety of reasons, including new rules and regulations, periods of financial distress or liquidity issues affecting our lenders or financial markets, which could materially adversely affect the adequacy of our liquidity sources and the cost of maintaining these sources.
Changes in economic conditions, monetary policy, financial regulation or other factors could result in higher interest rates, which would increase interest expense on our existing variable rate debt and new debt we expect to issue in the future, and thus reduce funds available to us for our current plans.
Additionally, an increase in our leverage, whether as a result of these factors or otherwise, could adversely affect us by:
•
causing a downgrade of our credit ratings;
•
increasing the cost of future debt financing and refinancing;
•
increasing our vulnerability to adverse economic and industry conditions; and
|
•
|
requiring us to dedicate an increased portion of our cash flow from operations to payments on our debt, which would reduce funds available to us for operations, future investment in our business or other purposes.
|
A downgrade of our credit ratings could materially and adversely affect our business, financial condition and results of operations.
Our current ratings are set forth in “Liquidity and Capital Resources — Credit Ratings” in Item 7. We cannot be sure that any of our current ratings will remain in effect for any given period of time or that a rating will not be lowered or withdrawn entirely by a rating agency if, in its judgment, circumstances in the future so warrant. Any downgrade or withdrawal could adversely affect the market price of Pinnacle West’s and APS’s securities, limit our access to capital and increase our borrowing costs, which would diminish our financial results. We would be required to pay a higher interest rate for future financings, and our potential pool of investors and funding sources could decrease. In addition, borrowing costs under our existing credit facilities
34
depend on our credit ratings. A downgrade could also require us to provide additional support in the form of letters of credit or cash or other collateral to various counterparties. If our short-term ratings were to be lowered, it could severely limit access to the commercial paper market. We note that the ratings from rating agencies are not recommendations to buy, sell or hold our securities and that each rating should be evaluated independently of any other rating.
Investment performance, changing interest rates and other economic factors could decrease the value of our benefit plan assets and nuclear decommissioning trust funds and increase the valuation of our related obligations, resulting in significant additional funding requirements. We are subject to risks related to the provision of employee healthcare benefits and recent healthcare reform legislation. Any inability to fully recover these costs in our utility rates would negatively impact our financial condition.
We have significant pension plan and other postretirement benefits plan obligations to our employees and retirees, and legal obligations to fund nuclear decommissioning trusts for Palo Verde. We hold and invest substantial assets in these trusts that are designed to provide funds to pay for certain of these obligations as they arise. Declines in market values of the fixed income and equity securities held in these trusts may increase our funding requirements into the related trusts. Additionally, the valuation of liabilities related to our pension plan and other postretirement benefit plans are impacted by a discount rate, which is the interest rate used to discount future pension and other postretirement benefit obligations. Declining interest rates decrease the discount rate, increase the valuation of the plan liabilities and may result in increases in pension and other postretirement benefit costs, cash contributions, regulatory assets, and charges to OCI. Changes in demographics, including increased number of retirements or changes in life expectancy and changes in other actuarial assumptions, may also result in similar impacts. The minimum contributions required under these plans are impacted by federal legislation. Increasing liabilities or otherwise increasing funding requirements under these plans, resulting from adverse changes in legislation or otherwise, could result in significant cash funding obligations that could have a material impact on our financial position, results of operations or cash flows.
We recover most of the pension costs and other postretirement benefit costs and all of the nuclear decommissioning costs in our regulated rates. Any inability to fully recover these costs in a timely manner would have a material negative impact on our financial condition, results of operations or cash flows.
Employee healthcare costs in recent years have continued to rise. The Patient Protection and Affordable Care Act is expected to result in additional healthcare cost increases. Costs and other effects of the legislation, which may include the cost of compliance and potentially increased costs of providing for medical insurance for our employees, cannot be determined with certainty at this time.
Our cash flow depends on the performance of APS.
We derive essentially all of our revenues and earnings from our wholly owned subsidiary, APS. Accordingly, our cash flow and our ability to pay dividends on our common stock is dependent upon the earnings and cash flows of APS and its distributions to us. APS is a separate and distinct legal entity and has no obligation to make distributions to us.
APS’s financing agreements may restrict its ability to pay dividends, make distributions or otherwise transfer funds to us. In addition, an ACC financing order requires APS to maintain a common equity ratio of at least 40% and does not allow APS to pay common dividends if the payment would reduce its common equity below that threshold. The common equity ratio, as defined in the ACC order, is total shareholder equity divided by the sum of total shareholder equity and long-term debt, including current maturities of long-term debt.
35
Pinnacle West’s ability to meet its debt service obligations could be adversely affected because its debt securities are structurally subordinated to the debt securities and other obligations of its subsidiaries.
Because Pinnacle West is structured as a holding company, all existing and future debt and other liabilities of our subsidiaries will be effectively senior in right of payment to our debt securities. The assets and cash flows of our subsidiaries will be available, in the first instance, to service their own debt and other obligations. Our ability to have the benefit of their cash flows, particularly in the case of any insolvency or financial distress affecting our subsidiaries, would arise only through our equity ownership interests in our subsidiaries and only after their creditors have been satisfied.
The market price of our common stock may be volatile.
The market price of our common stock could be subject to significant fluctuations in response to factors such as the following, some of which are beyond our control:
|
•
|
variations in our quarterly operating results;
|
|
•
|
operating results that vary from the expectations of management, securities analysts and investors;
|
|
•
|
changes in expectations as to our future financial performance, including financial estimates by securities analysts and investors;
|
|
•
|
developments generally affecting industries in which we operate;
|
|
•
|
announcements by us or our competitors of significant contracts, acquisitions, joint marketing relationships, joint ventures or capital commitments;
|
|
•
|
announcements by third parties of significant claims or proceedings against us;
|
|
•
|
favorable or adverse regulatory or legislative developments;
|
|
•
|
our dividend policy;
|
|
•
|
future sales by the Company of equity or equity-linked securities; and
|
|
•
|
general domestic and international economic conditions.
|
In addition, the stock market in general has experienced volatility that has often been unrelated to the operating performance of a particular company. These broad market fluctuations may adversely affect the market price of our common stock.
Certain provisions of our articles of incorporation and bylaws and of Arizona law make it difficult for shareholders to change the composition of our board and may discourage takeover attempts.
These provisions, which could preclude our shareholders from receiving a change of control premium, include the following:
|
•
|
restrictions on our ability to engage in a wide range of “business combination” transactions with an “interested shareholder” (generally, any person who owns 10% or more of our outstanding voting power or any of our affiliates or associates) or any affiliate or associate of an interested shareholder, unless specific conditions are met;
|
|
•
|
anti-greenmail provisions of Arizona law and our bylaws that prohibit us from purchasing shares of our voting stock from beneficial owners of more than 5% of our outstanding shares unless specified conditions are satisfied;
|
|
•
|
the ability of the Board of Directors to increase the size of the Board of Directors and fill vacancies on the Board of Directors, whether resulting from such increase, or from death, resignation, disqualification or otherwise; and
|
36
|
•
|
the ability of our Board of Directors to issue additional shares of common stock and shares of preferred stock and to determine the price and, with respect to preferred stock, the other terms, including preferences and voting rights, of those shares without shareholder approval.
|
While these provisions have the effect of encouraging persons seeking to acquire control of us to negotiate with our Board of Directors, they could enable the Board of Directors to hinder or frustrate a transaction that some, or a majority, of our shareholders might believe to be in their best interests and, in that case, may prevent or discourage attempts to remove and replace incumbent directors.
Neither Pinnacle West nor APS has received written comments regarding its periodic or current reports from the SEC staff that were issued 180 days or more preceding the end of its 2014 fiscal year and that remain unresolved.
37
Generation Facilities
APS’s portfolio of owned and leased generating facilities is provided in the table below:
|
Name
|
No. of
Units
|
%
Owned (a)
|
Principal
Fuels
Used
|
Primary
Dispatch
Type
|
Owned
Capacity
(MW)
|
|||||||
|
Nuclear:
|
|
|
|
|
|
|
|
|||||
|
Palo Verde (b)
|
3
|
29.1
|
%
|
Uranium
|
Base Load
|
1,146
|
|
|||||
|
Total Nuclear
|
|
|
|
|
|
1,146
|
|
|||||
|
Steam:
|
|
|
|
|
|
|
|
|||||
|
Four Corners 4, 5 (c)
|
2
|
63
|
%
|
Coal
|
Base Load
|
970
|
|
|||||
|
Cholla
|
3
|
|
|
Coal
|
Base Load
|
647
|
|
|||||
|
Navajo (d)
|
3
|
14
|
%
|
Coal
|
Base Load
|
315
|
|
|||||
|
Ocotillo
|
2
|
|
|
Gas
|
Peaking
|
220
|
|
|||||
|
Total Steam
|
|
|
|
|
|
2,152
|
|
|||||
|
Combined Cycle:
|
|
|
|
|
|
|
|
|||||
|
Redhawk
|
2
|
|
|
Gas
|
Load Following
|
984
|
|
|||||
|
West Phoenix
|
5
|
|
|
Gas
|
Load Following
|
887
|
|
|||||
|
Total Combined Cycle
|
|
|
|
|
|
1,871
|
|
|||||
|
Combustion Turbine:
|
|
|
|
|
|
|
|
|||||
|
Ocotillo
|
2
|
|
|
Gas
|
Peaking
|
110
|
|
|||||
|
Saguaro 1, 2
|
2
|
|
|
Gas/Oil
|
Peaking
|
110
|
|
|||||
|
Saguaro 3
|
1
|
|
|
Gas
|
Peaking
|
79
|
|
|||||
|
Douglas
|
1
|
|
|
Oil
|
Peaking
|
16
|
|
|||||
|
Sundance
|
10
|
|
|
Gas
|
Peaking
|
420
|
|
|||||
|
West Phoenix
|
2
|
|
|
Gas
|
Peaking
|
110
|
|
|||||
|
Yucca 1, 2, 3
|
3
|
|
|
Gas/Oil
|
Peaking
|
93
|
|
|||||
|
Yucca 4
|
1
|
|
|
Oil
|
Peaking
|
54
|
|
|||||
|
Yucca 5, 6
|
2
|
|
|
Gas
|
Peaking
|
96
|
|
|||||
|
Total Combustion Turbine
|
|
|
|
|
|
1,088
|
|
|||||
|
Solar:
|
|
|
|
|
|
|
|
|||||
|
Cotton Center
|
1
|
|
|
Solar
|
As Available
|
17
|
|
|||||
|
Hyder
|
1
|
|
|
Solar
|
As Available
|
16
|
|
|||||
|
Paloma
|
1
|
|
|
Solar
|
As Available
|
17
|
|
|||||
|
Chino Valley
|
1
|
|
|
Solar
|
As Available
|
19
|
|
|||||
|
Gila Bend
|
1
|
Solar
|
As Available
|
32
|
|
|||||||
|
Hyder II
|
1
|
|
|
Solar
|
As Available
|
14
|
|
|||||
|
Foothills
|
1
|
|
|
Solar
|
As Available
|
35
|
|
|||||
|
APS Owned Distributed Energy
|
|
|
|
Solar
|
As Available
|
15
|
|
|||||
|
Multiple facilities
|
|
|
|
Solar
|
As Available
|
4
|
|
|||||
|
Total Solar
|
|
|
|
|
|
169
|
|
|||||
|
Total Capacity
|
|
|
|
|
|
6,426
|
|
|||||
38
|
(a)
|
100% unless otherwise noted.
|
|
(b)
|
See “Business of Arizona Public Service Company — Energy Sources and Resource Planning — Generation Facilities — Nuclear” in Item 1 for details regarding leased interests in Palo Verde. The other participants are Salt River Project (17.49%), SCE (15.8%), El Paso (15.8%), Public Service Company of New Mexico (10.2%), Southern California Public Power Authority (5.91%), and Los Angeles Department of Water & Power (5.7%). The plant is operated by APS.
|
|
(c)
|
The other participants are Salt River Project (10%), Public Service Company of New Mexico (13%), Tucson Electric Power Company (7%) and El Paso (7%). The plant is operated by APS. As discussed under “Business of Arizona Public Service Company — Energy Sources and Resource Planning — Generation Facilities — Coal-Fueled Generating Facilities — Four Corners” in Item 1, in December 2013 APS acquired SCE’s 48% interest in Units 4 and 5, and closed Units 1, 2 and 3.
|
|
(d)
|
The other participants are Salt River Project (21.7%), Nevada Power Company (11.3%), the United States Government (24.3%), Tucson Electric Power Company (7.5%) and Los Angeles Department of Water & Power (21.2%). The plant is operated by Salt River Project.
|
See “Business of Arizona Public Service Company — Environmental Matters” in Item 1 with respect to matters having a possible impact on the operation of certain of APS’s generating facilities.
See “Business of Arizona Public Service Company” in Item 1 for a map detailing the location of APS’s major power plants and principal transmission lines.
Transmission and Distribution Facilities
Current Facilities
.
APS’s transmission facilities consist of approximately 5,909 pole miles of overhead lines and approximately 49 miles of underground lines, 5,686 miles of which are located in Arizona. APS’s distribution facilities consist of approximately 11,071 miles of overhead lines and approximately 17,908 miles of underground primary cable, all of which are located in Arizona. APS distribution facilities reflect an actual net gain of 167 miles in 2014. APS shares ownership of some of its transmission facilities with other companies. The following table shows APS’s jointly-owned interests in those transmission facilities recorded on the Consolidated Balance Sheets at December 31, 2014:
|
|
Percent Owned
(Weighted-Average)
|
|
|
Morgan — Pinnacle Peak System
|
64.4
|
%
|
|
Palo Verde — Estrella 500kV System
|
50.0
|
%
|
|
Round Valley System
|
50.0
|
%
|
|
ANPP 500kV System
|
33.6
|
%
|
|
Navajo Southern System
|
22.6
|
%
|
|
Four Corners Switchyards
|
47.5
|
%
|
|
Palo Verde — Yuma 500kV System
|
18.2
|
%
|
|
Phoenix — Mead System
|
17.1
|
%
|
|
Palo Verde — Morgan System
|
90.0
|
%
|
|
Hassayampa — North Gila System
|
80.0
|
%
|
Expansion.
Each year APS prepares and files with the ACC a ten-year transmission plan. In APS’s 2015 plan, APS projects it will develop 275 miles of new lines over the next ten years. One significant project currently under development is a new 500kV path that will span from the Palo Verde hub around the western and northern edges of the Phoenix metropolitan area and terminate at a bulk substation in the northeast part of Phoenix. The project consists of four phases. The first phase, Morgan to Pinnacle Peak 500kV, is currently in-service. The second and third phases, Delaney to Palo Verde 500kV and Delaney to Sun Valley 500kV, are
39
under construction. The fourth phase, Morgan to Sun Valley 500kV, has been permitted and is in final design and development. In total, the projects consist of over 100 miles of new 500kV lines, with many of those miles constructed with the capability to string a 230kV line as a second circuit.
APS continues to work with regulators to identify transmission projects necessary to support renewable energy facilities. Two such projects, which are included in APS’s 2015 transmission plan, are the Delaney to Palo Verde line and the North Gila to Hassayampa line, both of which are intended to support the transmission of renewable energy to Phoenix and California. The North Gila to Hassayampa line is under construction and expected to be in service before the summer of 2015.
Physical Security Standards.
On March 7, 2014, FERC issued an order requiring NERC to act within 90 days to develop standards that will require utilities to take steps, or to demonstrate that they have taken steps, to address physical security risks and vulnerabilities related to the reliable operation of the bulk-power system. On May 23, 2014, NERC filed a petition with FERC for approval of the proposed Physical Security Reliability Standard CIP-014-1. On November 20, 2014, FERC approved the Physical Security Reliability Standard CIP-014-1, and on January 21, 2015, FERC issued an order granting rehearing for further consideration. The Physical Security Reliability Standard requires transmission owners and operators to protect those critical transmission stations and substations and their associated primary control centers that, if rendered inoperable or damaged as a result of a physical attack, could result in widespread instability, uncontrolled separation or cascading within an interconnection. As required by the Physical Security Reliability Standard, APS will determine whether it has any critical transmission stations and substations and associated primary control centers that will be required to comply with the standard. Until APS has made such determination, we cannot predict the extent of any financial or operational impacts on APS.
Plant and Transmission Line Leases and Rights-of-Way on Indian Lands
The Navajo Plant and Four Corners are located on land held under leases from the Navajo Nation and also under rights-of-way from the federal government. The right-of-way and lease for the Navajo Plant expire in 2019 and the right-of-way and lease for Four Corners expire in 2016. On March 7, 2011, the Navajo Nation Council signed a resolution approving a 25-year extension to the existing Four Corners lease term and providing Navajo Nation consent to renewal of the related rights-of-way. APS is filing applications for renewal of these rights-of-way with the DOI. Before it may approve the Four Corners lease extension and issue the renewed rights-of-way, the United States must complete an analysis under the federal National Environmental Policy Act, the ESA and related statutes.
Certain portions of the transmission lines that carry power from several of our power plants are located on Indian lands pursuant to rights-of-way that are effective for specified periods. Some of these rights-of-way have expired and our renewal applications have not yet been acted upon by the appropriate Indian tribes or federal agencies. Other rights expire at various times in the future and renewal action by the applicable tribe or federal agencies will be required at that time. In recent negotiations, certain of the affected Indian tribes have required payments substantially in excess of amounts that we have paid in the past for such rights-of-way. The ultimate cost of renewal of certain of the rights-of-way for our transmission lines is therefore uncertain.
40
See “Business of Arizona Public Service Company — Environmental Matters” in Item 1 with regard to pending or threatened litigation and other disputes.
See Note 3 for ACC and FERC-related matters.
See Note 10 for information regarding environmental matters, Superfund–related matters, matters related to a September 2011 power outage and a New Mexico tax matter.
Not applicable.
41
EXECUTIVE OFFICERS OF PINNACLE WEST
Pinnacle West’s executive officers are elected no less often than annually and may be removed by the Board of Directors at any time. The executive officers, their ages at February 20, 2015, current positions and principal occupations for the past five years are as follows:
|
Name
|
Age
|
Position
|
Period
|
|||
|
Donald E. Brandt
|
60
|
Chairman of the Board and Chief Executive Officer of Pinnacle West; Chairman of the Board of APS
|
2009-Present
|
|||
|
|
|
President of APS
|
2013-Present
|
|||
|
|
|
President of Pinnacle West
|
2008-Present
|
|||
|
|
|
Chief Executive Officer of APS
|
2008-Present
|
|||
|
Robert S. Bement
|
59
|
Senior Vice President, Site Operations, PVNGS, of APS
|
2010-Present
|
|||
|
|
|
Vice President, Nuclear Operations of APS
|
2007-2010
|
|||
|
Denise R. Danner
|
59
|
Vice President, Controller and Chief Accounting Officer of Pinnacle West; Chief Accounting Officer of APS
|
2010-Present
|
|||
|
|
|
Vice President and Controller of APS
|
2009-Present
|
|||
|
Patrick Dinkel
|
51
|
Vice President, Transmission and Distribution Operations of APS
|
2014-Present
|
|||
|
|
|
Vice President, Resource Management of APS
|
2012-2014
|
|||
|
|
|
Vice President, Power Marketing, Resource Planning and Acquisition of APS
|
2011-2012
|
|||
|
|
|
Vice President, Power Marketing and Resource Planning of APS
|
2010-2011
|
|||
|
|
|
General Manager, Strategic Planning and Resource Acquisition of APS
|
2009-2010
|
|||
|
Randall K. Edington
|
61
|
Executive Vice President and Chief Nuclear Officer, PVNGS, of APS
|
2007-Present
|
|||
|
David P. Falck
|
61
|
Executive Vice President and General Counsel of Pinnacle West and APS
|
2009-Present
|
|||
|
|
|
Secretary of Pinnacle West and APS
|
2009-2012
|
|||
|
Daniel T. Froetscher
|
53
|
Senior Vice President, Transmission, Distribution & Customers of APS
|
2014-Present
|
|||
|
|
|
Vice President, Energy Delivery of APS
|
2008-2014
|
|||
|
Jeffrey B. Guldner
|
49
|
Senior Vice President, Public Policy of APS
|
2014-Present
|
|||
|
|
|
Senior Vice President, Customers and Regulation of APS
|
2012-2014
|
|||
|
|
|
Vice President, Rates and Regulation of APS
|
2007-2012
|
|||
|
James R. Hatfield
|
57
|
Executive Vice President of Pinnacle West and APS
|
2012-Present
|
|||
|
|
|
Chief Financial Officer of Pinnacle West and APS
|
2008-Present
|
|||
|
|
|
Senior Vice President of Pinnacle West and APS
|
2008-2012
|
|||
|
|
|
Treasurer of Pinnacle West and APS
|
2009-2010
|
|||
|
John S. Hatfield
|
49
|
Vice President, Communications of APS
|
2010-Present
|
|||
|
|
|
Director, Corporate Communications of SCE
|
2004-2010
|
|||
|
Tammy D. McLeod
|
53
|
Vice President, Resource Management of APS
|
2014-Present
|
|||
|
|
|
Vice President and Chief Customer Officer of APS
|
2007-2014
|
|||
|
Lee R. Nickloy
|
48
|
Vice President and Treasurer of Pinnacle West and APS
|
2010-Present
|
|||
|
|
|
Assistant Treasurer and Director Corporate Finance of Ameren Corporation
|
2000-2010
|
|||
|
Mark A. Schiavoni
|
59
|
Executive Vice President and Chief Operating Officer of APS
|
2014-Present
|
|||
|
Executive Vice President, Operations of APS
|
2012-2014
|
|||||
|
|
|
Senior Vice President, Fossil Operations of APS
|
2009-2012
|
|||
42
STOCKHOLDER MATTERS AND ISSUER PURCHASES OF EQUITY SECURITIES
Pinnacle West’s common stock is publicly held and is traded on the New York Stock Exchange. At the close of business on February 13, 2015, Pinnacle West’s common stock was held of record by approximately 21,649 shareholders.
QUARTERLY STOCK PRICES AND DIVIDENDS PAID PER SHARE
STOCK SYMBOL: PNW
|
|
|
|
|
Dividends
|
||||||||||||
|
2014
|
High
|
Low
|
Close
|
Per Share
|
||||||||||||
|
1
st
Quarter
|
$
|
55.99
|
|
$
|
51.15
|
|
$
|
54.66
|
|
$
|
0.5675
|
|
||||
|
2
nd
Quarter
|
58.06
|
|
53.71
|
|
57.84
|
|
0.5675
|
|
||||||||
|
3
rd
Quarter
|
57.95
|
|
52.13
|
|
54.64
|
|
0.5675
|
|
||||||||
|
4
th
Quarter
|
71.11
|
|
54.59
|
|
68.31
|
|
0.595
|
|
||||||||
|
|
|
|
|
Dividends
|
||||||||||||
|
2013
|
High
|
Low
|
Close
|
Per Share
|
||||||||||||
|
1
st
Quarter
|
$
|
57.96
|
|
$
|
51.50
|
|
$
|
57.89
|
|
$
|
0.545
|
|
||||
|
2
nd
Quarter
|
61.89
|
|
51.56
|
|
55.47
|
|
0.545
|
|
||||||||
|
3
rd
Quarter
|
60.33
|
|
52.03
|
|
54.74
|
|
0.545
|
|
||||||||
|
4
th
Quarter
|
58.70
|
|
52.32
|
|
52.92
|
|
0.5675
|
|
||||||||
APS’s common stock is wholly-owned by Pinnacle West and is not listed for trading on any stock exchange. As a result, there is no established public trading market for APS’s common stock.
The chart below sets forth the dividends paid on APS’s common stock for each of the four quarters for 2014 and 2013.
Common Stock Dividends
(Dollars in Thousands)
|
Quarter
|
2014
|
2013
|
||||||
|
1
st
Quarter
|
$
|
62,500
|
|
$
|
59,800
|
|
||
|
2
nd
Quarter
|
62,600
|
|
59,900
|
|
||||
|
3
rd
Quarter
|
62,700
|
|
59,900
|
|
||||
|
4
th
Quarter
|
65,800
|
|
62,500
|
|
||||
The sole holder of APS’s common stock, Pinnacle West, is entitled to dividends when and as declared out of legally available funds. As of December 31, 2014, APS did not have any outstanding preferred stock.
43
Issuer Purchases of Equity Securities
The following table contains information about our purchases of our common stock during the fourth quarter of 2014.
|
Period
|
Total
Number of
Shares
Purchased
(1)
|
Average
Price Paid
per Share
|
Total Number of
Shares Purchased
as Part of Publicly
Announced Plans
or Programs
|
Maximum Number of
Shares that May Yet Be
Purchased Under the
Plans or Programs
|
|||||||||
|
October 1 – October 31, 2014
|
56,107
|
|
$
|
58.73
|
|
—
|
|
—
|
|
||||
|
November 1 – November 30, 2014
|
—
|
|
—
|
|
—
|
|
—
|
|
|||||
|
December 1 – December 31, 2014
|
—
|
|
—
|
|
—
|
|
—
|
|
|||||
|
Total
|
56,107
|
|
$
|
58.73
|
|
—
|
|
—
|
|
||||
|
(1)
|
Represents shares of common stock withheld by Pinnacle West to satisfy tax withholding obligations upon the vesting of performance shares.
|
44
PINNACLE WEST CAPITAL CORPORATION – CONSOLIDATED
|
|
2014
|
2013
|
2012
|
2011
|
2010
|
|||||||||||||||
|
|
(dollars in thousands, except per share amounts)
|
|||||||||||||||||||
|
OPERATING RESULTS
|
|
|
|
|
|
|
|
|
|
|
||||||||||
|
Operating revenues
|
$
|
3,491,632
|
|
$
|
3,454,628
|
|
$
|
3,301,804
|
|
$
|
3,241,379
|
|
$
|
3,189,199
|
|
|||||
|
Income from continuing operations
|
$
|
423,696
|
|
$
|
439,966
|
|
$
|
418,993
|
|
$
|
355,634
|
|
$
|
344,851
|
|
|||||
|
Income (loss) from discontinued operations – net of income taxes (a)
|
—
|
|
—
|
|
(5,829
|
)
|
11,306
|
|
25,358
|
|
||||||||||
|
Net income
|
423,696
|
|
439,966
|
|
413,164
|
|
366,940
|
|
370,209
|
|
||||||||||
|
Less: Net income attributable to noncontrolling interests
|
26,101
|
|
33,892
|
|
31,622
|
|
27,467
|
|
20,156
|
|
||||||||||
|
Net income attributable to common shareholders
|
$
|
397,595
|
|
$
|
406,074
|
|
$
|
381,542
|
|
$
|
339,473
|
|
$
|
350,053
|
|
|||||
|
COMMON STOCK DATA
|
|
|
|
|
|
|
|
|
|
|
||||||||||
|
Book value per share – year-end
|
$
|
39.50
|
|
$
|
38.07
|
|
$
|
36.20
|
|
$
|
34.98
|
|
$
|
33.86
|
|
|||||
|
Earnings per weighted-average common share outstanding:
|
|
|
|
|
|
|
|
|
|
|
||||||||||
|
Continuing operations attributable to common shareholders – basic
|
$
|
3.59
|
|
$
|
3.69
|
|
$
|
3.54
|
|
$
|
3.01
|
|
$
|
3.05
|
|
|||||
|
Net income attributable to common shareholders – basic
|
$
|
3.59
|
|
$
|
3.69
|
|
$
|
3.48
|
|
$
|
3.11
|
|
$
|
3.28
|
|
|||||
|
Continuing operations attributable to common shareholders – diluted
|
$
|
3.58
|
|
$
|
3.66
|
|
$
|
3.50
|
|
$
|
2.99
|
|
$
|
3.03
|
|
|||||
|
Net income attributable to common shareholders – diluted
|
$
|
3.58
|
|
$
|
3.66
|
|
$
|
3.45
|
|
$
|
3.09
|
|
$
|
3.27
|
|
|||||
|
Dividends declared per share
|
$
|
2.33
|
|
$
|
2.23
|
|
$
|
2.67
|
|
$
|
2.10
|
|
$
|
2.10
|
|
|||||
|
Weighted-average common shares outstanding – basic
|
110,626,101
|
|
109,984,160
|
|
109,510,296
|
|
109,052,840
|
|
106,573,348
|
|
||||||||||
|
Weighted-average common shares outstanding – diluted
|
111,178,141
|
|
110,805,943
|
|
110,527,311
|
|
109,864,243
|
|
107,137,785
|
|
||||||||||
|
BALANCE SHEET DATA
|
|
|
|
|
|
|
|
|
|
|
||||||||||
|
Total assets
|
$
|
14,313,532
|
|
$
|
13,508,686
|
|
$
|
13,379,615
|
|
$
|
13,111,018
|
|
$
|
12,392,998
|
|
|||||
|
Liabilities and equity:
|
|
|
|
|
|
|
|
|
|
|
||||||||||
|
Current liabilities
|
$
|
1,559,143
|
|
$
|
1,618,644
|
|
$
|
1,083,542
|
|
$
|
1,342,705
|
|
$
|
1,449,704
|
|
|||||
|
Long-term debt less current maturities
|
3,031,215
|
|
2,796,465
|
|
3,199,088
|
|
3,019,054
|
|
3,045,794
|
|
||||||||||
|
Deferred credits and other
|
5,204,072
|
|
4,753,117
|
|
4,994,696
|
|
4,818,673
|
|
4,122,274
|
|
||||||||||
|
Total liabilities
|
9,794,430
|
|
9,168,226
|
|
9,277,326
|
|
9,180,432
|
|
8,617,772
|
|
||||||||||
|
Total equity
|
4,519,102
|
|
4,340,460
|
|
4,102,289
|
|
3,930,586
|
|
3,775,226
|
|
||||||||||
|
Total liabilities and equity
|
$
|
14,313,532
|
|
$
|
13,508,686
|
|
$
|
13,379,615
|
|
$
|
13,111,018
|
|
$
|
12,392,998
|
|
|||||
|
(a)
|
Amounts primarily related to SunCor discontinued operations (see Note 1).
|
45
SELECTED FINANCIAL DATA
ARIZONA PUBLIC SERVICE COMPANY – CONSOLIDATED
|
|
2014
|
2013
|
2012
|
2011
|
2010
|
|||||||||||||||
|
|
(dollars in thousands)
|
|||||||||||||||||||
|
OPERATING RESULTS
|
|
|
|
|
|
|
|
|
|
|
||||||||||
|
Electric operating revenues
|
$
|
3,488,946
|
|
$
|
3,451,251
|
|
$
|
3,293,489
|
|
$
|
3,237,241
|
|
$
|
3,180,807
|
|
|||||
|
Fuel and purchased power costs
|
1,179,829
|
|
1,095,709
|
|
994,790
|
|
1,009,464
|
|
1,046,815
|
|
||||||||||
|
Other operating expenses
|
1,716,325
|
|
1,733,677
|
|
1,693,170
|
|
1,673,394
|
|
1,584,955
|
|
||||||||||
|
Operating income
|
592,792
|
|
621,865
|
|
605,529
|
|
554,383
|
|
549,037
|
|
||||||||||
|
Other income
|
36,358
|
|
20,797
|
|
16,358
|
|
24,974
|
|
20,138
|
|
||||||||||
|
Interest expense — net of allowance for borrowed funds
|
181,830
|
|
183,801
|
|
194,777
|
|
215,584
|
|
213,349
|
|
||||||||||
|
Net income
|
447,320
|
|
458,861
|
|
427,110
|
|
363,773
|
|
355,826
|
|
||||||||||
|
Less: Net income attributable to noncontrolling interests
|
26,101
|
|
33,892
|
|
31,613
|
|
27,524
|
|
20,163
|
|
||||||||||
|
Net income attributable to common shareholder
|
$
|
421,219
|
|
$
|
424,969
|
|
$
|
395,497
|
|
$
|
336,249
|
|
$
|
335,663
|
|
|||||
|
BALANCE SHEET DATA
|
|
|
|
|
|
|
|
|
|
|
||||||||||
|
Total assets
|
$
|
14,215,004
|
|
$
|
13,381,377
|
|
$
|
13,242,542
|
|
$
|
13,032,237
|
|
$
|
12,271,877
|
|
|||||
|
Liabilities and equity:
|
|
|
|
|
|
|
|
|
|
|
||||||||||
|
Total equity
|
$
|
4,629,852
|
|
$
|
4,454,874
|
|
$
|
4,222,483
|
|
$
|
4,051,406
|
|
$
|
3,916,037
|
|
|||||
|
Long-term debt less current maturities
|
2,906,215
|
|
2,671,465
|
|
3,074,088
|
|
2,894,054
|
|
3,045,794
|
|
||||||||||
|
Total capitalization
|
7,536,067
|
|
7,126,339
|
|
7,296,571
|
|
6,945,460
|
|
6,961,831
|
|
||||||||||
|
Current liabilities
|
1,532,464
|
|
1,580,847
|
|
1,043,087
|
|
1,322,714
|
|
1,234,865
|
|
||||||||||
|
Deferred credits and other
|
5,146,473
|
|
4,674,191
|
|
4,902,884
|
|
4,764,063
|
|
4,075,181
|
|
||||||||||
|
Total liabilities and equity
|
$
|
14,215,004
|
|
$
|
13,381,377
|
|
$
|
13,242,542
|
|
$
|
13,032,237
|
|
$
|
12,271,877
|
|
|||||
46
OF FINANCIAL CONDITION AND RESULTS OF OPERATIONS
INTRODUCTION
The following discussion should be read in conjunction with Pinnacle West’s Consolidated Financial Statements and APS’s Consolidated Financial Statements and the related Notes that appear in Item 8 of this report. For information on factors that may cause our actual future results to differ from those we currently seek or anticipate, see “Forward-Looking Statements” at the front of this report and “Risk Factors” in Item 1A.
OVERVIEW
Pinnacle West owns all of the outstanding common stock of APS. APS is a vertically-integrated electric utility that provides either retail or wholesale electric service to most of the state of Arizona, with the major exceptions of about one-half of the Phoenix metropolitan area, the Tucson metropolitan area and Mohave County in northwestern Arizona. APS accounts for essentially all of our revenues and earnings, and is expected to continue to do so.
Areas of Business Focus
Operational Performance, Reliability and Recent Developments.
Nuclear.
APS operates and is a joint owner of Palo Verde. The March 2011 earthquake and tsunamis in Japan and the resulting accident at Japan’s Fukushima Daiichi nuclear power station had a significant impact on nuclear power operators worldwide. In the aftermath of the accident, the NRC conducted an independent assessment to consider actions to address lessons learned from the Fukushima events. The independent assessment, named the Near Term Task Force, recommended a number of proposed enhancements to U.S. commercial nuclear power plant equipment and emergency plans. The NRC has directed nuclear power plants to begin implementing some of the Near Term Task Force’s recommendations. To implement these recommendations, Palo Verde expects to spend approximately $40 million for capital enhancements to the plant over the next two years in addition to the approximate $80 million that has already been spent on capital enhancements as of December 31, 2014 (APS’s share is 29.1%).
Coal and Related Environmental Matters and Transactions.
APS is a joint owner of three coal-fired power plants and acts as operating agent for two of the plants. APS is focused on the impacts on its coal fleet that may result from increased regulation and potential legislation concerning GHG emissions. On June 2, 2014, EPA proposed a rule to limit carbon dioxide emissions from existing power plants. EPA expects to finalize the proposal in summer 2015. EPA’s proposal for Arizona would result in a shift in in-state generation from coal to natural gas and renewable generation. Such a substantial change in APS’s generation portfolio could require additional capital investments and increased operating costs, and thus have a significant financial impact on the Company. APS continually analyzes its long-range capital management plans to assess the potential effects of these changes, understanding that any resulting regulation and legislation could impact the economic viability of certain plants, as well as the willingness or ability of power plant participants to continue participation in such plants.
Cholla
On September 11, 2014, APS announced that it will close its 260 MW Unit 2 at Cholla by April 2016 and cease burning coal at the other APS-owned units (Units 1 and 3) at the plant by the mid-2020s if EPA approves a compromise proposal offered by APS to meet required environmental and emissions standards and
47
rules. APS will also ask the ACC to approve the plan contemplated by the proposal. (See Note 3 for details related to the resulting regulatory asset and Note 10 for details of the proposal.) APS believes that the environmental benefits of this proposal are greater in the long term than the benefits that would have resulted from adding the emissions control equipment.
Four Corners
Asset Purchase Agreement and Coal Supply Matters.
On December 30, 2013, APS purchased SCE’s 48% interest in each of Units 4 and 5 of Four Corners. The final purchase price for the interest was approximately $182 million, subject to certain minor post-closing adjustments. In connection with APS’s most recent retail rate case with the ACC, the ACC reserved the right to review the prudence of the Four Corners transaction for cost recovery purposes upon the closing of the transaction. On December 23, 2014, the ACC approved rate adjustments related to APS’s acquisition of SCE’s interest in Four Corners resulting in a revenue increase of $57.1 million on an annual basis.
Concurrently with the closing of the SCE transaction, BHP Billiton, the parent company of BNCC, the coal supplier and operator of the mine that serves Four Corners, transferred its ownership of BNCC to NTEC, a company formed by the Navajo Nation to own the mine and develop other energy projects. BHP Billiton will be retained by NTEC under contract as the mine manager and operator until July 2016. Also occurring concurrently with the closing, the Four Corners’ co-owners executed the 2016 Coal Supply Agreement for the supply of coal to Four Corners from July 2016, when the current coal supply agreement expires, through 2031. El Paso, a 7% owner in Units 4 and 5 of Four Corners, did not sign the 2016 Coal Supply Agreement. Under the 2016 Coal Supply Agreement, APS has agreed to assume the 7% shortfall obligation. On February 17, 2015, APS and El Paso entered into an asset purchase agreement providing for the purchase by APS, or an affiliate of APS, of El Paso’s 7% interest in each of Units 4 and 5 of Four Corners. The cash purchase price, which will be subject to certain adjustments at closing, is immaterial in amount, and the purchaser will assume El Paso's reclamation and decommissioning obligations associated with the 7% interest. Completion of the purchase is subject to the receipt of certain regulatory approvals and is expected to occur in July 2016.
When APS, or an affiliate of APS, ultimately acquires El Paso's interest in Four Corners, NTEC will have an option to purchase the interest within a certain timeframe pursuant to an option granted by APS to NTEC. The 2016 Coal Supply Agreement contains alternate pricing terms for the 7% shortfall obligations in the event NTEC does not exercise its option.
Pollution Control Investments and Shutdown of Units 1, 2 and 3.
EPA, in its final regional haze rule for Four Corners, required the Four Corners’ owners to elect one of two emissions alternatives to apply to the plant. On December 30, 2013, APS, on behalf of the co-owners, notified EPA that they chose the alternative BART compliance strategy requiring the permanent closure of Units 1, 2 and 3 by January 1, 2014 and installation and operation of SCR controls on Units 4 and 5 by July 31, 2018. On December 30, 2013, APS retired Units 1, 2 and 3.
Lease Extension.
APS, on behalf of the Four Corners participants, negotiated amendments to an existing facility lease with the Navajo Nation, which extends the Four Corners leasehold interest from 2016 to 2041. The Navajo Nation approved these amendments in March 2011. The effectiveness of the amendments also requires the approval of the DOI, as does a related federal rights-of-way grant which the Four Corners participants are pursuing. A federal environmental review is underway as part of the DOI review process. In March 2014, APS received a draft of the environmental impact statement in connection with the DOI review process. As a proponent of Four Corners and the Navajo Mine Energy Project, APS, along with other members of the public, submitted comments on the draft impact statement. APS cannot predict whether these federal approvals will be granted and, if so, on a timely basis, or whether any conditions that may be attached to them
48
will be acceptable to the Four Corners owners. On December 19, 2014, APS obtained a PSD permit from EPA allowing APS to install SCR control technology at Four Corners.
Transmission and Delivery.
APS is working closely with regulators to identify and plan for transmission needs that continue to support system reliability, access to markets and renewable energy development. The capital expenditures table presented in the “Liquidity and Capital Resources” section below includes new APS transmission projects through 2017, along with other transmission costs for upgrades and replacements. APS is also working to establish and expand smart grid technologies throughout its service territory to provide long-term benefits both to APS and its customers. APS is strategically deploying a variety of technologies that are intended to allow customers to better monitor their energy use and needs, minimize system outage durations, as well as the number of customers that experience outages, and facilitate greater cost savings to APS through improved reliability and the automation of certain distribution functions, including remote meter reading and remote connects and disconnects.
Renewable Energy
.
The ACC approved the RES in 2006. The renewable energy requirement is 5% of retail electric sales in 2015 and increases annually until it reaches 15% in 2025. In the 2009 Settlement Agreement, APS agreed to exceed the RES standards, committing to use APS’s best efforts to obtain 1,700 GWh of new renewable resources to be in service by year-end 2015, in addition to its 2008 renewable resource commitments. Taken together, APS’s commitment is currently estimated to be approximately 12% of APS’s estimated retail energy sales by year-end 2015, which is more than double the existing RES target of 5% for that year. A component of the RES targets development of distributed energy systems (generally speaking, small-scale renewable technologies that are located on customers’ properties).
On July 12, 2013, APS filed its annual RES implementation plan, covering the 2014-2018 timeframe and requesting a 2014 RES budget of approximately $143 million. In a final order dated January 7, 2014, the ACC approved the requested budget. Also in 2013, the ACC conducted a hearing to consider APS’s proposal to establish compliance with distributed energy requirements by tracking and recording distributed energy, rather than acquiring and retiring renewable energy credits. On February 6, 2014, the ACC established a proceeding to modify the renewable energy rules to establish a process for compliance with the renewable energy requirement that is not based solely on the use of renewable energy credits. On September 9, 2014, the ACC authorized a rulemaking process to modify the RES rules. The proposed changes would permit the ACC to find that utilities have complied with the distributed energy requirement in light of all available information. The ACC adopted these changes on December 18, 2014. The revised rules are expected to become effective in the second quarter of 2015.
In accordance with the ACC’s decision on the 2014 RES plan, on April 15, 2014, APS filed an application with the ACC requesting permission to build an additional
20
MW of APS-owned utility scale solar under the AZ Sun Program. In a subsequent filing, APS also offered an alternative proposal to replace the 20 MW of utility scale solar with 10 MW (approximately 1,500 customers) of APS-owned residential solar that will not be under the AZ Sun Program. On December 19, 2014, the ACC voted that it had no objection to APS implementing its residential rooftop solar program. The first stage of the residential rooftop solar program is to be 8 MW followed by a 2 MW second stage that will only be deployed if coupled with distributed storage. The program will target specific distribution feeders in an effort to maximize potential system benefits, as well as make systems available to limited-income customers who cannot easily install solar through transactions with third parties. The ACC expressly reserved that any determination of prudency of the residential rooftop solar program for rate making purposes shall not be made until the project is fully in service and APS requests cost recovery in a future rate case.
49
On July 1, 2014, APS filed its 2015 RES implementation plan and proposed a RES budget of approximately $154 million. On December 31, 2014, the ACC issued a decision approving the 2015 RES implementation plan with minor modifications, including reducing the budget to approximately $152 million.
Demand Side Management.
In December 2009, Arizona regulators placed an increased focus on energy efficiency and other demand side management programs to encourage customers to conserve energy, while incentivizing utilities to aid in these efforts that ultimately reduce the demand for energy. The ACC initiated an Energy Efficiency rulemaking, with a proposed EES of 22% cumulative annual energy savings by 2020. The 22% figure represents the cumulative reduction in future energy usage through 2020 attributable to energy efficiency initiatives. This standard became effective on January 1, 2011.
On June 1, 2012, APS filed its 2013 DSM Plan. In 2013, the standards required APS to achieve cumulative energy savings equal to 5% of its 2012 retail energy sales. Later in 2012, APS filed a supplement to its plan that included a proposed budget for 2013 of $87.6 million.
On March 11, 2014, the ACC issued an order approving APS’s 2013 DSM Plan. The ACC approved a budget of $68.9 million for each of 2013 and 2014. The ACC also approved a Resource Savings Initiative that allows APS to count towards compliance with the ACC Electric Energy Efficiency Standards, savings for improvements to APS’s transmission and delivery system, generation and facilities that have been approved through a DSM Plan. Consistent with the ACC’s March 11, 2014 order, APS intends to continue its approved DSM programs in 2015.
On June 27, 2013, the ACC voted to open a new docket investigating whether the Electric Energy Efficiency Rules should be modified. The ACC held a series of three workshops in March and April 2014 to investigate methodologies used to determine cost effective energy efficiency programs, cost recovery mechanisms, incentives, and potential changes to the Electric Energy Efficiency and Resource Planning Rules.
On November 4, 2014, the ACC staff issued a request for informal comment on a draft of possible amendments to Arizona’s Electric Utility Energy Efficiency Standards. The draft proposed substantial changes to the rules and energy efficiency standards. The ACC accepted written comments and took public comment regarding the possible amendments on December 19, 2014. A formal rule making has not been initiated and there has been no additional action on the draft to date.
Rate Matters.
APS needs timely recovery through rates of its capital and operating expenditures to maintain its financial health. APS’s retail rates are regulated by the ACC and its wholesale electric rates (primarily for transmission) are regulated by FERC. On June 1, 2011, APS filed a rate case with the ACC. APS and other parties to the retail rate case subsequently entered into the 2012 Settlement Agreement detailing the terms upon which the parties have agreed to settle the rate case. See Note 3 for details regarding the 2012 Settlement Agreement terms and for information on APS’s FERC rates.
APS has several recovery mechanisms in place that provide more timely recovery to APS of its fuel and transmission costs, and costs associated with the promotion and implementation of its demand side management and renewable energy efforts and customer programs. These mechanisms are described more fully in Note 3.
As part of APS’s acquisition of SCE’s interest in Units 4 and 5 of Four Corners, APS and SCE agreed, via a “Transmission Termination Agreement” that, upon closing of the acquisition, the companies would terminate an existing transmission agreement (“Transmission Agreement”) between the parties that provides transmission capacity on a system (the “Arizona Transmission System”) for SCE to transmit its portion of the output from Four Corners to California. APS previously submitted a request to FERC related to this
50
termination, which resulted in a FERC order denying rate recovery of $40 million that APS agreed to pay SCE associated with the termination. APS and SCE negotiated an alternate arrangement under which SCE would assign its 1,555 MW capacity rights over the Arizona Transmission System to third parties, including 300 MW to APS’s marketing and trading group. However, this alternative arrangement was not approved by FERC. In late March 2014, APS and SCE filed requests for rehearing with FERC. Both requests for rehearing were denied on August 14, 2014. Although APS and SCE continue to evaluate potential paths forward, it is possible that the terms of the Transmission Termination Agreement may again control. APS believes that the original denial by FERC of rate recovery under the Transmission Termination Agreement constitutes the failure of a condition that relieves APS of its obligations under that agreement. If APS and SCE were unable to determine a resolution through negotiation, the Transmission Termination Agreement requires that disputes be resolved through arbitration. APS is unable to predict the outcome of this matter if it proceeds to arbitration. If the matter proceeds to arbitration and APS is not successful, APS may be required to record a charge to its results of operations.
Deregulation.
On May 9, 2013, the ACC voted to re-examine the facilitation of a deregulated retail electric market in Arizona. The ACC subsequently opened a docket for this matter and received comments from a number of interested parties on the considerations involved in establishing retail electric deregulation in the state. One of these considerations is whether various aspects of a deregulated market, including setting utility rates on a “market” basis, would be consistent with the requirements of the Arizona Constitution. On September 11, 2013, after receiving legal advice from the ACC staff, the ACC voted 4-1 to close the current docket and await full Arizona Constitutional authority before any further examination of this matter. The motion approved by the ACC also included opening one or more new dockets in the future to explore options to offer more rate choices to customers and innovative changes within the existing cost-of-service regulatory model that could include elements of competition. The ACC opened a new docket on November 4, 2013 to explore technological advances and innovative changes within the electric utility industry. A series of workshops in this docket were held in 2014 and another is currently scheduled for February 26, 2015.
Net Metering.
On July 12, 2013, APS filed an application with the ACC proposing a solution to address the cost shift brought by the current net metering rules. On December 3, 2013, the ACC issued its order on APS’s net metering proposal. The ACC instituted a charge on customers who install rooftop solar panels after December 31, 2013, and directed APS to provide quarterly reports on the pace of rooftop solar adoption to assist the ACC in considering further increases. The charge of $0.70 per kilowatt became effective on January 1, 2014, and is estimated to collect $4.90 per month from a typical future rooftop solar customer to help pay for their use of the electricity grid.
In making its decision, the ACC determined that the current net metering program creates a cost shift, causing non-solar utility customers to pay higher rates to cover the costs of maintaining the electrical grid. ACC staff and the state’s Residential Utility Consumer Office, among other organizations, also agreed that a cost shift exists. The fixed charge does not increase APS’s revenue because it is credited to the LFCR, but it will modestly reduce the impact of the cost shift on non-solar customers. The ACC acknowledged that the new charge addresses only a portion of the cost shift. The ACC also required APS to file its next rate case in June 2015, the earliest date contemplated in the 2012 Settlement Agreement.
In May 2014, the ACC began conducting a series of workshops to, among other things, evaluate the role and value of the electric grid as it relates to rooftop solar and other issues regarding net metering.
On July 22, 2014, the ACC Commissioners voted to reopen the December 2013 net metering decision for the limited purpose of deciding whether to eliminate the requirement that APS file its next rate case in June 2015. The vote included a request that parties comment in the docket about their thoughts on removing the filing date requirement and on the process for the broader discussion regarding rate design. On August 12,
51
2014, the ACC Commissioners voted to lift the requirement that APS file its next general rate case by June 2015. On September 29, 2014, the staff of the ACC filed in a new docket a proposal for permitting a utility to request ACC approval of its proposed rate design outside of and before a general rate case. On October 20, 2014, APS and other interested stakeholders filed comments to this proposal. No further action has been taken in this docket.
Financial Strength and Flexibility.
Pinnacle West and APS currently have ample borrowing capacity under their respective credit facilities, and may readily access these facilities ensuring adequate liquidity for each company. Capital expenditures will be funded with internally generated cash and external financings, which may include issuances of long-term debt and Pinnacle West common stock.
Other Subsidiaries.
Bright Canyon Energy.
On July 31, 2014, Pinnacle West announced its creation of a wholly owned subsidiary, BCE. BCE will focus on new growth opportunities that leverage the Company’s core expertise in the electric energy industry. BCE’s first initiative is a 50/50 joint venture with MidAmerican Transmission, LLC. The joint venture, named TransCanyon, intends to focus on transmission opportunities within the Western Electricity Coordinating Council, excluding the retail service territories of the venture partners’ utility affiliates. The joint venture submitted a bid into CAISO's competitive solicitation process to design, build and own a new 500 kV transmission line between Arizona and California, the Delaney to Colorado River Transmission Line. The winner of the bidding process is expected to be announced in 2015. This transmission line will connect a planned Delaney substation near Palo Verde in Arizona to the existing Colorado River substation located just west of Blythe, California.
El Dorado.
The operations of El Dorado are not expected to have any material impact on our financial results, or to require any material amounts of capital, over the next three years.
Key Financial Drivers
In addition to the continuing impact of the matters described above, many factors influence our financial results and our future financial outlook, including those listed below. We closely monitor these factors to plan for the Company’s current needs, and to adjust our expectations, financial budgets and forecasts appropriately.
Electric Operating Revenues.
For the years 2012 through 2014, retail electric revenues comprised approximately 93% of our total electric operating revenues. Our electric operating revenues are affected by customer growth or decline, variations in weather from period to period, customer mix, average usage per customer and the impacts of energy efficiency programs, distributed energy additions, electricity rates and tariffs, the recovery of PSA deferrals and the operation of other recovery mechanisms. These revenue transactions are affected by the availability of excess generation or other energy resources and wholesale market conditions, including competition, demand and prices.
Customer and Sales Growth.
Retail customers in APS’s service territory increased 1.4% for the year ended December 31, 2014 compared with the prior-year. For the three years 2012 through 2014, APS’s customer growth averaged 1.3% per year. We currently expect annual customer growth to average in the range of 2.0-3.0% for 2015 through 2017 based on our assessment of modestly improving economic conditions in Arizona. Retail electricity sales in kWh, adjusted to exclude the effects of weather variations, were flat for the year ended December 31, 2014 compared with the prior-year, reflecting the effects of customer conservation and energy efficiency and distributed renewable generation initiatives, partially offset by improving economic conditions and customer growth. For the three years 2012 through 2014, APS experienced annual decreases in
52
retail electricity sales averaging 0.2%, adjusted to exclude the effects of weather variations. We currently estimate that annual retail electricity sales in kWh will increase on average in the range of 0.5-1.5% during 2015 through 2017, including the effects of customer conservation and energy efficiency and distributed renewable generation initiatives, but excluding the effects of weather variations. A slower recovery of the Arizona economy could further impact these estimates.
Actual sales growth, excluding weather-related variations, may differ from our projections as a result of numerous factors, such as economic conditions, customer growth, usage patterns and energy conservation, impacts of energy efficiency programs and growth in distributed generation, and responses to retail price changes. Based on past experience, a reasonable range of variation in our kWh sales projection attributable to such economic factors under normal business conditions can result in increases or decreases in annual net income of up to $10 million.
Weather.
In forecasting the retail sales growth numbers provided above, we assume normal weather patterns based on historical data. Historically, extreme weather variations have resulted in annual variations in net income in excess of $20 million. However, our experience indicates that the more typical variations from normal weather can result in increases or decreases in annual net income of up to $10 million.
Fuel and Purchased Power Costs.
Fuel and purchased power costs included on our Consolidated Statements of Income are impacted by our electricity sales volumes, existing contracts for purchased power and generation fuel, our power plant performance, transmission availability or constraints, prevailing market prices, new generating plants being placed in service in our market areas, changes in our generation resource allocation, our hedging program for managing such costs and PSA deferrals and the related amortization.
Operations and Maintenance Expenses
.
Operations and maintenance expenses are impacted by customer and sales growth, power plant operations, maintenance of utility plant (including generation, transmission, and distribution facilities), inflation, outages, renewable energy and demand side management related expenses (which are offset by the same amount of operating revenues) and other factors. In the 2009 Settlement Agreement, APS committed to operational expense reductions from 2010 through 2014.
On September 30, 2014, Pinnacle West announced plan design changes to the group life and medical postretirement benefit plan, which required an interim remeasurement of the benefit obligation for the plan. This remeasurement is expected to reduce net periodic benefit costs on a prospective basis. See Note 7. In October 2014, the Society of Actuaries' Retirement Plans Experience Committee issued its final report on mortality tables ("RP-2014 Mortality Tables Report"). At December 31, 2014, we updated our mortality assumptions using a modification of these tables, which better reflects our employees' demographics. See Note 7 for additional details.
Depreciation and Amortization Expenses.
Depreciation and amortization expenses are impacted by net additions to utility plant and other property (such as new generation, transmission, and distribution facilities), and changes in depreciation and amortization rates. See “Capital Expenditures” below for information regarding the planned additions to our facilities. See Note 3 regarding deferral of certain costs pursuant to an ACC order.
Property Taxes.
Taxes other than income taxes consist primarily of property taxes, which are affected by the value of property in-service and under construction, assessment ratios, and tax rates. The average property tax rate in Arizona for APS, which owns essentially all of our property, was 10.7% of the assessed value for 2014, 10.5% for 2013, and 9.6% for 2012. We expect property taxes to increase as we add new generating units and continue with improvements and expansions to our existing generating units, transmission and distribution facilities. (See Note 3 for property tax deferrals contained in the 2012 Settlement Agreement).
53
Income Taxes
.
Income taxes are affected by the amount of pretax book income, income tax rates, certain deductions and non-taxable items, such as AFUDC. In addition, income taxes may also be affected by the settlement of issues with taxing authorities.
Interest Expense.
Interest expense is affected by the amount of debt outstanding and the interest rates on that debt (see Note 6). The primary factors affecting borrowing levels are expected to be our capital expenditures, long-term debt maturities, equity issuances and internally generated cash flow. An allowance for borrowed funds used during construction offsets a portion of interest expense while capital projects are under construction. We stop accruing AFUDC on a project when it is placed in commercial operation.
RESULTS OF OPERATIONS
Pinnacle West’s only reportable business segment is our regulated electricity segment, which consists of traditional regulated retail and wholesale electricity businesses (primarily electric service to Native Load customers) and related activities and includes electricity generation, transmission and distribution.
Operating Results – 2014 compared with 2013.
Our consolidated net income attributable to common shareholders for the year ended December 31, 2014 was $398 million, compared with net income of $406 million for the prior year. The results reflect a decrease of approximately $4 million for the regulated electricity segment primarily due to
higher fossil generation costs, lower retail sales due to the effects of weather, higher property taxes, and lower retail transmission revenues. These negative factors were partially offset by lower operations and maintenance expenses related to lower employee benefit costs, higher other income, and increased revenues for lost fixed cost recovery. All other segment's income was lower by $4 million primarily related to El Dorado's investment losses.
The following table presents net income attributable to common shareholders by business segment compared with the prior year:
|
|
Year Ended
December 31,
|
|
|||||||||
|
2014
|
2013
|
Net Change
|
|||||||||
|
|
(dollars in millions)
|
||||||||||
|
Regulated Electricity Segment:
|
|
|
|
|
|
|
|||||
|
Operating revenues less fuel and purchased power expenses
|
$
|
2,309
|
|
$
|
2,356
|
|
$
|
(47
|
)
|
||
|
Operations and maintenance
|
(908
|
)
|
(925
|
)
|
17
|
|
|||||
|
Depreciation and amortization
|
(417
|
)
|
(416
|
)
|
(1
|
)
|
|||||
|
Taxes other than income taxes
|
(172
|
)
|
(164
|
)
|
(8
|
)
|
|||||
|
All other income and expenses, net
|
28
|
|
11
|
|
17
|
|
|||||
|
Interest charges, net of allowance for borrowed funds used during construction
|
(185
|
)
|
(187
|
)
|
2
|
|
|||||
|
Income taxes
|
(224
|
)
|
(232
|
)
|
8
|
|
|||||
|
Less income related to noncontrolling interests (Note 18)
|
(26
|
)
|
(34
|
)
|
8
|
|
|||||
|
Regulated electricity segment net income
|
405
|
|
409
|
|
(4
|
)
|
|||||
|
All other
|
(7
|
)
|
(3
|
)
|
(4
|
)
|
|||||
|
Net Income Attributable to Common Shareholders
|
$
|
398
|
|
$
|
406
|
|
$
|
(8
|
)
|
||
54
Operating revenues less fuel and purchased power expenses
.
Regulated electricity segment operating revenues less fuel and purchased power expenses were $47 million lower for the year ended December 31, 2014 compared with the prior year. The following table summarizes the major components of this change:
|
|
Increase (Decrease)
|
||||||||||
|
|
Operating
revenues
|
Fuel and
purchased
power
expenses
|
Net change
|
||||||||
|
|
(dollars in millions)
|
||||||||||
|
Effects of weather
|
$
|
(45
|
)
|
$
|
(16
|
)
|
$
|
(29
|
)
|
||
|
Lower demand side management regulatory surcharges, offset by renewable energy regulatory surcharges and purchased power
|
—
|
|
20
|
|
(20
|
)
|
|||||
|
Lower retail transmission revenues
|
(7
|
)
|
—
|
|
(7
|
)
|
|||||
|
Lower retail sales due to changes in customer usage patterns and related pricing, partially offset by customer growth
|
(4
|
)
|
—
|
|
(4
|
)
|
|||||
|
Higher net fuel and purchased power costs, including related deferrals and higher off-system sales margins
|
78
|
|
79
|
|
(1
|
)
|
|||||
|
Lost fixed cost recovery
|
12
|
|
—
|
|
12
|
|
|||||
|
Miscellaneous items, net
|
3
|
|
1
|
|
2
|
|
|||||
|
Total
|
$
|
37
|
|
$
|
84
|
|
$
|
(47
|
)
|
||
Operations and maintenance
.
Operations and maintenance expenses decreased $17 million for the year ended December 31, 2014 compared with the prior year primarily because of:
|
•
|
A decrease of $33 million related to costs for demand-side management, renewable energy and similar regulatory programs, which were partially offset in operating revenues and purchased power;
|
•
A decrease of $20 million related to lower employee benefit costs;
|
•
|
An increase of $33 million in generation costs, primarily related to an increased ownership share in Four Corners, a portion of which is deferred in depreciation and amortization, and higher fossil maintenance costs; and
|
|
•
|
An increase of $3 million related to miscellaneous other factors.
|
Depreciation and amortization.
Depreciation and amortization expenses were $1 million higher for the year ended December 31, 2014 compared with the prior year primarily related to higher plant balances of approximately $23 million
,
partially offset by higher Four Corners cost deferrals in the current year of approximately $22 million.
Taxes other than income taxes.
Taxes other than income taxes were $8 million higher for the year ended December 31, 2014 compared with the prior year primarily due to higher property tax rates and higher plant balances.
All other income and expenses, net.
All other income and expenses, net, were $17 million higher for the year ended December 31, 2014 compared with the prior year due to the debt return on the Four Corners acquisition, an increase in the allowance for equity funds used during construction due to higher balances, and other non-operating income.
55
Income taxes.
Income taxes were $8 million lower for the year ended December 31, 2014 compared with the prior year primarily due to the effects of lower pretax income in the current year.
Operating Results – 2013 compared with 2012.
Our consolidated net income attributable to common shareholders for the year ended December 31, 2013 was $406 million, compared with net income of $382 million for the prior year. The results reflect an increase of approximately $21 million for the regulated electricity segment, primarily due to increases related to the retail regulatory settlement effective July 1, 2012 (see Note 3); higher retail transmission revenues; and lower net interest charges due to lower debt balances and lower interest rates in the current-year period. These positive factors were partially offset by higher operations and maintenance expenses; higher fuel and purchased power costs, net of related deferrals; lower retail sales as a result of changes in customer usage related to energy efficiency, customer conservation and distributed generation, partially offset by customer growth; and higher depreciation and amortization expenses.
The following table presents net income attributable to common shareholders by business segment compared with the prior year:
|
|
Year Ended
December 31,
|
|
|||||||||
|
|
2013
|
2012
|
Net Change
|
||||||||
|
|
(dollars in millions)
|
||||||||||
|
Regulated Electricity Segment:
|
|
|
|
|
|
|
|||||
|
Operating revenues less fuel and purchased power expenses
|
$
|
2,356
|
|
$
|
2,299
|
|
$
|
57
|
|
||
|
Operations and maintenance
|
(925
|
)
|
(885
|
)
|
(40
|
)
|
|||||
|
Depreciation and amortization
|
(416
|
)
|
(404
|
)
|
(12
|
)
|
|||||
|
Taxes other than income taxes
|
(164
|
)
|
(159
|
)
|
(5
|
)
|
|||||
|
Other income (expenses), net
|
11
|
|
6
|
|
5
|
|
|||||
|
Interest charges, net of allowance for borrowed funds used during construction
|
(187
|
)
|
(200
|
)
|
13
|
|
|||||
|
Income taxes
|
(232
|
)
|
(237
|
)
|
5
|
|
|||||
|
Less income related to noncontrolling interests (Note 18)
|
(34
|
)
|
(32
|
)
|
(2
|
)
|
|||||
|
Regulated electricity segment net income
|
409
|
|
388
|
|
21
|
|
|||||
|
All other
|
(3
|
)
|
—
|
|
(3
|
)
|
|||||
|
Income from Continuing Operations Attributable to Common Shareholders
|
406
|
|
388
|
|
18
|
|
|||||
|
Loss from Discontinued Operations Attributable to Common Shareholders (a)
|
—
|
|
(6
|
)
|
6
|
|
|||||
|
Net Income Attributable to Common Shareholders
|
$
|
406
|
|
$
|
382
|
|
$
|
24
|
|
||
(a)
Includes activities related to SunCor.
56
Operating revenues less fuel and purchased power expenses
.
Regulated electricity segment operating revenues less fuel and purchased power expenses were $57 million higher for the year ended December 31, 2013 compared with the prior year. The following table summarizes the major components of this change:
|
|
Increase (Decrease)
|
||||||||||
|
|
Operating
revenues
|
Fuel and
purchased
power
expenses
|
Net change
|
||||||||
|
|
(dollars in millions)
|
||||||||||
|
Impacts of retail regulatory settlement effective July 1, 2012
|
$
|
64
|
|
$
|
6
|
|
$
|
58
|
|
||
|
Higher demand-side management, renewable energy and similar regulatory surcharges
|
34
|
|
7
|
|
27
|
|
|||||
|
Higher retail transmission revenues
|
11
|
|
—
|
|
11
|
|
|||||
|
Lower retail sales due to changes in customer usage patterns and related pricing, partially offset by customer growth
|
(17
|
)
|
(4
|
)
|
(13
|
)
|
|||||
|
Higher fuel and purchased power costs, net of related deferrals and off-system sales
|
74
|
|
95
|
|
(21
|
)
|
|||||
|
Miscellaneous items, net
|
(8
|
)
|
(3
|
)
|
(5
|
)
|
|||||
|
Total
|
$
|
158
|
|
$
|
101
|
|
$
|
57
|
|
||
Operations and maintenance
.
Operations and maintenance expenses increased $40 million for the year ended December 31, 2013 compared with the prior year primarily because of:
|
•
|
An increase of $14 million related to technical analysis, consulting, advertising and communications costs;
|
|
•
|
An increase of $13 million related to costs for demand-side management, renewable energy and similar regulatory programs, which were largely offset in operating revenues;
|
|
•
|
An increase of $9 million related to the closure of Four Corners Units 1, 2, and 3, deferred for regulatory recovery in depreciation;
|
|
•
|
An increase of $6 million in energy delivery and customer service costs;
|
|
•
|
An increase of $6 million in information technology costs;
|
|
•
|
A decrease of $6 million in generation costs primarily related to lower fossil generation outage costs and lower nuclear generation costs; and
|
|
•
|
A decrease of $2 million related to other miscellaneous factors.
|
Depreciation and amortization
.
Depreciation and amortization expenses were $12 million higher for the year ended December 31, 2013 compared with the prior year, primarily because of increased plant in service, partially offset by the regulatory deferral of operating expenses associated with the closure of Four Corners Units 1, 2, and 3.
Interest charges, net of allowance for borrowed funds used during construction
.
Interest charges, net of allowance for borrowed funds used during construction, decreased $13 million for the year ended December 31, 2013 compared with the prior year, primarily because of lower debt balances and lower interest rates in the current year.
57
Income taxes.
Income taxes were $5 million lower for the year ended December 31, 2013 compared with the prior year primarily due to a lower effective tax rate in the current period, partially offset by the effects of higher pretax income in the current year.
LIQUIDITY AND CAPITAL RESOURCES
Overview
Pinnacle West’s primary cash needs are for dividends to our shareholders and principal and interest payments on our indebtedness. The level of our common stock dividends and future dividend growth will be dependent on declaration by our Board of Directors and based on a number of factors, including our financial condition, payout ratio, free cash flow and other factors.
Our primary sources of cash are dividends from APS and external debt and equity issuances. An ACC order requires APS to maintain a common equity ratio of at least 40%. As defined in the related ACC order, the common equity ratio is defined as total shareholder equity divided by the sum of total shareholder equity and long-term debt, including current maturities of long-term debt. At December 31, 2014, APS’s common equity ratio, as defined, was 56%. Its total shareholder equity was approximately $4.5 billion, and total capitalization was approximately $8.0 billion. Under this order, APS would be prohibited from paying dividends if such payment would reduce its total shareholder equity below approximately $3.2 billion, assuming APS’s total capitalization remains the same. This restriction does not materially affect Pinnacle West’s ability to meet its ongoing cash needs or ability to pay dividends to shareholders.
APS’s capital requirements consist primarily of capital expenditures and maturities of long-term debt. APS funds its capital requirements with cash from operations and, to the extent necessary, external debt financing and equity infusions from Pinnacle West.
Summary of Cash Flows
The following tables present net cash provided by (used for) operating, investing and financing activities for the years ended December 31, 2014, 2013 and 2012 (dollars in millions):
Pinnacle West Consolidated
|
|
2014
|
2013
|
2012
|
||||||||
|
Net cash flow provided by operating activities
|
$
|
1,100
|
|
$
|
1,153
|
|
$
|
1,171
|
|
||
|
Net cash flow used for investing activities
|
(923
|
)
|
(1,009
|
)
|
(873
|
)
|
|||||
|
Net cash flow used for financing activities
|
(179
|
)
|
(161
|
)
|
(305
|
)
|
|||||
|
Net decrease in cash and cash equivalents
|
$
|
(2
|
)
|
$
|
(17
|
)
|
$
|
(7
|
)
|
||
Arizona Public Service Company
|
|
2014
|
2013
|
2012
|
||||||||
|
Net cash flow provided by operating activities
|
$
|
1,124
|
|
$
|
1,194
|
|
$
|
1,176
|
|
||
|
Net cash flow used for investing activities
|
(922
|
)
|
(1,009
|
)
|
(873
|
)
|
|||||
|
Net cash flow used for financing activities
|
(201
|
)
|
(185
|
)
|
(319
|
)
|
|||||
|
Net increase (decrease) in cash and cash equivalents
|
$
|
1
|
|
$
|
—
|
|
$
|
(16
|
)
|
||
58
Operating Cash Flows
2014 Compared with 2013.
Pinnacle West’s consolidated net cash provided by operating activities was $1,100 million in 2014 compared to $1,153 million in 2013, a decrease of $53 million in net cash provided. The decrease is primarily related to $99 million in higher fuel and purchased power costs, a $39 million increase in cash collateral posted, $34 million of higher pension contributions in 2014, and other changes in working capital. The decrease is partially offset by a $121 million increase in income tax refunds net of payments (primarily related to a $135 million income tax refund received in the first quarter of 2014). APS's
operating cash flows included income tax refunds of approximately $86 million in 2014 compared with payments of $8 million in 2013.
2013 Compared with 2012.
Pinnacle West’s consolidated net cash provided by operating activities was $1,153 million in 2013, compared to $1,171 million in 2012, a decrease of $18 million in net cash provided. The decrease is primarily related to a $127 million change in cash collateral posted and $76 million of higher pension contributions made in 2013 compared to 2012 (approximately $18 million of which is reflected in capital expenditures). The decrease is partially offset by approximately $167 million of higher cash inflows primarily due to higher authorized revenue requirements resulting from the retail regulatory settlement effective July 1, 2012 and other changes in working capital.
Other
.
Pinnacle West sponsors a qualified defined benefit pension plan and a non-qualified supplemental excess benefit retirement plan for the employees of Pinnacle West and our subsidiaries. The requirements of the Employee Retirement Income Security Act of 1974 (“ERISA”) require us to contribute a minimum amount to the qualified plan. We contribute at least the minimum amount required under ERISA regulations, but no more than the maximum tax-deductible amount. The minimum required funding takes into consideration the value of plan assets and our pension benefit obligations. Under ERISA, the qualified pension plan was 118% funded as of January 1, 2014 and is estimated to be approximately 118% funded as of January 1, 2015. Under GAAP, the qualified pension plan was 90% funded as of January 1, 2014 and is estimated to be approximately 90% funded as of January 1, 2015. The assets in the plan are comprised of fixed-income, equity, real estate, and short-term investments. Future year contribution amounts are dependent on plan asset performance and plan actuarial assumptions. We made contributions to our pension plan totaling $175 million in 2014, $141 million in 2013, and $65 million in 2012. The minimum contributions for the pension plan are zero for the next three years. We expect to make voluntary contributions totaling up to $300 million for the next three years (up to $100 million each year in 2015, 2016, and 2017). With regard to contributions to our other postretirement benefit plans, we made a contribution of approximately $1 million in 2014, $14 million in 2013, and $23 million in 2012. We expect to make contributions of approximately $1 million in each of the next three years to our other postretirement benefit plans.
Included in the current income tax receivable on the Consolidated Balance Sheets as of December 31, 2013 was $133 million that represented the anticipated IRS refund related to the finalized examinations of tax years ended December 31, 2008 and 2009. Cash related to this refund was received in the first quarter of 2014.
Investing Cash Flows
2014 Compared with 2013.
Pinnacle West’s consolidated net cash used for investing activities was $923 million in 2014, compared to $1,009 million in 2013, a decrease of $86 million in net cash used. The decrease in net cash used for investing activities is primarily related to APS's purchase of SCE’s interest in Units 4 and 5 of Four Corners of approximately $209 million in 2013, partially offset by an increase of approximately $123 million in other capital expenditures.
59
2013 Compared with 2012.
Pinnacle West’s consolidated net cash used for investing activities was $1,009 million in 2013, compared to $873 million in 2012, an increase of $136 million in net cash used. The increase in net cash used for investing activities is primarily related to APS’s purchase of SCE’s interest in Units 4 and 5 of Four Corners of approximately $209 million, partially offset by a decrease of approximately $73 million in other capital expenditures.
Capital Expenditures.
The following table summarizes the estimated capital expenditures for the next three years:
Capital Expenditures
(dollars in millions)
|
Estimated for the Year Ended
December 31,
|
|||||||||||
|
|
2015
|
2016
|
2017
|
||||||||
|
APS
|
|
|
|
|
|
|
|||||
|
Generation:
|
|
|
|
|
|
|
|||||
|
Nuclear Fuel
|
$
|
78
|
|
$
|
87
|
|
$
|
79
|
|
||
|
Renewables
|
86
|
|
1
|
|
2
|
|
|||||
|
Environmental
|
36
|
|
162
|
|
161
|
|
|||||
|
New Gas Generation
|
96
|
|
235
|
|
190
|
|
|||||
|
Other Generation
|
180
|
|
204
|
|
198
|
|
|||||
|
Distribution
|
329
|
|
362
|
|
385
|
|
|||||
|
Transmission
|
203
|
|
133
|
|
180
|
|
|||||
|
Other (a)
|
83
|
|
81
|
|
98
|
|
|||||
|
Total APS
|
$
|
1,091
|
|
$
|
1,265
|
|
$
|
1,293
|
|
||
(a)
Primarily information systems and facilities projects.
Generation capital expenditures are comprised of various improvements to APS’s existing fossil and nuclear plants. Examples of the types of projects included in this category are additions, upgrades and capital replacements of various power plant equipment, such as turbines, boilers and environmental equipment. The estimated Renewables expenditures include 20 MW of utility-scale solar projects which were approved by the ACC in the 2014 RES Implementation Plan and the residential rooftop solar program. We have not included estimated costs for Cholla’s compliance with MATS or EPA’s regional haze rule since we have challenged the regional haze rule judicially and we have proposed a compromise strategy to EPA, which, if approved, would allow us to avoid expenditures related to environmental control equipment. The portion of estimated costs through 2017 for installation of pollution control equipment needed to ensure Four Corners’ compliance with EPA’s regional haze rules have been included in the table above. The portion of estimated costs through 2017 for incremental costs to comply with the CCR rule for Four Corners and Cholla have also been included in the table above. The table does not include capital expenditures related to El Paso's 7% interest in Four Corners Units 4 and 5 of $24 million in 2016 and $23 million in 2017. The consummation of the purchase of El Paso's interest in Four Corners is not expected to take place until 2016, thus, there are no related capital expenditures in 2015. We are monitoring the status of other environmental matters, which, depending on their final outcome, could require modification to our planned environmental expenditures.
Distribution and transmission capital expenditures are comprised of infrastructure additions and upgrades, capital replacements, and new customer construction. Examples of the types of projects included in
60
the forecast include power lines, substations, and line extensions to new residential and commercial developments.
Capital expenditures will be funded with internally generated cash and external financings, which may include issuances of long-term debt and Pinnacle West common stock.
Financing Cash Flows and Liquidity
2014 Compared with 2013.
Pinnacle West’s consolidated net cash used for financing activities was $179 million in 2014, compared to $161 million in 2013, an increase of $18 million in net cash used. The increase in net cash used for financing activities is primarily due to $530 million in higher repayments of long-term debt, a $67 million net reduction in funds received through short-term borrowings, and $11 million in higher dividend payments, partially offset by $595 million in higher issuances of long-term debt (see below).
2013 Compared with 2012.
Pinnacle West’s consolidated net cash used for financing activities was $161 million in 2013, compared to $305 million of net cash used in 2012, a decrease of $144 million in net cash used. The decrease in net cash used for financing activities is primarily due to $531 million in lower repayments of long-term debt, largely offset by $340 million in lower issuances of long-term debt and a $31 million net change in APS’s commercial paper borrowings, which is classified as short-term borrowings on the Consolidated Balance Sheets. On December 30, 2013, commercial paper issuances were used to fund the acquisition of SCE’s 48% ownership interest in each of Units 4 and 5 of Four Corners (see below).
Significant Financing Activities.
On December 17, 2014, the Pinnacle West Board of Directors declared a quarterly dividend of $0.595 per share of common stock, payable on March 2, 2015, to shareholders of record on February 2, 2015. During 2014, Pinnacle West increased its indicated annual dividend from $2.27 per share to $2.38 per share. For the year ended December 31, 2014, Pinnacle West’s total dividends paid per share of common stock were $2.30 per share, which resulted in dividend payments of $247 million.
On July 12, 2013, APS purchased all $33 million of the Coconino County, Arizona Pollution Control Corporation Pollution Control Revenue Refunding Bonds, 1994 Series A, due 2029. On October 11, 2013, APS purchased all $32 million of the City of Farmington, New Mexico Pollution Control Revenue Bonds, 1994 Series C, due 2024. On January 15, 2014, both of these series of bonds were canceled and refinanced as described below.
On January 10, 2014, APS issued $250 million of 4.70% unsecured senior notes that mature on January 15, 2044. The proceeds from the sale were used to repay commercial paper which was used to fund the acquisition of SCE’s 48% ownership interest in each of Units 4 and 5 of Four Corners and to replenish cash used in 2013 to re-acquire the two series of tax-exempt indebtedness listed above.
On May 1, 2014, APS purchased a total of $100 million of the Maricopa County, Arizona, Pollution Control Corporation Pollution Control Revenue Refunding Bonds, 2009 Series A, D and E due 2029 in connection with the mandatory tender provisions for this indebtedness. On May 14, 2014, APS remarketed all $36 million of the 2009 Series A Bonds, which are classified as long-term debt on our Consolidated Balance Sheets at December 31, 2014. We expect to remarket or refinance all $64 million of the 2009 Series D Bonds and 2009 Series E Bonds within the next twelve months.
On May 30, 2014, APS purchased all $38 million of the Navajo County, Arizona, Pollution Control Corporation Pollution Control Revenue Refunding Bonds, 2009 Series A, due 2034, and on June 1, 2014, APS purchased a total of $64 million of the Navajo 2009 Series B Bonds and 2009 Series C Bonds, in each case, in connection with the mandatory tender provisions for this indebtedness. On September 23, 2014, APS remarketed all $38 million of the 2009 Series A Bonds, which are classified as current maturities of long-term
61
debt on our Consolidated Balance Sheets at December 31, 2014. On October 1, 2014, APS remarketed all $32 million of the 2009 Series C Bonds, which are classified as long-term debt on our Consolidated Balance Sheets at December 31, 2014. We expect to remarket or refinance all $32 million of the 2009 Series B Bonds within the next twelve months.
On June 1, 2014, APS remarketed all $13 million of the Coconino County, Arizona Pollution Control Corporation Pollution Control Revenue Refunding Bonds, 2009 Series A, due 2034. These bonds are classified as long-term debt on our Consolidated Balance Sheets at December 31, 2014.
On June 18, 2014, APS issued $250 million of 3.35% unsecured senior notes that mature on June 15, 2024. The net proceeds from the sale were used along with other funds to repay at maturity APS’s $300 million aggregate principal amount of 5.80% senior notes due June 30, 2014.
On December 31, 2014, Pinnacle West entered into a $125 million term loan facility that matures December 31, 2017. Pinnacle West used the proceeds to repay and refinance the term loan facility that would have matured in November 2015.
On January 12, 2015, APS issued $250 million of 2.20% unsecured senior notes that mature on January 15, 2020. The net proceeds from the sale were used to repay commercial paper borrowings and replenish cash temporarily used to fund capital expenditures.
Available Credit Facilities
.
Pinnacle West and APS maintain committed revolving credit facilities in order to enhance liquidity and provide credit support for their commercial paper programs.
On May 9, 2014, Pinnacle West replaced its $200 million revolving credit facility that would have matured in November 2016, with a new $200 million facility that matures in May 2019. At December 31, 2014, the facility was available to refinance indebtedness of the Company and for other general corporate purposes, including credit support for its $200 million commercial paper program. Pinnacle West has the option to increase the amount of the facility up to a maximum of $300 million upon the satisfaction of certain conditions and with the consent of the lenders. At December 31, 2014, Pinnacle West had no outstanding borrowings under its credit facility, no letters of credit outstanding and no commercial paper borrowings.
On May 9, 2014, APS replaced its $500 million revolving credit facility that would have matured in November 2016, with a new $500 million facility that matures in May 2019.
At December 31, 2014, APS had two credit facilities totaling $1 billion, including a $500 million credit facility that matures in April 2018 and the $500 million facility that matures in May 2019 (see above). APS may increase the amount of each facility up to a maximum of $700 million upon the satisfaction of certain conditions and with the consent of the lenders. APS will use these facilities to refinance indebtedness and for other general corporate purposes. Interest rates are based on APS’s senior unsecured debt credit ratings.
The facilities described above are available to support APS’s $250 million commercial paper program, for bank borrowings or for issuances of letters of credit. At December 31, 2014, APS had $147 million of commercial paper borrowings and no outstanding borrowings or outstanding letters of credit under these credit facilities.
See “Financial Assurances” in Note 10 for a discussion of APS’s separate outstanding letters of credit.
Other Financing Matters.
See Note 3 for information regarding the PSA approved by the ACC.
See Note 16 for information related to the change in our margin and collateral accounts.
62
Debt Provisions
Pinnacle West’s and APS’s debt covenants related to their respective bank financing arrangements include maximum debt to capitalization ratios. Pinnacle West and APS comply with this covenant. For both Pinnacle West and APS, this covenant requires that the ratio of consolidated debt to total consolidated capitalization not exceed 65%. At December 31, 2014, the ratio was approximately 46% for Pinnacle West and 45% for APS. Failure to comply with such covenant levels would result in an event of default which, generally speaking, would require the immediate repayment of the debt subject to the covenants and could “cross-default” other debt. See further discussion of “cross-default” provisions below.
Neither Pinnacle West’s nor APS’s financing agreements contain “rating triggers” that would result in an acceleration of the required interest and principal payments in the event of a rating downgrade. However, our bank credit agreements contain a pricing grid in which the interest rates we pay for borrowings thereunder are determined by our current credit ratings.
All of Pinnacle West’s loan agreements contain “cross-default” provisions that would result in defaults and the potential acceleration of payment under these loan agreements if Pinnacle West or APS were to default under certain other material agreements. All of APS’s bank agreements contain “cross-default” provisions that would result in defaults and the potential acceleration of payment under these bank agreements if APS were to default under certain other material agreements. Pinnacle West and APS do not have a material adverse change restriction for credit facility borrowings.
See Note 6 for further discussions of liquidity matters.
Credit Ratings
The ratings of securities of Pinnacle West and APS as of February 13, 2015 are shown below. We are disclosing these credit ratings to enhance understanding of our cost of short-term and long-term capital and our ability to access the markets for liquidity and long-term debt. The ratings reflect the respective views of the rating agencies, from which an explanation of the significance of their ratings may be obtained. There is no assurance that these ratings will continue for any given period of time. The ratings may be revised or withdrawn entirely by the rating agencies if, in their respective judgments, circumstances so warrant. Any downward revision or withdrawal may adversely affect the market price of Pinnacle West’s or APS’s securities and/or result in an increase in the cost of, or limit access to, capital. Such revisions may also result in substantial additional cash or other collateral requirements related to certain derivative instruments, insurance policies, natural gas transportation, fuel supply, and other energy-related contracts. At this time, we believe we have sufficient available liquidity resources to respond to a downward revision to our credit ratings.
63
|
|
Moody’s
|
Standard &
Poor’s
|
Fitch
|
||
|
Pinnacle West
|
|
|
|
||
|
Corporate credit rating
|
Baa1
|
A-
|
BBB+
|
||
|
Commercial paper
|
P-2
|
A-2
|
F2
|
||
|
Outlook
|
Positive
|
Stable
|
Positive
|
||
|
|
|
|
|
||
|
APS
|
|
|
|
||
|
Corporate credit rating
|
A3
|
A-
|
BBB+
|
||
|
Senior unsecured
|
A3
|
A-
|
A-
|
||
|
Secured lease obligation bonds
|
A3
|
A-
|
A-
|
||
|
Commercial paper
|
P-2
|
A-2
|
F2
|
||
|
Outlook
|
Positive
|
Stable
|
Positive
|
||
Off-Balance Sheet Arrangements
See Note 18 for a discussion of the impacts on our financial statements of consolidating certain VIEs.
Contractual Obligations
The following table summarizes Pinnacle West’s consolidated contractual requirements as of December 31, 2014 (dollars in millions):
|
|
2015
|
2016-
2017
|
2018-
2019
|
Thereafter
|
Total
|
||||||||||||||
|
Long-term debt payments, including interest: (a)
|
|
|
|
|
|
|
|
|
|||||||||||
|
APS
|
$
|
551
|
|
$
|
686
|
|
$
|
788
|
|
$
|
3,653
|
|
$
|
5,678
|
|
||||
|
Pinnacle West
|
2
|
|
131
|
|
—
|
|
—
|
|
133
|
|
|||||||||
|
Total long-term debt payments, including interest
|
553
|
|
817
|
|
788
|
|
3,653
|
|
5,811
|
|
|||||||||
|
Short-term debt payments, including interest (b)
|
147
|
|
—
|
|
—
|
|
—
|
|
147
|
|
|||||||||
|
Fuel and purchased power commitments (c)
|
618
|
|
1,223
|
|
1,146
|
|
7,994
|
|
10,981
|
|
|||||||||
|
Renewable energy credits (d)
|
46
|
|
84
|
|
84
|
|
448
|
|
662
|
|
|||||||||
|
Purchase obligations (e)
|
105
|
|
154
|
|
47
|
|
222
|
|
528
|
|
|||||||||
|
Coal reclamation
|
1
|
|
32
|
|
37
|
|
281
|
|
351
|
|
|||||||||
|
Nuclear decommissioning funding requirements
|
17
|
|
5
|
|
5
|
|
63
|
|
90
|
|
|||||||||
|
Noncontrolling interests (f)
|
35
|
|
45
|
|
45
|
|
250
|
|
375
|
|
|||||||||
|
Operating lease payments
|
18
|
|
11
|
|
7
|
|
63
|
|
99
|
|
|||||||||
|
Total contractual commitments
|
$
|
1,540
|
|
$
|
2,371
|
|
$
|
2,159
|
|
$
|
12,974
|
|
$
|
19,044
|
|
||||
|
(a)
|
The long-term debt matures at various dates through 2044 and bears interest principally at fixed rates. Interest on variable-rate long-term debt is determined by using average rates at December 31, 2014 (see Note 6).
|
|
(b)
|
The short-term debt represents commercial paper borrowings at APS (see Note 5).
|
64
|
(c)
|
Our fuel and purchased power commitments include purchases of coal, electricity, natural gas, renewable energy, nuclear fuel, and natural gas transportation (see Notes 3 and 10). These amounts include commitments incurred from acquiring SCE’s interest in Four Corners and APS assuming an additional 7% in the 2016 Coal Supply Agreement.
|
|
(d)
|
Contracts to purchase renewable energy credits in compliance with the RES (see Note 3).
|
|
(e)
|
These contractual obligations include commitments for capital expenditures and other obligations.
|
|
(f)
|
Payments to the noncontrolling interests relate to the Palo Verde Sale Leaseback (see Note 18).
|
This table excludes $46 million in unrecognized tax benefits because the timing of the future cash outflows is uncertain. Estimated minimum pension contributions are zero for 2015, 2016 and 2017, respectively (see Note 7).
CRITICAL ACCOUNTING POLICIES
In preparing the financial statements in accordance with accounting principles generally accepted in the United States of America (“GAAP”), management must often make estimates and assumptions that affect the reported amounts of assets, liabilities, revenues, expenses and related disclosures at the date of the financial statements and during the reporting period. Some of those judgments can be subjective and complex, and actual results could differ from those estimates. We consider the following accounting policies to be our most critical because of the uncertainties, judgments and complexities of the underlying accounting standards and operations involved.
Regulatory Accounting
Regulatory accounting allows for the actions of regulators, such as the ACC and FERC, to be reflected in our financial statements. Their actions may cause us to capitalize costs that would otherwise be included as an expense in the current period by unregulated companies. Regulatory assets represent incurred costs that have been deferred because they are probable of future recovery in customer rates. Regulatory liabilities generally represent expected future costs that have already been collected from customers. Management continually assesses whether our regulatory assets are probable of future recovery by considering factors such as applicable regulatory environment changes and recent rate orders to other regulated entities in the same jurisdiction. This determination reflects the current political and regulatory climate in Arizona and is subject to change in the future. If future recovery of costs ceases to be probable, the assets would be written off as a charge in current period earnings. We had $1,191 million of regulatory assets and $1,182 million of regulatory liabilities on the Consolidated Balance Sheets at December 31, 2014.
Included in the balance of regulatory assets at December 31, 2014 is a regulatory asset of $485 million for pension benefits. This regulatory asset represents the future recovery of these costs through retail rates as these amounts are charged to earnings. If these costs are disallowed by the ACC, this regulatory asset would be charged to OCI and result in lower future earnings.
See Notes 1 and 3 for more information.
Pensions and Other Postretirement Benefit Accounting
Changes in our actuarial assumptions used in calculating our pension and other postretirement benefit liability and expense can have a significant impact on our earnings and financial position. The most relevant actuarial assumptions are the discount rate used to measure our liability and net periodic cost, the expected long-term rate of return on plan assets used to estimate earnings on invested funds over the long-term, the
65
mortality assumptions, and the assumed healthcare cost trend rates. We review these assumptions on an annual basis and adjust them as necessary.
The following chart reflects the sensitivities that a change in certain actuarial assumptions would have had on the December 31, 2014 reported pension liability on the Consolidated Balance Sheets and our 2014 reported pension expense, after consideration of amounts capitalized or billed to electric plant participants, on Pinnacle West’s Consolidated Statements of Income (dollars in millions):
|
|
Increase (Decrease)
|
|||||||
|
Actuarial Assumption (a)
|
Impact on
Pension
Liability
|
Impact on
Pension
Expense
|
||||||
|
Discount rate:
|
|
|
|
|
||||
|
Increase 1%
|
$
|
(349
|
)
|
$
|
(2
|
)
|
||
|
Decrease 1%
|
427
|
|
13
|
|
||||
|
Expected long-term rate of return on plan assets:
|
||||||||
|
Increase 1%
|
—
|
|
(11
|
)
|
||||
|
Decrease 1%
|
—
|
|
11
|
|
||||
|
(a)
|
Each fluctuation assumes that the other assumptions of the calculation are held constant while the rates are changed by one percentage point.
|
The following chart reflects the sensitivities that a change in certain actuarial assumptions would have had on the December 31, 2014 other postretirement benefit obligation and our 2014 reported other postretirement benefit expense, after consideration of amounts capitalized or billed to electric plant participants, on Pinnacle West’s Consolidated Statements of Income (dollars in millions):
|
|
Increase (Decrease)
|
|||||||
|
Actuarial Assumption (a)
|
Impact on Other
Postretirement
Benefit
Obligation
|
Impact on Other
Postretirement
Benefit Expense
|
||||||
|
Discount rate:
|
|
|
|
|
||||
|
Increase 1%
|
$
|
(93
|
)
|
$
|
(1
|
)
|
||
|
Decrease 1%
|
120
|
|
6
|
|
||||
|
Healthcare cost trend rate (b):
|
||||||||
|
Increase 1%
|
110
|
|
10
|
|
||||
|
Decrease 1%
|
(88
|
)
|
(4
|
)
|
||||
|
Expected long-term rate of return on plan assets – pretax:
|
|
|
||||||
|
Increase 1%
|
—
|
|
(4
|
)
|
||||
|
Decrease 1%
|
—
|
|
4
|
|
||||
|
(a)
|
Each fluctuation assumes that the other assumptions of the calculation are held constant while the rates are changed by one percentage point.
|
|
(b)
|
This assumes a 1% change in the initial and ultimate healthcare cost trend rate.
|
See Note 7 for further details about our pension and other postretirement benefit plans.
66
Fair Value Measurements
We account for derivative instruments, investments held in our nuclear decommissioning trust fund, certain cash equivalents, and plan assets held in our retirement and other benefit plans at fair value on a recurring basis. Fair value is the price that would be received to sell an asset or paid to transfer a liability in an orderly transaction between market participants at the measurement date. We use inputs, or assumptions that market participants would use, to determine fair market value. We utilize valuation techniques that maximize the use of observable inputs and minimize the use of unobservable inputs. The significance of a particular input determines how the instrument is classified in a fair value hierarchy. The determination of fair value sometimes requires subjective and complex judgment. Our assessment of the inputs and the significance of a particular input to fair value measurement may affect the valuation of the instruments and their placement within a fair value hierarchy. Actual results could differ from our estimates of fair value. See Note 1 for a discussion on accounting policies and Note 13 for fair value measurement disclosures.
OTHER ACCOUNTING MATTERS
During 2014, we adopted new accounting guidance relating to the balance sheet presentation of certain unrecognized tax benefits. In addition, we are currently evaluating new revenue recognition guidance that we will be adopting on January 1, 2017. See Note 2.
MARKET AND CREDIT RISKS
Market Risks
Our operations include managing market risks related to changes in interest rates, commodity prices and investments held by our nuclear decommissioning trust fund and benefit plan assets.
Interest Rate and Equity Risk
We have exposure to changing interest rates. Changing interest rates will affect interest paid on variable-rate debt and the market value of fixed income securities held by our nuclear decommissioning trust fund (see Note 13 and Note 19) and benefit plan assets. The nuclear decommissioning trust fund and benefit plan assets also have risks associated with the changing market value of their equity and other non-fixed income investments. Nuclear decommissioning and benefit plan costs are recovered in regulated electricity prices.
67
The tables below present contractual balances of our consolidated long-term and short-term debt at the expected maturity dates, as well as the fair value of those instruments on December 31, 2014 and 2013. The interest rates presented in the tables below represent the weighted-average interest rates as of December 31, 2014 and 2013 (dollars in thousands):
Pinnacle West – Consolidated
|
|
Short-Term
Debt
|
Variable-Rate
Long-Term Debt
|
Fixed-Rate
Long-Term Debt
|
||||||||||||||||||
|
|
Interest
|
|
Interest
|
|
Interest
|
|
|||||||||||||||
|
2014
|
Rates
|
Amount
|
Rates
|
Amount
|
Rates
|
Amount
|
|||||||||||||||
|
2015
|
0.40
|
%
|
$
|
147,400
|
|
0.03
|
%
|
$
|
32,000
|
|
4.32
|
%
|
$
|
351,570
|
|
||||||
|
2016
|
—
|
|
—
|
|
0.04
|
%
|
43,580
|
|
6.15
|
%
|
314,000
|
|
|||||||||
|
2017
|
—
|
|
—
|
|
0.82
|
%
|
157,000
|
|
—
|
|
—
|
|
|||||||||
|
2018
|
—
|
|
—
|
|
—
|
|
—
|
|
1.75
|
%
|
32,000
|
|
|||||||||
|
2019
|
—
|
|
—
|
|
—
|
|
—
|
|
8.75
|
%
|
500,000
|
|
|||||||||
|
Years thereafter
|
—
|
|
—
|
|
0.27
|
%
|
48,825
|
|
4.90
|
%
|
1,940,150
|
|
|||||||||
|
Total
|
|
|
$
|
147,400
|
|
$
|
281,405
|
|
|
|
$
|
3,137,720
|
|
||||||||
|
Fair value
|
|
|
$
|
147,400
|
|
|
|
$
|
281,405
|
|
|
|
$
|
3,557,703
|
|
||||||
|
|
Short-Term
Debt
|
Variable-Rate
Long-Term Debt
|
Fixed-Rate
Long-Term Debt
|
||||||||||||||||||
|
|
Interest
|
|
Interest
|
|
Interest
|
|
|||||||||||||||
|
2013
|
Rates
|
Amount
|
Rates
|
Amount
|
Rates
|
Amount
|
|||||||||||||||
|
2014
|
0.23
|
%
|
$
|
153,125
|
|
—
|
|
$
|
—
|
|
5.58
|
%
|
$
|
540,424
|
|
||||||
|
2015
|
—
|
|
—
|
|
1.02
|
%
|
157,000
|
|
4.79
|
%
|
313,420
|
|
|||||||||
|
2016
|
—
|
|
—
|
|
0.06
|
%
|
43,580
|
|
6.15
|
%
|
314,000
|
|
|||||||||
|
2017
|
—
|
|
—
|
|
—
|
|
—
|
|
—
|
|
—
|
|
|||||||||
|
2018
|
—
|
|
—
|
|
—
|
|
—
|
|
1.75
|
%
|
32,000
|
|
|||||||||
|
Years thereafter
|
—
|
|
—
|
|
—
|
|
—
|
|
6.12
|
%
|
1,940,150
|
|
|||||||||
|
Total
|
|
|
$
|
153,125
|
|
$
|
200,580
|
|
|
|
$
|
3,139,994
|
|
||||||||
|
Fair value
|
|
|
$
|
153,125
|
|
|
|
$
|
200,580
|
|
|
|
$
|
3,378,102
|
|
||||||
68
The tables below present contractual balances of APS’s long-term debt at the expected maturity dates, as well as the fair value of those instruments on December 31, 2014 and 2013. The interest rates presented in the tables below represent the weighted-average interest rates as of December 31, 2014 and 2013 (dollars in thousands):
APS — Consolidated
|
|
Short-Term
Debt
|
Variable-Rate
Long-Term Debt
|
Fixed-Rate
Long-Term Debt
|
||||||||||||||||||
|
|
Interest
|
|
Interest
|
|
Interest
|
|
|||||||||||||||
|
2014
|
Rates
|
Amount
|
Rates
|
Amount
|
Rates
|
Amount
|
|||||||||||||||
|
2015
|
0.40
|
%
|
$
|
147,400
|
|
0.03
|
%
|
$
|
32,000
|
|
4.32
|
%
|
$
|
351,570
|
|
||||||
|
2016
|
—
|
|
—
|
|
0.04
|
%
|
43,580
|
|
6.15
|
%
|
314,000
|
|
|||||||||
|
2017
|
—
|
|
—
|
|
0.03
|
%
|
32,000
|
|
—
|
|
—
|
|
|||||||||
|
2018
|
—
|
|
—
|
|
—
|
|
—
|
|
1.75
|
%
|
32,000
|
|
|||||||||
|
2019
|
—
|
|
—
|
|
—
|
|
—
|
|
8.75
|
%
|
500,000
|
|
|||||||||
|
Years thereafter
|
—
|
|
—
|
|
0.27
|
%
|
48,825
|
|
4.90
|
%
|
1,940,150
|
|
|||||||||
|
Total
|
|
|
$
|
147,400
|
|
$
|
156,405
|
|
$
|
3,137,720
|
|
||||||||||
|
Fair value
|
|
|
$
|
147,400
|
|
|
|
$
|
156,405
|
|
|
|
$
|
3,557,703
|
|
||||||
|
|
Short-Term
Debt
|
Variable-Rate
Long-Term Debt
|
Fixed-Rate
Long-Term Debt
|
||||||||||||||||||
|
|
Interest
|
|
Interest
|
|
Interest
|
|
|||||||||||||||
|
2013
|
Rates
|
Amount
|
Rates
|
Amount
|
Rates
|
Amount
|
|||||||||||||||
|
2014
|
0.23
|
%
|
$
|
153,125
|
|
—
|
|
$
|
—
|
|
5.58
|
%
|
$
|
540,424
|
|
||||||
|
2015
|
—
|
|
—
|
|
0.03
|
%
|
32,000
|
|
4.79
|
%
|
313,420
|
|
|||||||||
|
2016
|
—
|
|
—
|
|
0.06
|
%
|
43,580
|
|
6.15
|
%
|
314,000
|
|
|||||||||
|
2017
|
—
|
|
—
|
|
—
|
|
—
|
|
—
|
|
—
|
|
|||||||||
|
2018
|
—
|
|
—
|
|
—
|
|
—
|
|
1.75
|
%
|
32,000
|
|
|||||||||
|
Years thereafter
|
—
|
|
—
|
|
—
|
|
—
|
|
6.12
|
%
|
1,940,150
|
|
|||||||||
|
Total
|
|
|
$
|
153,125
|
|
$
|
75,580
|
|
|
|
$
|
3,139,994
|
|
||||||||
|
Fair value
|
|
|
$
|
153,125
|
|
|
|
$
|
75,580
|
|
|
|
$
|
3,378,102
|
|
||||||
Commodity Price Risk
We are exposed to the impact of market fluctuations in the commodity price and transportation costs of electricity and natural gas. Our risk management committee, consisting of officers and key management personnel, oversees company-wide energy risk management activities to ensure compliance with our stated energy risk management policies. We manage risks associated with these market fluctuations by utilizing various commodity instruments that may qualify as derivatives, including futures, forwards, options and swaps. As part of our risk management program, we use such instruments to hedge purchases and sales of electricity and fuels. The changes in market value of such contracts have a high correlation to price changes in the hedged commodities.
69
The following table shows the net pretax changes in mark-to-market of our derivative positions in 2014 and 2013 (dollars in millions):
|
|
2014
|
2013
|
|||||
|
Mark-to-market of net positions at beginning of year
|
$
|
(73
|
)
|
$
|
(122
|
)
|
|
|
Recognized in earnings (a):
|
|
|
|
|
|||
|
Change in mark-to-market gains (losses) for future period deliveries
|
—
|
|
(1
|
)
|
|||
|
Decrease in regulatory asset/liability
|
(64
|
)
|
6
|
|
|||
|
Recognized in OCI:
|
|
|
|||||
|
Mark-to-market losses realized during the period
|
22
|
|
44
|
|
|||
|
Change in valuation techniques
|
—
|
|
—
|
|
|||
|
Mark-to-market of net positions at end of year
|
$
|
(115
|
)
|
$
|
(73
|
)
|
|
|
(a)
|
Represents the amounts reflected in income after the effect of PSA deferrals.
|
The table below shows the fair value of maturities of our derivative contracts (dollars in millions) at December 31, 2014 by maturities and by the type of valuation that is performed to calculate the fair values, classified in their entirety based on the lowest level of input that is significant to the fair value measurement. See Note 1, “Derivative Accounting” and “Fair Value Measurements,” for more discussion of our valuation methods.
|
Source of Fair Value
|
2015
|
2016
|
2017
|
2018
|
2019
|
Years
there-
after
|
Total
fair
value
|
|||||||||||||||||||||
|
Observable prices provided by other external sources
|
$
|
(40
|
)
|
$
|
(22
|
)
|
$
|
(11
|
)
|
$
|
(1
|
)
|
$
|
—
|
|
$
|
—
|
|
$
|
(74
|
)
|
|||||||
|
Prices based on unobservable inputs
|
(16
|
)
|
(11
|
)
|
(5
|
)
|
(4
|
)
|
(4
|
)
|
(1
|
)
|
(41
|
)
|
||||||||||||||
|
Total by maturity
|
$
|
(56
|
)
|
$
|
(33
|
)
|
$
|
(16
|
)
|
$
|
(5
|
)
|
$
|
(4
|
)
|
$
|
(1
|
)
|
$
|
(115
|
)
|
|||||||
70
The table below shows the impact that hypothetical price movements of 10% would have on the market value of our risk management assets and liabilities included on Pinnacle West’s Consolidated Balance Sheets at December 31, 2014 and 2013 (dollars in millions):
|
|
December 31, 2014
Gain (Loss)
|
December 31, 2013
Gain (Loss)
|
|||||||||||||
|
|
Price Up 10%
|
Price Down 10%
|
Price Up 10%
|
Price Down 10%
|
|||||||||||
|
Mark-to-market changes reported in:
|
|
|
|
|
|
|
|
|
|||||||
|
Regulatory asset (liability) or OCI (a)
|
|
|
|
|
|
|
|
|
|||||||
|
Electricity
|
3
|
|
(3
|
)
|
6
|
|
(6
|
)
|
|||||||
|
Natural gas
|
29
|
|
(29
|
)
|
26
|
|
(26
|
)
|
|||||||
|
Total
|
$
|
32
|
|
$
|
(32
|
)
|
$
|
32
|
|
$
|
(32
|
)
|
|||
|
(a)
|
These contracts are economic hedges of our forecasted purchases of natural gas and electricity. The impact of these hypothetical price movements would substantially offset the impact that these same price movements would have on the physical exposures being hedged. To the extent the amounts are eligible for inclusion in the PSA, the amounts are recorded as either a regulatory asset or liability.
|
Credit Risk
We are exposed to losses in the event of non-performance or non-payment by counterparties. See Note 16 for a discussion of our credit valuation adjustment policy.
DISCLOSURES ABOUT MARKET RISK
See “Market and Credit Risks” in Item 7 above for a discussion of quantitative and qualitative disclosures about market risks.
71
INDEX TO FINANCIAL STATEMENTS AND
FINANCIAL STATEMENT SCHEDULES
|
|
Page
|
|
|
|
|
|
|
|
|
|
|
Financial Statement Schedules for 2014, 2013 and 2012
|
|
See Note 12 and S-2 for the selected quarterly financial data (unaudited) required to be presented in this Item.
72
MANAGEMENT’S REPORT ON INTERNAL CONTROL
OVER FINANCIAL REPORTING
(PINNACLE WEST CAPITAL CORPORATION)
Our management is responsible for establishing and maintaining adequate internal control over financial reporting, as such term is defined in Exchange Act Rules 13a-15(f), for Pinnacle West. Management conducted an evaluation of the effectiveness of our internal control over financial reporting based on the framework in
Internal Control — Integrated Framework (2013)
issued by the Committee of Sponsoring Organizations of the Treadway Commission. Based on our evaluation under the framework in
Internal Control — Integrated Framework (2013),
our management concluded that our internal control over financial reporting was effective as of December 31, 2014. The effectiveness of our internal control over financial reporting as of December 31, 2014 has been audited by Deloitte & Touche LLP, an independent registered public accounting firm, as stated in their report which is included herein and also relates to the Company’s consolidated financial statements.
February 20, 2015
73
REPORT OF INDEPENDENT REGISTERED PUBLIC ACCOUNTING FIRM
To the Board of Directors and Stockholders of
Pinnacle West Capital Corporation
Phoenix, Arizona
We have audited the accompanying consolidated balance sheets of Pinnacle West Capital Corporation and subsidiaries (the “Company”) as of December 31, 2014 and 2013 and the related consolidated statements of income, comprehensive income, changes in equity, and cash flows for each of the three years in the period ended December 31, 2014. Our audits also included the financial statement schedules listed in the Index at Item 15. We also have audited the Company’s internal control over financial reporting as of December 31, 2014, based on criteria established in
Internal Control — Integrated Framework (2013)
issued by the Committee of Sponsoring Organizations of the Treadway Commission. The Company’s management is responsible for these financial statements and financial statement schedules, for maintaining effective internal control over financial reporting, and for its assessment of the effectiveness of internal control over financial reporting, included in the accompanying Management’s Report on Internal Control Over Financial Reporting. Our responsibility is to express an opinion on these financial statements and financial statement schedules and an opinion on the Company’s internal control over financial reporting based on our audits.
We conducted our audits in accordance with the standards of the Public Company Accounting Oversight Board (United States). Those standards require that we plan and perform the audit to obtain reasonable assurance about whether the financial statements are free of material misstatement and whether effective internal control over financial reporting was maintained in all material respects. Our audits of the financial statements included examining, on a test basis, evidence supporting the amounts and disclosures in the financial statements, assessing the accounting principles used and significant estimates made by management, and evaluating the overall financial statement presentation. Our audit of internal control over financial reporting included obtaining an understanding of internal control over financial reporting, assessing the risk that a material weakness exists, testing and evaluating the design and operating effectiveness of internal control based on the assessed risk. Our audits also included performing such other procedures as we considered necessary in the circumstances. We believe that our audits provide a reasonable basis for our opinions.
A company’s internal control over financial reporting is a process designed by, or under the supervision of, the company’s principal executive and principal financial officers, or persons performing similar functions, and effected by the company’s board of directors, management, and other personnel to provide reasonable assurance regarding the reliability of financial reporting and the preparation of financial statements for external purposes in accordance with generally accepted accounting principles. A company’s internal control over financial reporting includes those policies and procedures that (1) pertain to the maintenance of records that, in reasonable detail, accurately and fairly reflect the transactions and dispositions of the assets of the company; (2) provide reasonable assurance that transactions are recorded as necessary to permit preparation of financial statements in accordance with generally accepted accounting principles and that receipts and expenditures of the company are being made only in accordance with authorizations of management and directors of the company; and (3) provide reasonable assurance regarding prevention or timely detection of unauthorized acquisition, use, or disposition of the company’s assets that could have a material effect on the financial statements.
Because of the inherent limitations of internal control over financial reporting, including the possibility of collusion or improper management override of controls, material misstatements due to error or fraud may not be prevented or detected on a timely basis. Also, projections of any evaluation of the effectiveness of the internal control over financial reporting to future periods are subject to the risk that the controls may become
74
inadequate because of changes in conditions, or that the degree of compliance with the policies or procedures may deteriorate.
In our opinion, the consolidated financial statements referred to above present fairly, in all material respects, the financial position of Pinnacle West Capital Corporation and subsidiaries as of December 31, 2014 and 2013, and the results of their operations and their cash flows for each of the three years in the period ended December 31, 2014, in conformity with accounting principles generally accepted in the United States of America. Also, in our opinion, such financial statement schedules, when considered in relation to the basic consolidated financial statements taken as a whole, present fairly, in all material respects, the information set forth therein. Also, in our opinion, the Company maintained, in all material respects, effective internal control over financial reporting as of December 31, 2014, based on the criteria established in
Internal Control — Integrated Framework (2013)
issued by the Committee of Sponsoring Organizations of the Treadway Commission.
|
/s/ Deloitte & Touche LLP
|
|
|
|
|
|
Phoenix, Arizona
|
|
|
February 20, 2015
|
|
75
PINNACLE WEST CAPITAL CORPORATION
(dollars and shares in thousands, except per share amounts)
|
|
Year Ended December 31,
|
||||||||||
|
|
2014
|
2013
|
2012
|
||||||||
|
OPERATING REVENUES
|
$
|
3,491,632
|
|
$
|
3,454,628
|
|
$
|
3,301,804
|
|
||
|
OPERATING EXPENSES
|
|
|
|
|
|
|
|||||
|
Fuel and purchased power
|
1,179,829
|
|
1,095,709
|
|
994,790
|
|
|||||
|
Operations and maintenance
|
908,025
|
|
924,727
|
|
884,769
|
|
|||||
|
Depreciation and amortization
|
417,358
|
|
415,708
|
|
404,336
|
|
|||||
|
Taxes other than income taxes
|
172,295
|
|
164,167
|
|
159,323
|
|
|||||
|
Other expenses
|
2,883
|
|
7,994
|
|
6,831
|
|
|||||
|
Total
|
2,680,390
|
|
2,608,305
|
|
2,450,049
|
|
|||||
|
OPERATING INCOME
|
811,242
|
|
846,323
|
|
851,755
|
|
|||||
|
OTHER INCOME (DEDUCTIONS)
|
|
|
|
|
|
|
|||||
|
Allowance for equity funds used during construction (Note 1)
|
30,790
|
|
25,581
|
|
22,436
|
|
|||||
|
Other income (Note 17)
|
9,608
|
|
1,704
|
|
1,606
|
|
|||||
|
Other expense (Note 17)
|
(21,746
|
)
|
(16,024
|
)
|
(19,842
|
)
|
|||||
|
Total
|
18,652
|
|
11,261
|
|
4,200
|
|
|||||
|
INTEREST EXPENSE
|
|
|
|
|
|
|
|||||
|
Interest charges
|
200,950
|
|
201,888
|
|
214,616
|
|
|||||
|
Allowance for borrowed funds used during construction (Note 1)
|
(15,457
|
)
|
(14,861
|
)
|
(14,971
|
)
|
|||||
|
Total
|
185,493
|
|
187,027
|
|
199,645
|
|
|||||
|
INCOME FROM CONTINUING OPERATIONS BEFORE INCOME TAXES
|
644,401
|
|
670,557
|
|
656,310
|
|
|||||
|
INCOME TAXES (Note 4)
|
220,705
|
|
230,591
|
|
237,317
|
|
|||||
|
INCOME FROM CONTINUING OPERATIONS
|
423,696
|
|
439,966
|
|
418,993
|
|
|||||
|
LOSS FROM DISCONTINUED OPERATIONS
|
|
|
|
|
|
|
|||||
|
Net of income tax benefit of $(3,813) (Note 1)
|
—
|
|
—
|
|
(5,829
|
)
|
|||||
|
NET INCOME
|
423,696
|
|
439,966
|
|
413,164
|
|
|||||
|
Less: Net income attributable to noncontrolling interests (Note 18)
|
26,101
|
|
33,892
|
|
31,622
|
|
|||||
|
NET INCOME ATTRIBUTABLE TO COMMON SHAREHOLDERS
|
$
|
397,595
|
|
$
|
406,074
|
|
$
|
381,542
|
|
||
|
WEIGHTED-AVERAGE COMMON SHARES OUTSTANDING — BASIC
|
110,626
|
|
109,984
|
|
109,510
|
|
|||||
|
WEIGHTED-AVERAGE COMMON SHARES OUTSTANDING — DILUTED
|
111,178
|
|
110,806
|
|
110,527
|
|
|||||
|
EARNINGS PER WEIGHTED-AVERAGE COMMON SHARE OUTSTANDING
|
|
|
|
|
|
|
|||||
|
Income from continuing operations attributable to common shareholders — basic
|
$
|
3.59
|
|
$
|
3.69
|
|
$
|
3.54
|
|
||
|
Net income attributable to common shareholders — basic
|
3.59
|
|
3.69
|
|
3.48
|
|
|||||
|
Income from continuing operations attributable to common shareholders — diluted
|
3.58
|
|
3.66
|
|
3.50
|
|
|||||
|
Net income attributable to common shareholders — diluted
|
3.58
|
|
3.66
|
|
3.45
|
|
|||||
|
AMOUNTS ATTRIBUTABLE TO COMMON SHAREHOLDERS:
|
|
|
|
|
|
|
|||||
|
Income from continuing operations, net of tax
|
$
|
397,595
|
|
$
|
406,074
|
|
$
|
387,380
|
|
||
|
Discontinued operations, net of tax
|
—
|
|
—
|
|
(5,838
|
)
|
|||||
|
Net income attributable to common shareholders
|
$
|
397,595
|
|
$
|
406,074
|
|
$
|
381,542
|
|
||
See Notes to Pinnacle West’s Consolidated Financial Statements.
76
PINNACLE WEST CAPITAL CORPORATION
CONSOLIDATED STATEMENTS OF COMPREHENSIVE INCOME
(dollars in thousands)
|
|
Year Ended December 31,
|
||||||||||
|
|
2014
|
2013
|
2012
|
||||||||
|
NET INCOME
|
$
|
423,696
|
|
$
|
439,966
|
|
$
|
413,164
|
|
||
|
OTHER COMPREHENSIVE INCOME (LOSS), NET OF TAX
|
|
|
|
|
|
|
|||||
|
Derivative instruments:
|
|
|
|
|
|
|
|||||
|
Net unrealized loss, net of tax benefit (expense) of $(438), $140, and $14,900 (Note 16)
|
(810
|
)
|
(213
|
)
|
(22,763
|
)
|
|||||
|
Reclassification of net realized loss, net of tax benefit of $7,932, $17,472, and $39,120 (Note 16)
|
13,483
|
|
26,747
|
|
59,887
|
|
|||||
|
Pension and other postretirement benefits activity, net of tax (expense) benefit of $1,307, $(6,156), and $(651) (Note 7)
|
(2,761
|
)
|
9,421
|
|
1,031
|
|
|||||
|
Total other comprehensive income
|
9,912
|
|
35,955
|
|
38,155
|
|
|||||
|
COMPREHENSIVE INCOME
|
433,608
|
|
475,921
|
|
451,319
|
|
|||||
|
Less: Comprehensive income attributable to noncontrolling interests
|
26,101
|
|
33,892
|
|
31,622
|
|
|||||
|
COMPREHENSIVE INCOME ATTRIBUTABLE TO COMMON SHAREHOLDERS
|
$
|
407,507
|
|
$
|
442,029
|
|
$
|
419,697
|
|
||
See Notes to Pinnacle West’s Consolidated Financial Statements.
77
PINNACLE WEST CAPITAL CORPORATION
(dollars in thousands)
|
|
December 31,
|
||||||
|
|
2014
|
2013
|
|||||
|
ASSETS
|
|
|
|
|
|||
|
CURRENT ASSETS
|
|
|
|
|
|||
|
Cash and cash equivalents
|
$
|
7,604
|
|
$
|
9,526
|
|
|
|
Customer and other receivables
|
297,740
|
|
299,904
|
|
|||
|
Accrued unbilled revenues
|
100,533
|
|
96,796
|
|
|||
|
Allowance for doubtful accounts
|
(3,094
|
)
|
(3,203
|
)
|
|||
|
Materials and supplies (at average cost)
|
218,889
|
|
221,682
|
|
|||
|
Fossil fuel (at average cost)
|
37,097
|
|
38,028
|
|
|||
|
Deferred income taxes (Note 4)
|
122,232
|
|
91,152
|
|
|||
|
Income tax receivable (Note 4)
|
3,098
|
|
135,517
|
|
|||
|
Assets from risk management activities (Note 16)
|
13,785
|
|
17,169
|
|
|||
|
Deferred fuel and purchased power regulatory asset (Note 3)
|
6,926
|
|
20,755
|
|
|||
|
Other regulatory assets (Note 3)
|
129,808
|
|
76,388
|
|
|||
|
Other current assets
|
38,817
|
|
39,895
|
|
|||
|
Total current assets
|
973,435
|
|
1,043,609
|
|
|||
|
INVESTMENTS AND OTHER ASSETS
|
|
|
|
|
|||
|
Assets from risk management activities (Note 16)
|
17,620
|
|
23,815
|
|
|||
|
Nuclear decommissioning trust (Notes 13 and 19)
|
713,866
|
|
642,007
|
|
|||
|
Other assets
|
54,047
|
|
60,875
|
|
|||
|
Total investments and other assets
|
785,533
|
|
726,697
|
|
|||
|
PROPERTY, PLANT AND EQUIPMENT (Notes 1, 6 and 9)
|
|
|
|
|
|||
|
Plant in service and held for future use
|
15,543,063
|
|
15,200,464
|
|
|||
|
Accumulated depreciation and amortization
|
(5,397,751
|
)
|
(5,300,219
|
)
|
|||
|
Net
|
10,145,312
|
|
9,900,245
|
|
|||
|
Construction work in progress
|
682,807
|
|
581,369
|
|
|||
|
Palo Verde sale leaseback, net of accumulated depreciation of $229,795 and $225,925 (Note 18)
|
121,255
|
|
125,125
|
|
|||
|
Intangible assets, net of accumulated amortization of $489,538 and $439,703
|
119,755
|
|
157,689
|
|
|||
|
Nuclear fuel, net of accumulated amortization of $143,554 and $146,057
|
125,201
|
|
124,557
|
|
|||
|
Total property, plant and equipment
|
11,194,330
|
|
10,888,985
|
|
|||
|
DEFERRED DEBITS
|
|
|
|
|
|||
|
Regulatory assets (Notes 1, 3 and 4)
|
1,054,087
|
|
711,712
|
|
|||
|
Assets for other postretirement benefits (Note 7)
|
152,290
|
|
—
|
|
|||
|
Other
|
153,857
|
|
137,683
|
|
|||
|
Total deferred debits
|
1,360,234
|
|
849,395
|
|
|||
|
TOTAL ASSETS
|
$
|
14,313,532
|
|
$
|
13,508,686
|
|
|
See Notes to Pinnacle West’s Consolidated Financial Statements.
78
PINNACLE WEST CAPITAL CORPORATION
CONSOLIDATED BALANCE SHEETS
(dollars in thousands)
|
|
December 31,
|
||||||
|
|
2014
|
2013
|
|||||
|
LIABILITIES AND EQUITY
|
|
|
|
|
|||
|
CURRENT LIABILITIES
|
|
|
|
|
|||
|
Accounts payable
|
$
|
295,211
|
|
$
|
284,516
|
|
|
|
Accrued taxes (Note 4)
|
140,613
|
|
130,998
|
|
|||
|
Accrued interest
|
52,603
|
|
48,351
|
|
|||
|
Common dividends payable
|
65,790
|
|
62,528
|
|
|||
|
Short-term borrowings (Note 5)
|
147,400
|
|
153,125
|
|
|||
|
Current maturities of long-term debt (Note 6)
|
383,570
|
|
540,424
|
|
|||
|
Customer deposits
|
72,307
|
|
76,101
|
|
|||
|
Liabilities from risk management activities (Note 16)
|
59,676
|
|
31,892
|
|
|||
|
Liability for asset retirements (Note 11)
|
32,462
|
|
32,896
|
|
|||
|
Regulatory liabilities (Note 3)
|
130,549
|
|
99,273
|
|
|||
|
Other current liabilities
|
178,962
|
|
158,540
|
|
|||
|
Total current liabilities
|
1,559,143
|
|
1,618,644
|
|
|||
|
LONG-TERM DEBT LESS CURRENT MATURITIES (Note 6)
|
3,031,215
|
|
2,796,465
|
|
|||
|
DEFERRED CREDITS AND OTHER
|
|
|
|
|
|||
|
Deferred income taxes (Note 4)
|
2,582,636
|
|
2,351,882
|
|
|||
|
Regulatory liabilities (Notes 1, 3, 4 and 7)
|
1,051,196
|
|
801,297
|
|
|||
|
Liability for asset retirements (Note 11)
|
358,288
|
|
313,833
|
|
|||
|
Liabilities for pension and other postretirement benefits (Note 7)
|
453,736
|
|
513,628
|
|
|||
|
Liabilities from risk management activities (Note 16)
|
50,602
|
|
70,315
|
|
|||
|
Customer advances
|
123,052
|
|
114,480
|
|
|||
|
Coal mine reclamation
|
198,292
|
|
207,453
|
|
|||
|
Deferred investment tax credit
|
178,607
|
|
152,361
|
|
|||
|
Unrecognized tax benefits (Note 4)
|
19,377
|
|
42,209
|
|
|||
|
Other
|
188,286
|
|
185,659
|
|
|||
|
Total deferred credits and other
|
5,204,072
|
|
4,753,117
|
|
|||
|
COMMITMENTS AND CONTINGENCIES (SEE NOTES)
|
|
|
|
|
|||
|
EQUITY
|
|
|
|
|
|||
|
Common stock, no par value; authorized 150,000,000 shares, issued 110,649,762 at end of 2014 and 110,280,703 at end of 2013
|
2,512,970
|
|
2,491,558
|
|
|||
|
Treasury stock at cost; 78,400 shares at end of 2014 and 98,944 shares at end of 2013
|
(3,401
|
)
|
(4,308
|
)
|
|||
|
Total common stock
|
2,509,569
|
|
2,487,250
|
|
|||
|
Retained earnings
|
1,926,065
|
|
1,785,273
|
|
|||
|
Accumulated other comprehensive loss:
|
|
|
|
|
|||
|
Pension and other postretirement benefits (Note 7)
|
(57,756
|
)
|
(54,995
|
)
|
|||
|
Derivative instruments (Note 16)
|
(10,385
|
)
|
(23,058
|
)
|
|||
|
Total accumulated other comprehensive loss
|
(68,141
|
)
|
(78,053
|
)
|
|||
|
Total shareholders’ equity
|
4,367,493
|
|
4,194,470
|
|
|||
|
Noncontrolling interests (Note 18)
|
151,609
|
|
145,990
|
|
|||
|
Total equity
|
4,519,102
|
|
4,340,460
|
|
|||
|
TOTAL LIABILITIES AND EQUITY
|
$
|
14,313,532
|
|
$
|
13,508,686
|
|
|
See Notes to Pinnacle West’s Consolidated Financial Statements.
79
PINNACLE WEST CAPITAL CORPORATION
(dollars in thousands)
|
|
Year Ended December 31,
|
||||||||||
|
|
2014
|
2013
|
2012
|
||||||||
|
CASH FLOWS FROM OPERATING ACTIVITIES
|
|
|
|
|
|
|
|||||
|
Net Income
|
$
|
423,696
|
|
$
|
439,966
|
|
$
|
413,164
|
|
||
|
Adjustments to reconcile net income to net cash provided by operating activities:
|
|
|
|
|
|
|
|||||
|
Depreciation and amortization including nuclear fuel
|
496,487
|
|
492,322
|
|
481,262
|
|
|||||
|
Deferred fuel and purchased power
|
(26,927
|
)
|
21,678
|
|
71,573
|
|
|||||
|
Deferred fuel and purchased power amortization
|
40,757
|
|
31,190
|
|
(116,716
|
)
|
|||||
|
Allowance for equity funds used during construction
|
(30,790
|
)
|
(25,581
|
)
|
(22,436
|
)
|
|||||
|
Deferred income taxes
|
159,023
|
|
249,296
|
|
187,023
|
|
|||||
|
Deferred investment tax credit
|
26,246
|
|
52,542
|
|
41,579
|
|
|||||
|
Change in derivative instruments fair value
|
339
|
|
534
|
|
(749
|
)
|
|||||
|
Changes in current assets and liabilities:
|
|
|
|
|
|
|
|||||
|
Customer and other receivables
|
(52,672
|
)
|
(44,991
|
)
|
14,587
|
|
|||||
|
Accrued unbilled revenues
|
(3,737
|
)
|
(1,951
|
)
|
30,394
|
|
|||||
|
Materials, supplies and fossil fuel
|
3,724
|
|
(11,878
|
)
|
(23,043
|
)
|
|||||
|
Income tax receivable
|
132,419
|
|
(133,094
|
)
|
(4,043
|
)
|
|||||
|
Other current assets
|
4,384
|
|
(17,913
|
)
|
(27,352
|
)
|
|||||
|
Accounts payable
|
(353
|
)
|
45,414
|
|
(96,600
|
)
|
|||||
|
Accrued taxes
|
9,615
|
|
6,059
|
|
12,736
|
|
|||||
|
Other current liabilities
|
17,892
|
|
(7,513
|
)
|
23,869
|
|
|||||
|
Change in margin and collateral accounts — assets
|
(343
|
)
|
993
|
|
2,216
|
|
|||||
|
Change in margin and collateral accounts — liabilities
|
(24,975
|
)
|
12,355
|
|
137,785
|
|
|||||
|
Change in long-term income tax receivable
|
—
|
|
137,270
|
|
(1,756
|
)
|
|||||
|
Change in unrecognized tax benefits
|
2,778
|
|
(91,425
|
)
|
(2,583
|
)
|
|||||
|
Change in long-term regulatory liabilities
|
59,618
|
|
64,473
|
|
13,539
|
|
|||||
|
Change in other long-term assets
|
(59,344
|
)
|
(41,757
|
)
|
6,872
|
|
|||||
|
Change in other long-term liabilities
|
(78,210
|
)
|
(24,682
|
)
|
29,801
|
|
|||||
|
Net cash flow provided by operating activities
|
1,099,627
|
|
1,153,307
|
|
1,171,122
|
|
|||||
|
CASH FLOWS FROM INVESTING ACTIVITIES
|
|
|
|
|
|
|
|||||
|
Capital expenditures
|
(910,634
|
)
|
(1,016,322
|
)
|
(889,551
|
)
|
|||||
|
Contributions in aid of construction
|
20,325
|
|
41,090
|
|
49,876
|
|
|||||
|
Allowance for borrowed funds used during construction
|
(15,457
|
)
|
(14,861
|
)
|
(14,971
|
)
|
|||||
|
Proceeds from nuclear decommissioning trust sales
|
356,195
|
|
446,025
|
|
417,603
|
|
|||||
|
Investment in nuclear decommissioning trust
|
(373,444
|
)
|
(463,274
|
)
|
(434,852
|
)
|
|||||
|
Other
|
347
|
|
(2,059
|
)
|
(1,099
|
)
|
|||||
|
Net cash flow used for investing activities
|
(922,668
|
)
|
(1,009,401
|
)
|
(872,994
|
)
|
|||||
|
CASH FLOWS FROM FINANCING ACTIVITIES
|
|
|
|
|
|
|
|||||
|
Issuance of long-term debt
|
731,126
|
|
136,307
|
|
476,081
|
|
|||||
|
Repayment of long-term debt
|
(652,578
|
)
|
(122,828
|
)
|
(654,286
|
)
|
|||||
|
Short-term borrowings and payments — net
|
(5,725
|
)
|
60,950
|
|
92,175
|
|
|||||
|
Dividends paid on common stock
|
(246,671
|
)
|
(235,244
|
)
|
(225,075
|
)
|
|||||
|
Common stock equity issuance
|
15,288
|
|
17,319
|
|
15,955
|
|
|||||
|
Distributions to noncontrolling interests
|
(20,482
|
)
|
(17,385
|
)
|
(10,529
|
)
|
|||||
|
Other
|
161
|
|
299
|
|
170
|
|
|||||
|
Net cash flow used for financing activities
|
(178,881
|
)
|
(160,582
|
)
|
(305,509
|
)
|
|||||
|
NET DECREASE IN CASH AND CASH EQUIVALENTS
|
(1,922
|
)
|
(16,676
|
)
|
(7,381
|
)
|
|||||
|
CASH AND CASH EQUIVALENTS AT BEGINNING OF YEAR
|
9,526
|
|
26,202
|
|
33,583
|
|
|||||
|
CASH AND CASH EQUIVALENTS AT END OF YEAR
|
$
|
7,604
|
|
$
|
9,526
|
|
$
|
26,202
|
|
||
See Notes to Pinnacle West’s Consolidated Financial Statements.
80
PINNACLE WEST CAPITAL CORPORATION
CONSOLIDATED STATEMENTS OF CHANGES IN EQUITY
(dollars in thousands, except per share amounts)
|
Common Stock
|
Treasury Stock
|
Retained Earnings
|
Accumulated Other Comprehensive Income (Loss)
|
Noncontrolling Interests
|
Total
|
||||||||||||||||||||||||
|
Shares
|
Amount
|
Shares
|
Amount
|
||||||||||||||||||||||||||
|
Balance, December 31, 2011
|
109,356,974
|
|
$
|
2,444,247
|
|
(111,161
|
)
|
$
|
(4,717
|
)
|
$
|
1,534,483
|
|
$
|
(152,163
|
)
|
$
|
108,736
|
|
$
|
3,930,586
|
|
|||||||
|
Net income
|
381,542
|
|
31,622
|
|
413,164
|
|
|||||||||||||||||||||||
|
Other comprehensive income
|
38,155
|
|
38,155
|
|
|||||||||||||||||||||||||
|
Dividends on common stock ($2.67 per share)
|
(291,923
|
)
|
(291,923
|
)
|
|||||||||||||||||||||||||
|
Issuance of common stock
|
480,983
|
|
22,676
|
|
22,676
|
|
|||||||||||||||||||||||
|
Purchase of treasury stock (a)
|
(89,629
|
)
|
(4,607
|
)
|
(4,607
|
)
|
|||||||||||||||||||||||
|
Stock-based compensation and other
|
105,598
|
|
5,113
|
|
5,113
|
|
|||||||||||||||||||||||
|
Net capital activities by noncontrolling interests
|
(10,875
|
)
|
(10,875
|
)
|
|||||||||||||||||||||||||
|
Balance, December 31, 2012
|
109,837,957
|
|
2,466,923
|
|
(95,192
|
)
|
(4,211
|
)
|
1,624,102
|
|
(114,008
|
)
|
129,483
|
|
4,102,289
|
|
|||||||||||||
|
Net income
|
406,074
|
|
33,892
|
|
439,966
|
|
|||||||||||||||||||||||
|
Other comprehensive income
|
35,955
|
|
35,955
|
|
|||||||||||||||||||||||||
|
Dividends on common stock ($2.23 per share)
|
(244,903
|
)
|
(244,903
|
)
|
|||||||||||||||||||||||||
|
Issuance of common stock
|
442,746
|
|
24,635
|
|
24,635
|
|
|||||||||||||||||||||||
|
Purchase of treasury stock (a)
|
(174,290
|
)
|
(9,727
|
)
|
(9,727
|
)
|
|||||||||||||||||||||||
|
Stock-based compensation and other
|
170,538
|
|
9,630
|
|
9,630
|
|
|||||||||||||||||||||||
|
Net capital activities by noncontrolling interests
|
(17,385
|
)
|
(17,385
|
)
|
|||||||||||||||||||||||||
|
Balance, December 31, 2013
|
110,280,703
|
|
2,491,558
|
|
(98,944
|
)
|
(4,308
|
)
|
1,785,273
|
|
(78,053
|
)
|
145,990
|
|
4,340,460
|
|
|||||||||||||
|
Net income
|
397,595
|
|
26,101
|
|
423,696
|
|
|||||||||||||||||||||||
|
Other comprehensive income
|
9,912
|
|
9,912
|
|
|||||||||||||||||||||||||
|
Dividends on common stock ($2.33 per share)
|
(256,803
|
)
|
(256,803
|
)
|
|||||||||||||||||||||||||
|
Issuance of common stock
|
369,059
|
|
21,412
|
|
21,412
|
|
|||||||||||||||||||||||
|
Purchase of treasury stock (a)
|
(139,746
|
)
|
(7,893
|
)
|
(7,893
|
)
|
|||||||||||||||||||||||
|
Stock-based compensation and other
|
160,290
|
|
8,800
|
|
8,800
|
|
|||||||||||||||||||||||
|
Net capital activities by noncontrolling interests
|
(20,482
|
)
|
(20,482
|
)
|
|||||||||||||||||||||||||
|
Balance, December 31, 2014
|
110,649,762
|
|
$
|
2,512,970
|
|
(78,400
|
)
|
|
$
|
(3,401
|
)
|
$
|
1,926,065
|
|
$
|
(68,141
|
)
|
$
|
151,609
|
|
$
|
4,519,102
|
|
||||||
(a) Primarily represents shares of common stock withheld from certain stock awards for tax purposes.
See Notes to Pinnacle West’s Consolidated Financial Statements.
81
PINNACLE WEST CAPITAL CORPORATION
NOTES TO CONSOLIDATED FINANCIAL STATEMENTS
1.
Summary of Significant Accounting Policies
Description of Business and Basis of Presentation
Pinnacle West is a holding company that conducts business through its subsidiaries, APS, El Dorado, BCE, and formerly SunCor. APS, our wholly-owned subsidiary, is a vertically-integrated electric utility that provides either retail or wholesale electric service to substantially all of the state of Arizona, with the major exceptions of about one-half of the Phoenix metropolitan area, the Tucson metropolitan area and Mohave County in northwestern Arizona. APS accounts for essentially all of our revenues and earnings, and is expected to continue to do so. El Dorado is an investment firm. BCE is a new subsidiary formed in 2014 that focuses on growth opportunities that leverage the Company's core expertise in the electric energy industry. BCE is currently pursuing transmission opportunities through a joint venture arrangement. SunCor was a developer of residential, commercial and industrial real estate projects and essentially all of these assets were sold in 2009 and 2010. In February 2012, SunCor filed for protection under the United States Bankruptcy Code to complete an orderly liquidation of its business. All activities for SunCor are reported as discontinued operations.
Pinnacle West’s Consolidated Financial Statements include the accounts of Pinnacle West and our subsidiaries: APS, El Dorado, BCE, and formerly SunCor. APS’s consolidated financial statements include the accounts of APS and certain VIEs relating to the Palo Verde sale leaseback. Intercompany accounts and transactions between the consolidated companies have been eliminated.
We consolidate VIEs for which we are the primary beneficiary. We determine whether we are the primary beneficiary of a VIE through a qualitative analysis that identifies which variable interest holder has the controlling financial interest in the VIE. In performing our primary beneficiary analysis, we consider all relevant facts and circumstances, including the design and activities of the VIE, the terms of the contracts the VIE has entered into, and which parties participated significantly in the design or redesign of the entity. We continually evaluate our primary beneficiary conclusions to determine if changes have occurred which would impact our primary beneficiary assessments. We have determined that APS is the primary beneficiary of certain VIE lessor trusts relating to the Palo Verde sale leaseback, and therefore APS consolidates these entities (see Note 18).
Our consolidated financial statements reflect all adjustments (consisting only of normal recurring adjustments, except as otherwise disclosed in the notes) that we believe are necessary for the fair presentation of our financial position, results of operations and cash flows for the periods presented.
Accounting Records and Use of Estimates
Our accounting records are maintained in accordance with GAAP. The preparation of financial statements in accordance with GAAP requires management to make estimates and assumptions that affect the reported amounts of assets and liabilities, disclosure of contingent assets and liabilities at the date of the financial statements and reported amounts of revenues and expenses during the reporting period. Actual results could differ from those estimates.
82
Regulatory Accounting
APS is regulated by the ACC and FERC. The accompanying financial statements reflect the rate-making policies of these commissions. As a result, we capitalize certain costs that would be included as expense in the current period by unregulated companies. Regulatory assets represent incurred costs that have been deferred because they are probable of future recovery in customer rates. Regulatory liabilities generally represent expected future costs that have already been collected from customers.
Management continually assesses whether our regulatory assets are probable of future recovery by considering factors such as changes in the applicable regulatory environment and recent rate orders applicable to APS or other regulated entities in the same jurisdiction. This determination reflects the current political and regulatory climate in Arizona and is subject to change in the future. If future recovery of costs ceases to be probable, the assets would be written off as a charge in current period earnings.
See Note 3 for additional information.
Electric Revenues
We derive electric revenues primarily from sales of electricity to our regulated Native Load customers. Revenues related to the sale of electricity are generally recorded when service is rendered or electricity is delivered to customers. The billing of electricity sales to individual Native Load customers is based on the reading of their meters, which occurs on a systematic basis throughout the month. Unbilled revenues are estimated by applying an average revenue/kWh by customer class to the number of estimated kWhs delivered but not billed. Differences historically between the actual and estimated unbilled revenues are immaterial. We exclude sales taxes and franchise fees on electric revenues from both revenue and taxes other than income taxes.
Revenues from our Native Load customers and non-derivative instruments are reported on a gross basis on Pinnacle West’s Consolidated Statements of Income. In the electricity business, some contracts to purchase energy are netted against other contracts to sell energy. This is called a “book-out” and usually occurs for contracts that have the same terms (quantities and delivery points) and for which power does not flow. We net these book-outs, which reduces both revenues and fuel and purchased power costs.
For the period January 1, 2010 through June 30, 2012, electric revenues also include proceeds for line extension payments for new or upgraded service in accordance with the 2009 Settlement Agreement (see Note 3). Effective July 1, 2012, as a result of the 2012 Settlement Agreement, these amounts are now recorded as contributions in aid of construction and are not included in electric revenues.
Some of our cost recovery mechanisms are alternative revenue programs. For alternative revenue programs that meet specified accounting criteria, we recognize revenues when the specific events permitting billing of the additional revenues have been completed.
Allowance for Doubtful Accounts
The allowance for doubtful accounts represents our best estimate of existing accounts receivable that will ultimately be uncollectible. The allowance is calculated by applying estimated write-off factors to various classes of outstanding receivables, including accrued utility revenues. The write-off factors used to estimate uncollectible accounts are based upon consideration of both historical collections experience and management’s best estimate of future collections success given the existing collections environment.
83
Property, Plant and Equipment
Utility plant is the term we use to describe the business property and equipment that supports electric service, consisting primarily of generation, transmission and distribution facilities. We report utility plant at its original cost, which includes:
|
•
|
material and labor;
|
|
•
|
contractor costs;
|
|
•
|
capitalized leases;
|
|
•
|
construction overhead costs (where applicable); and
|
|
•
|
allowance for funds used during construction.
|
We expense the costs of plant outages, major maintenance and routine maintenance as incurred. We charge retired utility plant to accumulated depreciation. Liabilities associated with the retirement of tangible long-lived assets are recognized at fair value as incurred and capitalized as part of the related tangible long-lived assets. Accretion of the liability due to the passage of time is an operating expense, and the capitalized cost is depreciated over the useful life of the long-lived asset. See Note 11.
APS records a regulatory liability for the difference between the amount that has been recovered in regulated rates and the amount calculated in accordance with guidance on accounting for asset retirement obligations. APS believes it can recover in regulated rates the costs calculated in accordance with this accounting guidance.
We record depreciation on utility plant on a straight-line basis over the remaining useful life of the related assets. The approximate remaining average useful lives of our utility property at
December 31, 2014
were as follows:
•
Fossil plant —
19
years;
•
Nuclear plant —
28
years;
•
Other generation —
25
years;
•
Transmission —
38
years;
•
Distribution —
33
years; and
•
Other —
7
years.
Pursuant to an ACC order, we deferred operating costs in 2013 and 2014 related to APS’s acquisition of additional interests in Units 4 and 5 and the related closure of Units 1-3 of Four Corners. See Note 3 for further discussion. These costs were deferred and will be amortized on the depreciation line of the Consolidated Statements of Income.
For the years 2012 through 2014, the depreciation rates ranged from a low of
0.30%
to a high of
12.08%
. The weighted-average rate was
2.77%
for 2014,
3.00%
for 2013, and
2.71%
for 2012.
Allowance for Funds Used During Construction
AFUDC represents the approximate net composite interest cost of borrowed funds and an allowed return on the equity funds used for construction of regulated utility plant. Both the debt and equity components of AFUDC are non-cash amounts within the Consolidated Statements of Income. Plant
84
construction costs, including AFUDC, are recovered in authorized rates through depreciation when completed projects are placed into commercial operation.
AFUDC was calculated by using a composite rate of
8.47%
for 2014,
8.56%
for 2013, and
8.60%
for 2012. APS compounds AFUDC semi-annually and ceases to accrue AFUDC when construction work is completed and the property is placed in service.
Materials and Supplies
APS values materials, supplies and fossil fuel inventory using a weighted-average cost method. APS materials, supplies and fossil fuel inventories are carried at the lower of weighted-average cost or market, unless evidence indicates that the weighted-average cost (even if in excess of market) will be recovered.
Fair Value Measurements
We account for derivative instruments, investments held in our nuclear decommissioning trust, certain cash equivalents and plan assets held in our retirement and other benefit plans at fair value on a recurring basis. Due to the short-term nature of net accounts receivable, accounts payable, and short-term borrowings, the carrying values of these instruments approximate fair value. Fair value measurements may also be applied on a nonrecurring basis to other assets and liabilities in certain circumstances such as impairments. We also disclose fair value information for our long-term debt, which is carried at amortized cost (see Note 6).
Fair value is the price that would be received for an asset or paid to transfer a liability (exit price) in the principal or most advantageous market which we can access for the asset or liability in an orderly transaction between willing market participants on the measurement date. Inputs to fair value may include observable and unobservable data. We maximize the use of observable inputs and minimize the use of unobservable inputs when measuring fair value.
We determine fair market value using observable inputs such as actively-quoted prices for identical instruments when available. When actively quoted prices are not available for the identical instruments, we use other observable inputs, such as prices for similar instruments, other corroborative market information, or prices provided by other external sources. For options, long-term contracts and other contracts for which observable price data are not available, we use models and other valuation methods, which may incorporate unobservable inputs to determine fair market value.
The use of models and other valuation methods to determine fair market value often requires subjective and complex judgment. Actual results could differ from the results estimated through application of these methods.
See Note 13 for additional information about fair value measurements.
Derivative Accounting
We are exposed to the impact of market fluctuations in the commodity price and transportation costs of electricity, natural gas, coal and in interest rates. We manage risks associated with market volatility by utilizing various physical and financial instruments including futures, forwards, options and swaps. As part of our overall risk management program, we may use derivative instruments to hedge purchases and sales of electricity and fuels. The changes in market value of such contracts have a high correlation to price changes in the hedged transactions. We also enter into derivative instruments for economic hedging purposes. Contracts
85
that have the same terms (quantities, delivery points and delivery periods) and for which power does not flow are netted, which reduces both revenues and fuel and purchased power expenses in our Consolidated Statements of Income, but does not impact our financial condition, net income or cash flows.
We account for our derivative contracts in accordance with derivatives and hedging guidance, which requires all derivatives not qualifying for a scope exception to be measured at fair value on the balance sheet as either assets or liabilities. Transactions with counterparties that have master netting arrangements are reported net on the balance sheet. See Note 16 for additional information about our derivative instruments.
Loss Contingencies and Environmental Liabilities
Pinnacle West and APS are involved in certain legal and environmental matters that arise in the normal course of business. Contingent losses and environmental liabilities are recorded when it is determined that it is probable that a loss has occurred and the amount of the loss can be reasonably estimated. When a range of the probable loss exists and no amount within the range is a better estimate than any other amount, Pinnacle West and APS record a loss contingency at the minimum amount in the range. Unless otherwise required by GAAP, legal fees are expensed as incurred.
Retirement Plans and Other Benefits
Pinnacle West sponsors a qualified defined benefit and account balance pension plan for the employees of Pinnacle West and its subsidiaries. We also sponsor an other postretirement benefit plan for the employees of Pinnacle West and its subsidiaries that provides medical and life insurance benefits to retired employees. Pension and other postretirement benefit expense are determined by actuarial valuations, based on assumptions that are evaluated annually. See Note 7 for additional information on pension and other postretirement benefits.
Nuclear Fuel
APS amortizes nuclear fuel by using the unit-of-production method. The unit-of-production method is based on actual physical usage. APS divides the cost of the fuel by the estimated number of thermal units it expects to produce with that fuel. APS then multiplies that rate by the number of thermal units produced within the current period. This calculation determines the current period nuclear fuel expense.
APS also charges nuclear fuel expense for the interim storage and permanent disposal of spent nuclear fuel. The DOE is responsible for the permanent disposal of spent nuclear fuel and charged APS
$0.001
per kWh of nuclear generation through August 2014, at which point the DOE suspended the fee. In accordance with a settlement agreement with the DOE in August 2014, we will now accrue a receivable for incurred claims and an offsetting regulatory liability through the settlement period ending December of 2016. See Note 10 for information on spent nuclear fuel disposal costs.
Income Taxes
Income taxes are provided using the asset and liability approach prescribed by guidance relating to accounting for income taxes. We file our federal income tax return on a consolidated basis, and we file our state income tax returns on a consolidated or unitary basis. In accordance with our intercompany tax sharing agreement, federal and state income taxes are allocated to each first-tier subsidiary as though each first-tier subsidiary filed a separate income tax return. Any difference between that method and the consolidated (and unitary) income tax liability is attributed to the parent company. The income tax accounts reflect the tax and
86
interest associated with management’s estimate of the largest amount of tax benefit that is greater than
50%
likely of being realized upon settlement for all known and measurable tax exposures (see Note 4).
Cash and Cash Equivalents
We consider all highly liquid investments with a remaining maturity of three months or less at acquisition to be cash equivalents.
The following table summarizes supplemental Pinnacle West cash flow information for each of the last three years (dollars in thousands):
|
|
Year ended December 31,
|
||||||||||
|
|
2014
|
2013
|
2012
|
||||||||
|
Cash paid (received) during the period for:
|
|
|
|
|
|
|
|||||
|
Income taxes, net of refunds
|
$
|
(102,154
|
)
|
$
|
18,537
|
|
$
|
2,543
|
|
||
|
Interest, net of amounts capitalized
|
177,074
|
|
184,010
|
|
200,923
|
|
|||||
|
Significant non-cash investing and financing activities:
|
|
|
|
|
|
|
|||||
|
Accrued capital expenditures
|
$
|
44,712
|
|
$
|
33,184
|
|
$
|
26,208
|
|
||
|
Dividends declared but not paid
|
65,790
|
|
62,528
|
|
59,789
|
|
|||||
|
Liabilities assumed relating to acquisition of SCE Four Corners’ interest (see Note 3)
|
—
|
|
145,609
|
|
—
|
|
|||||
Intangible Assets
We have no goodwill recorded and have separately disclosed other intangible assets, primarily APS’s software, on Pinnacle West’s Consolidated Balance Sheets. The intangible assets are amortized over their finite useful lives. Amortization expense was
$53 million
in
2014
,
$53 million
in
2013
, and
$50 million
in
2012
. Estimated amortization expense on existing intangible assets over the next five years is
$42 million
in 2015,
$32 million
in 2016,
$21 million
in 2017,
$9 million
in 2018, and
$3 million
in 2019. At
December 31, 2014
, the weighted-average remaining amortization period for intangible assets was
6
years.
Investments
El Dorado accounts for its investments using either the equity method (if significant influence) or the cost method (if less than
20%
ownership and no significant influence).
Our investments in the nuclear decommissioning trust fund are accounted for in accordance with guidance on accounting for certain investments in debt and equity securities. See Note 13 and Note 19 for more information on these investments.
Business Segments
Pinnacle West’s reportable business segment is our regulated electricity segment, which consists of traditional regulated retail and wholesale electricity businesses (primarily electricity service to Native Load customers) and related activities and includes electricity generation, transmission and distribution. All other segment activities are insignificant.
87
Preferred Stock
At
December 31, 2014
, Pinnacle West had
10 million
shares of serial preferred stock authorized with no par value, none of which was outstanding, and APS had
15,535,000
shares of various types of preferred stock authorized with
$25
,
$50
and
$100
par values, none of which was outstanding.
2.
New Accounting Standards
During
2014
, we adopted, on a prospective basis, new guidance relating to the presentation of unrecognized tax benefits. This guidance generally requires entities to present unrecognized tax benefits as a reduction to any available deferred tax asset for a net operating loss, a similar tax loss, or a tax credit carryforward. Prior to adopting this guidance, we presented unrecognized tax benefits on a gross basis. The adoption of this new guidance changed our balance sheet presentation of unrecognized tax benefits, but did not impact our operating results or cash flows. See Note 4 for details regarding the impacts of adopting this guidance.
In May 2014, new revenue recognition guidance was issued. This guidance provides a single comprehensive model for entities to use in accounting for revenue arising from contracts with customers and supersedes most current revenue recognition guidance, including industry-specific guidance. The new guidance is effective for us on January 1, 2017, and may be adopted using full retrospective application or a simplified transition method that allows entities to record a cumulative effect adjustment in retained earnings at the date of initial application. We are currently evaluating this new guidance and the impacts it may have on our financial statements.
3.
Regulatory Matters
Retail Rate Case Filing with the Arizona Corporation Commission
On June 1, 2011, APS filed an application with the ACC for a net retail base rate increase of
$95.5 million
. APS requested that the increase become effective July 1, 2012. The request would have increased the average retail customer bill by approximately
6.6%
. On January 6, 2012, APS and other parties to the general retail rate case entered into the 2012 Settlement Agreement detailing the terms upon which the parties agreed to settle the rate case. On May 15, 2012, the ACC approved the 2012 Settlement Agreement without material modifications.
Settlement Agreement
The 2012 Settlement Agreement provides for a
zero
net change in base rates, consisting of: (1) a non-fuel base rate increase of
$116.3 million
; (2) a fuel-related base rate decrease of
$153.1 million
(to be implemented by a change in the Base Fuel Rate from
$0.03757
to
$0.03207
per kWh); and (3) the transfer of cost recovery for certain renewable energy projects from the RES surcharge to base rates in an estimated amount of
$36.8 million
.
APS also agreed not to file its next general rate case before May 31, 2015, and not to request that its next general retail rate increase be effective prior to July 1, 2016. The 2012 Settlement Agreement allows APS to request a change to its base rates during the stay-out period in the event of an extraordinary event that, in the ACC’s judgment, requires base rate relief in order to protect the public interest. Nor is APS precluded from seeking rate relief, or any other party to the 2012 Settlement Agreement precluded from petitioning the ACC to
88
examine the reasonableness of APS’s rates, in the event of significant regulatory developments that materially impact the financial results expected under the terms of the 2012 Settlement Agreement.
Other key provisions of the 2012 Settlement Agreement include the following:
•
An authorized return on common equity of
10.0%
;
•
A capital structure comprised of
46.1%
debt and
53.9%
common equity;
|
•
|
A test year ended December 31, 2010, adjusted to include plant that is in service as of March 31, 2012;
|
|
•
|
Deferral for future recovery or refund of property taxes above or below a specified 2010 test year level caused by changes to the Arizona property tax rate as follows:
|
|
•
|
Deferral of increases in property taxes of
25%
in 2012,
50%
in 2013 and
75%
for 2014 and subsequent years if Arizona property tax rates increase; and
|
•
Deferral of
100%
in all years if Arizona property tax rates decrease;
|
•
|
A procedure to allow APS to request rate adjustments prior to its next general rate case related to APS’s acquisition of additional interests in Units 4 and 5 and the related closure of Units 1-3 of Four Corners (APS made its filing under this provision on December 30, 2013, see "Four Corners" below);
|
|
•
|
Implementation of a “Lost Fixed Cost Recovery” rate mechanism to support energy efficiency and distributed renewable generation;
|
|
•
|
Modifications to the Environmental Improvement Surcharge to allow for the recovery of carrying costs for capital expenditures associated with government-mandated environmental controls, subject to an existing cents per kWh cap on cost recovery that could produce up to approximately
$5 million
in revenues annually;
|
•
Modifications to the PSA, including the elimination of the
9
0/10 sharing provision;
|
•
|
A limitation on the use of the RES surcharge and the DSMAC to recoup capital expenditures not required under the terms of the 2009 Settlement Agreement discussed below;
|
|
•
|
Allowing a negative credit that existed in the PSA rate to continue until February 2013, rather than being reset on the anticipated July 1, 2012 rate effective date;
|
|
•
|
Modification of the TCA to streamline the process for future transmission-related rate changes; and
|
|
•
|
Implementation of various changes to rate schedules, including the adoption of an experimental “buy-through” rate that could allow certain large commercial and industrial customers to select alternative sources of generation to be supplied by APS.
|
The 2012 Settlement Agreement was approved by the ACC on May 15, 2012, with new rates effective on July 1, 2012. This accomplished a goal set by the parties to the 2009 Settlement Agreement to process subsequent rate cases within
twelve
months of sufficiency findings from the ACC staff, which generally occurs within
30
days after the filing of a rate case.
89
Cost Recovery Mechanisms
APS has received regulatory decisions that allow for more timely recovery of certain costs through the following recovery mechanisms.
Renewable Energy Standard
.
In 2006, the ACC approved the RES. Under the RES, electric utilities that are regulated by the ACC must supply an increasing percentage of their retail electric energy sales from eligible renewable resources, including solar, wind, biomass, biogas and geothermal technologies. In order to achieve these requirements, the ACC allows APS to include a RES surcharge as part of customer bills to recover the approved amounts for use on renewable energy projects. Each year APS is required to file a
five
-year implementation plan with the ACC and seek approval for funding the upcoming year’s RES budget.
On July 12, 2013, APS filed its annual RES implementation plan, covering the 2014-2018 timeframe and requesting a 2014 RES budget of approximately
$143 million
. In a final order dated January 7, 2014, the ACC approved the requested budget. Also in 2013, the ACC conducted a hearing to consider APS’s proposal to establish compliance with distributed energy requirements by tracking and recording distributed energy, rather than acquiring and retiring renewable energy credits. On February 6, 2014, the ACC established a proceeding to modify the renewable energy rules to establish a process for compliance with the renewable energy requirement that is not based solely on the use of renewable energy credits. On September 9, 2014, the ACC authorized a rulemaking process to modify the RES rules. The proposed changes would permit the ACC to find that utilities have complied with the distributed energy requirement in light of all available information. The ACC adopted these changes on December 18, 2014. The revised rules are expected to become effective in the second quarter of 2015.
In accordance with the ACC’s decision on the 2014 RES plan, on April 15, 2014, APS filed an application with the ACC requesting permission to build an additional
20
MW of APS-owned utility scale solar under the AZ Sun Program. In a subsequent filing, APS also offered an alternative proposal to replace the 20 MW of utility scale solar with 10 MW (approximately 1,500 customers) of APS-owned residential solar that will not be under the AZ Sun Program. On December 19, 2014, the ACC voted that it had no objection to APS implementing its residential rooftop solar program. The first stage of the residential rooftop solar program is to be 8 MW followed by a 2 MW second stage that will only be deployed if coupled with distributed storage. The program will target specific distribution feeders in an effort to maximize potential system benefits, as well as make systems available to limited-income customers who cannot easily install solar through transactions with third parties. The ACC expressly reserved that any determination of prudency of the residential rooftop solar program for rate making purposes shall not be made until the project is fully in service and APS requests cost recovery in a future rate case.
On July 1, 2014, APS filed its 2015 RES implementation plan and proposed a RES budget of approximately
$154 million
. On December 31, 2014, the ACC issued a decision approving the 2015 RES implementation plan with minor modifications, including reducing the budget to approximately
$152 million
.
Demand Side Management Adjustor Charge
.
The ACC Electric Energy Efficiency Standards require APS to submit a DSM Plan for review by and approval of the ACC.
On June 1, 2012, APS filed its 2013 DSM Plan. In 2013, the standards required APS to achieve cumulative energy savings equal to
5%
of its 2012 retail energy sales. Later in 2012, APS filed a supplement to its plan that included a proposed budget for 2013 of
$87.6 million
.
90
On March 11, 2014, the ACC issued an order approving APS’s 2013 DSM Plan. The ACC approved a budget of
$68.9 million
for each of 2013 and 2014. The ACC also approved a Resource Savings Initiative that allows APS to count towards compliance with the ACC Electric Energy Efficiency Standards, savings for improvements to APS’s transmission and delivery system, generation and facilities that have been approved through a DSM Plan. Consistent with the ACC’s March 11, 2014 order, APS intends to continue its approved DSM programs in 2015.
On June 27, 2013, the ACC voted to open a new docket investigating whether the Electric Energy Efficiency Rules should be modified. The ACC held a series of three workshops in March and April 2014 to investigate methodologies used to determine cost effective energy efficiency programs, cost recovery mechanisms, incentives, and potential changes to the Electric Energy Efficiency and Resource Planning Rules.
On November 4, 2014, the ACC staff issued a request for informal comment on a draft of possible amendments to Arizona’s Electric Utility Energy Efficiency Standards. The draft proposed substantial changes to the rules and energy efficiency standards. The ACC accepted written comments and took public comment regarding the possible amendments on December 19, 2014. A formal rule making has not been initiated and there has been no additional action on the draft to date.
PSA Mechanism and Balance.
The PSA provides for the adjustment of retail rates to reflect variations in retail fuel and purchased power costs. The PSA is subject to specified parameters and procedures, including the following:
|
•
|
APS records deferrals for recovery or refund to the extent actual retail fuel and purchased power costs vary from the Base Fuel Rate;
|
|
•
|
an adjustment to the PSA rate is made annually each February 1 (unless otherwise approved by the ACC) and goes into effect automatically unless suspended by the ACC;
|
|
•
|
the PSA uses a forward-looking estimate of fuel and purchased power costs to set the annual PSA rate, which is reconciled to actual costs experienced for each PSA Year (February 1 through January 31) (see the following bullet point);
|
|
•
|
the PSA rate includes (a) a “Forward Component,” under which APS recovers or refunds differences between expected fuel and purchased power costs for the upcoming calendar year and those embedded in the Base Fuel Rate; (b) a “Historical Component,” under which differences between actual fuel and purchased power costs and those recovered through the combination of the Base Fuel Rate and the Forward Component are recovered during the next PSA Year; and (c) a “Transition Component,” under which APS may seek mid-year PSA changes due to large variances between actual fuel and purchased power costs and the combination of the Base Fuel Rate and the Forward Component; and
|
|
•
|
the PSA rate may not be increased or decreased more than
$0.004
per kWh in a year without permission of the ACC.
|
91
The following table shows the changes in the deferred fuel and purchased power regulatory asset for
2014
and
2013
(dollars in millions):
|
|
Year Ended December 31,
|
||||||
|
|
2014
|
2013
|
|||||
|
Beginning balance
|
$
|
21
|
|
$
|
73
|
|
|
|
Deferred fuel and purchased power costs - current period
|
27
|
|
(21
|
)
|
|||
|
Amounts charged to customers
|
(41
|
)
|
(31
|
)
|
|||
|
Ending balance
|
$
|
7
|
|
$
|
21
|
|
|
The PSA rate for the PSA year beginning February 1, 2015 is
$0.000887
per kWh, as compared to
$0.001557
per kWh for the prior year. This new rate is comprised of a forward component of
$0.001131
per kWh and a historical component of
$(0.000244)
per kWh. Any uncollected (overcollected) deferrals during the 2015 PSA year will be included in the calculation of the PSA rate for the PSA year beginning February 1, 2016.
Transmission Rates, Transmission Cost Adjustor and Other Transmission Matters
.
In July 2008, FERC approved an Open Access Transmission Tariff for APS to move from fixed rates to a formula rate-setting methodology in order to more accurately reflect and recover the costs that APS incurs in providing transmission services. A large portion of the rate represents charges for transmission services to serve APS’s retail customers (“Retail Transmission Charges”). In order to recover the Retail Transmission Charges, APS was previously required to file an application with, and obtain approval from, the ACC to reflect changes in Retail Transmission Charges through the TCA. Under the terms of the 2012 Settlement Agreement, however, an adjustment to rates to recover the Retail Transmission Charges will be made annually each June 1 and will go into effect automatically unless suspended by the ACC.
The formula rate is updated each year effective June 1 on the basis of APS’s actual cost of service, as disclosed in APS’s FERC Form 1 report for the previous fiscal year. Items to be updated include actual capital expenditures made as compared with previous projections, transmission revenue credits and other items. The resolution of proposed adjustments can result in significant volatility in the revenues to be collected. APS reviews the proposed formula rate filing amounts with the ACC staff. Any items or adjustments which are not agreed to by APS and the ACC staff can remain in dispute until settled or litigated at FERC. Settlement or litigated resolution of disputed issues could require an extended period of time and could have a significant effect on the Retail Transmission Charge because any adjustment, though applied prospectively, may be calculated to account for previously over- or under-collected amounts.
Effective June 1, 2014, APS’s annual wholesale transmission rates for all users of its transmission system increased by approximately
$5.9 million
for the twelve-month period beginning June 1, 2014 in accordance with the FERC-approved formula. An adjustment to APS’s retail rates to recover FERC-approved transmission charges went into effect automatically on June 1, 2014.
Lost Fixed Cost Recovery Mechanism
.
The LFCR mechanism permits APS to recover on an after-the-fact basis a portion of its fixed costs that would otherwise have been collected by APS in the kWh sales lost due to APS energy efficiency programs and to distributed generation such as rooftop solar arrays. The fixed costs recoverable by the LFCR mechanism were established in the 2012 Settlement Agreement and amount to approximately
3.1 cents
per residential kWh lost and
2.3 cents
per non-residential kWh lost. The LFCR adjustment has a year-over-year cap of
1%
of retail revenues. Any amounts left unrecovered in a particular year because of this cap can be carried over for recovery in a future year. The kWh’s lost from energy efficiency are based on a third-party evaluation of APS’s energy efficiency programs. Distributed generation
92
sales losses are determined from the metered output from the distributed generation units or if metering is unavailable, through accepted estimating techniques.
APS filed its first LFCR adjustment on January 15, 2013 and will file for a LFCR adjustment every January thereafter. On February 12, 2013, the ACC approved a LFCR adjustment of
$5.1 million
, representing a pro-rated amount for 2012 since the 2012 Settlement Agreement went into effect on July 1, 2012. APS filed its 2014 annual LFCR adjustment on January 15, 2014, requesting a LFCR adjustment of
$25.3 million
, effective March 1, 2014. The ACC approved APS’s LFCR adjustment without change on March 11, 2014, which became effective April 1, 2014. APS filed its 2015 annual LFCR adjustment on January 15, 2015, requesting an LFCR adjustment of
$38.5 million
effective March 1, 2015.
Deregulation
On May 9, 2013, the ACC voted to re-examine the facilitation of a deregulated retail electric market in Arizona. The ACC subsequently opened a docket for this matter and received comments from a number of interested parties on the considerations involved in establishing retail electric deregulation in the state. One of these considerations is whether various aspects of a deregulated market, including setting utility rates on a “market” basis, would be consistent with the requirements of the Arizona Constitution. On September 11, 2013, after receiving legal advice from the ACC staff, the ACC voted
4
-1 to close the current docket and await full Arizona Constitutional authority before any further examination of this matter. The motion approved by the ACC also included opening one or more new dockets in the future to explore options to offer more rate choices to customers and innovative changes within the existing cost-of-service regulatory model that could include elements of competition. The ACC opened a new docket on November 4, 2013 to explore technological advances and innovative changes within the electric utility industry. A series of workshops in this docket were held in 2014 and another is currently scheduled for February 26, 2015.
Net Metering
On July 12, 2013, APS filed an application with the ACC proposing a solution to address the cost shift brought by the current net metering rules. On December 3, 2013, the ACC issued its order on APS’s net metering proposal. The ACC instituted a charge on customers who install rooftop solar panels after
December 31, 2013
, and directed APS to provide quarterly reports on the pace of rooftop solar adoption to assist the ACC in considering further increases. The charge of
$0.70
per kilowatt became effective on January 1, 2014, and is estimated to collect
$4.90
per month from a typical future rooftop solar customer to help pay for their use of the electricity grid.
In making its decision, the ACC determined that the current net metering program creates a cost shift, causing non-solar utility customers to pay higher rates to cover the costs of maintaining the electrical grid. ACC staff and the state’s Residential Utility Consumer Office, among other organizations, also agreed that a cost shift exists. The fixed charge does not increase APS’s revenue because it is credited to the LFCR, but it will modestly reduce the impact of the cost shift on non-solar customers. The ACC acknowledged that the new charge addresses only a portion of the cost shift. The ACC also required APS to file its next rate case in June 2015, the earliest date contemplated in the 2012 Settlement Agreement.
In May 2014, the ACC began conducting a series of workshops to, among other things, evaluate the role and value of the electric grid as it relates to rooftop solar and other issues regarding net metering.
On July 22, 2014, the ACC Commissioners voted to reopen the December 2013 net metering decision for the limited purpose of deciding whether to eliminate the requirement that APS file its next rate case in June
93
2015. The vote included a request that parties comment in the docket about their thoughts on removing the filing date requirement and on the process for the broader discussion regarding rate design. On August 12, 2014, the ACC Commissioners voted to lift the requirement that APS file its next general rate case by June 2015. On September 29, 2014, the staff of the ACC filed in a new docket a proposal for permitting a utility to request ACC approval of its proposed rate design outside of and before a general rate case. On October 20, 2014, APS and other interested stakeholders filed comments to this proposal. No further action has been taken in this docket.
Four Corners
On December 30, 2013, APS purchased SCE’s
48%
ownership interest in each of Units 4 and 5 of Four Corners. The 2012 Settlement Agreement includes a procedure to allow APS to request rate adjustments prior to its next general rate case related to APS’s acquisition of the additional interests in Units 4 and 5 and the related closure of Units 1-3 of Four Corners. APS made its filing under this provision on December 30, 2013. On December 23, 2014, the ACC approved rate adjustments resulting in a revenue increase of
$57.1 million
on an annual basis. This includes the deferral for future recovery of all non-fuel operating costs for the acquired SCE interest in Four Corners, net of the non-fuel operating costs savings resulting from the closure of Units 1-3 from the date of closing of the purchase through its inclusion in rates. The 2012 Settlement Agreement also provides for deferral for future recovery of all unrecovered costs incurred in connection with the closure of Units 1-3. The deferral balance related to the acquisition of SCE’s interest in Units 4 and 5 and the closure of Units 1-3 was
$77 million
as of December 31, 2014 and is being amortized in rates over
10
years.
As part of APS’s acquisition of SCE’s interest in Units 4 and 5, APS and SCE agreed, via a “Transmission Termination Agreement” that, upon closing of the acquisition, the companies would terminate an existing transmission agreement (“Transmission Agreement”) between the parties that provides transmission capacity on a system (the “Arizona Transmission System”) for SCE to transmit its portion of the output from Four Corners to California. APS previously submitted a request to FERC related to this termination, which resulted in a FERC order denying rate recovery of
$40 million
that APS agreed to pay SCE associated with the termination. APS and SCE negotiated an alternate arrangement under which SCE would assign its
1,555
MW capacity rights over the Arizona Transmission System to third-parties, including
300
MW to APS’s marketing and trading group. However, this alternative arrangement was not approved by FERC. In late March 2014, APS and SCE filed requests for rehearing with FERC. Both requests for rehearing were denied on August 14, 2014. Although APS and SCE continue to evaluate potential paths forward, it is possible that the terms of the Transmission Termination Agreement may again control. As we previously disclosed, APS believes that the original denial by FERC of rate recovery under the Transmission Termination Agreement constitutes the failure of a condition that relieves APS of its obligations under that agreement. If APS and SCE were unable to determine a resolution through negotiation, the Transmission Termination Agreement requires that disputes be resolved through arbitration. APS is unable to predict the outcome of this matter if it proceeds to arbitration. If the matter proceeds to arbitration and APS is not successful, APS may be required to record a charge to its results of operations.
Cholla
After considering the costs to comply with environmental regulations, on September 11, 2014, APS announced that it will close Cholla Unit 2 by April 2016 and cease burning coal at the other APS-owned units (Units 1 and 3) at the plant by the mid-2020s, if EPA approves a compromise proposal offered by APS to meet required environmental and emissions standards and rules. Previously, APS estimated Cholla Unit 2’s end of life to be 2033. APS is currently recovering depreciation and a return on the net book value of the unit in base rates and plans to seek recovery of all of the unit’s retirement-related costs in its next retail rate case.
94
If APS closes Cholla Unit 2, APS believes it will be allowed recovery of the remaining net book value of Unit 2 (
$128 million
as of December 31, 2014), in addition to a return on its investment. In accordance with GAAP, in the third quarter of 2014, Unit 2’s remaining net book value was reclassified from property, plant and equipment to a regulatory asset. If the ACC does not allow full recovery of the remaining net book value of Cholla Unit 2, all or a portion of the regulatory asset will be written off and APS’s net income, cash flows, and financial position will be negatively impacted.
Regulatory Assets and Liabilities
The detail of regulatory assets is as follows (dollars in millions):
|
|
Remaining
Amortization
|
December 31, 2014
|
December 31, 2013
|
||||||||||||||
|
|
Period
|
Current
|
Non-Current
|
Current
|
Non-Current
|
||||||||||||
|
Pension and other postretirement benefits
|
(a)
|
$
|
—
|
|
$
|
485
|
|
$
|
—
|
|
$
|
314
|
|
||||
|
Income taxes — AFUDC equity
|
2044
|
5
|
|
118
|
|
4
|
|
105
|
|
||||||||
|
Deferred fuel and purchased power — mark-to-market (Note 16)
|
2017
|
51
|
|
46
|
|
5
|
|
29
|
|
||||||||
|
Transmission vegetation management
|
2016
|
9
|
|
5
|
|
9
|
|
14
|
|
||||||||
|
Coal reclamation
|
2026
|
—
|
|
7
|
|
8
|
|
18
|
|
||||||||
|
Palo Verde VIEs (Note 18)
|
2046
|
—
|
|
35
|
|
—
|
|
41
|
|
||||||||
|
Deferred compensation
|
2036
|
—
|
|
34
|
|
—
|
|
34
|
|
||||||||
|
Deferred fuel and purchased power (b) (c)
|
2015
|
7
|
|
—
|
|
21
|
|
—
|
|
||||||||
|
Tax expense of Medicare subsidy
|
2024
|
2
|
|
14
|
|
2
|
|
15
|
|
||||||||
|
Loss on reacquired debt
|
2034
|
1
|
|
16
|
|
1
|
|
17
|
|
||||||||
|
Income taxes — investment tax credit basis adjustment
|
2044
|
2
|
|
46
|
|
1
|
|
39
|
|
||||||||
|
Pension and other postretirement benefits deferral
|
2015
|
4
|
|
—
|
|
8
|
|
4
|
|
||||||||
|
Four Corners cost deferral
|
2024
|
7
|
|
70
|
|
—
|
|
37
|
|
||||||||
|
Lost fixed cost recovery
|
2015
|
38
|
|
—
|
|
25
|
|
—
|
|
||||||||
|
Transmission cost adjustor
|
2014
|
—
|
|
—
|
|
8
|
|
2
|
|
||||||||
|
Retired power plant costs
|
2033
|
10
|
|
136
|
|
3
|
|
18
|
|
||||||||
|
Deferred property taxes
|
(d)
|
—
|
|
30
|
|
—
|
|
11
|
|
||||||||
|
Other
|
Various
|
2
|
|
12
|
|
2
|
|
14
|
|
||||||||
|
Total regulatory assets (e)
|
|
$
|
138
|
|
$
|
1,054
|
|
$
|
97
|
|
$
|
712
|
|
||||
|
(a)
|
This asset represents the future recovery of pension and other postretirement benefit obligations through retail rates. If these costs are disallowed by the ACC, this regulatory asset would be charged to OCI and result in lower future revenues. See Note 7 for further discussion.
|
|
(b)
|
See “Cost Recovery Mechanisms” discussion above.
|
|
(c)
|
Subject to a carrying charge.
|
|
(d)
|
Per the provision of the 2012 Settlement Agreement.
|
|
(e)
|
There are no regulatory assets for which the ACC has allowed recovery of costs, but not allowed a return by exclusion from rate base. FERC rates are set using a formula rate as described in “Transmission Rates, Transmission Cost Adjustor and Other Transmission Matters.”
|
95
The detail of regulatory liabilities is as follows (dollars in millions):
|
|
Remaining
Amortization
|
December 31, 2014
|
December 31, 2013
|
||||||||||||||
|
|
Period
|
Current
|
Non-Current
|
Current
|
Non-Current
|
||||||||||||
|
Removal costs
|
(a)
|
$
|
31
|
|
$
|
273
|
|
$
|
28
|
|
$
|
303
|
|
||||
|
Asset retirement obligations
|
2044
|
—
|
|
296
|
|
—
|
|
266
|
|
||||||||
|
Renewable energy standard (b)
|
2017
|
25
|
|
23
|
|
33
|
|
15
|
|
||||||||
|
Income taxes — change in rates
|
2043
|
—
|
|
72
|
|
—
|
|
74
|
|
||||||||
|
Spent nuclear fuel
|
2047
|
5
|
|
66
|
|
6
|
|
36
|
|
||||||||
|
Deferred gains on utility property
|
2019
|
2
|
|
8
|
|
2
|
|
10
|
|
||||||||
|
Income taxes — deferred investment tax credit
|
2043
|
4
|
|
93
|
|
3
|
|
79
|
|
||||||||
|
Demand side management (b)
|
2015
|
31
|
|
—
|
|
27
|
|
—
|
|
||||||||
|
Other postretirement benefits
|
(c)
|
32
|
|
199
|
|
—
|
|
—
|
|
||||||||
|
Other
|
Various
|
1
|
|
21
|
|
—
|
|
18
|
|
||||||||
|
Total regulatory liabilities
|
|
$
|
131
|
|
$
|
1,051
|
|
$
|
99
|
|
$
|
801
|
|
||||
|
(a)
|
In accordance with regulatory accounting guidance, APS accrues for removal costs for its regulated assets, even if there is no legal obligation for removal (see Note 11).
|
|
(b)
|
See “Cost Recovery Mechanisms” discussion above.
|
|
(c)
|
See Note 7.
|
4. Income Taxes
Certain assets and liabilities are reported differently for income tax purposes than they are for financial statement purposes. The tax effect of these differences is recorded as deferred taxes. We calculate deferred taxes using currently enacted income tax rates.
APS has recorded regulatory assets and regulatory liabilities related to income taxes on its Balance Sheets in accordance with accounting guidance for regulated operations. The regulatory assets are for certain temporary differences, primarily the allowance for equity funds used during construction and pension and other postretirement benefits. The regulatory liabilities primarily relate to deferred taxes resulting from investment tax credits (“ITC”) and the change in income tax rates.
In accordance with regulatory requirements, APS ITCs are deferred and are amortized over the life of the related property with such amortization applied as a credit to reduce current income tax expense in the statement of income.
During the year ended December 31, 2013, IRS guidance was released which provided clarification regarding an APS tax accounting method change approved by the IRS in the third quarter of 2009. As a result of this guidance, uncertain tax positions decreased
$67
million. Additionally, the IRS finalized the examination of tax returns for the years ended December 31, 2008 and 2009, which further
reduced uncertain tax positions by approximately
$41
million. These reductions in uncertain tax positions were materially offset by an increase in deferred tax liabilities.
Included in the current income tax receivable on the Consolidated Balance Sheets as of December 31, 2013 was
$133 million
that represented an anticipated IRS refund related to the finalized examinations of tax years ended December 31, 2008 and 2009. Cash related to this refund was received in the first quarter of 2014.
96
On September 13, 2013, the U.S. Treasury Department released final income tax regulations on the deduction and capitalization of expenditures related to tangible property. These final regulations apply to tax years beginning on or after January 1, 2014. Several of the provisions within the regulations require a tax accounting method change to be filed with the IRS prior to September 15, 2015, resulting in a tax-effected cumulative effect adjustment of approximately
$82 million
. The anticipated impact of these final regulations has been accounted for in the Consolidated Balance Sheets as of December 31, 2013 and 2014.
Net income associated with the Palo Verde sale leaseback VIEs is not subject to tax (see Note 18). As a result, there is
no
income tax expense associated with the VIEs recorded on the Consolidated Statements of Income.
The following is a tabular reconciliation of the total amounts of unrecognized tax benefits, excluding interest and penalties, at the beginning and end of the year that are included in accrued taxes and unrecognized tax benefits (dollars in thousands):
|
|
2014
|
2013
|
2012
|
||||||||
|
Total unrecognized tax benefits, January 1
|
$
|
41,997
|
|
$
|
133,422
|
|
$
|
136,005
|
|
||
|
Additions for tax positions of the current year
|
4,309
|
|
3,516
|
|
5,167
|
|
|||||
|
Additions for tax positions of prior years
|
751
|
|
13,158
|
|
—
|
|
|||||
|
Reductions for tax positions of prior years for:
|
|
|
|
|
|
|
|||||
|
Changes in judgment
|
(2,282
|
)
|
(108,099
|
)
|
(7,729
|
)
|
|||||
|
Settlements with taxing authorities
|
—
|
|
—
|
|
—
|
|
|||||
|
Lapses of applicable statute of limitations
|
—
|
|
—
|
|
(21
|
)
|
|||||
|
Total unrecognized tax benefits, December 31
|
$
|
44,775
|
|
$
|
41,997
|
|
$
|
133,422
|
|
||
Included in the balances of unrecognized tax benefits at
December 31, 2014
,
2013
and
2012
were approximately
$11 million
,
$10 million
and
$10 million
, respectively, of tax positions that, if recognized, would decrease our effective tax rate.
As of the balance sheet date, the tax year ended December 31, 2011 and all subsequent tax years remain subject to examination by the IRS. With a few exceptions, we are no longer subject to state income tax examinations by tax authorities for years before 2008.
In January 2014, we prospectively adopted guidance requiring unrecognized tax benefits to be presented as a reduction to any available deferred income tax asset for a net operating loss, a similar tax loss, or a tax credit carryforward. As a result of this guidance,
$26 million
of unrecognized tax benefits were recorded as a reduction to net current deferred income tax assets on the Consolidated Balance Sheets as of December 31, 2014.
We reflect interest and penalties, if any, on unrecognized tax benefits in the Consolidated Statements of Income as income tax expense. The amount of interest recognized in the Consolidated Statements of Income related to unrecognized tax benefits was a pre-tax expense of
$1 million
for
2014
, a pre-tax benefit of
$4 million
for
2013
, and a pre-tax expense of
$4 million
for
2012
.
The total amount of accrued liabilities for interest recognized in the Consolidated Balance Sheets related to unrecognized tax benefits was less than
$1 million
as of
December 31, 2014
and
December 31, 2013
and
$13 million
as of
December 31, 2012
. To the extent that matters are settled favorably, this amount could reverse and decrease our effective tax rate. Additionally, as of
December 31, 2014
, we have recognized less
97
than
$1 million
of interest expense to be paid on the underpayment of income taxes for certain adjustments that we have filed, or will file, with the IRS.
The components of income tax expense are as follows (dollars in thousands):
|
|
Year Ended December 31,
|
||||||||||
|
|
2014
|
2013
|
2012
|
||||||||
|
Current:
|
|
|
|
|
|
|
|||||
|
Federal
|
$
|
25,054
|
|
$
|
(81,784
|
)
|
$
|
(3,493
|
)
|
||
|
State
|
10,382
|
|
10,537
|
|
8,395
|
|
|||||
|
Total current
|
35,436
|
|
(71,247
|
)
|
4,902
|
|
|||||
|
Deferred:
|
|
|
|
|
|
|
|||||
|
Federal
|
167,365
|
|
279,973
|
|
200,322
|
|
|||||
|
State
|
17,904
|
|
21,865
|
|
28,280
|
|
|||||
|
Total deferred
|
185,269
|
|
301,838
|
|
228,602
|
|
|||||
|
Total income tax expense
|
220,705
|
|
230,591
|
|
233,504
|
|
|||||
|
Less: income tax benefit on discontinued operations
|
—
|
|
—
|
|
(3,813
|
)
|
|||||
|
Income tax expense — continuing operations
|
$
|
220,705
|
|
$
|
230,591
|
|
$
|
237,317
|
|
||
The following chart compares pretax income from continuing operations at the
35%
federal income tax rate to income tax expense — continuing operations (dollars in thousands):
|
|
Year Ended December 31,
|
||||||||||
|
|
2014
|
2013
|
2012
|
||||||||
|
Federal income tax expense at 35% statutory rate
|
$
|
225,540
|
|
$
|
234,695
|
|
$
|
229,709
|
|
||
|
Increases (reductions) in tax expense resulting from:
|
|
|
|
|
|
|
|||||
|
State income tax net of federal income tax benefit
|
18,149
|
|
21,387
|
|
23,819
|
|
|||||
|
Credits and favorable adjustments related to prior years resolved in current year
|
—
|
|
(3,356
|
)
|
—
|
|
|||||
|
Medicare Subsidy Part-D
|
830
|
|
823
|
|
483
|
|
|||||
|
Allowance for equity funds used during construction (see Note 1)
|
(8,523
|
)
|
(6,997
|
)
|
(6,158
|
)
|
|||||
|
Palo Verde VIE noncontrolling interest (see Note 18)
|
(9,135
|
)
|
(11,862
|
)
|
(11,065
|
)
|
|||||
|
Investment tax credit amortization
|
(4,928
|
)
|
(3,548
|
)
|
(2,030
|
)
|
|||||
|
Other
|
(1,228
|
)
|
(551
|
)
|
2,559
|
|
|||||
|
Income tax expense — continuing operations
|
$
|
220,705
|
|
$
|
230,591
|
|
$
|
237,317
|
|
||
The following table shows the net deferred income tax liability recognized on the Consolidated Balance Sheets (dollars in thousands):
|
|
December 31,
|
||||||
|
|
2014
|
2013
|
|||||
|
Current asset
|
$
|
122,232
|
|
$
|
91,152
|
|
|
|
Long-term liability
|
(2,582,636
|
)
|
(2,351,882
|
)
|
|||
|
Deferred income taxes — net
|
$
|
(2,460,404
|
)
|
$
|
(2,260,730
|
)
|
|
On February 17, 2011, Arizona enacted legislation (H.B. 2001) that included a
four
-year phase-in of corporate income tax rate reductions beginning in 2014. As a result of these tax rate reductions, Pinnacle West has revised the tax rate applicable to reversing temporary items in Arizona. In accordance with accounting for
98
regulated companies, the benefit of this rate reduction is substantially offset by a regulatory liability. As of
December 31, 2014
, APS has recorded a regulatory liability of
$74 million
, with a corresponding decrease in accumulated deferred income tax liabilities, to reflect the impact of this change in tax law.
On April 4, 2013, New Mexico enacted legislation (H.B. 641) that included a
five
-year phase-in of corporate income tax rate reductions beginning in 2014. As a result of these tax rate reductions, Pinnacle West has revised the tax rate applicable to reversing temporary items in New Mexico. In accordance with accounting for regulated companies, the benefit of this rate reduction is substantially offset by a regulatory liability. As of
December 31, 2014
, APS has recorded a regulatory liability of
$2 million
, with a corresponding decrease in accumulated deferred income tax liabilities, to reflect the impact of this change in tax law.
The components of the net deferred income tax liability were as follows (dollars in thousands):
|
|
December 31,
|
||||||
|
|
2014
|
2013
|
|||||
|
DEFERRED TAX ASSETS
|
|
|
|
|
|||
|
Risk management activities
|
$
|
57,505
|
|
$
|
44,920
|
|
|
|
Regulatory liabilities:
|
|
|
|
|
|||
|
Asset retirement obligation and removal costs
|
229,772
|
|
235,959
|
|
|||
|
Unamortized investment tax credits
|
96,232
|
|
82,116
|
|
|||
|
Other postretirement benefits
|
90,496
|
|
—
|
|
|||
|
Other
|
60,409
|
|
42,609
|
|
|||
|
Pension liabilities
|
205,227
|
|
140,773
|
|
|||
|
Other postretirement liabilities
|
—
|
|
57,869
|
|
|||
|
Renewable energy incentives
|
65,169
|
|
65,434
|
|
|||
|
Credit and loss carryforwards
|
68,347
|
|
133,070
|
|
|||
|
Other
|
138,729
|
|
148,492
|
|
|||
|
Total deferred tax assets
|
1,011,886
|
|
951,242
|
|
|||
|
DEFERRED TAX LIABILITIES
|
|
|
|
|
|||
|
Plant-related
|
(2,958,369
|
)
|
(2,903,730
|
)
|
|||
|
Risk management activities
|
(12,171
|
)
|
(16,191
|
)
|
|||
|
Other postretirement assets
|
(59,170
|
)
|
—
|
|
|||
|
Regulatory assets:
|
|
|
|
|
|||
|
Allowance for equity funds used during construction
|
(48,286
|
)
|
(43,058
|
)
|
|||
|
Deferred fuel and purchased power
|
(2,498
|
)
|
(8,282
|
)
|
|||
|
Deferred fuel and purchased power — mark-to-market
|
(38,187
|
)
|
(13,343
|
)
|
|||
|
Pension and other postretirement benefits
|
(191,747
|
)
|
(129,250
|
)
|
|||
|
Retired power plant costs (see Note 3)
|
(57,255
|
)
|
(8,199
|
)
|
|||
|
Other
|
(99,123
|
)
|
(85,003
|
)
|
|||
|
Other
|
(5,484
|
)
|
(4,916
|
)
|
|||
|
Total deferred tax liabilities
|
(3,472,290
|
)
|
(3,211,972
|
)
|
|||
|
Deferred income taxes — net
|
$
|
(2,460,404
|
)
|
$
|
(2,260,730
|
)
|
|
As of
December 31, 2014
, the deferred tax assets for credit and loss carryforwards relate primarily to federal general business credits of approximately
$90 million
, which first begin to expire in 2031, and other federal and state loss carryforwards of
$4 million
, which first begin to expire in 2019. The credit and loss
99
carryforwards amount above has been reduced by
$26
million of unrecognized tax benefits as a result of the guidance adopted in January 2014, as disclosed above.
5.
Lines of Credit and Short-Term Borrowings
Pinnacle West and APS maintain committed revolving credit facilities in order to enhance liquidity and provide credit support for their commercial paper programs.
The table below presents the consolidated credit facilities and the amounts available and outstanding as of
December 31, 2014
(dollars in millions):
|
Credit Facility
|
Expiration
|
Amount
Committed
|
Unused
Amount (a)
|
Commitment
Fees
|
|||||||||
|
Pinnacle West Revolving Credit Facility
|
May 2019
|
$
|
200
|
|
$
|
200
|
|
0.175
|
%
|
||||
|
APS Revolving Credit Facility
|
May 2019
|
500
|
|
500
|
|
0.125
|
%
|
||||||
|
APS Revolving Credit Facility
|
April 2018
|
500
|
|
353
|
|
0.125
|
%
|
||||||
|
Total
|
|
$
|
1,200
|
|
$
|
1,053
|
|
|
|
||||
|
(a)
|
At
December 31, 2014
, APS had
$147 million
of outstanding commercial paper. Accordingly, at such date, the total combined amount available under its
two
$500 million
credit facilities was
$853 million
.
|
Pinnacle West
On May 9, 2014, Pinnacle West replaced its
$200 million
revolving credit facility that would have matured in November 2016, with a new
$200 million
facility that matures in May 2019. At
December 31, 2014
, the facility was available to refinance indebtedness of the Company and for other general corporate purposes, including credit support for its
$200 million
commercial paper program. Pinnacle West has the option to increase the amount of the facility up to a maximum of
$300 million
upon the satisfaction of certain conditions and with the consent of the lenders. At
December 31, 2014
, Pinnacle West had
no
outstanding borrowings under its credit facility,
no
letters of credit outstanding and
no
commercial paper borrowings.
APS
On May 9, 2014, APS refinanced its
$500 million
revolving credit facility that would have matured in November 2016, with a new
$500 million
facility that matures in May 2019.
At
December 31, 2014
, APS had
two
credit facilities totaling
$1 billion
, including a
$500 million
credit facility that matures in April 2018 and a
$500 million
credit facility that matures in May 2019 (see above). APS may increase the amount of each facility up to a maximum of
$700 million
upon the satisfaction of certain conditions and with the consent of the lenders. APS will use these facilities to refinance indebtedness and for other general corporate purposes. Interest rates are based on APS’s senior unsecured debt credit ratings.
The facilities described above are available to support APS’s
$250 million
commercial paper program, for bank borrowings or for issuances of letters of credit. At
December 31, 2014
, APS had
no
outstanding borrowings or letters of credit under its revolving credit facilities. In addition, APS had commercial paper borrowings of
$147 million
at
December 31, 2014
.
100
The table below presents the consolidated credit facilities and the amounts available and outstanding as of
December 31, 2013
(dollars in millions):
|
Credit Facility
|
Expiration
|
Amount
Committed
|
Unused
Amount (a)
|
Commitment
Fees
|
|||||||||
|
Pinnacle West Revolving Credit Facility
|
November 2016
|
$
|
200
|
|
$
|
200
|
|
0.175
|
%
|
||||
|
APS Revolving Credit Facility
|
November 2016
|
500
|
|
347
|
|
0.125
|
%
|
||||||
|
APS Revolving Credit Facility
|
April 2018
|
500
|
|
500
|
|
0.125
|
%
|
||||||
|
Total
|
|
$
|
1,200
|
|
$
|
1,047
|
|
|
|
||||
|
(a)
|
At
December 31, 2013
, APS had
$153 million
of outstanding commercial paper. Accordingly, at such date the total combined amount available under its
two
$500 million
credit facilities was
$847 million
.
|
Pinnacle West
At
December 31, 2013
, the Pinnacle West credit facility, which matures in November 2016, was available to refinance indebtedness of the Company and for other general corporate purposes, including credit support for its
$200 million
commercial paper program. Pinnacle West has the option to increase the amount of the facility up to a maximum of
$300 million
upon the satisfaction of certain conditions and with the consent of the lenders. At
December 31, 2013
, Pinnacle West had
no
outstanding borrowings under its credit facility,
no
letters of credit and
no
commercial paper borrowings.
APS
On April 9, 2013, APS refinanced its
$500 million
revolving credit facility that would have matured in February 2015, with a new
$500 million
facility. The new revolving credit facility matures in April 2018.
At December 31, 2013, APS had
two
credit facilities totaling
$1 billion
, including a
$500 million
credit facility that was refinanced in April 2013 (see above) and a
$500 million
credit facility that matures in November 2016. APS may increase the amount of each facility up to a maximum of
$700 million
upon the satisfaction of certain conditions and with the consent of the lenders. APS can use these facilities to refinance indebtedness and for other general corporate purposes. Interest rates are based on APS’s senior unsecured debt credit ratings.
The facilities described above are available to support APS’s
$250 million
commercial paper program, for bank borrowings or for issuances of letters of credit. At
December 31, 2013
, APS had
no
outstanding borrowings or letters of credit under its revolving credit facilities. In addition, APS had commercial paper borrowings of
$153 million
at
December 31, 2013
.
See “Financial Assurances” in Note 10 for a discussion of APS’s separate outstanding letters of credit.
Debt Provisions
Although provisions in APS’s articles of incorporation and ACC financing orders establish maximum amounts of preferred stock and debt that APS may issue, APS does not expect any of these provisions to limit its ability to meet its capital requirements. On February 6, 2013, the ACC issued a financing order in which, subject to specified parameters and procedures, it (a) approved APS’s short-term debt authorization equal to a
101
sum of (i)
7%
of APS’s capitalization, and (ii)
$500 million
(which is required to be used for costs relating to purchases of natural gas and power), (b) approved an increase in APS’s long-term debt authorization from
$4.2 billion
to
$5.1 billion
in light of the projected growth of APS and its customer base and the resulting projected financing needs, and (c) authorized APS to enter into derivative financial instruments for the purpose of managing interest rate risk associated with its long- and short-term debt. This financing order is set to expire on December 31, 2017.
6.
Long-Term Debt and Liquidity Matters
All of Pinnacle West’s and APS’s debt is unsecured. The following table presents the components of long-term debt on the Consolidated Balance Sheets outstanding at
December 31, 2014
and
2013
(dollars in thousands):
|
|
Maturity
|
Interest
|
December 31,
|
||||||||
|
|
Dates (a)
|
Rates
|
2014
|
2013
|
|||||||
|
APS
|
|
|
|
|
|
|
|||||
|
Pollution Control Bonds:
|
|
|
|
|
|
|
|||||
|
Variable
|
2029-2038
|
(b)
|
$
|
156,405
|
|
$
|
75,580
|
|
|||
|
Fixed
|
2024-2034
|
0.45%-5.75%
|
249,300
|
|
426,125
|
|
|||||
|
Total Pollution Control Bonds
|
|
|
405,705
|
|
501,705
|
|
|||||
|
Senior unsecured notes
|
2015-2044
|
3.35%-8.75%
|
2,875,000
|
|
2,675,000
|
|
|||||
|
Palo Verde sale leaseback lessor notes
|
2015
|
8.00%
|
13,420
|
|
38,869
|
|
|||||
|
Unamortized discount
|
|
|
(9,206
|
)
|
(8,732
|
)
|
|||||
|
Unamortized premium
|
|
|
4,866
|
|
5,047
|
|
|||||
|
Total APS long-term debt
|
|
|
3,289,785
|
|
3,211,889
|
|
|||||
|
Less current maturities
|
(d)
|
|
383,570
|
|
540,424
|
|
|||||
|
Total APS long-term debt less current maturities
|
|
|
2,906,215
|
|
2,671,465
|
|
|||||
|
Pinnacle West
|
|
|
|
|
|
|
|||||
|
Term loan
|
2017
|
(c)
|
125,000
|
|
125,000
|
|
|||||
|
TOTAL LONG-TERM DEBT
LESS CURRENT MATURITIES
|
|
|
$
|
3,031,215
|
|
$
|
2,796,465
|
|
|||
(a)
This schedule does not reflect the timing of redemptions that may occur prior to maturities.
(b)
The weighted-average rate for the variable rate pollution control bonds was
0.03%
-
0.27%
at
December 31, 2014
and
0.03%
-
0.06%
at
December 31, 2013
.
(c)
The weighted-average interest rate was
1.019%
at
December 31, 2014
and
1.269%
at
December 31, 2013
.
(d)
Current maturities include
$70 million
of pollution control bonds expected to be remarketed in 2015 and
$300 million
in senior unsecured notes that mature in 2015.
102
The following table shows principal payments due on Pinnacle West’s and APS’s total long-term debt (dollars in millions):
|
Year
|
Consolidated
Pinnacle West
|
Consolidated
APS
|
||||||
|
2015
|
$
|
384
|
|
$
|
384
|
|
||
|
2016
|
357
|
|
357
|
|
||||
|
2017
|
157
|
|
32
|
|
||||
|
2018
|
32
|
|
32
|
|
||||
|
2019
|
500
|
|
500
|
|
||||
|
Thereafter
|
1,989
|
|
1,989
|
|
||||
|
Total
|
$
|
3,419
|
|
$
|
3,294
|
|
||
Debt Fair Value
Our long-term debt fair value estimates are based on quoted market prices for the same or similar issues, and are classified within Level 2 of the fair value hierarchy. Certain of our debt instruments contain third-party credit enhancements and, in accordance with GAAP, we do not consider the effect of these credit enhancements when determining fair value. The following table represents the estimated fair value of our long-term debt, including current maturities (dollars in millions):
|
|
As of
December 31, 2014 |
As of
December 31, 2013 |
|||||||||||||
|
|
Carrying
Amount
|
Fair Value
|
Carrying
Amount
|
Fair Value
|
|||||||||||
|
Pinnacle West
|
$
|
125
|
|
$
|
125
|
|
$
|
125
|
|
$
|
125
|
|
|||
|
APS
|
3,290
|
|
3,714
|
|
3,212
|
|
3,454
|
|
|||||||
|
Total
|
$
|
3,415
|
|
$
|
3,839
|
|
$
|
3,337
|
|
$
|
3,579
|
|
|||
Credit Facilities and Debt Issuances
Pinnacle West
On December 31, 2014, Pinnacle West entered into a
$125 million
term loan facility that matures December 31, 2017. Pinnacle West used the proceeds to repay and refinance the term loan facility that would have matured in November 2015.
APS
On July 12, 2013, APS purchased all
$33 million
of the Coconino County, Arizona Pollution Control Corporation Pollution Control Revenue Refunding Bonds, 1994 Series A, due 2029. On October 11, 2013, APS purchased all
$32 million
of the City of Farmington, New Mexico Pollution Control Revenue Bonds, 1994 Series C, due 2024. On January 15, 2014, both of these series of bonds were canceled and refinanced.
On January 10, 2014, APS issued
$250 million
of
4.70%
unsecured senior notes that mature on January 15, 2044. The proceeds from the sale were used to repay commercial paper which was used to fund the acquisition of SCE’s
48%
ownership interest in each of Units 4 and 5 of Four Corners and to replenish cash used in 2013 to re-acquire the
two
series of tax-exempt indebtedness.
103
On May 1, 2014, APS purchased a total of
$100 million
of the Maricopa County, Arizona, Pollution Control Corporation Pollution Control Revenue Refunding Bonds, 2009 Series A, D and E, due 2029 in connection with the mandatory tender provisions for this indebtedness. On May 14, 2014, APS remarketed all
$36 million
of the 2009 Series A Bonds, which are classified as long-term debt on our Consolidated Balance Sheets at
December 31, 2014
. We expect to remarket or refinance all
$64 million
of the 2009 Series D Bonds and 2009 Series E Bonds within the next twelve months.
On May 30, 2014, APS purchased all
$38 million
of the Navajo County, Arizona, Pollution Control Corporation Pollution Control Revenue Refunding Bonds, 2009 Series A, due 2034, and on June 1, 2014, APS purchased a total of
$64 million
of the Navajo 2009 Series B Bonds and 2009 Series C Bonds, in each case, in connection with the mandatory tender provisions for this indebtedness. On September 23, 2014, APS remarketed all
$38 million
of the 2009 Series A Bonds, which are classified as current maturities of long-term debt on our Consolidated Balance Sheets at December 31, 2014. On October 1, 2014, APS remarketed all
$32 million
of the 2009 Series C Bonds, which are classified as long-term debt on our Consolidated Balance Sheets at December 31, 2014. We expect to remarket or refinance all
$32 million
of the 2009 Series B Bonds within the next twelve months.
On June 1, 2014, APS remarketed all
$13 million
of the Coconino County, Arizona Pollution Control Corporation Pollution Control Revenue Refunding Bonds, 2009 Series A, due 2034. These bonds are classified as long-term debt on our Consolidated Balance Sheets at
December 31, 2014
.
On June 18, 2014, APS issued
$250 million
of
3.35%
unsecured senior notes that mature on June 15, 2024. The net proceeds from the sale were used along with other funds to repay at maturity APS’s
$300 million
aggregate principal amount of
5.80%
senior notes due June 30, 2014.
On January 12, 2015, APS issued
$250 million
of
2.20%
unsecured senior notes that mature on January 15, 2020. The net proceeds from the sale were used to repay commercial paper borrowings and replenish cash temporarily used to fund capital expenditures.
See “Lines of Credit and Short-Term Borrowings” in Note 5 and “Financial Assurances” in Note 10 for discussion of APS’s separate outstanding letters of credit.
Debt Provisions
Pinnacle West’s and APS’s debt covenants related to their respective bank financing arrangements include maximum debt to capitalization ratios. Pinnacle West and APS comply with this covenant. For both Pinnacle West and APS, this covenant requires that the ratio of consolidated debt to total consolidated capitalization not exceed
65%
. At
December 31, 2014
, the ratio was approximately
46%
for Pinnacle West and
45%
for APS. Failure to comply with such covenant levels would result in an event of default which, generally speaking, would require the immediate repayment of the debt subject to the covenants and could cross-default other debt. See further discussion of “cross-default” provisions below.
Neither Pinnacle West’s nor APS’s financing agreements contain “rating triggers” that would result in an acceleration of the required interest and principal payments in the event of a rating downgrade. However, our bank credit agreements contain a pricing grid in which the interest rates we pay for borrowings thereunder are determined by our current credit ratings.
All of Pinnacle West’s loan agreements contain “cross-default” provisions that would result in defaults and the potential acceleration of payment under these loan agreements if Pinnacle West or APS were to default
104
under certain other material agreements. All of APS’s bank agreements contain "cross-default" provisions that would result in defaults and the potential acceleration of payment under these bank agreements if APS were to default under certain other material agreements. Pinnacle West and APS do not have a material adverse change restriction for credit facility borrowings.
An existing ACC order requires APS to maintain a common equity ratio of at least
40%
. As defined in the ACC order, the common equity ratio is total shareholder equity divided by the sum of total shareholder equity and long-term debt, including current maturities of long-term debt. At
December 31, 2014
, APS was in compliance with this common equity ratio requirement. Its total shareholder equity was approximately
$4.5 billion
, and total capitalization was approximately
$8.0 billion
. APS would be prohibited from paying dividends if the payment would reduce its total shareholder equity below approximately
$3.2 billion
, assuming APS’s total capitalization remains the same. Since APS was in compliance with this common equity ratio requirement, this restriction does not materially affect Pinnacle West’s ability to meet its ongoing capital requirements.
7.
Retirement Plans and Other Benefits
Pinnacle West sponsors a qualified defined benefit and account balance pension plan (The Pinnacle West Capital Corporation Retirement Plan) and a non-qualified supplemental excess benefit retirement plan for the employees of Pinnacle West and its subsidiaries. All new employees participate in the account balance plan. Defined benefit plans specify the amount of benefits a plan participant is to receive using information about the participant. The pension plan covers nearly all employees. The supplemental excess benefit retirement plan covers officers of the Company and highly compensated employees designated for participation by the Board of Directors. Our employees do not contribute to the plans. We calculate the benefits based on age, years of service and pay.
Pinnacle West also sponsors an other postretirement benefit plan (Pinnacle West Capital Corporation Group Life and Medical Plan) for the employees of Pinnacle West and its subsidiaries. This plan provides medical and life insurance benefits to retired employees. Employees must retire to become eligible for these retirement benefits, which are based on years of service and age. For the medical insurance plan, retirees make contributions to cover a portion of the plan costs. For the life insurance plan, retirees do not make contributions. We retain the right to change or eliminate these benefits.
On September 30, 2014, Pinnacle West announced plan design changes to the other postretirement benefit plan, which required an interim remeasurement of the benefit obligation for the plan. Effective January 1, 2015, those eligible retirees and dependents over age
65
and on Medicare can choose to be enrolled in a Health Reimbursement Arrangement (HRA). The Company will provide a subsidy allowing post-
65
retirees to purchase a Medicare supplement plan on a private exchange network. The remeasurement of the benefit obligation included updating the assumptions. The remeasurement reduced net periodic benefit costs in 2014 by
$10 million
(
$5 million
of which reduced expense), which was recognized during the fourth quarter of 2014. The September 30, 2014 remeasurement also resulted in a decrease in Pinnacle West’s other postretirement benefit obligation of
$316 million
, which was offset by the related regulatory asset and accumulated other comprehensive income. As a result of this reduction, the other postretirement benefit obligation, and related regulatory asset, have been reduced to the extent that Pinnacle West will now reflect an asset for other postretirement benefits and a related regulatory liability with balances at December 31, 2014 of
$152 million
and
$231 million
, respectively.
105
Because of the plan changes, the Company is currently in the process of seeking IRS and regulatory approval to move approximately
$100 million
of the other postretirement benefit trust assets into a new trust account to pay for active union employee medical costs.
Pinnacle West uses a December 31 measurement date each year for its pension and other postretirement benefit plans. The market-related value of our plan assets is their fair value at the measurement date. See Note 13 for further discussion of how fair values are determined. Due to subjective and complex judgments, which may be required in determining fair values, actual results could differ from the results estimated through the application of these methods.
A significant portion of the changes in the actuarial gains and losses of our pension and postretirement plans is attributable to APS and therefore is recoverable in rates. Accordingly, these changes are recorded as a regulatory asset or regulatory liability. In its 2009 retail rate case settlement, APS received approval to defer a portion of pension and other postretirement benefit cost increases incurred in 2011 and 2012. We deferred pension and other postretirement benefit costs of approximately
$14 million
in
2012
and
$11 million
in 2011. Pursuant to an ACC regulatory order, we began amortizing the regulatory asset over
3
years beginning in July 2012. We amortized approximately
$8 million
during
2014
,
$8 million
during
2013
, and
$4 million
during 2012.
The following table provides details of the plans’ net periodic benefit costs and the portion of these costs charged to expense (including administrative costs and excluding amounts capitalized as overhead construction, billed to electric plant participants or charged to the regulatory asset or liability) (dollars in thousands):
|
|
Pension
|
Other Benefits
|
|||||||||||||||||||||
|
|
2014
|
2013
|
2012
|
2014
|
2013
|
2012
|
|||||||||||||||||
|
Service cost-benefits earned during the period
|
$
|
53,080
|
|
$
|
64,195
|
|
$
|
63,502
|
|
$
|
18,139
|
|
$
|
23,597
|
|
$
|
27,163
|
|
|||||
|
Interest cost on benefit obligation
|
129,194
|
|
112,392
|
|
119,586
|
|
41,243
|
|
41,536
|
|
46,467
|
|
|||||||||||
|
Expected return on plan assets
|
(158,998
|
)
|
(146,333
|
)
|
(140,979
|
)
|
(46,400
|
)
|
(45,717
|
)
|
(45,793
|
)
|
|||||||||||
|
Amortization of:
|
|
|
|
|
|
|
|
|
|
|
|
|
|||||||||||
|
Transition obligation
|
—
|
|
—
|
|
—
|
|
—
|
|
—
|
|
452
|
|
|||||||||||
|
Prior service cost (credit)
|
869
|
|
1,097
|
|
1,143
|
|
(9,626
|
)
|
(179
|
)
|
(179
|
)
|
|||||||||||
|
Net actuarial loss
|
10,963
|
|
39,852
|
|
44,250
|
|
1,175
|
|
11,310
|
|
20,233
|
|
|||||||||||
|
Net periodic benefit cost
|
$
|
35,108
|
|
$
|
71,203
|
|
$
|
87,502
|
|
$
|
4,531
|
|
$
|
30,547
|
|
$
|
48,343
|
|
|||||
|
Portion of cost charged to expense
|
$
|
21,985
|
|
$
|
38,968
|
|
$
|
36,333
|
|
$
|
6,000
|
|
$
|
18,469
|
|
$
|
19,321
|
|
|||||
106
The following table shows the plans’ changes in the benefit obligations and funded status for the years
2014
and
2013
(dollars in thousands):
|
|
Pension
|
Other Benefits
|
|||||||||||||
|
|
2014
|
2013
|
2014
|
2013
|
|||||||||||
|
Change in Benefit Obligation
|
|
|
|
|
|
|
|
|
|||||||
|
Benefit obligation at January 1
|
$
|
2,646,530
|
|
$
|
2,850,846
|
|
$
|
890,418
|
|
$
|
990,418
|
|
|||
|
Service cost
|
53,080
|
|
64,195
|
|
18,139
|
|
23,597
|
|
|||||||
|
Interest cost
|
129,194
|
|
112,392
|
|
41,243
|
|
41,536
|
|
|||||||
|
Benefit payments
|
(128,550
|
)
|
(125,269
|
)
|
(29,054
|
)
|
(26,675
|
)
|
|||||||
|
Actuarial (gain) loss
|
378,394
|
|
(255,634
|
)
|
150,188
|
|
(138,458
|
)
|
|||||||
|
Plan amendments
|
—
|
|
—
|
|
(388,599
|
)
|
—
|
|
|||||||
|
Benefit obligation at December 31
|
3,078,648
|
|
2,646,530
|
|
682,335
|
|
890,418
|
|
|||||||
|
Change in Plan Assets
|
|
|
|
|
|
|
|
|
|||||||
|
Fair value of plan assets at January 1
|
2,264,121
|
|
2,079,181
|
|
748,339
|
|
684,221
|
|
|||||||
|
Actual return on plan assets
|
292,992
|
|
150,546
|
|
105,223
|
|
76,995
|
|
|||||||
|
Employer contributions
|
175,000
|
|
140,500
|
|
770
|
|
14,438
|
|
|||||||
|
Benefit payments
|
(116,709
|
)
|
(106,106
|
)
|
(19,707
|
)
|
(27,315
|
)
|
|||||||
|
Fair value of plan assets at December 31
|
2,615,404
|
|
2,264,121
|
|
834,625
|
|
748,339
|
|
|||||||
|
Funded Status at December 31
|
$
|
(463,244
|
)
|
$
|
(382,409
|
)
|
$
|
152,290
|
|
$
|
(142,079
|
)
|
|||
The following table shows the projected benefit obligation and the accumulated benefit obligation for pension plans with an accumulated obligation in excess of plan assets as of
December 31, 2014
and
2013
(dollars in thousands):
|
|
2014
|
2013
|
|||||
|
Projected benefit obligation
|
$
|
3,078,648
|
|
$
|
2,646,530
|
|
|
|
Accumulated benefit obligation
|
2,873,741
|
|
2,469,889
|
|
|||
|
Fair value of plan assets
|
2,615,404
|
|
2,264,121
|
|
|||
The following table shows the amounts recognized on the Consolidated Balance Sheets as of
December 31, 2014
and
2013
(dollars in thousands):
|
|
Pension
|
Other Benefits
|
|||||||||||||
|
|
2014
|
2013
|
2014
|
2013
|
|||||||||||
|
Noncurrent asset
|
$
|
—
|
|
$
|
—
|
|
$
|
152,290
|
|
$
|
—
|
|
|||
|
Current liability
|
(9,508
|
)
|
(10,860
|
)
|
—
|
|
—
|
|
|||||||
|
Noncurrent liability
|
(453,736
|
)
|
(371,549
|
)
|
—
|
|
(142,079
|
)
|
|||||||
|
Net amount recognized
|
$
|
(463,244
|
)
|
$
|
(382,409
|
)
|
$
|
152,290
|
|
$
|
(142,079
|
)
|
|||
107
The following table shows the details related to accumulated other comprehensive loss as of
December 31, 2014
and
2013
(dollars in thousands):
|
|
Pension
|
Other Benefits
|
|||||||||||||
|
|
2014
|
2013
|
2014
|
2013
|
|||||||||||
|
Net actuarial loss
|
$
|
577,976
|
|
$
|
344,540
|
|
$
|
148,006
|
|
$
|
57,816
|
|
|||
|
Prior service cost (credit)
|
1,203
|
|
2,072
|
|
(379,269
|
)
|
(296
|
)
|
|||||||
|
APS’s portion recorded as a regulatory (asset) liability
|
(485,037
|
)
|
(265,107
|
)
|
230,916
|
|
(49,298
|
)
|
|||||||
|
Income tax expense (benefit)
|
(36,890
|
)
|
(32,204
|
)
|
851
|
|
(2,528
|
)
|
|||||||
|
Accumulated other comprehensive loss
|
$
|
57,252
|
|
$
|
49,301
|
|
$
|
504
|
|
$
|
5,694
|
|
|||
The following table shows the estimated amounts that will be amortized from accumulated other comprehensive loss and regulatory assets into net periodic benefit cost in 2015 (dollars in thousands):
|
|
Pension
|
Other
Benefits
|
|||||
|
Net actuarial loss
|
$
|
28,180
|
|
$
|
5,651
|
|
|
|
Prior service cost (credit)
|
595
|
|
(37,968
|
)
|
|||
|
Total amounts estimated to be amortized from accumulated other comprehensive loss (gain) and regulatory assets (liabilities) in 2014
|
$
|
28,775
|
|
$
|
(32,317
|
)
|
|
The following table shows the weighted-average assumptions used for both the pension and other benefits to determine benefit obligations and net periodic benefit costs:
|
|
Benefit Obligations
As of December 31,
|
Benefit Costs
For the Years Ended December 31,
|
||||||||||||||
|
|
2014
|
2013
|
2014
|
2013
|
2012
|
|||||||||||
|
January - September
|
October - December
|
|||||||||||||||
|
Discount rate – pension
|
4.02
|
%
|
4.88
|
%
|
4.88
|
%
|
4.88
|
%
|
4.01
|
%
|
4.42
|
%
|
||||
|
Discount rate – other benefits
|
4.14
|
%
|
5.10
|
%
|
5.10
|
%
|
4.41
|
%
|
4.20
|
%
|
4.59
|
%
|
||||
|
Rate of compensation increase
|
4.00
|
%
|
4.00
|
%
|
4.00
|
%
|
4.00
|
%
|
4.00
|
%
|
4.00
|
%
|
||||
|
Expected long-term return on plan assets - pension
|
N/A
|
|
N/A
|
|
6.90
|
%
|
6.90
|
%
|
7.00
|
%
|
7.75
|
%
|
||||
|
Expected long-term return on plan assets - other benefits
|
N/A
|
|
N/A
|
|
6.80
|
%
|
4.25
|
%
|
7.00
|
%
|
7.75
|
%
|
||||
|
Initial healthcare cost trend rate (pre-65 participants)
|
7.00
|
%
|
7.50
|
%
|
7.50
|
%
|
7.50
|
%
|
7.50
|
%
|
7.50
|
%
|
||||
|
Initial healthcare cost trend rate (post-65 participants)
|
5.00
|
%
|
7.50
|
%
|
7.50
|
%
|
5.00
|
%
|
7.50
|
%
|
7.50
|
%
|
||||
|
Ultimate healthcare cost trend rate
|
5.00
|
%
|
5.00
|
%
|
5.00
|
%
|
5.00
|
%
|
5.00
|
%
|
5.00
|
%
|
||||
|
Number of years to ultimate trend rate (pre-65 participants)
|
4
|
|
4
|
|
4
|
|
4
|
|
4
|
|
4
|
|
||||
|
Number of years to ultimate trend rate (post-65 participants)
|
0
|
|
4
|
|
4
|
|
0
|
|
4
|
|
4
|
|
||||
In selecting the pretax expected long-term rate of return on plan assets, we consider past performance and economic forecasts for the types of investments held by the plan. For 2015, we are assuming a
6.90%
long-term rate of return for pension assets and
4.74%
(before tax) for other benefit assets, which we believe is reasonable given our asset allocation in relation to historical and expected performance.
In October 2014, the Society of Actuaries’ Retirement Plans Experience Committee issued its final reports on its recommended mortality basis (“RP-2014 Mortality Tables Report” and "Mortality Improvement
108
Scale MP-2014 Report"). At December 31, 2014, we updated our mortality assumptions using the recommended basis with modifications to better reflect our plan experience and additional data regarding mortality trends. The updated mortality assumptions resulted in a
$67 million
increase in Pinnacle West’s pension and other postretirement obligations, which was offset by the related regulatory asset, regulatory liability and accumulated other comprehensive income.
In selecting our healthcare trend rates, we consider past performance and forecasts of healthcare costs. A one percentage point change in the assumed initial and ultimate healthcare cost trend rates would have the following effects (dollars in millions):
|
|
1% Increase
|
1% Decrease
|
|||||
|
Effect on other postretirement benefits expense, after consideration of amounts capitalized or billed to electric plant participants
|
$
|
10
|
|
$
|
(4
|
)
|
|
|
Effect on service and interest cost components of net periodic other postretirement benefit costs
|
12
|
|
(9
|
)
|
|||
|
Effect on the accumulated other postretirement benefit obligation
|
110
|
|
(88
|
)
|
|||
Plan Assets
The Board of Directors has delegated oversight of the pension and other postretirement benefit plans’ assets to an Investment Management Committee (“Committee”). The Committee has adopted investment policy statements (“IPS”) for the pension and the other postretirement benefit plans’ assets. The investment strategies for these plans include external management of plan assets, and prohibition of investments in Pinnacle West securities.
The overall strategy of the pension plan’s IPS is to achieve an adequate level of trust assets relative to the benefit obligations. To achieve this objective, the plan’s investment policy provides for mixes of investments including long-term fixed income assets and return-generating assets. The target allocation between return-generating and long-term fixed income assets is defined in the IPS and is a function of the plan’s funded status. The plan’s funded status is reviewed on at least a monthly basis.
Long-term fixed income assets, also known as liability-hedging assets, are designed to offset changes in the benefit obligations due to changes in interest rates. Long-term fixed income assets consist primarily of fixed income debt securities issued by the U.S. Treasury, other government agencies, and corporations. Long-term fixed income assets may also include interest rate swaps, U.S. Treasury futures and other instruments.
Return-generating assets are intended to provide a reasonable long-term rate of investment return with a prudent level of volatility. Return-generating assets are composed of U.S. equities, international equities, and alternative investments. International equities include investments in both developed and emerging markets. Alternative investments include investments in real estate, private equity and various other strategies. The plan may hold investments in return-generating assets by holding securities in partnerships and common and collective trusts.
Based on the IPS, and given the pension plan’s funded status at year-end 2014, the long-term fixed income assets had a target allocation of
58%
with a permissible range of
55%
to
61%
and the return-generating assets had a target allocation of
42%
with a permissible range of
39%
to
45%
. The return-generating assets have additional target allocations, as a percent of total plan assets, of
22%
equities in U.S. and other developed markets,
6%
equities in emerging markets, and
14%
in alternative investments. The pension plan IPS does not provide for a specific mix of long-term fixed income assets, but does expect the average credit quality of such
109
assets to be investment grade. As of
December 31, 2014
, long-term fixed income assets represented
61%
of total pension plan assets, and return-generating assets represented
39%
of total pension plan assets.
As of December 31, 2014, the asset allocation for other postretirement benefit plan assets is governed by the IPS for those plans, which provides for different asset allocation target mixes depending on the characteristics of the liability. Some of these asset allocation target mixes vary with the plan’s funded status. As of
December 31, 2014
, investment in fixed income assets represented
43%
of the other postretirement benefit plan total assets, and non-fixed income assets represented
57%
of the other postretirement benefit plan’s assets. Fixed income assets are primarily invested in corporate bonds of investment-grade U.S. issuers, and U.S. Treasuries. Non-fixed income assets are primarily invested in large cap U.S. equities in diverse industries, and international equities in both emerging and developed markets.
See Note 13 for a discussion on the fair value hierarchy and how fair value methodologies are applied. The plans invest directly in fixed income and equity securities, in addition to investing indirectly in fixed income securities, equity securities and real estate through the use of partnerships and common and collective trusts. Equity securities held directly by the plans are valued using quoted active market prices from the published exchange on which the equity security trades, and are classified as Level 1. Fixed income securities issued by the U.S. Treasury held directly by the plans are valued using quoted active market prices, and are classified as Level 1. Fixed income securities issued by corporations, municipalities, and other agencies are primarily valued using quoted inactive market prices, or quoted active market prices for similar securities, or by utilizing calculations which incorporate observable inputs such as yield, maturity and credit quality. These instruments are classified as Level 2.
The common and collective trusts, which are similar to mutual funds, are maintained by banks or investment companies and hold certain investments in accordance with a stated set of objectives (such as tracking the performance of the S&P 500 Index). Common and collective trusts are valued using the concept of net asset value (“NAV”), which is a value derived from the quoted active market prices of the underlying securities. The plans’ common and collective real estate trust is valued using NAV, which is derived from the appraised values of the trust’s underlying real estate assets. As of
December 31, 2014
, the plans were able to transact in the common and collective trusts at NAV and accordingly classify these investments as Level 2. Because the trust’s shares are offered to a limited group of investors, they are not considered to be traded in an active market.
Investments in partnerships are also valued using the concept of NAV, which is derived from the value of the partnerships' underlying assets. The plan's partnerships holdings relate to investments in high-yield fixed income instruments and assets of privately held portfolio companies. Partnerships are classified as Level 2 if the plan is able to transact in the partnership at the NAV. At December 31, 2014, certain partnerships have been classified as Level 3 due to restrictions that limit the plan's ability to transact in these partnerships at the NAV. Certain partnerships also include funding commitments that may require the plan to contribute up to
$75 million
to these partnerhips; as of December 31, 2014,
$30 million
of these commitments have been funded.
The plans’ trustee provides valuation of our plan assets by using pricing services that utilize methodologies described to determine fair market value. We have internal control procedures to ensure this information is consistent with fair value accounting guidance. These procedures include assessing valuations using an independent pricing source, verifying that pricing can be supported by actual recent market transactions, assessing hierarchy classifications, comparing investment returns with benchmarks, and obtaining and reviewing independent audit reports on the trustee’s internal operating controls and valuation processes.
110
The fair value of Pinnacle West’s pension plan and other postretirement benefit plan assets at
December 31, 2014
, by asset category, are as follows (dollars in thousands):
|
|
Quoted Prices
in Active
Markets for
Identical
Assets
(Level 1)
|
Significant
Other
Observable
Inputs
(Level 2)
|
Significant
Unobservable
Inputs
(Level 3)
|
Other (b)
|
Balance at December 31, 2014
|
||||||||||||||
|
Pension Plan:
|
|
|
|
|
|
|
|
|
|
|
|||||||||
|
Assets:
|
|
|
|
|
|
|
|
|
|
|
|||||||||
|
Cash and cash equivalents
|
$
|
387
|
|
$
|
—
|
|
$
|
—
|
|
$
|
—
|
|
$
|
387
|
|
||||
|
Fixed Income Securities:
|
|
|
|
|
|
|
|
|
|
|
|||||||||
|
Corporate
|
—
|
|
1,162,096
|
|
—
|
|
—
|
|
1,162,096
|
|
|||||||||
|
U.S. Treasury
|
291,817
|
|
—
|
|
—
|
|
—
|
|
291,817
|
|
|||||||||
|
Other (a)
|
—
|
|
113,265
|
|
—
|
|
—
|
|
113,265
|
|
|||||||||
|
Equities:
|
|
|
|
|
|
|
|
|
|
|
|||||||||
|
U.S. Companies
|
246,387
|
|
—
|
|
—
|
|
—
|
|
246,387
|
|
|||||||||
|
International Companies
|
18,069
|
|
—
|
|
—
|
|
—
|
|
18,069
|
|
|||||||||
|
Common and collective trusts:
|
|
|
|
|
|
|
|
|
|
|
|||||||||
|
U.S. Equities
|
—
|
|
127,336
|
|
—
|
|
—
|
|
127,336
|
|
|||||||||
|
International Equities
|
—
|
|
317,167
|
|
—
|
|
—
|
|
317,167
|
|
|||||||||
|
Real estate
|
—
|
|
129,715
|
|
—
|
|
—
|
|
129,715
|
|
|||||||||
|
Partnerships
|
—
|
|
138,337
|
|
27,929
|
|
—
|
|
166,266
|
|
|||||||||
|
Short-term investments and other
|
—
|
|
26,016
|
|
—
|
|
16,883
|
|
42,899
|
|
|||||||||
|
Total Pension Plan
|
$
|
556,660
|
|
$
|
2,013,932
|
|
$
|
27,929
|
|
$
|
16,883
|
|
$
|
2,615,404
|
|
||||
|
Other Benefits:
|
|
|
|
|
|
|
|
|
|
|
|||||||||
|
Assets:
|
|
|
|
|
|
|
|
|
|
|
|||||||||
|
Cash and cash equivalents
|
$
|
318
|
|
$
|
—
|
|
$
|
—
|
|
$
|
—
|
|
$
|
318
|
|
||||
|
Fixed Income Securities:
|
|
|
|
|
|
|
|
|
|
|
|||||||||
|
Corporate
|
—
|
|
187,961
|
|
—
|
|
—
|
|
187,961
|
|
|||||||||
|
U.S. Treasury
|
130,967
|
|
—
|
|
—
|
|
—
|
|
130,967
|
|
|||||||||
|
Other (a)
|
—
|
|
35,291
|
|
—
|
|
—
|
|
35,291
|
|
|||||||||
|
Equities:
|
|
|
|
|
|
|
|
|
|
|
|||||||||
|
U.S. Companies
|
265,106
|
|
—
|
|
—
|
|
—
|
|
265,106
|
|
|||||||||
|
International Companies
|
17,813
|
|
—
|
|
—
|
|
—
|
|
17,813
|
|
|||||||||
|
Common and collective trusts:
|
|
|
|
|
|
|
|
|
|
|
|||||||||
|
U.S. Equities
|
—
|
|
88,258
|
|
—
|
|
—
|
|
88,258
|
|
|||||||||
|
International Equities
|
—
|
|
85,746
|
|
—
|
|
—
|
|
85,746
|
|
|||||||||
|
Real Estate
|
—
|
|
11,657
|
|
—
|
|
—
|
|
11,657
|
|
|||||||||
|
Short-term investments and other
|
—
|
|
7,408
|
|
—
|
|
4,100
|
|
11,508
|
|
|||||||||
|
Total Other Benefits
|
$
|
414,204
|
|
$
|
416,321
|
|
$
|
—
|
|
$
|
4,100
|
|
$
|
834,625
|
|
||||
|
(a)
|
This category consists primarily of debt securities issued by municipalities.
|
|
(b)
|
Represents plan receivables and payables.
|
111
The fair value of Pinnacle West’s pension plan and other postretirement benefit plan assets at
December 31, 2013
, by asset category, are as follows (dollars in thousands):
|
|
Quoted Prices
in Active
Markets for
Identical
Assets
(Level 1)
|
Significant
Other
Observable
Inputs
(Level 2)
|
Significant
Unobservable
Inputs
(Level 3)
|
Other (b)
|
Balance at December 31, 2013
|
||||||||||||||
|
Pension Plan:
|
|
|
|
|
|
|
|
|
|
|
|||||||||
|
Assets:
|
|
|
|
|
|
|
|
|
|
|
|||||||||
|
Cash and cash equivalents
|
$
|
504
|
|
$
|
—
|
|
$
|
—
|
|
$
|
—
|
|
$
|
504
|
|
||||
|
Fixed Income Securities:
|
|
|
|
|
|
|
|
|
|
|
|||||||||
|
Corporate
|
—
|
|
898,621
|
|
—
|
|
—
|
|
898,621
|
|
|||||||||
|
U.S. Treasury
|
231,590
|
|
—
|
|
—
|
|
—
|
|
231,590
|
|
|||||||||
|
Other (a)
|
—
|
|
84,011
|
|
—
|
|
—
|
|
84,011
|
|
|||||||||
|
Equities:
|
|
|
|
|
|
|
|
|
|
|
|||||||||
|
U.S. Companies
|
239,036
|
|
—
|
|
—
|
|
—
|
|
239,036
|
|
|||||||||
|
International Companies
|
19,429
|
|
—
|
|
—
|
|
—
|
|
19,429
|
|
|||||||||
|
Common and collective trusts:
|
|
|
|
|
|
|
|
|
|
|
|||||||||
|
U.S. Equities
|
—
|
|
116,150
|
|
—
|
|
—
|
|
116,150
|
|
|||||||||
|
International Equities
|
—
|
|
367,551
|
|
—
|
|
—
|
|
367,551
|
|
|||||||||
|
Fixed Income
|
—
|
|
137,520
|
|
—
|
|
—
|
|
137,520
|
|
|||||||||
|
Real estate
|
—
|
|
119,739
|
|
—
|
|
—
|
|
119,739
|
|
|||||||||
|
Partnerships
|
—
|
|
—
|
|
8,660
|
|
—
|
|
8,660
|
|
|||||||||
|
Short-term investments and other
|
—
|
|
41,060
|
|
—
|
|
250
|
|
41,310
|
|
|||||||||
|
Total Pension Plan
|
$
|
490,559
|
|
$
|
1,764,652
|
|
$
|
8,660
|
|
$
|
250
|
|
$
|
2,264,121
|
|
||||
|
Other Benefits:
|
|
|
|
|
|
|
|
|
|
|
|||||||||
|
Assets:
|
|
|
|
|
|
|
|
|
|
|
|||||||||
|
Cash and cash equivalents
|
|
|
|
|
|
|
|
|
|
|
|||||||||
|
Fixed Income Securities:
|
|
|
|
|
|
|
|
|
|
|
|||||||||
|
Corporate
|
$
|
—
|
|
$
|
153,888
|
|
$
|
—
|
|
$
|
—
|
|
$
|
153,888
|
|
||||
|
U.S. Treasury
|
98,704
|
|
—
|
|
—
|
|
—
|
|
98,704
|
|
|||||||||
|
Other (a)
|
—
|
|
27,936
|
|
—
|
|
—
|
|
27,936
|
|
|||||||||
|
Equities:
|
|
|
|
|
|
|
|
|
|
|
|||||||||
|
U.S. Companies
|
252,181
|
|
—
|
|
—
|
|
—
|
|
252,181
|
|
|||||||||
|
International Companies
|
20,892
|
|
—
|
|
—
|
|
—
|
|
20,892
|
|
|||||||||
|
Common and collective trusts:
|
|
|
|
|
|
|
|
|
|
|
|||||||||
|
U.S. Equities
|
—
|
|
80,751
|
|
—
|
|
—
|
|
80,751
|
|
|||||||||
|
International Equities
|
—
|
|
92,382
|
|
—
|
|
—
|
|
92,382
|
|
|||||||||
|
Real Estate
|
—
|
|
10,761
|
|
—
|
|
—
|
|
10,761
|
|
|||||||||
|
Short-term investments and other
|
—
|
|
8,414
|
|
—
|
|
2,430
|
|
10,844
|
|
|||||||||
|
Total Other Benefits
|
$
|
371,777
|
|
$
|
374,132
|
|
$
|
—
|
|
$
|
2,430
|
|
$
|
748,339
|
|
||||
|
(a)
|
This category consists primarily of debt securities issued by municipalities.
|
|
(b)
|
Represents plan receivables and payables.
|
112
The following table shows the changes in fair value for assets that are measured at fair value on a recurring basis using significant unobservable inputs (Level 3) for the year ended
December 31, 2014
and
2013
(dollars in thousands):
|
|
Pension
|
|||||||
|
Partnerships
|
2014
|
2013
|
||||||
|
Beginning balance at January 1
|
$
|
8,660
|
|
$
|
2,419
|
|
||
|
Actual return on assets still held at December 31
|
927
|
|
(498
|
)
|
||||
|
Purchases
|
19,984
|
|
7,377
|
|
||||
|
Sales
|
(1,642
|
)
|
(638
|
)
|
||||
|
Transfers in and/or out of Level 3
|
—
|
|
—
|
|
||||
|
Ending balance at December 31
|
$
|
27,929
|
|
$
|
8,660
|
|
||
Contributions
Future year contribution amounts are dependent on plan asset performance and plan actuarial assumptions. We made contributions to our pension plan totaling
$175 million
in
2014
,
$141 million
in
2013
, and
$65 million
in
2012
. The minimum contributions for the pension plan are
zero
for the next three years. We expect to make voluntary contributions totaling up to
$300 million
for the next three years (up to
$100 million
each year in 2015, 2016, and 2017). With regard to contributions to our other postretirement benefit plans, we made a contribution of
$1 million
in
2014
,
$14 million
in
2013
, and
$23 million
in
2012
. We expect to make contributions of approximately
$1 million
in each of the next three years to our other postretirement benefit plans. APS funds its share of the contributions. APS’s share of the pension plan contribution was
$175 million
in
2014
,
$140 million
in
2013
, and
$64 million
in
2012
. APS’s share of the contributions to the other postretirement benefit plan was
$1 million
in
2014
,
$14 million
in
2013
, and
$22 million
in
2012
.
Estimated Future Benefit Payments
Benefit payments, which reflect estimated future employee service, for the next five years and the succeeding five years thereafter, are estimated to be as follows (dollars in thousands):
|
Year
|
Pension
|
Other Benefits
|
||||||
|
2015
|
$
|
139,013
|
|
$
|
25,134
|
|
||
|
2016
|
155,968
|
|
27,311
|
|
||||
|
2017
|
160,080
|
|
29,253
|
|
||||
|
2018
|
167,600
|
|
31,258
|
|
||||
|
2019
|
177,470
|
|
33,190
|
|
||||
|
Years 2020-2024
|
983,557
|
|
184,772
|
|
||||
Electric plant participants contribute to the above amounts in accordance with their respective participation agreements.
Employee Savings Plan Benefits
Pinnacle West sponsors a defined contribution savings plan for eligible employees of Pinnacle West and its subsidiaries. In 2014, costs related to APS’s employees represented
99%
of the total cost of this plan. In a defined contribution savings plan, the benefits a participant receives result from regular contributions participants make to their own individual account, the Company’s matching contributions and earnings or losses on their investments. Under this plan, the Company matches a percentage of the participants’ contributions in cash which is then invested in the same investment mix as participants elect to invest their own
113
future contributions. Pinnacle West recorded expenses for this plan of approximately
$9 million
for
2014
,
$9 million
for
2013
, and
$8 million
for
2012
.
8.
Leases
We lease certain vehicles, land, buildings, equipment and miscellaneous other items through operating rental agreements with varying terms, provisions and expiration dates.
Total lease expense recognized in the Consolidated Statements of Income was
$18 million
in
2014
,
$18 million
in
2013
, and
$19 million
in
2012
. APS’s lease expense was
$15 million
in
2014
,
$15 million
in
2013
, and
$16 million
in
2012
.
Estimated future minimum lease payments for Pinnacle West’s and APS’s operating leases, excluding purchased power agreements, are approximately as follows (dollars in millions):
|
Year
|
Pinnacle West
Consolidated
|
APS
|
||||||
|
2015
|
$
|
18
|
|
$
|
15
|
|
||
|
2016
|
6
|
|
6
|
|
||||
|
2017
|
5
|
|
5
|
|
||||
|
2018
|
4
|
|
4
|
|
||||
|
2019
|
3
|
|
3
|
|
||||
|
Thereafter
|
63
|
|
62
|
|
||||
|
Total future lease commitments
|
$
|
99
|
|
$
|
95
|
|
||
In 1986, APS entered into agreements with
three
separate lessor trust entities in order to sell and lease back interests in Palo Verde Unit 2 and related common facilities. These lessor trust entities have been deemed VIEs for which APS is the primary beneficiary. As the primary beneficiary, APS consolidated these lessor trust entities. The impacts of these sale leaseback transactions are excluded from our lease disclosures as lease accounting is eliminated upon consolidation. See Note 18 for a discussion of VIEs.
114
9.
Jointly-Owned Facilities
APS shares ownership of some of its generating and transmission facilities with other companies. We are responsible for our share of operating costs, as well as for providing our own financing. Our share of operating expenses and utility plant costs related to these facilities is accounted for using proportional consolidation. The following table shows APS’s interests in those jointly-owned facilities recorded on the Consolidated Balance Sheets at
December 31, 2014
(dollars in thousands):
|
|
Percent
Owned
|
|
Plant in
Service
|
Accumulated
Depreciation
|
Construction
Work in
Progress
|
||||||||||||
|
Generating facilities:
|
|
|
|
|
|
|
|
|
|
||||||||
|
Palo Verde Units 1 and 3
|
29.1
|
%
|
|
$
|
1,734,918
|
|
$
|
1,051,670
|
|
$
|
16,955
|
|
|||||
|
Palo Verde Unit 2 (a)
|
16.8
|
%
|
|
556,472
|
|
349,960
|
|
13,710
|
|
||||||||
|
Palo Verde Common
|
28.0
|
%
|
(b)
|
612,190
|
|
224,208
|
|
68,896
|
|
||||||||
|
Palo Verde Sale Leaseback
|
|
|
(a)
|
351,050
|
|
229,795
|
|
—
|
|
||||||||
|
Four Corners Generating Station
|
63.0
|
%
|
|
811,648
|
|
578,772
|
|
33,150
|
|
||||||||
|
Navajo Generating Station Units 1, 2 and 3
|
14.0
|
%
|
|
272,208
|
|
159,198
|
|
2,716
|
|
||||||||
|
Cholla common facilities (c)
|
63.3
|
%
|
(b)
|
155,856
|
|
49,954
|
|
866
|
|
||||||||
|
Transmission facilities:
|
|
|
|
|
|
|
|
|
|
||||||||
|
ANPP 500kV System
|
33.6
|
%
|
(b)
|
106,369
|
|
35,035
|
|
3,731
|
|
||||||||
|
Navajo Southern System
|
22.5
|
%
|
(b)
|
59,994
|
|
18,119
|
|
1,113
|
|
||||||||
|
Palo Verde — Yuma 500kV System
|
18.2
|
%
|
(b)
|
12,925
|
|
4,943
|
|
12
|
|
||||||||
|
Four Corners Switchyards
|
47.5
|
%
|
(b)
|
33,034
|
|
10,035
|
|
386
|
|
||||||||
|
Phoenix — Mead System
|
17.1
|
%
|
(b)
|
39,777
|
|
12,843
|
|
105
|
|
||||||||
|
Palo Verde — Estrella 500kV System
|
50.0
|
%
|
(b)
|
89,572
|
|
16,491
|
|
736
|
|
||||||||
|
Morgan — Pinnacle Peak System
|
64.4
|
%
|
(b)
|
130,840
|
|
8,970
|
|
1,690
|
|
||||||||
|
Round Valley System
|
50.0
|
%
|
(b)
|
497
|
|
276
|
|
1
|
|
||||||||
|
Palo Verde — Morgan System
|
90.0
|
%
|
(b)
|
—
|
|
—
|
|
69,377
|
|
||||||||
|
Hassayampa - North Gila System
|
80.0
|
%
|
(b)
|
8,902
|
|
3,634
|
|
142,645
|
|
||||||||
|
(a)
|
See Note 18.
|
|
(b)
|
Weighted-average of interests.
|
|
(c)
|
PacifiCorp owns Cholla Unit 4 and APS operates the unit for PacifiCorp. The common facilities at Cholla are jointly-owned.
|
10.
Commitments and Contingencies
Palo Verde Nuclear Generating Station
Spent Nuclear Fuel and Waste Disposal
On December 19, 2012, APS, acting on behalf of itself and the participant owners of Palo Verde, filed a breach of contract lawsuit against the DOE in the United States Court of Federal Claims. The lawsuit seeks to recover damages incurred due to DOE’s breach of the Standard Contract for failing to accept Palo Verde spent nuclear fuel and high level waste from January 1, 2007 through June 30, 2011, as it was required to do pursuant to the terms of the Standard Contract and the NWPA. On August 18, 2014, APS and DOE entered into a settlement agreement, stipulating to a dismissal of the lawsuit and payment of
$57.4 million
by DOE to the Palo Verde owners for certain specified costs incurred by Palo Verde during the period January 1, 2007
115
through June 30, 2011. APS’s share of this amount is
$16.7 million
. Amounts recovered in the lawsuit and settlement were recorded as adjustments to a regulatory liability and had no impact on current income. In addition, the settlement agreement provides APS with a method for submitting claims and getting recovery for costs incurred through 2016.
Nuclear Insurance
Public liability for incidents at nuclear power plants is governed by the Price-Anderson Nuclear Industries Indemnity Act (“Price-Anderson Act”), which limits the liability of nuclear reactor owners to the amount of insurance available from both commercial sources and an industry retrospective payment plan. In accordance with the Price-Anderson Act, the Palo Verde participants are insured against public liability for a nuclear incident up to
$13.6 billion
per occurrence. Palo Verde maintains the maximum available nuclear liability insurance in the amount of
$375 million
, which is provided by commercial insurance carriers. The remaining balance of
$13.2 billion
of liability coverage is provided through a mandatory industry-wide retrospective assessment program. If losses at any nuclear power plant covered by the program exceed the accumulated funds, APS could be assessed retrospective premium adjustments. The maximum retrospective premium assessment per reactor under the program for each nuclear liability incident is approximately
$127.3 million
, subject to an annual limit of
$19 million
per incident, to be periodically adjusted for inflation. Based on APS’s ownership interest in the three Palo Verde units, APS’s maximum potential retrospective premium assessment per incident for all
three
units is approximately
$111 million
, with a maximum annual retrospective premium assessment of approximately
$16.5 million
.
The Palo Verde participants maintain “all risk” (including nuclear hazards) insurance for property damage to, and decontamination of, property at Palo Verde in the aggregate amount of
$2.75 billion
, a substantial portion of which must first be applied to stabilization and decontamination. APS has also secured insurance against portions of any increased cost of replacement generation or purchased power and business interruption resulting from a sudden and unforeseen accidental outage of any of the three units. The property damage, decontamination, and replacement power coverages are provided by Nuclear Electric Insurance Limited (“NEIL”). APS is subject to retrospective premium assessments under all NEIL policies if NEIL’s losses in any policy year exceed accumulated funds. The maximum amount APS could incur under the current NEIL policies totals approximately
$20 million
for each retrospective premium assessment declared by NEIL’s Board of Directors due to losses. In addition, NEIL policies contain rating triggers that would result in APS providing approximately
$53 million
of collateral assurance within
20
business days of a rating downgrade to non-investment grade. The insurance coverage discussed in this and the previous paragraph is subject to certain policy conditions, sublimits and exclusions.
Fuel and Purchased Power Commitments and Purchase Obligations
APS is party to purchase obligations and various fuel and purchased power contracts with terms expiring between 2015 and 2043 that include required purchase provisions. APS estimates the contract requirements to be approximately
$723 million
in
2015
;
$747 million
in
2016
;
$630 million
in
2017
;
$610 million
in
2018
;
$583 million
in
2019
; and
$8.2 billion
thereafter. However, these amounts may vary significantly pursuant to certain provisions in such contracts that permit us to decrease required purchases under certain circumstances.
Of the various fuel and purchased power contracts mentioned above, some of those contracts for coal supply include take-or-pay provisions. The current coal contracts with take-or-pay provisions have terms expiring through 2031.
116
The following table summarizes our estimated coal take-or-pay commitments (dollars in millions):
|
|
Years Ended December 31,
|
||||||||||||||||||||||
|
|
2015
|
2016
|
2017
|
2018
|
2019
|
Thereafter
|
|||||||||||||||||
|
Coal take-or-pay commitments (a)
|
$
|
151
|
|
$
|
171
|
|
$
|
195
|
|
$
|
190
|
|
$
|
194
|
|
$
|
2,469
|
|
|||||
|
(a)
|
Total take-or-pay commitments are approximately
$3.4 billion
. The total net present value of these commitments is approximately
$2.2 billion
.
|
APS may spend more to meet its actual fuel requirements than the minimum purchase obligations in our coal take-or-pay contracts. The following table summarizes actual payments under the coal contracts which include take-or-pay provisions for each of the last three years (dollars in millions):
|
|
Year Ended December 31,
|
||||||||||
|
|
2014
|
2013
|
2012
|
||||||||
|
Total payments
|
$
|
237
|
|
$
|
188
|
|
$
|
196
|
|
||
Renewable Energy Credits
APS has entered into contracts to purchase renewable energy credits to comply with the RES. APS estimates the contract requirements to be approximately
$46 million
in
2015
;
$42 million
in
2016
;
$42 million
in
2017
;
$42 million
in
2018
;
$42 million
in
2019
; and
$448 million
thereafter. These amounts do not include purchases of renewable energy credits that are bundled with energy. Also, these amounts do not include purchases of renewable energy credits that are associated with purchased power contracts.
Coal Mine Reclamation Obligations
APS must reimburse certain coal providers for amounts incurred for final and contemporaneous coal mine reclamation. We account for contemporaneous reclamation costs as part of the cost of the delivered coal. We utilize site-specific studies of costs expected to be incurred in the future to estimate our final reclamation obligation. These studies utilize various assumptions to estimate the future costs. Based on the most recent reclamation studies, APS recorded an obligation for the coal mine final reclamation of approximately
$198 million
at
December 31, 2014
and
$207 million
at
December 31, 2013
. Under our current coal supply agreements, we expect to make payments to certain coal providers for the final mine reclamation as follows:
$1 million
in 2015;
$15 million
in 2016;
$17 million
in 2017;
$18 million
in 2018;
$19 million
in 2019; and
$281 million
thereafter. Any amendments to current coal supply agreements may change the timing of the reimbursement.
Superfund-Related Matters
Superfund establishes liability for the cleanup of hazardous substances found contaminating the soil, water or air. Those who generated, transported or disposed of hazardous substances at a contaminated site are among those who are PRPs. PRPs may be strictly, and often are jointly and severally, liable for clean-up. On September 3, 2003, EPA advised APS that EPA considers APS to be a PRP in the Motorola 52
nd
Street Superfund Site, OU3 in Phoenix, Arizona. APS has facilities that are within this Superfund site. APS and Pinnacle West have agreed with EPA to perform certain investigative activities of the APS facilities within OU3. In addition, on September 23, 2009, APS agreed with EPA and one other PRP to voluntarily assist with the funding and management of the site-wide groundwater remedial investigation and feasibility study work
117
plan. We estimate that our costs related to this investigation and study will be approximately
$2 million
. We anticipate incurring additional expenditures in the future, but because the overall investigation is not complete and ultimate remediation requirements are not yet finalized, at the present time expenditures related to this matter cannot be reasonably estimated.
On August 6, 2013, RID filed a lawsuit in Arizona District Court against APS and
24
other defendants, alleging that RID’s groundwater wells were contaminated by the release of hazardous substances from facilities owned or operated by the defendants. The lawsuit also alleges that, under Superfund laws, the defendants are jointly and severally liable to RID. The allegations against APS arise out of APS’s current and former ownership of facilities in and around OU3. We are unable to predict the outcome of this matter; however, we do not expect the outcome to have a material impact on our financial position, results of operations or cash flows.
Southwest Power Outage
Regulatory
. On September 8, 2011 at approximately 3:30 PM, a
500
kV transmission line running between the Hassayampa and North Gila substations in southwestern Arizona tripped out of service due to a fault that occurred at a switchyard operated by APS. Approximately
ten
minutes after the transmission line went off-line, generation and transmission resources for the Yuma area were lost, resulting in approximately
69,700
APS customers losing service.
Within the same time period that APS’s Yuma customers lost service, a series of transmission and generation disruptions occurred across the systems of several utilities that resulted in outages affecting portions of southern Arizona, southern California and northern Mexico. A total of approximately
7,900
MW of firm load and
2.7 million
customers were reported to have been affected. Service to all affected APS customers was restored by 9:15 PM on September 8. Service to customers affected by the wider regional outages was restored by approximately 3:25 AM on September 9.
FERC and NERC conducted a joint inquiry into the outages and, on May 1, 2012, they issued a report (the “Joint Report”) with their analysis and conclusions as to the causes of the events. The report included recommendations to help industry operators prevent similar outages in the future, including increased data sharing and coordination among the western utilities and entities responsible for bulk electric system reliability coordination. The Joint Report did not address potential reliability violations or an assessment of responsibility of the parties involved.
On January 22, 2014, following non-public preliminary investigations, FERC Staff issued a Notice of Alleged Violations naming
six
entities involved in the event, including APS. FERC Staff alleged that each of the named entities violated varying numbers of NERC Reliability Standards. APS was alleged to have violated
seven
Reliability Standard Requirements. The allegations of violations were preliminary determinations by FERC Staff and did not constitute findings by FERC itself that any violations had occurred.
On July 7, 2014, FERC approved a Stipulation and Consent Agreement among FERC’s Office of Enforcement, NERC and APS which resolves all civil and administrative disputes within the jurisdiction of FERC concerning the September 8 event, including FERC’s and NERC’s investigations. In the settlement, APS neither admitted nor denied alleged violations of
four
Reliability Standard Requirements. APS agreed to pay a civil penalty of
$3.25 million
, of which
$2 million
is to be paid in equal parts to the Department of the Treasury and NERC and
$1.25 million
will be credited as a partial civil penalty offset in exchange for APS completing certain reliability enhancements.
118
Litigation.
On September 6, 2013, a purported consumer class action complaint was filed in Federal District Court in San Diego, California, naming APS and Pinnacle West as defendants and seeking damages for loss of perishable inventory and sales as a result of interruption of electrical service. APS and Pinnacle West filed a motion to dismiss, which the court granted on December 9, 2013. On January 13, 2014, the plaintiffs appealed the lower court’s decision. The appeal is now fully briefed and pending before the Ninth Circuit Court of Appeals. We are unable to predict the outcome of this matter.
Clean Air Act Citizen Lawsuit
On October 4, 2011, Earthjustice, on behalf of several environmental organizations, filed a lawsuit in the United States District Court for the District of New Mexico against APS and the other Four Corners participants alleging violations of the NSR provisions of the Clean Air Act. Subsequent to filing its original Complaint, on January 6, 2012, Earthjustice filed a First Amended Complaint adding claims for violations of the Clean Air Act’s NSPS program. Among other things, the environmental plaintiffs seek to have the court enjoin operations at Four Corners until APS applies for and obtains any required NSR permits and complies with the NSPS. The plaintiffs further request the court to order the payment of civil penalties, including a beneficial mitigation project. On April 2, 2012, APS and the other Four Corners participants filed motions to dismiss. The case is being held in abeyance while the parties seek to negotiate a settlement. On March 30, 2013, upon joint motion of the parties, the court issued an order deeming the motions to dismiss withdrawn without prejudice during pendency of the stay. At such time as the stay is lifted, APS and the other Four Corners participants may reinstate their motions to dismiss. We are unable to predict the outcome of this matter.
Environmental Matters
APS is subject to numerous environmental laws and regulations affecting many aspects of its present and future operations, including air emissions, water quality, wastewater discharges, solid waste, hazardous waste, and CCRs. These laws and regulations can change from time to time, imposing new obligations on APS resulting in increased capital, operating, and other costs. Associated capital expenditures or operating costs could be material. APS intends to seek recovery of any such environmental compliance costs through our rates, but cannot predict whether it will obtain such recovery. The following proposed and final rules involve material compliance costs to APS.
Regional Haze Rules.
APS has received the final rulemaking imposing new requirements on Four Corners, Cholla and the Navajo Plant. EPA and ADEQ will require these plants to install pollution control equipment that constitutes the BART to lessen the impacts of emissions on visibility surrounding the plants. Based on EPA’s final standards, APS estimates that its
63%
share of the cost of these controls for Four Corners Units 4 and 5 would be at least
$350 million
. In addition, APS and El Paso entered into an asset purchase agreement providing for the purchase by APS, or an affiliate of APS, of El Paso's
7%
interest in Four Corners Units 4 and 5, which would increase our share of the cost of these controls by approximately
$40
million. APS estimates that its share of costs for upgrades at the Navajo Plant, based on EPA’s FIP proposal, could be up to approximately
$200 million
. In October 2014, a coalition of environmental groups, an Indian tribe and others filed petitions for review in the United States Court of Appeals for the Ninth Circuit asking the Court to review EPA's final BART rule for the Navajo Plant. We cannot predict the outcome of this review process. As described under "Regional Haze Rules - Cholla" below, APS filed a Petition for Review of EPA’s rule as it applies to Cholla, which, if not successful, would require installation of SCR controls with a cost to APS of approximately
$200 million
. However, in September 2014, APS met with EPA to propose a compromise BART strategy wherein, pending certain regulatory approvals, APS would permanently close Cholla Unit 2 by
119
April 2016 and cease burning coal at Units 1 and 3 by the mid-2020s. (See Note 3 for details related to the resulting regulatory asset.) APS made the proposal with the understanding that additional emission control equipment is unlikely to be required in the future because retiring and converting the units as contemplated in the proposal is more cost effective than, and will result in increased visibility improvement over, the current BART requirements for NOx imposed on the Cholla units under EPA's BART FIP. Because APS’s proposal involves state and federal rule-making processes, APS is unable to predict when or whether it may ultimately be approved.
Mercury and Air Toxic Standards.
In 2011, EPA issued rules establishing maximum achievable control technology standards to regulate emissions of mercury and other hazardous air pollutants from fossil-fired plants. APS estimates that the cost for the remaining equipment necessary to meet these standards is approximately
$130 million
for Cholla, which would be avoided if EPA approves APS's compromise proposal discussed above. No additional equipment is needed for Four Corners Units 4 and 5 to comply with these rules. SRP, the operating agent for the Navajo Plant, is still evaluating compliance options under the rules.
Coal Combustion Waste.
On December 19, 2014, EPA issued its final regulations governing the handling and disposal of CCR, such as fly ash and bottom ash. The rule regulates CCR as a non-hazardous waste under Subtitle D of RCRA and establishes national minimum criteria for existing and new CCR landfills and surface impoundments and all lateral expansions consisting of location restrictions, design and operating criteria, groundwater monitoring and corrective action, closure requirements and post closure care, and recordkeeping, notification, and Internet posting requirements. The rule generally requires any existing unlined CCR surface impoundment that is contaminating groundwater above a regulated constituent’s groundwater protection standard to stop receiving CCR and either retrofit or close, and further requires the closure of any CCR landfill or surface impoundment that cannot meet the applicable performance criteria for location restrictions or structural integrity.
Because the Subtitle D rule is self-implementing, the CCR standards apply directly to the regulated facility, and facilities are directly responsible for ensuring that their operations comply with the rule’s requirements. While EPA has chosen to regulate the disposal of CCR in landfills and surface impoundments as non-hazardous waste under the final rule, the agency makes clear that it will continue to evaluate any risks associated with CCR disposal and leaves open the possibility that it may regulate CCR as a hazardous waste under RCRA Subtitle C in the future.
APS currently disposes of CCR in ash ponds and dry storage areas at Cholla and Four Corners. APS estimates that its share of incremental costs to comply with the CCR rule for Four Corners is approximately
$15 million
, and its share of incremental costs for Cholla is approximately
$85 million
. The Navajo Plant currently disposes of CCR in a dry landfill storage area. At this time, SRP, the operating agent for the Navajo Plant, is analyzing the operations that would be covered by the rule and any resulting compliance costs.
Other future environmental rules that could involve material compliance costs include those related to effluent limitations, the ozone national ambient air quality standard, GHG emissions (such as the EPA’s proposed “Clean Power Plan” rule issued in accordance with President Obama’s Climate Action Plan), and other rules or matters involving the Clean Air Act, Clean Water Act, ESA, the Navajo Nation, and water supplies for our power plants. The financial impact of complying with these and other future environmental rules could jeopardize the economic viability of our coal plants or the willingness or ability of power plant participants to fund any required equipment upgrades or continue their participation in these plants. The economics of continuing to own certain resources, particularly our coal plants, may deteriorate, warranting early retirement of those plants, which may result in asset impairments. APS would seek recovery in rates for
120
the book value of any remaining investments in the plants as well as other costs related to early retirement, but cannot predict whether it would obtain such recovery.
Regional Haze Rules — Cholla
APS believes that EPA’s final rule as it applies to Cholla is unsupported and that EPA had no basis for disapproving Arizona’s SIP and promulgating a FIP that is inconsistent with the state’s considered BART determinations under the regional haze program. Accordingly, on February 1, 2013, APS filed a Petition for Review of the final BART rule in the United States Court of Appeals for the Ninth Circuit. Briefing in the case was completed in February 2014; the court scheduled oral argument for March 9, 2015.
New Mexico Tax Matter
On May 23, 2013, the New Mexico Taxation and Revenue Department issued a notice of assessment for coal severance surtax, penalty, and interest totaling approximately
$30 million
related to coal supplied under the coal supply agreement for Four Corners (the “Assessment”). APS’s share of the Assessment is approximately
$12 million
. For procedural reasons, on behalf of the Four Corners co-owners, including APS, the coal supplier made a partial payment of the Assessment and immediately filed a refund claim with respect to that partial payment in August 2013. The New Mexico Taxation and Revenue Department denied the refund claim. On December 19, 2013, the coal supplier and APS, on its own behalf and as operating agent for Four Corners, filed a complaint with the New Mexico District Court contesting both the validity of the Assessment and the refund claim denial. We cannot predict the timing or outcome of this litigation; however, we do not expect the outcome to have a material impact on our financial position, results of operations or cash flows.
Financial Assurances
APS has entered into various agreements that require letters of credit for financial assurance purposes. At
December 31, 2014
, approximately
$109 million
of letters of credit were outstanding to support existing pollution control bonds of a similar amount. The letters of credit are available to fund the payment of principal and interest of such debt obligations. These letters of credit will expire in 2015, 2016, and 2017. APS has also entered into letters of credit to support certain equity participants in the Palo Verde sale leaseback transactions (see Note 18 for further details on the Palo Verde sale leaseback transactions). These letters of credit will expire on December 31, 2015, and totaled approximately
$23 million
at
December 31, 2014
. Additionally, APS has issued letters of credit to support collateral obligations under a natural gas tolling contract entered into with a third party. At
December 31, 2014
, that letter of credit totaled
$5 million
and will expire in 2015.
We enter into agreements that include indemnification provisions relating to liabilities arising from or related to certain of our agreements. Most significantly, APS has agreed to indemnify the equity participants and other parties in the Palo Verde sale leaseback transactions with respect to certain tax matters. Generally, a maximum obligation is not explicitly stated in the indemnification provisions and, therefore, the overall maximum amount of the obligation under such indemnification provisions cannot be reasonably estimated. Based on historical experience and evaluation of the specific indemnities, we do not believe that any material loss related to such indemnification provisions is likely.
Pinnacle West has issued parental guarantees and has provided indemnification under certain surety bonds for APS which were not material at
December 31, 2014
.
121
11.
Asset Retirement Obligations
APS has asset retirement obligations for its Palo Verde nuclear facilities and certain other generation, transmission and distribution assets.
The Palo Verde asset retirement obligation primarily relates to final plant decommissioning. This obligation is based on the NRC’s requirements for disposal of radiated property or plant and agreements APS reached with the ACC for final decommissioning of the plant. The non-nuclear generation asset retirement obligations primarily relate to requirements for removing portions of those plants at the end of the plant life or lease term and coal ash pond closures. Some of APS’s transmission and distribution assets have asset retirement obligations because they are subject to right of way and easement agreements that require final removal. These agreements have a history of uninterrupted renewal that APS expects to continue. As a result, APS cannot reasonably estimate the fair value of the asset retirement obligation related to such transmission and distribution assets. Additionally, APS has aquifer protection permits for some of its generation sites that require the closure of certain facilities at those sites.
In 2014, an update to the 2013 decommissioning study was completed for Palo Verde nuclear generation facility to incorporate additional spent fuel related charges resulting in an increase to the ARO in the amount of
$20 million
. Also in 2014, an updated Four Corners Units 1-3 coal-fired power plant decommissioning study was finalized, which resulted in an increase to the ARO of
$24 million
. In addition, Four Corners spent
$30 million
in actual decommissioning costs. Finally, in 2014 APS also recognized an ARO related to a new solar facility on leased property that requires the land to be returned to its original condition upon decommissioning of the plant, which resulted in an increase to the ARO of
$6 million
.
In 2013, a decommissioning study with updated cash flow estimates was completed for Palo Verde, which resulted in a decrease of
$52 million
. Also in 2013, APS finalized the transaction to acquire SCE’s interest in Four Corners. As part of that transaction, APS assumed SCE’s asset retirement obligation resulting in an increase to the ARO of
$34 million
. In addition, on December 30, 2013, APS also retired Four Corners Units 1-3 and began decommissioning activities. Finally, Four Corners spent
$12 million
in actual decommissioning costs. An update was made to the timing of the Units 1-3 decommissioning cash flows to coincide with the expected decommissioning activities. This update resulted in a decrease to the ARO of
$4 million
.
The following schedule shows the change in our asset retirement obligations for
2014
and
2013
(dollars in millions):
|
|
2014
|
2013
|
|||||
|
Asset retirement obligations at the beginning of year
|
$
|
347
|
|
$
|
357
|
|
|
|
Changes attributable to:
|
|
|
|
|
|||
|
Accretion expense
|
24
|
|
24
|
|
|||
|
Settlements
|
(30
|
)
|
(12
|
)
|
|||
|
Assumed SCE’s obligation
|
—
|
|
34
|
|
|||
|
Estimated cash flow revisions
|
44
|
|
(56
|
)
|
|||
|
Newly incurred obligation
|
6
|
|
—
|
|
|||
|
Asset retirement obligations at the end of year
|
$
|
391
|
|
$
|
347
|
|
|
As mentioned above, decommissioning activities for Four Corners Units 1-3 began in January 2014; and,
$32 million
of the total ARO at
December 31, 2014
, was classified as a current liability on the balance sheet.
At December 31, 2013,
$33 million
of the total ARO of
$347 million
was classified as a current liability on the balance sheet.
122
In accordance with regulatory accounting, APS accrues removal costs for its regulated utility assets, even if there is no legal obligation for removal. See detail of regulatory liabilities in Note 3.
12.
Selected Quarterly Financial Data (Unaudited)
Consolidated quarterly financial information for
2014
and
2013
is provided in the tables below (dollars in thousands, except per share amounts). Weather conditions cause significant seasonal fluctuations in our revenues; therefore, results for interim periods do not necessarily represent results expected for the year.
|
|
2014 Quarter Ended
|
2014
|
|||||||||||||||||
|
|
March 31,
|
June 30,
|
Sept. 30,
|
Dec. 31,
|
Total
|
||||||||||||||
|
Operating revenues
|
$
|
686,251
|
|
$
|
906,264
|
|
$
|
1,172,667
|
|
$
|
726,450
|
|
$
|
3,491,632
|
|
||||
|
Operations and maintenance
|
212,882
|
|
211,222
|
|
223,418
|
|
260,503
|
|
908,025
|
|
|||||||||
|
Operating income
|
75,170
|
|
254,113
|
|
421,775
|
|
60,184
|
|
811,242
|
|
|||||||||
|
Income taxes
|
6,405
|
|
74,540
|
|
134,753
|
|
5,007
|
|
220,705
|
|
|||||||||
|
Income from continuing operations
|
24,691
|
|
141,384
|
|
248,086
|
|
9,535
|
|
423,696
|
|
|||||||||
|
Net income attributable to common shareholders
|
15,766
|
|
132,458
|
|
243,961
|
|
5,410
|
|
397,595
|
|
|||||||||
|
Earnings Per Share:
|
|
|
|
|
|
|
|
|
|
|
|||||||||
|
Net income attributable to common shareholders — Basic
|
$
|
0.14
|
|
$
|
1.20
|
|
$
|
2.20
|
|
$
|
0.05
|
|
$
|
3.59
|
|
||||
|
Net income attributable to common shareholders — Diluted
|
0.14
|
|
1.19
|
|
2.20
|
|
0.05
|
|
3.58
|
|
|||||||||
|
|
2013 Quarter Ended
|
2013
|
|||||||||||||||||
|
|
March 31,
|
June 30,
|
Sept. 30,
|
Dec. 31,
|
Total
|
||||||||||||||
|
Operating revenues
|
$
|
686,652
|
|
$
|
915,822
|
|
$
|
1,152,392
|
|
$
|
699,762
|
|
$
|
3,454,628
|
|
||||
|
Operations and maintenance
|
223,250
|
|
229,300
|
|
233,323
|
|
238,854
|
|
924,727
|
|
|||||||||
|
Operating income
|
86,923
|
|
259,812
|
|
415,688
|
|
83,900
|
|
846,323
|
|
|||||||||
|
Income taxes
|
12,469
|
|
77,043
|
|
131,912
|
|
9,167
|
|
230,591
|
|
|||||||||
|
Income from continuing operations
|
32,836
|
|
139,598
|
|
234,718
|
|
32,814
|
|
439,966
|
|
|||||||||
|
Net income attributable to common shareholders
|
24,444
|
|
131,207
|
|
226,163
|
|
24,260
|
|
406,074
|
|
|||||||||
|
Earnings Per Share:
|
|
|
|
|
|
|
|
|
|
|
|||||||||
|
Net income attributable to common shareholders — Basic
|
$
|
0.22
|
|
$
|
1.19
|
|
$
|
2.06
|
|
$
|
0.22
|
|
$
|
3.69
|
|
||||
|
Net income attributable to common shareholders — Diluted
|
0.22
|
|
1.18
|
|
2.04
|
|
0.22
|
|
3.66
|
|
|||||||||
13.
Fair Value Measurements
We classify our assets and liabilities that are carried at fair value within the fair value hierarchy. This hierarchy ranks the quality and reliability of the inputs used to determine fair values, which are then classified and disclosed in one of three categories. The three levels of the fair value hierarchy are:
123
Level 1 — Unadjusted quoted prices in active markets for identical assets or liabilities that we have the ability to access at the measurement date. Active markets are those in which transactions for the asset or liability occur in sufficient frequency and volume to provide information on an ongoing basis. This category includes exchange traded equities, exchange traded derivative instruments, cash equivalents, and investments in U.S. Treasury securities.
Level 2 — Utilizes quoted prices in active markets for similar assets or liabilities; quoted prices in markets that are not active; and model-derived valuations whose inputs are observable (such as yield curves). This category includes non-exchange traded contracts such as forwards, options, swaps and certain investments in fixed income securities. This category also includes investments that are redeemable and valued based on NAV, such as common and collective trusts and commingled funds.
Level 3 — Valuation models with significant unobservable inputs that are supported by little or no market activity. Instruments in this category include long-dated derivative transactions where valuations are unobservable due to the length of the transaction, options, and transactions in locations where observable market data does not exist. The valuation models we employ utilize spot prices, forward prices, historical market data and other factors to forecast future prices.
Assets and liabilities are classified in their entirety based on the lowest level of input that is significant to the fair value measurement. Thus, a valuation may be classified in Level 3 even though the valuation may include significant inputs that are readily observable. We maximize the use of observable inputs and minimize the use of unobservable inputs. We rely primarily on the market approach of using prices and other market information for identical and/or comparable assets and liabilities. If market data is not readily available, inputs may reflect our own assumptions about the inputs market participants would use. Our assessment of the inputs and the significance of a particular input to the fair value measurement requires judgment and may affect the valuation of fair value assets and liabilities as well as their placement within the fair value hierarchy levels. We assess whether a market is active by obtaining observable broker quotes, reviewing actual market activity, and assessing the volume of transactions. We consider broker quotes observable inputs when the quote is binding on the broker, we can validate the quote with market activity, or we can determine that the inputs the broker used to arrive at the quoted price are observable.
Recurring Fair Value Measurements
We apply recurring fair value measurements to certain cash equivalents, derivative instruments, investments held in our nuclear decommissioning trust and plan assets held in our retirement and other benefit plans. See Note 7 for the fair value discussion of plan assets held in our retirement and other benefit plans.
Cash Equivalents
Cash equivalents represent short-term investments with original maturities of three months or less in exchange traded money market funds that are valued using quoted prices in active markets.
Risk Management Activities — Derivative Instruments
Exchange traded commodity contracts are valued using unadjusted quoted prices. For non-exchange traded commodity contracts, we calculate fair value based on the average of the bid and offer price, discounted to reflect net present value. We maintain certain valuation adjustments for a number of risks associated with the valuation of future commitments. These include valuation adjustments for liquidity and credit risks. The liquidity valuation adjustment represents the cost that would be incurred if all unmatched positions were closed
124
out or hedged. The credit valuation adjustment represents estimated credit losses on our net exposure to counterparties, taking into account netting agreements, expected default experience for the credit rating of the counterparties and the overall diversification of the portfolio. We maintain credit policies that management believes minimize overall credit risk.
Certain non-exchange traded commodity contracts are valued based on unobservable inputs due to the long-term nature of contracts, characteristics of the product, or the unique location of the transactions. Our long-dated energy transactions consist of observable valuations for the near-term portion and unobservable valuations for the long-term portions of the transaction. We rely primarily on broker quotes to value these instruments. When our valuations utilize broker quotes, we perform various control procedures to ensure the quote has been developed consistent with fair value accounting guidance. These controls include assessing the quote for reasonableness by comparison against other broker quotes, reviewing historical price relationships, and assessing market activity. When broker quotes are not available, the primary valuation technique used to calculate the fair value is the extrapolation of forward pricing curves using observable market data for more liquid delivery points in the same region and actual transactions at more illiquid delivery points.
Option contracts are primarily valued using a Black-Scholes option valuation model, which utilizes both observable and unobservable inputs such as broker quotes, interest rates and price volatilities.
When the unobservable portion is significant to the overall valuation of the transaction, the entire transaction is classified as Level 3. Our classification of instruments as Level 3 is primarily reflective of the long-term nature of our energy transactions and the use of option valuation models with significant unobservable inputs.
Our energy risk management committee, consisting of officers and key management personnel, oversees our energy risk management activities to ensure compliance with our stated energy risk management policies. We have a risk control function that is responsible for valuing our derivative commodity instruments in accordance with established policies and procedures. The risk control function reports to the chief financial officer’s organization.
Investments Held in our Nuclear Decommissioning Trust
The nuclear decommissioning trust invests in fixed income securities and equity securities. Equity securities are held indirectly through commingled funds. The commingled funds are valued based on the concept of NAV, which is a value primarily derived from the quoted active market prices of the underlying equity securities. We may transact in these commingled funds on a semi-monthly basis at the NAV, and accordingly classify these investments as Level 2. The commingled funds, which are similar to mutual funds, are maintained by a bank and hold investments in accordance with the stated objective of tracking the performance of the S&P 500 Index. Because the commingled fund shares are offered to a limited group of investors, they are not considered to be traded in an active market.
Cash equivalents reported within Level 2 represent investments held in a short-term investment commingled fund, valued using NAV, which invests in U.S. government fixed income securities. We may transact in this commingled fund on a daily basis at the NAV.
Fixed income securities issued by the U.S. Treasury held directly by the nuclear decommissioning trust are valued using quoted active market prices and are classified as Level 1. Fixed income securities issued by corporations, municipalities, and other agencies, including mortgage-backed instruments, are valued using quoted inactive market prices, quoted active market prices for similar securities, or by utilizing calculations
125
which incorporate observable inputs such as yield curves and spreads relative to such yield curves. These instruments are classified as Level 2. Whenever possible, multiple market quotes are obtained which enables a cross-check validation. A primary price source is identified based on asset type, class, or issue of securities.
We price securities using information provided by our trustee for our nuclear decommissioning trust assets. Our trustee uses pricing services that utilize the valuation methodologies described to determine fair market value. We have internal control procedures designed to ensure this information is consistent with fair value accounting guidance. These procedures include assessing valuations using an independent pricing source, verifying that pricing can be supported by actual recent market transactions, assessing hierarchy classifications, comparing investment returns with benchmarks, and obtaining and reviewing independent audit reports on the trustee’s internal operating controls and valuation processes. See Note 19 for additional discussion about our nuclear decommissioning trust.
Fair Value Tables
The following table presents the fair value at
December 31, 2014
of our assets and liabilities that are measured at fair value on a recurring basis (dollars in millions):
|
|
Quoted Prices
in Active
Markets for
Identical
Assets
(Level 1)
|
Significant
Other
Observable
Inputs
(Level 2)
|
Significant
Unobservable
Inputs (a)
(Level 3)
|
Other
|
|
Balance at December 31, 2014
|
|||||||||||||||
|
Assets
|
|
|
|
|
|
|
|
|
|
|
|
||||||||||
|
Risk management activities — derivative instruments:
|
|
|
|
|
|
|
|
|
|
|
|
||||||||||
|
Commodity Contracts
|
$
|
—
|
|
$
|
21
|
|
$
|
33
|
|
$
|
(23
|
)
|
(b)
|
$
|
31
|
|
|||||
|
Nuclear decommissioning trust:
|
|
|
|
|
|
|
|
|
|
|
|
||||||||||
|
U.S. commingled equity funds
|
—
|
|
310
|
|
—
|
|
—
|
|
|
310
|
|
||||||||||
|
Fixed income securities:
|
|
|
|
|
|
|
|
|
|
|
|
||||||||||
|
U.S. Treasury
|
119
|
|
—
|
|
—
|
|
—
|
|
|
119
|
|
||||||||||
|
Cash and cash equivalent funds
|
—
|
|
11
|
|
—
|
|
(7
|
)
|
(c)
|
4
|
|
||||||||||
|
Corporate debt
|
—
|
|
109
|
|
—
|
|
—
|
|
|
109
|
|
||||||||||
|
Mortgage-backed securities
|
—
|
|
89
|
|
—
|
|
—
|
|
|
89
|
|
||||||||||
|
Municipality bonds
|
—
|
|
69
|
|
—
|
|
—
|
|
|
69
|
|
||||||||||
|
Other
|
—
|
|
14
|
|
—
|
|
—
|
|
|
14
|
|
||||||||||
|
Subtotal nuclear decommissioning trust
|
119
|
|
602
|
|
—
|
|
(7
|
)
|
|
714
|
|
||||||||||
|
Total
|
$
|
119
|
|
$
|
623
|
|
$
|
33
|
|
$
|
(30
|
)
|
|
$
|
745
|
|
|||||
|
Liabilities
|
|
|
|
|
|
|
|
|
|
|
|
||||||||||
|
Risk management activities — derivative instruments:
|
|
|
|
|
|
|
|
|
|
|
|
||||||||||
|
Commodity contracts
|
$
|
—
|
|
$
|
(95
|
)
|
$
|
(74
|
)
|
$
|
59
|
|
(b)
|
$
|
(110
|
)
|
|||||
|
(a)
|
Primarily consists of heat rate options and other long-dated electricity contracts.
|
|
(b)
|
Represents counterparty netting, margin and collateral. See Note 16.
|
|
(c)
|
Represents nuclear decommissioning trust net pending securities sales and purchases.
|
126
The following table presents the fair value at
December 31, 2013
of our assets and liabilities that are measured at fair value on a recurring basis (dollars in millions):
|
|
Quoted Prices
in Active
Markets for
Identical
Assets
(Level 1)
|
Significant
Other
Observable
Inputs
(Level 2)
|
Significant
Unobservable
Inputs (a)
(Level 3)
|
Other
|
|
Balance at December 31, 2013
|
|||||||||||||||
|
Assets
|
|
|
|
|
|
|
|
|
|
|
|
||||||||||
|
Risk management activities — derivative instruments:
|
|
|
|
|
|
|
|
|
|
|
|
||||||||||
|
Commodity Contracts
|
$
|
—
|
|
$
|
9
|
|
$
|
41
|
|
$
|
(9
|
)
|
(b)
|
$
|
41
|
|
|||||
|
Nuclear decommissioning trust:
|
|
|
|
|
|
|
|
|
|
|
|
||||||||||
|
U.S. commingled equity funds
|
—
|
|
272
|
|
—
|
|
—
|
|
|
272
|
|
||||||||||
|
Fixed income securities:
|
|
|
|
|
|
|
|
|
|
|
|
||||||||||
|
U.S. Treasury
|
107
|
|
—
|
|
—
|
|
—
|
|
|
107
|
|
||||||||||
|
Cash and cash equivalent funds
|
—
|
|
11
|
|
—
|
|
(3
|
)
|
(c)
|
8
|
|
||||||||||
|
Corporate debt
|
—
|
|
88
|
|
—
|
|
—
|
|
|
88
|
|
||||||||||
|
Mortgage-backed securities
|
—
|
|
85
|
|
—
|
|
—
|
|
|
85
|
|
||||||||||
|
Municipality bonds
|
—
|
|
71
|
|
—
|
|
—
|
|
|
71
|
|
||||||||||
|
Other
|
—
|
|
11
|
|
—
|
|
—
|
|
|
11
|
|
||||||||||
|
Subtotal nuclear decommissioning trust
|
107
|
|
538
|
|
—
|
|
(3
|
)
|
|
642
|
|
||||||||||
|
Total
|
$
|
107
|
|
$
|
547
|
|
$
|
41
|
|
$
|
(12
|
)
|
|
$
|
683
|
|
|||||
|
Liabilities
|
|
|
|
|
|
|
|
|
|
|
|
||||||||||
|
Risk management activities — derivative instruments:
|
|
|
|
|
|
|
|
|
|
|
|
||||||||||
|
Commodity contracts
|
$
|
—
|
|
$
|
(33
|
)
|
$
|
(90
|
)
|
$
|
21
|
|
(b)
|
$
|
(102
|
)
|
|||||
|
(a)
|
Primarily consists of heat rate options and other long-dated electricity contracts.
|
|
(b)
|
Represents counterparty netting, margin and collateral. See Note 16.
|
|
(c)
|
Represents nuclear decommissioning trust net pending securities sales and purchases.
|
Fair Value Measurements Classified as Level 3
The significant unobservable inputs used in the fair value measurement of our energy derivative contracts include broker quotes that cannot be validated as an observable input primarily due to the long-term nature of the quote and option model inputs. Significant changes in these inputs in isolation would result in significantly higher or lower fair value measurements. Changes in our derivative contract fair values, including changes relating to unobservable inputs, typically will not impact net income due to regulatory accounting treatment (see Note 3).
Because our forward commodity contracts classified as Level 3 are currently in a net purchase position, we would expect price increases of the underlying commodity to result in increases in the net fair value of the related contracts. Conversely, if the price of the underlying commodity decreases, the net fair value of the related contracts would likely decrease.
Our option contracts classified as Level 3 primarily relate to purchase heat rate options. The significant unobservable inputs for these instruments include electricity prices, gas prices and volatilities. If
127
electricity prices and electricity price volatilities increase, we would expect the fair value of these options to increase, and if these valuation inputs decrease, we would expect the fair value of these options to decrease. If natural gas prices and natural gas price volatilities increase, we would expect the fair value of these options to decrease, and if these inputs decrease, we would expect the fair value of the options to increase. The commodity prices and volatilities do not always move in corresponding directions. The options’ fair values are impacted by the net changes of these various inputs.
Other unobservable valuation inputs include credit and liquidity reserves which do not have a material impact on our valuations; however, significant changes in these inputs could also result in higher or lower fair value measurements.
The following tables provide information regarding our significant unobservable inputs used to value our risk management derivative Level 3 instruments at
December 31, 2014
and
December 31, 2013
:
|
|
December 31, 2014
Fair Value (millions) |
Valuation Technique
|
Significant Unobservable Input
|
Range
|
Weighted-Average
|
||||||||||||
|
Commodity Contracts
|
Assets
|
Liabilities
|
|||||||||||||||
|
Electricity:
|
|
|
|
|
|
|
|
|
|
||||||||
|
Forward Contracts (a)
|
$
|
30
|
|
$
|
56
|
|
Discounted cash flows
|
Electricity forward price (per MWh)
|
$19.51 - $56.72
|
$
|
35.27
|
|
|||||
|
Option Contracts (b)
|
—
|
|
15
|
|
Option model
|
Electricity forward price (per MWh)
|
$32.14 - $66.09
|
$
|
45.83
|
|
|||||||
|
|
|
|
|
|
|
Natural gas forward price (per MMbtu)
|
$3.18 - $3.29
|
$
|
3.25
|
|
|||||||
|
|
|
|
|
|
|
Electricity price volatilities
|
23% - 63%
|
41
|
%
|
||||||||
|
|
|
|
|
|
|
Natural gas price volatilities
|
23% - 41%
|
31
|
%
|
||||||||
|
Natural Gas:
|
|
|
|
|
|
|
|
|
|
||||||||
|
Forward Contracts (a)
|
3
|
|
3
|
|
Discounted cash flows
|
Natural gas forward price (per MMbtu)
|
$2.98 - $4.13
|
$
|
3.45
|
|
|||||||
|
Total
|
$
|
33
|
|
$
|
74
|
|
|
|
|
|
|
||||||
|
(a)
|
Includes swaps and physical and financial contracts.
|
|
(b)
|
Electricity and natural gas price volatilities are estimated based on historical forward price movements due to lack of market quotes for implied volatilities.
|
128
|
|
December 31, 2013
Fair Value (millions) |
Valuation Technique
|
Significant Unobservable Input
|
Range
|
Weighted-Average
|
||||||||||||
|
Commodity Contracts
|
Assets
|
Liabilities
|
|||||||||||||||
|
Electricity:
|
|
|
|
|
|
|
|
|
|
||||||||
|
Forward Contracts (a)
|
$
|
40
|
|
$
|
66
|
|
Discounted cash flows
|
Electricity forward price (per MWh)
|
$24.89 - $65.04
|
$
|
41.09
|
|
|||||
|
Option Contracts (b)
|
—
|
|
19
|
|
Option model
|
Electricity forward price (per MWh)
|
$39.91 - $85.41
|
$
|
58.70
|
|
|||||||
|
|
|
|
|
|
|
Natural gas forward price (per MMbtu)
|
$3.57 - $3.80
|
$
|
3.71
|
|
|||||||
|
|
|
|
|
|
|
Electricity price volatilities
|
35% - 94%
|
59
|
%
|
||||||||
|
|
|
|
|
|
|
Natural gas price volatilities
|
22% - 36%
|
27
|
%
|
||||||||
|
Natural Gas:
|
|
|
|
|
|
|
|
|
|
||||||||
|
Forward Contracts (a)
|
1
|
|
5
|
|
Discounted cash flows
|
Natural gas forward price (per MMbtu)
|
$3.47 - $4.31
|
$
|
3.87
|
|
|||||||
|
Total
|
$
|
41
|
|
$
|
90
|
|
|
|
|
|
|
||||||
|
(a)
|
Includes swaps and physical and financial contracts.
|
|
(b)
|
Electricity and natural gas price volatilities are estimated based on historical forward price movements due to lack of market quotes for implied volatilities.
|
The following table shows the changes in fair value for our risk management activities’ assets and liabilities that are measured at fair value on a recurring basis using Level 3 inputs for the years ended
December 31, 2014
and
2013
(dollars in millions):
|
|
Year Ended
December 31,
|
|||||||
|
Commodity Contracts
|
2014
|
2013
|
||||||
|
Net derivative balance at beginning of period
|
$
|
(49
|
)
|
$
|
(48
|
)
|
||
|
Total net gains (losses) realized/unrealized:
|
|
|
|
|
||||
|
Included in earnings
|
—
|
|
—
|
|
||||
|
Included in OCI
|
—
|
|
—
|
|
||||
|
Deferred as a regulatory asset or liability
|
—
|
|
(10
|
)
|
||||
|
Settlements
|
12
|
|
10
|
|
||||
|
Transfers into Level 3 from Level 2
|
(2
|
)
|
—
|
|
||||
|
Transfers from Level 3 into Level 2
|
(2
|
)
|
(1
|
)
|
||||
|
Net derivative balance at end of period
|
$
|
(41
|
)
|
$
|
(49
|
)
|
||
|
Net unrealized gains included in earnings related to instruments still held at end of period
|
$
|
—
|
|
$
|
—
|
|
||
Amounts included in earnings are recorded in either operating revenues or fuel and purchased power depending on the nature of the underlying contract.
129
Transfers reflect the fair market value at the beginning of the period and are triggered by a change in the lowest significant input as of the end of the period. We had
no
significant Level 1 transfers to or from any other hierarchy level. Transfers in or out of Level 3 are typically related to our long-dated energy transactions that extend beyond available quoted periods.
Financial Instruments Not Carried at Fair Value
The carrying value of our net accounts receivable, accounts payable and short-term borrowings approximate fair value. Our short-term borrowings are classified within Level 2 of the fair value hierarchy. See Note 6 for our long-term debt fair values.
14.
Earnings Per Share
The following table presents the calculation of Pinnacle West’s basic and diluted earnings per share for continuing operations attributable to common shareholders for the years ended
December 31, 2014
,
2013
and
2012
(in thousands, except per share amounts):
|
|
2014
|
2013
|
2012
|
||||||||
|
Income from continuing operations attributable to common shareholders
|
$
|
397,595
|
|
$
|
406,074
|
|
$
|
387,380
|
|
||
|
Weighted average common shares outstanding — basic
|
110,626
|
|
109,984
|
|
109,510
|
|
|||||
|
Net effect of dilutive securities:
|
|
|
|
|
|
|
|||||
|
Contingently issuable performance shares and restricted stock units
|
552
|
|
822
|
|
1,017
|
|
|||||
|
Weighted average common shares outstanding — diluted
|
111,178
|
|
110,806
|
|
110,527
|
|
|||||
|
Earnings per average common share outstanding:
|
|||||||||||
|
Income from continuing operations attributable to common shareholders — basic
|
$
|
3.59
|
|
$
|
3.69
|
|
$
|
3.54
|
|
||
|
Income from continuing operations attributable to common shareholders — diluted
|
$
|
3.58
|
|
$
|
3.66
|
|
$
|
3.50
|
|
||
15.
Stock-Based Compensation
Pinnacle West grants long-term incentive awards under the 2012 Long-Term Incentive Plan (“2012 Plan”) in the form of Stock Grants, Restricted Stock Units, Stock Units and Performance Shares and may grant restricted stock, dividend equivalents, performance share units, performance cash, incentive and non-qualified stock options, and stock appreciation rights. The 2012 Plan, effective May 16, 2012, provides
4,595,500
common shares to be available for grant to eligible employees and members of the Board of Directors. Awards made since 2012 were issued under the 2012 Plan, and prior awards from 2007 to 2011 were issued under the 2007 Long-Term Incentive Plan (“2007 Plan”).
Restricted Stock Unit Awards, Stock Unit Awards and Stock Grants
Stock grants issued to non-officer members of the Board of Directors in
2014
,
2013
and
2012
provided the members of the Board of Directors the option to elect to receive a stock grant, or to defer receipt until a later date and receive restricted stock units in 2012 and stock units in 2013 and 2014 in lieu of the stock grant. The members of the Board of Directors who elect to defer may elect to receive payment in either stock, or
50%
in cash and
50%
in stock. The members of the Board of Directors may elect to receive payments either as of
130
the last business day of the month following the month in which they separate from service on the Board of Directors, or as of a specified date, which must be after December 31 of the year in which the grant was received. The deferred restricted stock units and stock units accrue dividend rights, equal to the amount of dividends the Directors would have received had they directly owned stock equal to the number of vested restricted stock units or stock units from the date of grant to the date of payment plus interest compounded quarterly. The dividends and interest are paid, based on the Director’s election, in either stock, or
50%
in cash and
50%
in stock.
Restricted stock units have been granted to officers and key employees in each year since 2008. From 2008 through 2009, officers and key employees elected to receive payment in either cash or in fully transferable shares of stock, in exchange for each restricted stock unit on pre-established valuation dates. From 2010 through 2014, officers and key employees elected to receive payment in either stock, or
50%
in cash and
50%
in stock.
Restricted stock unit awards vest and settle over a
4
-year period. In addition, officers and key employees accrue dividend rights on vested restricted stock units, equal to the amount of dividends that they would have received had they directly owned stock, equal to the number of vested restricted stock units from the date of grant to the date of payment plus interest compounded quarterly. The dividends and interest for the 2008 and 2009 awards were paid in cash. The dividends and interest for the 2010 through 2014 awards are paid in the same form as the restricted stock unit payment election. Restricted stock unit awards are accounted for as a liability award, with compensation cost initially calculated on the date of grant using the Company’s closing stock price, and remeasured at each balance sheet date. Compensation expense for retirement eligible participants is recognized immediately.
In December 2012, the Company granted a retention award of
50,617
restricted stock units to the Chairman of the Board, President, and Chief Executive Officer of Pinnacle West. The award will vest and will be paid in shares of common stock on December 31, 2016, provided that he remains employed with the Company until the vesting date. The award will accrue notional dividends equal to the amount of dividends that would have been received if the Chairman of the Board, President and Chief Executive Officer had directly owned
one
share of Pinnacle West common stock for each restricted stock unit held from the grant date to each dividend payment date. The award can be increased up to an additional
33,745
restricted stock units payable in stock if certain performance requirements are met.
A grant of restricted stock unit awards was made to officers of the company on February 15, 2011, payable solely in shares of common stock upon the officer’s retirement or other separation of employment. This award vested
50%
on February 15, 2013 and
25%
on February 15, 2014. The remaining award will vest
25%
on February 15, 2015, provided that the officer remains employed on such date. The officers will also accrue notional dividends equal to the amount of dividends that they would have received if they had directly owned
one
share of Pinnacle West common stock for each restricted stock unit held from the grant date to each dividend payment date. Each additional restricted stock unit will proportionally vest on the same remaining vesting schedule that applies to the original restricted stock unit.
The following table is a summary of granted restricted stock units, stock units and stock grants and the weighted-average fair value for the
3
years ended
2014
,
2013
and
2012
:
|
|
2014
|
2013
|
2012
|
||||||||
|
Units granted
|
130,273
|
|
129,620
|
|
202,278
|
|
|||||
|
Grant date fair value (a)
|
$
|
54.91
|
|
$
|
55.21
|
|
$
|
49.31
|
|
||
|
(a)
|
Weighted-average grant date fair value.
|
131
The following table is a summary of the status of restricted stock units, stock units and stock grants, as of
December 31, 2014
and changes during the year. This table represents only the stock portion of restricted stock units and stock units, per the election on payment discussed in the paragraph above:
|
Nonvested shares
|
Shares
|
Weighted-Average
Grant Date
Fair Value
|
|||||
|
Nonvested at January 1, 2014
|
397,976
|
|
$
|
47.74
|
|
||
|
Granted
|
130,273
|
|
54.91
|
|
|||
|
Vested
|
(161,283
|
)
|
45.55
|
|
|||
|
Forfeited
|
(13,067
|
)
|
51.53
|
|
|||
|
Nonvested at December 31, 2014
|
353,899
|
|
51.23
|
|
|||
The amount of cash required to settle the payments on restricted stock units is (dollars in millions):
|
Year
|
2014
|
2013
|
2012
|
|||||||||
|
2008 Grant
|
$
|
—
|
|
$
|
—
|
|
$
|
1.9
|
|
|||
|
2009 Grant
|
—
|
|
3.0
|
|
1.7
|
|
||||||
|
2010 Grant
|
2.3
|
|
2.3
|
|
0.6
|
|
||||||
|
2011 Grant
|
2.4
|
|
2.5
|
|
0.7
|
|
||||||
|
2012 Grant
|
2.1
|
|
2.2
|
|
—
|
|
||||||
|
2013 Grant
|
2.1
|
|
—
|
|
—
|
|
||||||
Performance Share Awards
Performance share awards have been granted to officers and key employees under the 2012 Plan since 2012 and under the 2007 Plan from 2009 to 2011. Performance share awards contain
two
performance element criteria that affect the number of shares received after the end of a
three
-year performance period if performance criteria conditions are met.
The
2014
,
2013
and
2012
performance share grant criteria is based
50%
upon the percentile ranking of Pinnacle West’s total shareholder return at the end of the three-year performance period, as compared with the total shareholder return of all relevant companies in a specified utility index and the other
50%
is based upon
six
non-financial separate performance metrics. The exact number of shares issued will vary from
0%
to
200%
of the target award. Shares received include dividend rights paid in stock equal to the amount of dividends that they would have received had they directly owned stock, equal to the number of vested performance shares from the date of grant to the date of payment plus interest compounded quarterly.
Performance share awards are accounted for as liability awards, with compensation cost initially calculated on the date of grant using the Company’s closing stock price, and remeasured at each balance sheet date. Compensation expense for retirement eligible participants is recognized immediately. Management also evaluates the probability of meeting the performance criteria at each balance sheet date. If performance criteria are not achieved, no compensation cost is recognized and any previously recognized compensation cost is reversed.
The following table is a summary of the performance shares granted and the weighted-average fair value for the three years ended
2014
,
2013
and
2012
:
132
|
|
2014
|
2013
|
2012
|
||||||||
|
Units granted (a)
|
166,244
|
|
176,332
|
|
185,878
|
|
|||||
|
Grant date fair value (b)
|
$
|
54.86
|
|
$
|
55.45
|
|
$
|
47.40
|
|
||
(a)
Reflects the target payout level.
(b)
Weighted-average grant date fair value.
The following table is a summary of the status of performance shares as of
December 31, 2014
and changes during the year:
|
Nonvested shares (a)
|
Shares
|
Weighted-Average
Grant Date
Fair Value
|
|||||
|
Nonvested at January 1, 2014
|
344,396
|
|
$
|
51.13
|
|
||
|
Granted
|
166,244
|
|
54.86
|
|
|||
|
Increase in performance factor
|
86,558
|
|
47.40
|
|
|||
|
Vested
|
(258,224
|
)
|
47.40
|
|
|||
|
Forfeited
|
(14,744
|
)
|
53.30
|
|
|||
|
Nonvested at December 31, 2014
|
324,230
|
|
54.92
|
|
|||
|
(a)
|
Nonvested shares are reflected at target payout level. The increase or decrease in the number of shares from the target level to the estimated actual payout level is included in the increase for performance factor amounts in the year the award vests.
|
Stock Options
The Company has not granted stock options since 2004 and has no stock options outstanding.
As of
December 31, 2014
, there was
$15 million
of total unrecognized compensation cost related to nonvested share-based compensation arrangements granted under the plans. That cost is expected to be recognized over a weighted-average period of
2
years. The total fair value of shares vested during
2014
,
2013
and
2012
was
$20 million
,
$20 million
and
$19 million
, respectively.
The compensation cost that has been charged against Pinnacle West’s income for share-based compensation plans was
$33 million
in
2014
,
$25 million
in
2013
, and
$32 million
in
2012
. The compensation cost that Pinnacle West has capitalized is immaterial for all years. Pinnacle West’s total income tax benefit recognized in the Consolidated Statements of Income for share-based compensation arrangements was
$13 million
in
2014
,
$10 million
in
2013
, and
$13 million
in
2012
. APS’s share of compensation cost that has been charged against income was
$33 million
in
2014
,
$25 million
in
2013
, and
$32 million
in
2012
.
Pinnacle West’s current policy is to issue new shares to satisfy share requirements for stock compensation plans, and it does not expect to repurchase any shares except to satisfy tax withholding obligations upon the vesting of restricted stock units and performance shares.
133
16.
Derivative Accounting
We are exposed to the impact of market fluctuations in the commodity price and transportation costs of electricity, natural gas, coal, emissions allowances and in interest rates. We manage risks associated with market volatility by utilizing various physical and financial derivative instruments, including futures, forwards, options and swaps. As part of our overall risk management program, we may use derivative instruments to hedge purchases and sales of electricity and fuels. Derivative instruments that meet certain hedge accounting criteria may be designated as cash flow hedges and are used to limit our exposure to cash flow variability on forecasted transactions. The changes in market value of such instruments have a high correlation to price changes in the hedged transactions. We also enter into derivative instruments for economic hedging purposes. While we believe the economic hedges mitigate exposure to fluctuations in commodity prices, these instruments have not been designated as accounting hedges. Contracts that have the same terms (quantities, delivery points and delivery periods) and for which power does not flow are netted, which reduces both revenues and fuel and purchased power costs in our Consolidated Statements of Income, but does not impact our financial condition, net income or cash flows.
On June 1, 2012, we elected to discontinue cash flow hedge accounting treatment for the significant majority of our contracts that had previously been designated as cash flow hedges. This discontinuation is due to changes in PSA recovery (see Note 3), which now allows for
100%
deferral of the unrealized gains and losses relating to these contracts. For those contracts that were de-designated, all changes in fair value after May 31, 2012 are no longer recorded through OCI, but are deferred through the PSA. The amounts previously recorded in accumulated OCI relating to these instruments will remain in accumulated OCI, and will transfer to earnings in the same period or periods during which the hedged transaction affects earnings or sooner if we determine it is probable that the forecasted transaction will not occur. When amounts have been reclassified from accumulated OCI to earnings, they will be subject to deferral in accordance with the PSA. Cash flow hedge accounting treatment will continue for a limited number of contracts that are not subject to PSA recovery.
Our derivative instruments, excluding those qualifying for a scope exception, are recorded on the balance sheet as an asset or liability and are measured at fair value. See Note 13 for a discussion of fair value measurements. Derivative instruments may qualify for the normal purchases and normal sales scope exception if they require physical delivery and the quantities represent those transacted in the normal course of business. Derivative instruments qualifying for the normal purchases and sales scope exception are accounted for under the accrual method of accounting and excluded from our derivative instrument discussion and disclosures below.
Hedge effectiveness is the degree to which the derivative instrument contract and the hedged item are correlated and is measured based on the relative changes in fair value of the derivative instrument contract and the hedged item over time. We assess hedge effectiveness both at inception and on a continuing basis. These assessments exclude the time value of certain options. For accounting hedges that are deemed an effective hedge, the effective portion of the gain or loss on the derivative instrument is reported as a component of OCI and reclassified into earnings in the same period during which the hedged transaction affects earnings. We recognize in current earnings, subject to the PSA, the gains and losses representing hedge ineffectiveness, and the gains and losses on any hedge components which are excluded from our effectiveness assessment. As cash flow hedge accounting has been discontinued for the significant majority of our contracts, after May 31, 2012, effectiveness testing is no longer being performed for these contracts.
For its regulated operations, APS defers for future rate treatment
100%
of the unrealized gains and losses on derivatives pursuant to the PSA mechanism that would otherwise be recognized in income. Realized
134
gains and losses on derivatives are deferred in accordance with the PSA to the extent the amounts are above or below the Base Fuel Rate (see Note 3). Gains and losses from derivatives in the following tables represent the amounts reflected in income before the effect of PSA deferrals.
As of
December 31, 2014
, we had the following outstanding gross notional volume of derivatives, which represent both purchases and sales (does not reflect net position):
|
Commodity
|
Quantity
|
||||
|
Power
|
3,915
|
|
GWh
|
||
|
Gas
|
136
|
|
Bcf (a)
|
||
|
(a)
|
“Bcf” is Billion Cubic Feet.
|
Gains and Losses from Derivative Instruments
The following table provides information about gains and losses from derivative instruments in designated cash flow accounting hedging relationships during the years ended
December 31, 2014
,
2013
and
2012
(dollars in thousands):
|
Financial Statement
|
Year Ended
December 31,
|
|||||||||||||
|
Commodity Contracts
|
Location
|
2014
|
2013
|
2012
|
||||||||||
|
Loss Recognized in OCI on Derivative Instruments (Effective Portion)
|
OCI — derivative instruments
|
$
|
(372
|
)
|
$
|
(353
|
)
|
$
|
(37,663
|
)
|
||||
|
Loss Reclassified from Accumulated OCI into Income (Effective Portion Realized) (a)
|
Fuel and purchased power (b)
|
(21,415
|
)
|
(44,219
|
)
|
(99,007
|
)
|
|||||||
|
Gain Recognized in Income (Ineffective Portion and Amount Excluded from Effectiveness Testing)
|
Fuel and purchased power (b)
|
—
|
|
—
|
|
117
|
|
|||||||
|
(a)
|
During the years ended
December 31, 2014
,
2013
, and
2012
, we had
zero
,
zero
, and
$1.8 million
of losses reclassified from accumulated OCI to earnings related to discontinued cash flow hedges.
|
|
(b)
|
Amounts are before the effect of PSA deferrals.
|
During the next twelve months, we estimate that a net loss of
$6 million
before income taxes will be reclassified from accumulated OCI as an offset to the effect of market price changes for the related hedged transactions. In accordance with the PSA, substantially all of these amounts will be recorded as either a regulatory asset or liability and have no immediate effect on earnings.
135
The following table provides information about gains and losses from derivative instruments not designated as accounting hedging instruments during the years ended
December 31, 2014
,
2013
and
2012
(dollars in thousands):
|
Financial Statement
|
Year Ended
December 31,
|
|||||||||||||
|
Commodity Contracts
|
Location
|
2014
|
2013
|
2012
|
||||||||||
|
Net Gain Recognized in Income
|
Operating revenues
|
$
|
324
|
|
$
|
289
|
|
$
|
103
|
|
||||
|
Net Loss Recognized in Income
|
Fuel and purchased power (a)
|
(66,367
|
)
|
(10,449
|
)
|
(2,747
|
)
|
|||||||
|
Total
|
|
$
|
(66,043
|
)
|
$
|
(10,160
|
)
|
$
|
(2,644
|
)
|
||||
|
(a)
|
Amounts are before the effect of PSA deferrals.
|
Derivative Instruments in the Consolidated Balance Sheets
Our derivative transactions are typically executed under standardized or customized agreements, which include collateral requirements and, in the event of a default, would allow for the netting of positive and negative exposures associated with a single counterparty. Agreements that allow for the offsetting of positive and negative exposures associated with a single counterparty are considered master netting arrangements. Transactions with counterparties that have master netting arrangements are offset and reported net on the Consolidated Balance Sheets. Transactions that do not allow for offsetting of positive and negative positions are reported gross on the Consolidated Balance Sheets.
We do not offset a counterparty’s current derivative contracts with the counterparty’s non-current derivative contracts, although our master netting arrangements would allow current and non-current positions to be offset in the event of a default. Additionally, in the event of a default, our master netting arrangements would allow for the offsetting of all transactions executed under the master netting arrangement. These types of transactions may include non-derivative instruments, derivatives qualifying for scope exceptions, trade receivables and trade payables arising from settled positions, and other forms of non-cash collateral (such as letters of credit). These types of transactions are excluded from the offsetting tables presented below.
The significant majority of our derivative instruments are not currently designated as hedging instruments. The Consolidated Balance Sheets as of
December 31, 2014
and
December 31, 2013
, include gross liabilities of
$4 million
and
$5 million
, respectively, of derivative instruments designated as hedging instruments.
136
The following tables provide information about the fair value of our risk management activities reported on a gross basis, and the impacts of offsetting as of
December 31, 2014
and
2013
. These amounts relate to commodity contracts and are located in the assets and liabilities from risk management activities lines of our Consolidated Balance Sheets.
|
As of December 31, 2014:
(dollars in thousands) |
Gross
Recognized
Derivatives
(a)
|
Amounts
Offset
(b)
|
Net
Recognized
Derivatives
|
Other
(c)
|
Amount
Reported on
Balance Sheet
|
|||||||||||||||
|
Current Assets
|
$
|
28,562
|
|
$
|
(15,127
|
)
|
$
|
13,435
|
|
$
|
350
|
|
$
|
13,785
|
|
|||||
|
Investments and Other Assets
|
24,810
|
|
(7,190
|
)
|
17,620
|
|
—
|
|
17,620
|
|
||||||||||
|
Total Assets
|
53,372
|
|
(22,317
|
)
|
31,055
|
|
350
|
|
31,405
|
|
||||||||||
|
Current Liabilities
|
(86,062
|
)
|
33,829
|
|
(52,233
|
)
|
(7,443
|
)
|
(59,676
|
)
|
||||||||||
|
Deferred Credits and Other
|
(82,990
|
)
|
32,388
|
|
(50,602
|
)
|
—
|
|
(50,602
|
)
|
||||||||||
|
Total Liabilities
|
(169,052
|
)
|
66,217
|
|
(102,835
|
)
|
(7,443
|
)
|
(110,278
|
)
|
||||||||||
|
Total
|
$
|
(115,680
|
)
|
$
|
43,900
|
|
$
|
(71,780
|
)
|
$
|
(7,093
|
)
|
$
|
(78,873
|
)
|
|||||
|
(a)
|
All of our gross recognized derivative instruments were subject to master netting arrangements.
|
|
(b)
|
Includes cash collateral provided to counterparties of
$43,900
.
|
|
(c)
|
Represents cash collateral and margin that is not subject to offsetting. Amounts relate to non-derivative instruments, derivatives qualifying for scope exceptions, or collateral and margin posted in excess of the recognized derivative instrument. Includes cash collateral received from counterparties of
$7,443
, and cash margin provided to counterparties of
$350
.
|
|
As of December 31, 2013:
(dollars in thousands) |
Gross
Recognized
Derivatives
(a)
|
Amounts
Offset
(b)
|
Net
Recognized
Derivatives
|
Other
(c)
|
Amount
Reported on
Balance Sheet
|
|||||||||||||||
|
Current Assets
|
$
|
24,587
|
|
$
|
(7,425
|
)
|
$
|
17,162
|
|
$
|
7
|
|
$
|
17,169
|
|
|||||
|
Investments and Other Assets
|
25,364
|
|
(1,549
|
)
|
23,815
|
|
—
|
|
23,815
|
|
||||||||||
|
Total Assets
|
49,951
|
|
(8,974
|
)
|
40,977
|
|
7
|
|
40,984
|
|
||||||||||
|
Current Liabilities
|
(50,540
|
)
|
26,166
|
|
(24,374
|
)
|
(7,518
|
)
|
(31,892
|
)
|
||||||||||
|
Deferred Credits and Other
|
(72,123
|
)
|
1,808
|
|
(70,315
|
)
|
—
|
|
(70,315
|
)
|
||||||||||
|
Total Liabilities
|
(122,663
|
)
|
27,974
|
|
(94,689
|
)
|
(7,518
|
)
|
(102,207
|
)
|
||||||||||
|
Total
|
$
|
(72,712
|
)
|
$
|
19,000
|
|
$
|
(53,712
|
)
|
$
|
(7,511
|
)
|
$
|
(61,223
|
)
|
|||||
|
(a)
|
All of our gross recognized derivative instruments were subject to master netting arrangements.
|
|
(b)
|
Includes cash collateral provided to counterparties of
$19,000
.
|
|
(c)
|
Represents cash collateral and margin that is not subject to offsetting. Amounts relate to non-derivative instruments, derivatives qualifying for scope exceptions, or collateral and margin posted in excess of the recognized derivative instrument. Includes cash collateral received from counterparties of
$7,518
, and cash margin provided to counterparties of
$7
.
|
137
Credit Risk and Credit Related Contingent Features
We are exposed to losses in the event of nonperformance or nonpayment by counterparties. We have risk management contracts with many counterparties, including
one
counterparty for which our exposure represents approximately
90%
of Pinnacle West’s
$31 million
of risk management assets as of
December 31, 2014
. This exposure relates to a long-term traditional wholesale contract with a counterparty that has a high credit quality. Our risk management process assesses and monitors the financial exposure of all counterparties. Despite the fact that the great majority of trading counterparties’ debt is rated as investment grade by the credit rating agencies, there is still a possibility that one or more of these companies could default, resulting in a material impact on consolidated earnings for a given period. Counterparties in the portfolio consist principally of financial institutions, major energy companies, municipalities and local distribution companies. We maintain credit policies that we believe minimize overall credit risk to within acceptable limits. Determination of the credit quality of our counterparties is based upon a number of factors, including credit ratings and our evaluation of their financial condition. To manage credit risk, we employ collateral requirements and standardized agreements that allow for the netting of positive and negative exposures associated with a single counterparty. Valuation adjustments are established representing our estimated credit losses on our overall exposure to counterparties.
Certain of our derivative instrument contracts contain credit-risk-related contingent features including, among other things, investment grade credit rating provisions, credit-related cross-default provisions, and adequate assurance provisions. Adequate assurance provisions allow a counterparty with reasonable grounds for uncertainty to demand additional collateral based on subjective events and/or conditions. For those derivative instruments in a net liability position, with investment grade credit contingencies, the counterparties could demand additional collateral if our debt credit rating were to fall below investment grade (below BBB- for Standard & Poor’s or Fitch or Baa3 for Moody’s).
The following table provides information about our derivative instruments that have credit-risk-related contingent features at
December 31, 2014
(dollars in millions):
|
|
December 31, 2014
|
||
|
Aggregate Fair Value of Derivative Instruments in a Net Liability Position
|
$
|
169
|
|
|
Cash Collateral Posted
|
44
|
|
|
|
Additional Cash Collateral in the Event Credit-Risk Related Contingent Features were Fully Triggered (a)
|
80
|
|
|
|
(a)
|
This amount is after counterparty netting and includes those contracts which qualify for scope exceptions, which are excluded from the derivative details above.
|
We also have energy related non-derivative instrument contracts with investment grade credit-related contingent features, which could also require us to post additional collateral of approximately
$175 million
if our debt credit ratings were to fall below investment grade.
17.
Other Income and Other Expense
The following table provides detail of other income and other expense for
2014
,
2013
and
2012
(dollars in thousands):
138
|
|
2014
|
2013
|
2012
|
||||||||
|
Other income:
|
|
|
|
|
|
|
|||||
|
Interest income
|
$
|
1,010
|
|
$
|
1,629
|
|
$
|
1,239
|
|
||
|
Debt return on the purchase of Four Corners units 4 & 5
|
8,386
|
|
—
|
|
—
|
|
|||||
|
Miscellaneous
|
212
|
|
75
|
|
367
|
|
|||||
|
Total other income
|
$
|
9,608
|
|
$
|
1,704
|
|
$
|
1,606
|
|
||
|
Other expense:
|
|
|
|
|
|
|
|||||
|
Non-operating costs
|
$
|
(9,657
|
)
|
$
|
(8,207
|
)
|
$
|
(7,777
|
)
|
||
|
Investment loss — net
|
(9,426
|
)
|
(3,711
|
)
|
(2,453
|
)
|
|||||
|
Miscellaneous
|
(2,663
|
)
|
(4,106
|
)
|
(9,612
|
)
|
|||||
|
Total other expense
|
$
|
(21,746
|
)
|
$
|
(16,024
|
)
|
$
|
(19,842
|
)
|
||
18.
Palo Verde Sale Leaseback Variable Interest Entities
In 1986, APS entered into agreements with
three
separate VIE lessor trusts in order to sell and lease back interests in Palo Verde Unit 2 and related common facilities. APS will pay approximately
$49 million
in 2015 related to these leases. The lease agreements include fixed rate renewal periods, which give APS the ability to utilize the assets for a significant portion of the asset’s economic life, and therefore provide APS with the power to direct activities of the VIEs that most significantly impact the VIEs’ economic performance. Predominately due to the fixed rate renewal periods, APS has been deemed the primary beneficiary of these VIEs and therefore consolidates the VIEs.
On July 7, 2014, APS notified the lessor trust entities of APS’s intent to exercise the fixed rate lease renewal options. The length of the renewal options will result in APS retaining the assets through 2023 under
one
lease and 2033 under the other
two
leases. APS will be required to make lease payments of approximately
$23 million
annually for the period 2016 through 2023, and about
$16 million
annually for the period 2024 through 2033. At the end of the lease renewal periods, APS will have the option to purchase the leased assets at their fair market value, extend the leases for up to
two years
, or return the assets to the lessors.
As a result of consolidation, we eliminate lease accounting and instead recognize depreciation and interest expense, resulting in an increase in net income for
2014
,
2013
and
2012
of
$26 million
,
$34 million
and
$32 million
, respectively, entirely attributable to the noncontrolling interests. Income attributable to Pinnacle West shareholders remains the same. The July 7, 2014 lease extension results in the VIEs accounting for the transaction as a new lease agreement. Consolidation of these VIEs also results in changes to our Consolidated Statements of Cash Flows, but does not impact net cash flows.
Our Consolidated Balance Sheets at
December 31, 2014
and
December 31, 2013
include the following amounts relating to the VIEs (in millions):
|
|
December 31, 2014
|
December 31, 2013
|
|||||
|
Palo Verde sale leaseback property plant and equipment, net of accumulated depreciation
|
$
|
121
|
|
$
|
125
|
|
|
|
Current maturities of long-term debt
|
13
|
|
26
|
|
|||
|
Long-term debt excluding current maturities
|
—
|
|
13
|
|
|||
|
Equity-Noncontrolling interests
|
152
|
|
146
|
|
|||
Assets of the VIEs are restricted and may only be used to settle the VIEs’ debt obligations and for payment to the noncontrolling interest holders. Other than the VIEs’ assets reported on our consolidated
139
financial statements, the creditors of the VIEs have no other recourse to the assets of APS or Pinnacle West, except in certain circumstances, such as a default by APS under the lease.
APS is exposed to losses relating to these VIEs upon the occurrence of certain events that APS does not consider reasonably likely to occur. Under certain circumstances (for example, the NRC issuing specified violation orders with respect to Palo Verde or the occurrence of specified nuclear events), APS would be required to make specified payments to the VIEs’ noncontrolling equity participants, assume the VIEs’ debt, and take title to the leased Palo Verde Unit 2 interests which, if appropriate, may be required to be written down in value. If such an event had occurred as of
December 31, 2014
, APS would have been required to pay the noncontrolling equity participants approximately
$123 million
and assume
$13 million
of debt. Since APS consolidates these VIEs, the debt APS would be required to assume is already reflected in our Consolidated Balance Sheets.
For regulatory ratemaking purposes, the leases are treated as operating leases and, as a result, we have recorded a regulatory asset relating to the arrangements.
19.
Nuclear Decommissioning Trusts
To fund the costs APS expects to incur to decommission Palo Verde, APS established external decommissioning trusts in accordance with NRC regulations. Third-party investment managers are authorized to buy and sell securities per stated investment guidelines. The trust funds are invested in fixed income securities and equity securities. APS classifies investments in decommissioning trust funds as available for sale. As a result, we record the decommissioning trust funds at their fair value on our Consolidated Balance Sheets. See Note 13 for a discussion of how fair value is determined and the classification of the nuclear decommissioning trust investments within the fair value hierarchy. Because of the ability of APS to recover decommissioning costs in rates and in accordance with the regulatory treatment for decommissioning trust funds, we have deferred realized and unrealized gains and losses (including other-than-temporary impairments on investment securities) in other regulatory liabilities
.
The following table includes the unrealized gains and losses based on the original cost of the investment and summarizes the fair value of APS’s nuclear decommissioning trust fund assets at
December 31, 2014
and
December 31, 2013
(dollars in millions):
|
|
Fair Value
|
Total
Unrealized
Gains
|
Total
Unrealized
Losses
|
||||||||
|
December 31, 2014
|
|
|
|
|
|
|
|||||
|
Equity securities
|
$
|
310
|
|
$
|
159
|
|
$
|
—
|
|
||
|
Fixed income securities
|
411
|
|
17
|
|
(1
|
)
|
|||||
|
Net payables (a)
|
(7
|
)
|
—
|
|
—
|
|
|||||
|
Total
|
$
|
714
|
|
$
|
176
|
|
$
|
(1
|
)
|
||
|
|
Fair Value
|
Total
Unrealized
Gains
|
Total
Unrealized
Losses
|
||||||||
|
December 31, 2013
|
|
|
|
|
|
|
|||||
|
Equity securities
|
$
|
272
|
|
$
|
129
|
|
$
|
—
|
|
||
|
Fixed income securities
|
373
|
|
11
|
|
(6
|
)
|
|||||
|
Net payables (a)
|
(3
|
)
|
—
|
|
—
|
|
|||||
|
Total
|
$
|
642
|
|
$
|
140
|
|
$
|
(6
|
)
|
||
140
|
(a)
|
Net payables relate to pending purchases and sales of securities.
|
The costs of securities sold are determined on the basis of specific identification. The following table sets forth approximate gains and losses and proceeds from the sale of securities by the nuclear decommissioning trust funds (dollars in millions):
|
|
Year Ended December 31,
|
||||||||||
|
|
2014
|
2013
|
2012
|
||||||||
|
Realized gains
|
$
|
5
|
|
$
|
6
|
|
$
|
7
|
|
||
|
Realized losses
|
(5
|
)
|
(7
|
)
|
(4
|
)
|
|||||
|
Proceeds from the sale of securities (a)
|
356
|
|
446
|
|
418
|
|
|||||
|
(a)
|
Proceeds are reinvested in the trust.
|
The fair value of fixed income securities, summarized by contractual maturities, at
December 31, 2014
is as follows (dollars in millions):
|
|
Fair Value
|
||
|
Less than one year
|
$
|
14
|
|
|
1 year – 5 years
|
116
|
|
|
|
5 years – 10 years
|
122
|
|
|
|
Greater than 10 years
|
159
|
|
|
|
Total
|
$
|
411
|
|
20.
Changes in Accumulated Other Comprehensive Loss
The following table shows the changes in accumulated other comprehensive loss, including reclassification adjustments, net of tax, by component for the year ended
December 31, 2014
(dollars in thousands):
|
|
Year Ended December 31, 2014
|
||||||||||||||
|
|
Derivative
Instruments
|
|
Pension and
Other
Postretirement
Benefits
|
|
Total
|
||||||||||
|
Beginning balance
|
$
|
(23,058
|
)
|
$
|
(54,995
|
)
|
$
|
(78,053
|
)
|
||||||
|
OCI (loss) before reclassifications
|
(810
|
)
|
(5,419
|
)
|
|
(6,229
|
)
|
||||||||
|
Amounts reclassified from accumulated other comprehensive loss
|
13,483
|
|
(a)
|
2,658
|
|
(b)
|
16,141
|
|
|||||||
|
Net current period OCI (loss)
|
12,673
|
|
|
(2,761
|
)
|
|
9,912
|
|
|||||||
|
Ending balance
|
$
|
(10,385
|
)
|
$
|
(57,756
|
)
|
$
|
(68,141
|
)
|
||||||
|
(a)
|
These amounts represent realized gains and losses and are included in the computation of fuel and purchased power costs and are subject to the PSA. See Note 16.
|
|
(b)
|
These amounts primarily represent amortization of actuarial loss, and are included in the computation of net periodic pension cost. See Note 7.
|
141
The following table shows the changes in accumulated other comprehensive loss, including reclassification adjustments, net of tax, by component for the year ended
December 31, 2013
(dollars in thousands):
|
|
Year Ended December 31, 2013
|
||||||||||||||
|
|
Derivative
Instruments
|
|
Pension and
Other
Postretirement
Benefits
|
|
Total
|
||||||||||
|
Beginning balance
|
$
|
(49,592
|
)
|
$
|
(64,416
|
)
|
$
|
(114,008
|
)
|
||||||
|
OCI (loss) before reclassifications
|
(213
|
)
|
5,594
|
|
|
5,381
|
|
||||||||
|
Amounts reclassified from accumulated other comprehensive loss
|
26,747
|
|
(a)
|
3,827
|
|
(b)
|
30,574
|
|
|||||||
|
Net current period OCI
|
26,534
|
|
|
9,421
|
|
|
35,955
|
|
|||||||
|
Ending balance
|
$
|
(23,058
|
)
|
$
|
(54,995
|
)
|
$
|
(78,053
|
)
|
||||||
|
(a)
|
These amounts represent realized gains and losses and are included in the computation of fuel and purchased power costs and are subject to the PSA. See Note 16.
|
|
(b)
|
These amounts primarily represent amortization of actuarial loss, and are included in the computation of net periodic pension cost. See Note 7.
|
142
MANAGEMENT’S REPORT ON INTERNAL CONTROL
OVER FINANCIAL REPORTING
(ARIZONA PUBLIC SERVICE COMPANY)
Our management is responsible for establishing and maintaining adequate internal control over financial reporting, as such term is defined in Exchange Act Rules 13a-15(f), for APS. Management conducted an evaluation of the effectiveness of our internal control over financial reporting based on the framework in
Internal Control — Integrated Framework (2013)
issued by the Committee of Sponsoring Organizations of the Treadway Commission. Based on our evaluation under the framework in
Internal Control — Integrated Framework (2013),
our management concluded that our internal control over financial reporting was effective as of December 31, 2014. The effectiveness of our internal control over financial reporting as of
December 31, 2014
has been audited by Deloitte & Touche LLP, an independent registered public accounting firm, as stated in their report which is included herein and also relates to the Company’s financial statements.
February 20, 2015
143
REPORT OF INDEPENDENT REGISTERED PUBLIC ACCOUNTING FIRM
To the Board of Directors and Stockholder of
Arizona Public Service Company
Phoenix, Arizona
We have audited the accompanying consolidated balance sheets of Arizona Public Service Company and subsidiary (the “Company”) as of
December 31, 2014
and
2013
, and the related consolidated statements of income, comprehensive income, changes in equity, and cash flows for each of the three years in the period ended
December 31, 2014
. Our audits also included the financial statement schedule listed in the Index at Item 15. We also have audited the Company’s internal control over financial reporting as of
December 31, 2014
, based on criteria established in
Internal Control — Integrated Framework (2013)
issued by the Committee of Sponsoring Organizations of the Treadway Commission. The Company’s management is responsible for these financial statements and financial statement schedule, for maintaining effective internal control over financial reporting, and for its assessment of the effectiveness of internal control over financial reporting, included in the accompanying Management’s Report on Internal Control over Financial Reporting. Our responsibility is to express an opinion on these financial statements and financial statement schedule and an opinion on the Company’s internal control over financial reporting based on our audits.
We conducted our audits in accordance with the standards of the Public Company Accounting Oversight Board (United States). Those standards require that we plan and perform the audit to obtain reasonable assurance about whether the financial statements are free of material misstatement and whether effective internal control over financial reporting was maintained in all material respects. Our audits of the financial statements included examining, on a test basis, evidence supporting the amounts and disclosures in the financial statements, assessing the accounting principles used and significant estimates made by management, and evaluating the overall financial statement presentation. Our audit of internal control over financial reporting included obtaining an understanding of internal control over financial reporting, assessing the risk that a material weakness exists, testing and evaluating the design and operating effectiveness of internal control based on the assessed risk. Our audits also included performing such other procedures as we considered necessary in the circumstances. We believe that our audits provide a reasonable basis for our opinions.
A company’s internal control over financial reporting is a process designed by, or under the supervision of, the company’s principal executive and principal financial officers, or persons performing similar functions, and effected by the company’s board of directors, management, and other personnel to provide reasonable assurance regarding the reliability of financial reporting and the preparation of financial statements for external purposes in accordance with generally accepted accounting principles. A company’s internal control over financial reporting includes those policies and procedures that (1) pertain to the maintenance of records that, in reasonable detail, accurately and fairly reflect the transactions and dispositions of the assets of the company; (2) provide reasonable assurance that transactions are recorded as necessary to permit preparation of financial statements in accordance with generally accepted accounting principles and that receipts and expenditures of the company are being made only in accordance with authorizations of management and directors of the company; and (3) provide reasonable assurance regarding prevention or timely detection of unauthorized acquisition, use, or disposition of the company’s assets that could have a material effect on the financial statements.
Because of the inherent limitations of internal control over financial reporting, including the possibility of collusion or improper management override of controls, material misstatements due to error or fraud may not be prevented or detected on a timely basis. Also, projections of any evaluation of the effectiveness of the internal control over financial reporting to future periods are subject to the risk that the controls may become
144
inadequate because of changes in conditions, or that the degree of compliance with the policies or procedures may deteriorate.
In our opinion, the consolidated financial statements referred to above present fairly, in all material respects, the financial position of Arizona Public Service Company and subsidiary as of
December 31, 2014
and
2013
, and the results of their operations and their cash flows for each of the three years in the period ended
December 31, 2014
, in conformity with accounting principles generally accepted in the United States of America. Also, in our opinion, such financial statement schedule, when considered in relation to the basic consolidated financial statements taken as a whole, present fairly, in all material respects, the information set forth therein. Also, in our opinion, the Company maintained, in all material respects, effective internal control over financial reporting as of
December 31, 2014
, based on the criteria established in
Internal Control — Integrated Framework (2013)
issued by the Committee of Sponsoring Organizations of the Treadway Commission.
|
/s/ Deloitte & Touche LLP
|
|
|
|
|
|
Phoenix, Arizona
|
|
|
February 20, 2015
|
|
145
ARIZONA PUBLIC SERVICE COMPANY
CONSOLIDATED STATEMENTS OF INCOME
(dollars in thousands)
|
|
Year Ended December 31,
|
||||||||||
|
|
2014
|
2013
|
2012
|
||||||||
|
ELECTRIC OPERATING REVENUES
|
$
|
3,488,946
|
|
$
|
3,451,251
|
|
$
|
3,293,489
|
|
||
|
OPERATING EXPENSES
|
|
|
|
|
|
|
|||||
|
Fuel and purchased power
|
1,179,829
|
|
1,095,709
|
|
994,790
|
|
|||||
|
Operations and maintenance
|
882,442
|
|
897,824
|
|
873,916
|
|
|||||
|
Depreciation and amortization
|
417,264
|
|
415,612
|
|
404,242
|
|
|||||
|
Income taxes (Notes 4 and S-1)
|
245,036
|
|
256,864
|
|
256,600
|
|
|||||
|
Taxes other than income taxes
|
171,583
|
|
163,377
|
|
158,412
|
|
|||||
|
Total
|
2,896,154
|
|
2,829,386
|
|
2,687,960
|
|
|||||
|
OPERATING INCOME
|
592,792
|
|
621,865
|
|
605,529
|
|
|||||
|
OTHER INCOME (DEDUCTIONS)
|
|
|
|
|
|
|
|||||
|
Income taxes (Notes 4 and S-1)
|
7,676
|
|
11,769
|
|
12,204
|
|
|||||
|
Allowance for equity funds used during construction (Note 1)
|
30,790
|
|
25,581
|
|
22,436
|
|
|||||
|
Other income (Note S-3)
|
11,295
|
|
3,896
|
|
2,868
|
|
|||||
|
Other expense (Note S-3)
|
(13,403
|
)
|
(20,449
|
)
|
(21,150
|
)
|
|||||
|
Total
|
36,358
|
|
20,797
|
|
16,358
|
|
|||||
|
INTEREST EXPENSE
|
|
|
|
|
|
|
|||||
|
Interest on long-term debt
|
186,323
|
|
188,011
|
|
198,398
|
|
|||||
|
Interest on short-term borrowings
|
6,796
|
|
6,605
|
|
7,135
|
|
|||||
|
Debt discount, premium and expense
|
4,168
|
|
4,046
|
|
4,215
|
|
|||||
|
Allowance for borrowed funds used during construction (Note 1)
|
(15,457
|
)
|
(14,861
|
)
|
(14,971
|
)
|
|||||
|
Total
|
181,830
|
|
183,801
|
|
194,777
|
|
|||||
|
NET INCOME
|
447,320
|
|
458,861
|
|
427,110
|
|
|||||
|
Less: Net income attributable to noncontrolling interests (Note 18)
|
26,101
|
|
33,892
|
|
31,613
|
|
|||||
|
NET INCOME ATTRIBUTABLE TO COMMON SHAREHOLDER
|
$
|
421,219
|
|
$
|
424,969
|
|
$
|
395,497
|
|
||
See Notes to Pinnacle West’s Consolidated Financial Statements and Supplemental Notes to Arizona Public Service Company’s Consolidated Financial Statements.
146
ARIZONA PUBLIC SERVICE COMPANY
CONSOLIDATED STATEMENTS OF COMPREHENSIVE INCOME
(dollars in thousands)
|
|
Year Ended December 31,
|
||||||||||
|
|
2014
|
2013
|
2012
|
||||||||
|
NET INCOME
|
$
|
447,320
|
|
$
|
458,861
|
|
$
|
427,110
|
|
||
|
OTHER COMPREHENSIVE INCOME (LOSS), NET OF TAX
|
|
|
|
|
|
|
|||||
|
Derivative instruments:
|
|
|
|
|
|
|
|||||
|
Net unrealized loss, net of tax benefit (expense) of $(438), $140, and $14,888 (Note 16)
|
(809
|
)
|
(214
|
)
|
(22,775
|
)
|
|||||
|
Reclassification of net realized loss, net of tax benefit of $7,932, $17,472, and $39,119 (Note 16)
|
13,483
|
|
26,747
|
|
59,888
|
|
|||||
|
Pension and other postretirement benefits activity, net of tax (expense) benefit of $4,655, $(6,003), and $408 (Note 7)
|
(7,635
|
)
|
9,190
|
|
(617
|
)
|
|||||
|
Total other comprehensive income
|
5,039
|
|
35,723
|
|
36,496
|
|
|||||
|
COMPREHENSIVE INCOME
|
452,359
|
|
494,584
|
|
463,606
|
|
|||||
|
Less: Comprehensive income attributable to noncontrolling interests
|
26,101
|
|
33,892
|
|
31,613
|
|
|||||
|
COMPREHENSIVE INCOME ATTRIBUTABLE TO COMMON SHAREHOLDER
|
$
|
426,258
|
|
$
|
460,692
|
|
$
|
431,993
|
|
||
See Notes to Pinnacle West’s Consolidated Financial Statements and Supplemental Notes to APS’s Consolidated Financial Statements.
147
ARIZONA PUBLIC SERVICE COMPANY
CONSOLIDATED BALANCE SHEETS
(dollars in thousands)
|
|
December 31,
|
||||||
|
|
2014
|
2013
|
|||||
|
ASSETS
|
|
|
|
|
|||
|
PROPERTY, PLANT AND EQUIPMENT (Notes 1, 6 and 9)
|
|
|
|
|
|||
|
Plant in service and held for future use
|
$
|
15,539,811
|
|
$
|
15,196,598
|
|
|
|
Accumulated depreciation and amortization
|
(5,394,650
|
)
|
(5,296,501
|
)
|
|||
|
Net
|
10,145,161
|
|
9,900,097
|
|
|||
|
Construction work in progress
|
682,807
|
|
581,369
|
|
|||
|
Palo Verde sale leaseback, net of accumulated depreciation of $229,795 and $225,925 (Note 18)
|
121,255
|
|
125,125
|
|
|||
|
Intangible assets, net of accumulated amortization of $489,538 and $439,703
|
119,600
|
|
157,534
|
|
|||
|
Nuclear fuel, net of accumulated amortization of $143,554 and $146,057
|
125,201
|
|
124,557
|
|
|||
|
Total property, plant and equipment
|
11,194,024
|
|
10,888,682
|
|
|||
|
INVESTMENTS AND OTHER ASSETS
|
|
|
|
|
|||
|
Nuclear decommissioning trust (Notes 13 and 19)
|
713,866
|
|
642,007
|
|
|||
|
Assets from risk management activities (Note 16)
|
17,620
|
|
23,815
|
|
|||
|
Other assets
|
33,362
|
|
33,709
|
|
|||
|
Total investments and other assets
|
764,848
|
|
699,531
|
|
|||
|
CURRENT ASSETS
|
|
|
|
|
|||
|
Cash and cash equivalents
|
4,515
|
|
3,725
|
|
|||
|
Customer and other receivables
|
297,712
|
|
299,055
|
|
|||
|
Accrued unbilled revenues
|
100,533
|
|
96,796
|
|
|||
|
Allowance for doubtful accounts
|
(3,094
|
)
|
(3,203
|
)
|
|||
|
Materials and supplies (at average cost)
|
218,889
|
|
221,682
|
|
|||
|
Fossil fuel (at average cost)
|
37,097
|
|
38,028
|
|
|||
|
Income tax receivable
|
—
|
|
135,179
|
|
|||
|
Assets from risk management activities (Note 16)
|
13,785
|
|
17,169
|
|
|||
|
Deferred fuel and purchased power regulatory asset (Note 3)
|
6,926
|
|
20,755
|
|
|||
|
Other regulatory assets (Note 3)
|
129,808
|
|
76,388
|
|
|||
|
Deferred income taxes (Notes 4 and S-1)
|
55,253
|
|
—
|
|
|||
|
Other current assets
|
38,693
|
|
39,153
|
|
|||
|
Total current assets
|
900,117
|
|
944,727
|
|
|||
|
DEFERRED DEBITS
|
|
|
|
|
|||
|
Regulatory assets (Notes 1, 3, 4 and S-1)
|
1,054,087
|
|
711,712
|
|
|||
|
Assets for other postretirement benefits (Note 7)
|
149,260
|
|
—
|
|
|||
|
Unamortized debt issue costs
|
24,642
|
|
21,860
|
|
|||
|
Other
|
128,026
|
|
114,865
|
|
|||
|
Total deferred debits
|
1,356,015
|
|
848,437
|
|
|||
|
TOTAL ASSETS
|
$
|
14,215,004
|
|
$
|
13,381,377
|
|
|
See Notes to Pinnacle West’s Consolidated Financial Statements and Supplemental Notes to APS’s Consolidated Financial Statements.
148
ARIZONA PUBLIC SERVICE COMPANY
CONSOLIDATED BALANCE SHEETS
(dollars in thousands)
|
|
December 31,
|
||||||
|
|
2014
|
2013
|
|||||
|
LIABILITIES AND EQUITY
|
|
|
|
|
|||
|
CAPITALIZATION
|
|
|
|
|
|||
|
Common stock
|
$
|
178,162
|
|
$
|
178,162
|
|
|
|
Additional paid-in capital
|
2,379,696
|
|
2,379,696
|
|
|||
|
Retained earnings
|
1,968,718
|
|
1,804,398
|
|
|||
|
Accumulated other comprehensive (loss):
|
|
|
|
|
|||
|
Pension and other postretirement benefits (Note 7)
|
(37,948
|
)
|
(30,313
|
)
|
|||
|
Derivative instruments (Note 16)
|
(10,385
|
)
|
(23,059
|
)
|
|||
|
Total shareholder equity
|
4,478,243
|
|
4,308,884
|
|
|||
|
Noncontrolling interests (Note 18)
|
151,609
|
|
145,990
|
|
|||
|
Total equity
|
4,629,852
|
|
4,454,874
|
|
|||
|
Long-term debt less current maturities (Note 6)
|
2,906,215
|
|
2,671,465
|
|
|||
|
Total capitalization
|
7,536,067
|
|
7,126,339
|
|
|||
|
CURRENT LIABILITIES
|
|
|
|
|
|||
|
Short-term borrowings (Note 5)
|
147,400
|
|
153,125
|
|
|||
|
Current maturities of long-term debt (Note 6)
|
383,570
|
|
540,424
|
|
|||
|
Accounts payable
|
289,930
|
|
281,237
|
|
|||
|
Accrued taxes (Notes 4 and S-1)
|
131,110
|
|
122,460
|
|
|||
|
Accrued interest
|
52,358
|
|
48,132
|
|
|||
|
Common dividends payable
|
65,800
|
|
62,500
|
|
|||
|
Customer deposits
|
72,307
|
|
76,101
|
|
|||
|
Deferred income taxes
|
—
|
|
2,033
|
|
|||
|
Liabilities from risk management activities (Note 16)
|
59,676
|
|
31,892
|
|
|||
|
Liabilities for asset retirements (Note 11)
|
32,462
|
|
32,896
|
|
|||
|
Regulatory liabilities (Note 3)
|
130,549
|
|
99,273
|
|
|||
|
Other current liabilities
|
167,302
|
|
130,774
|
|
|||
|
Total current liabilities
|
1,532,464
|
|
1,580,847
|
|
|||
|
DEFERRED CREDITS AND OTHER
|
|
|
|
|
|||
|
Deferred income taxes (Notes 4 and S-1)
|
2,571,365
|
|
2,347,724
|
|
|||
|
Regulatory liabilities (Notes 1, 3, 4, and S-1)
|
1,051,196
|
|
801,297
|
|
|||
|
Liability for asset retirements (Note 11)
|
358,288
|
|
313,833
|
|
|||
|
Liabilities for pension and other postretirement benefits (Note 7)
|
424,508
|
|
476,017
|
|
|||
|
Liabilities from risk management activities (Note 16)
|
50,602
|
|
70,315
|
|
|||
|
Customer advances
|
123,052
|
|
114,480
|
|
|||
|
Coal mine reclamation
|
198,292
|
|
207,453
|
|
|||
|
Deferred investment tax credit
|
178,607
|
|
152,361
|
|
|||
|
Unrecognized tax benefits (Notes 4 and S-1)
|
45,740
|
|
42,209
|
|
|||
|
Other
|
144,823
|
|
148,502
|
|
|||
|
Total deferred credits and other
|
5,146,473
|
|
4,674,191
|
|
|||
|
COMMITMENTS AND CONTINGENCIES (SEE NOTES)
|
|
|
|
|
|||
|
TOTAL LIABILITIES AND EQUITY
|
$
|
14,215,004
|
|
$
|
13,381,377
|
|
|
See Notes to Pinnacle West’s Consolidated Financial Statements and Supplemental Notes to APS’s Consolidated Financial Statements.
149
ARIZONA PUBLIC SERVICE COMPANY
CONSOLIDATED STATEMENTS OF CASH FLOWS
(dollars in thousands)
|
|
Year Ended December 31,
|
||||||||||
|
|
2014
|
2013
|
2012
|
||||||||
|
CASH FLOWS FROM OPERATING ACTIVITIES
|
|
|
|
|
|
|
|||||
|
Net income
|
$
|
447,320
|
|
$
|
458,861
|
|
$
|
427,110
|
|
||
|
Adjustments to reconcile net income to net cash provided by operating activities:
|
|
|
|
|
|
|
|||||
|
Depreciation and amortization including nuclear fuel
|
496,393
|
|
492,226
|
|
481,168
|
|
|||||
|
Deferred fuel and purchased power
|
(26,927
|
)
|
21,678
|
|
71,573
|
|
|||||
|
Deferred fuel and purchased power amortization
|
40,757
|
|
31,190
|
|
(116,716
|
)
|
|||||
|
Allowance for equity funds used during construction
|
(30,790
|
)
|
(25,581
|
)
|
(22,436
|
)
|
|||||
|
Deferred income taxes
|
155,401
|
|
278,101
|
|
202,159
|
|
|||||
|
Deferred investment tax credit
|
26,246
|
|
52,542
|
|
41,579
|
|
|||||
|
Change in derivative instruments fair value
|
339
|
|
534
|
|
(749
|
)
|
|||||
|
Changes in current assets and liabilities:
|
|
|
|
|
|
|
|||||
|
Customer and other receivables
|
(52,466
|
)
|
(46,552
|
)
|
12,914
|
|
|||||
|
Accrued unbilled revenues
|
(3,737
|
)
|
(1,951
|
)
|
30,394
|
|
|||||
|
Materials, supplies and fossil fuel
|
3,724
|
|
(11,878
|
)
|
(23,043
|
)
|
|||||
|
Income tax receivable
|
135,179
|
|
(134,590
|
)
|
(2,280
|
)
|
|||||
|
Other current assets
|
3,766
|
|
(17,112
|
)
|
(27,745
|
)
|
|||||
|
Accounts payable
|
(2,355
|
)
|
47,870
|
|
(97,395
|
)
|
|||||
|
Accrued taxes
|
8,650
|
|
5,760
|
|
7,330
|
|
|||||
|
Other current liabilities
|
33,970
|
|
(9,005
|
)
|
6,070
|
|
|||||
|
Change in margin and collateral accounts — assets
|
(343
|
)
|
993
|
|
2,216
|
|
|||||
|
Change in margin and collateral accounts — liabilities
|
(24,975
|
)
|
12,355
|
|
137,785
|
|
|||||
|
Change in long-term regulatory liabilities
|
59,618
|
|
64,473
|
|
13,539
|
|
|||||
|
Change in long-term income tax receivable
|
—
|
|
137,665
|
|
(1,756
|
)
|
|||||
|
Change in unrecognized tax benefits
|
2,778
|
|
(91,244
|
)
|
(2,583
|
)
|
|||||
|
Change in other long-term assets
|
(65,521
|
)
|
(46,043
|
)
|
1,391
|
|
|||||
|
Change in other long-term liabilities
|
(82,860
|
)
|
(25,601
|
)
|
34,854
|
|
|||||
|
Net cash flow provided by operating activities
|
1,124,167
|
|
1,194,691
|
|
1,175,379
|
|
|||||
|
CASH FLOWS FROM INVESTING ACTIVITIES
|
|
|
|
|
|
|
|||||
|
Capital expenditures
|
(910,084
|
)
|
(1,016,322
|
)
|
(889,551
|
)
|
|||||
|
Contributions in aid of construction
|
20,325
|
|
41,090
|
|
49,876
|
|
|||||
|
Allowance for borrowed funds used during construction
|
(15,457
|
)
|
(14,861
|
)
|
(14,971
|
)
|
|||||
|
Proceeds from nuclear decommissioning trust sales
|
356,195
|
|
446,025
|
|
417,603
|
|
|||||
|
Investment in nuclear decommissioning trust
|
(373,444
|
)
|
(463,274
|
)
|
(434,852
|
)
|
|||||
|
Other
|
347
|
|
(2,067
|
)
|
(1,099
|
)
|
|||||
|
Net cash flow used for investing activities
|
(922,118
|
)
|
(1,009,409
|
)
|
(872,994
|
)
|
|||||
|
CASH FLOWS FROM FINANCING ACTIVITIES
|
|
|
|
|
|
|
|||||
|
Issuance of long-term debt
|
606,126
|
|
136,307
|
|
351,081
|
|
|||||
|
Repayment of long-term debt
|
(527,578
|
)
|
(122,828
|
)
|
(529,286
|
)
|
|||||
|
Short-term borrowings and payments — net
|
(5,725
|
)
|
60,950
|
|
92,175
|
|
|||||
|
Dividends paid on common stock
|
(253,600
|
)
|
(242,100
|
)
|
(222,200
|
)
|
|||||
|
Noncontrolling interests
|
(20,482
|
)
|
(17,385
|
)
|
(10,529
|
)
|
|||||
|
Net cash flow used for financing activities
|
(201,259
|
)
|
(185,056
|
)
|
(318,759
|
)
|
|||||
|
NET INCREASE (DECREASE) IN CASH AND CASH EQUIVALENTS
|
790
|
|
226
|
|
(16,374
|
)
|
|||||
|
CASH AND CASH EQUIVALENTS AT BEGINNING OF YEAR
|
3,725
|
|
3,499
|
|
19,873
|
|
|||||
|
CASH AND CASH EQUIVALENTS AT END OF YEAR
|
$
|
4,515
|
|
$
|
3,725
|
|
$
|
3,499
|
|
||
|
Supplemental disclosure of cash flow information:
|
|
|
|
|
|
|
|||||
|
Cash paid (received) during the year for:
|
|
|
|
|
|
|
|||||
|
Income taxes, net of refunds
|
$
|
(86,054
|
)
|
$
|
7,524
|
|
$
|
1,196
|
|
||
|
Interest, net of amounts capitalized
|
$
|
173,436
|
|
$
|
180,757
|
|
$
|
196,038
|
|
||
|
Significant non-cash investing and financing activities:
|
|
|
|
|
|
|
|||||
|
Accrued capital expenditures
|
$
|
44,712
|
|
$
|
33,184
|
|
$
|
26,208
|
|
||
|
Dividends declared but not paid
|
$
|
65,800
|
|
$
|
62,500
|
|
$
|
59,800
|
|
||
|
Liabilities assumed related to acquisition of SCE’s Four Corners’ interest
|
$
|
—
|
|
$
|
145,609
|
|
$
|
—
|
|
||
See Notes to Pinnacle West’s Consolidated Financial Statements and Supplemental Notes to APS’s Consolidated Financial Statements.
150
ARIZONA PUBLIC SERVICE COMPANY
CONSOLIDATED STATEMENTS OF CHANGES IN EQUITY
(dollars in thousands)
|
Common Stock
|
Additional Paid-In Capital
|
Retained Earnings
|
Accumulated Other Comprehensive Income (Loss)
|
Noncontrolling Interests
|
Total
|
|||||||||||||||||||||
|
Shares
|
Amount
|
|||||||||||||||||||||||||
|
Balance, December 31, 2011
|
71,264,947
|
|
$
|
178,162
|
|
$
|
2,379,696
|
|
$
|
1,510,740
|
|
$
|
(125,591
|
)
|
$
|
108,399
|
|
$
|
4,051,406
|
|
||||||
|
Net income
|
395,497
|
|
31,613
|
|
427,110
|
|
||||||||||||||||||||
|
Other comprehensive income
|
36,496
|
|
36,496
|
|
||||||||||||||||||||||
|
Dividends on common stock
|
(282,000
|
)
|
(282,000
|
)
|
||||||||||||||||||||||
|
Net capital activities by noncontrolling interests
|
(10,529
|
)
|
(10,529
|
)
|
||||||||||||||||||||||
|
Balance, December 31, 2012
|
71,264,947
|
|
178,162
|
|
2,379,696
|
|
1,624,237
|
|
(89,095
|
)
|
129,483
|
|
4,222,483
|
|
||||||||||||
|
Net income
|
424,969
|
|
33,892
|
|
458,861
|
|
||||||||||||||||||||
|
Other comprehensive income
|
35,723
|
|
35,723
|
|
||||||||||||||||||||||
|
Dividends on common stock
|
(244,800
|
)
|
(244,800
|
)
|
||||||||||||||||||||||
|
Other
|
(8
|
)
|
(8
|
)
|
||||||||||||||||||||||
|
Net capital activities by noncontrolling interests
|
(17,385
|
)
|
(17,385
|
)
|
||||||||||||||||||||||
|
Balance, December 31, 2013
|
71,264,947
|
|
178,162
|
|
2,379,696
|
|
1,804,398
|
|
(53,372
|
)
|
145,990
|
|
4,454,874
|
|
||||||||||||
|
Net income
|
421,219
|
|
26,101
|
|
447,320
|
|
||||||||||||||||||||
|
Other comprehensive income
|
5,039
|
|
5,039
|
|
||||||||||||||||||||||
|
Dividends on common stock
|
(256,900
|
)
|
(256,900
|
)
|
||||||||||||||||||||||
|
Other
|
1
|
|
1
|
|
||||||||||||||||||||||
|
Net capital activities by noncontrolling interests
|
(20,482
|
)
|
(20,482
|
)
|
||||||||||||||||||||||
|
Balance, December 31, 2014
|
71,264,947
|
|
$
|
178,162
|
|
$
|
2,379,696
|
|
$
|
1,968,718
|
|
$
|
(48,333
|
)
|
$
|
151,609
|
|
$
|
4,629,852
|
|
||||||
See Notes to Pinnacle West’s Consolidated Financial Statements and Supplemental Notes to APS’s Consolidated Financial Statements.
151
Certain notes to APS’s consolidated financial statements are combined with the notes to Pinnacle West’s consolidated financial statements. Listed below are the consolidated notes to Pinnacle West’s consolidated financial statements, the majority of which also relate to APS’s consolidated financial statements. In addition, listed below are the supplemental notes which are required disclosures for APS and should be read in conjunction with Pinnacle West’s Consolidated Notes.
|
|
Consolidated
Note
Reference
|
|
APS’s
Supplemental
Note
Reference
|
|
Summary of Significant Accounting Policies
|
Note 1
|
|
—
|
|
New Accounting Standards
|
Note 2
|
|
—
|
|
Regulatory Matters
|
Note 3
|
|
—
|
|
Income Taxes
|
Note 4
|
|
Note S-1
|
|
Lines of Credit and Short-Term Borrowings
|
Note 5
|
|
—
|
|
Long-Term Debt and Liquidity Matters
|
Note 6
|
|
—
|
|
Retirement Plans and Other Benefits
|
Note 7
|
|
—
|
|
Leases
|
Note 8
|
|
—
|
|
Jointly-Owned Facilities
|
Note 9
|
|
—
|
|
Commitments and Contingencies
|
Note 10
|
|
—
|
|
Asset Retirement Obligations
|
Note 11
|
|
—
|
|
Selected Quarterly Financial Data (Unaudited)
|
Note 12
|
|
Note S-2
|
|
Fair Value Measurements
|
Note 13
|
|
—
|
|
Earnings Per Share
|
Note 14
|
|
—
|
|
Stock-Based Compensation
|
Note 15
|
|
—
|
|
Derivative Accounting
|
Note 16
|
|
—
|
|
Other Income and Other Expense
|
Note 17
|
|
Note S-3
|
|
Palo Verde Sale Leaseback Variable Interest Entities
|
Note 18
|
|
—
|
|
Nuclear Decommissioning Trusts
|
Note 19
|
|
—
|
|
Changes in Accumulated Other Comprehensive Loss
|
Note 20
|
|
Note S-4
|
152
S-1.
Income Taxes
APS is included in Pinnacle West’s consolidated tax return. However, when Pinnacle West allocates income taxes to APS, it is done based upon APS’s taxable income computed on a stand-alone basis, in accordance with the tax sharing agreement.
Certain assets and liabilities are reported differently for income tax purposes than they are for financial statements purposes. The tax effect of these differences is recorded as deferred taxes. We calculate deferred taxes using currently enacted tax rates.
APS has recorded regulatory assets and regulatory liabilities related to income taxes on its Balance Sheets in accordance with accounting guidance for regulated operations. The regulatory assets are for certain temporary differences, primarily the allowance for equity funds used during construction and pension and other postretirement benefits. The regulatory liabilities primarily relate to deferred taxes resulting from investment tax credits ("ITCs") and the change in income tax rates.
In accordance with regulatory requirements, APS ITCs are deferred and are amortized over the life of the related property, with such amortization applied as a credit to reduce current income tax expense in the statement of income.
During the year ended December 31, 2013, IRS guidance was released which provided clarification regarding an APS tax accounting method change approved by the IRS in the third quarter of 2009. As a result of this guidance, uncertain tax positions decreased
$67 million
. Additionally, the IRS finalized the examination of tax returns for the years ended December 31, 2008 and 2009, which further
reduced uncertain tax positions by approximately
$41 million
. These reductions in uncertain tax positions were materially offset by an increase in deferred tax liabilities.
The
$135 million
current income tax receivable on APS’s Consolidated Balance Sheets as of December 31, 2013 represented an anticipated IRS refund related to the finalized examinations of tax years ended December 31, 2008 and 2009. Cash related to this refund was received in the first quarter of 2014.
On September 13, 2013, the U.S. Treasury Department released final income tax regulations on the deduction and capitalization of expenditures related to tangible property. These final regulations apply to tax years beginning on or after January 1, 2014. Several of the provisions within the regulations require a tax accounting method change to be filed with the IRS prior to September 15, 2015 resulting in a tax-effected cumulative effect adjustment of approximately
$82 million
. The anticipated impact of these final regulations has been accounted for in APS's Consolidated Balance Sheets as of December 31, 2013 and 2014.
Net income associated with the Palo Verde sale leaseback VIEs is not subject to tax (see Note 18). As a result, there is no income tax expense associated with the VIEs recorded on APS’s Consolidated Statements of Income.
153
The following is a tabular reconciliation of the total amounts of unrecognized tax benefits, excluding interest and penalties, at the beginning and end of the year that are included in accrued taxes and unrecognized tax benefits (dollars in thousands):
|
|
2014
|
2013
|
2012
|
||||||||
|
Total unrecognized tax benefits, January 1
|
$
|
41,997
|
|
$
|
133,241
|
|
$
|
135,824
|
|
||
|
Additions for tax positions of the current year
|
4,309
|
|
3,516
|
|
5,167
|
|
|||||
|
Additions for tax positions of prior years
|
751
|
|
13,158
|
|
—
|
|
|||||
|
Reductions for tax positions of prior years for:
|
|
|
|
|
|
|
|||||
|
Changes in judgment
|
(2,282
|
)
|
(107,918
|
)
|
(7,729
|
)
|
|||||
|
Settlements with taxing authorities
|
—
|
|
—
|
|
—
|
|
|||||
|
Lapses of applicable statute of limitations
|
—
|
|
—
|
|
(21
|
)
|
|||||
|
Total unrecognized tax benefits, December 31
|
$
|
44,775
|
|
$
|
41,997
|
|
$
|
133,241
|
|
||
Included in the balance of unrecognized tax benefits at
December 31, 2014
,
2013
and
2012
were approximately
$11 million
,
$10 million
and
$10 million
, respectively, of tax positions that, if recognized, would decrease our effective tax rate.
As of the balance sheet date, the tax year ended December 31, 2011 and all subsequent tax years remain subject to examination by the IRS. With a few exceptions, we are no longer subject to state income tax examinations by tax authorities for years before 2008.
In January 2014, we prospectively adopted guidance requiring unrecognized tax benefits to be presented as a reduction to any available deferred income tax asset for a net operating loss, a similar tax loss, or a tax credit carryforward. The adoption of this guidance did not have any impact on APS's Consolidated Balance Sheets as of December 31, 2014.
We reflect interest and penalties, if any, on unrecognized tax benefits in the Statements of Income as income tax expense. The amount of interest recognized in the Statements of Income related to unrecognized tax benefits was a pre-tax expense of
$1 million
for
2014
, a pre-tax benefit of
$4 million
for
2013
and a pre-tax expense of
$4 million
for
2012
.
The total amount of accrued liabilities for interest recognized in the Consolidated Balance Sheets related to unrecognized tax benefits was
$1 million
as of
December 31, 2014
, less than
$1 million
as of
December 31, 2013
and
$13 million
as of
December 31, 2012
. To the extent that matters are settled favorably, this amount could be reversed and decrease our effective tax rate. Additionally, as of
December 31, 2014
, we have recognized less than
$1 million
of interest expense to be paid on the underpayment of income taxes for certain adjustments that we have filed, or will file, with the IRS.
154
The components of APS’s income tax expense are as follows (dollars in thousands):
|
|
Year Ended December 31,
|
||||||||||
|
|
2014
|
2013
|
2012
|
||||||||
|
Current:
|
|
|
|
|
|
|
|||||
|
Federal
|
$
|
40,115
|
|
$
|
(97,531
|
)
|
$
|
(11,650
|
)
|
||
|
State
|
15,598
|
|
11,983
|
|
12,308
|
|
|||||
|
Total current
|
55,713
|
|
(85,548
|
)
|
658
|
|
|||||
|
Deferred:
|
|
|
|
|
|
|
|||||
|
Federal
|
165,027
|
|
305,389
|
|
216,367
|
|
|||||
|
State
|
16,620
|
|
25,254
|
|
27,371
|
|
|||||
|
Total deferred
|
181,647
|
|
330,643
|
|
243,738
|
|
|||||
|
Total income tax expense
|
$
|
237,360
|
|
$
|
245,095
|
|
$
|
244,396
|
|
||
On the APS Statements of Income, federal and state income taxes are allocated between operating income and other income.
The following chart compares APS’s pretax income at the
35%
federal income tax rate to income tax expense (dollars in thousands):
|
|
Year Ended December 31,
|
||||||||||
|
|
2014
|
2013
|
2012
|
||||||||
|
Federal income tax expense at 35% statutory rate
|
$
|
239,638
|
|
$
|
246,384
|
|
$
|
235,027
|
|
||
|
Increases (reductions) in tax expense resulting from:
|
|
|
|
|
|
|
|||||
|
State income tax net of federal income tax benefit
|
21,148
|
|
23,970
|
|
25,379
|
|
|||||
|
Credits and favorable adjustments related to prior years resolved in current year
|
—
|
|
(3,231
|
)
|
—
|
|
|||||
|
Medicare Subsidy Part-D
|
830
|
|
823
|
|
483
|
|
|||||
|
Allowance for equity funds used during construction (see Note 1)
|
(8,523
|
)
|
(6,997
|
)
|
(6,158
|
)
|
|||||
|
Palo Verde VIE noncontrolling interest (see Note 18)
|
(9,135
|
)
|
(11,862
|
)
|
(11,065
|
)
|
|||||
|
Investment tax credit amortization
|
(4,928
|
)
|
(3,548
|
)
|
(2,030
|
)
|
|||||
|
Other
|
(1,670
|
)
|
(444
|
)
|
2,760
|
|
|||||
|
Income tax expense
|
$
|
237,360
|
|
$
|
245,095
|
|
$
|
244,396
|
|
||
The following table shows the net deferred income tax liability recognized on the APS Balance Sheets (dollars in thousands):
|
|
December 31,
|
||||||
|
|
2014
|
2013
|
|||||
|
Current asset (liability)
|
$
|
55,253
|
|
$
|
(2,033
|
)
|
|
|
Long-term liability
|
(2,571,365
|
)
|
(2,347,724
|
)
|
|||
|
Deferred income taxes — net
|
$
|
(2,516,112
|
)
|
$
|
(2,349,757
|
)
|
|
On February 17, 2011, Arizona enacted legislation (H.B. 2001) that included a four-year phase-in of corporate income tax rate reductions beginning in 2014. As a result of these tax rate reductions, Pinnacle West has revised the tax rate applicable to reversing temporary items in Arizona. In accordance with accounting for regulated companies, the benefit of this rate reduction is substantially offset by a regulatory liability. As of
December 31, 2014
, APS has recorded a regulatory liability of
$74 million
, with a corresponding decrease in accumulated deferred income tax liabilities, to reflect the impact of this change in tax law.
155
On April 4, 2013, New Mexico enacted legislation (H.B. 641) that included a five-year phase-in of corporate income tax rate reductions beginning in 2014. As a result of these tax rate reductions, Pinnacle West has revised the tax rate applicable to reversing temporary items in New Mexico. In accordance with accounting for regulated companies, the benefit of this rate reduction is substantially offset by a regulatory liability. As of
December 31, 2014
, APS has recorded a regulatory liability of
$2 million
, with a corresponding decrease in accumulated deferred income tax liabilities, to reflect the impact of this change in tax law.
The components of the net deferred income tax liability were as follows (dollars in thousands):
|
|
December 31,
|
||||||
|
|
2014
|
2013
|
|||||
|
DEFERRED TAX ASSETS
|
|
|
|
|
|||
|
Regulatory liabilities:
|
|
|
|
|
|||
|
Asset retirement obligation and removal costs
|
$
|
229,772
|
|
$
|
235,959
|
|
|
|
Unamortized investment tax credits
|
96,232
|
|
82,116
|
|
|||
|
Other postretirement benefits
|
90,496
|
|
—
|
|
|||
|
Other
|
60,409
|
|
42,609
|
|
|||
|
Risk management activities
|
57,505
|
|
44,920
|
|
|||
|
Pension liabilities
|
194,541
|
|
132,263
|
|
|||
|
Other postretirement liabilities
|
—
|
|
53,950
|
|
|||
|
Renewable energy incentives
|
65,169
|
|
65,434
|
|
|||
|
Credit and loss carryforwards
|
—
|
|
38,183
|
|
|||
|
Other
|
161,379
|
|
166,781
|
|
|||
|
Total deferred tax assets
|
955,503
|
|
862,215
|
|
|||
|
DEFERRED TAX LIABILITIES
|
|
|
|
|
|||
|
Plant-related
|
(2,958,369
|
)
|
(2,903,730
|
)
|
|||
|
Risk management activities
|
(12,171
|
)
|
(16,191
|
)
|
|||
|
Other postretirement benefit assets
|
(58,495
|
)
|
—
|
|
|||
|
Regulatory assets:
|
|
|
|
|
|||
|
Allowance for equity funds used during construction
|
(48,286
|
)
|
(43,058
|
)
|
|||
|
Deferred fuel and purchased power
|
(2,498
|
)
|
(8,282
|
)
|
|||
|
Deferred fuel and purchased power — mark-to-market
|
(38,187
|
)
|
(13,343
|
)
|
|||
|
Pension and other postretirement benefits
|
(191,747
|
)
|
(129,250
|
)
|
|||
|
Retired power plant costs (see Note 3)
|
(57,255
|
)
|
(8,199
|
)
|
|||
|
Other
|
(99,123
|
)
|
(85,003
|
)
|
|||
|
Other
|
(5,484
|
)
|
(4,916
|
)
|
|||
|
Total deferred tax liabilities
|
(3,471,615
|
)
|
(3,211,972
|
)
|
|||
|
Deferred income taxes — net
|
$
|
(2,516,112
|
)
|
$
|
(2,349,757
|
)
|
|
156
S-2.
Selected Quarterly Financial Data (Unaudited)
Quarterly financial information for
2014
and
2013
is as follows (dollars in thousands):
|
|
2014 Quarter Ended,
|
2014
|
|||||||||||||||||
|
|
March 31,
|
June 30,
|
September 30,
|
December 31,
|
Total
|
||||||||||||||
|
Operating revenues
|
$
|
685,545
|
|
$
|
905,578
|
|
$
|
1,172,190
|
|
$
|
725,633
|
|
$
|
3,488,946
|
|
||||
|
Operations and maintenance
|
208,285
|
|
208,059
|
|
212,430
|
|
253,668
|
|
882,442
|
|
|||||||||
|
Operating income
|
69,635
|
|
180,394
|
|
287,928
|
|
54,835
|
|
592,792
|
|
|||||||||
|
Net income attributable to common shareholder
|
19,518
|
|
134,916
|
|
251,047
|
|
15,738
|
|
421,219
|
|
|||||||||
|
|
2013 Quarter Ended,
|
2013
|
|||||||||||||||||
|
|
March 31,
|
June 30,
|
September 30,
|
December 31,
|
Total
|
||||||||||||||
|
Operating revenues
|
$
|
685,827
|
|
$
|
915,065
|
|
$
|
1,151,535
|
|
$
|
698,824
|
|
$
|
3,451,251
|
|
||||
|
Operations and maintenance
|
220,752
|
|
224,950
|
|
222,617
|
|
229,505
|
|
897,824
|
|
|||||||||
|
Operating income
|
74,862
|
|
183,728
|
|
284,251
|
|
79,024
|
|
621,865
|
|
|||||||||
|
Net income attributable to common shareholder
|
26,042
|
|
133,949
|
|
234,954
|
|
30,024
|
|
424,969
|
|
|||||||||
S-3.
Other Income and Other Expense
The following table provides detail of APS’s other income and other expense for
2014
,
2013
and
2012
(dollars in thousands):
|
|
2014
|
2013
|
2012
|
||||||||
|
Other income:
|
|
|
|
|
|
|
|||||
|
Interest income
|
$
|
689
|
|
$
|
1,234
|
|
$
|
310
|
|
||
|
Debt return on the purchase of Four Corners units 4 & 5
|
8,386
|
|
—
|
|
—
|
|
|||||
|
Miscellaneous
|
2,220
|
|
2,662
|
|
2,558
|
|
|||||
|
Total other income
|
$
|
11,295
|
|
$
|
3,896
|
|
$
|
2,868
|
|
||
|
Other expense:
|
|
|
|
|
|
|
|||||
|
Non-operating costs (a)
|
$
|
(10,397
|
)
|
$
|
(9,626
|
)
|
$
|
(8,706
|
)
|
||
|
Asset dispositions
|
(615
|
)
|
(4,992
|
)
|
(1,511
|
)
|
|||||
|
Miscellaneous
|
(2,391
|
)
|
(5,831
|
)
|
(10,933
|
)
|
|||||
|
Total other expense
|
$
|
(13,403
|
)
|
$
|
(20,449
|
)
|
$
|
(21,150
|
)
|
||
(a)
As defined by FERC, includes non-operating utility income and expense (items excluded from utility rate recovery).
157
S-4.
Changes in Accumulated Other Comprehensive Loss
The following table shows the changes in accumulated other comprehensive loss, including reclassification adjustments, net of tax, by component for the year ended
December 31, 2014
(dollars in thousands):
|
|
Year Ended December 31, 2014
|
||||||||||||||
|
|
Derivative
Instruments
|
|
Pension and
Other
Postretirement
Benefits
|
|
Total
|
||||||||||
|
Beginning balance
|
$
|
(23,059
|
)
|
$
|
(30,313
|
)
|
$
|
(53,372
|
)
|
||||||
|
OCI (loss) before reclassifications
|
(809
|
)
|
(10,415
|
)
|
|
(11,224
|
)
|
||||||||
|
Amounts reclassified from accumulated other comprehensive loss
|
13,483
|
|
(a)
|
2,780
|
|
(b)
|
16,263
|
|
|||||||
|
Net current period OCI (loss)
|
12,674
|
|
|
(7,635
|
)
|
|
5,039
|
|
|||||||
|
Ending balance
|
$
|
(10,385
|
)
|
$
|
(37,948
|
)
|
$
|
(48,333
|
)
|
||||||
|
(a)
|
These amounts represent realized gains and losses and are included in the computation of fuel and purchased power costs and are subject to the PSA. See Note 16.
|
|
(b)
|
These amounts primarily represent amortization of actuarial loss, and are included in the computation of net periodic pension cost. See Note 7.
|
The following table shows the changes in accumulated other comprehensive loss, including reclassification adjustments, net of tax, by component for the year ended
December 31, 2013
(dollars in thousands):
|
|
Year Ended December 31, 2013
|
||||||||||||||
|
|
Derivative
Instruments
|
|
Pension and
Other
Postretirement
Benefits
|
|
Total
|
||||||||||
|
Beginning balance
|
$
|
(49,592
|
)
|
$
|
(39,503
|
)
|
$
|
(89,095
|
)
|
||||||
|
OCI (loss) before reclassifications
|
(214
|
)
|
5,387
|
|
|
5,173
|
|
||||||||
|
Amounts reclassified from accumulated other comprehensive loss
|
26,747
|
|
(a)
|
3,803
|
|
(b)
|
30,550
|
|
|||||||
|
Net current period OCI
|
26,533
|
|
|
9,190
|
|
|
35,723
|
|
|||||||
|
Ending balance
|
$
|
(23,059
|
)
|
$
|
(30,313
|
)
|
$
|
(53,372
|
)
|
||||||
|
(a)
|
These amounts represent realized gains and losses and are included in the computation of fuel and purchased power costs and are subject to the PSA. See Note 16.
|
|
(b)
|
These amounts primarily represent amortization of actuarial loss, and are included in the computation of net periodic pension cost. See Note 7.
|
158
PINNACLE WEST CAPITAL CORPORATION HOLDING COMPANY
SCHEDULE I — CONDENSED FINANCIAL INFORMATION OF REGISTRANT
CONDENSED STATEMENTS OF COMPREHENSIVE INCOME
(in thousands)
|
|
Year Ended December 31,
|
||||||||||
|
|
2014
|
2013
|
2012
|
||||||||
|
Operating revenues
|
$
|
642
|
|
$
|
799
|
|
$
|
6,133
|
|
||
|
Operating expenses
|
23,507
|
|
24,930
|
|
12,125
|
|
|||||
|
Operating loss
|
(22,865
|
)
|
(24,131
|
)
|
(5,992
|
)
|
|||||
|
Other
|
|
|
|
|
|
|
|||||
|
Equity in earnings of subsidiaries
|
411,528
|
|
420,926
|
|
391,528
|
|
|||||
|
Other expense
|
(3,276
|
)
|
(1,999
|
)
|
(2,001
|
)
|
|||||
|
Total
|
408,252
|
|
418,927
|
|
389,527
|
|
|||||
|
Interest expense
|
3,663
|
|
3,226
|
|
4,868
|
|
|||||
|
Income from continuing operations
|
381,724
|
|
391,570
|
|
378,667
|
|
|||||
|
Income tax benefit
|
(15,871
|
)
|
(14,504
|
)
|
(7,079
|
)
|
|||||
|
Income from continuing operations — net of income taxes
|
397,595
|
|
406,074
|
|
385,746
|
|
|||||
|
Loss from discontinued operations — net of income taxes
|
—
|
|
—
|
|
(4,204
|
)
|
|||||
|
Net income attributable to common shareholders
|
397,595
|
|
406,074
|
|
381,542
|
|
|||||
|
Other comprehensive income — attributable to common shareholders
|
9,912
|
|
35,955
|
|
38,155
|
|
|||||
|
Total comprehensive income — attributable to common shareholders
|
$
|
407,507
|
|
$
|
442,029
|
|
$
|
419,697
|
|
||
See Notes to Pinnacle West’s Consolidated Financial Statements.
159
PINNACLE WEST CAPITAL CORPORATION HOLDING COMPANY
SCHEDULE I — CONDENSED FINANCIAL INFORMATION OF REGISTRANT
CONDENSED BALANCE SHEETS
(in thousands)
|
|
December 31,
|
||||||
|
|
2014
|
2013
|
|||||
|
ASSETS
|
|
|
|
|
|||
|
Current assets
|
|
|
|
|
|||
|
Cash and cash equivalents
|
$
|
3,088
|
|
$
|
5,798
|
|
|
|
Accounts receivable
|
99,958
|
|
80,108
|
|
|||
|
Current deferred income taxes
|
66,979
|
|
93,185
|
|
|||
|
Income tax receivable
|
7,329
|
|
1,853
|
|
|||
|
Other current assets
|
124
|
|
242
|
|
|||
|
Total current assets
|
177,478
|
|
181,186
|
|
|||
|
Investments and other assets
|
|
|
|
|
|||
|
Investments in subsidiaries
|
4,630,570
|
|
4,455,049
|
|
|||
|
Other assets
|
43,051
|
|
13,789
|
|
|||
|
Total investments and other assets
|
4,673,621
|
|
4,468,838
|
|
|||
|
Total Assets
|
$
|
4,851,099
|
|
$
|
4,650,024
|
|
|
|
LIABILITIES AND EQUITY
|
|
|
|
|
|||
|
Current liabilities
|
|
|
|
|
|||
|
Accounts payable
|
$
|
5,250
|
|
$
|
3,279
|
|
|
|
Accrued taxes
|
12,220
|
|
8,538
|
|
|||
|
Common dividends payable
|
65,790
|
|
62,528
|
|
|||
|
Other current liabilities
|
38,992
|
|
31,295
|
|
|||
|
Total current liabilities
|
122,252
|
|
105,640
|
|
|||
|
Long-term debt less current maturities
|
125,000
|
|
125,000
|
|
|||
|
Deferred credits and other
|
|
|
|
|
|||
|
Deferred income taxes
|
12,055
|
|
4,158
|
|
|||
|
Pension and other postretirement liabilities
|
29,228
|
|
37,611
|
|
|||
|
Other
|
43,462
|
|
37,155
|
|
|||
|
Total deferred credits and other
|
84,745
|
|
78,924
|
|
|||
|
Common stock equity
|
|
|
|||||
|
Common stock
|
2,509,569
|
|
2,487,250
|
|
|||
|
Accumulated other comprehensive loss
|
(68,141
|
)
|
(78,053
|
)
|
|||
|
Retained earnings
|
1,926,065
|
|
1,785,273
|
|
|||
|
Total Pinnacle West Shareholders’ equity
|
4,367,493
|
|
4,194,470
|
|
|||
|
Noncontrolling interests
|
151,609
|
|
145,990
|
|
|||
|
Total Equity
|
4,519,102
|
|
4,340,460
|
|
|||
|
Total Liabilities and Equity
|
$
|
4,851,099
|
|
$
|
4,650,024
|
|
|
See Notes to Pinnacle West’s Consolidated Financial Statements.
160
PINNACLE WEST CAPITAL CORPORATION HOLDING COMPANY
SCHEDULE I — CONDENSED FINANCIAL INFORMATION OF REGISTRANT
CONDENSED STATEMENTS OF CASH FLOWS
(in thousands)
|
|
Year Ended December 31,
|
||||||||||
|
|
2014
|
2013
|
2012
|
||||||||
|
Cash flows from operating activities
|
|
|
|
|
|
|
|||||
|
Net income
|
$
|
397,595
|
|
$
|
406,074
|
|
$
|
381,542
|
|
||
|
Adjustments to reconcile net income to net cash provided by operating activities:
|
|
|
|
|
|||||||
|
Equity in earnings of subsidiaries — net
|
(411,528
|
)
|
(420,926
|
)
|
(391,528
|
)
|
|||||
|
Depreciation and amortization
|
94
|
|
95
|
|
94
|
|
|||||
|
Deferred income taxes
|
4,406
|
|
(28,806
|
)
|
(15,135
|
)
|
|||||
|
Accounts receivable
|
(22,945
|
)
|
21,671
|
|
28,763
|
|
|||||
|
Accounts payable
|
2,017
|
|
(2,449
|
)
|
879
|
|
|||||
|
Accrued taxes and income tax receivables — net
|
(1,795
|
)
|
1,402
|
|
(3,103
|
)
|
|||||
|
Dividends received from subsidiaries
|
253,600
|
|
242,100
|
|
222,200
|
|
|||||
|
Other
|
18,432
|
|
(15,065
|
)
|
(4,589
|
)
|
|||||
|
Net cash flow provided by operating activities
|
239,876
|
|
204,096
|
|
219,123
|
|
|||||
|
Cash flows from investing activities
|
|
|
|
|
|
|
|||||
|
Investments in subsidiaries
|
(10,236
|
)
|
(3,400
|
)
|
—
|
|
|||||
|
Repayments of loans from subsidiaries
|
322
|
|
2,149
|
|
996
|
|
|||||
|
Advances of loans to subsidiaries
|
(1,450
|
)
|
(2,099
|
)
|
(1,200
|
)
|
|||||
|
Net cash flow used for investing activities
|
(11,364
|
)
|
(3,350
|
)
|
(204
|
)
|
|||||
|
Cash flows from financing activities
|
|
|
|
|
|
|
|||||
|
Issuance of long-term debt
|
125,000
|
|
—
|
|
125,000
|
|
|||||
|
Dividends paid on common stock
|
(246,671
|
)
|
(235,244
|
)
|
(225,075
|
)
|
|||||
|
Repayment of long-term debt
|
(125,000
|
)
|
—
|
|
(125,000
|
)
|
|||||
|
Common stock equity issuance
|
15,288
|
|
17,319
|
|
15,955
|
|
|||||
|
Other
|
161
|
|
298
|
|
170
|
|
|||||
|
Net cash flow used for financing activities
|
(231,222
|
)
|
(217,627
|
)
|
(208,950
|
)
|
|||||
|
Net increase (decrease) in cash and cash equivalents
|
(2,710
|
)
|
(16,881
|
)
|
9,969
|
|
|||||
|
Cash and cash equivalents at beginning of year
|
5,798
|
|
22,679
|
|
12,710
|
|
|||||
|
Cash and cash equivalents at end of year
|
$
|
3,088
|
|
$
|
5,798
|
|
$
|
22,679
|
|
||
See Notes to Pinnacle West’s Consolidated Financial Statements.
161
PINNACLE WEST CAPITAL CORPORATION
SCHEDULE II — RESERVE FOR UNCOLLECTIBLES
(dollars in thousands)
|
Column A
|
Column B
|
Column C
|
Column D
|
Column E
|
|||||||||||||||
|
|
|
Additions
|
|
|
|||||||||||||||
|
Description
|
Balance at
beginning
of period
|
Charged to
cost and
expenses
|
Charged
to other
accounts
|
Deductions
|
Balance
at end of
period
|
||||||||||||||
|
Reserve for uncollectibles:
|
|
|
|
|
|
|
|
|
|
|
|||||||||
|
2014
|
$
|
3,203
|
|
$
|
3,942
|
|
$
|
—
|
|
$
|
4,051
|
|
$
|
3,094
|
|
||||
|
2013
|
3,340
|
|
4,923
|
|
—
|
|
5,060
|
|
3,203
|
|
|||||||||
|
2012
|
3,748
|
|
5,290
|
|
—
|
|
5,698
|
|
3,340
|
|
|||||||||
162
ARIZONA PUBLIC SERVICE COMPANY
SCHEDULE II — RESERVE FOR UNCOLLECTIBLES
(dollars in thousands)
|
Column A
|
Column B
|
Column C
|
Column D
|
Column E
|
||||||||||||||||
|
|
|
Additions
|
|
|
||||||||||||||||
|
Description
|
Balance at
beginning
of period
|
Charged to
cost and
expenses
|
Charged
to other
accounts
|
Deductions
|
Balance
at end of
period
|
|||||||||||||||
|
Reserve for uncollectibles:
|
|
|
|
|
|
|
|
|
|
|
||||||||||
|
2014
|
$
|
3,203
|
|
$
|
3,942
|
|
$
|
—
|
|
$
|
4,051
|
|
$
|
3,094
|
|
|||||
|
2013
|
3,340
|
|
4,923
|
|
—
|
|
5,060
|
|
3,203
|
|
||||||||||
|
2012
|
3,748
|
|
5,290
|
|
—
|
|
5,698
|
|
3,340
|
|
||||||||||
163
ON ACCOUNTING AND FINANCIAL DISCLOSURE
None.
(a)
Disclosure Controls and Procedures
The term “disclosure controls and procedures” means controls and other procedures of a company that are designed to ensure that information required to be disclosed by a company in the reports that it files or submits under the Securities Exchange Act of 1934 (the “Exchange Act”) (15 U.S.C. 78a
et seq
.) is recorded, processed, summarized and reported, within the time periods specified in the SEC’s rules and forms. Disclosure controls and procedures include, without limitation, controls and procedures designed to ensure that information required to be disclosed by a company in the reports that it files or submits under the Exchange Act is accumulated and communicated to a company’s management, including its principal executive and principal financial officers, or persons performing similar functions, as appropriate to allow timely decisions regarding required disclosure.
Pinnacle West’s management, with the participation of Pinnacle West’s Chief Executive Officer and Chief Financial Officer, have evaluated the effectiveness of Pinnacle West’s disclosure controls and procedures as of December 31, 2014. Based on that evaluation, Pinnacle West’s Chief Executive Officer and Chief Financial Officer have concluded that, as of that date, Pinnacle West’s disclosure controls and procedures were effective.
APS’s management, with the participation of APS’s Chief Executive Officer and Chief Financial Officer, have evaluated the effectiveness of APS’s disclosure controls and procedures as of December 31, 2014. Based on that evaluation, APS’s Chief Executive Officer and Chief Financial Officer have concluded that, as of that date, APS’s disclosure controls and procedures were effective.
(b)
Management’s Annual Reports on Internal Control Over Financial Reporting
Reference is made to “Management’s Report on Internal Control Over Financial Reporting (Pinnacle West Capital Corporation)” on page 73 of this report and “Management’s Report on Internal Control Over Financial Reporting (Arizona Public Service Company)” on page 143 of this report.
(c)
Attestation Reports of the Registered Public Accounting Firm
Reference is made to “Report of Independent Registered Public Accounting Firm” on page 74 of this report and “Report of Independent Registered Public Accounting Firm” on page 144 of this report on the internal control over financial reporting of Pinnacle West and APS, respectively.
(d)
Changes In Internal Control Over Financial Reporting
No change in Pinnacle West’s or APS’s internal control over financial reporting occurred during the fiscal quarter ended December 31, 2014 that materially affected, or is reasonably likely to materially affect, Pinnacle West’s or APS’s internal control over financial reporting.
164
None.
AND CORPORATE GOVERNANCE OF PINNACLE WEST
Reference is hereby made to “Information About Our Board and Corporate Governance,” “Proposal 1 — Election of Directors” and to “Section 16(a) Beneficial Ownership Reporting Compliance” in the Pinnacle West Proxy Statement relating to the Annual Meeting of Shareholders to be held on May 20, 2015 (the “2015 Proxy Statement”) and to the “Executive Officers of Pinnacle West” section in Part I of this report.
Pinnacle West has adopted a Code of Ethics for Financial Executives that applies to financial executives including Pinnacle West’s Chief Executive Officer, Chief Financial Officer, Chief Accounting Officer, Controller, Treasurer, and General Counsel, the President and Chief Operating Officer of APS and other persons designated as financial executives by the Chair of the Audit Committee. The Code of Ethics for Financial Executives is posted on Pinnacle West’s website (
www.pinnaclewest.com)
. Pinnacle West intends to satisfy the requirements under Item 5.05 of Form 8-K regarding disclosure of amendments to, or waivers from, provisions of the Code of Ethics for Financial Executives by posting such information on Pinnacle West’s website.
Reference is hereby made to “Directors’ Compensation,” “Report of the Human Resources Committee,” “Executive Compensation,” and “Human Resources Committee Interlocks and Insider Participation” in the 2015 Proxy Statement.
CERTAIN BENEFICIAL OWNERS AND MANAGEMENT
AND RELATED STOCKHOLDER MATTERS
Reference is hereby made to “Ownership of Pinnacle West Stock” in the 2015 Proxy Statement.
Securities Authorized for Issuance Under Equity Compensation Plans
The following table sets forth information as of December 31, 2014 with respect to the 2012 Plan and the 2007 Plan, under which our equity securities are outstanding or currently authorized for issuance.
165
Equity Compensation Plan Information
|
Plan Category
|
Number of
securities to be
issued upon
exercise of
outstanding
options, warrants
and rights
(a)
|
Weighted-
average exercise price
of outstanding
options,
warrants and
rights
(b)
|
Number of
securities remaining
available for future
issuance under
equity
compensation plans
(excluding
securities reflected
in column (a))
(c)
|
|||||
|
Equity compensation plans approved by security holders
|
1,661,797
|
|
—
|
|
3,103,760
|
|
||
|
Equity compensation plans not approved by security holders
|
—
|
|
—
|
|
—
|
|
||
|
Total
|
1,661,797
|
|
—
|
|
3,103,760
|
|
||
(a)
This amount includes shares subject to outstanding performance share awards and restricted stock unit awards at the maximum amount of shares issuable under such awards. However, payout of the performance share awards is contingent on the Company reaching certain levels of performance during a three-year performance period. If the performance criteria for these awards are not fully satisfied, the award recipient will receive less than the maximum number of shares available under these grants and may receive nothing from these grants.
(b)
The weighted-average exercise price in this column does not take performance share awards or restricted stock unit awards into account, as those awards have no exercise price.
(c)
Awards under the 2012 Plan can take the form of options, stock appreciation rights, restricted stock, performance shares, performance share units, performance cash, stock grants, stock units, dividend equivalents, and restricted stock units. Additional shares cannot be awarded under the 2007 Plan. However, if an award under the 2012 Plan or an award that was outstanding under the 2007 Plan on or after December 31, 2011 is forfeited, terminated or cancelled or expires, the shares subject to such award, to the extent of the forfeiture, termination, cancellation or expiration, may be added back to the shares available for issuance under the 2012 Plan.
Equity Compensation Plans Approved By Security Holders
Amounts in column (a) in the table above include shares subject to awards outstanding under two equity compensation plans that were previously approved by our shareholders: (a) the 2007 Plan, which was approved by our shareholders at our 2007 annual meeting of shareholders and under which no new stock awards may be granted; and (b) the 2012 Plan, which was approved by our shareholders at our 2012 annual meeting of shareholders. See Note 15 of the Notes to Consolidated Financial Statements for additional information regarding these plans.
Equity Compensation Plans Not Approved by Security Holders
The Company does not have any equity compensation plans under which shares can be issued that have not been approved by the shareholders.
TRANSACTIONS, AND DIRECTOR INDEPENDENCE
Reference is hereby made to “Information About Our Board and Corporate Governance” and “Related Party Transactions” in the 2015 Proxy Statement.
166
FEES AND SERVICES
Pinnacle West
Reference is hereby made to “Accounting and Auditing Matters — Audit Fees and — Pre-Approval Policies” in the 2015 Proxy Statement.
APS
The following fees were paid to APS’s independent registered public accountants, Deloitte & Touche LLP, for the last two fiscal years:
|
Type of Service
|
2013
|
2014
|
||||||
|
Audit Fees (1)
|
$
|
1,859,270
|
|
$
|
2,062,685
|
|
||
|
Audit-Related Fees (2)
|
189,990
|
|
212,600
|
|
||||
|
Tax Fees (3)
|
28,000
|
|
8,857
|
|
||||
(1)
The aggregate fees billed for services rendered for the audit of annual financial statements and for review of financial statements included in Reports on Form 10-Q.
(2)
The aggregate fees billed for assurance services that are reasonably related to the performance of the audit or review of the financial statements that are not included in Audit Fees reported above, which primarily consist of fees for employee benefit plan audits performed in 2014 and 2013.
(3)
The aggregate fees billed primarily related to tax compliance and tax planning.
Pinnacle West’s Audit Committee pre-approves each audit service and non-audit service to be provided by APS’s registered public accounting firm. The Audit Committee has delegated to the Chair of the Audit Committee the authority to pre-approve audit and non-audit services to be performed by the independent public accountants if the services are not expected to cost more than $50,000. The Chair must report any pre-approval decisions to the Audit Committee at its next scheduled meeting. All of the services performed by Deloitte & Touche LLP for APS in 2014 were pre-approved by the Audit Committee or the Chair of the Audit Committee consistent with the pre-approval policy.
167
Financial Statements and Financial Statement Schedules
See the Index to Financial Statements and Financial Statement Schedule in Part II, Item 8.
Exhibits Filed
The documents listed below are being filed or have previously been filed on behalf of Pinnacle West or APS and are incorporated herein by reference from the documents indicated and made a part hereof. Exhibits not identified as previously filed are filed herewith.
|
Exhibit
No.
|
|
Registrant(s)
|
|
Description
|
Previously Filed as Exhibit:
a
|
|
Date Filed
|
|
|
3.1
|
|
Pinnacle West
|
|
Articles of Incorporation, restated as of May 21, 2008
|
3.1 to Pinnacle West/APS June 30, 2008 Form 10-Q Report, File No. 1-8962
|
|
8/7/2008
|
|
|
3.2
|
|
Pinnacle West
|
|
Pinnacle West Capital Corporation Bylaws, amended as of May 19, 2010
|
3.1 to Pinnacle West/APS June 30, 2010 Form 10-Q Report, File No. 1-8962
|
|
8/3/2010
|
|
|
3.3
|
|
APS
|
|
Articles of Incorporation, restated as of May 25, 1988
|
4.2 to APS’s Form 18 Registration Nos. 33-33910 and 33-55248 by means of September 24, 1993 Form 8-K Report, File No. 1-4473
|
|
9/29/1993
|
|
|
3.3.1
|
|
APS
|
|
Amendment to the Articles of Incorporation of Arizona Public Service Company, amended May 16, 2012
|
3.1 to Pinnacle West/APS May 22, 2012 Form 8-K Report, File Nos. 1-8962 and 1-4473
|
|
5/22/2012
|
|
|
3.4
|
|
APS
|
|
Arizona Public Service Company Bylaws, amended as of December 16, 2008
|
3.4 to Pinnacle West/APS December 31, 2008 Form 10-K, File No. 1-4473
|
|
2/20/2009
|
|
|
4.1
|
|
Pinnacle West
|
|
Specimen Certificate of Pinnacle West Capital Corporation Common Stock, no par value
|
4.1 to Pinnacle West June 28, 2011 Form 8-K Report, File No. 1-8962
|
|
6/28/2011
|
|
|
4.2
|
|
Pinnacle West
APS
|
|
Indenture dated as of January 1, 1995 among APS and The Bank of New York Mellon, as Trustee
|
4.6 to APS’s Registration Statement Nos. 33-61228 and 33-55473 by means of January 1, 1995 Form 8-K Report, File No. 1-4473
|
|
1/11/1995
|
|
|
4.2a
|
|
Pinnacle West
APS
|
|
First Supplemental Indenture dated as of January 1, 1995
|
4.4 to APS’s Registration Statement Nos. 33-61228 and 33-55473 by means of January 1, 1995 Form 8-K Report, File No. 1-4473
|
|
1/11/1995
|
|
|
4.3
|
|
Pinnacle West
APS
|
|
Indenture dated as of November 15, 1996 between APS and The Bank of New York, as Trustee
|
4.5 to APS’s Registration Statements Nos. 33-61228, 33-55473, 33-64455 and 333- 15379 by means of November 19, 1996 Form 8-K Report, File No. 1-4473
|
|
11/22/1996
|
|
168
|
Exhibit
No.
|
|
Registrant(s)
|
|
Description
|
Previously Filed as Exhibit:
a
|
|
Date Filed
|
|
|
4.3a
|
|
Pinnacle West
APS
|
|
First Supplemental Indenture dated as of November 15, 1996
|
4.6 to APS’s Registration Statements Nos. 33-61228, 33-55473, 33-64455 and 333-15379 by means of November 19, 1996 Form 8-K Report, File No. 1-4473
|
|
11/22/1996
|
|
|
4.3b
|
|
Pinnacle West
APS
|
|
Second Supplemental Indenture dated as of April 1, 1997
|
4.10 to APS’s Registration Statement Nos. 33-55473, 33-64455 and 333-15379 by means of April 7, 1997 Form 8-K Report, File No. 1-4473
|
|
4/9/1997
|
|
|
4.3c
|
|
Pinnacle West
APS
|
|
Third Supplemental Indenture dated as of November 1, 2002
|
10.2 to Pinnacle West’s March 31, 2003 Form 10-Q Report, File No. 1-8962
|
|
5/15/2003
|
|
|
4.4
|
|
Pinnacle West
|
|
Indenture dated as of December 1, 2000 between the Company and The Bank of New York, as Trustee, relating to Senior Unsecured Debt Securities
|
4.1 to Pinnacle West’s Registration Statement No. 333-52476
|
|
12/21/2000
|
|
|
4.5
|
|
Pinnacle West
|
|
Indenture dated as of December 1, 2000 between the Company and The Bank of New York, as Trustee, relating to Subordinated Unsecured Debt Securities
|
4.2 to Pinnacle West’s Registration Statement No. 333-52476
|
|
12/21/2000
|
|
|
4.6
|
|
Pinnacle West
APS
|
|
Indenture dated as of January 15, 1998 between APS and The Bank of New York Mellon Trust Company N.A. (successor to JPMorgan Chase Bank, N.A., formerly known as The Chase Manhattan Bank), as Trustee
|
4.10 to APS’s Registration Statement Nos. 333-15379 and 333-27551 by means of January 13, 1998 Form 8-K Report, File No. 1-4473
|
|
1/16/1998
|
|
|
4.6a
|
|
Pinnacle West
APS
|
|
Seventh Supplemental Indenture dated as of May 1, 2003
|
4.1 to APS’s Registration Statement No. 333-90824 by means of May 7, 2003 Form 8-K Report, File No. 1-4473
|
|
5/9/2003
|
|
|
4.6b
|
|
Pinnacle West
APS
|
|
Eighth Supplemental Indenture dated as of June 15, 2004
|
4.1 to APS’s Registration Statement No. 333-106772 by means of June 24, 2004 Form 8-K Report, File No. 1-4473
|
|
6/28/2004
|
|
|
4.6c
|
|
Pinnacle West
APS
|
|
Ninth Supplemental Indenture dated as of August 15, 2005
|
4.1 to APS’s Registration Statements Nos. 333-106772 and 333-121512 by means of August 17, 2005 Form 8-K Report, File No. 1-4473
|
|
8/22/2005
|
|
|
4.6d
|
|
APS
|
|
Tenth Supplemental Indenture dated as of August 1, 2006
|
4.1 to APS’s July 31, 2006 Form 8-K Report, File No. 1-4473
|
|
8/3/2006
|
|
|
4.6e
|
|
Pinnacle West
APS
|
|
Eleventh Supplemental Indenture dated as of February 26, 2009
|
||||
|
4.6f
|
|
Pinnacle West
APS
|
|
Twelfth Supplemental Indenture dated as of August 25, 2011
|
||||
|
4.6g
|
|
Pinnacle West
APS
|
|
Thirteenth Supplemental Indenture dated as of January 13, 2012
|
||||
|
4.6h
|
|
Pinnacle West
APS
|
|
Fourteenth Supplemental Indenture dated as of January 10, 2014
|
||||
169
|
Exhibit
No.
|
|
Registrant(s)
|
|
Description
|
Previously Filed as Exhibit:
a
|
|
Date Filed
|
|
|
4.6i
|
|
Pinnacle West
APS
|
|
Fifteenth Supplemental Indenture dated as of June 18, 2014
|
||||
|
4.6j
|
|
Pinnacle West
APS
|
|
Sixteenth Supplemental Indenture dated as of January 12, 2015
|
||||
|
4.7
|
|
Pinnacle West
|
|
Second Amended and Restated Pinnacle West Capital Corporation Investors Advantage Plan dated as of June 23, 2004
|
4.4 to Pinnacle West’s June 23, 2004 Form 8-K Report, File No. 1-8962
|
|
8/9/2004
|
|
|
4.7a
|
|
Pinnacle West
|
|
Third Amended and Restated Pinnacle West Capital Corporation Investors Advantage Plan dated as of November 25, 2008
|
4.1 to Pinnacle West’s Form S-3 Registration Statement No. 333-155641, File No. 1-8962
|
|
11/25/2008
|
|
|
4.8
|
|
Pinnacle West
|
|
Agreement, dated March 29, 1988, relating to the filing of instruments defining the rights of holders of long-term debt not in excess of 10% of the Company’s total assets
|
4.1 to Pinnacle West’s 1987 Form 10-K Report, File No. 1-8962
|
|
3/30/1988
|
|
|
4.8a
|
|
Pinnacle West
APS
|
|
Agreement, dated March 21, 1994, relating to the filing of instruments defining the rights of holders of APS long-term debt not in excess of 10% of APS’s total assets
|
4.1 to APS’s 1993 Form 10-K Report, File No. 1-4473
|
|
3/30/1994
|
|
|
10.1.1
|
|
Pinnacle West
APS
|
|
Two separate Decommissioning Trust Agreements (relating to PVNGS Units 1 and 3, respectively), each dated July 1, 1991, between APS and Mellon Bank, N.A., as Decommissioning Trustee
|
10.2 to APS’s September 30, 1991 Form 10-Q Report, File No. 1-4473
|
|
11/14/1991
|
|
|
10.1.1a
|
|
Pinnacle West
APS
|
|
Amendment No. 1 to Decommissioning Trust Agreement (PVNGS Unit 1), dated as of December 1, 1994
|
10.1 to APS’s 1994 Form 10-K Report, File No. 1-4473
|
|
3/30/1995
|
|
|
10.1.1b
|
|
Pinnacle West
APS
|
|
Amendment No. 1 to Decommissioning Trust Agreement (PVNGS Unit 3), dated as of December 1, 1994
|
10.2 to APS’s 1994 Form 10-K Report, File No. 1-4473
|
|
3/30/1995
|
|
|
10.1.1c
|
|
Pinnacle West
APS
|
|
Amendment No. 2 to APS Decommissioning Trust Agreement (PVNGS Unit 1) dated as of July 1, 1991
|
10.4 to APS’s 1996 Form 10-K Report , File No. 1-4473
|
|
3/28/1997
|
|
|
10.1.1d
|
|
Pinnacle West
APS
|
|
Amendment No. 2 to APS Decommissioning Trust Agreement (PVNGS Unit 3) dated as of July 1, 1991
|
10.6 to APS’s 1996 Form 10-K Report, File No. 1-4473
|
|
3/28/1997
|
|
|
10.1.1e
|
|
Pinnacle West
APS
|
|
Amendment No. 3 to the Decommissioning Trust Agreement (PVNGS Unit 1), dated as of March 18, 2002
|
10.2 to Pinnacle West’s March 31, 2002 Form 10-Q Report, File No. 1-8962
|
|
5/15/2002
|
|
|
10.1.1f
|
|
Pinnacle West
APS
|
|
Amendment No. 3 to the Decommissioning Trust Agreement (PVNGS Unit 3), dated as of March 18, 2002
|
10.4 to Pinnacle West’s March 2002 Form 10-Q Report, File No. 1-8962
|
|
5/15/2002
|
|
170
|
Exhibit
No.
|
|
Registrant(s)
|
|
Description
|
Previously Filed as Exhibit:
a
|
|
Date Filed
|
|
|
10.1.1g
|
|
Pinnacle West
APS
|
|
Amendment No. 4 to the Decommissioning Trust Agreement (PVNGS Unit 1), dated as of December 19, 2003
|
10.3 to Pinnacle West’s 2003 Form 10-K Report, File No. 1-8962
|
|
3/15/2004
|
|
|
10.1.1h
|
|
Pinnacle West
APS
|
|
Amendment No. 4 to the Decommissioning Trust Agreement (PVNGS Unit 3), dated as of December 19, 2003
|
10.5 to Pinnacle West’s 2003 Form 10-K Report, File No. 1-8962
|
|
3/15/2004
|
|
|
10.1.1i
|
|
Pinnacle West
APS
|
|
Amendment No. 5 to the Decommissioning Trust Agreement (PVNGS Unit 1), dated as of May 1, 2007
|
10.1 to Pinnacle West/APS March 31, 2007 Form 10-Q Report, File Nos. 1-8962 and 1-4473
|
|
5/9/2007
|
|
|
10.1.1j
|
|
Pinnacle West
APS
|
|
Amendment No. 5 to the Decommissioning Trust Agreement (PVNGS Unit 3), dated as of May 1, 2007
|
10.2 to Pinnacle West/APS March 31, 2007 Form 10-Q Report, File Nos. 1-8962 and 104473
|
|
5/9/2007
|
|
|
10.1.2
|
|
Pinnacle West
APS
|
|
Amended and Restated Decommissioning Trust Agreement (PVNGS Unit 2) dated as of January 31, 1992, among APS, Mellon Bank, N.A., as Decommissioning Trustee, and State Street Bank and Trust Company, as successor to The First National Bank of Boston, as Owner Trustee under two separate Trust Agreements, each with a separate Equity Participant, and as Lessor under two separate Facility Leases, each relating to an undivided interest in PVNGS Unit 2
|
10.1 to Pinnacle West’s 1991 Form 10-K Report, File No. 1-8962
|
|
3/26/1992
|
|
|
10.1.2a
|
|
Pinnacle West
APS
|
|
First Amendment to Amended and Restated Decommissioning Trust Agreement (PVNGS Unit 2), dated as of November 1, 1992
|
10.2 to APS’s 1992 Form 10-K Report, File No. 1-4473
|
|
3/30/1993
|
|
|
10.1.2b
|
|
Pinnacle West
APS
|
|
Amendment No. 2 to Amended and Restated Decommissioning Trust Agreement (PVNGS Unit 2), dated as of November 1, 1994
|
10.3 to APS’s 1994 Form 10-K Report, File No. 1-4473
|
|
3/30/1995
|
|
|
10.1.2c
|
|
Pinnacle West
APS
|
|
Amendment No. 3 to Amended and Restated Decommissioning Trust Agreement (PVNGS Unit 2), dated as of June 20, 1996
|
10.1 to APS’s June 30, 1996 Form 10-Q Report, File No. 1-4473
|
|
8/9/1996
|
|
|
10.1.2d
|
|
Pinnacle West
APS
|
|
Amendment No. 4 to Amended and Restated Decommissioning Trust Agreement (PVNGS Unit 2) dated as of December 16, 1996
|
APS 10.5 to APS’s 1996 Form 10-K Report, File No. 1-4473
|
|
3/28/1997
|
|
|
10.1.2e
|
|
Pinnacle West
APS
|
|
Amendment No. 5 to the Amended and Restated Decommissioning Trust Agreement (PVNGS Unit 2), dated as of June 30, 2000
|
10.1 to Pinnacle West’s March 31, 2002 Form 10-Q Report, File No. 1-8962
|
|
5/15/2002
|
|
|
10.1.2f
|
|
Pinnacle West
APS
|
|
Amendment No. 6 to the Amended and Restated Decommissioning Trust Agreement (PVNGS Unit 2), dated as of March 18, 2002
|
10.3 to Pinnacle West’s March 31, 2002 Form 10-Q Report, File No. 1-8962
|
|
5/15/2002
|
|
171
|
Exhibit
No.
|
|
Registrant(s)
|
|
Description
|
Previously Filed as Exhibit:
a
|
|
Date Filed
|
|
|
10.1.2g
|
|
Pinnacle West
APS
|
|
Amendment No. 7 to the Amended and Restated Decommissioning Trust Agreement (PVNGS Unit 2), dated as of December 19, 2003
|
10.4 to Pinnacle West’s 2003 Form 10-K Report, File No. 1-8962
|
|
3/15/2004
|
|
|
10.1.2h
|
|
Pinnacle West
APS
|
|
Amendment No. 8 to the Amended and Restated Decommissioning Trust Agreement (PVNGS Unit 2), dated as of April 1, 2007
|
10.1.2h to Pinnacle West’s 2007 Form 10-K Report, File No. 1-8962
|
|
2/27/2008
|
|
|
10.2.1
b
|
|
Pinnacle West
APS
|
|
Arizona Public Service Company Deferred Compensation Plan, as restated, effective January 1, 1984, and the second and third amendments thereto, dated December 22, 1986, and December 23, 1987, respectively
|
10.4 to APS’s 1988 Form 10-K Report, File No. 1-4473
|
|
3/8/1989
|
|
|
10.2.1a
b
|
|
Pinnacle West
APS
|
|
Third Amendment to the Arizona Public Service Company Deferred Compensation Plan, effective as of January 1, 1993
|
10.3A to APS’s 1993 Form 10-K Report, File No. 1-4473
|
|
3/30/1994
|
|
|
10.2.1b
b
|
|
Pinnacle West
APS
|
|
Fourth Amendment to the Arizona Public Service Company Deferred Compensation Plan effective as of May 1, 1993
|
10.2 to APS’s September 30, 1994 Form 10-Q Report, File No. 1-4473
|
|
11/10/1994
|
|
|
10.2.1c
b
|
|
Pinnacle West
APS
|
|
Fifth Amendment to the Arizona Public Service Company Deferred Compensation Plan effective January 1, 1997
|
10.3A to APS’s 1996 Form 10-K Report, File No. 1-4473
|
|
3/28/1997
|
|
|
10.2.1d
b
|
|
Pinnacle West
APS
|
|
Sixth Amendment to the Arizona Public Service Company Deferred Compensation Plan effective January 1, 2001
|
10.8A to Pinnacle West’s 2000 Form 10-K Report, File No. 1-8962
|
|
3/14/2001
|
|
|
10.2.2
b
|
|
Pinnacle West
APS
|
|
Arizona Public Service Company Directors’ Deferred Compensation Plan, as restated, effective January 1, 1986
|
10.1 to APS’s June 30, 1986 Form 10-Q Report, File No. 1-4473
|
|
8/13/1986
|
|
|
10.2.2a
b
|
|
Pinnacle West
APS
|
|
Second Amendment to the Arizona Public Service Company Directors’ Deferred Compensation Plan, effective as of January 1, 1993
|
10.2A to APS’s 1993 Form 10-K Report, File No. 1-4473
|
|
3/30/1994
|
|
|
10.2.2b
b
|
|
Pinnacle West
APS
|
|
Third Amendment to the Arizona Public Service Company Directors’ Deferred Compensation Plan, effective as of May 1, 1993
|
10.1 to APS’s September 30, 1994 Form 10-Q Report, File No. 1-4473
|
|
11/10/1994
|
|
|
10.2.2c
b
|
|
Pinnacle West
APS
|
|
Fourth Amendment to the Arizona Public Service Company Directors Deferred Compensation Plan, effective as of January 1, 1999
|
10.8A to Pinnacle West’s 1999 Form 10-K Report, File No. 1-8962
|
|
3/30/2000
|
|
|
10.2.3
b
|
|
Pinnacle West
APS
|
|
Trust for the Pinnacle West Capital Corporation, Arizona Public Service Company and SunCor Development Company Deferred Compensation Plans dated August 1, 1996
|
10.14A to Pinnacle West’s 1999 Form 10-K Report, File No. 1-8962
|
|
3/30/2000
|
|
172
|
Exhibit
No.
|
|
Registrant(s)
|
|
Description
|
Previously Filed as Exhibit:
a
|
|
Date Filed
|
|
|
10.2.3a
b
|
|
Pinnacle West
APS
|
|
First Amendment dated December 7, 1999 to the Trust for the Pinnacle West Capital Corporation, Arizona Public Service Company and SunCor Development Company Deferred Compensation Plans
|
10.15A to Pinnacle West’s 1999 Form 10-K Report, File No. 1-8962
|
|
3/30/2000
|
|
|
10.2.4
b
|
|
Pinnacle West
APS
|
|
Pinnacle West Capital Corporation, Arizona Public Service Company, SunCor Development Company and El Dorado Investment Company Deferred Compensation Plan as amended and restated effective January 1, 1996
|
10.10A to APS’s 1995 Form 10-K Report, File No. 1-4473
|
|
3/29/1996
|
|
|
10.2.4a
b
|
|
Pinnacle West
APS
|
First Amendment effective as of January 1, 1999, to the Pinnacle West Capital Corporation, Arizona Public Service Company, SunCor Development Company and El Dorado Investment Company Deferred Compensation Plan
|
10.7A to Pinnacle West’s 1999 Form 10-K Report, File No. 1-8962
|
3/30/2000
|
|||
|
10.2.4b
b
|
|
Pinnacle West
APS
|
Second Amendment effective January 1, 2000 to the Pinnacle West Capital Corporation, Arizona Public Service Company, SunCor Development Company and El Dorado Investment Company Deferred Compensation Plan
|
10.10A to Pinnacle West’s 1999 Form 10-K Report, File No. 1-8962
|
3/30/2000
|
|||
|
10.2.4c
b
|
|
Pinnacle West
APS
|
Third Amendment to the Pinnacle West Capital Corporation, Arizona Public Service Company, SunCor Development Company and El Dorado Investment Company Deferred Compensation Plan, effective as of January 1, 2002
|
10.3 to Pinnacle West’s March 31, 2003 Form 10-Q Report, File No. 1-8962
|
5/15/2003
|
|||
|
10.2.4d
b
|
|
Pinnacle West
APS
|
|
Fourth Amendment to the Pinnacle West Capital Corporation, Arizona Public Service Company, SunCor Development Company and El Dorado Investment Company Deferred Compensation Plan, effective January 1, 2003
|
10.64 to Pinnacle West/APS 2005 Form 10-K Report, File Nos. 1-8962 and 1-4473
|
|
3/13/2006
|
|
|
10.2.5
b
|
|
Pinnacle West
APS
|
|
Deferred Compensation Plan of 2005 for Employees of Pinnacle West Capital Corporation and Affiliates
|
10.2.6 to Pinnacle West/APS 2008 Form 10-K Report, File Nos. 1-8962 and 1-4473
|
|
2/20/2009
|
|
|
10.2.5a
b
|
|
Pinnacle West
APS
|
|
First Amendment to the Deferred Compensation Plan of 2005 for Employees of Pinnacle West Capital Corporation and Affiliates
|
10.2.6a to Pinnacle West/APS 2009 Form 10-K Report, File Nos. 1-8962 and 1-4473
|
|
2/19/2010
|
|
|
10.2.5b
b
|
|
Pinnacle West
APS
|
|
Second Amendment to the Deferred Compensation Plan of 2005 for Employees of Pinnacle West Capital Corporation and Affiliates
|
10.2.5b to Pinnacle West/APS 2011 Form 10-K Report, File Nos. 1-8962 and 1-4473
|
|
2/24/2012
|
|
|
10.2.5c
b
|
|
Pinnacle West
APS
|
|
Third Amendment to the Deferred Compensation Plan of 2005 for Employees of Pinnacle West Capital Corporation and Affiliates
|
10.2.5c to Pinnacle West/APS 2013 Form 10-K Report, File Nos. 1-8962 and 1-4473
|
|
2/21/2014
|
|
173
|
Exhibit
No.
|
|
Registrant(s)
|
|
Description
|
Previously Filed as Exhibit:
a
|
|
Date Filed
|
|
|
10.3.1
b
|
|
Pinnacle West
APS
|
|
Pinnacle West Capital Corporation Supplement Excess Benefit Retirement Plan, amended and restated as of January 1, 2003
|
10.7A to Pinnacle West’s 2003 Form 10-K Report, File No. 1-8962
|
|
3/15/2004
|
|
|
10.3.1a
b
|
|
Pinnacle West
APS
|
|
Pinnacle West Capital Corporation Supplemental Excess Benefit Retirement Plan, as amended and restated, dated December 18, 2003
|
10.48b to Pinnacle West/APS 2005 Form 10-K Report, File Nos. 1-8962 and 1-4473
|
|
3/13/2006
|
|
|
10.3.2
b
|
|
Pinnacle West
APS
|
|
Pinnacle West Capital Corporation Supplemental Excess Benefit Retirement Plan of 2005
|
10.3.2 to Pinnacle West/APS 2008 Form 10-K Report, File Nos. 1-8962 and 1-4473
|
|
2/20/2009
|
|
|
10.3.2a
b
|
Pinnacle West
APS
|
First Amendment to the Pinnacle West Capital Corporation Supplemental Excess Benefit Retirement Plan of 2005
|
||||||
|
10.3.2b
b
|
Pinnacle West
APS
|
Second Amendment to the Pinnacle West Capital Corporation Supplemental Excess Benefit Retirement Plan of 2005
|
10.1 to Pinnacle West/APS March 31, 2014 Form 10-Q Report, File Nos. 1-8962 and 1-4473
|
5/2/2014
|
||||
|
10.4.1
b
|
|
APS
|
|
Letter Agreement dated December 20, 2006 between APS and Randall K. Edington
|
10.78 to Pinnacle West/APS 2006 Form 10-K Report, File Nos. 1-8962 and 1-4473
|
|
2/28/2007
|
|
|
10.4.2
b
|
|
APS
|
|
Letter Agreement dated July 22, 2008 between APS and Randall K. Edington
|
10.3 to Pinnacle West/APS June 30, 2008 Form 10-Q Report, File No. 1-4473
|
|
8/7/2008
|
|
|
10.4.3
b
|
|
Pinnacle West
APS
|
|
Letter Agreement dated June 17, 2008 between Pinnacle West/APS and James R. Hatfield
|
10.1 to Pinnacle West/APS June 30, 2008 Form 10-Q Report, File Nos. 1-8962 and 1-4473
|
|
8/7/2008
|
|
|
10.4.4
b
|
|
APS
|
|
Supplemental Agreement dated December 26, 2008 between APS and Randall K. Edington
|
10.4.10 to Pinnacle West/APS 2008 Form 10-K Report, File No. 1-4473
|
|
2/20/2009
|
|
|
10.4.5
b
|
|
APS
|
|
Description of 2010 Palo Verde Specific Compensation Opportunity for Randall K. Edington
|
10.4.13 to Pinnacle West/APS 2009 Form 10-K Report, File Nos. 1-8962 and 1-4473
|
|
2/19/2010
|
|
|
10.4.6
b
|
|
Pinnacle West
|
|
Letter Agreement dated May 21, 2009, between Pinnacle West and David P. Falck
|
10.4 to Pinnacle West/APS March 31, 2010 Form 10-Q Report, File No. 1-8962
|
|
5/6/2010
|
|
|
10.4.7
b
|
|
APS
|
|
Supplemental Agreement dated June 19, 2012 between APS and Randall K. Edington
|
10.1 to Pinnacle West/APS June 30, 2012 Form 10-Q Report File Nos. 1-8962 and 1-4473
|
|
8/2/2012
|
|
|
10.4.8
b
|
|
APS
|
|
Description of 2013 Palo Verde Specific Compensation Opportunity for Randall K. Edington
|
Pinnacle West/APS December 24, 2012 Form 8-K Report, File No. 1-4473
|
|
12/26/2012
|
|
|
10.4.9
b
|
|
APS
|
Supplemental Agreement dated December 14, 2014 between APS and Randall K. Edington
|
|||||
|
10.5.1
bd
|
|
Pinnacle West
APS
|
|
Key Executive Employment and Severance Agreement between Pinnacle West and certain executive officers of Pinnacle West and its subsidiaries
|
10.77 to Pinnacle West/APS 2005 Form 10-K Report, File Nos. 1-8962 and 1-4473
|
|
3/13/2006
|
|
174
|
Exhibit
No.
|
|
Registrant(s)
|
|
Description
|
Previously Filed as Exhibit:
a
|
|
Date Filed
|
|
|
10.5.1a
bd
|
|
Pinnacle West
APS
|
|
Form of Amended and Restated Key Executive Employment and Severance Agreement between Pinnacle West and certain officers of Pinnacle West and its subsidiaries
|
10.4 to Pinnacle West/APS September 30, 2007 Form 10-Q Report, File Nos. 1-8962 and 1-4473
|
|
11/6/2007
|
|
|
10.5.2
bd
|
|
Pinnacle West
APS
|
|
Form of Key Executive Employment and Severance Agreement between Pinnacle West and certain officers of Pinnacle West and its subsidiaries
|
10.3 to Pinnacle West/APS September 30, 2007 Form 10-Q Report, File Nos. 1-8962 and 1-4473
|
|
11/6/2007
|
|
|
10.5.3
bd
|
|
Pinnacle West
APS
|
|
Form of Key Executive Employment and Severance Agreement between Pinnacle West and certain officers of Pinnacle West and its subsidiaries
|
10.5.3 to Pinnacle West/APS 2009 Form 10-K Report, File Nos. 1-8962 and 1-4473
|
|
2/19/2010
|
|
|
10.5.4
bd
|
|
Pinnacle West
APS
|
|
Form of Key Executive Employment and Severance Agreement between Pinnacle West and certain officers of Pinnacle West and its subsidiaries
|
10.5.4 to Pinnacle West/APS 2012 Form 10-K, File Nos. 1-8962 and 1-4473
|
|
2/22/2013
|
|
|
10.6.1
b
|
|
Pinnacle West
APS
|
|
Pinnacle West Capital Corporation 2002 Long-Term Incentive Plan
|
10.5A to Pinnacle West’s 2002 Form 10-K Report
|
|
3/31/2003
|
|
|
10.6.1a
bd
|
|
Pinnacle West
APS
|
|
Performance Share Agreement under the Pinnacle West Capital Corporation 2002 Long-Term Incentive Plan
|
10.1 to Pinnacle West/APS December 9, 2005 Form 8-K Report, File Nos. 1-8962 and 1-4473
|
|
12/15/2005
|
|
|
10.6.1b
bd
|
|
Pinnacle West
APS
|
|
Performance Share Agreement under the Pinnacle West Capital Corporation 2002 Long-Term Incentive Plan
|
10.1 to Pinnacle West/APS December 31, 2005 Form 8-K Report, File Nos. 1-8962 and 1-4473
|
|
2/1/2006
|
|
|
10.6.1c
bd
|
|
Pinnacle West
APS
|
|
Performance Accelerated Stock Option Agreement under Pinnacle West Capital Corporation 2002 Long-Term Incentive Plan
|
10.98 to Pinnacle West/APS 2004 Form 10-K Report, File Nos. 1-8962 and 1-4473
|
|
3/16/2005
|
|
|
10.6.1d
bd
|
|
Pinnacle West
APS
|
|
Performance Share Agreement under the Pinnacle West Capital Corporation 2002 Long-Term Incentive Plan
|
10.91 to Pinnacle West/APS 2005 Form 10-K Report, File Nos. 1-8962 and 1-4473
|
|
3/13/2006
|
|
|
10.6.2
b
|
|
Pinnacle West
|
|
Pinnacle West Capital Corporation 2007 Long-Term Incentive Plan
|
Appendix B to the Proxy Statement for Pinnacle West’s 2007 Annual Meeting of Shareholders, File No. 1-8962
|
|
4/20/2007
|
|
|
10.6.2a
b
|
|
Pinnacle West
|
|
First Amendment to the Pinnacle West Capital Corporation 2007 Long-Term Incentive Plan
|
10.2 to Pinnacle West/APS April 18, 2007 Form 8-K Report, File No. 1-8962
|
|
4/20/2007
|
|
|
10.6.2b
bd
|
|
Pinnacle West
APS
|
|
Performance Share Agreement under the Pinnacle West Capital Corporation 2007 Long-Term Incentive Plan
|
10.3 to Pinnacle West/APS March 31, 2009 Form 10-Q Report, File Nos. 1-8962 and 1-4473
|
|
5/5/2009
|
|
|
10.6.2c
bd
|
|
Pinnacle West
|
|
Form of Performance Share Agreement under the Pinnacle West Capital Corporation 2007 Long-Term Incentive Plan
|
10.1 to Pinnacle West/APS June 30, 2010 Form 10-Q Report, File No. 1-8962
|
|
8/3/2010
|
|
|
10.6.2d
bd
|
|
Pinnacle West
|
|
Form of Restricted Stock Unit Agreement under the Pinnacle West Capital Corporation 2007 Long-Term Incentive Plan
|
10.2 to Pinnacle West/APS June 30, 2010 Form 10-Q Report, File No. 1-8962
|
|
8/3/2010
|
|
175
|
Exhibit
No.
|
|
Registrant(s)
|
|
Description
|
Previously Filed as Exhibit:
a
|
|
Date Filed
|
|
|
10.6.2e
bd
|
|
Pinnacle West
|
|
Form of Performance Share Agreement under the Pinnacle West Capital Corporation 2007 Long-Term Incentive Plan
|
10.4 to Pinnacle West/APS March 31, 2011 Form 10-Q Report, File No. 1-8962
|
|
4/29/2011
|
|
|
10.6.2f
bd
|
|
Pinnacle West
|
|
Form of Restricted Stock Unit Agreement under the Pinnacle West Capital Corporation 2007 Long-Term Incentive Plan
|
10.5 to Pinnacle West/APS March 31, 2011 Form 10-Q Report, File No. 1-8962
|
|
4/29/2011
|
|
|
10.6.2g
bd
|
|
Pinnacle West
|
|
Form of Restricted Stock Unit Agreement under the Pinnacle West Capital Corporation 2007 Long-Term Incentive Plan (Supplemental 2010 Award)
|
10.6 to Pinnacle West/APS March 31, 2011 Form 10-Q Report, File No. 1-8962
|
|
4/29/2011
|
|
|
10.6.3
b
|
|
Pinnacle West
|
|
Description of Annual Stock Grants to Non-Employee Directors
|
10.1 to Pinnacle West/APS September 30, 2007 Form 10-Q Report, File No. 1-8962
|
|
11/6/2007
|
|
|
10.6.4
b
|
|
Pinnacle West
|
|
Description of Stock Grant to W. Douglas Parker
|
10.2 to Pinnacle West/APS September 30, 2007 Form 10-Q Report, File No. 1-8962
|
|
11/6/2007
|
|
|
10.6.5
b
|
|
Pinnacle West
|
|
Description of Annual Stock Grants to Non-Employee Directors
|
10.2 to Pinnacle West/APS June 30, 2008 Form 10-Q Report, File No. 1-8962
|
|
8/7/2008
|
|
|
10.6.6
bd
|
|
Pinnacle West
APS
|
|
Summary of 2015 CEO Variable Incentive Plan and Officer Variable Incentive Plan
|
|
|
|
|
|
10.6.7
|
|
Pinnacle West
|
|
Description of Restricted Stock Unit Grant to Donald E. Brandt
|
Pinnacle West/APS December 24, 2012 Form 8-K Report, File No. 1-8962
|
|
12/26/2012
|
|
|
10.6.8
b
|
|
Pinnacle West
APS
|
|
Pinnacle West Capital Corporation 2012 Long-Term Incentive Plan
|
Appendix A to the Proxy Statement for Pinnacle West’s 2012 Annual Meeting of Shareholders, File No. 1-8962
|
|
3/29/2012
|
|
|
10.6.8a
bd
|
|
Pinnacle West
|
|
Form of Performance Share Award Agreement under the Pinnacle West Capital Corporation 2012 Long-Term Incentive Plan
|
10.1 to Pinnacle West/APS March 31, 2012 Form 10-Q Report, File Nos. 1-8962 and 1-4473
|
|
5/3/2012
|
|
|
10.6.8b
bd
|
|
Pinnacle West
|
|
Form of Restricted Stock Unit Award Agreement under the Pinnacle West Capital Corporation 2012 Long-Term Incentive Plan
|
10.2 to Pinnacle West/APS March 31, 2012 Form 10-Q Report, File Nos. 1-8962 and 1-4473
|
|
5/3/2012
|
|
|
10.6.8c
bd
|
|
Pinnacle West
|
|
Form of Performance Share Award Agreement under the Pinnacle West Capital Corporation 2012 Long-Term Incentive Plan
|
10.6.8c to Pinnacle West/APS 2013 Form 10-K Report, File Nos. 1-8962 and 1-4473
|
|
2/21/2014
|
|
|
10.6.8d
bd
|
|
Pinnacle West
|
|
Form of Restricted Stock Unit Award Agreement under the Pinnacle West Capital Corporation 2012 Long-Term Incentive Plan
|
10.6.8d to Pinnacle West/APS 2013 Form 10-K Report, File Nos. 1-8962 and 1-4473
|
|
2/21/2014
|
|
|
10.6.8e
bd
|
|
Pinnacle West
|
|
Master Amendment to Performance Share Agreements
|
10.3 to Pinnacle West/APS March 31, 2012 Form 10-Q Report, File Nos. 1-8962 and 1-4473
|
|
5/3/2012
|
|
|
10.6.8f
bd
|
|
Pinnacle West
|
|
Master Amendment to Restricted Stock Unit Agreements
|
10.4 to Pinnacle West/APS March 31, 2012 Form 10-Q Report, File Nos. 1-8962 and 1-4473
|
|
5/3/2012
|
|
176
|
Exhibit
No.
|
|
Registrant(s)
|
|
Description
|
Previously Filed as Exhibit:
a
|
|
Date Filed
|
|
|
10.7.1
|
|
Pinnacle West
APS
|
|
Indenture of Lease with Navajo Tribe of Indians, Four Corners Plant
|
5.01 to APS’s Form S-7 Registration Statement, File No. 2-59644
|
|
9/1/1977
|
|
|
10.7.1a
|
|
Pinnacle West
APS
|
|
Supplemental and Additional Indenture of Lease, including amendments and supplements to original lease with Navajo Tribe of Indians, Four Corners Plant
|
5.02 to APS’s Form S-7 Registration Statement, File No. 2-59644
|
|
9/1/1977
|
|
|
10.7.1b
|
|
Pinnacle West
APS
|
|
Amendment and Supplement No. 1 to Supplemental and Additional Indenture of Lease Four Corners, dated April 25, 1985
|
10.36 to Pinnacle West’s Registration Statement on Form 8-B Report, File No. 1-8962
|
|
7/25/1985
|
|
|
10.7.1c
|
|
Pinnacle West
APS
|
|
Amendment and Supplement No. 2 to Supplemental and Additional Indenture of Lease with the Navajo Nation dated March 7, 2011
|
10.1 to Pinnacle West/APS March 31, 2011 Form 10-Q Report, File Nos. 1-8962 and 1-4473
|
|
4/29/2011
|
|
|
10.7.1d
|
|
Pinnacle West
APS
|
|
Amendment and Supplement No. 3 to Supplemental and Additional Indenture of Lease with the Navajo Nation dated March 7, 2011
|
10.2 to Pinnacle West/APS March 31, 2011 Form 10-Q Report, File Nos. 1-8962 and 1-4473
|
|
4/29/2011
|
|
|
10.7.2
|
|
Pinnacle West
APS
|
|
Application and Grant of multi-party rights-of-way and easements, Four Corners Plant Site
|
5.04 to APS’s Form S-7 Registration Statement, File No. 2-59644
|
|
9/1/1977
|
|
|
10.7.2a
|
|
Pinnacle West
APS
|
|
Application and Amendment No. 1 to Grant of multi-party rights-of-way and easements, Four Corners Site dated April 25, 1985
|
10.37 to Pinnacle West’s Registration Statement on Form 8-B, File No. 1-8962
|
|
7/25/1985
|
|
|
10.7.3
|
|
Pinnacle West
APS
|
|
Application and Grant of APS rights- of-way and easements, Four Corners Site
|
5.05 to APS’s Form S-7 Registration Statement, File No. 2-59644
|
|
9/1/1977
|
|
|
10.7.3a
|
|
Pinnacle West
APS
|
|
Application and Amendment No. 1 to Grant of APS rights-of-way and easements, Four Corners Site dated April 25, 1985
|
10.38 to Pinnacle West’s Registration Statement on Form 8-B, File No. 1-8962
|
|
7/25/1985
|
|
|
10.7.4a
|
|
Pinnacle West
APS
|
|
Four Corners Project Co-Tenancy Agreement Amendment No. 6
|
10.7 to Pinnacle West’s 2000 Form 10-K Report, File No. 1-8962
|
|
3/14/2001
|
|
|
10.7.4b
|
Pinnacle West
APS
|
Four Corners Project Co-Tenancy Agreement Amendment No. 7, dated December 30, 2013, among APS, El Paso Electric Company, Public Service Company of New Mexico, SRP, SCE, and Tucson Electric Power Company
|
10.3 to Pinnacle West/APS March 31, 2014 Form 10-Q Report, File Nos. 1-8962 and 1-4473
|
5/2/2014
|
||||
|
10.8.1
|
|
Pinnacle West
APS
|
|
Indenture of Lease, Navajo Units 1, 2, and 3
|
5(g) to APS’s Form S-7 Registration Statement, File No. 2-36505
|
|
3/23/1970
|
|
|
10.8.2
|
|
Pinnacle West
APS
|
|
Application of Grant of rights-of-way and easements, Navajo Plant
|
5(h) to APS Form S-7 Registration Statement, File No. 2-36505
|
|
3/23/1970
|
|
|
10.8.3
|
|
Pinnacle West
APS
|
|
Water Service Contract Assignment with the United States Department of Interior, Bureau of Reclamation, Navajo Plant
|
5(l) to APS’s Form S-7 Registration Statement, File No. 2-394442
|
|
3/16/1971
|
|
177
|
Exhibit
No.
|
|
Registrant(s)
|
|
Description
|
Previously Filed as Exhibit:
a
|
|
Date Filed
|
|
|
10.8.4
|
|
Pinnacle West
APS
|
|
Navajo Project Co-Tenancy Agreement dated as of March 23, 1976, and Supplement No. 1 thereto dated as of October 18, 1976, Amendment No. 1 dated as of July 5, 1988, and Amendment No. 2 dated as of June 14, 1996; Amendment No. 3 dated as of February 11, 1997; Amendment No. 4 dated as of January 21, 1997; Amendment No. 5 dated as of January 23, 1998; Amendment No. 6 dated as of July 31, 1998
|
10.107 to Pinnacle West/APS 2005 Form 10-K Report, File Nos. 1-8962 and 1-4473
|
|
3/13/2006
|
|
|
10.8.5
|
|
Pinnacle West
APS
|
|
Navajo Project Participation Agreement dated as of September 30, 1969, and Amendment and Supplement No. 1 dated as of January 16, 1970, and Coordinating Committee Agreement No. 1 dated as of September 30, 1971
|
10.108 to Pinnacle West/APS 2005 Form 10-K Report, File Nos. 1-8962 and 1-4473
|
|
3/13/2006
|
|
|
10.9.1
|
|
Pinnacle West
APS
|
|
ANPP Participation Agreement, dated August 23, 1973, among APS, SRP, SCE, Public Service Company of New Mexico, El Paso, Southern California Public Power Authority, and Department of Water and Power of the City of Los Angeles, and amendments 1-12 thereto
|
10. 1 to APS’s 1988 Form 10-K Report, File No. 1-4473
|
|
3/8/1989
|
|
|
10.9.1a
|
|
Pinnacle West
APS
|
|
Amendment No. 13, dated as of April 22, 1991, to ANPP Participation Agreement, dated August 23, 1973, among APS, SRP, SCE, Public Service Company of New Mexico, El Paso, Southern California Public Power Authority, and Department of Water and Power of the City of Los Angeles
|
10.1 to APS’s March 31, 1991 Form 10-Q Report, File No. 1-4473
|
|
5/15/1991
|
|
|
10.9.1b
|
|
Pinnacle West
APS
|
|
Amendment No. 14 to ANPP Participation Agreement, dated August 23, 1973, among APS, SRP, SCE, Public Service Company of New Mexico, El Paso, Southern California Public Power Authority, and Department of Water and Power of the City of Los Angeles
|
99.1 to Pinnacle West’s June 30, 2000 Form 10-Q Report, File No. 1-8962
|
|
8/14/2000
|
|
|
10.9.1c
|
|
Pinnacle West
APS
|
|
Amendment No. 15, dated November 29, 2010, to ANPP Participation Agreement, dated August 23, 1973, among APS, SRP, SCE, Public Service Company of New Mexico, El Paso, Southern California Public Power Authority, and Department of Water and Power of the City of Los Angeles
|
10.9.1c to Pinnacle West/APS 2010 Form 10-K Report, File Nos. 1-8962 and 1-4473
|
|
2/18/2011
|
|
178
|
Exhibit
No.
|
|
Registrant(s)
|
|
Description
|
Previously Filed as Exhibit:
a
|
|
Date Filed
|
|
|
10.9.1d
|
Pinnacle West
APS
|
Amendment No. 16, dated April 28, 2014, to ANPP Participation Agreement, dated August 23, 1973, among APS, SRP, SCE, Public Service Company of New Mexico, El Paso, Southern California Public Power Authority, and Department of Water and Power of the City of Los Angeles
|
10.2 to Pinnacle West/APS March 31, 2014 Form 10-Q Report, File Nos. 1-8962 and 1-4473
|
5/2/2014
|
||||
|
10.10.1
|
|
Pinnacle West
APS
|
|
Asset Purchase and Power Exchange Agreement dated September 21, 1990 between APS and PacifiCorp, as amended as of October 11, 1990 and as of July 18, 1991
|
10.1 to APS’s June 30, 1991 Form 10-Q Report, File No. 1-4473
|
|
8/8/1991
|
|
|
10.10.2
|
|
Pinnacle West
APS
|
|
Long-Term Power Transaction Agreement dated September 21, 1990 between APS and PacifiCorp, as amended as of October 11, 1990, and as of July 8, 1991
|
10.2 to APS’s June 30, 1991 Form 10-Q Report, File No. 1-4473
|
|
8/8/1991
|
|
|
10.10.2a
|
|
Pinnacle West
APS
|
|
Amendment No. 1 dated April 5, 1995 to the Long-Term Power Transaction Agreement and Asset Purchase and Power Exchange Agreement between PacifiCorp and APS
|
10.3 to APS’s 1995 Form 10-K Report, File No. 1-4473
|
|
3/29/1996
|
|
|
10.10.3
|
|
Pinnacle West
APS
|
|
Restated Transmission Agreement between PacifiCorp and APS dated April 5, 1995
|
10.4 to APS’s 1995 Form 10-K Report, File No. 1-4473
|
|
3/29/1996
|
|
|
10.10.4
|
|
Pinnacle West
APS
|
|
Contract among PacifiCorp, APS and DOE Western Area Power Administration, Salt Lake Area Integrated Projects for Firm Transmission Service dated May 5, 1995
|
10.5 to APS’s 1995 Form 10-K Report, File No. 1-4473
|
|
3/29/1996
|
|
|
10.10.5
|
|
Pinnacle West
APS
|
|
Reciprocal Transmission Service Agreement between APS and PacifiCorp dated as of March 2, 1994
|
10.6 to APS’s 1995 Form 10-K Report, File No. 1-4473
|
|
3/29/1996
|
|
|
10.11.1
|
|
Pinnacle West
APS
|
|
Five-Year Credit Agreement dated as of May 9, 2014, among APS, as Borrower, Barclays Bank PLC, as Agent and Issuing Bank, and the lenders and other parties thereto
|
10.3 to Pinnacle West/APS June 30, 2014 Form 10-Q Report, File Nos. 1-8962 and 1-4473
|
|
7/31/2014
|
|
|
10.11.2
|
|
Pinnacle West
|
|
Term Loan Agreement dated as of December 31, 2014 among Pinnacle West, as Borrower, JPMorgan Chase Bank, N.A., as Agent, U.S. Bank Association, as Syndication Agent, TD Bank, N.A., The Bank of Nova Scotia and The Bank of Tokyo-Mitsubishi UFJ, Ltd., as Co-Documentation Agents, and such institutions compromising the lenders party thereto
|
||||
179
|
Exhibit
No.
|
|
Registrant(s)
|
|
Description
|
Previously Filed as Exhibit:
a
|
|
Date Filed
|
|
|
10.11.3
|
|
Pinnacle West
|
|
Five-Year Credit Agreement, dated as of May 9, 2014, among Pinnacle West, as Borrower, Barclays Bank PLC, as Agent and Issuing Bank, and the lenders and other parties thereto
|
10.4 to Pinnacle West/APS June 30, 2014 Form 10-Q Report, File Nos. 1-8962 and 1-4473
|
|
7/31/2014
|
|
|
10.11.4
|
|
Pinnacle West
APS
|
|
Reimbursement Agreement among APS, the Banks party thereto, and JPMorgan Chase Bank, N.A., as Administrative Agent and Issuing Bank, dated as of April 16, 2010
|
10.2 to Pinnacle West/APS March 31, 2010 Form 10-Q Report, File Nos. 1-8962 and 1-4473
|
|
5/6/2010
|
|
|
10.11.4a
|
|
Pinnacle West
APS
|
|
Amendment No. 1 to the Reimbursement Agreement among APS, the Banks party thereto, and JPMorgan Chase Bank, N.A., as Administrative Agent and Issuing Bank, dated December 22, 2011
|
10.11.5a to Pinnacle West/APS 2011 Form 10-K Report, File Nos. 1-8962 and 1-4473
|
|
2/24/2012
|
|
|
10.11.5
|
|
Pinnacle West
APS
|
|
Reimbursement Agreement among APS, the Banks party thereto, and JPMorgan Chase Bank, N.A., as Administrative Agent and Issuing Bank, dated as of April 16, 2010
|
10.3 to Pinnacle West/APS March 31, 2010 Form 10-Q Report, File Nos. 1-8962 and 1-4473
|
|
5/6/2010
|
|
|
10.11.5a
|
|
Pinnacle West
APS
|
|
Amendment No. 1 to the Reimbursement Agreement among APS, the Banks party thereto, and JPMorgan Chase Bank, N.A., as Administrative Agent and Issuing Bank, dated December 22, 2011
|
10.11.6a to Pinnacle West/APS 2011 Form 10-K Report, File Nos. 1-8962 and 1-4473
|
|
2/24/2012
|
|
|
10.11.6
|
|
APS
|
|
Five-Year Credit Agreement dated as of April 9, 2013 among APS, as Borrower, Barclays Bank PLC, as Agent and the lenders and other parties thereto
|
10.1 to Pinnacle West/APS March 31, 2013 Form 10-Q Report, File Nos. 1-8962 and 1-4473
|
|
5/3/2013
|
|
|
10.12.1
c
|
|
Pinnacle West
APS
|
|
Facility Lease, dated as of August 1, 1986, between U.S. Bank National Association, successor to State Street Bank and Trust Company, as successor to The First National Bank of Boston, in its capacity as Owner Trustee, as Lessor, and APS, as Lessee
|
4.3 to APS’s Form 18 Registration Statement, File No. 33-9480
|
|
10/24/1986
|
|
|
10.12.1a
c
|
|
Pinnacle West
APS
|
|
Amendment No. 1, dated as of November 1, 1986, to Facility Lease, dated as of August 1, 1986, between U.S. Bank National Association, successor to State Street Bank and Trust Company, as successor to The First National Bank of Boston, in its capacity as Owner Trustee, as Lessor, and APS, as Lessee
|
10.5 to APS’s September 30, 1986 Form 10-Q Report by means of Amendment No. 1 on December 3, 1986 Form 8, File No. 1-4473
|
|
12/4/1986
|
|
|
10.12.1b
c
|
|
Pinnacle West
APS
|
|
Amendment No. 2 dated as of June 1, 1987 to Facility Lease dated as of August 1, 1986 between U.S. Bank National Association, successor to State Street Bank and Trust Company, as successor to The First National Bank of Boston, as Lessor, and APS, as Lessee
|
10.3 to APS’s 1988 Form 10-K Report, File No. 1-4473
|
|
3/8/1989
|
|
180
|
Exhibit
No.
|
|
Registrant(s)
|
|
Description
|
Previously Filed as Exhibit:
a
|
|
Date Filed
|
|
|
10.12.1c
c
|
|
Pinnacle West
APS
|
|
Amendment No. 3, dated as of March 17, 1993, to Facility Lease, dated as of August 1, 1986, between U.S. Bank National Association, successor to State Street Bank and Trust Company, as successor to The First National Bank of Boston, as Lessor, and APS, as Lessee
|
10.3 to APS’s 1992 Form 10-K Report, File No. 1-4473
|
|
3/30/1993
|
|
|
10.12.2
|
|
Pinnacle West
APS
|
|
Facility Lease, dated as of December 15, 1986, between U.S. Bank National Association, successor to State Street Bank and Trust Company, as successor to The First National Bank of Boston, in its capacity as Owner Trustee, as Lessor, and APS, as Lessee
|
10.1 to APS’s November 18, 1986 Form 8-K Report, File No. 1-4473
|
|
1/20/1987
|
|
|
10.12.2a
|
|
Pinnacle West
APS
|
|
Amendment No. 1, dated as of August 1, 1987, to Facility Lease, dated as of December 15, 1986, between U.S. Bank National Association, successor to State Street Bank and Trust Company, as successor to The First National Bank of Boston, as Lessor, and APS, as Lessee
|
4.13 to APS’s Form 18 Registration Statement No. 33-9480 by means of August 1, 1987 Form 8-K Report, File No. 1-4473
|
|
8/24/1987
|
|
|
10.12.2b
|
|
Pinnacle West
APS
|
|
Amendment No. 2, dated as of March 17, 1993, to Facility Lease, dated as of December 15, 1986, between U.S. Bank National Association, successor to State Street Bank and Trust Company, as successor to The First National Bank of Boston, as Lessor, and APS, as Lessee
|
10.4 to APS’s 1992 Form 10-K Report, File No. 1-4473
|
|
3/30/1993
|
|
|
10.12.2c
|
|
Pinnacle West
APS
|
Amendment No. 3, dated July 10, 2014, to Facility Lease, dated as of December 15, 1986, between U.S. Bank National Association, successor to State Street Bank and Trust Company, as successor to the First National Bank of Boston, as Lessor, and APS, as Lessee
|
10.2 to Pinnacle West/APS June 30, 2014 Form 10-Q Report, File Nos. 1-8962 and 1-4473
|
|
7/31/2014
|
||
|
10.13.1
|
|
Pinnacle West
APS
|
|
Agreement between Pinnacle West Energy Corporation and APS for Transportation and Treatment of Effluent by and between Pinnacle West Energy Corporation and APS dated as of the 10
th
day of April, 2001
|
10.102 to Pinnacle West/APS 2004 Form 10-K Report, File Nos. 1-8962 and 1-4473
|
|
3/16/2005
|
|
|
10.13.2
|
|
Pinnacle West
APS
|
|
Agreement for the Transfer and Use of Wastewater and Effluent by and between APS, SRP and PWE dated June 1, 2001
|
10.103 to Pinnacle West/APS 2004 Form 10-K Report, File Nos. 1-8962 and 1-4473
|
|
3/16/2005
|
|
|
10.13.3
|
|
Pinnacle West
APS
|
|
Agreement for the Sale and Purchase of Wastewater Effluent dated November 13, 2000, by and between the City of Tolleson, Arizona, APS and SRP
|
10.104 to Pinnacle West/APS 2004 Form 10-K Report, File Nos. 1-8962 and 1-4473
|
|
3/16/2005
|
|
181
|
Exhibit
No.
|
|
Registrant(s)
|
|
Description
|
Previously Filed as Exhibit:
a
|
|
Date Filed
|
|
|
10.13.4
|
|
Pinnacle West
APS
|
|
Operating Agreement for the Co-Ownership of Wastewater Effluent dated November 16, 2000 by and between APS and SRP
|
10.105 to Pinnacle West/APS 2004 Form 10-K Report, File Nos. 1-8962 and 1-4473
|
|
3/16/2005
|
|
|
10.13.5
|
|
Pinnacle West
APS
|
|
Municipal Effluent Purchase and Sale Agreement dated April 29, 2010, by and between City of Phoenix, City of Mesa, City of Tempe, City of Scottsdale, City of Glendale, APS and SRP
|
10.1 to Pinnacle West/APS March 31, 2010 Form 10-Q Report, File Nos. 1-8962 and 1-4473
|
|
5/6/2010
|
|
|
10.14.1
|
|
Pinnacle West
APS
|
|
Contract, dated July 21, 1984, with DOE providing for the disposal of nuclear fuel and/or high-level radioactive waste, ANPP
|
10.31 to Pinnacle West’s Form S-14 Registration Statement, File No. 2-96386
|
|
3/13/1985
|
|
|
10.15.1
|
|
Pinnacle West
APS
|
|
Territorial Agreement between APS and SRP
|
10.1 to APS’s March 31, 1998 Form 10-Q Report, File No. 1-4473
|
|
5/15/1998
|
|
|
10.15.2
|
|
Pinnacle West
APS
|
|
Power Coordination Agreement between APS and SRP
|
10.2 to APS’s March 31, 1998 Form 10-Q Report, File No. 1-4473
|
|
5/15/1998
|
|
|
10.15.3
|
|
Pinnacle West
APS
|
|
Memorandum of Agreement between APS and SRP
|
10.3 to APS’s March 31, 1998 Form 10-Q Report, File No. 1-4473
|
|
5/15/1998
|
|
|
10.15.3a
|
|
Pinnacle West
APS
|
|
Addendum to Memorandum of Agreement between APS and SRP dated as of May 19, 1998
|
10.2 to APS’s May 19, 1998 Form 8-K Report, File No. 1-4473
|
|
6/26/1998
|
|
|
10.16
|
|
Pinnacle West
APS
|
|
Purchase and Sale Agreement dated November 8, 2010 by and between SCE and APS
|
10.1 to Pinnacle West/APS November 8, 2010 Form 8-K Report, File Nos. 1-8962 and 1-4473
|
|
11/8/2010
|
|
|
10.17
|
|
Pinnacle West
APS
|
|
Proposed Settlement Agreement dated January 6, 2012 by and among APS and certain parties to its retail rate case (approved by ACC Order No. 73183)
|
10.17 to Pinnacle West/APS 2011 Form 10-K Report, File Nos. 1-8962 and 1-4473
|
|
2/24/2012
|
|
|
12.1
|
|
Pinnacle West
|
|
Ratio of Earnings to Fixed Charges
|
|
|
|
|
|
12.2
|
|
APS
|
|
Ratio of Earnings to Fixed Charges
|
|
|
|
|
|
12.3
|
|
Pinnacle West
|
|
Ratio of Earnings to Combined Fixed Charges and Preferred Stock Dividend Requirements
|
|
|
|
|
|
21.1
|
|
Pinnacle West
|
|
Subsidiaries of Pinnacle West
|
|
|
|
|
|
23.1
|
|
Pinnacle West
|
|
Consent of Deloitte & Touche LLP
|
|
|
|
|
|
23.2
|
|
APS
|
|
Consent of Deloitte & Touche LLP
|
|
|
|
|
|
31.1
|
|
Pinnacle West
|
|
Certificate of Donald E. Brandt, Chief Executive Officer, pursuant to Rule 13a-14(a) and Rule 15d-14(a) of the Securities Exchange Act, as amended
|
|
|
|
|
|
31.2
|
|
Pinnacle West
|
|
Certificate of James R. Hatfield, Chief Financial Officer, pursuant to Rule 13a-14(a) and Rule 15d-14(a) of the Securities Exchange Act, as amended
|
|
|
|
|
182
|
Exhibit
No.
|
|
Registrant(s)
|
|
Description
|
Previously Filed as Exhibit:
a
|
|
Date Filed
|
|
|
31.3
|
|
APS
|
|
Certificate of Donald E. Brandt, Chief Executive Officer, pursuant to Rule 13a-14(a) and Rule 15d-14(a) of the Securities Exchange Act, as amended
|
|
|
|
|
|
31.4
|
|
APS
|
|
Certificate of James R. Hatfield, Chief Financial Officer, pursuant to Rule 13a-14(a) and Rule 15d-14(a) of the Securities Exchange Act, as amended
|
|
|
|
|
|
32.1
e
|
|
Pinnacle West
|
|
Certification of Chief Executive Officer and Chief Financial Officer, pursuant to 18 U.S.C. Section 1350, as adopted pursuant to Section 906 of the Sarbanes-Oxley Act of 2002
|
|
|
|
|
|
32.2
e
|
|
APS
|
|
Certification of Chief Executive Officer and Chief Financial Officer, pursuant to 18 U.S.C. Section 1350, as adopted pursuant to Section 906 of the Sarbanes-Oxley Act of 2002
|
|
|
|
|
|
99.1
|
|
Pinnacle West
APS
|
|
Collateral Trust Indenture among PVNGS II Funding Corp., Inc., APS and Chemical Bank, as Trustee
|
4.2 to APS’s 1992 Form 10-K Report, File No. 1-4473
|
|
3/30/1993
|
|
|
99.1a
|
|
Pinnacle West
APS
|
|
Supplemental Indenture to Collateral Trust Indenture among PVNGS II Funding Corp., Inc., APS and Chemical Bank, as Trustee
|
4.3 to APS’s 1992 Form 10-K Report, File No. 1-4473
|
|
3/30/1993
|
|
|
99.2
c
|
|
Pinnacle West
APS
|
|
Participation Agreement, dated as of August 1, 1986, among PVNGS Funding Corp., Inc., Bank of America National Trust and Savings Association, State Street Bank and Trust Company, as successor to The First National Bank of Boston, in its individual capacity and as Owner Trustee, Chemical Bank, in its individual capacity and as Indenture Trustee, APS, and the Equity Participant named therein
|
28.1 to APS’s September 30, 1992 Form 10-Q Report, File No. 1-4473
|
|
11/9/1992
|
|
|
99.2a
c
|
|
Pinnacle West
APS
|
|
Amendment No. 1 dated as of November 1, 1986, to Participation Agreement, dated as of August 1, 1986, among PVNGS Funding Corp., Inc., Bank of America National Trust and Savings Association, State Street Bank and Trust Company, as successor to The First National Bank of Boston, in its individual capacity and as Owner Trustee, Chemical Bank, in its individual capacity and as Indenture Trustee, APS, and the Equity Participant named therein
|
10.8 to APS’s September 30, 1986 Form 10-Q Report by means of Amendment No. 1, on December 3, 1986 Form 8, File No. 1-4473
|
|
12/4/1986
|
|
183
|
Exhibit
No.
|
|
Registrant(s)
|
|
Description
|
Previously Filed as Exhibit:
a
|
|
Date Filed
|
|
|
99.2b
c
|
|
Pinnacle West
APS
|
|
Amendment No. 2, dated as of March 17, 1993, to Participation Agreement, dated as of August 1, 1986, among PVNGS Funding Corp., Inc., PVNGS II Funding Corp., Inc., State Street Bank and Trust Company, as successor to The First National Bank of Boston, in its individual capacity and as Owner Trustee, Chemical Bank, in its individual capacity and as Indenture Trustee, APS, and the Equity Participant named therein
|
28.4 to APS’s 1992 Form 10-K Report, File No. 1-4473
|
|
3/30/1993
|
|
|
99.3
c
|
|
Pinnacle West
APS
|
|
Trust Indenture, Mortgage, Security Agreement and Assignment of Facility Lease, dated as of August 1, 1986, between State Street Bank and Trust Company, as successor to The First National Bank of Boston, as Owner Trustee, and Chemical Bank, as Indenture Trustee
|
4.5 to APS’s Form 18 Registration Statement, File No. 33-9480
|
|
10/24/1986
|
|
|
99.3a
c
|
|
Pinnacle West
APS
|
|
Supplemental Indenture No. 1, dated as of November 1, 1986 to Trust Indenture, Mortgage, Security Agreement and Assignment of Facility Lease, dated as of August 1, 1986, between State Street Bank and Trust Company, as successor to The First National Bank of Boston, as Owner Trustee, and Chemical Bank, as Indenture Trustee
|
10.6 to APS’s September 30, 1986 Form 10-Q Report by means of Amendment No. 1 on December 3, 1986 Form 8, File No. 1-4473
|
|
12/4/1986
|
|
|
99.3b
c
|
|
Pinnacle West
APS
|
|
Supplemental Indenture No. 2 to Trust Indenture, Mortgage, Security Agreement and Assignment of Facility Lease, dated as of August 1, 1986, between State Street Bank and Trust Company, as successor to The First National Bank of Boston, as Owner Trustee, and Chemical Bank, as Lease Indenture Trustee
|
4.4 to APS’s 1992 Form 10-K Report, File No. 1-4473
|
|
3/30/1993
|
|
|
99.4
c
|
|
Pinnacle West
APS
|
|
Assignment, Assumption and Further Agreement, dated as of August 1, 1986, between APS and State Street Bank and Trust Company, as successor to The First National Bank of Boston, as Owner Trustee
|
28.3 to APS’s Form 18 Registration Statement, File No. 33-9480
|
|
10/24/1986
|
|
|
99.4a
c
|
|
Pinnacle West
APS
|
|
Amendment No. 1, dated as of November 1, 1986, to Assignment, Assumption and Further Agreement, dated as of August 1, 1986, between APS and State Street Bank and Trust Company, as successor to The First National Bank of Boston, as Owner Trustee
|
10.10 to APS’s September 30, 1986 Form 10-Q Report by means of Amendment No. l on December 3, 1986 Form 8, File No. 1-4473
|
|
12/4/1986
|
|
184
|
Exhibit
No.
|
|
Registrant(s)
|
|
Description
|
Previously Filed as Exhibit:
a
|
|
Date Filed
|
|
|
99.4b
c
|
|
Pinnacle West
APS
|
|
Amendment No. 2, dated as of March 17, 1993, to Assignment, Assumption and Further Agreement, dated as of August 1, 1986, between APS and State Street Bank and Trust Company, as successor to The First National Bank of Boston, as Owner Trustee
|
28.6 to APS’s 1992 Form 10-K Report, File No. 1-4473
|
|
3/30/1993
|
|
|
99.5
|
|
Pinnacle West
APS
|
|
Participation Agreement, dated as of December 15, 1986, among PVNGS Funding Report Corp., Inc., State Street Bank and Trust Company, as successor to The First National Bank of Boston, in its individual capacity and as Owner Trustee, Chemical Bank, in its individual capacity and as Indenture Trustee under a Trust Indenture, APS, and the Owner Participant named therein
|
28.2 to APS’s September 30, 1992 Form 10-Q Report, File No. 1-4473
|
|
11/9/1992
|
|
|
99.5a
|
|
Pinnacle West
APS
|
|
Amendment No. 1, dated as of August 1, 1987, to Participation Agreement, dated as of December 15, 1986, among PVNGS Funding Corp., Inc. as Funding Corporation, State Street Bank and Trust Company, as successor to The First National Bank of Boston, as Owner Trustee, Chemical Bank, as Indenture Trustee, APS, and the Owner Participant named therein
|
28.20 to APS’s Form 18 Registration Statement No. 33-9480 by means of a November 6, 1986 Form 8-K Report, File No. 1-4473
|
|
8/10/1987
|
|
|
99.5b
|
|
Pinnacle West
APS
|
|
Amendment No. 2, dated as of March 17, 1993, to Participation Agreement, dated as of December 15, 1986, among PVNGS Funding Corp., Inc., PVNGS II Funding Corp., Inc., State Street Bank and Trust Company, as successor to The First National Bank of Boston, in its individual capacity and as Owner Trustee, Chemical Bank, in its individual capacity and as Indenture Trustee, APS, and the Owner Participant named therein
|
28.5 to APS’s 1992 Form 10-K Report, File No. 1-4473
|
|
3/30/1993
|
|
|
99.6
|
|
Pinnacle West
APS
|
|
Trust Indenture, Mortgage Security Agreement and Assignment of Facility Lease, dated as of December 15, 1986, between State Street Bank and Trust Company, as successor to The First National Bank of Boston, as Owner Trustee, and Chemical Bank, as Indenture Trustee
|
10.2 to APS’s November 18, 1986 Form 10-K Report, File No. 1-4473
|
|
1/20/1987
|
|
|
99.6a
|
|
Pinnacle West
APS
|
|
Supplemental Indenture No. 1, dated as of August 1, 1987, to Trust Indenture, Mortgage, Security Agreement and Assignment of Facility Lease, dated as of December 15, 1986, between State Street Bank and Trust Company, as successor to The First National Bank of Boston, as Owner Trustee, and Chemical Bank, as Indenture Trustee
|
4.13 to APS’s Form 18 Registration Statement No. 33-9480 by means of August 1, 1987 Form 8-K Report, File No. 1-4473
|
|
8/24/1987
|
|
185
|
Exhibit
No.
|
|
Registrant(s)
|
|
Description
|
Previously Filed as Exhibit:
a
|
|
Date Filed
|
|
|
99.6b
|
|
Pinnacle West
APS
|
|
Supplemental Indenture No. 2 to Trust Indenture Mortgage, Security Agreement and Assignment of Facility Lease, dated as of December 15, 1986, between State Street Bank and Trust Company, as successor to The First National Bank of Boston, as Owner Trustee, and Chemical Bank, as Lease Indenture Trustee
|
4.5 to APS’s 1992 Form 10-K Report, File No. 1-4473
|
|
3/30/1993
|
|
|
99.7
|
|
Pinnacle West
APS
|
|
Assignment, Assumption and Further Agreement, dated as of December 15, 1986, between APS and State Street Bank and Trust Company, as successor to The First National Bank of Boston, as Owner Trustee
|
10.5 to APS’s November 18, 1986 Form 8-K Report, File No. 1-4473
|
|
1/20/1987
|
|
|
99.7a
|
|
Pinnacle West
APS
|
|
Amendment No. 1, dated as of March 17, 1993, to Assignment, Assumption and Further Agreement, dated as of December 15, 1986, between APS and State Street Bank and Trust Company, as successor to The First National Bank of Boston, as Owner Trustee
|
28.7 to APS’s 1992 Form 10-K Report, File No. 1-4473
|
|
3/30/1993
|
|
|
99.8
c
|
|
Pinnacle West
APS
|
|
Indemnity Agreement dated as of March 17, 1993 by APS
|
28.3 to APS’s 1992 Form 10-K Report, File No. 1-4473
|
|
3/30/1993
|
|
|
99.9
|
|
Pinnacle West
APS
|
|
Extension Letter, dated as of August 13, 1987, from the signatories of the Participation Agreement to Chemical Bank
|
28.20 to APS’s Form 18 Registration Statement No. 33-9480 by means of a November 6, 1986 Form 8-K Report, File No. 1-4473
|
|
8/10/1987
|
|
|
99.10
|
|
Pinnacle West
APS
|
|
ACC Order, Decision No. 61969, dated September 29, 1999, including the Retail Electric Competition Rules
|
10.2 to APS’s September 30, 1999 Form 10-Q Report, File No. 1-4473
|
|
11/15/1999
|
|
|
99.11
|
|
Pinnacle West
|
|
Purchase Agreement by and among Pinnacle West Energy Corporation and GenWest, L.L.C. and Nevada Power Company, dated June 21, 2005
|
99.5 to Pinnacle West/APS June 30, 2005 Form 10-Q Report, File Nos. 1-8962 and 1-4473
|
|
8/9/2005
|
|
|
101.INS
|
|
Pinnacle West
APS
|
|
XBRL Instance Document
|
|
|
|
|
|
101.SCH
|
|
Pinnacle West
APS
|
|
XBRL Taxonomy Extension Schema Document
|
|
|
|
|
|
101.CAL
|
|
Pinnacle West
APS
|
|
XBRL Taxonomy Extension Calculation Linkbase Document
|
|
|
|
|
|
101.LAB
|
|
Pinnacle West
APS
|
|
XBRL Taxonomy Extension Label Linkbase Document
|
|
|
|
|
|
101.PRE
|
|
Pinnacle West
APS
|
|
XBRL Taxonomy Extension Presentation Linkbase Document
|
|
|
|
|
|
101.DEF
|
|
Pinnacle West
APS
|
|
XBRL Taxonomy Definition Linkbase Document
|
|
|
|
|
a
Reports filed under File No. 1-4473 and 1-8962 were filed in the office of the Securities and Exchange Commission located in Washington, D.C.
186
b
Management contract or compensatory plan or arrangement to be filed as an exhibit pursuant to Item 15(b) of Form 10-K.
c
An additional document, substantially identical in all material respects to this Exhibit, has been entered into, relating to an additional Equity Participant. Although such additional document may differ in other respects (such as dollar amounts, percentages, tax indemnity matters, and dates of execution), there are no material details in which such document differs from this Exhibit.
d
Additional agreements, substantially identical in all material respects to this Exhibit have been entered into with additional persons. Although such additional documents may differ in other respects (such as dollar amounts and dates of execution), there are no material details in which such agreements differ from this Exhibit.
e
Furnished herewith as an Exhibit.
187
SIGNATURES
Pursuant to the requirements of Section 13 or 15(d) of the Securities Exchange Act of 1934, the Registrant has duly caused this report to be signed on its behalf by the undersigned, thereunto duly authorized.
|
PINNACLE WEST CAPITAL CORPORATION
|
|
|
(Registrant)
|
|
|
Date: February 20, 2015
|
/s/ Donald E. Brandt
|
|
(Donald E. Brandt, Chairman of
the Board of Directors, President and
Chief Executive Officer)
|
|
Power of Attorney
We, the undersigned directors and executive officers of Pinnacle West Capital Corporation, hereby severally appoint James R. Hatfield and David P. Falck, and each of them, our true and lawful attorneys with full power to them and each of them to sign for us, and in our names in the capacities indicated below, any and all amendments to this Annual Report on Form 10-K filed with the Securities and Exchange Commission.
Pursuant to the requirements of the Securities Exchange Act of 1934, this report has been signed below by the following persons on behalf of the registrant and in the capacities and on the dates indicated.
|
Signature
|
Title
|
Date
|
||
|
/s/ Donald E. Brandt
|
Principal Executive Officer
|
February 20, 2015
|
||
|
(Donald E. Brandt, Chairman
|
and Director
|
|||
|
of the Board of Directors, President
|
||||
|
and Chief Executive Officer)
|
||||
|
/s/ James R. Hatfield
|
Principal Financial Officer
|
February 20, 2015
|
||
|
(James R. Hatfield,
|
||||
|
Executive Vice President and
|
||||
|
Chief Financial Officer)
|
||||
|
/s/ Denise R. Danner
|
Principal Accounting Officer
|
February 20, 2015
|
||
|
(Denise R. Danner,
|
||||
|
Vice President, Controller and
|
||||
|
Chief Accounting Officer)
|
||||
188
|
/s/ Denis A. Cortese
|
Director
|
February 20, 2015
|
||
|
(Denis A. Cortese, M.D.)
|
||||
|
/s/ Richard P. Fox
|
Director
|
February 20, 2015
|
||
|
(Richard P. Fox)
|
||||
|
/s/ Michael L. Gallagher
|
Director
|
February 20, 2015
|
||
|
(Michael L. Gallagher)
|
||||
|
/s/ Roy A. Herberger
|
Director
|
February 20, 2015
|
||
|
(Roy A. Herberger, Jr., Ph.D.)
|
||||
|
/s/ Dale E. Klein
|
Director
|
February 20, 2015
|
||
|
(Dale E. Klein, Ph.D.)
|
||||
|
/s/ Humberto S. Lopez
|
Director
|
February 20, 2015
|
||
|
(Humberto S. Lopez)
|
||||
|
/s/ Kathryn L. Munro
|
Director
|
February 20, 2015
|
||
|
(Kathryn L. Munro)
|
||||
|
/s/ Bruce J. Nordstrom
|
Director
|
February 20, 2015
|
||
|
(Bruce J. Nordstrom)
|
||||
|
/s/ David P. Wagener
|
Director
|
February 20, 2015
|
||
|
(David P. Wagener)
|
||||
189
SIGNATURES
Pursuant to the requirements of Section 13 or 15(d) of the Securities Exchange Act of 1934, the Registrant has duly caused this report to be signed on its behalf by the undersigned, thereunto duly authorized.
|
|
ARIZONA PUBLIC SERVICE COMPANY
|
|
|
(Registrant)
|
|
|
|
|
|
|
|
Date: February 20, 2015
|
/s/ Donald E. Brandt
|
|
|
(Donald E. Brandt, Chairman of
the Board of Directors, President and Chief
Executive Officer)
|
Power of Attorney
We, the undersigned directors and executive officers of Arizona Public Service Company, hereby severally appoint James R. Hatfield and David P. Falck, and each of them, our true and lawful attorneys with full power to them and each of them to sign for us, and in our names in the capacities indicated below, any and all amendments to this Annual Report on Form 10-K filed with the Securities and Exchange Commission.
Pursuant to the requirements of the Securities Exchange Act of 1934, this report has been signed below by the following persons on behalf of the registrant and in the capacities and on the dates indicated.
|
Signature
|
|
Title
|
|
Date
|
|
|
|
|
|
|
|
|
|
|
|
|
|
/s/ Donald E. Brandt
|
|
Principal Executive Officer
|
|
February 20, 2015
|
|
(Donald E. Brandt, Chairman
|
|
and Director
|
|
|
|
of the Board of Directors, President and
|
|
|
|
|
|
Chief Executive Officer)
|
|
|
|
|
|
|
|
|
|
|
|
|
|
|
|
|
|
/s/ James R. Hatfield
|
|
Principal Financial Officer
|
|
February 20, 2015
|
|
(James R. Hatfield,
|
|
|
|
|
|
Executive Vice President and
|
|
|
|
|
|
Chief Financial Officer)
|
|
|
|
|
|
|
|
|
|
|
|
|
|
|
|
|
|
/s/ Denise R. Danner
|
|
Principal Accounting Officer
|
|
February 20, 2015
|
|
(Denise R. Danner,
|
|
|
|
|
|
Vice President, Controller and
|
|
|
|
|
|
Chief Accounting Officer)
|
|
|
|
|
190
|
/s/ Denis A. Cortese
|
|
Director
|
|
February 20, 2015
|
|
(Denis A. Cortese, M.D.)
|
|
|
|
|
|
|
|
|
|
|
|
/s/ Richard P. Fox
|
|
Director
|
|
February 20, 2015
|
|
(Richard P. Fox)
|
|
|
|
|
|
|
|
|
|
|
|
/s/ Michael L. Gallagher
|
|
Director
|
|
February 20, 2015
|
|
(Michael L. Gallagher)
|
|
|
|
|
|
|
|
|
|
|
|
|
|
|
|
|
|
/s/ Roy A. Herberger
|
|
Director
|
|
February 20, 2015
|
|
(Roy A. Herberger, Jr., Ph.D.)
|
|
|
|
|
|
|
|
|
|
|
|
|
|
|
|
|
|
/s/ Dale E. Klein
|
|
Director
|
|
February 20, 2015
|
|
(Dale E. Klein, Ph.D.)
|
|
|
|
|
|
|
|
|
|
|
|
|
|
|
|
|
|
/s/ Humberto S. Lopez
|
|
Director
|
|
February 20, 2015
|
|
(Humberto S. Lopez)
|
|
|
|
|
|
|
|
|
|
|
|
|
|
|
|
|
|
/s/ Kathryn L. Munro
|
|
Director
|
|
February 20, 2015
|
|
(Kathryn L. Munro)
|
|
|
|
|
|
|
|
|
|
|
|
|
|
|
|
|
|
/s/ Bruce J. Nordstrom
|
|
Director
|
|
February 20, 2015
|
|
(Bruce J. Nordstrom)
|
|
|
|
|
|
|
|
|
|
|
|
|
|
|
|
|
|
/s/ David P. Wagener
|
|
Director
|
|
February 20, 2015
|
|
(David P. Wagener)
|
|
|
|
|
191
TABLE OF CONTENTS
Part IItem 1. BusinessItem 1A. Risk FactorsItem 1B. Unresolved Staff CommentsItem 2. PropertiesItem 3. Legal ProceedingsItem 4. Mine Safety DisclosuresPart IIItem 5. Market For Registrants Common Equity, RelatedItem 6. Selected Financial DataItem 7. Management S Discussion and AnalysisItem 7A. Quantitative and QualitativeItem 8. Financial Statements and Supplementary DataItem 9. Changes in and Disagreements with AccountantsItem 9A. Controls and ProceduresItem 9B. Other InformationPart IIIItem 10. Directors, Executive OfficersItem 11. Executive CompensationItem 12. Security Ownership OfItem 13. Certain Relationships and RelatedItem 14. Principal AccountantPart IVItem 15. Exhibits and Financial Statement Schedules