INSULET CORP
10-Ks and 10-Qs
|
|
|
|
|
|
|
|
|
|
|
|
|
|
|
|
|
|
|
|
|
|
|
|
|
|
|
|
|
|
|
|
|
|
|
|
|
|
|
|
|
|
|
|
|
|
|
|
|
|
|
|
|
|
|
|
UNITED STATES SECURITIES AND EXCHANGE COMMISSION
Washington, D.C. 20549
Form 10-K
|
x
|
ANNUAL REPORT PURSUANT TO SECTION 13 OR 15(d) OF THE SECURITIES EXCHANGE ACT OF 1934
|
|
For the fiscal year ended December 31, 2017
|
|
|
¨
|
TRANSITION REPORT PURSUANT TO SECTION 13 OR 15(d) OF THE SECURITIES EXCHANGE ACT OF 1934
|
|
For the transition period from to
|
|
Commission File Number 001-33462
INSULET CORPORATION
(Exact name of Registrant as specified in its charter)
|
Delaware
|
|
04-3523891
|
|
(State or Other Jurisdiction of
Incorporation or Organization)
|
|
(I.R.S. Employer
Identification No.)
|
|
600 Technology Park Drive, Suite 200
Billerica, Massachusetts
|
|
01821
|
|
(Address of Principal Executive Offices)
|
|
(Zip Code)
|
Registrant’s telephone number, including area code:
(978) 600-7000
Securities registered pursuant to Section 12(b) of the Act:
|
Title of Each Class
|
|
Name of Each Exchange on Which Registered
|
|
Common Stock, $0.001 Par Value Per Share
|
|
The NASDAQ Stock Market, LLC
|
|
Preferred Stock Purchase Rights
|
|
The NASDAQ Stock Market, LLC
|
Securities registered pursuant to Section 12(g) of the Act:
None
Indicate by check mark if the registrant is a well-known seasoned issuer, as defined in Rule 405 of the Securities Act. Yes
x
No
¨
Indicate by check mark if the registrant is not required to file reports pursuant to Section 13 or Section 15(d) of the Act. Yes
¨
No
x
Indicate by check mark whether the registrant (1) has filed all reports required to be filed by Section 13 or 15(d) of the Securities Exchange Act of 1934 during the preceding 12 months (or for such shorter period that the Registrant was required to file such reports) and (2) has been subject to such filing requirements for the past 90 days. Yes
x
No
¨
Indicate by check mark whether the registrant has submitted electronically and posted on its corporate Web site, if any, every Interactive Data File required to be submitted and posted pursuant to Rule 405 of Regulation S-T (§ 232.405 of this chapter) during the preceding 12 months (or for such shorter period that the registrant was required to submit and post such files). Yes
x
No
¨
Indicate by check mark if disclosure of delinquent filers pursuant to Item 405 of Regulation S-K (§ 229.405) is not contained herein, and will not be contained, to the best of registrant’s knowledge, in definitive proxy or information statements incorporated by reference in Part III of this Form 10-K or any amendment to this Form 10-K.
¨
Indicate by check mark whether the registrant is a large accelerated filer, an accelerated filer, a non-accelerated filer, or a smaller reporting company. See the definitions of “large accelerated filer,” “accelerated filer” and “smaller reporting company” in Rule 12b-2 of the Exchange Act. (Check one):
|
Large accelerated filer
x
|
|
Accelerated filer
o
|
|
Non-accelerated filer
o
|
|
Smaller reporting company
o
|
|
|
(Do not check if a smaller reporting company)
|
|||||
Indicate by check mark whether the Registrant is a shell company (as defined in Rule 12b-2 of the Exchange Act). Yes
¨
No
x
The aggregate market value of the common stock held by non-affiliates of the registrant computed by reference to the last reported sale price of the Common Stock as reported on The NASDAQ Global Market on
June 30, 2017
was approximately
$3.0 billion
.
The number of shares outstanding of each of the registrant’s classes of common stock as of
February 16, 2018
:
|
Title of Class
|
|
Shares Outstanding
|
|
Common Stock, $0.001 Par Value Per Share
|
|
58,391,036
|
|
Preferred Stock Purchase Rights
|
|
—
|
DOCUMENTS INCORPORATED BY REFERENCE
The registrant intends to file a proxy statement pursuant to Regulation 14A within 120 days of the end of the fiscal year ended December 31,
2017
. Portions of such proxy statement are incorporated by reference into Part III of this Annual Report on Form 10-K.
TABLE OF CONTENTS
Overview
We are primarily engaged in the development, manufacturing and sale of our proprietary Omnipod
®
Insulin Management System (the “Omnipod System”), an innovative, discreet and easy-to-use continuous insulin delivery system for people with insulin-dependent diabetes. The Omnipod System features a small, lightweight, self-adhesive disposable tubeless Omnipod device, which is worn on the body for approximately three days at a time, and its wireless companion: the handheld Personal Diabetes Manager (“PDM”). Conventional tubed insulin pumps require people with insulin-dependent diabetes to learn to use, manage and wear a number of cumbersome components, including up to 42 inches of tubing. In contrast, the Omnipod System features only two discreet, easy-to-use devices that eliminate the need for a bulky pump and tubing, provides for virtually pain-free automated cannula insertion, communicates wirelessly and integrates a blood glucose meter. We believe that the Omnipod System’s unique proprietary design and features allow people with insulin-dependent diabetes to manage their diabetes with unprecedented freedom, comfort, convenience, and ease.
We began commercial sale of the Omnipod System in the United States in 2005. We sell the Omnipod System in the United States through direct sales to customers or through our distribution partners. The Omnipod System is currently available in multiple countries in Europe, as well as in Canada and Israel.
In January 2018, the Centers for Medicare & Medicaid Services (“CMS”) issued guidance clarifying that Medicare Part D Plan Sponsors may provide coverage for products such as the Omnipod System under the Medicare Part D (prescription drug) program. We believe this guidance will allow many additional people with diabetes to begin accessing our product in the future. Securing Medicare Part D coverage also provides us with a direct pathway to gain Medicaid coverage at the state level, as many state-run Medicaid programs follow CMS prescription drug guidance to determine coverage. This allows access for lower-income individuals and families on Medicaid for whom Omnipod is currently not an option. The Company estimates that obtaining Medicare and Medicaid coverage extends access to Insulet's Omnipod System to approximately 450,000 additional individuals with Type 1 diabetes in the United States.
We announced in 2017 our plans to assume, on July 1, 2018, all commercial activities (including, among other things, distribution, sales, marketing, training and support) of our Omnipod System across Europe following the expiration of our distribution agreement with Ypsomed Distribution AG ("Ypsomed" or our "European distributor") on June 30, 2018.
In addition to the diabetes market space, we have partnered with pharmaceutical and biotechnology companies that utilize a customized form of the Omnipod System to deliver a drug over a specified interval of time, at a certain administered volume. The majority of our drug delivery revenue currently consists of sales of Amgen's Neulasta Onpro kit.
We are constructing a highly-automated manufacturing facility in Acton, Massachusetts, with planned production out of the facility beginning in early 2019. The facility will also serve as our global headquarters. We expect that the new facility will allow us to lower our manufacturing costs, increase supply redundancy, add capacity closer to our largest customer base and support growth.
In January 2018, we submitted a premarket notification 510(k) to the U.S. Food and Drug Administration ("FDA") requesting clearance for commercial distribution of our DASH
TM
System, which is our next generation of the Omnipod System, featuring a secured Bluetooth Low Energy enabled Pod and PDM with a touch screen color user interface supported by smartphone connectivity. Upon clearance, we would begin a limited commercial release of the product prior to a full market launch.
3
Our Market
Diabetes is a chronic, life-threatening disease for which there is no known cure. Diabetes is caused by the body’s inability to produce or effectively utilize the hormone insulin. This inability prevents the body from adequately regulating blood glucose levels. Glucose, the primary source of energy for cells, must be maintained at certain concentrations in the blood in order to permit optimal cell function and health. In people with diabetes, blood glucose levels fluctuate between very high levels, a condition known as hyperglycemia, and very low levels, a condition called hypoglycemia. Hyperglycemia can lead to serious short-term complications, such as confusion, vomiting, dehydration and loss of consciousness and long-term complications, such as blindness, kidney disease, nervous system disease, occlusive vascular diseases, stroke and cardiovascular disease, or death. Hypoglycemia can lead to confusion, loss of consciousness or death.
Diabetes is typically classified as either Type 1 or Type 2:
|
•
|
Type 1 diabetes is characterized by the body’s nearly complete inability to produce insulin. It is frequently diagnosed during childhood or adolescence. Individuals with Type 1 diabetes require daily insulin therapy to survive, typically administered via injections or continuous infusion through pump therapy. It is estimated that approximately 1.5 million people have Type 1 diabetes in the United States.
|
|
•
|
Type 2 diabetes, the more common form of diabetes, is characterized by the body’s inability to either properly utilize insulin or produce enough insulin. Historically, Type 2 diabetes has occurred in later adulthood, but its incidence is increasing among the younger population, due primarily to increasing childhood obesity. Initially, many people with Type 2 diabetes attempt to manage their diabetes with improvements in diet, exercise and/or oral medications. As their diabetes advances, some patients progress to multiple drug therapies, which often include insulin therapy. It is estimated that approximately 1.7 million people in the United States have Type 2 diabetes requiring daily insulin administration.
|
Throughout this Annual Report on Form 10-K, we refer to both Type 1 diabetes and insulin-requiring Type 2 diabetes as insulin-dependent diabetes.
Diabetes Management Challenges
Diabetes is often frustrating and difficult for patients to manage. Blood glucose levels can be affected by the carbohydrate and fat content of meals, exercise, stress, illness or impending illness, hormonal releases, variability in insulin absorption and changes in the effects of insulin on the body. For people with insulin-dependent diabetes, many corrections, consisting of the administration of additional insulin or ingestion of additional carbohydrates, are needed throughout the day in order to maintain blood glucose levels within normal ranges. Achieving this result can be very difficult without multiple daily injections of insulin or the use of continuous subcutaneous insulin infusion (“CSII”), often referred to as pump therapy. Patients attempting to control their blood glucose levels tightly to prevent the long-term complications associated with fluctuations in blood glucose levels are at greater risk for overcorrection and the resultant hypoglycemia. As a result, many patients have difficulty managing their diabetes optimally. Additionally, the time spent in managing diabetes, the swings in blood glucose levels and the fear of hypoglycemia can render diabetes management overwhelming to patients and their families.
Current Insulin Therapy
People with insulin-dependent diabetes need a continuous supply of insulin, known as basal insulin, to provide for background metabolic needs. In addition to basal insulin, people with insulin-dependent diabetes require supplemental insulin, known as bolus insulin, to compensate for carbohydrates ingested during meals or snacks or for a high blood glucose level.
There are two
primary types of insulin therapy practiced today: multiple daily injection (“MDI”) therapy using syringes or insulin pens; and pump therapy using insulin pumps. Insulin pumps are used to perform continuous subcutaneous insulin infusion, or insulin pump therapy, and typically use a programmable device and an infusion set to administer insulin into the person’s body.
4
MDI therapy involves the administration of a rapid acting insulin before meals (bolus) to bring blood glucose levels down into the healthy range. MDI therapy may also require a separate injection of a long-acting (basal) insulin, to control glucose levels between meals; this type of insulin is typically taken once or twice per day. By comparison, insulin pump therapy uses only rapid acting insulin to fulfill both mealtime (bolus) and background (basal) requirements. Insulin pump therapy allows a person to customize their bolus and basal insulin doses to meet their insulin needs throughout the day, and is intended to more closely resemble the physiologic function of a healthy pancreas.
Insulin pump therapy has been shown to provide people with insulin-dependent diabetes with numerous advantages relative to MDI therapy. For example, insulin pump therapy eliminates individual insulin injections, delivers insulin more accurately and precisely than injections, often improves HbA1c (a common measure of blood glucose levels) over time, provides greater flexibility with meals, exercise and daily schedules, and can reduce severe low blood glucose levels.
We estimate that approximately one-third of the Type 1 diabetes population in the United States use insulin pump therapy. In addition, we believe less than 10% of the Type 2 diabetes population in the United States who are insulin-dependent use insulin pump therapy. We believe that the distinct advantages and increased awareness of insulin pump therapy as compared to other available insulin therapies will continue to generate demand for insulin pump devices.
In addition to the diabetes market space, we have partnered with pharmaceutical and biotechnology companies that utilize a customized form of the Omnipod System to deliver specific drugs over a specified interval of time, at a certain administered volume.
The Omnipod System
The Omnipod Insulin Management System is an innovative continuous insulin delivery system that provides all the proven benefits of insulin pump therapy in a way no conventional insulin pump can. The Omnipod System's innovative design and differentiated features allows people with insulin-dependent diabetes to live their lives, and manage their diabetes, with unprecedented freedom, comfort, convenience and ease.

The long-term health benefits of better blood glucose control are well known. Maintaining near-normal blood glucose levels can help people with insulin-dependent diabetes live a longer, healthier life with fewer diabetes-related complications. The Omnipod System also has many practical, everyday benefits, including convenience, freedom, flexibility and ease of use.
Continuous insulin delivery at preset rates eliminates the need for individual injections and the interruptions that come with them. In addition, with the Omnipod System, insulin delivery can be changed with the press of a button to adapt to snacks or unexpected changes in daily routine.
The Omnipod System works much like the pancreas of a person without diabetes by delivering insulin in two ways:
5
|
•
|
A small, constant background supply of insulin (basal) is delivered automatically at a programmed rate, all day and night.
|
|
•
|
An extra dose of insulin (bolus) can be delivered when a patient needs it to match the carbohydrates in a meal or snacks or to correct high blood glucose.
|
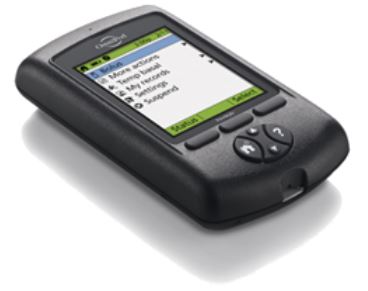
The Omnipod System is a discreet two part design, the Omnipod device (“Omnipod” or “Pod”) and the PDM, that eliminates the need for the external tubing required with conventional pumps.
|
•
|
The Pod is a small, lightweight, self-adhesive device that the user fills with insulin and wears directly on the body. The Pod delivers precise, personalized doses of insulin into the body through a small flexible tube (called a cannula), based on instructions that the patient programs into the Pod's wireless companion, the PDM.
|
|
•
|
The PDM is a wireless, handheld device that programs the Pod with the user's personalized insulin-delivery instructions, wirelessly monitors the Pod's operation and includes a FreeStyle
®
blood glucose meter.
|
We have designed the Omnipod System to fit within the normal daily routines of patients. The Omnipod System consists of just two devices, as opposed to up to seven for conventional tubed insulin pumps. As a result, the Omnipod System is easy for patients to use, which also reduces the training burden on healthcare professionals and users. We believe that the Omnipod System’s overall ease of use makes it very attractive to people with insulin-dependent diabetes. We also believe that the Omnipod System’s ease of use and substantially lower training burden helps to redefine which diabetes patients are appropriate for insulin pump therapy, allowing healthcare professionals to prescribe pump therapy to a broader pool of patients.
The Omnipod System’s unique patented design and proprietary manufacturing process allow us to provide CSII therapy at a relatively low up-front investment compared to conventional tubed insulin pumps. We believe that our pricing model reduces the risk of investing in pump therapy for third-party payors and makes this therapy much more accessible for people with insulin-dependent diabetes.
In 2017, the results of a clinical study were published in a peer-reviewed, scientific journal demonstrating that insulin infusion devices similar to the Omnipod System can effectively maintain the blood glucose levels at a basal level across a representative sample of individuals, including children and adolescents, with Type 1 diabetes. This study further demonstrates the effectiveness of the Omnipod System and builds on the catalog of clinical evidence that helps us build support for our product within the physician community.
In 2016, there were three publications in peer-reviewed, scientific journals demonstrating the clinical and quality of life benefits associated with use of the Omnipod System. Two publications reported results of a retrospective study of patients with Type 1 and Type 2 diabetes. The study demonstrated clinically meaningful and statistically significant improvements in HbA1c (an important measure of blood glucose control), reduction in total daily dose of insulin and reduction in the frequency and severity of self-reported hypoglycemic episodes after three months of Omnipod System use compared to previous treatment with either multiple daily injections or traditional tubed insulin pumps. The third publication reported results of a second study that surveyed current adult Omnipod System users of which the majority reported positive changes in quality of life including perceived control over their diabetes, reduced diabetes distress, improved overall well-being and sense of hypoglycemic safety since initiating treatment with the Omnipod System. In addition, the majority of patients also reported significant improvement in glycemic control with more than one-third reporting a decrease in severe hypoglycemic episodes.
6
Competition
The medical device industry is intensely competitive, subject to rapid change and significantly affected by new product introductions and other market activities of industry participants. The Omnipod System competes for patients in the insulin delivery industry. As the majority of new Omnipod System end-users have previously used MDI therapy, which is currently the most prevalent method of insulin delivery, we believe that we primarily compete with companies that provide MDI products such as insulin syringes and needles. Also, we compete with companies in the insulin pump therapy market, which consist of conventional tubed pump companies and patch-pump companies. Conventional tubed pump companies include Medtronic MiniMed, a division of Medtronic Public Limited Company ("Medtronic"), and Tandem Inc. Medtronic has historically held the majority share of the conventional tubed insulin pump market in the United States. The competitive landscape in our industry is undergoing significant change. For example, during 2017, Animas Corporation, a division of Johnson & Johnson, announced that it is exiting the insulin pump market in the United States and other countries. In addition to the established insulin pump competitors, several companies are working to develop and market new insulin patch pumps and other methods of insulin delivery, such as nasal, for the treatment of diabetes. These companies are at various stages of development and the number of such companies often changes as they enter or exit the market. Our non-insulin drug delivery product line also competes with drug delivery device companies such as West Pharmaceutical Services, Inc.
Several of our competitors are large, well-capitalized companies with significantly more market share and resources than we have. They are able to spend aggressively on product development, marketing, sales and other product initiatives. Some of these competitors have:
|
•
|
significantly greater name recognition;
|
|
•
|
established relations with healthcare professionals, customers and third-party payors;
|
|
•
|
larger and more established sales forces and distribution networks;
|
|
•
|
greater experience in conducting research and development, manufacturing, clinical trials, marketing and obtaining regulatory approval for products; and
|
|
•
|
greater financial and human resources for product development, sales and marketing and patent litigation.
|
Research and Development
Our current research and development efforts are primarily focused on the development of mobile applications for the Omnipod System, including:
|
•
|
Omnipod DASH Insulin Management System
. We are developing our next generation of the Omnipod System, which features a secure Bluetooth Low Energy enabled Pod and PDM with a touch screen color user interface supported by smartphone connectivity. We refer to this as our Omnipod DASH System, or (“DASH”). In January 2018, we submitted a premarket notification 510(k) application to the FDA requesting permission for commercial distribution of DASH.
|
|
•
|
Concentrated Insulin Delivery
. In collaboration with Eli Lilly, we are developing new products that leverage the DASH mobile platform to support the use of concentrated insulins for Type 1 and Type 2 patients with higher insulin-requirements, utilizing the same form factor as our existing Pod. These new products are being specifically designed to deliver Humalog
®
200 units/mL and Humulin
®
R U-500 insulin, which are concentrated forms of insulin used by people with highly insulin resistant Type 2 diabetes. We believe these innovations should significantly expand our access to more of the Type 2 diabetes market.
|
|
•
|
Omnipod Horizon Automated Glucose Control
. We are also developing a hybrid closed loop control system that would utilize the DASH mobile platform. Our Pod will communicate with Dexcom Inc.'s ("Dexcom") continuous glucose monitor and help control insulin delivery utilizing an algorithm located on the Pod.
|
7
In addition to insulin delivery, we continue to work with pharmaceutical and biotechnology companies on alternative uses for our Omnipod System technology as a delivery platform for a range of different pharmaceuticals and therapies.
Manufacturing and Quality Assurance
We believe a key contributing factor to the overall attractiveness of the Omnipod System is the disposable Omnipod continuous insulin delivery device. In order to manufacture sufficient volumes and achieve a cost-effective per unit production price for the Omnipod, we have designed the Omnipod to be manufactured through our current semi-automated process.
We are currently producing our devices on varying degrees of semi-automated manufacturing lines at a facility in China, operated by a subsidiary of Flex Ltd. (“Flex”). We purchase our devices pursuant to an agreement with Flex. The current term of the agreement expires in September 2021 and is subject to an automatic renewal thereafter, unless otherwise canceled by the parties under the contract terms. The contract may be terminated by either party upon compliance with certain advance written notice provisions that are intended to provide the parties with sufficient time to make alternative arrangements.
To lower our manufacturing costs, increase supply redundancy, add capacity closer to our largest customer base, and support our growth, we continue to invest in our supply chain operations. As part of our investment strategy, in 2016 we announced our plan to establish a highly automated manufacturing operation in the United States, and we expect to begin production through this operation in early 2019. To date, we have invested approximately $70 million in property, equipment and infrastructure related to the new facility.
We utilize outside vendors for the supply of components, sub-assemblies, and various services used in the manufacture of the Omnipod System. Our outside vendors produce the components to our specifications and they are audited periodically by our Quality Assurance Department to ensure conformity with the specifications, policies and procedures for the Omnipod System. Our Quality Assurance Department also inspects and tests the Omnipod System at various steps in the manufacturing cycle to facilitate compliance with our specifications. We have received approval of our Quality Management System from the BSI Group London, U.K., an accredited Notified Body for CE Marking and the International Standards Organization (“ISO”). Processes utilized in the manufacture, test and release of the Omnipod System have been verified and validated as required by the FDA and other regulatory bodies. As a medical device manufacturer and distributor, our manufacturing facilities and the facilities of our suppliers are subject to periodic inspection by the FDA and certain corresponding state agencies.
Intellectual Property
To maintain a competitive advantage, we believe we must develop and preserve the proprietary aspect of our technologies. We rely on a combination of copyright, patent, trademark, trade secret and other intellectual property laws, non-disclosure agreements and other measures to protect our proprietary rights. Currently, we require our employees, consultants and advisers to execute non-disclosure agreements in connection with their employment, consulting or advisory relationships with us, where appropriate. We also require our employees, consultants and advisers who we expect to work on our current or future products to agree to disclose and assign to us all inventions conceived during their work with us that are developed using our property or which relate to our business. Despite any measures taken to protect our intellectual property, unauthorized parties may attempt to copy aspects of the Omnipod System or to obtain and use information that we regard as proprietary.
Patents.
As of December 31,
2017
, we had 16 granted and active United States patents with expiration dates ranging from 2020 through 2034, and had 53 additional pending United States patent applications. We believe it will take up to four years, and possibly longer, for the most recent of these U.S. patent applications to result in issued patents. We are also seeking patent protection for our proprietary technology in other countries and regions throughout the world. The issued patents and pending patent applications cover, among other things:
|
•
|
the basic architecture of the Omnipod System, including the pump and the PDM;
|
|
•
|
the Omnipod shape memory alloy drive system;
|
|
•
|
the Omnipod System cannula insertion system;
|
8
|
•
|
communication features between system components for the Omnipod System and next generation products;
|
|
•
|
software for controlling the Omnipod System and next generation products; and
|
|
•
|
various novel aspects of the Omnipod System, potential future generations of Omnipod Systems, and other mechanisms for the delivery of pharmaceuticals.
|
Trademarks.
We have registered various trademarks associated with our business with the United States Patent and Trademark Office on the Principal Register and in other appropriate jurisdictions. Our trademarks include OMNIPOD
(R)
, DASH
TM
, OMNIPOD U-200
TM
, OMNIPOD U-500
TM
, and HORIZON
TM
.
Markets and Distribution Methods
We sell our Omnipod System directly to patients or indirectly through intermediaries, such as independent distributors and the pharmacy channel, in the United States, Canada, Europe, and Israel. In 2017, direct sales to patients represented approximately 52% of our total revenue in the United States. We sell the Omnipod System in certain countries in Europe through our independent distributor. Our exclusive European distribution agreement expires on June 30, 2018, at which time we plan to assume all commercial activities (including, among other things, distribution, sales, marketing, training and support) of our Omnipod System across Europe.
Comprehensive approach across three interrelated constituencies.
Our sales and marketing effort for the Omnipod System is focused on patient retention and growing patient, clinician and payor demand for the Omnipod System. We have a uniform sales and marketing approach, aligned across patients, physicians and providers, to capitalize on the unique benefits of our Omnipod System technology. We have three areas of focus:
|
•
|
First, build patient awareness about the features and benefits that the Omnipod System provides.
|
|
•
|
Second, build physician support by increasing the clinical evidence that clearly demonstrates the benefits that the Omnipod System provides and by improving the data available to physicians to monitor their patient's diabetes care.
|
|
•
|
Third, provide payors with the clinical and economic justification of why the Omnipod System is a greater benefit for the patients whom they insure.
|
Training.
We believe that patient training is critical to ensure successful outcomes and patient retention on the Omnipod System. We have streamlined our new patient training by developing improved online resources, a standardized approach as well as increasing our field clinician team to directly train new Omnipod System customers.
Customer Support.
We seek to provide our customers with high quality customer support, from product ordering to insurance investigation, order fulfillment and ongoing support. We have integrated our customer support systems with our sales, reimbursement and billing processes and also offer support by telephone and through our website to provide customers with seamless and reliable customer support.
Government Regulation
Domestic Regulation.
The Omnipod System is a medical device subject to extensive and ongoing regulation by the FDA and other federal, state, and local regulatory bodies. FDA regulations govern, among other things, product design and development, pre-clinical and clinical testing, manufacturing, labeling, post-market adverse event reporting, post-market surveillance, complaint handling, repair or recall of products, product storage, record keeping, pre-market clearance or approval, advertising and promotion, and sales and distribution.
9
FDA’s Pre-Market Notification 510(k) and Pre-Market Approval Requirements.
Unless an exemption applies, each medical device we seek to commercially distribute in the United States will require either prior 510(k) clearance or pre-market approval (“PMA”) from the FDA. The FDA classifies medical devices into one of three classes. Devices deemed to pose low to moderate risk are placed in either class I or II, which, absent an exemption, requires the manufacturer to submit to the FDA a premarket notification requesting clearance for commercial distribution. Some low risk devices are exempt from this requirement. Devices deemed by the FDA to pose the greatest risk, such as life-sustaining, life-supporting or implantable devices, or devices deemed not substantially equivalent to a previously cleared 510(k) device, are placed in class III, requiring approval of a PMA application. We have obtained 510(k) clearance for the Omnipod System and expect that PMA approval will be needed for some of our future products. We may be required to obtain a new 510(k) clearance or pre-market approval for significant post-market modifications to the Omnipod System. Both the 510(k) clearance and PMA processes can be expensive and lengthy and entail significant user fees, unless an exemption is available.
510(k) Clearance
. To obtain 510(k) clearance for any of our potential future devices (or for certain modifications to devices that have previously received 510(k) clearance), we must submit a pre-market notification demonstrating that the proposed device is substantially equivalent to a previously cleared 510(k) device or a pre-amendment device that was in commercial distribution before May 28, 1976 for which the FDA has not yet called for the submission of a PMA application. The FDA’s 510(k) clearance pathway generally takes from three to twelve months from the date the application is completed, but can take significantly longer. After a medical device receives 510(k) clearance, any modification that could significantly affect its safety or effectiveness, or that would constitute a significant change in its intended use, requires a new 510(k) clearance or, depending on the modification, could require a PMA application. The FDA requires each manufacturer to make this determination initially, but the FDA can review any such decision and can disagree with a manufacturer’s determination.
If the FDA disagrees with a manufacturer’s determination regarding whether a new premarket submission is required for the modification of an existing device, the FDA can, at its discretion, require the manufacturer to cease marketing and/or recall the modified device until 510(k) clearance or approval of a PMA application is obtained. In addition, in these circumstances, we may be subject to significant regulatory fines or penalties for failure to submit the requisite PMA application(s).
PMA.
Devices deemed by the FDA to pose the greatest risk, such as life-sustaining, life-supporting or implantable devices, devices deemed not substantially equivalent to a previously cleared 510(k) device or devices in commercial distribution before May 28, 1976 for which PMAs have not been required, generally require a PMA before they can be commercially distributed. A PMA application must be supported by extensive data, including technical information, pre-clinical and clinical trials, manufacturing and labeling to demonstrate the safety and effectiveness of the device to the FDA’s satisfaction. After a PMA application is complete, the FDA begins an in-depth review of the submitted information, which generally takes between one and three years, but may take significantly longer. During this review period, the FDA may request additional information or clarification of information already provided. Also during the review period, an advisory panel of experts from outside the FDA may be convened to review and evaluate the application and provide recommendations to the FDA as to the approvability of the device. In addition, the FDA will conduct a pre-approval inspection of the manufacturing facility to ensure compliance with Quality System Regulations, or QSRs, which impose elaborate design development, testing, control, documentation and other quality assurance procedures in the design and manufacturing process. The FDA may approve a PMA application with post-approval conditions intended to ensure the safety and effectiveness of the device including, among other things, restrictions on labeling, promotion, sale and distribution and collection of long-term follow-up data from patients in the clinical study that supported approval. Failure to comply with the conditions of approval can result in materially adverse enforcement action, including the loss or withdrawal of the approval. After any pre-market approval, a new pre-market approval application or application supplement may be required in the event of modifications to the device, its labeling, intended use or indication or its manufacturing process. PMA supplements often require submission of the same type of information as a PMA application, except that the supplement is limited to information needed to support any changes from the device covered by the original PMA application, and may not require as extensive clinical data or the convening of an advisory panel.
10
Clinical Trials.
Clinical trials are almost always required to support a PMA application and sometimes also 510(k) submissions. If the device presents a “significant risk” to human health as defined by the FDA, the FDA requires the device sponsor to submit an investigational device exemption ("IDE") to the FDA and obtain IDE approval prior to commencing the human clinical trials. The IDE must be supported by appropriate data, such as animal and laboratory testing results, showing that it is safe to test the device in humans and that the testing protocol is scientifically sound. The IDE must be approved in advance by the FDA for a specified number of patients, unless the product is deemed a “non-significant risk” device, in which case an IDE approval from the FDA would not be required, although the clinical trial would need to meet other requirements including IRB approval. Clinical trials for a significant risk device may begin once an IDE is approved by the FDA and the appropriate Institutional Review Board ("IRB") at each clinical trial site. Future clinical trials may require that we obtain an IDE from the FDA prior to commencing any such clinical trial and that the trial be conducted with the oversight of an IRB at the clinical trial site.
Our clinical trials must be conducted in accordance with FDA regulations and federal and state regulations concerning human subject protection, including informed consent and healthcare privacy. A clinical trial may be suspended by the FDA or at a specific site by the relevant IRB at any time for various reasons, including a belief that the risks to the trial participants outweigh the benefits of participation in the clinical trial. Even if a clinical trial is completed, the results of our clinical testing may not demonstrate the safety and efficacy of the device, or may be equivocal or otherwise not be sufficient for us to obtain approval of our product.
Ongoing Regulation by FDA.
Even after a device is placed on the market, regardless of its classification or premarket pathway, numerous regulatory requirements apply. These include, but are not limited to:
|
•
|
establishment registration and device listing;
|
|
•
|
quality system regulation, or QSR, which requires manufacturers, including third party manufacturers, to follow stringent design, testing, control, documentation and other quality assurance procedures during all aspects of the manufacturing process;
|
|
•
|
labeling regulations and FDA prohibitions against the promotion of products for uncleared, unapproved or “off-label” uses, and other requirements related to promotional activities;
|
|
•
|
medical device reporting regulations, which require that manufacturers report to the FDA if their device may have caused or contributed to a death or serious injury or malfunctioned in a way that would likely cause or contribute to a death or serious injury if the malfunction were to recur;
|
|
•
|
corrections and removals reporting regulations, which require that manufacturers report to the FDA field corrections and product recalls or removals if undertaken to reduce a risk to health posed by the device or to remedy a violation of the Federal Food, Drug and Cosmetic Act that may present a risk to health. In addition, FDA may order a mandatory recall if there is a reasonable probability that the device would cause serious adverse health consequences or death; and
|
|
•
|
post-market surveillance regulations, which apply when necessary to protect the public health or to provide additional safety and effectiveness data for the device.
|
Failure to comply with applicable regulatory requirements can result in enforcement actions by the FDA and other regulatory agencies, which may include any of the following sanctions: untitled letters or warning letters, fines, injunctions, consent decrees, civil or criminal penalties, recall or seizure of our current or future products, operating restrictions, partial suspension or total shutdown of production, refusal of or delay in granting 510(k) clearance or PMA approval of new products or modified products, rescinding previously granted 510(k) clearances or withdrawing previously granted PMA approvals, or refusal to grant import or export approval of our products.
11
We are subject to announced and unannounced inspections by the FDA, and these inspections may include the manufacturing facilities of our subcontractors. If, as a result of these inspections, the FDA determines that our equipment, facilities, laboratories or processes do not comply with applicable FDA regulations and conditions of product approval, the FDA may seek civil, criminal or administrative sanctions and/or remedies against us, including the suspension of our manufacturing operations. Since approval of the Omnipod System, we have been subject to FDA inspections of our facility on multiple occasions. We cannot assure you that our facilities or our contract manufacturer or component suppliers’ facilities would pass any future quality system inspection.
International Regulation.
International sales of medical devices are subject to foreign government regulations, which may vary substantially from country to country. The time required to obtain approval by a foreign country may be longer or shorter than that required for FDA clearance or approval, and the requirements may differ. There is a trend towards harmonization of quality system standards among the European Union, United States, Canada and various other industrialized countries.
The primary regulatory body in Europe is that of the European Union, which includes most of the major countries in Europe. Other countries, such as Switzerland, have voluntarily adopted laws and regulations that mirror those of the European Union with respect to medical devices. The European Union has adopted numerous directives and standards regulating the design, manufacture, clinical trials, labeling and adverse event reporting for medical devices, including the Medical Device Directive ("MDD"). Devices that comply with the requirements of a relevant directive will be entitled to bear the CE conformity marking, indicating that the device conforms to the essential requirements of the applicable directives and, accordingly, can be commercially distributed throughout Europe. The method of assessing conformity varies depending on the class of the product, but normally involves a combination of self-assessment by the manufacturer and a third party assessment by a “Notified Body.” This third-party assessment may consist of an audit of the manufacturer’s quality system and specific testing of the manufacturer’s product. An assessment by a Notified Body of one country within the European Union is required in order for a manufacturer to commercially distribute the product throughout the European Union. Outside of the European Union, regulatory approval needs to be sought on a country-by-country basis in order for us to market our products.
In April 2009, we obtained the right to affix the CE Mark to the original Omnipod System, and in August 2011, we obtained the right to affix the CE Mark for our updated Omnipod System. The CE Mark gives us authorization to distribute the Omnipod System throughout the European Union and in other countries that recognize the CE Mark. In September 2009, we received Health Canada approval to distribute the original Omnipod System throughout Canada, and in March 2013, we received Health Canada approval for our current Omnipod System. We have been distributing the Omnipod System in certain countries in Europe through our European distributor since 2010.
Licensure.
Several states require that durable medical equipment (“DME”) providers be licensed in order to sell products to patients in that state. Certain of these states require, among other things, that DME providers maintain an in-state location. Although we believe we are in compliance with all applicable state regulations regarding licensure requirements, if we were found to be noncompliant, we could lose our licensure in that state, which could prohibit us from selling our current or future products directly to patients in that state.
In addition, we are subject to certain state laws regarding professional licensure. We believe that our certified diabetes educators are in compliance with all such state laws. However, if our educators or we were to be found non-compliant in a given state, we may need to modify our approach to providing education, clinical support and customer service.
Federal Anti-Kickback and Self-Referral Laws.
The Federal Anti-Kickback Statute prohibits the knowing and willful offer, payment, solicitation or receipt of any form of remuneration in return for, or to induce:
|
•
|
the referral of an individual;
|
|
•
|
furnishing or arranging for the furnishing of items or services reimbursable under Medicare, Medicaid or other federal health care programs; or
|
|
•
|
the purchase, lease, or order of, or the arrangement or recommendation of the purchasing, leasing, or ordering of, any item or service reimbursable under Medicare, Medicaid or other federal health care programs.
|
12
The Federal Anti-Kickback Statute has been interpreted to apply to arrangements between drug and medical device manufacturers and suppliers on one hand and prescribers, patients, purchasers and formulary managers on the other. Liability under the statute may be established without a person or entity having actual knowledge of the statute or specific intent to violate it. In addition, claims resulting from a violation of the Federal Anti-Kickback Statute constitute false or fraudulent claims for purposes of the Federal False Claims Act, which is addressed below. Although there are a number of statutory exemptions and regulatory safe harbors protecting certain common business practices from prosecution and administrative sanctions, the exemptions and safe harbors are drawn narrowly, and practices that involve remuneration that may be perceived as inducing the prescription, purchase, or recommendation of the Omnipod System may be subject to scrutiny under the law. For example, we provide the initial training to patients necessary for appropriate use of the Omnipod System either through our own diabetes educators or by contracting with outside diabetes educators that have completed a Certified Pod Trainer training course. We compensate outside diabetes educators for their services at contracted rates deemed to be consistent with the market. We have structured our arrangements with diabetes educators and other business practices to comply with statutory exemptions and regulatory safe harbors whenever possible, but our practices may be subject to scrutiny if they fail to strictly comply with the criteria in the exemption or regulatory safe harbor. Moreover, there are no safe harbors for many common practices such providing reimbursement assistance, coding and billing information or other patient assistance and product support programs. If any of our practices, arrangements or programs are found not to be in compliance with the Federal Anti-Kickback Statute, we can be subject to criminal, civil and administrative penalties, including imprisonment, fines, damages, and exclusion from Medicare, Medicaid or other governmental programs, any of which could have an adverse effect on our business and results of operations.
Federal law also includes a provision commonly known as the “Stark Law,” which prohibits a physician from referring Medicare or Medicaid patients to an entity for the furnishing of certain “designated health services,” including durable medical equipment, in which the physician has an ownership or investment interest or with which the physician has entered into a compensation arrangement. Violation of the Stark Law could result in denial of payment, disgorgement of reimbursements received for items and services referred by a physician with a noncompliant arrangement, civil damages and penalties, and exclusion from Medicare, Medicaid or other governmental programs. Although there are a number of statutory and regulatory exceptions protecting certain common business practices implicating the Stark Law, and we have structured our arrangements with physicians and other providers to comply with these exceptions, these arrangements may not expressly meet the requirements for applicable exceptions from the law.
Federal civil False Claims Act.
The Federal civil False Claims Act imposes penalties against any person or entity who, among other things, knowingly presents, or causes to be presented, a false or fraudulent claim for payment of government funds or knowingly making, using or causing to be made or used a false record or statement material to a false or fraudulent claim. Actions under the False Claims Act may be brought by the Attorney General or as a qui tam action by a private individual in the name of the government. Violations of the False Claims Act are subject to the imposition of significant per claim penalties, three times the amount of damages that the federal government sustained and possible exclusion from participation in federal health care programs like Medicare and Medicaid. We believe that we are in compliance with the federal government’s laws and regulations concerning the filing of claims for reimbursement. However, many drug and medical device manufacturers have been investigated or subject to lawsuits by whistleblowers and have reached substantial financial settlements with the federal government under the False Claims Act for a variety of alleged improper marketing activities, including providing free product to customers with the expectation that the customers would bill federal programs for the product; or causing submission of false claims by providing inaccurate coding or billing information to actual or prospective purchasers, and our business practices could be subject to scrutiny and enforcement under the Federal False Claims Act. We also may be subject to other federal false claim laws, including federal criminal statutes that prohibit making a false statement to the federal government.
13
Civil Monetary Penalties Law.
We are also subject to the Federal Civil Monetary Penalties Law, which prohibits, among other things, the offering or transferring of remuneration to a Medicare or Medicaid beneficiary that the person knows or should know is likely to influence the beneficiary’s selection of a particular supplier of Medicare or Medicaid payable items or services. Noncompliance can result in significant civil money penalties for each wrongful act, assessment of three times the amount claimed for each item or service and exclusion from the federal healthcare programs.
Federal Health Care Fraud Statutes.
We are also subject to a federal health care fraud statute that, among other things, imposes criminal and civil liability for executing a scheme to defraud any health care benefit program including non-governmental programs, and prohibits knowingly and willfully falsifying, concealing or covering up a material fact or making any materially false or fraudulent statement or representation, or making or using any false writing or document with knowledge that it contains a materially false or fraudulent statement in connection with the delivery of or payment for health care benefits, items or services.
State Fraud and Abuse Laws and Marketing Restrictions.
Many states have also adopted anti-kickback, anti-referral laws, and false claims laws and regulations analogous to the Federal civil Anti-Kickback Statute and Federal False Claims Act, and in some cases these state laws apply regardless of the payer, including private payors. We believe that we are in conformance with such laws. Moreover, several states have imposed requirements to disclose payments to health care providers, restrictions on marketing and other expenditures, and requirements to adopt a code of conduct or compliance program with specific elements. Nevertheless, a determination of liability under such laws could result in fines and penalties and restrictions on our ability to operate in these jurisdictions.
Administrative Simplification of the Health Insurance Portability and Accountability Act of 1996.
The Health Insurance Portability and Accountability Act of 1996 (“HIPAA”) mandated the adoption of standards for the exchange of electronic health information in an effort to encourage overall administrative simplification and enhance the effectiveness and efficiency of the healthcare industry. Ensuring privacy and security of patient information is one of the key factors driving the legislation. If we are found to be in violation of HIPAA, we could be subject to civil or criminal penalties.
Patient Protection and Affordable Care Act
. The Patient Protection and Affordable Care Act as amended by the Health Care and Education Reconciliation Act of 2010 (“ACA”) enacted significant changes to the provision of and payment for healthcare in the United States. Under the ACA and related laws and regulations, federal and state government initiatives are focused on limiting the growth of healthcare costs and implementing changes to healthcare delivery structures. These reforms are intended in part to put increased emphasis on the delivery to patients of more cost-effective therapies and could adversely affect our business. Certain changes to the ACA in the 115th United States Congress and under the Trump Administration have occurred and additional changes remain possible. Such changes could adversely affect our business. While some uncertainty exists regarding the future aspects of the ACA, we expect that the ACA will continue to have a significant impact on the delivery of healthcare in the United States and on our business in the near term.
Physician Payments Sunshine Act
. The Physician Payments Sunshine Act, implemented as the Open Payments program, requires manufacturers of drugs and devices for which Medicare or Medicaid payment is available to track and report payments and other transfers of value provided to physicians and teaching hospitals, as well as ownership and investment interests held by physician and their immediate family members. Our failure to disclose reportable payments could subject us to penalties and materially adversely impact our business and financial results.
Additionally, as these laws and regulations continue to evolve, we lack definitive guidance as to the application of certain key aspects of these laws and regulations as they relate to certain of our arrangements and programs, including those with providers with respect to patient training. We cannot predict the final form of these federal and state regulations or the effect that application of those interpretations will have on us. As a result, our provider and training arrangements may ultimately be found not to be in compliance with applicable federal law. Even if we are not found to have violated the law, responding to lawsuits, government investigations or enforcement actions, defending any claims raised, and paying any resulting settlement amounts would be expensive and time-consuming, and could have a material adverse effect on our reputation and business operations.
14
Third-Party Reimbursement
In the United States, our products are generally reimbursed by third-party payors, and we bill those payors for products provided to patients. Our fulfillment and reimbursement systems are fully integrated such that product is generally shipped only after confirmation of a physician’s valid statement of medical necessity and current health insurance information. We maintain an insurance benefits investigation department that works to simplify and expedite claims processing and to assist patients in obtaining third-party reimbursement.
We continue to work with third-party payors in the United States to establish coverage and payment for the Omnipod System. Our coverage contracts with third-party payors typically have a term of between one and three years and set coverage amounts during that term. Typically, coverage contracts automatically renew for specified incremental periods upon expiration, unless one of the parties terminates the contract.
Common medical criteria for third-party payors approving reimbursement for CSII therapy include a patient having elevated A1c levels, a history of recurring hypoglycemia, fluctuations in blood glucose levels prior to meals or upon waking or, severe glycemic variability. Third-party payors may decline to reimburse for procedures, supplies or services determined not to be “medically necessary” or “reasonable.” In a limited number of cases, some third-party payors have declined to reimburse us for a particular patient because such patient failed to meet its criteria, most often because the patient already received reimbursement for an insulin pump from that payor within the warranty period, which is generally four years, or because the patient did not meet their medical criteria for an insulin infusion device. Reimbursement may also be declined by insurers based upon language in the contract between the insurer and the insured group. An example of this is certain employer self-insurance plans that may choose to decline coverage based on specific provisions within those individual plans.
Historically, there had not been an established mechanism for Medicare or broad Medicaid coverage for the majority of the Omnipod System. However, in January 2018, the CMS issued guidance clarifying that Medicare Part D Plan Sponsors are permitted to provide coverage for products such as the Omnipod System under the Medicare Part D (prescription drug) program. We have begun discussions with Medicare Part D Plan Sponsors to be listed on their formularies, which will allow many additional people with diabetes to begin accessing our product. Medicare Part D Plan Sponsors will be submitting bids to the government in the Spring of 2018 that include their formularies for 2019 plans.
The ability of Medicare Part D plans to cover the Omnipod System also provides us with a direct pathway to gain Medicaid coverage at the state level, as many state-run Medicaid programs follow CMS prescription drug guidance to determine coverage. This allows access for lower-income individuals and families on Medicaid for whom Omnipod is currently not an option. The Company estimates that obtaining Medicare and Medicaid coverage extends access to Insulet's Omnipod System to approximately 450,000 additional individuals with Type 1 diabetes in the United States.
As part of our international distribution agreements, our distribution partners establish appropriate reimbursement contracts with third-party payors in countries and provinces in which they distribute the Omnipod System prior to distributing the Omnipod System in each territory. In anticipation of our transition to direct distribution and commercial support of our product in Europe upon the expiration of our European distribution agreement in June 2018, we are working with local payors to establish coverage and a payment process for our Omnipod System.
Employees
As of December 31,
2017
, we had
857
full-time employees. None of our employees are represented by a collective bargaining agreement, and we have never experienced any work stoppage. We believe that our employee relations are good.
15
Company Information
Insulet Corporation is a Delaware corporation formed in 2000. Our principal offices are located at 600 Technology Park Drive, Suite 200, Billerica, Massachusetts 01821, and our telephone number is (978) 600-7000. Our website address is
http://www.insulet.com
. We make available, free of charge, on or through our website, our annual reports on Form 10-K, quarterly reports on Form 10-Q, current reports on Form 8-K, proxy statements and any amendments to those reports filed or furnished pursuant to Section 13(a) or 15(d) of the Securities Exchange Act of 1934, as amended, as soon as reasonably practicable after such material is electronically filed with or furnished to the Securities and Exchange Commission. The information on our website is not part of this Annual Report on Form 10-K for the year ended December 31, 2017.
This Annual Report on Form 10-K contains forward-looking statements. Forward-looking statements relate to future events or our future financial performance.
We generally identify forward looking statements by terminology such as “may,” “will,” “should,” “expects,” “plans,” “anticipates,” “could,” “intends,” “targets,” “projects,” “contemplates,” “believes,” “estimates,” “predicts,” “potential” or “continue” or the negative of these terms or other similar words. These statements are only predictions. We have based these forward-looking statements largely on our current expectations and projections about future events and financial trends that we believe may affect our business, results of operations and financial condition.
The outcomes of the events described in these forward-looking statements are subject to risks, uncertainties and other factors described in this Item 1A Risk Factors and elsewhere in this Annual Report on Form 10-K. Accordingly, you should not rely upon forward-looking statements as predictions of future events. We cannot assure you that the events and circumstances reflected in the forward-looking statements will be achieved or occur, and actual results could differ materially from those projected in the forward-looking statements. The forward-looking statements made in this Annual Report on Form 10-K relate only to events as of the date of this report. We undertake no obligation to update any forward-looking statement to reflect events or circumstances after the date on which the statement is made or to reflect the occurrence of unanticipated events.
Risks Relating to Our Business
We have incurred significant operating losses since inception and cannot assure you that we will achieve profitability.
Since our inception in 2000, we have incurred significant operating losses. We began commercial sales of the Omnipod System in 2005. For the year ended December 31,
2017
, our operating loss was
$7.4 million
. Our net losses for the years ended December 31,
2017
,
2016
and
2015
were
$26.8 million
,
$28.9 million
and
$73.5 million
, respectively. The extent of our future operating losses and the timing of profitability are uncertain, and we may never achieve or sustain profitability. As of December 31,
2017
, we had an accumulated deficit of
$707.3 million
.
We may experience significant fluctuations in our quarterly results of operations.
The fluctuations in our quarterly results of operations have resulted, and may continue to result, from numerous factors, including:
|
•
|
delays in shipping due to capacity constraints;
|
|
•
|
practices of health insurance companies and other third-party payors with respect to reimbursement for our current or future products;
|
|
•
|
market acceptance of the Omnipod System;
|
|
•
|
our ability to manufacture the Omnipod System efficiently;
|
|
•
|
transitions in our distribution channel;
|
|
•
|
timing of regulatory approvals and clearances;
|
|
•
|
new product introductions;
|
16
|
•
|
competition; and
|
|
•
|
timing of research and development expenditures.
|
These factors, some of which are not within our control, may cause the price of our stock to fluctuate substantially. In particular, if our quarterly results of operations fail to meet or exceed the expectations of securities analysts or investors, our stock price could drop suddenly and significantly. We believe the quarterly comparisons of our financial results are not necessarily meaningful and should not be the only indication of our future performance.
We currently rely on sales of the Omnipod System to generate most of our revenue. The failure of the Omnipod System to achieve and maintain significant market acceptance or any factors that negatively impact sales of this product will adversely affect our business, financial condition and results of operations.
Our main product is the Omnipod System, which we introduced to the market in 2005. We expect to continue to derive a significant portion of our revenue from the sale of this product. Accordingly, our ability to generate revenue is highly reliant on our ability to market and sell the devices that comprise the Omnipod System. Our sales of the Omnipod System may be negatively impacted by many factors, including:
|
•
|
the failure of the Omnipod System to achieve and maintain wide acceptance among opinion leaders in the diabetes treatment community, insulin-prescribing physicians, third-party payors and people with insulin-dependent diabetes;
|
|
•
|
manufacturing problems or capacity constraints;
|
|
•
|
actual or perceived quality problems;
|
|
•
|
changes in reimbursement rates or policies relating to the Omnipod System by third-party payors;
|
|
•
|
claims that any portion of the Omnipod System infringes on patent rights or other intellectual property rights owned by other parties;
|
|
•
|
adverse regulatory or legal actions relating to the Omnipod System;
|
|
•
|
damage, destruction or loss of any of the facilities where our products are manufactured or stored or of the equipment therein or failure to successfully open or expand new facilities;
|
|
•
|
conversion rate of patient referrals to actual sales of the Omnipod System;
|
|
•
|
write-offs of receivables from customers;
|
|
•
|
attrition rates of customers who cease using the Omnipod System;
|
|
•
|
competitive pricing and related factors; and
|
|
•
|
results of clinical studies relating to the Omnipod System or our competitors’ products.
|
If any of these events occurs, our ability to generate revenue could be significantly reduced.
Our ability to achieve profitability from a current net loss level will depend on our ability to sustain or reduce the per unit cost of producing the Omnipod System by increasing customer orders, increasing manufacturing volume and productivity and reducing raw material and overhead costs per unit.
Currently, the gross profit from the sale of the Omnipod System is not sufficient to cover our operating expenses. To achieve profitability, we need to, among other things, sustain or reduce the per unit cost of the Omnipod System. If we are unable to sustain or reduce raw material and manufacturing overhead costs through volume purchase discounts, negotiation of improved pricing and increased productivity and production capacity, our ability to achieve profitability will be severely constrained. Any increase in manufacturing volumes must be supported by an associated increase in customer orders. Each Omnipod System contains limited amounts of precious metals, the costs of which have fluctuated over the recent past. The occurrence of one or more factors that negatively impact the manufacturing or sales of the Omnipod System or increase our raw material costs may prevent us from achieving our desired increase in manufacturing volume, which would prevent us from attaining profitability.
17
Adverse changes in general economic conditions in the United States and globally could adversely affect us.
We are subject to the risks arising from adverse changes in general economic market conditions. A U.S. or global recession, could negatively impact our current and prospective customers, adversely affect the financial ability of health insurers to pay claims, adversely impact our expenses and ability to obtain financing of our operations, cause delays or other problems with key suppliers and increase the risk of counterparty failures.
Healthcare spending in the United States, Canada and Europe could be negatively affected in the event of a downturn in economic conditions. For example, U.S. patients who have lost their jobs or healthcare coverage may no longer be covered by an employer-sponsored health insurance plan and patients reducing their overall spending may eliminate purchases requiring co-payments. Since the sale of the Omnipod System to a new patient is generally dependent on the availability of third-party reimbursement and normally requires the patient to make a significant co-payment, an economic downturn on our potential customers could reduce the referrals generated by our sales force and thereby reduce our customer orders. Similarly, existing customers could cease purchasing the Omnipod System and return to MDI or other less-costly therapies, which would cause our attrition rate to increase. Any decline in new customer orders or increase in our customer attrition rate would reduce our revenue, which in turn would make it more difficult to achieve our per-unit cost-savings goals, which we are attempting to attain in part through increases in our manufacturing volume.
Healthcare reform laws could adversely affect our revenue and financial condition.
During the past several years, the U.S. healthcare industry has been subject to an increase in governmental regulation at both the federal and state levels. Efforts to control healthcare costs, including limiting access to care, alternative delivery models and changes in the methods used to determine reimbursement scenarios and rates, are ongoing at the federal and state government levels. There are provisions of law that provide for the creation of a new public-private Patient-Centered Outcomes Research Institute tasked with identifying comparative effectiveness research priorities. For example, establishing a research project agenda and contracting with entities to conduct the research in accordance with the agenda. Research findings published by this institute are publicly disseminated. It is difficult at this time to determine whether a comparative effectiveness analysis impacting our business will be done, and assuming one is, what impact that analysis will have on the Omnipod System or our future financial results.
Sales of certain medical devices are subject to a 2.3% federal excise tax, subject to a suspension through 2019. We believe that the sales of our products are exempt from this excise tax. However, if it is subsequently determined that sales of one or more of our products are subject to this excise tax, these tax obligations could adversely affect our financial results.
In addition, the Affordable Care Act and related healthcare reform laws, regulations and initiatives have significantly increased regulation of managed care plans and decreased reimbursement to Medicare managed care. Some of these initiatives purport to, among other things, require that health plan members have greater access to drugs not included on a plan’s formulary. Moreover, to alleviate budget shortfalls, states have reduced or frozen payments to Medicaid managed care plans. We cannot accurately predict the complete impact of these healthcare reform initiatives, but they could lead to a decreased demand for our products and other outcomes that could adversely impact our business and financial results.
Certain changes to the ACA have occurred in the 115th United States Congress and under the Trump Administration. For example, the Tax Cuts and Jobs Act enacted on December 22, 2017, eliminated the shared responsibility payment for individuals who fail to maintain minimum essential coverage under section 5000A of the Internal Revenue Code of 1986, commonly referred to as the individual mandate, beginning in 2019. Additional changes to the ACA remain possible. We expect that the ACA, as currently enacted or as it may be amended in the future, and other healthcare reform measures that may be adopted in the future, could have an adverse effect on our industry generally and on our ability to maintain or increase sales of any of our products and achieve profitability.
18
We may need to raise additional funds in the future, and these funds may not be available on acceptable terms or at all.
Our capital requirements will depend on many factors, including:
|
•
|
revenue generated by sales of our current products and any other future products that we may develop;
|
|
•
|
costs associated with adding further manufacturing capacity;
|
|
•
|
costs associated with expanding our sales and marketing efforts in the United States and internationally;
|
|
•
|
expenses we incur in manufacturing and selling the Omnipod System;
|
|
•
|
costs of developing new products or technologies and enhancements to the Omnipod System;
|
|
•
|
the cost of obtaining and maintaining FDA approval or clearance of our current or future products;
|
|
•
|
costs associated with any expansion;
|
|
•
|
the cost of complying with regulatory requirements;
|
|
•
|
costs associated with capital expenditures;
|
|
•
|
costs associated with litigation; and
|
|
•
|
the number and timing of any acquisitions or other strategic transactions.
|
We believe that our current cash, cash equivalents and short-term investments of
$440.1 million
, together with the cash to be generated from expected product sales, will be sufficient to meet our projected operating requirements through at least the end of 2018.
We may in the future seek additional funds from public and private stock offerings, borrowings under credit lines or other sources. We may need to raise additional debt or equity financing to repay our outstanding Senior Convertible Notes. If we issue equity or debt securities to raise additional funds, our existing stockholders may experience dilution, and the new equity or debt securities may have rights, preferences and privileges senior to those of our existing stockholders. In addition, if we raise additional funds through collaboration, licensing or other similar arrangements, it may be necessary to relinquish valuable rights to our potential future products or proprietary technologies, or grant licenses on terms that are not favorable to us.
Our ability to raise additional capital may be adversely impacted by current economic conditions, including the effects of any disruptions to the credit and financial markets in the United States and worldwide. As a result of these and other factors, we do not know whether additional capital will be available when needed, or that, if available, we will be able to obtain additional capital on terms favorable to us or our stockholders.
If we are unable to raise additional capital due to these or other factors, we may need to further manage our operational expenses to reflect these external factors, including potentially curtailing our planned development activities. If we cannot raise additional funds in the future on acceptable terms, we may not be able to develop new products, execute our business plan, take advantage of future opportunities or respond to competitive pressures or unanticipated customer requirements. If any of these events occur, it could adversely affect our business, financial condition and results of operations.
19
We may not be able to generate sufficient cash to service our indebtedness represented by our Convertible Senior Notes. We may be forced to take other actions to satisfy our obligations under our indebtedness or we may experience a financial failure.
As of December 31, 2017, we had outstanding principal amounts due of
$751.2 million
on our Convertible Senior Notes, which mature between 2019 and 2024. Our ability to make scheduled payments or to refinance the Convertible Senior Notes or other debt obligations depends on our financial and operating performance, which is subject to prevailing economic and competitive conditions and to certain financial, business and other factors beyond our control. We cannot assure you that we will maintain a level of cash flows from operating activities sufficient to permit us to pay the principal, premium, if any, and interest on our indebtedness. If our cash flows and capital resources are insufficient to fund our debt service obligations, we may be forced to reduce or delay capital expenditures, sell assets or operations, seek additional capital or restructure or refinance our indebtedness, including the outstanding Convertible Senior Notes. We cannot assure you that we would be able to take any of these actions, that these actions would be successful and permit us to meet our scheduled debt service obligations or that these actions would be permitted under the terms of our future debt agreements. In the absence of sufficient operating results and resources, we could face substantial liquidity problems and might be required to dispose of material assets or operations to meet our debt service and other obligations. We may not be able to consummate those dispositions or obtain sufficient proceeds from those dispositions to meet our debt service and other obligations when due.
We are dependent upon third-party suppliers, making us vulnerable to supply problems and price fluctuations.
We rely on a number of suppliers who manufacture the components for and perform assembly of the Omnipods and PDMs. In addition, a subsidiary of Flex in China performs assembly and supplies all finished Omnipod Systems. We do not have long-term supply agreements with most of our suppliers, and, in many cases, we, or Flex on our behalf, make purchases on the basis of individual purchase orders. In some other cases, where we do have agreements in place, our agreements with suppliers can be terminated by either party upon short notice. Additionally, our suppliers may encounter problems during manufacturing for a variety of reasons, including failure to follow specific protocols and procedures, failure to comply with applicable regulations, equipment malfunction, component part supply constraints and environmental factors, any of which could delay or impede their ability to meet our demand. Our reliance on these third-party suppliers also subjects us to other risks that could harm our business, including:
|
•
|
we are not a major customer of many of our suppliers, and these suppliers may therefore give other customers’ needs higher priority than ours;
|
|
•
|
we may not be able to obtain an adequate supply in a timely manner or on commercially reasonable terms;
|
|
•
|
our suppliers may make errors in manufacturing that could negatively affect the efficacy or safety of the Omnipod System or cause delays in shipment;
|
|
•
|
we may have difficulty locating and qualifying alternative suppliers for our sole-source supplies;
|
|
•
|
switching components may require product redesign and submission to the FDA of a new 510(k);
|
|
•
|
our suppliers manufacture products for a range of customers, and fluctuations in demand for the products these suppliers manufacture for others may affect their ability to deliver products to us in a timely manner;
|
|
•
|
the occurrence of a fire, natural disaster or other catastrophe, impacting one or more of our suppliers, may affect their ability to deliver products to us in a timely manner; and
|
|
•
|
our suppliers may encounter financial hardships unrelated to our demand, which could inhibit their ability to fulfill our orders and meet our requirements.
|
We may not be able to quickly establish additional or alternative suppliers, particularly for our sole-source suppliers, in part because of the FDA approval process and because of the custom nature of various parts we require. Any interruption or delay in obtaining products from our third-party suppliers, or our inability to obtain products from alternate sources at acceptable prices in a timely manner, could impair our ability to meet the demand of our customers and cause them to cancel orders or switch to competing products.
20
Establishment of a competitive bid program by CMS for conventional insulin pumps could negatively affect our operating results.
CMS has announced that it will establish a competitive bidding program nationwide for conventional insulin pumps effective January 1, 2019. Since the Omnipod System is currently coverable by Medicare Part D through the pharmacy channel and not as durable medical equipment or as a prosthetic device, we would not be directly affected by this program. However, should this program commence in 2019 on a nationwide basis as announced, it is expected that there would be a reduction in the amount reimbursed by CMS for conventional insulin pumps. This may negatively impact our ability to negotiate future pricing with private payors comparing the price of the Omnipod System to conventional insulin pumps.
If we are required to pay sales tax on sales of certain products, our results of operations could be adversely affected.
We believe that sales of most diabetes supplies are exempt from sales tax in most U.S. jurisdictions. However, if it is subsequently determined that sales of one or more of our products are subject to sales tax in such jurisdictions, our obligation to pay such sales taxes could materially adversely affect our financial results.
Our financial condition or results of operations may be adversely affected by international business risks.
We use an exclusive distributor of the Omnipod System under an agreement that is in place through June 2018 in multiple countries in Europe including France, Germany, the United Kingdom, the Netherlands, Switzerland, Austria, Italy, Norway, and Sweden. In addition to the Omnipod System, our European distributor also markets and sells a suite of other products for the treatment of diabetes and has introduced and sells its own branded conventional tubed insulin pump. Therefore, this distributor could have a greater financial incentive to sell its proprietary products rather than the Omnipod System through the contract expiration in June 2018. We also sell the Omnipod System in Canada. As a result of our international sales, we are exposed to fluctuations in product demand and sales productivity outside the United States, which may be partially attributed to foreign exchange rate changes, and have to manage the risks associated with market acceptance of the Omnipod System in foreign countries. Our efforts to introduce or expand our current or future products in foreign markets may not be successful, in which case we may have expended significant resources without realizing the expected benefit. Ultimately, the investment required for expansion into foreign markets could exceed the results of operations generated from this expansion. We do not have control over our European distributor's operational and financial condition, and we are subject to foreign regulatory and import or export requirements.
In addition, in order to reduce our cost of goods sold and increase our production capacity, we increasingly rely on third-party suppliers located outside the United States. For example, currently all of our Omnipod Systems are manufactured at a facility in China operated by Flex. As a result, our business is subject to risks associated with doing business internationally, including:
|
•
|
political instability and adverse economic conditions;
|
|
•
|
trade protection measures, such as tariff increases, and import and export licensing and control requirements;
|
|
•
|
potentially negative consequences from changes in tax laws;
|
|
•
|
difficulty in staffing and managing widespread operations;
|
|
•
|
difficulties associated with foreign legal systems including increased costs associated with enforcing contractual obligations in foreign jurisdictions;
|
|
•
|
changes in foreign currency exchange rates;
|
|
•
|
differing protection of intellectual property;
|
|
•
|
unexpected changes in regulatory requirements;
|
|
•
|
failure to fulfill foreign regulatory requirements on a timely basis or at all to market the Omnipod System or other future products;
|
|
•
|
availability of, and changes in, reimbursement within prevailing foreign health care payment systems;
|
21
|
•
|
adapting to the differing laws and regulations, business and clinical practices, and patient preferences in foreign markets;
|
|
•
|
difficulties in managing foreign relationships and operations, including any relationships that we establish with foreign partners, distributors or sales or marketing agents; and
|
|
•
|
difficulty in collecting accounts receivable and longer collection periods.
|
In addition, expansion into foreign markets imposes additional burdens on our executive and administrative personnel, research and sales departments and general management resources. Our future success will depend in large part on our ability to anticipate and effectively manage these and other risks associated with doing business outside of the United States. Any of these factors may have a material adverse effect on our production capacity and, consequently, our business, financial condition and results of operations.
Our planned assumption on July 1, 2018 of the commercial activities, including, among other things, distribution, sales, marketing, training and support, of our Omnipod System in Europe following the expiration of our current third-party global distribution agreement creates several business and operational risks related to the future sales of our Omnipod System in Europe.
We announced on July 20, 2017 our plan to assume, on July 1, 2018, all commercial activities (including, among other things, distribution, sales, marketing, training and support) of our Omnipod System across Europe following the expiration of our distribution agreement with our European distributor on June 30, 2018. Until the expiration of the agreement, our current distribution agreement for our Omnipod products in Europe will remain in effect. While we do not expect this transition to materially affect our financial trends during the first half of 2018, there could be a negative effect on our sales during the transition period if our European distributor places more emphasis on selling its own proprietary products and other products, instead of ours, during this period, thereby reducing our sales. In addition, to retain current revenue streams after July 1, 2018, we will need to secure the existing customer installed base of Omnipod users in Europe, and there can be no assurance that we will succeed in doing so. More generally, if we are unable to effectively establish direct distribution and commercial support for the Omnipod System in Europe in a timely manner (which will include hiring employees in many of these jurisdictions), we may not be able to service the current Omnipod users in Europe and grow the business as we anticipate. We expect to incur increased operating expenses as we invest in these European operations, and it is possible that the ultimate economic benefits that we derive from these investments could be less than anticipated, or that such expected economic benefits could fail to materialize at all. Any of the foregoing risks could negatively affect our future revenues and, depending on severity, potentially cause a materially adverse effect on our business and results of operations.
Failure to secure or retain adequate coverage or reimbursement for our products by third-party payors could adversely affect our business, financial condition and results of operations.
We expect that sales of the Omnipod System will be limited unless a substantial portion of the sales price of the Omnipod System is paid for by third-party payors, including private insurance companies, health maintenance organizations, preferred provider organizations, federal and state government healthcare agencies and other managed care providers. We currently have contracts establishing reimbursement for the Omnipod System with national and regional third-party payors that provide reimbursement for patients residing in all 50 states. While we anticipate entering into additional contracts with other third-party payors, we cannot assure that we will be successful in doing so. In addition, these contracts can generally be terminated by the third-party payor without cause. Also, healthcare market initiatives in the United States may lead third-party payors to decline or reduce reimbursement for the Omnipod System. Moreover, compliance with administrative procedures or requirements of third-party payors may result in delays in processing approvals by those payors for patients to obtain coverage for the use of the Omnipod System. In addition, coverage decisions and rates of reimbursement increasingly require clinical evidence showing an improvement in patient outcomes. Generating this clinical evidence requires substantial time and investment and there is no guarantee of a desired outcome.
We are an approved Medicare supplier and, in January 2018, CMS issued guidance clarifying that Medicare Part D Plan Sponsors may provide coverage for products such as the Omnipod System under the Medicare Part D prescription drug program. As a result, we must negotiate with third-party payors in order to provide our product through the pharmacy channel to users who are covered under Medicare Part D. Compliance with administrative procedures or requirements of these third-party payors may result in delays in processing approvals by those payors
22
for patients to obtain Medicare Part D coverage for the use of the Omnipod System. Medicaid coverage decisions are made by the governing authorities in each state. As the Medicaid coverage process and stakeholders are unique to each state, the timeline to gain coverage in each state may vary.
Finally, as we expand our sales and marketing efforts outside of the United States, we face additional risks associated with obtaining and maintaining reimbursement from foreign health care payment systems on a timely basis or at all. Failure to secure or retain adequate coverage or reimbursement for the Omnipod System by third-party payors, including Medicare, could have a material adverse effect on our business, financial condition and results of operations.
We face competition from numerous competitors, many of whom have far greater resources than we have, which may make it more difficult for us to achieve significant market penetration and which may allow them to develop additional products for the treatment of diabetes that compete with the Omnipod System.
The medical device industry is intensely competitive, subject to rapid change and significantly affected by new product introductions and other market activities of industry participants. The Omnipod System competes with several existing insulin delivery devices as well as other methods for the treatment of diabetes. Medtronic MiniMed, a division of Medtronic, has been the market leader for many years and has the majority share of the conventional insulin pump market in the United States. Other suppliers in the United States include Tandem Diabetes Care, Inc.
In addition to the Omnipod System, our European distributor markets and sells a suite of other products for the treatment of diabetes and also sells its own branded conventional tubed insulin pump. This distributor may have a greater financial incentive to sell its proprietary products rather than the Omnipod System.
Many of our competitors are large, well-capitalized companies with significantly more market share and resources than we have. As a consequence, they are able to spend more aggressively on product development, marketing, sales and other product initiatives than we can. Many of these competitors have:
|
•
|
significantly greater name recognition;
|
|
•
|
different and more complete reimbursement profiles;
|
|
•
|
established relations with healthcare professionals, customers and third-party payors;
|
|
•
|
larger and more established distribution networks;
|
|
•
|
greater experience in conducting research and development, manufacturing, clinical trials, marketing and obtaining regulatory approval; and
|
|
•
|
greater financial and human resources for product development, sales and marketing and patent litigation.
|
We also compete with MDI therapy, which is substantially less expensive than CSII therapy. MDI therapy has been made more effective by the introduction of long-acting insulin analogs that can be used in combination with bolus devices. While we believe that CSII therapy, in general, and the Omnipod System, in particular, have significant competitive and clinical advantages over traditional MDI therapy, improvements in the effectiveness of MDI therapy may result in fewer people with insulin-dependent diabetes converting from MDI therapy to CSII therapy than we expect and may result in negative price pressure.
In addition to the established insulin pump competitors, several companies are working to develop and market new insulin “patch” pumps and other methods for the treatment of diabetes, such as inhaled insulin. These companies are at various stages of development and the number of such companies continuously change as they enter or exit the market on an ongoing basis.
23
Our current competitors or other companies may at any time develop additional products for the treatment of diabetes. For example, other diabetes-focused companies, including Abbott Diabetes Care, Inc. ("Abbott"), Becton Dickinson and Company, Eli Lilly and Company, Novo Nordisk A/S, and Takeda Pharmaceuticals Company Limited, are developing similar products. All of these competitors are large, well-capitalized companies with significantly greater product development resources than we have. If an existing or future competitor develops a product that competes with or is superior to the Omnipod System, our revenue may decline. In addition, some of our competitors may compete by changing their pricing model or by lowering the price of their insulin delivery systems or ancillary supplies. If these competitors’ products were to gain acceptance by healthcare professionals, people with insulin-dependent diabetes or third-party payors, a downward pressure on prices could result. If prices were to fall, we may not improve our gross margins or sales growth sufficiently to achieve profitability.
We rely on the proper function, availability and security of our information technology systems to operate our business and a cyber-attack or other breach or disruption of these systems could have a material adverse effect on our business and results of operations.
We rely on information technology systems to process, transmit and store electronic information in our day-to-day operations. The form and function of such systems may change over time as our business needs change. The nature of our business involves the receipt and storage of personal and financial information regarding our patients. We use our information technology systems to manage or support a variety of business processes and activities, including sales, shipping, billing, customer service, procurement and supply chain, manufacturing and accounts payable. In addition, we use enterprise information technology systems to record, process, and summarize transactions and other financial information and results of operations for internal reporting purposes and to comply with regulatory financial reporting, legal, and tax requirements. Our information technology systems may be susceptible to damage, disruptions or shutdowns due to computer viruses, attacks by computer hackers, failures during the process of upgrading or replacing software, databases or components thereof, power outages, hardware failures, telecommunication failures, user errors or catastrophic events. Any failure by us to maintain or protect our information technology systems and data integrity, including from cyber-attacks, intrusions, disruptions or shutdowns, could result in the unauthorized access to patient data and personally identifiable information, theft of intellectual property or other misappropriation of assets or the loss of key data and information, or otherwise compromise our confidential or proprietary information and disrupt our operations. If our information technology systems are breached or suffer severe damage, disruption or shutdown and we are unable to effectively resolve the issues in a timely manner, our business and operating results may be materially and adversely affected.
Technological breakthroughs in diabetes monitoring, treatment or prevention could render the Omnipod System obsolete. In addition, our own new product development initiatives may prove to be ineffective or not commercially successful.
The diabetes treatment market is subject to rapid technological change and product innovation. The Omnipod System is based on our proprietary technology, but a number of companies, medical researchers and existing pharmaceutical companies are pursuing new delivery devices, delivery technologies, sensing technologies, procedures, drugs and other therapeutics for the monitoring, treatment and/or prevention of insulin-dependent diabetes. For example, FDA approval of a commercially viable “closed-loop” or "hybrid closed-loop" system that combines continuous “real-time” glucose sensing or monitoring and automatic continuous subcutaneous insulin infusion in a manner that delivers appropriate amounts of insulin on a timely basis with reduced patient direction could have a material adverse effect on our revenue and future profitability. Medtronic has developed a "hybrid closed-loop" system with FDA-approval, which was commercially launched in 2017 and
which could negatively impact our business. In addition, the National Institutes of Health and other supporters of diabetes research are continually seeking ways to prevent, cure or improve the treatment of diabetes. Any technological breakthroughs in diabetes monitoring, treatment or prevention could render the Omnipod System obsolete, which would have a material adverse effect on our business, financial condition and results of operations.
We also have ongoing initiatives to develop products to improve the treatment of Type 1 diabetes and to treat patients with highly insulin resistant Type 2 diabetes. For example, we are working with DexCom to integrate its continuous glucose monitoring technology with the Omnipod System and we continue to explore partnership opportunities with other companies that have blood glucose monitoring and continuous glucose monitoring technologies. We are also developing with Eli Lilly and Company a new version of the Omnipod System specifically designed to deliver Humulin
®
R U-500 and U-200 insulin, which are more concentrated forms of
24
insulin than traditional U-100 insulin for patients with higher insulin-resistance. In each of these cases, these projects will require substantial clinical support and are subject to regulatory approvals. No assurances can be given that these or other development initiatives by us will be successful. The failure to successfully bring any of these products to market could have an adverse effect on our business and results of operations.
If our existing license agreement with Abbott is terminated or we fail to enter into new license agreements allowing us to incorporate a blood glucose meter into the Omnipod System, or if Abbott's FreeStyle meter is less desirable to our current and potential customers, our business may be materially adversely impacted.
Our rights to incorporate the FreeStyle blood glucose meter into the Omnipod System are governed by a development and license agreement with Abbott. This agreement provides us with a non-exclusive, fully paid, non-transferable and non-sublicensable license in the United States under patents and other relevant technical information relating to the FreeStyle blood glucose meter during the term of the agreement. As amended, this agreement runs through January 2020. The agreement may be terminated or limited in geographical scope by Abbott or us under certain circumstances. Termination of this agreement could require us to either remove the blood glucose meter from PDMs to be sold in the future, which could impair the functionality of the Omnipod System, or attempt to incorporate an alternative blood glucose meter into the PDM, either of which would require significant development and regulatory activities that might not be completed in time to prevent an interruption in the availability of the Omnipod System to our customers, which could have a material adverse effect on our business, financial condition and results of operations.
The FreeStyle blood glucose meter in our PDM is only approved for use with FreeStyle test strips in the United States. Not all third party payors reimburse patients for the purchase and use of FreeStyle test strips to the same extent as they reimburse patients for other brands of test strips. The absence or reduction in such reimbursement or availability of the test strips may make the Omnipod System less desirable to our current and potential customers.
In the future, we may need additional agreements or licenses to intellectual property or other rights in order to sell our current product or commercialize new products. If we cannot obtain these agreements, licenses, or other rights, we may not be able to sell, develop or commercialize these products. Our rights to use technologies licensed to us by third parties are not entirely within our control, and we may not be able to continue selling the Omnipod System or sell future products without these rights.
Our non-insulin drug delivery product line faces challenges which, if not met, may impair its future success and continued growth.
Our non-insulin drug delivery product line has grown substantially over the past years. This product line typically involves the development, manufacturing and sale of a modified Omnipod System for delivery of a specific drug other than insulin. The marketing and sales initiatives driving this product line differ markedly from those on which we rely for our sales of Omnipod Systems to treat diabetes since the non-insulin drug delivery devices depend on marketing and sales to pharmaceutical companies, not to patients and clinicians. We expect that the continued success of our non-insulin drug delivery product line will face several challenges, including:
|
•
|
our identification of drug delivery opportunities appropriate for a modified Omnipod System;
|
|
•
|
our achievement of satisfactory development and pricing terms with the pharmaceutical companies that sell such drugs;
|
|
•
|
our development of appropriate modifications to our Omnipod System technology to address the needs and parameters required for the respective drug-delivery opportunities;
|
|
•
|
manufacturing issues relating to the modified Omnipod System;
|
|
•
|
long lead-times associated with the development, regulatory approvals and ramp up applicable to the use of modified Omnipod Systems for the delivery of such drugs;
|
|
•
|
relatively small number of modified Omnipod Systems needed to address each drug-delivery opportunity;
|
|
•
|
uncertainties regarding the market acceptance of such drugs and the modified Omnipod Systems as appropriate delivery devices;
|
25
|
•
|
uncertainties relating to the success of the pharmaceutical companies in marketing and selling such drugs as well as the modified Omnipod Systems as the appropriate delivery devices;
|
|
•
|
intense competition in the drug-delivery industry, including from competitors which have substantially greater resources than we do;
|
|
•
|
maintaining appropriate gross margins; and
|
|
•
|
regulatory requirements and reimbursement rates associated with such drugs.
|
If we are unsuccessful in overcoming one or more of these challenges, our ability to capitalize on these opportunities and to continue to grow our non-insulin drug delivery product line could be significantly impaired, which in turn could materially and adversely impact our business and financial results.
The patent rights on which we rely to protect the intellectual property underlying our products may not be adequate, which could enable third parties to use our technology and would harm our continued ability to compete in the market.
Our success will depend in part on our continued ability to develop or acquire commercially-valuable patent rights and to protect these rights adequately. Our patent position is generally uncertain and involves complex legal and factual questions. The risks and uncertainties that we face with respect to our patents and other related rights include the following:
|
•
|
the pending patent applications we have filed or to which we have exclusive rights may not result in issued patents or may take longer than we expect to result in issued patents;
|
|
•
|
the claims of any patents that are issued may not provide meaningful protection;
|
|
•
|
we may not be able to develop additional proprietary technologies that are patentable; and
|
|
•
|
other companies may design around technologies we have patented, licensed or developed.
|
We also may not be able to protect our patent rights effectively in some foreign countries. For a variety of reasons, we may decide not to file for patent protection. Our patent rights underlying the our products may not be adequate, and our competitors or customers may design around our proprietary technologies or independently develop similar or alternative technologies or products that are equal or superior to ours without infringing on any of our patent rights. In addition, the patents licensed or issued to us may not provide a competitive advantage. The occurrence of any of these events may have a material adverse effect on our business, financial condition and results of operations.
Other rights and measures we have taken to protect our intellectual property may not be adequate, which would harm our ability to compete in the market.
In addition to patents, we rely on a combination of trade secrets, copyright and trademark laws, confidentiality, non-disclosure and assignment of invention agreements and other contractual provisions and technical measures to protect our intellectual property rights. Despite these measures, any of our intellectual property rights could be challenged, invalidated, circumvented or misappropriated. While we currently require employees, consultants and other third parties to enter into confidentiality, non-disclosure or assignment of invention agreements, or a combination thereof where appropriate, any of the following could still occur:
|
•
|
the agreements may be breached;
|
|
•
|
we may have inadequate remedies for any breach;
|
|
•
|
trade secrets and other proprietary information could be disclosed to our competitors; or
|
|
•
|
others may independently develop substantially equivalent or superior proprietary information and techniques or otherwise gain access to our trade secrets or disclose such technologies.
|
If, for any of the above reasons, our intellectual property is disclosed or misappropriated, it would harm our ability to protect our rights and have a material adverse effect on our business, financial condition and results of operations.
26
We may need to initiate lawsuits to protect or enforce our patents and other intellectual property rights, which could be expensive and, if we lose, could cause us to lose some of our intellectual property rights, which would harm our ability to compete in the market.
We rely on patents to protect a portion of our intellectual property and our competitive position. The patent laws that relate to the scope of claims in the technology fields in which we operate are still evolving and, consequently, certain patent positions in the medical device industry are generally uncertain. In order to protect or enforce our patent rights, we may initiate patent litigation against third parties, such as infringement suits or interference proceedings. Litigation may be necessary to:
|
•
|
assert claims of infringement;
|
|
•
|
enforce our patents;
|
|
•
|
protect our trade secrets or know-how; or
|
|
•
|
determine the enforceability, scope and validity of the proprietary rights of others.
|
Any lawsuits that we initiate could be expensive, take significant time and divert management’s attention from other business concerns. Litigation also puts our patents at risk of being invalidated or interpreted narrowly and our patent applications at risk of not issuing. Additionally, we may provoke third parties to assert claims against us. We may not prevail in any lawsuits that we initiate and the damages or other remedies awarded, if any, may not be commercially valuable. The occurrence of any of these events could have a material adverse effect on our business, financial condition and results of operations.
Claims that our current or future products infringe or misappropriate the proprietary rights of others could adversely affect our ability to sell those products and cause us to incur additional costs.
Substantial litigation over intellectual property rights exists in the medical device industry, and we have settled infringement suits in the past. We expect that we could be increasingly subject to third-party infringement claims as our revenue increases, the number of competitors grows and the functionality of products and technology in different industry segments overlaps. Third parties may currently have, or may eventually be issued, patents on which our current or future products or technologies may infringe. Any of these third parties might make a claim of infringement against us.
Such litigation, regardless of its outcome, could result in the expenditure of significant financial resources and the diversion of management’s time and resources. In addition, such litigation could cause negative publicity, adversely affect prospective customers, cause product shipment delays, limit or prohibit us from manufacturing, marketing or selling our current or future products, require us to develop non-infringing technology, make substantial payments to third parties or enter into royalty or license agreements, which may not be available on acceptable terms or at all. If a successful claim of infringement were made against us and we could not develop non-infringing technology or license the infringed or similar technology on a timely and cost-effective basis, our revenue could decrease substantially and we could be exposed to significant liability. A court could enter orders that temporarily, preliminarily or permanently enjoin us or our customers from making, using, selling, offering to sell or importing our current or future products, or could enter an order mandating that we undertake certain remedial activities.
We are subject to extensive government regulation, both in the United States and abroad, which could restrict the sales and marketing of our products and could cause us to incur significant costs.
Our medical device products and operations are subject to extensive regulation by the FDA and various other federal, state, local and foreign government authorities. Government regulation of medical devices is meant to assure their safety and effectiveness, and includes regulation of, among other things:
•
design, development and manufacturing;
•
testing, labeling, content and language of instructions for use and storage;
•
clinical trials;
•
product safety;
•
marketing, sales and distribution;
•
regulatory clearances and approvals including premarket clearance and approval;
27
•
conformity assessment procedures;
•
product traceability and record keeping procedures;
•
advertising and promotion;
•
product complaints, complaint reporting, recalls and field safety corrective actions;
|
•
|
post-market surveillance, including reporting of deaths or serious injuries and malfunctions that, if they were to recur, could lead to death or serious injury;
|
•
post-market studies; and
•
product import and export.
The regulations to which we are subject are complex and have tended to become more stringent over time. Regulatory changes could result in restrictions on our ability to carry on or expand our operations, higher than anticipated costs or lower than anticipated sales.
Before a new medical device, or a significant modification of a medical device, including a new use of or a new use of or claim for an existing product, can be marketed in the United States, it must first receive either 510(k) clearance or PMA from the FDA, unless an exemption applies. In the 510(k) clearance process, the FDA must determine that a proposed device is "substantially equivalent" to a device legally on the market, known as a "predicate" device, with respect to intended use, technology and safety and effectiveness, in order to clear the proposed device for marketing. Clinical data is sometimes required to support substantial equivalence. In December 2012 we received 501(k) clearance for our new Omnipod System. We have since obtained clearance for modified versions of this device. We may be required to obtain a new 510(k) clearance or pre-market approval for significant further post-market modifications to the Omnipod System. Obtaining 510(k) clearance or pre-market approval for medical devices can be expensive and lengthy, and entail significant user fees, unless an exemption is available. The FDA’s process for obtaining 510(k) clearance usually takes three to twelve months, but it can last longer. In the PMA approval process, the FDA must determine that a proposed device is safe and effective for its intended use based, in part, on extensive data, including but not limited to, technical, pre-clinical, clinical trial, manufacturing and labeling data. The process for obtaining pre-market approval is much more costly and uncertain and it generally takes from one to three years, or longer, from the time the application is filed with the FDA. Modifications to products that are approved through a PMA application generally need FDA approval. We expect that some of our future products will require PMA approval. In addition, the FDA may demand that we obtain a PMA prior to marketing future changes of our existing Omnipod System. Further, we may not be able to obtain additional 510(k) clearances or pre-market approvals for new products or for modifications to, or additional indications for, the Omnipod System in a timely fashion or at all. Delays in obtaining future clearances could adversely affect our ability to introduce new or enhanced products in a timely manner which in turn could harm our revenue and future profitability.
We also are subject to numerous post-marketing regulatory requirements, which include quality system regulations related to the manufacturing of our devices, labeling regulations and medical device reporting regulations. The last of these regulations requires us to report to the FDA if our devices cause or contribute to a death or serious injury, or malfunction in a way that would likely cause or contribute to a death or serious injury. If we fail to comply with present or future regulatory requirements that are applicable to us, we may be subject to enforcement action by the FDA, which may include any of the following sanctions:
|
•
|
untitled letters, warning letters, fines, injunctions, consent decrees and civil penalties;
|
|
•
|
customer notification, or orders for repair, replacement or refunds;
|
|
•
|
voluntary or mandatory recall or seizure of our current or future products;
|
|
•
|
administrative detention by the FDA of medical devices believed to be adulterated or misbranded;
|
|
•
|
imposing operating restrictions, suspension or shutdown of production;
|
|
•
|
refusing our requests for 510(k) clearance or pre-market approval of new products, new intended uses or modifications to the Omnipod System;
|
28
|
•
|
rescinding 510(k) clearance or suspending or withdrawing pre-market approvals that have already been granted; and
|
|
•
|
criminal prosecution.
|
The occurrence of any of these events may have a material adverse effect on our business, financial condition and results of operations.
In addition, the FDA may change its clearance and approval policies, adopt additional regulations or revise existing regulations, or take other actions that may prevent or delay approval or clearance of our products under development or impact our ability to modify our currently approved or cleared products on a timely basis. For example, as part of the 21
st
Century Act passed in 2016, Congress enacted several reforms that further affect medical device regulation both pre- and post-approval. While those changes are still being implemented by FDA, this serves as an example of the rapidly changing regulatory environment in which we operate. In addition, regulatory requirements may change in the future in a way that adversely affects us. For instance, the FDA is in the process of reviewing the 510(k) approval process and criteria and has announced initiatives to improve the current pre-market and post-market regulatory processes and requirements associated with infusion pumps and other home use medical devices. As part of this effort, the FDA is reviewing the adverse event reporting and recall processes for insulin pumps. Any change in the laws or regulations that govern the clearance and approval processes relating to our current and future products could make it more difficult and costly to obtain clearance or approval for new products, or to produce, market and distribute existing products.
The Omnipod System is also sold in a number of European countries, Canada and Israel. As a result, we are required to comply with additional foreign regulatory requirements. For example, in April 2009, we first received CE Mark approval for our Omnipod System. The CE Mark gives us authorization to distribute the Omnipod System throughout the European Union and in other countries that recognize the CE Mark. Additionally, in September 2009, we first received Health Canada approval to distribute the Omnipod System throughout Canada. As we expand our sales efforts internationally, we may need to obtain additional foreign approval certifications.
There is no guarantee that the FDA will grant 510(k) clearance or PMA approval of our future products, and failure to obtain necessary clearances or approvals for our future products would adversely affect our ability to grow our business.
Some of our new or modified products will require FDA clearance of a 510(k) or FDA approval of a PMA. The FDA may not approve or clear these products for the indications that are necessary or desirable for successful commercialization. Indeed, the FDA may refuse our requests for 510(k) clearance or premarket approval of new products. Even early stage review may result in issues. For example, the FDA has issued guidance documents intended to explain the procedures and criteria the FDA will use in assessing whether a 510(k) and PMA submissions meets a minimum threshold of acceptability and should be accepted for substantive review. Under the “Refuse to Accept” guidance, the FDA conducts an early review against specific acceptance criteria to inform 510(k) and PMA submitters if the submission is administratively complete, or if not, to identify the missing element(s). Submitters are given the opportunity to provide the FDA with the identified information. If the information is not provided within a defined time, the submission will not be accepted for FDA review. Significant delays in receiving clearance or approval, or the failure to receive clearance or approval for our new products would have an adverse effect on our ability to expand our business.
29
If we, our contract manufacturer or our component suppliers fail to comply with the FDA’s quality system regulations, the manufacturing and distribution of our devices could be interrupted, and our product sales and operating results could suffer.
We, our contract manufacturer and our component suppliers are required to comply with the FDA’s quality system regulations ("QSR"), which is a complex regulatory framework that covers the procedures and documentation of the design, testing, production, control, quality assurance, labeling, packaging, sterilization, storage and shipping of our devices. Compliance with applicable regulatory requirements is subject to continual review and is monitored rigorously through periodic, sometimes unannounced, inspections by the FDA. We cannot assure you that our facilities or our contract manufacturer or component suppliers’ facilities would pass any future quality system inspection. If our or any of our contract manufacturer or component suppliers’ facilities fails a quality system inspection, the manufacturing or distribution of our devices could be interrupted and our operations disrupted. Failure to take adequate and timely corrective action in response to an adverse quality system inspection could force a suspension or shutdown of our labeling operations or the manufacturing operations of our contract manufacturer, or a recall of our devices.
If we, or our manufacturers, fail to adhere to QSR requirements, this could delay production of our products and lead to fines, difficulties in obtaining regulatory clearances, recalls, enforcement actions, including injunctive relief or consent decrees, or other consequences, which could, in turn, have a material adverse effect on our financial condition or results of operations.
If our products, or malfunction of our products, cause or contribute to a death or a serious injury, we will be subject to medical device reporting regulations, which can result in voluntary corrective actions or agency enforcement actions.
Under the FDA medical device reporting regulations, medical device manufacturers are required to report to the FDA information that a device has or may have caused or contributed to a death or serious injury or has malfunctioned in a way that would likely cause or contribute to death or serious injury if the malfunction of the device or one of our similar devices were to recur. Any such adverse event involving our products could result in future voluntary corrective actions, such as recalls or customer notifications, or agency action, such as inspection or enforcement action. Adverse events involving our products have been reported to us in the past, and we cannot guarantee that they will not occur in the future. Any corrective action, whether voluntary or involuntary, will require the dedication of our time and capital, distract management from operating our business and may harm our reputation and financial results.
Our current or future products may be subject to product recalls even after receiving FDA clearance or approval. A recall of our products, either voluntarily or at the direction of the FDA, or the discovery of serious safety issues with our products, could have a significant adverse impact on us.
The FDA and similar governmental bodies in other countries have the authority to require the recall of our current or future products if we or our contract manufacturers fail to comply with relevant regulations pertaining to manufacturing practices, labeling, advertising or promotional activities, or if new information is obtained concerning the safety or efficacy of these products. For example, under the FDA’s medical device reporting, or MDR, regulations, we are required to report to the FDA any incident in which our product may have caused or contributed to a death or serious injury or in which our product malfunctioned and, if the malfunction were to recur, would likely cause or contribute to death or serious injury. Repeated product malfunctions may result in a voluntary or involuntary product recall. A government-mandated recall could occur if the FDA finds that there is a reasonable probability that the device would cause serious, adverse health consequences or death. A voluntary recall by us could occur as a result of any material deficiency in a device, such as manufacturing defects, labeling deficiencies, packaging defects or other failures to comply with applicable regulations. In general, if we decide to make a change to our product, we are responsible for determining whether to classify the change as a recall. It is possible that the FDA could disagree with our initial classification. The FDA requires that certain classifications of recalls be reported to the FDA within 10 working days after the recall is initiated. In general if any change or group of changes to a device addresses a violation of the Federal Food, Drug, and Cosmetic Act, that change would generally constitute a medical device recall and require submission of a recall report to the FDA.
30
Recalls of any of our products would divert managerial and financial resources and have an adverse effect on our reputation, results of operations and financial condition, which could impair our ability to produce our products in a cost-effective and timely manner in order to meet our customers’ demands. We may also be subject to liability claims, be required to bear other costs, or take other actions that may have a negative impact on our future sales and our ability to generate profits. Companies are required to maintain certain records of recalls, even if they are not reportable to the FDA. We may initiate voluntary recalls involving our products in the future that we determine do not require notification of the FDA. If the FDA disagrees with our determinations, they could require us to report those actions as recalls. A future recall announcement could harm our reputation with customers and negatively affect our sales. In addition, the FDA could take enforcement action for failing to report the recalls when they were conducted.
Further, under the FDA’s medical device reporting, or MDR, regulations, we are required to report to the FDA any incident in which our product may have caused or contributed to a death or serious injury or in which our product malfunctioned and, if the malfunction were to recur, would likely cause or contribute to death or serious injury. Repeated product malfunctions may result in a voluntary or involuntary product recall, which could divert managerial and financial resources, impair our ability to manufacture our products in a cost-effective and timely manner, and have an adverse effect on our reputation, results of operations and financial condition. We are also required to follow detailed recordkeeping requirements for all firm-initiated medical device corrections and removals, and to report such corrective and removal actions to FDA if they are carried out in response to a risk to health and have not otherwise been reported under the MDR regulations.
If the third parties on which we rely to conduct our clinical trials and to assist us with pre-clinical development do not perform as contractually required or expected, we may not be able to obtain regulatory clearance or approval or commercialize our products.
We rely on third parties, such as contract research organizations, medical institutions, clinical investigators, contract laboratories and other third parties to conduct some of our clinical trials and pre-clinical investigations. If these third parties do not successfully carry out their contractual duties or regulatory obligations or meet expected deadlines, or if the quality or accuracy of the data they obtain is compromised due to the failure to adhere to our clinical protocols or regulatory requirements or for other reasons, our pre-clinical development activities or clinical trials may be extended, delayed, suspended or terminated, and we may not be able to obtain regulatory approval for, or successfully commercialize, our products on a timely basis, if at all, and our business, operating results and prospects may be adversely affected. Furthermore, our third-party clinical trial investigators may be delayed in conducting our clinical trials for reasons outside of their control.
We may be subject to enforcement action if we engage in improper marketing or promotion of our products.
Our promotional materials and training methods must comply with FDA and other applicable laws and regulations, including the prohibition of the promotion of unapproved, or off-label, use. Doctors may use our products off-label, as the FDA does not restrict or regulate a doctor’s choice of treatment within the practice of medicine. However, if the FDA determines that our promotional materials or training constitutes promotion of an off-label use, it could request that we modify our training or promotional materials or subject us to regulatory or enforcement actions, including the issuance of an untitled letter, a warning letter, injunction, seizure, civil fine or criminal penalties. It is also possible that other federal, state or foreign enforcement authorities might take action if they consider our promotional or training materials to constitute promotion of an off-label use, which could result in significant fines or penalties under other statutory authorities, such as laws prohibiting false claims for reimbursement. In that event, our reputation could be damaged and adoption of the products could be impaired. Although our policy is to refrain from statements that could be considered off-label promotion of our products, the FDA or another regulatory agency could disagree and conclude that we have engaged in off-label promotion. In addition, the off-label use of our products may increase the risk of product liability claims. Product liability claims are expensive to defend and could divert our management’s attention, result in substantial damage awards against us, and harm our reputation.
31
We are subject to federal, state and foreign laws prohibiting “kickbacks” and false or fraudulent claims, and other fraud and abuse laws, transparency laws, and other health care laws and regulations, which, if violated, could subject us to substantial penalties. Additionally, any challenge to or investigation into our practices under these laws could cause adverse publicity and be costly to respond to, and thus could harm our business.
Our relationships with customers and third-party payers are subject to broadly applicable fraud and abuse and other health care laws and regulations that may constrain our sales, marketing and other promotional activities by limiting the kinds of financial arrangements, including sales programs, we may have with hospitals, physicians, patients or other potential purchasers of medical devices. These laws include the Federal Anti-Kickback Statute, the Federal False Claims Act, other federal health care false statement and fraud statutes, the Open Payments program, the Civil Monetary Penalties Law, and analogous fraud and abuse and transparency laws in most states, as described in greater detail in the section above entitled “Government Regulation”.
We conduct various marketing and product training activities that involve making payments to healthcare providers and entities. While we believe and make every effort to ensure that our business arrangements with third parties and other activities comply with all applicable laws, these laws are complex and our activities may be found not to be compliant with one of these laws, which may result in significant civil, criminal and/or administrative penalties. Even an unsuccessful challenge or investigation into our practices could cause adverse publicity, and be costly to respond to, and thus could have a material adverse effect on our business, financial condition and results of operations. Our compliance with Medicare and Medicaid regulations may be reviewed by federal or state agencies, including the United States Department of Health and Human Services’ Office of the Inspector General (“OIG”), CMS, and the Department of Justice. To ensure compliance with Medicare, Medicaid and other regulations, government agencies conduct periodic audits of us to ensure compliance with various supplier standards and billing requirements.
If we are found to have violated laws protecting the confidentiality of patient health information, we could be subject to civil or criminal penalties, which could increase our liabilities and harm our reputation or our business.
There are a number of federal and state laws protecting the confidentiality of certain patient health information, including patient records, and restricting the use and disclosure of that protected information. In particular, the U.S. Department of Health and Human Services promulgated patient privacy rules under HIPAA. These privacy rules protect medical records and other personal health information by limiting their use and disclosure, giving individuals the right to access, amend and seek accounting of their own health information and limiting most use and disclosures of health information to the minimum amount reasonably necessary to accomplish the intended purpose. If we are found to be in violation of the privacy rules under HIPAA, we could be subject to civil or criminal penalties, which could increase our liabilities, harm our reputation and have a material adverse effect on our business, financial condition and results of operations.
We are subject to complex and evolving U.S. and foreign laws and regulations regarding privacy, data protection, and other matters. Many of these laws and regulations are subject to change and uncertain interpretation, and could result in claims, changes to our business practices, monetary penalties, increased cost of operations, or declines in user growth or engagement, or otherwise harm our business.
We are subject to a variety of laws and regulations in the United States and abroad that involve matters central to our business, including laws and regulations relating to privacy and data protection, rights of publicity, content, intellectual property, advertising, marketing, distribution, data security, data retention and deletion, personal information, electronic contracts and other communications, competition, protection of minors, consumer protection, telecommunications, product liability, taxation, economic or other trade prohibitions or sanctions, corrupt practices, fraud, waste and abuse restrictions, and securities law compliance. The introduction of new products or expansion of our activities in certain jurisdictions may subject us to additional laws and regulations. For example, data protection laws passed by the federal government, many states and foreign countries require notification to users when there is a security breach for personal data.
In addition, foreign data protection, privacy, and other laws and regulations can be more restrictive than those in the United States. For example, data localization laws in some countries generally mandate that certain types of data
32
collected in a particular country be stored and/or processed within that country. We could be subject to audits in Europe and around the world, particularly in the areas of consumer and data protection, as we continue to grow and expand our operations. Legislators and regulators may make legal and regulatory changes, or interpret and apply existing laws, in ways that make our products less useful to our customers, require us to incur substantial costs, expose us to unanticipated civil or criminal liability, or cause us to change our business practices. These changes or increased costs could negatively impact our business and results of operations in material ways.
Product liability suits, whether or not meritorious, could be brought against us due to an alleged defective product or for the misuse of our devices. These suits could result in expensive and time-consuming litigation, payment of substantial damages, and an increase in our insurance rates.
If our current or future products are defectively designed or manufactured, contain defective components or are misused, or if someone claims any of the foregoing, whether or not meritorious, we may become subject to substantial and costly litigation. Misusing our devices or failing to adhere to the operating guidelines of the Omnipod System or other products based on the Omnipod System technology could cause significant harm to patients, including death. In addition, if our operating guidelines are found to be inadequate, we may be subject to liability. Product liability claims could divert management’s attention from our core business, be expensive to defend and result in sizable damage awards against us. While we believe that we are reasonably insured against these risks, we may not have sufficient insurance coverage for all future claims. Any product liability claims brought against us, with or without merit, could increase our product liability insurance rates or prevent us from securing continuing coverage, could harm our reputation in the industry and could reduce revenue. Product liability claims in excess of our insurance coverage would be paid out of cash reserves harming our financial condition and adversely affecting our results of operations.
Our ability to grow our revenue depends in part on our retaining a high percentage of our customer base.
A key to driving our revenue growth is the retention of a high percentage of our customers. We have developed retention programs aimed at both healthcare professionals and patients, which include appeals assistance, ongoing patient communications, newsletters, support, training and an automatic re-order program for certain patients. We have had a satisfactory customer retention rate; however, we cannot assure you that we will maintain this retention rate in the future. Current uncertainty in global economic conditions, higher levels of unemployment, changes in insurance reimbursement levels and negative financial news may negatively affect product demand. If demand for our products fluctuates as a result of economic conditions or otherwise, our ability to attract and retain customers could be harmed. The failure to retain a high percentage of our customers would negatively impact our revenue growth and may have a material adverse effect on our business, financial condition and results of operations.
Under our distribution model, we depend on a small number of customers, including distributors, for a large portion of our business, and changes in orders from such customers could have a significant impact on our operating results. If a major customer, either in our insulin or non-insulin drug delivery businesses significantly reduces the amount of business it does with us, there would be an adverse impact on our operating results.
Revenue for customers comprising more than 10% of total revenue were as follows:
|
Twelve Months Ended December 31,
|
||||||
|
|
2017
|
2016
|
2015
|
|||
|
Amgen, Inc.
|
15%
|
17%
|
10%
|
|||
|
Ypsomed Distribution AG
|
22%
|
16%
|
12%
|
|||
|
RGH Enterprises, Inc.
|
11%
|
10%
|
13%
|
|||
33
We have sponsored, and expect to continue to sponsor market studies seeking to demonstrate certain aspects of the efficacy of the Omnipod System, which may fail to produce favorable results.
To help improve, market and sell the Omnipod System, we have sponsored, and expect to continue to sponsor market studies to assess various aspects of the Omnipod System’s functionality and its relative efficacy. The data obtained from the studies may be unfavorable to the Omnipod System or may be inadequate to support satisfactory conclusions. In addition, in the future we may sponsor clinical trials to assess certain aspects of the efficacy of the Omnipod System. If future clinical trials fail to support the efficacy of our current or future products, our sales may be adversely affected and we may lose an opportunity to secure clinical preference from prescribing clinicians, which may have a material adverse effect on our business, financial condition and results of operations.
If future clinical studies or other articles are published, or diabetes associations or other organizations announce positions that are unfavorable to the Omnipod System, our sales efforts and revenue may be negatively affected.
Future clinical studies or other articles regarding our existing products or any competing products may be published that either support a claim, or are perceived to support a claim, that a competitor’s product is clinically more effective or easier to use than the Omnipod System or that the Omnipod System is not as effective or easy to use as we claim. Additionally, diabetes associations, healthcare providers that focus on diabetes or other organizations that may be viewed as authoritative could endorse products or methods that compete with the Omnipod System or otherwise announce positions that are unfavorable to the Omnipod System. Any of these events may negatively affect our sales efforts and result in decreased revenue.
Substantially all of our operations related to the Omnipod System are conducted at a single location and substantially all of our Omnipod System inventory is held at a single location. Any disruption at either of these locations could increase our expenses.
Substantially all of our manufacturing of complete Omnipod Systems is currently conducted at a single location on manufacturing lines owned by us at a facility located in China, operated by a subsidiary of Flex. We take precautions to ensure that Flex safeguards our assets, including insurance and health and safety protocols. However, a natural or other disaster, such as a fire or flood, could cause substantial delays in our operations, damage or destroy our manufacturing equipment, and cause us to incur additional expenses. The insurance we maintain may not be adequate to cover our losses in any particular case. With or without insurance, damage to our manufacturing equipment, or to any of our suppliers, may have a material adverse effect on our business, financial condition and results of operations.
In addition, substantially all of our Omnipod System inventory is held at a single location in Massachusetts. We take precautions to safeguard our facility, including insurance, health and safety protocols and off-site storage of computer data. However, a natural or other disaster, such as a fire or flood, could cause substantial delays in our operations, damage or destroy our inventory, and cause us to incur additional expenses. The insurance we maintain may not be adequate to cover our losses in any particular case. With or without insurance, damage to our facility or our other property may have a material adverse effect on our business, financial condition and results of operations.
If we do not effectively manage the construction of our planned manufacturing facility in the U.S., our results of operations may be adversely affected.
To lower our manufacturing costs, increase supply redundancy and add capacity to support growth, we are constructing a highly-automated manufacturing facility in Acton, Massachusetts. This facility will also serve as our global headquarters. As of December 31, 2017, we had outstanding purchase commitments with various suppliers for the construction of the facility. To date, we have incurred capital expenditures of approximately $70 million related to this facility and we expect that capital expenditures for this facility will approach $200 million when production begins in 2019. These costs could increase significantly and there is no assurance that the final cost of the facility will not be materially higher than anticipated. There may be design changes, material cost escalations or budgetary overruns associated with the construction.
We may experience delays in the construction of our planned manufacturing facility. We may also encounter defects in materials and/or workmanship in connection with construction which could lead to a failure to adhere to compliance requirements. Any defects could delay the commencement of operations of the facility, lead to fines
34
from non-compliance of regulatory requirements, or, if such defects are discovered after operations have commenced, could halt or discontinue the facility indefinitely.
Our success will depend on our ability to attract and retain personnel.
Over the last several years, we have made significant changes to our senior management team and to many other positions throughout the Company. We believe we will benefit substantially from the leadership and performance of these new employees. As such, our success will depend on our ability to retain our new employees and to attract and retain additional qualified personnel in the future. In addition, it is important to the success of the Company that the transition of the new employees be largely seamless. Competition for senior management personnel, and other highly skilled personnel is intense and there can be no assurances that we will be able to retain our personnel. The loss of the services of members of our senior management, and other highly skilled personnel could prevent or delay the implementation and completion of our objectives, or divert management’s attention to seeking qualified replacements.
Additionally, the sale and after-sale support of the Omnipod System is logistically complex, requiring us to maintain an extensive infrastructure of field sales personnel, diabetes educators, customer support, insurance specialists, and billing and collections personnel. We face considerable challenges in recruiting, training, managing, motivating and retaining these teams, including managing geographically dispersed efforts. If we fail to maintain and grow an adequate pool of trained and motivated personnel, our reputation could suffer and our financial position could be adversely affected.
If we do not effectively manage our growth, our business resources may become strained and we may not be able to deliver the Omnipod System in a timely manner, which could harm our results of operations.
Since the commercial launch of the Omnipod System, we have progressively expanded our marketing efforts to cover the entire United States. In addition, the Omnipod System is sold in a number of European countries, Canada and Israel. As we continue to expand our sales internationally, including our assumption of the distribution, sales, marketing, training and support activities of our Omnipod System across Europe following the expiration of our global distribution agreement with our European distributor on June 30, 2018, we will need to obtain regulatory approvals and reimbursement agreements with government agencies or private third-party payors in those countries. Failure to obtain such agreements would limit our ability to successfully penetrate those foreign, including the European, markets. In addition, the geographic expansion of our business will require additional manufacturing capacity to supply those markets as well as additional sales and marketing resources.
We expect to continue to increase our manufacturing capacity, our personnel and the scope of our U.S. and international sales and marketing efforts. This growth, as well as any other growth that we may experience in the future, will provide challenges to our organization and may strain our management and operations resources. In order to manage future growth, we will be required to improve existing, and implement new, sales and marketing efforts and distribution channels. The form and function of our enterprise information technology systems will need to change and be improved upon as our business needs change. We will need to manage our supply chain effectively, including the development of our U.S. manufacturing, our relationship with Flex and other suppliers going forward. We may also need to partner with additional third-party suppliers to manufacture certain components of the Omnipod System and complete additional manufacturing lines in the future. A transition to new suppliers may result in additional costs or delays. We may misjudge the amount of time or resources that will be required to effectively manage any anticipated or unanticipated growth in our business or we may not be able to manufacture sufficient inventory, or attract, hire and retain sufficient personnel to meet our needs. If we cannot scale our business appropriately, maintain control over expenses or otherwise adapt to anticipated and unanticipated growth, our business resources may become strained, we may not be able to deliver the Omnipod System in a timely manner and our results of operations may be adversely affected.
If we choose to acquire or invest in new businesses, products or technologies, instead of developing them ourselves, these acquisitions or investments could disrupt our business and could result in the use of significant amounts of equity, cash or a combination of both.
35
From time to time we may seek to acquire or invest in new businesses, products or technologies, instead of developing them ourselves. Acquisitions and investments involve numerous risks, including:
|
•
|
the inability to complete the acquisition or investment;
|
|
•
|
disruption of our ongoing businesses and diversion of management attention;
|
|
•
|
difficulties in integrating the acquired entities, products or technologies;
|
|
•
|
risks associated with acquiring intellectual property;
|
|
•
|
difficulties in operating the acquired business profitably;
|
|
•
|
the inability to achieve anticipated synergies, cost savings or growth;
|
|
•
|
potential loss of key employees, particularly those of the acquired business;
|
|
•
|
difficulties in transitioning and maintaining key customer, distributor and supplier relationships;
|
|
•
|
risks associated with entering markets in which we have no or limited prior experience; and
|
|
•
|
unanticipated costs.
|
In addition, any future acquisitions or investments may result in one or more of the following:
|
•
|
dilutive issuances of equity securities, which may be sold at a discount to market price;
|
|
•
|
the use of significant amounts of cash;
|
|
•
|
the incurrence of debt;
|
|
•
|
the assumption of significant liabilities;
|
|
•
|
increased operating costs or reduced earnings;
|
|
•
|
financing obtained on unfavorable terms;
|
|
•
|
large one-time expenses; and
|
|
•
|
the creation of certain intangible assets, including goodwill, the write-down of which in future periods may result in significant charges to earnings.
|
Any of these factors could materially harm our stock price, business, financial condition and results of operations.
We need to expand our distribution network to maintain and grow our business and revenue. If we fail to expand and maintain an effective sales force or successfully develop our relationships with distributors, our business, prospects and brand may be materially and adversely affected.
We currently promote, market and sell the majority of our Omnipod Systems through our own direct sales force. We currently utilize a limited number of domestic distributors to augment our sales efforts. In addition, in January 2010 we entered into an exclusive distribution agreement with our European distributor to promote, advertise, distribute and sell the Omnipod System in certain countries. This agreement expires in mid-2018, at which point we will assume the distribution, sales, marketing, training and support activities of our Omnipod System across Europe. In addition to the Omnipod System, our European distributor also markets and sells a suite of other products for the treatment of diabetes and has introduced and sells its own branded conventional insulin pump. We cannot assure you that we will be able to successfully develop our relationships with third-party distributors. If we fail to do so, our sales could fail to grow or could decline, and our ability to grow our business could be adversely affected. Distributors that are in the business of selling other medical products may not devote a sufficient level of resources and support required to generate awareness of our products and grow or maintain product sales. If our distributors are unwilling or unable to market and sell our products, or if they do not perform to our expectations, we could experience delayed or reduced market acceptance and sales of our products.
36
If we are unable to successfully maintain effective internal control over financial reporting, investors may lose confidence in our reported financial information and our stock price and our business may be adversely impacted.
As a public company, we are required to maintain internal control over financial reporting and our management is required to evaluate the effectiveness of our internal control over financial reporting as of the end of each fiscal year. Additionally, we are required to disclose in our Annual Reports on Form 10-K our management’s assessment of the effectiveness of our internal control over financial reporting along with a registered public accounting firm’s attestation report on the effectiveness of our internal controls. If we are not successful in maintaining effective internal control over financial reporting, there could be inaccuracies or omissions in the consolidated financial information we are required to file with the Securities and Exchange Commission. Additionally, even if there are no inaccuracies or omissions, we will be required to publicly disclose the conclusion of our management that our internal control over financial reporting or disclosure controls and procedures are not effective. These events could cause investors to lose confidence in our reported financial information, adversely impact our stock price, result in increased costs to remediate any deficiencies, attract regulatory scrutiny or lawsuits that could be costly to resolve and distract management’s attention, limit our ability to access the capital markets or cause our stock to be delisted from The NASDAQ Global Market or any other securities exchange on which it is then listed.
The price of our common stock may be volatile.
The market price of our common stock is affected by a number of factors, including:
|
•
|
failure to maintain and increase production capacity and reduce per unit production costs;
|
|
•
|
changes in the availability of third-party reimbursement in the United States or other countries;
|
|
•
|
volume and timing of orders for the Omnipod System;
|
|
•
|
developments in administrative proceedings or litigation related to intellectual property rights;
|
|
•
|
issuance of patents to us or our competitors;
|
|
•
|
the announcement of new products or product enhancements by us or our competitors;
|
|
•
|
the announcement of technological or medical innovations in the treatment or diagnosis of diabetes;
|
|
•
|
changes in governmental regulations or in the status of our regulatory approvals or applications;
|
|
•
|
developments in our industry;
|
|
•
|
publication of clinical studies relating to the Omnipod System or a competitor’s product;
|
|
•
|
quarterly variations in our or our competitors’ results of operations;
|
|
•
|
changes in earnings estimates or recommendations by securities analysts; and
|
|
•
|
general market conditions and other factors, including factors unrelated to our operating performance or the operating performance of our competitors.
|
At times, the fluctuations in the market price of our common stock have been unrelated or disproportionate to our operating performance. In particular, the U.S. equity markets have at times experienced significant price and volume fluctuations that have affected the market prices of equity securities of many technology companies. Broad market and industry factors such as these could materially and adversely affect the market price of our stock, regardless of our actual operating performance.
Conversion of any of our Convertible Senior Notes may dilute the ownership interest of existing stockholders or depress our stock price.
The conversion of some or all of our Convertible Senior Notes may dilute the ownership interests of existing stockholders. Any sales in the public market of any of our common stock issuable upon such conversion could adversely affect prevailing market prices of our common stock. In addition, the anticipated conversion of the Convertible Senior Notes into a combination of cash and shares of our common stock could depress the price of our common stock.
37
Furthermore, the price of our common stock also could be affected by possible sales of our common stock by investors who view the Convertible Senior Notes as a more attractive means of equity participation in us and by hedging or arbitrage trading activity that we expect will develop involving our common stock. A decline in the price of shares of our common stock might impede our ability to raise capital through the issuance of additional shares of our common stock or other equity securities.
We could be subject to indemnification obligations in connection with the disposition of our former Neighborhood Diabetes supplies business.
In February 2016, we sold Neighborhood Diabetes to Liberty Medical. Under the terms of the sale, we agreed to indemnify Liberty Medical for certain customary matters primarily related to our pre-closing operation of the business. Although we currently do not expect any material indemnification obligations to arise, we could be required to reimburse Liberty Medical for such claims in the event that they were to arise.
Our ability to use net operating loss carryforwards may be subject to limitation.
Section 382 of the U.S. Internal Revenue Code of 1986, as amended, imposes an annual limit on the amount of net operating loss carryforwards that may be used to offset taxable income when a corporation has undergone significant changes in its stock ownership or equity structure. Our ability to use net operating losses may be limited by prior changes in our ownership, and may be further limited by the issuance of common stock in connection with the conversion of our Convertible Senior Notes, or by the consummation of other transactions. As a result, if we earn net taxable income, our ability to use net operating loss carryforwards to offset U.S. federal taxable income may become subject to limitations, which could potentially result in increased future tax liabilities for us.
Anti-takeover provisions in our organizational documents, our shareholder rights plan and Delaware law may discourage or prevent a change of control, even if an acquisition would be beneficial to our stockholders, which could affect our stock price adversely and prevent attempts by our stockholders to replace or remove our current management.
Our certificate of incorporation and bylaws contain provisions that could delay or prevent a change of control of our company or changes in our board of directors that our stockholders might consider favorable. Some of these provisions:
|
•
|
authorize the issuance of preferred stock which can be created and issued by the board of directors without prior stockholder approval, with rights senior to those of our common stock;
|
|
•
|
provide for a classified board of directors, with each director serving a staggered three-year term;
|
|
•
|
prohibit our stockholders from filling board vacancies, calling special stockholder meetings or taking action by written consent;
|
|
•
|
provide for the removal of a director only with cause and by the affirmative vote of the holders of 75% or more of the shares then entitled to vote at an election of our directors; and
|
|
•
|
require advance written notice of stockholder proposals and director nominations.
|
We are subject to the provisions of Section 203 of the Delaware General Corporation Law, which may prohibit certain business combinations with stockholders owning 15% or more of our outstanding voting stock. These and other provisions in our certificate of incorporation, bylaws and Delaware law could make it more difficult for stockholders or potential acquirers to obtain control of our board of directors or initiate actions that are opposed by our then-current board of directors, including a merger, tender offer or proxy contest involving our company. Any delay or prevention of a change of control transaction or changes in our board of directors could cause the market price of our common stock to decline.
In addition, in November 2008, our board of directors adopted a shareholder rights plan, implementing what is commonly known as a “poison pill.” This poison pill significantly increases the costs that would be incurred by an unwanted third party acquirer if such party owns or announces its intent to commence a tender offer for more than 15% of our outstanding common stock or otherwise “triggers” the poison pill by exceeding the applicable stock ownership threshold. The existence of this poison pill could delay, deter or prevent a takeover of us. The shareholder rights plan is scheduled to expire in November 2018.
38
None.
We lease a total of approximately
143,000
square feet of office space, laboratory, warehousing and other related facilities. Approximately
100,000
of the total square footage consists of laboratory and office space for our corporate headquarters in Billerica, Massachusetts under leases expiring in November 2022.
Additionally, we lease approximately
29,000
square feet of warehousing space in Billerica, Massachusetts under a lease expiring in September 2019. We lease other facilities in Canada, China, the United Kingdom, California and Tennessee containing a total of approximately
14,000
square feet under leases expiring from April 2018 to December 2020.
In December 2016, we purchased property for our U.S. manufacturing facility in Acton, Massachusetts. The property includes 195,000 square feet of manufacturing and office space.
The information required by this Item is provided under "Legal Proceedings" in Note
12
to the consolidated financial statements included under Item 8 of this Form 10-K, and is incorporated herein by reference.
Not applicable.
39
MARKET FOR REGISTRANT'S COMMON EQUITY
Our common stock has been listed on The NASDAQ Global Market under the trading symbol “PODD” since our initial public offering on May 15, 2007. The following table sets forth the high and low closing sales prices of our common stock, as reported by The NASDAQ Global Market, for each of the periods listed.
|
High
|
Low
|
||||||
|
Fiscal Year 2016
|
|||||||
|
First Quarter
|
$
|
37.54
|
|
$
|
24.68
|
|
|
|
Second Quarter
|
$
|
35.15
|
|
$
|
26.89
|
|
|
|
Third Quarter
|
$
|
45.07
|
|
$
|
30.46
|
|
|
|
Fourth Quarter
|
$
|
40.72
|
|
$
|
30.73
|
|
|
|
Fiscal Year 2017
|
|||||||
|
First Quarter
|
$
|
47.22
|
|
$
|
36.98
|
|
|
|
Second Quarter
|
$
|
51.31
|
|
$
|
39.10
|
|
|
|
Third Quarter
|
$
|
59.46
|
|
$
|
49.49
|
|
|
|
Fourth Quarter
|
$
|
71.80
|
|
$
|
55.67
|
|
|
As of
February 16, 2018
, there were approximately
11
registered holders of record of our common stock. The number of beneficial stockholders of our shares is greater than the number of stockholders of record.
Performance Graph
The chart set forth below shows the value of an investment of $100 on
December 31, 2012
in each of Insulet Corporation common stock, the NASDAQ Composite Index, and the NASDAQ Health Care Index. All values assume reinvestment of the pre-tax value of dividends paid by companies included in these indices and are calculated as of December 31,
2017
. The historical stock price performance of our common stock shown in the performance graph below is not necessarily indicative of future stock price performance.
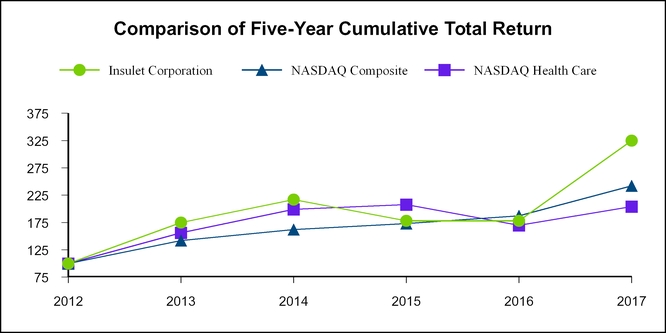
40
|
2012
|
2013
|
2014
|
2015
|
2016
|
2017
|
|||||||||||||
|
Insulet Corporation
|
$
|
100
|
|
$
|
175
|
|
$
|
217
|
|
$
|
178
|
|
$
|
178
|
|
$
|
325
|
|
|
NASDAQ Composite
|
100
|
|
142
|
|
162
|
|
173
|
|
187
|
|
242
|
|
||||||
|
NASDAQ Health Care
|
100
|
|
156
|
|
199
|
|
208
|
|
170
|
|
204
|
|
||||||
The material in this performance graph is not soliciting material, is not deemed filed with the Securities and Exchange Commission (“SEC”) and is not incorporated by reference in any filing of Insulet Corporation under the Securities Act of 1933, as amended (the “Securities Act”) or the Exchange Act of 1934, as amended, whether made on, before or after the date of this filing and irrespective of any general incorporation language in such filing.
Dividend Policy
We currently intend to retain future earnings for the development, operation and expansion of our business and do not anticipate paying any cash dividends in the foreseeable future.
Securities Authorized For Issuance Under Equity Compensation Plans
The following table sets forth information regarding securities authorized for issuance under our equity compensation plans as of December 31,
2017
.
|
Plan Category
|
Number of securities to be
issued upon exercise of
outstanding options,
warrants and rights
(a)
|
Weighted average
exercise price of
outstanding options,
warrants and rights
(b)
|
Number of securities
remaining available for
future issuance under
equity compensation plans
(excluding securities
reflected in column (a))
(c)
|
|||||||
|
Equity compensation plans approved by security holders
(1)
|
3,598,462
|
|
$
|
35.10
|
|
5,058,556
|
|
|||
|
Equity compensation plans not approved by security holders
(2)
|
773,122
|
|
$
|
35.08
|
|
—
|
|
|||
|
Total
(4)
|
4,371,584
|
|
$
|
35.10
|
|
5,058,556
|
|
(3)
|
||
(1)
Includes our Amended and Restated 2007 Stock Option and Incentive Plan. Outstanding restricted stock units convert to common stock without the payment of consideration. As of December 31,
2017
, 860,123 restricted stock units were outstanding. The weighted-average exercise price of outstanding options as of such date issued under these Plans (excluding restricted stock units) was $32.76.
(2)
Consists of the following inducement grants made to certain executive officers upon their initial hire by us:
|
•
|
one inducement grant of 499,468 shares of non-qualified stock option awards made to Patrick J. Sullivan upon being hired by us in September 2014;
|
|
•
|
one inducement grant of 26,756 non-qualified stock options made to Bradley Thomas upon being hired by us in November 2014;
|
|
•
|
one inducement grant of 79,936 non-qualified stock options and 56,965 restricted stock units (37,976 of which have vested as of December 31, 2017) made to Shacey Petrovic upon being hired by us in February 2015;
|
|
•
|
one inducement grant of 58,852 non-qualified stock options and 43,028 restricted stock units (28,685 of which have vested as of December 31, 2017) made to Michael Levitz upon being hired by us in May 2015;
|
|
•
|
one inducement grant of 29,581 non-qualified stock options and 21,627 restricted stock units (14,418 of which have vested as of December 31, 2017) made to David Colleran upon being hired by us in June 2015; and
|
|
•
|
one inducement grant of 30,511 non-qualified stock options and 22,431 restricted stock units (14,954 of which have vested as of December 31, 2017) made to Michael Spears upon being hired by us in July 2015.
|
These non-qualified stock option awards and restricted stock units were granted outside of our Amended and Restated 2007 Stock Option and Incentive Plan in compliance with Nasdaq Listing Rule 5635.
(3)
The maximum number of shares of our common stock that remain available for future issuance under our 2017 Stock Option and Incentive Plan as of December 31,
2017
is
5,058,556
shares.
(4)
As of December 31,
2017
,
994,364
restricted stock units were outstanding. The weighted-average exercise price of outstanding options as of such date issued as inducement grants was $35.08.
For more information relating to our equity compensation plans, see footnote
13
to our consolidated financial statements.
Issuer Repurchases of Equity Securities
We did not repurchase any of our equity securities during the quarter ended December 31,
2017
, nor issue any securities that were not registered under Securities Act.
41
Purchases of Equity Securities by the Issuer and Affiliated Purchasers
None.
|
|
Years Ended December 31,
|
||||||||||||||||||
|
(In thousands, except share and per share data)
|
2017
|
2016
|
2015
|
2014
|
2013
|
||||||||||||||
|
Consolidated Statements of Operations Data:
|
|||||||||||||||||||
|
Revenue
|
$
|
463,768
|
|
$
|
366,989
|
|
$
|
263,893
|
|
$
|
231,321
|
|
$
|
185,139
|
|
||||
|
Cost of revenue
|
186,599
|
|
155,903
|
|
130,622
|
|
104,195
|
|
95,364
|
|
|||||||||
|
Gross profit
|
277,169
|
|
211,086
|
|
133,271
|
|
127,126
|
|
89,775
|
|
|||||||||
|
Operating expenses:
|
|||||||||||||||||||
|
Research and development
|
74,452
|
|
55,710
|
|
43,208
|
|
27,900
|
|
21,765
|
|
|||||||||
|
Sales and marketing
|
121,617
|
|
94,483
|
|
78,407
|
|
50,552
|
|
45,176
|
|
|||||||||
|
General and administrative
(1)
|
88,487
|
|
71,597
|
|
60,392
|
|
57,548
|
|
49,509
|
|
|||||||||
|
Total operating expenses
|
284,556
|
|
221,790
|
|
182,007
|
|
136,000
|
|
116,450
|
|
|||||||||
|
Operating loss
|
(7,387
|
)
|
(10,704
|
)
|
(48,736
|
)
|
(8,874
|
)
|
(26,675
|
)
|
|||||||||
|
Interest expense and other, net
(3)
|
(19,187
|
)
|
(16,114
|
)
|
(12,654
|
)
|
(39,006
|
)
|
(15,783
|
)
|
|||||||||
|
Loss from continuing operations before income taxes
|
(26,574
|
)
|
(26,818
|
)
|
(61,390
|
)
|
(47,880
|
)
|
(42,458
|
)
|
|||||||||
|
Income tax expense (benefit)
|
257
|
|
392
|
|
212
|
|
60
|
|
22
|
|
|||||||||
|
Net loss from continuing operations
|
(26,831
|
)
|
(27,210
|
)
|
(61,602
|
)
|
(47,940
|
)
|
(42,480
|
)
|
|||||||||
|
Loss from discontinued operations, net of tax
(2)
|
—
|
|
(1,669
|
)
|
(11,918
|
)
|
(3,560
|
)
|
(2,494
|
)
|
|||||||||
|
Net loss
|
$
|
(26,831
|
)
|
$
|
(28,879
|
)
|
$
|
(73,520
|
)
|
$
|
(51,500
|
)
|
$
|
(44,974
|
)
|
||||
|
Net loss per share basic and diluted:
|
|||||||||||||||||||
|
Net loss from continuing operations per share
|
(0.46
|
)
|
(0.48
|
)
|
(1.08
|
)
|
(0.86
|
)
|
(0.78
|
)
|
|||||||||
|
Net loss from discontinued operations per share
|
—
|
|
(0.03
|
)
|
(0.21
|
)
|
(0.06
|
)
|
(0.05
|
)
|
|||||||||
|
Weighted-average number of shares used in calculating net loss per share
|
58,003,434
|
|
57,251,377
|
|
56,785,646
|
|
55,628,542
|
|
54,010,887
|
|
|||||||||
|
|
As of December 31,
|
||||||||||||||||||
|
(In thousands)
|
2017
|
2016
|
2015
|
2014
|
2013
|
||||||||||||||
|
Consolidated Balance Sheets Data:
|
|||||||||||||||||||
|
Cash and cash equivalents
|
$
|
272,577
|
|
$
|
137,174
|
|
$
|
122,672
|
|
$
|
151,193
|
|
$
|
149,727
|
|
||||
|
Short-term investments
|
$
|
167,479
|
|
$
|
161,396
|
|
$
|
—
|
|
$
|
—
|
|
$
|
—
|
|
||||
|
Working capital
|
$
|
451,146
|
|
$
|
314,263
|
|
$
|
125,605
|
|
$
|
163,900
|
|
$
|
155,824
|
|
||||
|
Long-term investments
|
$
|
125,549
|
|
$
|
—
|
|
$
|
—
|
|
$
|
—
|
|
$
|
—
|
|
||||
|
Total assets
|
$
|
816,744
|
|
$
|
456,647
|
|
$
|
275,126
|
|
$
|
297,182
|
|
$
|
286,541
|
|
||||
|
Current portion of long-term debt and capital lease obligations
|
$
|
—
|
|
$
|
269
|
|
$
|
5,519
|
|
$
|
3,380
|
|
$
|
2,637
|
|
||||
|
Long-term debt and capital lease obligations
(3)
|
$
|
566,173
|
|
$
|
332,768
|
|
$
|
171,967
|
|
$
|
166,283
|
|
$
|
117,627
|
|
||||
|
Other long-term liabilities
|
$
|
6,030
|
|
$
|
5,032
|
|
$
|
3,952
|
|
$
|
2,774
|
|
$
|
1,943
|
|
||||
|
Total stockholders’ equity
|
$
|
158,516
|
|
$
|
63,150
|
|
$
|
34,051
|
|
$
|
83,829
|
|
$
|
124,597
|
|
||||
|
(1)
|
Includes a charge of $6.1 million related to in-process internally developed software in 2016.
|
|
(2)
|
Includes an impairment charge of $9.0 million in 2015 related to the impairment of the Neighborhood Diabetes asset group. See Note 19 to our consolidated financial statements included in this Annual Report on Form 10-K.
|
42
|
(3)
|
In June 2008, we issued and sold $85.0 million principal amount of 5.375% Convertible Senior Notes due June 2013. In June 2011, we issued and sold $143.8 million of 3.75% Convertible Notes due June 2016 and repurchased $70 million in principal of the 5.375% Notes. In June 2014, we issued and sold $201.3 million of 2% Convertible Notes due June 2019 and repurchased $114.9 million in 3.75% Notes. In July 2014, the remaining principal balance of the 3.75% Notes were converted and the principal was settled in cash. In September 2016, we issued $345.0 million of 1.25% Convertible Notes due September 2021 and repurchased $134.2 million in principal of the 2% Notes. In November 2017, we issued $402.5 million of 1.375% Convertible Notes due November 2024 and repurchased $63.4 million in principal of the 2% Notes. See Note
11
to our consolidated financial statements included in this Annual Report on Form 10-K.
|
43
Executive Level Overview
We are primarily engaged in the development, manufacturing and sale of our proprietary Omnipod System, an innovative, discreet and easy-to-use continuous insulin delivery system for people with insulin-dependent diabetes. The Omnipod System features a small, lightweight, self-adhesive disposable tubeless Omnipod device, which is worn on the body for approximately three days at a time, and its wireless companion, the handheld PDM. Conventional insulin pumps require people with insulin-dependent diabetes to learn to use, manage and wear a number of cumbersome components, including up to 42 inches of tubing. In contrast, the Omnipod System features only two discreet, easy-to-use devices that eliminate the need for a bulky pump and tubing, provides for virtually pain-free automated cannula insertion, communicates wirelessly and integrates a blood glucose meter. We believe that the Omnipod System’s unique proprietary design and features allow people with insulin-dependent diabetes to manage their diabetes with unprecedented freedom, comfort, convenience, and ease.
We began commercial sale of the Omnipod System in the United States in 2005. We sell the Omnipod System in the United States through direct sales to customers or through our distribution partners. The Omnipod System is currently available in multiple countries in Europe, as well as Canada and Israel.
In addition to the diabetes market space, we have partnered with pharmaceutical and biotechnology companies that utilize a customized form of the Omnipod System to deliver a drug over a specified interval of time, at a certain administered volume. The majority of our drug delivery revenue currently consists of sales of Amgen's Neulasta Onpro kit.
We are constructing a highly-automated manufacturing facility in Acton, Massachusetts, with planned production out of the facility beginning in early 2019. The facility will also serve as our global headquarters. We expect that the new facility will allow us to lower our manufacturing costs, increase supply redundancy, add capacity closer to our largest customer base and support growth. We expect capital expenditures for the construction of the Acton facility and related equipment purchases will approach $200 million when production begins in 2019 and will be funded by our cash flows from operations and proceeds from our senior convertible debt offerings.
We announced on July 20, 2017 our plans to assume, on July 1, 2018, all commercial activities (including, among other things, distribution, sales, marketing, training and support) of our Omnipod System across Europe following the expiration of our distribution agreement with our European distributor on June 30, 2018. Once we assume commercial activities following the expiration of the current distribution agreement, we expect our revenue and gross margins to increase, as average customer pricing in Europe is higher than the current distributor pricing to our European distributor. Throughout 2018, we expect to incur increased operating expenses as we invest in our European operations. Once European operations are established, excluding nonrecurring transition-related costs, we expect that the assumption of direct distribution will be accretive to our consolidated results of operations.
Highlights and Recent Developments:
|
•
|
In January 2018, we announced that CMS has issued guidance clarifying that Medicare Part D Plan Sponsors are permitted to provide coverage for products such as the Omnipod System under the Medicare Part D (prescription drug) program. The CMS guidance empowers us to begin working with Medicare Part D carriers to ensure beneficiaries living with diabetes have access to the Omnipod System. Securing Medicare Part D coverage also provides us with a direct pathway to gain Medicaid coverage at the state level, as many state-run Medicaid programs follow CMS prescription drug guidance to determine coverage. This allows access for lower-income individuals and families on Medicaid for whom Omnipod currently is not a covered option. The Company estimates that obtaining Medicare and Medicaid coverage extends Omnipod System coverage access to approximately 450,000 additional individuals with Type 1 diabetes in the United States.
|
|
•
|
Also in January 2018, we submitted a premarket notification 510(k) to the FDA requesting clearance for commercial distribution of our DASH
TM
System, which is our next generation of the Omnipod System, featuring a secured Bluetooth Low Energy enabled Pod and PDM with a touch screen color user interface
|
44
supported by smartphone connectivity. Upon clearance, we would begin a limited commercial release of the product prior to a full market launch.
|
•
|
In November 2017, we issued and sold $402.5 million in principal amount of 1.375% Convertible Senior Notes due in 2024 and repurchased $63.4 million in principal amount of our 2.0% Convertible Senior Notes due in 2019.
|
|
•
|
In July 2017, we announced plans to assume distribution and commercial support for the Omnipod System in Europe as further discussed above. We believe that our strategy of accessing our customers directly in Europe will allow us to have better control over existing and future markets, be closer to our customers, gain a better understanding of innovation needs specific to the European market, and expand our customer base.
|
|
•
|
During 2017, we began construction of our new, highly-automated U.S. manufacturing facility in Acton, Massachusetts. We believe that this manufacturing facility will allow us to lower our manufacturing costs, increase supply redundancy, add capacity closer our growing U.S. customer base and support our growth. The facility will also serve as our global headquarters.
|
2017
Revenue Results:
|
•
|
Total revenue of
$463.8 million
|
|
◦
|
U.S. Omnipod revenue of
$271.6 million
, an
18%
increase year over year
|
|
◦
|
International Omnipod revenue of
$120.0 million
, a
67%
increase year over year
|
|
◦
|
Drug Delivery revenue of
$72.2 million
, an
11%
increase year over year
|
Our long-term financial objective is to achieve and sustain profitable growth. We expect our efforts in
2018
and 2019 to focus primarily on the construction and commissioning of our U.S. manufacturing facility, the establishment of our European operations, the launch of new products, such as the DASH
TM
Omnipod System, continuing our product development efforts, and taking the necessary actions such as amending or creating payor or distributor contracts to allow us to service patients who receive benefits through the Medicare Part D and Medicaid programs. Achieving these objectives is expected to require additional investments in certain personnel and initiatives, as well as enhancements to our supply chain operation capacity, efficiency and effectiveness. We believe that we will continue to incur net losses in the near term in order to achieve these objectives. However, we believe that the accomplishment of our near term objectives will have a positive impact on our financial condition in the future.
Components of Financial Operations
Revenue.
We derive most of our revenue from global sales of the Omnipod System. Our revenue also includes sales of devices based on the Omnipod System technology platform to global pharmaceutical and biotechnology companies for the delivery of subcutaneous drugs across multiple therapeutic areas.
Cost of revenue.
Cost of revenue consists primarily of raw material, labor, warranty, inventory reserve and overhead costs such as freight-in and depreciation, and the cost of products we acquire from third party suppliers.
Research and development.
Research and development expenses consist primarily of personnel costs and outside services within our product development, regulatory and clinical functions, and product development projects. We generally expense research and development costs as incurred.
Sales and marketing.
Sales and marketing expenses consist primarily of personnel costs within our sales, marketing, reimbursement support, customer care and training functions, sales commissions paid to our sales representatives, costs associated with promotional activities and participation in industry trade shows.
General and administrative.
General and administrative expenses consist primarily of salaries and other related costs for personnel serving the executive, finance, legal, information technology and human resource functions, as well as legal fees, accounting fees, insurance costs, bad debt expenses, shipping, handling and facilities-related costs.
45
Results of Operations
This section discusses our consolidated results of operations for
2017
compared to
2016
, as well as
2016
compared to
2015
, and should be read in conjunction with the consolidated financial statements and accompanying notes included under Item 8 of this Form 10-K.
|
TABLE 1: RESULTS OF OPERATIONS
|
|||||||||||||||||||||||||||||
|
Years Ended December 31,
|
Years Ended December 31,
|
||||||||||||||||||||||||||||
|
(In Thousands)
|
2017
|
2016
|
$ Change
|
% Change
|
2016
|
2015
|
$ Change
|
% Change
|
|||||||||||||||||||||
|
Revenue
|
|
|
|
|
|
|
|
|
|||||||||||||||||||||
|
U.S. Omnipod
|
$
|
271,597
|
|
$
|
229,785
|
|
$
|
41,812
|
|
18
|
%
|
$
|
229,785
|
|
$
|
189,604
|
|
$
|
40,181
|
|
21
|
%
|
|||||||
|
International Omnipod
|
119,953
|
|
71,889
|
|
48,064
|
|
67
|
%
|
71,889
|
|
40,339
|
|
31,550
|
|
78
|
%
|
|||||||||||||
|
Drug Delivery
|
72,218
|
|
65,315
|
|
6,903
|
|
11
|
%
|
65,315
|
|
33,950
|
|
31,365
|
|
92
|
%
|
|||||||||||||
|
Total Revenue
|
463,768
|
|
366,989
|
|
96,779
|
|
26
|
%
|
366,989
|
|
263,893
|
|
103,096
|
|
39
|
%
|
|||||||||||||
|
Cost of revenue
|
186,599
|
|
155,903
|
|
30,696
|
|
20
|
%
|
155,903
|
|
130,622
|
|
25,281
|
|
19
|
%
|
|||||||||||||
|
Gross profit
|
277,169
|
|
211,086
|
|
66,083
|
|
31
|
%
|
211,086
|
|
133,271
|
|
77,815
|
|
58
|
%
|
|||||||||||||
|
Gross margin
|
59.8
|
%
|
57.5
|
%
|
|
|
2.3
|
57.5
|
%
|
50.5
|
%
|
|
|
7
|
|||||||||||||||
|
Operating expenses:
|
|||||||||||||||||||||||||||||
|
Research and development
|
74,452
|
|
55,710
|
|
18,742
|
|
34
|
%
|
55,710
|
|
43,208
|
|
12,502
|
|
29
|
%
|
|||||||||||||
|
Sales and marketing
|
121,617
|
|
94,483
|
|
27,134
|
|
29
|
%
|
94,483
|
|
78,407
|
|
16,076
|
|
21
|
%
|
|||||||||||||
|
General and administrative
|
88,487
|
|
71,597
|
|
16,890
|
|
24
|
%
|
71,597
|
|
60,392
|
|
11,205
|
|
19
|
%
|
|||||||||||||
|
Total operating expenses
|
284,556
|
|
221,790
|
|
62,766
|
|
28
|
%
|
221,790
|
|
182,007
|
|
39,783
|
|
22
|
%
|
|||||||||||||
|
Operating loss
|
(7,387
|
)
|
(10,704
|
)
|
(3,317
|
)
|
(31
|
)%
|
(10,704
|
)
|
(48,736
|
)
|
(38,032
|
)
|
(78
|
)%
|
|||||||||||||
|
Interest expense and other, net
|
(19,187
|
)
|
(16,114
|
)
|
(3,073
|
)
|
19
|
%
|
(16,114
|
)
|
(12,654
|
)
|
(3,460
|
)
|
27
|
%
|
|||||||||||||
|
Loss from continuing operations before income taxes
|
(26,574
|
)
|
(26,818
|
)
|
(244
|
)
|
(1
|
)%
|
(26,818
|
)
|
(61,390
|
)
|
(34,572
|
)
|
(56
|
)%
|
|||||||||||||
|
Income tax expense
|
257
|
|
392
|
|
(135
|
)
|
(34
|
)%
|
392
|
|
212
|
|
180
|
|
85
|
%
|
|||||||||||||
|
Net loss from continuing operations
|
(26,831
|
)
|
(27,210
|
)
|
(379
|
)
|
(1
|
)%
|
(27,210
|
)
|
(61,602
|
)
|
(34,392
|
)
|
(56
|
)%
|
|||||||||||||
|
Loss from discontinued operations, net of tax
|
—
|
|
(1,669
|
)
|
(1,669
|
)
|
(100
|
)%
|
(1,669
|
)
|
(11,918
|
)
|
(10,249
|
)
|
(86
|
)%
|
|||||||||||||
|
Net loss
|
$
|
(26,831
|
)
|
$
|
(28,879
|
)
|
$
|
2,048
|
|
(7
|
)%
|
$
|
(28,879
|
)
|
$
|
(73,520
|
)
|
$
|
44,641
|
|
(61
|
)%
|
|||||||
Comparison of the Years Ended December 31,
2017
and December 31,
2016
Revenue
Our total revenue increased to
$463.8 million
, up
$96.8 million
, or
26%
, in
2017
compared to
2016
, due to strong growth in our International Omnipod revenue, our U.S. Omnipod revenue and our on-body injection device for drug delivery. Our International Omnipod revenue increased to
$120.0 million
, up
$48.1 million
, or
67%
, primarily due to growth in distributor sales from continued adoption in existing and newer markets within Europe such as France. Our U.S. Omnipod revenue increased to
$271.6 million
, up
$41.8 million
, or
18%
, primarily due to growth in our installed base as we continue to expand awareness of the Omnipod System. Our drug delivery revenue increased to
$72.2 million
, up
$6.9 million
, or
11%
, due to growth in demand for our primary drug delivery device on greater market adoption of Amgen's Neulasta Onpro kit.
For
2018
, we expect strong revenue growth driven by our expansion in the U.S. and internationally, as well as the transition to direct distribution of our Omnipod System across Europe following the expiration of our global distribution agreement with our European distributor on June 30, 2018, partially offset by lower drug delivery revenue.
Cost of Revenue
Cost of revenue increased to
$186.6 million
, up
$30.7 million
, or
20%
, in
2017
compared to
2016
, primarily due to an increase in sales volumes, partially offset by improvements in supply chain operations in 2017.
46
Gross Margin
Gross margin increased to
59.8%
, up approximately
2.3
points, in
2017
compared to
2016
. The increase in gross margin was primarily due to improvements in supply chain operations, partially offset by the unfavorable mix impact of higher distributor sales in Europe. For
2018
, we expect gross margin to increase as compared to 2017 primarily due to improvements in supply chain operations and our assumption of distribution of our Omnipod System in Europe in the second half of 2018
.
Research and Development
Research and development expenses increased to
$74.5 million
, up
$18.7 million
, or
34%
, in
2017
compared to
2016
. The increase in research and development expenses in the current period was primarily due to an increase in expenses related to our development projects, including our digital mobile Omnipod platform, which involves interaction with continuous glucose monitoring technology, our concentrated insulin program and our artificial pancreas program. For
2018
, we expect overall research and development spending to increase as compared to 2017 primarily due to the development efforts on our ongoing projects.
Sales and Marketing
Sales and marketing expenses increased to
$121.6 million
, up
$27.1 million
, or
29%
, for
2017
, compared to
2016
. The increase in sales and marketing expenses in the current period was primarily due increased personnel-related expenses associated with the expansion of our customer support, market access and sales force personnel, investments to support our assumption in mid-2018 of direct commercial support for Omnipod in Europe, and increased advertising expenses associated with direct to patient marketing activities. We expect sales and marketing expenses in
2018
to increase as compared to 2017 due to the expansion of our sales force and customer support personnel and establishment of direct commercial operations in Europe.
General and Administrative
General and administrative expenses increased to
$88.5 million
, up
$16.9 million
, or
24%
, for
2017
, compared to
2016
. The increase in general and administrative expenses in the current period was primarily attributable to increased personnel-related costs and fees related to external consultants and professional service providers to support the growth in our business. For
2018
, we expect overall general and administrative expenses to increase as compared to 2017 as we continue to grow the business and make investments in our operating structure to support continued growth as well as the establishment of direct commercial operations in Europe.
Interest Expense and Other, Net
Interest expense and other, net, increased to
$19.2 million
, up
$3.1 million
, or
19%
, for
2017
, compared to
2016
. The increase in interest expense and other, net, in the current period was primarily due to a net increase in our outstanding long-term debt, partially offset by lower losses on the extinguishment of debt in 2017. Non-cash interest expense, which includes the amortization of deferred financing and debt issuance costs, increased
$7.9 million
and cash interest expense increased
$1.8 million
in 2017 as compared to 2016. These increases were partially offset by a
$1.9 million
reduction in losses on the extinguishment of debt in 2017, higher capitalization of interest, and higher interest income. We expect that our interest expense and other, net, will increase in 2018 compared to the prior year primarily due to an increase in non-cash interest expense associated with the issuance in November 2017 of our 1.375% Notes, partially offset by higher capitalization of interest due to increased capital expenditures associated with the construction of our Acton, Massachusetts facility.
Income Tax Expense
Income tax expense was not material to our results of operations in the years 2017 or 2016 as we have generated net operating losses to date and have fully reserved our net operating loss carryforwards. For more information on our income tax expense, please refer to Note 15 to the consolidated financial statements.
47
Comparison of the Years Ended December 31,
2016
and December 31,
2015
Revenue
Our total revenue increased to
$367.0 million
, up
$103.1 million
, or
39%
, in
2016
, compared to
2015
, primarily due to strong growth in our U.S. Omnipod revenue, International Omnipod revenue and our on-body injection device for drug delivery. Our U.S. Omnipod revenue increased to
$229.8 million
, up
$40.2 million
, or
21%
, primarily due to growth in our installed base of Omnipod users which was greatly driven by the expansion in 2015 and 2016 of our sales force and customer support personnel and strategic initiatives introduced in mid-2015 to expand awareness of the Omnipod System. The results for 2015 were also partially impacted by unfavorable distributor ordering patterns in the first quarter of 2015 which stabilized thereafter. Our International Omnipod revenue increased to
$71.9 million
, up
$31.6 million
, or
78%
, primarily due to growth in distributor sales from continued adoption in existing markets and to a lesser extent from entry into new markets. The results for 2015 included lower International Omnipod sales which partially resulted from unfavorable distributor ordering patterns in the first and second quarters of 2015, which stabilized thereafter. Our drug delivery revenue increased to
$65.3 million
, up
$31.4 million
due to strong growth in demand for our primary drug delivery device following regulatory approval in December 2014.
Cost of Revenue
Cost of revenue increased to
$155.9 million
, up
$25.3 million
, or
19%
, in
2016
compared to
2015
, primarily due to an increase in sales volumes, partially offset by $11.5 million of costs incurred during 2015 that were considered non-recurring in nature, along with supply chain operation efficiency and effectiveness improvements made in 2016.
Gross Margin
Gross margin increased to 57.5%, up approximately 7 points, in 2016 compared to 2015, primarily due to $11.5 million of costs incurred in 2015 that were considered non-recurring in nature, along with supply chain operation efficiencies and effectiveness improvements made in 2016.
Research and Development
Research and development expenses increased to
$55.7 million
, up
$12.5 million
, or
29%
, in
2016
compared to
2015
, primarily due to an increase in expenses related to our development projects, including our mobile application development which involves interaction with continuous glucose monitoring technology, artificial pancreas program, development efforts with Eli Lilly and Company for the use of concentrated insulin for patients with higher insulin-resistance and other Omnipod product improvement initiatives.
Sales and Marketing
Sales and marketing expenses increased to
$94.5 million
, up
$16.1 million
, or
21%
, for
2016
compared to
2015
, primarily due to an increase of $16.0 million in personnel-related expenses, including increased incentive compensation costs resulting from growth in the business, as well as costs associated with the expansion in 2015 of our sales force and customer support personnel.
General and Administrative
General and administrative expenses increased to
$71.6 million
, up
$11.2 million
, or
19%
, for
2016
compared to
2015
. This increase includes a charge of $6.1 million related to in-process internally developed software recorded in the fourth quarter of 2016 due to a change in our longer-term enterprise resource planning system requirements. In addition, the increase was also due to a $4.6 million increase that was primarily attributable to personnel-related costs on higher incentive compensation associated with growth in our business, as well as additional staff to support our growth expectations and fees paid for external consultants.
Interest Expense and Other, Net
Interest expense and other income, net increased to
$16.1 million
, up
$3.5 million
, or
27%
for
2016
compared to
2015
, due to $3.0 million of net additional interest expense associated with the issuance of the 1.25% Notes and a $2.6 million charge recorded for the extinguishment of debt related to the repurchase of $134.2 million in principal of the 2% Notes. This was partially offset from a slight decrease in capital lease interest expense.
Income Tax Expense
Income tax expense was not material to our results of operations in the years 2016 or 2015. For more information on our income tax expense, please refer to Note 15 to the consolidated financial statements.
48
Loss from Discontinued Operations, Net of Tax
The loss from discontinued operations decreased by approximately $10.2 million in 2016, compared to the year ended December 31, 2015. This decrease was primarily the result of a $9.1 million impairment charge recorded in the fourth quarter of 2015 for the long-lived assets of Neighborhood Diabetes which we sold in February 2016. As the Neighborhood Diabetes business was sold in February 2016, 2016 includes less than two months of full operations compared to a full year for 2015.
Liquidity and Capital Resources
As of December 31,
2017
, we had
$272.6 million
in cash and cash equivalents and
$293.0 million
in short-term and long-term investments. We believe that our current liquidity will be sufficient to meet our projected operating, investing and debt service requirements for at least the next twelve months.
To lower our manufacturing costs, increase supply redundancy, add capacity closer to our largest customer base and support growth, we are constructing a highly-automated manufacturing facility in Acton, Massachusetts, with planned production out of the facility beginning in 2019. This facility will also serve as our global headquarters. As a result, capital expenditures have increased above historic levels to fund the construction of the Acton facility and related equipment purchases. As of December 31, 2017, investments in construction-in-progress related to the Acton facility were approximately $70 million. We expect that capital expenditures for this facility will approach $200 million when production begins in 2019.
In connection with our plans to assume, on July 1, 2018, all commercial activities of our Omnipod System across Europe following the expiration of our distribution agreement with our European distributor on June 30, 2018, we will be required to pay to the European distributor a per unit fee for sales of our Omnipod device, over the twelve months following the expiration of the global distribution agreement, to identified customers (as that term is defined in the distribution agreement) of the European distributor who had previously entered into an agreement with the distributor for the purchase of Omnipod devices. While the actual total fee could vary significantly, we estimate that the total fee could be in the range of approximately $10 million to $55 million. The fee will be determined and paid on a quarterly basis following the expiration of the distribution agreement and the actual amount of the fee will depend on a number of factors and will not be known until the number of qualifying sales of Omnipod devices is determined following each quarter beginning with the quarter ending September 30, 2018.
Convertible Senior Notes
In order to finance our operations and global expansion, we have periodically issued and sold Convertible Senior Notes, which are convertible into our common stock. As of December 31, 2017, the following Notes were outstanding:
|
Issuance Date
|
Coupon
|
Principal Outstanding (in thousands)
|
Due Date
|
Initial Conversion Rate per Share of Common Stock
|
Conversion Price per Share of Common Stock
|
||
|
June 2014
|
2.000%
|
$
|
3,664
|
|
June 15, 2019
|
21.5019
|
$46.51
|
|
September 2016
|
1.250%
|
345,000
|
|
September 15, 2021
|
17.1332
|
$58.37
|
|
|
November 2017
|
1.375%
|
402,500
|
|
November 15, 2024
|
10.7315
|
$93.18
|
|
|
Total
|
$
|
751,164
|
|
||||
Additional information regarding our debt issuances is provided in Note
11
to the consolidated financial statements included under Item 8 of this Form 10-K.
Capital Leases
As of December 31,
2017
, we had no capital leases outstanding.
49
|
Summary of Cash Flows
|
Years Ended December 31,
|
|||||||||||
|
(In thousands)
|
2017
|
2016
|
2015
|
|||||||||
|
Cash provided by (used in):
|
||||||||||||
|
Operating activities
|
$
|
41,207
|
|
$
|
15,911
|
|
$
|
(12,552
|
)
|
|||
|
Investing activities
|
(210,797
|
)
|
(178,010
|
)
|
(15,323
|
)
|
||||||
|
Financing activities
|
304,547
|
|
176,567
|
|
(371
|
)
|
||||||
|
Effect of exchange rate changes on cash
|
446
|
|
34
|
|
(275
|
)
|
||||||
|
Net increase (decrease) in cash and cash equivalents
|
$
|
135,403
|
|
$
|
14,502
|
|
$
|
(28,521
|
)
|
|||
Included in our summary of cash flows for the years ended December 31, 2016 and 2015 are the results of our discontinued operations. Additional information regarding our discontinued operations is provided in Note 19 to the consolidated financial statements included under Item 8 of this Form 10-K.
Operating Activities
Our net cash provided by operating activities for the year ended December 31,
2017
was
$41.2 million
compared to net cash provided by operating activities of
$15.9 million
in the same period of
2016
, an increase of
$25.3 million
year over year. The increase in cash provided by operating activities in the current period is primarily due to reductions in working capital (excluding cash and cash equivalents and short-term investments) in the current period as compared to investments in working capital in 2016, which included additional inventory purchases in order to support customer demand. Reductions in working capital in the current period were primarily due to increases in accounts payable, accrued expenses and other liabilities, partially offset by increases in account receivable due to the growth of our business.
Our net cash provided by operating activities was
$15.9 million
for the year ended December 31,
2016
compared to net cash used in operating activities of
$12.6 million
in the same period in
2015
. The increase was primarily due to a lower net loss recorded for the year and improved customer collections, partially offset by timing of cash disbursements and additional inventory purchases in order to support customer demand and to allow for alternative shipping methods.
Investing Activities
Net cash used in investing activities for the year ended December 31,
2017
was
$210.8 million
compared to net cash used in investing activities of
$178.0 million
in
2016
, an increase of
$32.8 million
. The increase in investing activities in the current period is primarily due to an increase in capital expenditures, which were
$77.2 million
in 2017 compared to $22.1 million in 2016, primarily associated with the construction of our manufacturing facility in Acton, Massachusetts, partially offset by fewer net investments in marketable securities in the current period.
Net cash used in investing activities in the year ended December 31,
2016
was
$178.0 million
compared to
$15.3 million
in the same period of
2015
. In the year ended December 31, 2016, we invested $161.6 million in marketable securities (net of proceeds from redemptions and sales) driven by the net proceeds from the issuance of our 1.25% Notes. There were no such investments in 2015. In addition, the increase in investing activities related to higher capital expenditures of $22.1 million in 2016 compared to $10.6 million in 2015, primarily associated with investments in supply chain operations including $10.7 million for equipment in process of construction to support our U.S. manufacturing initiatives.
Financing Activities
Net cash provided by financing activities for the year ended December 31,
2017
was
$304.5 million
compared to
$176.6 million
in net cash provided by financing activities in
2016
, an increase of
$127.9 million
. The increase was primarily attributable to net proceeds of
$391.6 million
in November 2017 from the issuance of our 1.375% Notes as compared to $333.7 million of net proceeds from the issuance in 2016 of our 1.25% Notes, and lower repayments to retire outstanding debt in the current period as compared to 2016. In November 2017, we made payments of
$98.6 million
to extinguish
$63.4 million
of our outstanding 2% Notes as compared to $153.6 million of payments to extinguish a portion of our 2% Notes in 2016.
Net cash provided by financing activities in the year ended December 31,
2016
was
$176.6 million
compared to
$0.4 million
in net cash used in financing activities in the same period of
2015
. The increase was primarily
50
attributable to net proceeds of $333.7 million in September 2016 from the issuance of our 1.25% Notes, offset by repayments of $153.6 million to extinguish $134.2 million, or approximately 67%, of our outstanding 2% Notes.
Commitments and Contingencies
We lease facilities in Massachusetts, California, Tennessee, the United Kingdom, Canada and China. These leases are accounted for as operating leases and generally provide for a base rent plus real estate taxes and certain operating expenses related to the leases. Certain of our operating lease agreements contain scheduled rent increases. Rent expense is recorded using the straight-line method and deferred rent is included in other liabilities in the accompanying consolidated balance sheets.
The following table summarizes our principal obligations as of December 31,
2017
:
|
(In millions)
|
||||||||||||||||||||||||||||
|
Contractual Obligations
(3)
|
Total
|
2018
|
2019
|
2020
|
2021
|
2022
|
Later
|
|||||||||||||||||||||
|
Operating lease obligations
|
$
|
13.1
|
|
$
|
3.0
|
|
$
|
3.0
|
|
$
|
2.6
|
|
$
|
2.4
|
|
$
|
2.1
|
|
$
|
—
|
|
|||||||
|
Debt obligations: principal
(1)
|
751.2
|
|
—
|
|
3.7
|
|
—
|
|
345.0
|
|
—
|
|
402.5
|
|
||||||||||||||
|
Debt obligations: cash interest
(1)
|
54.1
|
|
9.9
|
|
9.9
|
|
9.8
|
|
8.6
|
|
5.5
|
|
10.4
|
|
||||||||||||||
|
Purchase obligations
(2)
|
140.9
|
|
128.3
|
|
12.6
|
|
—
|
|
—
|
|
—
|
|
—
|
|
||||||||||||||
|
Total contractual obligations
|
$
|
959.3
|
|
$
|
141.2
|
|
$
|
29.2
|
|
$
|
12.4
|
|
$
|
356.0
|
|
$
|
7.6
|
|
$
|
412.9
|
|
|||||||
|
(1)
|
Debt obligations include principal and cash interest. Our senior convertible notes incur annual interest of 2%, 1.25% and 1.375%.
|
|
(2)
|
Our purchase obligations include commitments with certain of our suppliers, primarily for the purchase of Omnipod System components and manufacturing equipment along with other commitments to purchase goods or services in the normal course of business. We make such commitments through a combination of purchase orders, supplier contracts, and open orders based on projected demand information. These amounts include approximately $58.0 million of commitments with three major suppliers for the construction of our Acton, Massachusetts manufacturing facility and the establishment of highly-automated manufacturing operations.
|
|
(3)
|
The contractual obligations table excludes a fee that we will be required to pay to our European distributor following the expiration of our global distribution agreement on June 30, 2018. The actual amount of the fee is uncertain and is dependent on a number of factors.
|
Legal Proceedings
The significant estimates and judgments related with establishing litigation reserves are discussed under "Legal Proceedings" in Note
12
of the consolidated financial statements included under Item 8 of this Form 10-K.
Off-Balance Sheet Arrangements
As of December 31,
2017
, we did not have any off-balance sheet financing arrangements.
Critical Accounting Policies and Estimates
Our financial statements are based on the selection and application of generally accepted accounting principles, which require us to make estimates and assumptions about future events that affect the amounts reported in our financial statements and the accompanying notes. Future events and their effects cannot be determined with certainty. Therefore, the determination of estimates requires the exercise of judgment. Actual results could differ from those estimates, and any such differences may be material to our financial statements.
Based on the sensitivity of reported financial statement amounts to the underlying estimates and assumptions, the relatively more significant accounting policies applied by us have been identified by management as those associated with the following:
•
Revenue recognition
•
Fair value measurements
•
Accounts receivable and allowance for doubtful accounts
•
Inventories
51
•
Product warranty costs
•
Convertible debt
•
Commitments and contingencies
•
Stock-based compensation
Additional information on our critical accounting estimates and significant accounting policies, including references to applicable footnotes, is provided in Note
2
to the consolidated financial statements included under Item 8 of this Form 10-K.
Recent Accounting Pronouncements
Information with respect to recent accounting developments is provided in Note
2
to the consolidated financial statements included under Item 8 of this Form 10-K.
52
We do not use derivative financial instruments in our investment portfolio and have no foreign exchange contracts.
Our financial instruments consist of cash, cash equivalents, short-term and long-term investments, accounts receivable, accounts payable, accrued expenses, debt and long-term obligations. We consider investments that, when purchased, have a remaining maturity of 90 days or less to be cash equivalents.The primary objectives of our investment strategy are to preserve principal, maintain proper liquidity to meet operating needs and maximize yields. To minimize our exposure to an adverse shift in interest rates, we invest in cash equivalents, short-term and long-term marketing securities. We do not believe that a 10% change in interest rates would have a material impact on the fair value of our investment portfolio or our interest income.
As of December 31,
2017
, we had outstanding debt recorded on our consolidated balance sheet of
$566.2 million
, net of deferred financing costs and unamortized debt discount totaling
$185.0 million
, related to our Convertible Senior Notes. As the interest rates are fixed and the notes are not carried at fair value, changes in interest rates do not affect the value of our debt.
Our business is subject to risks, including, but not limited to: unique economic conditions, changes in political climate, differing tax structures, other regulations and restrictions, and foreign exchange rate volatility. We are primarily exposed to currency exchange rate fluctuations related to our subsidiary operation in Canada and, to a lesser extent, Europe. Currently, the majority of our sales outside of the U.S. are transacted in U.S. dollars and are not subject to material foreign currency fluctuations. We expect that as we establish our commercial operations in Europe during 2018 that our business will become more susceptible to foreign exchange rate volatility, primarily related to the Euro and the British Pound.
Fluctuations in foreign currency rates could affect our sales, cost of goods and operating margins and could result in exchange losses. In addition, currency devaluations can result in a loss if we hold deposits of that currency. A hypothetical 10% increase or decrease in foreign currencies that we transact in would not have a material adverse impact on our cash flows, financial condition or results of operations.
Our financial statements as of December 31,
2017
and
2016
and for each of the three years in the period ended December 31,
2017
, and the Reports of the Registered Independent Public Accounting Firms are included in this report as listed in the index.
|
INDEX TO CONSOLIDATED FINANCIAL STATEMENTS
|
|
53
Report of Independent Registered Public Accounting Firm
Board of Directors and Shareholders
Insulet Corporation
Opinion on the financial statements
We have audited the accompanying consolidated balance sheets of Insulet Corporation (a Delaware corporation) and subsidiaries (the “Company”) as of December 31,
2017
and 2016, the related consolidated statements of operations, comprehensive loss, shareholders’ equity, and cash flows for each of the two years in the period ended December 31,
2017
, and the related notes and schedule (collectively referred to as the "financial statements"). In our opinion, the financial statements present fairly, in all material respects, the financial position of the Company as of December 31, 2017 and 2016, and the results of its operations and its cash flows for each of the two years in the period ended December 31, 2017, in conformity with accounting principles generally accepted in the United States of America.
We also have audited, in accordance with the standards of the Public Company Accounting Oversight Board (United States) ("PCAOB"), the Company’s internal control over financial reporting as of December 31, 2017, based on criteria established in the 2013
Internal Control-Integrated Framework
issued by the Committee of Sponsoring Organizations of the Treadway Commission ("COSO"), and our report dated
February 21, 2018
expressed an unqualified opinion.
Basis for opinion
These financial statements are the responsibility of the Company's management. Our responsibility is to express an opinion on the Company's financial statements based on our audits. We are a public accounting firm registered with the PCAOB and are required to be independent with respect to the Company in accordance with the U.S federal securities laws and the applicable rules and regulations of the Securities and Exchange Commission and the PCAOB.
We conducted our audits in accordance with the standards of the PCAOB. Those standards require that we plan and perform the audit to obtain reasonable assurance about whether the financial statements are free of material misstatement, whether due to error or fraud. Our audits included performing procedures to assess the risks of material misstatement of the financial statements, whether due to error or fraud, and performing procedures that respond to those risks. Such procedures included examining, on a test basis, evidence supporting the amounts and disclosures in the financial statements. Our audits also included evaluating the accounting principles used and significant estimates made by management, as well as evaluating the overall presentation of the financial statements. We believe that our audits provide a reasonable basis for our opinion.
/s/ GRANT THORNTON LLP
We have served as the Company's auditor since 2016.
Boston, Massachusetts
February 21, 2018
54
Report of Independent Registered Public Accounting Firm
The Board of Directors and Stockholders of
Insulet Corporation
We have audited the accompanying consolidated statements of operations, comprehensive loss, stockholders' equity and cash flows of Insulet Corporation for the year ended December 31, 2015. Our audit also includes the financial statement schedule listed in the Index at Item 15(a) for the year ended December 31, 2015. These financial statements and schedule are the responsibility of the Company's management. Our responsibility is to express an opinion on these financial statements and schedule based on our audit.
We conducted our audit in accordance with the standards of the Public Company Accounting Oversight Board (United States). Those standards require that we plan and perform the audit to obtain reasonable assurance about whether the financial statements are free of material misstatement. An audit includes examining, on a test basis, evidence supporting the amounts and disclosures in the financial statements. An audit also includes assessing the accounting principles used and significant estimates made by management, as well as evaluating the overall financial statement presentation. We believe that our audit provides a reasonable basis for our opinion.
In our opinion, the financial statements referred to above present fairly, in all material respects, the consolidated results of its operations and its cash flows of Insulet Corporation for the year ended December 31, 2015, in conformity with U.S. generally accepted accounting principles. Also, in our opinion, the related financial statement schedule for the year ended December 31, 2015 when considered in relation to the basic financial statements taken as a whole, presents fairly in all material respects the information set forth therein.
/s/ Ernst & Young LLP
Boston, Massachusetts
February 29, 2016
(except for the effects of discontinued operations as discussed in Note 19 as to which the date is September 6, 2016 and the effects of the adoption of ASU 2016-19 and ASU 2016-18 as discussed in Notes 2 and 7, as to which the date is February 21, 2018 )
55
INSULET CORPORATION
|
December 31,
2017 |
December 31,
2016 |
||||||
|
(In thousands, except share and per share data)
|
|||||||
|
ASSETS
|
|||||||
|
Current Assets
|
|||||||
|
Cash and cash equivalents
|
$
|
272,577
|
|
$
|
137,174
|
|
|
|
Short-term investments
|
167,479
|
|
161,396
|
|
|||
|
Accounts receivable, net
|
53,373
|
|
28,803
|
|
|||
|
Inventories
|
33,793
|
|
35,514
|
|
|||
|
Prepaid expenses and other current assets
|
9,949
|
|
7,073
|
|
|||
|
Total current assets
|
537,171
|
|
369,960
|
|
|||
|
Long-term investments
|
125,549
|
|
—
|
|
|||
|
Property and equipment, net
|
107,864
|
|
44,753
|
|
|||
|
Other intangible assets, net
|
4,351
|
|
2,041
|
|
|||
|
Goodwill
|
39,840
|
|
39,677
|
|
|||
|
Other assets
|
1,969
|
|
216
|
|
|||
|
Total assets
|
$
|
816,744
|
|
$
|
456,647
|
|
|
|
LIABILITIES AND STOCKHOLDERS’ EQUITY
|
|||||||
|
Current Liabilities
|
|||||||
|
Accounts payable
|
$
|
24,413
|
|
$
|
13,160
|
|
|
|
Accrued expenses and other current liabilities
|
59,256
|
|
41,228
|
|
|||
|
Deferred revenue
|
2,356
|
|
1,309
|
|
|||
|
Total current liabilities
|
86,025
|
|
55,697
|
|
|||
|
Long-term debt, net
|
566,173
|
|
332,768
|
|
|||
|
Other long-term liabilities
|
6,030
|
|
5,032
|
|
|||
|
Total liabilities
|
658,228
|
|
393,497
|
|
|||
|
Commitments and contingencies (Note 12)
|
|
|
|||||
|
Stockholders’ Equity
|
|||||||
|
Preferred stock, $.001 par value:
|
|||||||
|
Authorized: 5,000,000 shares at December 31, 2017 and 2016.
Issued and outstanding: zero shares at December 31, 2017 and 2016
|
—
|
|
—
|
|
|||
|
Common stock, $.001 par value:
|
|||||||
|
Authorized: 100,000,000 shares at December 31, 2017 and 2016.
Issued and outstanding: 58,319,348 and 57,457,967 shares at December 31, 2017 and 2016, respectively |
58
|
|
57
|
|
|||
|
Additional paid-in capital
|
866,206
|
|
744,243
|
|
|||
|
Accumulated other comprehensive loss
|
(493
|
)
|
(726
|
)
|
|||
|
Accumulated deficit
|
(707,255
|
)
|
(680,424
|
)
|
|||
|
Total stockholders’ equity
|
158,516
|
|
63,150
|
|
|||
|
Total liabilities and stockholders’ equity
|
$
|
816,744
|
|
$
|
456,647
|
|
|
The accompanying notes are an integral part of these consolidated financial statements.
56
INSULET CORPORATION
|
|
Years Ended December 31,
|
||||||||||
|
(In thousands, except share and per share data)
|
2017
|
2016
|
2015
|
||||||||
|
Revenue
|
$
|
463,768
|
|
$
|
366,989
|
|
$
|
263,893
|
|
||
|
Cost of revenue
|
186,599
|
|
155,903
|
|
130,622
|
|
|||||
|
Gross profit
|
277,169
|
|
211,086
|
|
133,271
|
|
|||||
|
Operating expenses:
|
|||||||||||
|
Research and development
|
74,452
|
|
55,710
|
|
43,208
|
|
|||||
|
Sales and marketing
|
121,617
|
|
94,483
|
|
78,407
|
|
|||||
|
General and administrative
|
88,487
|
|
71,597
|
|
60,392
|
|
|||||
|
Total operating expenses
|
284,556
|
|
221,790
|
|
182,007
|
|
|||||
|
Operating loss
|
(7,387
|
)
|
(10,704
|
)
|
(48,736
|
)
|
|||||
|
Interest expense
|
21,211
|
|
14,388
|
|
12,712
|
|
|||||
|
Interest income and other, net
|
2,633
|
|
825
|
|
58
|
|
|||||
|
Loss on extinguishment of long-term debt
|
609
|
|
2,551
|
|
—
|
|
|||||
|
Interest and other income (expense), net
|
(19,187
|
)
|
(16,114
|
)
|
(12,654
|
)
|
|||||
|
Loss from continuing operations before income taxes
|
(26,574
|
)
|
(26,818
|
)
|
(61,390
|
)
|
|||||
|
Income tax expense
|
257
|
|
392
|
|
212
|
|
|||||
|
Net loss from continuing operations
|
(26,831
|
)
|
(27,210
|
)
|
(61,602
|
)
|
|||||
|
Loss from discontinued operations, net of tax ($408 and $79 for the years ended December 31, 2016 and 2015, respectively)
|
—
|
|
(1,669
|
)
|
(11,918
|
)
|
|||||
|
Net loss
|
$
|
(26,831
|
)
|
$
|
(28,879
|
)
|
$
|
(73,520
|
)
|
||
|
Net loss from continuing operations per share basic and diluted
|
$
|
(0.46
|
)
|
$
|
(0.48
|
)
|
$
|
(1.08
|
)
|
||
|
Net loss from discontinued operations per share basic and diluted
|
$
|
—
|
|
$
|
(0.03
|
)
|
$
|
(0.21
|
)
|
||
|
Weighted-average number of shares used in calculating net loss per share
|
58,003,434
|
|
57,251,377
|
|
56,785,646
|
|
|||||
The accompanying notes are an integral part of these consolidated financial statements.
57
INSULET CORPORATION
CONSOLIDATED STATEMENTS OF COMPREHENSIVE LOSS
|
|
Years Ended December 31,
|
||||||||||
|
(In thousands)
|
2017
|
2016
|
2015
|
||||||||
|
Net loss
|
$
|
(26,831
|
)
|
$
|
(28,879
|
)
|
$
|
(73,520
|
)
|
||
|
Other comprehensive loss, net of tax
|
|||||||||||
|
Foreign currency translation adjustment, net of tax
|
565
|
|
135
|
|
(641
|
)
|
|||||
|
Unrealized loss on available-for-sale securities, net of tax
|
(332
|
)
|
(207
|
)
|
—
|
|
|||||
|
Total other comprehensive income (loss), net of tax
|
233
|
|
(72
|
)
|
(641
|
)
|
|||||
|
Total comprehensive loss
|
$
|
(26,598
|
)
|
$
|
(28,951
|
)
|
$
|
(74,161
|
)
|
||
The accompanying notes are an integral part of these consolidated financial statements.
58
INSULET CORPORATION
CONSOLIDATED STATEMENTS OF STOCKHOLDERS’ EQUITY
|
|
Common Stock
|
Additional
Paid-in
Capital
|
Accumulated
Deficit
|
Accumulated Other Comprehensive Loss
|
Total
Stockholders’
Equity
|
|||||||||||||||||
|
(In thousands, except share data)
|
Shares
|
Amount
|
||||||||||||||||||||
|
Balance, December 31, 2014
|
56,299,022
|
|
$
|
56
|
|
$
|
661,811
|
|
$
|
(578,025
|
)
|
$
|
(13
|
)
|
$
|
83,829
|
|
|||||
|
Exercise of options to purchase common stock
|
449,149
|
|
1
|
|
7,198
|
|
—
|
|
—
|
|
7,199
|
|
||||||||||
|
Issuance for employee stock purchase plan
|
22,039
|
|
—
|
|
652
|
|
—
|
|
—
|
|
652
|
|
||||||||||
|
Stock-based compensation expense
|
—
|
|
—
|
|
19,178
|
|
—
|
|
—
|
|
19,178
|
|
||||||||||
|
Restricted stock units vested, net of shares withheld for taxes
|
184,620
|
|
—
|
|
(2,646
|
)
|
—
|
|
—
|
|
(2,646
|
)
|
||||||||||
|
Net loss
|
—
|
|
—
|
|
—
|
|
(73,520
|
)
|
—
|
|
(73,520
|
)
|
||||||||||
|
Other comprehensive income
|
(641
|
)
|
(641
|
)
|
||||||||||||||||||
|
Balance, December 31, 2015
|
56,954,830
|
|
57
|
|
686,193
|
|
(651,545
|
)
|
(654
|
)
|
34,051
|
|
||||||||||
|
Exercise of options to purchase common stock
|
242,962
|
|
—
|
|
4,832
|
|
—
|
|
—
|
|
4,832
|
|
||||||||||
|
Issuance for employee stock purchase plan
|
30,949
|
|
—
|
|
802
|
|
—
|
|
—
|
|
802
|
|
||||||||||
|
Stock-based compensation expense
|
—
|
|
—
|
|
23,638
|
|
—
|
|
—
|
|
23,638
|
|
||||||||||
|
Restricted stock units vested, net of shares withheld for taxes
|
229,226
|
|
—
|
|
(2,866
|
)
|
—
|
|
—
|
|
(2,866
|
)
|
||||||||||
|
Allocation to equity for conversion feature on 1.25% Notes, net of issuance costs
|
—
|
|
—
|
|
64,509
|
|
—
|
|
—
|
|
64,509
|
|
||||||||||
|
Extinguishment of conversion feature on 2% Notes, net of issuance costs
|
—
|
|
—
|
|
(32,865
|
)
|
—
|
|
—
|
|
(32,865
|
)
|
||||||||||
|
Net loss
|
—
|
|
—
|
|
—
|
|
(28,879
|
)
|
—
|
|
(28,879
|
)
|
||||||||||
|
Other comprehensive loss
|
(72
|
)
|
(72
|
)
|
||||||||||||||||||
|
Balance, December 31, 2016
|
57,457,967
|
|
57
|
|
744,243
|
|
(680,424
|
)
|
(726
|
)
|
63,150
|
|
||||||||||
|
Exercise of options to purchase common stock
|
505,207
|
|
1
|
|
13,987
|
|
—
|
|
—
|
|
13,988
|
|
||||||||||
|
Issuance for employee stock purchase plan
|
59,134
|
|
—
|
|
1,817
|
|
—
|
|
—
|
|
1,817
|
|
||||||||||
|
Stock-based compensation expense
|
—
|
|
31,941
|
|
—
|
|
—
|
|
31,941
|
|
||||||||||||
|
Restricted stock units vested, net of shares withheld for taxes
|
297,040
|
|
—
|
|
(4,054
|
)
|
—
|
|
—
|
|
(4,054
|
)
|
||||||||||
|
Allocation to equity for conversion feature on 1.375% Notes, net of issuance costs
|
—
|
|
—
|
|
117,458
|
|
—
|
|
—
|
|
117,458
|
|
||||||||||
|
Extinguishment of conversion feature on 2% Notes, net of issuance costs
|
—
|
|
—
|
|
(39,186
|
)
|
—
|
|
—
|
|
(39,186
|
)
|
||||||||||
|
Net loss
|
|
|
|
|
(26,831
|
)
|
|
|
(26,831
|
)
|
||||||||||||
|
Other comprehensive income
|
233
|
|
233
|
|
||||||||||||||||||
|
Balance, December 31, 2017
|
58,319,348
|
|
$
|
58
|
|
$
|
866,206
|
|
$
|
(707,255
|
)
|
$
|
(493
|
)
|
$
|
158,516
|
|
|||||
The accompanying notes are an integral part of these consolidated financial statements.
59
INSULET CORPORATION
|
Years Ended December 31,
|
|||||||||||
|
(In thousands)
|
2017
|
2016
|
2015
|
||||||||
|
Cash flows from operating activities
|
|||||||||||
|
Net loss
|
$
|
(26,831
|
)
|
$
|
(28,879
|
)
|
$
|
(73,520
|
)
|
||
|
Adjustments to reconcile net loss to net cash provided by (used in) operating activities
|
|||||||||||
|
Depreciation and amortization
|
13,854
|
|
13,833
|
|
15,838
|
|
|||||
|
Non-cash interest expense
|
18,008
|
|
10,068
|
|
7,678
|
|
|||||
|
Stock-based compensation expense
|
31,941
|
|
23,617
|
|
19,178
|
|
|||||
|
Loss on extinguishment of long-term debt
|
609
|
|
2,551
|
|
—
|
|
|||||
|
Provision for bad debts
|
1,922
|
|
2,070
|
|
1,184
|
|
|||||
|
Impairments and other
|
89
|
|
6,234
|
|
9,086
|
|
|||||
|
Changes in operating assets and liabilities:
|
|||||||||||
|
Accounts receivable
|
(26,322
|
)
|
12,551
|
|
(9,793
|
)
|
|||||
|
Inventories
|
1,689
|
|
(24,103
|
)
|
(722
|
)
|
|||||
|
Deferred revenue
|
1,061
|
|
(849
|
)
|
809
|
|
|||||
|
Prepaid expenses and other assets
|
(3,328
|
)
|
(2,621
|
)
|
(1,460
|
)
|
|||||
|
Accounts payable, accrued expenses and other current liabilities
|
27,313
|
|
639
|
|
17,986
|
|
|||||
|
Other long-term liabilities
|
1,202
|
|
800
|
|
1,184
|
|
|||||
|
Net cash provided by (used in) operating activities
(1)
|
41,207
|
|
15,911
|
|
(12,552
|
)
|
|||||
|
Cash flows from investing activities
|
|||||||||||
|
Purchases of property, equipment and software
(2)
|
(77,226
|
)
|
(22,115
|
)
|
(10,608
|
)
|
|||||
|
Purchases of investments
|
(297,965
|
)
|
(177,654
|
)
|
—
|
|
|||||
|
Receipts from the maturity or sale of investments
|
164,394
|
|
16,045
|
|
—
|
|
|||||
|
Proceeds from divestiture of business, net
|
—
|
|
5,714
|
|
—
|
|
|||||
|
Acquisition of business
|
—
|
|
—
|
|
(4,715
|
)
|
|||||
|
Net cash used in investing activities
|
(210,797
|
)
|
(178,010
|
)
|
(15,323
|
)
|
|||||
|
Cash flows from financing activities
|
|||||||||||
|
Principal payments of capital lease obligations
|
(269
|
)
|
(5,518
|
)
|
(5,576
|
)
|
|||||
|
Proceeds from issuance of convertible notes, net of issuance costs
|
391,638
|
|
333,725
|
|
—
|
|
|||||
|
Repayment of convertible notes
|
(98,572
|
)
|
(153,628
|
)
|
—
|
|
|||||
|
Proceeds from exercise of stock options and issuance of common stock under employee stock purchase plan
|
15,804
|
|
4,854
|
|
7,851
|
|
|||||
|
Payment of withholding taxes in connection with vesting of restricted stock units
|
(4,054
|
)
|
(2,866
|
)
|
(2,646
|
)
|
|||||
|
Net cash provided by (used in) financing activities
|
304,547
|
|
176,567
|
|
(371
|
)
|
|||||
|
Effect of exchange rate changes on cash
|
446
|
|
34
|
|
(275
|
)
|
|||||
|
Net increase (decrease) in cash, cash equivalents and restricted cash
|
135,403
|
|
14,502
|
|
(28,521
|
)
|
|||||
|
Cash, cash equivalents and restricted cash, beginning of year
(3)
|
137,174
|
|
122,672
|
|
151,193
|
|
|||||
|
Cash, cash equivalents and restricted cash, end of year
(3)
|
$
|
272,577
|
|
$
|
137,174
|
|
$
|
122,672
|
|
||
|
Supplemental disclosure of cash flow information
|
|||||||||||
|
Cash paid for interest
|
$
|
2,476
|
|
$
|
3,687
|
|
$
|
4,025
|
|
||
|
Cash paid for taxes
|
$
|
462
|
|
$
|
932
|
|
$
|
109
|
|
||
|
Non-cash investing and financing activities
|
|||||||||||
|
Allocation to equity for conversion feature for issuance of 1.375% convertible notes
|
$
|
120,710
|
|
$
|
—
|
|
$
|
—
|
|
||
|
Allocation to equity for conversion feature for issuance of 1.25% convertible notes
|
$
|
—
|
|
$
|
66,689
|
|
$
|
—
|
|
||
|
Allocation to equity for conversion feature for the repurchase of 2% convertible notes
|
$
|
(39,186
|
)
|
$
|
(32,865
|
)
|
$
|
—
|
|
||
|
Purchases of property and equipment under capital lease
|
$
|
—
|
|
$
|
—
|
|
$
|
5,721
|
|
||
(1)
Includes activity related to discontinued operations for the years ended December 31, 2016 and 2015. See Note
19
to the consolidated financial statements for discussion of discontinued operations.
(2)
Cash outflows from purchases of property, equipment and software for the year ended December 31, 2017 include
$2.0 million
of purchases made in prior periods that were included in accounts payable and accrued expenses as of December 31, 2016 and exclude
$4.0 million
of purchases made during the year ended December 31, 2017 that were included in accounts payable and accrued expenses as of December 31, 2017.
(3)
Cash and cash equivalents includes restricted cash amounts totaling
$0.5 million
,
$1.2 million
and
$1.2 million
as of December 31, 2017, 2016 and 2015, respectively. See Note 2 to the consolidated financial statements.
The accompanying notes are an integral part of these consolidated financial statements.
60
INSULET CORPORATION
NOTES TO CONSOLIDATED FINANCIAL STATEMENTS
Note
1
. Nature of the Business
Insulet Corporation, the "Company," is primarily engaged in the development, manufacturing and sale of its proprietary Omnipod Insulin Management System (the “Omnipod System”), an innovative, discreet and easy-to-use continuous insulin delivery system for people with insulin-dependent diabetes. The Omnipod System features a small, lightweight, self-adhesive disposable tubeless Omnipod device, which is worn on the body for approximately three days at a time, and its wireless companion, the handheld Personal Diabetes Manager (“PDM”). Conventional insulin pumps require people with insulin-dependent diabetes to learn to use, manage and wear a number of cumbersome components, including up to
42
inches of tubing. In contrast, the Omnipod System features only two discreet, easy-to-use devices that eliminate the need for a bulky pump and tubing, provides for virtually pain-free automated cannula insertion, communicates wirelessly and integrates a blood glucose meter. The Company believes that the Omnipod System’s unique proprietary design and features allow people with insulin-dependent diabetes to manage their diabetes with unprecedented freedom, comfort, convenience, and ease.
Commercial sales of the Omnipod System began in the United States in 2005. The Company sells the Omnipod System in the United States through direct sales to customers or through its distribution partners. The Omnipod System is currently available in multiple countries in Europe, as well as in Canada and Israel.
To lower manufacturing costs, increase supply redundancy, add capacity closer to its largest customer base and support growth, the Company is constructing a highly-automated manufacturing facility in Acton, Massachusetts with planned production out of the facility beginning in early 2019. The facility will also serve as the Company's global headquarters.
The Company announced on July 20, 2017 its plans to assume, on July 1, 2018, all commercial activities (including, among other things, distribution, sales, marketing, training and support) of its Omnipod System across Europe following the expiration of its distribution agreement with
Ypsomed Distribution AG ("Ypsomed" or the "European distributor")
on June 30, 2018.
Until the expiration of the distribution agreement, the Company's current distribution agreement for its Omnipod products in Europe will remain in effect.
The Company will be required to pay to the European distributor a per unit fee for sales of the Company's Omnipod device, over the twelve months following the expiration of the distribution agreement, to identified customers, as that term is defined in the distribution agreement, of the European distributor who had previously entered into an agreement with the distributor for the purchase of Omnipod devices. The Company expects to recognize a liability for this fee as qualifying sales of its Omnipod device are made to these identified customers during the twelve-month period beginning July 1, 2018.
In addition to using the Omnipod for insulin delivery, the Company also partners with global pharmaceutical and biotechnology companies to tailor the Omnipod System technology platform for the delivery of subcutaneous drugs across multiple therapeutic areas.
The Company acquired Neighborhood Holdings, Inc. and its wholly-owned subsidiaries (collectively, “Neighborhood Diabetes”) in
June 2011
. Through Neighborhood Diabetes, the Company provided customers with blood glucose testing supplies, traditional insulin pumps, pump supplies and pharmaceuticals and had the ability to process claims as either durable medical equipment or through pharmacy benefits. In February 2016, the Company sold Neighborhood Diabetes to Liberty Medical LLC ("Liberty Medical"). Additional information regarding the disposition and treatment of the Neighborhood Diabetes business as discontinued operations is provided in Note
19
to these consolidated financial statements.
Note
2
. Summary of Significant Accounting Policies
Use of Estimates in Preparation of Financial Statements
The preparation of financial statements in conformity with accounting principles generally accepted in the United States ("GAAP") requires management to make estimates and assumptions in the application of certain of its significant accounting policies that may materially affect the reported amounts of assets, liabilities, equity, revenue
61
and expenses. The most significant estimates used in these financial statements include the valuation of stock-based compensation expense; the fair value of intangible assets acquired in businesses combinations; the valuation of inventory; the valuation of deferred revenue; the calculation of gains and losses, if any, on the retirement or conversion of convertible debt; the estimated useful lives of property and equipment and intangible assets; the amount of internal use software development costs that qualify for capitalization; the valuation allowance related to deferred income taxes, the estimated amount, if any, of accrued contingent liabilities as well as warranty and doubtful accounts allowance reserve calculations. Actual results may differ from those estimates.
Principles of Consolidation and Basis of Presentation
The consolidated financial statements include the accounts of the Company and its wholly-owned subsidiaries. All material intercompany balances and transactions have been eliminated in consolidation. Certain reclassifications, primarily related to internal-use software intangible assets, have been made to prior period amounts to conform to the current period financial statement presentation.
Foreign Currency Translation
For foreign operations, asset and liability accounts are translated at exchange rates as of the balance sheet date; income and expenses are translated using weighted average exchange rates for the reporting period. Resulting translation adjustments are reported in accumulated other comprehensive loss, a separate component of stockholders' equity. Gains and losses arising from transactions and translation of period-end balances denominated in currencies other than the functional currency, primarily the Canadian dollar, are included in interest and other income (expense), net, and were not material for fiscal years
2017
,
2016
and
2015
.
Cash and Cash Equivalents
For the purpose of the financial statement classification, the Company considers all highly-liquid investment instruments with original maturities of 90 days or less, when purchased, to be cash equivalents. Cash equivalents include money market mutual funds, corporate bonds, and certificates of deposit which are carried at cost which approximates their fair value. Included in the Company's cash and cash equivalents are restricted cash amounts set aside for collateral on outstanding letters of credit related to lease obligations totaling
$0.5 million
as of December 31,
2017
and
$1.2 million
as of December 31,
2016
.
Investments in Marketable Securities
Short-term and long-term investment securities consist of available-for-sale marketable securities and are carried at fair value with unrealized gains or losses included as a component of other comprehensive loss in stockholders' equity. Investments, exclusive of cash equivalents, with a stated maturity date of more than one year from the balance sheet date and that are not expected to be used in current operations, are classified as long-term investments. Short-term and long-term investments include U.S. government and agency bonds, corporate bonds, and certificates of deposit.
The Company reviews investments for other-than-temporary impairment when the fair value of an investment is less than its amortized cost. If an available-for-sale security is other than temporarily impaired, the loss is charged to earnings.
Property and Equipment
Property and equipment is stated at cost and depreciated using the straight-line method over the estimated useful life of the respective assets. Leasehold improvements are amortized over their useful life or the life of the lease, whichever is shorter. Assets acquired under capital leases are amortized in accordance with the respective class of owned assets and the amortization is included with depreciation expense. Maintenance and repair costs are expensed as incurred.
Business Combinations
The Company recognizes the assets and liabilities assumed in business combinations on the basis of their fair values at the date of acquisition. The Company assesses the fair value of assets, including intangible assets, using a variety of methods and each asset is measured at fair value from the perspective of a market participant. The method used to estimate the fair values of intangible assets incorporates significant assumptions regarding the estimates a market participant would make in order to evaluate an asset, including a market participant’s use of the asset and the appropriate discount rates for a market participant. Assets recorded from the perspective of a market participant that are determined to not have economic use for the Company are expensed immediately. Any excess purchase price
62
over the fair value of the net tangible and intangible assets acquired is allocated to goodwill. Transaction costs and restructuring costs associated with a business combination are expensed as incurred.
Segment Reporting
Operating segments are defined as components of an enterprise about which separate financial information is available that is evaluated on a regular basis by the chief operating decision-maker ("CODM") in deciding how to allocate resources to an individual segment and in assessing performance of the segment. The Company has concluded that its Chief Executive Officer is the CODM as he is the ultimate decision maker for key operating decisions, determining the allocation of resources and assessing the financial performance of the Company. These decisions, allocations and assessments are performed by the CODM using consolidated financial information. Consolidated financial information is utilized by the CODM as the Company’s current product offering primarily consists of the Omnipod System and drug delivery. The Company’s products are relatively consistent and manufacturing is centralized and consistent across product offerings. Based on these factors, key operating decisions and resource allocations are made by the CODM using consolidated financial data and as such the Company has concluded that it operates as
one
segment.
Goodwill
Goodwill represents the excess of the cost of acquired businesses over the fair value of identifiable net assets acquired. The Company follows the provisions of Financial Accounting Standards Board ("FASB") ASC 350-20,
Intangibles - Goodwill and Other
(“ASC 350-20”) whereby the Company performs an assessment of its goodwill for impairment on at least an annual basis or whenever events or changes in circumstances indicate there might be impairment. The Company's annual impairment test date is October 1st.
Goodwill is evaluated for impairment at the reporting unit level. As the Company operates in
one
segment, the Company has considered whether that segment contains multiple components which represent separate reporting units. The Company has concluded that it has a single reporting unit. In reaching this conclusion, the Company considered how components of the business are managed, whether discrete financial information at the component level is reviewed on a regular basis by segment management and whether components may be aggregated based on economic similarity.
In performing that annual goodwill test, the Company utilizes the two-step approach as currently prescribed by ASC 350-20. The first step compares the carrying value of the reporting unit to its fair value. If the reporting unit’s carrying value exceeds its fair value, the Company would perform the second step and record an impairment loss to the extent that the carrying value of the reporting unit's goodwill exceeds its implied fair value. There were
no
impairments of goodwill during the years ended December 31,
2017
,
2016
or
2015
.
The following table presents the change in carrying amount of goodwill during the period indicated:
|
Years Ended December 31,
|
|||||||
|
(In thousands)
|
2017
|
2016
|
|||||
|
Goodwill:
|
|||||||
|
Beginning balance
|
$
|
39,677
|
|
$
|
39,607
|
|
|
|
Foreign currency adjustment
|
163
|
|
70
|
|
|||
|
Ending balance
|
$
|
39,840
|
|
$
|
39,677
|
|
|
Revenue Recognition
The Company generates the majority of its revenue from sales of its Omnipod System directly to patients and through third-party distributors.
Revenue recognition requires that persuasive evidence of a sales arrangement exists, delivery of goods occurs through transfer of title and risk and rewards of ownership, the selling price is fixed or determinable and collectability is reasonably assured. With respect to these criteria:
|
•
|
The evidence of an arrangement generally consists of a physician order form, a patient information form and, if applicable, third-party insurance approval for sales directly to patients or a purchase order for sales to a third-party distributor.
|
63
|
•
|
Revenue is recognized when title and risk and rewards of ownership have transferred to the customer.
|
|
•
|
The selling prices for all sales are fixed and agreed with the patient or third-party distributor and, if applicable, the patient’s third-party insurance provider(s) prior to shipment and are based on established list prices or, in the case of certain third-party insurers, contractually agreed upon prices. Provisions for discounts, rebates and other adjustments to customers are established as a reduction to revenue in the same period the related sales are recorded.
|
The Company offers a
45
-day right of return for sales of its Omnipod System in the United States, and a
90
-day right of return for sales of its Omnipod System in Canada to new patients and defers revenue to reflect estimated sales returns in the same period that the related product sales are recorded. Returns are estimated through a comparison of the Company’s historical return data to its related sales. Historical rates of return are adjusted for known or expected changes in the marketplace when appropriate. When doubt exists about reasonable assuredness of collectability from specific customers, the Company defers revenue from sales of products to those customers until payment is received.
The Company had deferred revenue of
$3.2 million
and
$1.9 million
as of December 31,
2017
and
2016
, respectively. Deferred revenue included
$0.9 million
and
$0.6 million
classified in other long-term liabilities as of December 31,
2017
and
2016
, respectively. Deferred revenue relates to undelivered elements within certain of the Company's developmental arrangements and other instances where the Company has not yet met the revenue recognition criteria.
Collaborative Arrangements
The Company enters into collaborative arrangements for ongoing initiatives to develop products. Although the Company does not consider any individual alliance to be material, the following more notable alliances are described below.
Eli Lilly and Concentrated insulins
: In May 2013, the Company entered into an agreement with Eli Lilly and Company (Eli Lilly) to develop a new version of the Omnipod System specifically designed to deliver Humulin
®
R U-500 insulin, a concentrated form of insulin used by people with highly insulin resistant Type 2 diabetes. In January 2016, the Company entered into a development agreement with Eli Lilly to develop a new version of Insulet's Omnipod tubeless insulin delivery system, specifically designed to deliver Lilly's Humalog
®
200 units/mL insulin, a concentrated form of insulin used by higher insulin-requiring patients with diabetes that provides the same dose of insulin in half the volume of Lilly's Humalog
®
U-100 insulin. Under the terms of these arrangements, the parties share the responsibility of the permissible costs that are incurred. Any amounts incurred in excess of the permissible shared costs that are the responsibility of one party becomes due and payable by the other party. Consideration received and payments made by the Company under the terms of the arrangements are recorded within research and development expense.
Shipping and Handling Costs
The Company does not typically charge its customers for shipping and handling costs associated with shipping its product to its customers unless non-standard shipping and handling services are requested. These shipping and handling costs are included in general and administrative expenses and were
$5.0 million
,
$4.1 million
and
$3.7 million
in the years ended December 31,
2017
,
2016
and
2015
, respectively.
Concentration of Credit Risk
Financial instruments that subject the Company to credit risk primarily consist of cash and cash equivalents, short-term and long-term investments in marketable securities and accounts receivable. The Company maintains the majority of its cash and short-term and long-term investments with
one
financial institution. Accounts are partially insured up to various amounts mandated by the Federal Deposit Insurance Corporation or by the foreign country where the account is held.
The Company purchases Omnipod Systems from Flex Ltd., its single source supplier. As of December 31,
2017
and December 31,
2016
, liabilities to this vendor represented approximately
20%
and
16%
, respectively, of the combined balance of accounts payable, accrued expenses and other current liabilities.
64
Revenue for customers comprising more than 10% of total revenue were as follows:
|
Twelve Months Ended December 31,
|
||||||
|
|
2017
|
2016
|
2015
|
|||
|
Amgen, Inc.
|
15%
|
17%
|
10%
|
|||
|
Ypsomed Distribution AG
|
22%
|
16%
|
12%
|
|||
|
RGH Enterprises, Inc.
|
11%
|
10%
|
13%
|
|||
Recently Adopted Accounting Standards
During 2017, the Company retrospectively adopted Accounting Standards Update ("ASU") 2016-19,
Technical Corrections and Improvements,
which included clarification that the license of internal-use software shall be accounted for as the acquisition of an intangible asset. As a result of adoption, the Company reclassified
$4.1 million
of gross internal-use software costs, net of accumulated amortization of
$2.6 million
, from property and equipment to other intangible assets as of December 31, 2016.
Effective January 1, 2017, the Company adopted ASU 2015-11,
Simplifying the Measurement of Inventory,
which requires entities to measure most inventory at the lower of cost and net realizable value. The adoption of this guidance did not have a material impact on the consolidated financial statements.
Effective January 1, 2017, the Company adopted ASU 2016-09,
Improvements to Employee Share-Based Payment Accounting
("ASU 2016-09") using the modified retrospective method. ASU 2016-09 simplifies several aspects of the accounting for employee share-based payment transactions, including the accounting for income taxes, forfeitures, and statutory tax withholding requirements, as well as classification in the statement of cash flows. The adoption of ASU 2016-09 resulted in the Company increasing its deferred tax assets by approximately
$23.8 million
, which was offset by a full valuation allowance. The adoption of the standard did not have a material impact on the Company's consolidated financial statements.
Effective January 1, 2017, the Company adopted ASU 2016-18,
Restricted Cash (a consensus of the Emerging Issues Task Force)
("ASU 2016-18") using the retrospective transition method. ASU 2016-18 requires the statement of cash flows to show the changes in the total of cash, cash equivalents, and restricted cash. There was no significant impact on the statement of cash flows upon the adoption of ASU 2016-18.
Accounting Pronouncements Issued and Not Yet Adopted as of December 31, 2017
In May 2014, the FASB issued ASU No. 2014-09,
Revenue from Contracts with Customers
("ASU 2014-09"). ASU 2014-09 and its related amendments (collectively referred to as ASC 606) requires that an entity recognize revenue when it transfers promised goods or services to customers in an amount that reflects the consideration to which the entity expects to be entitled in exchange for those goods or services. Under this guidance, an entity makes additional estimates regarding performance conditions and the allocation of variable consideration and must evaluate whether revenue derived from a contract should be recognized at a point in time or over time.
The Company adopted the standard as of the required effective date of January 1, 2018 using the modified retrospective method. Under this method, the new guidance was applied to contracts that were not yet completed as of January 1, 2018 with the cumulative effect of initially applying the guidance recognized through accumulated deficit as the date of initial application. In addition to the enhanced footnote disclosures related to customer contracts, the Company anticipates that the most significant impact of the new standard will relate to the timing of revenue recognition relative to a portion of its drug delivery product line, the deferral and amortization of contract acquisition costs such as commissions and a material right granted to the Company's European distributor in 2010.
The quantitative ranges provided below are estimates of the expected effects of the Company’s adoption of ASC 606 as of the time of preparation of this Annual Report on Form 10-K. The anticipated accounting impacts described below will have no impact on cash flows.
65
|
i.
|
Drug Delivery Revenue.
The adoption of ASC 606 will accelerate the timing of revenue recognition relative to a portion of the Company's drug delivery product line whereby revenue will be recognized as the product is produced pursuant to the customer’s firm purchase commitments as the Company has an enforceable right to payment for performance completed to date and the inventory has no alternative use to the Company. This guidance is in contrast to legacy accounting guidance whereby revenue is recognized when the product is shipped to the customer. Upon the adoption of ASC 606 on January 1, 2018, the Company expects to record a contract asset on its consolidated balance sheet of approximately
$4 million
to
$6 million
to reflect revenue that would have been recognized upon shipment of the product in 2018 under ASC 605 but will not be under ASC 606 as it would have been recognized in 2017 as the product was produced. The impact on the Company's drug delivery revenue in 2018 and forward will depend on the timing of drug delivery inventory production levels.
|
|
ii.
|
Material Right.
The adoption of ASC 606 will require the Company to record a contract liability on January 1, 2018 of approximately
$1 million
to
$3 million
associated with a volume-based pricing discount granted to the Company's European distributor at the outset of the distribution contract in 2010. The contract liability will be classified as deferred revenue and will be recognized as revenue through the completion of the distributor contract during the first half of 2018.
|
|
iii.
|
Contract Acquisition Costs.
The adoption of ASC 606 will impact the treatment of contract acquisition costs, such as commissions, which will be capitalized and amortized over the expected period of benefit. Upon adoption, the Company expects to increase its current and other assets by approximately
$18 million
to
$20 million
for the net value of cumulative commissions paid prior to adoption less amortization to date. The new guidance will likely have an accretive impact to the Company's earnings in 2018 as the Company continues to increase its customer base.
|
The deferred tax assets and liabilities resulting from these adjustments will be substantially offset by an associated adjustment to the Company valuation allowance. Therefore, as the Company currently maintains a full valuation allowance against its domestic net deferred tax assets, the Company does not expect the adoption of ACS 606 to have a significant impact on its deferred tax balances or income tax expense in 2018.
Effective January 1, 2018, the Company adopted ASU 2016-01,
Recognition and Measurement of Financial Assets and Financial Liabilities
("ASU 2016-01"). ASU 2016-01 changes the current GAAP model for the accounting of equity investments, whereby equity investments with readily determinable fair value will be carried at fair value with changes reported in net income (loss) as opposed to other comprehensive income (loss). The classification and measurement guidance was effective January 1, 2018 for the Company. As the Company held no available for sale equity investments on December 31, 2017, there was no impact on the consolidated financial statements upon the adoption of ASU 2016-01.
Effective January 1, 2018, the Company adopted ASU 2016-15,
Statement of Cash Flows (Topic 230), Classification of Certain Cash Receipts and Cash Payments (a consensus of the Emerging Issues Task Force)
("ASU 2016-15"). ASU 2016-15 clarifies how entities should classify certain cash receipts and cash payments on the statement of cash flows. The guidance also clarifies how the predominance principle should be applied when cash receipts and cash payments have aspects of more than one class of cash flows. The Company does not expect that the adoption of this guidance will have an impact on the consolidated statement of cash flows.
Effective January 1, 2018, the Company adopted ASU 2017-09,
Compensation-Stock Compensation (Topic 718):
Scope of Modification Accounting
("ASU 2017-09"). ASU 2017-09 specifies the types of changes to the terms or conditions of a share-based payment award that require an entity to apply modification accounting in accordance with Topic 718. The new standard is effective for the Company on January 1, 2018 and early adoption is permitted. The adoption of ASU 2017-09 did not have an impact on the Company's consolidated financial statements.
Effective January 1, 2018, the Company adopted ASU 2016-16,
Income Taxes (Topic 740): Intra-Entity Transfers of Assets Other Than Inventory
("ASU 2016-16"). ASU 2016-16 requires than an entity recognized the income tax effects of an intra-entity transfer of an asset, other than inventory, when the transfer occurs as opposed to when the asset is sold to a third party. The Company does not expect that the adoption of this guidance will have a material impact on the consolidated financial statements.
66
In August 2017, the FASB issued ASU 2017-12,
Targeted Improvements to Accounting for Hedging Activities
("ASU 2017-12"). ASU 2017-12 updates the current hedge accounting guidance with the objective of improving the financial reporting of hedging activities by better portraying the economic results of an entity's risk management activities in its financial statements. The new guidance is effective for the Company on January 1, 2019 and early adoption is permitted. The Company is currently evaluating the impact of ASU 2017-12 on its consolidated financial statements.
In February 2016, the FASB issued ASU 2016-02,
Leases
("ASU 2016-02"). ASU 2016-02 requires lessees to recognize the assets and liabilities on their balance sheet for the rights and obligations created by most leases and continue to recognize expenses on their income statements over the lease term. The new guidance will also require disclosures designed to give financial statement users information on the amount, timing, and uncertainty of cash flows arising from leases. The guidance is effective for the Company on January 1, 2019 and is expected to be applicable to all leases in place as of the beginning of the earliest reporting period. The Company does not expect to early-adopt the guidance. While the Company is currently evaluating the impact of ASU 2016-02, the Company currently expects that the new guidance will require an increase in the Company's long-lived assets and a corresponding increase to long-term obligations associated with leased office and warehouse space.
In January 2017, the FASB issued ASU 2017-04,
Simplifying the Test for Goodwill Impairment
("ASU 2017-04"). ASU 2017-04 simplifies the accounting for goodwill impairments by eliminating "Step 2" from the goodwill impairment test, which requires an entity to calculate the implied fair value of goodwill to measure a goodwill impairment charge, and alternatively, requires an entity to measure the impairment of goodwill assigned to a reporting unit as the amount by which the carrying value of the assets and liabilities of the reporting unit, including goodwill, exceeds the reporting unit's fair value. The guidance is effective for annual reporting periods beginning after December 15, 2019, and interim periods within those years. Early adoption is permitted for all entities. The Company is currently evaluating the impact of ASU 2017-04 but does not expect it to be material to the consolidated financial statements.
Other Significant Policies:
The following table identifies the Company's other significant accounting policies and the note and page where a detailed description of each policy can be found.
|
Note
|
3
|
|
Page
|
||
|
Note
|
5
|
|
Page
|
||
|
Note
|
6
|
|
Page
|
||
|
Product Warranty Costs
|
Note
|
9
|
|
Page
|
|
|
Convertible Debt
|
Note
|
11
|
|
Page
|
|
|
Commitments and Contingencies
|
Note
|
12
|
|
Page
|
|
|
Stock-Based Compensation
|
Note
|
13
|
|
Page
|
|
67
Note
3
. Fair Value Measurements
The Company applies ASC 820,
Fair Value Measurements and Disclosures
(“ASC 820”) related to the fair value measurement of certain of its assets and liabilities. ASC 820 defines fair value as the price that would be received for an asset or paid to transfer a liability (an exit price) in the principal or most advantageous market for the asset or liability in an orderly transaction between market participants on the measurement date. A single estimate of fair value results from a complex series of judgments about future events and uncertainties and relies heavily on estimates and assumptions. When estimating fair value, depending on the nature and complexity of the asset or liability, the Company may use one or all of the following approaches:
|
•
|
Market approach, which is based on market prices and other information from market transactions involving identical or comparable assets or liabilities.
|
|
•
|
Cost approach, which is based on the cost to acquire or construct comparable assets less an allowance for functional and/or economic obsolescence.
|
|
•
|
Income approach, which is based on the present value of the future stream of net cash flows.
|
To measure fair value, the Company uses the following fair value hierarchy based on three levels of inputs, as described in ASC 820, of which the first two are considered observable and the last unobservable:
Level 1 — quoted prices in active markets for identical assets or liabilities
Level 2 — observable inputs other than quoted prices in active markets for identical assets or liabilities
Level 3 — unobservable inputs in which there is little or no market data available, which require the reporting entity to develop its own assumptions
Certain of the Company’s financial instruments, including cash and cash equivalents, accounts receivable, accounts payable, accrued expenses and other liabilities are carried at cost, which approximates their fair value because of the short-term maturity of these financial instruments.
68
The following table provides a summary of assets that are measured at fair value as of December 31,
2017
and
2016
, aggregated by the level in the fair value hierarchy within which those measurements fall:
|
Fair Value Measurements
|
|||||||||||||||
|
(in thousands)
|
Total
|
Level 1
|
Level 2
|
Level 3
|
|||||||||||
|
December 31, 2017
|
|||||||||||||||
|
Recurring fair value measurements:
|
|||||||||||||||
|
Cash equivalents:
|
|||||||||||||||
|
Money market mutual funds
|
$
|
236,936
|
|
$
|
236,936
|
|
$
|
—
|
|
$
|
—
|
|
|||
|
U.S. government and agency bonds
|
5,000
|
|
5,000
|
|
—
|
|
—
|
|
|||||||
|
Corporate bonds
|
—
|
|
—
|
|
—
|
|
—
|
|
|||||||
|
Certificates of deposit
|
—
|
|
—
|
|
—
|
|
—
|
|
|||||||
|
Total cash equivalents
|
$
|
241,936
|
|
$
|
241,936
|
|
$
|
—
|
|
$
|
—
|
|
|||
|
Short-term investments:
|
|||||||||||||||
|
U.S. government bonds
|
$
|
112,076
|
|
$
|
90,703
|
|
$
|
21,373
|
|
$
|
—
|
|
|||
|
Corporate bonds
|
47,681
|
|
—
|
|
47,681
|
|
—
|
|
|||||||
|
Certificates of deposit
|
7,722
|
|
—
|
|
7,722
|
|
—
|
|
|||||||
|
Total short-term investments
|
$
|
167,479
|
|
$
|
90,703
|
|
$
|
76,776
|
|
$
|
—
|
|
|||
|
Long-term investments:
|
|||||||||||||||
|
U.S. government and agency bonds
|
$
|
92,464
|
|
$
|
49,651
|
|
$
|
42,813
|
|
$
|
—
|
|
|||
|
Corporate bonds
|
27,812
|
|
—
|
|
27,812
|
|
—
|
|
|||||||
|
Certificates of deposit
|
5,273
|
|
—
|
|
5,273
|
|
—
|
|
|||||||
|
Total long-term investments
|
$
|
125,549
|
|
$
|
49,651
|
|
$
|
75,898
|
|
$
|
—
|
|
|||
|
December 31, 2016
|
|||||||||||||||
|
Recurring fair value measurements:
|
|||||||||||||||
|
Cash equivalents:
|
|||||||||||||||
|
Money market mutual funds
|
$
|
93,467
|
|
$
|
93,467
|
|
$
|
—
|
|
$
|
—
|
|
|||
|
Corporate bonds
|
4,203
|
|
—
|
|
4,203
|
|
—
|
|
|||||||
|
Certificates of deposit
|
735
|
|
—
|
|
735
|
|
—
|
|
|||||||
|
Total cash equivalents
|
$
|
98,405
|
|
$
|
93,467
|
|
$
|
4,938
|
|
$
|
—
|
|
|||
|
Short-term investments:
|
|||||||||||||||
|
U.S. government and agency bonds
|
$
|
79,093
|
|
$
|
49,963
|
|
$
|
29,130
|
|
$
|
—
|
|
|||
|
Corporate bonds
|
56,653
|
|
—
|
|
56,653
|
|
—
|
|
|||||||
|
Certificates of deposit
|
25,650
|
|
—
|
|
25,650
|
|
—
|
|
|||||||
|
Total short-term investments
|
$
|
161,396
|
|
$
|
49,963
|
|
$
|
111,433
|
|
$
|
—
|
|
|||
The estimated fair value of the Company's convertible debt is based on the Level 2 quoted market prices for the same or similar issues and includes the impact of the conversion features.
69
The carrying amounts, net of unamortized discounts and issuance costs, and the estimated fair values of the Company's convertible debt as of December 31,
2017
and
2016
are as follows:
|
December 31, 2017
|
December 31, 2016
|
||||||||||||||
|
(in thousands)
|
Carrying
Value
|
Estimated Fair
Value
|
Carrying
Value |
Estimated Fair
Value |
|||||||||||
|
2% Convertible Senior Notes
|
$
|
3,421
|
|
$
|
5,467
|
|
$
|
59,737
|
|
$
|
71,909
|
|
|||
|
1.375% Convertible Senior Notes
|
276,172
|
|
407,652
|
|
—
|
|
—
|
|
|||||||
|
1.25% Convertible Senior Notes
|
286,580
|
|
450,881
|
|
273,031
|
|
320,969
|
|
|||||||
|
Total
|
$
|
566,173
|
|
$
|
864,000
|
|
$
|
332,768
|
|
$
|
392,878
|
|
|||
Note
4
. Investments
The Company's short-term and long-term investments have maturity dates that range from
15 days
to
23
months as of December 31,
2017
. Amortized costs, gross unrealized holding gains and losses, and fair values at December 31,
2017
are as follows:
|
(in thousands)
|
Amortized cost
|
Gross Unrealized Gains
|
Gross Unrealized Losses
|
Fair Value
|
|||||||||||
|
December 31, 2017
|
|||||||||||||||
|
U.S. government and agency bonds
|
$
|
112,311
|
|
$
|
—
|
|
$
|
(235
|
)
|
$
|
112,076
|
|
|||
|
Corporate bonds
|
47,713
|
|
3
|
|
(35
|
)
|
47,681
|
|
|||||||
|
Certificates of deposit
|
7,722
|
|
—
|
|
—
|
|
7,722
|
|
|||||||
|
Total short-term investments
|
$
|
167,746
|
|
$
|
3
|
|
$
|
(270
|
)
|
$
|
167,479
|
|
|||
|
U.S. government and agency bonds
|
$
|
92,677
|
|
$
|
—
|
|
$
|
(213
|
)
|
$
|
92,464
|
|
|||
|
Corporate bonds
|
27,871
|
|
—
|
|
(59
|
)
|
27,812
|
|
|||||||
|
Certificates of deposit
|
5,273
|
|
—
|
|
—
|
|
5,273
|
|
|||||||
|
Total long-term investments
|
$
|
125,821
|
|
$
|
—
|
|
$
|
(272
|
)
|
$
|
125,549
|
|
|||
|
December 31, 2016
|
|||||||||||||||
|
U.S. government and agency bonds
|
$
|
79,211
|
|
$
|
—
|
|
$
|
(118
|
)
|
$
|
79,093
|
|
|||
|
Corporate bonds
|
56,742
|
|
—
|
|
(89
|
)
|
56,653
|
|
|||||||
|
Certificates of deposit
|
25,650
|
|
—
|
|
—
|
|
25,650
|
|
|||||||
|
Total short-term investments
|
$
|
161,603
|
|
$
|
—
|
|
$
|
(207
|
)
|
$
|
161,396
|
|
|||
|
Total long-term investments
|
$
|
—
|
|
$
|
—
|
|
$
|
—
|
|
$
|
—
|
|
|||
The Company's realized gains or losses in the years ended December 31, 2017 and 2016 were insignificant.
Note
5
. Accounts Receivable, Net
Accounts receivable consist of amounts due from third-party payors, patients, and third-party distributors. The Company records an allowance for doubtful accounts at the time potential collection risk is identified. The Company estimates its allowance based on historical experience, assessment of specific risk, discussions with individual customers or various assumptions and estimates that are believed to be reasonable under the circumstances. The Company believes the reserve is adequate to mitigate current collection risk.
70
Customers that represented greater than 10% of gross accounts receivable as of December 31,
2017
, and
2016
were as follows:
|
As of
|
|||||
|
December 31, 2017
|
December 31, 2016
|
||||
|
Amgen, Inc.
|
10
|
%
|
16
|
%
|
|
|
Ypsomed Distribution AG
|
31
|
%
|
19
|
%
|
|
The components of accounts receivable are as follows:
|
(in thousands)
|
As of
|
||||||
|
December 31, 2017
|
December 31, 2016
|
||||||
|
Trade receivables
|
$
|
55,914
|
|
$
|
31,714
|
|
|
|
Allowance for doubtful accounts
|
(2,541
|
)
|
(2,911
|
)
|
|||
|
Total accounts receivable
|
$
|
53,373
|
|
$
|
28,803
|
|
|
Note
6
. Inventories
Inventories are held at the lower of cost or market, determined under the first-in, first-out method, and include the costs of material, labor and overhead. Inventory has been recorded at cost, or net realizable value as appropriate, as of December 31,
2017
and
2016
. The Company reviews inventories for net realizable value based on quantities on hand and expectations of future use. Work in process is calculated based upon a buildup in the stage of completion using estimated labor inputs for each stage in production.
The components of inventories are as follows:
|
(in thousands)
|
As of
|
||||||
|
December 31, 2017
|
December 31, 2016
|
||||||
|
Raw materials
|
$
|
2,146
|
|
$
|
1,911
|
|
|
|
Work-in-process
|
23,918
|
|
15,681
|
|
|||
|
Finished goods, net
|
7,729
|
|
17,922
|
|
|||
|
Total inventories
|
$
|
33,793
|
|
$
|
35,514
|
|
|
Note
7
. Property and Equipment, Net
Property and equipment related to continuing operations consist of the following:
|
|
Estimated
Useful Life
(Years)
|
As of
|
|||||||
|
(in thousands)
|
December 31, 2017
|
December 31, 2016
|
|||||||
|
Land
|
n/a
|
$
|
2,525
|
|
$
|
—
|
|
||
|
Machinery and equipment
|
2-7
|
60,878
|
|
53,246
|
|
||||
|
Lab equipment
|
3-7
|
1,038
|
|
694
|
|
||||
|
Computers
|
3-5
|
3,659
|
|
2,833
|
|
||||
|
Office furniture and fixtures
|
3-5
|
2,521
|
|
1,960
|
|
||||
|
Leasehold improvement
|
*
|
1,425
|
|
1,126
|
|
||||
|
Construction in process
|
—
|
87,397
|
|
23,859
|
|
||||
|
Total property and equipment
|
$
|
159,443
|
|
$
|
83,718
|
|
|||
|
Less: accumulated depreciation
|
(51,579
|
)
|
(38,965
|
)
|
|||||
|
Total property and equipment, net
|
$
|
107,864
|
|
$
|
44,753
|
|
|||
____________________________________
* Lesser of lease term or useful life of asset.
71
Depreciation expense related to property and equipment from continuing operations was
$12.7 million
,
$12.6 million
and
$11.0 million
for the years ended December 31,
2017
,
2016
and
2015
, respectively. Depreciation expense from discontinued operations was not significant during those same periods. The Company recorded
$3.1 million
,
$0.5 million
and
$0.2 million
of capitalized interest in the years ended December 31,
2017
,
2016
and
2015
.
Construction in process mainly consists of construction of the Company's highly-automated manufacturing facility in Acton, Massachusetts with planned production out of the facility beginning in early 2019.
Note
8
. Other Intangible Assets, Net
The Company’s finite-lived intangible assets are stated at cost less accumulated amortization. The Company assesses its intangible and other long-lived assets for impairment whenever events or changes in circumstances suggest that the carrying value of an asset may not be recoverable. The Company recognizes an impairment loss for intangibles and other finite-lived assets if the carrying amount of a long-lived asset is not recoverable based on its undiscounted future cash flows. Any such impairment loss is measured as the difference between the carrying amount and the fair value of the asset.
During 2016, the Company restructured its plan for an internally developed ERP system in order to leverage current third-party software available and scale conversion based on the Company's evolving ERP needs. As a result, the Company recorded a charge of
$6.1 million
, included in general and administrative expenses, related to this in-process internally developed software.
The Company recorded
$2.1 million
of other intangible assets in 2015 as a result of the acquisition of its Canadian distribution business (see Note 18 for further description). The Company determined that the estimated useful life of the contractual relationship asset is
5 years
and is amortizing the asset over its estimated life, based on the expected cash flows of the assets, accordingly.
The Company adopted ASU 2016-19 on January 1, 2017 and, as a result, reclassified
$4.1 million
of gross internal-use software costs, net of accumulated amortization of
$2.6 million
, from property and equipment to other intangible assets as of December 31, 2016.
Other intangible assets consist of the following:
|
|
As of
|
||||||||||||||||||||||
|
December 31, 2017
|
December 31, 2016
|
||||||||||||||||||||||
|
(in thousands)
|
Gross Carrying Amount
|
Accumulated Amortization
|
Net Book Value
|
Gross Carrying Amount
|
Accumulated Amortization
|
Net Book Value
|
|||||||||||||||||
|
Customer and contractual relationships
|
$
|
2,135
|
|
$
|
(1,764
|
)
|
$
|
371
|
|
$
|
1,994
|
|
$
|
(1,466
|
)
|
$
|
528
|
|
|||||
|
Internal use software
|
7,545
|
|
(3,565
|
)
|
3,980
|
|
4,064
|
|
(2,551
|
)
|
1,513
|
|
|||||||||||
|
Total intangible assets
|
$
|
9,680
|
|
$
|
(5,329
|
)
|
$
|
4,351
|
|
$
|
6,058
|
|
$
|
(4,017
|
)
|
$
|
2,041
|
|
|||||
Amortization expense was approximately
$1.2 million
and
$1.2 million
for the years ended December 31,
2017
and
2016
, respectively. Amortization expense is recorded in general and administration expenses in the consolidated statements of operations.
Amortization expense expected for the next five years and thereafter is as follows:
72
|
(in thousands)
|
|||||||||||
|
Years Ending December 31,
|
Customer and Contractual Relationships
|
Internal-Use Software
|
Total
|
||||||||
|
2018
|
$
|
165
|
|
$
|
1,235
|
|
$
|
1,400
|
|
||
|
2019
|
138
|
|
984
|
|
1,122
|
|
|||||
|
2020
|
68
|
|
744
|
|
812
|
|
|||||
|
2021
|
—
|
|
623
|
|
623
|
|
|||||
|
2022
|
—
|
|
383
|
|
383
|
|
|||||
|
Thereafter
|
—
|
|
11
|
|
11
|
|
|||||
|
Total
|
$
|
371
|
|
$
|
3,980
|
|
$
|
4,351
|
|
||
As of December 31,
2017
, the weighted average amortization periods of the Company’s customer and contractual relationships intangible assets and internal use software intangible assets are approximately
3
years and
4
years, respectively.
Note
9
. Accrued Expenses and Other Current Liabilities
Accrued expenses and other current liabilities related to continuing operations consist of the following:
|
Years Ended December 31,
|
|||||||
|
(in thousands)
|
2017
|
2016
|
|||||
|
Employee compensation and related costs
|
$
|
34,942
|
|
$
|
21,999
|
|
|
|
Professional and consulting services
|
9,273
|
|
6,753
|
|
|||
|
Supplier charges
|
3,542
|
|
2,886
|
|
|||
|
Warranty
|
1,653
|
|
1,642
|
|
|||
|
Accrued interest
|
2,030
|
|
1,303
|
|
|||
|
Accrued freight
|
1,148
|
|
595
|
|
|||
|
Other
|
6,668
|
|
6,050
|
|
|||
|
Total accrued expenses and other current liabilities
|
$
|
59,256
|
|
$
|
41,228
|
|
|
Product Warranty Costs
The Company provides a
four
-year warranty on its PDMs sold in the United States and a
five
-year warranty on its PDMs sold in Canada and may replace any Omnipod that does not function in accordance with product specifications. The Company estimates its warranty at the time the product is shipped based on historical experience and the estimated cost to service the claims. Warranty expense is recorded in cost of goods sold on the statement of operations. Cost to service the claims reflects the current product cost. As these estimates are based on historical experience, and the Company continues to introduce new products and versions, the Company also considers the anticipated performance of the product over its warranty period in estimating warranty reserves.
A reconciliation of the changes in the Company’s product warranty liability is as follows:
|
Years Ended December 31,
|
|||||||
|
(in thousands)
|
2017
|
2016
|
|||||
|
Product warranty liability at the beginning of the period
|
$
|
4,388
|
|
$
|
4,152
|
|
|
|
Warranty expense
|
6,127
|
|
4,602
|
|
|||
|
Warranty claims settled
|
(5,178
|
)
|
(4,366
|
)
|
|||
|
Product warranty liability at the end of the period
|
$
|
5,337
|
|
$
|
4,388
|
|
|
73
|
|
As of
|
||||||
|
(in thousands)
|
December 31, 2017
|
December 31, 2016
|
|||||
|
Composition of balance:
|
|||||||
|
Short-term
|
$
|
1,653
|
|
$
|
1,642
|
|
|
|
Long-term
|
3,684
|
|
2,746
|
|
|||
|
Product warranty liability at the end of the period
|
$
|
5,337
|
|
$
|
4,388
|
|
|
Note
10
. Capital Lease Obligations
As of December 31,
2016
, the Company had approximately
$13.7 million
of manufacturing equipment acquired under capital leases, which is included in property and equipment. During 2017, the Company made final minimum lease payments of
$0.3 million
and at the expiration of these leases title to the equipment was transferred to the Company. These assets were depreciated on a straight-line basis over
5
years. Depreciation expense related to these assets was
$2.7 million
,
$2.7 million
and
$2.5 million
in the years ended December 31,
2017
,
2016
and
2015
, respectively. As of December 31, 2017, the Company had
no
assets under capital lease and
no
future minimum lease payments due under capital leases. The Company recorded
$0.4 million
and
$1.2 million
of interest expense on capital leases in the years ended December 31,
2016
, and
2015
, respectively. Interest expense on capital leases was not significant in 2017.
Note
11
. Convertible Debt
The Company had outstanding convertible debt and related deferred financing costs on its consolidated balance sheet as follows:
|
|
As of
|
||||||
|
(in thousands)
|
December 31, 2017
|
December 31, 2016
|
|||||
|
Principal amount of 2.0% Convertible Senior Notes
|
$
|
3,664
|
|
$
|
67,084
|
|
|
|
Principal amount of 1.25% Convertible Senior Notes
|
345,000
|
|
345,000
|
|
|||
|
Principal amount of 1.375% Convertible Senior Notes
|
402,500
|
|
—
|
|
|||
|
Unamortized debt discount
|
(170,448
|
)
|
(69,684
|
)
|
|||
|
Deferred financing costs
|
(14,543
|
)
|
(9,632
|
)
|
|||
|
Long-term debt, net of discount and issuance costs
|
$
|
566,173
|
|
$
|
332,768
|
|
|
Interest expense related to the convertible notes is as follows:
|
|
Years Ended December 31,
|
||||||||||
|
(in thousands)
|
2017
|
2016
|
2015
|
||||||||
|
Contractual coupon interest
|
$
|
6,282
|
|
$
|
4,467
|
|
$
|
4,025
|
|
||
|
Accretion of debt discount
|
15,931
|
|
8,800
|
|
6,552
|
|
|||||
|
Amortization of debt issuance costs
|
2,077
|
|
1,270
|
|
1,126
|
|
|||||
|
Total interest expense related to convertible notes
|
$
|
24,290
|
|
$
|
14,537
|
|
$
|
11,703
|
|
||
Interest expense related to convertible notes for the year ended December 31, 2017 is as follows:
|
(in thousands)
|
1.375%
|
1.25%
|
2.0%
|
Total
|
|||||||||||
|
Contractual coupon interest
|
$
|
769
|
|
$
|
4,336
|
|
$
|
1,177
|
|
$
|
6,282
|
|
|||
|
Amortization of debt discount and issuance costs
|
1,998
|
|
13,549
|
|
2,461
|
|
18,008
|
|
|||||||
|
Total interest expense
|
$
|
2,767
|
|
$
|
17,885
|
|
$
|
3,638
|
|
$
|
24,290
|
|
|||
74
1.375% Convertible Senior Notes
In November 2017, the Company issued and sold
$402.5 million
in aggregate principal amount of
1.375%
Convertible Senior Notes, due November 15, 2024 (the "
1.375%
Notes"). The interest rate on the notes is
1.375%
per annum, payable semi-annually in arrears in cash on May 15 and November 15 of each year. Interest began accruing on November 10, 2017 and the first interest payment is due on May 15, 2018. The
1.375%
Notes are convertible into the Company’s common stock at an initial conversion rate of
10.7315
shares of common stock per
$1,000
principal amount of the
1.375%
Notes, which is equivalent to a conversion price of approximately
$93.18
per share, subject to adjustment under certain circumstances. The
1.375%
Notes will be convertible prior to the close of business on the business day immediately preceding August 15, 2024 only under certain circumstances and during certain periods, and will be convertible on or after August 15, 2024 until the close of business on the second scheduled trading day immediately preceding November 15, 2024, regardless of those circumstances.
The Company recorded a debt discount of
$120.7 million
related to the
1.375%
Notes resulting from the allocation of a portion of the proceeds to the fair value of the conversion feature. The debt discount was recorded as additional paid-in capital and the remaining liability reflects a nonconvertible debt borrowing rate of
6.8%
per annum. This debt discount is being amortized as non-cash interest expense over the
seven
year term of the
1.375%
Notes. The Company also incurred debt issuance costs and other expenses related to the
1.375%
Notes of approximately
$10.9 million
, of which
$3.3 million
has been reclassified as a reduction to the value of the conversion feature allocated to equity. The remaining
$7.6 million
of debt issuance costs is presented as a reduction of debt in the consolidated balance sheet and is being amortized using the effective interest method as non-cash interest expense over the
seven
year term of the
1.375%
Notes.
The
1.375%
Notes contain provisions that allow for additional interest to holders of the notes upon failure to timely file documents or reports that the Company is required to file with the SEC. The additional interest is at a rate of
0.50%
per annum of the principal amounts of the notes outstanding for a period of
360
days. If the Company merges or consolidates with a foreign entity, then additional taxes may be required to be paid by the Company under the terms of the
1.375%
Notes. The Company determined that the higher interest payments required and tax payments required in certain circumstances are considered embedded derivatives and should be bifurcated and accounted for at fair value. The Company assesses the value of the embedded derivatives at each balance sheet date. The derivatives had nominal value at the balance sheet date.
As of December 31, 2017, the Company included
$276.2 million
, net of unamortized discount and issuance costs, on its consolidated balance sheet in long-term debt related to the
1.375%
Notes.
1.25% Convertible Senior Notes
In September 2016, the Company issued and sold
$345.0 million
in principal amount of
1.25%
Convertible Senior Notes, due
September 15, 2021
. The interest rate on the notes is
1.25%
per annum, payable semi-annually in arrears in cash on
March 15
and
September 15
of each year. The
1.25%
Notes are convertible into the Company’s common stock at an initial conversion rate of
17.1332
shares of common stock per
$1,000
principal amount of the
1.25%
Notes, which is equivalent to a conversion price of approximately
$58.37
per share, subject to adjustment under certain circumstances. The
1.25%
Notes will be convertible prior to the close of business on the business day immediately preceding June 15, 2021 only under certain circumstances and during certain periods, and will be convertible on or after June 15, 2021 until the close of business on the second scheduled trading day immediately preceding September 15, 2021, regardless of those circumstances.
The Company recorded a debt discount of
$66.7 million
related to the
1.25%
Notes which results from allocating a portion of the proceeds to the fair value of the conversion feature. The fair value of the debt discount was estimated using a trinomial lattice model based on the following inputs: Company's stock price, expected volatility, term to maturity, risk-free interest rate, and dividend yield. The debt discount was recorded as additional paid-in capital and the remaining liability reflects the value of the Company’s nonconvertible debt borrowing rate of
5.8%
per annum. This debt discount is being amortized as non-cash interest expense over the
five
year term of the
1.25%
Notes. The Company incurred debt issuance costs and other expenses related to this offering of approximately
$11.3 million
, of which
$2.2 million
has been reclassified as a reduction to the value of the amount allocated to equity. The remainder is presented as a reduction of debt in the consolidated balance sheet, is being amortized using the effective interest method, and is recorded as non-cash interest expense over the
five
year term of the
1.25%
Notes.
75
The
1.25%
Notes contain provisions that allow for additional interest to holders of the notes upon failure to timely file documents or reports that the Company is required to file with the SEC. The additional interest is at a rate of
0.50%
per annum of the principal amounts of the notes outstanding for a period of
360
days. If the Company merges or consolidates with a foreign entity, then additional taxes may be required to be paid by the Company under the terms of the
1.25%
Notes. The Company determined that the higher interest payments required and tax payments required in certain circumstances are considered embedded derivatives and should be bifurcated and accounted for at fair value. The Company assesses the value of the embedded derivatives at each balance sheet date. The derivatives had a nominal value at the balance sheet date.
As of December 31, 2017, the Company included
$286.6 million
, net of unamortized discount and issuance costs, on its consolidated balance sheet in long-term debt related to the
1.25%
Notes.
2% Convertible Senior Notes
In June 2014, the Company issued and sold
$201.3 million
in principal amount of
2%
Convertible Senior Notes due June 15, 2019 (the “
2%
Notes”). The interest rate on the notes is
2%
per annum, payable semi-annually in arrears in cash on
June 15
and
December 15
of each year. The
2%
Notes are convertible into the Company’s common stock at an initial conversion rate of
21.5019
shares of common stock per
$1,000
principal amount of the
2%
Notes, which is equivalent to a conversion price of approximately
$46.51
per share, subject to adjustment under certain circumstances.
Upon issuance of the notes, the Company recorded a debt discount of
$35.6 million
, which was recorded as additional paid-in capital to reflect the value of the Company’s nonconvertible debt borrowing rate of
6.2%
per annum. The debt discount is being amortized as non-cash interest expense over the
five
year term of the
2%
Notes. Financing costs related to this offering were approximately
$6.7 million
, of which
$1.2 million
was classified to equity and the remainder was recorded as a reduction to debt in the consolidated balance sheet and is being amortized as non-cash interest expense over the
five
year term of the
2%
Notes.
In September 2016, in connection with the issuance of
$345 million
in principal amount of the
1.25%
Notes, the Company repurchased approximately
$134.2 million
in principal amount of the
2%
Notes for
$153.6 million
. The extinguishment of the
2%
Notes was accounted for separately from the issuance of the
1.25%
Notes as both transactions were viewed as arm's-length in nature and were not contingent upon one another. The $
153.6 million
paid to extinguish the debt was allocated to debt and equity based on their respective fair values immediately prior to the transaction. The fair value of the debt, which is classified as a Level 3 measurement, was estimated using a trinomial lattice model based on the following inputs: Company's stock price, expected volatility, term to maturity, risk-free interest rate, and dividend yield. The Company allocated
$121.4 million
of the payment to the debt and
$32.9 million
to equity. The Company recorded a loss on extinguishment of debt of
$2.6 million
in connection with the repurchase and redemption of the
2%
Notes during the year ended December 31, 2016, representing the excess of the
$121.4 million
allocated to the debt over its carrying value, net of unamortized debt discount, deferred financing costs and accrued interest.
In November 2017, the Company used
$98.6 million
of the net proceeds from the
1.375%
Notes to repurchase approximately
$63.4 million
principal amount of its outstanding
2.0%
Convertible Senior Notes due 2019 (the "
2%
Notes") pursuant to individually negotiated transactions. The extinguishment of the
2%
Notes was accounted for separately from the issuance of the
1.375%
Notes as both transactions were arm's-length in nature and were not contingent upon one another. The amount paid to extinguish these notes was allocated between debt in the amount
$59.4 million
and equity in the amount of
$39.2 million
based on their respective fair values immediately prior to the transaction. The fair value of the debt, which is considered a Level 3 measurement, was determined by comparing the effective yield-to-maturity of the repurchased 2% Notes as of the extinguishment date to the market yield for non-convertible debt with similar characteristics. The Company recorded a loss on extinguishment of debt of
$0.6 million
in connection with the repurchase of the
2%
Notes during the year ended December 31, 2017, representing the excess of the amount allocated to the debt over the principal amount of the debt plus accrued interest, net of unamortized debt discount and deferred financing costs.
The
2%
Notes contain provisions that allow for additional interest to the holders of the notes upon the failure to timely file documents or reports that the Company is required to file with the SEC. The additional interest is at a rate of
0.25%
per annum of the principal amount of the notes outstanding for the first
180
days and
0.50%
per annum of the principal amount of the notes outstanding for a period up to
360
days. The Company determined that
76
the higher interest and tax payments required in certain circumstances are considered embedded derivatives and should be bifurcated and accounted for at fair value. The Company assesses the value of the embedded derivatives at each balance sheet date. The derivatives had a nominal value at the balance sheet date.
As of December 31,
2017
, the Company included
$3.4 million
, net of unamortized discount and issuance costs, on its consolidated balance sheet in long-term debt related to the
2%
Notes.
Note
12
. Commitments and Contingencies
The Company records a liability in the consolidated financial statements for loss contingencies when a loss is known or considered probable and the amount can be reasonably estimated. If the reasonable estimate of a known or probable loss is a range, and no amount within the range is a better estimate than any other, the minimum amount of the range is accrued. If a loss is reasonably possible but not known or probable, and can be reasonably estimated, the estimated loss or range of loss is disclosed.
Operating Leases
The Company leases facilities in Massachusetts, California, Tennessee, the United Kingdom, Canada and China. The Company’s leases are accounted for as operating leases. The leases generally provide for a base rent plus real estate taxes and certain operating expenses related to the leases.
The Company leases approximately
100,000
square feet of laboratory and office space for its corporate headquarters in Billerica, Massachusetts. The lease expires in
November 2022
and contain escalating payments over the life of the lease. Additionally, the Company leases approximately
29,000
square feet of warehousing space in Billerica, Massachusetts under a lease expiring in September 2019. The Company leases other facilities in Canada, China, the United Kingdom, California and Tennessee containing a total of approximately
14,000
square feet under leases expiring from April 2018 to December 2020.
Certain of the Company’s operating lease agreements contain scheduled rent increases. Rent expense is recorded using the straight-line method and deferred rent is included in other liabilities in the accompanying consolidated balance sheets. Rental expense from continuing operations under operating leases was
$2.8 million
,
$2.5 million
and
$1.9 million
in the years ended December 31,
2017
,
2016
and
2015
, respectively.
The aggregate future minimum lease payments related to these leases as of December 31,
2017
are as follows:
|
(in thousands)
|
|||
|
Years Ending December 31,
|
Minimum Lease
Payments
|
||
|
2018
|
3,025
|
|
|
|
2019
|
2,961
|
|
|
|
2020
|
2,611
|
|
|
|
2021
|
2,383
|
|
|
|
2022
|
2,131
|
|
|
|
Thereafter
|
—
|
|
|
|
Total
|
$
|
13,111
|
|
Legal Proceedings
Between May 5, 2015 and June 16, 2015, three class action lawsuits were filed by shareholders in the U.S. District Court, for the District of Massachusetts, against the Company and certain individual current and former executives of the Company. Two suits subsequently were voluntarily dismissed.
Arkansas Teacher Retirement System v. Insulet, et al.
, 1:15-cv-12345, (“ATRS”) which remains outstanding, alleges that the Company (and certain executives) committed violations of Sections 10(b) and 20(a) and Rule 10b-5 of the Securities Exchange Act of 1934 by making allegedly false and misleading statements about the Company’s business, operations, and prospects. The lawsuit seeks, among other things, compensatory damages in connection with the Company’s allegedly inflated stock price between May 7, 2013 and April 30, 2015, as well as attorneys' fees and costs. In addition, on April 26, 2017, a derivative action (Walker v. DeSisto, et al., 1:17-cv-10738) (“Walker”) was filed, and on October 13, 2017, a second
77
derivative action (Carnazza v. DeSisto, et al., 1:17-cv-11977) (“Carnazza”) was filed, both on behalf of the Company, each by a shareholder in the U.S. District Court for the District of Massachusetts against the Company (as a nominal defendant) and certain individual current and former officers and directors of the Company. Both actions were filed as related actions to the securities class action referenced above, and the allegations in the actions are substantially similar to those alleged in the securities class action. The actions seek, among other things, damages, disgorgement of certain types of compensation or profits, and attorneys’ fees and costs.
On December 14, 2017, following a series of negotiations, the Company, the individual defendants and their insurers reached an agreement in principle with the plaintiffs in the ATRS matter, individually and on behalf of the respective classes they purport to represent, to settle and release all claims with respect to the matter, subject to final court approval. Under the terms of the agreement in principle, a payment would be made to the plaintiffs and the classes they purport to represent. The Company has accrued fees and expenses in connection with this matter up to and including the amount of any expected residual settlement liability that would not be covered by insurance, and such amount is not material to the Company's consolidated financial statements. The parties have filed a motion for preliminary approval of the settlement with the court and it is currently under review. Although the Company currently believes that the settlement is likely to be consummated and approved, there can be no assurance that the settlement will receive court approval on the terms proposed by the parties. In the event that the settlement is not approved by the court, the Company would not be able to reasonably estimate the possible uninsured loss, or range of uninsured loss, to the Company in connection with an alternative resolution of this matter.
The Company is, from time to time, involved in the normal course of business in various legal proceedings, including intellectual property, contract, employment and product liability suits. Although the Company is unable to quantify the exact financial impact of any of these matters, the Company believes that none of these currently pending matters will have an outcome material to its financial condition or business.
Note
13
. Stock-Based Compensation and Stockholders' Equity
Stock-Based Compensation
The Company accounts for stock-based compensation under the provisions of ASC 718-10,
Compensation — Stock Compensation
(“ASC 718-10”), which requires all share-based payments to employees and directors, including grants of stock options and restricted stock units, to be recognized in the income statement based on their fair values. Share-based payments that contain performance conditions are recognized when such conditions are probable of being achieved.
The Company grants share-based awards to employees in the form of options to purchase the Company’s common stock, the ability to purchase stock at a discounted price under the employee stock purchase plan and restricted stock units. The Company uses the Black-Scholes option pricing model to determine the weighted-average fair value of options granted and determines the intrinsic value of restricted stock units based on the closing price of its common stock on the date of grant. The Company recognizes the compensation expense of share-based awards on a straight-line basis for awards with only service conditions and on an accelerated basis for awards with performance conditions. Compensation expense is recognized over the vesting period of the awards.
Stock-based compensation from continuing operations related to share-based awards recognized in the years ended December 31,
2017
,
2016
and
2015
was
$31.9 million
,
$23.8 million
and
$18.7 million
, respectively. At December 31,
2017
, the Company had
$41.2 million
of total unrecognized compensation expense related to unvested stock options and restricted stock units.
Equity Award Plans
In May 2007, in conjunction with the Company's initial public offering, the Company adopted its 2007 Stock Option and Incentive Plan (the "2007 Plan"). The 2007 Plan was amended and restated in November 2008, May 2012 and May 2015 to provide for the issuance of additional shares and to amend certain other provisions. Under the 2007 Plan, awards were granted to persons who were, at the time of grant, employees, officers, non-employee directors or key persons (including consultants and prospective employees) of the Company or the Company's subsidiaries. The 2007 Plan provided for the grant of stock options, restricted stock units, stock appreciation rights,
78
deferred stock awards, restricted stock, unrestricted stock, cash-based awards, performance share awards or dividend equivalent rights. Options granted under the 2007 Plan generally vest over a period of
four
years and expire
ten
years from the date of grant. In May 2017, the Company adopted the 2017 Stock Option and Incentive Plan (the "2017 Plan"), which has replaced the 2007 Plan as the means by which the Company makes equity and cash awards. Effective May 18, 2017, the 2017 Plan became effective (the "2017 Plan Effective Date") and the Company ceased granting awards from the 2007 Plan. Outstanding awards under the 2007 Plan remain subject to the terms of the 2007 Plan. Under the 2017 Plan, awards may be granted to persons who are, at the time of grant, employees, officers, non-employee directors, consultants, or advisers of the Company or the Company's subsidiaries and affiliates. The 2017 Plan provides for the grant of stock options, restricted stock units, stock appreciation rights, deferred stock awards, restricted stock, unrestricted stock, cash-based awards, performance share awards or dividend equivalent rights. Stock options granted under the 2017 Plan generally vest over a period of
four
years and expire
ten
years from the date of grant. Shares of stock subject to awards granted under the 2007 Plan and the 2017 Plan that are forfeited, expire or otherwise terminate without delivery generally become available for future issuance under the 2017 Plan.
As of December 31,
2017
,
5.1 million
shares remain available for future issuance under the 2017 Plan.
Stock Options
In the years ended December 31, 2017, 2016 and 2015, the Company awarded
34,500
,
65,000
and
194,500
shares of performance-based incentive stock options, respectively. These stock options were granted under the 2007 and 2017 Plans and vest over a
four
year period from the grant date with the potential of an accelerated vesting period pursuant to the achievement of certain performance conditions.
The determination of the fair value of share-based payment awards utilizing the Black-Scholes model is affected by the stock price and the following assumptions, including expected volatility, expected life of the awards, the risk-free interest rate, and the dividend yield.
|
•
|
Expected volatility measures the amount that a stock price has fluctuated or is expected to fluctuate during a period and is computed over expected terms based upon the historical volatility of the Company's stock.
|
|
•
|
The expected life of the awards is estimated based on the midpoint scenario, which combines historical exercise data with hypothetical exercise data for outstanding options, as the Company believes this data currently represents the best estimate of the expected life of a new employee option. The Company stratifies its employee population into two groups based upon organizational hierarchy.
|
|
•
|
The risk-free interest rate assumption is based on U.S. Treasury zero-coupon issues with remaining terms similar to the expected term on the options.
|
|
•
|
The dividend yield assumption is based on Company history and expectation of paying no dividends. The Company has never declared or paid any cash dividends and does not plan to pay cash dividends in the foreseeable future, and, therefore, used an expected dividend yield of zero in the valuation.
|
Forfeitures are estimated at the time of grant and revised, if necessary, in subsequent periods if actual forfeitures differ from those estimates. Stock-based compensation expense recognized in the financial statements is based on awards that are ultimately expected to vest. If the Company’s actual forfeiture rate is materially different from its estimate, the stock-based compensation expense could be significantly different from what the Company has recorded in the current period.
The Company evaluates the assumptions used to value the awards on a quarterly basis and if factors change and different assumptions are utilized, stock-based compensation expense may differ significantly from what has been recorded in the past. If there are any modifications or cancellations of the underlying unvested securities, the Company may be required to accelerate, increase or cancel any remaining unearned stock-based compensation expense.
79
The estimated grant date fair values of the employee stock options were calculated using the Black-Scholes option pricing model, based on the following assumptions:
|
|
Years Ended December 31,
|
||||
|
|
2017
|
2016
|
2015
|
||
|
Risk-free interest rate
|
1.66% - 1.85%
|
0.99% - 1.91%
|
1.16% - 1.75%
|
||
|
Expected term (in years)
|
4.7 - 5.3
|
5.1 - 5.4
|
4.9 - 5.3
|
||
|
Dividend yield
|
—
|
—
|
—
|
||
|
Expected volatility
|
38% - 39%
|
38% - 40%
|
37% - 38%
|
||
The weighted average grant date fair value per share of options granted for the years ended December 31,
2017
,
2016
and
2015
was
$17.28
,
$11.60
and
$11.09
, respectively.
The following summarizes the activity under the Company’s stock option plans:
|
Number of
Options (#)
|
Weighted Average
Exercise Price ($)
|
Weighted Average Remaining Contractual Term
|
Aggregate
Intrinsic
Value ($)
|
|||||||||
|
|
|
|
(In thousands)
|
|||||||||
|
Outstanding at December 31, 2016
|
3,441,303
|
|
$
|
32.27
|
|
|||||||
|
Granted
|
543,045
|
|
45.99
|
|
||||||||
|
Exercised
|
(505,207
|
)
|
27.72
|
|
$
|
11,846
|
|
|||||
|
Canceled
|
(101,921
|
)
|
34.29
|
|
||||||||
|
Outstanding at December 31, 2017
|
3,377,220
|
|
$
|
35.10
|
|
7.6
|
$
|
114,505
|
|
|||
|
Vested, December 31, 2017
|
1,934,398
|
|
$
|
33.51
|
|
7.0
|
$
|
68,654
|
|
|||
|
Vested or expected to vest, December 31, 2017
(1)
|
3,211,982
|
|
$
|
34.93
|
|
7.6
|
$
|
109,462
|
|
|||
|
(1)
|
Represents total outstanding stock options as of December 31,
2017
, adjusted for the estimated forfeiture.
|
The aggregate intrinsic value of stock options exercised was calculated based on the positive difference between the estimated fair value of the Company’s common stock and the exercise price of the underlying options. The aggregate intrinsic value of options exercised in the years ended December 31,
2016
and
2015
was
$4.6 million
and
$8.6 million
, respectively.
The aggregate intrinsic value for outstanding awards as of December 31, 2017 was calculated based on the positive difference between the Company’s closing stock price of
$69.00
on December 31, 2017 and the exercise price of the underlying options.
Employee stock-based compensation from continuing operations related to stock options in the years ended December 31,
2017
,
2016
and
2015
was
$11.6 million
,
$9.9 million
and
$9.1 million
, respectively, and was based on awards ultimately expected to vest. Stock-based compensation from discontinued operations related to stock options was not significant for these periods. At December 31,
2017
, the Company had
$15.5 million
of total unrecognized compensation expense related to stock options that will be recognized over a weighted average vesting period of
2.4
years.
Restricted Stock Units
In the years ended December 31,
2017
and
2016
, the Company awarded
436,066
and
592,783
restricted stock units, respectively, to certain employees and non-employee members of the Board of Directors, which included
169,394
and
154,991
restricted stock units, respectively, subject to the achievement of performance conditions (performance-based restricted stock units). For performance-based restricted stock units for which the performance criteria has not yet been achieved as of December 31,
2017
, the Company recognized stock compensation expense of
$5.9 million
and
$2.4 million
in
2017
and
2016
, respectively, as it expects a portion of the performance-based restricted stock units granted will be earned based on its evaluation of the performance criteria. An additional
$0.5 million
and
$1.0 million
of stock compensation expense was recognized in
2017
and
2016
, respectively, for performance-based restricted stock units for which the performance criteria had been achieved as of the end of these
80
periods. The restricted stock units generally vest annually over a
one
or
three
year period from the grant date, except for the performance-based restricted stock units, which follow different vesting patterns.
The restricted stock units granted in
2017
have a weighted average fair value of
$47.64
per share based on the closing price of the Company’s common stock on the date of grant. The restricted stock units granted during the year ended December 31,
2017
were valued at approximately
$20.8 million
on their grant date, and the Company is recognizing the compensation expense over the vesting period. Approximately
$13.3 million
,
$10.2 million
and
$8.1 million
of stock-based compensation expense from continuing operations related to the vesting of non-performance based restricted stock units was recognized in the years ended December 31,
2017
,
2016
and
2015
, respectively. Employee stock-based compensation expense from discontinued operations related to the vesting of non-performance based restricted stock was not significant for the three year period ended December 31, 2017.
Approximately
$25.7 million
of the fair value of restricted stock units, including performance-based restricted stock units, remained unrecognized as of December 31,
2017
and will be recognized over a weighted average period of
1.8
years. Under the terms of the awards, the Company will issue shares of common stock on each of the vesting dates.
The following table summarizes the status of the Company’s restricted stock units:
|
Number of
Shares (#)
|
Weighted
Average
Fair Value ($)
|
|||||
|
Outstanding at December 31, 2016
|
962,219
|
|
$
|
31.14
|
|
|
|
Granted
|
436,066
|
|
47.64
|
|
||
|
Vested
|
(386,284
|
)
|
31.79
|
|
||
|
Forfeited
|
(17,637
|
)
|
33.68
|
|
||
|
Outstanding at December 31, 2017
|
994,364
|
|
$
|
38.08
|
|
|
Employee Stock Purchase Plan
The Employee Stock Purchase Plan (“ESPP”) authorizes the issuance of up to a total of
380,000
shares of common stock to participating employees. The Company makes one or more offerings each year to eligible employees to purchase stock under the ESPP. Offering periods begin on the first business day occurring on or after each December 1 and June 1 and end on the last business day occurring on or before the following May 31 and November 30, respectively.
Each employee who is a participant in the Company’s ESPP may purchase up to a maximum of
800
shares per offering period or
$25,000
worth of common stock, valued at the start of the purchase period, per year by authorizing payroll deductions of up to
10%
of his or her base salary. Unless the participating employee withdraws from the offering period, his or her accumulated payroll deductions will be used to purchase common stock. The purchase price for each share purchased is
85%
of the lower of (i) the fair market value of the common stock on the first day of the offering period or (ii) the fair market value of the common stock on the last day of the offering period.
The Company issued
59,134
shares of common stock in
2017
,
30,949
shares of common stock in
2016
and
22,039
shares of common stock in
2015
to employees participating in the ESPP. The Company recorded approximately
$0.6 million
,
$0.2 million
and
$0.1 million
of stock-based compensation expense related to the ESPP in each of the years ended December 31,
2017
,
2016
and
2015
.
Stockholders' Equity
Shareholder Rights Plan
In November 2008, the Board of Directors of the Company adopted a shareholder rights plan (the "Shareholder Rights Plan”), as set forth in the Shareholder Rights Agreement between the Company and the rights agent, the purpose of which is, among other things, to enhance the ability of the Board of Directors to protect shareholder interests and to ensure that shareholders receive fair treatment in the event any coercive takeover attempt of the Company is made in the future. The Shareholder Rights Plan could make it more difficult for a third party to
81
acquire, or could discourage a third party from acquiring, the Company or a large block of the Company’s common stock. The Shareholder Rights Plan is scheduled to expire in November 2018.
In connection with the adoption of the Shareholder Rights Plan, the Board of Directors of the Company declared a dividend distribution of one preferred stock purchase right (a “Right”) for each outstanding share of common stock to stockholders of record as of the close of business on November 15, 2008. In addition, one Right will automatically attach to each share of common stock issued between November 15, 2008 and the distribution date. The Rights currently are not exercisable and are attached to and trade with the outstanding shares of common stock. Under the Shareholder Rights Plan, the Rights become exercisable if a person or group becomes an “acquiring person” by acquiring
15%
or more of the outstanding shares of common stock or if a person or group commences a tender offer that would result in that person or group owning
15%
or more of the common stock. The Board of Directors, from time to time, can and has taken action to allow certain shareholders to acquire more than
15%
of the outstanding shares of common stock under certain conditions. If a person or group becomes an “acquiring person,” each holder of a Right (other than the acquiring person) would be entitled to purchase, at the then-current exercise price, such number of shares of the Company’s preferred stock which are equivalent to shares of common stock having a value of twice the exercise price of the Right. If the Company is acquired in a merger or other business combination transaction after any such event, each holder of a Right would then be entitled to purchase, at the then-current exercise price, shares of the acquiring company’s common stock having a value of twice the exercise price of the Right.
The Insulet 401(k) Retirement Plan (the “401(k) Plan”) is a defined contribution plan in the form of a qualified 401(k) plan in which substantially all employees are eligible to participate upon hire. Eligible employees may elect to contribute
100%
of their eligible compensation up to the IRS maximum. The Company has the option of making both matching contributions and discretionary profit-sharing contributions to the 401(k) Plan. Since 2011, the Company has offered a discretionary match of
50%
for the first
6%
of an employee’s salary that was contributed to the 401(k) Plan. The Company match vests after the employee attains
one
year of service. The total amount contributed by the Company under the 401(k) Plan in continuing operations was
$3.0 million
,
$1.6 million
and
$1.6 million
for the years ended December 31,
2017
,
2016
and
2015
, respectively. Contributions in discontinued operations were not significant during those same periods.
Note
15
. Income Taxes
The Company accounts for income taxes in accordance with ASC 740-10,
Income Taxes
(“ASC 740-10”) under the asset and liability method, which requires the recognition of deferred tax assets and liabilities for the expected future tax consequences of events that have been included in the financial statements. Deferred tax assets and liabilities are determined based on differences between the financial reporting and tax bases of assets and liabilities and are measured using the enacted tax rates that will be in effect in the years in which the differences are expected to reverse. The Company reviews its deferred tax assets for recoverability considering historical profitability, projected future taxable income, and the expected timing of the reversals of existing temporary differences and tax planning strategies. The effect of a change in enacted tax rates on deferred tax assets and liabilities is recognized in income in the period that includes the enactment date. As of December 31, 2017, the Company had
no
uncertain tax positions.
On December 22, 2017, the President of the United States signed into law the Tax Cuts and Jobs Act ("Tax Reform Act"). The legislation significantly changes U.S. tax law by, among other things, lowering corporate income tax rates, implementing a territorial tax system, expanding the tax base and imposing a tax on deemed repatriated earnings of foreign subsidiaries. The Tax Reform Act permanently reduces the U.S. corporate federal income tax rate from a maximum of 35% to a flat 21% rate, effective January 1, 2018. The Company has recognized the impact of the Tax Reform Act in these consolidated financial statements and related disclosures. Staff Accounting Bulletin No. 118 ("SAB 118") provides Companies with guidance on accounting for the impact of the Tax Reform Act. Specifically, SAB 118 provides for a measurement period, not to exceed one year, that begins on the date of enactment of December 22, 2017, and ends when the Company has obtained, prepared, and analyzed information
82
needed to complete accounting requirements. In accordance with SAB 118, the Company recorded provisional amounts reflecting the impact of the Tax Reform Act in these consolidated financial statements and related disclosures. The impact of the remeasurement of the Company’s U.S. deferred tax assets and liabilities to 21% resulted in a tax benefit of approximately
$0.3 million
consisting of a reduction of the deferred tax assets of
$60.5 million
offset by a reduction in the valuation allowance of
$60.8 million
. The Company recorded
no
tax expense related to the deemed repatriation tax consisting of a reduction in net operating losses in 2017 of
$0.8 million
offset by a reduction in the valuation allowance of the
$0.8 million
. The impact of the deemed repatriation tax computation is still open due to finalization of the earnings and profits of the Company's foreign subsidiaries, as well as the Company’s evaluation of certain elections and guidance.
The Company files federal, state and foreign tax returns. These returns are generally open to examination by the relevant tax authorities from
two
to
four
years from the date they are filed or, in certain circumstances, from the end of the accounting period. The tax filings relating to the Company's federal and state tax returns are currently open to examination for tax years 2014 through 2016 and 2013 through 2016, respectively. In addition, the Company has generated tax losses since its inception in 2000. These years may be subject to examination if the losses are carried forward and utilized in future years.
At December 31,
2017
and
2016
, the Company provided a full valuation allowance against its domestic net deferred tax asset as, in the judgment of the Company, it is not more likely than not that the future tax benefit will be realized. In addition, the Company has a net deferred tax asset in foreign jurisdictions where no valuation allowance is recorded as, in the judgment of the Company, it is more likely than not that the future tax benefit will be realized.
Income tax expense from continuing operations consists of the following:
|
Years Ended December 31,
|
|||||||||||
|
(in thousands)
|
2017
|
2016
|
2015
|
||||||||
|
Current:
|
|||||||||||
|
Federal
|
$
|
—
|
|
$
|
—
|
|
$
|
—
|
|
||
|
State
|
151
|
|
52
|
|
72
|
|
|||||
|
Non-U.S.
|
603
|
|
539
|
|
321
|
|
|||||
|
Total current expense
|
754
|
|
591
|
|
393
|
|
|||||
|
Deferred:
|
|||||||||||
|
Federal
|
(347
|
)
|
—
|
|
—
|
|
|||||
|
State
|
91
|
|
—
|
|
—
|
|
|||||
|
Non-U.S.
|
(241
|
)
|
(199
|
)
|
(181
|
)
|
|||||
|
Total deferred expense
|
(497
|
)
|
(199
|
)
|
(181
|
)
|
|||||
|
Total income tax expense
|
$
|
257
|
|
$
|
392
|
|
$
|
212
|
|
||
83
Income tax expense from discontinued operations was
$0.4 million
for the year ended December 31, 2016 and was primarily generated from federal deferred taxes. Income tax expense from discontinued operations was
not
significant for the year ended December 31, 2015.
The following table reconciles the federal statutory income rate to the Company's effective income tax rate:
|
|
Year Ended December 31,
|
|||||||
|
|
2017
|
2016
|
2015
|
|||||
|
Tax at U.S. statutory rate
|
34.00
|
%
|
34.00
|
%
|
34.00
|
%
|
||
|
Changes from statutory rate:
|
||||||||
|
State taxes, net of federal benefit
|
10.21
|
|
(10.86
|
)
|
3.06
|
|
||
|
Tax credits
|
13.28
|
|
0.03
|
|
1.51
|
|
||
|
Permanent items
|
(0.55
|
)
|
(11.03
|
)
|
(2.09
|
)
|
||
|
Change in enacted rates
|
0.98
|
|
—
|
|
—
|
|
||
|
Change in valuation allowance
|
(57.91
|
)
|
(13.45
|
)
|
(37.11
|
)
|
||
|
Other
|
(0.98
|
)
|
(0.15
|
)
|
0.28
|
|
||
|
Effective income tax rate
|
(0.97
|
)%
|
(1.46
|
)%
|
(0.35
|
)%
|
||
Pre-tax income attributable to the Company's operations located outside the U.S. was approximately
$1.1 million
,
$0.8 million
and
$0.3 million
for
2017
,
2016
and
2015
, respectively. In general, it is the Company's practice and intention to reinvest the earnings of its non-U.S. subsidiaries in those operations. As of December 31,
2017
, the Company has chosen to indefinitely reinvest approximately
$6.4 million
of earnings of certain of its non-U.S. subsidiaries. To the extent the Company repatriates its foreign earnings, certain withholding taxes and state taxes may apply. No provision has been recorded for taxes that could be incurred upon repatriation. The deferred tax liability related to repatriation of these earnings would not be material to the company's consolidated financial statements.
84
Significant components of the Company’s deferred tax assets (liabilities) consists of the following:
|
|
Year Ended December 31,
|
||||||
|
(in thousands)
|
2017
|
2016
|
|||||
|
Deferred tax assets:
|
|||||||
|
Net operating loss carryforwards
|
$
|
129,184
|
|
$
|
169,203
|
|
|
|
Start up expenditures
|
462
|
|
929
|
|
|||
|
Tax credits
|
12,705
|
|
8,007
|
|
|||
|
Provision for bad debts
|
824
|
|
1,330
|
|
|||
|
Depreciation and amortization
|
3,068
|
|
6,368
|
|
|||
|
Capital loss carryforwards
|
12,850
|
|
18,961
|
|
|||
|
Stock-based compensation
|
9,799
|
|
10,359
|
|
|||
|
Other
|
4,449
|
|
4,701
|
|
|||
|
Total deferred tax assets
|
$
|
173,341
|
|
$
|
219,858
|
|
|
|
Deferred tax liabilities:
|
|||||||
|
Prepaid assets
|
$
|
(1,326
|
)
|
$
|
(1,173
|
)
|
|
|
Amortization of acquired intangibles
|
(5
|
)
|
(33
|
)
|
|||
|
Amortization of debt discount
|
(43,083
|
)
|
(25,977
|
)
|
|||
|
Goodwill
|
(633
|
)
|
(855
|
)
|
|||
|
Other
|
(259
|
)
|
(313
|
)
|
|||
|
Total deferred tax liabilities
|
$
|
(45,306
|
)
|
$
|
(28,351
|
)
|
|
|
Valuation allowance
|
$
|
(127,927
|
)
|
$
|
(191,922
|
)
|
|
|
Net deferred tax liabilities
|
$
|
108
|
|
$
|
(415
|
)
|
|
The Company has recorded a deferred tax liability related to the tax basis in acquired goodwill that is not amortized for financial reporting purposes. The deferred tax liability will only reverse at the time of further impairment of the goodwill. Due to the uncertain timing of this reversal, the temporary difference cannot be considered as a source of future taxable income for purposes of determining a valuation allowance. Therefore, the deferred tax liability cannot be used to offset the deferred tax asset related to the net operating loss carryforward for tax purposes. The Tax Reform Act limits certain deductions and these limitations may impact the value of existing deferred tax assets. The Company will continue to review the impact of these limitations as regulatory guidance is issued.
A valuation allowance is required to reduce the deferred tax assets reported if, based on the weight of the evidence, it is more likely than not that some portion or all of the U.S. deferred tax assets will not be realized. After consideration of the available evidence, both positive and negative, the Company has determined that a
$127.9 million
valuation allowance at December 31,
2017
is necessary to reduce the deferred tax assets to the amount that will more likely than not be realized. The Company provided a valuation allowance for the full amount of its domestic net deferred tax asset for the years ended December 31,
2017
and
2016
because it is not more likely than not that the future tax benefit will be realized. In the year ended December 31,
2017
, the Company’s valuation allowance decreased to
$127.9 million
from the balance at December 31,
2016
of
$191.9 million
. The change in the valuation allowance is primarily attributable to the reduction in the U.S. federal tax rate from 34% to 21% as a result of the 2017 Tax Reform Act, which had an impact of reducing the valuation allowance by approximately
$60.8 million
. Additional movement in the valuation allowance from December 31, 2016 to December 31, 2017 is comprised of an increase of approximately
$15.6 million
to offset current year net deferred tax asset and liability changes, a decrease of approximately
$42.6 million
to offset the net deferred tax liability related to the debt discount and deferred financing costs related to the Company’s
1.375%
Notes issued during the year ended December 31, 2017, and an increase of approximately
$23.8 million
increase related to the adoption of ASU 2016-09 related to accounting for stock-based compensation.
85
At December 31,
2017
, the Company had approximately
$543.6 million
,
$250.6 million
and
$12.7 million
of gross federal net operating loss carryforwards, state net operating loss carryforwards and research and development and other tax credits, respectively. If not utilized, these federal carryforwards will begin to expire in 2020 and will continue to expire through 2037, and the state carryforwards will continue to expire through 2037. At December 31, 2016, the Company had approximately
$535.7 million
,
$216.2 million
and
$8.0 million
of federal net operating loss carryforwards, state net operating loss carryforwards and research and development and other tax credits, respectively from continuing operations. The utilization of such net operating loss carryforwards and the realization of tax benefits in future years depends predominantly upon the Company's ability to generate taxable income. Under the provisions of the Internal Revenue Code, certain substantial changes in the Company's ownership may result in a limitation on the amount of net operating loss carryforwards which may be used in future years whereby there would be a yearly limitation placed on the amount of net operating loss available for use in future years. Additionally, it is probable that a portion of the research and development tax credit carryforward may not be available to offset future income.
As a result of certain realization requirements of ASC 718, the table of deferred tax assets and liabilities does not include certain deferred tax assets as of December 31,
2016
that arose directly from tax deductions related to equity compensation greater than compensation recognized for financial reporting. Upon adoption of ASU 2016-09 on January 1, 2017, the Company recorded
$23.8 million
of deferred tax assets, less a full valuation allowance related to these amounts.
Basic net loss per share is computed by dividing net loss by the weighted average number of common shares outstanding for the period, excluding unvested restricted common shares. Diluted net loss per share is computed using the weighted average number of common shares outstanding and, when dilutive, potential common share equivalents from options, restricted stock units and warrants (using the treasury-stock method), and potential common shares from convertible securities (using the if-converted method). Because the Company reported a net loss for the years ended December 31,
2017
,
2016
and
2015
, all potential dilutive common shares have been excluded from the computation of the diluted net loss per share for all periods presented, as the effect would have been anti-dilutive.
Potential dilutive common share equivalents consist of the following:
|
Years Ended December 31,
|
||||||||
|
|
2017
|
2016
|
2015
|
|||||
|
1.375% Convertible Senior Notes
|
4,319,429
|
|
—
|
|
—
|
|
||
|
2.00% Convertible Senior Notes
|
78,783
|
|
1,442,433
|
|
4,327,257
|
|
||
|
1.25% Convertible Senior Notes
|
5,910,954
|
|
5,910,954
|
|
—
|
|
||
|
Unvested restricted stock units
|
994,364
|
|
962,219
|
|
811,965
|
|
||
|
Outstanding stock options
|
3,377,220
|
|
3,441,303
|
|
2,999,199
|
|
||
|
Total dilutive common shares
|
14,680,750
|
|
11,756,909
|
|
8,138,421
|
|
||
Note
17
. Segment Reporting
As further described in Note 2, the Company has concluded that it operates as
one
segment. Worldwide revenue for the Company's products is categorized as follows:
|
Years Ended December 31,
|
|||||||||||
|
(in thousands)
|
2017
|
2016
|
2015
|
||||||||
|
U.S. Omnipod
|
$
|
271,597
|
|
$
|
229,785
|
|
$
|
189,604
|
|
||
|
International Omnipod
|
119,953
|
|
71,889
|
|
40,339
|
|
|||||
|
Drug Delivery
|
72,218
|
|
65,315
|
|
33,950
|
|
|||||
|
Total
|
$
|
463,768
|
|
$
|
366,989
|
|
$
|
263,893
|
|
||
86
Geographic information about revenue, based on the region of the customer's shipping location, is as follows:
|
Years Ended December 31,
|
|||||||||||
|
(in thousands)
|
2017
|
2016
|
2015
|
||||||||
|
United States
|
$
|
343,815
|
|
$
|
295,100
|
|
$
|
223,554
|
|
||
|
All other
|
119,953
|
|
71,889
|
|
40,339
|
|
|||||
|
Total
|
$
|
463,768
|
|
$
|
366,989
|
|
$
|
263,893
|
|
||
Geographic information about long-lived assets, net, excluding goodwill and other intangible assets is as follows:
|
(in thousands)
|
December 31, 2017
|
December 31, 2016
|
|||||
|
United States
|
$
|
89,404
|
|
$
|
19,341
|
|
|
|
China
|
18,217
|
|
25,431
|
|
|||
|
Other
|
434
|
|
197
|
|
|||
|
Total
|
$
|
108,055
|
|
$
|
44,969
|
|
|
On July 7, 2015, the Company executed an asset purchase agreement with GlaxoSmithKline ("GSK") whereby the Company acquired GSK's assets associated with the Canadian distribution of the Company's products. The acquisition was accounted for as a business combination. With the acquisition, the Company assumed all distribution, sales, marketing, training and support activities for the Omnipod System in Canada through its wholly-owned subsidiary, Insulet Canada Corporation. The acquisition allowed the Company to establish a local presence in Canada that enabled it to engage directly with healthcare providers and Omnipod users.
The aggregate purchase price of approximately
$4.7 million
consisted of cash paid at closing and was allocated to the fair value of assets acquired and liabilities assumed as follows:
|
(in thousands)
|
|||
|
Goodwill
|
$
|
2,403
|
|
|
Contractual relationships
|
2,100
|
|
|
|
Inventory step-up
|
230
|
|
|
|
Assumed liabilities
|
(18
|
)
|
|
|
$
|
4,715
|
|
|
Note
19
. Discontinued Operations
In February 2016, the Company sold Neighborhood Diabetes to Liberty Medical for approximately
$6.2 million
in cash, which included
$1.2 million
of closing adjustments finalized in June 2016 and paid by Liberty Medical. The results of operations, assets, and liabilities of Neighborhood Diabetes, are classified as discontinued operations for all periods presented, except for certain corporate overhead costs which remain in continuing operations.
In connection with the 2016 disposition, the Company entered into a transition services agreement pursuant to which various services were provided to Liberty Medical on an interim transitional basis. Total expenses incurred for such transition services were
$0.9 million
for the year ended December 31, 2016.
Following the disposition, the Company entered into a distribution agreement with the Neighborhood Diabetes subsidiary of Liberty Medical to continue to act as a distributor for the Company's products. Omnipod sales transacted through Neighborhood Diabetes prior to the divestiture that were previously eliminated in consolidation were
$0.3 million
and
$2.8 million
for the years ended December 31,
2016
and
2015
, respectively. These amounts
87
were historically reported in the Neighborhood Diabetes revenue results and are being presented based on current market terms of products sold to the Neighborhood Diabetes subsidiary of Liberty Medical. Post divestiture, Omnipod System sales to the Neighborhood Diabetes subsidiary of Liberty Medical were
$0.4 million
for the year ended December 31, 2016.
The following is a summary of the operating results of Neighborhood Diabetes included in discontinued operations for the year ended December 31,
2016
and
2015
:
|
|
Years Ended December 31,
|
|||||||
|
(In thousands)
|
2016
|
2015
|
||||||
|
Discontinued operations:
|
||||||||
|
Revenue
(1)
|
$
|
7,730
|
|
$
|
60,332
|
|
||
|
Cost of revenue
|
5,468
|
|
45,449
|
|
||||
|
Gross profit
|
2,262
|
|
14,883
|
|
||||
|
Operating expenses:
|
||||||||
|
Sales and marketing
|
1,542
|
|
9,945
|
|
||||
|
General and administrative
(2) (3)
|
1,853
|
|
16,967
|
|
||||
|
Total operating expenses
|
3,395
|
|
26,912
|
|
||||
|
Operating loss
|
(1,133
|
)
|
(12,029
|
)
|
||||
|
Interest and other income (expense), net
|
(128
|
)
|
190
|
|
||||
|
Loss from discontinued operations before taxes
|
(1,261
|
)
|
(11,839
|
)
|
||||
|
Income tax expense
|
408
|
|
79
|
|
||||
|
Net loss from discontinued operations
|
$
|
(1,669
|
)
|
$
|
(11,918
|
)
|
||
(1)
Revenue for the year ended December 31, 2016 includes revenue from operations of Neighborhood Diabetes through the date of sale in February 2016.
(2)
Included in general and administration expenses for the year ended December 31, 2015 was a charge of
$9.1 million
related to the impairment of Neighborhood Diabetes asset group.
(3)
Included in general and administration expenses for the year ended December 31, 2015 was
$0.5 million
of stock-based compensation expense from discontinued operations related to share-based awards. Stock-based compensation expense from discontinued operations related to share-based awards was not significant for the year ended December 31, 2016.
Depreciation and amortization expense included in discontinued operations was
$0.0 million
,
$0.1 million
, and
$3.3 million
for the years ended December 31,
2017
,
2016
and
2015
, respectively. There were no assets or liabilities presented as discontinued operations as of December 31, 2017 or December 31, 2016. Net operating cash flows used in discontinued operations in the years ended December 31,
2017
,
2016
and 2015 were
$0.0 million
,
$2.0 million
, and
$3.2 million
, respectively.
20. Quarterly Data (Unaudited)
|
|
2017 Quarters Ended
|
||||||||||||||
|
|
December 31
|
September 30
|
June 30
|
March 31
|
|||||||||||
|
(In thousands, except per share data)
|
|||||||||||||||
|
Revenue
|
$
|
130,524
|
|
$
|
121,775
|
|
$
|
109,756
|
|
$
|
101,713
|
|
|||
|
Gross profit
|
79,508
|
|
73,624
|
|
64,639
|
|
59,398
|
|
|||||||
|
Operating (loss) income
|
(768
|
)
|
2,047
|
|
(3,358
|
)
|
(5,308
|
)
|
|||||||
|
Net loss
|
$
|
(6,860
|
)
|
$
|
(2,227
|
)
|
$
|
(7,767
|
)
|
$
|
(9,977
|
)
|
|||
|
Net loss per share
|
$
|
(0.12
|
)
|
$
|
(0.04
|
)
|
$
|
(0.13
|
)
|
$
|
(0.17
|
)
|
|||
88
|
2016 Quarters Ended
|
|||||||||||||||
|
|
December 31
(1)
|
September 30
|
June 30
|
March 31
|
|||||||||||
|
(In thousands, except per share data)
|
|||||||||||||||
|
Revenue
|
$
|
103,575
|
|
$
|
94,871
|
|
$
|
87,330
|
|
$
|
81,213
|
|
|||
|
Gross profit
|
60,937
|
|
55,641
|
|
50,457
|
|
44,051
|
|
|||||||
|
Operating (loss) income
|
(4,135
|
)
|
2,418
|
|
(1,288
|
)
|
(7,699
|
)
|
|||||||
|
Net loss from continuing operations, net of taxes
|
(9,153
|
)
|
(3,017
|
)
|
(4,351
|
)
|
(10,689
|
)
|
|||||||
|
Income (loss) from discontinued operations, net of taxes
|
34
|
|
(64
|
)
|
153
|
|
(1,792
|
)
|
|||||||
|
Net loss
|
$
|
(9,119
|
)
|
$
|
(3,081
|
)
|
$
|
(4,198
|
)
|
$
|
(12,481
|
)
|
|||
|
Net loss per share from continuing operations
|
$
|
(0.16
|
)
|
$
|
(0.05
|
)
|
$
|
(0.08
|
)
|
$
|
(0.19
|
)
|
|||
|
Net loss per share from discontinued operations
|
$
|
—
|
|
$
|
—
|
|
$
|
—
|
|
$
|
(0.03
|
)
|
|||
|
(1)
|
Included in net loss from continuing operations for the fourth quarter of 2016 was a charge of
$6.1 million
related to in-process internally developed software.
|
89
SCHEDULE II — VALUATION AND QUALIFYING ACCOUNTS
The following table sets forth activities in the Company's accounts receivable reserve and deferred tax valuation allowance accounts:
|
Description
|
Balance at
Beginning of
Period
|
Additions Charged
to Costs and
Expenses
|
Deductions
|
Balance at
End
of Period
|
|||||||||||
|
(In thousands)
|
|||||||||||||||
|
Year Ended December 31, 2017
|
|||||||||||||||
|
Allowance for doubtful accounts
|
$
|
2,911
|
|
$
|
1,923
|
|
$
|
2,293
|
|
$
|
2,541
|
|
|||
|
Deferred tax valuation allowance
|
$
|
191,922
|
|
$
|
14,232
|
|
$
|
78,227
|
|
$
|
127,927
|
|
|||
|
Year Ended December 31, 2016
|
|||||||||||||||
|
Allowance for doubtful accounts
(1)
|
$
|
4,454
|
|
$
|
2,069
|
|
$
|
3,612
|
|
$
|
2,911
|
|
|||
|
Deferred tax valuation allowance
(1)
|
$
|
193,405
|
|
$
|
7,599
|
|
$
|
9,082
|
|
$
|
191,922
|
|
|||
|
Year Ended December 31, 2015
|
|||||||||||||||
|
Allowance for doubtful accounts
(1)
|
$
|
5,837
|
|
$
|
1,184
|
|
$
|
2,567
|
|
$
|
4,454
|
|
|||
|
Deferred tax valuation allowance
(1)
|
$
|
165,020
|
|
$
|
28,418
|
|
$
|
33
|
|
$
|
193,405
|
|
|||
(1)
Includes the amount classified as discontinued operations on the consolidated balance sheet and related activity.
90
None.
Disclosure Controls and Procedures
Our management, with the participation of our chief executive officer and chief financial officer, evaluated the effectiveness of our disclosure controls and procedures as of December 31,
2017
. The term “disclosure controls and procedures,” as defined in Rules 13a-15(e) and 15d-15(e) under the Securities Exchange Act of 1934, as amended (the “Exchange Act”) means controls and other procedures of a company that are designed to ensure that information required to be disclosed by a company in the reports that it files or submits under the Exchange Act is recorded, processed, summarized and reported, within the time periods specified in the Securities and Exchange Commission’s rules and forms. Disclosure controls and procedures include, without limitation, controls and procedures designed to ensure that information required to be disclosed by a company in the reports that it files or submits under the Exchange Act is accumulated and communicated to the company’s management, including its principal executive and principal financial officers, as appropriate to allow timely decisions regarding required disclosure. Management recognizes that any controls and procedures, no matter how well designed and operated, can provide only reasonable assurance of achieving their objectives and management necessarily applies its judgment in evaluating the cost-benefit relationship of possible controls and procedures. Based on the evaluation of our disclosure controls and procedures as of December 31,
2017
, our chief executive officer and chief financial officer concluded that, as of such date, our disclosure controls and procedures were effective at a reasonable assurance level.
Changes in Internal Control Over Financial Reporting
There were no changes in our internal control over financial reporting during the three months ended December 31,
2017
that have materially affected, or are reasonably likely to materially affect, our internal control over financial reporting.
Management's Annual Report on Internal Control Over Financial Reporting
Our management is responsible for establishing and maintaining adequate internal control over financial reporting as such term is defined in Exchange Act Rule 13a — 15(f). Our internal control system was designed to provide reasonable assurance to our management and the Board of Directors regarding the preparation and fair presentation of published financial statements. All internal control systems, no matter how well designed have inherent limitations. Therefore, even those systems determined to be effective can provide only reasonable assurance with respect to financial statement preparation and presentation. Our management assessed the effectiveness of our internal control over financial reporting as of December 31,
2017
. In making this assessment, our management used the criteria set forth by the Committee of Sponsoring Organizations of the Treadway Commission 2013 (“COSO”) in Internal Control — Integrated Framework (the COSO criteria).
Based on our assessment we believe that, as of December 31,
2017
, our internal control over financial reporting is effective based on those criteria. The effectiveness of our internal control over financial reporting as of December 31,
2017
has been audited by Grant Thornton LLP, an independent registered public accounting firm, as stated in their report which appears below.
91
Report of Independent Registered Public Accounting Firm
Board of Directors and Shareholders
Insulet Corporation
Opinion on internal control over financial reporting
We have audited the internal control over financial reporting of Insulet Corporation (a Delaware corporation) and subsidiaries (the “Company”) as of December 31, 2017, based on criteria established in the 2013
Internal Control-Integrated Framework
issued by the Committee of Sponsoring Organizations of the Treadway Commission (COSO). In our opinion, the Company maintained, in all material respects, effective internal control over financial reporting as of December 31, 2017, based on criteria established in the 2013
Internal Control-Integrated Framework
issued by COSO.
We also have audited, in accordance with the standards of the Public Company Accounting Oversight Board (United States) (“PCAOB”), the consolidated financial statements of the Company as of and for the year ended December 31, 2017, and our report dated
February 21, 2018
expressed an unqualified opinion on those financial statements.
Basis for opinion
The Company’s management is responsible for maintaining effective internal control over financial reporting and for its assessment of the effectiveness of internal control over financial reporting, included in the accompanying Management’s Annual Report on Internal Control Over Financial Reporting. Our responsibility is to express an opinion on the Company’s internal control over financial reporting based on our audit. We are a public accounting firm registered with the PCAOB and are required to be independent with respect to the Company in accordance with the U.S. federal securities laws and the applicable rules and regulations of the Securities and Exchange Commission and the PCAOB.
We conducted our audit in accordance with the standards of the PCAOB. Those standards require that we plan and perform the audit to obtain reasonable assurance about whether effective internal control over financial reporting was maintained in all material respects. Our audit included obtaining an understanding of internal control over financial reporting, assessing the risk that a material weakness exists, testing and evaluating the design and operating effectiveness of internal control based on the assessed risk, and performing such other procedures as we considered necessary in the circumstances. We believe that our audit provides a reasonable basis for our opinion.
Definition and limitations of internal control over financial reporting
A company’s internal control over financial reporting is a process designed to provide reasonable assurance regarding the reliability of financial reporting and the preparation of financial statements for external purposes in accordance with generally accepted accounting principles. A company’s internal control over financial reporting includes those policies and procedures that (1) pertain to the maintenance of records that, in reasonable detail, accurately and fairly reflect the transactions and dispositions of the assets of the company; (2) provide reasonable assurance that transactions are recorded as necessary to permit preparation of financial statements in accordance with generally accepted accounting principles, and that receipts and expenditures of the company are being made only in accordance with authorizations of management and directors of the company; and (3) provide reasonable assurance regarding prevention or timely detection of unauthorized acquisition, use, or disposition of the company’s assets that could have a material effect on the financial statements.
Because of its inherent limitations, internal control over financial reporting may not prevent or detect misstatements. Also, projections of any evaluation of effectiveness to future periods are subject to the risk that controls may become inadequate because of changes in conditions, or that the degree of compliance with the policies or procedures may deteriorate.
/s/ GRANT THORNTON LLP
Boston, Massachusetts
February 21, 2018
92
None.
Certain information required by this Item 10 relating to our directors, executive officers and corporate governance is incorporated by reference herein from our proxy statement in connection with our
2018
annual meeting of stockholders, which proxy statement will be filed with the Securities and Exchange Commission (the “SEC”) not later than 120 days after the close of our year ended December 31,
2017
.
Certain information required by this Item 11 relating to remuneration of directors and executive officers and other transactions involving management is incorporated by reference herein from our proxy statement in connection with our
2018
annual meeting of stockholders, which proxy statement will be filed with the Securities and Exchange Commission not later than 120 days after the close of our year ended December 31,
2017
.
Certain information required by this Item 12 relating to security ownership of certain beneficial owners and management is incorporated by reference herein from our proxy statement in connection with our
2018
annual meeting of stockholders, which proxy statement will be filed with the Securities and Exchange Commission not later than 120 days after the close of our fiscal year ended December 31,
2017
. For information on securities authorized for issuance under equity compensation plans, see the section entitled “Market for Registrant’s Common Equity, Related Stockholders Matters, and Issuer Purchases of Equity Securities “ in Part II, Item 5, in this Annual Report on Form 10-K.
Certain information required by this Item 13 relating to certain relationships and related transactions, and director independence is incorporated by reference herein from our proxy statement in connection with our
2018
annual meeting of stockholders, which proxy statement will be filed with the Securities and Exchange Commission not later than 120 days after the close of our year ended December 31,
2017
.
Certain information required by this Item 14 regarding principal accounting fees and services is set forth under “Principal Accounting Fees and Services” in our proxy statement in connection with our
2018
annual meeting of stockholders, which proxy statement will be filed with the Securities and Exchange Commission not later than 120 days after the close of our year ended December 31,
2017
.
93
|
(A)(1) FINANCIAL STATEMENTS
|
||
|
The following consolidated financial statements of Insulet Corporation are included in Item 8 hereof:
|
||
|
Report of Independent Registered Public Accounting Firm
|
||
|
Consolidated Balance Sheets - Years ended December 31, 2017 and 2016
|
||
|
Consolidated Statements of Operations - Years ended December 31, 2017, 2016 and 2015
|
||
|
Consolidated Statements of Comprehensive Loss - Years ended December 31, 2017, 2016 and 2015
|
||
|
Consolidated Statements of Stockholders' Equity - Years ended December 31, 2017, 2016 and 2015
|
||
|
Consolidated Statements of Cash Flows - Years ended December 31, 2017, 2016 and 2015
|
||
|
Notes to Consolidated Financial Statements
|
||
|
(A)(2) FINANCIAL STATEMENT SCHEDULES
|
||
|
Certain schedules to the consolidated financial statements have been omitted if they were not required by Article 9 of Regulation S-X or if, under the related instructions, they were inapplicable, or the information was contained elsewhere herein.
|
||
|
(A)(3) EXHIBITS
|
||
|
The exhibits listed in the Exhibit Index following the signature page of this Form 10-K are filed herewith or are incorporated herein by reference to other SEC filings.
|
||
None.
SIGNATURES
Pursuant to the requirements of Section 13 or 15(d) of the Securities Exchange Act of 1934, the Registrant has caused this report to be signed on its behalf by the undersigned thereunto duly authorized.
|
INSULET CORPORATION
(Registrant)
|
|
|
February 21, 2018
|
/s/ Patrick J. Sullivan
|
|
Patrick J. Sullivan
|
|
|
Chief Executive Officer
(Principal Executive Officer)
|
|
|
February 21, 2018
|
/s/ Michael L. Levitz
|
|
Michael L. Levitz
|
|
|
Chief Financial Officer
(Principal Financial and Accounting Officer)
|
|
94
POWER OF ATTORNEY AND SIGNATURES
We, the undersigned officers and directors of Insulet Corporation, hereby severally constitute and appoint Patrick J. Sullivan and Michael L. Levitz, and each of them singly, our true and lawful attorneys, with full power to them and each of them singly, to sign for us in our names in the capacities indicated below, on all amendments to this Report, and generally to do all things in our names and on our behalf in such capacities to enable Insulet Corporation to comply with the provisions of the Securities Exchange Act of 1934, as amended, and all requirements of the Securities and Exchange Commission.
Pursuant to the requirements of the Securities Exchange Act of 1934, this Report has been signed below by the following persons on behalf of the Registrant and in the capacities on
February 21, 2018
.
|
Signature
|
|
Title
|
|
/s/ Patrick J. Sullivan
|
Chief Executive Officer
|
|
|
Patrick J. Sullivan
|
|
(Principal Executive Officer)
|
|
/s/ Michael L. Levitz
|
Chief Financial Officer
|
|
|
Michael L. Levitz
|
|
(Principal Financial and Accounting Officer)
|
|
/s/ Sally Crawford
|
||
|
Sally Crawford
|
|
Director
|
|
/s/ John Fallon, M.D.
|
||
|
John Fallon, M.D.
|
|
Director
|
|
/s/ Dr. Jessica Hopfield
|
||
|
Dr. Jessica Hopfield
|
|
Director
|
|
/s/ David A. Lemoine
|
||
|
David Lemoine
|
|
Director
|
|
/s/ Timothy J. Scannell
|
||
|
Timothy J. Scannell
|
Director
|
|
|
/s/ Michael R. Minogue
|
||
|
Michael R. Minogue
|
|
Director
|
|
/s/ James C. Mullen
|
||
|
James C. Mullen
|
|
Director
|
95
EXHIBIT INDEX
Listed and indexed below are all Exhibits filed as part of this report.
|
Number
|
Description
|
|
3.1
|
|
|
3.2
|
|
|
4.1
|
|
|
4.2
|
|
|
4.3
|
|
|
4.4
|
|
|
4.5
|
|
|
4.6
|
|
|
4.7
|
|
|
4.8
|
|
|
4.9
|
|
|
10.1
|
|
|
10.2
|
|
|
10.3
|
|
|
10.4
|
|
|
10.5
|
|
|
10.6
|
|
96
|
10.7
|
|
|
10.8
|
|
|
10.9
|
|
|
10.10
|
|
|
10.11
|
|
|
10.12
|
|
|
10.13
|
|
|
10.14
|
|
|
10.15
|
|
|
10.16
|
|
|
10.17
|
|
|
10.18
|
|
|
10.19
|
|
|
10.20
|
|
|
10.21
|
|
|
10.22
|
|
|
10.23
|
|
97
|
10.24
|
|
|
10.25
|
|
|
10.26
|
|
|
10.27
|
|
|
10.28
|
|
|
10.29
|
|
|
10.30
|
|
|
10.31
|
|
|
10.32
|
|
|
10.33
|
|
|
10.34
|
|
|
10.35
|
|
|
10.36
|
|
|
10.37
|
|
|
10.38
|
|
|
10.39
|
|
|
10.40
|
|
98
|
10.41
|
|
|
10.42
|
|
|
10.43
|
|
|
10.44
|
|
|
10.45
|
|
|
10.46
|
|
|
10.47
|
|
|
10.48
|
|
|
10.49
|
|
|
10.50
|
|
|
10.51
|
|
|
10.52
|
|
|
10.53
|
|
|
10.54
|
|
|
10.55+
|
|
|
10.56+
|
|
|
10.57+
|
|
|
10.58+
|
|
|
10.59+
|
|
99
|
10.60
|
|
|
10.61+
|
|
|
21.1
|
|
|
23.1
|
|
|
23.2
|
|
|
24.1
|
|
|
31.1
|
|
|
31.2
|
|
|
32.1*
|
|
|
101
|
The following materials from Insulet Corporation’s Annual Report on Form 10-K for the year ended December 31, 2017 formatted in XBRL (eXtensible Business Reporting Language): (i) the Consolidated Balance Sheets; (ii) the Consolidated Statements of Operations; (iii) the Consolidated Statements of Comprehensive Loss; (iv) the Consolidated Statements of Stockholders’ Equity; (v) the Consolidated Statements of Cash Flows
|
|
*
|
This certification shall not be deemed “filed” for purposes of Section 18 of the Securities Exchange Act of 1934, or otherwise subject to the liability of that Section, nor shall it be deemed to be incorporated by reference into any filing under the Securities Act of 1933 or the Securities Exchange Act of 1934.
|
|
+
|
Confidential treatment granted as to certain portions of this exhibit.
|
100
TABLE OF CONTENTS
Part IItem 1. BusinessItem 1A. Risk FactorsItem 1B. Unresolved Staff CommentsItem 2. PropertiesItem 3. Legal ProceedingsItem 4. Mine Safety DisclosuresPart IIItem 5. Market For Registrant's Common Equity, Related Stockholder Matters and Issuer Purchases Of Equity SecuritiesItem 6. Selected Financial DataItem 7. Management's Discussion and Analysis Of Financial Condition and Results Of OperationsItem 7A. Quantitative and Qualitative Disclosures About Market RiskItem 8. Financial Statements and Supplementary DataNote 1. Nature Of The BusinessNote 2. Summary Of Significant Accounting PoliciesNote 3. Fair Value MeasurementsNote 4. InvestmentsNote 5. Accounts Receivable, NetNote 6. InventoriesNote 7. Property and Equipment, NetNote 8. Other Intangible Assets, NetNote 9. Accrued Expenses and Other Current LiabilitiesNote 10. Capital Lease ObligationsNote 11. Convertible DebtNote 12. Commitments and ContingenciesNote 13. Stock-based Compensation and Stockholders' EquityNote 14. Defined Contribution PlanNote 15. Income TaxesNote 16. Net Loss Per ShareNote 17. Segment ReportingNote 18. Business CombinationNote 19. Discontinued OperationsItem 9. Changes in and Disagreements with Accountants on Accounting and Financial DisclosureItem 9A. Controls and ProceduresItem 9B. Other InformationPart IIIItem 10. Directors, Executive Officers and Corporate GovernanceItem 11. Executive CompensationItem 12. Security Ownership Of Certain Beneficial Owners and Management and Related Stockholder MattersItem 13. Certain Relationships and Related Transactions, and Director IndependenceItem 14. Principal Accounting Fees and ServicesItem 15. Exhibits, Financial Statement SchedulesItem 16. Form 10-k Summary