POOL CORP
10-Ks and 10-Qs
|
|
|
|
|
|
|
|
|
|
|
|
|
|
|
|
|
|
|
|
|
|
|
|
|
|
|
|
|
|
|
|
|
|
|
|
|
|
|
|
|
|
|
|
|
|
|
|
|
|
|
|
|
|
|
|
UNITED STATES
SECURITIES AND EXCHANGE COMMISSION
WASHINGTON, D.C. 20549
FORM 10-K
|
S
|
ANNUAL REPORT PURSUANT TO SECTION 13 OR 15(d) OF THE SECURITIES EXCHANGE ACT OF 1934
|
For the fiscal year ended
December 31, 2012
or
|
£
|
TRANSITION REPORT PURSUANT TO SECTION 13 OR 15(d) OF THE SECURITIES EXCHANGE ACT OF 1934
|
For the transition period from
to
Commission File Number: 0-26640

POOL CORPORATION
(Exact name of registrant as specified in its charter)
|
Delaware
|
36-3943363
|
|
(State or other jurisdiction of
incorporation or organization)
|
(I.R.S. Employer
Identification No.)
|
|
|
|
|
109 Northpark Boulevard, Covington, Louisiana
|
70433-5001
|
|
(Address of principal executive offices)
|
(Zip Code)
|
985-892-5521
(Registrant’s telephone number, including area code)
Securities registered pursuant to Section 12(b) of the Act:
|
Title of each class
|
Name of each exchange on which registered
|
|
Common Stock, par value $0.001 per share
|
NASDAQ Global Select Market
|
Securities registered pursuant to Section 12(g) of the Act:
None
Indicate by check mark if the registrant is a well-known seasoned issuer, as defined in Rule 405 of the Securities Act. YES
T
NO
£
Indicate by check mark if the registrant is not required to file reports pursuant to Section 13 or 15(d) of the Act. YES
£
NO
T
Indicate by check mark whether the registrant (1) has filed all reports required to be filed by Section 13 or 15(d) of the Securities Exchange Act of 1934 during the preceding 12 months (or for such shorter period that the registrant was required to file such reports), and (2) has been subject to such filing requirements for the past 90 days. YES
T
NO
£
Indicate by check mark whether the registrant has submitted electronically and posted on its corporate Web site, if any, every Interactive Data File required to be submitted and posted pursuant to Rule 405 of Regulations S-T (§232.405 of this chapter) during the preceding 12 months (or for such shorter period that the registrant was required to submit and post such files). YES
T
NO
£
Indicate by check mark if disclosure of delinquent filers pursuant to Item 405 of Regulation S-K (§229.405 of this chapter) is not contained herein, and will not be contained, to the best of the registrant’s knowledge, in definitive proxy or information statements incorporated by reference in Part III of this Form 10-K or any amendment to this Form 10-K.
£
Indicate by check mark whether the registrant is a large accelerated filer, an accelerated filer, a non-accelerated filer, or a smaller reporting company. See the definitions of “large accelerated filer,” “accelerated filer” and “smaller reporting company” in Rule 12b-2 of the Exchange Act.
|
Large accelerated filer
T
|
Accelerated filer
o
|
|
|
|
|
Non-accelerated filer
o
(Do not check if a smaller reporting company)
|
Smaller reporting company
o
|
Indicate by check mark whether the registrant is a shell company (as defined in Rule 12b-2 of the Act). YES
£
NO
T
The aggregate market value of voting and non-voting common equity held by non-affiliates of the registrant based on the closing sales price of the registrant’s common stock as of
June 29, 2012
was
$1,797,664,827
.
As of
February 20, 2013
, there were
46,424,500
shares of common stock outstanding.
Documents Incorporated by Reference
Portions of the registrant’s Proxy Statement to be mailed to stockholders on or about
March 28, 2013
for the
Annual Meeting to be held on
May 1, 2013
, are incorporated by reference in Part III of this Form 10-K.
POOL CORPORATION
TABLE OF CONTENTS
|
|
|
|
|
|
|
Page
|
|
PART I.
|
|
|
|
|
|
|
|
Item 1.
|
||
|
Item 1A.
|
||
|
Item 1B.
|
||
|
Item 2.
|
||
|
Item 3.
|
||
|
Item 4.
|
||
|
|
|
|
|
PART II.
|
|
|
|
|
|
|
|
Item 5.
|
||
|
Item 6.
|
||
|
Item 7.
|
||
|
Item 7A.
|
||
|
Item 8.
|
||
|
Item 9.
|
||
|
Item 9A.
|
||
|
Item 9B.
|
||
|
|
|
|
|
PART III.
|
|
|
|
|
|
|
|
Item 10.
|
||
|
Item 11.
|
||
|
Item 12.
|
||
|
Item 13.
|
||
|
Item 14.
|
||
|
|
|
|
|
PART IV.
|
|
|
|
|
|
|
|
Item 15.
|
||
|
|
|
|
|
|
||
General
Based on industry data, Pool Corporation (the
Company
, which may be referred to as
we, us
or
our
) is the world’s largest wholesale distributor of swimming pool supplies, equipment and related leisure products and is one of the top three distributors of irrigation and landscape products in the United States. The Company was incorporated in the State of Delaware in 1993 and has grown from a regional distributor to a multi-national, multi-network distribution company.
Our industry is highly fragmented, and as such, we add considerable value to the industry by purchasing products from a large number of manufacturers and then distributing the products to our customer base on conditions that are more favorable than our customers could obtain on their own.
As of
December 31, 2012
, we operated
312
sales centers in North America and Europe through our three distribution networks:
|
•
|
SCP Distributors LLC (SCP);
|
|
•
|
Superior Pool Products LLC (Superior); and
|
|
•
|
Horizon Distributors, Inc. (Horizon).
|
Superior and Horizon are both wholly owned subsidiaries of SCP, which is wholly owned by Pool Corporation.
Our Industry
We believe that the swimming pool industry is relatively young, with room for continued growth from increased penetration of new pools. Of the approximately
80 million
homes in the United States that have the economic capacity and the yard space to have a swimming pool, approximately
12%
currently have a pool. There are also significant growth opportunities in pool remodeling, due to the aging of the installed base of swimming pools, and pool equipment replacement, due to technological advancements and more energy‑efficient products. The irrigation and landscape industry shares many characteristics with the pool industry and we believe that it will realize long-term growth rates similar to the pool industry.
Favorable demographic and socioeconomic trends have positively impacted our industry and we believe these trends will continue to do so in the long term. These favorable trends include the following:
|
•
|
long-term growth in housing units in warmer markets due to the population migration toward the south, which contributes to the growing installed base of pools that homeowners must maintain;
|
|
•
|
increased homeowner spending on outdoor living spaces for relaxation and entertainment;
|
|
•
|
consumers bundling the purchase of a swimming pool and other products, with new irrigation systems and landscaping often being key components to both pool installations and remodels; and
|
|
•
|
consumers using more automation and control products, higher quality materials and other pool features that add to our sales opportunities over time.
|
Approximately
60%
of consumer spending in the pool industry is for maintenance and minor repair of existing swimming pools. Maintaining proper chemical balance and the related upkeep and repair of swimming pool equipment, such as pumps, heaters, filters and safety equipment, creates a non-discretionary demand for pool chemicals, equipment and other related parts and supplies. We also believe cosmetic considerations such as a pool’s appearance and the overall look of backyard environments create an ongoing demand for other maintenance related goods and certain discretionary products.
We believe that the recurring nature of the maintenance and repair market has historically helped maintain a relatively consistent rate of industry growth. This characteristic, along with relatively consistent rates of inflationary price increases averaging 1% to 2% that have been passed on by manufacturers and distributors, has helped cushion the negative impact on revenues in periods when unfavorable economic conditions and softness in the housing market have adversely impacted pool construction and major replacement and refurbishment activities.
1
The following table reflects growth in the domestic installed base of in-ground and above-ground swimming pools over the past 11 years (based on Company estimates and information from 2011 P.K. Data, Inc. reports):
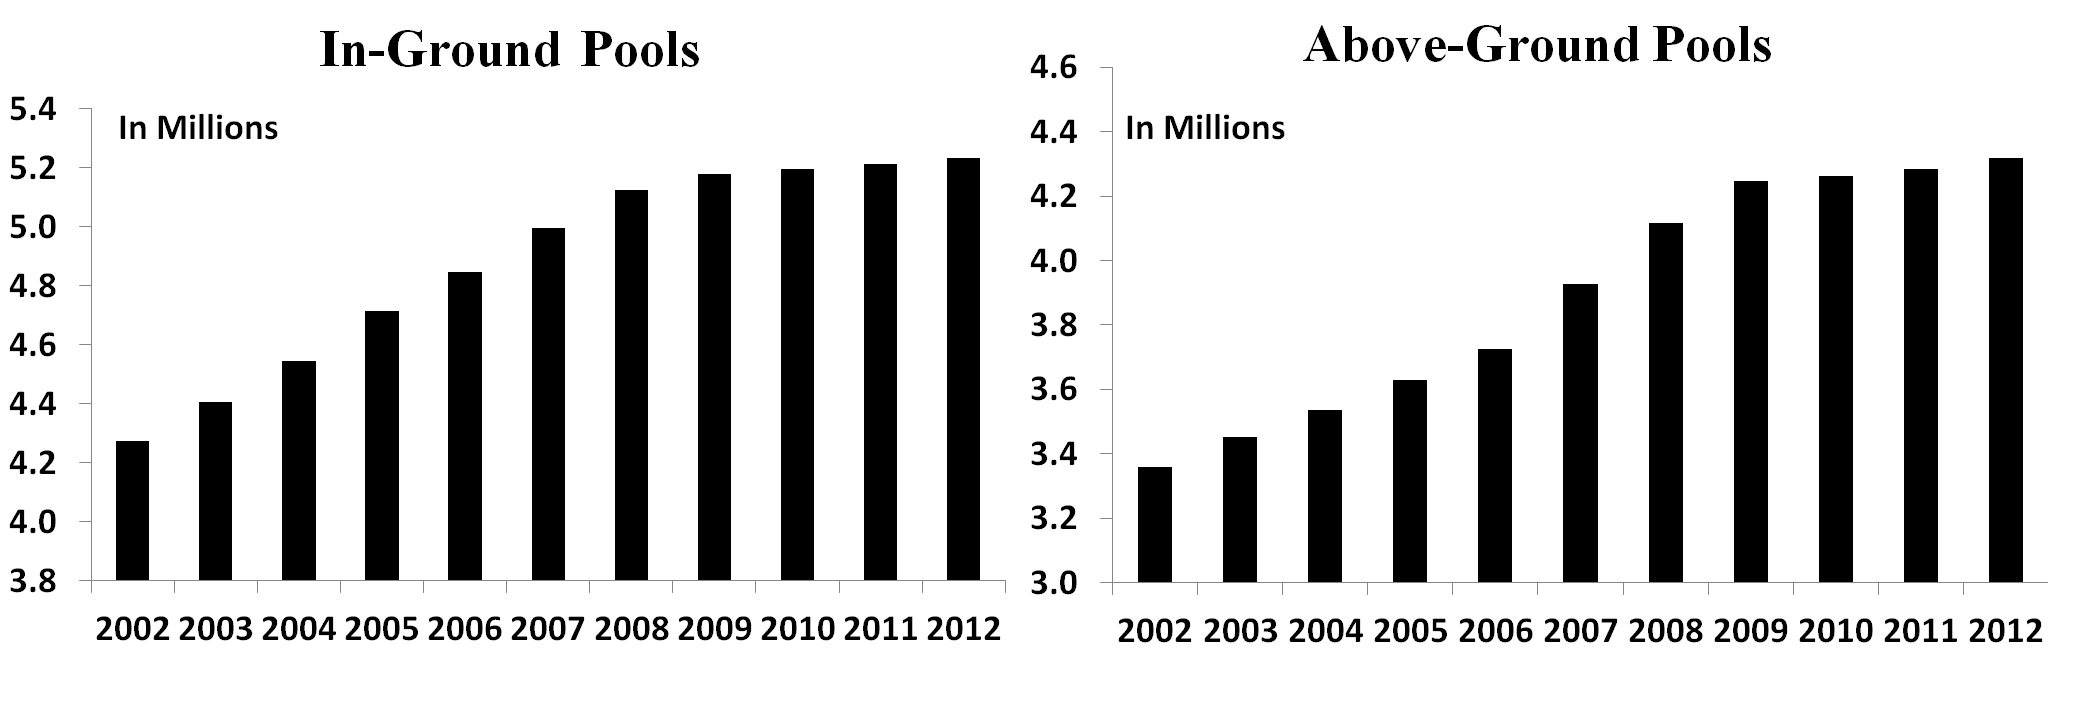
The replacement and refurbishment market includes major swimming pool remodeling and currently accounts for close to 30% of consumer spending in the pool industry. This activity is based on the aging of the installed base of pools with the timing of expenditures being more sensitive to economic factors that impact consumer spending compared to the maintenance and minor repair market.
New swimming pool construction comprises the bulk of the remaining consumer spending in the pool industry. The demand for new pools is driven by the perceived benefits of pool ownership including relaxation, entertainment, family activity, exercise and convenience. The industry competes for new pool sales against other discretionary consumer purchases such as kitchen and bathroom remodeling, boats, motorcycles, recreational vehicles and vacations. The industry is also affected by other factors including, but not limited to, consumer preferences or attitudes toward pool and landscape products for aesthetic, environmental, safety or other reasons.
The irrigation and landscape distribution business is split between residential and commercial markets, with the majority of sales related to the residential market. Irrigation and landscape maintenance activities account for approximately
40%
of total spending in the irrigation industry, with the remaining
60%
of spending related to irrigation construction and other discretionary related products. As such, our irrigation business is more heavily weighted toward new construction activities and the sale of discretionary related products compared to our pool business and is therefore more sensitive to economic factors that impact consumer spending.
Certain trends in the housing market, the availability of consumer credit and general economic conditions (as commonly measured by Gross Domestic Product or GDP) affect our industry, particularly new pool and irrigation system starts as well as the timing and extent of pool refurbishments and equipment replacement. We believe that over the long term, housing turnover and single family home value appreciation are the best indicators of new pool construction, with higher rates of home turnover and appreciation having a positive impact on new pool starts over time. We also believe that homeowners’ access to consumer credit is a critical factor enabling the purchase of new swimming pools and irrigation systems. Similar to other discretionary purchases, replacement and refurbishment activities are more impacted by economic factors such as consumer confidence, GDP and unemployment.
The economic downturn between 2007 and 2009 had a significant impact on our industry, driving an approximate 80% reduction in new pool construction in the United States compared to peak levels in 2005 and also contributing to more than a 30% decline in replacement and refurbishment activities. While we estimate that new pool construction has increased from a low of roughly
45,000
new units in
2009
to approximately
60,000
new units in
2012
, it is still down more than 70% compared to peak levels in 2005 and down approximately 60% from what we consider to be normalized levels.
Our base business sales growth in 2011 and 2012 was driven primarily by market share gains, but also reflected continued improvement in consumer discretionary expenditures and higher replacement activities given our estimated industry growth of 3% to 4% each year. Although general external market factors including consumer confidence, employment, consumer financing and economic growth have improved, we believe the current economic environment remains uncertain, especially in Europe due to the lingering sovereign debt and economic issues.
2
We believe there is potential for a significant sales recovery due to the build-up of deferred replacement and remodeling activity and our expectation for gradually normalized new pool and irrigation construction levels. We also expect that market conditions will continue to improve, enabling further recovery of replacement, remodeling and new construction activity to normalized levels over the next 7 to 10 years. We expect that the industry will realize an annual growth rate of approximately 4% to 7% over this time period before reverting back to 3% to 5% annual growth over the longer term.
Our industry is seasonal and weather is one of the principal external factors that affect our business. Peak industry activity occurs during the warmest months of the year, typically April through September. Unseasonable warming or cooling trends can delay or accelerate the start or end of the pool and landscape season, impacting our maintenance and repair sales. These impacts at the shoulders of the season are generally more pronounced in northern markets. Weather also impacts our sales of construction and installation products to the extent that above average precipitation, late spring thaws in northern markets and other extreme weather conditions delay, interrupt or cancel current or planned construction and installation activities.
Business Strategy and Growth
Our mission is to provide exceptional value to our customers and suppliers, in order to provide exceptional return to our shareholders while providing exceptional opportunities to our employees. Our three core strategies are as follows:
|
•
|
to promote the growth of our industry;
|
|
•
|
to promote the growth of our customers’ businesses; and
|
|
•
|
to continuously strive to operate more effectively.
|
We promote the growth of the industry through various advertising and promotional programs intended to raise consumer awareness of the benefits and affordability of pool ownership, the ease of pool maintenance and the many ways in which a pool and the surrounding spaces may be enjoyed beyond swimming. These programs include media advertising, industry oriented website development such as
www.swimmingpool.com
®, public relations campaigns and other online marketing initiatives including social media. We use these programs as tools to educate consumers and lead prospective pool owners to our customers.
We promote the growth of our customers’ businesses by offering comprehensive support programs that include promotional tools and marketing support to help our customers generate increased sales. Our uniquely tailored programs include such features as customer lead generation, personalized websites, brochures, direct mail, marketing campaigns and business development training. As a customer service, we also provide certain retail store customers assistance with all aspects of their business including site selection, store layout and design, business management system implementation, comprehensive product offering selections and efficient ordering and inventory management processes.
Growth initiatives related to our various customer programs include our retail brand licensing program and our rewards program designed for pool service professionals. Under our brand licensing program, customers make commitments to meet minimum purchase levels, stock a minimum of nine specific product categories and operate within certain guidelines (including weekend hour requirements). Our rewards program aligns with our replacement parts growth initiative and provides customers with monthly coupons and other special discounts on parts product purchases. In addition to these programs, we also feature consumer showrooms in over 70 of our sales centers and host an annual retail summit.
In addition to our efforts aimed at industry and customer growth, we strive to operate more effectively by continuously focusing on improvements in our operations such as product sourcing, procurement and logistics initiatives, adoption of enhanced business practices and improved working capital management. Other key internal growth initiatives include the continued expansion of both our product offerings (as described in the “Customers and Products” section below) and our distribution networks.
We have grown our distribution networks through acquisitions, new sales center openings and the expansion of existing sales centers. Since the beginning of
2008
, we completed
12
acquisitions consisting of
33
sales centers (net of sales center closings and consolidations within one year of acquisition). These acquired locations included six sales centers added to our international SCP network ahead of the
2012
season, including one sales center in Germany, four sales centers in British Columbia, Canada and one sales center in Ontario, Canada. Given the more stabilized external environment, we have increased our focus on new sales center openings, including satellite locations that enable us to more effectively serve customers in existing markets. We opened
9
new sales centers in
2012
and we expect to open between
7
and
10
new sales centers in
2013
.
We plan to continue to selectively expand our swimming pool and irrigation distribution networks via both acquisitions and new sales center openings. We plan to make strategic acquisitions to further penetrate existing markets and expand into both new geographic markets and new product categories. For additional discussion of our recent acquisitions, see Note 2 of “Notes to Consolidated Financial Statements,” included in Item 8 of this Form 10-K.
3
We believe that our high customer service levels and expanded product offerings have enabled us to gain market share historically, including the period between 2007 and 2009 when our industry contracted, and that these market share gains continued in 2011 and 2012. Going forward, we expect to realize sales growth higher than the industry average due to further increases in market share and continued expansion of our product offerings.
We estimate that price inflation has averaged 1% to 2% annually in our industry over the past 10 years. We generally pass industry price increases through the supply chain and make strategic volume inventory purchases ahead of vendor price increases. In 2012, we estimate that price inflation was consistent with the historical average, while in 2011 price inflation was approximately 2%. We anticipate price inflation will vary some by product lines, but will approximate the long-term average overall in 2013.
Customers and Products
We serve roughly
80,000
customers, none of which account for more than 1% of our sales. We primarily serve five types of customers:
|
•
|
swimming pool remodelers and builders;
|
|
•
|
specialty retailers that sell swimming pool supplies;
|
|
•
|
swimming pool repair and service businesses;
|
|
•
|
landscape construction and maintenance contractors; and
|
|
•
|
government, golf courses and like commercial customers.
|
The majority of these customers are small, family owned businesses with relatively limited capital resources. The recent economic environment has had the greatest impact on swimming pool remodelers and builders and landscape construction companies. We have seen a modest contraction in our customer base in these segments over the last several years.
We conduct our operations through
312
sales centers in North America and Europe. Our primary markets, with the highest concentration of swimming pools, are California, Texas, Florida and Arizona, representing approximately
50%
of our net sales in
2012
. We use a combination of local and international sales and marketing personnel to promote the growth of our business and develop and strengthen our customers’ businesses. Our sales and marketing personnel focus on developing customer programs and promotional activities, creating and enhancing sales management tools and providing product and market expertise. Our local sales personnel work from our sales centers and are charged with understanding and meeting our customers’ specific needs.
We offer our customers more than
160,000
national brand and Pool Corporation branded products. We believe that our selection of pool equipment, supplies, chemicals, replacement parts, irrigation and landscape products and other pool construction and recreational products is the most comprehensive in the industry. The products we sell can be categorized as follows:
|
•
|
maintenance products such as chemicals, supplies and pool accessories;
|
|
•
|
repair and replacement parts for pool equipment, such as cleaners, filters, heaters, pumps and lights;
|
|
•
|
packaged pool kits including walls, liners, braces and coping for in-ground and above-ground pools;
|
|
•
|
pool equipment and components for new pool construction and the remodeling of existing pools;
|
|
•
|
irrigation and landscape products, including irrigation system components and professional lawn care equipment and supplies; and
|
|
•
|
other pool construction and recreational products, which consist of a number of product categories and includes:
|
|
◦
|
building materials used for pool installations and remodeling, such as concrete, plumbing and electrical components and both functional and decorative pool surface and decking materials; and
|
|
◦
|
discretionary recreational and related outdoor lifestyle products that enhance consumers’ use and enjoyment of outdoor living spaces, such as spas, grills and components for outdoor kitchens.
|
We track and monitor the majority of our sales by product lines and categories to provide support for sales and marketing efforts and for consideration in incentive plan programs. We currently have over
400
product lines and over
50
product categories. Based on our
2012
product classifications, sales for our pool and spa chemicals product category as a percentage of total net sales was
15%
in
2012
,
16%
in
2011
and
17%
in
2010
. While market share gains drove chemical volume growth of
4%
in 2012 and
6%
in 2011, chemical sales growth did not keep pace with our overall sales growth due to price deflation of approximately
2%
in 2011 and lingering price deflation for certain chemical products in 2012. No other product category accounted for 10% or more of total net sales in any of the last three fiscal years.
4
We categorize our maintenance, repair and replacement products into the following two groupings:
|
•
|
maintenance and minor repair (non-discretionary); and
|
|
•
|
major refurbishment and replacement (partially discretionary).
|
In 2012, the sale of maintenance and minor repair products accounted for approximately 60% of our sales and gross profits while approximately 40% of sales and gross profits were derived from the refurbishment, replacement, construction and installation (equipment, materials, plumbing, electrical, etc.) of swimming pools. This reflected a shift back toward more sales of major refurbishment and replacement products due to the modest recovery of these activities since levels reached a low point in 2009. Between 2005 and early 2010, sales of maintenance and minor repair products had increased to approximately 70% of our sales and gross profits due to the significant declines in new pool construction. Prior to this industry downturn, just over 50% of our total sales and gross profits were related to maintenance and minor repair products.
Since our acquisition of National Pool Tile (NPT) in 2008, we have expanded the number of sales center locations that offer NPT tile and composite pool finish products from the original
14
locations to over
70
locations. These locations feature consumer showrooms where swimming pool dealers and homeowners can view and select pool components including tile, decking materials and interior pool finishes in various styles and grades. Another key product initiative has been the expansion of our replacement parts offerings. These product initiatives, along with the continued expansion of our Pool Corporation branded products, have contributed to gross margin improvements over time. Throughout 2012, we experienced product and customer mix changes, particularly related to sales growth in higher value, lower margin products such as variable speed pumps, motorized pool lifts and pool heaters. We also observed faster sales growth from larger, lower margin customers. Our strategic plan considers how these recent trends can contribute to operating income growth over the next several years.
Products related to pool construction and remodeling have been an important factor in our historical base business sales growth. While sales of these products declined between 2007 and 2009 as the majority of these products are discretionary in nature, we realized some sales growth in 2010 followed by double digit sales growth in 2011 and 2012 due to our ongoing expansion of these product offerings and the gradual improvement in new construction, remodeling and economic trends. We continue to identify new related product categories and we typically introduce new categories each year in select markets. We then evaluate the performance in these test markets and focus on those product categories that we believe exhibit the best long-term growth potential. We expect to realize continued sales growth for these types of product offerings by expanding the number of locations that offer these products, increasing the number of products offered at certain locations and continuing a modest broadening of these product offerings on a company-wide basis.
Operating Strategy
We distribute swimming pool supplies, equipment and related leisure products domestically through our SCP and Superior networks and internationally through our SCP network, while we distribute irrigation and landscape products through our Horizon network. We adopted the strategy of operating two distinct distribution networks within the U.S. swimming pool marketplace primarily for two reasons:
|
•
|
to offer our customers a choice of distinctive product selections, locations and service personnel; and
|
|
•
|
to increase the level of customer service and operational efficiency provided by the sales centers in each network by promoting healthy competition between the two networks.
|
We evaluate our sales centers based upon their performance relative to predetermined standards that include both financial and operational measures. Our corporate support groups provide our field operations with various services, such as developing and coordinating customer and vendor related programs, information systems support and expert resources to help them achieve their goals. We believe our incentive programs and feedback tools, along with the competitive nature of our internal networks, stimulate and enhance employee performance.
Distribution
Our sales centers are located within population centers near customer concentrations, typically in industrial, commercial or mixed‑use zones. Customers may pick up products at any sales center location, or we may deliver products to their premises or job sites via our trucks or third party carriers.
Our sales centers maintain well-stocked inventories to meet customers’ immediate needs. We utilize warehouse management technology to optimize receiving, inventory control, picking, packing and shipping functions.
5
We also operate
six
centralized shipping locations (CSLs) that redistribute products we purchase in bulk quantities to our sales centers or in some cases, directly to customers. Our CSLs are regional locations that carry a wide range of traditional swimming pool, irrigation and related construction products.
Purchasing and Suppliers
We enjoy good relationships with our suppliers, who generally offer competitive pricing, return policies and promotional allowances. It is customary in our industry for certain manufacturers to offer seasonal terms to qualifying purchasers such as POOL. These terms typically allow us to place orders in the fall prior to any seasonal price increases, take delivery of product during the off-season months and pay for these purchases in the spring or early summer.
Our preferred vendor program encourages our distribution networks to stock and sell products from a smaller number of vendors to optimize profitability and shareholder return. We also work closely with our vendors to develop programs and services to better meet the needs of our customers and to concentrate our inventory investments. These practices, together with a more comprehensive service offering, have positively impacted our selling margins and our returns on inventory investments.
We regularly evaluate supplier relationships and consider alternate sourcing to assure competitive cost, service and quality standards. Our largest suppliers include Pentair Water Pool and Spa, Inc., Hayward Pool Products, Inc. and Zodiac Pool Systems, Inc., which accounted for approximately
18%
,
11%
and
8%
, respectively, of the cost of products we sold in
2012
.
Competition
Based on industry knowledge and available data, management believes we are the largest wholesale distributor of swimming pool and related backyard products and the only truly national wholesale distributor focused on the swimming pool industry in the United States. We are also one of the top three distributors of irrigation and landscape products in the United States. We face intense competition from many regional and local distributors in our markets and from one national wholesale distributor of irrigation and landscape products. We also face competition, both directly and indirectly, from mass-market retailers and large pool supply retailers (both store-based and internet) who buy directly from manufacturers and, to a lesser extent, from other distributors.
Some geographic markets we serve, particularly the five largest and higher pool density markets of California, Florida, Texas, Arizona and New York, have a greater concentration of competition than others. Barriers to entry in our industry are relatively low. We believe that the principal competitive factors in swimming pool and landscape supply distribution are:
|
•
|
the breadth and availability of products offered;
|
|
•
|
the quality and level of customer service;
|
|
•
|
the breadth and depth of sales and marketing programs;
|
|
•
|
consistency and stability of business relationships with customers and suppliers;
|
|
•
|
competitive product pricing; and
|
|
•
|
access to commercial credit to finance business working capital.
|
We believe that we generally compete favorably with respect to each of these factors.
Seasonality and Weather
For a discussion regarding seasonality and weather, see Item 7, “Management’s Discussion and Analysis of Financial Condition and Results of Operations - Seasonality and Quarterly Fluctuations,” of this Form 10-K.
Environmental, Health and Safety Regulations
Our business is subject to regulation under local fire codes and international, federal, state and local environmental and health and safety requirements, including regulation by the Environmental Protection Agency, the Consumer Product Safety Commission, the Department of Transportation, the Occupational Safety and Health Administration, the National Fire Protection Agency and the International Maritime Organization. Most of these requirements govern the packaging, labeling, handling, transportation, storage and sale of chemicals and fertilizers. We store certain types of chemicals and/or fertilizers at each of our sales centers and the storage of these items is strictly regulated by local fire codes. In addition, we sell algaecides and pest control products that are regulated as pesticides under the Federal Insecticide, Fungicide and Rodenticide Act and various state pesticide laws. These laws are primarily related to labeling, annual registration and licensing.
6
Employees
We employed approximately
3,400
people at
December 31, 2012
. Given the seasonal nature of our business, our peak employment period is the summer and depending on expected sales levels, we add
200
to
500
employees to our work force to meet seasonal demand.
Intellectual Property
We maintain both domestic and foreign registered trademarks, primarily for our private label products, that are important to our current and future business operations. We also own rights to numerous internet domain names.
Geographic Areas
Net sales by geographic region were as follows for the past three fiscal years (in thousands):
|
|
Year Ended December 31,
|
|||||||||||
|
|
2012
|
2011
|
2010
|
|||||||||
|
United States
|
$
|
1,770,362
|
|
$
|
1,608,874
|
|
$
|
1,450,959
|
|
|||
|
International
|
183,612
|
|
184,444
|
|
162,787
|
|
||||||
|
|
$
|
1,953,974
|
|
$
|
1,793,318
|
|
$
|
1,613,746
|
|
|||
Net property and equipment by geographic region was as follows (in thousands):
|
|
December 31,
|
|||||||||||
|
|
2012
|
2011
|
2010
|
|||||||||
|
United States
|
$
|
42,443
|
|
$
|
37,782
|
|
$
|
27,337
|
|
|||
|
International
|
4,123
|
|
3,612
|
|
3,348
|
|
||||||
|
|
$
|
46,566
|
|
$
|
41,394
|
|
$
|
30,685
|
|
|||
Available Information
Our annual report on Form 10-K, quarterly reports on Form 10-Q, current reports on Form 8-K and amendments to those reports filed or furnished pursuant to Section 13(a) or 15(d) of the Securities Exchange Act of 1934 are available free of charge on our website at
www.poolcorp.com
as soon as reasonably practical after we electronically file such reports with, or furnish them to, the Securities and Exchange Commission (SEC).
Additionally, we have adopted a Code of Business Conduct and Ethics that applies to all of our employees, officers and directors, and is available on our website at
www.poolcorp.com
.
Cautionary Statement for Purposes of the "Safe Harbor" Provisions of the Private Securities Litigation Reform Act of
1995
Our disclosure and analysis in this report contains forward-looking information that involves risks and uncertainties. Our forward‑looking statements express our current expectations or forecasts of possible future results or events, including projections of future performance, statements of management’s plans and objectives, future contracts, and forecasts of trends and other matters. Forward-looking statements speak only as of the date of this filing, and we undertake no obligation to update or revise such statements to reflect new circumstances or unanticipated events as they occur. You can identify these statements by the fact that they do not relate strictly to historic or current facts and often use words such as “anticipate”, “estimate”, “expect”, “believe”, “will likely result”, “outlook”, “project” and other words and expressions of similar meaning. No assurance can be given that the results in any forward-looking statements will be achieved and actual results could be affected by one or more factors, which could cause them to differ materially. For these statements, we claim the protection of the safe harbor for forward‑looking statements contained in the Private Securities Litigation Reform Act.
7
Risk Factors
Certain factors that may affect our business and could cause actual results to differ materially from those expressed in any forward‑looking statements include the following:
The demand for our swimming pool, irrigation and related outdoor lifestyle products has been and may continue to be adversely affected by unfavorable economic conditions.
In economic downturns, the demand for swimming pool, irrigation and related outdoor lifestyle products may decline as discretionary consumer spending, the growth rate of pool eligible households and swimming pool construction decline. Although maintenance products and repair and replacement equipment that must be purchased by pool owners to maintain existing swimming pools currently account for approximately 87% of our net sales and gross profits, the growth of this portion of our business depends on the expansion of the installed pool base and could also be adversely affected by decreases in construction activities similar to the trends between late 2006 and early 2010. A weak economy may also cause consumers to defer discretionary replacement and refurbish activity. In addition, even in generally favorable economic conditions, severe and/or prolonged downturns in the housing market could have a material adverse impact on our financial performance. Such downturns expose us to certain additional risks, including but not limited to the risk of customer closures or bankruptcies, which could shrink our potential customer base and inhibit our ability to collect on those customers’ receivables.
We believe that homeowners’ access to consumer credit is a critical factor enabling the purchase of new pool and irrigation systems. The recent unfavorable economic conditions and downturn in the housing market have resulted in significant tightening of credit markets, which has limited the ability of consumers to access financing for new swimming pools and irrigation systems. If these trends continue or worsen, many consumers will likely not be able to obtain financing for pool and irrigation projects, which could negatively impact our sales of construction related products.
We are susceptible to adverse weather conditions.
Weather is one of the principal external factors affecting our business. For example, unseasonably late warming trends in the spring or early cooling trends in the fall can shorten the length of the pool season. Also, unseasonably cool weather or extraordinary rainfall during the peak season can decrease swimming pool use, installation and maintenance, as well as landscape installations and maintenance. These weather conditions adversely affect sales of our products. Drought conditions or water management initiatives may lead to municipal ordinances related to water use restrictions, which could result in decreased pool and irrigation system installations and negatively impact our sales. While warmer weather conditions favorably impact our sales, global warming trends and other significant climate changes can create more variability in the short-term or lead to other unfavorable weather conditions that could adversely impact our sales or operations. For a discussion regarding seasonality and weather, see Item 7, “Management’s Discussion and Analysis of Financial Condition and Results of Operations - Seasonality and Quarterly Fluctuations,” of this Form 10-K.
Our distribution business is highly dependent on our ability to maintain favorable relationships with suppliers.
As a distribution company, maintaining favorable relationships with our suppliers is critical to our success. We believe that we add considerable value to the swimming pool and irrigation and landscape supply chains by purchasing products from a large number of manufacturers and distributing the products to a highly fragmented customer base on conditions that are more favorable than these customers could obtain on their own. We believe that we currently enjoy good relationships with our suppliers, who generally offer us competitive pricing, return policies and promotional allowances. However, our inability to maintain favorable relationships with our suppliers could have an adverse effect on our business.
Our largest suppliers are Pentair Water Pool and Spa, Inc., Hayward Pool Products, Inc. and Zodiac Pool Systems, Inc., which accounted for approximately
18%
,
11%
and
8%
, respectively, of the costs of products we sold in
2012
. A decision by several suppliers, acting in concert, to sell their products directly to retailers or other end users of their products, bypassing distribution companies like ours, would have an adverse effect on our business. Additionally, the loss of a single significant supplier due to financial failure or a decision to sell exclusively to retailers or end-use consumers could also adversely affect our business. We dedicate considerable resources to promote the benefits and affordability of pool ownership, which we believe significantly benefits our swimming pool customers and suppliers.
8
We face intense competition both from within our industry and from other leisure product alternatives.
We face competition from both inside and outside of our industry. Within our industry, we compete against various regional and local distributors and, to a lesser extent, mass market retailers, large pool or landscape supply retailers and internet retailers. Outside of our industry, we compete with sellers of other leisure product alternatives, such as boats and motor homes, and with other companies who rely on discretionary homeowner expenditures, such as home remodelers. New competitors may emerge as there are low barriers to entry in our industry. Some geographic markets that we serve, particularly our four largest, higher density markets in California, Texas, Florida and Arizona, representing approximately
50%
of our net sales in
2012
, also tend to be more competitive than others.
More aggressive competition by mass merchants and large pool or landscape supply retailers could adversely affect our sales.
Mass market retailers today carry a limited range of, and devote a limited amount of shelf space to, merchandise and products targeted to our industry. Historically, mass market retailers have generally expanded by adding new stores and product breadth, but their product offering of pool and landscape related products has remained relatively constant. Should mass market retailers increase their focus on the pool or professional landscape industries, or increase the breadth of their pool and landscape related product offerings, they may become a more significant competitor for our direct customers and end-use consumers which could have an adverse impact on our business. We may face additional competitive pressures if large pool or landscape supply retailers look to expand their customer base to compete more directly within the distribution channel.
We depend on key personnel.
We consider our employees to be the foundation for our growth and success. As such, our future success depends in large part on our ability to attract, retain and motivate qualified personnel, including our executive officers and key management personnel. If we are unable to attract and retain key personnel, our operating results could be adversely affected.
Past growth may not be indicative of future growth.
Historically, we have experienced substantial sales growth through acquisitions, market share gains and new sales center openings that have increased our size, scope and geographic distribution. Since the beginning of
2008
, we completed
12
acquisitions consisting of
33
sales centers (net of sales center closings and consolidations within one year of acquisition). While we contemplate continued growth through acquisitions and internal expansion, no assurance can be made as to our ability to:
|
•
|
penetrate new markets;
|
|
•
|
identify appropriate acquisition candidates;
|
|
•
|
complete acquisitions on satisfactory terms and successfully integrate acquired businesses;
|
|
•
|
obtain financing;
|
|
•
|
generate sufficient cash flows to support expansion plans and general operating activities;
|
|
•
|
maintain favorable supplier arrangements and relationships; and
|
|
•
|
identify and divest assets which do not continue to create value consistent with our objectives.
|
If we do not manage these potential difficulties successfully, our operating results could be adversely affected.
Our business is highly seasonal.
In
2012
, approximately
66%
of our net sales and over 100% of our operating income were generated in the second and third quarters of the year. These quarters represent the peak months of both swimming pool use, installation, remodeling and repair, and landscape installations and maintenance. Our sales are substantially lower during the first and fourth quarters of the year, when we may incur net losses.
The nature of our business subjects us to compliance with environmental, health, transportation and safety regulations.
We are subject to regulation under federal, state and local environmental, health, transportation and safety requirements, which govern such things as packaging, labeling, handling, transportation, storage and sale of chemicals and fertilizers. For example, we sell algaecides and pest control products that are regulated as pesticides under the Federal Insecticide, Fungicide and Rodenticide Act and various state pesticide laws. These laws are primarily related to labeling, annual registration and licensing.
9
Failure to comply with these laws and regulations may result in the assessment of administrative, civil and criminal penalties or the imposition of injunctive relief. Moreover, compliance with such laws and regulations in the future could prove to be costly, and there can be no assurance that we will not incur such costs in material amounts. These laws and regulations have changed substantially and rapidly over the last 25 years and we anticipate that there will be continuing changes. The clear trend in environmental, health, transportation and safety regulation is to place more restrictions and limitations on activities that impact the environment, such as the use and handling of chemical substances. Increasingly, strict restrictions and limitations have resulted in higher operating costs for us and it is possible that the costs of compliance with such laws and regulations will continue to increase. We will attempt to anticipate future regulatory requirements that might be imposed and we will plan accordingly to remain in compliance with changing regulations and to minimize the costs of such compliance.
We store chemicals, fertilizers and other combustible materials that involve fire, safety and casualty risks.
We store chemicals and fertilizers, including certain combustible, oxidizing compounds, at our sales centers. A fire, explosion or flood affecting one of our facilities could give rise to fire, safety and casualty losses and related liability claims. We maintain what we believe is prudent insurance protection. However, we cannot guarantee that our insurance coverage will be adequate to cover future claims that may arise or that we will be able to maintain adequate insurance in the future at rates we consider reasonable. Successful claims for which we are not fully insured may adversely affect our working capital and profitability. In addition, changes in the insurance industry have generally led to higher insurance costs and decreased availability of coverage.
We conduct business internationally, which exposes us to additional risks.
Our international operations expose us to certain additional risks, including:
|
•
|
difficulty in staffing international subsidiary operations;
|
|
•
|
different political and regulatory conditions;
|
|
•
|
currency fluctuations;
|
|
•
|
adverse tax consequences; and
|
|
•
|
dependence on other economies.
|
We rely on manufacturers and other suppliers to provide us with the products we sell and distribute. As we increase the number of Pool Corporation branded products we distribute, our exposure to potential liability claims may increase. The risk of claims may also be greater with respect to products manufactured by third-party suppliers outside the United States, particularly in China. Uncertainties with respect to foreign legal systems may adversely affect us in resolving claims arising from our foreign sourced products. Even if we are successful in defending any claim relating to the products we distribute, claims of this nature could negatively impact customer confidence in our products and our company.
For foreign sourced products, we may be subject to certain trade restrictions that would prevent us from obtaining products and there is also a greater risk that we may not be able to access products in a timely and efficient manner. Fluctuations in other factors relating to international trade, such as tariffs, transportation costs and inflation are additional risks for our international operations.
A terrorist attack or the threat of a terrorist attack could have a material adverse effect on our business.
Discretionary spending on leisure product offerings such as ours is generally adversely affected during times of economic or political uncertainty. The potential for terrorist attacks, the national and international responses to terrorist attacks, and other acts of war or hostility could create these types of uncertainties and negatively impact our business for the short or long term in ways that cannot presently be predicted.
None.
10
We lease the POOL corporate offices, which consist of approximately
53,000
square feet of office space in Covington, Louisiana, from an entity in which we have a
50%
ownership interest. We own
three
sales center facilities in Florida and
one
in Texas. We lease all of our other properties and the majority of our leases have
three
to
seven
year terms.
As of
December 31, 2012
, we had
11
leases with remaining terms longer than
seven
years that expire between
2020
and
2027
. Most of our leases contain renewal options, some of which involve rent increases. In addition to minimum rental payments, which are set at competitive rates, certain leases require reimbursement for taxes, maintenance and insurance.
Our sales centers range in size from approximately
2,000
square feet to
60,000
square feet and generally consist of warehouse, counter, display and office space. Our centralized shipping locations (CSLs) range in size from approximately
34,000
square feet to
78,000
square feet.
We believe that our facilities are well maintained, suitable for our business and occupy sufficient space to meet our operating needs. As part of our normal business, we regularly evaluate sales center performance and site suitability and may relocate a sales center or consolidate two locations if a sales center is redundant in a market, underperforming or otherwise deemed unsuitable. We do not believe that any single lease is material to our operations.
The table below summarizes the changes in our sales centers during the year ended
December 31, 2012
:
|
Network
|
12/31/11
|
New
Locations
|
Consolidated
and Closed
Locations
(1)
|
Acquired
Locations
(2)
|
Converted
Locations
(3)
|
12/31/12
|
||||||||||||
|
SCP
|
150
|
|
5
|
|
—
|
|
—
|
|
1
|
|
156
|
|
||||||
|
Superior
|
62
|
|
3
|
|
—
|
|
—
|
|
—
|
|
65
|
|
||||||
|
Horizon
|
60
|
|
—
|
|
—
|
|
—
|
|
(1
|
)
|
59
|
|
||||||
|
Total Domestic
|
272
|
|
8
|
|
—
|
|
—
|
|
—
|
|
280
|
|
||||||
|
SCP International
|
26
|
|
1
|
|
—
|
|
5
|
|
—
|
|
32
|
|
||||||
|
Total
|
298
|
|
9
|
|
—
|
|
5
|
|
—
|
|
312
|
|
||||||
|
(1)
|
Consolidated sales centers are those locations where we expect to transfer the majority of the existing business to our nearby sales center locations.
|
|
(2)
|
We completed
two
acquisitions in Canada in
2012
. We do not plan to close or consolidate any of these acquired sales centers.
|
|
(3)
|
In
2012
, we converted
one
existing sales center in Utah from our Horizon network to our SCP network.
|
11
The table below identifies the number of sales centers in each state, territory or country by distribution network as of
December 31, 2012
:
|
Location
|
SCP
|
Superior
|
Horizon
|
Total
|
||||||||
|
United States
|
|
|
|
|
||||||||
|
California
|
24
|
|
22
|
|
17
|
|
63
|
|
||||
|
Florida
|
33
|
|
6
|
|
4
|
|
43
|
|
||||
|
Texas
|
16
|
|
4
|
|
10
|
|
30
|
|
||||
|
Arizona
|
7
|
|
5
|
|
10
|
|
22
|
|
||||
|
Georgia
|
7
|
|
2
|
|
—
|
|
9
|
|
||||
|
Nevada
|
2
|
|
3
|
|
4
|
|
9
|
|
||||
|
Tennessee
|
4
|
|
3
|
|
—
|
|
7
|
|
||||
|
Washington
|
1
|
|
—
|
|
6
|
|
7
|
|
||||
|
Alabama
|
4
|
|
2
|
|
—
|
|
6
|
|
||||
|
New York
|
6
|
|
—
|
|
—
|
|
6
|
|
||||
|
Louisiana
|
5
|
|
—
|
|
—
|
|
5
|
|
||||
|
New Jersey
|
3
|
|
2
|
|
—
|
|
5
|
|
||||
|
Ohio
|
2
|
|
3
|
|
—
|
|
5
|
|
||||
|
Colorado
|
1
|
|
1
|
|
2
|
|
4
|
|
||||
|
Illinois
|
3
|
|
1
|
|
—
|
|
4
|
|
||||
|
Indiana
|
2
|
|
2
|
|
—
|
|
4
|
|
||||
|
Missouri
|
3
|
|
1
|
|
—
|
|
4
|
|
||||
|
North Carolina
|
3
|
|
1
|
|
—
|
|
4
|
|
||||
|
Oregon
|
1
|
|
—
|
|
3
|
|
4
|
|
||||
|
Pennsylvania
|
3
|
|
1
|
|
—
|
|
4
|
|
||||
|
South Carolina
|
3
|
|
1
|
|
—
|
|
4
|
|
||||
|
Idaho
|
1
|
|
—
|
|
2
|
|
3
|
|
||||
|
Oklahoma
|
2
|
|
1
|
|
—
|
|
3
|
|
||||
|
Virginia
|
2
|
|
1
|
|
—
|
|
3
|
|
||||
|
Arkansas
|
2
|
|
—
|
|
—
|
|
2
|
|
||||
|
Kansas
|
2
|
|
—
|
|
—
|
|
2
|
|
||||
|
Maryland
|
1
|
|
—
|
|
1
|
|
2
|
|
||||
|
Massachusetts
|
2
|
|
—
|
|
—
|
|
2
|
|
||||
|
Michigan
|
2
|
|
—
|
|
—
|
|
2
|
|
||||
|
Minnesota
|
1
|
|
1
|
|
—
|
|
2
|
|
||||
|
Connecticut
|
1
|
|
—
|
|
—
|
|
1
|
|
||||
|
Hawaii
|
1
|
|
—
|
|
—
|
|
1
|
|
||||
|
Iowa
|
1
|
|
—
|
|
—
|
|
1
|
|
||||
|
Kentucky
|
—
|
|
1
|
|
—
|
|
1
|
|
||||
|
Mississippi
|
1
|
|
—
|
|
—
|
|
1
|
|
||||
|
Nebraska
|
1
|
|
—
|
|
—
|
|
1
|
|
||||
|
New Mexico
|
1
|
|
—
|
|
—
|
|
1
|
|
||||
|
Puerto Rico
|
1
|
|
—
|
|
—
|
|
1
|
|
||||
|
Utah
|
1
|
|
—
|
|
—
|
|
1
|
|
||||
|
Wisconsin
|
—
|
|
1
|
|
—
|
|
1
|
|
||||
|
Total United States
|
156
|
|
65
|
|
59
|
|
280
|
|
||||
|
International
|
|
|
|
|
||||||||
|
Canada
|
15
|
|
—
|
|
—
|
|
15
|
|
||||
|
France
|
5
|
|
—
|
|
—
|
|
5
|
|
||||
|
Mexico
|
3
|
|
—
|
|
—
|
|
3
|
|
||||
|
Portugal
|
3
|
|
—
|
|
—
|
|
3
|
|
||||
|
United Kingdom
|
2
|
|
—
|
|
—
|
|
2
|
|
||||
|
Belgium
|
1
|
|
—
|
|
—
|
|
1
|
|
||||
|
Germany
|
1
|
|
—
|
|
—
|
|
1
|
|
||||
|
Italy
|
1
|
|
—
|
|
—
|
|
1
|
|
||||
|
Spain
|
1
|
|
—
|
|
—
|
|
1
|
|
||||
|
Total International
|
32
|
|
—
|
|
—
|
|
32
|
|
||||
|
Total
|
188
|
|
65
|
|
59
|
|
312
|
|
||||
12
From time to time, we are subject to various claims and litigation arising in the ordinary course of business, including product liability, personal injury, commercial, contract and employment matters. Litigation can be expensive and disruptive to normal business operations.
As previously disclosed in our Form 10-Q filed on July 27, 2012, a number of purported anti-trust class action suits have been filed against us in various United States District Courts. The cases were transferred and consolidated before the Judicial Panel for Multidistrict Litigation, MDL Docket No. 2328, and are presently pending in the Eastern District of Louisiana. On June 14, 2012, indirect purchaser plaintiffs, purporting to represent indirect purchasers of swimming pool products in Arizona, California, Florida and Missouri, filed a first amended class action complaint. On September 5, 2012, they filed a second amended complaint. On June 29, 2012, direct purchaser plaintiffs, who are current or former customers, filed a consolidated amended class action complaint, which added three defendants, Hayward Industries Inc., Pentair Water Pool and Spa, Inc. and Zodiac Pool Systems, Inc. The amended complaints seek unspecified compensatory and enhanced damages, interest, costs and fees and other equitable relief. We believe the amended complaints are without merit and we intend to vigorously defend ourselves.
We are subject to regulation under federal, state and local environmental, health transportation and safety requirements, which govern such things as packaging, labeling, handling, transportation, storage and sale of chemicals. As previously disclosed in our Form 10-Q filed on July 27, 2012, in the second quarter of 2012 the Office of the District Attorney for the County of Riverside, California, made a monetary demand upon us for civil penalties, alleging noncompliance in the past with local and state hazardous waste handling, storage and transportation laws, fire and building code regulations and California Business & Professions Code Section 17200, primarily relating to liquid chlorine and muriatic acid. We are engaged in discussions with Riverside County regarding resolution of these matters, but we are unable to predict the outcome. Based on information currently available to us, we do not expect this matter to have a material adverse effect on our financial condition, results of operations or cash flows.
While the outcome of any litigation is inherently unpredictable, based on currently available facts we do not believe that the ultimate resolution of any of these matters or other claims and litigation not discussed above will have a material adverse impact on our financial condition, results of operations or cash flows. Our view of these matters may change in the future as the litigation and related events unfold.
Not applicable.
13
Our common stock is traded on the NASDAQ Global Select Market under the symbol “POOL”. On
February 13, 2013
, there were approximately
12,030
holders of record of our common stock. The table below sets forth the high and low closing sales prices of our common stock as well as dividends declared for each quarter during the last two fiscal years.
|
High
|
Low
|
Dividends
Declared
|
||||||||||
|
Fiscal 2012
|
|
|
|
|||||||||
|
First Quarter
|
$
|
38.31
|
|
$
|
30.12
|
|
$
|
0.14
|
|
|||
|
Second Quarter
|
40.46
|
|
34.98
|
|
0.16
|
|
||||||
|
Third Quarter
|
41.63
|
|
36.64
|
|
0.16
|
|
||||||
|
Fourth Quarter
|
43.00
|
|
39.80
|
|
0.16
|
|
||||||
|
Fiscal 2011
|
|
|
|
|||||||||
|
First Quarter
|
$
|
26.09
|
|
$
|
22.65
|
|
$
|
0.13
|
|
|||
|
Second Quarter
|
30.98
|
|
24.40
|
|
0.14
|
|
||||||
|
Third Quarter
|
30.63
|
|
22.60
|
|
0.14
|
|
||||||
|
Fourth Quarter
|
30.57
|
|
24.94
|
|
0.14
|
|
||||||
We initiated quarterly dividend payments to our shareholders in the second quarter of 2004 and we have continued payments in each subsequent quarter. Our Board of Directors (our Board) has increased the dividend amount seven times including in the fourth quarter of 2004, annually in the second quarter of 2005 through 2008 and in the second quarters of 2011 and 2012. Future dividend payments will be at the discretion of our Board, after considering various factors, including our earnings, capital requirements, financial position, contractual restrictions and other relevant business considerations. We cannot assure shareholders or potential investors that dividends will be declared or paid any time in the future if our Board determines that there is a better use of those funds.
Stock Performance Graph
The information included under the caption “Stock Performance Graph” in this Item 5 of this Annual Report on Form 10-K is not deemed to be “soliciting material” or to be “filed” with the SEC or subject to Regulation 14A or 14C under the Securities Exchange Act of 1934 (the 1934 Act) or to the liabilities of Section 18 of the 1934 Act, and will not be deemed to be incorporated by reference into any filing under the Securities Act of 1933 or the 1934 Act, except to the extent we specifically incorporate it by reference into such a filing.
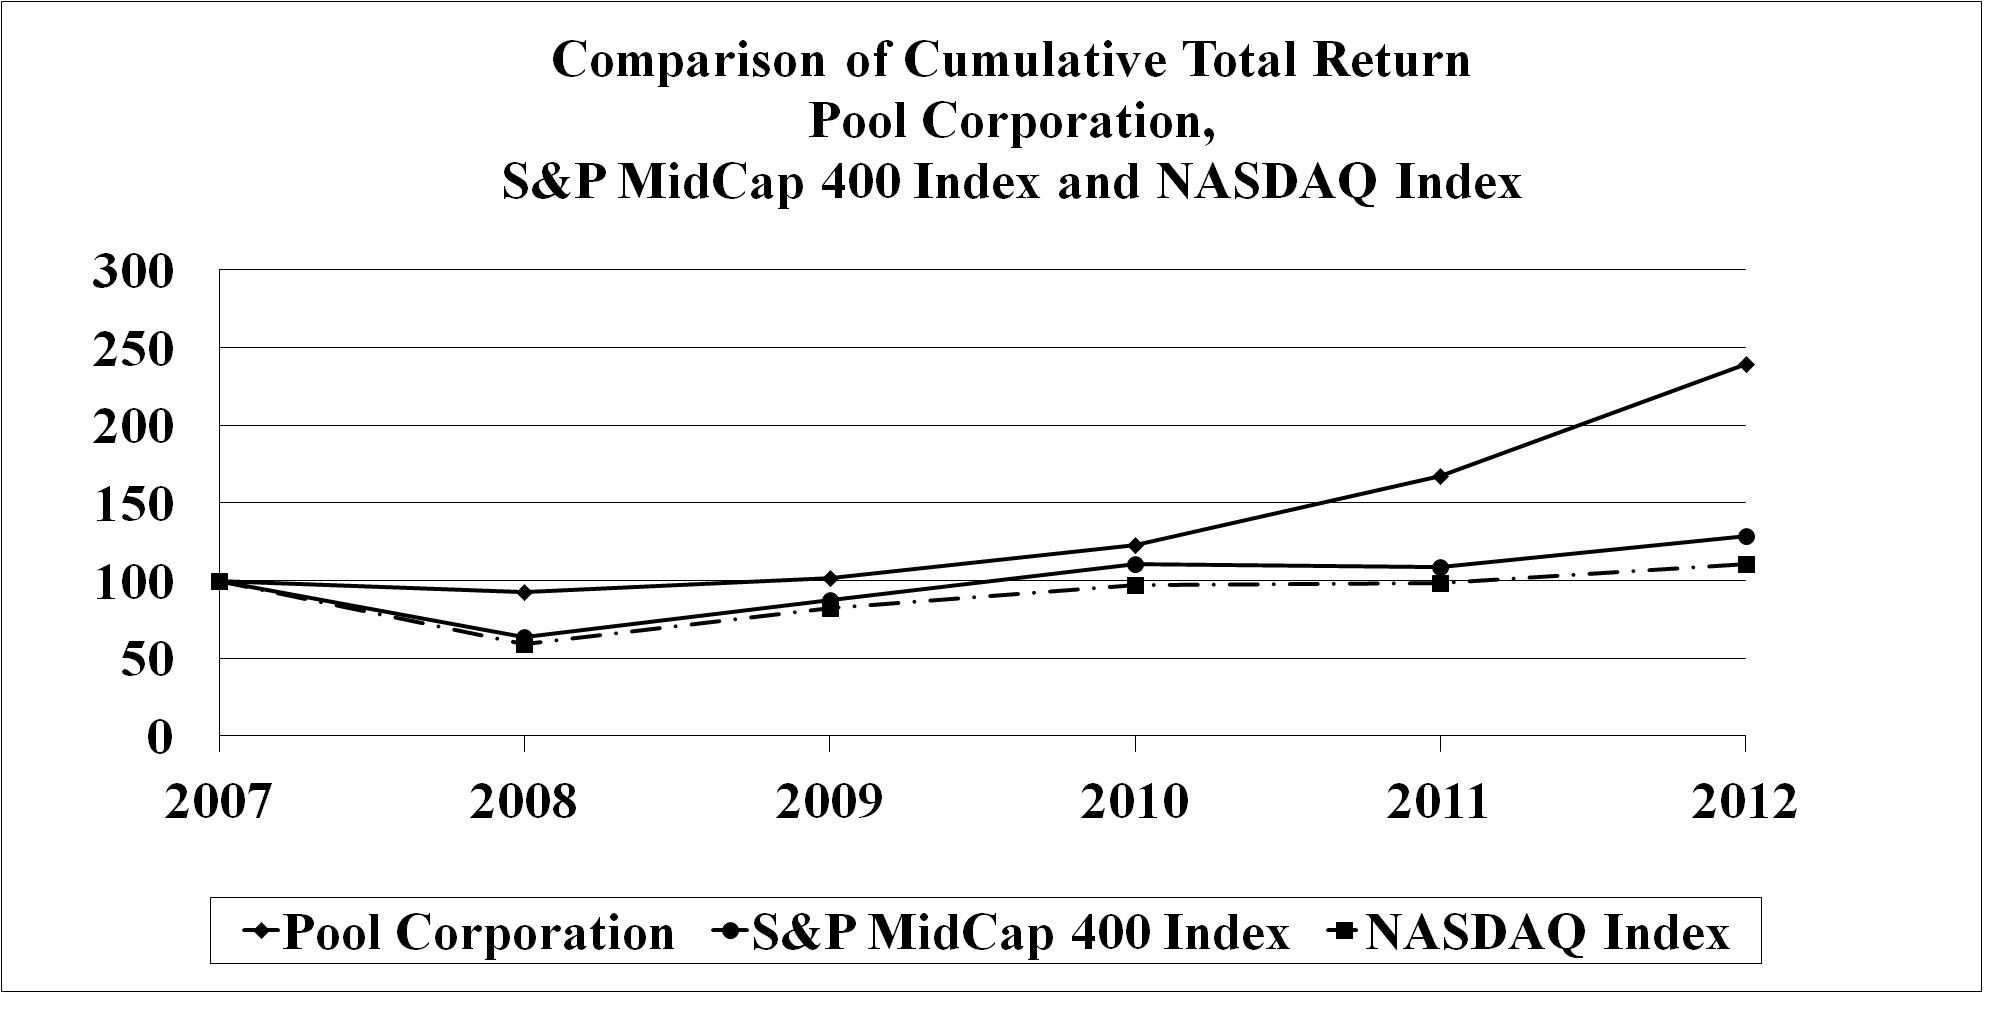
The following graph compares the total stockholder return on our common stock for the last five fiscal years with the total return on the NASDAQ Index and the S&P MidCap 400 Index for the same period, in each case assuming the investment of
$100
on
December 31, 2007
and the reinvestment of all dividends. We believe the S&P MidCap 400 Index includes companies with market capitalization comparable to ours. Additionally, we chose the S&P MidCap 400 Index for comparison, as opposed to an industry index, because we do not believe that we can reasonably identify a peer group or a published industry or line-of-business index that contains companies in a similar line of business.
14
|
Base
Period
|
Indexed Returns
Years Ending
|
|||||||||||||||||||||||
|
Company / Index
|
12/31/07
|
12/31/08
|
12/31/09
|
12/31/10
|
12/31/11
|
12/31/12
|
||||||||||||||||||
|
Pool Corporation
|
$
|
100.00
|
|
$
|
92.96
|
|
$
|
101.68
|
|
$
|
123.07
|
|
$
|
167.66
|
|
$
|
239.50
|
|
||||||
|
S&P MidCap 400 Index
|
100.00
|
|
63.77
|
|
87.61
|
|
110.94
|
|
109.02
|
|
128.51
|
|
||||||||||||
|
NASDAQ Index
|
100.00
|
|
59.03
|
|
82.25
|
|
97.32
|
|
98.63
|
|
110.78
|
|
||||||||||||
Purchases of Equity Securities
The table below summarizes the repurchases of our common stock in the fourth quarter of
2012
.
|
Period
|
Total Number
of Shares Purchased
(1)
|
Average
Price
Paid per
Share
|
Total Number of
Shares Purchased
as Part of Publicly
Announced Plan
(2)
|
Maximum Approximate
Dollar
Value of Shares
That May Yet be Purchased
Under
the Plan
(3)
|
||||||||||
|
October 1 – October 31, 2012
|
48,285
|
|
$
|
42.94
|
|
—
|
|
$
|
114,896,445
|
|
||||
|
November 1 – November 30, 2012
|
307,305
|
|
$
|
40.63
|
|
307,305
|
|
$
|
102,412,124
|
|
||||
|
December 1 – December 31, 2012
|
293,002
|
|
$
|
41.34
|
|
271,393
|
|
$
|
91,192,959
|
|
||||
|
Total
|
648,592
|
|
$
|
41.12
|
|
578,698
|
|
|
|
|||||
|
(1)
|
These shares may include shares of our common stock surrendered to us by employees in order to satisfy tax withholding obligations in connection with certain exercises of employee stock options and/or the exercise price of such options granted under our share-based compensation plans. Shares surrendered totaled
48,285
shares in
October
and
21,609
shares in
December
. There were
no
shares surrendered for this purpose in
November
.
|
|
(2)
|
In
May 2011
, our Board authorized a new
$100.0 million
share repurchase program that replaced our previous share repurchase program. In
August 2012
, our Board authorized an additional
$100.0 million
share repurchase program. Both of these programs are for the repurchase of shares of our common stock in the open market at prevailing market prices or in privately negotiated transactions.
|
|
(3)
|
In
2012
, we purchased a total of
$77.0 million
, or
2,042,272
shares, at an average price of
$37.72
per share. As of
February 20, 2013
,
$89.5 million
of the authorized amount remained available under our current share repurchase program.
|
15
The table below sets forth selected financial data from the Consolidated Financial Statements. You should read this information in conjunction with the discussions in Item 7 of this Form 10-K and with the Consolidated Financial Statements and accompanying Notes in Item 8 of this Form 10-K.
|
(in thousands, except per share data)
|
Year Ended December 31,
(1)
|
|||||||||||||||||||
|
2012
(2)
|
2011
|
2010
|
2009
(3)
|
2008
|
||||||||||||||||
|
Statement of Income Data
|
|
|
|
|
|
|||||||||||||||
|
Net sales
|
$
|
1,953,974
|
|
$
|
1,793,318
|
|
$
|
1,613,746
|
|
$
|
1,539,794
|
|
$
|
1,783,683
|
|
|||||
|
Operating income
|
144,869
|
|
125,067
|
|
101,245
|
|
88,440
|
|
115,476
|
|
||||||||||
|
Net income
|
81,972
|
|
71,993
|
|
57,638
|
|
19,202
|
|
56,956
|
|
||||||||||
|
Earnings per share:
|
|
|
|
|
|
|
|
|||||||||||||
|
Basic
|
$
|
1.75
|
|
$
|
1.49
|
|
$
|
1.17
|
|
$
|
0.39
|
|
$
|
1.19
|
|
|||||
|
Diluted
|
$
|
1.71
|
|
$
|
1.47
|
|
$
|
1.15
|
|
$
|
0.39
|
|
$
|
1.17
|
|
|||||
|
Cash dividends declared per common share
|
$
|
0.62
|
|
$
|
0.55
|
|
$
|
0.52
|
|
$
|
0.52
|
|
$
|
0.51
|
|
|||||
|
Balance Sheet Data
|
|
|
|
|
|
|
|
|
||||||||||||
|
Working capital
(4)
|
$
|
295,100
|
|
$
|
305,467
|
|
$
|
265,054
|
|
$
|
230,804
|
|
$
|
294,552
|
|
|||||
|
Total assets
(4)
|
780,576
|
|
770,902
|
|
728,545
|
|
743,099
|
|
830,906
|
|
||||||||||
|
Total long-term debt, including current portion
|
230,882
|
|
247,300
|
|
198,700
|
|
248,700
|
|
307,000
|
|
||||||||||
|
Stockholders' equity
|
281,623
|
|
279,746
|
|
285,182
|
|
252,187
|
|
241,734
|
|
||||||||||
|
Other
|
|
|
|
|
|
|
|
|||||||||||||
|
Base business sales growth/(decline)
(5)
|
7
|
%
|
10
|
%
|
2
|
%
|
(15
|
)%
|
(9
|
)%
|
||||||||||
|
Number of sales centers
|
312
|
|
298
|
|
291
|
|
287
|
|
288
|
|
||||||||||
|
(1)
|
During the years
2008
to
2012
, we completed
12
acquisitions consisting of
33
sales centers (net of sales center closings and consolidations within one year of acquisition). For information about our recent acquisitions, see Note 2 of “Notes to Consolidated Financial Statements,” included in Item 8 of this Form 10-K. Our results were negatively impacted between 2008 and 2010 due to adverse external market conditions, which included downturns in the housing market and overall economy that led to significant declines in pool and irrigation construction activities and deferred discretionary replacement purchases by consumers.
|
|
(2)
|
In 2012, operating income, net income and earnings per share amounts were significantly impacted by a $6.9 million non-cash goodwill impairment charge related to our United Kingdom reporting unit. The impact of this impairment charge on earnings was $0.14 per diluted share.
|
|
(3)
|
The 2009 net income and earnings per share amounts include the impact of a $26.5 million equity loss that we recognized in September 2009 related to our pro rata share of Latham Acquisition Corporation’s (LAC) non-cash goodwill and other intangible asset impairment charge. The impact of this impairment charge on earnings was $0.54 per diluted share. The recognized loss resulted in the full write-off of our equity method investment in LAC. As of January 2010, we no longer had an equity interest in LAC.
|
|
(4)
|
For comparative purposes, we reclassified certain amounts in the 2011 financial statements to conform to the 2012 presentation. For additional information, see Note 1 and Note 7 of "Notes to Consolidated Financial Statements," included in Item 8 of this Form 10-K.
|
|
(5)
|
For a discussion regarding our calculation of base business sales, see Item 7, “Management’s Discussion and Analysis of Financial Condition and Results of Operations - RESULTS OF OPERATIONS,” of this Form 10-K.
|
16
For a discussion of our base business calculations, see the RESULTS OF OPERATIONS section below.
In our discussion of results of operations below, adjusted operating income, adjusted net income and adjusted diluted earnings per share (EPS) for all periods exclude the Goodwill impairment line item on the Consolidated Statements of Income. We have provided these adjusted amounts because we believe it helps investors assess our year-over-year operating performance.
2012 FINANCIAL OVERVIEW
Financial Results
Solid performance in 2012 produced record results, surpassing our objectives. Net sales increased 9% compared to 2011, including a 7% increase in base business sales. Base business sales growth was driven by market share gains, continued improvement in consumer discretionary expenditures, growth in the installed base of pools and some price inflation, partially offset by unfavorable currency fluctuations of approximately 1%.
Gross profit increased 7% compared to 2011, while gross profit as a percentage of net sales (gross margin) decreased 60 basis points to 29.0%. This decrease reflects unfavorable product and customer mix changes and competitive pricing pressures. Gross margin in 2012 was also comparatively lower than 2011 gross margin due to the benefits realized in 2011 from opportunistic inventory purchases.
Selling and administrative expenses (operating expenses) for 2012 increased 3%, with base business operating expenses essentially flat year over year. Decreases in employee incentive costs, lower bad debt expense and the impact of currency fluctuations were offset by higher professional fees and increases in wages and employee insurance.
During the third quarter of 2012, we recorded a non-cash goodwill impairment charge of $6.9 million, equal to the total goodwill carrying amount of our United Kingdom reporting unit. This impairment charge had a $0.14 negative impact on diluted EPS for the year ended December 31, 2012. Since this goodwill impairment charge was not deductible for tax purposes, our effective income tax rate for the year ended December 31, 2012 was higher than normal. During the fourth quarter of 2011, we recorded a non-cash goodwill impairment charge of $1.6 million resulting from our annual goodwill impairment analysis. This impairment charge had a $0.03 negative impact on diluted EPS for the year ended December 31, 2011.
Operating income for the year improved 16%, while operating income as a percentage of net sales (operating margin) increased 40 basis points to 7.4%. Excluding goodwill impairment in both years, adjusted operating income for 2012 increased 20% and adjusted operating margin increased 70 basis points to 7.8% for the year ended December 31, 2012. Net interest expense decreased $1.5 million due to the impacts of changes in estimated interest expense related to uncertain tax positions and foreign currency translation gains and losses.
Net income increased 14% compared to 2011, while earnings per share was up 16% to $1.71 per diluted share. Adjusted net income for 2012 increased 21% and adjusted EPS was up 23% to $1.85 per diluted share.
Financial Position and Liquidity
Cash provided by operations of $
119.1 million
in
2012
was $
30.2 million
more than adjusted net income and, combined with $
83.6 million
in net proceeds from our revolving line of credit and $
20.2 million
in proceeds from stock issued under share-based compensation plans, helped fund the following:
|
•
|
payments of $
4.7 million
related to acquisitions;
|
|
•
|
net capital expenditures of $16.3 million;
|
|
•
|
quarterly cash dividend payments to shareholders, which totaled $
29.1 million
for the year;
|
|
•
|
share repurchases in the open market of $77.0 million; and
|
|
•
|
the payoff of our $100.0 million Floating Rate Senior Notes at maturity.
|
Total net receivables increased 4% compared to
December 31, 2011
due primarily to an increase in current trade receivables as a result of December base business sales growth, higher vendor receivables and a slight reduction in the allowance for doubtful accounts. Days sales outstanding (DSO) improved between periods to
28.8
days at
December 31, 2012
compared to
29.9
days at
December 31, 2011
.
17
Inventory levels were up 3% to $400.3 million at
December 31, 2012
compared to levels at
December 31, 2011
. Excluding inventory of approximately $4.0 million from recent acquisitions, inventories increased 2% year over year. Our inventory turns, as calculated on a trailing twelve month basis, accelerated to
3.4
times at
December 31, 2012
from
3.2
times at
December 31, 2011
.
Total debt outstanding was
$230.9 million
at
December 31, 2012
, a decrease of
$16.4 million
compared to
December 31, 2011
.
Current Trends and Outlook
The economic downturn between 2007 and 2009 had a significant impact on our industry, driving an approximate 80% reduction in new pool construction in the United States compared to peak levels in 2005 and also contributing to more than a 30% decline in replacement and refurbishment activities. While we estimate that new pool construction has increased from a low of roughly
45,000
new units in 2009 to approximately
60,000
new units in 2012, construction levels are still down more than
70%
compared to peak levels in 2005 and down approximately 60% from what we consider normalized levels.
Our base business sales growth in 2012 and 2011 was driven by market share gains, but also reflected continued improvement in consumer discretionary expenditures and higher replacement activities given our estimated industry growth of 3% to 4% each year. Although general external market factors including consumer confidence, employment, housing, consumer financing and economic growth have improved, we believe the current economic environment remains uncertain, especially in Europe due to lingering sovereign debt and economic issues.
Looking ahead, we believe there is potential for a significant sales recovery due to the build-up of deferred replacement and remodeling activity and our expectation for gradually normalized new pool and irrigation construction levels. We also expect that market conditions will continue to improve, enabling further recovery of replacement, remodeling and new construction activity to normalized levels over the next 7 to 10 years. We expect that the industry will realize an annual growth rate of approximately 4% to 7% over this time period before reverting back to 3% to 5% annual growth over the longer term. We believe that we are well positioned to take advantage of both the eventual market recovery and the inherent long-term growth opportunities in our industry.
Our outlook for 2013 is very similar to 2012 with regard to the macroeconomic environment, industry growth levels and opportunities for us to realize additional market share gains. We anticipate 5% to 7% base business sales growth, including our expectation for average inflationary product cost increases of 1% to 2%. We believe that unfavorable product and customer mix changes and competitive pricing trends will continue in 2013, therefore improved purchasing and pricing discipline will be key to realizing any gross margin improvement in 2013. As such, we expect that our gross margin will remain relatively flat for the full year with quarterly gross margin comparisons versus 2012 varying by 30 or more basis points.
Base business operating expenses were essentially flat versus 2011, as decreases in employee incentive costs, lower bad debt expense and the impact of currency fluctuations were offset by higher professional fees and increases in wages and employee insurance. Overall, we anticipate more normalized levels of expense growth in 2013, including inflationary increases and some incremental costs to support our sales growth expectations with operating expense growth at about half the rate of sales growth. We expect base business results will generate operating profit growth as a percentage of base business sales growth (contribution margin) at or approaching 20% in 2013.
Based on these expectations, we project that 2013 earnings per share will be approximately $2.13 to $2.23 per diluted share. We expect cash provided by operations will exceed net income for fiscal
2013
and anticipate that share repurchase activity will be similar to 2012.
The forward-looking statements in this Current Trends and Outlook section are subject to significant risks and uncertainties, including changes in the economy and the housing market, the sensitivity of our business to weather conditions, our ability to maintain favorable relationships with suppliers and manufacturers, competition from other leisure product alternatives and mass merchants, and other risks detailed in Item 1A of this Form 10-K.
18
CRITICAL ACCOUNTING ESTIMATES
We prepare our Consolidated Financial Statements in accordance with U.S. generally accepted accounting principles (GAAP), which requires management to make estimates and assumptions that affect reported amounts and related disclosures. Management identifies critical accounting estimates as:
|
•
|
those that require the use of assumptions about matters that are inherently and highly uncertain at the time the estimates are made; and
|
|
•
|
those for which changes in the estimate or assumptions, or the use of different estimates and assumptions, could have a material impact on our consolidated results of operations or financial condition.
|
Management has discussed the development, selection and disclosure of our critical accounting estimates with the Audit Committee of our Board. We believe the following critical accounting estimates require us to make the most difficult, subjective or complex judgments.
Allowance for Doubtful Accounts
We maintain an allowance for doubtful accounts for an estimate of the losses we will incur if our customers do not make required payments. We perform periodic credit evaluations of our customers and typically do not require collateral. Consistent with industry practices, we generally require payment from our North American customers within 30 days except for sales under early buy programs for which we provide extended payment terms to qualified customers. The extended terms usually require payments in equal installments in April, May and June or May and June, depending on geographic location. Credit losses have generally been within or better than our expectations.
As our business is seasonal, our customers’ businesses are also seasonal. Sales are lowest in the winter months and our past due accounts receivable balance as a percentage of total receivables generally increases during this time. We provide reserves for uncollectible accounts based on the accounts receivable aging ranging from 0.1% for amounts currently due up to 100% for specific accounts more than 60 days past due.
At the end of each quarter, we perform a reserve analysis of all accounts with balances greater than $20,000 and more than 60 days past due. Additionally, we perform a separate reserve analysis on the balance of our accounts receivables with emphasis on past due accounts. As we review these past due accounts, we evaluate collectibility based on a combination of factors including:
|
•
|
aging statistics and trends;
|
|
•
|
customer payment history;
|
|
•
|
independent credit reports; and
|
|
•
|
discussions with customers.
|
During the year, we write off account balances when we have exhausted reasonable collection efforts and determined that the likelihood of collection is remote. These write-offs are charged against our allowance for doubtful accounts. In the past five years, write-offs have averaged approximately
0.3%
of net sales annually. Write-offs as a percentage of net sales were
0.1%
in
2012
,
0.2%
in
2011
and
0.3%
in
2010
. Write-offs in 2010 were higher than our long-term historical average of approximately 0.2% of net sales due to the negative impacts on some of our customers' businesses from the challenging external environment between 2007 and 2010. Based on significant reductions in our past due receivables aging categories due to gradually improving external market trends, heightened collection efforts and creditworthiness evaluations, net write-offs improved significantly in 2011 and 2012. We expect that write-offs will be approximately
0.1%
of net sales in
2013
.
If the balance of the accounts receivable reserve increased or decreased by 20% at
December 31, 2012
, pretax income would change by approximately
$1.1 million
and earnings per share would change by approximately
$0.01
per diluted share (based on the number of weighted average diluted shares outstanding for the year ended
December 31, 2012
).
Inventory Obsolescence
Product inventories represent the largest asset on our balance sheet. Our goal is to manage our inventory such that we minimize stock-outs to provide the highest level of service to our customers. To do this, we maintain at each sales center an adequate inventory of stock keeping units (SKUs) with the highest sales volumes. At the same time, we continuously strive to better manage our slower moving classes of inventory, which are not as critical to our customers and thus, inherently have lower velocity. Sales centers classify products into 13 classes based on sales at that location over the past 12 months (or 36 months for tile products).
19
All inventory is included in these classes, except for non-stock special order items and products with less than 12 months of usage. The table below presents a description of these inventory classes:
|
Class 0
|
new products with less than 12 months usage (or 36 months for tile products)
|
|
|
|
|
Classes 1-4
|
highest sales value items, which represent approximately 80% of net sales at the sales center
|
|
|
|
|
Classes 5-12
|
lower sales value items, which we keep in stock to provide a high level of customer service
|
|
|
|
|
Class 13
|
products with no sales for the past 12 months at the local sales center level, excluding special order products not yet delivered to the customer
|
|
|
|
|
Null class
|
non-stock special order items
|
There is little risk of obsolescence for products in classes 1-4 because products in these classes generally turn quickly. We establish our reserve for inventory obsolescence based on inventory classes 5-13, which we believe represent some exposure to inventory obsolescence, with particular emphasis on SKUs with the least sales over the previous 12 months. The reserve is intended to reflect the value of inventory that we may not be able to sell at a profit. We provide a reserve of 5% for inventory in classes 5-13 and non-stock inventory as determined at the sales center level. We also provide an additional 5% reserve for excess inventory in classes 5-12 and an additional 45% reserve for excess inventory in class 13. We determine excess inventory, which is defined as the amount of inventory on hand in excess of the previous 12 months usage, on a company-wide basis. We also evaluate whether the calculated reserve provides sufficient coverage of the total class 13 inventory.
In evaluating the adequacy of our reserve for inventory obsolescence, we consider a combination of factors including:
|
•
|
the level of inventory in relationship to historical sales by product, including inventory usage by class based on product sales at both the sales center and Company levels;
|
|
•
|
changes in customer preferences or regulatory requirements;
|
|
•
|
seasonal fluctuations in inventory levels;
|
|
•
|
geographic location; and
|
|
•
|
new product offerings.
|
We periodically adjust our reserve for inventory obsolescence as changes occur in the above-identified factors.
If the balance of our inventory reserve increased or decreased by 20% at
December 31, 2012
, pretax income would change by approximately
$1.5 million
and earnings per share would change by approximately
$0.02
per diluted share (based on the number of weighted average diluted shares outstanding for the year ended
December 31, 2012
).
Vendor Incentives
Many of our vendor arrangements provide for us to receive incentives of specified amounts of consideration when we achieve any of a number of measures. These measures are generally related to the volume level of purchases from our vendors and may include negotiated pricing arrangements. We account for vendor incentives as a reduction of the prices of the vendor’s products and therefore a reduction of inventory until we sell the product, at which time such incentives are recognized as a reduction of cost of sales in our income statement.
Throughout the year, we estimate the amount of the incentive earned based on our estimate of total purchases for the fiscal year relative to the purchase levels that mark our progress toward earning the incentives. We accrue vendor incentives on a monthly basis using these estimates provided that we determine they are probable and reasonably estimable. Our estimates for annual purchases, future inventory levels and sales of qualifying products are driven by our sales projections, which can be significantly impacted by a number of external factors including weather and changes in economic conditions. Changes in our purchasing mix also impact our incentive estimates, as incentive rates can vary depending on our volume of purchases from specific vendors. We continually revise these estimates throughout the year to reflect actual purchase levels and identifiable trends. As a result, our estimated quarterly vendor incentive accruals may include cumulative catch-up adjustments to reflect any changes in our estimates between reporting periods.
20
If market conditions were to change, vendors may change the terms of some or all of these programs. Although such changes would not affect the amounts we have recorded related to products already purchased, they may lower or raise our gross margins for products purchased and sold in future periods.
Income Taxes
We record deferred tax assets or liabilities based on differences between the financial reporting and tax basis of assets and liabilities using currently enacted rates and laws that will be in effect when we expect the differences to reverse. Due to changing tax laws and state income tax rates, significant judgment is required to estimate the effective tax rate expected to apply to tax differences that are expected to reverse in the future.
As of
December 31, 2012
, we have not provided for United States income taxes on undistributed earnings of our foreign subsidiaries, as we have invested or expect to invest the undistributed earnings indefinitely. If these earnings are repatriated to the United States in the future, or if we determine that the earnings will be remitted in the foreseeable future, additional tax provisions may be required. Determining the amount of unrecognized deferred tax liability on these undistributed earnings is not practicable due to the complexity of tax laws and regulations and the varying circumstances, tax treatments and timing of any future repatriation.
We hold, through our wholly owned affiliates, cash balances in the countries in which we operate, including amounts held outside the United States. Most of the amounts held outside the United States could be repatriated to the United States, but, under current law, may be subject to United States federal income taxes, less applicable foreign tax credits. Repatriation of some foreign balances is restricted by local laws including the imposition of withholding taxes in some jurisdictions.
We have operations in
39
states,
1
United States territory and
9
foreign countries. The amount of income taxes we pay is subject to adjustment by the applicable tax authorities. We are subject to regular audits by federal, state and foreign tax authorities. Our estimate for the potential outcome of any uncertain tax issue is highly judgmental. We regularly evaluate our tax positions, assess the probability of examinations by taxing authorities and incorporate these expectations into our reserve estimates. We believe we have adequately provided for any reasonably foreseeable outcome related to these matters. However, our future results may include favorable or unfavorable adjustments to our estimated tax liabilities in the period the assessments are made or resolved or when statutes of limitation on potential assessments expire. These adjustments may include changes in valuation allowances that we have established. As a result of these uncertainties, our total income tax provision may fluctuate on a quarterly basis.
Incentive Compensation Accrual
Our incentive compensation structure is designed to attract, motivate and retain employees. Our incentive compensation packages include bonus plans that are specific to each group of eligible participants and their levels and areas of responsibility. The majority of our bonus plans have annual cash payments that are based primarily on objective performance criteria, with a component based on management’s discretion. We calculate bonuses based on the achievement of certain key measurable financial and operational results, including budgeted operating income and diluted earnings per share. We generally make bonus payments at the end of February following the most recently completed fiscal year.
Management sets the objectives for our bonus plans at the beginning of the bonus plan year using both historical information and forecasted results of operations for the current plan year. The Compensation Committee of our Board approves these objectives for certain bonus plans. We record an incentive compensation accrual at the end of each month using management’s estimate of the total overall incentives earned based on the amount of progress achieved toward the stated bonus plan objectives. During the third and fourth quarters and as of our fiscal year end, we adjust our estimated incentive compensation accrual based on our detailed analysis of each bonus plan, the participants’ progress toward achievement of their specific objectives and management’s estimates related to the discretionary components of the bonus plans.
Our quarterly incentive compensation expense and accrual balances may vary relative to actual annual bonus expense and payouts due to the following:
|
•
|
the discretionary components of the bonus plans;
|
|
•
|
differences between estimated and actual performance; and
|
|
•
|
our projections related to achievement of multiple-year performance objectives for our Strategic Plan Incentive Program.
|
21
Impairment of Goodwill
Our largest intangible asset is goodwill. At
December 31, 2012
, our goodwill balance was
$170.0 million
, representing approximately
22%
of total assets. Goodwill represents the excess of the amount we paid to acquire a company over the estimated fair value of tangible assets and identifiable intangible assets acquired, less liabilities assumed.
We are required to test goodwill for impairment annually or on a more frequent basis if events or changes in circumstances occur that indicate potential impairment. If the estimated fair value of any of our reporting units has fallen below their carrying value, we compare the estimated fair value of the reporting unit's goodwill to its carrying value. If the carrying value of a reporting unit's goodwill exceeds its estimated fair value, we recognize the difference as an impairment loss in operating income.
Since we define an operating segment as an individual sales center and we do not have operations below the sales center level, our reporting unit is an individual sales center. As of
October 1, 2012
, we had
209
reporting units with allocated goodwill balances. The highest goodwill balance was
$5.7 million
and the average goodwill balance was
$0.8 million
.
We estimate the fair value of our reporting units by utilizing a present value model that incorporates our assumptions for projected future cash flows, discount rates and multiples. In order to determine the reasonableness of the assumptions included in our fair value estimates, we compare the total estimated fair value for all aggregated reporting units to our market capitalization on the date of our impairment test. We also review for potential impairment indicators at the reporting unit level based on an evaluation of recent historical operating trends, current and projected local market conditions and other relevant factors as appropriate.
During the third quarter of 2012, we performed an interim goodwill impairment analysis based on our identification of impairment indicators related to our results through the end of the 2012 pool season and the depressed economic conditions in the United Kingdom. Our results for the nine months ended September 30, 2012 were significantly lower than our 2012 sales, gross profit and operating profit estimates for the United Kingdom reporting unit that we used in our 2011 annual goodwill impairment test. We updated our 2011 impairment analysis for both our actual 2012 year to date results and our updated growth estimates for future years based on expectations for a more prolonged economic recovery period in the United Kingdom. Our updated projections had a significant impact on our projected future cash flow calculation and resulted in a much lower estimated fair value for our United Kingdom reporting unit. Consequently, we recorded a non-cash goodwill impairment charge of
$6.9 million
equal to the total carrying amount of our United Kingdom reporting unit.
In October
2012
, we performed our annual goodwill impairment test and did not identify any goodwill impairment at the reporting unit level.
Based on the combination of their higher goodwill balances and the overall economic conditions and uncertainty in Europe, we identified our Spain and Italy reporting units as the most at risk for goodwill impairment. We believe that our domestic reporting units most at risk for goodwill impairment are the three Horizon locations in Texas that had a recorded goodwill impairment in 2011. Other domestic reporting units considered at risk for goodwill impairment include two additional Horizon locations in Texas, one Horizon location in Nevada and one Superior location in New Jersey that each had marginal results in recent years, but improved profitability in 2012. As of
December 31, 2012
, our European at risk reporting units had an aggregate goodwill balance of
$6.4 million
and our domestic at risk reporting units had an aggregate goodwill balance of
$9.5 million
.
If our assumptions or estimates in our fair value calculations change, we could incur additional impairment charges in future periods, especially related to the reporting units discussed above. Additional impairment charges would decrease operating income and result in lower asset values on our balance sheet. We performed a sensitivity test for the two key assumptions in our 2012 annual goodwill impairment test and determined that an increase in our estimated weighted average cost of capital of 50 basis points or a decrease in the estimated perpetuity growth rate of 50 basis points would not hav
e resulted in any calculated g
oodwill impairments.
Recent Accounting Pronouncements
In February 2013, the Financial Accounting Standards Board issued new guidance to give more prominence to items reclassified out of accumulated other comprehensive income (AOCI). The new standard requires companies to disclose the effect on each income statement line item due to the reclassification of an AOCI component into net income, or if the reclassification does not impact net income, the applicable accounting guidance and related financia
l statement effects. This standard is effective for reporting periods beginning after December 15, 2012. We expect that the adoption of this guidance will impact our financial statement disclosures, but will not have a material impact on our financial position or results of operations.
22
RESULTS OF OPERATIONS
The table below summarizes information derived from our Consolidated Statements of Income expressed as a percentage of net sales for the past three fiscal years:
|
Year Ended December 31,
|
|||||||||
|
2012
|
2011
|
2010
|
|||||||
|
Net sales
|
100.0
|
%
|
100.0
|
%
|
100.0
|
%
|
|||
|
Cost of sales
|
71.0
|
|
70.4
|
|
70.8
|
|
|||
|
Gross profit
|
29.0
|
|
29.6
|
|
29.2
|
|
|||
|
Operating expenses
|
21.3
|
|
22.6
|
|
22.9
|
|
|||
|
Goodwill impairment
|
0.4
|
|
0.1
|
|
—
|
|
|||
|
Operating income
|
7.4
|
|
7.0
|
|
6.3
|
|
|||
|
Interest expense, net
|
0.3
|
|
0.4
|
|
0.4
|
|
|||
|
Income before income taxes and equity earnings
|
7.1
|
%
|
6.5
|
%
|
5.9
|
%
|
|||
|
Note: Due to rounding, percentages may not add to operating income or income before income taxes and equity earnings.
|
Our discussion of consolidated operating results includes the operating results from acquisitions in
2012
,
2011
and
2010
. We have included the results of operations in our consolidated results since the respective acquisition dates.
Fiscal Year
2012
compared to Fiscal Year
2011
The following table breaks out our consolidated results into the base business component and the excluded components (sales centers excluded from base business):
|
(Unaudited)
|
Base Business
|
Excluded
|
Total
|
|||||||||||||||||||||
|
(in thousands)
|
Year Ended
|
Year Ended
|
Year Ended
|
|||||||||||||||||||||
|
|
December 31,
|
December 31,
|
December 31,
|
|||||||||||||||||||||
|
|
2012
|
2011
|
2012
|
2011
|
2012
|
2011
|
||||||||||||||||||
|
Net sales
|
$
|
1,910,333
|
|
$
|
1,787,800
|
|
$
|
43,641
|
|
$
|
5,518
|
|
$
|
1,953,974
|
|
$
|
1,793,318
|
|
||||||
|
Gross profit
|
555,493
|
|
530,002
|
|
11,914
|
|
1,588
|
|
567,407
|
|
531,590
|
|
||||||||||||
|
Gross margin
|
29.1
|
%
|
29.6
|
%
|
27.3
|
%
|
28.8
|
%
|
29.0
|
%
|
29.6
|
%
|
||||||||||||
|
Operating expenses
|
401,897
|
|
402,709
|
|
13,695
|
|
2,264
|
|
415,592
|
|
404,973
|
|
||||||||||||
|
Expenses as a % of net sales
|
21.0
|
%
|
22.5
|
%
|
31.4
|
%
|
41.0
|
%
|
21.3
|
%
|
22.6
|
%
|
||||||||||||
|
Goodwill impairment
|
6,946
|
|
1,550
|
|
—
|
|
—
|
|
6,946
|
|
1,550
|
|
||||||||||||
|
Operating income (loss)
|
146,650
|
|
125,743
|
|
(1,781
|
)
|
(676
|
)
|
144,869
|
|
125,067
|
|
||||||||||||
|
Operating margin
|
7.7
|
%
|
7.0
|
%
|
(4.1
|
)%
|
(12.3
|
)%
|
7.4
|
%
|
7.0
|
%
|
||||||||||||
23
We have excluded the following acquisitions from base business for the periods identified:
|
Acquired
(1)
|
Acquisition
Date
|
Net
Sales Centers
Acquired
|
Periods
Excluded
|
|||
|
CCR Distribution
|
March 2012
|
1
|
March–December 2012
|
|||
|
Ideal Distributors Ltd.
|
February 2012
|
4
|
February–December 2012
|
|||
|
G.L. Cornell Company
|
December 2011
|
1
|
January–December 2012 and December 2011
|
|||
|
Poolway Schwimmbadtechnik GmbH
|
November 2011
|
1
|
January–December 2012 and November–December 2011
|
|||
|
The Kilpatrick Company, Inc.
|
May 2011
|
4
|
January–July 2012 and May–July 2011
|
|||
|
Turf Equipment Supply Co.
|
December 2010
|
3
|
January–February 2012 and January–February 2011
|
|||
|
Pool Boat and Leisure, S.A.
|
December 2010
|
1
|
January–February 2012 and January–February 2011
|
|||
|
(1)
|
We acquired certain distribution assets of each of these companies.
|
We exclude sales centers that are acquired, closed or opened in new markets from base business results for a period of 15 months. We also exclude consolidated sales centers when we do not expect to maintain the majority of the existing business and existing sales centers that are consolidated with acquired sales centers. There were four sales centers opened in new markets that were excluded from base business as of
December 31, 2012
.
We generally allocate corporate overhead expenses to excluded sales centers on the basis of their net sales as a percentage of total net sales. After 15 months of operations, we include acquired, consolidated and new market sales centers in the base business calculation including the comparative prior year period.
The table below summarizes the changes in our sales centers during
2012
:
|
December 31, 2011
|
298
|
|
|
Acquired
|
5
|
|
|
New locations
|
9
|
|
|
December 31, 2012
|
312
|
|
For information about our recent acquisitions, see Note 2 of “Notes to Consolidated Financial Statements,” included in Item 8 of this Form 10-K.
Net Sales
|
(in millions)
|
Year Ended December 31,
|
|
||||||||||||
|
2012
|
2011
|
Change
|
||||||||||||
|
Net sales
|
$
|
1,954.0
|
|
$
|
1,793.3
|
|
$
|
160.7
|
|
9%
|
||||
Net sales for 2012 increased 9% compared to 2011, including a 7% increase in base business sales and a 2% increase related to our recent acquisitions and sales centers opened in new markets. Our base business sales growth included a 7% increase on the swimming pool side of the business and a 10% increase on the irrigation side of the business. In local currencies, net sales in Europe declined approximately 1% in 2012, as modest sales growth in France, our largest European market, offset double digit sales declines in the United Kingdom and sales declines in Spain and Italy.
24
The principal factors contributing to base business sales growth included the following (listed in order of estimated magnitude):
|
•
|
market share gains attributed to continued improvements in customer service levels, sales growth rates for certain product offerings such as building materials and chemicals (see discussion below) and higher base business sales growth for the irrigation side of the business, which included benefits realized from a regional competitor going out of business;
|
|
•
|
double‑digit sales growth for higher value, lower margin products, such as variable speed pumps, motorized pool lifts, pool heaters and LED lighting;
|
|
•
|
continued improvement in consumer discretionary expenditures, including some market recovery in remodeling activity;
|
|
•
|
the impact of inflationary product cost increases (estimated at approximately 1% to 2%); and
|
|
•
|
higher sales of non-discretionary products for the refurbishment of the aging installed base of swimming pools, which we estimate grew 1% over the past year.
|
Sales of building materials, tile and packaged pool products grew by 16% compared to 2011, although collectively these products only accounted for approximately 12% of our total sales. Chemical sales grew by 5%, with a small benefit overall from price inflation despite some lingering price deflation for certain chemical products.
These sales increases were offset by unfavorable foreign currency fluctuations of approximately 1%.
Our sales performance in 2012 was strongest in the first quarter with 13% base business sales growth, modest in the middle second and third quarters, and solid in the fourth quarter with 12% base business sales growth. Sales benefited from exceptionally favorable weather through May as record warm spring temperatures spawned an early start to the 2012 peak season. However, June and July sales were negatively impacted by unfavorable weather conditions compared to the same period in 2011 and the shift of business into earlier months. See discussion of significant weather impacts under the subheading
Seasonality and Quarterly Fluctuations
beginning on page 30.
Gross Profit
|
(in millions)
|
Year Ended December 31,
|
|
||||||||||||
|
2012
|
2011
|
Change
|
||||||||||||
|
Gross profit
|
$
|
567.4
|
|
$
|
531.6
|
|
$
|
35.8
|
|
7%
|
||||
|
Gross margin
|
29.0
|
%
|
29.6
|
%
|
|
|
||||||||
Gross margin decreased 60 basis points between periods, reflecting unfavorable changes in our product and customer mix, competitive pricing pressures and unfavorable comparisons to 2011, which benefited from opportunistic inventory purchases. As discussed above, customer demand shifted somewhat in 2012 to higher value, lower margin products. While this product mix change strongly contributed to 2012 sales and gross profit growth, it negatively impacted gross margin. Additionally, going into the 2011 season, we made greater early buy inventory purchases in advance of year-end vendor price increases and we made additional bulk inventory purchases in advance of mid-year 2011 vendor price increases. These strategic purchases benefited our gross margin throughout 2011. We made more modest early buy inventory purchases going into the 2012 season as vendor price increases were less escalated.
Favorable impacts on comparative gross margin included continued improvements in purchasing and pricing discipline and a 10 basis point increase attributed to lower debit card fees as a percentage of net sales as a result of the Dodd‑Frank Wall Street Reform and Consumer Protection Act.
Year over year, gross margin comparisons worsened throughout 2012, with declines of 30 basis points in the first quarter, 50 basis points in the second quarter, 70 basis points in the third quarter and 90 basis points in the fourth quarter. The gradual decline reflected the difficult comparison to 2011 due to the timing and amount of inventory purchases, combined with changes in product and customer mix during 2012.
25
Operating Expenses
|
(in millions)
|
Year Ended December 31,
|
|
||||||||||||
|
2012
|
2011
|
Change
|
||||||||||||
|
Operating expenses
|
$
|
415.6
|
|
$
|
405.0
|
|
$
|
10.6
|
|
3%
|
||||
|
Operating expenses as a percentage of net sales
|
21.3
|
%
|
22.6
|
%
|
|
|
||||||||
Operating expenses increased 3% compared to 2011. Base business operating expenses remained essentially flat due to the following:
|
•
|
a $3.7 million decrease in employee incentive costs;
|
|
•
|
a $2.5 million impact on expenses from currency fluctuations; and
|
|
•
|
a $2.2 million decline in bad debt expense, due to improved collection and write-off trends.
|
These declines were offset by increases of $4.1 million in salaries and wages and $2.1 million in employee insurance costs primarily due to a 3% increase in average headcount excluding acquisitions. Professional fees also increased by $2.5 million.
Interest Expense, net
Interest expense, net decreased $1.5 million due primarily to the impact of foreign currency transaction gains and losses, with gains of $0.1 million recognized in 2012 compared to losses of $0.6 million recognized in 2011. Interest expense related to borrowings declined approximately $0.3 million in 2012 due primarily to a decline in expense on interest rate swap contracts. Average outstanding debt was down 2% compared to 2011 and the weighted average effective interest rate remained flat at 2.6% between periods. In 2011, we realized a $0.3 million loss related to the early termination of interest rate swap contracts in the fourth quarter.
Income Taxes
Our effective income tax rate was 41.00% at December 31, 2012 compared to 38.70% at December 31, 2011. This slightly higher effective income tax rate reflects an increase in our valuation allowance and a small impact due to the temporary lapse of the controlled foreign corporation income exclusion, offset by benefits realized upon the expiration of statutes of limitations for our 2007 income tax returns.
Net Income and Earnings Per Share
Net income increased 14% to $82.0 million in 2012, while earnings per share increased 16% to $1.71 per diluted share. Excluding the $6.9 million ($0.14 per diluted share) impact from the goodwill impairment charge in 2012 and the $1.6 million ($0.03 per diluted share) impact from the goodwill impairment charge in 2011, adjusted net income for 2012 increased 21% to $88.9 million and adjusted earnings per share increased 23% to $1.85 per diluted share. Earnings per share for 2012 also included the following:
|
•
|
an accretive impact of approximately $0.02 per diluted share from the reduction in our weighted average shares outstanding due to our share repurchase activities during the year; and
|
|
•
|
an unfavorable impact of $0.01 per diluted share due to foreign currency fluctuations.
|
26
Fiscal Year
2011
compared to Fiscal Year
2010
The following table breaks out our consolidated results into the base business component and the excluded components (sales centers excluded from base business):
|
(Unaudited)
|
Base Business
|
Excluded
|
Total
|
|||||||||||||||||||||
|
(in thousands)
|
Year Ended
|
Year Ended
|
Year Ended
|
|||||||||||||||||||||
|
|
December 31,
|
December 31,
|
December 31,
|
|||||||||||||||||||||
|
|
2011
|
2010
|
2011
|
2010
|
2011
|
2010
|
||||||||||||||||||
|
Net sales
|
$
|
1,766,651
|
|
$
|
1,607,892
|
|
$
|
26,667
|
|
$
|
5,854
|
|
$
|
1,793,318
|
|
$
|
1,613,746
|
|
||||||
|
Gross profit
|
523,778
|
|
469,515
|
|
7,812
|
|
1,747
|
|
531,590
|
|
471,262
|
|
||||||||||||
|
Gross margin
|
29.6
|
%
|
29.2
|
%
|
29.3
|
%
|
29.8
|
%
|
29.6
|
%
|
29.2
|
%
|
||||||||||||
|
Operating expenses
|
396,272
|
|
368,603
|
|
8,701
|
|
1,414
|
|
404,973
|
|
370,017
|
|
||||||||||||
|
Expenses as a % of net sales
|
22.4
|
%
|
22.9
|
%
|
32.6
|
%
|
24.2
|
%
|
22.6
|
%
|
22.9
|
%
|
||||||||||||
|
Goodwill impairment
|
1,550
|
|
—
|
|
—
|
|
—
|
|
1,550
|
|
—
|
|
||||||||||||
|
Operating income (loss)
|
125,956
|
|
100,912
|
|
(889
|
)
|
333
|
|
125,067
|
|
101,245
|
|
||||||||||||
|
Operating margin
|
7.1
|
%
|
6.3
|
%
|
(3.3
|
)%
|
5.7
|
%
|
7.0
|
%
|
6.3
|
%
|
||||||||||||
For an explanation of how we calculate base business, please refer to the discussion of base business on page 24 under the heading "Fiscal Year
2012
compared to Fiscal Year
2011
".
For purposes of comparing operating results for the year ended
December 31, 2011
to the year ended
December 31, 2010
, we excluded acquired sales centers from base business for the periods identified in the table below. As of
December 31, 2011
, we also excluded one existing sales center that was consolidated with an acquired sales center and one new market sales center that opened in
2011
.
|
Acquired
|
Acquisition
Date
|
Net
Sales Centers
Acquired
|
Periods
Excluded
|
|||
|
G.L. Cornell Company
(1)
|
December 2011
|
1
|
December 2011
|
|||
|
Poolway Schwimmbadtechnik GmbH
(1)
|
November 2011
|
1
|
November–December 2011
|
|||
|
The Kilpatrick Company, Inc.
(1)
|
May 2011
|
4
|
May–December 2011
|
|||
|
Turf Equipment Supply Co.
(1)
|
December 2010
|
3
|
January–December 2011 and December 2010
|
|||
|
Pool Boat and Leisure, S.A.
(1)
|
December 2010
|
1
|
January–December 2011 and December 2010
|
|||
|
Les Produits de Piscine Metrinox Inc.
|
April 2010
|
2
|
January–June 2011 and April–June 2010
|
|||
|
(1)
|
We acquired certain distribution assets of each of these companies.
|
The table below summarizes the changes in our sales centers during
2011
:
|
December 31, 2010
|
291
|
|
|
Acquired
|
6
|
|
|
New locations
|
4
|
|
|
Consolidated
|
(3
|
)
|
|
December 31, 2011
|
298
|
|
For information about our recent acquisitions, see Note 2 of “Notes to Consolidated Financial Statements,” included in Item 8 of this Form 10-K.
27
Net Sales
|
(in millions)
|
Year Ended December 31,
|
|
||||||||||||
|
2011
|
2010
|
Change
|
||||||||||||
|
Net sales
|
$
|
1,793.3
|
|
$
|
1,613.7
|
|
$
|
179.6
|
|
11%
|
||||
Net sales for 2011 increased 11% compared to 2010, including a 10% increase in base business sales and a 1% increase related to our recent acquisitions and new sales centers. Our base business sales growth included a 10% increase on the swimming pool side of the business and an 8% increase on the irrigation side of the business. The principal driver of base business sales growth was market share gains, which we attributed to continued improvements in customer service levels, benefits from our focus on the building materials product segment and retail customer segment of our industry and further expansion of our product offerings. Other factors contributing to the sales growth included the following (listed in order of estimated magnitude):
|
•
|
higher replacement activity attributable to the aging installed base of swimming pools;
|
|
•
|
the impact of inflationary product cost increases (estimated at approximately 2%);
|
|
•
|
a modest improvement in consumer discretionary expenditures compared to the restrained levels experienced in 2010; and
|
|
•
|
approximately 1% growth from favorable currency fluctuations.
|
One example of our success in achieving market share gains was the 18% sales growth for our building material products, which include tile and specialty pool finish products. The impact of double digit sales growth rates for products related to replacement and remodel activity was partially offset by lower growth rates for maintenance and repair products. Chemical sales grew 4% compared to 2010, with volumes up close to 6% and an unfavorable impact of 2% from price deflation on certain chemical products.
We realized more moderate sales growth rates in the last nine months of 2011 compared to the 15% base business sales growth realized in the first quarter of 2011, which had easier sales comparisons to the same period in 2010 and benefited from more favorable weather conditions across most of the Sunbelt markets compared to the first quarter of 2010. See discussion of significant weather impacts under the subheading
Seasonality and Quarterly Fluctuations
beginning on page 30.
Gross Profit
|
(in millions)
|
Year Ended December 31,
|
|
||||||||||||
|
2011
|
2010
|
Change
|
||||||||||||
|
Gross profit
|
$
|
531.6
|
|
$
|
471.3
|
|
$
|
60.3
|
|
13%
|
||||
|
Gross margin
|
29.6
|
%
|
29.2
|
%
|
|
|
||||||||
Gross margin increased 40 basis points between periods, reflecting continued improvements in sales, pricing and purchasing discipline. This included a continued migration of sales to higher margin preferred vendor and Pool Corporation branded products and some benefit attributed to the impact of mid‑year vendor price increases implemented by some vendors. We realized a favorable impact of 10 basis points related to higher freight out income, which compensated for higher delivery costs included in operating expenses. In 2011, we also experienced a more normalized competitive pricing environment in some markets compared to the past few years when our industry contracted.
Year over year gross margin comparisons varied by quarter, with improvements of 90 basis points in the seasonally slower first quarter, 50 basis points in the second quarter and 60 basis points in the third quarter compared to a decline of 60 basis points in the fourth quarter. The majority of the improvement in the first quarter was due to an easier comparison to the first quarter of 2010 when our gross margin was down 110 basis points from the first quarter of 2009. Fourth quarter margins were down due primarily to the favorable impact on fourth quarter 2010 gross margin from certain non‑recurring vendor incentives.
28
Operating Expenses
|
(in millions)
|
Year Ended December 31,
|
|
||||||||||||
|
2011
|
2010
|
Change
|
||||||||||||
|
Operating expenses
|
$
|
405.0
|
|
$
|
370.0
|
|
$
|
35.0
|
|
9%
|
||||
|
Operating expenses as a percentage of net sales
|
22.6
|
%
|
22.9
|
%
|
|
|
||||||||
Total operating expenses increased 10% compared to 2010, including an 8% increase in base business operating expenses due primarily to the following:
|
•
|
a $15.4 million increase in employee incentive costs, which reflected the catch‑up of incentives to more normalized levels following the business downturn in 2007-2009, rewards to employees for exceptional financial and operational performance in 2011 and accruals for our longer‑term senior management incentive program;
|
|
•
|
other variable expenses, which increased along with our base business sales growth;
|
|
•
|
a $3.3 million increase in delivery costs, including higher delivery volumes and higher fuel costs;
|
|
•
|
a $2.1 million increase in bad debt expense, which reflects a normalized expense level compared to 2010 when we recorded an adjustment in the second quarter that reduced the allowance for doubtful accounts due to significantly better than expected customer collections; and
|
|
•
|
a $2.1 million impact from currency fluctuations.
|
The only significant base business expense reduction compared to 2010 was a $2.1 million decline in facility lease costs, which reflected the continued but moderating impact from lower negotiated lease rates and facility consolidations in 2010 and 2011.
Interest Expense, net
Interest expense, net increased $1.3 million due primarily to the impact of foreign currency transaction gains and losses, with losses of $0.6 million recognized in 2011 compared to gains of $1.5 million recognized in 2010. Interest expense related to borrowings declined approximately $0.7 million in 2011, despite a $0.3 million realized loss related to the early termination of interest rate swaps in the fourth quarter. The decline in interest expense on borrowings was due to a lower weighted average effective interest rate on 6% higher average debt compared to 2010. The weighted average effective interest rate decreased to 2.6% in 2011 from 3.0% in 2010.
Income Taxes
Our effective income tax rate was 38.70% at December 31, 2011 and 39.20% at December 31, 2010. The decline in rates between years was due primarily to tax credits and other benefits realized in 2011. There were no significant changes in our estimates related to our income tax provision.
Net Income and Earnings Per Share
Net income increased 25% to $72.0 million in 2011, while earnings per share increased 28% to $1.47 per diluted share. This increase included accretive impacts of approximately $0.05 per diluted share from the reduction in our weighted average shares outstanding due to our share repurchase activities and approximately $0.02 per diluted share from favorable currency fluctuations in 2011.
29
Seasonality and Quarterly Fluctuations
Our business is highly seasonal. In general, sales and operating income are highest during the second and third quarters, which represent the peak months of both swimming pool use and installation and landscape installations and maintenance. Sales are substantially lower during the first and fourth quarters, when we may incur net losses. In
2012
, approximately
66%
of our net sales and over 100% of our operating income were generated in the second and third quarters of the year.
We typically experience a build-up of product inventories and accounts payable during the winter months in anticipation of the peak selling season. Excluding borrowings to finance acquisitions and share repurchases, our peak borrowing usually occurs during the second quarter, primarily because extended payment terms offered by our suppliers typically are payable in April, May and June, while our peak accounts receivable collections typically occur in June, July and August.
The following table presents certain unaudited quarterly data for
2012
and
2011
. We have included income statement and balance sheet data for the most recent eight quarters to allow for a meaningful comparison of the seasonal fluctuations in these amounts. In our opinion, this information reflects all normal and recurring adjustments considered necessary for a fair presentation of this data. Due to the seasonal nature of our industry, the results of any one or more quarters are not necessarily a good indication of results for an entire fiscal year or of continuing trends.
|
(Unaudited)
|
QUARTER
|
|||||||||||||||||||||||||||||||
|
(in thousands)
|
2012
|
2011
|
||||||||||||||||||||||||||||||
|
|
First
|
Second
|
Third
|
Fourth
|
First
|
Second
|
Third
|
Fourth
|
||||||||||||||||||||||||
|
Statement of Income Data
|
|
|
|
|
|
|
|
|
||||||||||||||||||||||||
|
Net sales
|
$
|
361,954
|
|
$
|
757,175
|
|
$
|
528,027
|
|
$
|
306,818
|
|
$
|
312,889
|
|
$
|
706,423
|
|
$
|
503,584
|
|
$
|
270,422
|
|
||||||||
|
Gross profit
|
104,563
|
|
222,405
|
|
151,501
|
|
88,938
|
|
91,410
|
|
211,439
|
|
147,906
|
|
80,835
|
|
||||||||||||||||
|
Operating income (loss)
|
6,021
|
|
108,134
|
|
41,011
|
|
(10,297
|
)
|
576
|
|
97,921
|
|
40,913
|
|
(14,343
|
)
|
||||||||||||||||
|
Net income (loss)
|
3,651
|
|
64,943
|
|
21,375
|
|
(7,997
|
)
|
(638
|
)
|
58,577
|
|
24,169
|
|
(10,115
|
)
|
||||||||||||||||
|
Net sales as a % of annual net sales
|
19
|
%
|
39
|
%
|
27
|
%
|
16
|
%
|
17
|
%
|
39
|
%
|
28
|
%
|
15
|
%
|
||||||||||||||||
|
Gross profit as a % of annual gross profit
|
18
|
%
|
39
|
%
|
27
|
%
|
16
|
%
|
17
|
%
|
40
|
%
|
28
|
%
|
15
|
%
|
||||||||||||||||
|
Operating income (loss) as a % of annual operating income
|
4
|
%
|
75
|
%
|
28
|
%
|
(7
|
)%
|
—
|
%
|
78
|
%
|
33
|
%
|
(11
|
)%
|
||||||||||||||||
|
Balance Sheet Data
|
||||||||||||||||||||||||||||||||
|
Receivables, net
|
$
|
201,792
|
|
$
|
270,089
|
|
$
|
175,459
|
|
$
|
113,859
|
|
$
|
173,787
|
|
$
|
266,032
|
|
$
|
160,647
|
|
$
|
109,273
|
|
||||||||
|
Product inventories, net
|
462,810
|
|
402,266
|
|
349,325
|
|
400,308
|
|
438,791
|
|
389,763
|
|
337,698
|
|
386,924
|
|
||||||||||||||||
|
Accounts payable
|
319,462
|
|
267,990
|
|
163,543
|
|
199,787
|
|
303,395
|
|
247,904
|
|
120,221
|
|
177,437
|
|
||||||||||||||||
|
Total debt
|
299,011
|
|
309,813
|
|
214,328
|
|
230,882
|
|
280,157
|
|
306,049
|
|
268,700
|
|
247,300
|
|
||||||||||||||||
|
Note: Due to rounding, the sum of quarterly percentage amounts may not equal 100%.
|
We expect that our quarterly results of operations will continue to fluctuate depending on the timing and amount of revenue contributed by new and acquired sales centers. Based on our peak summer selling season, we generally open new sales centers and close or consolidate sales centers, when warranted, either in the first quarter before the peak selling season begins or in the fourth quarter after the peak selling season ends.
30
Weather is one of the principal external factors affecting our business. The table below presents some of the possible effects resulting from various weather conditions.
|
Weather
|
|
Possible Effects
|
|
Hot and dry
|
•
|
Increased purchases of chemicals and supplies
|
|
|
|
for existing swimming pools
|
|
|
•
|
Increased purchases of above-ground pools and
|
|
|
|
irrigation products
|
|
|
|
|
|
Unseasonably cool weather or
|
•
|
Fewer pool and landscape installations
|
|
extraordinary amounts of rain
|
•
|
Decreased purchases of chemicals and supplies
|
|
|
•
|
Decreased purchases of impulse items such as
|
|
|
|
above-ground pools and accessories
|
|
|
|
|
|
Unseasonably early warming trends in spring/late cooling trends in fall
|
•
|
A longer pool and landscape season, thus positively impacting our sales
|
|
(primarily in the northern half of the U.S. and Canada)
|
|
|
|
|
|
|
|
Unseasonably late warming trends in spring/early cooling trends in fall
|
•
|
A shorter pool and landscape season, thus negatively impacting our sales
|
|
(primarily in the northern half of the U.S. and Canada)
|
|
|
Overall, we believe that weather favorably impacted sales in 2012, particularly in the first quarter. Our first quarter sales benefited from the unusually mild winter, including record warm temperatures across the Northeast and Midwest. Favorable weather trends continued in the beginning of the second quarter with much higher than normal temperatures across the United States, excluding the Pacific Northwest. The three month period between March and May 2012 was the warmest on record both nationally and for 31 of the 37 states east of the Rocky Mountains. The unusually mild winter and record warm spring led sales to shift into the first and early second quarter and resulted in the earlier than normal peak of the 2012 season. June sales were negatively impacted by weather due to below normal temperatures across the Southeast and cooler temperatures compared to 2011 in most markets excluding California and the Southwest. In the third and fourth quarters of 2012, weather conditions were favorable in most markets but comparable overall to the same period in 2011.
Weather also had a moderately favorable impact on our operations in 2011. Sales benefited from weather conditions in the Southeast and Southwest, including record high temperatures in Texas, although this impact was partially offset by unfavorable conditions throughout the year on the West Coast due to cooler than average temperatures. In the first quarter of 2011, our sales benefited from much more favorable weather conditions across the Sunbelt markets compared to the same period in 2010. Sales in our North Texas and Oklahoma markets were also positively impacted by repair and replacement activity for freeze damaged pool equipment. While our sales in the second quarter of 2011 benefited from above average temperatures across the Southeast, a slow start to the pool season in the Midwest (due to record precipitation levels) and closer to average temperatures across the Northeast resulted in some unfavorable comparisons to the same period in 2010. In the third quarter of 2011, we estimate that the weather impact on sales was neutral overall compared to both the same period in 2010 and long-term averages. Weather conditions were more favorable in the fourth quarter of 2011, with warmer temperatures across much of the Eastern half of the country compared to the fourth quarter of 2010.
Our first quarter 2010 sales were negatively impacted by unfavorable weather conditions across the Sunbelt markets between January and mid-March, including record cold weather in Florida and much colder than average temperatures across the rest of the Southeast. However, warmer weather in these regions during the latter half of March and near record warm temperatures in March across our markets in the Northeast and Canada helped drive a late rebound in our daily sales rates and flat base business sales overall for March compared to the same period in 2009. Sales in our second and third quarters of 2010 benefited from much more favorable weather conditions across the Southeast, Midwest and Northeast compared to the same periods in 2009, including record or near record high temperatures across the eastern half of the United States and our markets in Canada during the second quarter of 2010. However, this benefit was largely offset by the adverse impact from unseasonably cool weather along the West Coast throughout the 2010 pool season, most notably in California, our largest market.
31
LIQUIDITY AND CAPITAL RESOURCES
Liquidity is defined as the ability to generate adequate amounts of cash to meet short-term and long-term cash needs. We assess our liquidity in terms of our ability to generate cash to fund our operating activities, taking into consideration the seasonal nature of our business. Significant factors which could affect our liquidity include the following:
|
•
|
cash flows generated from operating activities;
|
|
•
|
the adequacy of available bank lines of credit;
|
|
•
|
acquisitions;
|
|
•
|
scheduled debt repayments;
|
|
•
|
dividend payments;
|
|
•
|
capital expenditures;
|
|
•
|
the timing and extent of share repurchases; and
|
|
•
|
the ability to attract long-term capital with satisfactory terms.
|
Our primary capital needs are seasonal working capital obligations and other general corporate initiatives, including acquisitions, dividend payments and share repurchases. Our primary sources of working capital are cash from operations supplemented by bank borrowings, which have historically been sufficient to support our growth and finance acquisitions. The same principle applies to funds used for capital expenditures and share repurchases.
We prioritize our use of cash based on investing in our business, maintaining a prudent debt structure and returning money to our shareholders. Our specific priorities for the use of cash are as follows:
|
•
|
maintenance and new sales center capital expenditures;
|
|
•
|
strategic acquisitions executed opportunistically; and
|
|
•
|
payment of cash dividends as and when declared by the Board.
|
As discussed further under the subheading
Future Sources and Uses of Cash
on page 33, we are required to comply with certain financial covenants under our Credit Facility, including the maintenance of a maximum average total leverage ratio. Although more conservative than the maximum, we strive to maintain an average total leverage ratio of 1.50 to 2.00. While considering this metric, we also use our cash to repurchase common stock based on Board‑defined parameters and repay our debt.
Capital expenditures, which historically have averaged 0.5% to 1.0% of net sales, were below and at the bottom of this range between 2008 and 2010 due to lower capacity expansion. In 2011, capital expenditures increased to 1.1% of net sales since we began purchasing rather than leasing new vehicles and forklifts. In 2012, capital expenditures were 0.8% of net sales. Going forward, we project capital expenditures will be relatively consistent with our historical average.
Sources and Uses of Cash
The following table summarizes our cash flows (in thousands):
|
|
Year Ended December 31,
|
|||||||||||
|
|
2012
|
2011
|
2010
|
|||||||||
|
Operating activities
|
$
|
119,078
|
|
$
|
75,103
|
|
$
|
93,959
|
|
|||
|
Investing activities
|
(21,208
|
)
|
(25,578
|
)
|
(14,251
|
)
|
||||||
|
Financing activities
|
(102,644
|
)
|
(40,554
|
)
|
(85,158
|
)
|
||||||
Cash provided by operations in 2012 exceeded net income by $37.1 million. Compared to the prior year, cash provided by operations increased primarily due to the increase in net income and improved working capital management. The decrease in cash used in investing activities is primarily due to a $3.2 million decline in capital expenditures compared to 2011, which included a few large information technology upgrade projects.
32
Cash used in financing activities increased during 2012 due primarily to the change in net proceeds and payments on our debt arrangements. Based on the year over year improvement in cash provided by operations, we made $16.4 million of net payments on our debt arrangements in 2012 compared to $48.6 million of net borrowings in 2011. The activity for proceeds and payments on our debt arrangements included the payoff of our $100.0 million Floating Rate Senior Notes at maturity on February 12, 2012. Proceeds from common stock issued under our share-based compensation plans increased by $7.1 million compared to 2011 due to a higher weighted average exercise price on 2012 stock option exercises. Higher cash dividend payments reflected the $0.02 per share increase in our quarterly dividend beginning in the second quarter of 2012. We repurchased $77.0 million of shares on the open market in 2012, up $6.0 million compared to 2011.
Cash provided by operations in 2011 exceeded net income by $3.1 million, but declined versus 2010 due primarily to our drawdown of inventories in 2010 and the impact of higher comparative inventory levels in 2011. The increase in cash used in investing activities compared to 2010 reflected higher capital expenditures, which included a few large information technology upgrade projects and an impact of approximately $6.1 million related to purchasing rather than leasing new vehicles and forklifts in 2011. Cash used in financing activities in 2011 reflected $48.6 million of net debt borrowings, which helped fund $71.0 million of share repurchases.
On October 19, 2011, we entered into a new $430.0 million unsecured syndicated senior credit facility (the Credit Facility) described further below. Since the Credit Facility replaced and refinanced the outstanding balances under our $240.0 million unsecured revolving credit facility (the Previous Revolver), proceeds from and payments on revolving lines of credit in 2011 reflected the $161.5 million payoff of the Previous Revolver.
Future Sources and Uses of Cash
The Credit Facility provides for $430.0 million in borrowing capacity under a five-year revolving credit facility and includes sublimits for the issuance of swingline loans and standby letters of credit. Pursuant to an accordion feature, the aggregate maximum principal amount of the commitments under the Credit Facility may be increased at our request and with agreement by the lenders by up to $75.0 million, to a total of $505.0 million. The Credit Facility matures on October 19, 2016. We intend to use the Credit Facility for general corporate purposes and to fund future growth initiatives.
At
December 31, 2012
, there was
$230.9 million
outstanding and
$195.5 million
available for borrowing under the Credit Facility. We currently have five interest rate swap contracts in place that reduce our exposure to fluctuations in interest rates on the Credit Facility. These swap contracts convert the Credit Facility’s variable interest rate to fixed rates of 1.185% on notional amounts totaling $50.0 million, 1.100% on a notional amount of $50.0 million, 1.050% on a notional amount of $25.0 million and 0.990% on a notional amount of $25.0 million. Interest expense related to the notional amounts under these swaps is based on the fixed rates plus the applicable margin on the Credit Facility. All five swap agreements will terminate on October 19, 2016. The weighted average effective interest rate for the Credit Facility as of
December 31, 2012
was approximately
2.2%
, excluding commitment fees.
Financial covenants on the Credit Facility include maintenance of a maximum average total leverage ratio and a minimum fixed charge coverage ratio, which are our most restrictive financial covenants. As of
December 31, 2012
, the calculations of these two covenants are detailed below:
|
•
|
Maximum Average Total Leverage Ratio
. On the last day of each fiscal quarter, our average total leverage ratio must be less than 3.25 to 1.00. Average Total Leverage Ratio is the ratio of the trailing twelve months (TTM) Average Total Funded Indebtedness plus the TTM Average Accounts Securitization Proceeds divided by the TTM EBITDA (as those terms are defined in the Credit Facility). As of
December 31, 2012
, our average total leverage ratio equaled
1.49
(compared to
1.80
as of
December 31, 2011
) and the TTM average total debt amount used in this calculation was
$257.6 million
.
|
|
•
|
Minimum Fixed Charge Coverage Ratio
. On the last day of each fiscal quarter, our fixed charge ratio must be greater than or equal to 2.25 to 1.00. Fixed Charge Ratio is the ratio of the TTM EBITDAR divided by TTM Interest Expense paid or payable in cash plus TTM Rental Expense (as those terms are defined in the Credit Facility). As of
December 31, 2012
, our fixed charge ratio equaled
3.90
(compared to
3.26
as of
December 31, 2011
) and TTM Rental Expense was
$51.1 million
.
|
33
The Credit Facility also limits the declaration and payment of dividends on our common stock to no more than 50% of the preceding year’s Net Income (as defined in the Credit Facility), provided no default or event of default has occurred and is continuing, or would result from the payment of dividends. Further, dividends must be declared and paid in a manner consistent with our past practice. Under the Credit Facility, we may repurchase shares of our common stock provided no default or event of default has occurred and is continuing, or would result from the repurchase of shares, and our maximum average total leverage ratio (determined on a pro forma basis) is less than 2.50 to 1.00. Other covenants include restrictions on our ability to grant liens, incur indebtedness, make investments, merge or consolidate, and sell or transfer assets. Failure to comply with any of our financial covenants or any other terms of the Credit Facility could result in penalty payments, higher interest rates on our borrowings or the acceleration of the maturities of our outstanding debt.
As of
December 31, 2012
, we were in compliance with all covenants and financial ratio requirements. We believe we will remain in compliance with all covenants and financial ratio requirements throughout
2013
. For additional information regarding our debt arrangements, see Note 5 of “Notes to Consolidated Financial Statements,” included in Item 8 of this Form 10-K.
We believe we have adequate availability of capital to fund present operations and the current capacity to finance any working capital needs that may arise. We continually evaluate potential acquisitions and hold discussions with acquisition candidates. If suitable acquisition opportunities arise that would require financing, we believe that we have the ability to finance any such transactions.
As of
February 20, 2013
,
$89.5 million
of the current Board-authorized amount under our share repurchase program remained available. We expect to repurchase additional shares on the open market from time to time depending on market conditions. We plan to fund these repurchases with cash provided by operations and borrowings under the Credit Facility.
Contractual Obligations
At
December 31, 2012
, our contractual obligations for long-term debt and operating leases were as follows (in thousands):
|
|
|
Payments Due by Period
|
||||||||||||||||||
|
Total
|
Less than
1 year
|
1-3 years
|
3-5 years
|
More than
5 years
|
||||||||||||||||
|
Long-term debt
|
$
|
230,882
|
|
$
|
—
|
|
$
|
—
|
|
$
|
230,882
|
|
$
|
—
|
|
|||||
|
Operating leases
|
146,698
|
|
42,250
|
|
60,724
|
|
31,584
|
|
12,140
|
|
||||||||||
|
|
$
|
377,580
|
|
$
|
42,250
|
|
$
|
60,724
|
|
$
|
262,466
|
|
$
|
12,140
|
|
|||||
For additional discussion related to our debt, see Note 5 of “Notes to Consolidated Financial Statements,” included in Item 8 of this Form 10-K. The table below contains estimated interest payments related to our long-term debt obligations listed in the table above. Our estimates of future interest payments are calculated based on the
December 31, 2012
outstanding debt balances, using the fixed rates under our interest rate swap agreements for the applicable notional amounts and the weighted average effective interest rates as of
December 31, 2012
for the remaining outstanding balances not covered by our swaps. To project the estimated interest expense to coincide with the time periods used in the table above, we have projected the estimated debt balances for future years based on the scheduled maturity date of the Credit Facility.
|
|
|
Estimated Payments Due by Period
|
||||||||||||||||||
|
Total
|
Less than
1 year
|
1-3 years
|
3-5 years
|
More than
5 years
|
||||||||||||||||
|
Interest
|
$
|
19,473
|
|
$
|
5,080
|
|
$
|
10,160
|
|
$
|
4,233
|
|
$
|
—
|
|
|||||
34
We are exposed to market risks, including interest rate risk and foreign currency risk. The adverse effects of potential changes in these market risks are discussed below. The following discussion does not consider the effects of the reduced level of overall economic activity that could exist following such changes. Further, in the event of changes of such magnitude, we would likely take actions to mitigate our exposure to such changes.
Interest Rate Risk
Our earnings are exposed to changes in short-term interest rates because of the variable interest rates on our debt. However, we have entered into interest rate swap contracts to reduce our exposure to market fluctuations. For information about our debt arrangements and interest rate swaps, see Note 5 of “Notes to Consolidated Financial Statements,” included in Item 8 of this Form 10‑K.
In
2012
, there was no interest rate risk related to the notional amounts under our interest rate swap contracts for the Credit Facility. The portion of our outstanding balance under the Credit Facility that was not covered by our interest rate swap contracts was subject to variable interest rates. To calculate the potential impact in
2012
related to interest rate risk, we performed a sensitivity analysis assuming that we borrowed the maximum available amount under the Credit Facility, excluding the accordion feature. In this analysis, we assumed that the variable interest rates for the Credit Facility increased 1.0%. Based on this calculation, our pretax income would have decreased by approximately
$3.0 million
and earnings per share would have decreased by approximately
$0.04
per diluted share (based on the number of weighted average diluted shares outstanding for the year ended
December 31, 2012
). The maximum amount available under the Credit Facility is
$430.0 million
excluding the
$75.0 million
accordion feature.
Failure of our swap counterparties would result in the loss of any potential benefit to us under our swap agreements. In this case, we would still be obligated to pay the variable interest payments underlying our debt agreements. Additionally, failure of our swap counterparties would not eliminate our obligation to continue to make payments under our existing swap agreements if we continue to be in a net pay position.
Currency Risk
We have wholly owned subsidiaries in Canada, the United Kingdom, Belgium, France, Germany, Italy, Portugal, Spain and Mexico. Based on the functional currencies for these international subsidiaries as shown in the table below, changes in exchange rates for these currencies may positively or negatively impact our sales, operating expenses and earnings. Historically, we have not hedged our currency exposure and fluctuations in exchange rates have not materially affected our operating results. While our international operations accounted for only
9.4%
of total net sales in
2012
, our exposure to currency rate fluctuations could be material in
2013
and future years to the extent that either currency rate changes are significant or that our international operations comprise a larger percentage of our consolidated results.
|
Functional Currencies
|
|
|
Canada
|
Canadian Dollar
|
|
United Kingdom
|
British Pound
|
|
Belgium
|
Euro
|
|
France
|
Euro
|
|
Germany
|
Euro
|
|
Italy
|
Euro
|
|
Portugal
|
Euro
|
|
Spain
|
Euro
|
|
Mexico
|
Peso
|
35
INDEX TO CONSOLIDATED FINANCIAL STATEMENTS
|
|
Page
|
|
|
|
|
|
|
|
|
|
|
|
|
|
|
|
36
Report of Independent Registered Public Accounting Firm
The Board of Directors and Shareholders
Pool Corporation
We have audited the accompanying consolidated balance sheets of Pool Corporation (the Company) as of December 31, 2012 and 2011, and the related consolidated statements of income, comprehensive income, stockholders’ equity, and cash flows for each of the three years in the period ended December 31, 2012. These financial statements are the responsibility of the Company's management. Our responsibility is to express an opinion on these financial statements based on our audits.
We conducted our audits in accordance with the standards of the Public Company Accounting Oversight Board (United States). Those standards require that we plan and perform the audit to obtain reasonable assurance about whether the financial statements are free of material misstatement. An audit includes examining, on a test basis, evidence supporting the amounts and disclosures in the financial statements. An audit also includes assessing the accounting principles used and significant estimates made by management, as well as evaluating the overall financial statement presentation. We believe that our audits provide a reasonable basis for our opinion.
In our opinion, the financial statements referred to above present fairly, in all material respects, the consolidated financial position of Pool Corporation at December 31, 2012 and 2011, and the consolidated results of its operations and its cash flows for each of the three years in the period ended December 31, 2012, in conformity with U.S. generally accepted accounting principles.
We also have audited, in accordance with the standards of the Public Company Accounting Oversight Board (United States), Pool Corporation's internal control over financial reporting as of December 31, 2012, based on criteria established in
Internal Control—Integrated Framework
, issued by the Committee of Sponsoring Organizations of the Treadway Commission, and our report dated March 1, 2013 expressed an unqualified opinion thereon.

New Orleans, Louisiana
March 1, 2013
37
POOL CORPORATION
(In thousands, except per share data)
|
|
Year Ended December 31,
|
||||||||||
|
|
2012
|
2011
|
2010
|
||||||||
|
Net sales
|
$
|
1,953,974
|
|
$
|
1,793,318
|
|
$
|
1,613,746
|
|
||
|
Cost of sales
|
1,386,567
|
|
1,261,728
|
|
1,142,484
|
|
|||||
|
Gross profit
|
567,407
|
|
531,590
|
|
471,262
|
|
|||||
|
Selling and administrative expenses
|
415,592
|
|
404,973
|
|
370,017
|
|
|||||
|
Goodwill impairment
|
6,946
|
|
1,550
|
|
—
|
|
|||||
|
Operating income
|
144,869
|
|
125,067
|
|
101,245
|
|
|||||
|
Interest expense, net
|
6,469
|
|
7,964
|
|
6,619
|
|
|||||
|
Income before income taxes and equity earnings
|
138,400
|
|
117,103
|
|
94,626
|
|
|||||
|
Provision for income taxes
|
56,744
|
|
45,319
|
|
37,093
|
|
|||||
|
Equity earnings in unconsolidated investments
|
316
|
|
209
|
|
105
|
|
|||||
|
Net income
|
$
|
81,972
|
|
$
|
71,993
|
|
$
|
57,638
|
|
||
|
Earnings per share:
|
|
|
|
||||||||
|
Basic
|
$
|
1.75
|
|
$
|
1.49
|
|
$
|
1.17
|
|
||
|
Diluted
|
$
|
1.71
|
|
$
|
1.47
|
|
$
|
1.15
|
|
||
|
Weighted average shares outstanding:
|
|
|
|
||||||||
|
Basic
|
46,937
|
|
48,158
|
|
49,469
|
|
|||||
|
Diluted
|
48,058
|
|
48,987
|
|
50,161
|
|
|||||
|
Cash dividends declared per common share
|
$
|
0.62
|
|
$
|
0.55
|
|
$
|
0.52
|
|
||
The accompanying Notes are an integral part of these Consolidated Financial Statements.
38
POOL CORPORATION
Consolidated Statements of Comprehensive Income
(In thousands)
|
|
Year Ended December 31,
|
||||||||||
|
|
2012
|
2011
|
2010
|
||||||||
|
Net income
|
$
|
81,972
|
|
$
|
71,993
|
|
$
|
57,638
|
|
||
|
Other comprehensive income (loss):
|
|||||||||||
|
Foreign currency translation adjustments
|
(534
|
)
|
(609
|
)
|
(2,170
|
)
|
|||||
|
Change in unrealized gains and losses on interest rate swaps,
net of tax of $1,163, $(1,152) and $(645)
|
(1,820
|
)
|
1,777
|
|
996
|
|
|||||
|
Total other comprehensive income (loss)
|
(2,354
|
)
|
1,168
|
|
(1,174
|
)
|
|||||
|
Comprehensive income
|
$
|
79,618
|
|
$
|
73,161
|
|
$
|
56,464
|
|
||
The accompanying Notes are an integral part of the Consolidated Financial Statements.
39
POOL CORPORATION
(In thousands, except share data)
|
|
December 31,
|
||||||
|
|
2012
|
2011
|
|||||
|
Assets
|
|
|
|||||
|
Current assets:
|
|
|
|||||
|
Cash and cash equivalents
|
$
|
12,463
|
|
$
|
17,487
|
|
|
|
Receivables, net
|
113,859
|
|
109,273
|
|
|||
|
Product inventories, net
|
400,308
|
|
386,924
|
|
|||
|
Prepaid expenses and other current assets
|
11,280
|
|
11,298
|
|
|||
|
Deferred income taxes
|
5,186
|
|
7,084
|
|
|||
|
Total current assets
|
543,096
|
|
532,066
|
|
|||
|
Property and equipment, net
|
46,566
|
|
41,394
|
|
|||
|
Goodwill
|
169,983
|
|
177,103
|
|
|||
|
Other intangible assets, net
|
11,053
|
|
11,738
|
|
|||
|
Equity interest investments
|
1,160
|
|
980
|
|
|||
|
Other assets, net
|
8,718
|
|
7,621
|
|
|||
|
Total assets
|
$
|
780,576
|
|
$
|
770,902
|
|
|
|
Liabilities and stockholders' equity
|
|
|
|
||||
|
Current liabilities:
|
|
|
|
||||
|
Accounts payable
|
$
|
199,787
|
|
$
|
177,437
|
|
|
|
Accrued expenses and other current liabilities
|
48,186
|
|
49,140
|
|
|||
|
Current portion of long-term debt and other long-term liabilities
|
23
|
|
22
|
|
|||
|
Total current liabilities
|
247,996
|
|
226,599
|
|
|||
|
Deferred income taxes
|
13,453
|
|
9,531
|
|
|||
|
Long-term debt
|
230,882
|
|
247,300
|
|
|||
|
Other long-term liabilities
|
6,622
|
|
7,726
|
|
|||
|
Total liabilities
|
498,953
|
|
491,156
|
|
|||
|
Stockholders' equity:
|
|
|
|
||||
|
Common stock, $.001 par value; 100,000,000 shares authorized;
46,303,728 shares issued and outstanding at December 31, 2012 and
47,366,997 shares issued and outstanding at December 31, 2011
|
46
|
|
47
|
|
|||
|
Additional paid-in capital
|
276,334
|
|
243,180
|
|
|||
|
Retained earnings
|
5,377
|
|
34,299
|
|
|||
|
Accumulated other comprehensive (loss) income
|
(134
|
)
|
2,220
|
|
|||
|
Total stockholders' equity
|
281,623
|
|
279,746
|
|
|||
|
Total liabilities and stockholders' equity
|
$
|
780,576
|
|
$
|
770,902
|
|
|
The accompanying Notes are an integral part of these Consolidated Financial Statements.
40
POOL CORPORATION
(In thousands)
|
|
Year Ended December 31,
|
||||||||||
|
|
2012
|
2011
|
2010
|
||||||||
|
Operating activities
|
|
|
|
||||||||
|
Net income
|
$
|
81,972
|
|
$
|
71,993
|
|
$
|
57,638
|
|
||
|
Adjustments to reconcile net income to net cash provided by operating activities:
|
|
|
|
|
|||||||
|
Depreciation
|
11,592
|
|
9,746
|
|
8,980
|
|
|||||
|
Amortization
|
1,284
|
|
1,559
|
|
2,348
|
|
|||||
|
Share-based compensation
|
8,465
|
|
8,233
|
|
7,790
|
|
|||||
|
Excess tax benefits from share-based compensation
|
(4,487
|
)
|
(3,118
|
)
|
(1,877
|
)
|
|||||
|
Provision for doubtful accounts receivable, net of write-offs
|
(422
|
)
|
(1,202
|
)
|
(4,324
|
)
|
|||||
|
Provision for inventory obsolescence, net
|
447
|
|
(11
|
)
|
(721
|
)
|
|||||
|
Change in deferred income taxes
|
3,168
|
|
2,605
|
|
1,795
|
|
|||||
|
Loss on sale of property and equipment
|
44
|
|
263
|
|
324
|
|
|||||
|
Equity earnings in unconsolidated investments
|
(316
|
)
|
(209
|
)
|
(105
|
)
|
|||||
|
(Gains) losses on foreign currency transactions
|
(111
|
)
|
592
|
|
(1,498
|
)
|
|||||
|
Goodwill impairment
|
6,946
|
|
1,550
|
|
—
|
|
|||||
|
Other
|
138
|
|
195
|
|
145
|
|
|||||
|
Changes in operating assets and liabilities, net of effects of acquisitions:
|
|
|
|
|
|||||||
|
Receivables
|
(3,396
|
)
|
(5,887
|
)
|
4,832
|
|
|||||
|
Product inventories
|
(9,232
|
)
|
(35,339
|
)
|
15,951
|
|
|||||
|
Prepaid expenses and other assets
|
(1,159
|
)
|
(2,951
|
)
|
4,694
|
|
|||||
|
Accounts payable
|
20,253
|
|
6,402
|
|
(14,417
|
)
|
|||||
|
Accrued expenses and other current liabilities
|
3,892
|
|
20,682
|
|
12,404
|
|
|||||
|
Net cash provided by operating activities
|
119,078
|
|
75,103
|
|
93,959
|
|
|||||
|
Investing activities
|
|
|
|
|
|
||||||
|
Acquisition of businesses, net of cash acquired
|
(4,699
|
)
|
(5,934
|
)
|
(6,173
|
)
|
|||||
|
Purchases of property and equipment, net of sale proceeds
|
(16,271
|
)
|
(19,454
|
)
|
(8,078
|
)
|
|||||
|
Other investments, net
|
(238
|
)
|
(190
|
)
|
—
|
|
|||||
|
Net cash used in investing activities
|
(21,208
|
)
|
(25,578
|
)
|
(14,251
|
)
|
|||||
|
Financing activities
|
|
|
|
|
|||||||
|
Proceeds from revolving line of credit
|
607,923
|
|
749,349
|
|
453,039
|
|
|||||
|
Payments on revolving line of credit
|
(524,341
|
)
|
(700,749
|
)
|
(457,568
|
)
|
|||||
|
Payments on long-term debt and other long-term liabilities
|
(100,022
|
)
|
(149
|
)
|
(48,225
|
)
|
|||||
|
Payments of deferred acquisition consideration
|
—
|
|
(500
|
)
|
(1,000
|
)
|
|||||
|
Payments of deferred financing costs
|
—
|
|
(1,674
|
)
|
(145
|
)
|
|||||
|
Excess tax benefits from share-based compensation
|
4,487
|
|
3,118
|
|
1,877
|
|
|||||
|
Proceeds from stock issued under share-based compensation plans
|
20,205
|
|
13,085
|
|
6,293
|
|
|||||
|
Payments of cash dividends
|
(29,135
|
)
|
(26,470
|
)
|
(25,746
|
)
|
|||||
|
Purchases of treasury stock
|
(81,761
|
)
|
(76,564
|
)
|
(13,683
|
)
|
|||||
|
Net cash used in financing activities
|
(102,644
|
)
|
(40,554
|
)
|
(85,158
|
)
|
|||||
|
Effect of exchange rate changes on cash and cash equivalents
|
(250
|
)
|
(1,205
|
)
|
(672
|
)
|
|||||
|
Change in cash and cash equivalents
|
(5,024
|
)
|
7,766
|
|
(6,122
|
)
|
|||||
|
Cash and cash equivalents at beginning of year
|
17,487
|
|
9,721
|
|
15,843
|
|
|||||
|
Cash and cash equivalents at end of year
|
$
|
12,463
|
|
$
|
17,487
|
|
$
|
9,721
|
|
||
The accompanying Notes are an integral part of these Consolidated Financial Statements.
41
POOL CORPORATION
Consolidated Statements of Changes in Stockholders’ Equity
(In thousands)
|
Common Stock
|
Treasury
|
Additional
Paid-In
|
Retained
|
Accumulated
Other
Comprehensive
|
|||||||||||||||||||||||
|
|
Shares
|
Amount
|
Stock
|
Capital
|
Earnings
|
Income (Loss)
|
Total
|
||||||||||||||||||||
|
Balance at December 31, 2009
|
48,991
|
|
$
|
49
|
|
$
|
—
|
|
$
|
202,784
|
|
$
|
47,128
|
|
$
|
2,226
|
|
$
|
252,187
|
|
|||||||
|
Net income
|
—
|
|
—
|
|
—
|
|
—
|
|
57,638
|
|
—
|
|
57,638
|
|
|||||||||||||
|
Foreign currency translation
|
—
|
|
—
|
|
—
|
|
—
|
|
—
|
|
(2,170
|
)
|
(2,170
|
)
|
|||||||||||||
|
Interest rate swaps, net of tax of $(645)
|
—
|
|
—
|
|
—
|
|
—
|
|
—
|
|
996
|
|
996
|
|
|||||||||||||
|
Repurchases of common stock, net of retirements
|
(638
|
)
|
—
|
|
(2,344
|
)
|
—
|
|
(11,339
|
)
|
—
|
|
(13,683
|
)
|
|||||||||||||
|
Share-based compensation
|
—
|
|
—
|
|
—
|
|
7,790
|
|
—
|
|
—
|
|
7,790
|
|
|||||||||||||
|
Issuance of shares under incentive stock plans, including tax benefit of $1,877
|
925
|
|
—
|
|
—
|
|
8,170
|
|
—
|
|
—
|
|
8,170
|
|
|||||||||||||
|
Declaration of cash dividends
|
—
|
|
—
|
|
—
|
|
—
|
|
(25,746
|
)
|
—
|
|
(25,746
|
)
|
|||||||||||||
|
Balance at December 31, 2010
|
49,278
|
|
49
|
|
(2,344
|
)
|
218,744
|
|
67,681
|
|
1,052
|
|
285,182
|
|
|||||||||||||
|
Net income
|
—
|
|
—
|
|
—
|
|
—
|
|
71,993
|
|
—
|
|
71,993
|
|
|||||||||||||
|
Foreign currency translation
|
—
|
|
—
|
|
—
|
|
—
|
|
—
|
|
(609
|
)
|
(609
|
)
|
|||||||||||||
|
Interest rate swaps, net of tax of $(1,152)
|
—
|
|
—
|
|
—
|
|
—
|
|
—
|
|
1,777
|
|
1,777
|
|
|||||||||||||
|
Repurchases of common stock, net of retirements
|
(3,034
|
)
|
(3
|
)
|
2,344
|
|
—
|
|
(78,905
|
)
|
—
|
|
(76,564
|
)
|
|||||||||||||
|
Share-based compensation
|
—
|
|
—
|
|
—
|
|
8,233
|
|
—
|
|
—
|
|
8,233
|
|
|||||||||||||
|
Issuance of shares under incentive stock plans, including tax benefit of $3,118
|
1,123
|
|
1
|
|
—
|
|
16,203
|
|
—
|
|
—
|
|
16,204
|
|
|||||||||||||
|
Declaration of cash dividends
|
—
|
|
—
|
|
—
|
|
—
|
|
(26,470
|
)
|
—
|
|
(26,470
|
)
|
|||||||||||||
|
Balance at December 31, 2011
|
47,367
|
|
47
|
|
—
|
|
243,180
|
|
34,299
|
|
2,220
|
|
279,746
|
|
|||||||||||||
|
Net income
|
—
|
|
—
|
|
—
|
|
—
|
|
81,972
|
|
—
|
|
81,972
|
|
|||||||||||||
|
Foreign currency translation
|
—
|
|
—
|
|
—
|
|
—
|
|
—
|
|
(534
|
)
|
(534
|
)
|
|||||||||||||
|
Interest rate swaps, net of tax of $1,163
|
—
|
|
—
|
|
—
|
|
—
|
|
—
|
|
(1,820
|
)
|
(1,820
|
)
|
|||||||||||||
|
Repurchases of common stock, net of retirements
|
(2,165
|
)
|
(2
|
)
|
—
|
|
—
|
|
(81,759
|
)
|
—
|
|
(81,761
|
)
|
|||||||||||||
|
Share-based compensation
|
—
|
|
—
|
|
—
|
|
8,465
|
|
—
|
|
—
|
|
8,465
|
|
|||||||||||||
|
Issuance of shares under incentive stock plans, including tax benefit of $4,487
|
1,102
|
|
1
|
|
—
|
|
24,689
|
|
—
|
|
—
|
|
24,690
|
|
|||||||||||||
|
Declaration of cash dividends
|
—
|
|
—
|
|
—
|
|
—
|
|
(29,135
|
)
|
—
|
|
(29,135
|
)
|
|||||||||||||
|
Balance at December 31, 2012
|
46,304
|
|
$
|
46
|
|
$
|
—
|
|
$
|
276,334
|
|
$
|
5,377
|
|
$
|
(134
|
)
|
$
|
281,623
|
|
|||||||
The accompanying Notes are an integral part of these Consolidated Financial Statements.
42
POOL CORPORATION
Notes to Consolidated Financial Statements
Description of Business
As of
December 31, 2012
, Pool Corporation and our wholly owned subsidiaries (the
Company
, which may be referred to as
POOL
,
we, us
or
our
), operated
312
sales centers in North America and Europe from which we sell swimming pool equipment, parts and supplies and irrigation and landscape products to pool builders, retail stores, service companies, landscape contractors and golf courses. We distribute products through
three
networks: SCP Distributors LLC (SCP), Superior Pool Products LLC (Superior) and Horizon Distributors, Inc. (Horizon). Superior and Horizon are both wholly owned subsidiaries of SCP, which is a wholly owned subsidiary of Pool Corporation.
Basis of Presentation and Principles of Consolidation
We prepared the Consolidated Financial Statements following U.S. generally accepted accounting principles (GAAP) and the requirements of the Securities and Exchange Commission (SEC). The financial statements include all normal and recurring adjustments that are necessary for a fair presentation of our financial position and operating results. The Consolidated Financial Statements include the accounts of Pool Corporation and our wholly owned subsidiaries. We eliminated all significant intercompany accounts and transactions among our wholly owned subsidiaries.
Reclassifications
For comparative purposes, we reclassified certain amounts in the 2011 financial statements to conform to the 2012 presentation. These changes included the reclassification of both our deferred tax balances and deferred tax valuation allowances between current and non‑current line items to reflect net presentation on the Consolidated Balance Sheets as of December 31, 2011. We also changed the presentation of deferred service charge income between Accrued expenses and other current liabilities and Receivables, net on the Consolidated Balance Sheets as of December 31, 2011.
Use of Estimates
In order to prepare financial statements that conform to GAAP, we make estimates and assumptions that affect the amounts reported in our financial statements and accompanying notes. Our most significant estimates are those relating to the allowance for doubtful accounts, inventory obsolescence reserves, vendor incentives, income taxes, incentive compensation accruals and goodwill impairment evaluations. We continually review our estimates and make adjustments as necessary, but actual results could be significantly different from what we expected when we made these estimates.
Segment Reporting
Our chief operating decision maker (CODM) evaluates sales centers based upon their individual performance relative to predetermined standards that include both financial and operational measures. Additionally, our CODM makes decisions about how to allocate resources primarily on a sales center-by-sales center basis. Since all of our sales centers have similar operations and share similar economic characteristics, we aggregate our sales centers into a single reportable segment.
Based on the number of product lines and product categories we have, the fact that we do not track sales by product lines and product categories on a consolidated basis and the fact that we make ongoing changes to how products are classified within these groups, it is impracticable to report our sales by product category.
43
Seasonality and Weather
Our business is highly seasonal and weather is one of the principal external factors affecting our business. In general, sales and net income are highest during the second and third quarters, which represent the peak months of both swimming pool use and installation and landscape installations and maintenance. Sales are substantially lower during the first and fourth quarters, when we may incur net losses.
Revenue Recognition
We recognize revenue when four basic criteria are met:
1. persuasive evidence of an arrangement exists;
2. delivery has occurred or services have been rendered;
3. our price to the buyer is fixed or determinable; and
4. collectibility is reasonably assured.
We record revenue when customers take delivery of products. Customers may pick up products at any sales center location, or we may deliver products to their premises or job sites via our trucks or third party carriers. Products shipped via third party carriers are considered delivered based on the shipping terms, which are generally FOB shipping point. We include shipping and handling fees billed to customers as freight out income within net sales.
We offer volume incentives to some of our customers and we account for these incentives as an adjustment to sales. We estimate the amount of volume incentives earned based on our estimate of cumulative sales for the fiscal year relative to our customers’ progress toward achieving minimum purchase requirements. We record customer returns, including those associated with early buy programs, as an adjustment to sales. In the past, customer returns have not been material. Other items that we record as adjustments to sales include cash discounts, pricing adjustments and credit card fees related to customer payments.
We also report sales net of tax amounts that we collect from our customers and remit to governmental authorities. These tax amounts may include, but are not limited to, sales, use, value added and some excise taxes.
Vendor Incentives
Many of our arrangements with our vendors provide for us to receive incentives of specified amounts of consideration when we achieve any of a number of measures. These measures are generally related to the volume level of purchases from our vendors and may include negotiated pricing arrangements. We account for such incentives as a reduction of the prices of the vendor’s products and therefore as a reduction of inventory until we sell the product, at which time such incentives are recognized as a reduction of cost of sales in our income statement.
Throughout the year, we estimate the amount of the incentive earned based on our estimate of total purchases for the fiscal year relative to the purchase levels that mark our progress toward earning the incentives. We accrue vendor incentives on a monthly basis using these estimates provided that we determine they are probable and reasonably estimable. We continually revise these estimates to reflect actual incentives earned based on actual purchase levels and trends related to sales and purchasing mix. When we make adjustments to our estimates, we determine whether any portion of the adjustment impacts the amount of vendor incentives that are deferred in inventory. We recognize changes in our estimates for vendor incentives as a cumulative catch-up adjustment to the amounts recognized to date in our Consolidated Financial Statements.
Shipping and Handling Costs
We record shipping and handling costs associated with inbound freight as cost of sales. The table below presents shipping and handling costs associated with outbound freight, which we include in selling and administrative expenses (in thousands):
|
2012
|
2011
|
2010
|
||||||||
|
$
|
33,964
|
|
$
|
33,588
|
|
$
|
29,924
|
|
||
44
Share-Based Compensation
We record share-based compensation for stock options and other share-based awards based on the estimated fair value as measured on the grant date. For stock option awards, we use a Black-Scholes model for estimating the grant date fair value. For additional discussion of share-based compensation, see Note 6.
Advertising Costs
We expense advertising costs when incurred. The table below presents advertising expense for the past three years (in thousands):
|
2012
|
2011
|
2010
|
||||||||
|
$
|
6,248
|
|
$
|
5,484
|
|
$
|
5,534
|
|
||
Income Taxes
We record deferred tax assets or liabilities based on differences between the financial reporting and the tax basis of assets and liabilities using currently enacted rates and laws that will be in effect when we expect the differences to reverse. Due to changing tax laws and state income tax rates, significant judgment is required to estimate the effective tax rate expected to apply to tax differences that are expected to reverse in the future.
We record a valuation allowance to reduce the carrying amounts of net deferred tax assets if there is uncertainty regarding their future realization. We consider many factors when assessing the likelihood of future realization including our recent cumulative earnings experience by taxing jurisdiction, expectations of future taxable income, the carryforward periods available to us for tax reporting purposes and other relevant factors. For additional discussion of income taxes, see Note 7.
Equity Method Investments
We account for our 50% investment in Northpark Corporate Center, LLC (NCC) using the equity method of accounting. Accordingly, we report our share of income or loss based on our ownership interest in this investment.
Earnings Per Share
We calculate basic earnings per share by dividing net income or loss by the weighted average number of common shares outstanding. We include outstanding unvested restricted stock awards of our common stock in the basic weighted average share calculation. Diluted earnings per share includes the dilutive effects of other share-based awards. For additional discussion of earnings per share, see Note 8.
Foreign Currency
The functional currency of each of our foreign subsidiaries is its applicable local currency. We translate our foreign subsidiary financial statements into U.S. dollars based on published exchange rates. We include these translation adjustments as a component of Accumulated other comprehensive income (loss) on the Consolidated Balance Sheets. We include realized transaction gains and losses that arise from exchange rate fluctuations in Interest expense, net on the Consolidated Statements of Income. We realized net foreign currency transaction gains of
$0.1 million
in
2012
, net losses of
$0.6 million
in
2011
and net gains of
$1.5 million
in
2010
.
Fair Value Measurements
Our assets and liabilities that are measured at fair value on a recurring basis include the unrealized gains or losses on our interest rate swaps. We use significant other observable market data or assumptions (Level 2 inputs as defined in the accounting guidance) that we believe market participants would use in pricing similar assets or liabilities, including assumptions about risk when appropriate.
45
The table below presents the estimated fair value of our swap agreements (in thousands):
|
|
Fair Value at December 31,
|
|||||||
|
Level 2
|
2012
|
2011
|
||||||
|
Unrealized Losses on Interest Rate Swaps
|
$
|
(3,404
|
)
|
$
|
(420
|
)
|
||
These unrealized losses are included in Accrued expenses and other current liabilities on the Consolidated Balance Sheets.
The carrying values of cash, receivables, accounts payable and accrued liabilities approximate fair value due to the short maturity of those instruments and the carrying value of long-term debt approximates fair value. Our determination of the estimated fair value of long-term debt reflects a discounted cash flow model using our estimates, primarily those related to assumptions for borrowing rates (Level 3 inputs as defined in the accounting guidance).
Interest Rate Swaps
We designate our interest rate swaps as cash flow hedges and record the changes in fair value of these swaps to Accumulated other comprehensive income (loss). If our interest rate swaps became ineffective, we would immediately recognize the changes in fair value of our swaps in earnings. We recognize any differences between the variable interest rate payments and the fixed interest rate settlements from our swap counterparties as an adjustment to interest expense over the life of the swaps. For additional discussion of our interest rate swaps, see Note 5.
Cash Equivalents
We consider all highly liquid investments with an original maturity of three months or less when purchased to be cash equivalents.
Credit Risk and Allowance for Doubtful Accounts
We record trade receivables at the invoiced amounts less an allowance for doubtful accounts for estimated losses we may incur if customers do not pay. We perform periodic credit evaluations of our customers and we typically do not require collateral. Consistent with industry practices, we generally require payment from our North American customers within 30 days, except for sales under early buy programs for which we provide extended payment terms to qualified customers.
At the end of each quarter, we perform a reserve analysis of all accounts with balances greater than
$20,000
and more than
60
days past due. Additionally, we perform a separate reserve analysis on the balance of our accounts receivables with emphasis on the remainder of the past due portion of the aging. During the year, we write off account balances when we have exhausted reasonable collection efforts and determined that the likelihood of collection is remote. These write-offs are charged against our allowance for doubtful accounts.
The following table summarizes the changes in our allowance for doubtful accounts for the past three years (in thousands):
|
|
2012
|
2011
|
2010
|
|||||||||
|
Balance at beginning of year
|
$
|
5,900
|
|
$
|
7,102
|
|
$
|
11,426
|
|
|||
|
Bad debt expense
|
1,007
|
|
2,958
|
|
779
|
|
||||||
|
Write-offs, net of recoveries
|
(1,430
|
)
|
(4,160
|
)
|
(5,103
|
)
|
||||||
|
Balance at end of year
|
$
|
5,477
|
|
$
|
5,900
|
|
$
|
7,102
|
|
|||
Product Inventories and Reserve for Inventory Obsolescence
Product inventories consist primarily of goods we purchase from manufacturers to sell to our customers. We record inventory at the lower of cost, using the average cost method, or market. We establish our reserve for inventory obsolescence based on inventory turns by class with particular emphasis on stock keeping units with the weakest sales over the previous
12
months (or
36
months for tile products). The reserve is intended to reflect the net realizable value of inventory that we may not be able to sell at a profit.
46
In evaluating the adequacy of our reserve for inventory obsolescence at the sales center level, we consider a combination of factors including:
|
•
|
the level of inventory in relationship to historical sales by product, including inventory usage by class based on product sales at both the sales center and Company levels;
|
|
•
|
changes in customer preferences or regulatory requirements;
|
|
•
|
seasonal fluctuations in inventory levels;
|
|
•
|
geographic location; and
|
|
•
|
new product offerings.
|
We periodically adjust our reserve for inventory obsolescence as changes occur in the above-identified factors.
The following table summarizes the changes in our allowance for inventory obsolescence for the past three years (in thousands):
|
|
2012
|
2011
|
2010
|
|||||||||
|
Balance at beginning of year
|
$
|
7,073
|
|
$
|
7,084
|
|
$
|
7,805
|
|
|||
|
Provision for inventory write-downs
|
3,852
|
|
3,590
|
|
875
|
|
||||||
|
Deduction for inventory write-offs
|
(3,405
|
)
|
(3,601
|
)
|
(1,596
|
)
|
||||||
|
Balance at end of year
|
$
|
7,520
|
|
$
|
7,073
|
|
$
|
7,084
|
|
|||
Property and Equipment
Property and equipment are stated at cost. We depreciate property and equipment on a straight-line basis over the following estimated useful lives:
|
Buildings
|
40 years
|
|
Leasehold improvements
(1)
|
1 - 10 years
|
|
Autos and trucks
|
3 - 5 years
|
|
Machinery and equipment
|
3 - 10 years
|
|
Computer equipment
|
3 - 7 years
|
|
Furniture and fixtures
|
5 - 10 years
|
|
(1)
|
For substantial improvements made near the end of a lease term where we are reasonably certain the lease will be renewed, we amortize the leasehold improvement over the remaining life of the lease including the expected renewal period.
|
The table below presents depreciation expense for the past three years (in thousands):
|
2012
|
2011
|
2010
|
||||||||
|
$
|
11,592
|
|
$
|
9,746
|
|
$
|
8,980
|
|
||
Acquisitions
We use the acquisition method of accounting and recognize assets acquired and liabilities assumed at fair value as of the acquisition date. Any contingent assets acquired and contingent liabilities assumed are also recognized at fair value if we can reasonably estimate fair value during the measurement period (which cannot exceed
one
year from the acquisition date). We expense all acquisition related costs as incurred, including any restructuring costs associated with a business combination.
We remeasure any contingent liabilities at fair value in each subsequent reporting period. If our initial acquisition accounting is incomplete by the end of the reporting period in which a business combination occurs, we report provisional amounts for incomplete items. Once we obtain information required to finalize the accounting for incomplete items, we retrospectively adjust the provisional amounts recognized as of the acquisition date. We make adjustments to these provisional amounts during the measurement period.
For all acquisitions, we include the results of operations in our Consolidated Financial Statements as of the acquisition date. For additional discussion of acquisitions, see Note 2.
47
Goodwill and Other Intangible Assets
Goodwill represents the excess of the amount we paid to acquire a company over the estimated fair value of tangible assets and identifiable intangible assets acquired, less liabilities assumed. We test goodwill and other indefinite-lived intangible assets for impairment annually as of October 1st and at any other time when impairment indicators exist.
For our annual goodwill impairment test, we estimate the fair value of our reporting units by utilizing a present value model that incorporates our assumptions for projected future cash flows, discount rates and multiples. These assumptions are considered unobservable inputs (Level 3 inputs as defined in the accounting guidance). If the estimated fair value of any of our reporting units has fallen below their carrying value, we compare the estimated fair value of the reporting unit's goodwill to its carrying value. If the carrying value of a reporting unit's goodwill exceeds its estimated fair value, we recognize the difference as an impairment loss in operating income. Since we define an operating segment as an individual sales center and we do not have operations below the sales center level, our reporting unit is an individual sales center. For additional discussion of goodwill and other intangible assets, see Note 3.
Self Insurance
We are self-insured for employee health benefits, workers’ compensation coverage, automobile and property and casualty insurance. To limit our exposure, we also maintain excess and aggregate liability coverage. We establish self‑insurance reserves based on estimates of claims incurred but not reported and information that we obtain from third-party service providers regarding known claims. Our management reviews these reserves based on consideration of various factors, including but not limited to the age of existing claims, estimated settlement amounts and other historical claims data.
Supplemental Cash Flow Information
The supplemental disclosures to the accompanying Consolidated Statements of Cash Flows are as follows (in thousands):
|
|
Year Ended December 31,
|
||||||||||
|
|
2012
|
2011
|
2010
|
||||||||
|
Cash paid during the year for:
|
|
|
|
||||||||
|
Interest
|
$
|
5,495
|
|
$
|
7,104
|
|
$
|
7,690
|
|
||
|
Income taxes, net of refunds
|
45,404
|
|
39,771
|
|
25,965
|
|
|||||
2012 Acquisitions
In February 2012, we acquired the distribution assets of Ideal Distributors Ltd., a regional swimming pool products distributor with four sales center locations in British Columbia, Canada. In March 2012, we acquired the distribution assets of CCR Distribution, a swimming pool products distributor with one sales center in Ontario, Canada.
We completed our preliminary acquisition accounting for each of these acquisitions, subject to adjustments in accordance with the terms of the purchase agreements during the one year measurement period. These acquisitions did not have a material impact on our financial position or results of operations.
2011 Acquisitions
In May 2011, we acquired certain distribution assets of The Kilpatrick Company, Inc., a regional distributor of landscape and irrigation products and a provider of equipment services with four sales center locations in South Florida. In November 2011, we acquired the distribution assets of Poolway Schwimmbadtechnik GmbH, a manufacturer of swimming pool walls and filtration kits and a distributor of swimming pool products and supplies with one sales center in Germany. In December 2011, we acquired the distribution assets of G.L. Cornell Company, a distributor of golf course equipment and irrigation products and a provider of equipment services with one sales center location in Maryland.
In 2012, we completed the acquisition accounting for each of our 2011 acquisitions. These acquisitions did not have a material impact on our financial position or results of operations.
48
2010 Acquisitions
In April 2010, we acquired Les Produits de Piscine Metrinox Inc. (Metrinox), a swimming pool products distributor with two sales centers in Quebec, Canada. In December 2010, we acquired the distribution assets of Turf Equipment Supply Company, a distributor of landscape and irrigation products and services with three sales centers in Las Vegas, and the distribution assets of Pool Boat and Leisure, S.A., a swimming pool products distributor with one sales center in Belgium.
In 2011, we completed the acquisition accounting for each of our 2010 acquisitions. These acquisitions did not have a material impact on our financial position or results of operations.
The changes in the carrying amount of goodwill are as follows (in thousands):
|
Goodwill (gross) at December 31, 2010
|
$
|
179,286
|
|
|
Acquired goodwill
|
137
|
|
|
|
Goodwill (gross) at December 31, 2011
|
179,423
|
|
|
|
Accumulated impairment losses at December 31, 2010
|
(770
|
)
|
|
|
Goodwill impairment
|
(1,550
|
)
|
|
|
Accumulated impairment losses at December 31, 2011
|
(2,320
|
)
|
|
|
Goodwill (net) at December 31, 2011
|
$
|
177,103
|
|
|
Goodwill (gross) at December 31, 2011
|
$
|
179,423
|
|
|
Acquired goodwill
|
—
|
|
|
|
Foreign currency translation adjustments
|
(174
|
)
|
|
|
Goodwill (gross) at December 31, 2012
|
179,249
|
|
|
|
Accumulated impairment losses at December 31, 2011
|
(2,320
|
)
|
|
|
Goodwill impairment
|
(6,946
|
)
|
|
|
Accumulated impairment losses at December 31, 2012
|
(9,266
|
)
|
|
|
Goodwill (net) at December 31, 2012
|
$
|
169,983
|
|
During the third quarter of 2012, we performed an interim goodwill impairment analysis for our United Kingdom reporting unit based on our identification of impairment indicators related to our results through the end of the 2012 pool season and our expectation for continued depressed economic conditions in the United Kingdom. Our results for the nine months ended September 30, 2012 were significantly lower than our 2012 sales, gross profit and operating profit estimates for the United Kingdom reporting unit that we used in our 2011 annual goodwill impairment test. We updated our 2011 impairment analysis for both our actual 2012 year to date results and our updated growth estimates for future years based on expectations for a more prolonged economic recovery period in the United Kingdom. These updates significantly impacted our projected future cash flow calculation for the United Kingdom reporting unit and resulted in a much lower estimated fair value for that reporting unit. As a result of our interim impairment analysis, we recorded a non-cash goodwill impairment charge of
$6.9 million
on the Consolidated Statements of Income. This charge was
equal to the total September
30,
2012 goodwill carrying amount of our United Kingdom reporting unit of
$6.9 million
.
In October 2012, we performed our annual goodwill impairment test and determined that the goodwill attributed to all of our reporting units was not impaired. As of
October 1, 2012
, we had
209
reporting units with allocated goodwill balances. The highest goodwill balance was
$5.7 million
and the average goodwill balance was
$0.8 million
.
49
In 2011, we identified three Horizon locations in Texas that had estimated fair values below their carrying values. The combined carrying value of goodwill for these three reporting units was
$4.6 million
. Since the estimated fair value for each reporting unit’s goodwill was below the respective carrying value, we recognized the total difference of
$1.6 million
as an impairment loss on the Consolidated Statements of Income.
Other intangible assets consisted of the following (in thousands):
|
|
December 31,
|
||||||
|
|
2012
|
2011
|
|||||
|
Horizon tradename (indefinite life)
|
$
|
8,400
|
|
$
|
8,400
|
|
|
|
National Pool Tile (NPT) tradename (20 year life)
|
1,500
|
|
1,500
|
|
|||
|
Non-compete agreements (5 year weighted average useful life)
(1)
|
4,531
|
|
10,223
|
|
|||
|
Employment contracts
(1)
|
—
|
|
650
|
|
|||
|
Distribution agreement
(1)
|
—
|
|
6,115
|
|
|||
|
Other intangible assets
|
14,431
|
|
26,888
|
|
|||
|
Less accumulated amortization
(1)
|
(3,378
|
)
|
(15,150
|
)
|
|||
|
Other intangible assets, net
|
$
|
11,053
|
|
$
|
11,738
|
|
|
(1)
All fully amortized intangible assets and related amortization amounts were removed in the fourth quarter of 2012.
The Horizon tradename has an indefinite useful life and is not subject to amortization. However, we evaluate the useful life of this intangible asset and test for impairment annually. The NPT tradename and the non-compete agreements have finite useful lives and we amortize the estimated fair value of these agreements using the straight-line method over their respective useful lives. The useful lives for our non-compete agreements are based on their contractual terms.
Other intangible amortization expense was
$0.9 million
in
2012
,
$1.2 million
in
2011
and
$1.9 million
in
2010
.
The table below presents estimated amortization expense for other intangible assets for the next five years (in thousands):
|
2013
|
$
|
829
|
|
|
|
2014
|
686
|
|
||
|
2015
|
174
|
|
||
|
2016
|
114
|
|
||
|
2017
|
82
|
|
||
50
The table below presents additional information regarding certain balance sheet accounts (in thousands):
|
|
December 31,
|
|||||||
|
|
2012
|
2011
|
||||||
|
Receivables, net:
|
|
|
||||||
|
Trade accounts
|
$
|
86,177
|
|
$
|
84,039
|
|
||
|
Vendor incentives
|
31,451
|
|
29,373
|
|
||||
|
Other, net
|
1,708
|
|
1,761
|
|
||||
|
Total receivables
|
119,336
|
|
115,173
|
|
||||
|
Less allowance for doubtful accounts
|
(5,477
|
)
|
(5,900
|
)
|
||||
|
Receivables, net
|
$
|
113,859
|
|
$
|
109,273
|
|
||
|
Prepaid expenses and other current assets:
|
|
|
||||||
|
Prepaid expenses
|
$
|
8,647
|
|
$
|
7,527
|
|
||
|
Other current assets
|
2,633
|
|
3,771
|
|
||||
|
Prepaid expenses and other current assets
|
$
|
11,280
|
|
$
|
11,298
|
|
||
|
Property and equipment, net:
|
|
|
|
|||||
|
Land
|
$
|
1,641
|
|
$
|
1,641
|
|
||
|
Buildings
|
2,188
|
|
2,188
|
|
||||
|
Leasehold improvements
|
26,254
|
|
24,820
|
|
||||
|
Autos and trucks
|
14,221
|
|
7,099
|
|
||||
|
Machinery and equipment
|
26,871
|
|
24,433
|
|
||||
|
Computer equipment
|
32,875
|
|
31,616
|
|
||||
|
Furniture and fixtures
|
8,388
|
|
7,480
|
|
||||
|
Fixed assets in progress
|
2,384
|
|
2,000
|
|
||||
|
Total property and equipment
|
114,822
|
|
101,277
|
|
||||
|
Less accumulated depreciation
|
(68,256
|
)
|
(59,883
|
)
|
||||
|
Property and equipment, net
|
$
|
46,566
|
|
$
|
41,394
|
|
||
|
Accrued expenses and other current liabilities:
|
|
|
|
|||||
|
Salaries
|
$
|
7,625
|
|
$
|
6,356
|
|
||
|
Bonuses
|
22,549
|
|
29,786
|
|
||||
|
Other
|
18,012
|
|
12,998
|
|
||||
|
Accrued expenses and other current liabilities
|
$
|
48,186
|
|
$
|
49,140
|
|
||
51
The components of our debt for the past two years were as follows (in thousands):
|
|
December 31,
|
|||||||
|
|
2012
|
2011
|
||||||
|
Long-term debt:
|
|
|
||||||
|
Revolving Credit Facility, variable rate (described below)
|
$
|
230,882
|
|
$
|
147,300
|
|
||
|
Floating Rate Senior Notes (described below)
|
—
|
|
100,000
|
|
||||
|
Total debt
|
$
|
230,882
|
|
$
|
247,300
|
|
||
Revolving Credit Facility
On
October 19, 2011
, we entered into a new
$430.0 million
unsecured syndicated senior credit facility (the Credit Facility), along with our wholly owned subsidiaries SCP Distributors Canada Inc., as the Canadian Borrower, and SCP Pool B.V., as the Dutch Borrower. The Credit Facility provides us with an increased borrowing capacity under a
five
-year revolving credit facility that matures on
October 19, 2016
. The Credit Facility includes sublimits for the issuance of swingline loans and standby letters of credit. Pursuant to an accordion feature, the aggregate maximum principal amount of the commitments under the Credit Facility may be increased at our request and with agreement by the lenders by up to
$75.0 million
, to a total of
$505.0 million
. The Credit Facility replaced our amended and restated unsecured senior credit facility (the Previous Credit Facility) dated
December 20, 2007
, which provided for
$240.0 million
in borrowing capacity through a five-year revolving credit facility (the Previous Revolver) that was scheduled to mature on
December 20, 2012
.
Our obligations under the Credit Facility are guaranteed by substantially all of our existing and future direct and indirect domestic subsidiaries. The Credit Facility contains terms and provisions (including representations, covenants and conditions) and events of default customary for transactions of this type. If we default under the Credit Facility, the lenders may terminate their obligations under the Credit Facility and may require us to repay all amounts.
At
December 31, 2012
, there was
$230.9 million
outstanding and
$195.5 million
available for borrowing under the Credit Facility. The weighted average effective interest rate for the Credit Facility as of
December 31, 2012
was approximately
2.2%
, excluding commitment fees.
Revolving borrowings under the Credit Facility bear interest, at our option, at either of the following and in each case plus an applicable margin:
|
a.
|
a base rate, which is the highest of (i) the Wells Fargo Bank, National Association prime rate, (ii) the Federal Funds Rate plus 0.500% and (iii) the LIBOR Market Index Rate plus 1.000%; or
|
|
b.
|
the London Interbank Offered Rate (LIBOR).
|
Borrowings by the Canadian Borrower bear interest, at the Canadian Borrower’s option, at either of the following and in each case plus an applicable margin:
|
a.
|
a base rate, which is the greatest of (i) the Canadian Reference Bank prime rate, (ii) the annual rate of interest equal to the sum of the CDOR Rate plus 1.000% and (iii) the LIBOR Market Index Rate plus 1.000%; or
|
|
b.
|
LIBOR.
|
Borrowings by the Dutch Borrower bear interest at LIBOR plus an applicable margin.
The interest rate margins on the borrowings and letters of credit are based on our leverage ratio and will range from 1.225% to 1.900% on LIBOR and swingline loans, and from 0.225% to 0.900% on Base Rate and Canadian Base Rate loans. Borrowings under the swingline loans are based on the LIBOR Market Index Rate plus any applicable margin. We are also required to pay an annual facility fee ranging from
0.150%
to
0.350%
, depending on our leverage ratio.
52
Floating Rate Senior Notes
On
February 12, 2007
, we issued and sold
$100.0 million
aggregate principal amount of Floating Rate Senior Notes (the Notes) in a private placement offering pursuant to a Note Purchase Agreement. The Notes were classified as Long‑term debt as of
December 31, 2011
based on our intention to repay them using the increased capacity under the Credit Facility. The Notes were paid off at maturity on
February 12, 2012
.
Interest Rate Swaps
As of
December 31, 2012
, we had
five
interest rate swap contracts in place to reduce our exposure to fluctuations in interest rates on the Credit Facility. These swaps convert the variable interest rate to a fixed interest rate on borrowings under the Credit Facility. Each of these swap contracts terminates on
October 19, 2016
. The following table provides additional details related to each of these swap contracts:
|
Derivative
|
|
Effective Date
|
|
Notional
Amount
(in millions)
|
|
Fixed
Interest
Rate
|
|||
|
Interest rate swap 1
|
|
November 21, 2011
|
|
$
|
25.0
|
|
|
1.185
|
%
|
|
Interest rate swap 2
|
|
November 21, 2011
|
|
25.0
|
|
|
1.185
|
%
|
|
|
Interest rate swap 3
|
|
December 21, 2011
|
|
50.0
|
|
|
1.100
|
%
|
|
|
Interest rate swap 4
|
|
January 17, 2012
|
|
25.0
|
|
|
1.050
|
%
|
|
|
Interest rate swap 5
|
|
January 19, 2012
|
|
25.0
|
|
|
0.990
|
%
|
|
Since inception, we have not recognized any gains or losses on these swaps through income and there has been no effect on income from hedge ineffectiveness. The net difference between interest paid and interest received related to our swap agreements resulted in incremental interest expense of
$1.3 million
in
2012
and
$3.6 million
in
2011
.
Failure of our swap counterparties would result in the loss of any potential benefit to us under our swap agreements. In this case, we would still be obligated to pay the variable interest payments underlying our debt agreements. Additionally, failure of our swap counterparties would not eliminate our obligation to continue to make payments under our existing swap agreements if we continue to be in a net pay position.
We had two previous interest rate swap agreements in effect that reduced our exposure to fluctuations in interest rates on the Notes and the Previous Revolver. One interest rate swap agreement converted the variable interest rate on the Notes to a fixed rate of
5.088%
on a notional amount of
$50.0 million
. This swap agreement was effective
February 12, 2007
and was scheduled to terminate on
February 12, 2012
. Our other interest rate swap agreement converted the variable interest rate on the Previous Revolver to a fixed rate of
1.725%
on a notional amount of
$50.0 million
. This swap agreement was effective
January 27, 2010
and was scheduled to terminate on
January 27, 2012
. We de‑designated this interest rate swap when we replaced the Previous Revolver on
October 19, 2011
. In
December 2011
, we terminated both of these interest rate swaps and realized a loss of
$0.3 million
.
Financial and Other Covenants
Financial covenants on the Credit Facility and the Notes are closely aligned and include a minimum fixed charge coverage ratio and maintenance of a maximum average total leverage ratio, which are our most restrictive covenants. The Credit Facility also limits the declaration and payment of dividends on our common stock to no more than
50%
of the preceding year’s Net Income (as defined in the Credit Facility), provided no default or event of default has occurred and is continuing, or would result from the payment of dividends. Further, dividends must be declared and paid in a manner consistent with our past practice. Under the Credit Facility, we may repurchase shares of our common stock provided no default or event of default has occurred and is continuing, or would result from the repurchase of shares, and our maximum average total leverage ratio (determined on a pro forma basis) is less than 2.50 to 1.00. Other covenants include restrictions on our ability to grant liens, incur indebtedness, make investments, merge or consolidate, and sell or transfer assets. Failure to comply with any of our financial covenants or any other terms of the Credit Facility could result in penalty payments, higher interest rates on our borrowings or the acceleration of the maturities of our outstanding debt.
As of
December 31, 2012
, we were in compliance with all covenants and financial ratio requirements related to the Credit Facility.
53
Deferred Financing Costs
We capitalize financing costs we incur related to implementing and amending our debt arrangements. We record these costs as Other assets, net on our Consolidated Balance Sheets and amortize them over the contractual life of the related debt arrangements. The changes in deferred financing costs are as follows (in thousands):
|
|
2012
|
2011
|
||||||
|
Deferred financing costs:
|
|
|
||||||
|
Balance at beginning of year
|
$
|
3,451
|
|
$
|
2,172
|
|
||
|
Financing costs deferred
|
—
|
|
1,674
|
|
||||
|
Write-off fully amortized deferred financing costs
|
(396
|
)
|
(395
|
)
|
||||
|
Balance at end of year
|
3,055
|
|
3,451
|
|
||||
|
Accumulated amortization of deferred financing costs:
|
|
|
||||||
|
Balance at beginning of year
|
(1,581
|
)
|
(1,652
|
)
|
||||
|
Amortization of deferred financing costs
|
(388
|
)
|
(324
|
)
|
||||
|
Write-off fully amortized deferred financing costs
|
396
|
|
395
|
|
||||
|
Balance at end of year
|
(1,573
|
)
|
(1,581
|
)
|
||||
|
Deferred financing costs, net of accumulated amortization
|
$
|
1,482
|
|
$
|
1,870
|
|
||
Share-Based Plans
Current Plan
In May 2007, our stockholders approved the 2007 Long-Term Incentive Plan (the 2007 LTIP), which authorizes the Compensation Committee of our Board of Directors (the Board) to grant non-qualified stock options and restricted stock awards to employees, directors, consultants or advisors. The 2007 LTIP replaced the 2002 Plan and the Director Plan, both of which are discussed below. In May 2009, our stockholders approved the Amended and Restated 2007 Long-Term Incentive Plan (the Amended 2007 LTIP). The amendment increased the number of shares that may be issued from
1,515,000
shares under the 2007 LTIP to
5,415,000
shares under the Amended 2007 LTIP. As of
December 31, 2012
, we had
1,965,169
shares available for future issuance including
605,552
shares that may be issued as restricted stock.
Granted stock options have an exercise price equal to our stock’s closing market price on the grant date and expire
ten
years from the grant date. Restricted stock awards granted under the Amended 2007 LTIP are issued at no cost to the grantee. Both stock options and restricted stock awards vest over time depending on an employee’s length of service with the Company. Share-based awards generally vest either
five
years from the grant date or on a
three
/
five
year split vest schedule, where half of the awards vest three years from the grant date and the remainder of the awards vest five years from the grant date. Share-based awards to directors, excluding our chief executive officer, vest one year from the grant date.
Preceding Plans
In May 2002, our stockholders approved the 2002 Long-Term Incentive Plan (the 2002 Plan), which authorized the Board to grant stock options and restricted stock awards to employees, agents, consultants or independent contractors. In May 2004, our stockholders approved an amendment to increase the number of shares authorized for issuance under the 2002 Plan from
1,575,000
to
2,700,000
shares. Granted stock options have an exercise price equal to our stock’s market price on the grant date. These options generally vest either
five
years from the grant date or on a
three
/
five
year split vest schedule, as described above. These options expire
ten
years from the grant date. In May 2007, the Board suspended the 2002 Plan. Options granted prior to the suspension were not affected by this action.
54
The SCP Pool Corporation Non-Employee Directors Equity Incentive Plan (the Director Plan) permitted the Board to grant stock options to each non-employee director. No more than
1,350,000
shares were authorized to be issued under this plan. Granted options have an exercise price equal to our stock’s market price on the grant date. The options generally were exercisable
one
year after the grant date, and they expire
ten
years after the grant date. The Director Plan expired during 2006. Options granted prior to the expiration were not affected by this action.
In May 1998, our stockholders approved the 1998 Stock Option Plan (the 1998 Plan), which authorized the Board to grant stock options, stock appreciation rights, restricted stock and performance awards to employees, agents, consultants or independent contractors. These options generally were exercisable three or more years after the grant date, and they expire ten years after the grant date. In May 2002, the Board suspended the 1998 Plan. Options granted prior to the suspension were not affected by this action.
Stock Option Awards
The following is a summary of the stock option activity under our share-based plans for the year ended
December 31, 2012
:
|
|
Shares
|
Weighted Average
Exercise Price
|
Weighted Average
Remaining
Contractual Term
(Years)
|
Aggregate
Intrinsic Value
|
|||||||||
|
Balance at December 31, 2011
|
4,669,237
|
|
$
|
24.23
|
|
|
|
||||||
|
Granted
|
280,746
|
|
37.13
|
|
|
|
|
||||||
|
Less: Exercised
|
986,110
|
|
19.49
|
|
|
|
|
||||||
|
Forfeited
|
19,682
|
|
24.26
|
|
|
|
|
||||||
|
Balance at December 31, 2012
|
3,944,191
|
|
$
|
26.33
|
|
5.16
|
$
|
63,069,781
|
|
||||
|
Exercisable at December 31, 2012
|
2,090,468
|
|
$
|
28.89
|
|
3.46
|
$
|
28,091,967
|
|
||||
The table below summarizes information about stock options outstanding and exercisable at
December 31, 2012
:
|
|
Outstanding
Stock Options
|
Exercisable
Stock Options
|
||||||||||||||
|
Range of exercise prices
|
Shares
|
Weighted Average
Remaining
Contractual Term
(Years)
|
Weighted Average Exercise Price
|
Shares
|
Weighted Average Exercise Price
|
|||||||||||
|
$ 0.00 to $ 17.99
|
27,744
|
|
0.12
|
$
|
11.98
|
|
27,744
|
|
$
|
11.98
|
|
|||||
|
$ 18.00 to $ 23.99
|
2,062,660
|
|
5.25
|
20.11
|
|
885,433
|
|
20.42
|
|
|||||||
|
$ 24.00 to $ 29.99
|
447,516
|
|
7.62
|
24.69
|
|
48,516
|
|
26.22
|
|
|||||||
|
$ 30.00 to $ 47.30
|
1,406,271
|
|
4.36
|
36.27
|
|
1,128,775
|
|
36.06
|
|
|||||||
|
|
3,944,191
|
|
5.16
|
$
|
26.33
|
|
2,090,468
|
|
$
|
28.89
|
|
|||||
The following table summarizes the cash proceeds and tax benefits realized from the exercise of stock options:
|
|
Year Ended December 31,
|
|||||||||||
|
(in thousands, except share amounts)
|
2012
|
2011
|
2010
|
|||||||||
|
Options exercised
|
986,110
|
|
958,509
|
|
650,210
|
|
||||||
|
Cash proceeds
|
$
|
19,221
|
|
$
|
12,173
|
|
$
|
5,411
|
|
|||
|
Intrinsic value of options exercised
|
$
|
19,383
|
|
$
|
13,868
|
|
$
|
8,589
|
|
|||
|
Tax benefits realized
|
$
|
7,418
|
|
$
|
5,409
|
|
$
|
3,375
|
|
|||
55
We estimated the fair value of employee stock option awards at the grant date based on the assumptions summarized in the following table:
|
|
Year Ended December 31,
|
||||||||||||||
|
(Weighted average)
|
2012
|
2011
|
2010
|
||||||||||||
|
Expected volatility
|
38.6
|
%
|
37.9
|
%
|
38.9
|
%
|
|||||||||
|
Expected term
|
7.6
|
|
years
|
7.8
|
|
years
|
6.7
|
|
years
|
||||||
|
Risk-free interest rate
|
1.61
|
%
|
3.10
|
%
|
3.23
|
%
|
|||||||||
|
Expected dividend yield
|
2.0
|
%
|
2.0
|
%
|
2.0
|
%
|
|||||||||
|
Grant date fair value
|
$
|
12.66
|
|
|
$
|
8.97
|
|
|
$
|
7.34
|
|
|
|||
We calculated expected volatility over the expected term of the awards based on the historical volatility of our common stock. We use weekly price observations for our historical volatility calculation because we believe that they provide the most appropriate measurement of volatility given the trading patterns of our common stock. We estimated the expected term based on the vesting period of the awards and our historical exercise activity for awards with similar characteristics. The weighted average expected term increased in 2011 due to a higher expected term estimate for stock option awards granted to our named executive officers and the impact of fewer stock option awards granted. The risk-free interest rate is based on the U.S. Treasury zero-coupon issues with a remaining term approximating the expected term of the option. We determined the expected dividend yield based on the anticipated dividends over the expected term.
For purposes of recognizing share-based compensation expense, we ratably expense the estimated fair value of employee stock options over the options’ requisite service period. The requisite service period for our share-based awards is either the vesting period, or if shorter, the period from the grant date to the date that employees meet the retirement provisions of our share-based award agreements. We recognize compensation cost for awards with graded vesting using the graded vesting recognition method.
The table below presents the total share-based compensation expense for stock option awards and the related recognized tax benefits for the past three years (in thousands):
|
|
2012
|
2011
|
2010
|
|||||||||
|
Share-based compensation expense
|
$
|
4,304
|
|
$
|
4,497
|
|
$
|
4,570
|
|
|||
|
Recognized tax benefits
|
1,647
|
|
1,721
|
|
1,796
|
|
||||||
At
December 31, 2012
, the unamortized compensation expense related to stock option awards totaled
$3.5 million
. We anticipate that this expense will be recognized over a weighted average period of
2.0
years.
Restricted Stock Awards
The following is a summary of the restricted stock awards activity under our share-based plans for the year ended
December 31, 2012
:
|
|
Shares
|
Weighted Average
Grant Date Fair Value
|
|||||
|
Balance unvested at December 31, 2011
|
505,290
|
|
$
|
22.37
|
|
||
|
Granted (at market price)
|
87,476
|
|
37.13
|
|
|||
|
Less: Vested
|
69,580
|
|
33.60
|
|
|||
|
Forfeited
|
7,000
|
|
22.53
|
|
|||
|
Balance unvested at December 31, 2012
|
516,186
|
|
$
|
23.36
|
|
||
At
December 31, 2012
, the unamortized compensation expense related to the restricted stock awards totaled
$3.1 million
. We anticipate that this expense will be recognized over a weighted average period of
1.8
years.
56
The table below presents the total number of restricted stock awards that vested for the past three years and the related fair value of those awards (in thousands, except share amounts):
|
|
2012
|
2011
|
2010
|
|||||||||
|
Shares vested
|
69,580
|
|
32,856
|
|
44,152
|
|
||||||
|
Fair value of restricted stock awards vested
|
$
|
2,338
|
|
$
|
812
|
|
$
|
1,077
|
|
|||
The table below presents the total share-based compensation expense for restricted stock awards for the past three years (in thousands):
|
|
2012
|
2011
|
2010
|
|||||||||
|
Share-based compensation expense
|
$
|
3,873
|
|
$
|
3,507
|
|
$
|
3,028
|
|
|||
Employee Stock Purchase Plan
In March 1998, the Board adopted the SCP Pool Corporation Employee Stock Purchase Plan (the ESPP). Under the ESPP, employees who meet minimum age and length of service requirements may purchase stock at
85%
of the lower of:
|
a.
|
the closing price of our common stock at the end of a six month plan period ending either June 30 or December 31; or
|
|
b.
|
the average of the beginning and ending closing prices of our common stock for such six month period.
|
No more than
956,250
shares of our common stock may be issued under the ESPP. For the two six month offering periods in each year presented below, our employees purchased the following aggregate number of shares:
|
2012
|
2011
|
2010
|
|||||
|
31,275
|
|
37,653
|
|
48,002
|
|
||
The grant date fair value for the most recent ESPP purchase period ended
December 31, 2012
was
$7.16
per share. Share-based compensation expense related to our ESPP was
$0.3 million
in
2012
,
$0.2 million
in
2011
and
$0.2 million
in
2010
.
Income (loss) before income taxes and equity earnings is attributable to the following jurisdictions (in thousands):
|
|
Year Ended December 31,
|
|||||||||||
|
|
2012
|
2011
|
2010
|
|||||||||
|
United States
|
$
|
144,578
|
|
$
|
111,376
|
|
$
|
92,108
|
|
|||
|
Foreign
(1)
|
(6,178
|
)
|
5,727
|
|
2,518
|
|
||||||
|
Total
|
$
|
138,400
|
|
$
|
117,103
|
|
$
|
94,626
|
|
|||
(1)
The foreign loss before income taxes in 2012 includes the $6.9 million goodwill impairment charge related to the United Kingdom.
57
The provision for income taxes consisted of the following (in thousands):
|
|
Year Ended December 31,
|
|||||||||||
|
|
2012
|
2011
|
2010
|
|||||||||
|
Current:
|
|
|
|
|||||||||
|
Federal
|
$
|
43,871
|
|
$
|
32,850
|
|
$
|
29,040
|
|
|||
|
State and other
|
5,958
|
|
7,675
|
|
5,682
|
|
||||||
|
Total current provision for income taxes
|
49,829
|
|
40,525
|
|
34,722
|
|
||||||
|
Deferred:
|
|
|
|
|||||||||
|
Federal
|
6,071
|
|
4,754
|
|
1,715
|
|
||||||
|
State and other
|
844
|
|
40
|
|
656
|
|
||||||
|
Total deferred provision for income taxes
|
6,915
|
|
4,794
|
|
2,371
|
|
||||||
|
Provision for income taxes
|
$
|
56,744
|
|
$
|
45,319
|
|
$
|
37,093
|
|
|||
A reconciliation of the U.S. federal statutory tax rate to our effective tax rate on Income before income taxes and equity earnings is as follows:
|
|
Year Ended December 31,
|
||||||||
|
|
2012
|
2011
|
2010
|
||||||
|
Federal statutory rate
|
35.00
|
%
|
35.00
|
%
|
35.00
|
%
|
|||
|
Change in valuation allowance
|
1.97
|
|
0.37
|
|
0.81
|
|
|||
|
Other, primarily state income tax rate
|
4.03
|
|
3.33
|
|
3.39
|
|
|||
|
Total effective tax rate
|
41.00
|
%
|
38.70
|
%
|
39.20
|
%
|
|||
58
The components of the deferred tax assets and liabilities are as follows (in thousands):
|
|
December 31,
|
|||||||
|
|
2012
|
2011
|
||||||
|
Deferred tax assets:
|
|
|
||||||
|
Product inventories
|
$
|
7,703
|
|
$
|
8,075
|
|
||
|
Accrued expenses
|
2,780
|
|
2,885
|
|
||||
|
Allowance for doubtful accounts
|
420
|
|
777
|
|
||||
|
Total current
|
10,903
|
|
11,737
|
|
||||
|
Less: valuation allowance
|
(1,584
|
)
|
(1,677
|
)
|
||||
|
Component reclassified for net presentation
|
(4,133
|
)
|
(2,976
|
)
|
||||
|
Total current, net
|
5,186
|
|
7,084
|
|
||||
|
Leases
|
1,957
|
|
1,866
|
|
||||
|
Share-based compensation
|
16,970
|
|
17,740
|
|
||||
|
Uncertain tax positions
|
1,226
|
|
1,650
|
|
||||
|
Net operating losses
|
6,703
|
|
3,972
|
|
||||
|
Interest rate swaps
|
1,327
|
|
164
|
|
||||
|
Equity losses in unconsolidated investments
|
5,653
|
|
5,653
|
|
||||
|
Other
|
1,150
|
|
1,037
|
|
||||
|
Total non-current
|
34,986
|
|
32,082
|
|
||||
|
Less: valuation allowance
|
(10,772
|
)
|
(7,948
|
)
|
||||
|
Component reclassified for net presentation
|
(23,474
|
)
|
(23,461
|
)
|
||||
|
Total non-current, net
|
740
|
|
673
|
|
||||
|
Total deferred tax assets
|
5,926
|
|
7,757
|
|
||||
|
Deferred tax liabilities:
|
|
|
|
|
||||
|
Trade discounts on purchases
|
2,681
|
|
1,944
|
|
||||
|
Prepaid expenses
|
1,452
|
|
1,032
|
|
||||
|
Total current
|
4,133
|
|
2,976
|
|
||||
|
Component reclassified for net presentation
|
(4,133
|
)
|
(2,976
|
)
|
||||
|
Total current, net
|
—
|
|
—
|
|
||||
|
Intangible assets, primarily goodwill
|
30,645
|
|
27,107
|
|
||||
|
Depreciation
|
6,282
|
|
5,885
|
|
||||
|
Total non-current
|
36,927
|
|
32,992
|
|
||||
|
Component reclassified for net presentation
|
(23,474
|
)
|
(23,461
|
)
|
||||
|
Total non-current, net
|
13,453
|
|
9,531
|
|
||||
|
Total deferred tax liabilities
|
13,453
|
|
9,531
|
|
||||
|
Net deferred tax liability
|
$
|
(7,527
|
)
|
$
|
(1,774
|
)
|
||
59
At
December 31, 2012
, certain of our international subsidiaries had tax loss carryforwards totaling approximately
$23.9 million
, which expire in various years after
2013
. Deferred tax assets related to the tax loss carryforwards of these international subsidiaries were
$6.7 million
as of
December 31, 2012
and
$4.0 million
as of
December 31, 2011
. We have recorded a corresponding valuation allowance of
$6.7 million
and
$4.0 million
in the respective years. The increase in our net operating losses and corresponding valuation allowances in 2012 is primarily related to the United Kingdom. We have also recorded a
$5.7 million
valuation allowance related to our deferred tax asset recorded for the write‑off of our investment in LAC.
As presented in the Consolidated Statements of Cash Flows, the changes in deferred income taxes include changes related to the deferred income tax provision and the estimated tax impact of accumulated other comprehensive income (loss).
We reduce federal and state income taxes payable by the tax benefits associated with the exercise of nonqualified stock options and the lapse of restrictions on restricted stock awards. To the extent realized tax deductions exceed the amount of previously recognized deferred tax benefits related to share-based compensation, we record an excess tax benefit in stockholders’ equity. We recorded excess tax benefits of
$4.5 million
in
2012
and
$3.1 million
in
2011
.
As of
December 31, 2012
, United States income taxes were not provided on earnings of our foreign subsidiaries, as we have invested or expect to invest the undistributed earnings indefinitely. If in the future these earnings are repatriated to the United States, or if we determine that the earnings will be remitted in the foreseeable future, additional income tax provisions may be required. Determining the amount of unrecognized deferred tax liability on these undistributed earnings is not practicable due to the complexity of tax laws and regulations and the varying circumstances, tax treatments and timing of any future repatriation.
We hold, through our affiliates, cash balances in the countries in which we operate, including amounts held outside the United States. Most of the amounts held outside the United States could be repatriated to the United States, but, under current law, may be subject to United States federal income taxes, less applicable foreign tax credits. Repatriation of some foreign balances is restricted by local laws including the imposition of withholding taxes in some jurisdictions. We have not provided for the United States federal tax liability on these amounts and for financial statement purposes, these foreign cash balances are considered indefinitely reinvested.
The following is a summary of the activity related to uncertain tax positions for the past three years (in thousands):
|
|
2012
|
2011
|
2010
|
|||||||||
|
Balance at beginning of year
|
$
|
4,715
|
|
$
|
3,962
|
|
$
|
4,550
|
|
|||
|
Increases for tax positions taken during a prior period
|
—
|
|
—
|
|
114
|
|
||||||
|
Increases for tax positions taken during the current period
|
972
|
|
914
|
|
811
|
|
||||||
|
Decreases resulting from the expiration of the statute of limitations
|
(2,123
|
)
|
(46
|
)
|
(992
|
)
|
||||||
|
Decreases relating to settlements
|
(60
|
)
|
(115
|
)
|
(521
|
)
|
||||||
|
Balance at end of year
|
$
|
3,504
|
|
$
|
4,715
|
|
$
|
3,962
|
|
|||
The total amount of unrecognized tax benefits that, if recognized, would decrease the effective tax rate was
$2.3 million
at
December 31, 2012
and
$3.0 million
at
December 31, 2011
.
We record interest expense related to unrecognized tax benefits in interest expense, while we record related penalties in selling and administrative expenses. For unrecognized tax benefits, we had interest income of
$0.3 million
in
2012
and interest expense of
$0.3 million
in
2011
and
$0.1 million
in 2010. Accrued interest related to unrecognized tax benefits was approximately
$0.5 million
at
December 31, 2012
and
$0.8 million
at
December 31, 2011
.
We file income tax returns in the U.S. federal jurisdiction and various state and foreign jurisdictions. With few exceptions, we are no longer subject to U.S. federal, state and local, or non-U.S. income tax examinations by tax authorities for years before
2009
.
60
The table below presents the computation of earnings per share, including the reconciliation of basic and diluted weighted average shares outstanding (in thousands, except per share data):
|
|
Year Ended December 31,
|
|||||||||||
|
|
2012
|
2011
|
2010
|
|||||||||
|
Net income
|
$
|
81,972
|
|
$
|
71,993
|
|
$
|
57,638
|
|
|||
|
Weighted average shares outstanding:
|
|
|
|
|
|
|||||||
|
Basic
|
46,937
|
|
48,158
|
|
49,469
|
|
||||||
|
Effect of dilutive securities:
|
|
|
|
|
|
|||||||
|
Stock options and employee stock purchase plan
|
1,121
|
|
829
|
|
692
|
|
||||||
|
Diluted
|
48,058
|
|
48,987
|
|
50,161
|
|
||||||
|
Earnings per share:
|
|
|
|
|||||||||
|
Basic
|
$
|
1.75
|
|
$
|
1.49
|
|
$
|
1.17
|
|
|||
|
Diluted
|
$
|
1.71
|
|
$
|
1.47
|
|
$
|
1.15
|
|
|||
|
Anti-dilutive stock options excluded from diluted earnings per share computations
(1)
|
417
|
|
1,381
|
|
1,964
|
|
||||||
|
(1)
|
Since these options have exercise prices that are higher than the average market prices of our common stock, including them in the calculation would have an anti-dilutive effect on earnings per share.
|
We lease facilities for our corporate office, sales centers, vehicles and equipment under operating leases that expire in various years through 2027. Most of our leases contain renewal options, some of which involve rate increases. For leases with step rent provisions whereby the rental payments increase incrementally over the life of the lease, we recognize the total minimum lease payments on a straight-line basis over the minimum lease term. The table below presents rent expenses associated with operating leases for the past three years (in thousands):
|
2012
|
2011
|
2010
|
||||||||
|
$
|
59,873
|
|
$
|
62,099
|
|
$
|
64,995
|
|
||
The table below sets forth the approximate future minimum lease payments as of
December 31, 2012
related to non-cancelable operating leases and the non-cancelable portion of certain vehicle operating leases with initial terms of one year or more (in thousands):
|
2013
|
$
|
42,250
|
|
|
|
2014
|
33,913
|
|
||
|
2015
|
26,811
|
|
||
|
2016
|
19,903
|
|
||
|
2017
|
11,681
|
|
||
|
Thereafter
|
12,140
|
|
||
From time to time, we are subject to various claims and litigation arising in the ordinary course of business, including product liability, personal injury, commercial, contract and employment matters. While the outcome of any litigation is inherently unpredictable, we do not believe, based on currently available facts, that the ultimate resolution of any of these matters will have a material adverse impact on our financial condition, results of operations or cash flows.
61
Policy
Our policy for related party transactions is included in our written Audit Committee Charter. This policy requires that our Audit Committee review and approve all related party transactions required to be disclosed in our Annual Proxy Statement or required to be approved based on NASDAQ rules.
Transactions
In May 2005, we acquired a
50%
membership interest in NCC through a
$1.1 million
cash contribution. NCC owns and operates an office building in Covington, Louisiana. We lease corporate and administrative offices from NCC, occupying approximately
53,000
square feet of office space. In May 2005 we amended the lease agreement, which has a
ten
year term. As of
December 31, 2012
, we pay rent of
$79,156
per month.
In January 2002, we entered into a lease agreement with S&C Development, LLC (S&C) for additional warehouse space adjacent to our Mandeville, Louisiana sales center. The sole owner of S&C is A. David Cook, a POOL executive officer. In 2006, we extended this lease for a second term, which will last
seven
years and expire on December 31, 2013. As of
December 31, 2012
, we pay rent of
$5,779
per month for the
8,600
square foot space.
In May 2001, we entered into a lease agreement with Kenneth St. Romain, a POOL executive officer, for a sales center facility in Jackson, Mississippi. In 2008, we extended this lease for a second term, which will last
five
years and expire on November 30, 2013. As of
December 31, 2012
, we pay rent of
$9,931
per month for the
20,000
square foot facility.
In January 2001, we entered into a lease agreement with S&C for a sales center facility in Oklahoma City, Oklahoma. The ten year lease term commenced on November 10, 2001. In August 2011, S&C sold this facility to an unrelated third party and we executed a lease agreement with the new landlord.
In March 1997, we entered into a lease agreement with Mr. St. Romain for a sales center facility in Baton Rouge, Louisiana. In March 2007, we extended this lease for a third term of five years. In September 2011, Mr. St. Romain sold this facility to an unrelated third party and we executed a lease agreement with the new landlord.
The table below presents rent expense associated with these leases for the past three years (in thousands):
|
|
2012
|
2011
|
2010
|
|||||||||
|
NCC
|
$
|
937
|
|
$
|
923
|
|
$
|
835
|
|
|||
|
Other
|
183
|
|
405
|
|
469
|
|
||||||
|
Total
|
$
|
1,120
|
|
$
|
1,328
|
|
$
|
1,304
|
|
|||
We offer a 401(k) savings and retirement plan, which provides benefits for substantially all employees who meet length of service requirements. Eligible employees are able to contribute up to
75%
of their compensation, subject to the federal dollar limit. For plan participants, we provide a matching contribution. We contribute a total match on employee contributions of up to
4%
of their compensation, with a
100%
match on the first
3%
of compensation deferred and a
50%
match on deferrals between
3%
and
5%
of compensation.
We have a nonqualified deferred compensation plan that allows certain employees who occupy key management positions to defer salary and bonus amounts. This plan also provides a matching contribution similar to that provided under our 401(k) plan to the extent that a participant’s contributions to the 401(k) plan are limited by IRS deferral and compensation limitations. The total combined company matching contribution provided to a participant under the 401(k) plan and the nonqualified deferred compensation plan for any one year may not exceed 4% of a participant’s salary and bonus. The employee and company matching contributions are invested in certain equity and fixed income securities based on individual employee elections.
62
The table below sets forth our matching contributions for the past three years (in thousands):
|
|
2012
|
2011
|
2010
|
|||||||||
|
Matching contributions - 401(k)
|
$
|
4,589
|
|
$
|
4,015
|
|
$
|
3,600
|
|
|||
|
Matching contributions - deferred compensation plan
|
262
|
|
59
|
|
18
|
|
||||||
The table below summarizes the unaudited quarterly results of operations for the past two years (in thousands, except per share data):
|
|
Quarter
|
||||||||||||||||||||||||||||||
|
|
2012
|
2011
|
|||||||||||||||||||||||||||||
|
|
First
|
Second
|
Third
|
Fourth
|
First
|
Second
|
Third
|
Fourth
|
|||||||||||||||||||||||
|
Net sales
|
$
|
361,954
|
|
$
|
757,175
|
|
$
|
528,027
|
|
$
|
306,818
|
|
$
|
312,889
|
|
$
|
706,423
|
|
$
|
503,584
|
|
$
|
270,422
|
|
|||||||
|
Gross profit
|
104,563
|
|
222,405
|
|
151,501
|
|
88,938
|
|
91,410
|
|
211,439
|
|
147,906
|
|
80,835
|
|
|||||||||||||||
|
Net income (loss)
|
3,651
|
|
64,943
|
|
21,375
|
|
(7,997
|
)
|
(638
|
)
|
58,577
|
|
24,169
|
|
(10,115
|
)
|
|||||||||||||||
|
Earnings (loss) per share:
|
|
|
|
|
|
|
|
|
|
|
|
|
|||||||||||||||||||
|
Basic
|
$
|
0.08
|
|
$
|
1.38
|
|
$
|
0.46
|
|
$
|
(0.17
|
)
|
$
|
(0.01
|
)
|
$
|
1.21
|
|
$
|
0.50
|
|
$
|
(0.21
|
)
|
|||||||
|
Diluted
|
$
|
0.08
|
|
$
|
1.34
|
|
$
|
0.45
|
|
$
|
(0.17
|
)
|
$
|
(0.01
|
)
|
$
|
1.19
|
|
$
|
0.50
|
|
$
|
(0.21
|
)
|
|||||||
The sum of basic and diluted earnings per share for each of the quarters may not equal the total basic and diluted earnings per share for the annual periods because of rounding differences and a difference in the way that in-the-money stock options are considered from quarter to quarter.
The above amounts include the $6.9 million goodwill impairment charge recorded in the third quarter of 2012 and the $1.6 million goodwill impairment charge recorded in the fourth quarter of 2011.
63
Not applicable.
The term “disclosure controls and procedures” is defined in Rules 13a-15(e) and 15d-15(e) of the Securities Exchange Act of 1934 (the Act). The rules refer to the controls and other procedures designed to ensure that information required to be disclosed in reports that we file or submit under the Act is (1) recorded, processed, summarized and reported within the time periods specified in the Commission’s rules and forms and (2) accumulated and communicated to our management, including our principal executive officer and principal financial officer, as appropriate to allow timely decisions regarding required disclosure. As of
December 31, 2012
, management, including the CEO and CFO, performed an evaluation of the effectiveness of our disclosure controls and procedures. Based on that evaluation, management, including the CEO and CFO, concluded that as of
December 31, 2012
, our disclosure controls and procedures were effective.
We maintain a system of internal control over financial reporting that is designed to provide reasonable assurance regarding the reliability of financial reporting and the preparation of financial statements for external purposes in accordance with U.S. generally accepted accounting principles. Based on the most recent evaluation, we have concluded that no change in our internal control over financial reporting occurred during the last fiscal quarter that has materially affected, or is reasonably likely to materially affect, our internal control over financial reporting.
64
Management’s Report on Internal Control Over Financial Reporting
POOL’s management is responsible for establishing and maintaining adequate internal control over financial reporting, as defined in Rules 13a-15(f) and 15d-15(f) under the Securities Exchange Act of 1934, as amended. Our internal control system was designed to provide reasonable assurance regarding the reliability of financial reporting and the preparation of published financial statements. All internal control systems, no matter how well designed, have inherent limitations. Therefore, even those systems determined to be effective can provide only reasonable assurance with respect to financial statement preparation and presentation. Any evaluation or projection of effectiveness to future periods is also subject to risk that controls may become inadequate due to changes in conditions, or that the degree of compliance with the policies or procedures may deteriorate.
POOL’s management assessed the effectiveness of our internal control over financial reporting as of December 31, 2012. In making this assessment, management used the criteria set forth by the Committee of Sponsoring Organizations of the Treadway Commission (COSO) in
Internal Control-Integrated Framework.
Based on this assessment, management has concluded that, as of December 31, 2012, POOL’s internal control over financial reporting was effective.
The independent registered public accounting firm that audited the Consolidated Financial Statements included in Item 8 of this Form 10-K has issued a report on POOL’s internal control over financial reporting. This report appears below.
65
Report of Independent Registered Public Accounting Firm
The Board of Directors and Shareholders
Pool Corporation
We have audited Pool Corporation’s internal control over financial reporting as of December 31, 2012, based on criteria established in
Internal Control—Integrated Framework
issued by the Committee of Sponsoring Organizations of the Treadway Commission (the COSO criteria). Pool Corporation’s management is responsible for maintaining effective internal control over financial reporting, and for its assessment of the effectiveness of internal control over financial reporting included in the accompanying Management’s Report on Internal Control Over Financial Reporting. Our responsibility is to express an opinion on Pool Corporation’s internal control over financial reporting based on our audit.
We conducted our audit in accordance with the standards of the Public Company Accounting Oversight Board (United States). Those standards require that we plan and perform the audit to obtain reasonable assurance about whether effective internal control over financial reporting was maintained in all material respects. Our audit included obtaining an understanding of internal control over financial reporting, assessing the risk that a material weakness exists, testing and evaluating the design and operating effectiveness of internal control based on the assessed risk, and performing such other procedures as we considered necessary in the circumstances. We believe that our audit provides a reasonable basis for our opinion.
A company’s internal control over financial reporting is a process designed to provide reasonable assurance regarding the reliability of financial reporting and the preparation of financial statements for external purposes in accordance with generally accepted accounting principles. A company’s internal control over financial reporting includes those policies and procedures that (1) pertain to the maintenance of records that, in reasonable detail, accurately and fairly reflect the transactions and dispositions of the assets of the company; (2) provide reasonable assurance that transactions are recorded as necessary to permit preparation of financial statements in accordance with generally accepted accounting principles, and that receipts and expenditures of the company are being made only in accordance with authorizations of management and directors of the company; and (3) provide reasonable assurance regarding prevention or timely detection of unauthorized acquisition, use, or disposition of the company’s assets that could have a material effect on the financial statements.
Because of its inherent limitations, internal control over financial reporting may not prevent or detect misstatements. Also, projections of any evaluation of effectiveness to future periods are subject to the risk that controls may become inadequate because of changes in conditions, or that the degree of compliance with the policies or procedures may deteriorate.
In our opinion, Pool Corporation maintained, in all material respects, effective internal control over financial reporting as of December 31, 2012, based on the COSO criteria.
We also have audited, in accordance with the standards of the Public Company Accounting Oversight Board (United States), the consolidated balance sheets of Pool Corporation as of December 31, 2012 and 2011, and the related consolidated statements of income, comprehensive income, stockholders’ equity, and cash flows of Pool Corporation for each of the three years in the period ended December 31, 2012, and our report dated March 1, 2013 expressed an unqualified opinion thereon.
New Orleans, Louisiana
March 1, 2013
66
Not applicable.
Incorporated by reference to POOL’s
2013
Proxy Statement to be filed with the SEC.
Incorporated by reference to POOL’s
2013
Proxy Statement to be filed with the SEC.
Incorporated by reference to POOL’s
2013
Proxy Statement to be filed with the SEC.
Incorporated by reference to POOL’s
2013
Proxy Statement to be filed with the SEC.
Incorporated by reference to POOL’s
2013
Proxy Statement to be filed with the SEC.
67
|
(a)
|
The following documents are filed as part of this report:
|
|
(1)
|
Consolidated Financial Statements:
|
|
|
|
|
Page
|
|
|
||
|
|
||
|
|
||
|
|
||
|
|
||
|
|
||
|
|
|
|
|
(2)
|
Financial Statement Schedules.
|
|
|
|
|
|
|
|
All schedules are omitted because they are not applicable or are not required or because the required information is provided in our Consolidated Financial Statements or accompanying Notes included in Item 8 of this Form 10-K.
|
|
|
|
|
|
|
(3)
|
The exhibits listed in the Index to Exhibits.
|
|
68
SIGNATURES
Pursuant to the requirements of Section 13 or 15(d) of the Securities Exchange Act of 1934, the registrant has duly caused this report to be signed on its behalf by the undersigned, thereunto duly authorized on
March 1, 2013
.
|
|
POOL CORPORATION
|
|
|
|
|
|
|
|
|
|
|
By:
|
/s/ WILSON B. SEXTON
|
|
|
Wilson B. Sexton, Chairman of the Board
|
|
|
and Director
|
Pursuant to the requirements of the Securities Exchange Act of 1934, this report has been signed below by the following persons on behalf of the registrant in the capacities indicated on
March 1, 2013
.
|
Signature:
|
Title:
|
|
|
|
|
/s/ WILSON B. SEXTON
|
|
|
Wilson B. Sexton
|
Chairman of the Board and Director
|
|
|
|
|
/s/ MANUEL J. PEREZ DE LA MESA
|
|
|
Manuel J. Perez de la Mesa
|
President, Chief Executive Officer and Director
|
|
|
|
|
/s/ MARK W. JOSLIN
|
|
|
Mark W. Joslin
|
Vice President and Chief Financial Officer
|
|
|
|
|
/s/ MELANIE M. HOUSEY
|
|
|
Melanie M. Housey
|
Corporate Controller and Chief Accounting Officer
|
|
|
|
|
/s/ ANDREW W. CODE
|
|
|
Andrew W. Code
|
Director
|
|
|
|
|
/s/ JAMES J. GAFFNEY
|
|
|
James J. Gaffney
|
Director
|
|
|
|
|
/s/ GEORGE T. HAYMAKER
|
|
|
George T. Haymaker
|
Director
|
|
|
|
|
/s/ HARLAN F. SEYMOUR
|
|
|
Harlan F. Seymour
|
Director
|
|
|
|
|
/s/ ROBERT C. SLEDD
|
|
|
Robert C. Sledd
|
Director
|
|
|
|
|
/s/ JOHN E. STOKELY
|
|
|
John E. Stokely
|
Director
|
69
INDEX TO EXHIBITS
|
|
|
|
|
|
|
Incorporated by Reference
|
||||
|
No.
|
|
Description
|
|
Filed
with this
Form 10-K
|
|
Form
|
|
File No.
|
|
Date Filed
|
|
3.1
|
|
Restated Certificate of Incorporation of the Company.
|
|
|
|
10-Q
|
|
000-26640
|
|
08/09/2006
|
|
3.2
|
|
Restated Composite Bylaws of the Company.
|
|
|
|
8-K
|
|
000-26640
|
|
12/20/2012
|
|
4.1
|
|
Form of certificate representing shares of common stock of the Company.
|
|
|
|
8-K
|
|
000-26640
|
|
05/19/2006
|
|
10.1
|
*
|
Amended and Restated Non-Employee Directors Equity Incentive Plan,
|
|
|
|
10-Q
|
|
000-26640
|
|
08/13/2001
|
|
10.2
|
*
|
as amended by Amendment No. 1.
|
|
|
|
10-Q
|
|
000-26640
|
|
07/25/2002
|
|
10.3
|
*
|
SCP Pool Corporation 1998 Stock Option Plan.
|
|
|
|
DEF 14A
|
|
000-26640
|
|
04/08/1998
|
|
10.4
|
*
|
Form of Stock Option Agreement under 1998 Stock Option Plan.
|
|
|
|
10-K
|
|
000-26640
|
|
03/31/1999
|
|
10.5
|
*
|
Amended and Restated SCP Pool Corporation Employee Stock Purchase Plan.
|
|
|
|
10-Q
|
|
000-26640
|
|
07/25/2002
|
|
10.6
|
*
|
Amended and Restated SCP Pool Corporation 2002 Long-Term Incentive Plan.
|
|
|
|
10-K
|
|
000-26640
|
|
03/01/2005
|
|
10.7
|
*
|
Form of Stock Option Agreement under 2002 Long‑Term Incentive Plan.
|
|
|
|
10-K
|
|
000-26640
|
|
03/01/2005
|
|
10.8
|
*
|
Pool Corporation Amended and Restated 2007 Long‑Term Incentive Plan.
|
|
|
|
8-K
|
|
000-26640
|
|
05/09/2009
|
|
10.9
|
*
|
Form of Stock Option Agreement for Employees under the Amended and Restated 2007 Long‑Term Incentive Plan.
|
|
|
|
8-K
|
|
000-26640
|
|
05/06/2009
|
|
10.10
|
*
|
Form of Restricted Stock Agreement for Employees under the Amended and Restated 2007 Long‑Term Incentive Plan.
|
|
|
|
8-K
|
|
000-26640
|
|
05/06/2009
|
|
10.11
|
*
|
Form of Stock Option Agreement for Directors under the Amended and Restated 2007 Long‑Term Incentive Plan.
|
|
|
|
8-K
|
|
000-26640
|
|
05/06/2009
|
|
10.12
|
*
|
Form of Restricted Stock Agreement for Directors under the Amended and Restated 2007 Long Term Incentive Plan.
|
|
|
|
8-K
|
|
000-26640
|
|
05/06/2009
|
|
10.13
|
*
|
Form of Employment Agreement.
|
|
|
|
10-K
|
|
000-26640
|
|
03/18/2003
|
|
10.14
|
*
|
Employment Agreement, dated January 25, 1999, among SCP Pool Corporation, South Central Pool Supply, Inc. and Manuel J. Perez de la Mesa.
|
|
|
|
10-K
|
|
000-26640
|
|
03/31/1999
|
|
10.15
|
*
|
Employment Agreement, dated January 17, 2003, between SCP Distributors, LLC and
A. David Cook.
|
|
|
|
10-K
|
|
000-26640
|
|
03/01/2005
|
|
10.16
|
*
|
Employment Agreement, dated January 17, 2003, between SCP Distributors, LLC and
Stephen C. Nelson.
|
|
|
|
10-K
|
|
000-26640
|
|
03/01/2005
|
|
10.17
|
*
|
Compensation of Non-Employee Directors.
|
|
|
|
10-K
|
|
000-26640
|
|
03/01/2010
|
|
10.18
|
*
|
Form of Indemnity Agreement for Directors and Officers.
|
|
|
|
10-Q
|
|
000-26640
|
|
10/29/2004
|
|
10.19
|
|
Lease Agreement (Mandeville Warehouse) entered into as of January 16, 2002, by and between S&C Development Company, LLC and SCP Distributors, LLC, as amended by First Amendment entered into as of February 11, 2002 by and between S&C Development Company, LLC and SCP Distributors, LLC,
|
|
|
|
10-Q
|
|
000-26640
|
|
07/30/2004
|
70
|
|
|
|
|
|
|
Incorporated by Reference
|
||||
|
No.
|
|
Description
|
|
Filed
with this
Form 10-K
|
|
Form
|
|
File No.
|
|
Date Filed
|
|
10.20
|
|
as amended by Second Amendment entered into as of January 16, 2007 by and between S&C Development Company, LLC and SCP Distributors, LLC.
|
|
|
|
10-K
|
|
000-26640
|
|
03/01/2007
|
|
10.21
|
|
Lease (Oklahoma City Sales Center) entered into as of January 15, 2001, by and between Dave Cook, individually and SCP Pool Corporation, as amended by First Amendment, entered into as of October 24, 2001 by and between S&C Development, LLC and SCP Pool Corporation, as amended by First Amendment, entered into, as of December 5, 2001 by and between S&C Development, LLC and SCP Pool Corporation.
|
|
|
|
10-Q
|
|
000-26640
|
|
07/30/2004
|
|
10.22
|
*
|
Form of Stock Option Agreement under the Non‑employee Directors Equity Incentive Plan.
|
|
|
|
10-K
|
|
000-26640
|
|
03/01/2005
|
|
10.23
|
*
|
Nonqualified Deferred Compensation Plan Basic Plan Document, dated March 1, 2005.
|
|
|
|
10-Q
|
|
000-26640
|
|
04/29/2005
|
|
10.24
|
*
|
Nonqualified Deferred Compensation Plan Adoption Agreement by and among SCP Distributors, L.L.C., Superior Pool Products, L.L.C. and Cypress, Inc., dated March 1, 2005.
|
|
|
|
10-Q
|
|
000-26640
|
|
04/29/2005
|
|
10.25
|
|
Trust Agreement by and among SCP Distributors, L.L.C., Superior Pool Products, L.L.C. and Cypress, Inc. and T. Rowe Price Trust Company, dated March 1, 2005.
|
|
|
|
10-Q
|
|
000-26640
|
|
04/29/2005
|
|
10.26
|
|
Note Purchase Agreement by and among Pool Corporation and the Purchasers party thereto.
|
|
|
|
8-K
|
|
000-26640
|
|
02/15/2007
|
|
10.27
|
|
Subsidiary Guaranty by Pool Corporation in favor of the holders from time to time of the Notes.
|
|
|
|
8-K
|
|
000-26640
|
|
02/15/2007
|
|
10.28
|
|
Amended and Restated Credit Agreement dated as of December 20, 2007, among Pool Corporation, as US Borrower, SCP Distributors Inc., as Canadian Borrower, the Lenders, Wachovia Bank, National Association, as Administrative Agent, Swingline Lender and Issuing Lender, Wachovia Capital Finance Corporation (Canada) as Canadian Dollar Lender, JPMorgan Chase Bank, a syndication Agent, Wells Fargo Bank National Association, Regions Bank and Capital One, National Association, as Documentation Agents,
|
|
|
|
10-K
|
|
000-26640
|
|
02/29/2008
|
|
10.29
|
|
as amended by First Amendment entered into as of March 1, 2010.
|
|
|
|
10-K
|
|
000-26640
|
|
03/01/2010
|
|
10.30
|
|
Amended and Restated Subsidiary Guaranty Agreement dated as of December 20, 2007.
|
|
|
|
10-K
|
|
000-26640
|
|
02/29/2008
|
|
10.31
|
*
|
2008 Strategic Plan Incentive Program (SPIP).
|
|
|
|
8-K
|
|
000-26640
|
|
03/03/2008
|
|
10.32
|
*
|
Pool Corporation Executive Bonus Plan.
|
|
|
|
10-K
|
|
000-26640
|
|
03/01/2010
|
|
10.33
|
|
Credit Agreement dated as of October 19, 2011, among Pool Corporation, as US Borrower, SCP Distributors Canada Inc., as Canadian Borrower, SCP Pool B.V., as Dutch Borrower, the Lenders, Wells Fargo Bank, National Association, as Administrative Agent, Swingline Lender and Issuing Lender, JPMorgan Chase Bank, N.A., as Syndication Agent, Wells Fargo Securities, LLC and J.P. Morgan Securities, LLC, as joint Lead Arrangers and joint Bookrunners, Bank of America, N.A., Regions Bank and Capital One, N.A., as Documentation Agents, and Branch Banking and Trust Company, Comerica Bank and Union Bank, N.A.
|
|
|
|
10-Q
|
|
000-26640
|
|
10/31/2011
|
71
|
|
|
|
|
|
|
Incorporated by Reference
|
||||
|
No.
|
|
Description
|
|
Filed
with this
Form 10-K
|
|
Form
|
|
File No.
|
|
Date Filed
|
|
14
|
|
Code of Business Conduct and Ethics for Directors, Officers and Employees.
|
|
|
|
10-K
|
|
000-26640
|
|
03/01/2004
|
|
|
Subsidiaries of the registrant.
|
|
X
|
|
|
|
|
|
|
|
|
|
Consent of Ernst & Young LLP.
|
|
X
|
|
|
|
|
|
|
|
|
|
Certification by Mark W. Joslin pursuant to Rule 13a-14(a) and 15d-14(a), as adopted pursuant to Section 302 of the Sarbanes-Oxley Act of 2002.
|
|
X
|
|
|
|
|
|
|
|
|
|
Certification by Manuel J. Perez de la Mesa pursuant to Rule 13a-14(a) and 15d-14(a), as adopted pursuant to Section 302 of the Sarbanes-Oxley Act of 2002.
|
|
X
|
|
|
|
|
|
|
|
|
|
Certification by Manuel J. Perez de la Mesa and Mark W. Joslin pursuant to 18 U.S.C. Section 1350, as adopted pursuant to Section 906 of the Sarbanes-Oxley Act of 2002.
|
|
X
|
|
|
|
|
|
|
|
|
101.INS
|
+
|
XBRL Instance Document
|
|
X
|
|
|
|
|
|
|
|
101.SCH
|
+
|
XBRL Taxonomy Extension Schema Document
|
|
X
|
|
|
|
|
|
|
|
101.CAL
|
+
|
XBRL Taxonomy Extension Calculation Linkbase Document
|
|
X
|
|
|
|
|
|
|
|
101.DEF
|
+
|
XBRL Taxonomy Extension Definition Linkbase Document
|
|
X
|
|
|
|
|
|
|
|
101.LAB
|
+
|
XBRL Taxonomy Extension Label Linkbase Document
|
|
X
|
|
|
|
|
|
|
|
101.PRE
|
+
|
XBRL Taxonomy Extension Presentation Linkbase Document
|
|
X
|
|
|
|
|
|
|
|
*
|
Indicates a management contract or compensatory plan or arrangement
|
|
+
|
Attached as Exhibit 101 to this report are the following items formatted in XBRL (Extensible Business Reporting Language):
|
|
1.
|
Consolidated Statements of Income for the
years ended December 31, 2012, December 31, 2011 and December 31, 2010
;
|
|
2.
|
Consolidated Statements of Comprehensive Income for the
years ended December 31, 2012, December 31, 2011 and December 31, 2010
;
|
|
3.
|
Consolidated Balance Sheets at
December 31, 2012 and December 31, 2011
;
|
|
4.
|
Consolidated Statements of Cash Flows for the
years ended December 31, 2012, December 31, 2011 and December 31, 2010
;
|
|
5.
|
Consolidated Statements of Changes in Stockholders’ Equity for
years ended December 31, 2012, December 31, 2011 and December 31, 2010
; and
|
|
6.
|
Notes to Consolidated Financial Statements.
|
72
TABLE OF CONTENTS
Part IItem 1. BusinessItem 1A. Risk FactorsItem 1B. Unresolved Staff CommentsItem 2. PropertiesItem 3. Legal ProceedingsItem 4. Mine Safety DisclosuresPart IIItem 5. Market For Registrant S Common Equity, Related Stockholder Matters and Issuer Purchases Of Equity SecuritiesItem 6. Selected Financial DataItem 7. Management S Discussion and Analysis Of Financial Condition and Results Of OperationsItem 7A. Quantitative and Qualitative Disclosures About Market RiskItem 8. Financial Statements and Supplementary DataNote 1 - Organization and Summary Of Significant Accounting PoliciesNote 2 - AcquisitionsNote 3 - Goodwill and Other Intangible AssetsNote 4 - Details Of Certain Balance Sheet AccountsNote 5 - DebtNote 6 - Share-based CompensationNote 7 - Income TaxesNote 8 - Earnings Per ShareNote 9 - Commitments and ContingenciesNote 10 - Related Party TransactionsNote 11 - Employee Benefit PlansNote 12 - Quarterly Financial Data (unaudited)Item 9. Changes in and Disagreements with Accountants on Accounting and Financial DisclosureItem 9A. Controls and ProceduresItem 9B. Other InformationPart IIIItem 10. Directors, Executive Officers and Corporate GovernanceItem 11. Executive CompensationItem 12. Security Ownership Of Certain Beneficial Owners and Management and Related Stockholder MattersItem 13. Certain Relationships and Related Transactions, and Director IndependenceItem 14. Principal Accounting Fees and ServicesPart IVItem 15. Exhibits, Financial Statement Schedules