PILGRIMS PRIDE CORP
10-Ks and 10-Qs
|
|
|
|
|
|
|
|
|
|
|
|
|
|
|
|
|
|
|
|
|
|
|
|
|
|
|
|
|
|
|
|
|
|
|
|
|
|
|
|
|
|
|
|
|
|
|
|
|
|
|
|
|
|
|
|
|
|
|
|
|
|
|
|
|
UNITED STATES
SECURITIES AND EXCHANGE COMMISSION
Washington, D.C. 20549
|
FORM 10-K
|
||||
(Mark One)
|
x
|
ANNUAL REPORT PURSUANT TO SECTION 13 OR 15(d) OF THE SECURITIES EXCHANGE ACT OF 1934
|
For the fiscal year ended
December 31, 2017
OR
o
TRANSITION REPORT PURSUANT TO SECTION 13 OR 15(d) OF THE SECURITIES EXCHANGE ACT OF 1934
For the transition period from
to
Commission File number
1-9273
PILGRIM’S PRIDE CORPORATION
(Exact name of registrant as specified in its charter)
|
Delaware
|
75-1285071
|
|
(State or other jurisdiction of
incorporation or organization)
|
(I.R.S. Employer Identification No.)
|
|
1770 Promontory Circle, Greeley, Colorado
|
80634-9038
|
|
(Address of principal executive offices)
|
(Zip code)
|
Registrant’s telephone number, including area code:
(970) 506-8000
Securities registered pursuant to Section 12(b) of the Act:
|
Title of each class
|
Name of each exchange on which registered
|
|
Common Stock, Par Value $0.01
|
The NASDAQ Stock Market LLC
|
Securities registered pursuant to Section 12(g) of the Act: None
Indicate by check mark if the registrant is a well-known seasoned issuer, as defined in Rule 405 of the Securities Act. Yes
x
No
o
Indicate by check mark if the registrant is not required to file reports pursuant to Section 13 or Section 15(d) of the Exchange Act. Yes
o
No
x
Indicate by check mark whether the Registrant (1) has filed all reports required to be filed by Section 13 or 15(d) of the Securities Exchange Act of 1934 during the preceding 12 months (or for such shorter period that the Registrant was required to file such reports), and (2) has been subject to such filing requirements for the past 90 days. Yes
x
No
o
Indicate by check mark whether the registrant has submitted electronically and posted on its corporate Website, if any, every Interactive Data File required to be submitted and posted pursuant to Rule 405 of Regulation S-T (§232.405 of this chapter) during the preceding 12 months (or for such shorter period that the registrant was required to submit and post such files). Yes
x
No
o
Indicate by check mark if disclosure of delinquent filers pursuant to Item 405 of Regulation S-K is not contained herein, and will not be contained, to the best of Registrant’s knowledge, in definitive proxy or information statements incorporated by reference in Part III of this Form 10-K or any amendment to this Form 10-K.
x
Indicate by check mark whether the registrant is a large accelerated filer, an accelerated filer, a non-accelerated filer, a smaller reporting company, or an emerging growth company. See the definitions of “large accelerated filer,” “accelerated filer,” “smaller reporting company,” and “emerging growth company” in Rule 12b-2 of the Exchange Act.
|
Large Accelerated Filer
|
x
|
|
Accelerated Filer
|
|
o
|
|
Non-accelerated Filer
|
o
(Do not check if a smaller reporting company)
|
|
Smaller reporting company
|
|
o
|
|
Emerging growth company
|
o
|
||||
If an emerging growth company, indicate by check mark if the registrant has elected not to use the extended transition period for complying with any new or revised financial accounting standards provided pursuant to Section 13(a) of the Exchange Act.
o
Indicate by check mark whether the registrant is a shell company (as defined in Rule 12b-2 of the Exchange Act). Yes
o
No
x
The aggregate market value of the Registrant’s Common Stock, $0.01 par value, held by non-affiliates of the Registrant as of June 25, 2017 was
$1,203,667,109.
For purposes of the foregoing calculation only, all directors, executive officers and greater than 10% beneficial owners have been deemed affiliates. Number of shares of the Registrant’s Common Stock outstanding as of
February 14, 2018
was 248,752,508.
DOCUMENTS INCORPORATED BY REFERENCE
Portions of the Company’s Proxy Statement for the 2018 Annual Meeting of Stockholders are incorporated by reference into Part III of this annual report.
PILGRIM’S PRIDE CORPORATION
FORM 10-K
TABLE OF CONTENTS
|
PART I
|
Page
|
|
|
Item 1.
|
||
|
Item 1A.
|
||
|
Item 1B.
|
||
|
Item 2.
|
||
|
Item 3.
|
||
|
Item 4.
|
||
|
PART II
|
||
|
Item 5.
|
||
|
Item 6.
|
||
|
Item 7.
|
||
|
Item 7A.
|
||
|
Item 8.
|
||
|
Item 9.
|
||
|
Item 9A.
|
||
|
PART III
|
||
|
Item 10.
|
||
|
Item 11.
|
||
|
Item 12.
|
||
|
Item 13.
|
||
|
Item 14.
|
||
|
PART IV
|
||
|
Item 15.
|
||
i
Forward Looking Statements and Explanatory Note
Certain written and oral statements made by our Company and subsidiaries of our Company may constitute “forward-looking statements” as defined under the Private Securities Litigation Reform Act of 1995. This includes statements made herein, in our other filings with the Securities and Exchange Commission (“SEC”), in press releases, and in certain other oral and written presentations.
Statements of our intentions, beliefs, expectations or predictions for the future, denoted by the words “anticipate,” “believe,” “estimate,” “expect,” “plan,” “project,” “imply,” “intend,” “should,” “foresee” and similar expressions, are forward-looking statements that reflect our current views about future events and are subject to risks, uncertainties and assumptions. Such risks, uncertainties and assumptions include those described under “Risk Factors” below and elsewhere in this annual report.
Actual results could differ materially from those projected in these forward-looking statements as a result of these factors, among others, many of which are beyond our control.
In making these statements, we are not undertaking, and specifically decline to undertake, any obligation to address or update each or any factor in future filings or communications regarding our business or results, and we are not undertaking to address how any of these factors may have caused changes in information contained in previous filings or communications. The risks described below are not the only risks we face, and additional risks and uncertainties may also impair our business operations. The occurrence of any one or more of the following or other currently unknown factors could materially adversely affect our business and operating results.
Item 1.
Business
Company Overview
Pilgrim’s Pride Corporation (referred to herein as “Pilgrim’s,” “PPC,” “the Company,” “we,” “us,” “our,” or similar terms), which was incorporated in Texas in 1968 and reincorporated in Delaware in 1986, is the successor to a partnership founded in 1946 as a retail feed store. JBS S.A., through its indirect wholly-owned subsidiaries (together, “JBS”), beneficially owns 78.6% of our outstanding common stock. We are one of the largest chicken producers in the world with operations in the United States (“U.S.”), the United Kingdom (“U.K.”), Mexico, France, Puerto Rico, and the Netherlands. We are primarily engaged in the production, processing, marketing and distribution of fresh, frozen and value-added chicken products to retailers, distributors and foodservice operators. We offer a wide range of products to our customers through strong national and international distribution channels. Pilgrim's fresh chicken products consist of refrigerated (non-frozen) whole chickens, whole cut-up chickens and selected chicken parts that are either marinated or non-marinated. The Company's prepared chicken products include fully cooked, ready-to-cook and individually frozen chicken parts, strips, nuggets and patties, some of which are either breaded or non-breaded and either marinated or non-marinated, ready-to-eat meals, multi-protein frozen foods, vegetarian foods and desserts.
We market our balanced portfolio of fresh, prepared and value-added chicken products to a diverse set of over 5,500 customers across the U.S., the U.K., Mexico and in approximately
100
other countries, with no single customer accounting for more than 10% of total sales. We have become a valuable partner to our customers and a recognized industry leader by consistently providing high-quality products and services designed to meet their needs and enhance their business. Our sales efforts are largely targeted towards the foodservice industry, principally chain restaurants and food processors, such as Chick-fil-A
®
and retail customers, including grocery store chains and wholesale clubs, such as Kroger
®
, Costco®, Publix®, and H-E-B®.
As a vertically integrated company, we control every phase of the production process, which helps us better manage food safety and quality, as well as more effectively control margins and improve customer service. As of December 31, 2017, we operate feed mills, hatcheries, processing plants and distribution centers in 14 U.S. states, the U.K., Europe, Mexico and Puerto Rico. Our plants are strategically located to ensure that customers timely receive fresh products. With our global network of approximately 5,200 growers, 39 feed mills, 50 hatcheries, 36 processing plants, 16 prepared foods cook plants, 20 distribution centers, nine rendering facilities and four pet food plants, we believe we are well-positioned to supply the growing demand for our products.
Our U.K. and Europe segment reflects the operations of Granite Holdings Sàrl and its subsidiaries (together, “Moy Park”), which we acquired on September 8, 2017. Moy Park is a leading and highly regarded U.K. food company, providing fresh, high quality and locally farmed poultry and convenience food products. Moy Park has operated in the U.K. and Europe retail market for over 50 years and delivers a range of fresh, ready-to-cook, coated and ready-to-eat poultry products to major retailers and large
1
foodservice customers throughout the United Kingdom, Ireland, France and The Netherlands. We believe that we operate one of the most efficient business models for chicken production in the U.K. and Europe.
We are one of the largest, and we believe one of the most efficient, producers and sellers of chicken in Mexico. Our presence in Mexico provides access to a market with growing demand and has enabled us to leverage our operational strengths within the region. The market for chicken products in Mexico is still developing, with most sales attributed to fresh, commodity-oriented, market price-based business. Additionally, we are an important player in the live market in Mexico. We believe our Mexico business is well-positioned to continue benefiting from these trends in the Mexican consumer market.
As of December 31, 2017, we have approximately
51,300
employees and have the capacity to process more than
45.2
million birds per week for a total of more than
13.3
billion pounds of live chicken annually. In 2017, we produced
10.0 billion
pounds of chicken products, generating approximately
$10.8 billion
in net sales and approximately
$694.6 million
in net income attributable to Pilgrim’s.
On June 29, 2015, we acquired 100% of the equity of Provemex Holdings, LLC and its subsidiaries (together, “Tyson Mexico”) from Tyson Foods, Inc. and certain of its subsidiaries. Tyson Mexico is a vertically integrated poultry business based in Gómez Palacio, Durango, Mexico. The acquired business had a production capacity of
2.9 million
birds per week in its three plants and employed approximately
4,400
people at the time of acquisition. The acquisition further strengthened our strategic position in the Mexico chicken market. The Tyson Mexico operations are included in our Mexico segment.
On January 6, 2017, we acquired
100%
of the membership interests of GNP from Maschhoff Family Foods, LLC for a cash purchase price of
$350 million
, subject to customary working capital adjustments. GNP is a vertically integrated poultry business based in St. Cloud, Minnesota. The acquired business had a production capacity of
2.1 million
birds per five-day work week in its
two
plants and employed approximately
1,500
people at the time of acquisition. The plants are located in geographic areas where Pilgrim’s did not have a presence, providing Pilgrim’s the opportunity to expand its production and customer bases. We plan to continue to leverage GNP’s operations to enhance production efficiencies. Also, the addition of GNP’s Just Bare® product lines join our existing no-antibiotics-ever and organic production capabilities, strengthening our footprint in fast-growing and higher-margin chicken segments. This acquisition further strengthens the Company’s strategic position in the U.S. chicken market. The GNP operations are included in our U.S. segment.
On September 8, 2017, we acquired
100%
of the issued and outstanding shares of Granite Holdings Sàrl and its subsidiaries (together, “Moy Park”) from JBS S.A. for a cash purchase price of
$301.3 million
and a note payable to the seller in the amount of
£562.5 million
. Moy Park is one of the top-ten food companies in the U.K., Northern Ireland's largest private sector business and one of Europe's leading poultry producers. With
4
fresh processing plants, 10 prepared foods cook plants, 3 feed mills, 7 hatcheries and 1 rendering facility in the U.K., France, and The Netherlands, the acquired business processes
6.0
million birds per seven-day work week, in addition to producing around
456.0 million
pounds of prepared foods per year. Moy Park currently has approximately
10,200
employees. The plants are located in geographic areas where Pilgrim’s is not currently present, providing Pilgrim’s the opportunity to expand its production and customer bases. The Moy Park operations constitutes our U.K. and Europe segment.
We operate on the basis of a 52/53-week fiscal year that ends on the Sunday falling on or before December 31. Any reference we make to a particular year (for example, 2017) applies to our fiscal year and not the calendar year. Fiscal 2017 was a 53-week fiscal year.
Our Industry
Industry Overview
The U.S. consumes more chicken than any other protein (approximately
35.3 billion
pounds projected in calendar year 2018 according to the U.S. Department of Agriculture (“USDA”)), and chicken is the second most consumed protein globally after pork. The U.S. is the world’s largest producer of chicken and is projected to produce approximately
42.0 billion
pounds of ready-to-cook broiler meat in calendar year 2018, representing
20.8%
of the total world production. Broilers are tender, young chickens suitable for broiling or roasting. Brazil and China produce the second and third most broiler meat, with
14.8%
and
12.1%
of the world market, respectively, according to the USDA.
According to the USDA, the export of U.S. chicken products increased at an average annual growth rate of
1.3%
from 2007 through 2017. The U.S. is the second-largest exporter of broiler meat behind Brazil. The U.S. is projected to export
6.9 billion
pounds in calendar year 2018, which would account for
27.9%
of the total world exports and
16.8%
of the total U.S. production, according to the USDA. The top five exporters are projected to control over
85.7%
of the market in 2018.
2
According to the USDA, chicken production in the U.S. increased from 2007 through 2017 at a compounded annual growth rate of
1.2%
. The growth in chicken demand is attributable to (i) relative affordability compared to other proteins such as beef and pork, (ii) the increasingly health conscious nature of U.S. consumers, (iii) chicken’s consistent quality and versatility and (iv) its introduction on many foodservice menus. In addition, global protein demand continues to be strong, consistent with rising standards of living and a growing middle class in developing countries around the world. USDA estimates from 2017 through 2026 show an anticipated increase of global chicken production at a compounded annual growth rate of
0.8%
. We believe our relationship with JBS positions us to capture a portion of those emerging markets.
Key Industry Dynamics
Pricing.
Items that influence chicken pricing in the U.S. include international demand, changes in production by other broiler producing countries, input costs and the demand associated with substitute products such as beef and pork. We believe our focus on sales mix enables us to adapt to changing supply demand dynamics by adjusting our production to maximize value. We also benefit from a shorter production lifecycle of broilers compared to other proteins. While production for cattle takes approximately 28 to 39 months from breeding to slaughter and the production for pork takes 11 to 12 months, the production lifecycle for the broiler is only ten weeks.
Feed.
Broilers are fed corn and soybean meal as well as certain vitamins and minerals. Corn and soybean meal accounted for approximately
45.7%
and
37.0%
of our feed costs, respectively, in 2017. Broiler production is significantly more efficient from a feed perspective than cattle or hog production. Approximately two pounds of feed are required for each pound of chicken, as compared to approximately seven and 3.5 pounds for cattle and hogs, respectively. We have sought to mitigate the impact of feed price volatility on our profitability by decreasing the amount of our products that are sold under longer term fixed price contracts, broadening our product portfolio and expanding the variety of contracts within our book of business.
Competitive Strengths
We believe that our competitive strengths will enable us to maintain and grow our position as a leading chicken company and to capitalize on future favorable growth opportunities:
Leading market position in the growing chicken industry.
We are one of the largest chicken producers globally and a leading chicken producer in the U.S. with an approximate
17.3%
market share, based on ready-to-cook production in 2017, according to
WATTPoultryUSA
magazine. We believe we can maintain this prominent market position as we are one of the few producers in the chicken industry that can fully satisfy the requirements of large retailers and foodservice companies due to our broad product range, national distribution, vertically integrated operations and technical capabilities. Further, our scale of operations, balanced product portfolio and a wide range of production capabilities enable us to meet both the capacity and quality requirements of our customer base. Finally, we believe we are well-positioned with our global footprint to benefit from the growth in the U.S. chicken export market.
Broad product portfolio.
We have a diversified product portfolio ranging from large to small birds and from fresh to cooked to processed chicken. In addition, our prepared foods business is focused on our most profitable product lines. We believe we are well-positioned to be the primary chicken supplier for large customers due to our ability to provide consistent supply, innovate and develop new products to address consumer desires and provide competitive pricing across a diverse product portfolio. Our balanced portfolio of fresh, prepared and value-added chicken products yields a diversified sales mix, mitigating supply and market volatility and creating more consistent gross margins.
Blue chip and diverse customer base across all industry segments.
We benefit from strong relationships with leading companies in every customer segment, including Chick-fil-A
®
, US Foods, Kroger
®
, Costco
®
, Publix
®
, and H-E-B
®
, most of whom have been doing business with us for more than five years. We sell our products to a large and diverse customer base, with over 5,500 customers, with no single one accounting for more than 10% of total sales.
Lean and focused enterprise.
We are an efficient and lean organization supported by our market-driven business strategy. We have closed, idled or sold plants and distribution centers, reduced or consolidated production at other facilities, streamlined our workforce and reduced administrative and corporate expenses. In addition, we continue to seek to make significant production improvements driven by improved yields, labor, cost savings and product mix. We utilize zero-based budgeting and plant-level profit and loss analysis, driving engagement and ownership over the results at each plant. These strategic initiatives have reduced our cost base, resulting in higher and more sustainable profits. We share corporate headquarters with JBS in Greeley, Colorado, and have integrated certain corporate functions with JBS to save costs.
Experienced management team and results-oriented corporate culture.
We have a proven senior management team whose tenure in the chicken industry has spanned numerous market cycles and is among the most experienced in the industry.
3
Our senior management team is led by William W. Lovette, our Chief Executive Officer, who has over 30 years of experience in the chicken industry. Our management team has successfully improved and realigned our business and instilled a corporate culture focused on performance and accountability. We also benefit from management ideas, best practices and talent shared with the seasoned management team of JBS, which has over 50 years of combined experience operating protein processing facilities in South America, North America, Australia and Europe.
Relationship with JBS.
We work closely with JBS management to identify areas where Pilgrim’s and JBS can achieve synergies. We share corporate headquarters with JBS in Greeley, Colorado, and have integrated certain corporate functions with JBS to save costs. In addition to cost savings through the integration of certain corporate functions and the rationalization of facilities, our relationship with JBS allows us to enjoy several advantages given its diversified international operations and strong record in commodity risk management. In addition, the expertise of JBS in managing the risk associated with volatile commodity inputs will help us to further improve our operations and manage our margins.
Business Strategy
We intend to continue growing our business and enhancing profitability by pursuing the following strategies:
Be a valued partner with our key customers.
We have developed and acquired complementary markets, distributor relationships and geographic locations that have enabled us to expand our customer base and provide global distribution capabilities for all of our product lines. As a result, we believe we are one of only two U.S. chicken producers that can supply the growing demand for a broad range of price competitive standard and specialized products with well-known brand names on a nationwide basis from a single-source supplier. Additionally, we intend to leverage our innovation capabilities to develop new products along with our customers to accelerate sales and enhance the profitability of chicken products at their businesses. We plan to further enhance our industry position by optimizing our sales mix and accelerating innovation.
Relentless pursuit of operational excellence
.
As production and sales grow, we continue to focus on improving operating efficiencies by focusing on cost reductions, more effective processes, training and our total quality management program. Specific initiatives include:
|
•
|
Benchmarking live and plant costs against the industry;
|
|
•
|
Striving to be in the top 25% of the industry for yields and costs;
|
|
•
|
Fostering a culture of accountability and ownership deeper in the organization;
|
|
•
|
Conducting monthly performance reviews with senior management; and
|
|
•
|
Improving sales mix and price.
|
Between 2011 and 2017, these initiatives have resulted in approximately
$1.1 billion
of cumulative operational
improvements, including from reduction of plant-related costs and improved sales mix and product yield.
Accountability and ownership culture.
We have a results-oriented culture with our business strategy centered on reducing fixed costs and increasing profitability, consistent with JBS values. Our employee accountability has further increased as we have de-layered the organization through our recent restructuring and cost improvement initiatives. In addition, we continue to invest in developing our talent internally. As a result, we have a strong accountability and ownership culture. We strive to be the best managed and most respected company in our industry.
Reportable Business Segment
We operate in three reportable business segments: U.S., U.K. and Europe, and Mexico. As a producer and seller of chicken products we either produce or purchase chicken for resale in the U.S., the U.K and Europe, and Mexico. We conduct separate operations in the U.S., the U.K. and Europe, Puerto Rico and Mexico; however, for geographic reporting purposes, we include Puerto Rico with our U.S. operations. See “Note 21. Business Segment and Geographic Reporting” of our Consolidated and Combined Financial Statements included in this annual report for additional information.
Foreign Operations Risks
Our foreign operations pose special risks to our business and operations. A discussion of foreign operations risks is included in “Item 1A. Risk Factors."
Products and Markets
4
Our primary product types are fresh chicken products, prepared chicken products and value-added export chicken products. We sell our fresh chicken products to the foodservice and retail markets. Our fresh chicken products consist of refrigerated (nonfrozen) whole or cut-up chicken, either pre-marinated or non-marinated and prepackaged case-ready chicken. Our case-ready chicken includes various combinations of freshly refrigerated, whole chickens and chicken parts in trays, bags or other consumer packs labeled and priced ready for the retail grocer’s fresh meat counter. Our fresh chicken sales accounted for
83.0%
of our total U.S. chicken sales in 2017.
We also sell prepared chicken products, including portion-controlled breast fillets, tenderloins and strips, delicatessen products, salads, formed nuggets and patties and bone-in chicken parts. These products are sold either refrigerated or frozen and may be fully cooked, partially cooked or raw. In addition, these products are breaded or non-breaded and either pre-marinated or non-marinated. Our prepared chicken products sales accounted for
13.9%
of our total U.S. chicken sales in 2017.
Export and other chicken products primarily consist of whole chickens and chicken parts sold either refrigerated for distributors in the U.S. or frozen for distribution to export markets. We sell U.S.-produced chicken products for export to Mexico, the Middle East, Asia, countries within the Commonwealth of Independent States (the “CIS”) and other world markets. In the U.S., prices of these products are negotiated daily or weekly and are generally related to market prices quoted by the USDA or other public price reporting services. Prices for export sales are determined by supply and demand and local market conditions. In certain newly accessed international markets, we have established premium brands, which allow us to market our products at a premium to commodity price levels within those regions. Our export and other chicken products sales accounted for
3.1%
of our total U.S. chicken sales in 2017.
Our primary customer markets consist of the foodservice and retail channels, as well as selected export and other markets.
Our foodservice market principally consists of chain restaurants, food processors, broad-line distributors and certain other institutions located throughout the continental U.S. Within this market, we service frozen, fresh and corporate accounts. Fresh and frozen chicken products are usually pre-cut to customer specifications and are often marinated to enhance value and product differentiation. Corporate accounts include further-processed and value-added products supplied to select foodservice customers, improving their ability to manage product consistency and quality in a cost efficient manner. We believe we are positioned to be the primary or secondary supplier to national and international chain restaurants who require multiple suppliers of chicken products. Additionally, we believe we are well suited to be the sole supplier for many regional chain restaurants. Regional chain restaurants often offer better margin opportunities and a growing base of business. We believe that our full-line product capabilities, high-volume production capacities, research and development expertise and extensive distribution and marketing experience are competitive strengths compared to smaller and non-vertically integrated producers.
Our retail market consists primarily of grocery store chains, wholesale clubs and other retail distributors. Our retail market products consist primarily of branded, prepackaged cut-up and whole chicken and chicken parts. We concentrate our efforts in this market on creating value for our customers through category management and supporting key customers in expanding their private label sales programs. Additionally, for many years, we have invested in both trade and retail marketing designed to establish high levels of brand name awareness and consumer preference. We utilize numerous advertising and marketing techniques to develop and strengthen trade and consumer awareness and increase brand loyalty for consumer products marketed under the Gold Kist
®
, County Post
®
, Pierce Chicken
®
, Pilgrim’s Pride
®,
Pilgrim’s
®
brands, and Moy Park
®
. We believe our efforts to achieve and maintain brand awareness and loyalty help to achieve greater price premiums than would otherwise be the case in certain markets and support and expand our product distribution. We actively seek to identify and address consumer preferences by using sophisticated qualitative and quantitative consumer research techniques in key geographic markets to discover and validate new product ideas, packaging designs and methods.
Our export and other chicken market consists primarily of customers who purchase for distribution in the U.S. or for export to Mexico, the Middle East, Asia, countries within the CIS and other world markets. Our value-added export and other chicken products, with the exception of our exported prepared chicken products, consist of whole chickens and chicken parts sold in bulk, or value-added form, either refrigerated or frozen. We believe that U.S. chicken exports will continue to grow as worldwide demand increases for high-quality, low-cost meat protein sources. We expect that worldwide demand for higher-margin prepared food products will increase over the next several years and believe our strategy of value-added export growth positions us to take advantage of this expected demand.
Historically, we have targeted international markets to generate additional demand for our dark chicken meat, for which there has been less demand in the U.S. than for white chicken meat. We have expanded our portfolio to provide prepared chicken products tailored for export to the international divisions of our U.S. chain restaurant customers, as well as newly identified customers in regions not previously accessed. Through our relationship with JBS, we have developed an international distribution channel focused on growing our tailored export program and expanding value-added products, such as all-vegetable-fed whole
5
griller birds, chicken franks and further processed thigh meat. Utilizing the extensive sales network of JBS, we believe that we can accelerate the sales of value-added chicken products into these international channels.
The following table sets forth, for the periods beginning with 2013, net sales attributable to each of our primary product lines and markets served with those products. We based the table on our internal sales reports and their classification of product types.
|
2017
|
2016
|
2015
|
2014
|
2013
|
|||||||||||||||
|
(In thousands)
|
|||||||||||||||||||
|
U.S. chicken:
|
|||||||||||||||||||
|
Fresh chicken
|
$
|
5,700,503
|
|
$
|
4,627,137
|
|
$
|
4,701,943
|
|
$
|
4,703,993
|
|
$
|
4,123,089
|
|
||||
|
Prepared chicken
|
950,378
|
|
1,269,010
|
|
1,672,693
|
|
1,787,389
|
|
2,046,746
|
|
|||||||||
|
Export and other chicken
|
213,595
|
|
313,827
|
|
358,877
|
|
620,082
|
|
715,969
|
|
|||||||||
|
Total U.S. chicken
|
6,864,476
|
|
6,209,974
|
|
6,733,513
|
|
7,111,464
|
|
6,885,804
|
|
|||||||||
|
U.K. and Europe chicken:
|
|
|
|||||||||||||||||
|
Fresh chicken
|
846,575
|
|
811,127
|
|
240,815
|
|
—
|
|
—
|
|
|||||||||
|
Prepared chicken
|
792,284
|
|
794,880
|
|
241,589
|
|
—
|
|
—
|
|
|||||||||
|
Export and other chicken
|
318,699
|
|
283,276
|
|
67,903
|
|
—
|
|
—
|
|
|||||||||
|
Total U.K. and Europe chicken
|
1,957,558
|
|
1,889,283
|
|
550,307
|
|
—
|
|
—
|
|
|||||||||
|
Mexico chicken
|
1,303,656
|
|
1,245,644
|
|
1,016,200
|
|
900,360
|
|
864,454
|
|
|||||||||
|
Total chicken
|
10,125,690
|
|
9,344,901
|
|
8,300,020
|
|
8,011,824
|
|
7,750,258
|
|
|||||||||
|
Other products:
|
|||||||||||||||||||
|
U.S.
|
578,746
|
|
461,429
|
|
409,841
|
|
535,572
|
|
614,409
|
|
|||||||||
|
U.K. and Europe
|
38,761
|
|
58,158
|
|
22,261
|
|
—
|
|
—
|
|
|||||||||
|
Mexico
|
24,666
|
|
14,076
|
|
20,550
|
|
35,969
|
|
46,481
|
|
|||||||||
|
Total other products
|
642,173
|
|
533,663
|
|
452,652
|
|
571,541
|
|
660,890
|
|
|||||||||
|
Total net sales
|
$
|
10,767,863
|
|
$
|
9,878,564
|
|
$
|
8,752,672
|
|
$
|
8,583,365
|
|
$
|
8,411,148
|
|
||||
The following table sets forth, beginning with 2013, the percentage of net U.S. chicken sales attributable to each of our primary product lines and the markets serviced with those products. We based the table and related discussion on our internal sales reports and their classification of product types and customers.
|
2017
|
2016
|
2015
|
2014
|
2013
|
|||||
|
U.S. chicken:
|
|||||||||
|
Fresh chicken
|
83.0
|
74.5
|
69.8
|
66.2
|
59.9
|
||||
|
Prepared chicken
|
13.9
|
20.4
|
24.9
|
25.1
|
29.7
|
||||
|
Export and other chicken
|
3.1
|
5.1
|
5.3
|
8.7
|
10.4
|
||||
|
Total U.S. chicken
|
100.0
|
100.0
|
100.0
|
100.0
|
100.0
|
||||
United States Operations
Product Types
Fresh Chicken Overview.
Fresh chicken is an important component of our sales and accounted for
$5,700.5 million
, or
83.0%
, of our total U.S. chicken sales in 2017 and
$4,123.1 million
, or
59.9%
, in 2013. Most fresh chicken products are sold to established customers, based upon certain weekly or monthly market prices reported by the USDA and other public price reporting services, plus a markup, which is dependent upon the customer’s location, volume, product specifications and other factors. We believe our practices with respect to sales of fresh chicken are generally consistent with those of our competitors. The majority of these products are sold pursuant to agreements with varying terms that set a price according to formulas based on underlying chicken price markets, subject in many cases to minimum and maximum prices.
6
Prepared Chicken Overview.
In 2017,
$950.4 million
, or
13.9%
, of our U.S. chicken sales were in prepared chicken products to foodservice customers and retail distributors, as compared to
$2,046.7 million
, or
29.7%
, in 2013. The production and sale in the U.S. of prepared chicken products reduce the impact of the costs of feed ingredients on our profitability. Feed ingredient costs are the single largest component of our U.S. cost of sales, representing approximately 30.8% of our U.S. cost of sales in 2017. The production of feed ingredients is positively or negatively affected primarily by the global level of supply inventories, demand for feed ingredients, the agricultural policies of the U.S. and foreign governments and weather patterns throughout the world. As further processing is performed, feed ingredient costs become a decreasing percentage of a product’s total production cost, thereby reducing their impact on our profitability. Products sold in this form enable us to charge a premium, reduce the impact of feed ingredient costs on our profitability and improve and stabilize our profit margins.
We establish prices for our prepared chicken products based primarily upon perceived value to the customer, production costs and prices of competing products. The majority of these products are sold pursuant to agreements with varying terms that either set a fixed price for short-term periods or set a price according to formulas based on an underlying commodity market such as corn and chicken price forecasts, subject in many cases to minimum and maximum prices. Many times, these prices are dependent upon the customer’s location, volume, product specifications and other factors.
Export and Other Chicken Overview.
Our export and other chicken products consist of whole chickens and chicken parts sold primarily in bulk, nonbranded form, either refrigerated to distributors in the U.S. or frozen for distribution to export markets, and branded and nonbranded prepared chicken products for distribution to export markets. In 2017, approximately
$213.6 million
, or
3.1%
, of our total U.S. chicken sales were attributable to U.S. chicken export and other chicken products, as compared to
$716.0 million
, or
10.4%
, in 2013.
Markets for Other Products
Presently, this category includes chicken by-products, which we convert into protein products and sell primarily to manufacturers of pet foods. In addition, many of our U.S. feed mills produce and sell some livestock feeds to local dairy farmers and livestock producers.
|
2017
|
2016
|
2015
|
2014
|
2013
|
|||||
|
U.K. and Europe chicken:
|
|||||||||
|
Fresh chicken
|
43.2
|
42.9
|
43.8
|
—
|
—
|
||||
|
Prepared chicken
|
40.5
|
42.1
|
43.9
|
—
|
—
|
||||
|
Export and other chicken
|
16.3
|
15.0
|
12.3
|
—
|
—
|
||||
|
Total U.K. and Europe chicken
|
100.0
|
100.0
|
100.0
|
—
|
—
|
||||
United Kingdom and Europe Operations
Background
On September 8, 2017, a subsidiary of the Company acquired 100% of the issued and outstanding shares of Moy Park from JBS S.A. in a common-control transaction for cash and a note payable to the seller. Moy Park is one of the top-ten food companies in the U.K., Northern Ireland's largest private sector business and one of Europe's leading poultry producers. With 4 fresh processing plants, 10 prepared foods cook plants, 3 feed mills, 7 hatcheries and 1 rendering facility in the U.K., France, and the Netherlands, Moy Park processes 6.0 million birds per seven-day work week, in addition to producing around 456.0 million pounds of prepared foods per year.
Our Moy Park operations, with plants in the U.K., France and The Netherlands generated approximately 18.2% of our net sales in 2017. We are one of the largest producers and sellers of chicken in the U.K.. We believe that we operate one of the most efficient business models for chicken production in the U.K. and Europe.
During 2016 and 2017, we invested approximately £20 million in a new poultry hatchery facility in Newark, England with an egg set capacity of 2.9 million eggs per week. The first birds were hatched from the facility in September 2017.
Product Types
7
In the United Kingdom, Moy Park’s fresh chicken sales primarily consist of refrigerated and frozen whole chickens, breast fillets and bone-in chicken parts. In the United Kingdom, Ireland, France and The Netherlands, Moy Park produces further processed and prepared chicken products for sale to customers in retail, foodservice, agricultural and international distribution channels. Moy Park also sells a range of ready-to-cook, coated and ready-to-eat chicken products to major retailers and large foodservice customers. Moy Park maintains a new product development team and an executive chef to continue to develop new ideas for value added products across its range, and share those insights with its customers in order to drive sales. Moy Park has included new innovative products in its portfolio every year during the last five years with a growing new product development pipeline.
In recent years, Moy Park has built strong brands with high levels of brand recognition in the markets in which such brands are sold, including “Moy Park,” “Castle Lea,” “O’Kane Limited” and the Moy Park’s “Jamie Oliver” range. Moy Park believes the development of its brands are important as it provides customers with confidence in the quality and consistency of its products. Brand marketing is focused on establishing its brands through consistent quality and product innovation as well as developing relationships with key customers. Moy Park believes that its brands can be expanded throughout Europe, which provides the opportunity to sell higher margin products in its traditional markets.
Markets
Customers for Moy Park’s fresh and further processed and prepared chicken products include: national and regional retailers (including grocery supermarket chains, independent grocers and club stores) and wholesale distributors; international retailers and wholesale distributors; and the foodservice industry, including foodservice distributors, fast food and other restaurants.
Mexico Operations
Background
Our Mexico operations generated approximately
12.1%
of our net sales in 2017. We are one of the largest producers and sellers of chicken in Mexico. We believe that we operate one of the more efficient business models for chicken production in Mexico.
On June 29, 2015, we acquired, indirectly through certain of our Mexican subsidiaries, 100% of the equity of Tyson Mexico from Tyson Foods, Inc. and certain of its subsidiaries for cash. Tyson Mexico is a vertically integrated poultry business based in Gómez Palacio, Durango, Mexico. The acquired business has a production capacity of 2.9 million birds per week in its three plants. The acquisition further strengthened our strategic position in the Mexico chicken market.
During 2014 and 2015, we invested approximately $12.5 million in the first phase of a new poultry processing complex in Veracruz, Mexico. We initiated live production operations at this facility in September 2015.
Product Types
While the market for chicken products in Mexico is less developed than in the U.S., with sales attributed to fewer, simpler products, we believe we have been successful in differentiating our products through high-quality client service and product improvements. Additionally, we are an important player in the live market in Mexico.
Markets
We sell our chicken products primarily to wholesalers, large restaurant chains, fast food accounts and supermarket chains, and also engage in direct retail distribution in selected markets. Our largest presence is by far in the central states of the country where we have been able to gain market share. Our presence in Mexico reaches approximately
75.4%
of the population.
Key Customers
Our two largest customers accounted for approximately
11.0%
and
11.6%
of our net sales in 2017 and 2016, respectively. No single customer accounted for ten percent or more of our net sales in either 2017 or 2016.
Competition
The chicken industry is highly competitive. We are one of the largest chicken producers in the world and we believe our relationship with JBS enhances our competitive position. In the U.S. and Mexico, we compete principally with other vertically integrated poultry companies. However, there is some competition with non-vertically integrated further processors in the U.S.
8
prepared chicken business. We believe vertical integration generally provides significant, long-term cost and quality advantages over non-vertically integrated further processors.
In general, the competitive factors in the U.S. chicken industry include price, product quality, product development, brand identification, breadth of product line and customer service. Competitive factors vary by major market. In the U.S. retail market, we believe that product quality, brand awareness, customer service and price are the primary bases of competition. In the foodservice market, competition is based on consistent quality, product development, service and price. The export market is competitive on a global level based on price, product quality, product tailoring, brand identification and customer service. Competitive factors vary by market and may be impacted further by trade restrictions, sanitary and phyto-sanitary issues, brand awareness and the relative strength or weakness of the U.S. dollar against local currencies. We believe that product customization, service and price are the most critical competitive factors for export sales.
In Mexico, where product differentiation has traditionally been limited, we believe product quality and price have been the most critical competitive factors.
Regulation and Environmental Matters
The chicken industry is subject to government regulation, particularly in the health, workplace safety and environmental areas, including provisions relating to the discharge of materials into the environment, by the Centers for Disease Control (“CDC”), the USDA, the Food and Drug Administration (“FDA”), the Environmental Protection Agency (“EPA”), the Occupational Safety and Health Administration (“OSHA”) and state and local regulatory authorities in the U.S. and by similar governmental agencies in Mexico. Our chicken processing facilities in the U.S. are subject to on-site examination, inspection and regulation by the USDA. The FDA inspects the production of our feed mills in the U.S. Our Mexican food processing facilities and feed mills are subject to on-site examination, inspection and regulation by government agencies that perform functions similar to those performed by the USDA and FDA.
Our operations are subject to extensive regulation by the EPA and other state and local authorities relating to handling and discharge of waste water, storm water, air emissions, treatment, storage and disposal of wastes, handling of hazardous substances and remediation of contaminated soil, surface water and groundwater. Moy Park’s operations in the U.K. and Europe are subject to a number of local, national and regional laws and other requirements relating to the protection of the environment and the safety and health of personnel and the public. Our Mexican operations also are subject to extensive regulation by Mexican environmental authorities. The EPA, Mexican, U.K. and European environmental authorities and/or other U.S. or Mexican state and local authorities may, from time to time, adopt revisions to environmental rules and regulations, and/or changes in the terms and conditions of our environmental permits, with which we must comply. Compliance with existing or new environmental requirements, including more stringent limitations imposed or expected in recently-renewed or soon-to be renewed environmental permits, may require capital expenditures and operating expenses which may be significant. Our operations are also subject to regulation by the EPA, OSHA and other state, federal and local regulatory authorities regarding the treatment and disposal of agricultural and food processing wastes, the use and maintenance of refrigeration systems, including ammonia-based chillers, noise, odor and dust management, the operation of mechanized processing equipment, and other operations.
Some of our facilities have been operating for many years, and were built before current environmental, health and safety standards were imposed and/or in areas that recently have become subject to residential and commercial development pressures. We are upgrading wastewater treatment facilities at a number of our facilities, either pursuant to consent agreements with regulatory authorities or on a voluntary basis in anticipation of future permit requirements. We do not anticipate that the capital expenditures associated with these upgrades, which will be spread over a number of years, will be material.
We have from time to time had incidents at our plants involving worker health and safety. These have included ammonia releases due to mechanical failures in chiller systems and worker injuries and fatalities involving processing equipment and vehicle accidents. We have taken preventive measures in response.
Some of our properties have been impacted by contamination from spills or other releases, and we have incurred costs to remediate such contamination. In addition, in the past we acquired businesses with operations such as pesticide and fertilizer production that involved greater use of hazardous materials and generation of more hazardous wastes than our current operations. While many of those operations have been sold or closed, some environmental laws impose strict and, in certain circumstances, joint and several liability for costs of investigation and remediation of contaminated sites on current and former owners and operators of the sites, and on persons who arranged for disposal of wastes at such sites. In addition, current owners or operators of such contaminated sites may seek to recover cleanup costs from us based on past operations or contractual indemnifications. See “Item 1A. Risk Factors” for risks associated with compliance with existing or changing environmental requirement.
9
We anticipate increased regulation by the USDA concerning food safety, by the FDA concerning the use of medications in feed and by the EPA and various other state agencies concerning discharges to the environment. Although we do not currently anticipate that such increased regulation will have a material adverse effect upon us, new environmental, health and safety requirements that are more stringent than we anticipate, stricter interpretations of existing environmental requirements, or obligations related to the investigation or clean-up of contaminated sites may materially affect our business or operations in the future.
Employees
As of December 31, 2017, we employed approximately
30,900
persons in the U.S., approximately
10,200
persons in Mexico and approximately
10,200
persons in the U.K. and Europe. Approximately
37.8%
of the Company’s employees were covered under collective bargaining agreements. Substantially all employees covered under collective bargaining agreements are covered under agreements that expire in 2018 or later. We have not experienced any labor-related work stoppage at any location in over ten years. We believe our relationship with our employees and union leadership is satisfactory. At any given time, we will likely be in some stage of contract negotiations with various collective bargaining units. In the absence of agreements, we may become subject to labor disruption at one or more of these locations, which could have an adverse effect on our financial results.
Trademarks
We own registered trademarks which are used in connection with our activity in our business. The trademarks are important to the overall marketing and branding of our products. All major trademarks in our business are registered. In part, our success can be attributed to the existence and continued protection of these trademarks.
Seasonality
The demand for our chicken products generally is greatest during the spring and summer months and lowest during the winter months.
Financial Information about Foreign Operations
We have foreign operations in Mexico, the U.K. and Europe. Geographic financial information is set forth in “Item 7. Management’s Discussion and Analysis of Financial Condition and Results of Operations.” For additional information, see “Note 21. Business Segment and Geographic Reporting” of our Consolidated and Combined Financial Statements included in this annual report.
Available Information
The Company’s Internet website is www.pilgrims.com. The Company makes available, free of charge, through its Internet website, the Company’s annual reports on Form 10-K, quarterly reports on Form 10-Q, current reports on Form 8-K, directors and officers Forms 3, 4 and 5, and amendments to those reports, as soon as reasonably practicable after electronically filing such materials with, or furnishing them to, the Securities and Exchange Commission. The public may read and copy any materials that the Company files with the Securities and Exchange Commission at its Public Reference Room at 100 F Street, NE, Washington, DC 20549 and may obtain information about the operation of the Public Information Room by calling the Securities and Exchange Commission at 1-800-SEC-0330.
In addition, the Company makes available, through its Internet website, the Company’s Business Code of Conduct and Ethics, Corporate Governance Guidelines and the written charter of the Audit Committee, each of which is available in print to any stockholder who requests it by contacting the Secretary of the Company at 1770 Promontory Circle, Greeley, Colorado 80634-9038. Information contained on the Company’s website is not included as part of, or incorporated by reference into, this annual report.
Executive Officers
Set forth below is certain information relating to our current executive officers:
|
Name
|
Age
|
Positions
|
|||
|
William W. Lovette
|
58
|
|
President and Chief Executive Officer
|
||
|
Fabio Sandri
|
46
|
|
Chief Financial Officer
|
||
10
William W. Lovette joined Pilgrim’s as President and Chief Executive Officer on January 3, 2011. He brings more than 30 years of industry leadership experience to Pilgrim’s. He previously served two years as President and Chief Operating Officer of Case Foods, Inc. Before joining Case Foods, Inc., Mr. Lovette spent 25 years with Tyson Foods in various roles in senior management, including President of its International Business Unit, President of its Foodservice Business Unit and Senior Group Vice President of Poultry and Prepared Foods. Mr. Lovette earned a B.S. degree from Texas A&M University. In addition, he is a graduate of Harvard Business School’s Advanced Management Program.
Fabio Sandri has served as the Chief Financial Officer for Pilgrim’s since June 2011. From April 2010 to June 2011, Mr. Sandri served as the Chief Financial Officer of Estacio Participações, the private post-secondary educational institution in Brazil. From November 2008 until April 2010, he was the Chief Financial Officer of Imbra SA, a provider of dental services based in Sao Paolo, Brazil. Commencing in 2005 through October 2008, he was employed by Braskem S.A., a New York Stock Exchange-listed petrochemical company headquartered in Camaçari, Brazil, first from 2005 to 2007 as its strategy director, then from 2007 until his departure as its corporate controller. He earned his Masters in Business Administration in 2001 from the Wharton School at the University of Pennsylvania and a degree in electrical engineering in 1993 from Escola Politécnica da Universidade de São Paulo.
Item 1A.
Risk Factors
The following risk factors should be read carefully in connection with evaluating our business and the forward-looking information contained in this annual report on Form 10-K. Any of the following risks could materially adversely affect our business, operations, industry or financial position or our future financial performance. While we believe we have identified and discussed below all risk factors affecting our business that we believe are material, there may be additional risks and uncertainties that are not presently known or that are not currently believed to be significant that may adversely affect our business, operations, industry, financial position and financial performance in the future.
Industry cyclicality can affect our earnings, especially due to fluctuations in commodity prices of feed ingredients and chicken.
Profitability in the chicken industry is materially affected by the commodity prices of feed ingredients and market prices of chicken, which are determined by supply and demand factors. As a result, the chicken industry is subject to cyclical earnings fluctuations.
The price of feed ingredients is positively or negatively affected primarily by the global level of supply inventories and demand for feed ingredients, the agricultural policies of the U.S. and foreign governments and weather patterns throughout the world. In particular, weather patterns often change agricultural conditions in an unpredictable manner. A significant change in weather patterns could affect supplies of feed ingredients, as well as both the industry’s and our ability to obtain feed ingredients, grow chickens or deliver products. More recently, feed prices have been impacted by increased demand both domestically for ethanol and globally for protein production, as well as grain production levels outside the U.S. We have recently benefited from low market prices for feed ingredients, but market prices for feed ingredients remain volatile. Consequently, there can be no assurance that the price of corn or soybean meal will not continue to rise as a result of, among other things, increasing demand for these products around the world and alternative uses of these products, such as ethanol and biodiesel production.
Volatility in feed ingredient prices has had, and may continue to have, a materially adverse effect on our operating results, which has resulted in, and may continue to result in, additional noncash expenses due to impairment of the carrying amounts of certain of our assets. We periodically seek, to the extent available, to enter into advance purchase commitments or financial derivative contracts for the purchase of feed ingredients in an effort to manage our feed ingredient costs. The use of these instruments may not be successful. In addition, we have not designated the derivative financial instruments that we have purchased to mitigate commodity purchase exposures as cash flow hedges. Therefore, we recognize changes in the fair value of these derivative financial instruments immediately in earnings. Unexpected changes in the fair value of these instruments could adversely affect the results of our operations. Although we have sought to mitigate the impact of feed price volatility on our profitability by decreasing the amount of our products that are sold under longer term fixed price contracts, these changes will not eliminate the impact of changes in feed ingredient prices on our profitability and would prevent us from profiting on such contracts during times of declining market prices of chicken.
Outbreaks of livestock diseases in general and poultry diseases in particular, including avian influenza, can significantly affect our ability to conduct our operations and demand for our products.
We take precautions designed to ensure that our flocks are healthy and that our processing plants and other facilities operate in a sanitary and environmentally-sound manner. However, events beyond our control, such as the outbreaks of disease, either in our own flocks or elsewhere, could significantly affect demand for our products or our ability to conduct our operations.
11
Furthermore, an outbreak of disease could result in governmental restrictions on the import and export of our fresh chicken or other products to or from our suppliers, facilities or customers, or require us to destroy one or more of our flocks. This could also result in the cancellation of orders by our customers and create adverse publicity that may have a material adverse effect on our ability to market our products successfully and on our business, reputation and prospects.
For example, there was substantial publicity in 2015 regarding highly pathogenic avian influenza (“HPAI”) H5 in the Pacific, Central, and Mississippi flyways (or migratory bird paths) of North America. The disease was found in wild birds, as well as in a few backyard and commercial poultry flocks. The CDC considers the risk to people from these HPAI H5 infections to be low. No human cases of these HPAI H5 viruses have been detected. In its response effort, the USDA coordinated closely with state officials in affected and bordering states and other federal departments on avian influenza surveillance, reporting and control efforts. The USDA also coordinated with Canada on the HPAI H5 findings that were close to the northern U.S. border. Furthermore, there was substantial publicity in 2012 and 2013 regarding a highly pathogenic strain of avian influenza, known as H7N3, which affected several states in central Mexico. There was also substantial publicity in 2013 regarding a low pathogenic strain of avian influenza, known as H7N9, which affected eastern and northern China in and around the cities of Shanghai and Beijing.
There have been outbreaks of other low pathogenic strains of avian influenza in the U.S., and in Mexico outbreaks of both high and low-pathogenic strains of avian influenza are a fairly common occurrence. Historically, the outbreaks of low pathogenic strains of avian influenza have not generated the same level of concern, or received the same level of publicity or been accompanied by the same reduction in demand for poultry products in certain countries as that associated with highly pathogenic strains such as HPAI H5 and H7N3 or highly infectious strains such as H7N9. Even if no further highly pathogenic or highly contagious strains of avian influenza are confirmed in the U.S., the U.K. and Europe or Mexico, there can be no assurance that outbreaks of these strains in other countries will not materially adversely affect demand for U.S.-produced poultry internationally and/or U.S.-produced, the U.K. and Europe produced or Mexico-produced poultry domestically, and, if any of these strains were to spread to either the U.S., the U.K. and Europe or Mexico, there can be no assurance that it would not significantly affect our ability to conduct our operations and/or demand for our products, in each case in a manner having a material adverse effect on our business, reputation and/or prospects.
If our poultry products become contaminated, we may be subject to product liability claims and product recalls.
Poultry products may be subject to contamination by disease-producing organisms, or pathogens, such as
Listeria monocytogenes
, Salmonella and generic E.coli. These pathogens are generally found in the environment, and, as a result, there is a risk that, as a result of food processing, they could be present in our processed poultry products. These pathogens can also be introduced as a result of improper handling at the further processing, foodservice or consumer level. These risks may be controlled, although not eliminated, by adherence to good manufacturing practices and finished product testing. We have little, if any, control over proper handling once the product has been shipped. Illness and death may result if the pathogens are not eliminated at the further processing, foodservice or consumer level. Even an inadvertent shipment of contaminated products is a violation of law and may lead to increased risk of exposure to product liability claims, product recalls and increased scrutiny by federal and state regulatory agencies and may have a material adverse effect on our business, reputation and prospects.
Product liability claims or product recalls can adversely affect our business reputation, expose us to increased scrutiny by federal and state regulators and may not be fully covered by insurance.
The packaging, marketing and distribution of food products entail an inherent risk of product liability and product recall and the resultant adverse publicity. We may be subject to significant liability if the consumption of any of our products causes injury, illness or death. We could be required to recall certain products in the event of contamination or damage to the products. In addition to the risks of product liability or product recall due to deficiencies caused by our production or processing operations, we may encounter the same risks if any third party tampers with our products. We cannot assure you that we will not be required to perform product recalls, or that product liability claims will not be asserted against us, in the future. Any claims that may be made may create adverse publicity that would have a material adverse effect on our ability to market our products successfully or on our business, reputation, prospects, financial condition and results of operations.
If our poultry products become contaminated, we may be subject to product liability claims and product recalls. There can be no assurance that any litigation or reputational injury associated with product recalls will not have a material adverse effect on our ability to market our products successfully or on our business, reputation, prospects, financial condition and results of operations.
We currently maintain insurance with respect to certain of these risks, including product liability insurance, business interruption insurance and general liability insurance, but in many cases such insurance is expensive, difficult to obtain and no assurance can be given that such insurance can be maintained in the future on acceptable terms, or in sufficient amounts to protect us against losses due to any such events, or at all. Moreover, even though our insurance coverage may be designed to protect us
12
from losses attributable to certain events, it may not adequately protect us from liability and expenses we incur in connection with such events.
We may not be able to successfully integrate the operations of companies we acquire, including Moy Park or GNP, or benefit from growth opportunities.
We intend to pursue additional selected growth opportunities in the future. These opportunities, including the Moy Park acquisition and the GNP acquisition, may expose us to successor liability relating to actions involving any acquired entities, their respective management or contingent liabilities incurred prior to our involvement and will expose us to liabilities associated with ongoing operations, in particular to the extent we are unable to adequately and safely manage such acquired operations. A material liability associated with these types of opportunities, or our failure to successfully integrate any acquired entities into our business, could adversely affect our reputation and have a material adverse effect on us.
Undisclosed liabilities from our acquisitions may harm our financial condition and operating results. If we make acquisitions in the future, these transactions may be structured in such a manner that would result in our assumption of undisclosed liabilities or liabilities not identified during our pre-acquisition due diligence. These obligations and liabilities could adversely affect our financial condition and operating results.
We may not be able to successfully integrate any growth opportunities we may undertake in the future, including the Moy Park acquisition and the GNP acquisition, or successfully implement appropriate operational, financial and administrative systems and controls to achieve the benefits that we expect to result therefrom. These risks include: (1) failure of the acquired entities to achieve expected results; (2) possible inability to retain or hire key personnel of the acquired entities; and (3) possible inability to achieve expected synergies and/or economies of scale. In addition, the process of integrating businesses could cause interruption of, or loss of momentum in, the activities of our existing business. The diversion of our management’s attention and any delays or difficulties encountered in connection with the integration of these businesses could adversely affect our business, results of operations, prospects and the market price of the notes.
Competition in the chicken industry with other vertically integrated poultry companies may make us unable to compete successfully in this industry, which could adversely affect our business.
The chicken industry is highly competitive. In the U.S. and Mexico, we primarily compete with other vertically integrated chicken companies.
In general, the competitive factors in the U.S. chicken industry include price, product quality, product development, brand identification, breadth of product line and customer service. Competitive factors vary by major market. In the foodservice market, competition is based on consistent quality, product development, service and price. In the U.S. retail market, we believe that competition is based on product quality, brand awareness, customer service and price. Further, there is some competition with non-vertically integrated further processors in the prepared chicken business. In Mexico, where product differentiation has traditionally been limited, we believe product quality and price have been the most critical competitive factors.
The loss of one or more of our largest customers could adversely affect our business.
Our two largest customers accounted for approximately
11.0%
of our net sales in 2017. Our business could suffer significant setbacks in revenues and operating income if we lost one or more of our largest customers, or if our customers’ plans and/or markets should change significantly.
Our foreign operations pose special risks to our business and operations.
We have significant operations and assets located in Mexico and Europe and may participate in or acquire operations and assets in other foreign countries in the future. Foreign operations are subject to a number of special risks such as currency exchange rate fluctuations, trade barriers, exchange controls, expropriation and changes in laws and policies, including tax laws and laws governing foreign-owned operations.
Currency exchange rate fluctuations have adversely affected us in the past. Exchange rate fluctuations or one or more other risks may have a material adverse effect on our business or operations in the future.
Our operations in Mexico are conducted through subsidiaries organized under the laws of Mexico. Claims of creditors of our subsidiaries, including trade creditors, will generally have priority as to the assets of our subsidiaries over our claims. Additionally, the ability of our Mexican subsidiaries to make payments and distributions to us may be limited by the terms of our Mexico credit facility and will be subject to, among other things, Mexican law. In the past, these laws have not had a material adverse effect on the ability of our Mexican subsidiaries to make these payments and distributions. However, laws such as these
13
may have a material adverse effect on the ability of our Mexican subsidiaries to make these payments and distributions in the future.
The terms of Moy Park’s indenture restrict Moy Park’s ability and the ability of certain of Moy Park’s subsidiaries to, among other things, make payments and distributions to us. These restrictions may have a material adverse effect on Moy Park’s ability to make these payments and distributions in the future.
Disruptions in international markets and distribution channels could adversely affect our business.
Historically, we have targeted international markets to generate additional demand for our products. In particular, given U.S. customers’ general preference for white meat, we have targeted international markets for the sale of dark chicken meat, specifically leg quarters, which are a natural by-product of our U.S. operations’ concentration on prepared chicken products. As part of this initiative, we have created a significant international distribution network into several markets in Mexico, the Middle East, Asia and countries within the Commonwealth of Independent States (the “CIS”). Our success in these markets may be, and our success in recent periods has been, adversely affected by disruptions in chicken export markets. For example, dozens of countries, including Mexico, Canada, China, Angola and South Korea, imposed either partial or full bans on the importation of poultry produced in the U.S. after an outbreak of HPAI H5 avian influenza was confirmed in 2015. Additionally, China imposed anti-dumping and countervailing duties on the U.S. chicken producers in 2010, which have deterred Chinese importers from purchases of U.S.-origin chicken products. Russia also banned the importation of chicken and other agricultural products from the U.S. and certain other western countries in August 2014 in retaliation for sanctions imposed by the U.S. and Europe on Russia over its actions in Ukraine.
A significant risk is disruption due to import restrictions and tariffs, other trade protection measures, and import or export licensing requirements. In addition, disruptions may be caused by outbreaks of disease such as avian influenza, either in our flocks or elsewhere in the world, and resulting changes in consumer preferences.
One or more of these or other disruptions in the international markets and distribution channels could adversely affect our business.
Regulation, present and future, is a constant factor affecting our business.
Our operations will continue to be subject to federal, state and local governmental regulation, including in the health, safety and environmental areas. Changes in laws or regulations or the application thereof regarding areas such as wage and hour and environmental compliance may lead to government enforcement actions and resulting litigation by private litigants.
In addition, unknown matters, new laws and regulations, or stricter interpretations of existing laws or regulations may also materially affect our business or operations in the future.
New immigration legislation or increased enforcement efforts in connection with existing immigration legislation could cause the costs of doing business to increase, cause us to change the way we conduct our business or otherwise disrupt our operations.
Immigration reform continues to attract significant attention in the public arena and the U.S. Congress. If new federal immigration legislation is enacted or if states in which we do business enact immigration laws, such laws may contain provisions that could make it more difficult or costly for us to hire U.S. citizens and/or legal immigrant workers. Additionally, there may be uncertainty as to the position the U.S. will take with respect to immigration following the 2016 U.S. presidential election and related change in the U.S. political agenda. In such case, we may incur additional costs to run our business or may have to change the way we conduct our operations, either of which could have a material adverse effect on our business, operating results and financial condition. Also, despite our past and continuing efforts to hire only U.S. citizens and/or persons legally authorized to work in the U.S., we may be unable to ensure that all of our employees are U.S. citizens and/or persons legally authorized to work in the U.S. No assurances can be given that enforcement efforts by governmental authorities will not disrupt a portion of our workforce or operations at one or more facilities, thereby negatively impacting our business. Also, no assurance can be given that further enforcement efforts by governmental authorities will not result in the assessment of fines that could adversely affect our financial position, operating results or cash flows.
Loss of essential employees could have a significant negative impact on our business.
Our success is largely dependent on the skills, experience, and efforts of our management and other employees. The loss of the services of one or more members of our senior management or of numerous employees with essential skills could have a
14
negative effect on our business, financial condition and results of operations. If we are not able to retain or attract talented, committed individuals to fill vacant positions when needs arise, it may adversely affect our ability to achieve our business objectives.
Our performance depends on favorable labor relations with our employees and our compliance with labor laws. Any deterioration of those relations or increase in labor costs due to our compliance with labor laws could adversely affect our business.
As of December 31, 2017, we employed approximately 30,900 persons in the U.S.,approximately 10,200 persons in Mexico and approximately 10,200 persons in the U.K. and Europe. Approximately 37.8% of the Company’s employees were covered under collective bargaining agreements. Substantially all employees covered under collective bargaining agreements are covered under agreements that expire in 2018 or later. We have not experienced any labor-related work stoppage at any location in over ten years. We believe our relationship with our employees and union leadership is satisfactory. At any given time, we will likely be in some stage of contract negotiations with various collective bargaining units. In the absence of agreements, we may become subject to labor disruption at one or more of these locations, which could have an adverse effect on our financial results.
Extreme weather, natural disasters or other events beyond our control could negatively impact our business.
Bioterrorism, fire, pandemic, extreme weather or natural disasters, including droughts, floods, excessive cold or heat, hurricanes or other storms, could impair the health or growth of our flocks, production or availability of feed ingredients, or interfere with our operations due to power outages, fuel shortages, damage to our production and processing facilities or disruption of transportation channels, among other things. Any of these factors could have an adverse effect on our financial results.
We may face significant costs for compliance with existing or changing environmental, health and safety requirements and for potential environmental obligations relating to current or discontinued operations.
Our operations are subject to extensive and increasingly stringent federal, state, local and foreign laws and regulations pertaining to the protection of the environment, including those relating to the discharge of materials into the environment, the handling, treatment and disposal of wastes and remediation of soil and groundwater contamination. Failure to comply with these requirements could have serious consequences for us, including criminal as well as civil and administrative penalties, claims for property damage, personal injury and damage to natural resources and negative publicity. Compliance with existing or changing environmental requirements, including more stringent limitations imposed or expected to be imposed in recently-renewed or soon-to be renewed environmental permits, will require capital expenditures for installation of new or upgraded pollution control equipment at some of our facilities.
Operations at many of our facilities require the treatment and disposal of wastewater, stormwater and agricultural and food processing wastes, the use and maintenance of refrigeration systems, including ammonia-based chillers, noise, odor and dust management, the operation of mechanized processing equipment, and other operations that potentially could affect the environment, health and safety. Some of our facilities have been operating for many years, and were built before current environmental standards were imposed, and/or in areas that recently have become subject to residential and commercial development pressures. Failure to comply with current and future environmental, health and safety standards could result in the imposition of fines and penalties, and we have been subject to such sanctions from time to time. We are upgrading wastewater treatment facilities at a number of these locations, either pursuant to consent agreements with regulatory authorities or on a voluntary basis in anticipation of future permit requirements.
In the past, we have acquired businesses with operations such as pesticide and fertilizer production that involved greater use of hazardous materials and generation of more hazardous wastes than our current operations. While many of those operations have been sold or closed, some environmental laws impose strict and, in certain circumstances, joint and several liability for costs of investigation and remediation of contaminated sites on current and former owners and operators of the sites, and on persons who arranged for disposal of wastes at such sites. In addition, current owners or operators of such contaminated sites may seek to recover cleanup costs from us based on past operations or contractual indemnifications.
New environmental, health and safety requirements, stricter interpretations of existing requirements, or obligations related to the investigation or clean-up of contaminated sites, may materially affect our business or operations in the future.
JBS USA beneficially owns a majority of our common stock and has the ability to control the vote on most matters brought before the holders of our common stock.
JBS USA beneficially owns a majority of the shares and voting power of our common stock and is entitled to appoint a majority of the members of our Board of Directors. As a result, JBS USA will, subject to restrictions on its voting power and actions in a stockholders agreement between JBS USA and us and our organization documents, have the ability to control our
15
management, policies and financing decisions, elect a majority of the members of our Board of Directors at the annual meeting and control the vote on most matters coming before the holders of our common stock.
Under the stockholders agreement between JBS USA and us, JBS USA has the ability to elect up to six members of our Board of Directors and the other holders of our common stock have the ability to elect up to three members of our Board of Directors. If the percentage of our outstanding common stock owned by JBS USA exceeds 80%, then JBS USA would have the ability to elect one additional member of our Board of Directors while the other holders of our common stock would have the ability to elect one less member of our Board of Directors.
J&F Investimentos S.A. is investigating improper payments made in Brazil in connection with admissions of illicit conduct to the Brazilian Federal Prosecutor’s Office and the outcome of this investigation and related investigations by the Brazilian government could have a material adverse effect on us.
On May 3, 2017, certain officers of J&F Investimentos S.A. (“J&F,” and the companies controlled by J&F, the “J&F Group”) (including two former directors of the Company)
, a company organized in Brazil and an indirect controlling stockholder of the Company, entered into plea bargain agreements (the "Plea Bargain Agreements") with the Brazilian Federal Prosecutor's Office (
Ministério Público Federal
) ("MPF") in connection with certain illicit conduct involving improper payments made to Brazilian politicians, government officials and other individuals in Brazil committed by or on behalf of J&F and certain J&F Group companies. The details of such illicit conduct are set forth in separate annexes to the Plea Bargain Agreements, and include admissions of improper payments to politicians and political parties in Brazil over the last 10 years in exchange for receiving, or attempting to receive, favorable treatment for certain J&F Group companies in Brazil.
Pursuant to the terms of the Plea Bargain Agreements, the MPF agreed to grant immunity to the officers in exchange for such officers agreeing, among other considerations, to: (1) pay fines totaling R$225.0 million;
(2) cooperate with the MPF, including providing supporting evidence of the illicit conduct identified in the annexes to the Plea Bargain Agreements; and (3) present any previously undisclosed illicit conduct within 120 days following the execution of the Plea Bargain Agreements as long as the description of such conduct had not been omitted in bad faith. In addition, the Plea Bargain Agreements provide that the MPF may terminate any Plea Bargain Agreement and request that the Supreme Court of Brazil (
Supremo Tribunal Federal
) ("STF") ratify such termination if any illicit conduct is identified that was not included in the annexes to the Plea Bargain Agreements.
On June 5, 2017, J&F, in its role as the controlling shareholder of the J&F Group, entered into a leniency agreement (the "Leniency Agreement") with the MPF, whereby J&F assumed responsibility for the conduct that was described in the annexes to the Plea Bargain Agreements. In connection with the Leniency Agreement, J&F has agreed to pay a fine of
R$10.3 billion
, adjusted for inflation, over a 25- year period. In exchange, the MPF agreed not to initiate or propose any criminal, civil or administrative actions against J&F, the companies of the J&F Group or those officers of J&F with respect to such conduct. Pursuant to the terms of the Leniency Agreement, if the Plea Bargain Agreement is annulled by the STF, then the Leniency Agreement may also be terminated by the Fifth Chamber of Coordination and Reviews of the MPF or, solely with respect to the criminal related provisions of the Leniency Agreement, by the 10th Federal Court of the Federal District in Brasilia, the authorities responsible for the ratification of the Leniency Agreement.
On August 24, 2017, the Fifth Chamber ratified the Leniency Agreement. On September 8, 2017, the 10th Federal Court ratified the Leniency Agreement. In compliance with the terms of the Leniency Agreement, J&F is conducting an internal investigation involving improper payments made in Brazil by or on behalf of J&F, certain companies of the J&F Group and certain officers of J&F (including two former directors of the Company). J&F has engaged outside advisors to assist in conducting the investigation, including an assessment as to whether any of the misconduct disclosed to Brazilian authorities had any connection to the Company, or resulted in a violation of U.S. law. The internal investigation is ongoing and the Company is fully cooperating with J&F in connection with the investigation. We cannot predict when the investigation will be completed or the results of the investigation, including the outcome or impact of any government investigations or any resulting litigation.
On September 8, 2017, at the request of the MPF, the STF issued an order temporarily revoking the immunity from prosecution previously granted to Joesley Mendonça Batista and another executive of J&F in connection with the Plea Bargain Agreements. The MPF requested the revocation of their immunity following public disclosure of certain voice recordings involving them in which they discussed certain alleged illicit activities the MPF claims were not covered by the annexes to their respective Plea Bargain Agreements. On September 10, 2017, Joesley Mendonça Batista voluntarily turned himself into police in Brazil. On September 11, 2017, the 10th Federal Court suspended its ratification of the criminal provisions of the Leniency Agreement as a result of the STF's temporary revocation of Joesley Mendonça Batista immunity under his Plea Bargain Agreement. On October 11, 2017, Judge Vallisney de Souza of the 10th Federal Court revalidated the criminal provisions of the Leniency Agreement.
We cannot predict whether the Plea Bargain Agreements will be upheld or terminated by the STF, and, if terminated, whether the Leniency Agreement will be also terminated by either the Fifth Chamber and/or the 10th Federal Court, and to what
16
extent. If the Leniency Agreement is terminated, in whole or in part, as a result of any Plea Bargain Agreement being terminated, this may materially adversely affect the public perception or reputation of the J&F Group, including the Company, and could have a material adverse effect on the J&F Group's business, financial condition, results of operations and prospects. Furthermore, the termination of the Leniency Agreement may cause the termination of certain stabilization agreements entered into by JBS S.A. and certain of its subsidiaries, which would permit the lenders of the debt that is the subject to the terms of the stabilization agreements to accelerate their debt, which could have a material adverse effect on JBS S.A. and its subsidiaries (including the Company).
Separately, Wesley Mendonça Batista (the former Chief Executive Officer of JBS S.A.) was arrested on September 13, 2017, as a result of a separate investigation by Brazil’s federal police alleging that Joesley Mendonça Batista and Wesley Mendonça Batista carried out insider trading transactions involving the sale of shares of JBS S.A. and foreign exchange futures contracts prior to the announcement of the Plea Bargain Agreements. The Securities and Exchange Commission of Brazil (
Comissão de Valores Mobiliários
) is also investigating these insider trading transactions. On September 21, 2017, the Brazilian federal police formally requested that the federal prosecutor bring charges against Joesley Mendonça Batista and Wesley Mendonça Batista as a result of this investigation. These investigations, possible indictments and any further developments in this matter may materially adversely affect the public perception or reputation of JBS S.A. and its subsidiaries (including the Company) and could have a material adverse effect on JBS S.A. and its subsidiaries (including the Company).
Our operations are subject to general risks of litigation.
We are involved on an ongoing basis in litigation relating to alleged antitrust violations or arising in the ordinary course of business or otherwise. For example, between September 2, 2016 and October 13, 2016, ten purported class action lawsuits were brought against Pilgrim’s and 13 other producers by and on behalf of direct and indirect purchasers of broiler chickens. The complaints, which were filed with the U.S. District Court for the Northern District of Illinois, seek, among other relief, treble damages for an alleged conspiracy among defendants to reduce output and increase prices of broiler chickens from the period of January 2008 to the present. See “Item 3. Legal Proceedings.” Trends in litigation may include class actions involving consumers, shareholders, employees or injured persons, and claims relating to commercial, labor, employment, antitrust, securities or environmental matters. Litigation trends and the outcome of litigation cannot be predicted with certainty, and adverse litigation trends and outcomes could result material damages, which could adversely affect our financial condition and results of operations.
We are subject to anti-corruption laws in the jurisdictions in which we operate, including the U.S. Foreign Corrupt Practices Act and the UK Bribery Act.
We are subject to a number of anti-corruption laws, including the U.S. Foreign Corrupt Practices Act (“FCPA”) and the UK Bribery Act.
The FCPA and similar anti-bribery laws generally prohibit companies and their intermediaries from making improper payments or improperly providing anything of value to foreign officials, directly or indirectly, for the purpose of obtaining or keeping business and/or other benefits. Some of these laws have legal effect outside the jurisdictions in which they are adopted under certain circumstances. The FCPA also requires maintenance of adequate record-keeping and internal accounting practices to accurately reflect transactions. Under the FCPA, companies operating in the United States may be held liable for actions taken by their strategic or local partners or representatives.
The UK Bribery Act is broader in scope than the FCPA in that it directly prohibits commercial bribery (i.e. bribing others than government officials) in addition to bribery of government officials and it does not recognize certain exceptions, notably for facilitation payments, that are permitted by the FCPA. The UK Bribery Act also has wide jurisdiction. It covers any offense committed in the United Kingdom, but proceedings can also be brought if a person who has a close connection with the United Kingdom commits the relevant acts or omissions outside the United Kingdom. The UK Bribery Act defines a person with a close connection to include British citizens, individuals ordinarily resident in the United Kingdom and bodies incorporated in the United Kingdom.
The UK Bribery Act also provides that any organization that conducts part of its business in the United Kingdom, even if it is not incorporated in the United Kingdom, can be prosecuted for the corporate offense of failing to prevent bribery by an associated person, even if the bribery took place entirely outside the United Kingdom and the associated person had no connection with the United Kingdom. Other jurisdictions in which we operate have adopted similar anti-corruption, anti-bribery and anti-kickback laws to which we are subject. Civil and criminal penalties may be imposed for violations of these laws.
Although the code of ethics and standards of conduct adopted by JBS S.A. in late 2015 requires our employees to comply with the FCPA and the UK Bribery Act, we are still implementing a formal compliance program and policies that cover our employees and consultants. We operate in some countries which are viewed as high risk for corruption. Despite our ongoing efforts to ensure compliance with the FCPA, the UK Bribery Act and similar laws, there can be no assurance that our directors, officers,
17
employees, agents, third-party intermediaries and the companies to which we outsource certain of our business operations, will comply with those laws and our anti-corruption policies, and we may be ultimately held responsible for any such non-compliance. If we or our directors or officers violate anti-corruption laws or other laws governing the conduct of business with government entities (including local laws), we or our directors or officers may be subject to criminal and civil penalties or other remedial measures, which could harm our reputation and have a material adverse impact on our business, financial condition, results of operations and prospects. Any actual or alleged violations of such laws could also harm our reputation or have an adverse impact on our business, financial condition, results of operations and prospects.
We depend on contract growers and independent producers to supply us with livestock.
We contract primarily with independent contract growers to raise the live chickens processed in our poultry operations. If we do not attract and maintain contracts with growers or maintain marketing and purchasing relationships with independent producers, our production operations could be negatively affected.
Changes in consumer preference could negatively impact our business.
The food industry in general is subject to changing consumer trends, demands and preferences. Trends within the food industry change often, and failure to identify and react to changes in these trends could lead to, among other things, reduced demand and price reductions for our products, and could have an adverse effect on our financial results.
The consolidation of customers could negatively impact our business.
Our customers, such as supermarkets, warehouse clubs and food distributors, have consolidated in recent years, and consolidation is expected to continue throughout the U.S. and in other major markets. These consolidations have produced large, sophisticated customers with increased buying power who are more capable of operating with reduced inventories, opposing price increases, and demanding lower pricing, increased promotional programs and specifically tailored products. These customers also may use shelf space currently used for our products for their own private label products. Because of these trends, our volume growth could slow or we may need to lower prices or increase promotional spending for our products, any of which could adversely affect our financial results.
We are increasingly dependent on information technology, and our business and reputation could suffer if we are unable to protect our information technology systems against, or effectively respond to, cyber-attacks, other cyber incidents or security breaches or if our information technology systems are otherwise disrupted.
The proper functioning of our information systems is critical to the successful operation of our business. Although our information systems are protected with robust backup systems, including physical and software safeguards and remote processing capabilities, information systems are still vulnerable to natural disasters, power losses, unauthorized access, telecommunication failures, and other problems. In addition, certain software used by us is licensed from, and certain services related to our information systems are provided by, third parties who could choose to discontinue their relationship with us. If critical information systems fail or these systems or related software or services are otherwise unavailable, our ability to process orders, maintain proper levels of inventories, collect accounts receivable, pay expenses, and maintain the security of Company and customer data could be adversely affected.
Cyber-attacks and other cyber incidents are occurring more frequently and are constantly evolving in nature and sophistication. Our failure to maintain our cyber-security measures and keep abreast of new and evolving threats may make our systems vulnerable. The vulnerability of our systems and our failure to identify or respond timely to cyber incidents could have an adverse effect on our operations and reputation and expose us to liability or regulatory enforcement actions.
Our future financial and operating flexibility may be adversely affected by significant leverage.
On a consolidated basis, as of December 31, 2017, we had approximately
$865.2 million
in secured indebtedness,
$1,844.2 million
of unsecured indebtedness and had the ability to borrow approximately
$750.1 million
under our credit agreements. Significant amounts of cash flow will be necessary to make payments of interest and repay the principal amount of such indebtedness.
The degree to which we are leveraged could have important consequences because:
|
•
|
It could affect our ability to satisfy our obligations under our credit agreements;
|
|
•
|
A substantial portion of our cash flow from operations is required to be dedicated to interest and principal payments and may not be available for operations, working capital, capital expenditures, expansion, acquisitions or general corporate or other purposes;
|
18
|
•
|
Our ability to obtain additional financing and to fund working capital, capital expenditures and other general corporate requirements in the future may be impaired;
|
|
•
|
We may be more highly leveraged than some of our competitors, which may place us at a competitive disadvantage;
|
|
•
|
Our flexibility in planning for, or reacting to, changes in our business may be limited;
|
|
•
|
It may limit our ability to pursue acquisitions and sell assets; and
|
|
•
|
It may make us more vulnerable in the event of a continued or new downturn in our business or the economy in general.
|
Our ability to make payments on and to refinance our debt, including our credit facilities, will depend on our ability to generate cash in the future. This, to a certain extent, is subject to various business factors (including, among others, the commodity prices of feed ingredients and chicken) and general economic, financial, competitive, legislative, regulatory, and other factors that are beyond our control.
There can be no assurance that we will be able to generate sufficient cash flow from operations or that future borrowings will be available under our credit facilities in an amount sufficient to enable us to pay our debt obligations, including obligations under our credit facilities, or to fund our other liquidity needs. We may need to refinance all or a portion of their debt on or before maturity. There can be no assurance that we will be able to refinance any of their debt on commercially reasonable terms or at all.
Impairment in the carrying value of goodwill could negatively affect our operating results.
We have a significant amount of goodwill on our Consolidated and Combined Balance Sheet. Under generally accepted accounting principles, goodwill must be evaluated for impairment annually or more frequently if events indicate it is warranted. If the carrying value of our reporting units exceeds their current fair value as determined based on the discounted future cash flows of the related business, the goodwill is considered impaired and is reduced to fair value by a non-cash charge to earnings. Events and conditions that could result in impairment in the value of our goodwill include changes in the industry in which we operate, particularly the impact of a downturn in the global economy or the economies of geographic regions or countries in which we operate, as well as competition, adverse changes in the regulatory environment, or other factors leading to reduction in expected long-term sales or profitability.
Media campaigns related to food production present risks.
Individuals or organizations can use social media platforms to publicize inappropriate or inaccurate stories or perceptions about the food production industry or our company. Such practices could cause damage to the reputations of our company and/or the food production industry in general. This damage could adversely affect our financial results.
Assumption of unknown liabilities in acquisitions may harm our financial condition and operating results.
Acquisitions may be structured in such a manner that would result in the assumption of unknown liabilities not disclosed by the seller or uncovered during pre-acquisition due diligence. For example, our acquisition of GNP was structured as an equity purchase in which we effectively assumed all of the liabilities of GNP including liabilities that may be unknown. Such unknown obligations and liabilities could harm our financial condition and operating results.
We may pursue additional opportunities to acquire complementary businesses, which could further increase leverage and debt service requirements and could adversely affect our financial situation if we fail to successfully integrate the acquired business.
We intend to continue to pursue selective acquisitions of complementary businesses in the future. Inherent in any future acquisitions are certain risks such as increasing leverage and debt service requirements and combining company cultures and facilities, which could have a material adverse effect on our operating results, particularly during the period immediately following such acquisitions. Additional debt or equity capital may be required to complete future acquisitions, and there can be no assurance that we will be able to raise the required capital. Furthermore, acquisitions involve a number of risks and challenges, including:
•
Diversion of management’s attention;
•
The need to integrate acquired operations;
•
Potential loss of key employees and customers of the acquired companies;
19
•
Lack of experience in operating in the geographical market of the acquired business; and
•
An increase in our expenses and working capital requirements.
Any of these and other factors could adversely affect our ability to achieve anticipated cash flows at acquired operations or realize other anticipated benefits of acquisitions.
The vote by the U.K. electorate in favor of having the U.K. exit the European Union could adversely impact our business, results of operations and financial condition.
In a referendum held in the U.K. on June 23, 2016, a majority of those voting voted for the U.K. to leave the European Union (referred to as “Brexit”). For now, the U.K. remains a member of the European Union and there will not be any immediate change in either European Union or U.K. law as a consequence of the vote. European Union law does not govern contracts and the U.K. is not part of the European Union’s monetary union. However, Brexit vote signals the beginning of a lengthy process under which the terms of the U.K.’s withdrawal from, and future relationship with, the European Union will be negotiated and legislation to implement the U.K.’s withdrawal from the European Union will be enacted. The ultimate impact of Brexit vote will depend on the terms that are negotiated in relation to the U.K.’s future relationship with the European Union. Although the timetable for U.K. withdrawal is not at all clear at this stage, it is likely that the withdrawal of the U.K. from the European Union will take more than two years to be negotiated and conclude.
Brexit could impair our ability to transact business in the U.K. and in countries in the European Union. Brexit has already and could continue to adversely affect European and/or worldwide economic and market conditions and could continue to contribute to instability in the global financial markets. The long-term effects of Brexit will depend in part on any agreements the U.K. makes to retain access to markets in the European Union following the U.K.’s withdrawal from the European Union. In addition, we expect that Brexit could lead to legal uncertainty and potentially divergent national laws and regulations as the U.K. determines which European Union laws to replicate or replace. If the U.K. were to significantly alter its regulations affecting the food industry, we could face significant new costs. It may also be time-consuming and expensive for us to alter our internal operations in order to comply with new regulations. Additionally, Moy Park’s results of operations may be adversely affected if the U.K. is unable to secure replacement trade agreements and arrangements on terms as favorable as those currently enjoyed by the U.K. Any of the effects of Brexit could adversely affect our business, business opportunities, results of operations, financial condition and cash flows.
Item 1B.
Unresolved Staff Comments
None.
20
Item 2.
Properties
Operating Facilities
Our main operating facilities are as follows:
|
Operating
|
Idled
|
Capacity
(a)
|
Unit of measure
|
Average Capacity Utilization
(b)
|
||||||||||
|
Legacy Pilgrim’s Facilities:
|
||||||||||||||
|
U.S. Facilities
|
||||||||||||||
|
Fresh processing plants
|
25
|
|
6
|
|
6.6 million
|
|
Birds per day
|
83.4
|
%
|
|||||
|
Prepared foods cook plants
|
4
|
|
2
|
|
393.7 million
|
|
Pounds per year
|
82.4
|
%
|
|||||
|
Feed mills
|
26
|
|
2
|
|
11.4 million
|
|
Tons per year
|
84.5
|
%
|
|||||
|
Hatcheries
|
32
|
|
3
|
|
2.3 billion
|
|
Eggs per year
|
83.6
|
%
|
|||||
|
Rendering
|
4
|
|
2
|
|
381,408
|
|
Tons per year
|
69.5
|
%
|
|||||
|
Pet food processing
|
4
|
|
—
|
|
79,144
|
|
Tons per year
|
47.0
|
%
|
|||||
|
Freezers
|
1
|
|
1
|
|
125,000
|
|
Square feet
|
N/A
|
|
|||||
|
Grain elevator
|
1
|
|
—
|
|
4.0 million
|
|
Bushels put through per year
|
100.0
|
%
|
|||||
|
U.K. and Europe Facilities
|
||||||||||||||
|
Fresh processing plants
|
4
|
|
—
|
|
0.9 million
|
|
Birds per day
|
94.3
|
%
|
|||||
|
Prepared foods cook plants
|
10
|
|
1
|
|
456.0 million
|
|
Pounds per year
|
80.7
|
%
|
|||||
|
Feed mills
|
3
|
|
—
|
|
0.7 million
|
|
Tons per year
|
100.0
|
%
|
|||||
|
Hatcheries
|
7
|
|
1
|
|
433.7 million
|
|
Eggs per year
|
91.0
|
%
|
|||||
|
Rendering
|
1
|
|
—
|
|
17,784
|
|
Tons per year
|
93.1
|
%
|
|||||
|
Puerto Rico Facilities
|
||||||||||||||
|
Fresh processing plant
|
1
|
|
—
|
|
0.1 million
|
|
Birds per day
|
68.2
|
%
|
|||||
|
Feed mill
|
1
|
|
—
|
|
0.1 million
|
|
Tons per year
|
61.5
|
%
|
|||||
|
Hatchery
|
1
|
|
—
|
|
27.0 million
|
|
Eggs per year
|
54.9
|
%
|
|||||
|
Rendering
|
1
|
|
—
|
|
8,204
|
|
Tons per year
|
38.0
|
%
|
|||||
|
Distribution center
|
1
|
|
—
|
|
N/A
|
|
N/A
|
|
||||||
|
Mexico Facilities
|
||||||||||||||
|
Fresh processing plants
|
6
|
|
—
|
|
1.1 million
|
|
Birds per day
|
86.3
|
%
|
|||||
|
Prepared foods cook plants
|
2
|
|
—
|
|
27.8 million
|
|
Kilograms per year
|
84.1
|
%
|
|||||
|
Feed mills
|
9
|
|
—
|
|
2.3 million
|
|
Tons per year
|
76.2
|
%
|
|||||
|
Hatcheries
|
10
|
|
—
|
|
515.6 million
|
|
Eggs per year
|
98.1
|
%
|
|||||
|
Rendering
|
3
|
|
—
|
|
54,240
|
|
Tons per year
|
65.3
|
%
|
|||||
|
Distribution centers
|
19
|
|
—
|
|
N/A
|
|
N/A
|
|
||||||
|
(a)
|
Capacity and utilization numbers do not include idled facilities.
|
|
(b)
|
Due to Hurricane Maria, our Puerto Rico Facilities only operated for approximately 38 weeks in 2017, greatly reducing the reported average capacity utilization for the year.
|
Other Facilities and Information
In the U.S., our corporate offices share a building with JBS in Greeley, Colorado. We own a building in Richardson, Texas, which houses our computer data center. We also own office buildings in Broadway, Virginia, and Pittsburg, Texas, which house additional administrative, sales and marketing, research and development, and other support functions. We lease building space in St. Cloud, Minnesota, which houses GNP administrative, sales and marketing, and other support functions. We also lease office buildings in Bentonville, Arkansas, Boulder, Colorado and Cincinnati, Ohio for members of our sales team and building space in Carrollton, Texas, which houses a second computer data center.
In Mexico, we own an office building in Gómez Palacio, Durango and lease an office building in Santiago de Querétaro, Querétaro, both of which house our Mexican administrative functions. We also lease office space in Mexico City that houses our Mexican marketing office.
21
In the U.K., we lease an office building in Craigavon, U.K., which houses administrative, sales, marketing and other support functions. We also lease space in Ballymena, U.K. that houses a research and development lab.
Most of our U.S. property, plant and equipment are pledged as collateral on our U.S. credit facilities. See “Item 7. Management’s Discussion and Analysis of Financial Condition and Results of Operations.”
Item 3.
Legal Proceedings
Tax Claims and Proceedings
In 2009, the IRS asserted claims against the Company in the Bankruptcy Court for the Northern District of Texas, Fort Worth Division, or the Bankruptcy Court, totaling $74.7 million. Following a series of objections and motions of opposition filed by both parties with the Bankruptcy Court, the Company worked with the IRS through the normal processes and procedures that are available to resolve the IRS’ claims. On December 12, 2012, the Company entered into two Stipulation of Settled Issues agreements with the IRS, or the Stipulations. The first Stipulation related to the Company’s 2003, 2005, and 2007 tax years and resolved all of the material issues in the case. The second Stipulation related to the Company as the successor in interest to Gold Kist Inc., or Gold Kist, for the tax years ended June 30, 2005 and September 30, 2005, and resolved all substantive issues in the case. These Stipulations accounted for approximately $29.3 million of the claims and should result in no additional tax due. The Company is currently working with the IRS to finalize the complete tax calculations associated with the Stipulations.
A Mexico subsidiary of the Company is currently appealing an unfavorable tax adjustment proposed by Mexican Tax Authorities due to an examination of a specific transaction undertaken by the Mexico subsidiary during tax years 2009 and 2010. At the time of the transaction the Company obtained a “should” level opinion from outside legal counsel representing no additional tax due as a result of the transaction. However, in February 2018, the Company received a new assessment from external legal counsel indicating an unfavorable outcome to the Company as reasonably possible. Amounts under appeal are
$24.3 million
and
$16.1 million
for tax years 2009 and 2010, respectively. No loss has been recorded for these amounts at this time.
Other Claims and Proceedings
Between September 2, 2016 and October 13, 2016, a series of purported class action lawsuits styled as
In re Broiler Chicken Antitrust Litigation
, Case No. 1:16-cv-08637 were filed with the U.S. District Court for the Northern District of Illinois against the Company and
13
other producers by and on behalf of direct and indirect purchasers of broiler chickens alleging violations of federal and state antitrust and unfair competition laws. The complaints seek, among other relief, treble damages for an alleged conspiracy among defendants to reduce output and increase prices of broiler chickens from the period of January 2008 to the present. The plaintiffs have filed three consolidated amended complaints: one on behalf of direct purchasers and two on behalf of distinct groups of indirect purchasers. The defendants, including the Company, filed motions to dismiss these actions. On November 20, 2017, the court denied all pending motions to dismiss with the exception of certain state-law claims by indirect purchasers that were dismissed or narrowed in scope. Discovery is proceeding and is currently scheduled to be complete by June 13, 2019. In December 2017 and January 2018 four individual complaints (
Affiliated Foods, Inc. v. Claxton Poultry Farms, Inc.
, Case No. 1:17-cv-08850;
Winn Dixie Stores, Inc. v. Koch Foods, Inc.
, Case No. 1:18-cv-00245;
Sysco Corp. v. Tyson Foods Inc., et al;
Case No. 1:18-cv-00700; and
U.S. Foods Inc.
v. Tyson Foods Inc., et al;
Case No. 1:18-cv-00702) were filed, mirroring the class action complaints. The class complaints were answered in January 2018. A schedule for answers to the individual complaints will be set and the court has indicated it intends to coordinate scheduling for the individual complaints with the class complaints to the greatest extent possible.
On October 10, 2016, Patrick Hogan, acting on behalf of himself and a putative class of persons who purchased shares of the Company’s stock between February 21, 2014 and October 6, 2016, filed a class action complaint in the U.S. District Court for the District of Colorado against the Company and its named executive officers. The complaint alleges, among other things, that the Company’s SEC filings contained statements that were rendered materially false and misleading by the Company’s failure to disclose that (i) the Company colluded with several of its industry peers to fix prices in the broiler-chicken market as alleged in the
In re Broiler Chicken Antitrust Litigation
, (ii) its conduct constituted a violation of federal antitrust laws, (iii) the Company’s revenues during the class period were the result of illegal conduct and (iv) that the Company lacked effective internal control over financial reporting, as well as stating that the Company’s industry was anticompetitive. On April 4, 2017, the court appointed another stockholder, George James Fuller, as lead plaintiff. On April 26, 2017, the court set a briefing schedule for the filing of an amended complaint and the defendants’ motion to dismiss. On May 11, 2017, the plaintiff filed an amended complaint, which extended the end date of the putative class period to November 17, 2016. Defendants moved to dismiss on June 12, 2017, and the plaintiff filed its opposition on July 12, 2017. Defendants filed their reply on August 1, 2017. The Colorado Court’s decision on the motion is pending.
22
On January 27, 2017, a purported class action on behalf of broiler chicken farmers was brought against the Company and
four
other producers in the Eastern District of Oklahoma alleging, among other things, a conspiracy to reduce competition for grower services and depress the price paid to growers. Plaintiffs allege violations of the Sherman Act and Packers and Stockyards Act and seek, among other relief, treble damages. The complaint was consolidated with a subsequently filed consolidated amended class action complaint styled as
In re Broiler Chicken Grower Litigation
, Case No. CIV-17-033-RJS. The defendants, including the Company, jointly moved to dismiss the consolidated amended complaint on September 9, 2017. During oral argument on January 19, 2018, the court considered and granted other defendants’ motions challenging jurisdiction and, as a result, granted the plaintiffs time to determine whether they will proceed forward with the case or dismiss the lawsuit. The plaintiffs have until Friday, February 2, 2018 to inform the district court of their plan course of action, and oral argument on remaining motions will be scheduled as necessary. In addition, on August 29, 2017, the Company filed a Motion to Enforce Confirmation Order Against Growers in the U.S. Bankruptcy Court in the Eastern district of Texas, seeking an order enjoining the
In re Broiler Chicken Grower Litigation
plaintiffs from pursuing the class action against the Company. A hearing on this motion was held in October 2017 and a second was scheduled for February 13, 2018. A court decision on this motion is pending.
On March 9, 2017, a stockholder derivative action styled as
DiSalvio v. Lovette
, et al., No. 2017 cv. 30207, was brought against all of the Company’s directors and its Chief Financial Officer, Fabio Sandri, in the District Court for the County of Weld in Colorado. The complaint alleges, among other things, that the named defendants breached their fiduciary duties by failing to prevent the Company and its officers from engaging in an antitrust conspiracy as alleged in the In re Broiler Chicken Antitrust Litigation, and issuing false and misleading statements as alleged in the Hogan class action litigation. On April 17, 2017, a related stockholder derivative action styled
Brima v. Lovette
, et al., No. 2017 cv. 30308, was brought against all of the Company’s directors and its Chief Financial Officer in the District Court for the County of Weld in Colorado. The Brima complaint contains largely the same allegations as the DiSalvio complaint. On May 4, 2017, the plaintiffs in both the DiSalvio and Brima actions moved to (i) consolidate the two stockholder derivative cases, (ii) stay the consolidated action until the resolution of the motion to dismiss in the Hogan putative securities class action, and (iii) appoint co-lead counsel. The court granted the motion on May 8, 2017, staying the proceedings pending resolution of the motion to dismiss in the Hogan action.
On January 10, 2018 a shareholder derivative action was filed in the U.S. District Court for the District of Colorado against the the Company, as nominal defendant, as well as the Company’s directors, its Chief Financial Officer, and majority shareholder
JBS S.A. in Raul v. Nogueira de Souza, et al
., Civil Action No. 18-cv-00069. The complaint alleges, among other things, that (i) defendants permitted the Company to omit material information from its proxy statements filed in 2014 through 2017 related to the conduct of former directors Wesley Mendonça Batista and Joesley Mendonça Batista and (ii) the individual defendants and JBS breached their fiduciary duties by failing to prevent the Company and its officers from engaging in an antitrust conspiracy as alleged in the Broiler Litigation and issuing false and misleading statements as alleged in the Hogan class action litigation. The defendants are currently in discussions with counsel for the Raul plaintiffs regarding the possibility of consolidating the Raul action with the consolidated state court derivative action, which is currently stayed, or in the alternative, determining a motion to dismiss briefing schedule.
On January 25, 2018, a stockholder derivative action styled as Sciabacucchi v. JBS S.A.et al., was brought against all of the Company’s directors, JBS S.A., JBS USA Holding and several members of the Batista family, in the Court of Chancery of the State of Delaware. The complaint alleges, among other things, that the named defendants breached their fiduciary duties in connection with the Moy Park acquisition.
The Company believes it has strong defenses in each of the above litigations and intends to contest them vigorously. The Company cannot predict the outcome of these actions nor when they will be resolved. If the plaintiffs were to prevail in any of these litigations, the Company could be liable for damages, which could be material and could adversely affect its financial condition or results of operations.
J&F Investigation
On May 3, 2017, certain officers of J&F Investimentos S.A. (“J&F,” and the companies controlled by J&F, the “J&F Group”) (including
two
former directors of the Company)
, a company organized in Brazil and an indirect controlling stockholder of the Company, entered into plea bargain agreements (the "Plea Bargain Agreements") with the Brazilian Federal Prosecutor's Office (
Ministério Público Federal
) ("MPF") in connection with certain illicit conduct involving improper payments made to Brazilian politicians, government officials and other individuals in Brazil committed by or on behalf of J&F and certain J&F Group companies. The details of such illicit conduct are set forth in separate annexes to the Plea Bargain Agreements, and include admissions of improper payments to politicians and political parties in Brazil over the last 10 years in exchange for receiving, or attempting to receive, favorable treatment for certain J&F Group companies in Brazil.
Pursuant to the terms of the Plea Bargain Agreements, the MPF agreed to grant immunity to the officers in exchange for such officers agreeing, among other considerations, to: (1) pay fines totaling R
$225.0 million
;
(2) cooperate with the MPF,
23
including providing supporting evidence of the illicit conduct identified in the annexes to the Plea Bargain Agreements; and (3) present any previously undisclosed illicit conduct within 120 days following the execution of the Plea Bargain Agreements as long as the description of such conduct had not been omitted in bad faith. In addition, the Plea Bargain Agreements provide that the MPF may terminate any Plea Bargain Agreement and request that the Supreme Court of Brazil (
Supremo Tribunal Federal
) ("STF") ratify such termination if any illicit conduct is identified that was not included in the annexes to the Plea Bargain Agreements.
On June 5, 2017, J&F, in its role as the controlling shareholder of the J&F Group, entered into a leniency agreement (the "Leniency Agreement") with the MPF, whereby J&F assumed responsibility for the conduct that was described in the annexes to the Plea Bargain Agreements. In connection with the Leniency Agreement, J&F has agreed to pay a fine of
R$10.3 billion
,
adjusted for inflation, over a 25- year period. In exchange, the MPF agreed not to initiate or propose any criminal, civil or administrative actions against J&F, the companies of the J&F Group or those officers of J&F with respect to such conduct. Pursuant to the terms of the Leniency Agreement, if the Plea Bargain Agreement is annulled by the STF, then the Leniency Agreement may also be terminated by the Fifth Chamber of Coordination and Reviews of the MPF or, solely with respect to the criminal related provisions of the Leniency Agreement, by the 10th Federal Court of the Federal District in Brasilia, the authorities responsible for the ratification of the Leniency Agreement.
On August 24, 2017, the Fifth Chamber ratified the Leniency Agreement. On September 8, 2017, the 10th Federal Court ratified the Leniency Agreement. In compliance with the terms of the Leniency Agreement, J&F is conducting an internal investigation involving improper payments made in Brazil by or on behalf of J&F, certain companies of the J&F Group and certain officers of J&F (including two former directors of the Company). J&F has engaged outside advisors to assist in conducting the investigation, including an assessment as to whether any of the misconduct disclosed to Brazilian authorities had any connection to the Company, or resulted in a violation of U.S. law. The internal investigation is ongoing and the Company is fully cooperating with J&F in connection with the investigation. We cannot predict when the investigation will be completed or the results of the investigation, including the outcome or impact of any government investigations or any resulting litigation.
On September 8, 2017, at the request of the MPF, the STF issued an order temporarily revoking the immunity from prosecution previously granted to Joesley Mendonça Batista and another executive of J&F in connection with the Plea Bargain Agreements. The MPF requested the revocation of their immunity following public disclosure of certain voice recordings involving them in which they discussed certain alleged illicit activities the MPF claims were not covered by the annexes to their respective Plea Bargain Agreements. On September 10, 2017, Joesley Mendonça Batista voluntarily turned himself into police in Brazil. On September 11, 2017, the 10th Federal Court suspended its ratification of the criminal provisions of the Leniency Agreement as a result of the STF's temporary revocation of Joesley Mendonça Batista immunity under his Plea Bargain Agreement. On October 11, 2017, Judge Vallisney de Souza of the 10th Federal Court revalidated the criminal provisions of the Leniency Agreement.
We cannot predict whether the Plea Bargain Agreements will be upheld or terminated by the STF, and, if terminated, whether the Leniency Agreement will be also terminated by either the Fifth Chamber and/or the 10th Federal Court, and to what extent. If the Leniency Agreement is terminated, in whole or in part, as a result of any Plea Bargain Agreement being terminated, this may materially adversely affect the public perception or reputation of the J&F Group, including the Company, and could have a material adverse effect on the J&F Group's business, financial condition, results of operations and prospects. Furthermore, the termination of the Leniency Agreement may cause the termination of certain stabilization agreements entered into by JBS S.A. and certain of its subsidiaries, which would permit the lenders of the debt that is the subject to the terms of the stabilization agreements to accelerate their debt, which could have a material adverse effect on JBS S.A. and its subsidiaries (including the Company).
Item 4.
Mine Safety Disclosures
None.
24
Market Information
Our common stock is listed on the NASDAQ Global Select Market (“NASDAQ”) under the symbol “PPC.” High and low closing prices of the Company’s common stock for 2017 and 2016 are as follows:
|
|
2017 Prices
|
2016 Prices
|
||||||||||||||
|
Quarter
|
High
|
Low
|
High
|
Low
|
||||||||||||
|
First
|
$
|
22.35
|
|
$
|
18.10
|
|
$
|
25.15
|
|
$
|
21.00
|
|
||||
|
Second
|
26.22
|
|
21.70
|
|
27.50
|
|
23.48
|
|
||||||||
|
Third
|
29.86
|
|
20.28
|
|
25.82
|
|
20.80
|
|
||||||||
|
Fourth
|
38.39
|
|
27.68
|
|
21.84
|
|
17.38
|
|
||||||||
Holders
The Company estimates there were approximately 37,200 holders (including individual participants in security position listings) of the Company’s common stock as of February 15, 2018.
Dividends
On May 18, 2016, the Company paid a special cash dividend from retained earnings of approximately $700 million, or $2.75 per share, to stockholders of record as of May 10, 2016. On February 17, 2015, the Company paid a special cash dividend from retained earnings of approximately $1.5 billion, or $5.77 per share, to stockholders of record as of January 30, 2015. The Company used proceeds from the U.S. Credit Facility, along with cash on hand, to fund both special cash dividends.
Notwithstanding the special cash dividends paid on May 18, 2016 and February 17, 2015, the Company has no current intention to pay any further dividends to its stockholders. Any change in dividend policy will depend upon future conditions, including earnings and financial condition, general business conditions, any applicable contractual limitations and other factors deemed relevant by our Board of Directors in its discretion.
Both the U.S. Credit Facility and the indentures governing the Company’s senior notes restrict, but do not prohibit, the Company from declaring dividends. The terms of Moy Park's indenture and the Moy Park Multicurrency Revolving Facility Agreement restrict Moy Park’s ability and the ability of certain of Moy Park’s subsidiaries to, among other things, make payments and distributions to us. See "Note 11. Long-Term Debt and Other Borrowing Arrangements” of our Consolidated and Combined Financial Statements included in this annual report for additional information.
Issuer Purchases of Equity Securities in 2017
On July 28, 2015, the Company’s Board of Directors approved a $150.0 million share repurchase authorization. The Company plans to repurchase shares through various means, which may include but are not limited to open market purchases, privately negotiated transactions, the use of derivative instruments and/or accelerated share repurchase programs. The share repurchase program was originally scheduled to expire on July 27, 2016. On February 10, 2016, the Company’s Board of Directors approved an increase of the share repurchase authorization to $300.0 million and an extension of the expiration date to February 9, 2017. The extent to which the Company repurchases its shares and the timing of such repurchases will vary and depend upon market conditions and other corporate considerations, as determined by the Company’s management team. The Company reserves the right to limit or terminate the repurchase program at any time without notice. For the fifty-three weeks ended December 31, 2017, the Company repurchased 0.8 million shares of its common stock under the program for an aggregate cost of $14.6 million and an average price of $18.78 per share. Since the inception of the program, the Company has repurchased 11.4 million shares of its common stock under the program for an aggregate cost of $231.8 million and an average price of $20.30 per share. Set forth below is information regarding our stock repurchases for the thirteen weeks ended December 31, 2017.
25
|
Issuer Purchases of Equity Securities
|
||||||||||||||
|
Period
|
Total Number of Shares Purchased
|
Average Price
Paid per Share |
Total Number of Shares Purchased as Part of Publicly Announced Plans or Programs
|
Approximate Dollar Value of the Shares That May Yet Be Purchased Under the Plans or Programs
|
||||||||||
|
September 25, 2017 through October 22, 2017
|
—
|
|
$
|
—
|
|
—
|
|
$
|
72,913,018
|
|
||||
|
October 23, 2017 through November 26, 2017
|
—
|
|
—
|
|
—
|
|
72,913,018
|
|
||||||
|
November 27, 2017 through December 31, 2017
|
—
|
|
—
|
|
—
|
|
72,913,018
|
|
||||||
|
Total
|
—
|
|
$
|
—
|
|
—
|
|
$
|
72,913,018
|
|
||||
Total Return on Registrant’s Common Equity
The graph below matches the cumulative 5-Year total return of holders of Pilgrim’s Pride Corporation’s common stock with the cumulative total returns of the Russell 2000 index and a customized peer group of three companies that includes: Hormel Foods Corp, Sanderson Farms Inc. and Tyson Foods Inc. The graph assumes that the value of the investment in our common stock, in each index, and in the peer group (including reinvestment of dividends) was $100 on December 30, 2012 and tracks it through December 31, 2017.
The graph covers the period from December 30, 2012 to December 31, 2017, and reflects the performance of the Company’s single class of common stock. The stock price performance represented by this graph is not necessarily indicative of future stock performance.
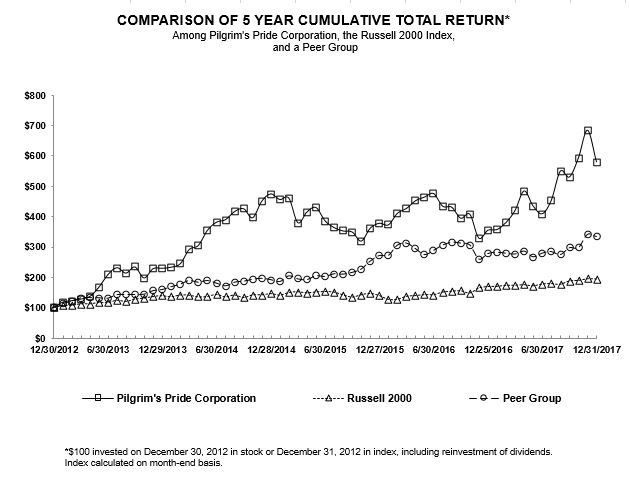
26
|
12/30/12
|
06/30/13
|
12/29/13
|
06/30/14
|
12/28/14
|
06/30/15
|
12/27/15
|
06/30/16
|
12/25/16
|
06/30/17
|
12/31/17
|
|||||||||||||||||||||||||||||||||
|
PPC
|
$
|
100.00
|
|
$
|
207.79
|
|
$
|
229.07
|
|
$
|
380.53
|
|
$
|
473.85
|
|
$
|
385.19
|
|
$
|
377.14
|
|
$
|
474.73
|
|
$
|
354.37
|
|
$
|
408.41
|
|
$
|
578.70
|
|
||||||||||
|
Russell 2000
|
100.00
|
|
115.86
|
|
138.82
|
|
143.25
|
|
145.62
|
|
152.54
|
|
139.19
|
|
142.27
|
|
168.85
|
|
177.27
|
|
193.58
|
|
|||||||||||||||||||||
|
Peer Group
|
100.00
|
|
130.78
|
|
159.09
|
|
180.22
|
|
191.67
|
|
202.24
|
|
271.06
|
|
287.87
|
|
277.45
|
|
278.99
|
|
332.78
|
|
|||||||||||||||||||||
Item 6.
Selected Financial Data
|
(In thousands, except ratios and per share data)
|
2017
|
2016
|
2015
|
2014
|
2013
|
||||||||||||||
|
Operating Results Data:
|
|||||||||||||||||||
|
Net sales
|
$
|
10,767,863
|
|
$
|
9,878,564
|
|
$
|
8,752,672
|
|
$
|
8,583,365
|
|
$
|
8,411,148
|
|
||||
|
Gross profit
(a)
|
1,471,614
|
|
1,103,983
|
|
1,298,724
|
|
1,393,995
|
|
845,439
|
|
|||||||||
|
Operating income
(a)
|
1,072,322
|
|
792,082
|
|
1,061,132
|
|
1,203,115
|
|
658,863
|
|
|||||||||
|
Interest expense, net
|
99,453
|
|
73,335
|
|
42,721
|
|
77,271
|
|
84,881
|
|
|||||||||
|
Loss on early extinguishment of debt
|
—
|
|
—
|
|
—
|
|
—
|
|
—
|
|
|||||||||
|
Income (loss) before income taxes
(a)
|
982,066
|
|
724,036
|
|
1,001,324
|
|
1,102,391
|
|
573,940
|
|
|||||||||
|
Income tax expense (benefit)
(b)
|
263,899
|
|
243,919
|
|
338,352
|
|
390,953
|
|
24,227
|
|
|||||||||
|
Net income
(a)
|
718,167
|
|
480,117
|
|
662,972
|
|
711,438
|
|
549,713
|
|
|||||||||
|
Net income (loss) attributable to noncontrolling interest
|
102
|
|
(803
|
)
|
48
|
|
(210
|
)
|
158
|
|
|||||||||
|
Net income attributable to Pilgrim’s Pride Corporation
(a)
|
694,579
|
|
440,532
|
|
645,914
|
|
711,648
|
|
549,555
|
|
|||||||||
|
Ratio of earnings to fixed charges
(c)
|
9.11x
|
|
8.86x
|
|
19.86x
|
|
12.96x
|
|
7.47x
|
|
|||||||||
|
Per Common Diluted Share Data:
|
|||||||||||||||||||
|
Net income attributable to Pilgrim’s Pride Corporation
|
$
|
2.79
|
|
$
|
1.73
|
|
$
|
2.50
|
|
$
|
2.74
|
|
$
|
2.12
|
|
||||
|
Adjusted net income
attributable to Pilgrim’s Pride Corporation
(d)
|
2.78
|
|
1.75
|
|
2.60
|
|
2.96
|
|
2.14
|
|
|||||||||
|
Book value
|
7.45
|
|
8.21
|
|
10.28
|
|
8.46
|
|
5.75
|
|
|||||||||
|
Balance Sheet Summary:
|
|
||||||||||||||||||
|
Working capital
|
1,063,765
|
|
624,728
|
|
1,090,129
|
|
1,138,177
|
|
845,584
|
|
|||||||||
|
Total assets
|
6,248,652
|
|
5,021,942
|
|
5,668,292
|
|
3,091,718
|
|
3,172,402
|
|
|||||||||
|
Notes payable and current maturities of long-term debt
|
47,775
|
|
15,712
|
|
28,108
|
|
262
|
|
410,234
|
|
|||||||||
|
Long-term debt, less current maturities
|
2,635,617
|
|
1,396,124
|
|
1,436,852
|
|
3,980
|
|
501,999
|
|
|||||||||
|
Total stockholders’ equity
|
1,855,661
|
|
2,086,132
|
|
2,659,875
|
|
2,196,801
|
|
1,492,602
|
|
|||||||||
|
Cash Flow Summary:
|
|||||||||||||||||||
|
Cash flows from operating activities
|
801,321
|
|
795,362
|
|
1,020,380
|
|
1,066,692
|
|
878,533
|
|
|||||||||
|
Depreciation and amortization
(e)
|
277,792
|
|
231,708
|
|
173,817
|
|
155,824
|
|
150,884
|
|
|||||||||
|
Impairment of goodwill and other assets
|
5,156
|
|
790
|
|
4,813
|
|
—
|
|
4,004
|
|
|||||||||
|
Purchases of investment securities
|
—
|
|
—
|
|
|
|
(55,100
|
)
|
(96,902
|
)
|
|||||||||
|
Proceeds from sale or maturity of investment securities
|
—
|
|
—
|
|
|
|
152,050
|
|
—
|
|
|||||||||
|
Acquisitions of property, plant and equipment
|
(339,872
|
)
|
(340,960
|
)
|
(190,262
|
)
|
(171,443
|
)
|
(116,223
|
)
|
|||||||||
|
Purchase of acquired business, net of cash acquired
|
(658,520
|
)
|
—
|
|
(373,532
|
)
|
—
|
|
—
|
|
|||||||||
|
Payment of cash dividends
|
—
|
|
(714,785
|
)
|
(1,498,470
|
)
|
—
|
|
—
|
|
|||||||||
|
Cash flows from financing activities
|
466,395
|
|
(828,219
|
)
|
(585,005
|
)
|
(905,595
|
)
|
(250,214
|
)
|
|||||||||
|
Other Data:
|
|||||||||||||||||||
|
EBITDA
(f)(g)
|
1,353,343
|
|
1,023,755
|
|
1,213,779
|
|
1,321,774
|
|
800,398
|
|
|||||||||
|
Adjusted EBITDA
(f)(g)
|
1,388,029
|
|
1,029,682
|
|
1,245,633
|
|
1,352,249
|
|
810,316
|
|
|||||||||
|
Key Indicators (as a percent of net sales):
|
|||||||||||||||||||
|
Gross profit
(a)
|
13.7
|
%
|
11.2
|
%
|
14.8
|
%
|
16.2
|
%
|
10.1
|
%
|
|||||||||
|
Selling, general and administrative expenses
|
3.6
|
%
|
3.1
|
%
|
2.6
|
%
|
2.2
|
%
|
2.2
|
%
|
|||||||||
|
Operating income
(a)
|
10.0
|
%
|
8.0
|
%
|
12.1
|
%
|
14.0
|
%
|
7.8
|
%
|
|||||||||
|
Interest expense, net
|
0.9
|
%
|
0.7
|
%
|
0.5
|
%
|
0.9
|
%
|
1.0
|
%
|
|||||||||
|
Net income
(a)
|
6.5
|
%
|
4.5
|
%
|
7.4
|
%
|
8.3
|
%
|
6.5
|
%
|
|||||||||
|
(a)
|
Operating income and net income include the following restructuring charges for each of the years presented:
|
|
2017
|
2016
|
2015
|
2014
|
2013
|
||||||||||
|
(In millions)
|
||||||||||||||
|
Additional effect on operating income:
|
||||||||||||||
|
Administrative restructuring charges
|
(9.8
|
)
|
(1.1
|
)
|
(5.8
|
)
|
(2.3
|
)
|
(5.7
|
)
|
||||
27
|
(b)
|
Income tax expense in 2017, 2016, 2015 and 2014 resulted primarily from expense recorded on our year-to-date income. Income tax expense in 2013 resulted primarily from expense recorded on our year-to-date income offset by a decrease in valuation allowance as a result of year-to-date earnings.
|
|
(c)
|
For purposes of computing the ratio of earnings to fixed charges, earnings consist of income before income taxes plus fixed charges (excluding capitalized interest). Fixed charges consist of interest (including capitalized interest) on all indebtedness, amortization of capitalized financing costs and that portion of rental expense that we believe to be representative of interest.
|
|
(d)
|
Adjusted net income attributable to Pilgrim’s Pride Corporation per common diluted share is presented because it is used by us and we believe it is frequently used by securities analysts, investors and other interested parties, in addition to and not in lieu of results prepared in conformity with GAAP, to compare the performance of companies. Adjusted net income attributable to Pilgrim’s Pride Corporation per common diluted share is not a measurement of financial performance under GAAP, has limitations as an analytical tool and should not be considered in isolation or as a substitute for an analysis of our results as reported under GAAP. It does not reflect the impact of earnings or charges resulting from matters we consider to not be indicative of our ongoing operations.
|
A reconciliation of net income attributable to Pilgrim’s Pride Corporation per common diluted share to adjusted net income attributable to Pilgrim’s Pride Corporation per common diluted share is as follows:
|
2017
|
2016
|
2015
|
2014
|
2013
|
|||||||||||||||
|
(In thousands except per share data)
|
|||||||||||||||||||
|
Net income attributable to Pilgrim’s Pride Corporation
|
$
|
694,579
|
|
$
|
440,532
|
|
$
|
645,914
|
|
$
|
711,648
|
|
$
|
549,555
|
|
||||
|
Loss on early extinguishment of debt
|
—
|
|
—
|
|
1,470
|
|
29,475
|
|
—
|
|
|||||||||
|
Foreign currency transaction losses (gains)
|
(2,659
|
)
|
4,055
|
|
26,148
|
|
27,979
|
|
4,415
|
|
|||||||||
|
Adjusted net income attributable to Pilgrim’s Pride Corporation
|
691,920
|
|
444,587
|
|
673,532
|
|
769,102
|
|
553,970
|
|
|||||||||
|
Weighted average diluted shares of common stock outstanding
|
248,971
|
|
254,126
|
|
258,676
|
|
259,471
|
|
259,241
|
|
|||||||||
|
Adjusted net income attributable to Pilgrim’s Pride Corporation
per common diluted share
|
$
|
2.78
|
|
$
|
1.75
|
|
$
|
2.60
|
|
$
|
2.96
|
|
$
|
2.14
|
|
||||
|
(e)
|
Includes amortization of capitalized financing costs of approximately $6.0 million, $5.3 million, $4.1 million, $13.7 million, and $9.3 million in 2017, 2016, 2015, 2014, and 2013, respectively.
|
|
(f)
|
“EBITDA” is defined as the sum of net income (loss) plus interest, taxes, depreciation and amortization. “Adjusted EBITDA” is calculated by adding to EBITDA certain items of expense and deducting from EBITDA certain items of income that we believe are not indicative of our ongoing operating performance consisting of: (i) net income (loss) attributable to noncontrolling interests in the period from 2013 through 2017, (ii) restructuring charges in the period from 2013 through 2017, (iii) foreign currency transaction losses (gains) in the period from 2013 through 2017 and (iv) transaction costs related to the Moy Park acquisition in 2017. EBITDA is presented because it is used by us and we believe it is frequently used by securities analysts, investors and other interested parties, in addition to and not in lieu of results prepared in conformity with GAAP, to compare the performance of companies. We believe investors would be interested in our Adjusted EBITDA because this is how our management analyzes EBITDA applicable to continuing operations. We also believe that Adjusted EBITDA, in combination with our financial results calculated in accordance with GAAP, provides investors with additional perspective regarding the impact of certain significant items on EBITDA and facilitates a more direct comparison of its performance with its competitors. EBITDA and Adjusted EBITDA are not measurements of financial performance under GAAP. EBITDA and Adjusted EBITDA have limitations as analytical tools and should not be considered in isolation or as substitutes for an analysis of our results as reported under GAAP. Some of the limitations of these measures are:
|
|
•
|
They do not reflect our cash expenditures, future requirements for capital expenditures or contractual commitments;
|
|
•
|
They do not reflect changes in, or cash requirements for, our working capital needs;
|
|
•
|
They do not reflect the significant interest expense or the cash requirements necessary to service interest or principal payments on our debt;
|
|
•
|
Although depreciation and amortization are non-cash charges, the assets being depreciated and amortized will often have to be replaced in the future, and EBITDA and Adjusted EBITDA do not reflect any cash requirements for such replacements;
|
|
•
|
They are not adjusted for all non-cash income or expense items that are reflected in our statements of cash flows;
|
|
•
|
EBITDA does not reflect the impact of earnings or charges attributable to noncontrolling interests;
|
|
•
|
They do not reflect the impact of earnings or charges resulting from matters we consider to not be indicative of our ongoing operations; and
|
|
•
|
They do not reflect limitations on or costs related to transferring earnings from our subsidiaries to us.
|
|
(g)
|
In addition, other companies in our industry may calculate these measures differently than we do, limiting their usefulness as a comparative measure. Because of these limitations, EBITDA and Adjusted EBITDA should not be considered as an alternative to cash flow from operating activities or as a measure of liquidity or an alternative to net income as indicators of our operating performance or any other measures of performance derived in accordance with GAAP. You should compensate for these limitations by relying primarily on our GAAP results and using EBITDA and Adjusted EBITDA only on a supplemental basis.
|
28
A reconciliation of net income to EBITDA and Adjusted EBITDA is as follows:
|
2017
|
2016
|
2015
|
2014
|
2013
|
|||||||||||||||
|
|
(In thousands)
|
||||||||||||||||||
|
Net income
|
$
|
718,167
|
|
$
|
480,117
|
|
$
|
662,972
|
|
$
|
711,438
|
|
$
|
549,713
|
|
||||
|
Add:
|
|||||||||||||||||||
|
Interest expense, net
(a)
|
99,453
|
|
73,335
|
|
42,721
|
|
77,271
|
|
84,881
|
|
|||||||||
|
Income tax expense (benefit)
|
263,899
|
|
243,919
|
|
338,352
|
|
390,953
|
|
24,227
|
|
|||||||||
|
Depreciation and amortization
(b)
|
277,792
|
|
231,708
|
|
173,817
|
|
155,824
|
|
150,884
|
|
|||||||||
|
Minus:
|
|||||||||||||||||||
|
Amortization of capitalized financing costs
(c)
|
5,968
|
|
5,324
|
|
4,083
|
|
13,712
|
|
9,307
|
|
|||||||||
|
EBITDA
|
1,353,343
|
|
1,023,755
|
|
1,213,779
|
|
1,321,774
|
|
800,398
|
|
|||||||||
|
Add:
|
|||||||||||||||||||
|
Foreign currency transaction losses (gains)
(d)
|
(2,659
|
)
|
4,055
|
|
26,148
|
|
27,979
|
|
4,415
|
|
|||||||||
|
Restructuring charges
(e)
|
9,775
|
|
1,069
|
|
5,754
|
|
2,286
|
|
5,661
|
|
|||||||||
|
Transaction costs related to the Moy Park acquisition
|
19,606
|
|
—
|
|
—
|
|
—
|
|
—
|
|
|||||||||
|
Puerto Rico hurricane impact
|
8,066
|
|
—
|
|
—
|
|
—
|
|
—
|
|
|||||||||
|
Minus:
|
|||||||||||||||||||
|
Net income (loss) attributable to noncontrolling interest
|
102
|
|
(803
|
)
|
48
|
|
(210
|
)
|
158
|
|
|||||||||
|
Adjusted EBITDA
|
$
|
1,388,029
|
|
$
|
1,029,682
|
|
|
$
|
1,245,633
|
|
|
$
|
1,352,249
|
|
|
$
|
810,316
|
|
|
|
(a)
|
Interest expense, net, consists of interest expense less interest income.
|
|
(b)
|
2013 includes $0.4 million of asset impairments not included in restructuring charges.
|
|
(c)
|
Amortization of capitalized financing costs is included in both interest expense, net and depreciation and amortization above.
|
|
(d)
|
The Company measures the financial statements of its Mexico subsidiaries as if the U.S. dollar were the functional currency. Accordingly, we remeasure assets and liabilities, other than nonmonetary assets, of the Mexico subsidiaries at current exchange rates. We remeasure nonmonetary assets using the historical exchange rate in effect on the date of each asset’s acquisition. Currency exchange gains or losses resulting from these remeasurements are included in the line item
Foreign currency transaction losses (gains)
in the Consolidated and Combined Statements of Income.
|
|
(e)
|
Restructuring charges includes tangible asset impairment, severance and change-in-control compensation costs, and losses incurred on both the sale of unneeded broiler eggs and flock depletion.
|
29
Item 7.
Management’s Discussion and Analysis of Financial Condition and Results of Operations
Our Company
We are one of the largest chicken producers in the world, with operations in the United States (“U.S.”), United Kingdom (“U.K.”), Mexico, France, Puerto Rico, and The Netherlands. We are primarily engaged in the production, processing, marketing and distribution of fresh, frozen and value-added chicken products to retailers, distributors and foodservice operators. We offer a wide range of products to our customers through strong national and international distribution channels. Pilgrim’s fresh chicken products consist of refrigerated (non-frozen) whole chickens, whole cut-up chickens and selected chicken parts that are either marinated or non-marinated. The Company's prepared chicken products include fully cooked, ready-to-cook and individually frozen chicken parts, strips, nuggets and patties, some of which are either breaded or non-breaded and either marinated or non-marinated, ready-to-eat meals, multi-protein frozen foods, vegetarian foods and desserts.
We market our balanced portfolio of fresh, prepared and value-added chicken products to a diverse set of over 5,500 customers across the U.S., the U.K. and Europe, Mexico and in approximately
100
other countries, with no single customer accounting for more than 10% of total sales. We have become a valuable partner to our customers and a recognized industry leader by consistently providing high-quality products and services designed to meet their needs and enhance their business. Our sales efforts are largely targeted towards the foodservice industry, principally chain restaurants and food processors, such as Chick‑fil‑A
®
and retail customers, including grocery store chains and wholesale clubs, such as Kroger
®
, Costco®, Publix®, and H-E-B®.
As a vertically integrated company, we control every phase of the production process, which helps us better manage food safety and quality, as well as more effectively control margins and improve customer service. We operate feed mills, hatcheries, processing plants and distribution centers in 14 U.S. states, the U.K. and Europe, Puerto Rico and Mexico. Our plants are strategically located to ensure that customers timely receive fresh products. With our global network of approximately
5,200
growers, 39 feed mills, 50 hatcheries, 36 processing plants, 16 prepared foods cook plants, 20 distribution centers, nine rendering facilities and four pet food plants, we believe we are well-positioned to supply the growing demand for our products.
Our U.K. and Europe segment reflects the operations of Granite Holdings Sàrl and its subsidiaries (together, “Moy Park”), which we acquired on September 8, 2017. Moy Park is a leading and highly regarded U.K. food company, providing fresh, high quality and locally farmed poultry and convenience food products. Moy Park has operated in the U.K. retail market for over 50 years and delivers a range of fresh, ready-to-cook, coated and ready-to-eat poultry products to major retailers and large foodservice customers throughout the United Kingdom, Ireland, France and The Netherlands. We believe that we operate one of the most efficient business models for chicken production in the U.K. and Europe.
We are one of the largest, and we believe one of the most efficient, producers and sellers of chicken in Mexico. Our presence in Mexico provides access to a market with growing demand and has enabled us to leverage our operational strengths within the region. The market for chicken products in Mexico is still developing, with most sales attributed to fresh, commodity-oriented, market price-based business. Additionally, we are an important player in the live market in Mexico. We believe our Mexico business is well positioned to continue benefiting from these trends in the Mexican consumer market.
As of December 31, 2017, we had approximately 51,300 employees and the capacity to process more than
45.2 million
birds per week for a total of more than
13.3 billion
pounds of live chicken annually. In 2017, we produced 10.0 billion pounds of chicken products, generating approximately
$10.8 billion
in net sales and approximately
$694.6 million
in net income attributable to Pilgrim’s.
We operate on a 52/53-week fiscal year that ends on the Sunday falling on or before December 31. Any reference we make to a particular year (for example, 2017) in this report applies to our fiscal year and not the calendar year. Fiscal 2017 was a 53-week fiscal year.
30
Executive Summary
We reported net income attributable to Pilgrim’s Pride Corporation of
$694.6 million
, or
$2.79
per diluted common share, for 2017. These operating results included gross profit of
$1,471.6 million
. During 2017, we generated
$801.3 million
of cash from operations.
The following table compares the highest and lowest prices reached on nearby futures for one bushel of corn and one ton of soybean meal during the current year and previous two years:
|
Corn
|
Soybean Meal
|
||||||||||||||
|
Highest
Price
|
Lowest Price
|
Highest Price
|
Lowest Price
|
||||||||||||
|
2017:
|
|||||||||||||||
|
Fourth Quarter
|
$
|
3.68
|
|
$
|
3.47
|
|
$
|
346.30
|
|
$
|
315.50
|
|
|||
|
Third Quarter
|
4.15
|
|
3.46
|
|
346.20
|
|
296.50
|
|
|||||||
|
Second Quarter
|
3.96
|
|
3.66
|
|
321.00
|
|
297.20
|
|
|||||||
|
First Quarter
|
3.86
|
|
3.55
|
|
352.70
|
|
314.10
|
|
|||||||
|
2016:
|
|||||||||||||||
|
Fourth Quarter
|
3.98
|
|
3.58
|
|
320.70
|
|
269.00
|
|
|||||||
|
Third Quarter
|
3.94
|
|
3.16
|
|
401.00
|
|
302.80
|
|
|||||||
|
Second Quarter
|
4.38
|
|
3.52
|
|
418.30
|
|
266.80
|
|
|||||||
|
First Quarter
|
3.73
|
|
3.52
|
|
275.30
|
|
257.20
|
|
|||||||
|
2015:
|
|||||||||||||||
|
Fourth Quarter
|
3.98
|
|
3.58
|
|
320.70
|
|
269.00
|
|
|||||||
|
Third Quarter
|
4.34
|
|
3.48
|
|
374.80
|
|
302.40
|
|
|||||||
|
Second Quarter
|
4.10
|
|
3.53
|
|
326.40
|
|
286.50
|
|
|||||||
|
First Quarter
|
4.13
|
|
3.70
|
|
377.40
|
|
317.50
|
|
|||||||
We purchase derivative financial instruments, specifically exchange-traded futures and options, in an attempt to mitigate price risk related to our anticipated consumption of commodity inputs such as corn, soybean meal, wheat, soybean oil and natural gas. We will sometimes purchase a derivative instrument to minimize the impact of a commodity’s price volatility on our operating results. We will also purchase derivative financial instruments in an attempt to mitigate currency exchange rate exposure related to the financial statements of our Mexico segment that are denominated in Mexican pesos and our U.K. and Europe segment that are denominated in British pounds.
For our Mexico segment, we do not designate derivative financial instruments that we purchase to mitigate commodity purchase or currency exchange rate exposures as cash flow hedges; therefore, we recognize changes in the fair value of these derivative financial instruments immediately in earnings.
For our U.K. and Europe segment, we do designate certain derivative financial instruments that we have purchased to mitigate foreign currency transaction exposures as cash flow hedges; therefore, before the settlement date of the financial derivative instruments, we recognize changes in the fair value of the effective portion of the cash flow hedge in accumulated other comprehensive income (loss) while we recognize changes in the fair value of the ineffective portion immediately in earnings. When the derivative financial instruments associated with the effective portion are settled, the amount in accumulated other comprehensive income (loss) is then reclassified to earnings. Gains or losses related to these derivative financial instruments are included in the line item
Cost of sales
in the Consolidated and Combined Statements of Income.
We recognized
$6.7 million
in net gains related to changes in the fair value of our derivative financial instruments during 2017. We recognized
$4.3 million
in net losses and
$21.6 million
in net gains related to changes in the fair value of our derivative financial instruments during
2016
and
2015
, respectively.
Although changes in the market price paid for feed ingredients impact cash outlays at the time we purchase the ingredients, such changes do not immediately impact cost of sales. The cost of feed ingredients is recognized in cost of sales, on a first-in-first-out basis, at the same time that the sales of the chickens that consume the feed grains are recognized. Thus, there is a lag between the time cash is paid for feed ingredients and the time the cost of such feed ingredients is reported in cost of goods sold. For example, corn delivered to a feed mill and paid for one week might be used to manufacture feed the following week. However,
31
the chickens that eat that feed might not be processed and sold for another 42 to 63 days, and only at that time will the costs of the feed consumed by the chickens become included in cost of goods sold.
Commodities such as corn, soybean meal, and soybean oil are actively traded through various exchanges with future market prices quoted on a daily basis. These quoted market prices, although a good indicator of the commodity's base price, do not represent the final price for which we can purchase these commodities. There are several components in addition to the quoted market price, such as freight, storage and seller premiums, that are included in the final price that we pay for grain. Although changes in quoted market prices may be a good indicator of the commodity’s base price, the components mentioned above may have a significant impact on the total change in grain costs recognized from period to period.
Market prices for chicken products are currently at levels sufficient to offset the costs of feed ingredients. However, there can be no assurance that chicken prices will not decrease due to such factors as competition from other proteins and substitutions by consumers of non-protein foods because of uncertainty surrounding the general economy and unemployment.
Recent Developments
Moy Park Acquisition.
On September 8, 2017, we acquired 100% of the issued and outstanding shares of Moy Park from JBS S.A. for cash of $301.3 million and a note payable to the seller in the amount of £562.5 million. Moy Park is one of the top-ten food companies in the U.K., Northern Ireland's largest private sector business and one of Europe's leading poultry producers. With 4 fresh processing plants, 10 prepared foods cook plants, 3 feed mills, 7 hatcheries and 1 rendering facility in the U.K., France and The Netherlands, the acquired business processes 6.0 million birds per seven-day work week, in addition to producing around 456.0 million pounds of prepared foods per year. Moy Park currently has approximately 10,200 employees. See “Note 2. Business Acquisitions” of our Consolidated and Combined Financial Statements included in this annual report for additional information relating to this acquisition. The Moy Park operations constitutes our U.K. and Europe segment.
The acquisition was treated as a common-control transaction under U.S. GAAP. A common-control transaction is a transfer of net assets or an exchange of equity interests between entities under the control of the same parent. The accounting and reporting for a transaction between entities under common control is not to be considered a business combination under U.S. GAAP. Accordingly, for the period from September 30, 2015 through September 7, 2017, the Consolidated and Combined Financial Statements includes the accounts of the Company and its majority-owned subsidiaries combined with the accounts of Moy Park. For the period from September 8, 2017 through September 24, 2017, the Consolidated and Combined Financial Statements includes the accounts of the Company and its majority-owned subsidiaries, including Moy Park.
GNP Acquisition
. On January 6, 2017, we acquired
100%
of the membership interests of GNP from Maschhoff Family Foods, LLC for a cash purchase price of $350 million, subject to customary working capital adjustments. GNP is a vertically integrated poultry business based in St. Cloud, Minnesota. The acquired business has a production capacity of
2.1 million
birds per five-day work week in its
two
plants and currently employs approximately
1,500
people. This acquisition further strengthens our strategic position in the U.S. chicken market. The GNP operations are included in our U.S. segment.
2017 Tax Reform
On December 22, 2017, the U.S. government enacted comprehensive tax legislation (the “Tax Act”), which significantly revises the ongoing U.S. corporate income tax law by lowering the U.S. federal corporate income tax rate from
35.0%
to
21.0%
, implementing a territorial tax system, imposing one-time tax on foreign unremitted earnings and setting limitations on deductibility of certain costs (e.g., interest expense), among other things.
Due to the complexities involved in accounting for the recently enacted Tax Act, the U.S. Securities and Exchange Commission’s Staff Accounting Bulletin (“SAB”) 118, requires that the Company include in its financial statements the reasonable estimate of the impact of the Tax Act on earnings to the extent such reasonable estimate has been determined. Accordingly, the Company accrued
$41.5 million
in provisional tax benefit related to the net change in deferred tax liabilities stemming from the Tax Act’s reduction of the U.S. federal tax rate from
35.0%
to
21.0%
for the year ended December 31, 2017. Additionally, the Company is currently estimating a zero tax liability on foreign unremitted earnings due to a net earnings and profits (“E&P”) deficit on accumulated post-1986 deferred foreign income. Therefore, the Company has not accrued any amount of tax expense for the Tax Act’s one-time transition tax on the foreign subsidiaries’ accumulated, unremitted earnings going back to 1986 for the year ended December 31, 2017. The Company will continue to analyze historical E&P on accumulated post-1986 deferred foreign income and will record any resulting tax adjustment during 2018. All other accounting as required by the Tax Act as of December 31, 2017 is complete
The Tax Act also includes a provision to tax global intangible low-taxed income (“GILTI”) of foreign subsidiaries and a base erosion anti-abuse tax (“BEAT”) measure that taxes certain payments between a U.S. corporation and its subsidiaries. The Company may be subject to the GILTI and BEAT provisions effective beginning January 1, 2018 and is in the process of analyzing their effects, including how to account for the GILTI provision from an accounting policy standpoint.
32
The final impact on the Company from the Tax Act’s transition tax legislation may differ from the aforementioned one-time transition tax amount due to the complexity of calculating and supporting with primary evidence such U.S. tax attributes as accumulated foreign earnings and profits, foreign tax paid, and other tax components involved in foreign tax credit calculations for prior years back to 1986. Such differences could be material, due to, among other things, changes in interpretations of the Tax Act, future legislative action to address questions that arise because of the Tax Act, changes in accounting standards for income taxes or related interpretations in response to the Tax Act, or any updates or changes to estimates the company has utilized to calculate the one-time transition tax.
Business Segment and Geographic Reporting
We operate in
three
reportable business segments: the U.S., the U.K. and Europe, and Mexico. We measure segment profit as operating income. Corporate expenses are allocated to Mexico based upon various apportionment methods for specific expenditures incurred related thereto with the remaining amounts allocated to the U.S. For additional information, see “Note 21. Business Segment and Geographic Reporting” of our Consolidated and Combined Financial Statements included in this annual report.
33
Results of Operations
2017 Compared to 2016
Net sales.
Net sales for 2017 increased $889.3 million, or 9.0%, from 2016. The following table provides additional information regarding net sales:
|
|
|
Change from 2016
|
|
|||||||||
|
Source of net sales
|
2017
|
Amount
|
Percent
|
|
||||||||
|
|
(In thousands, except percent data)
|
|
||||||||||
|
United States
|
$
|
7,443,222
|
|
$
|
771,819
|
|
11.6
|
%
|
(a)
|
|||
|
U.K. and Europe
|
1,996,319
|
|
48,878
|
|
2.5
|
%
|
(b)
|
|||||
|
Mexico
|
1,328,322
|
|
68,602
|
|
5.4
|
%
|
(c)
|
|||||
|
Total net sales
|
$
|
10,767,863
|
|
$
|
889,299
|
|
9.0
|
%
|
||||
|
(a)
|
U.S. net sales generated in 2017 increased $771.8 million, or 11.6%, from U.S. net sales generated in 2016 primarily because of net sales generated by the recently acquired GNP operations and an increase in net sales per pound experienced by our existing customers offset by a decrease in sales volume. The impact of the acquired business contributed $433.9 million, or 6.5 percentage points, to the increase in net sales. Higher net sales per pound, which resulted primarily from higher market prices, contributed $533.0 million, or 8.0 percentage points, to the net sales increase. Decreased sales volume, which resulted from the unfavorable impact that ongoing operational improvements in one of our prepared foods facilities had on production, the conversion of our Sanford, North Carolina facility to an organic operation, as well as more deboning of leg quarters in several of our facilities, offset the overall net sales increase by $195.2 million, or 2.9 percentage points. Included in U.S. sales generated during 2017 and 2016 were sales to JBS USA Food Company totaling $15.3 million and $16.5 million, respectively.
|
|
(b)
|
U.K. and Europe sales generated in 2017 increased $48.9 million, or 2.5%, from U.K. and Europe sales generated in 2016, primarily because of an increase in sales volume and an increase in net sales per pound partially offset by the impact of foreign currency translation. The increase in sales volume contributed $80.5 million, or 4.1 percentage points, to the increase in U.K. and Europe net sales. The increase in net sales per pound contributed $151.6 million, or 7.8 percentage points, to the increase in U.K. and Europe net sales. The increase to net sales was partially offset by the impact of foreign currency translation, which reduced U.K. and Europe net sales by $183.3 million, or 9.4 percentage points. Other factors affecting the increase in U.K. and Europe net sales were individually immaterial.
|
|
(c)
|
Mexico sales generated in 2017 increased $68.6 million, or 5.4%, from Mexico sales generated in 2016, primarily because of an increase in sales volume and an increase in net sales per pound partially offset by the impact of foreign currency translation. The increase in sales volume contributed $50.1 million, or 4.0 percentage points, to the increase in Mexico net sales. The increase in net sales per pound contributed $69.6 million, or 5.5 percentage points, to the increase in Mexico net sales. The impact of foreign currency translation partially offset the overall net sales increase by $51.1million, or 4.1 percentage points. Other factors affecting the increase in Mexico net sales were individually immaterial.
|
Gross profit.
Gross profit increased by $367.6 million, or 33.3%, from $1.1 billion generated in 2016 to $1.5 billion generated in 2017. The following tables provide gross profit information:
|
|
|
Change from 2016
|
Percent of Net Sales
|
|
||||||||||||||
|
Components of gross profit
|
2017
|
Amount
|
Percent
|
2017
|
2016
|
|
||||||||||||
|
|
(In thousands, except percent data)
|
|
||||||||||||||||
|
Net sales
|
$
|
10,767,863
|
|
$
|
889,299
|
|
9.0
|
%
|
100.0
|
%
|
100.0
|
%
|
||||||
|
Cost of sales
|
9,296,249
|
|
521,668
|
|
5.9
|
%
|
86.3
|
%
|
88.8
|
%
|
(a)(b)
|
|||||||
|
Gross profit
|
$
|
1,471,614
|
|
$
|
367,631
|
|
33.3
|
%
|
13.7
|
%
|
11.2
|
%
|
||||||
|
Sources of gross profit
|
2017
|
Change from 2016
|
||||||||||
|
Amount
|
Percent
|
|||||||||||
|
|
(In thousands, except percent data)
|
|||||||||||
|
United States
|
$
|
1,094,811
|
|
$
|
352,726
|
|
47.5
|
%
|
||||
|
U.K. and Europe
|
188,180
|
|
(1,443
|
)
|
(0.8
|
)%
|
||||||
|
Mexico
|
188,528
|
|
16,348
|
|
9.5
|
%
|
||||||
|
Elimination
|
95
|
|
—
|
|
—
|
%
|
(c)
|
|||||
|
Total gross profit
|
$
|
1,471,614
|
|
$
|
367,631
|
|
33.3
|
%
|
||||
34
|
Sources of cost of sales
|
2017
|
Change from 2016
|
||||||||||
|
Amount
|
Percent
|
|||||||||||
|
|
(In thousands, except percent data)
|
|||||||||||
|
United States
|
$
|
6,348,411
|
|
$
|
419,093
|
|
7.1
|
%
|
(a)
|
|||
|
U.K. and Europe
|
1,808,139
|
|
50,321
|
|
2.9
|
%
|
(b)
|
|||||
|
Mexico
|
1,139,794
|
|
52,254
|
|
4.8
|
%
|
(c)
|
|||||
|
Elimination
|
(95
|
)
|
—
|
|
—
|
%
|
(d)
|
|||||
|
Total cost of sales
|
$
|
9,296,249
|
|
$
|
521,668
|
|
5.9
|
%
|
||||
|
(a)
|
Cost of sales incurred by our U.S. operations in 2017 increased $419.1 million, or 7.1%, from cost of sales incurred by our U.S. operations in 2016. Cost of sales primarily increased because of costs incurred by the acquired GNP operations and, to a lesser extent, by increases in cost of sales incurred by our existing U.S. operations. Cost of sales incurred by the acquired GNP operations contributed $363.5 million, or 6.2 percentage points, to the increase in U.S. cost of sales. Cost of sales related to the existing U.S. operations increased due to $88.7 million in increased labor costs, $25.7 million in increased chick costs, $19.7 million in increased depreciation, $19.1 million in increased health care costs and $25.7 million in increased freight. These increases were offset by associated lower sales volume, a $79.6 million decrease in feed ingredients costs and $20.6 million of commodity derivative gains. Other factors affecting U.S. cost of sales were individually immaterial.
|
|
(b)
|
Cost of sales incurred by the U.K. and Europe operations during 2017 increased $50.3 million, or 2.9%, from cost of sales incurred by the U.K. and Europe operations during 2016 primarily because of increased sales volume and a $64.5 million increase in feed ingredient costs. U.K. and Europe cost of sales also increased because of a $4.5 million increase in freight and storage costs, a $3.5 million increase in other costs, and a $0.8 million increase in utilities costs. These costs were partially offset by a decline in depreciation of $15.4 million and a decline of wages and benefits by $8.3 million from 2016 amounts. Other factors affecting cost of sales were individually immaterial.
|
|
(c)
|
Cost of sales incurred by the Mexico operations during 2017 increased $52.3 million, or 4.8%, from cost of sales incurred by the Mexico operations during 2016 primarily because of increased sales volume and a $37.1 million increase in contract services. Mexico cost of sales also increased because of a $12.9 million increase in wages and benefits, a $9.3 million increase in warehousing costs, an $8.6 million increase in utilities costs, a $6.6 million increase in transportation costs and a $1.8 million increase in in depreciation and amortization costs. These costs were partially offset by the $21.5 million favorable impact of foreign currency translation on inventory, a $1.3 million gain in commodity derivatives and a $1.1 million decrease in travel and entertainment costs. Other factors affecting cost of sales were individually immaterial.
|
|
(d)
|
Our Consolidated and Combined Financial Statements include the accounts of our company and its majority owned subsidiaries. We eliminate all significant affiliate accounts and transactions upon consolidation.
|
Operating income.
Operating income increased $280.2 million, or 35.4%, from $792.1 million generated for 2016 to $1.1 billion generated for 2017. The following tables provide operating income information:
|
|
|
Change from 2016
|
Percent of Net Sales
|
|
||||||||||||||
|
Components of operating income
|
2017
|
Amount
|
Percent
|
2017
|
2016
|
|
||||||||||||
|
|
(In thousands, except percent data)
|
|
||||||||||||||||
|
Gross profit
|
$
|
1,471,614
|
|
$
|
367,631
|
|
33.3
|
%
|
13.7
|
%
|
11.2
|
%
|
||||||
|
SG&A expenses
|
389,517
|
|
78,685
|
|
25.3
|
%
|
3.6
|
%
|
3.1
|
%
|
(a)(b)
|
|||||||
|
Administrative restructuring charges
|
9,775
|
|
8,706
|
|
814.4
|
%
|
0.1
|
%
|
—
|
%
|
(c)
|
|||||||
|
Operating income
|
$
|
1,072,322
|
|
$
|
280,240
|
|
35.4
|
%
|
10.0
|
%
|
8.1
|
%
|
||||||
|
|
|
Change from 2016
|
||||||||||
|
Source of operating income
|
2017
|
Amount
|
Percent
|
|||||||||
|
|
(In thousands, except percent data)
|
|||||||||||
|
United States
|
$
|
841,491
|
|
$
|
268,932
|
|
47.0
|
%
|
||||
|
U.K. and Europe
|
77,105
|
|
(1,467
|
)
|
(1.9
|
)%
|
||||||
|
Mexico
|
153,631
|
|
12,775
|
|
9.1
|
%
|
||||||
|
Elimination
|
95
|
|
—
|
|
—
|
%
|
(f)
|
|||||
|
Total operating income
|
$
|
1,072,322
|
|
$
|
280,240
|
|
35.4
|
%
|
||||
|
Sources of SG&A expenses
|
2017
|
Change from 2016
|
||||||||||
|
Amount
|
Percent
|
|||||||||||
|
|
(In thousands, except percent data)
|
|||||||||||
|
United States
|
$
|
245,061
|
|
$
|
76,604
|
|
45.5
|
%
|
(a)
|
|||
|
U.K. and Europe
|
109,559
|
|
(1,492
|
)
|
(1.3
|
)%
|
(b)
|
|||||
|
Mexico
|
34,897
|
|
3,573
|
|
11.4
|
%
|
(c)
|
|||||
|
Total SG&A expense
|
$
|
389,517
|
|
$
|
78,685
|
|
25.3
|
%
|
||||
35
|
Sources of administrative restructuring charges
|
2017
|
Change from 2016
|
||||||||||
|
Amount
|
Percent
|
|||||||||||
|
|
(In thousands, except percent data)
|
|||||||||||
|
United States
|
$
|
8,259
|
|
$
|
7,190
|
|
672.6
|
%
|
(d)
|
|||
|
U.K. and Europe
|
1,516
|
|
1,516
|
|
100.0
|
%
|
(e)
|
|||||
|
Total administrative restructuring charges
|
$
|
9,775
|
|
$
|
8,706
|
|
814.4
|
%
|
||||
|
(a)
|
SG&A expense incurred by the U.S. operations during 2017 increased $76.6 million, or 45.5%, from SG&A expense incurred by the U.S. operations during 2016 primarily because of expenses incurred by the acquired GNP operations and, to a lesser extent, by increases in SG&A expense incurred by our existing U.S. operations. Expenses incurred by the acquired GNP business contributed $35.5 million, or 21.2 percentage points, to the overall increase in SG&A expenses. Expenses incurred by our existing U.S. operations increased primarily because of an $18.7 million increase in transaction costs associated with the Moy Park acquisition, a $6.0 million increase in professional fees expenses, a $5.7 million increase in management fees charged for administrative functions shared with JBS USA Food Company, a $5.0 million increase in advertising and promotional expenses, a $4.4 million increase in employee wages and benefits and a $1.4 million increase in depreciation and amortization expenses. Other factors affecting SG&A expense were individually immaterial.
|
|
(b)
|
SG&A expense incurred by the U.K. and Europe operations during 2017 decreased $1.5 million, or 1.3%, from SG&A expense incurred by the U.K. and Europe operations during 2016 primarily because of a $9.0 million decrease in advertising and promotion costs and a $4.0 million decrease in management fees charged for administrative functions shared with JBS S.A. These decreases to SG&A expense were partially offset by a $7.4 million increase in employee wages and benefits, a $2.3 million increase in miscellaneous expenses and a $1.6 million increase in depreciation and amortization. Other factors affecting SG&A expense were individually immaterial.
|
|
(c)
|
SG&A expense incurred by the Mexico operations during 2017 increased $3.6 million, or 11.4%, from SG&A expense incurred by the Mexico operations during 2016 primarily because of a $1.7 million increase in wages and benefits and a $1.9 million increase in advertising and promotion expenses. These increases to SG&A expense were partially offset by a $0.3 million benefit from a decline in foreign exchange rates. Other factors affecting SG&A expense were individually immaterial.
|
|
(d)
|
Administrative restructuring charges incurred by the U.S. operations during 2017 increased $7.2 million, or 672.6%, from administrative restructuring charges incurred during 2016. Administrative restructuring charges incurred by the U.S. segment during 2017 included a $3.5 million impairment of the aggregate carrying amount of an asset group held for sale in Alabama, $2.6 million in severance costs related to the GNP operations, the elimination of prepaid costs totaling $0.7 million related to obsolete software assumed in the GNP acquisition, and $0.9 million in costs associated with the plant closure in Luverne, Minnesota. Administrative restructuring charges incurred by the U.S. operations during 2016 represented impairment costs of $0.8 million related to assets held for sale in Texas and impairment costs of $0.3 million related to the sale of an asset in Louisiana.
|
|
(e)
|
Administrative restructuring charges incurred by the U.K. and Europe operations during 2017 increased $1.5 million, or 100.0%, from administrative restructuring charges incurred during 2016. During 2017, administrative restructuring charges represented impairment costs of $1.5 million related to to a property in Dublin, Ireland.
|
|
(f)
|
Our Consolidated and Combined Financial Statements include the accounts of both our company and its majority owned subsidiaries. We eliminate all significant affiliate accounts and transactions upon consolidation.
|
Interest expense
. Consolidated and combined interest expense increased 41.7% to $107.2 million in 2017 from $75.6 million in 2016, primarily because of an increase in the weighted average interest rate to 4.54% in 2017 from 4.39% in 2016 and an increase in average borrowings of $2.0 billion in 2017 from $1.5 billion in 2016. Borrowings increased primarily to fund both the GNP and Moy Park acquisitions during 2017. As a percent of net sales, interest expense in 2017 and 2016 was 1.00% and 0.77%, respectively.
Income taxes.
Our consolidated and combined income tax expense in 2017 was $263.9 million, compared to income tax expense of $243.9 million in 2016. The increase in income tax expense in 2017 resulted from an increase in pre-tax income during 2017, partially offset by the recognition of a future reduction in the U.S. tax rate during 2017. As a result of the future reduction in the U.S. tax rate, we expect a future effective tax rate of approximately 24%.
2016 Compared to 2015
Net sales.
Net sales for 2016 increased $1.1 billion, or 12.9%, from 2015. The following table provides additional information regarding net sales:
|
|
|
Change from 2015
|
|
|||||||||
|
Source of net sales
|
2016
|
Amount
|
Percent
|
|
||||||||
|
|
(In thousands, except percent data)
|
|
||||||||||
|
United States
|
$
|
6,671,403
|
|
$
|
(471,951
|
)
|
(6.6
|
)%
|
(a)
|
|||
|
U.K. and Europe
|
1,947,441
|
|
1,374,873
|
|
240.1
|
%
|
(b)
|
|||||
|
Mexico
|
1,259,720
|
|
222,970
|
|
21.5
|
%
|
(c)
|
|||||
|
Total net sales
|
$
|
9,878,564
|
|
$
|
1,125,892
|
|
12.9
|
%
|
||||
|
(a)
|
U.S. net sales generated in 2016 decreased $472.0 million, or 6.6%, from U.S. net sales generated in 2015 primarily because of decreases in both sales volume and net sales per pound. The decrease in sales volume, which resulted from the unfavorable impact that ongoing operational improvements in one of our prepared foods facilities had on production during the period and lower product demand from our commercial customers, contributed $300.5 million, or 4.2 percentage points, to the net sales decrease. Lower net sales per pound, which resulted primarily from lower market prices, contributed
|
36
$171.4 million, or 2.3 percentage points, to the net sales decrease. Included in U.S. sales generated during 2016 and 2015 were sales to JBS USA Food Company totaling $16.5 million and $21.7 million, respectively.
|
(b)
|
U.K. and Europe sales generated in 2016 increased $1.4 billion, or 240.1%, from U.K. and Europe sales generated in 2015, primarily due to the common- control acquisition of Moy Park on September 30, 2015.
|
|
(c)
|
Mexico sales generated in 2016 increased $223.0 million, or 21.5%, from Mexico sales generated in 2015, primarily because of an increase in sales volume and an increase in net sales per pound partially offset by the impact of foreign currency translation. The increase in sales volume contributed $310.6 million, or 30.0 percentage points, to the increase in Mexico net sales. The increase in net sales per pound contributed $133.7 million, or 12.9 percentage points, to the increase in Mexico net sales. The increases to net sales was partially offset by the impact of foreign currency translation, which contributed $221.3 million, or 21.3 percentage points, to the decrease in Mexico net sales. Other factors affecting the increase in Mexico net sales were individually immaterial.
|
Gross profit.
Gross profit decreased by $194.7 million, or 15.0%, from $1.3 billion generated in 2015 to $1.1 billion generated in 2016. The following tables provide gross profit information:
|
|
|
Change from 2015
|
Percent of Net Sales
|
|
||||||||||||||
|
Components of gross profit
|
2016
|
Amount
|
Percent
|
2016
|
2015
|
|
||||||||||||
|
|
(In thousands, except percent data)
|
|
||||||||||||||||
|
Net sales
|
$
|
9,878,564
|
|
$
|
1,125,892
|
|
12.9
|
%
|
100.0
|
%
|
100.0
|
%
|
||||||
|
Cost of sales
|
8,774,581
|
|
1,320,633
|
|
17.7
|
%
|
88.8
|
%
|
85.2
|
%
|
(a)(b)
|
|||||||
|
Gross profit
|
$
|
1,103,983
|
|
$
|
(194,741
|
)
|
(15.0
|
)%
|
11.2
|
%
|
14.8
|
%
|
||||||
|
Sources of gross profit
|
2016
|
Change from 2015
|
||||||||||
|
Amount
|
Percent
|
|||||||||||
|
|
(In thousands, except percent data)
|
|||||||||||
|
United States
|
$
|
742,085
|
|
$
|
(384,776
|
)
|
(34.1
|
)%
|
||||
|
U.K. and Europe
|
189,623
|
|
145,276
|
|
327.6
|
%
|
||||||
|
Mexico
|
172,180
|
|
44,759
|
|
35.1
|
%
|
||||||
|
Elimination
|
95
|
|
—
|
|
—
|
%
|
(c)
|
|||||
|
Total gross profit
|
$
|
1,103,983
|
|
$
|
(194,741
|
)
|
(15.0
|
)%
|
||||
|
Sources of cost of sales
|
2016
|
Change from 2015
|
||||||||||
|
Amount
|
Percent
|
|||||||||||
|
|
(In thousands, except percent data)
|
|||||||||||
|
United States
|
$
|
5,929,318
|
|
$
|
(87,175
|
)
|
(1.4
|
)%
|
(a)
|
|||
|
U.K. and Europe
|
1,757,818
|
|
1,229,597
|
|
232.8
|
%
|
(b)
|
|||||
|
Mexico
|
1,087,540
|
|
178,211
|
|
19.6
|
%
|
(c)
|
|||||
|
Elimination
|
(95
|
)
|
—
|
|
—
|
%
|
(d)
|
|||||
|
Total cost of sales
|
$
|
8,774,581
|
|
$
|
1,320,633
|
|
17.7
|
%
|
||||
|
(a)
|
Cost of sales incurred by our U.S. operations in 2016 decreased $87.2 million, or 1.4%, from cost of sales incurred by our U.S. operations in 2015. Cost of sales primarily decreased because of lower sales volume, an $81.5 million decrease in feed ingredients costs and a $17.9 million decrease in freight and storage costs. These costs were partially offset by a $27.0 million increase in contract labor costs, derivative losses of $5.0 million in 2016 compared to derivative gains of $21.3 million in 2015, a $21.3 million increase in wages and benefits, and an $18.1 million increase in co-pack labor costs. Other factors affecting U.S. cost of sales were individually immaterial.
|
|
(b)
|
Cost of sales incurred by the U.K. and Europe operations during 2016 increased $1.2 billion, or 232.8%, from cost of sales incurred by the U.K. and Europe operations during 2015 primarily due to the common-control acquisition of Moy Park on September 30, 2015.
|
|
(c)
|
Cost of sales incurred by the Mexico operations during 2016 increased $178.2 million, or 19.6%, from cost of sales incurred by the Mexico operations during 2015 primarily because of increased sales volume and a $33.3 million increase in feed ingredient costs. Mexico cost of sales also increased because of a $22.9 million increase in wages and benefits, a $11.9 million increase in freight and storage costs, and a $11.2 increase in in depreciation and amortization costs. These costs were partially offset by the impact of foreign currency translation which contributed $191.9 million, or 21.1 percentage points, to the decrease in cost of sales incurred by our Mexico operations. Other factors affecting cost of sales were individually immaterial.
|
|
(d)
|
Our Consolidated and Combined Financial Statements include the accounts of our company and its majority owned subsidiaries. We eliminate all significant affiliate accounts and transactions upon consolidation.
|
Operating income.
Operating income decreased $269.1 million, or 25.4%, from $1.1 billion generated for 2015 to $0.8 billion generated for 2016. The following tables provide operating income information:
37
|
|
|
Change from 2015
|
Percent of Net Sales
|
|
||||||||||||||
|
Components of operating income
|
2016
|
Amount
|
Percent
|
2016
|
2015
|
|
||||||||||||
|
|
(In thousands, except percent data)
|
|
||||||||||||||||
|
Gross profit
|
$
|
1,103,983
|
|
$
|
(194,741
|
)
|
(15.0
|
)%
|
11.2
|
%
|
14.8
|
%
|
||||||
|
SG&A expenses
|
310,832
|
|
78,994
|
|
34.1
|
%
|
3.1
|
%
|
2.6
|
%
|
(a)(b)
|
|||||||
|
Administrative restructuring charges
|
1,069
|
|
(4,685
|
)
|
(81.4
|
)%
|
—
|
%
|
0.1
|
%
|
(c)
|
|||||||
|
Operating income
|
$
|
792,082
|
|
$
|
(269,050
|
)
|
(25.4
|
)%
|
8.1
|
%
|
12.1
|
%
|
||||||
|
|
|
Change from 2015
|
||||||||||
|
Source of operating income
|
2016
|
Amount
|
Percent
|
|||||||||
|
|
(In thousands, except percent data)
|
|||||||||||
|
United States
|
$
|
572,559
|
|
$
|
(377,051
|
)
|
(39.7
|
)%
|
||||
|
U.K. and Europe
|
78,572
|
|
62,331
|
|
383.8
|
%
|
||||||
|
Mexico
|
140,856
|
|
45,670
|
|
48.0
|
%
|
||||||
|
Elimination
|
95
|
|
—
|
|
—
|
%
|
(e)
|
|||||
|
Total operating income
|
$
|
792,082
|
|
$
|
(269,050
|
)
|
(25.4
|
)%
|
||||
|
Sources of SG&A expenses
|
2016
|
Change from 2015
|
||||||||||
|
Amount
|
Percent
|
|||||||||||
|
|
(In thousands, except percent data)
|
|||||||||||
|
United States
|
$
|
168,457
|
|
$
|
(3,189
|
)
|
(1.9
|
)%
|
(a)
|
|||
|
U.K. and Europe
|
111,051
|
|
83,094
|
|
297.2
|
%
|
(b)
|
|||||
|
Mexico
|
31,324
|
|
(911
|
)
|
(2.8
|
)%
|
(c)
|
|||||
|
Total SG&A expense
|
$
|
310,832
|
|
$
|
78,994
|
|
34.1
|
%
|
||||
|
Sources of administrative restructuring charges
|
2016
|
Change from 2015
|
||||||||||
|
Amount
|
Percent
|
|||||||||||
|
|
(In thousands, except percent data)
|
|||||||||||
|
United States
|
$
|
1,069
|
|
$
|
(4,536
|
)
|
(80.9
|
)%
|
(d)
|
|||
|
U.K. and Europe
|
—
|
|
(149
|
)
|
(100.0
|
)%
|
||||||
|
Total administrative restructuring charges
|
$
|
1,069
|
|
$
|
(4,685
|
)
|
(81.4
|
)%
|
||||
|
(a)
|
SG&A expense incurred by the U.S. operations during 2016 decreased $3.2 million, or 1.9%, from SG&A expense incurred by the U.S. operations during 2015 primarily because of a $5.2 million decrease in brokerage expenses, a $2.6 million decrease in management fees charged for administrative functions shared with JBS USA Food Company, and a $2.0 million decrease in employee wages and benefits that were partially offset by a a $3.1 million increase in contract labor expenses, and a $2.6 million increase in professional fees expenses. Other factors affecting SG&A expense were individually immaterial.
|
|
(b)
|
SG&A expense incurred by the U.K. and Europe operations during 2016 increased $83.1 million, or 297.2%, from SG&A expense incurred by the U.K. and Europe operations during 2015 primarily due to the common-control acquisition of Moy Park on September 30, 2015.
|
|
(c)
|
SG&A expense incurred by the Mexico operations during 2016 decreased $0.9 million, or 2.8%, from SG&A expense incurred by the Mexico operations during 2015 primarily because of a $15.0 million decrease in management fees charged for administrative functions shared with JBS USA Food Company and a $2.6 million decrease in professional fees expenses. These decreases to SG&A expense were partially offset by a $15.9 increase in employee wages and benefits. Other factors affecting SG&A expense were individually immaterial.
|
|
(d)
|
Administrative restructuring charges incurred by the U.S. operations during 2016 decreased $4.5 million, or 80.9%, from administrative restructuring charges incurred during 2015. During 2016, administrative restructuring charges represented impairment costs of $0.8 million related to assets held for sale in Texas and impairment costs of $0.3 million related to the sale of an asset in Louisiana. During 2015, administrative restructuring charges represented impairment costs of $4.8 million related to assets held for sale in Louisiana and Texas and a loss of $0.8 million related to the sale of a rendering plant in Arkansas.
|
|
(e)
|
Our Consolidated and Combined Financial Statements include the accounts of both our company and its majority owned subsidiaries. We eliminate all significant affiliate accounts and transactions upon consolidation.
|
Interest expense.
Consolidated and combined interest expense increased 62.5% to $75.6 million in 2016 from $46.6 million in 2015, primarily because of an increase in the weighted average interest rate to 4.39% in 2016 from 4.09% in 2015 and an increase in average borrowings of $1.5 billion in 2016 from $1.1 billion in 2015. As a percent of net sales, interest expense in 2016 and 2015 was 0.77% and 0.53%, respectively.
38
Income taxes.
Our consolidated and combined income tax expense in 2016 was $243.9 million, compared to income tax expense of $338.4 million in 2015. The decrease in income tax expense in 2016 resulted primarily from a decrease in income.
39
Liquidity and Capital Resources
The following table presents our available sources of liquidity as of December 31, 2017:
|
Source of Liquidity
(a)
|
Facility
Amount |
Amount
Outstanding |
Available
|
|
|||||||||
|
|
(In millions)
|
|
|||||||||||
|
Cash and cash equivalents
|
$
|
—
|
|
$
|
—
|
|
$
|
581.5
|
|
||||
|
Debt facilities:
|
|||||||||||||
|
U.S. Credit Facility
|
750.0
|
|
73.3
|
|
631.9
|
|
(a)
|
||||||
|
Mexico Credit Facility
|
76.3
|
|
76.3
|
|
—
|
|
(b)
|
||||||
|
U.K. and Europe Credit Facilities
|
123.7
|
|
11.4
|
|
112.3
|
|
(c)
|
||||||
|
(a)
|
Availability under the U.S. Credit Facility is also reduced by our outstanding standby letters of credit. Standby letters of credit outstanding at December 31, 2017 totaled $44.8 million.
|
|
(b)
|
As of December 31, 2017, the U.S. dollar-equivalent of the amount available under the Mexico Credit Facility (as described below) was less than $0.1 million. The Mexico Credit Facility provides for a loan commitment of $1.5 billion Mexican pesos.
|
|
(c)
|
The U.K. and Europe Credit Facilities consist of the Moy Park Multicurrency Revolving Facility Agreement, the Moy Park Receivables Finance Agreement, and the Moy Park France Invoice Discounting Facility, as described below. As of December 31, 2017, the U.S. dollar-equivalent of the amount available under the U.K. and Europe Credit Facilities totaled $112.3 million. The facilities provide for a combined loan commitment amount of £65 million pound sterling and €30 million euro.
|
U.S. Senior Notes
On March 11, 2015, the Company completed a sale of
$500.0 million
aggregate principal amount of its
5.75%
senior notes due 2025 (the “Senior Notes due 2025”). The Company used the net proceeds from the sale of the Senior Notes to repay
$350.0 million
and
$150.0 million
of the term loan indebtedness under the U.S. Credit Facility on March 12, 2015 and April 22, 2015, respectively. On September 29, 2017, the Company completed an add-on offering of
$250.0 million
of the Senior Notes due 2025 (the “Additional Senior Notes due 2025”). The issuance price of the add-on offering was
102.0%
which created gross proceeds of
$255.0 million
. The additional
$5.0 million
will be amortized over the life of the bond. The Company used the net proceeds from the sale of the Additional Senior Notes due 2025 to repay in full the JBS S.A. Promissory Note (as described below) issued as part of the Moy Park acquisition and for general corporate purposes. The Additional Senior Notes due 2025 will be treated as a single class with the existing Senior Notes due 2025 for all purposes under the 2015 Indenture (defined below) and will have the same terms as those of the existing Senior Notes due 2025. The Additional Senior Notes due 2025 were sold to qualified institutional buyers pursuant to Rule 144A under the Securities Act of 1933, as amended (the “Securities Act”), and outside the United States to non-U.S. persons pursuant to Regulation S under the Securities Act.
The Senior Notes due 2025 and the Additional Senior Notes due 2025 are governed by, and were issued pursuant to, an indenture dated as of March 11, 2015 by and among the Company, its guarantor subsidiary and Wells Fargo Bank, National Association, as trustee (the “2015 Indenture”). The 2015 Indenture provides, among other things, that the Senior Notes due 2025 and the Additional Senior Notes due 2025 bear interest at a rate of
5.75%
per annum from the date of issuance until maturity, payable semi-annually in cash in arrears, beginning on September 15, 2015 for the Senior Notes due 2025 and March, 15 2018 for the Additional Senior Notes due 2025. The Senior Notes due 2025 and the Additional Senior Notes due 2025 are guaranteed on a senior unsecured basis by the Company’s guarantor subsidiary. In addition, any of the Company’s other existing or future domestic restricted subsidiaries that incur or guarantee any other indebtedness (with limited exceptions) must also guarantee the Senior Notes due 2025 and the Additional Senior Notes due 2025. The Senior Notes due 2025 and the Additional Senior Notes due 2025 and related guarantees are unsecured senior obligations of the Company and its guarantor subsidiary and rank equally with all of the Company’s and its guarantor subsidiary’s other unsubordinated indebtedness. The Senior Notes due 2025 and the Additional Senior Notes due 2025 and the 2015 Indenture also contain customary covenants and events of default, including failure to pay principal or interest on the Senior Notes due 2025 and the Additional Senior Notes due 2025 when due, among others.
On September 29, 2017, the Company completed a sale of
$600.0 million
aggregate principal amount of its
5.875%
senior notes due 2027 (the “Senior Notes due 2027”). The Company used the net proceeds from the sale of the Senior Notes due 2027 to repay in full the JBS S.A. Promissory Note issued as part of the Moy Park acquisition and for general corporate purposes. The Senior Notes due 2027 were sold to qualified institutional buyers pursuant to Rule 144A under the Securities Act, and outside the United States to non-U.S. persons pursuant to Regulation S under the Securities Act.
40
The Senior Notes due 2027 are governed by, and were issued pursuant to, an indenture dated as of September 29, 2017 by and among the Company, its guarantor subsidiary and U.S. Bank National Association, as trustee (the “2017 Indenture”). The 2017 Indenture provides, among other things, that the Senior Notes due 2027 bear interest at a rate of
5.875%
per annum from the date of issuance until maturity, payable semi-annually in cash in arrears, beginning on March 30, 2018. The Senior Notes due 2027 are guaranteed on a senior unsecured basis by the Company’s guarantor subsidiary. In addition, any of the Company’s other existing or future domestic restricted subsidiaries that incur or guarantee any other indebtedness (with limited exceptions) must also guarantee the Senior Notes due 2027. The Senior Notes due 2027 and related guarantees are unsecured senior obligations of the Company and its guarantor subsidiary and rank equally with all of the Company’s and its guarantor subsidiary’s other unsubordinated indebtedness. The Senior Notes due 2027 and the 2017 Indenture also contain customary covenants and events of default, including failure to pay principal or interest on the Senior Notes due 2027 when due, among others.
Moy Park Senior Notes
On May 29, 2014, Moy Park (Bondco) Plc, a subsidiary of Granite Holdings Sàrl, completed the sale of a £
200.0 million
aggregate principal amount of its
6.25%
senior notes due 2021 (the “Moy Park Notes”). On April 17, 2015, an add-on offering of £
100.0 million
of the Moy Park Notes (the “Additional Moy Park Notes”) was completed. The Moy Park Notes and the Additional Moy Park Notes were sold to qualified institutional buyers pursuant to Rule 144A under the Securities Act, and outside the United States to non-U.S. persons pursuant to Regulation S under the Securities Act
.
The Moy Park Notes and the Additional Moy Park Notes are governed by, and were issued pursuant to, an indenture dated as of May 29, 2014 by Moy Park (Bondco) Plc, as issuer, Moy Park Holdings (Europe) Limited, Moy Park (Newco) Limited, Moy Park Limited, O’Kane Poultry Limited, as guarantors, and The Bank of New York Mellon, as trustee (the “Moy Park Indenture”). The Moy Park Indenture provides, among other things, that the Moy Park Notes and the Additional Moy Park Notes bear interest at a rate of
6.25%
per annum from the date of issuance until maturity, payable semiannually in cash in arrears, beginning on November 29, 2014 for the Moy Park Notes and May 28, 2015 for the Additional Moy Park Notes. The Moy Park Notes and the Additional Moy Park Notes are guaranteed by each of the subsidiary guarantors described above. The Moy Park Indenture contains customary covenants and events of default that may limit Moy Park (Bondco) Plc’s ability and the ability of certain subsidiaries to incur additional debt, declare or pay dividends or make certain investments, among others.
On November 2, 2017, Moy Park (Bondco) Plc announced the final results of its previously announced tender offer to purchase for cash any and all of its issued and outstanding Moy Park Notes and Moy Park Additional Notes. As of November 2, 2017,
£1,185,000
principal amount of Moy Park Notes and Moy Park Additional Notes had been validly tendered (and not validly withdrawn). Moy Park (Bondco) Plc has purchased all validly tendered (and not validly withdrawn) Moy Park Notes and Moy Park Additional Notes on or prior to November 2, 2017, with such settlement occurring on November 3, 2017.
U.S. Credit Facility
On May 8, 2017, the Company and certain of its subsidiaries entered into a Third Amended and Restated Credit Agreement (the “U.S. Credit Facility”) with Coöperatieve Rabobank U.A., New York Branch (“Rabobank”), as administrative agent and collateral agent, and the other lenders party thereto. The U.S. Credit Facility provides for a revolving loan commitment of up to
$750.0 million
and a term loan commitment of up to
$800.0 million
(the “Term Loans”). The U.S. Credit Facility also includes an accordion feature that allows the Company, at any time, to increase the aggregate revolving loan and term loan commitments by up to an additional
$1.0 billion
, subject to the satisfaction of certain conditions, including obtaining the lenders’ agreement to participate in the increase.
The revolving loan commitment under the U.S. Credit Facility matures on May 6, 2022. All principal on the Term Loans is due at maturity on May 6, 2022. Installments of principal are required to be made, in an amount equal to
1.25%
of
the original principal amount of the Term Loans, on a quarterly basis prior to the maturity date of the Term Loans. Covenants in the U.S. Credit Facility also require the Company to use the proceeds it receives from certain asset sales and specified debt or equity issuances and upon the occurrence of other events to repay outstanding borrowings under the U.S. Credit Facility. As of December 31, 2017, the company had Term Loans outstanding totaling
$780.0 million
and the amount available for borrowing under the revolving loan commitment was
$631.9 million
. The Company had letters of credit of
$44.8 million
and borrowings of
$73.3 million
outstanding under the revolving loan commitment as of December 31, 2017.
The U.S. Credit Facility includes a
$75.0 million
sub-limit for swingline loans and a
$125.0 million
sub-limit for letters of credit. Outstanding borrowings under the revolving loan commitment and the Term Loans bear interest at a per annum rate equal to (i) in the case of LIBOR loans, LIBOR plus
1.50%
through December 31, 2017 and, thereafter, based on the Company’s net senior secured leverage ratio, between LIBOR plus
1.25%
and LIBOR plus
2.75%
and (ii) in the case of alternate base rate loans, the base rate plus
0.50%
through December 31, 2017 and, based on the Company’s net senior secured leverage ratio, between the base rate plus
0.25%
and base rate plus
1.75%
thereafter.
41
The U.S. Credit Facility contains financial covenants and various other covenants that may adversely affect the Company’s ability to, among other things, incur additional indebtedness, incur liens, pay dividends or make certain restricted payments, consummate certain assets sales, enter into certain transactions with JBS and the Company’s other affiliates, merge, consolidate and/or sell or dispose of all or substantially all of our assets. The U.S. Credit Facility requires the Company to comply with a minimum level of tangible net worth covenant. The U.S. Credit Facility also provides that we may not incur capital expenditures in excess of
$500.0 million
in any fiscal year. The Company is currently in compliance with the covenants under the U.S. Credit Facility.
All obligations under the U.S. Credit Facility continue to be unconditionally guaranteed by certain of the Company’s subsidiaries and continue to be secured by a first priority lien on (i) the accounts receivable and inventory of our company and its non-Mexico subsidiaries, (ii)
100%
of the equity interests in our domestic subsidiaries, To-Ricos, Ltd. and To-Ricos Distribution, Ltd., and
65%
of the equity interests in our direct foreign subsidiaries and (iii) substantially all of the assets of the Company and the guarantors under the U.S. Credit Facility.
Mexico Credit Facility
On September 27, 2016, certain of our Mexican subsidiaries entered into an unsecured credit agreement (the “Mexico Credit Facility”) with BBVA Bancomer, S.A. Institución de Banca Múltiple, Grupo Financiero BBVA Bancomer, as lender. The loan commitment under the Mexico Credit Facility was
$1.5 billion
Mexican pesos. Outstanding borrowings under the Mexico Credit Facility accrued interest at a rate equal to the Interbank Equilibrium Interest Rate plus
0.95%
. The Mexico Credit Facility will mature on September 27, 2019. As of
December 31, 2017
, the U.S. dollar-equivalent of the loan commitment under the Mexico Credit Facility was
$76.3 million
, and there were
$76.3 million
outstanding borrowings under the Mexico Credit Facility that bear interest at a per annum rate of
8.34%
. As of
December 31, 2017
, the U.S. dollar-equivalent borrowing availability was less than
$0.1 million
.
Moy Park Multicurrency Revolving Facility Agreement
On March 19, 2015, Moy Park Holdings (Europe) Limited, a subsidiary of Granite Holdings Sàrl, and its subsidiaries, entered into an agreement with Barclays Bank plc which matures on March 19, 2018. The agreement provides for a multicurrency revolving loan commitment of up to £
20.0 million
. As of December 31, 2017, the U.S. dollar-equivalent loan commitment under Moy Park multicurrency revolving facility was
$27.0 million
and there were
$9.6 million
outstanding borrowings. Outstanding borrowings under the facility bear interest at a per annum rate equal to LIBOR plus a margin determined by Moy Park’s Net Debt to EBITDA ratio. The current margin stands at
2.2%
. As of December 31, 2017, the U.S. dollar-equivalent borrowing availability was
$17.4 million
.
The facility contains financial covenants and various other covenants that may adversely affect Moy Park's ability to, among other things, incur additional indebtedness, consummate certain assets sales, enter into certain transactions with JBS and the Company's other affiliates, merge, consolidate and/or sell or dispose of all or substantially all of the Moy Park's assets.
Moy Park Receivables Finance Agreement
Moy Park Limited, a subsidiary of Granite Holdings Sàrl, entered into a
£45.0 million
receivables finance agreement on January 29, 2016 (the “Receivables Finance Agreement”), with Barclays Bank plc, which matures on January 29, 2020. As of December 31, 2017, the U.S. dollar-equivalent loan commitment under the Receivables Finance Agreement was
$60.8 million
and there were
no
outstanding borrowings. Outstanding borrowings under the facility bear interest at a per annum rate equal to LIBOR plus
1.5%
. The Receivables Finance Agreement includes an accordion feature that allows us, at any time, to increase the commitments by up to an additional £
15.0 million
(U.S. dollar-equivalent
$20.3 million
as of December 31, 2017), subject to the satisfaction of certain conditions.
The Receivables Finance Agreement contains financial covenants and various other covenants that may adversely affect Moy Park's ability to, among other things, incur additional indebtedness, consummate certain asset sales, enter into certain transactions with JBS and the Company's other affiliates, merge, consolidate and/or sell or dispose of all or substantially all of Moy Park's assets.
Moy Park France Invoice Discounting Facility
In June 2009, Moy Park France Sàrl, a subsidiary of Granite Holdings Sàrl, entered into a
€20.0 million
invoice discounting facility with GE De Facto (the “Invoice Discounting Facility”). The facility limit was increased
€10.0 million
in September 2016 to
€30.0 million
. The Invoice Discounting Facility is payable on demand and the term is extended on an annual basis. The agreement can be terminated with three months’ notice. As of December 31, 2017, the U.S. dollar-equivalent loan commitment under the Invoice Discounting Facility was
$36.0 million
and there were
$1.8 million
outstanding borrowings. As of December 31, 2017,
42
the U.S. dollar-equivalent borrowing availability was
$34.2 million
. Outstanding borrowings under the Invoice Discounting Facility bear interest at a per annum rate equal to EURIBOR plus a margin of
0.80%
.
The Invoice Discounting Facility contains financial covenants and various other covenants that may adversely affect Moy Park's ability to, among other things, incur additional indebtedness, consummate certain asset sales, enter into certain transactions with JBS and the Company's other affiliates, merge, consolidate and/or sell or dispose of all or substantially all of Moy Park's assets.
JBS S.A. Promissory Note
On September 8, 2017, Onix Investments UK Ltd., a wholly owned subsidiary of Pilgrim’s Pride Corporation, executed a subordinated promissory note payable to JBS S.A. (the “JBS S.A. Promissory Note”) for
£562.5 million
, which had a maturity date of September 6, 2018. Interest on the outstanding principal balance of the JBS S.A. Promissory Note accrued at the rate per annum equal to (i) from and after November 8, 2017 and prior to January 7, 2018,
4.00%
, (ii) from and after January 7, 2018 and prior to March 8, 2018,
6.00%
and (iii) from and after March 8, 2018,
8.00%
. The JBS S.A. Promissory Note was repaid in full on October 2, 2017 using the net proceeds from the sale of Senior Notes due 2027 and the Additional Senior Notes due 2025.
Collateral
Substantially all of our domestic inventories and domestic fixed assets are pledged as collateral to secure the obligations under the U.S. Credit Facility.
Off-Balance Sheet Arrangements
We maintain operating leases for various types of equipment, some of which contain residual value guarantees for the market value of assets at the end of the term of the lease. The terms of the lease maturities range from one to ten years. We estimate the maximum potential amount of the residual value guarantees is approximately $48.5 million; however, the actual amount would be offset by any recoverable amount based on the fair market value of the underlying leased assets. No liability has been recorded related to this contingency as the likelihood of payments under these guarantees is not considered to be probable, and the fair value of the guarantees is immaterial. We historically have not experienced significant payments under similar residual guarantees.
We are a party to many routine contracts in which we provide general indemnities in the normal course of business to third parties for various risks. Among other considerations, we have not recorded a liability for any of these indemnities as, based upon the likelihood of payment, the fair value of such indemnities would not have a material impact on our financial condition, results of operations and cash flows.
Capital Expenditures
We anticipate spending between $315 million and $325 million on the acquisition of property, plant and equipment in 2018. Capital expenditures will primarily be incurred to improve efficiencies and reduce costs. We expect to fund these capital expenditures with cash flow from operations and proceeds from the revolving lines of credit under our various debt facilities.
Indefinite Reinvestment of Foreign Subsidiaries’ Undistributed Earnings
We have determined that the undistributed earnings of our Mexico, Puerto Rico and U.K. subsidiaries will be indefinitely
reinvested and not distributed to the U.S. The undistributed earnings of our Mexico, Puerto Rico and U.K. subsidiaries totaled $805.9 million, $21.3 million and $12.6 million, respectively, at December 31, 2017.
Contractual Obligations
In addition to our debt commitments at December 31, 2017, we had other commitments and contractual obligations that obligate us to make specified payments in the future. The following table summarizes the total amounts due as of December 31, 2017, under all debt agreements, commitments and other contractual obligations. The table indicates the years in which payments are due under the contractual obligations.
43
|
|
Payments Due By Period
|
|||||||||||||||||||
|
Contractual Obligations
(a)
|
Total
|
Less than
One Year
|
One to
Three Years
|
Three to
Five Years
|
Greater than
Five Years
|
|||||||||||||||
|
|
(In thousands)
|
|||||||||||||||||||
|
Long-term debt
(b)
|
$
|
2,695,290
|
|
$
|
42,348
|
|
$
|
166,236
|
|
$
|
1,136,706
|
|
$
|
1,350,000
|
|
|||||
|
Interest
(c)
|
765,544
|
|
118,708
|
|
224,927
|
|
173,784
|
|
248,125
|
|
||||||||||
|
Capital leases
|
10,118
|
|
5,951
|
|
4,167
|
|
—
|
|
—
|
|
||||||||||
|
Operating leases
|
242,873
|
|
54,759
|
|
83,645
|
|
57,145
|
|
47,324
|
|
||||||||||
|
Derivative liabilities
|
4,058
|
|
4,058
|
|
—
|
|
—
|
|
—
|
|
||||||||||
|
Purchase obligations
(d)
|
346,770
|
|
346,730
|
|
40
|
|
—
|
|
—
|
|
||||||||||
|
Total
|
$
|
4,064,653
|
|
$
|
572,554
|
|
$
|
479,015
|
|
$
|
1,367,635
|
|
$
|
1,645,449
|
|
|||||
|
(a)
|
The total amount of unrecognized tax benefits at December 31, 2017 was $11.9 million. We did not include this amount in the contractual obligations table above as reasonable estimates cannot be made at this time of the amounts or timing of future cash outflows.
|
|
(b)
|
Long-term debt is presented at face value and excludes $44.8 million in letters of credit outstanding related to normal business transactions.
|
|
(c)
|
Interest expense in the table above assumes the continuation of interest rates and outstanding borrowings as of December 31, 2017.
|
|
(d)
|
Includes agreements to purchase goods or services that are enforceable and legally binding on us and that specify all significant terms, including fixed or minimum quantities to be purchased; fixed, minimum, or variable price provisions; and the approximate timing of the transaction.
|
W
e expect cash flows from operations, combined with availability under the U.S. Credit Facility, and U.K. and Europe Credit Facilities to provide sufficient liquidity to fund current obligations, projected working capital requirements, maturities of long-term debt and capital spending for at least the next twelve months.
Historical Flow of Funds
Calendar Year 2017
Cash provided by operating activities was
$801.3 million
during 2017. The cash flows provided by operating activities were primarily from net income of $718.2 million, proceeds of $277.8 million related to depreciation and amortization, partially offset by a use of $207.4 million in cash related to inventories.
Trade accounts and other receivables, including accounts receivable from related parties, used cash of $82.2 million related to operating activities during 2017. The change in operating cash related to trade accounts and other receivables is primarily due to a decrease in outstanding receivables and customer payment timing.
Inventories had uses of cash of $207.4 million related to operating activities during 2017. The change in cash related to inventories was primarily due to increases in our live chicken and finished chicken products and inventories related to the GNP acquisition.
Prepaid expenses and other current assets had uses of cash of $14.8 million related to operating activities during 2017. The change resulted primarily from a net increase in value-added tax receivables, as well as increases in prepaid expenses and other current assets related to the GNP acquisition.
Accounts payable and accrued expenses, including accounts payable to related parties, had uses of cash of $22.8 million related to operating activities during 2017. This change resulted primarily from the timing of payments.
Income taxes, which includes income taxes receivables, income taxes payable, deferred tax assets, deferred tax liabilities, reserves for uncertain tax positions and the tax components within accumulated other comprehensive loss, had proceeds of cash of $188.1 million. This change resulted primarily from the timing of estimated tax payments.
Net non-cash expenses provided $233.9 million in cash during 2017. Net non-cash expense items increased primarily because of $277.8 million in cash related to depreciation and amortization, partially offset by a deferred income tax benefit of $50.0 million.
Cash used in investing activities was $992.1 million during 2017. This change resulted primarily because of cash used in business acquisitions totaling $658.5 million and the use of cash for capital expenditures totaling $339.9 million. Capital expenditures were primarily incurred to improve operational efficiencies, reduce costs and tailor processes to meet specific customer needs in order to further solidify our competitive advantages. Capital expenditures for 2017 could not exceed $500.0 million under the terms of our U.S. credit facility. Cash proceeds generated from property disposals and proceeds from settlement of life insurance totaled $4.5 million and $1.8 million, respectively.
44
Cash proceeds from financing activities was $466.4 million during 2017. Cash proceeds from long-term debt totaled $1,871.8 million and proceeds from equity contributions under the Tax Sharing Agreement with JBS USA Food Company Holdings totaled $5.0 million. Cash was used for payment of note payable to affiliate totaling $753.5 million, repayment of long-term debt totaling $628.7 million, purchase common stock under our share repurchase program totaling $14.6 million and payment of capitalized loan costs totaling $13.6 million.
Calendar Year 2016
Cash provided by operating activities was
$795.4 million
during 2016. The cash flows provided by operating activities were primarily from net income of $480.1 million and proceeds of $231.7 million related to depreciation and amortization.
Trade accounts and other receivables, including accounts receivable from related parties, used cash of $32.4 million related to operating activities during 2016. The change in operating cash related to trade accounts and other receivables is primarily due to a decrease in outstanding receivables and customer payment timing.
Inventories had uses of cash of $33.1 million related to operating activities during 2016. The use of cash related to inventories was primarily due to a build up of freezer inventories.
Prepaid expenses and other current assets had cash proceeds of $19.3 million related to operating activities during 2016. The proceeds of cash related to prepaid expenses and other current assets is primarily attributable to a decrease in value-added tax receivables and a decline in prepaid insurance.
Accounts payable and accrued expenses, including accounts payable to related parties, had proceeds of cash of $75.9 million related to operating activities during 2016. This change resulted primarily from the timing of payments.
Income taxes, which include income taxes receivables, income taxes payable, deferred tax assets, deferred tax liabilities, reserves for uncertain tax positions, and the tax components within accumulated other comprehensive loss, had proceeds of cash of $75.2 million during 2016. This change resulted primarily from the timing of estimated tax payments and the impact of the Moy Park acquisition.
Net non-cash expenses provided $225.1 million in cash during 2016. Net non-cash expense items increased primarily because of $231.7 million in cash proceeds related to depreciation and amortization.
Cash used in investing activities was $327.6 million during 2016, primarily because of incurred capital expenditures of $341.0 million. Capital expenditures were primarily incurred for the routine replacement of equipment and to improve efficiencies and reduce costs. Capital expenditures for 2016 could not exceed $500 million under the terms of our U.S. credit facility. Additionally, cash proceeds generated from property disposals totaled $13.4 million.
Cash used by financing activities was $828.2 million during 2016. Cash was used to pay a special cash dividend and purchase common stock under share repurchase program for $714.8 million and $117.9 million, respectively. Cash proceeds from long-term debt totaled $593.0 million, partially offset by cash used on payments of long-term borrowings of $570.0 million.
45
Recently Issued Accounting Pronouncements
In May 2014, the Financial Accounting Standards Board (“FASB”) issued new accounting guidance on revenue recognition, which provides for a single five-step model to be applied to all revenue contracts with customers.
In July 2015, the FASB issued new accounting guidance on the subsequent measurement of inventory, which, in an effort to simplify unnecessarily complicated accounting guidance that can result in several potential outcomes, requires an entity to measure inventory at the lower of cost or net realizable value.
In February 2016, the FASB issued new accounting guidance on lease arrangements, which, in an effort to increase transparency and comparability among organizations utilizing leasing, requires an entity that is a lessee to recognize the assets and liabilities arising from leases on the balance sheet.
In March 2016, the FASB issued new accounting guidance on employee share-based payments, which, in an effort to simplify unnecessarily complicated aspects of accounting and reporting for share-based payment transactions, requires an entity to amend accounting and reporting methodology for areas such as the income tax consequences of share-based payments, classification of share-based awards as either equity or liabilities, and classification of share-based payment transactions in the statement of cash flows.
In June 2016, the FASB issued new accounting guidance on the measurement of credit losses on financial instruments, which, in an effort to provide financial statement users with more decision-useful information about the expected credit losses on financial instruments, replaces the current incurred loss impairment methodology with a methodology that reflects expected credit losses and requires consideration of a broader range of reasonable and supportable information to inform credit loss estimates.
In November 2016, the FASB issued new accounting guidance on the classification and presentation of restricted cash in the statement of cash flows in order to eliminate the discrepancies that currently exist in how companies present these changes.
In March 2017, the FASB issued new accounting guidance on the presentation of net periodic pension cost and net periodic postretirement benefit cost, which requires the service cost component of net benefit cost to be reported in the same line of the income statement as other compensation costs earned by the employee and the other components of net benefit cost to be reported below income from operations.
In August 2017, the FASB issued an accounting standard update that simplifies the application of hedge accounting guidance in current GAAP and improves the reporting of hedging relationships to better portray the economic results of an entity’s risk management activities in its financial statements.
See “Note 1. Description of Business and Basis of Presentation” of our Consolidated and Combined Financial Statements included in this annual report for additional information relating to these new accounting pronouncements.
Critical Accounting Policies and Estimates
General
. Our discussion and analysis of our financial condition and results of operations are based upon our financial statements, which have been prepared in accordance with U.S. GAAP. The preparation of these financial statements requires us to make estimates and judgments that affect the reported amounts of assets, liabilities, revenues and expenses. On an ongoing basis, we evaluate our estimates, including those related to revenue recognition, customer programs and incentives, allowance for doubtful accounts, inventories, income taxes and product recall accounting. We base our estimates on historical experience and on various other assumptions that are believed to be reasonable under the circumstances, the results of which form the basis for making judgments about the carrying values of assets and liabilities that are not readily apparent from other sources. Actual results may differ from these estimates under different assumptions or conditions.
We believe the following critical accounting policies affect our more significant judgments and estimates used in the preparation of our financial statements.
Revenue Recognition.
We recognize revenue when all of the following circumstances are satisfied: (i) persuasive evidence of an arrangement exists, (ii) price is fixed or determinable, (iii) collectability is reasonably assured and (iv) delivery has occurred. Delivery occurs in the period in which the customer takes title and assumes the risks and rewards of ownership of the products specified in the customer’s purchase order or sales agreement. Revenue is recorded net of estimated incentive offerings including special pricing agreements, promotions and other volume-based incentives. Revisions to these estimates are charged back to net sales in the period in which the facts that give rise to the revision become known.
Inventory.
Live chicken inventories are stated at the lower of cost or market and breeder hen inventories at the lower of cost, less accumulated amortization, or market. The costs associated with breeder hen inventories are accumulated up to the
46
production stage and amortized over their productive lives using the unit-of-production method. Finished poultry products, feed, eggs and other inventories are stated at the lower of cost (average) or market. We record valuations and adjustments for our inventory and for estimated obsolescence at or equal to the difference between the cost of inventory and the estimated market value based upon known conditions affecting inventory obsolescence, including significantly aged products, discontinued product lines, or damaged or obsolete products. We allocate meat costs between our various finished chicken products based on a by-product costing technique that reduces the cost of the whole bird by estimated yields and amounts to be recovered for certain by-product parts. This primarily includes leg quarters, wings, tenders and offal, which are carried in inventory at the estimated recovery amounts, with the remaining amount being reflected as our breast meat cost. Generally, we perform an evaluation of whether any lower of cost or market adjustments are required at the country level based on a number of factors, including: (i) pools of related inventory, (ii) product continuation or discontinuation, (iii) estimated market selling prices and (iv) expected distribution channels. If actual market conditions or other factors are less favorable than those projected by management, additional inventory adjustments may be required.
Property, Plant and Equipment.
We record impairment charges on long-lived assets held for use when events and circumstances indicate that the assets may be impaired and the undiscounted cash flows estimated to be generated by those assets are less than the carrying amount of those assets. The impairment charge is determined based upon the amount by which the net book value of the assets exceeds their fair market value. In making these determinations, we utilize certain assumptions, including, but not limited to: (i) future cash flows estimated to be generated by these assets, which are based on additional assumptions such as asset utilization, remaining length of service and estimated salvage values, (ii) estimated fair market value of the assets, and (iii) determinations with respect to the lowest level of cash flows relevant to the respective impairment test, generally groupings of related operational facilities. Given the interdependency of our individual facilities during the production process, which operate as a vertically integrated network, we evaluate impairment of assets held for use at the country level (i.e., the U.S. and Mexico). Management believes this is the lowest level of identifiable cash flows for our assets that are held for use in production activities. At the present time, our forecasts indicate that we can recover the carrying value of our assets held for use based on the projected undiscounted cash flows of the operations.
We record impairment charges on long-lived assets held for sale when the carrying amount of those assets exceeds their fair value less appropriate selling costs. Fair value is based on amounts documented in sales contracts or letters of intent accepted by us, amounts included in counteroffers initiated by us, or, in the absence of current contract negotiations, amounts determined using a sales comparison approach for real property and amounts determined using a cost approach for personal property. Under the sales comparison approach, sales and asking prices of reasonably comparable properties are considered to develop a range of unit prices within which the current real estate market is operating. Under the cost approach, a current cost to replace the asset new is calculated and then the estimated replacement cost is reduced to reflect the applicable decline in value resulting from physical deterioration, functional obsolescence and economic obsolescence. Appropriate selling costs includes reasonable broker's commissions, costs to produce title documents, filing fees, legal expenses and the like. We estimate appropriate closing costs as 4% to 6% of asset fair value. This range of rates is considered reasonable for our assets held for sale based on historical experience.
Goodwill and Other Intangibles, net.
Goodwill represents the excess of the aggregate purchase price over the fair value of the net identifiable assets acquired in a business combination. Identified intangible assets represent trade names, customer relationships and non-compete agreements arising from acquisitions that are recorded at fair value as of the date acquired less accumulated amortization, if any. The Company uses various market valuation techniques to determine the fair value of its identified intangible assets.
Goodwill and other intangible assets with indefinite lives are not amortized but are tested for impairment on an annual basis in the fourth quarter of each fiscal year or more frequently if impairment indicators arise. For goodwill, an impairment loss is recognized for any excess of the carrying amount of a reporting unit’s goodwill over the implied fair value of that goodwill. Management first reviews relevant qualitative factors to determine if an indication of impairment exists for a reporting unit. If management determines there is an indication that the carrying amount of reporting unit goodwill might be impaired, a quantitative analysis is performed. Management performed a qualitative analysis noting
no
indications of goodwill impairment in any of its reporting units as of
December 31, 2017
. For indefinite-lived intangible assets, an impairment loss is recognized if the carrying amount of an indefinite-lived intangible asset exceeds the estimated fair value of that intangible asset. Management first reviews relevant qualitative factors to determine if an indication of impairment exists. If management determines there is an indication that the carrying amount of the intangible asset might be impaired, and quantitative analysis is performed. Management performed a qualitative analysis noting no indications of impairment for any of its indefinite-lived intangible assets as of
December 31, 2017
.
Identifiable intangible assets with definite lives, such as customer relationships, non-compete agreements and trade names that the Company expects to use for a limited amount of time, are amortized over their estimated useful lives on a straight-line basis. The useful lives range from
three
to
20
years for trade names and non-compete agreements and
5
to
16
years for customer relationships. Identified intangible assets with definite lives are tested for recoverability whenever events or changes in circumstances indicate that their carrying amount may not be recoverable. Management assessed if events or changes in
47
circumstances indicated that the aggregate carrying amount of its identified intangible assets with definite lives might not be recoverable and determined that there were
no
impairment indicators during the fifty-three weeks ended
December 31, 2017
and fifty-two weeks ended
December 25, 2016
.
Derivative Financial Instruments.
The Company uses derivative financial instruments (e.g., futures, forwards and options) for the purpose of mitigating exposure to changes in commodity prices and foreign currency exchange rates.
|
•
|
Commodity Price Risk
-
The Company utilizes various raw materials, which are all considered commodities, in its operations, including corn, soybean meal, soybean oil, wheat, natural gas, electricity and diesel fuel. The Company considers these raw materials to be generally available from a number of different sources and believes it can obtain them to meet its requirements. These commodities are subject to price fluctuations and related price risk due to factors beyond our control, such as economic and political conditions, supply and demand, weather, governmental regulation and other circumstances. Generally, the Company enters into derivative contracts such as physical forward contracts and exchange-traded futures or option contracts in an attempt to mitigate price risk related to its anticipated consumption of commodity inputs for periods up to 12 months. The Company may enter into longer-term derivatives on particular commodities if deemed appropriate.
|
|
•
|
Foreign Currency Risk -
The Company has foreign operations and, therefore, has exposure to foreign exchange risk when the financial results of those operations are translated to US dollars. The Company will occasionally purchase derivative financial instruments such as foreign currency forward contracts in an attempt to mitigate currency exchange rate exposure related to the net assets of its Mexico operations that are denominated in Mexican pesos. The Company’s Moy Park operation also attempts to mitigate foreign currency exposure on certain euro- and U.S. dollar-denominated transactions through the use of derivative financial instruments.
|
Pilgrim’s recognizes all commodity derivative instruments that qualify for derivative accounting treatment as either assets or liabilities and measures those instruments at fair value unless they qualify for, and we elect, the normal purchases and normal sales scope exception (“NPNS”). The permitted accounting treatments include: cash flow hedge; fair value hedge; and undesignated contracts. Undesignated contract accounting is the default accounting treatment for all derivatives unless they qualify, and we specifically designate them, for one of the other accounting treatments. Derivatives designated for any of the elective accounting treatments must meet specific, restrictive criteria both at the time of designation and on an ongoing basis.
The Company has generally applied the NPNS exception to its forward physical grain purchase contracts. NPNS contracts are accounted for using the accrual method of accounting; therefore, there were
no
amounts recorded in the Consolidated and Combined Financial Statements at December 31, 2017 and December 25, 2016.
Undesignated contracts may include contracts not designated as a hedge or for which the NPNS exception was not elected, contracts that do not qualify for hedge accounting and derivatives that do not or no longer qualify for the NPNS scope exception. The fair value of these derivatives is recognized in the Consolidated and Combined Balance Sheets within
Prepaid expenses and other current assets
or
Accrued expenses and other current liabilities
. Changes in fair value of these derivatives are recognized immediately in the Consolidated and Combined Statements of Income within
Net sales
,
Cost of sales
or
Selling, general and administrative expense
, depending on the risk they are intended to mitigate. While management believes these instruments help mitigate various market risks, they are not designated nor accounted for as hedges as a result of the extensive recordkeeping requirements.
The Company designated a British pound-denominated promissory note payable issued to JBS S.A. in conjunction with the Moy Park acquisition as a hedge of its net investment in Moy Park. The remeasurement of the note is reported as a foreign currency translation adjustment in accumulated other comprehensive loss in the Consolidated and Combined Balance Sheets and will be reclassified into earnings only if the Company divests its investment in Moy Park. The Company paid the promissory note payable in full with proceeds from the sale of senior notes (See “Note 11. Long-Term Debt and Other Borrowing Arrangements” to the Consolidated and Combined Financial Statements). At December 31, 2017, the remeasurement adjustment was a loss of
$13.5 million
and is included in accumulated other comprehensive loss, net of tax.
Pilgrim’s has designated a portion of its foreign currency derivatives as cash flow hedges and the effective portion of the gain or loss on these derivatives is reported as a component of
Accumulated other comprehensive loss
within the Consolidated and Combined Balance Sheets and reclassified into earnings in the same period or periods during which the hedged transactions affect earnings. The derivatives are designated as hedging the variability in expected future cash flows from foreign currency exchange risk related to sales and purchases denominated in nonfunctional currencies.
Litigation and Contingent Liabilities.
We are subject to lawsuits, investigations and other claims related to employment, environmental, product, and other matters. We are required to assess the likelihood of any adverse judgments or outcomes, as well
48
as potential ranges of probable losses, to these matters. We estimate the amount of reserves required for these contingencies when losses are determined to be probable and after considerable analysis of each individual issue. We expense legal costs related to such loss contingencies as they are incurred. With respect to our environmental remediation obligations, the accrual for environmental remediation liabilities is measured on an undiscounted basis. These reserves may change in the future due to changes in our assumptions, the effectiveness of strategies, or other factors beyond our control.
Accrued Self Insurance
. Insurance expense for casualty claims and employee-related health care benefits are estimated using historical and current experience and actuarial estimates. Stop-loss coverage is maintained with third-party insurers to limit our total exposure. Certain categories of claim liabilities are actuarially determined. The assumption used to arrive at periodic expenses is reviewed regularly by management. However, actual expenses could differ from these estimates and could result in adjustments to be recognized.
Income Taxes.
We follow provisions under ASC No. 740-10-30-27 in the Expenses-Income Taxes topic with regard to members of a group that file a consolidated tax return but issue separate financial statements. We file our own U.S. federal tax return, but we are included in certain state unitary returns with JBS USA Holdings. The income tax expense of our company is computed using the separate return method. The provision for income taxes has been determined using the asset and liability approach of accounting for income taxes. For the unitary states, we have an obligation to make tax payments to JBS USA Holdings for our share of the unitary taxable income, which is included in taxes payable in our Consolidated and Combined Balance Sheets. Under this approach, deferred income taxes reflect the net tax effect of temporary differences between the book and tax bases of recorded assets and liabilities, net operating losses and tax credit carry forwards. The amount of deferred tax on these temporary differences is determined using the tax rates expected to apply to the period when the asset is realized or the liability is settled, as applicable, based on the tax rates and laws in the respective tax jurisdiction enacted as of the balance sheet date. We recognize potential interest and penalties related to income tax positions as a part of the income tax provision.
Realizability of Deferred Tax Assets.
We review our deferred tax assets for recoverability and establish a valuation allowance based on historical taxable income, potential for carry back of tax losses, projected future taxable income, applicable tax strategies, and the expected timing of the reversals of existing temporary differences. A valuation allowance is provided when it is more likely than not that some or all of the deferred tax assets will not be realized. Valuation allowances have been established primarily for net operating loss carry forwards. See “Note 12. Income Taxes” to the Consolidated Financial Statements in this annual report.
Indefinite Reinvestment in Foreign Subsidiaries.
We deem our earnings from foreign subsidiaries as of December 31, 2017 to be permanently reinvested. As such, U.S. deferred income taxes have not been provided on these earnings. If such earnings were not considered indefinitely reinvested, certain deferred foreign and U.S. income taxes would be provided.
Accounting for Uncertainty in Income Taxes.
We follow provisions under ASC No. 740-10-25 that provide a recognition threshold and measurement criteria for the financial statement recognition of a tax benefit taken or expected to be taken in a tax return. Tax benefits are recognized only when it is more likely than not, based on the technical merits, that the benefits will be sustained on examination. Tax benefits that meet the more-likely-than-not recognition threshold are measured using a probability weighting of the largest amount of tax benefit that has greater than 50% likelihood of being realized upon settlement. Whether the more-likely-than-not recognition threshold is met for a particular tax benefit is a matter of judgment based on the individual facts and circumstances evaluated in light of all available evidence as of the balance sheet date. See “Note 12. Income Taxes” to the Consolidated Financial Statements in this annual report.
Pension and Other Postretirement Benefits
. Our pension and other postretirement benefit costs and obligations are dependent on the various actuarial assumptions used in calculating such amounts. These assumptions relate to discount rates, salary growth, long-term return on plan assets and other factors. We base the discount rate assumptions on current investment yields on high-quality corporate long-term bonds. Long-term return on plan assets is determined based on historical portfolio results and management’s expectation of the future economic environment. Actual results that differ from our assumptions are accumulated and, if in excess of the lesser of 10% of the projected benefit obligation or the fair market value of plan assets, amortized over either (i) the estimated average future service period of active plan participants if the plan is active or (ii) the estimated average future life expectancy of all plan participants if the plan is frozen.
49
Item 7A.
Quantitative and Qualitative Disclosures about Market Risk
Market Risk-Sensitive Instruments and Positions
The risk inherent in our market risk-sensitive instruments and positions is primarily the potential loss arising from adverse changes in commodity prices, foreign currency exchange rates, interest rates and the credit quality of available-for-sale securities as discussed below. The sensitivity analyses presented do not consider the effects that such adverse changes may have on overall economic activity, nor do they consider additional actions our management may take to mitigate our exposure to such changes. Actual results may differ.
Commodity Prices
We purchase certain commodities, primarily corn, soybean meal and sorghum, for use as ingredients in the feed we either sell commercially or consume in our live operations. As a result, our earnings are affected by changes in the price and availability of such feed ingredients. In the past, we have from time to time attempted to minimize our exposure to the changing price and availability of such feed ingredients using various techniques, including, but not limited to, (i) executing purchase agreements with suppliers for future physical delivery of feed ingredients at established prices and (ii) purchasing or selling derivative financial instruments such as futures and options.
For this sensitivity analysis, market risk is estimated as a hypothetical 10.0% change in the weighted-average cost of our primary feed ingredients as of December 31, 2017 and December 25, 2016. However, fluctuations greater than 10.0% could occur. Based on our feed consumption during 2017 and 2016, such a change would have resulted in a change to cost of sales of approximately $279.7 million and $280.1 million, respectively, excluding the impact of any feed ingredients derivative financial instruments in that period. A 10.0% change in ending feed ingredients inventories at December 31, 2017 and December 25, 2016 would be $14.6 million and $12.4 million, respectively, excluding any potential impact on the production costs of our chicken inventories.
We purchase commodity derivative financial instruments, specifically exchange-traded futures and options, in an attempt to mitigate price risk related to its anticipated consumption of commodity inputs for the next 12 months. A 10.0% increase in corn, soybean meal, and soybean oil prices on December 31, 2017 and December 25, 2016 would have resulted in an increase of approximately $0.5 million and $0.4 million, respectively, in the fair value of our net commodity derivative position, including margin cash, as of that date.
Interest Rates
Our variable-rate debt instruments represent approximately 34.7% and 38.1% of our total debt at December 31, 2017 and December 25, 2016, respectively. Holding other variables constant, including levels of indebtedness, an increase in interest rates of 25 basis points would have increased our interest expense by $0.6 million and $0.3 million in 2017 and 2016, respectively.
Market risk for fixed-rate debt is estimated as the potential increase in fair value resulting from a hypothetical decrease in interest rates of 10.0%. Using a discounted cash flow analysis, a hypothetical 10.0% decrease in interest rates would have decreased the fair value of our fixed-rate debt by approximately $10.2 million and $5.2 million as of December 31, 2017 and December 25, 2016, respectively.
Foreign Currency
Our earnings are also affected by foreign exchange rate fluctuations related to the Mexican peso net monetary position of our Mexico subsidiaries. We manage this exposure primarily by attempting to minimize our Mexican peso net monetary position. We are also exposed to the effect of potential currency exchange rate fluctuations to the extent that amounts are repatriated from Mexico to the U.S. We currently anticipate that the future cash flows of our Mexico subsidiaries will be reinvested in our Mexico operations.
The Mexican peso exchange rate can directly and indirectly impact our financial condition and results of operations in several ways, including potential economic recession in Mexico because of devaluation of their currency. Foreign currency exchange gains, representing the change in the U.S. dollar value of the net monetary assets of our Mexican subsidiaries denominated in Mexican pesos, were $2.7 million in 2017, while foreign exchange losses were $3.9 million and $25.9 million in 2016 and 2015, respectively. The average exchange rates for 2017, 2016 and 2015 were 18.93 Mexican pesos to 1 U.S. dollar, 18.64 Mexican pesos to 1 U.S. dollar and 15.85 Mexican pesos to 1 U.S. dollar, respectively. For this sensitivity analysis, market risk is estimated as a hypothetical 10.0% deterioration in the current exchange rate used to convert Mexican pesos to U.S. dollars as of December 31, 2017 and December 25, 2016. However, fluctuations greater than 10.0% could occur. Based on the net monetary liability position of our Mexico operations at December 31, 2017, such a change would have resulted in an increase in foreign currency
50
transaction losses recognized in 2017 of approximately $3.7 million. Based on the net monetary liability position of our Mexico operations at December 25, 2016, such a change would have resulted in a decrease in foreign currency transaction losses recognized in 2016 of approximately $0.4 million. No assurance can be given as to how future movements in the Mexican peso could affect our future financial condition or results of operations.
Additionally, we are exposed to foreign exchange-related variability of investments and earnings from our foreign investments in Europe (including the U.K.). Foreign currency market risk is the possibility that our financial results or financial position could be better or worse than planned because of changes in foreign currency exchange rates. At December 31, 2017, our U.K. and Europe segment had net assets of approximately
$2.2 billion
denominated in British pounds, after consideration of our derivative and nonderivative financial instruments. Based on our sensitivity analysis, a 10% adverse change in exchange rates would cause a reduction of
$222.8 million
to our net assets.
At December 31, 2017, we had foreign currency forward contracts, which were designated and qualify as cash flow hedges, with an aggregate notional amount of $38.0 million to hedge a portion of our investments in Europe (including the U.K.). On the basis of our sensitivity analysis, a weakening of the U.S. dollar against the British pound by 10% would result in a $3.0 million negative change in our cash flows on settlement while a weakening of the U.S. dollar against the euro by 10% would result in a $0.8 million negative change in our cash flows on settlement. No assurance can be given as to how future movements in currency rates could affect our future financial condition or results of operations.
Quality of Investments
Certain retirement plans that we sponsor invest in a variety of financial instruments. We have analyzed our portfolios of investments and, to the best of our knowledge, none of our investments, including money market funds units, commercial paper and municipal securities, have been downgraded, and neither we nor any fund in which we participate hold significant amounts of structured investment vehicles, auction rate securities, collateralized debt obligations, credit derivatives, hedge funds investments, fund of funds investments or perpetual preferred securities. Certain postretirement funds in which we participate hold significant amounts of mortgage-backed securities. However, none of the mortgages collateralizing these securities are considered subprime.
Impact of Inflation
Due to low to moderate inflation in the U.S., U.K. and Europe, and Mexico and our rapid inventory turnover rate, the results of operations have not been significantly affected by inflation during the past three-year period.
51
Item 8.
Financial Statements and Supplementary Data
Report of Independent Registered Public Accounting Firm
The Stockholders and Board of Directors
Pilgrim’s Pride Corporation:
Opinion on the Consolidated and Combined Financial Statements
We have audited the accompanying consolidated and combined balance sheets of Pilgrim’s Pride Corporation (the Company) as of December 31, 2017 and December 25, 2016, the related consolidated and combined statements of income, comprehensive income, stockholders’ equity, and cash flows for the fifty-three weeks ended December 31, 2017, the fifty-two weeks ended December 25, 2016, and the fifty-two weeks ended December 27, 2015, and the related notes and financial statement schedule II (collectively, the consolidated and combined financial statements). In our opinion, the consolidated and combined financial statements present fairly, in all material respects, the financial position of the Company as of December 31, 2017 and December 25, 2016, and the results of its operations and its cash flows for the fifty-three weeks ended December 31, 2017, the fifty-two weeks ended December 25, 2016, and the fifty-two weeks ended December 27, 2015, in conformity with U.S. generally accepted accounting principles.
We also have audited, in accordance with the standards of the Public Company Accounting Oversight Board (United States) (PCAOB), the Company’s internal control over financial reporting as of December 31, 2017, based on criteria established in
Internal Control - Integrated Framework (2013)
issued by the Committee of Sponsoring Organizations of the Treadway Commission, and our report dated February 15, 2018 expressed an unqualified opinion on the effectiveness of the Company’s internal control over financial reporting.
Basis for Opinion
These consolidated and combined financial statements are the responsibility of the Company’s management. Our responsibility is to express an opinion on these consolidated and combined financial statements based on our audits. We are a public accounting firm registered with the PCAOB and are required to be independent with respect to the Company in accordance with the U.S. federal securities laws and the applicable rules and regulations of the Securities and Exchange Commission and the PCAOB.
We conducted our audits in accordance with the standards of the PCAOB. Those standards require that we plan and perform the audit to obtain reasonable assurance about whether the consolidated and combined financial statements are free of material misstatement, whether due to error or fraud. Our audits included performing procedures to assess the risks of material misstatement of the consolidated and combined financial statements, whether due to error or fraud, and performing procedures that respond to those risks. Such procedures included examining, on a test basis, evidence regarding the amounts and disclosures in the consolidated and combined financial statements. Our audits also included evaluating the accounting principles used and significant estimates made by management, as well as evaluating the overall presentation of the consolidated and combined financial statements. We believe that our audits provide a reasonable basis for our opinion.
/s/ KPMG LLP
We have served as the Company’s auditor since 2012.
Denver, Colorado
February 15, 2018
52
PILGRIM’S PRIDE CORPORATION
|
December 31, 2017
|
December 25, 2016
|
||||||
|
|
(In thousands, except share and par value data)
|
||||||
|
Cash and cash equivalents
|
$
|
581,510
|
|
$
|
292,544
|
|
|
|
Restricted cash and cash equivalents
|
8,021
|
|
4,979
|
|
|||
|
Trade accounts and other receivables, less allowance for doubtful accounts
|
565,478
|
|
445,553
|
|
|||
|
Accounts receivable from related parties
|
2,951
|
|
4,010
|
|
|||
|
Inventories
|
1,255,070
|
|
975,608
|
|
|||
|
Prepaid expenses and other current assets
|
102,550
|
|
81,932
|
|
|||
|
Assets held for sale
|
708
|
|
5,259
|
|
|||
|
Total current assets
|
2,516,288
|
|
1,809,885
|
|
|||
|
Other long-lived assets
|
18,165
|
|
19,260
|
|
|||
|
Identified intangible assets, net
|
617,163
|
|
471,591
|
|
|||
|
Goodwill
|
1,001,889
|
|
887,221
|
|
|||
|
Property, plant and equipment, net
|
2,095,147
|
|
1,833,985
|
|
|||
|
Total assets
|
$
|
6,248,652
|
|
$
|
5,021,942
|
|
|
|
Accounts payable
|
$
|
762,444
|
|
$
|
790,378
|
|
|
|
Accounts payable to related parties
|
2,889
|
|
4,468
|
|
|||
|
Accrued expenses and other current liabilities
|
417,342
|
|
347,021
|
|
|||
|
Income taxes payable
|
222,073
|
|
27,578
|
|
|||
|
Current maturities of long-term debt
|
47,775
|
|
15,712
|
|
|||
|
Total current liabilities
|
1,452,523
|
|
1,185,157
|
|
|||
|
Long-term debt, less current maturities
|
2,635,617
|
|
1,396,124
|
|
|||
|
Deferred tax liabilities
|
208,492
|
|
251,807
|
|
|||
|
Other long-term liabilities
|
96,359
|
|
102,722
|
|
|||
|
Total liabilities
|
4,392,991
|
|
2,935,810
|
|
|||
|
Commitments and contingencies
|
|
|
|
|
|||
|
Preferred stock, $.01 par value, 50,000,000 shares authorized; no shares issued
|
—
|
|
—
|
|
|||
|
Common stock, $.01 par value, 800,000,000 shares authorized; 260,167,881 and
259,682,000 shares issued at year-end 2017 and year-end 2016, respectively;
248,752,508 and 249,046,139 shares outstanding at year-end 2017 and year-end
2016, respectively
|
2,602
|
|
307,288
|
|
|||
|
Treasury stock, at cost, 11,415,373 shares and 10,635,861 shares at year-end 2017 and year-end 2016, respectively
|
(231,758
|
)
|
(217,117
|
)
|
|||
|
Additional paid-in capital
|
1,932,509
|
|
3,100,332
|
|
|||
|
Retained earnings (accumulated deficit)
|
173,943
|
|
(782,785
|
)
|
|||
|
Accumulated other comprehensive loss
|
(31,140
|
)
|
(329,858
|
)
|
|||
|
Total Pilgrim’s Pride Corporation stockholders’ equity
|
1,846,156
|
|
2,077,860
|
|
|||
|
Noncontrolling interest
|
9,505
|
|
8,272
|
|
|||
|
Total stockholders’ equity
|
1,855,661
|
|
2,086,132
|
|
|||
|
Total liabilities and stockholders’ equity
|
$
|
6,248,652
|
|
$
|
5,021,942
|
|
|
The accompanying notes are an integral part of these Consolidated and Combined Financial Statements.
53
PILGRIM’S PRIDE CORPORATION
CONSOLIDATED AND COMBINED STATEMENTS OF INCOME
|
Fifty-Three Weeks Ended December 31, 2017
|
Fifty-Two Weeks
Ended December 25, 2016 |
Fifty-Two Weeks
Ended December 27, 2015 |
|||||||||
|
|
(In thousands, except per share data)
|
||||||||||
|
Net sales
|
$
|
10,767,863
|
|
$
|
9,878,564
|
|
$
|
8,752,672
|
|
||
|
Cost of sales
|
9,296,249
|
|
8,774,581
|
|
7,453,948
|
|
|||||
|
Gross profit
|
1,471,614
|
|
1,103,983
|
|
1,298,724
|
|
|||||
|
Selling, general and administrative expense
|
389,517
|
|
310,832
|
|
231,838
|
|
|||||
|
Administrative restructuring charges
|
9,775
|
|
1,069
|
|
5,754
|
|
|||||
|
Operating income
|
1,072,322
|
|
792,082
|
|
1,061,132
|
|
|||||
|
Interest expense, net of capitalized interest
|
107,183
|
|
75,636
|
|
46,549
|
|
|||||
|
Interest income
|
(7,730
|
)
|
(2,301
|
)
|
(3,828
|
)
|
|||||
|
Foreign currency transaction losses (gains)
|
(2,659
|
)
|
4,055
|
|
26,148
|
|
|||||
|
Miscellaneous, net
|
(6,538
|
)
|
(9,344
|
)
|
(9,061
|
)
|
|||||
|
Income before income taxes
|
982,066
|
|
724,036
|
|
1,001,324
|
|
|||||
|
Income tax expense
|
263,899
|
|
243,919
|
|
338,352
|
|
|||||
|
Net income
|
718,167
|
|
480,117
|
|
662,972
|
|
|||||
|
Less: Net income from Granite Holdings Sàrl prior to acquisition by Pilgrim’s Pride Corporation
|
23,486
|
|
40,388
|
|
17,010
|
|
|||||
|
Less: Net income (loss) attributable to noncontrolling interest
|
102
|
|
(803
|
)
|
48
|
|
|||||
|
Net income attributable to Pilgrim’s Pride Corporation
|
$
|
694,579
|
|
$
|
440,532
|
|
$
|
645,914
|
|
||
|
Weighted average shares of common stock outstanding:
|
|||||||||||
|
Basic
|
248,738
|
|
253,669
|
|
258,442
|
|
|||||
|
Effect of dilutive common stock equivalents
|
233
|
|
457
|
|
234
|
|
|||||
|
Diluted
|
248,971
|
|
254,126
|
|
258,676
|
|
|||||
|
Net income attributable to Pilgrim’s Pride Corporation
per share of common stock outstanding:
|
|||||||||||
|
Basic
|
$
|
2.79
|
|
$
|
1.74
|
|
$
|
2.50
|
|
||
|
Diluted
|
$
|
2.79
|
|
$
|
1.73
|
|
$
|
2.50
|
|
||
The accompanying notes are an integral part of these Consolidated and Combined Financial Statements.
54
PILGRIM’S PRIDE CORPORATION
CONSOLIDATED AND COMBINED STATEMENTS OF COMPREHENSIVE INCOME
|
Fifty-Three Weeks Ended
December 31, 2017
|
Fifty-Two Weeks
Ended
December 25, 2016
|
Fifty-Two Weeks
Ended
December 27, 2015
|
|||||||||
|
(In thousands)
|
|||||||||||
|
Net income
|
$
|
718,167
|
|
$
|
480,117
|
|
$
|
662,972
|
|
||
|
Other comprehensive loss:
|
|||||||||||
|
Foreign currency translation adjustment
|
|||||||||||
|
Gains (losses) arising during the period
|
100,081
|
|
(233,232
|
)
|
(32,482
|
)
|
|||||
|
Income tax effect
|
3,137
|
|
—
|
|
—
|
|
|||||
|
Derivative financial instruments designated as cash
flow hedges |
|||||||||||
|
Gains (losses) arising during the period
|
60
|
|
(151
|
)
|
(56
|
)
|
|||||
|
Reclassification to net earnings for losses (gains)
realized |
(639
|
)
|
311
|
|
(5
|
)
|
|||||
|
Available-for-sale securities
|
|||||||||||
|
Gains arising during the period
|
132
|
|
443
|
|
533
|
|
|||||
|
Income tax effect
|
(50
|
)
|
(167
|
)
|
(201
|
)
|
|||||
|
Reclassification to net earnings for gains realized
|
(34
|
)
|
(552
|
)
|
(475
|
)
|
|||||
|
Income tax effect
|
13
|
|
209
|
|
179
|
|
|||||
|
Defined benefit plans
|
|||||||||||
|
Gains (losses) arising during the period
|
(8,738
|
)
|
(9,085
|
)
|
5,054
|
|
|||||
|
Income tax effect
|
968
|
|
3,429
|
|
(1,908
|
)
|
|||||
|
Reclassification to net earnings of losses realized
|
932
|
|
659
|
|
689
|
|
|||||
|
Income tax effect
|
(353
|
)
|
(249
|
)
|
(260
|
)
|
|||||
|
Total other comprehensive income (loss), net of tax
|
95,509
|
|
(238,385
|
)
|
(28,932
|
)
|
|||||
|
Comprehensive income
|
813,676
|
|
241,732
|
|
634,040
|
|
|||||
|
Less: Comprehensive income (loss) for Granite
Holdings Sàrl prior to acquisition by Pilgrim's Pride Corporation |
88,050
|
|
(192,684
|
)
|
(15,533
|
)
|
|||||
|
Less: Comprehensive income (loss) attributable to
noncontrolling interests |
102
|
|
(803
|
)
|
48
|
|
|||||
|
Comprehensive income attributable to Pilgrim's Pride
Corporation |
$
|
725,524
|
|
$
|
435,219
|
|
$
|
649,525
|
|
||
The accompanying notes are an integral part of these Consolidated and Combined Financial Statements.
55
PILGRIM’S PRIDE CORPORATION
CONSOLIDATED AND COMBINED STATEMENTS OF STOCKHOLDERS’ EQUITY
|
Pilgrim’s Pride Corporation Stockholders
|
|||||||||||||||||||||||||||||||||
|
|
Common Stock
|
Treasury Stock
|
Additional
Paid-in Capital |
Retained Earnings (Accumulated
Deficit) |
Accumulated
Other Comprehensive Loss |
Noncontrolling
Interest |
Total
|
||||||||||||||||||||||||||
|
Shares
|
Amount
|
Shares
|
Amount
|
||||||||||||||||||||||||||||||
|
|
(In thousands)
|
||||||||||||||||||||||||||||||||
|
Balance at December 28, 2014
|
259,029
|
|
$
|
2,590
|
|
—
|
|
$
|
—
|
|
$
|
1,662,354
|
|
$
|
591,492
|
|
$
|
(62,541
|
)
|
$
|
2,906
|
|
$
|
2,196,801
|
|
||||||||
|
Comprehensive income:
|
|||||||||||||||||||||||||||||||||
|
Net income (loss)
|
—
|
|
—
|
|
—
|
|
—
|
|
—
|
|
662,924
|
|
—
|
|
48
|
|
662,972
|
|
|||||||||||||||
|
Other comprehensive loss, net of tax benefit of $2,190
|
—
|
|
—
|
|
—
|
|
—
|
|
—
|
|
—
|
|
(28,932
|
)
|
—
|
|
(28,932
|
)
|
|||||||||||||||
|
Capital contribution under Tax Sharing Agreement between JBS USA
Food Company Holdings and Pilgrim’s Pride Corporation (the“TSA”)
|
—
|
|
—
|
|
—
|
|
—
|
|
3,690
|
|
—
|
|
—
|
|
—
|
|
3,690
|
|
|||||||||||||||
|
Share-based compensation plans:
|
|||||||||||||||||||||||||||||||||
|
Common stock issued under compensation plans
|
671
|
|
7
|
|
—
|
|
—
|
|
(7
|
)
|
—
|
|
—
|
|
—
|
|
—
|
|
|||||||||||||||
|
Common stock forfeited under compensation plans
|
(15
|
)
|
(85
|
)
|
(85
|
)
|
|||||||||||||||||||||||||||
|
Requisite service period recognition
|
—
|
|
—
|
|
—
|
|
—
|
|
3,060
|
|
—
|
|
—
|
|
—
|
|
3,060
|
|
|||||||||||||||
|
Tax benefit related to share-based compensation
|
—
|
|
—
|
|
—
|
|
—
|
|
6,474
|
|
—
|
|
—
|
|
—
|
|
6,474
|
|
|||||||||||||||
|
Common stock purchased under share repurchase program
|
—
|
|
—
|
|
(4,862
|
)
|
(99,233
|
)
|
—
|
|
—
|
|
—
|
|
—
|
|
(99,233
|
)
|
|||||||||||||||
|
Special cash dividend
|
—
|
|
—
|
|
—
|
|
—
|
|
—
|
|
(1,498,470
|
)
|
—
|
|
—
|
|
(1,498,470
|
)
|
|||||||||||||||
|
Other
|
—
|
|
—
|
|
—
|
|
—
|
|
188
|
|
(188
|
)
|
—
|
|
—
|
|
—
|
|
|||||||||||||||
|
Stockholders' Equity of Granite Holdings Sàrl
|
13,000
|
|
304,691
|
|
—
|
|
—
|
|
1,414,716
|
|
(304,678
|
)
|
—
|
|
(1,131
|
)
|
1,413,598
|
|
|||||||||||||||
|
Balance at December 27, 2015
|
272,685
|
|
$
|
307,288
|
|
(4,862
|
)
|
$
|
(99,233
|
)
|
$
|
3,090,390
|
|
$
|
(548,920
|
)
|
$
|
(91,473
|
)
|
$
|
1,823
|
|
$
|
2,659,875
|
|
||||||||
|
Comprehensive income:
|
|||||||||||||||||||||||||||||||||
|
Net income
|
—
|
|
—
|
|
—
|
|
—
|
|
—
|
|
480,920
|
|
—
|
|
(803
|
)
|
480,117
|
|
|||||||||||||||
|
Other comprehensive loss, net of tax expense of $3,222
|
—
|
|
—
|
|
—
|
|
—
|
|
—
|
|
—
|
|
(238,385
|
)
|
—
|
|
(238,385
|
)
|
|||||||||||||||
|
Capital contribution under the TSA
|
—
|
|
—
|
|
—
|
|
—
|
|
5,039
|
|
—
|
|
—
|
|
—
|
|
5,039
|
|
|||||||||||||||
|
Share-based compensation plans:
|
|||||||||||||||||||||||||||||||||
|
Requisite service period recognition
|
—
|
|
—
|
|
6,102
|
|
—
|
|
—
|
|
—
|
|
6,102
|
|
|||||||||||||||||||
|
Common stock purchased under share repurchase program
|
—
|
|
—
|
|
(5,774
|
)
|
(117,884
|
)
|
—
|
|
—
|
|
—
|
|
—
|
|
(117,884
|
)
|
|||||||||||||||
|
Capital contributions to subsidiary by noncontrolling participants
|
—
|
|
—
|
|
—
|
|
—
|
|
—
|
|
—
|
|
—
|
|
7,252
|
|
7,252
|
|
|||||||||||||||
|
Common stock purchased from retirement plan participants
|
(3
|
)
|
—
|
|
—
|
|
—
|
|
(73
|
)
|
—
|
|
—
|
|
—
|
|
(73
|
)
|
|||||||||||||||
|
Dividend paid by Granite Holdings Sàrl to JBS S.A.
|
—
|
|
—
|
|
—
|
|
—
|
|
—
|
|
(14,870
|
)
|
—
|
|
—
|
|
(14,870
|
)
|
|||||||||||||||
|
Special cash dividend
|
—
|
|
—
|
|
—
|
|
—
|
|
—
|
|
(699,915
|
)
|
—
|
|
—
|
|
(699,915
|
)
|
|||||||||||||||
|
Other
|
—
|
|
—
|
|
—
|
|
—
|
|
(1,126
|
)
|
—
|
|
—
|
|
—
|
|
(1,126
|
)
|
|||||||||||||||
|
Balance at December 25, 2016
|
272,682
|
|
$
|
307,288
|
|
(10,636
|
)
|
$
|
(217,117
|
)
|
$
|
3,100,332
|
|
$
|
(782,785
|
)
|
$
|
(329,858
|
)
|
$
|
8,272
|
|
$
|
2,086,132
|
|
||||||||
|
Comprehensive income:
|
|||||||||||||||||||||||||||||||||
|
Net income (loss)
|
—
|
|
—
|
|
—
|
|
—
|
|
—
|
|
718,065
|
|
—
|
|
102
|
|
718,167
|
|
|||||||||||||||
|
Other comprehensive income, net of tax expense of $4,012
|
—
|
|
—
|
|
—
|
|
—
|
|
—
|
|
—
|
|
95,509
|
|
—
|
|
95,509
|
|
|||||||||||||||
|
Capital contribution under the TSA
|
—
|
|
—
|
|
—
|
|
—
|
|
5,558
|
|
—
|
|
—
|
|
—
|
|
5,558
|
|
|||||||||||||||
|
Share-based compensation plans:
|
|||||||||||||||||||||||||||||||||
|
Common stock issued under compensation plans
|
486
|
|
5
|
|
—
|
|
—
|
|
(5
|
)
|
—
|
|
—
|
|
—
|
|
—
|
|
|||||||||||||||
|
Requisite service period recognition
|
—
|
|
—
|
|
—
|
|
—
|
|
3,019
|
|
—
|
|
—
|
|
—
|
|
3,019
|
|
|||||||||||||||
|
Common stock purchased under share repurchase program
|
—
|
|
—
|
|
(780
|
)
|
(14,641
|
)
|
—
|
|
—
|
|
—
|
|
—
|
|
(14,641
|
)
|
|||||||||||||||
|
Deemed equity contribution resulting from the transfer of Granite Holdings Sàrl net assets from JBS S.A. to Pilgrim's Pride Corporation in a common-control transaction
|
—
|
|
—
|
|
—
|
|
—
|
|
237,195
|
|
—
|
|
—
|
|
237,195
|
|
|||||||||||||||||
|
Transfer of Granite Holdings Sàrl to Pilgrim's from JBS S.A.
|
(13,000
|
)
|
(304,691
|
)
|
—
|
|
—
|
|
(1,413,590
|
)
|
238,663
|
|
203,209
|
|
1,131
|
|
(1,275,278
|
)
|
|||||||||||||||
|
Balance at December 31, 2017
|
260,168
|
|
$
|
2,602
|
|
(11,416
|
)
|
$
|
(231,758
|
)
|
$
|
1,932,509
|
|
$
|
173,943
|
|
$
|
(31,140
|
)
|
$
|
9,505
|
|
$
|
1,855,661
|
|
||||||||
The accompanying notes are an integral part of these Consolidated and Combined Financial Statements.
56
PILGRIM’S PRIDE CORPORATION
|
Fifty-Three Weeks Ended December 31, 2017
|
Fifty-Two Weeks
Ended December 25, 2016 |
Fifty-Two Weeks
Ended December 27, 2015 |
|||||||||
|
|
(In thousands)
|
||||||||||
|
Cash flows from operating activities:
|
|||||||||||
|
Net income
|
$
|
718,167
|
|
$
|
480,117
|
|
$
|
662,972
|
|
||
|
Adjustments to reconcile net income to cash provided by operating activities:
|
|||||||||||
|
Depreciation and amortization
|
277,792
|
|
231,708
|
|
173,817
|
|
|||||
|
Asset impairment
|
5,156
|
|
790
|
|
4,813
|
|
|||||
|
Foreign currency transaction gains related to borrowing arrangements
|
(1,387
|
)
|
—
|
|
—
|
|
|||||
|
Amortization of bond premium
|
(180
|
)
|
—
|
|
—
|
|
|||||
|
Gain on property disposals
|
(506
|
)
|
(8,914
|
)
|
(10,372
|
)
|
|||||
|
Loss (gain) on equity method investments
|
(59
|
)
|
452
|
|
—
|
|
|||||
|
Share-based compensation
|
3,020
|
|
6,102
|
|
2,975
|
|
|||||
|
Deferred income tax expense (benefit)
|
(49,963
|
)
|
(5,034
|
)
|
19,872
|
|
|||||
|
Changes in operating assets and liabilities:
|
|||||||||||
|
Trade accounts and other receivables
|
(82,169
|
)
|
(32,428
|
)
|
76,130
|
|
|||||
|
Inventories
|
(207,399
|
)
|
(33,083
|
)
|
83,595
|
|
|||||
|
Prepaid expenses and other current assets
|
(14,827
|
)
|
19,270
|
|
23,578
|
|
|||||
|
Accounts payable and accrued expenses
|
(22,827
|
)
|
75,893
|
|
36,314
|
|
|||||
|
Income taxes
|
188,120
|
|
75,238
|
|
(55,324
|
)
|
|||||
|
Long-term pension and other postretirement obligations
|
(10,864
|
)
|
(10,165
|
)
|
(3,500
|
)
|
|||||
|
Other
|
(753
|
)
|
(4,584
|
)
|
5,510
|
|
|||||
|
Cash provided by operating activities
|
801,321
|
|
795,362
|
|
1,020,380
|
|
|||||
|
Cash flows from investing activities:
|
|||||||||||
|
Acquisitions of property, plant and equipment
|
(339,872
|
)
|
(340,960
|
)
|
(190,262
|
)
|
|||||
|
Purchase of acquired business, net of cash acquired
|
(658,520
|
)
|
—
|
|
(373,532
|
)
|
|||||
|
Proceeds from property disposals
|
4,475
|
|
13,375
|
|
14,610
|
|
|||||
|
Proceeds from settlement of life insurance contract
|
1,845
|
|
—
|
|
—
|
|
|||||
|
Cash used in investing activities
|
(992,072
|
)
|
(327,585
|
)
|
(549,184
|
)
|
|||||
|
Cash flows from financing activities:
|
|||||||||||
|
Proceeds from notes payable to bank
|
—
|
|
36,838
|
|
28,726
|
|
|||||
|
Payments on notes payable to bank
|
—
|
|
(65,564
|
)
|
—
|
|
|||||
|
Payment of note payable to affiliate
|
(753,512
|
)
|
—
|
|
—
|
|
|||||
|
Proceeds from revolving line of credit and long-term borrowings
|
1,871,818
|
|
593,015
|
|
1,680,000
|
|
|||||
|
Payments on revolving line of credit, long-term borrowings and capital lease obligations
|
(628,677
|
)
|
(570,015
|
)
|
(690,138
|
)
|
|||||
|
Proceeds from capital contribution under Tax Sharing Agreement between
JBS USA Food Company Holdings and Pilgrim’s Pride Corporation |
5,038
|
|
3,690
|
|
—
|
|
|||||
|
Tax benefit related to share-based compensation
|
—
|
|
—
|
|
6,474
|
|
|||||
|
Capital contributions to subsidiary by noncontrolling stockholders
|
—
|
|
7,252
|
|
—
|
|
|||||
|
Payment of capitalized loan costs
|
(13,631
|
)
|
(693
|
)
|
(12,364
|
)
|
|||||
|
Purchase of common stock under share repurchase program
|
(14,641
|
)
|
(117,884
|
)
|
(99,233
|
)
|
|||||
|
Purchase of common stock from retirement plan participants
|
—
|
|
(73
|
)
|
—
|
|
|||||
|
Payment of cash dividend
|
—
|
|
(714,785
|
)
|
(1,498,470
|
)
|
|||||
|
Cash provided by (used in) financing activities
|
466,395
|
|
(828,219
|
)
|
(585,005
|
)
|
|||||
|
Effect of exchange rate changes on cash and cash equivalents
|
16,364
|
|
(38,587
|
)
|
(4,264
|
)
|
|||||
|
Increase (decrease) in cash and cash equivalents
|
292,008
|
|
(399,029
|
)
|
(118,073
|
)
|
|||||
|
Cash and cash equivalents, beginning of period
|
297,523
|
|
696,552
|
|
814,625
|
|
|||||
|
Cash and cash equivalents, end of period
|
$
|
589,531
|
|
$
|
297,523
|
|
$
|
696,552
|
|
||
|
Supplemental Disclosure Information:
|
|||||||||||
|
Interest paid (net of amount capitalized)
|
$
|
81,260
|
|
$
|
69,857
|
|
$
|
42,968
|
|
||
|
Income taxes paid
|
122,956
|
|
161,026
|
|
361,183
|
|
|||||
57
NOTES TO CONSOLIDATED AND COMBINED FINANCIAL STATEMENTS
1. BUSINESS AND SUMMARY OF SIGNIFICANT ACCOUNTING POLICIES
Business
Pilgrim’s Pride Corporation (referred to herein as “Pilgrim’s,” “PPC,” “the Company,” “we,” “us,” “our,” or similar terms) is one of the largest chicken producers in the world, with operations in the United States (“U.S.”), the United Kingdom (“U.K.”), Mexico, France, Puerto Rico, and The Netherlands. Pilgrim’s products are sold to foodservice, retail and frozen entrée customers. The Company’s primary distribution is through retailers, foodservice distributors and restaurants throughout the countries listed above. Additionally, the Company exports chicken products to approximately
100
countries. Pilgrim’s fresh chicken products consist of refrigerated (nonfrozen) whole chickens, whole cut-up chickens and selected chicken parts that are either marinated or non-marinated. The Company’s prepared chicken products include fully cooked, ready-to-cook and individually frozen chicken parts, strips, nuggets and patties, some of which are either breaded or non-breaded and either marinated or non-marinated. The Company’s other products include ready-to-eat meals, multi-protein frozen foods, vegetarian foods and desserts. As a vertically integrated company, we control every phase of the production of our products. We operate feed mills, hatcheries, processing plants and distribution centers in
14
U.S. states, the U.K., Europe, Puerto Rico and Mexico. As of
December 31, 2017
, Pilgrim’s had approximately
51,300
employees and the capacity to process more than
45.2 million
birds per week for a total of more than
13.3 billion
pounds of live chicken annually. Approximately
5,200
contract growers supply poultry for the Company’s operations. As of
December 31, 2017
, JBS S.A., through its indirect wholly-owned subsidiaries (together, “JBS”) beneficially owned
78.6%
of the Company’s outstanding common stock.
Consolidated and Combined Financial Statements
The Company operates on the basis of a
52
/
53
-week fiscal year ending on the Sunday falling on or before December 31. Any reference we make to a particular year (for example,
2017
) in the notes to these Consolidated and Combined Financial Statements applies to our fiscal year and not the calendar year.
On September 8, 2017, a subsidiary of the Company acquired
100%
of the issued and outstanding shares of Granite Holdings Sàrl and its subsidiaries (together, “Moy Park”) from JBS S.A. in a common-control transaction. Moy Park was acquired by JBS S.A. from an unrelated third party on September 30, 2015. For the period from September 30, 2015 through September 7, 2017, the Consolidated and Combined Financial Statements include the accounts of the Company and its majority-owned subsidiaries combined with the accounts of Moy Park. For the period from September 8, 2017 through December 31, 2017, the Consolidated and Combined Financial Statements include the accounts of the Company and its majority-owned subsidiaries, including Moy Park. We eliminate all significant affiliate accounts and transactions upon consolidation.
The Consolidated and Combined Financial Statements have been prepared in conformity with U.S. GAAP using management’s best estimates and judgments. These estimates and judgments affect the reported amounts of assets and liabilities and disclosure of the contingent assets and liabilities at the date of the financial statements. The estimates and judgments will also affect the reported amounts for certain revenues and expenses during the reporting period. Actual results could differ materially from these estimates and judgments. Significant estimates made by the Company include the allowance for doubtful accounts, reserves related to inventory obsolescence or valuation, useful lives of long-lived assets, goodwill, valuation of deferred tax assets, insurance accruals, valuation of pension and other postretirement benefits obligations, income tax accruals, certain derivative positions and valuations of acquired businesses.
The functional currency of the Company's U.S. and Mexico operations and certain holding-company subsidiaries in Luxembourg, the U.K. and Ireland is the U.S. dollar. The functional currency of its U.K. operations is the British pound. The functional currency of the Company's operations in France and the Netherlands is the euro. For foreign currency-denominated entities other than the Company's Mexico operations, translation from local currencies into U.S. dollars is performed for most assets and liabilities using the exchange rates in effect as of the balance sheet date. Income and expense accounts are remeasured using average exchange rates for the period. Adjustments resulting from translation of these financial records are reflected as a separate component of
Accumulated other comprehensive loss
in the Consolidated and Combined Balance Sheets. For the Company's Mexico operations, remeasurement from the Mexican peso to U.S. dollars is performed for monetary assets and liabilities using the exchange rate in effect as of the balance sheet date. Remeasurement is performed for non-monetary assets using the historical exchange rate in effect on the date of each asset’s acquisition. Income and expense accounts are remeasured using average exchange rates for the period. Net adjustments resulting from remeasurement of these financial records are reflected in
Foreign currency transaction losses (gains)
in the Consolidated and Combined Statements of Income.
58
The Company or its subsidiaries may use derivatives for the purpose of mitigating exposure to changes in foreign currency exchange rates. Foreign currency transaction gains or losses are reported in the Consolidated and Combined Statements of Income.
Revenue Recognition
We recognize revenue when all of the following circumstances are satisfied: (i) persuasive evidence of an arrangement exits, (ii) price is fixed or determinable, (iii) collectability is reasonably assured and (iv) delivery has occurred. Delivery occurs in the period in which the customer takes title and assumes the risks and rewards of ownership of the products specified in the customer’s purchase order or sales agreement. Revenue is recorded net of estimated incentive offerings including special pricing agreements, promotions and other volume-based incentives. Revisions to these estimates are charged back to net sales in the period in which the facts that give rise to the revision become known. Taxes collected from customers and remitted to governmental authorities are excluded from revenues.
Shipping and Handling Costs
Costs associated with the products shipped to customers are recognized in cost of sales.
Advertising Costs
The Company expenses advertising costs as incurred. Advertising costs are included in selling, general and administrative expenses and totaled
$18.5 million
,
$12.3 million
and
$5.8 million
for
2017
,
2016
and
2015
, respectively.
Research and Development Costs
Research and development costs are expensed as incurred. Research and development costs totaled
$3.7 million
,
$3.5 million
and
$4.1 million
for
2017
,
2016
and
2015
, respectively.
Cash and Cash Equivalents
The Company considers highly liquid investments with a maturity of three months or less when acquired to be cash equivalents. The majority of the Company’s disbursement bank accounts are zero balance accounts where cash needs are funded as checks are presented for payment by the holder. Checks issued pending clearance that result in overdraft balances for accounting purposes are classified as accounts payable and the change in the related balance is reflected in operating activities on the Consolidated and Combined Statements of Cash Flows.
Investments
The Company’s current investments are all highly liquid investments with a maturity of three months or less when acquired and are, therefore, considered cash equivalents. The Company’s current investments are comprised of fixed income securities, primarily commercial paper and a money market fund. These investments are classified as available-for-sale. These securities are recorded at fair value, and unrealized holding gains and losses are recorded, net of tax, as a separate component of accumulated other comprehensive income. Investments in fixed income securities with remaining maturities of less than one year and those identified by management at the time of purchase for funding operations in less than one year are classified as current assets. Investments in fixed income securities with remaining maturities in excess of one year that management has not identified at the time of purchase for funding operations in less than one year are classified as long-term assets. Unrealized losses are charged against net earnings when a decline in fair value is determined to be other than temporary. Management reviews several factors to determine whether a loss is other than temporary, such as the length of time a security is in an unrealized loss position, the extent to which fair value is less than amortized cost, the impact of changing interest rates in the short and long term, and the Company’s intent and ability to hold the security for a period of time sufficient to allow for any anticipated recovery in fair value. The Company determines the cost of each security sold and each amount reclassified out of accumulated other comprehensive income into earnings using the specific identification method. Purchases and sales are recorded on a settlement date basis.
Investments in entities in which the Company has an ownership interest greater than
50%
and exercises control over the entity are consolidated in the Consolidated and Combined Financial Statements. Investments in entities in which the Company has an ownership interest between
20%
and
50%
and exercises significant influence are accounted for using the equity method. The Company invests from time to time in ventures in which its ownership interest is less than 20% and over which it does not exercise significant influence. Such investments are accounted for under the cost method. The fair values for investments not traded on a quoted exchange are estimated based upon the historical performance of the ventures, the ventures’ forecasted financial performance and management’s evaluation of the ventures’ viability and business models. To the extent the book value of an investment exceeds its assessed fair value, the Company will record an appropriate impairment charge.
59
Accounts Receivable
The Company records accounts receivable when revenue is recognized. We record an allowance for doubtful accounts, reducing our receivables balance to an amount we estimate is collectible from our customers. Estimates used in determining the allowance for doubtful accounts are based on historical collection experience, current trends, aging of accounts receivable, and periodic credit evaluations of our customers’ financial condition. We write off accounts receivable when it becomes apparent, based upon age or customer circumstances, that such amounts will not be collected. Generally, the Company does not require collateral for its accounts receivable.
Inventories
Live chicken inventories are stated at the lower of cost or market and breeder hen inventories at the lower of cost, less accumulated amortization, or market. The costs associated with breeder hen inventories are accumulated up to the production stage and amortized over their productive lives using the unit-of-production method. Finished poultry products, feed, eggs and other inventories are stated at the lower of cost (average) or market.
We record valuation adjustments for our inventory and for estimated obsolescence at or equal to the difference between the cost of inventory and the estimated market value based upon known conditions affecting inventory, including significantly aged products, discontinued product lines, or damaged or obsolete products. We allocate meat costs between our various finished chicken products based on a by-product costing technique that reduces the cost of the whole bird by estimated yields and amounts to be recovered for certain by-product parts. This primarily includes leg quarters, wings, tenders and offal, which are carried in inventory at the estimated recovery amounts, with the remaining amount being reflected as our breast meat cost.
Generally, the Company performs an evaluation of whether any lower of cost or market adjustments are required at the country level based on a number of factors, including: (i) pools of related inventory, (ii) product continuation or discontinuation, (iii) estimated market selling prices and (iv) expected distribution channels. If actual market conditions or other factors are less favorable than those projected by management, additional inventory adjustments may be required.
Property, Plant and Equipment
Property, plant and equipment are stated at cost, and repair and maintenance costs are expensed as incurred. Depreciation is computed using the straight-line method over the estimated useful lives of these assets. Estimated useful lives for building, machinery and equipment are
five
to
33
years and for automobiles and trucks are
three
to
ten
years. The charge to income resulting from amortization of assets recorded under capital leases is included with depreciation expense.
The Company records impairment charges on long-lived assets held for use when events and circumstances indicate that the assets may be impaired and the undiscounted cash flows estimated to be generated by those assets are less than the carrying amount of those assets. When the above is true, the impairment charge is determined based upon the amount the net book value of the assets exceeds their fair market value. In making these determinations, the Company utilizes certain assumptions, including, but not limited to: (i) future cash flows estimated to be generated by these assets, which are based on additional assumptions such as asset utilization, remaining length of service and estimated salvage values, (ii) estimated fair market value of the assets and (iii) determinations with respect to the lowest level of cash flows relevant to the respective impairment test, generally groupings of related operational facilities. Given the interdependency of the Company’s individual facilities during the production process, which operate as a vertically integrated network, it evaluates impairment of assets held for use at the country level (i.e., the U.S. and Mexico). Management believes this is the lowest level of identifiable cash flows for its assets that are held for use in production activities. At the present time, the Company’s forecasts indicate that it can recover the carrying value of its assets held for use based on the projected undiscounted cash flows of the operations.
The Company records impairment charges on long-lived assets held for sale when the carrying amount of those assets exceeds their fair value less appropriate selling costs. Fair value is based on amounts documented in sales contracts or letters of intent accepted by the Company, amounts included in counteroffers initiated by the Company, or, in the absence of current contract negotiations, amounts determined using a sales comparison approach for real property and amounts determined using a cost approach for personal property. Under the sales comparison approach, sales and asking prices of reasonably comparable properties are considered to develop a range of unit prices within which the current real estate market is operating. Under the cost approach, a current cost to replace the asset new is calculated and then the estimated replacement cost is reduced to reflect the applicable decline in value resulting from physical deterioration, functional obsolescence and economic obsolescence. Appropriate selling costs includes reasonable broker’s commissions, costs to produce title documents, filing fees, legal expenses and the like. We estimate appropriate closing costs as
4%
to
6%
of asset fair value. This range of rates is considered reasonable for our assets held for sale based on historical experience.
60
Goodwill and Other Intangibles, net
Goodwill represents the excess of the aggregate purchase price over the fair value of the net identifiable assets acquired in a business combination. Identified intangible assets represent trade names, customer relationships and non-compete agreements arising from acquisitions that are recorded at fair value as of the date acquired less accumulated amortization, if any. The Company uses various market valuation techniques to determine the fair value of its identified intangible assets.
Goodwill and other intangible assets with indefinite lives are not amortized but are tested for impairment on an annual basis in the fourth quarter of each fiscal year or more frequently if impairment indicators arise. For goodwill, an impairment loss is recognized for any excess of the carrying amount of a reporting unit’s goodwill over the implied fair value of that goodwill. Management first reviews relevant qualitative factors to determine if an indication of impairment exists for a reporting unit. If management determines there is an indication that the carrying amount of reporting unit goodwill might be impaired, a quantitative analysis is performed. Management performed a qualitative analysis noting
no
indications of goodwill impairment in any of its reporting units as of
December 31, 2017
. For indefinite-lived intangible assets, an impairment loss is recognized if the carrying amount of an indefinite-lived intangible asset exceeds the estimated fair value of that intangible asset. Management first reviews relevant qualitative factors to determine if an indication of impairment exists. If management determines there is an indication that the carrying amount of the intangible asset might be impaired, and quantitative analysis is performed. Management performed a qualitative analysis noting no indications of impairment for any of its indefinite-lived intangible assets as of
December 31, 2017
.
Identifiable intangible assets with definite lives, such as customer relationships, non-compete agreements and trade names that the Company expects to use for a limited amount of time, are amortized over their estimated useful lives on a straight-line basis. The useful lives range from
three
to
20
years for trade names and non-compete agreements and
5
to
16
years for customer relationships. Identified intangible assets with definite lives are tested for recoverability whenever events or changes in circumstances indicate that their carrying amount may not be recoverable. Management assessed if events or changes in circumstances indicated that the aggregate carrying amount of its identified intangible assets with definite lives might not be recoverable and determined that there were
no
impairment indicators during the fifty-three weeks ended
December 31, 2017
and fifty-two weeks ended
December 25, 2016
.
Book Overdraft Balances
The majority of the Company’s disbursement bank accounts are zero balance accounts where cash needs are funded as checks are presented for payment by the holder. Checks issued pending clearance that result in overdraft balances for accounting purposes are classified as accounts payable and the change in the related balance is reflected in operating activities on the Consolidated and Combined Statements of Cash Flows.
Litigation and Contingent Liabilities
The Company is subject to lawsuits, investigations and other claims related to employment, environmental, product and other matters. The Company is required to assess the likelihood of any adverse judgments or outcomes, as well as potential ranges of probable losses, to these matters. The Company estimates the amount of reserves required for these contingencies when losses are determined to be probable and after considerable analysis of each individual issue. The Company expenses legal costs related to such loss contingencies as they are incurred. The accrual for environmental remediation liabilities is measured on an undiscounted basis. These reserves may change in the future due to changes in the Company’s assumptions, the effectiveness of strategies, or other factors beyond the Company’s control.
Accrued Self Insurance
Insurance expense for casualty claims and employee-related health care benefits are estimated using historical and current experience and actuarial estimates. Stop-loss coverage is maintained with third-party insurers to limit the Company’s total exposure. Certain categories of claim liabilities are actuarially determined. The assumptions used to arrive at periodic expenses are reviewed regularly by management. However, actual expenses could differ from these estimates and could result in adjustments to be recognized.
Asset Retirement Obligations
The Company monitors certain asset retirement obligations in connection with its operations. These obligations relate to clean-up, removal or replacement activities and related costs for “in-place” exposures only when those exposures are moved or modified, such as during renovations of our facilities. These in-place exposures include asbestos, refrigerants, wastewater, oil, lubricants and other contaminants common in manufacturing environments. Under existing regulations, the Company is not required to remove these exposures and there are no plans to undertake a renovation that would require removal of the asbestos or the remediation of the other in-place exposures at this time. The facilities are expected to be maintained and repaired by activities that
61
will not result in the removal or disruption of these in-place exposures at this time. As a result, there is an indeterminate settlement date for these asset retirement obligations because the range of time over which the Company may incur these liabilities is unknown and cannot be reasonably estimated. Therefore, the Company has not recorded the fair value of any potential liability.
Income Taxes
The Company follows provisions under ASC No. 740-10-30-27 in the Expenses-Income Taxes topic with regard to members of a group that file a consolidated tax return but issue separate financial statements. The Company files its own U.S. federal tax return, but it is included in certain state unitary returns with JBS USA Food Company Holdings (“JBS USA Holdings”). The income tax expense of the Company is computed using the separate return method. The provision for income taxes has been determined using the asset and liability approach of accounting for income taxes. For the unitary states, we have an obligation to make tax payments to JBS USA Holdings for our share of the unitary taxable income, which is included in taxes payable in our Consolidated and Combined Balance Sheets. Under this approach, deferred income taxes reflect the net tax effect of temporary differences between the book and tax bases of recorded assets and liabilities, net operating losses and tax credit carry forwards. The amount of deferred tax on these temporary differences is determined using the tax rates expected to apply to the period when the asset is realized or the liability is settled, as applicable, based on the tax rates and laws in the respective tax jurisdiction enacted as of the balance sheet date.
The Company reviews its deferred tax assets for recoverability and establishes a valuation allowance based on historical taxable income, potential for carry back of tax losses, projected future taxable income, applicable tax strategies, and the expected timing of the reversals of existing temporary differences. A valuation allowance is provided when it is more likely than not that some or all of the deferred tax assets will not be realized. Valuation allowances have been established primarily for net operating loss carry forwards of certain foreign subsidiaries. See “Note 12. Income Taxes” to the Consolidated and Combined Financial Statements.
The Company deems its earnings from its foreign subsidiaries as of
December 31, 2017
to be permanently reinvested. As such, U.S. deferred income taxes have not been provided on these earnings. If such earnings were not considered indefinitely reinvested, certain deferred foreign and U.S. income taxes would be provided.
The Company follows provisions under ASC No. 740-10-25 that provide a recognition threshold and measurement criteria for the financial statement recognition of a tax benefit taken or expected to be taken in a tax return. Tax benefits are recognized only when it is more likely than not, based on the technical merits, that the benefits will be sustained on examination. Tax benefits that meet the more-likely-than-not recognition threshold are measured using a probability weighting of the largest amount of tax benefit that has greater than 50.0% likelihood of being realized upon settlement. Whether the more-likely-than-not recognition threshold is met for a particular tax benefit is a matter of judgment based on the individual facts and circumstances evaluated in light of all available evidence as of the balance sheet date. See “Note 12. Income Taxes” to the Consolidated and Combined Financial Statements.
Pension and Other Postemployment Benefits
Our pension and other postemployment benefit costs and obligations are dependent on the various actuarial assumptions used in calculating such amounts. These assumptions relate to discount rates, long-term return on plan assets and other factors. We base the discount rate assumptions on current investment yields on high-quality corporate long-term bonds. We determine the long-term return on plan assets based on historical portfolio results and management’s expectation of the future economic environment. Actual results that differ from our assumptions are accumulated and, if in excess of the lesser of 10% of the projected benefit obligation or the fair market value of plan assets, amortized over either (i) the estimated average future service period of active plan participants if the plan is active or (ii) the estimated average future life expectancy of all plan participants if the plan is frozen.
Operating Leases
Rent expense for operating leases is recorded on a straight-line basis over the lease term unless the lease contains an escalation clause which is not fixed or determinable. The lease term begins when we have the right to control the use of the leased property, which is typically before rent payments are due under the terms of the lease. If a lease has a fixed or determinable escalation clause, the difference between rent expense and rent paid is recorded as deferred rent and is included in the Consolidated and Combined Balance Sheets. Rent for operating leases that do not have an escalation clause or where escalation is based on an inflation index is expensed over the lease term as it is payable.
Derivative Financial Instruments
62
The Company uses derivative financial instruments (e.g., futures, forwards and options) for the purpose of mitigating exposure to changes in commodity prices and foreign currency exchange rates.
|
•
|
Commodity Price Risk -
The Company utilizes various raw materials, which are all considered commodities, in its operations, including corn, soybean meal, soybean oil, wheat, natural gas, electricity and diesel fuel. The Company considers these raw materials to be generally available from a number of different sources and believes it can obtain them to meet its requirements. These commodities are subject to price fluctuations and related price risk due to factors beyond our control, such as economic and political conditions, supply and demand, weather, governmental regulation and other circumstances. Generally, the Company enters into derivative contracts such as physical forward contracts and exchange-traded futures or option contracts in an attempt to mitigate price risk related to its anticipated consumption of commodity inputs for periods up to 12 months. The Company may enter into longer-term derivatives on particular commodities if deemed appropriate.
|
|
•
|
Foreign Currency Risk -
The Company has foreign operations and, therefore, has exposure to foreign exchange risk when the financial results of those operations are translated to US dollars. The Company will occasionally purchase derivative financial instruments such as foreign currency forward contracts in an attempt to mitigate currency exchange rate exposure related to the net assets of its Mexico operations that are denominated in Mexican pesos. The Company’s Moy Park operation also attempts to mitigate foreign currency exposure on certain euro- and U.S. dollar-denominated transactions through the use of derivative financial instruments.
|
Pilgrim’s recognizes all commodity derivative instruments that qualify for derivative accounting treatment as either assets or liabilities and measures those instruments at fair value unless they qualify for, and we elect, the normal purchases and normal sales scope exception (“NPNS”). The permitted accounting treatments include: cash flow hedge; fair value hedge; and undesignated contracts. Undesignated contract accounting is the default accounting treatment for all derivatives unless they qualify, and we specifically designate them, for one of the other accounting treatments. Derivatives designated for any of the elective accounting treatments must meet specific, restrictive criteria both at the time of designation and on an ongoing basis.
The Company has generally applied the NPNS exception to its forward physical grain purchase contracts. NPNS contracts are accounted for using the accrual method of accounting; therefore, there were
no
amounts recorded in the Consolidated and Combined Financial Statements at December 31, 2017 and December 25, 2016.
Undesignated contracts may include contracts not designated as a hedge or for which the NPNS exception was not elected, contracts that do not qualify for hedge accounting and derivatives that do not or no longer qualify for the NPNS scope exception. The fair value of these derivatives is recognized in the Consolidated and Combined Balance Sheets within
Prepaid expenses and other current assets
or
Accrued expenses and other current liabilities
. Changes in fair value of these derivatives are recognized immediately in the Consolidated and Combined Statements of Income within
Net sales
,
Cost of sales
or
Selling, general and administrative expense
, depending on the risk they are intended to mitigate. While management believes these instruments help mitigate various market risks, they are not designated nor accounted for as hedges as a result of the extensive recordkeeping requirements.
The Company designated a British pound-denominated promissory note payable issued to JBS S.A. in conjunction with the Moy Park acquisition as a hedge of its net investment in Moy Park. The remeasurement of the note is reported as a foreign currency translation adjustment in accumulated other comprehensive loss in the Consolidated and Combined Balance Sheets and will be reclassified into earnings only if the Company divests its investment in Moy Park. The Company paid the promissory note payable in full with proceeds from the sale of senior notes (See “Note 11. Long-Term Debt and Other Borrowing Arrangements” to the Consolidated and Combined Financial Statements). At December 31, 2017, the balance of the remeasurement adjustment in accumulated other comprehensive loss, net of tax, was
$13.5 million
.
Pilgrim’s has designated a portion of its foreign currency derivatives as cash flow hedges and the effective portion of the gain or loss on these derivatives is reported as a component of
Accumulated other comprehensive loss
within the Consolidated and Combined Balance Sheets and reclassified into earnings in the same period or periods during which the hedged transactions affect earnings. The derivatives are designated as hedging the variability in expected future cash flows from foreign currency exchange risk related to sales and purchases denominated in nonfunctional currencies.
Use of Estimates
The preparation of financial statements in conformity with accounting principles generally accepted in the U.S. (“U.S. GAAP”) requires management to make estimates and assumptions that affect the reported amounts of assets and liabilities and disclosure of contingent assets and liabilities at the date of the financial statements and the reported amounts of revenues and expenses during the reporting period. Actual results could differ from those estimates. We make significant estimates in regard to
63
receivables collectability; inventory valuation; realization of deferred tax assets; valuation of long-lived assets; valuation of contingent liabilities, liabilities subject to compromise and self insurance liabilities; valuation of pension and other postretirement benefits obligations; and valuation of acquired businesses.
Recent Accounting Pronouncements
In May 2014, the Financial Accounting Standards Board (“FASB”) issued new accounting guidance new accounting guidance on revenue recognition, which provides for a single five-step model to be applied to all revenue contracts with customers. The new standard also requires additional financial statement disclosures that will enable users to understand the nature, amount, timing and uncertainty of revenue and cash flows relating to customer contracts. Companies have an option to use either a retrospective approach or cumulative effect adjustment approach to implement the standard.
We will adopt this standard as of January 1, 2018, the beginning of our 2018 fiscal year, using the cumulative effect adjustment, often referred to as modified retrospective approach. Under this method, we would not restate the prior financial statements presented, and would record any adjustments in the opening balance sheet for January 2018. The new guidance on revenue recognition requires the use of more estimates and judgments than the present standards. Additional disclosures will include the amount by which each financial statement line item is affected in the current reporting period during 2018, as compared to the prior guidance.
Our implementation of the new revenue guidance is in its final stages of a three phased evaluation process. Our process is outlined below.
Phase 1 - Assess:
|
•
|
A high-level adoption analysis and training
|
|
•
|
Reviewed and analyzed the Company’s revenue streams
|
|
•
|
Identified and reviewed representative customer contracts from revenue streams
|
|
•
|
Identified potential accounting impacts and documented key items to be validated and quantified
|
Phase 2 - Evaluate:
|
•
|
Company has concluded on the majority of Company's position for any accounting treatment differences and is in the process of documenting
|
|
•
|
Quantifying the potential effects this guidance will have on its Consolidated and Combined Financial Statement
|
|
•
|
Evaluating any changes to the Company's accounting policies
|
|
•
|
Expanding disclosures as required by the new standard
|
|
•
|
Identifying the impact the new standard will have on business processes, systems and internal controls to support the recognition and disclosure requirements under the new standard
|
|
•
|
Training the organization, as applicable
|
Phase 3- Implement (in process):
|
•
|
Finalize decisions related to the new standard
|
|
•
|
Record any accounting adjustments identified
|
|
•
|
Evaluate and test updated or newly implemented internal controls surrounding adoption of the new standard
|
|
•
|
Revise the Company’s first quarter 2018 financial statement disclosures to incorporate the qualitative and quantitative impact of adoption and expanded disclosures
|
|
•
|
Share results with Audit Committee
|
The Company is on schedule to complete the implementation phase in March 2018. While the Company has reached conclusions on key accounting assumptions we are in process of finalizing any accounting policy changes, documentation and internal controls for the new revenue standard. The new revenue standard will have a minimal impact on our financial statements beyond additional disclosure requirements. The cumulative effect on equity of initially applying the new standard is expected to be immaterial, with an immaterial impact to our net income on an ongoing basis. Due to the nature of our business, we anticipate minimal changes will be made to our accounting and revenue policies.
In July 2015, the FASB issued new accounting guidance on the subsequent measurement of inventory, which, in an effort to simplify unnecessarily complicated accounting guidance that can result in several potential outcomes, requires an entity to measure inventory at the lower of cost or net realizable value. Net realizable value is the estimated selling prices in the ordinary course of business, less reasonably predictable costs of completion, disposal and transportation. Current accounting guidance requires an entity to measure inventory at the lower of cost or market. Market could be replacement cost, net realizable value, or net realizable value less an approximately normal profit margin. The provisions of the new guidance were effective as of the beginning of our 2017 fiscal year. The initial adoption of this guidance did not have a material impact on our financial statements.
64
In February 2016, the FASB issued new accounting guidance on lease arrangements, which, in an effort to increase transparency and comparability among organizations utilizing leasing, requires an entity that is a lessee to recognize the assets and liabilities arising from leases on the balance sheet. This guidance also requires disclosures about the amount, timing and uncertainty of cash flows arising from leases. In transition, the entity is required to recognize and measure leases at the beginning of the earliest period presented using a modified retrospective approach. The provisions of the new guidance will be effective as of the beginning of our 2019 fiscal year. Early adoption is permitted. We are currently evaluating the impact of the new guidance on our financial statements and have elected to adopt as of the beginning of our 2019 fiscal year.
In March 2016, the FASB issued new accounting guidance on employee share-based payments, which, in an effort to simplify unnecessarily complicated aspects of accounting and reporting for share-based payment transactions, requires an entity to amend accounting and reporting methodology for areas such as the income tax consequences of share-based payments, classification of share-based awards as either equity or liabilities, and classification of share-based payment transactions in the statement of cash flows. The transition approach will vary depending on the area of accounting and reporting methodology to be amended. The Company adopted this standard on December 26, 2016, the beginning of our 2017 fiscal year, and will prospectively present excess tax benefits or deficiencies in the income statement as a component of “Provision for income taxes” rather than in the “Equity” section of the Balance Sheet. As part of the adoption, the Company did not have a cumulative-effect adjustment, as there were no previous unrecognized excess tax benefits that would impact retained earnings. As a result, there was no retrospective adjustment to the prior period statement of cash flows of excess tax benefits as an operating activity rather than a financing activity.
In June 2016, the FASB issued new accounting guidance on the measurement of credit losses on financial instruments, which, in an effort to provide financial statement users with more decision-useful information about the expected credit losses on financial instruments, replaces the current incurred loss impairment methodology with a methodology that reflects expected credit losses and requires consideration of a broader range of reasonable and supportable information to inform credit loss estimates. The amendments affect loans, debt securities, trade receivables, net investments in leases, off-balance sheet credit exposures, reinsurance receivables and any other financial assets not excluded from the scope that have the contractual right to receive cash. The provisions of the new guidance will be effective as of the beginning of our 2020 fiscal year. Early adoption is permitted after our 2018 fiscal year. We are currently evaluating the impact of the new guidance on our financial statements and have not yet selected an adoption date.
In November 2016, the FASB issued new accounting guidance on the classification and presentation of restricted cash in the statement of cash flows in order to eliminate the diversity that currently exists in how companies present these changes. The new guidance requires restricted cash to be included with cash and cash equivalents when explaining the changes in cash in the statement of cash flows. We elected to early adopt this guidance as of December 26, 2016, the beginning of our 2017 fiscal year. An entity should apply the new guidance on a retrospective basis, wherein the statement of cash flow of each individual period presented should be adjusted to reflect the period-specific effects of applying the new guidance. Upon transition, an entity is required to comply with the applicable disclosures for a change in an accounting principle. These disclosures include the nature of and reason for the change in accounting principle, the transition method, a description of the prior-period information that has been retrospectively adjusted and the effect of the change on the financial statement line items. A description of the prior-period information that has been retrospectively adjusted and the effect of the change on the statement of cash flow line items is not disclosed as it is not material.
In March 2017, the FASB issued new accounting guidance on the presentation of net periodic pension cost and net periodic postretirement benefit cost, which, in an effort to improve consistency and transparency, requires the service cost component of defined benefit pension cost and postretirement benefit cost (“net benefit cost”) to be reported in the same line of the income statement as other compensation costs earned by the employee and the other components of net benefit cost to be reported below income from operations. The new guidance will be effective as of the beginning of our 2019 fiscal year with early adoption permitted. We are currently evaluating the impact of the new guidance on our financial statements and have not yet selected an adoption date.
In August 2017, the FASB issued an accounting standard update that simplifies the application of hedge accounting guidance in current GAAP and improves the reporting of hedging relationships to better portray the economic results of an entity’s risk management activities in its financial statements. Among the simplification updates, the standard eliminates the requirement in current GAAP to separately recognize periodic hedge ineffectiveness. Mismatches between the changes in value of the hedged item and hedging instrument may still occur but they will no longer be separately reported. The standard requires the presentation of the earnings effect of the hedging instrument in the same income statement line item in which the earnings effect of the hedged item is reported. The standard is effective for annual and interim reporting periods beginning after December 15, 2018, but early adoption is permitted. We are currently evaluating the impact the adoption of this standard will have on our financial statements.
2. BUSINESS ACQUISITIONS
65
Moy Park
On September 8, 2017, the Company purchased
100%
of the issued and outstanding shares of Moy Park from JBS S.A. for cash of
$301.3 million
and a note payable to the seller in the amount of £
562.5 million
. Moy Park is one of the top-ten food companies in the U.K., Northern Ireland's largest private sector business and one of Europe's leading poultry producers. With
4
fresh processing plants,
10
prepared foods cook plants,
3
feed mills,
7
hatcheries and
1
rendering facility in Northern Ireland, the U.K., France, and The Netherlands, Moy Park processes
6.0 million
birds per seven-day work week, in addition to producing around
456.0 million
pounds of prepared foods per year. Its product portfolio comprises fresh and added-value poultry, ready-to-eat meals, breaded and multi-protein frozen foods, vegetarian foods and desserts, supplied to major food retailers and restaurant chains in Europe (including the U.K.). Moy Park has approximately
10,200
employees as of December 31, 2017. The Moy Park operations comprise our U.K. and Europe segment.
The acquisition was treated as a common-control transaction under U.S. GAAP. A common-control transaction is a transfer of net assets or an exchange of equity interests between entities under the control of the same parent. The accounting and reporting for a transaction between entities under common control is not to be considered a business combination under U.S. GAAP. Since there is no change in control over the net assets from the parent’s perspective, there is no change in basis in the assets or liabilities. Therefore, Pilgrim's, as the receiving entity, recognized the assets and liabilities received at their historical carrying amounts, as reflected in the parent’s financial statements. The difference between the proceeds transferred and the carrying amounts of the net assets on the date of the acquisition is recognized in equity.
Transaction costs incurred in conjunction with the acquisition were approximately
$19.6 million
. These costs were expensed as incurred. Beginning September 8, 2017, the results of operations and financial position of Moy Park have been included in the consolidated results of operations and financial position of the Company. The results of operations and financial position of Moy Park have been combined with the results of operations and financial position of Pilgrim's from September 30, 2015, the common control date, through September 7, 2017. The following table summarizes the results of operations of Moy Park since the September 30, 2015 common-control date:
|
Net Sales
|
Net Income
|
||||||
|
(In thousands)
|
|||||||
|
September 8, 2017 through December 31, 2017
|
$
|
722,387
|
|
$
|
34,039
|
|
|
|
December 26, 2016 through September 7, 2017
|
1,273,932
|
|
23,486
|
|
|||
|
2016
|
1,947,441
|
|
40,388
|
|
|||
|
2015
|
572,568
|
|
17,010
|
|
|||
GNP
On January 6, 2017, the Company acquired
100%
of the membership interests of JFC LLC and its subsidiaries (together, “GNP”) from Maschhoff Family Foods, LLC for
$350.0 million
, subject to customary working capital adjustments. The purchase was funded through cash on hand and borrowings under the U.S. Credit Agreement. GNP is a vertically integrated poultry business based in St. Cloud, Minnesota. The acquired business has a production capacity of
2.1 million
birds per five-day work week in its
two
plants and currently employs approximately
1,500
people. This acquisition further strengthens the Company’s strategic position in the U.S. chicken market. The GNP operations are included in our U.S. segment.
The following table summarizes the consideration paid for GNP (in thousands)
|
Negotiated sales price
|
$
|
350,000
|
|
|
Working capital adjustment
|
7,252
|
|
|
|
Preliminary purchase price
|
$
|
357,252
|
|
Transaction costs incurred in conjunction with the purchase were approximately
$0.6 million
. These costs were expensed as incurred. The results of operations of the acquired business since January 6, 2017 are included in the Company’s Consolidated and Combined Statements of Income. Net sales and net income generated by the acquired business during the year ended December 31, 2017 totaled
$433.9 million
and
$30.4 million
, respectively.
The assets acquired and liabilities assumed in the GNP acquisition were measured at their fair values at January 6, 2017 as set forth below. The excess of the purchase price over the fair values of the net tangible assets and identifiable intangible assets was recorded as goodwill. The factors contributing to the recognition of the amount of goodwill are based on several strategic and synergistic benefits that are expected to be realized from the acquisition as well the assembled workforce. These benefits include
66
(i) complementary product offerings, (ii) an enhanced footprint in the U.S., (iii) shared knowledge of innovative technologies such as gas stunning, aeroscalding and automated deboning, (iv) enhanced position in the fast-growing antibiotic-free and certified organic chicken segments due to the addition of GNP’s portfolio of Just BARE® Certified Organic and Natural/American Humane CertifiedTM/No-Antibiotics-Ever product lines and (v) attractive cost-reduction synergy opportunities and value creation. The Company has tax basis in the goodwill, and therefore, the goodwill is deductible for tax purposes. The fair values recorded were determined based upon upon various external and internal valuations..
The fair values recorded for the assets acquired and liabilities assumed for GNP are as follows (in thousands):
|
Cash and cash equivalents
|
$
|
10
|
|
|
Trade accounts and other receivables
|
18,453
|
|
|
|
Inventories
|
56,459
|
|
|
|
Prepaid expenses and other current assets
|
3,414
|
|
|
|
Property, plant and equipment
|
144,138
|
|
|
|
Identifiable intangible assets
|
131,120
|
|
|
|
Other long-lived assets
|
829
|
|
|
|
Total assets acquired
|
354,423
|
|
|
|
Accounts payable
|
23,848
|
|
|
|
Other current liabilities
|
11,866
|
|
|
|
Other long-term liabilities
|
3,393
|
|
|
|
Total liabilities assumed
|
39,107
|
|
|
|
Total identifiable net assets
|
315,316
|
|
|
|
Goodwill
|
41,936
|
|
|
|
Total net assets
|
$
|
357,252
|
|
The Company recognized certain identifiable intangible assets as of January 6, 2017 due to this acquisition. The following table presents the fair values and useful lives, where applicable, of these assets:
|
Fair Value
|
Useful Life
|
||||
|
(In thousands)
|
(In years)
|
||||
|
Customer relationships
|
$
|
92,900
|
|
13.0
|
|
|
Trade names
|
38,200
|
|
20.0
|
||
|
Non-compete agreement
|
20
|
|
3.0
|
||
|
Total fair value
|
$
|
131,120
|
|
||
|
Weighted average useful life
|
15.2
|
||||
The Company performed a valuation of the assets and liabilities of GNP as of January 6, 2017. Significant assumptions used in the valuation and the bases for their determination are summarized as follows:
|
•
|
Property, plant and equipment, net
. Property, plant and equipment at fair value gave consideration to the highest and best use of the assets. The valuation of the Company's real property improvements and the majority of its personal property was based on the cost approach. The valuation of the Company's land, as if vacant, and certain personal property assets was based on the market or sales comparison approach.
|
|
•
|
Trade names
. The Company valued two trade names using the income approach, specifically the relief from royalty method. Under this method, the asset value of each trade name was determined by estimating the hypothetical royalties that would have to be paid if it was not owned. Royalty rates were selected based on consideration of several factors, including (i) prior transactions involving GNP trade names, (ii) incomes derived from license agreements on comparable trade names within the food industry and (iii) the relative profitability and perceived contribution of each trade name. The royalty rate used in the determination of the fair values of the two trade names was
2.0%
of expected net sales related to the respective trade names. In estimating the fair value of the trade names, net sales related to the respective trade names were estimated to grow at a rate of
2.5%
. Income taxes were estimated at
39.3%
of pre-tax income, a tax amortization benefit factor was estimated at
1.2098
and the hypothetical savings generated by avoiding royalty costs were discounted using a rate of
13.8%
.
|
67
|
•
|
Customer relationships
. The Company valued GNP customer relationships using the income approach, specifically the multi-period excess earnings model. Under this model, the fair value of the customer relationships asset was determined by estimating the net cash inflows from the relationships discounted to present value. In estimating the fair value of the customer relationships, net sales related to existing GNP customers were estimated to grow at a rate of
2.5%
annually, but we also anticipate losing existing GNP customers at an attrition rate of
4.0%
. Income taxes were estimated at
39.3%
of pre-tax income, a tax amortization benefit factor was estimated at
1.2098
and net cash flows attributable to our existing customers were discounted using a rate of
13.8%
.
|
See “Note 8. Goodwill and Identified Intangible Assets” for additional information regarding the goodwill and intangible assets recognized by the Company in the GNP acquisition.
Tyson Mexico
On June 29, 2015, the Company acquired, indirectly through certain of its Mexican subsidiaries,
100%
of the equity of Provemex Holdings, LLC and its subsidiaries (together, “Tyson Mexico”) from Tyson Foods, Inc. and certain of its subsidiaries for cash. Tyson Mexico is a vertically integrated poultry business based in Gómez Palacio, Durango, Mexico. The acquired business has a production capacity of
2.9 million
birds per five-day work week in its
three
plants and currently employs more than
4,400
people in its plants, offices and
five
distribution centers. This acquisition further strengthened the Company’s strategic position in the Mexico chicken market.
The following table summarizes the consideration paid for Tyson Mexico (in thousands):
|
Negotiated sales price
|
$
|
400,000
|
|
|
Working capital adjustment
|
(20,933
|
)
|
|
|
Final purchase price
|
$
|
379,067
|
|
The results of operations of the acquired business since June 29, 2015 are included in the Company’s Consolidated and Combined Statements of Income. Net sales generated by the acquired business during
2017
and
2016
totaled
$141.4 million
and
$250.6 million
, respectively. The significant decrease in net sales during
2017
as compared to
2016
primarily resulted from a shift in sales activity from the acquired business to the Company’s legacy business operating in Mexico. The acquired business generated net income of
$6.3 million
during
2017
and incurred a net loss of
$13.7 million
during
2016
.
The assets acquired and liabilities assumed in the Tyson Mexico acquisition were measured at their fair values at June 29, 2015 as set forth below. The excess of the purchase price over the fair values of the net tangible assets and identifiable intangible assets was recorded as goodwill. The factors contributing to the recognition of the amount of goodwill are based on several strategic and synergistic benefits that are expected to be realized from the acquisition as well the assembled workforce. These benefits include complementary product offerings, an enhanced footprint in Mexico and attractive synergy opportunities and value creation. The Company does not have tax basis in the goodwill, and therefore, the goodwill is not deductible for tax purposes. The fair values recorded were determined based upon various external and internal valuations.
The fair values recorded for the assets acquired and liabilities assumed for Tyson Mexico are as follows (in thousands):
68
|
Cash and cash equivalents
|
$
|
5,535
|
|
|
Trade accounts and other receivables
|
24,173
|
|
|
|
Inventories
|
68,130
|
|
|
|
Prepaid expenses and other current assets
|
7,661
|
|
|
|
Property, plant and equipment
|
209,139
|
|
|
|
Identifiable intangible assets
|
26,411
|
|
|
|
Other long-lived assets
|
199
|
|
|
|
Total assets acquired
|
341,248
|
|
|
|
Accounts payable
|
21,550
|
|
|
|
Other current liabilities
|
8,707
|
|
|
|
Long-term deferred tax liabilities
|
52,376
|
|
|
|
Other long-term liabilities
|
5,155
|
|
|
|
Total liabilities assumed
|
87,788
|
|
|
|
Total identifiable net assets
|
253,460
|
|
|
|
Goodwill
|
125,607
|
|
|
|
Total net assets
|
$
|
379,067
|
|
The Company performed a valuation of the assets and liabilities of Tyson Mexico at June 29, 2015. Significant assumptions used in the valuation and the bases for their determination are summarized as follows:
|
•
|
Property, plant and equipment, net
. Property, plant and equipment at fair value gave consideration to the highest and best use of the assets. The valuation of the Company’s real property improvements and the majority of its personal property was based on the cost approach. The valuation of the Company’s land, as if vacant, and certain personal property assets was based on the market or sales comparison approach.
|
|
•
|
Indefinite-lived trade names
. The Company valued
two
indefinite-lived trade names using the income approach, specifically the relief from royalty method. Under this method, the asset value of each trade name was determined by estimating the hypothetical royalties that would have to be paid if it was not owned. Royalty rates were selected based on consideration of several factors, including (i) prior transactions involving Tyson Mexico trade names, (ii) incomes derived from license agreements on comparable trade names within the food and non-alcoholic beverages industry and (iii) the relative profitability and perceived contribution of each trade name. Royalty rates used in the determination of the fair values of the two trade names ranged from
4.0%
to
5.0%
of expected net sales related to the respective trade names and trade name maintenance costs were estimated as
1.4%
of the royalty saved. The Company anticipates using both trade names for an indefinite period as demonstrated by the sustained use of each subject trade name. In estimating the fair value of the trade names, net sales related to the respective trade names were estimated to grow at a rate of
3.5%
to
4.0%
annually with a terminal year growth rate of
3.8%
. Income taxes were estimated at
30.0%
of pre-tax income, a tax amortization benefit was estimated considering a rate of
15.0%
and the hypothetical savings generated by avoiding royalty costs were discounted using a rate of
12.0%
. The two trade names were valued at
$9.7 million
under this approach.
|
|
•
|
Customer relationships
. The Company valued Tyson Mexico’s customer relationships using the income approach, specifically the multi-period excess earnings model. Under this model, the fair value of the customer relationships asset is determined by estimating the net cash inflows from the relationships discounted to present value. In estimating the fair value of the customer relationships, net sales related to our existing customers were estimated to grow at a rate of
4.0%
annually, but we also anticipate losing existing customers at an attrition rate of
7.9%
. Income taxes were estimated at
30.0%
of pre-tax income, a tax amortization benefit was estimated considering a rate of
23.4%
and net cash flows attributable to our existing customers were discounted using a rate of
13.5%
. Customer relationships were valued at
$16.7 million
under this approach.
|
The Company recognized the following change in goodwill related to this acquisition during 2016 (in thousands):
|
Goodwill, beginning of period
|
$
|
156,565
|
|
|
Additional fair value attributed to acquired property, plant and equipment
|
(51,387
|
)
|
|
|
Deferred tax impact related to additional fair value attributed to acquired
property, plant and equipment
|
15,416
|
|
|
|
Deferred tax impact related to customer relationship intangibles
|
5,013
|
|
|
|
Goodwill, end of period
|
$
|
125,607
|
|
69
Unaudited Pro Forma Financial Information
The following unaudited pro forma information presents the combined financial results for the Company, Moy Park, GNP and Tyson Mexico as if all the acquisitions had been completed at the beginning of
2015
.
|
2017
|
2016
|
2015
|
|||||||||
|
(In thousands, except per share amounts)
|
|||||||||||
|
Net sales
|
$
|
10,773,662
|
|
$
|
10,311,325
|
|
$
|
11,157,328
|
|
||
|
Net income attributable to Pilgrim's Pride Corporation
|
664,776
|
|
401,630
|
|
631,800
|
|
|||||
|
Net income attributable to Pilgrim's Pride Corporation
per common share - diluted |
2.67
|
|
1.58
|
|
2.44
|
|
|||||
The above unaudited pro forma financial information is presented for informational purposes only and does not purport to represent what the Company’s results of operations would have been had it completed the acquisitions on the date assumed, nor is it necessarily indicative of the results that may be expected in future periods. Pro forma adjustments exclude cost savings from any synergies resulting from the acquisitions.
3. FAIR VALUE MEASUREMENTS
Fair value is an exit price, representing the amount that would be received to sell an asset or paid to transfer a liability in an orderly transaction between market participants. Assets and liabilities measured at fair value must be categorized into one of three different levels depending on the assumptions (i.e., inputs) used in the valuation:
|
Level 1
|
Unadjusted quoted prices in active markets for identical assets or liabilities;
|
|
|
Level 2
|
|
Quoted prices in active markets for similar assets and liabilities and inputs that are observable for the asset or liability; or
|
|
Level 3
|
Unobservable inputs, such as discounted cash flow models or valuations.
|
|
The determination of where assets and liabilities fall within this hierarchy is based upon the lowest level of input that is significant to the fair value measurement in its entirety.
As of
December 31, 2017
and
December 25, 2016
, the Company held derivative assets and liabilities that were required to be measured at fair value on a recurring basis. Derivative assets and liabilities consist of long and short positions on exchange-traded commodity futures instruments and foreign currency forward contracts to manage translation and remeasurement risk.
The following items were measured at fair value on a recurring basis:
|
December 31, 2017
|
||||||||||||||||
|
Level 1
|
Level 2
|
Level 3
|
Total
|
|||||||||||||
|
|
(In thousands)
|
|||||||||||||||
|
Fair value assets:
|
||||||||||||||||
|
Commodity futures instruments
|
$
|
301
|
|
$
|
—
|
|
$
|
—
|
|
$
|
301
|
|
||||
|
Commodity options instruments
|
421
|
|
—
|
|
—
|
|
421
|
|
||||||||
|
Foreign currency instruments
|
45
|
|
—
|
|
—
|
|
45
|
|
||||||||
|
Fair value liabilities:
|
||||||||||||||||
|
Commodity futures instruments
|
(296
|
)
|
—
|
|
—
|
|
(296
|
)
|
||||||||
|
Commodity options instruments
|
(3,551
|
)
|
—
|
|
—
|
|
(3,551
|
)
|
||||||||
|
Foreign currency instruments
|
(211
|
)
|
—
|
|
—
|
|
(211
|
)
|
||||||||
70
NOTES TO CONSOLIDATED AND COMBINED FINANCIAL STATEMENTS
|
December 25, 2016
|
||||||||||||||||
|
Level 1
|
Level 2
|
Level 3
|
Total
|
|||||||||||||
|
|
(In thousands)
|
|||||||||||||||
|
Fair value assets:
|
||||||||||||||||
|
Commodity futures instruments
|
$
|
5,341
|
|
$
|
—
|
|
$
|
—
|
|
$
|
5,341
|
|
||||
|
Commodity options instruments
|
98
|
|
—
|
|
—
|
|
98
|
|
||||||||
|
Foreign currency instruments
|
516
|
|
—
|
|
—
|
|
516
|
|
||||||||
|
Fair value liabilities:
|
||||||||||||||||
|
Commodity futures instruments
|
(4,063
|
)
|
—
|
|
—
|
|
(4,063
|
)
|
||||||||
|
Commodity option instruments
|
(2,764
|
)
|
—
|
|
—
|
|
(2,764
|
)
|
||||||||
|
Foreign currency instruments
|
(153
|
)
|
—
|
|
—
|
|
(153
|
)
|
||||||||
See “Note 7. Derivative Financial Instruments” for additional information.
The valuation of financial assets and liabilities classified in Level 1 is determined using a market approach, taking into account current interest rates, creditworthiness, and liquidity risks in relation to current market conditions, and is based upon unadjusted quoted prices for identical assets in active markets. The valuation of financial assets and liabilities in Level 2 is determined using a market approach based upon quoted prices for similar assets and liabilities in active markets or other inputs that are observable for substantially the full term of the financial instrument. The valuation of financial assets in Level 3 is determined using an income approach based on unobservable inputs such as discounted cash flow models or valuations. For each class of assets and liabilities not measured at fair value in the Consolidated and Combined Balance Sheet but for which fair value is disclosed, the Company is not required to provide the quantitative disclosure about significant unobservable inputs used in fair value measurements categorized within Level 3 of the fair value hierarchy.
In addition to the fair value disclosure requirements related to financial instruments carried at fair value, accounting standards require interim disclosures regarding the fair value of all of the Company’s financial instruments. The methods and significant assumptions used to estimate the fair value of financial instruments and any changes in methods or significant assumptions from prior periods are also required to be disclosed.
The carrying amounts and estimated fair values of our fixed-rate debt obligation recorded in the Consolidated and Combined Balance Sheets consisted of the following:
|
|
December 31, 2017
|
December 25, 2016
|
||||||||||||||
|
|
Carrying
Amount |
Fair
Value |
Carrying
Amount |
Fair
Value |
||||||||||||
|
|
|
(In thousands)
|
|
|||||||||||||
|
Fixed-rate senior notes payable at 5.75%, at Level 1 inputs
|
$
|
(750,000
|
)
|
$
|
(774,375
|
)
|
$
|
(500,000
|
)
|
$
|
(503,395
|
)
|
||||
|
Fixed-rate senior notes payable at 5.875%, at Level 1 inputs
|
(604,820
|
)
|
(619,080
|
)
|
—
|
|
—
|
|
||||||||
|
Fixed-rate senior notes payable at 6.25%, at Level 1 inputs
|
(403,444
|
)
|
(418,787
|
)
|
(369,736
|
)
|
(389,709
|
)
|
||||||||
|
Chattel Mortgages, at Level 3 inputs
|
(873
|
)
|
(855
|
)
|
(1,432
|
)
|
(1,379
|
)
|
||||||||
See “Note 11. Long-Term Debt and Other Borrowing Arrangements” for additional information.
The carrying amounts of our cash and cash equivalents, derivative trading accounts' margin cash, restricted cash and cash equivalents, accounts receivable, accounts payable and certain other liabilities approximate their fair values due to their relatively short maturities. Derivative assets were recorded at fair value based on quoted market prices and are included in the line item
Prepaid expenses and other current assets
on the Consolidated and Combined Balance Sheet. Derivative liabilities were recorded at fair value based on quoted market prices and are included in the line item
Accrued expenses and other current liabilities
on the Consolidated and Combined Balance Sheet. The fair values of the Company’s Level 1 fixed-rate debt obligation was based on the quoted market price at
December 31, 2017
or
December 25, 2016
, as applicable. The fair values of the Company’s Level 3 fixed-rate debt obligation was based on discounted cash flows at
December 31, 2017
or
December 25, 2016
, as applicable.
In addition to assets and liabilities that are recorded at fair value on a recurring basis, the Company records certain assets and liabilities at fair value on a nonrecurring basis. Generally, assets are recorded at fair value on a nonrecurring basis as a result of impairment charges when required by U.S. GAAP. There were no significant fair value measurement losses recognized for such assets and liabilities in the periods reported.
71
4. TRADE ACCOUNTS AND OTHER RECEIVABLES
Trade accounts and other receivables (including accounts receivable from related parties), less allowance for doubtful accounts, consisted of the following:
|
December 31, 2017
|
December 25, 2016
|
||||||
|
|
(In thousands)
|
||||||
|
Trade accounts receivable
|
$
|
548,472
|
|
$
|
435,818
|
|
|
|
Notes receivable - current
|
5,130
|
|
630
|
|
|||
|
Other receivables
|
20,021
|
|
15,766
|
|
|||
|
Receivables, gross
|
573,623
|
|
452,214
|
|
|||
|
Allowance for doubtful accounts
|
(8,145
|
)
|
(6,661
|
)
|
|||
|
Receivables, net
|
$
|
565,478
|
|
$
|
445,553
|
|
|
|
Accounts receivable from related parties
(a)
|
$
|
2,951
|
|
$
|
4,010
|
|
|
|
(a)
|
Additional information regarding accounts receivable from related parties is included in “Note 18. Related Party Transactions.”
|
Changes in the allowance for doubtful accounts were as follows:
|
Total
|
||||
|
(In thousands)
|
||||
|
Balance at December 25, 2016
|
$
|
(6,661
|
)
|
|
|
Provision charged to operating results
|
(2,700
|
)
|
||
|
Account write-offs and recoveries
|
1,538
|
|
||
|
Effect of exchange rate
|
(322
|
)
|
||
|
Balance at December 31, 2017
|
$
|
(8,145
|
)
|
|
5. INVENTORIES
Inventories consisted of the following:
|
December 31, 2017
|
December 25, 2016
|
||||||
|
|
(In thousands)
|
||||||
|
Live chicken and hens
|
$
|
585,525
|
|
$
|
407,475
|
|
|
|
Feed, eggs and other
|
218,611
|
|
257,049
|
|
|||
|
Finished chicken products
|
390,412
|
|
243,824
|
|
|||
|
Total chicken inventories
|
1,194,548
|
|
908,348
|
|
|||
|
Commercial feed, table eggs and other
|
60,522
|
|
67,260
|
|
|||
|
Total inventories
|
$
|
1,255,070
|
|
$
|
975,608
|
|
|
6. INVESTMENTS IN SECURITIES
We recognize investments in available-for-sale securities as cash equivalents, current investments or long-term investments depending upon each security’s length to maturity. Additionally, those securities identified by management at the time of purchase for funding operations in less than one year are classified as current.
The following table summarizes our investments in available-for-sale securities:
72
|
|
December 31, 2017
|
December 25, 2016
|
|||||||||||||
|
|
Cost |
Fair
Value |
Cost |
Fair
Value |
|||||||||||
|
|
(In thousands)
|
||||||||||||||
|
Cash equivalents:
|
|||||||||||||||
|
Fixed income securities
|
$
|
330,456
|
|
$
|
330,456
|
|
$
|
140,480
|
|
$
|
140,480
|
|
|||
|
Other
|
942
|
|
942
|
|
61
|
|
61
|
|
|||||||
Securities classified as cash and cash equivalents mature within 90 days. Securities classified as short-term investments mature between 91 and 365 days. Securities classified as long-term investments mature after 365 days. The specific identification method is used to determine the cost of each security sold and each amount reclassified out of accumulated other comprehensive loss to earnings. Gross realized gains recognized during
2017
and
2016
related to the Company’s available-for-sale securities totaled
$0.4 million
and
$0.9 million
, respectively. Gross realized losses recognized during
2017
and
2016
related to the Company’s available-for-sale securities totaled
$6,500
and
$83,400
, respectively. Proceeds received from the sale or maturity of available-for-sale securities during
2017
and
2016
are disclosed in the Consolidated and Combined Statements of Cash Flows. Net unrealized holding gains and losses on the Company’s available-for-sale securities recognized during
2017
and
2016
that have been included in accumulated other comprehensive loss and the net amount of gains and losses reclassified out of accumulated other comprehensive loss to earnings during
2017
and
2016
are disclosed in “Note 14. Stockholders’ Equity.”
7. DERIVATIVE FINANCIAL INSTRUMENTS
The Company utilizes various raw materials in its operations, including corn, soybean meal, soybean oil, sorghum, natural gas, electricity and diesel fuel, which are all considered commodities. The Company considers these raw materials generally available from a number of different sources and believes it can obtain them to meet its requirements. These commodities are subject to price fluctuations and related price risk due to factors beyond our control, such as economic and political conditions, supply and demand, weather, governmental regulation and other circumstances. Generally, the Company purchases derivative financial instruments, specifically exchange-traded futures and options, in an attempt to mitigate price risk related to its anticipated consumption of commodity inputs for approximately the next 12 months. The Company may purchase longer-term derivative financial instruments on particular commodities if deemed appropriate.
The Company has operations in Mexico and Europe (including the U.K.) and, therefore, has exposure to translational foreign exchange risk when the financial results of those operations are remeasured in U.S. dollars. The Company has purchased foreign currency forward contracts to manage this translational foreign exchange risk.
The fair value of derivative assets is included in the line item
Prepaid expenses and other current assets
on the Consolidated and Combined Balance Sheets while the fair value of derivative liabilities is included in the line item
Accrued expenses and other current liabilities
on the same statements. Our counterparties require that we post cash collateral for changes in the net fair value of the derivative contracts.
We have not designated certain derivative financial instruments that we have purchased to mitigate commodity purchase or foreign currency transaction exposures on our Mexico operations as cash flow hedges. Items designated as cash flow hedges are disclosed and described further below. Therefore, we recognized changes in the fair value of these derivative financial instruments immediately in earnings. Gains or losses related to these derivative financial instruments are included in the line item
Cost of sales
in the Consolidated and Combined Statements of Income.
We have designated certain derivative financial instruments related to our U.K. and Europe segment that we have purchased to mitigate foreign currency transaction exposures as cash flow hedges. Before the settlement date of the financial derivative instruments, we recognize changes in the fair value of the effective portion of the cash flow hedge into accumulated other comprehensive income (“AOCI”) while we recognize changes in the fair value of the ineffective portion immediately in earnings. When the derivative financial instruments associated with the effective portion are settled, the amount in AOCI is then reclassified to earnings. Gains or losses related to these derivative financial instruments are included in the line item
Cost of sales
in the Consolidated and Combined Statements of Income.
The Company recognized
$6.7 million
in net gains related to changes in the fair value of its derivative financial instruments during
2017
. The Company recognized
$4.3 million
in net losses and
$21.6 million
in net gains related to changes in the fair value of its derivative financial instruments during
2016
and
2015
, respectively.
Information regarding the Company’s outstanding derivative instruments and cash collateral posted with (owed to) brokers is included in the following table:
73
NOTES TO CONSOLIDATED AND COMBINED FINANCIAL STATEMENTS
|
December 31, 2017
|
December 25, 2016
|
||||||
|
(Fair values in thousands)
|
|||||||
|
Fair values:
|
|||||||
|
Commodity derivative assets
|
$
|
722
|
|
$
|
5,439
|
|
|
|
Commodity derivative liabilities
|
(3,847
|
)
|
(6,827
|
)
|
|||
|
Foreign currency derivative assets
|
45
|
|
516
|
|
|||
|
Foreign currency derivative liabilities
|
(211
|
)
|
(153
|
)
|
|||
|
Cash collateral posted with brokers
|
8,021
|
|
4,979
|
|
|||
|
Derivatives Coverage
(a)
:
|
|||||||
|
Corn
|
3.1
|
%
|
2.3
|
%
|
|||
|
Soybean meal
|
1.7
|
%
|
0.3
|
%
|
|||
|
Period through which stated percent of needs are covered:
|
|||||||
|
Corn
|
March 2019
|
|
September 2018
|
|
|||
|
Soybean meal
|
December 2018
|
|
July 2017
|
|
|||
|
(a)
|
Derivatives coverage is the percent of anticipated corn and soybean meal needs covered by outstanding derivative instruments through a specified date.
|
The following tables present the components of the gain or loss on derivatives that qualify as cash flow hedges:
|
Gain (Loss) Recognized in Other Comprehensive Income on Derivative (Effective Portion)
|
||||||||||||
|
December 31, 2017
|
December 25, 2016
|
December 27, 2015
|
||||||||||
|
(In thousands)
|
||||||||||||
|
Foreign currency derivatives gain (loss)
|
$
|
(60
|
)
|
$
|
152
|
|
$
|
55
|
|
|||
|
Total
|
$
|
(60
|
)
|
$
|
152
|
|
$
|
55
|
|
|||
|
Net Realized Gain (Loss) Recognized in Income on Derivative (Ineffective Portion)
|
||||||||||||
|
December 31, 2017
|
December 25, 2016
|
December 27, 2015
|
||||||||||
|
(In thousands)
|
||||||||||||
|
Foreign currency derivatives
|
$
|
—
|
|
$
|
—
|
|
$
|
—
|
|
|||
|
Total
|
$
|
—
|
|
$
|
—
|
|
$
|
—
|
|
|||
|
Gain (Loss) Reclassified from AOCI into Income (Effective Portion)
|
||||||||||||
|
December 31, 2017
|
December 25, 2016
|
December 27, 2015
|
||||||||||
|
(In thousands)
|
||||||||||||
|
Foreign currency derivatives gain (loss)
|
$
|
639
|
|
$
|
(310
|
)
|
$
|
5
|
|
|||
|
Total
|
$
|
639
|
|
$
|
(310
|
)
|
$
|
5
|
|
|||
At December 31, 2017, the before-tax deferred net gains on derivatives recorded in AOCI that are expected to be reclassified to the Consolidated and Combined Statements of Income during the next twelve months are
$0.5 million
. This expectation is based on the anticipated settlements on the hedged investments in foreign currencies that will occur over the next twelve months, at which time the Company will recognize the deferred gains (losses) to earnings.
The Company reported a
$16.7 million
adjustment resulting from the translation of a British pound-denominated note payable owed to JBS S.A. as a component of
Accumulated other comprehensive loss
in the
Consolidated and Combined
Balance Sheet as of December 31, 2017. The Company designated this note payable as a hedge of its net investment in Moy Park.
74
8. GOODWILL AND IDENTIFIED INTANGIBLE ASSETS
The activity in goodwill by segment for the years ended
December 31, 2017
and
December 25, 2016
were as follows:
|
December 25, 2016
|
Additions
|
Currency Translation
|
December 31, 2017
|
|||||||||||||
|
(In thousands)
|
||||||||||||||||
|
United States
|
$
|
—
|
|
$
|
41,936
|
|
$
|
—
|
|
$
|
41,936
|
|
||||
|
U.K. and Europe
|
761,614
|
|
—
|
|
72,732
|
|
834,346
|
|
||||||||
|
Mexico
|
125,607
|
|
—
|
|
—
|
|
125,607
|
|
||||||||
|
Total
|
$
|
887,221
|
|
$
|
41,936
|
|
$
|
72,732
|
|
$
|
1,001,889
|
|
||||
|
December 27, 2015
|
Additions
|
Currency Translation
|
December 25, 2016
|
|||||||||||||
|
(In thousands)
|
||||||||||||||||
|
United States
|
$
|
—
|
|
$
|
—
|
|
$
|
—
|
|
$
|
—
|
|
||||
|
U.K. and Europe
|
915,641
|
|
—
|
|
(154,027
|
)
|
761,614
|
|
||||||||
|
Mexico
|
156,565
|
|
(30,958
|
)
|
—
|
|
125,607
|
|
||||||||
|
Total
|
$
|
1,072,206
|
|
$
|
(30,958
|
)
|
$
|
(154,027
|
)
|
$
|
887,221
|
|
||||
Identified intangible assets consisted of the following:
|
December 25, 2016
|
Additions
|
Amortization
|
Currency Translation
|
Disposals
|
December 31, 2017
|
|||||||||||||||||||
|
(In thousands)
|
||||||||||||||||||||||||
|
Carrying amount:
|
||||||||||||||||||||||||
|
Trade names
|
$
|
41,369
|
|
$
|
38,200
|
|
$
|
—
|
|
$
|
117
|
|
$
|
—
|
|
$
|
79,686
|
|
||||||
|
Customer relationships
|
151,147
|
|
92,900
|
|
—
|
|
7,905
|
|
—
|
|
251,952
|
|
||||||||||||
|
Non-compete agreements
|
300
|
|
20
|
|
—
|
|
—
|
|
—
|
|
320
|
|
||||||||||||
|
Trade names not subject to
amortization
|
369,258
|
|
—
|
|
—
|
|
34,336
|
|
—
|
|
403,594
|
|
||||||||||||
|
Accumulated amortization:
|
—
|
|
|
|||||||||||||||||||||
|
Trade names
|
(37,128
|
)
|
—
|
|
(3,808
|
)
|
48
|
|
—
|
|
(40,888
|
)
|
||||||||||||
|
Customer relationships
|
(53,055
|
)
|
—
|
|
(22,571
|
)
|
(1,568
|
)
|
—
|
|
(77,194
|
)
|
||||||||||||
|
Non-compete agreements
|
(300
|
)
|
—
|
|
(7
|
)
|
—
|
|
—
|
|
(307
|
)
|
||||||||||||
|
Total
|
$
|
471,591
|
|
$
|
131,120
|
|
$
|
(26,386
|
)
|
$
|
40,838
|
|
$
|
—
|
|
$
|
617,163
|
|
||||||
|
December 27, 2015
|
Additions
|
Amortization
|
Currency Translation
|
Disposals
|
December 25, 2016
|
|||||||||||||||||||
|
(In thousands)
|
||||||||||||||||||||||||
|
Carrying amount:
|
||||||||||||||||||||||||
|
Trade names
|
$
|
41,617
|
|
$
|
—
|
|
$
|
—
|
|
$
|
(248
|
)
|
$
|
—
|
|
$
|
41,369
|
|
||||||
|
Customer relationships
|
168,021
|
|
—
|
|
—
|
|
(16,874
|
)
|
—
|
|
151,147
|
|
||||||||||||
|
Non-compete agreements
|
300
|
|
—
|
|
—
|
|
—
|
|
—
|
|
300
|
|
||||||||||||
|
Trade names not subject to
amortization
|
441,974
|
|
—
|
|
—
|
|
(72,716
|
)
|
—
|
|
369,258
|
|
||||||||||||
|
Accumulated amortization:
|
—
|
|
||||||||||||||||||||||
|
Trade names
|
(35,216
|
)
|
—
|
|
(1,905
|
)
|
(7
|
)
|
—
|
|
(37,128
|
)
|
||||||||||||
|
Customer relationships
|
(37,583
|
)
|
—
|
|
(16,834
|
)
|
1,362
|
|
—
|
|
(53,055
|
)
|
||||||||||||
|
Non-compete agreements
|
(300
|
)
|
—
|
|
—
|
|
—
|
|
(300
|
)
|
||||||||||||||
|
Total
|
$
|
578,813
|
|
$
|
—
|
|
$
|
(18,739
|
)
|
$
|
(88,483
|
)
|
$
|
—
|
|
$
|
471,591
|
|
||||||
Intangible assets are amortized over the estimated useful lives of the assets as follows:
75
|
Customer relationships
|
5-16 years
|
|
|
Trade names
|
3-20 years
|
|
|
Non-compete agreements
|
3 years
|
|
The Company recognized amortization expense related to identified intangible assets of
$26.4 million
in 2017,
$18.7 million
in 2016 and
$8.5 million
in 2015.
The Company expects to recognize amortization expense associated with identified intangible assets of
$24.9 million
in 2018,
$23.5 million
in 2019,
$19.7 million
in 2020,
$19.7 million
in 2021 and
$19.7 million
in 2022.
At
December 31, 2017
, the Company assessed qualitative factors to determine if it was necessary to perform either the two-step quantitative impairment test related to the carrying amount of its goodwill or quantitative impairment tests related to the carrying amounts of its identified intangible assets not subject to amortization. Based on these assessments, the Company determined that it was not necessary to perform either the two-step quantitative impairment test related to the carrying amount of its goodwill nor the quantitative impairment tests related to the carrying amounts its identified intangible assets not subject to amortization at that date.
At
December 31, 2017
, the Company assessed if events or changes in circumstances indicated that the aggregate carrying amount of its identified intangible assets subject to amortization might not be recoverable. There were no indicators present that required the Company to test the recoverability of the aggregate carrying amount of its identified intangible assets subject to amortization at that date.
9. PROPERTY, PLANT AND EQUIPMENT
Property, plant and equipment (“PP&E”), net consisted of the following:
|
December 31, 2017
|
December 25, 2016
|
||||||
|
|
(In thousands)
|
||||||
|
Land
|
$
|
205,087
|
|
$
|
150,127
|
|
|
|
Buildings
|
1,681,610
|
|
1,487,353
|
|
|||
|
Machinery and equipment
|
2,533,522
|
|
2,268,526
|
|
|||
|
Autos and trucks
|
58,159
|
|
58,454
|
|
|||
|
Construction-in-progress
|
187,094
|
|
255,086
|
|
|||
|
Property, plant and equipment, gross
|
4,665,472
|
|
4,219,546
|
|
|||
|
Accumulated depreciation
|
(2,570,325
|
)
|
(2,385,561
|
)
|
|||
|
Property, plant and equipment, net
|
$
|
2,095,147
|
|
$
|
1,833,985
|
|
|
The Company recognized depreciation expense of
$245.4 million
,
$210.5 million
and
$161.7 million
during
2017
,
2016
and
2015
, respectively.
During
2017
, the Company spent
$339.9 million
on capital projects and transferred
$411.8 million
of completed projects from construction-in-progress to depreciable assets. During
2016
, the Company spent
$341.0 million
on capital projects and transferred
$269.6 million
of completed projects from construction-in-progress to depreciable assets. Capital expenditures were primarily incurred during
2017
to improve operational efficiencies, reduce costs and tailor processes to meet specific customer needs in order to further solidify competitive advantages for the Company.
During
2017
, the Company sold certain PP&E for
$4.5 million
and recognized a gain of
$0.5 million
. PP&E sold in
2017
included a processing plant in Texas, a feed mill in Arkansas, poultry farms in Alabama and Texas, vacant land in Texas, a processing plant in Ireland, a hatchery in the U.K. and miscellaneous equipment. During
2016
, the Company sold certain PP&E for
$13.4 million
and recognized a gain of
$8.9 million
. PP&E sold in
2016
included a processing plant in Louisiana, poultry farms in Mexico and Texas, vacant land in Alabama and Texas, an office building in Texas and miscellaneous equipment.
Management has committed to the sale of certain properties and related assets, including, but not limited to, a processing complex in Alabama and other miscellaneous assets, which no longer fit into the operating plans of the Company. The Company is actively marketing these properties and related assets for immediate sale and believes a sale of each property can be consummated within the next 12 months. At
December 31, 2017
, the Company reported assets held for sale totaling
$0.7 million
in
Assets held for sale
on its Consolidated and Combined Balance Sheets.
76
NOTES TO CONSOLIDATED AND COMBINED FINANCIAL STATEMENTS
The Company tested the recoverability of its Alabama processing complex held for sale at various effective dates during 2017. The Company determined that the aggregate carrying amount of this asset group at June 25, 2017, was not recoverable over the remaining life of the primary asset in the group and recognized impairment costs of
$3.5 million
within its U.S. segment, which is reported in the line item
Administrative restructuring charges
on its Consolidated and Combined Statements of Income. The Company determined that the aggregate carrying amount at December 31, 2017 of this asset group was recoverable over the remaining life of the primary asset in the group.
The Company tested the recoverability of its Ireland processing facility held for sale at various effective dates during 2017. The Company determined that the aggregate carrying amount of this asset group at September 24, 2017, was not recoverable over the remaining life of the primary asset in the group and recognized impairment costs of
$1.5 million
within its U.K. segment, which is reported in the line item
Administrative restructuring charges
on its Consolidated and Combined Statements of Income. The Ireland processing facility was sold in December 2017.
The Company has closed or idled various processing complexes, processing plants, hatcheries, broiler farms, and feed mills throughout the U.S. segment. Neither the Board of Directors nor JBS has determined if it would be in the best interest of the Company to divest any of these closed or idled assets. Management is therefore, not certain that it can or will divest any of these assets within one year, is not actively marketing these assets and, accordingly, has not classified them as assets held for sale. The Company continues to depreciate these assets. At
December 31, 2017
, the carrying amount of these idled assets was
$48.6 million
based on depreciable value of
$166.7 million
and accumulated depreciation of
$118.1 million
.
The Company has closed or idled various processing complexes, processing plants, hatcheries, and other miscellaneous assets, throughout the U.K. and Europe segment. Neither the Board of Directors nor JBS has determined if it would be in the best interest of the Company to divest any of these closed or idled assets. Management is therefore not certain that it can or will divest any of these assets within one year, is not actively marketing these assets and, accordingly, has not classified them as assets held for sale. The Company continues to depreciate these assets. At
December 31, 2017
, the carrying amount of these idled assets was
$2.9 million
based on depreciable value of
$11.4 million
and accumulated depreciation of
$8.5 million
.
At December 31, 2017, the Company assessed if events or changes in circumstances indicated that the aggregate carrying amount of its property, plant and equipment held for use might not be recoverable. There were no indicators present that required the Company to test the recoverability of the aggregate carrying amount of its property, plant and equipment held for use at that date.
77
NOTES TO CONSOLIDATED AND COMBINED FINANCIAL STATEMENTS
10. CURRENT LIABILITIES
Current liabilities, other than income taxes and current maturities of long-term debt, consisted of the following components:
|
December 31, 2017
|
December 25, 2016
|
||||||
|
|
(In thousands)
|
||||||
|
Accounts payable:
|
|||||||
|
Trade accounts
|
$
|
691,176
|
|
$
|
722,495
|
|
|
|
Book overdrafts
|
56,022
|
|
63,577
|
|
|||
|
Other payables
|
15,246
|
|
4,306
|
|
|||
|
Total accounts payable
|
762,444
|
|
790,378
|
|
|||
|
Accounts payable to related parties
(a)
|
2,889
|
|
4,468
|
|
|||
|
Accrued expenses and other current liabilities:
|
|||||||
|
Compensation and benefits
|
181,678
|
|
160,591
|
|
|||
|
Interest and debt-related fees
|
29,750
|
|
10,907
|
|
|||
|
Insurance and self-insured claims
|
79,911
|
|
82,544
|
|
|||
|
Derivative liabilities:
|
|||||||
|
Commodity futures
|
296
|
|
4,063
|
|
|||
|
Commodity options
|
3,551
|
|
2,764
|
|
|||
|
Foreign currency derivatives
|
211
|
|
153
|
|
|||
|
Other accrued expenses
|
121,944
|
|
85,999
|
|
|||
|
Total accrued expenses and other current liabilities
|
417,341
|
|
347,021
|
|
|||
|
$
|
1,182,674
|
|
$
|
1,141,867
|
|
||
|
(a)
|
Additional information regarding accounts payable to related parties is included in “Note 18. Related Party Transactions.”
|
78
NOTES TO CONSOLIDATED AND COMBINED FINANCIAL STATEMENTS
11. LONG-TERM DEBT AND OTHER BORROWING ARRANGEMENTS
Long-term debt consisted of the following components:
|
Maturity
|
December 31, 2017
|
December 25, 2016
|
|||||||
|
Long-term debt and other long-term borrowing arrangements:
|
|
(In thousands)
|
|||||||
|
Senior notes payable, net of unaccreted premium at 5.75%
|
2025
|
$
|
754,820
|
|
$
|
500,000
|
|
||
|
Senior notes payable at 5.875%
|
2027
|
600,000
|
|
—
|
|
||||
|
Senior notes payable at 6.25%
|
2021
|
403,444
|
|
369,736
|
|
||||
|
U.S. Credit Facility (defined below):
|
|||||||||
|
Term note payable at 2.61%
|
2022
|
780,000
|
|
500,000
|
|
||||
|
Revolving note payable at 2.84%
|
2022
|
73,262
|
|
—
|
|
||||
|
Mexico Credit Facility (defined below) with notes payable at TIIE rate
plus 0.90%
|
2019
|
76,307
|
|
23,304
|
|
||||
|
Moy Park Multicurrency Revolving Facility with notes payable at
LIBOR rate plus 2.5%
|
2019
|
9,590
|
|
11,985
|
|
||||
|
Moy Park Receivables Finance Agreement with payables at LIBOR
plus 1.5%
|
2020
|
—
|
|
—
|
|
||||
|
Moy Park France Invoice Discounting Revolver with payables at
EURIBOR plus 0.8%
|
2018
|
1,815
|
|
8,918
|
|
||||
|
Chattels mortgages at weighted average of 3.74%
|
Various
|
873
|
|
1,432
|
|
||||
|
Term Loan Agence L’eau
|
2018
|
—
|
|
6
|
|
||||
|
Capital lease obligations
|
Various
|
9,239
|
|
14,600
|
|
||||
|
Long-term debt
|
2,709,350
|
|
1,429,981
|
|
|||||
|
Less: Current maturities of long-term debt
|
(47,775
|
)
|
(15,712
|
)
|
|||||
|
Long-term debt, less current maturities
|
2,661,575
|
|
1,414,269
|
|
|||||
|
Less: Capitalized financing costs
|
(25,958
|
)
|
(18,145
|
)
|
|||||
|
Long-term debt, less current maturities, net of capitalized
financing costs:
|
$
|
2,635,617
|
|
$
|
1,396,124
|
|
|||
U.S. Senior Notes
On March 11, 2015, the Company completed a sale of
$500.0 million
aggregate principal amount of its
5.75%
senior notes due 2025 (the “Senior Notes due 2025”). The Company used the net proceeds from the sale of the Senior Notes to repay
$350.0 million
and
$150.0 million
of the term loan indebtedness under the U.S. Credit Facility on March 12, 2015 and April 22, 2015, respectively. On September 29, 2017, the Company completed an add-on offering of
$250.0 million
of the Senior Notes due 2025 (the “Additional Senior Notes due 2025”). The issuance price of the add-on offering was
102.0%
which created gross proceeds of
$255.0 million
. The additional
$5.0 million
will be amortized over the life of the bond. The Company used the net proceeds from the sale of the Additional Senior Notes due 2025 to repay in full the JBS S.A. Promissory Note (as described below) issued as part of the Moy Park acquisition and for general corporate purposes. The Additional Senior Notes due 2025 will be treated as a single class with the existing Senior Notes due 2025 for all purposes under the 2015 Indenture (defined below) and will have the same terms as those of the existing Senior Notes due 2025. The Additional Senior Notes due 2025 were sold to qualified institutional buyers pursuant to Rule 144A under the Securities Act of 1933, as amended (the “Securities Act”), and outside the United States to non-U.S. persons pursuant to Regulation S under the Securities Act.
The Senior Notes due 2025 and the Additional Senior Notes due 2025 are governed by, and were issued pursuant to, an indenture dated as of March 11, 2015 by and among the Company, its guarantor subsidiary and Wells Fargo Bank, National Association, as trustee (the “2015 Indenture”). The 2015 Indenture provides, among other things, that the Senior Notes due 2025 and the Additional Senior Notes due 2025 bear interest at a rate of
5.75%
per annum from the date of issuance until maturity, payable semi-annually in cash in arrears, beginning on September 15, 2015 for the Senior Notes due 2025 and March, 15 2018 for the Additional Senior Notes due 2025. The Senior Notes due 2025 and the Additional Senior Notes due 2025 are guaranteed on a senior unsecured basis by the Company’s guarantor subsidiary. In addition, any of the Company’s other existing or future domestic restricted subsidiaries that incur or guarantee any other indebtedness (with limited exceptions) must also guarantee the Senior Notes due 2025 and the Additional Senior Notes due 2025. The Senior Notes due 2025 and the Additional Senior Notes due 2025 and related guarantees are unsecured senior obligations of the Company and its guarantor subsidiary and rank equally
79
NOTES TO CONSOLIDATED AND COMBINED FINANCIAL STATEMENTS
with all of the Company’s and its guarantor subsidiary’s other unsubordinated indebtedness. The Senior Notes due 2025 and the Additional Senior Notes due 2025 and the 2015 Indenture also contain customary covenants and events of default, including failure to pay principal or interest on the Senior Notes due 2025 and the Additional Senior Notes due 2025 when due, among others.
On September 29, 2017, the Company completed a sale of
$600.0 million
aggregate principal amount of its
5.875%
senior notes due 2027 (the “Senior Notes due 2027”). The Company used the net proceeds from the sale of the Senior Notes due 2027 to repay in full the JBS S.A. Promissory Note issued as part of the Moy Park acquisition and for general corporate purposes. The Senior Notes due 2027 were sold to qualified institutional buyers pursuant to Rule 144A under the Securities Act, and outside the United States to non-U.S. persons pursuant to Regulation S under the Securities Act.
The Senior Notes due 2027 are governed by, and were issued pursuant to, an indenture dated as of September 29, 2017 by and among the Company, its guarantor subsidiary and U.S. Bank National Association, as trustee (the “2017 Indenture”). The 2017 Indenture provides, among other things, that the Senior Notes due 2027 bear interest at a rate of
5.875%
per annum from the date of issuance until maturity, payable semi-annually in cash in arrears, beginning on March 30, 2018. The Senior Notes due 2027 are guaranteed on a senior unsecured basis by the Company’s guarantor subsidiary. In addition, any of the Company’s other existing or future domestic restricted subsidiaries that incur or guarantee any other indebtedness (with limited exceptions) must also guarantee the Senior Notes due 2027. The Senior Notes due 2027 and related guarantees are unsecured senior obligations of the Company and its guarantor subsidiary and rank equally with all of the Company’s and its guarantor subsidiary’s other unsubordinated indebtedness. The Senior Notes due 2027 and the 2017 Indenture also contain customary covenants and events of default, including failure to pay principal or interest on the Senior Notes due 2027 when due, among others.
Moy Park Senior Notes
On May 29, 2014, Moy Park (Bondco) Plc, a subsidiary of Granite Holdings Sàrl, completed the sale of a £
200.0 million
aggregate principal amount of its
6.25%
senior notes due 2021 (the “Moy Park Notes”). On April 17, 2015, an add-on offering of £
100.0 million
of the Moy Park Notes (the “Additional Moy Park Notes”) was completed. The Moy Park Notes and the Additional Moy Park Notes were sold to qualified institutional buyers pursuant to Rule 144A under the Securities Act, and outside the United States to non-U.S. persons pursuant to Regulation S under the Securities Act
.
The Moy Park Notes and the Additional Moy Park Notes are governed by, and were issued pursuant to, an indenture dated as of May 29, 2014 by Moy Park (Bondco) Plc, as issuer, Moy Park Holdings (Europe) Limited, Moy Park (Newco) Limited, Moy Park Limited, O’Kane Poultry Limited, as guarantors, and The Bank of New York Mellon, as trustee (the “Moy Park Indenture”). The Moy Park Indenture provides, among other things, that the Moy Park Notes and the Additional Moy Park Notes bear interest at a rate of
6.25%
per annum from the date of issuance until maturity, payable semiannually in cash in arrears, beginning on November 29, 2014 for the Moy Park Notes and May 28, 2015 for the Additional Moy Park Notes. The Moy Park Notes and the Additional Moy Park Notes are guaranteed by each of the subsidiary guarantors described above. The Moy Park Indenture contains customary covenants and events of default that may limit Moy Park (Bondco) Plc’s ability and the ability of certain subsidiaries to incur additional debt, declare or pay dividends or make certain investments, among others.
On November 2, 2017, Moy Park (Bondco) Plc announced the final results of its previously announced tender offer to purchase for cash any and all of its issued and outstanding Moy Park Notes and Moy Park Additional Notes. As of November 2, 2017,
£1,185,000
principal amount of Moy Park Notes and Moy Park Additional Notes had been validly tendered (and not validly withdrawn). Moy Park (Bondco) Plc has purchased all validly tendered (and not validly withdrawn) Moy Park Notes and Moy Park Additional Notes on or prior to November 2, 2017, with such settlement occurring on November 3, 2017.
U.S. Credit Facility
On May 8, 2017, the Company and certain of its subsidiaries entered into a Third Amended and Restated Credit Agreement (the “U.S. Credit Facility”) with Coöperatieve Rabobank U.A., New York Branch (“Rabobank”), as administrative agent and collateral agent, and the other lenders party thereto. The U.S. Credit Facility provides for a revolving loan commitment of up to
$750.0 million
and a term loan commitment of up to
$800.0 million
(the “Term Loans”). The U.S. Credit Facility also includes an accordion feature that allows the Company, at any time, to increase the aggregate revolving loan and term loan commitments by up to an additional
$1.0 billion
, subject to the satisfaction of certain conditions, including obtaining the lenders’ agreement to participate in the increase.
The revolving loan commitment under the U.S. Credit Facility matures on May 6, 2022. All principal on the Term Loans is due at maturity on May 6, 2022. Installments of principal are required to be made, in an amount equal to
1.25%
of
the original principal amount of the Term Loans, on a quarterly basis prior to the maturity date of the Term Loans. Covenants in the U.S. Credit Facility also require the Company to use the proceeds it receives from certain asset sales and specified debt or equity issuances and upon the occurrence of other events to repay outstanding borrowings under the U.S. Credit Facility. As of December 31, 2017, the company had Term Loans outstanding totaling
$780.0 million
and the amount available for borrowing under the revolving
80
NOTES TO CONSOLIDATED AND COMBINED FINANCIAL STATEMENTS
loan commitment was
$631.9 million
. The Company had letters of credit of
$44.8 million
and borrowings of
$73.3 million
outstanding under the revolving loan commitment as of December 31, 2017.
The U.S. Credit Facility includes a
$75.0 million
sub-limit for swingline loans and a
$125.0 million
sub-limit for letters of credit. Outstanding borrowings under the revolving loan commitment and the Term Loans bear interest at a per annum rate equal to (i) in the case of LIBOR loans, LIBOR plus
1.50%
through December 31, 2017 and, thereafter, based on the Company’s net senior secured leverage ratio, between LIBOR plus
1.25%
and LIBOR plus
2.75%
and (ii) in the case of alternate base rate loans, the base rate plus
0.50%
through December 31, 2017 and, based on the Company’s net senior secured leverage ratio, between the base rate plus
0.25%
and base rate plus
1.75%
thereafter.
The U.S. Credit Facility contains financial covenants and various other covenants that may adversely affect the Company’s ability to, among other things, incur additional indebtedness, incur liens, pay dividends or make certain restricted payments, consummate certain assets sales, enter into certain transactions with JBS and the Company’s other affiliates, merge, consolidate and/or sell or dispose of all or substantially all of our assets. The U.S. Credit Facility requires the Company to comply with a minimum level of tangible net worth covenant. The U.S. Credit Facility also provides that we may not incur capital expenditures in excess of
$500.0 million
in any fiscal year. The Company is currently in compliance with the covenants under the U.S. Credit Facility.
All obligations under the U.S. Credit Facility continue to be unconditionally guaranteed by certain of the Company’s subsidiaries and continue to be secured by a first priority lien on (i) the accounts receivable and inventory of our company and its non-Mexico subsidiaries, (ii)
100%
of the equity interests in our domestic subsidiaries, To-Ricos, Ltd. and To-Ricos Distribution, Ltd., and
65%
of the equity interests in our direct foreign subsidiaries and (iii) substantially all of the assets of the Company and the guarantors under the U.S. Credit Facility.
Mexico Credit Facility
On September 27, 2016, certain of our Mexican subsidiaries entered into an unsecured credit agreement (the “Mexico Credit Facility”) with BBVA Bancomer, S.A. Institución de Banca Múltiple, Grupo Financiero BBVA Bancomer, as lender. The loan commitment under the Mexico Credit Facility was
$1.5 billion
Mexican pesos. Outstanding borrowings under the Mexico Credit Facility accrued interest at a rate equal to the Interbank Equilibrium Interest Rate plus
0.95%
. The Mexico Credit Facility will mature on September 27, 2019. As of
December 31, 2017
, the U.S. dollar-equivalent of the loan commitment under the Mexico Credit Facility was
$76.3 million
, and there were
$76.3 million
outstanding borrowings under the Mexico Credit Facility that bear interest at a per annum rate of
8.34%
. As of
December 31, 2017
, the U.S. dollar-equivalent borrowing availability was less than
$0.1 million
.
Moy Park Multicurrency Revolving Facility Agreement
On March 19, 2015, Moy Park Holdings (Europe) Limited, a subsidiary of Granite Holdings Sàrl, and its subsidiaries, entered into an agreement with Barclays Bank plc which matures on March, 2019. The agreement provides for a multicurrency revolving loan commitment of up to £
20.0 million
. As of December 31, 2017, the U.S. dollar-equivalent loan commitment under Moy Park multicurrency revolving facility was
$27.0 million
and there were
$9.6 million
outstanding borrowings. Outstanding borrowings under the facility bear interest at a per annum rate equal to LIBOR plus a margin determined by Moy Park’s Net Debt to EBITDA ratio. The current margin stands at
2.2%
. As of December 31, 2017, the U.S. dollar-equivalent borrowing availability was
$17.4 million
.
The facility contains financial covenants and various other covenants that may adversely affect Moy Park's ability to, among other things, incur additional indebtedness, consummate certain assets sales, enter into certain transactions with JBS and the Company's other affiliates, merge, consolidate and/or sell or dispose of all or substantially all of the Moy Park's assets.
Moy Park Receivables Finance Agreement
Moy Park Limited, a subsidiary of Granite Holdings Sàrl, entered into a
£45.0 million
receivables finance agreement on January 29, 2016 (the “Receivables Finance Agreement”), with Barclays Bank plc, which matures on January 29, 2020. As of December 31, 2017, the U.S. dollar-equivalent loan commitment under the Receivables Finance Agreement was
$60.8 million
and there were
no
outstanding borrowings. Outstanding borrowings under the facility bear interest at a per annum rate equal to LIBOR plus
1.5%
. The Receivables Finance Agreement includes an accordion feature that allows us, at any time, to increase the commitments by up to an additional £
15.0 million
(U.S. dollar-equivalent
$20.3 million
as of December 31, 2017), subject to the satisfaction of certain conditions.
The Receivables Finance Agreement contains financial covenants and various other covenants that may adversely affect Moy Park's ability to, among other things, incur additional indebtedness, consummate certain asset sales, enter into certain
81
NOTES TO CONSOLIDATED AND COMBINED FINANCIAL STATEMENTS
transactions with JBS and the Company's other affiliates, merge, consolidate and/or sell or dispose of all or substantially all of Moy Park's assets.
Moy Park France Invoice Discounting Facility
In June 2009, Moy Park France Sàrl, a subsidiary of Granite Holdings Sàrl, entered into a
€20.0 million
invoice discounting facility with GE De Facto (the “Invoice Discounting Facility”). The facility limit was increased
€10.0 million
in September 2016 to
€30.0 million
. The Invoice Discounting Facility is payable on demand and the term is extended on an annual basis. The agreement can be terminated with three months’ notice. As of December 31, 2017, the U.S. dollar-equivalent loan commitment under the Invoice Discounting Facility was
$36.0 million
and there were
$1.8 million
outstanding borrowings. As of December 31, 2017, the U.S. dollar-equivalent borrowing availability was
$34.2 million
. Outstanding borrowings under the Invoice Discounting Facility bear interest at a per annum rate equal to EURIBOR plus a margin of
0.80%
.
The Invoice Discounting Facility contains financial covenants and various other covenants that may adversely affect Moy Park's ability to, among other things, incur additional indebtedness, consummate certain asset sales, enter into certain transactions with JBS and the Company's other affiliates, merge, consolidate and/or sell or dispose of all or substantially all of Moy Park's assets.
JBS S.A. Promissory Note
On September 8, 2017, Onix Investments UK Ltd., a wholly owned subsidiary of Pilgrim’s Pride Corporation, executed a subordinated promissory note payable to JBS S.A. (the “JBS S.A. Promissory Note”) for
£562.5 million
, which had a maturity date of September 6, 2018. Interest on the outstanding principal balance of the JBS S.A. Promissory Note accrued at the rate per annum equal to (i) from and after November 8, 2017 and prior to January 7, 2018,
4.00%
, (ii) from and after January 7, 2018 and prior to March 8, 2018,
6.00%
and (iii) from and after March 8, 2018,
8.00%
. The JBS S.A. Promissory Note was repaid in full on October 2, 2017 using the net proceeds from the sale of Senior Notes due 2027 and the Additional Senior Notes due 2025.
12. INCOME TAXES
Income before income taxes by jurisdiction is as follows:
|
2017
|
2016
|
2015
|
|||||||||
|
|
(In thousands)
|
||||||||||
|
U.S.
|
$
|
773,160
|
|
$
|
532,853
|
|
$
|
920,250
|
|
||
|
Foreign
|
208,906
|
|
191,183
|
|
81,074
|
|
|||||
|
Total
|
$
|
982,066
|
|
$
|
724,036
|
|
$
|
1,001,324
|
|
||
The components of income tax expense (benefit) are set forth below:
|
2017
|
2016
|
2015
|
|||||||||
|
|
(In thousands)
|
||||||||||
|
Current:
|
|||||||||||
|
Federal
|
$
|
213,146
|
|
$
|
165,989
|
|
$
|
248,821
|
|
||
|
Foreign
|
65,100
|
|
62,753
|
|
43,640
|
|
|||||
|
State and other
|
35,614
|
|
20,211
|
|
26,019
|
|
|||||
|
Total current
|
313,860
|
|
248,953
|
|
318,480
|
|
|||||
|
Deferred:
|
|||||||||||
|
Federal
|
(19,434
|
)
|
(3,529
|
)
|
32,819
|
|
|||||
|
Foreign
|
(34,264
|
)
|
(2,490
|
)
|
(19,695
|
)
|
|||||
|
State and other
|
3,737
|
|
985
|
|
6,748
|
|
|||||
|
Total deferred
|
(49,961
|
)
|
(5,034
|
)
|
19,872
|
|
|||||
|
$
|
263,899
|
|
$
|
243,919
|
|
$
|
338,352
|
|
|||
The effective tax rate for
2017
was
26.9%
compared to
34.6%
for
2016
and
34.9%
for 2015.
82
NOTES TO CONSOLIDATED AND COMBINED FINANCIAL STATEMENTS
The following table reconciles the statutory U.S. federal income tax rate to the Company’s effective income tax rate:
|
2017
|
2016
|
2015
|
|||||||
|
Federal income tax rate
|
35.0
|
|
%
|
35.0
|
|
%
|
35.0
|
|
%
|
|
State tax rate, net
|
2.6
|
|
2.4
|
|
2.3
|
|
|||
|
Domestic production activity
|
(1.6
|
)
|
(1.3
|
)
|
(1.9
|
)
|
|||
|
Difference in U.S. statutory tax rate and foreign
country effective tax rate
|
(1.4
|
)
|
(1.4
|
)
|
(0.9
|
)
|
|||
|
Rate change
|
(5.3
|
)
|
—
|
|
—
|
|
|||
|
Tax credits
|
(0.5
|
)
|
(0.6
|
)
|
(0.7
|
)
|
|||
|
Change in reserve for unrecognized tax
benefits
|
(0.7
|
)
|
(0.2
|
)
|
(0.1
|
)
|
|||
|
Change in valuation allowance
|
(1.2
|
)
|
(0.1
|
)
|
—
|
|
|||
|
Other
|
—
|
|
0.8
|
|
1.2
|
|
|||
|
Total
|
26.9
|
|
%
|
34.6
|
|
%
|
34.9
|
|
%
|
On December 22, 2017, the U.S. government enacted comprehensive tax legislation (the “Tax Act”), which significantly revises the ongoing U.S. corporate income tax law by lowering the U.S. federal corporate income tax rate from
35.0%
to
21.0%
, implementing a territorial tax system, imposing one-time tax on foreign unremitted earnings and setting limitations on deductibility of certain costs (e.g., interest expense), among other things.
Due to the complexities involved in accounting for the recently enacted Tax Act, the U.S. Securities and Exchange Commission’s Staff Accounting Bulletin (“SAB”) 118 requires that the Company include in its financial statements the reasonable estimate of the impact of the Tax Act on earnings to the extent such reasonable estimate has been determined. Accordingly, the Company accrued
$41.5 million
in provisional tax benefit related to the net change in deferred tax liabilities stemming from the Tax Act’s reduction of the U.S. federal tax rate from
35.0%
to
21.0%
for the year ended December 31, 2017. Additionally, the Company is currently estimating a zero tax liability on foreign unremitted earnings due to a net earnings and profits (“E&P”) deficit on accumulated post-1986 deferred foreign income. Therefore, the Company has not accrued any amount of tax expense for the Tax Act’s one-time transition tax on the foreign subsidiaries’ accumulated, unremitted earnings going back to 1986 for the year ended December 31, 2017. The Company will continue to analyze historical E&P on accumulated post-1986 deferred foreign income and will record any resulting tax adjustment during 2018. All other accounting as required by the Tax Act as of December 31, 2017 is complete
The Tax Act also includes a provision to tax global intangible low-taxed income (“GILTI”) of foreign subsidiaries and a base erosion anti-abuse tax (“BEAT”) measure that taxes certain payments between a U.S. corporation and its subsidiaries. The Company may be subject to the GILTI and BEAT provisions effective beginning January 1, 2018 and is in the process of analyzing their effects, including how to account for the GILTI provision from an accounting policy standpoint.
The final impact on the Company from the Tax Act’s transition tax legislation may differ from the aforementioned one-time transition tax amount due to the complexity of calculating and supporting with primary evidence such U.S. tax attributes as accumulated foreign earnings and profits, foreign tax paid, and other tax components involved in foreign tax credit calculations for prior years back to 1986. Such differences could be material, due to, among other things, changes in interpretations of the Tax Act, future legislative action to address questions that arise because of the Tax Act, changes in accounting standards for income taxes or related interpretations in response to the Tax Act, or any updates or changes to estimates the company has utilized to calculate the one-time transition tax.
Significant components of the Company’s deferred tax liabilities and assets are as follows:
83
NOTES TO CONSOLIDATED AND COMBINED FINANCIAL STATEMENTS
|
December 31, 2017
|
December 25, 2016
|
||||||
|
|
(In thousands)
|
||||||
|
Deferred tax liabilities:
|
|||||||
|
PP&E and identified intangible assets
|
$
|
213,500
|
|
$
|
242,991
|
|
|
|
Inventories
|
57,641
|
|
93,114
|
|
|||
|
Insurance claims and losses
|
29,253
|
|
42,186
|
|
|||
|
Business combinations
|
50,695
|
|
47,260
|
|
|||
|
Other
|
18,519
|
|
7,938
|
|
|||
|
Total deferred tax liabilities
|
369,608
|
|
433,489
|
|
|||
|
Deferred tax assets:
|
|||||||
|
Net operating losses
|
3,276
|
|
3,396
|
|
|||
|
Foreign net operating losses
|
26,934
|
|
32,825
|
|
|||
|
Credit carry forwards
|
2,425
|
|
2,080
|
|
|||
|
Allowance for doubtful accounts
|
1,767
|
|
4,274
|
|
|||
|
Accrued liabilities
|
50,389
|
|
57,567
|
|
|||
|
Workers compensation
|
26,119
|
|
38,834
|
|
|||
|
Pension and other postretirement benefits
|
13,379
|
|
21,903
|
|
|||
|
Other
|
51,306
|
|
46,414
|
|
|||
|
Total deferred tax assets
|
175,595
|
|
207,293
|
|
|||
|
Valuation allowance
|
(14,479
|
)
|
(25,611
|
)
|
|||
|
Net deferred tax assets
|
161,116
|
|
181,682
|
|
|||
|
Net deferred tax liabilities
|
$
|
208,492
|
|
$
|
251,807
|
|
|
In assessing the realizability of deferred tax assets, management considers whether it is more likely than not that some portion or all of the deferred tax assets will not be realized. The ultimate realization of deferred tax assets is dependent upon the generation of future taxable income during the periods in which those temporary differences become deductible. Management considers the scheduled reversal of deferred tax liabilities (including the impact of available carry back and carry forward periods), projected future taxable income and tax-planning strategies in making this assessment.
As of
December 31, 2017
, the Company believes it has sufficient positive evidence to conclude that realization of its federal and state net deferred tax assets is more likely than not to be realized. The decrease in valuation allowance of
$11.1 million
during
2017
was primarily due to a release of valuation on certain Mexico and U.K. net operating losses. As of
December 31, 2017
, the Company’s valuation allowance is
$14.5 million
, of which
$13.9 million
relates to U.K. and Europe operations,
$0.5 million
relates to state net operating losses and
$0.1 million
relates to its Mexico operations.
As of
December 31, 2017
, the Company had state net operating loss carry forwards of approximately
$98.0 million
that will begin to expire in
2018
. The Company also had Mexico net operating loss carry forwards at
December 31, 2017
of approximately
$19.3 million
that begin to expire in
2018
.
As of
December 31, 2017
, the Company had approximately
$2.1 million
of state tax credit carry forwards that begin to expire in
2018
.
On November 6, 2009, H.R. 3548 was signed into law and included a provision that allowed most business taxpayers an increased carry back period for net operating losses incurred in 2008 or 2009. As a result, during 2009 the Company utilized
$547.7 million
of its U.S. federal net operating losses under the expanded carry back provisions of H.R. 3548 and filed a claim for refund of
$169.7 million
. The Company received
$122.6 million
in refunds from the Internal Revenue Service (“IRS”) from the carry back claims during 2010. The Company anticipates receipt of the remainder of its claim pending resolution of its litigation with the IRS. See “Note 19. Commitments and Contingencies” for additional information.
The Company has not provided any deferred income taxes on the undistributed earnings of its foreign subsidiaries as of
December 31, 2017
based upon the determination that such earnings will be indefinitely reinvested. It is not practicable to determine the amount of incremental taxes that might arise if these earnings were to be remitted.
84
NOTES TO CONSOLIDATED AND COMBINED FINANCIAL STATEMENTS
For the fifty-three weeks ended December 31, 2017 and fifty-two weeks ended December 25, 2016, there is a tax effect of
$4.0 million
and
$3.2 million
, respectively, reflected in other comprehensive income.
Beginning in 2017, as a result of the new FASB guidance on share-based payments, excess tax benefits are now required to be reported in income tax expense rather than in additional paid-in capital. For the fifty-three weeks ended December 31, 2017, there is a tax effect of
$1.1 million
reflected in income tax expense due to excess tax benefits related to share-based compensation. For the fifty-two weeks ended December 25, 2016, there is
no
tax effect reflected in additional paid-in capital due to excess tax benefits related to share-based compensation. See “Note 1. Business and Summary of Significant Accounting Policies” for additional information.
A reconciliation of the beginning and ending amounts of unrecognized tax benefits is as follows:
|
December 31, 2017
|
December 25, 2016
|
||||||
|
|
(In thousands)
|
||||||
|
Unrecognized tax benefits, beginning of year
|
$
|
16,813
|
|
$
|
17,110
|
|
|
|
Increase as a result of tax positions taken during the current year
|
1,163
|
|
1,031
|
|
|||
|
Increase as a result of tax positions taken during prior years
|
60
|
|
16
|
|
|||
|
Decrease as a result of tax positions taken during prior years
|
(892
|
)
|
(140
|
)
|
|||
|
Decrease for lapse in statute of limitations
|
(4,123
|
)
|
(1,204
|
)
|
|||
|
Decrease relating to settlements with taxing authorities
|
(1,155
|
)
|
—
|
|
|||
|
Unrecognized tax benefits, end of year
|
$
|
11,866
|
|
$
|
16,813
|
|
|
Included in unrecognized tax benefits of
$11.9 million
at
December 31, 2017
, was
$6.7 million
of tax benefits that, if recognized, would reduce the Company’s effective tax rate. It is not practicable at this time to estimate the amount of unrecognized tax benefits that will change in the next twelve months.
The Company recognizes interest and penalties related to unrecognized tax benefits in its provision for income taxes. As of
December 31, 2017
, the Company had recorded a liability of
$7.1 million
for interest and penalties. During
2017
, accrued interest and penalty amounts related to uncertain tax positions decreased by
$1.1 million
.
The Company operates in the U.S. (including multiple state jurisdictions), Puerto Rico and several foreign locations including Mexico and the United Kingdom. With few exceptions, the Company is no longer subject to U.S. federal, state or local income tax examinations for years prior to 2011 and is no longer subject to Mexico and U.K. income tax examinations by taxing authorities for years prior to 2011.
The Company has a tax sharing agreement with JBS USA Food Company Holdings effective for tax years beginning 2010. The net tax receivable for tax year
2017
of
$5.6 million
was accrued in
2017
as a capital contribution and an account receivable from a related party in our Consolidated and Combined Balance Sheet.
85
NOTES TO CONSOLIDATED AND COMBINED FINANCIAL STATEMENTS
13.
PENSION AND OTHER POSTRETIREMENT BENEFITS
The Company sponsors programs that provide retirement benefits to most of its employees. These programs include qualified defined benefit pension plans, nonqualified defined benefit retirement plans, a defined benefit postretirement life insurance plan, and defined contribution retirement savings plans. Under all of our retirement plans, the Company’s expenses were
$10.8 million
,
$11.2 million
and
$11.2 million
in
2017
,
2016
and
2015
, respectively.
The Company used a year-end measurement date of
December 31, 2017
for its pension and postretirement benefits plans. Certain disclosures are listed below. Other disclosures are not material to the financial statements.
Qualified Defined Benefit Pension Plans
The Company sponsors
two
qualified defined benefit pension plans named the Pilgrim’s Pride Retirement Plan for Union Employees (the “Union Plan”) and the Pilgrim’s Pride Pension Plan for Legacy Gold Kist Employees (the “GK Pension Plan”). The Union Plan covers certain locations or work groups within PPC. The GK Pension Plan covers certain eligible U.S. employees who were employed at locations that the Company purchased through its acquisition of Gold Kist in 2007. Participation in the GK Pension Plan was frozen as of February 8, 2007 for all participants with the exception of terminated vested participants who are or may become permanently and totally disabled. The plan was frozen for that group as of March 31, 2007.
Nonqualified Defined Benefit Pension Plans
The Company sponsors
two
nonqualified defined benefit retirement plans named the Former Gold Kist Inc. Supplemental Executive Retirement Plan (the “SERP Plan”) and the Former Gold Kist Inc. Directors’ Emeriti Retirement Plan (the “Directors’ Emeriti Plan”). Pilgrim’s Pride assumed sponsorship of the SERP Plan and Directors’ Emeriti Plan through its acquisition of Gold Kist in 2007. The SERP Plan provides benefits on compensation in excess of certain IRC limitations to certain former executives with whom Gold Kist negotiated individual agreements. Benefits under the SERP Plan were frozen as of February 8, 2007. The Directors’ Emeriti Plan provides benefits to former Gold Kist directors.
Defined Benefit Postretirement Life Insurance Plan
The Company sponsors
one
defined benefit postretirement life insurance plan named the Gold Kist Inc. Retiree Life Insurance Plan (the “Retiree Life Plan”). Pilgrim’s Pride assumed defined benefit postretirement medical and life insurance obligations, including the Retiree Life Plan, through its acquisition of Gold Kist in 2007. In January 2001, Gold Kist began to substantially curtail its programs for active employees. On July 1, 2003, Gold Kist terminated medical coverage for retirees age 65 or older, and only retired employees in the closed group between ages 55 and 65 could continue their coverage at rates above the average cost of the medical insurance plan for active employees. These retired employees all reached the age of 65 in 2012 and liabilities of the postretirement medical plan then ended.
Defined Benefit Plans Obligations and Assets
The change in benefit obligation, change in fair value of plan assets, funded status and amounts recognized in the Consolidated and Combined Balance Sheets for these plans were as follows:
|
|
Pension Benefits
|
Other Benefits
|
|||||||||||||
|
|
2017
|
2016
|
2017
|
2016
|
|||||||||||
|
Change in projected benefit obligation:
|
(In thousands)
|
||||||||||||||
|
Projected benefit obligation, beginning of year
|
$
|
167,159
|
|
$
|
165,952
|
|
$
|
1,648
|
|
$
|
1,672
|
|
|||
|
Interest cost
|
5,571
|
|
5,585
|
|
51
|
|
51
|
|
|||||||
|
Actuarial losses (gains)
|
15,745
|
|
10,305
|
|
68
|
|
46
|
|
|||||||
|
Benefits paid
|
(10,228
|
)
|
(6,098
|
)
|
—
|
|
—
|
|
|||||||
|
Settlements
(a)
|
—
|
|
(8,585
|
)
|
(164
|
)
|
(121
|
)
|
|||||||
|
Projected benefit obligation, end of year
|
$
|
178,247
|
|
$
|
167,159
|
|
$
|
1,603
|
|
$
|
1,648
|
|
|||
|
(a)
|
A settlement is a transaction that is an irrevocable action, relieves the employer or the plan of primary responsibility for a pension or postretirement obligation and eliminates significant risks related to the obligation and the assets used to affect the settlement. A settlement can be triggered when a plan pays lump sums totaling more than the sum of the plan’s interest cost and service cost. The GK Pension Plan, the Retiree Life Plan, and the Union Pension Plan met this threshold in 2017 and 2016.
|
86
NOTES TO CONSOLIDATED AND COMBINED FINANCIAL STATEMENTS
|
|
Pension Benefits
|
Other Benefits
|
|||||||||||||
|
|
2017
|
2016
|
2017
|
2016
|
|||||||||||
|
Change in plan assets:
|
(In thousands)
|
||||||||||||||
|
Fair value of plan assets, beginning of year
|
$
|
97,526
|
|
$
|
96,947
|
|
$
|
—
|
|
$
|
—
|
|
|||
|
Actual return on plan assets
|
12,325
|
|
4,460
|
|
—
|
|
—
|
|
|||||||
|
Contributions by employer
|
12,947
|
|
10,802
|
|
164
|
|
121
|
|
|||||||
|
Benefits paid
|
(10,228
|
)
|
(6,098
|
)
|
—
|
|
—
|
|
|||||||
|
Settlements
|
—
|
|
(8,585
|
)
|
(164
|
)
|
(121
|
)
|
|||||||
|
Fair value of plan assets, end of year
|
$
|
112,570
|
|
$
|
97,526
|
|
$
|
—
|
|
$
|
—
|
|
|||
|
|
Pension Benefits
|
Other Benefits
|
|||||||||||||
|
|
2017
|
2016
|
2017
|
2016
|
|||||||||||
|
Funded status:
|
(In thousands)
|
||||||||||||||
|
Unfunded benefit obligation, end of year
|
$
|
(65,677
|
)
|
$
|
(69,633
|
)
|
$
|
(1,603
|
)
|
$
|
(1,648
|
)
|
|||
|
|
Pension Benefits
|
Other Benefits
|
|||||||||||||
|
|
2017
|
2016
|
2017
|
2016
|
|||||||||||
|
Amounts recognized in the Consolidated and Combined Balance Sheets at end of year:
|
(In thousands)
|
||||||||||||||
|
Current liability
|
$
|
(12,168
|
)
|
$
|
(13,113
|
)
|
$
|
(149
|
)
|
$
|
(147
|
)
|
|||
|
Long-term liability
|
(53,509
|
)
|
(56,520
|
)
|
(1,454
|
)
|
(1,501
|
)
|
|||||||
|
Recognized liability
|
$
|
(65,677
|
)
|
$
|
(69,633
|
)
|
$
|
(1,603
|
)
|
$
|
(1,648
|
)
|
|||
|
Pension Benefits
|
Other Benefits
|
||||||||||||||
|
2017
|
2016
|
2017
|
2016
|
||||||||||||
|
Amounts recognized in accumulated other
comprehensive loss at end of year:
|
(In thousands)
|
||||||||||||||
|
Net actuarial loss (gain)
|
$
|
54,235
|
|
$
|
46,494
|
|
$
|
35
|
|
$
|
(31
|
)
|
|||
The accumulated benefit obligation for our defined benefit pension plans was
$178.2 million
and
$167.2 million
at
December 31, 2017
and
December 25, 2016
, respectively. Each of our defined benefit pension plans had accumulated benefit obligations that exceeded the fair value of plan assets at
December 31, 2017
and
December 25, 2016
. As of
December 31, 2017
, the weighted average duration of our defined benefit obligation is
31.02
years.
Net Periodic Benefit Cost (Income)
Net pension and other postretirement costs included the following components:
|
|
Pension Benefits
|
Other Benefits
|
|||||||||||||||||||||
|
|
2017
|
2016
|
2015
|
2017
|
2016
|
2015
|
|||||||||||||||||
|
|
(In thousands)
|
||||||||||||||||||||||
|
Interest cost
|
$
|
5,571
|
|
$
|
5,585
|
|
$
|
7,754
|
|
$
|
51
|
|
$
|
51
|
|
$
|
67
|
|
|||||
|
Estimated return on plan assets
|
(5,254
|
)
|
(5,256
|
)
|
(6,684
|
)
|
—
|
|
—
|
|
—
|
|
|||||||||||
|
Settlement loss (gain)
|
—
|
|
2,064
|
|
3,843
|
|
2
|
|
(2
|
)
|
(4
|
)
|
|||||||||||
|
Amortization of net loss
|
932
|
|
659
|
|
714
|
|
—
|
|
—
|
|
—
|
|
|||||||||||
|
Net cost
|
$
|
1,249
|
|
$
|
3,052
|
|
$
|
5,627
|
|
$
|
53
|
|
$
|
49
|
|
$
|
63
|
|
|||||
87
NOTES TO CONSOLIDATED AND COMBINED FINANCIAL STATEMENTS
Economic Assumptions
The weighted average assumptions used in determining pension and other postretirement plan information were as follows:
|
|
Pension Benefits
|
Other Benefits
|
|||||||||||||||
|
|
2017
|
2016
|
2015
|
2017
|
2016
|
2015
|
|||||||||||
|
Benefit obligation:
|
|||||||||||||||||
|
Discount rate
|
3.69
|
%
|
4.31
|
%
|
4.47
|
%
|
3.39
|
%
|
3.81
|
%
|
4.47
|
%
|
|||||
|
Net pension and other postretirement cost:
|
|||||||||||||||||
|
Discount rate
|
4.32
|
%
|
4.47
|
%
|
4.22
|
%
|
3.81
|
%
|
4.47
|
%
|
4.22
|
%
|
|||||
|
Expected return on plan assets
|
5.50
|
%
|
5.50
|
%
|
5.50
|
%
|
NA
|
|
NA
|
|
NA
|
|
|||||
The discount rate represents the interest rate used to determine the present value of future cash flows currently expected to be required to settle the Company’s pension and other benefit obligations. The weighted average discount rate for each plan was established by comparing the projection of expected benefit payments to the AA Above Median yield curve. The expected benefit payments were discounted by each corresponding discount rate on the yield curve. For payments beyond 30 years, the Company extended the curve assuming the discount rate derived in year 30 is extended to the end of the plan’s payment expectations. Once the present value of the string of benefit payments was established, the Company determined the single rate on the yield curve, that when applied to all obligations of the plan, would exactly match the previously determined present value. As part of the evaluation of pension and other postretirement assumptions, the Company applied assumptions for mortality that incorporate generational white and blue collar mortality trends. In determining its benefit obligations, the Company used generational tables that take into consideration increases in plan participant longevity. All pension and other postretirement benefit plans used variations of the RP-2006 mortality table and the MP-2017 mortality improvement scale as of
December 31, 2017
. All pension and postretirement plans used variations of the RP-2006 mortality table and the MP-2016 mortality improvement scale as of
December 25, 2016
.
The sensitivity of the projected benefit obligation for pension benefits to changes in the discount rate is set out below. The impact of a change in the discount rate of 0.25% on the projected benefit obligation for other benefits is less than
$1,000
. This sensitivity analysis is based on changing one assumption while holding all other assumptions constant. In practice, this is unlikely to occur, and changes in some of the assumptions may be correlated. When calculating the sensitivity of the defined benefit obligation to variations in significant actuarial assumptions, the same method (present value of the defined benefit obligation calculated with the projected unit credit method at the end of the reporting period) has been applied as that for calculating the liability recognized in the Consolidated and Combined Balance Sheet.
|
Increase in Discount Rate of 0.25%
|
Decrease in Discount Rate of 0.25%
|
||||||
|
(In thousands)
|
|||||||
|
Impact on projected benefit obligation for pension benefits
|
$
|
(5,087
|
)
|
$
|
4,828
|
|
|
The expected rate of return on plan assets was primarily based on the determination of an expected return and behaviors for each plan’s current asset portfolio that the Company believes are likely to prevail over long periods. This determination was made using assumptions for return and volatility of the portfolio. Asset class assumptions were set using a combination of empirical and forward-looking analysis. To the extent historical results were affected by unsustainable trends or events, the effects of those trends or events were quantified and removed. The Company also considered anticipated asset allocations, investment strategies and the views of various investment professionals when developing this rate.
88
NOTES TO CONSOLIDATED AND COMBINED FINANCIAL STATEMENTS
Plan Assets
The following table reflects the pension plans’ actual asset allocations:
|
2017
|
2016
|
||||
|
Cash and cash equivalents
|
5
|
%
|
—
|
%
|
|
|
Pooled separate accounts
(a)
:
|
|||||
|
Equity securities
|
5
|
%
|
5
|
%
|
|
|
Fixed income securities
|
4
|
%
|
5
|
%
|
|
|
Common collective trust funds
(a)
:
|
|||||
|
Equity securities
|
56
|
%
|
60
|
%
|
|
|
Fixed income securities
|
30
|
%
|
30
|
%
|
|
|
Total assets
|
100
|
%
|
100
|
%
|
|
|
(a)
|
Pooled separate accounts (“PSAs”) and common collective trust funds (“CCTs”) are two of the most common types of alternative vehicles in which benefit plans invest. These investments are pooled funds that look like mutual funds, but they are not registered with the Securities and Exchange Commission. Often times, they will be invested in mutual funds or other marketable securities, but the unit price generally will be different from the value of the underlying securities because the fund may also hold cash for liquidity purposes, and the fees imposed by the fund are deducted from the fund value rather than charged separately to investors. Some PSAs and CCTs have no restrictions as to their investment strategy and can invest in riskier investments, such as derivatives, hedge funds, private equity funds, or similar investments.
|
Absent regulatory or statutory limitations, the target asset allocation for the investment of pension assets in the pooled separate accounts is
50%
in each of fixed income securities and equity securities and the target asset allocation for the investment of pension assets in the common collective trust funds is
30%
in fixed income securities and
70%
in equity securities. The plans only invest in fixed income and equity instruments for which there is a ready public market. We develop our expected long-term rate of return assumptions based on the historical rates of returns for equity and fixed income securities of the type in which our plans invest.
The fair value measurements of plan assets fell into the following levels of the fair value hierarchy as of
December 31, 2017
and
December 25, 2016
:
|
2017
|
2016(a)
|
||||||||||||||||||||||||||||||
|
Level 1
(a)
|
Level 2
(b)
|
Level 3
(c)
|
Total
|
Level 1
(a)
|
Level 2
(b)
|
Level 3
(c)
|
Total
|
||||||||||||||||||||||||
|
|
(In thousands)
|
||||||||||||||||||||||||||||||
|
Cash and cash equivalents
|
$
|
6,128
|
|
$
|
—
|
|
$
|
—
|
|
$
|
6,128
|
|
$
|
119
|
|
$
|
—
|
|
$
|
—
|
|
$
|
119
|
|
|||||||
|
Pooled separate accounts:
|
|||||||||||||||||||||||||||||||
|
Large U.S. equity funds
(d)
|
—
|
|
3,483
|
|
—
|
|
3,483
|
|
—
|
|
3,302
|
|
—
|
|
3,302
|
|
|||||||||||||||
|
Small/Mid U.S. equity funds
(e)
|
—
|
|
420
|
|
—
|
|
420
|
|
—
|
|
406
|
|
—
|
|
406
|
|
|||||||||||||||
|
International equity funds
(f)
|
—
|
|
1,665
|
|
—
|
|
1,665
|
|
—
|
|
1,231
|
|
—
|
|
1,231
|
|
|||||||||||||||
|
Fixed income funds
(g)
|
—
|
|
4,799
|
|
—
|
|
4,799
|
|
—
|
|
4,867
|
|
—
|
|
4,867
|
|
|||||||||||||||
|
Common collective trusts funds:
|
|||||||||||||||||||||||||||||||
|
Large U.S. equity funds
(d)
|
—
|
|
22,695
|
|
—
|
|
22,695
|
|
—
|
|
24,547
|
|
—
|
|
24,547
|
|
|||||||||||||||
|
Small/Mid U.S. equity funds
(e)
|
—
|
|
20,592
|
|
—
|
|
20,592
|
|
—
|
|
17,344
|
|
—
|
|
17,344
|
|
|||||||||||||||
|
International equity funds
(f)
|
—
|
|
19,923
|
|
—
|
|
19,923
|
|
—
|
|
17,006
|
|
—
|
|
17,006
|
|
|||||||||||||||
|
Fixed income funds
(g)
|
—
|
|
32,865
|
|
—
|
|
32,865
|
|
—
|
|
28,704
|
|
—
|
|
28,704
|
|
|||||||||||||||
|
Total assets
|
$
|
6,128
|
|
$
|
106,442
|
|
$
|
—
|
|
$
|
112,570
|
|
$
|
119
|
|
$
|
97,407
|
|
$
|
—
|
|
$
|
97,526
|
|
|||||||
|
(a)
|
Unadjusted quoted prices in active markets for identical assets are used to determine fair value.
|
|
(b)
|
Quoted prices in active markets for similar assets and inputs that are observable for the asset are used to determine fair value.
|
|
(c)
|
Unobservable inputs, such as discounted cash flow models or valuations, are used to determine fair value.
|
|
(d)
|
This category is comprised of investment options that invest in stocks, or shares of ownership, in large, well-established U.S. companies. These investment options typically carry more risk than fixed income options but have the potential for higher returns over longer time periods.
|
|
(e)
|
This category is generally comprised of investment options that invest in stocks, or shares of ownership, in small to medium-sized U.S. companies. These investment options typically carry more risk than larger U.S. equity investment options but have the potential for higher returns.
|
|
(f)
|
This category is comprised of investment options that invest in stocks, or shares of ownership, in companies with their principal place of business or office outside of the U.S.
|
89
NOTES TO CONSOLIDATED AND COMBINED FINANCIAL STATEMENTS
|
(g)
|
This category is comprised of investment options that invest in bonds, or debt of a company or government entity (including U.S. and non-U.S. entities). It may also include real estate investment options that directly own property. These investment options typically carry more risk than short-term fixed income investment options (including, for real estate investment options, liquidity risk), but less overall risk than equities.
|
The valuation of plan assets in Level 2 is determined using a market approach based upon quoted prices for similar assets and liabilities in active markets, or other inputs that are observable for substantially the full term of the financial instrument. Level 2 securities primarily include equity and fixed income securities funds.
Benefit Payments
The following table reflects the benefits as of
December 31, 2017
expected to be paid in each of the next five years and in the aggregate for the five years thereafter from our pension and other postretirement plans. Because our pension plans are primarily funded plans, the anticipated benefits with respect to these plans will come primarily from the trusts established for these plans. Because our other postretirement plans are unfunded, the anticipated benefits with respect to these plans will come from our own assets.
|
Pension Benefits
|
Other
Benefits
|
||||||
|
|
(In thousands)
|
||||||
|
2018
|
$
|
18,368
|
|
$
|
148
|
|
|
|
2019
|
11,889
|
|
148
|
|
|||
|
2020
|
11,687
|
|
146
|
|
|||
|
2021
|
11,337
|
|
143
|
|
|||
|
2022
|
11,160
|
|
139
|
|
|||
|
2023-2027
|
50,628
|
|
611
|
|
|||
|
Total
|
$
|
115,069
|
|
$
|
1,335
|
|
|
We anticipate contributing
$12.2 million
and
$0.1 million
, as required by funding regulations or laws, to our pension and other postretirement plans, respectively, during
2018
.
Unrecognized Benefit Amounts in Accumulated Other Comprehensive Loss (Income)
The amounts in accumulated other comprehensive income (loss) that were not recognized as components of net periodic benefits cost and the changes in those amounts are as follows:
|
|
Pension Benefits
|
Other Benefits
|
|||||||||||||||||||||
|
|
2017
|
2016
|
2015
|
2017
|
2016
|
2015
|
|||||||||||||||||
|
|
(In thousands)
|
||||||||||||||||||||||
|
Net actuarial loss (gain), beginning of year
|
$
|
46,494
|
|
$
|
38,115
|
|
$
|
43,907
|
|
$
|
(31
|
)
|
$
|
(79
|
)
|
$
|
(127
|
)
|
|||||
|
Amortization
|
(932
|
)
|
(659
|
)
|
(714
|
)
|
—
|
|
—
|
|
—
|
|
|||||||||||
|
Settlement adjustments
|
—
|
|
(2,064
|
)
|
(3,843
|
)
|
(2
|
)
|
2
|
|
4
|
|
|||||||||||
|
Actuarial loss (gain)
|
15,745
|
|
10,305
|
|
(10,944
|
)
|
68
|
|
46
|
|
44
|
|
|||||||||||
|
Asset loss (gain)
|
(7,072
|
)
|
797
|
|
9,709
|
|
—
|
|
—
|
|
—
|
|
|||||||||||
|
Net actuarial loss (gain), end of year
|
$
|
54,235
|
|
$
|
46,494
|
|
$
|
38,115
|
|
$
|
35
|
|
$
|
(31
|
)
|
$
|
(79
|
)
|
|||||
The Company expects to recognize in net pension cost throughout
2018
an actuarial loss of
$1.2 million
that was recorded in accumulated other comprehensive income at
December 31, 2017
.
Risk Management
Through its defined benefit plans, the Company is exposed to a number of risks, the most significant of which are detailed below:
Asset volatility.
The plan liabilities are calculated using a discount rate set with reference to corporate bond yields; if plan assets under perform this yield, this will create a deficit. The pension plans hold a significant proportion of equities, which are expected to outperform corporate bonds in the long-term while contributing volatility and risk in the short-
90
NOTES TO CONSOLIDATED AND COMBINED FINANCIAL STATEMENTS
term. The Company monitors the level of investment risk but has no current plan to significantly modify the mixture of investments. The investment position is discussed more below.
Changes in bond yields.
A decrease in corporate bond yields will increase plan liabilities, although this will be partially offset by an increase in the value of the plans’ bond holdings.
The investment position is managed and monitored by a committee of individuals from various departments. This group actively monitors how the duration and the expected yield of the investments are matching the expected cash outflows arising from the pension obligations. The group has not changed the processes used to manage its risks from previous periods. The group does not use derivatives to manage its risk. Investments are well diversified, such that the failure of any single investment would not have a material impact on the overall level of assets. The majority of equities are in U.S. large and small cap companies with some global diversification into international entities. The plans are not exposed to significant foreign currency risk.
Remeasurement
The Company remeasures both plan assets and obligations on a quarterly basis.
Defined Contribution Plans
The Company sponsors
two
defined contribution retirement savings plans in the U.S. segment named the Pilgrim’s Pride Retirement Savings Plan (the “RS Plan”) and the To-Ricos Employee Savings, Retirement Plan (the “To-Ricos Plan”). The RS Plan is an IRC Section 401(k) salary deferral plan maintained for certain eligible U.S. employees. Under the RS Plan, eligible U.S. employees may voluntarily contribute a percentage of their compensation. The Company matches up to
30.0%
of the first
2.00%
to
6.00%
of salary based on the salary deferral and compensation levels up to
$245,000
. The To-Ricos Plan is an IRC Section 1165(e) salary deferral plan maintained for certain eligible Puerto Rico employees. Under the To-Ricos Plan, eligible employees may voluntarily contribute a percentage of their compensation and there are various company matching provisions. The Company maintains
three
postretirement plans for eligible Mexico employees, as required by Mexico law, which primarily cover termination benefits. The Company maintains
two
defined contribution retirement savings plans in the U.K. and Europe for eligible U.K. and Europe employees, as required by U.K. and European law. Salaried employees can contribute up to
3.0%
of salary and the Company matches between
4.0%
and
5.5%
. Weekly employees can contribute up to
1.0%
of wages with a
1.0%
Company match.
The Company’s expenses related to its defined contribution plans totaled
$9.5 million
,
$8.1 million
and
$5.5 million
in
2017
,
2016
and
2015
, respectively.
91
NOTES TO CONSOLIDATED AND COMBINED FINANCIAL STATEMENTS
14.
STOCKHOLDERS’ EQUITY
Accumulated Other Comprehensive Loss
The following tables provide information regarding the changes in accumulated other comprehensive loss during
2017
and
2016
:
|
2017
(a)
|
|||||||||||||||||||
|
Losses Related to Foreign Currency Translation
|
Unrealized Gains (Losses) on Derivative Financial Instruments Classified as Cash Flow Hedges
|
Losses Related to Pension and Other Postretirement Benefits
|
Unrealized Holding Gains on Available-for-Sale Securities
|
Total
|
|||||||||||||||
|
(In thousands)
|
|||||||||||||||||||
|
Balance, beginning of year
|
$
|
(265,714
|
)
|
$
|
99
|
|
$
|
(64,243
|
)
|
$
|
—
|
|
$
|
(329,858
|
)
|
||||
|
Granite Holdings Sàrl common-control transaction
|
204,577
|
|
(1,368
|
)
|
—
|
|
—
|
|
203,209
|
|
|||||||||
|
Other comprehensive income (loss)
before reclassifications |
103,218
|
|
60
|
|
(7,770
|
)
|
82
|
|
95,590
|
|
|||||||||
|
Amounts reclassified from
accumulated other comprehensive
loss to net income
|
—
|
|
(639
|
)
|
579
|
|
(21
|
)
|
(81
|
)
|
|||||||||
|
Net current year other
comprehensive income (loss)
|
103,218
|
|
(579
|
)
|
(7,191
|
)
|
61
|
|
95,509
|
|
|||||||||
|
Balance, end of year
|
$
|
42,081
|
|
$
|
(1,848
|
)
|
$
|
(71,434
|
)
|
$
|
61
|
|
$
|
(31,140
|
)
|
||||
|
2016(a)
|
|||||||||||||||||||
|
Losses Related to Foreign Currency Translation
|
Unrealized Gains (Losses) on Derivative Financial Instruments Classified as Cash Flow Hedges
|
Losses Related to Pension and Other Postretirement Benefits
|
Unrealized Holding Gains on Available-for-Sale Securities
|
Total
|
|||||||||||||||
|
(In thousands)
|
|||||||||||||||||||
|
Balance, beginning of year
|
$
|
(32,482
|
)
|
$
|
(61
|
)
|
$
|
(58,997
|
)
|
$
|
67
|
|
$
|
(91,473
|
)
|
||||
|
Other comprehensive income (loss)
before reclassifications |
(233,232
|
)
|
(151
|
)
|
(5,657
|
)
|
277
|
|
(238,763
|
)
|
|||||||||
|
Amounts reclassified from
accumulated other comprehensive
loss to net income
|
—
|
|
311
|
|
411
|
|
(344
|
)
|
378
|
|
|||||||||
|
Net current year other
comprehensive income (loss)
|
(233,232
|
)
|
160
|
|
(5,246
|
)
|
(67
|
)
|
(238,385
|
)
|
|||||||||
|
Balance, end of year
|
$
|
(265,714
|
)
|
$
|
99
|
|
$
|
(64,243
|
)
|
$
|
—
|
|
$
|
(329,858
|
)
|
||||
|
(a)
|
All amounts are net of tax. Amounts in parentheses indicate debits.
|
92
NOTES TO CONSOLIDATED AND COMBINED FINANCIAL STATEMENTS
|
Details about Accumulated Other Comprehensive Loss Components
|
Amount Reclassified from Accumulated Other Comprehensive Loss(a)
|
|
||||||||
|
2017
|
2016
|
|||||||||
|
(In thousands)
|
||||||||||
|
Realized gain (loss) on settlement of
derivative financial instruments
classified as cash flow hedges
|
$
|
639
|
|
$
|
(311
|
)
|
Cost of sales
|
|||
|
Realized gain on sale of securities
|
34
|
|
552
|
|
Interest income
|
|||||
|
Amortization of pension and other
postretirement plan actuarial losses: |
||||||||||
|
Union employees pension plan
(b)
|
(24
|
)
|
(20
|
)
|
(d)
|
Cost of goods sold
|
||||
|
Legacy Gold Kist plans
(c)
|
(283
|
)
|
(199
|
)
|
(d)
|
Cost of goods sold
|
||||
|
Legacy Gold Kist plans
(c)
|
(625
|
)
|
(440
|
)
|
(d)
|
Selling, general and administrative expense
|
||||
|
Total before tax
|
(259
|
)
|
(418
|
)
|
||||||
|
Tax benefit
|
340
|
|
40
|
|
||||||
|
Total reclassification for the period
|
$
|
81
|
|
(378
|
)
|
|||||
|
(a)
|
Amounts in parentheses represent debits to results of operations.
|
|
(b)
|
The Company sponsors the Union Plan, a qualified defined benefit pension plan covering certain locations or work groups with collective bargaining agreements.
|
|
(c)
|
The Company sponsors the GK Pension Plan, a qualified defined benefit pension plan covering certain eligible U.S. employees who were employed at locations that the Company purchased through its acquisition of Gold Kist in 2007, the SERP Plan, a nonqualified defined benefit retirement plan covering certain former Gold Kist executives, the Directors’ Emeriti Plan, a nonqualified defined benefit retirement plan covering certain former Gold Kist directors and the Retiree Life Plan, a defined benefit postretirement life insurance plan covering certain retired Gold Kist employees (collectively, the “Legacy Gold Kist Plans”).
|
|
(d)
|
These accumulated other comprehensive loss components are included in the computation of net periodic pension cost. See “Note 13. Pension and Other Postretirement Benefits” to the Consolidated and Combined Financial Statements.
|
Share Repurchase Program and Treasury Stock
On July 28, 2015, the Company's Board of Directors approved a
$150.0 million
share repurchase authorization. The Company plans to repurchase shares through various means, which may include but are not limited to open market purchases, privately negotiated transactions, the use of derivative instruments and/or accelerated share repurchase programs. The share repurchase program was originally scheduled to expire on July 27, 2016. On February 10, 2016, the Company’s Board of Directors approved an increase of the share repurchase authorization to
$300.0 million
and an extension of the expiration to February 9, 2017. The extent to which the Company repurchases its shares and the timing of such repurchases will vary and depend upon market conditions and other corporate considerations, as determined by the Company’s management team. The Company reserves the right to limit or terminate the repurchase program at any time without notice. As of December 31, 2017, the Company had repurchased
11.4 million
shares under this program with a market value of approximately
$231.8 million
. The Company accounted for the shares repurchased using the cost method. The Company currently plans to maintain these shares as treasury stock.
Special Cash Dividends
On
May 18, 2016
, the Company paid a special cash dividend from retained earnings of approximately
$700.0 million
, or
$2.75
per share, to stockholders of record on
May 10, 2016
. The Company used proceeds from the U.S. Credit Facility, along with cash on hand, to fund the special cash dividend.
On
February 17, 2015
, the Company paid a special cash dividend from retained earnings of approximately
$1.5 billion
, or
$5.77
per share, to stockholders of record as of
January 30, 2015
. The Company used proceeds from the U.S. Credit Facility, along with cash on hand, to fund the special cash dividend.
Capital Contributions to a Subsidiary
In July 2016, the stockholders of Gallina Pesada, S.A.P.I. de C.V. (“GAPESA”), a subsidiary that is controlled, but not wholly owned, by the Company, contributed additional capital to fund a capacity expansion project in southern Mexico. The Company contributed
$2.7 million
of additional capital. This contribution was eliminated upon consolidation. The noncontrolling stockholders contributed
$7.3 million
of additional capital. The respective contributions did not impact either the Company or noncontrolling stockholders’ ownership percentages in GAPESA.
93
NOTES TO CONSOLIDATED AND COMBINED FINANCIAL STATEMENTS
Restrictions on Dividends
Both the U.S. Credit Facility and the indentures governing the Company’s senior notes restrict, but do not prohibit, the Company from declaring dividends.
The Moy Park Notes restrict, but do not prohibit, Moy Park from declaring dividends or making any distributions related to securities issues by Moy Park.
15.
INCENTIVE COMPENSATION
The Company sponsors a short-term incentive plan that provides the grant of either cash or share-based bonus awards payable upon achievement of specified performance goals (the “STIP”). Full-time, salaried exempt employees of the Company and its affiliates who are selected by the administering committee are eligible to participate in the STIP. The Company has accrued
$44.8 million
in costs related to the STIP at
December 31, 2017
related to cash bonus awards that could potentially be awarded during
2018
. The Company assumed responsibility for the JFC LLC Long-Term Equity Incentive Plan dated January 1, 2014, as amended (the “JFC LTIP”) through its acquisition of GNP on January 6, 2017. The Company has accrued
$3.3 million
in costs related to the JFC LTIP at December 31, 2017. The Company assumed responsibility for the Moy Park Incentive Plan dated January 1, 2013, as amended (the “MPIP”) through its acquisition of Moy Park on September 8, 2017. The Company has accrued
$0.6 million
in costs related to the MPIP at December 31, 2017.
The Company also sponsors a performance-based, omnibus long-term incentive plan that provides for the grant of a broad range of long-term equity-based and cash-based awards to the Company’s officers and other employees, members of the Board and any consultants (the “LTIP”). The equity-based awards that may be granted under the LTIP include “incentive stock options,” within the meaning of the IRC, nonqualified stock options, stock appreciation rights, restricted stock awards (“RSAs”) and restricted stock units (“RSUs”). At
December 31, 2017
, we have reserved approximately
4.8 million
shares of common stock for future issuance under the LTIP.
The following awards were outstanding during
2017
:
|
Award
Type
|
Benefit
Plan
|
Awards Granted
|
Grant
Date
|
Grant Date Fair Value per Award
(a)
|
Vesting
Condition
|
Vesting
Date
|
Vesting Date Fair Value per Award
(a)
|
Estimated
Forfeiture
Rate
|
Awards Forfeited to Date
|
Settlement Method
|
|||||||||||||||||
|
RSU
|
LTIP
|
449,217
|
|
02/19/2014
|
$
|
16.70
|
|
Service
|
12/31/2016
|
$
|
18.99
|
|
13.49
|
%
|
86,458
|
|
Stock
|
||||||||||
|
RSU
|
LTIP
|
223,701
|
|
03/03/2014
|
17.18
|
|
Performance / Service
|
12/31/2017
|
31.06
|
|
12.34
|
%
|
53,363
|
|
Stock
|
||||||||||||
|
RSU
|
(b)
|
LTIP
|
45,961
|
|
02/11/2015
|
25.87
|
|
Service
|
12/31/2017
|
31.06
|
|
12.34
|
%
|
10,965
|
|
Stock
|
|||||||||||
|
RSU
|
LTIP
|
251,136
|
|
03/30/2016
|
25.36
|
|
Performance / Service
|
12/31/2019
|
—
|
%
|
251,136
|
|
(d)
|
Stock
|
|||||||||||||
|
RSU
|
(b)
|
LTIP
|
74,535
|
|
10/13/2016
|
20.93
|
|
Service
|
12/31/2016
|
18.99
|
|
13.49
|
%
|
—
|
|
Stock
|
|||||||||||
|
RSU
|
LTIP
|
389,424
|
|
01/19/2017
|
18.38
|
|
Performance / Service
|
(e)
|
—
|
%
|
—
|
|
Stock
|
||||||||||||||
|
RSU
|
(c)
|
LTIP
|
48,586
|
|
02/13/2017
|
20.52
|
|
Service
|
12/31/2016
|
18.99
|
|
—
|
%
|
—
|
|
Stock
|
|||||||||||
|
RSU
|
(c)
|
LTIP
|
23,469
|
|
02/13/2017
|
20.52
|
|
Service
|
12/31/2017
|
31.06
|
|
—
|
%
|
652
|
|
Stock
|
|||||||||||
|
(a)
|
The fair value of each RSU granted or vested represents the closing price of the Company’s common stock on the respective grant date or vesting date.
|
|
(b)
|
On February 17, 2015, the Company paid a special cash dividend to stockholders of record as of January 30, 2015 totaling
$5.77
per share. On January 27, 2015, the Compensation Committee of the Company’s Board of Directors agreed to grant Dividend Equivalent Rights (“DERs”) in the form of RSUs to reflect an additional
$5.77
in value for each outstanding RSU.
|
|
(c)
|
On May 18, 2016, the Company paid a special cash dividend to stockholders of record as of May 10, 2015 totaling
$2.75
per share. On October 27, 2016, the Compensation Committee of the Company's Board of Directors agreed to grant additional RSUs to LTIP participants that were equal to the amount of the dividend that would be awarded to them had their RSUs existing as of the dividend record date been vested. The additional RSUs that were granted to the LTIP participants are subject to the same vesting requirements as the underlying RSUs granted under the LTIP.
|
|
(d)
|
Performance conditions associated with these awards were not satisfied. Therefore,
100%
of the awards were forfeited.
|
|
(e)
|
The subject RSUs will vest in ratable tranches on December 31, 2018, December 31, 2019, and December 31, 2020.
|
Compensation costs and the income tax benefit recognized for our share-based compensation arrangements are included below:
94
NOTES TO CONSOLIDATED AND COMBINED FINANCIAL STATEMENTS
|
2017
|
2016
|
2015
|
|||||||||
|
(In thousands)
|
|||||||||||
|
Share-based compensation cost:
|
|||||||||||
|
Cost of goods sold
|
$
|
256
|
|
$
|
770
|
|
$
|
596
|
|
||
|
Selling, general and administrative expenses
|
2,763
|
|
5,332
|
|
2,379
|
|
|||||
|
Total
|
$
|
3,019
|
|
$
|
6,102
|
|
$
|
2,975
|
|
||
|
Income tax benefit
|
$
|
1,006
|
|
$
|
1,858
|
|
$
|
868
|
|
||
The Company’s RSA and RSU activity is included below:
|
2017
|
2016
|
2015
|
||||||||||||||||||
|
Number
|
Weighted Average Grant Date Fair Value
|
Number
|
Weighted Average Grant Date Fair Value
|
Number
|
Weighted Average Grant Date Fair Value
|
|||||||||||||||
|
(In thousands, except weighted average fair values)
|
||||||||||||||||||||
|
RSAs:
|
||||||||||||||||||||
|
Outstanding at beginning of year
|
—
|
|
$
|
—
|
|
—
|
|
$
|
—
|
|
30
|
|
$
|
8.72
|
|
|||||
|
Granted
|
—
|
|
—
|
|
—
|
|
—
|
|
—
|
|
—
|
|
||||||||
|
Vested
|
—
|
|
—
|
|
—
|
|
—
|
|
—
|
|
—
|
|
||||||||
|
Forfeited
|
—
|
|
—
|
|
—
|
|
—
|
|
(30
|
)
|
8.72
|
|
||||||||
|
Outstanding at end of year
|
—
|
|
$
|
—
|
|
—
|
|
$
|
—
|
|
—
|
|
$
|
—
|
|
|||||
|
RSUs:
|
||||||||||||||||||||
|
Outstanding at beginning of year
|
906
|
|
$
|
20.00
|
|
774
|
|
$
|
18.78
|
|
1,120
|
|
$
|
11.97
|
|
|||||
|
Granted
|
461
|
|
18.72
|
|
325
|
|
24.35
|
|
428
|
|
21.00
|
|
||||||||
|
Vested
|
(714
|
)
|
18.09
|
|
—
|
|
—
|
|
(671
|
)
|
8.81
|
|
||||||||
|
Forfeited
|
(264
|
)
|
25.33
|
|
(193
|
)
|
24.51
|
|
(103
|
)
|
18.90
|
|
||||||||
|
Outstanding at end of year
|
389
|
|
$
|
18.39
|
|
906
|
|
$
|
20.00
|
|
774
|
|
$
|
18.78
|
|
|||||
The total fair value of awards vested in
2017
and
2015
was
$16.3 million
and
$22.4 million
, respectively.
No
awards vested in
2016
.
At
December 31, 2017
, the total unrecognized compensation cost related to all nonvested awards was
$7.2 million
. That cost is expected to be recognized over a weighted average period of
2.13
years.
Historically, we have issued new shares to satisfy award conversions.
16. RESTRUCTURING-RELATED ACTIVITIES
During 2017, the Company initiated a restructuring initiative to capitalize on cost-saving opportunities within its GNP operations. Implementation of the initiative is expected to result in total pre-tax charges of approximately
$6.8 million
, and approximately
$5.4 million
of these charges are estimated to result in cash outlays. These activities initiated in the first quarter of 2017 and are expected to be substantially completed by the second quarter of 2020.
The following table provides a summary of our estimates of costs associated with this restructuring initiative by major type of cost:
95
NOTES TO CONSOLIDATED AND COMBINED FINANCIAL STATEMENTS
|
Type of Cost
|
Total Estimated Amount Expected to be Incurred
|
|||
|
(In thousands)
|
||||
|
Employee termination benefits
|
$
|
4,074
|
|
|
|
Inventory impairments
|
699
|
|
||
|
Other
(1)
|
1,983
|
|
||
|
$
|
6,756
|
|
||
|
(1)
|
Comprised of other costs directly related to the restructuring initiative, including prepaid software impairment, St. Cloud, Minnesota office lease costs, and Luverne, Minnesota plant closure costs.
|
During 2017, the Company recognized the following costs and incurred the following cash outlays related to this restructuring initiative:
|
Expenses
|
Cash Outlays
|
||||||
|
(In thousands)
|
|||||||
|
Employee termination benefits
|
$
|
3,381
|
|
$
|
2,581
|
|
|
|
Inventory impairments
|
699
|
|
—
|
|
|||
|
Other
|
752
|
|
—
|
|
|||
|
$
|
4,832
|
|
$
|
2,581
|
|
||
These charges are reported in the line item
Administrative restructuring charges
on the Consolidated and Combined Statements of Income and are recognized in the U.S. segment.
The following table is a rollforward of our liabilities and reserves associated with this restructuring initiative. Ending liability balances for employee termination benefits and other charges are reported in the line item
Accrued expenses and other current liabilities
in our Consolidated and Combined Balance Sheets. The ending reserve balance for inventory impairments is reported in the line item
Inventories
in our Consolidated and Combined Balance Sheets.
|
Employee Termination Benefits
|
Inventory
Impairments |
Other
Charges |
Total
|
||||||||||||
|
(In thousands)
|
|||||||||||||||
|
Restructuring charges
|
$
|
3,381
|
|
$
|
699
|
|
$
|
752
|
|
$
|
4,832
|
|
|||
|
Payments
|
(2,581
|
)
|
—
|
|
—
|
|
(2,581
|
)
|
|||||||
|
Ending liability or reserve
|
$
|
800
|
|
$
|
699
|
|
$
|
752
|
|
$
|
2,251
|
|
|||
During 2017, the Company also reported impairment costs of
$3.5 million
and
$1.5 million
related to its Athens, Alabama and Dublin, Ireland plants, respectively, in the line item
Administrative restructuring charges
on the Consolidated Statements of Income. The impairment cost related the Athens, Alabama plant was recognized in the U.S. segment, while the impairment cost related to the Dublin, Ireland plant was recognized in the U.K. and Europe segment.
17. PUERTO RICO HURRICANE IMPACT
Hurricane Maria became the strongest storm to make landfall in Puerto Rico in
85
years when it came ashore on September 20, 2017. The hurricane knocked out power to the entire island. Trees were uprooted, homes and other buildings were destroyed, and there was also widespread flooding. The Company suffered significant damage because of the storm. Pilgrim’s lost
2.1 million
birds on the island, many of the Company’s contract growers lost their poultry houses, and the Company incurred damage at its processing plant, feed mill and hatchery. PPC does not expect that its operations on the island will be fully functional until the third quarter of 2018.
Estimated damages incurred by the Company through December 31, 2017 included property and casualty losses totaling
$5.2 million
and a business interruption claim totaling
$8.4 million
. Pilgrim’s expects to receive insurance proceeds related to
96
NOTES TO CONSOLIDATED AND COMBINED FINANCIAL STATEMENTS
these damages in the amount of
$5.5 million
and has recorded a receivable from its insurance provider for that amount. The amount of insurance recovery related to both the property and casualty losses and the business interruption claim are included in
Cost of sales
in the Consolidated and Combined Statements of Income and are recognized in the U.S. segment.
18.
RELATED PARTY TRANSACTIONS
Pilgrim's has been and, in some cases, continues to be a party to certain transactions with affiliated companies.
97
NOTES TO CONSOLIDATED AND COMBINED FINANCIAL STATEMENTS
|
2017
|
2016
|
2015
|
|||||||||
|
|
(In thousands)
|
||||||||||
|
Sales to related parties:
|
|||||||||||
|
JBS USA Food Company
(c)
|
$
|
15,289
|
|
$
|
16,534
|
|
$
|
21,743
|
|
||
|
JBS Five Rivers
|
31,004
|
|
14,126
|
|
—
|
|
|||||
|
JBS Global (UK) Ltd.
|
44
|
|
122
|
|
305
|
|
|||||
|
JBS Chile Ltda.
|
178
|
|
615
|
|
100
|
|
|||||
|
J&F Investimentos Ltd.
|
104
|
|
69
|
|
—
|
|
|||||
|
JBS S.A.
|
—
|
|
—
|
|
—
|
|
|||||
|
Seara International Ltd.
|
104
|
|
4
|
|
—
|
|
|||||
|
JBS Toledo
|
—
|
|
143
|
|
—
|
|
|||||
|
Rigamonti Salumificio S.P.A.
|
—
|
|
3
|
|
—
|
|
|||||
|
Total sales to related parties
|
$
|
46,723
|
|
$
|
31,616
|
|
$
|
22,148
|
|
||
|
Cost of goods purchased from related parties:
|
|||||||||||
|
JBS USA Food Company
(c)
|
$
|
101,685
|
|
$
|
139,476
|
|
$
|
103,542
|
|
||
|
Seara Meats B.V.
|
13,949
|
|
21,038
|
|
3,381
|
|
|||||
|
JBS S.A.
|
—
|
|
—
|
|
—
|
|
|||||
|
Seara International Ltd.
|
11,236
|
|
2,746
|
|
2,784
|
|
|||||
|
JBS Toledo
|
231
|
|
123
|
|
—
|
|
|||||
|
Macedo Agroindustrial Ltda.
|
—
|
|
—
|
|
60
|
|
|||||
|
Rigamonti Salumificio S.P.A.
|
—
|
|
15
|
|
—
|
|
|||||
|
Total cost of goods purchased from related parties
|
$
|
127,101
|
|
$
|
163,398
|
|
$
|
109,767
|
|
||
|
Expenditures paid by related parties:
|
|||||||||||
|
JBS USA Food Company
(d)
|
$
|
40,313
|
|
$
|
40,519
|
|
$
|
40,611
|
|
||
|
JBS S.A.
|
3,777
|
|
8,125
|
|
—
|
|
|||||
|
Seara Alimentos
|
64
|
|
—
|
|
—
|
|
|||||
|
Total expenditures paid by related parties
|
$
|
44,154
|
|
$
|
48,644
|
|
$
|
40,611
|
|
||
|
Expenditures paid on behalf of related parties:
|
|||||||||||
|
JBS USA Food Company
(d)
|
$
|
5,376
|
|
$
|
10,586
|
|
$
|
3,998
|
|
||
|
JBS Toledo
|
—
|
|
—
|
|
—
|
|
|||||
|
JBS S.A.
|
5
|
|
86
|
|
29
|
|
|||||
|
Seara International Ltd.
|
—
|
|
72
|
|
29
|
|
|||||
|
Seara Meats B.V.
|
12
|
|
—
|
|
—
|
|
|||||
|
Rigamonti Salumificio S.P.A.
|
—
|
|
3
|
|
—
|
|
|||||
|
Total expenditures paid on behalf of related parties
|
$
|
5,393
|
|
$
|
10,747
|
|
$
|
4,056
|
|
||
|
Other related party transactions:
|
|||||||||||
|
Letter of credit fees
(a)
|
$
|
—
|
|
$
|
202
|
|
$
|
1,268
|
|
||
|
Capital contribution under tax sharing agreement
(b)
|
5,558
|
|
5,038
|
|
3,690
|
|
|||||
|
Total other related party transactions
|
$
|
5,558
|
|
$
|
5,240
|
|
$
|
4,958
|
|
||
98
NOTES TO CONSOLIDATED AND COMBINED FINANCIAL STATEMENTS
|
2017
|
2016
|
||||||
|
|
(In thousands)
|
||||||
|
Accounts receivable from related parties:
|
|||||||
|
JBS USA Food Company
(c)
|
$
|
2,826
|
|
$
|
3,754
|
|
|
|
JBS Chile Ltda.
|
108
|
|
159
|
|
|||
|
JBS S.A.
|
—
|
|
46
|
|
|||
|
Seara International Ltd.
|
15
|
|
51
|
|
|||
|
Seara Meats B.V.
|
2
|
|
—
|
|
|||
|
Total accounts receivable from related parties
|
$
|
2,951
|
|
$
|
4,010
|
|
|
|
Accounts payable to related parties:
|
|||||||
|
JBS USA Food Company
(c)
|
$
|
440
|
|
$
|
1,421
|
|
|
|
Seara Meats B.V.
|
2,410
|
|
3,026
|
|
|||
|
JBS Toledo
|
39
|
|
21
|
|
|||
|
Total accounts payable to related parties
|
$
|
2,889
|
|
$
|
4,468
|
|
|
|
(a)
|
JBS USA Food Company Holdings (“JBS USA Holdings”) arranged for letters of credit to be issued on its account in the aggregate amount of
$56.5 million
to an insurance company on our behalf in order to allow that insurance company to return cash it held as collateral against potential workers’ compensation, auto liability and general liability claims. In return for providing this letter of credit, the Company has agreed to reimburse JBS USA Holdings for the letter of credit fees the Company would otherwise incur under its U.S. Credit Facility. The letter of credit arrangements for
$40.0 million
and
$16.5 million
were terminated on March 7, 2016 and April 1, 2016, respectively. During 2016, the Company paid JBS USA Holdings
$0.2 million
for letter of credit fees.
|
|
(b)
|
The Company entered into a tax sharing agreement during 2014 with JBS USA Holdings effective for tax years starting 2010. The net tax receivable for tax year 2017 was accrued in 2017 and will be paid in 2018. The net tax receivable for tax year 2016 was accrued in 2016 and paid in January 2017. The net tax receivable for tax year 2015 was accrued in 2015 and paid in January 2016. The net tax receivable for tax years 2010 through 2014 was accrued in 2014 and paid in January 2015.
|
|
(c)
|
We routinely execute transactions to both purchase products from JBS USA Food Company (“JBS USA”) and sell products to them. As of
December 31, 2017
and December 25, 2016, the outstanding payable to JBS USA was
$0.4 million
and
$1.4 million
, respectively. As of
December 31, 2017
and December 25, 2016, the outstanding receivable from JBS USA was
$2.8 million
and
$3.8 million
, respectively. As of
December 31, 2017
, approximately
$1.7 million
of goods from JBS USA were in transit and not reflected on our Consolidated and Combined Balance Sheet.
|
|
(d)
|
The Company has an agreement with JBS USA to allocate costs associated with JBS USA’s procurement of SAP licenses and maintenance services for both companies. Under this agreement, the fees associated with procuring SAP licenses and maintenance services are allocated between the Company and JBS USA in proportion to the percentage of licenses used by each company. The agreement expires on the date of expiration, or earlier termination, of the underlying SAP license agreement. The Company also has an agreement with JBS USA to allocate the costs of supporting the business operations by one consolidated corporate team, which have historically been supported by their respective corporate teams. Expenditures paid by JBS USA on behalf of the Company will be reimbursed by the Company and expenditures paid by the Company on behalf of JBS USA will be reimbursed by JBS USA. This agreement expires on December 31, 2019.
|
19.
COMMITMENTS AND CONTINGENCIES
General
We are a party to many routine contracts in which we provide general indemnities in the normal course of business to third parties for various risks. Among other considerations, we have not recorded a liability for any of these indemnities as based upon the likelihood of payment, the fair value of such indemnities would not have a material impact on our financial condition, results of operations and cash flows.
Purchase Obligations
The Company will sometimes enter into noncancelable contracts to purchase capital equipment and certain commodities such as corn, soybean meal, and electricity. At
December 31, 2017
, the Company was party to outstanding purchase contracts totaling
$346.7 million
and less than
$0.1 million
payable in
2018
and
2019
, respectively. There were
no
outstanding purchase contracts in 2019.
Operating Leases
The Consolidated and Combined Statements of Income include rental expense for operating leases of approximately
$59.0 million
,
$56.9 million
and
$32.1 million
in
2017
,
2016
and
2015
, respectively. The Company’s future minimum lease commitments under noncancelable operating leases are as follows (in thousands):
99
NOTES TO CONSOLIDATED AND COMBINED FINANCIAL STATEMENTS
|
2018
|
$
|
54,961
|
|
|
|
2019
|
47,007
|
|
||
|
2020
|
37,043
|
|
||
|
2021
|
31,219
|
|
||
|
2022
|
26,332
|
|
||
|
Thereafter
|
38,206
|
|
||
|
Total
|
$
|
234,768
|
|
|
Certain of the Company’s operating leases include rent escalations. The Company includes the rent escalation in its minimum lease payments obligations and recognizes them as a component of rental expense on a straight-line basis over the minimum lease term.
The Company also maintains operating leases for various types of equipment, some of which contain residual value guarantees for the market value of assets at the end of the term of the lease. The terms of the lease maturities range from
one
to
ten
years. The maximum potential amount of the residual value guarantees is estimated to be approximately
$48.5 million
; however, the actual amount would be offset by any recoverable amount based on the fair market value of the underlying leased assets. No liability has been recorded related to this contingency as the likelihood of payments under these guarantees is not considered to be probable and the fair value of such guarantees is immaterial. The Company historically has not experienced significant payments under similar residual guarantees.
Financial Instruments
The Company’s loan agreements generally obligate the Company to reimburse the applicable lender for incremental increased costs due to a change in law that imposes (i) any reserve or special deposit requirement against assets of, deposits with or credit extended by such lender related to the loan, (ii) any tax, duty or other charge with respect to the loan (except standard income tax) or (iii) capital adequacy requirements. In addition, some of the Company’s loan agreements contain a withholding tax provision that requires the Company to pay additional amounts to the applicable lender or other financing party, generally if withholding taxes are imposed on such lender or other financing party as a result of a change in the applicable tax law. These increased cost and withholding tax provisions continue for the entire term of the applicable transaction, and there is no limitation on the maximum additional amounts the Company could be obligated to pay under such provisions. Any failure to pay amounts due under such provisions generally would trigger an event of default, and, in a secured financing transaction, would entitle the lender to foreclose upon the collateral to realize the amount due.
Litigation
We are a party to many routine contracts in which we provide general indemnities in the normal course of business to third parties for various risks. Among other considerations, we have not recorded a liability for any of these indemnities as based upon the likelihood of payment, the fair value of such indemnities would not have a material impact on our financial condition, results of operations and cash flows.
The Company is subject to various legal proceedings and claims which arise in the ordinary course of business. In the Company’s opinion, it has made appropriate and adequate accruals for claims where necessary; however, the ultimate liability for these matters is uncertain, and if significantly different than the amounts accrued, the ultimate outcome could have a material effect on the financial condition or results of operations of the Company. For a discussion of the material legal proceedings and claims, see Part II, Item 1. “Legal Proceedings.” Below is a summary of some of these material proceedings and claims. The Company believes it has substantial defenses to the claims made and intends to vigorously defend these cases.
Tax Claims and Proceedings
In 2009, the IRS asserted claims against Pilgrim’s Pride in the Bankruptcy Court for the Northern District of Texas, Fort Worth Division, or the Bankruptcy Court, totaling
$74.7 million
. Following a series of objections and motions of opposition filed by both parties with the Bankruptcy Court, the Company worked with the IRS through the normal processes and procedures that are available to resolve the IRS’ claims. On December 12, 2012, the Company entered into
two
Stipulation of Settled Issues agreements with the IRS, or the Stipulations. The first Stipulation related to the Company’s 2003, 2005, and 2007 tax years and resolved all of the material issues in the case. The second Stipulation related to the Company as the successor in interest to Gold Kist Inc., or Gold Kist, for the tax years ended June 30, 2005 and September 30, 2005, and resolved all substantive issues in the case. These Stipulations accounted for approximately
$29.3 million
of the claims and should result in no additional tax due. the Company is currently working with the IRS to finalize the complete tax calculations associated with the Stipulations.
100
NOTES TO CONSOLIDATED AND COMBINED FINANCIAL STATEMENTS
A Mexico subsidiary of the Company is currently appealing an unfavorable tax adjustment proposed by Mexican Tax Authorities due to an examination of a specific transaction undertaken by the Mexico subsidiary during tax years 2009 and 2010. At the time of the transaction the Company obtained a “should” level opinion from outside legal counsel representing no additional tax due as a result of the transaction. However, in February 2018, the Company received a new assessment from external legal counsel indicating an unfavorable outcome to the Company as reasonably possible. Amounts under appeal are
$24.3 million
and
$16.1 million
for tax years 2009 and 2010, respectively. No loss has been recorded for these amounts at this time.
Other Claims and Proceedings
Between September 2, 2016 and October 13, 2016, a series of purported class action lawsuits styled as
In re Broiler Chicken Antitrust Litigation
, Case No. 1:16-cv-08637 were filed with the U.S. District Court for the Northern District of Illinois against the Company and
13
other producers by and on behalf of direct and indirect purchasers of broiler chickens alleging violations of federal and state antitrust and unfair competition laws. The complaints seek, among other relief, treble damages for an alleged conspiracy among defendants to reduce output and increase prices of broiler chickens from the period of January 2008 to the present. The plaintiffs have filed three consolidated amended complaints: one on behalf of direct purchasers and two on behalf of distinct groups of indirect purchasers. The defendants, including the Company, filed motions to dismiss these actions. On November 20, 2017, the court denied all pending motions to dismiss with the exception of certain state-law claims by indirect purchasers that were dismissed or narrowed in scope. Discovery is proceeding and is currently scheduled to be complete by June 13, 2019. In December 2017 and January 2018 four individual complaints (
Affiliated Foods, Inc. v. Claxton Poultry Farms, Inc.
, Case No. 1:17-cv-08850;
Winn Dixie Stores, Inc. v. Koch Foods, Inc.
, Case No. 1:18-cv-00245;
Sysco Corp. v. Tyson Foods Inc., et al;
Case No. 1:18-cv-00700; and
U.S. Foods Inc.
v. Tyson Foods Inc., et al;
Case No. 1:18-cv-00702) were filed, mirroring the class action complaints. The class complaints were answered in January 2018. A schedule for answers to the individual complaints will be set and the court has indicated it intends to coordinate scheduling for the individual complaints with the class complaints to the greatest extent possible.
On October 10, 2016, Patrick Hogan, acting on behalf of himself and a putative class of persons who purchased shares of the Company’s stock between February 21, 2014 and October 6, 2016, filed a class action complaint in the U.S. District Court for the District of Colorado against the Company and its named executive officers. The complaint alleges, among other things, that the Company’s SEC filings contained statements that were rendered materially false and misleading by the Company’s failure to disclose that (i) the Company colluded with several of its industry peers to fix prices in the broiler-chicken market as alleged in the
In re Broiler Chicken Antitrust Litigation
, (ii) its conduct constituted a violation of federal antitrust laws, (iii) the Company’s revenues during the class period were the result of illegal conduct and (iv) that the Company lacked effective internal control over financial reporting, as well as stating that the Company’s industry was anticompetitive. On April 4, 2017, the court appointed another stockholder, George James Fuller, as lead plaintiff. On April 26, 2017, the court set a briefing schedule for the filing of an amended complaint and the defendants’ motion to dismiss. On May 11, 2017, the plaintiff filed an amended complaint, which extended the end date of the putative class period to November 17, 2016. Defendants moved to dismiss on June 12, 2017, and the plaintiff filed its opposition on July 12, 2017. Defendants filed their reply on August 1, 2017. As of the date of this offering memorandum, the Colorado Court’s decision on the motion is pending.
On January 27, 2017, a purported class action on behalf of broiler chicken farmers was brought against the Company and
four
other producers in the Eastern District of Oklahoma alleging, among other things, a conspiracy to reduce competition for grower services and depress the price paid to growers. Plaintiffs allege violations of the Sherman Act and Packers and Stockyards Act and seek, among other relief, treble damages. The complaint was consolidated with a subsequently filed consolidated amended class action complaint styled as
In re Broiler Chicken Grower Litigation
, Case No. CIV-17-033-RJS. The defendants, including the Company, jointly moved to dismiss the consolidated amended complaint on September 9, 2017. During oral argument on January 19, 2018, the court considered and granted other defendants’ motions challenging jurisdiction and, as a result, granted the plaintiffs time to determine whether they will proceed forward with the case or dismiss the lawsuit. The plaintiffs have until Friday, February 2, 2018 to inform the district court of their plan course of action, and oral argument on remaining motions will be scheduled as necessary. In addition, on August 29, 2017, the Company filed a Motion to Enforce Confirmation Order Against Growers in the U.S. Bankruptcy Court in the Eastern district of Texas, seeking an order enjoining the
In re Broiler Chicken Grower Litigation
plaintiffs from pursuing the class action against the Company. A hearing on this motion was held in October 2017 and a second is scheduled for February 13, 2018. As of the date of this offering memorandum, a court decision on this motion is pending.
On March 9, 2017, a stockholder derivative action styled as
DiSalvio v. Lovette
, et al., No. 2017 cv. 30207, was brought against all of the Company’s directors and its Chief Financial Officer, Fabio Sandri, in the District Court for the County of Weld in Colorado. The complaint alleges, among other things, that the named defendants breached their fiduciary duties by failing to prevent the Company and its officers from engaging in an antitrust conspiracy as alleged in the In re Broiler Chicken Antitrust Litigation, and issuing false and misleading statements as alleged in the Hogan class action litigation. On April 17, 2017, a related stockholder derivative action styled
Brima v. Lovette
, et al., No. 2017 cv. 30308, was brought against all of the Company’s directors
101
NOTES TO CONSOLIDATED AND COMBINED FINANCIAL STATEMENTS
and its Chief Financial Officer in the District Court for the County of Weld in Colorado. The Brima complaint contains largely the same allegations as the DiSalvio complaint. On May 4, 2017, the plaintiffs in both the DiSalvio and Brima actions moved to (i) consolidate the two stockholder derivative cases, (ii) stay the consolidated action until the resolution of the motion to dismiss in the Hogan putative securities class action, and (iii) appoint co-lead counsel. The court granted the motion on May 8, 2017, staying the proceedings pending resolution of the motion to dismiss in the Hogan action.
On January 10, 2018 a shareholder derivative action was filed in the U.S. District Court for the District of Colorado against the the Company, as nominal defendant, as well as the Company’s directors, its Chief Financial Officer, and majority shareholder JBS S.A. in
Raul v. Nogueira de Souza, et al.
, Civil Action No. 18-cv-00069. The complaint alleges, among other things, that (i) defendants permitted the Company to omit material information from its proxy statements filed in 2014 through 2017 related to the conduct of former directors Wesley Mendonça Batista and Joesley Mendonça Batista and (ii) the individual defendants and JBS breached their fiduciary duties by failing to prevent the Company and its officers from engaging in an antitrust conspiracy as alleged in the Broiler Litigation and issuing false and misleading statements as alleged in the Hogan class action litigation. The defendants are currently in discussions with counsel for the
Raul
plaintiffs regarding the possibility of consolidating the
Raul
action with the consolidated state court derivative action, which is currently stayed, or in the alternative, determining a motion to dismiss briefing schedule.
On January 25, 2018 a stockholder derivative action styled as
Sciabacucchi v. JBS S.A.et al.
, was brought against all of the Company’s directors, JBS S.A., JBS USA Holding and several members of the Batista family, in the Court of Chancery of the State of Delaware. The complaint alleges, among other things, that the named defendants breached their fiduciary duties in connection with the Moy Park Acquisition.
The Company believes it has strong defenses in each of the above litigations and intends to contest them vigorously. The Company cannot predict the outcome of these actions nor when they will be resolved. If the plaintiffs were to prevail in any of these litigations, the Company could be liable for damages, which could be material and could adversely affect its financial condition or results of operations.
J&F Investigation
On May 3, 2017, certain officers of J&F Investimentos S.A. (“J&F,” and the companies controlled by J&F, the “J&F Group”) (including
two
former directors of the Company)
, a company organized in Brazil and an indirect controlling stockholder of the Company, entered into plea bargain agreements (the "Plea Bargain Agreements") with the Brazilian Federal Prosecutor's Office (
Ministério Público Federal
) ("MPF") in connection with certain illicit conduct involving improper payments made to Brazilian politicians, government officials and other individuals in Brazil committed by or on behalf of J&F and certain J&F Group companies. The details of such illicit conduct are set forth in separate annexes to the Plea Bargain Agreements, and include admissions of improper payments to politicians and political parties in Brazil over the last 10 years in exchange for receiving, or attempting to receive, favorable treatment for certain J&F Group companies in Brazil.
Pursuant to the terms of the Plea Bargain Agreements, the MPF agreed to grant immunity to the officers in exchange for such officers agreeing, among other considerations, to: (1) pay fines totaling R
$225.0 million
;
(2) cooperate with the MPF, including providing supporting evidence of the illicit conduct identified in the annexes to the Plea Bargain Agreements; and (3) present any previously undisclosed illicit conduct within 120 days following the execution of the Plea Bargain Agreements as long as the description of such conduct had not been omitted in bad faith. In addition, the Plea Bargain Agreements provide that the MPF may terminate any Plea Bargain Agreement and request that the Supreme Court of Brazil (
Supremo Tribunal Federal
) ("STF") ratify such termination if any illicit conduct is identified that was not included in the annexes to the Plea Bargain Agreements.
On June 5, 2017, J&F, in its role as the controlling shareholder of the J&F Group, entered into a leniency agreement (the "Leniency Agreement") with the MPF, whereby J&F assumed responsibility for the conduct that was described in the annexes to the Plea Bargain Agreements. In connection with the Leniency Agreement, J&F has agreed to pay a fine of
R$10.3 billion
, adjusted for inflation, over a
25
- year period. In exchange, the MPF agreed not to initiate or propose any criminal, civil or administrative actions against J&F, the companies of the J&F Group or those officers of J&F with respect to such conduct. Pursuant to the terms of the Leniency Agreement, if the Plea Bargain Agreement is annulled by the STF, then the Leniency Agreement may also be terminated by the Fifth Chamber of Coordination and Reviews of the MPF or, solely with respect to the criminal related provisions of the Leniency Agreement, by the 10th Federal Court of the Federal District in Brasilia, the authorities responsible for the ratification of the Leniency Agreement.
On August 24, 2017, the Fifth Chamber ratified the Leniency Agreement. On September 8, 2017, the 10th Federal Court ratified the Leniency Agreement. In compliance with the terms of the Leniency Agreement, J&F is conducting an internal investigation involving improper payments made in Brazil by or on behalf of J&F, certain companies of the J&F Group and certain officers of J&F (including two former directors of the Company). J&F has engaged outside advisors to assist in conducting the investigation, including an assessment as to whether any of the misconduct disclosed to Brazilian authorities had any connection
102
NOTES TO CONSOLIDATED AND COMBINED FINANCIAL STATEMENTS
to the Company, or resulted in a violation of U.S. law. The internal investigation is ongoing and the Company is fully cooperating with J&F in connection with the investigation. We cannot predict when the investigation will be completed or the results of the investigation, including the outcome or impact of any government investigations or any resulting litigation.
On September 8, 2017, at the request of the MPF, the STF issued an order temporarily revoking the immunity from prosecution previously granted to Joesley Mendonça Batista and another executive of J&F in connection with the Plea Bargain Agreements. The MPF requested the revocation of their immunity following public disclosure of certain voice recordings involving them in which they discussed certain alleged illicit activities the MPF claims were not covered by the annexes to their respective Plea Bargain Agreements. On September 10, 2017, Joesley Mendonça Batista voluntarily turned himself into police in Brazil. On September 11, 2017, the 10th Federal Court suspended its ratification of the criminal provisions of the Leniency Agreement as a result of the STF's temporary revocation of Joesley Mendonça Batista immunity under his Plea Bargain Agreement. On October 11, 2017, Judge Vallisney de Souza of the 10th Federal Court revalidated the criminal provisions of the Leniency Agreement.
We cannot predict whether the Plea Bargain Agreements will be upheld or terminated by the STF, and, if terminated, whether the Leniency Agreement will be also terminated by either the Fifth Chamber and/or the 10th Federal Court, and to what extent. If the Leniency Agreement is terminated, in whole or in part, as a result of any Plea Bargain Agreement being terminated, this may materially adversely affect the public perception or reputation of the J&F Group, including the Company, and could have a material adverse effect on the J&F Group's business, financial condition, results of operations and prospects. Furthermore, the termination of the Leniency Agreement may cause the termination of certain stabilization agreements entered into by JBS S.A. and certain of its subsidiaries, which would permit the lenders of the debt that is the subject to the terms of the stabilization agreements to accelerate their debt, which could have a material adverse effect on JBS S.A. and its subsidiaries (including the Company).
20.
MARKET RISKS AND CONCENTRATIONS
The Company’s financial instruments that are exposed to concentrations of credit risk consist primarily of cash equivalents, investment securities and trade accounts receivable. The Company’s cash equivalents and investment securities are high-quality debt and equity securities placed with major banks and financial institutions. The Company’s trade accounts receivable are generally unsecured. Credit evaluations are performed on all significant customers and updated as circumstances dictate. Concentrations of credit risk with respect to trade accounts receivable are limited due to the large number of customers and their dispersion across geographic areas. With the exception of one customer that accounts for approximately
4.9%
of trade accounts and other receivables at December 31, 2017, and approximately
5.9%
of net sales for 2017, the Company does not believe it has significant concentrations of credit risk in its trade accounts receivable.
As of December 31, 2017, we employed approximately
30,900
persons in the U.S., approximately
10,200
persons in Mexico and approximately
10,200
persons in the U.K. and Europe. Approximately
37.8%
of the Company’s employees were covered under collective bargaining agreements. Substantially all employees covered under collective bargaining agreements are covered under agreements that expire in 2018 or later. We have not experienced any labor-related work stoppage at any location in over
ten years
. We believe our relationship with our employees and union leadership is satisfactory. At any given time, we will likely be in some stage of contract negotiations with various collective bargaining units. In the absence of an agreement, we may become subject to labor disruption at one or more of these locations, which could have an adverse effect on our financial results.
At December 31, 2017, the aggregate carrying amount of net assets belonging to our Mexico and European operations was $
711.2 million
and $
1,367.7 million
, respectively. At December 25, 2016, the aggregate carrying amount of net assets belonging to our Mexico and European operations was
$673.0 million
and $
1,232.8 million
, respectively.
21.
BUSINESS SEGMENT AND GEOGRAPHIC REPORTING
We operate in
three
reportable business segments, U.S., U.K. and Europe, and Mexico. We measure segment profit as operating income. Corporate expenses are allocated to Mexico based upon various apportionment methods for specific expenditures incurred related thereto with the remaining amounts allocated to the U.S.
On September 8, 2017, we acquired Moy Park, one of the top-ten food companies in the U.K., Northern Ireland's largest private sector business and one of Europe's leading poultry producers, from JBS S.A. in a common-control transaction. Moy Park's results from operations subsequent to the common-control date of September 30, 2015 comprise the U.K. and Europe segment.
On January 6, 2017, the Company acquired GNP, a vertically integrated poultry business with locations in Minnesota and Wisconsin. GNP's results from operations subsequent to the acquisition date are included in the U.S. segment.
Net sales to customers by customer location and long-lived assets are as follows:
103
NOTES TO CONSOLIDATED AND COMBINED FINANCIAL STATEMENTS
|
December 31, 2017
|
December 25, 2016
|
December 28, 2015
|
||||||||||
|
(In thousands)
|
||||||||||||
|
Net sales
|
||||||||||||
|
United States
|
$
|
7,443,222
|
|
$
|
6,671,403
|
|
$
|
7,143,354
|
|
|||
|
U.K. and Europe
|
1,996,319
|
|
1,947,441
|
|
572,568
|
|
||||||
|
Mexico
|
1,328,322
|
|
1,259,720
|
|
1,036,750
|
|
||||||
|
Total
|
$
|
10,767,863
|
|
$
|
9,878,564
|
|
$
|
8,752,672
|
|
|||
|
December 31, 2017
|
December 25, 2016
|
December 28, 2015
|
||||||||||
|
(In thousands)
|
||||||||||||
|
Operating income
|
||||||||||||
|
United States
|
$
|
841,492
|
|
$
|
572,558
|
|
$
|
949,610
|
|
|||
|
U.K. and Europe
|
77,105
|
|
78,572
|
|
16,241
|
|
||||||
|
Mexico
|
153,631
|
|
140,857
|
|
95,186
|
|
||||||
|
Elimination
|
94
|
|
95
|
|
95
|
|
||||||
|
Total operating income
|
$
|
1,072,322
|
|
$
|
792,082
|
|
$
|
1,061,132
|
|
|||
|
Interest expense, net of capitalized interest
|
107,183
|
|
75,636
|
|
46,549
|
|
||||||
|
Interest income
|
(7,730
|
)
|
(2,301
|
)
|
(3,828
|
)
|
||||||
|
Foreign currency transaction gain
|
(2,659
|
)
|
4,055
|
|
26,148
|
|
||||||
|
Miscellaneous, net
|
(6,538
|
)
|
(9,344
|
)
|
(9,061
|
)
|
||||||
|
Income before income taxes
|
$
|
982,066
|
|
$
|
724,036
|
|
$
|
1,001,324
|
|
|||
|
December 31, 2017
|
December 25, 2016
|
December 28, 2015
|
||||||||||
|
(In thousands)
|
||||||||||||
|
Net sales to customers by customer location:
|
||||||||||||
|
United States
|
$
|
7,452,758
|
|
$
|
6,460,787
|
|
$
|
6,722,455
|
|
|||
|
Mexico
|
1,019,170
|
|
1,180,947
|
|
1,116,455
|
|
||||||
|
Asia
|
136,144
|
|
101,209
|
|
120,724
|
|
||||||
|
Canada, Caribbean and Central America
|
114,543
|
|
152,516
|
|
176,396
|
|
||||||
|
Africa
|
29,905
|
|
17,117
|
|
16,493
|
|
||||||
|
Europe
|
2,000,843
|
|
1,952,192
|
|
584,651
|
|
||||||
|
South America
|
13,279
|
|
11,955
|
|
12,114
|
|
||||||
|
Pacific
|
1,221
|
|
1,841
|
|
3,384
|
|
||||||
|
Total
|
$
|
10,767,863
|
|
$
|
9,878,564
|
|
$
|
8,752,672
|
|
|||
|
|
December 31, 2017
|
December 25, 2016
|
|||||
|
|
(In thousands)
|
||||||
|
Long-lived assets
(a)
:
|
|||||||
|
United States
|
$
|
1,437,220
|
|
$
|
1,220,263
|
|
|
|
U.K. and Europe
|
368,521
|
|
328,045
|
|
|||
|
Mexico
|
289,406
|
|
285,677
|
|
|||
|
Total
|
$
|
2,095,147
|
|
$
|
1,833,985
|
|
|
|
(a)
|
For this disclosure, we exclude financial instruments, deferred tax assets and intangible assets in accordance with ASC 280-10-50-41,
Segment Reporting
. Long-lived assets, as used in ASC 280-10-50-41, implies hard assets that cannot be readily removed.
|
104
NOTES TO CONSOLIDATED AND COMBINED FINANCIAL STATEMENTS
The following table sets forth, for the periods beginning with
2015
, net sales attributable to each of our primary product lines and markets served with those products. We based the table on our internal sales reports and their classification of product types.
|
2017
|
2016
|
2015
|
|||||||||
|
(In thousands)
|
|||||||||||
|
U.S. chicken:
|
|||||||||||
|
Fresh chicken
|
$
|
5,700,503
|
|
$
|
4,627,137
|
|
$
|
4,701,943
|
|
||
|
Prepared chicken
|
950,378
|
|
1,269,010
|
|
1,672,693
|
|
|||||
|
Export and other chicken
|
213,595
|
|
313,827
|
|
358,877
|
|
|||||
|
Total U.S. chicken
|
6,864,476
|
|
6,209,974
|
|
6,733,513
|
|
|||||
|
U.K. and Europe chicken:
|
|||||||||||
|
Fresh chicken
|
846,575
|
|
811,127
|
|
240,815
|
|
|||||
|
Prepared chicken
|
792,284
|
|
794,880
|
|
241,589
|
|
|||||
|
Export and other chicken
|
318,699
|
|
283,276
|
|
67,903
|
|
|||||
|
Total U.K. and Europe chicken
|
1,957,558
|
|
1,889,283
|
|
550,307
|
|
|||||
|
Mexico chicken
|
1,303,656
|
|
1,245,644
|
|
1,016,200
|
|
|||||
|
Total chicken
|
10,125,690
|
|
9,344,901
|
|
8,300,020
|
|
|||||
|
Other products:
|
|||||||||||
|
U.S.
|
578,746
|
|
461,429
|
|
409,841
|
|
|||||
|
U.K. and Europe
|
38,761
|
|
58,158
|
|
22,261
|
|
|||||
|
Mexico
|
24,666
|
|
14,076
|
|
20,550
|
|
|||||
|
Total other products
|
642,173
|
|
533,663
|
|
452,652
|
|
|||||
|
Total net sales
|
$
|
10,767,863
|
|
$
|
9,878,564
|
|
$
|
8,752,672
|
|
||
105
NOTES TO CONSOLIDATED AND COMBINED FINANCIAL STATEMENTS
22.
QUARTERLY RESULTS (UNAUDITED)
|
2017
|
First
(a)
|
Second
(b)
|
Third
(c)
|
Fourth
(d)
|
Year
|
|||||||||||||||
|
|
(In thousands, except per share data)
|
|||||||||||||||||||
|
Net sales
|
$
|
2,479,340
|
|
$
|
2,752,286
|
|
$
|
2,793,885
|
|
$
|
2,742,352
|
|
$
|
10,767,863
|
|
|||||
|
Gross profit
|
256,388
|
|
474,838
|
|
478,584
|
|
261,804
|
|
1,471,614
|
|
||||||||||
|
Net income attributable to PPC
common stockholders
|
93,921
|
|
233,641
|
|
232,680
|
|
134,337
|
|
694,579
|
|
||||||||||
|
Net income per share amounts -
basic
|
0.38
|
|
0.94
|
|
0.94
|
|
0.54
|
|
2.79
|
|
||||||||||
|
Net income per share amounts -
diluted
|
0.38
|
|
0.94
|
|
0.93
|
|
0.54
|
|
2.79
|
|
||||||||||
|
Number of days in period
|
91
|
|
91
|
|
91
|
|
98
|
|
371
|
|
||||||||||
|
2016
|
First
|
Second
|
Third
|
Fourth
(e)
|
Year
|
|||||||||||||||
|
(In thousands, except per share data)
|
||||||||||||||||||||
|
Net sales
|
$
|
2,460,410
|
|
$
|
2,551,990
|
|
$
|
2,495,281
|
|
$
|
2,370,883
|
|
$
|
9,878,564
|
|
|||||
|
Gross profit (loss)
|
284,257
|
|
337,796
|
|
253,060
|
|
228,870
|
|
1,103,983
|
|
||||||||||
|
Net income attributable to PPC
common stockholders |
118,371
|
|
152,886
|
|
98,657
|
|
70,618
|
|
440,532
|
|
||||||||||
|
Net income per share amounts -
basic |
0.46
|
|
0.60
|
|
0.39
|
|
0.29
|
|
1.74
|
|
||||||||||
|
Net income per share amounts -
diluted |
0.46
|
|
0.60
|
|
0.39
|
|
0.28
|
|
1.73
|
|
||||||||||
|
Number of days in period
|
91
|
|
91
|
|
91
|
|
91
|
|
364
|
|
||||||||||
|
2015
|
First
|
Second
(f)
|
Third
(g)
|
Fourth
(g)
|
Year
|
|||||||||||||||
|
(In thousands, except per share data)
|
||||||||||||||||||||
|
Net sales
|
$
|
2,052,919
|
|
$
|
2,053,876
|
|
$
|
2,112,529
|
|
$
|
2,533,348
|
|
$
|
8,752,672
|
|
|||||
|
Gross profit
|
377,120
|
|
432,020
|
|
284,544
|
|
205,040
|
|
1,298,724
|
|
||||||||||
|
Net income attributable to PPC
common stockholders |
204,215
|
|
241,489
|
|
137,062
|
|
63,148
|
|
645,914
|
|
||||||||||
|
Net income per share amounts -
basic |
0.79
|
|
0.93
|
|
0.53
|
|
0.25
|
|
2.50
|
|
||||||||||
|
Net income per share amounts -
diluted |
0.79
|
|
0.93
|
|
0.53
|
|
0.25
|
|
2.50
|
|
||||||||||
|
Number of days in period
|
91
|
|
91
|
|
91
|
|
91
|
|
364
|
|
||||||||||
|
(a)
|
In the first quarter of 2017, the company had transaction costs of approximately
$0.6 million
for the acquisition of GNP.
|
|
(b)
|
In the second quarter of 2017, the company recognized impairment charges of approximately
$3.5 million
related to our Athens, Alabama plant held for sale.
|
|
(c)
|
In the third quarter of 2017, the company had transaction costs of approximately
$15 million
for the acquisition of Moy Park.
|
|
(d)
|
In the fourth quarter of 2017, the company had transaction costs of approximately
$4.5 million
for the acquisition of Moy Park.
|
|
(e)
|
In the fourth quarter of 2016, the company recognized impairment charges of
$0.8 million
and
$0.3 million
related to our Dallas, Texas and Bossier City, Louisiana plants held for sale.
|
|
(f)
|
In the second quarter of 2015, the Company recognized impairment charges of
$4.8 million
related to our Dallas, Texas and Bossier City, Louisiana plants held for sale.
|
|
(g)
|
On June 29, 2015, the Company acquired, indirectly through certain of its Mexican subsidiaries,
100%
of the equity of Tyson Mexico from Tyson Foods, Inc. and certain of its subsidiaries. The results of operations of the acquired business since June 29, 2015 are included in the Company’s Consolidated and Combined Statements of Operations. Net sales generated by the acquired business during the third and fourth quarters of 2015 were
$128.9 million
and
$121.7 million
, respectively. The acquired business incurred net losses of
$2.9 million
and
$10.8 million
during the third and fourth quarters of 2015, respectively.
|
106
SCHEDULE II
PILGRIM’S PRIDE CORPORATION
VALUATION AND QUALIFYING ACCOUNTS
|
|
|
Additions
|
|
|
|
||||||||||||||||
|
|
Beginning
Balance
|
Charged to
Operating Results
|
Charged to
Other
Accounts
|
Deductions
|
|
Ending
Balance
|
|||||||||||||||
|
|
(In thousands)
|
||||||||||||||||||||
|
Trade Accounts and Other Receivables—
|
|||||||||||||||||||||
|
Allowance for Doubtful Accounts:
|
|||||||||||||||||||||
|
2017
|
$
|
6,661
|
|
$
|
2,683
|
|
$
|
339
|
|
$
|
1,538
|
|
(a)
|
$
|
8,145
|
|
|||||
|
2016
|
9,381
|
|
1,172
|
|
(452
|
)
|
3,440
|
|
(a)
|
6,661
|
|
||||||||||
|
2015
|
2,525
|
|
1,201
|
|
6,087
|
|
(d)
|
432
|
|
(a)
|
9,381
|
|
|||||||||
|
Trade Accounts and Other Receivables—
|
|||||||||||||||||||||
|
Allowance for Sales Adjustments:
|
|||||||||||||||||||||
|
2017
|
$
|
4,874
|
|
$
|
185,198
|
|
$
|
—
|
|
$
|
180,595
|
|
(b)
|
$
|
9,477
|
|
|||||
|
2016
|
5,662
|
|
199,423
|
|
—
|
|
200,211
|
|
(b)
|
4,874
|
|
||||||||||
|
2015
|
7,425
|
|
150,113
|
|
—
|
|
151,876
|
|
(b)
|
5,662
|
|
||||||||||
|
Deferred Tax Assets—
|
|||||||||||||||||||||
|
Valuation Allowance:
|
|||||||||||||||||||||
|
2017
|
$
|
25,611
|
|
$
|
—
|
|
$
|
—
|
|
$
|
(11,132
|
)
|
(c)
|
$
|
14,479
|
|
|||||
|
2016
|
27,300
|
|
—
|
|
—
|
|
(1,689
|
)
|
(c)
|
25,611
|
|
||||||||||
|
2015
|
9,150
|
|
—
|
|
19,379
|
|
(e)
|
(1,229
|
)
|
(c)
|
27,300
|
|
|||||||||
(a) Uncollectible accounts written off, net of recoveries.
(b) Deductions either written off, rebilled or reclassified as liabilities for market development fund rebates.
(c) Reductions in the valuation allowance.
(d) Allowance for doubtful accounts assumed with the acquisition of Moy Park.
(e) Valuation allowance assumed with the acquisition of Moy Park.
Item 9.
Changes in and Disagreements with Accountants on Accounting and Financial Disclosure
None.
Item 9A.
Controls and Procedures
Evaluation of Disclosure Controls and Procedures
As of
December 31, 2017
, an evaluation was performed under the supervision and with the participation of the Company’s management, including the Chief Executive Officer and Chief Financial Officer, of the effectiveness of the design and operation of the Company’s “disclosure controls and procedures” (as defined in Rules 13a-15(e) and 15d-15(e) under the Securities Exchange Act of 1934 (the “Exchange Act”)). Based on that evaluation, the Company’s management, including the Chief Executive Officer and Chief Financial Officer, concluded the Company’s disclosure controls and procedures were effective to ensure that information required to be disclosed by the Company in reports that it files or submits under the Exchange Act is recorded, processed, summarized and reported within the time periods specified in Securities and Exchange Commission rules and forms, and that information we are required to disclose in our reports filed with the Securities and Exchange Commission is accumulated and communicated to our management, including our Chief Executive Officer and Chief Financial Officer, as appropriate to allow timely decisions regarding required disclosure.
Changes in Internal Control Over Financial Reporting
In connection with the evaluation described above, the Company’s management, including the Chief Executive Officer and Chief Financial Officer, identified no changes in the Company’s internal control over financial reporting that occurred during the Company’s quarter ended
December 31, 2017
, and that has materially affected, or is reasonably likely to materially affect, the Company’s internal control over financial reporting.
107
On May 14, 2013, the Committee of Sponsoring Organizations of the Treadway Commission (COSO) published Internal Control-Integrated Framework (2013) (the “2013 Framework”) and related illustrative documents as an update to Internal Control-Integrated Framework (1992) (the “1992 Framework”). While the 2013 Framework’s internal control components (i.e., control environment, risk assessment, control activities, information and communication, and monitoring activities) are the same as those in the 1992 Framework, the 2013 Framework, among other matters, requires companies to assess whether 17 principles are present and functioning in determining whether their system of internal control is effective. The Company adopted the 2013 Framework during the fiscal year ending December 27, 2015.
Management’s Report on Internal Control over Financial Reporting
Pilgrim’s Pride Corporation’s (“PPC”) management is responsible for establishing and maintaining adequate internal control over financial reporting, as such term is defined in Exchange Act Rule 13a-15(f). PPC’s internal control is designed to provide reasonable assurance regarding the reliability of financial reporting and the preparation of financial statements in accordance with generally accepted accounting principles.
Under the supervision and with the participation of management, including its Chief Executive Officer and Chief Financial Officer, PPC's management assessed the design and operating effectiveness of internal control over financial reporting as of
December 31, 2017
based on the 2013 Framework. Based on this assessment, management concluded that PPC’s internal control over financial reporting was effective as of
December 31, 2017
. KPMG LLP, an independent registered public accounting firm, has issued an unqualified report on the effectiveness of the Company’s internal control over financial reporting as of
December 31, 2017
. That report is included in this Item 9A of this annual report.
The Company’s evaluation of internal control over financial reporting did not include the internal control of Moy Park which the Company acquired in the third quarter of 2017. The amount of total assets and revenue of Moy Park included in our Consolidated and Combined Financial statements as of and for the fifty-three weeks ended December 31, 2017 was
$2.2 billion
and
$2.0 billion
, respectively.
108
REPORT OF INDEPENDENT REGISTERED PUBLIC ACCOUNTING FIRM
The Stockholders and Board of Directors
Pilgrims Pride Corporation:
Opinion on Internal Control over Financial Reporting
We have audited Pilgrim’s Pride Corporation’s (the Company) internal control over financial reporting as of December 31, 2017, based on criteria established in
Internal Control - Integrated Framework (2013)
issued by the Committee of Sponsoring Organizations of the Treadway Commission
.
In our opinion, the Company maintained, in all material respects, effective internal control over financial reporting as of December 31, 2017, based on criteria established in
Internal Control - Integrated Framework (2013)
issued by the Committee of Sponsoring Organizations of the Treadway Commission.
We also have audited, in accordance with the standards of the Public Company Accounting Oversight Board (United States) (PCAOB), the consolidated and combined balance sheets of the Company as of December 31, 2017 and December 25, 2016, and the related combined and consolidated statements of income, comprehensive income, stockholders’ equity, and cash flows for the fifty-three weeks ended December 31, 2017, the fifty-two weeks ended December 25, 2016, and the fifty-two weeks ended December 27, 2015, and related notes and financial statement schedule II, and our report dated February 15, 2018 expressed an unqualified opinion on those consolidated and combined financial statements.
The Company acquired Granite Holdings Sàrl (Moy Park) during 2017, and management excluded from its assessment of the effectiveness of the Company’s internal control over financial reporting as of December 31, 2017, Moy Park’s internal control over financial reporting associated with total assets of $2.2 billion and total revenues of $2.0 billion included in the consolidated and combined financial statements of the Company as of and for the fifty-three weeks ended December 31, 2017. Our audit of internal control over financial reporting of the Company also excluded an evaluation of the internal control over financial reporting of Moy Park.
Basis for Opinion
The Company’s management is responsible for maintaining effective internal control over financial reporting and for its assessment of the effectiveness of internal control over financial reporting, included in the accompanying Management’s Report on Internal Control over Financial Reporting. Our responsibility is to express an opinion on the Company’s internal control over financial reporting based on our audit. We are a public accounting firm registered with the PCAOB and are required to be independent with respect to the Company in accordance with the U.S. federal securities laws and the applicable rules and regulations of the Securities and Exchange Commission and the PCAOB.
We conducted our audit in accordance with the standards of the PCAOB. Those standards require that we plan and perform the audit to obtain reasonable assurance about whether effective internal control over financial reporting was maintained in all material respects. Our audit of internal control over financial reporting included obtaining an understanding of internal control over financial reporting, assessing the risk that a material weakness exists, and testing and evaluating the design and operating effectiveness of internal control based on the assessed risk. Our audit also included performing such other procedures as we considered necessary in the circumstances. We believe that our audit provides a reasonable basis for our opinion.
Definition and Limitations of Internal Control over Financial Reporting
A company’s internal control over financial reporting is a process designed to provide reasonable assurance regarding the reliability of financial reporting and the preparation of financial statements for external purposes in accordance with generally accepted accounting principles. A company’s internal control over financial reporting includes those policies and procedures that (1) pertain to the maintenance of records that, in reasonable detail, accurately and fairly reflect the transactions and dispositions of the assets of the company; (2) provide reasonable assurance that transactions are recorded as necessary to permit preparation of financial statements in accordance with generally accepted accounting principles, and that receipts and expenditures of the company are being made only in accordance with authorizations of management and directors of the company; and (3) provide reasonable assurance regarding prevention or timely detection of unauthorized acquisition, use, or disposition of the company’s assets that could have a material effect on the financial statements.
109
Because of its inherent limitations, internal control over financial reporting may not prevent or detect misstatements. Also, projections of any evaluation of effectiveness to future periods are subject to the risk that controls may become inadequate because of changes in conditions, or that the degree of compliance with the policies or procedures may deteriorate.
/s/ KPMG LLP
Denver, Colorado
February 15, 2018
110
Item 10.
Directors and Executive Officers and Corporate Governance
Certain information regarding our executive officers has been presented under “Executive Officers” included in “Item 1. Business,” above.
Reference is made to the sections entitled “Security Ownership,” “Election of JBS Directors,” “Election of Equity Directors and the Founder Director,” “Section 16(a) Beneficial Ownership Reporting Compliance,” “Committees of the Board of Directors” and “Related Party Transactions” of the Company’s Proxy Statement for its 2018 Annual Meeting of Stockholders, which sections are incorporated herein by reference.
We have adopted a Code of Business Conduct and Ethics, which applies to all employees, including our Chief Executive Officer and our Chief Financial Officer and Principal Accounting Officer. The full text of our Code of Business Conduct and Ethics is published on our website, at www.pilgrims.com, under the “Investors-Corporate Governance” caption. We intend to disclose future amendments to, or waivers from, certain provisions of this Code on our website within four business days following the date of such amendment or waiver.
Item 11.
Executive Compensation
Reference is made to the sections entitled “Security Ownership,” “Section 16(a) Beneficial Ownership Reporting Compliance,” “2017 Director Compensation Table,” “Report of the Compensation Committee,” “Compensation Discussion and Analysis,” “Executive Compensation,” “Compensation Committee Interlocks and Insider Participation” and “Related Party Transactions” of the Company’s Proxy Statement for its 2018 Annual Meeting of Stockholders, which sections are incorporated herein by reference.
Item 12.
Security Ownership of Certain Beneficial Owners and Management and Related Stockholder Matters
Equity Compensation Plan Information
The following table provides certain information about our common stock that may be issued under the Long Term Incentive Plan (the “LTIP”), as of
December 31, 2017
. For additional information concerning terms of the LTIP, see “Note 15. Incentive Compensation” of our Consolidated and Combined Financial Statements included in this annual report.
|
Plan Category
|
Number of Securities to Be Issued Upon Exercise of Outstanding Options, Warrants and Rights
|
Weighted-Average Exercise Price of Outstanding Option, Warrants and Rights
|
Number of Securities Remaining Available for Future Issuance Under Equity Compensation Plans (Excluding Securities Reflected in the First Column)
|
||||||
|
Equity compensation plans approved by securities holders
|
—
|
|
—
|
|
4,825,825
|
|
|||
|
Equity compensation plans not approved by securities holders
|
—
|
|
—
|
|
—
|
|
|||
|
Total
|
—
|
|
—
|
|
4,825,825
|
|
|||
Reference is made to the section entitled “Security Ownership,” of the Company’s Proxy Statement for its 2018 Annual Meeting of Stockholders, which section is incorporated herein by reference.
Item 13.
Certain Relationships and Related Transactions, and Director Independence
Reference is made to the sections entitled “Corporate Governance” and “Related Party Transactions” of the Company’s Proxy Statement for its 2018 Annual Meeting of Stockholders, which sections are incorporated herein by reference.
Item 14.
Principal Accounting Fees and Services
The information required by this item is incorporated herein by reference from the section entitled “Independent Registered Public Accounting Firm Fee Information” of the Company’s Proxy Statement for its 2018 Annual Meeting of Stockholders.
111
|
(a)
|
Financial Statements
|
|
(1)
|
The financial statements and schedules listed in the index to financial statements and schedules on page 1 of this annual report are filed as part of this annual report.
|
|
(2)
|
All other schedules for which provision is made in the applicable accounting regulations of the Securities and Exchange Commission are not required under the related instructions or are not applicable and therefore have been omitted.
|
|
(3)
|
The financial statements schedule entitled “Valuation and Qualifying Accounts and Reserves” is filed as part of this annual report on page 85.
|
|
(b)
|
Exhibits
|
Exhibit Number
|
2.1
|
|
|
|
|
2.2
|
|
|
|
|
2.3
|
|
|
|
|
2.4
|
|
|
|
|
2.5
|
|
|
|
|
3.1
|
|
|
|
|
3.2
|
|
|
|
|
4.1
|
|
||
|
4.2
|
|
||
|
4.3
|
|
|
|
|
4.4
|
|
|
|
|
4.5
|
|
||
|
4.9
|
|
|
|
|
4.10
|
|
|
|
112
|
4.11
|
|
|
|
|
10.1
|
|
|
|
|
10.2
|
|
|
|
|
10.3
|
|
||
|
10.4
|
|
||
|
10.5
|
|
||
|
10.6
|
|
|
|
|
10.7
|
|
||
|
10.8
|
|
||
|
10.9
|
|
||
|
10.10
|
|
||
|
10.11
|
|
||
|
10.12
|
|
||
|
10.13
|
|
||
|
10.14
|
|
||
|
10.15
|
|
||
113
|
10.16
|
|
||
|
10.17
|
|
||
|
10.18
|
|
||
|
10.19
|
|
||
|
10.20
|
|
|
|
|
10.21
|
|
||
|
12
|
|
|
|
|
21
|
|
||
|
23.1
|
|
||
|
31.1
|
|
||
|
31.2
|
|
||
|
32.1
|
|
|
|
|
32.2
|
|
|
|
|
101.INS
|
|
XBRL Instance Document
|
|
|
101.SCH
|
|
XBRL Taxonomy Extension Schema
|
|
|
101.CAL
|
|
XBRL Taxonomy Extension Calculation
|
|
|
101.DEF
|
|
XBRL Taxonomy Extension Definition
|
|
|
101.LAB
|
|
XBRL Taxonomy Extension Label
|
|
|
101.PRE
|
|
XBRL Taxonomy Extension Presentation
|
|
|
*
|
|
Filed herewith
|
|
|
||
|
**
|
Furnished herewith
|
|
|
|
||
|
†
|
Represents a management contract or compensation plan arrangement
|
|
114
SIGNATURES
Pursuant to the requirements of Section 13 or 15(d) the Securities Exchange Act of 1934, the Registrant has duly caused this report to be signed on its behalf by the undersigned, thereunto duly authorized, on
February 14, 2018
.
|
PILGRIM’S PRIDE CORPORATION
|
||
|
By:
|
/s/ Fabio Sandri
|
|
|
Fabio Sandri
|
||
|
Chief Financial Officer
|
||
Pursuant to the requirements of the Securities Exchange Act of 1934, this report has been signed below by the following persons on behalf of the Registrant and in the capacities and on the date indicated.
|
Signature
|
|
Title
|
|
Date
|
|
/s/ Gilberto Tomazoni
|
|
Chairman of the Board
|
|
February 14, 2018
|
|
Gilberto Tomazoni
|
||||
|
|
|
|||
|
/s/ William W. Lovette
|
President and Chief Executive Officer
|
February 14, 2018
|
||
|
William W. Lovette
|
(Principal Executive Officer)
|
|||
|
|
Chief Financial Officer
|
|
||
|
/s/ Fabio Sandri
|
(Principal Financial Officer and
|
February 14, 2018
|
||
|
Fabio Sandri
|
Principal Accounting Officer)
|
|||
|
/s/ David E. Bell
|
|
Director
|
|
February 14, 2018
|
|
David E. Bell
|
||||
|
/s/ Michael L. Cooper
|
|
Director
|
|
February 14, 2018
|
|
Michael L. Cooper
|
||||
|
/s/ Wallim Cruz de Vasconcellos Junior
|
|
Director
|
|
February 14, 2018
|
|
Wallim Cruz de Vasconcellos Junior
|
||||
|
|
Director
|
|
February 14, 2018
|
|
|
Charles Macaluso
|
||||
|
/s/ Denilson Molina
|
|
Director
|
|
February 14, 2018
|
|
Denilson Molina
|
||||
|
/s/ Andre Nogueira de Souza
|
|
Director
|
|
February 14, 2018
|
|
Andre Nogueira de Souza
|
||||
115
TABLE OF CONTENTS
Part IItem 1. BusinessItem 1A. Risk FactorsItem 1B. Unresolved Staff CommentsItem 2. PropertiesItem 3. Legal ProceedingsItem 4. Mine Safety DisclosuresPart IIItem 5. Market For The Registrant S Common Equity, Related Stockholder Matters and Issuer Purchases Of Equity SecuritiesItem 6. Selected Financial DataItem 7. Management S Discussion and Analysis Of Financial Condition and Results Of OperationsItem 7A. Quantitative and Qualitative Disclosures About Market RiskItem 8. Financial Statements and Supplementary DataItem 9. Changes in and Disagreements with Accountants on Accounting and Financial DisclosureItem 9A. Controls and ProceduresPart IIIItem 10. Directors and Executive Officers and Corporate GovernanceItem 11. Executive CompensationItem 12. Security Ownership Of Certain Beneficial Owners and Management and Related Stockholder MattersItem 13. Certain Relationships and Related Transactions, and Director IndependenceItem 14. Principal Accounting Fees and ServicesPart IVItem 15. Exhibits and Financial Statement Schedules