PROASSURANCE CORP
10-Ks and 10-Qs
|
|
|
|
|
|
|
|
|
|
|
|
|
|
|
|
|
|
|
|
|
|
|
|
|
|
|
|
|
|
|
|
|
|
|
|
|
|
|
|
|
|
|
|
|
|
|
|
|
|
United States
Securities and Exchange Commission
Washington, D.C. 20549
FORM 10-K
(Mark One)
|
ý
|
Annual report pursuant to section 13 or 15(d) of the Securities Exchange Act of 1934 [Fee Required]
|
for the fiscal year ended
December 31, 2014
,
or
|
¨
|
Transition report pursuant to section 13 or 15(d) of the Securities Exchange Act of 1934 [No Fee Required]
|
for the transition period from to .
Commission file number: 001-16533
ProAssurance Corporation
(Exact name of registrant as specified in its charter)
|
Delaware
|
|
63-1261433
|
|
(State of
incorporation or organization)
|
|
(I.R.S. Employer
Identification No.)
|
|
100 Brookwood Place,
Birmingham, AL
|
|
35209
|
|
(Address of principal executive offices)
|
|
(Zip Code)
|
(205) 877-4400
(Registrant’s Telephone Number, Including Area Code)
Securities registered pursuant to Section 12(b) of the Act:
|
Title of Each Class
|
|
Name of Each Exchange On Which Registered
|
|
Common Stock, par value $0.01 per share
|
|
New York Stock Exchange
|
Securities registered pursuant to Section 12(g) of the Act:
None.
Indicate by check mark if the registrant is a well-known seasoned issuer, as defined in Rule 405 of the Securities Act. Yes
ý
No
¨
Indicate by check mark if the registrant is not required to file reports pursuant to Section 13 or Section 15(d) of the Act. Yes
¨
No
ý
Indicate by check mark whether the registrant (1) has filed all reports required to be filed by Section 13 or 15(d) of the Securities Exchange Act of 1934 during the preceding 12 months (or for such shorter period that the registrant was required to file such reports), and (2) has been subject to such filing requirements for the past 90 days. Yes
ý
No
¨
Indicate by check mark whether the registrant has submitted electronically and posted on its corporate web site, if any, every Interactive Data File required to be submitted and posted pursuant to Rule 405 of Regulation S-T (§232.405 of this chapter) during the preceding 12 months (or for such shorter period that the registrant was required to submit and post such files). Yes
ý
No
¨
Indicate by check mark if disclosure of delinquent filers pursuant to Item 405 of Regulation S-K (§229.405) is not contained herein, and will not be contained, to the best of registrant’s knowledge, in definitive proxy or information statements incorporated by reference in Part III of this Form 10-K or any amendment to this Form 10-K.
¨
Indicate by check mark whether the registrant is a large accelerated filer, an accelerated filer, a non-accelerated filer, or a smaller reporting company. See the definitions of “large accelerated filer,” “accelerated filer” and “smaller reporting company” in Rule 12b-2 of the Exchange Act. (Check one):
|
Large accelerated filer
|
|
ý
|
|
Accelerated filer
|
|
¨
|
|
Non-accelerated filer
|
|
¨
(Do not check if a smaller reporting company)
|
|
Smaller reporting company
|
|
¨
|
Indicate by check mark whether the registrant is a shell company (as defined in Rule 12b-2 of the Act). Yes
¨
No
ý
The aggregate market value of voting stock held by non-affiliates of the registrant at
June 30, 2014
was
$2,557,238,513
.
As of
February 20, 2015
, the registrant had outstanding approximately
55,814,475
shares of its common stock.
1
|
TABLE OF CONTENTS
|
||
2
Documents incorporated by reference in this Form 10-K
|
(i)
|
The definitive proxy statement for the
2015
Annual Meeting of the Stockholders of ProAssurance Corporation (File No. 001-16533) is incorporated by reference into Part III of this report.
|
General Information
Throughout this report, references to ProAssurance, “we”, “us”, “our” or "the Company" refer to ProAssurance Corporation and its consolidated subsidiaries. Also, as ProAssurance is an insurance holding company and certain terms and phrases common to the insurance industry are used in this report that carry special and specific meanings, we encourage you to read the Glossary of Selected Insurance and Related Financial Terms posted on the Supplemental Information page of our website (www.ProAssurance.com/InvestorRelations/supplemental.aspx).
Caution Regarding Forward-Looking Statements
Any statements in this Form 10-K that are not historical facts are specifically identified as forward-looking statements. These statements are based upon our estimates and anticipation of future events and are subject to certain risks and uncertainties that could cause actual results to vary materially from the expected results described in the forward-looking statements. Forward-looking statements are identified by words such as, but not limited to, "anticipate," "believe," "estimate," "expect," "hope," "hopeful," "intend," "likely," "may," "optimistic," "possible," "potential," "preliminary," "project," "should," "will" and other analogous expressions. There are numerous factors that could cause our actual results to differ materially from those in the forward-looking statements. Thus, sentences and phrases that we use to convey our view of future events and trends are expressly designated as forward-looking statements as are sections of this Form 10-K that are identified as giving our outlook on future business.
Forward-looking statements relating to our business include among other things: statements concerning future liquidity and capital requirements, investment valuation and performance, return on equity, financial ratios, net income, premiums, losses and loss reserve, premium rates and retention of current business, competition and market conditions, the expansion of product lines, the development or acquisition of business in new geographical areas, the availability of acceptable reinsurance, actions by regulators and rating agencies, court actions, legislative actions, payment or performance of obligations under indebtedness, payment of dividends, and other matters.
These forward-looking statements are subject to significant risks, assumptions and uncertainties, including, among other things, the following factors that could affect the actual outcome of future events:
|
Ÿ
|
changes in general economic conditions, including the impact of inflation or deflation and unemployment;
|
|
Ÿ
|
our ability to maintain our dividend payments;
|
|
Ÿ
|
regulatory, legislative and judicial actions or decisions that could affect our business plans or operations;
|
|
Ÿ
|
the enactment or repeal of tort reforms;
|
|
Ÿ
|
formation or dissolution of state-sponsored insurance entities providing coverages now offered by ProAssurance which could remove or add sizable numbers of insureds from or to the private insurance market;
|
|
Ÿ
|
changes in the interest rate environment;
|
|
Ÿ
|
changes in U.S. laws or government regulations regarding financial markets or market activity that may affect the U.S. economy and our business;
|
|
Ÿ
|
changes in the ability of the U.S. government to meet its obligations that may affect the U.S. economy and our business;
|
|
Ÿ
|
performance of financial markets affecting the fair value of our investments or making it difficult to determine the value of our investments;
|
|
Ÿ
|
changes in requirements or accounting policies and practices that may be adopted by our regulatory agencies, the Financial Accounting Standards Board, the Securities and Exchange Commission (SEC), the Public Company Accounting Oversight Board, or the New York Stock Exchange (NYSE) and that may affect our business;
|
|
Ÿ
|
changes in laws or government regulations affecting the financial services industry, the property and casualty insurance industry or particular insurance lines underwritten by our subsidiaries;
|
|
Ÿ
|
the effect on our insureds, particularly the insurance needs of our insureds, and our loss costs, of changes in the healthcare delivery system, including changes attributable to the Patient Protection and Affordable Care Act (the Affordable Care Act);
|
3
|
Ÿ
|
consolidation of our insureds into or under larger entities which may not have a risk profile that meets our underwriting criteria or which may not use external providers for insuring or otherwise managing substantial portions of their liability risk;
|
|
Ÿ
|
uncertainties inherent in the estimate of our loss and loss adjustment expense reserve and reinsurance recoverable;
|
|
Ÿ
|
changes in the availability, cost, quality, or collectability of insurance/reinsurance;
|
|
Ÿ
|
the results of litigation, including pre- or post-trial motions, trials and/or appeals we undertake;
|
|
Ÿ
|
allegations of bad faith which may arise from our handling of any particular claim, including failure to settle;
|
|
Ÿ
|
loss or consolidation of independent agents, agencies, brokers, or brokerage firms;
|
|
Ÿ
|
changes in our organization, compensation and benefit plans;
|
|
Ÿ
|
changes in the business or competitive environment may limit the effectiveness of our business strategy and impact our revenues;
|
|
Ÿ
|
our ability to retain and recruit senior management;
|
|
Ÿ
|
the availability, integrity and security of our technology infrastructure;
|
|
Ÿ
|
the impact of a catastrophic event, as it relates to both our operations and our insured risks;
|
|
Ÿ
|
the impact of acts of terrorism and acts of war;
|
|
Ÿ
|
the effects of terrorism related insurance legislation and laws;
|
|
Ÿ
|
assessments from guaranty funds;
|
|
Ÿ
|
our ability to achieve continued growth through expansion into other states or through acquisitions or business combinations;
|
|
Ÿ
|
changes to the ratings assigned by rating agencies to our insurance subsidiaries, individually or as a group;
|
|
Ÿ
|
provisions in our charter documents, Delaware law and state insurance laws may impede attempts to replace or remove management or may impede a takeover;
|
|
Ÿ
|
state insurance restrictions may prohibit assets held by our insurance subsidiaries, including cash and investment securities, from being used for general corporate purposes;
|
|
Ÿ
|
taxing authorities can take exception to our tax positions and cause us to incur significant amounts of legal and accounting costs and, if our defense is not successful, additional tax costs, including interest and penalties; and
|
|
Ÿ
|
expected benefits from completed and proposed acquisitions may not be achieved or may be delayed longer than expected due to business disruption; loss of customers, employees and key agents; increased operating costs or inability to achieve cost savings; and assumption of greater than expected liabilities, among other reasons.
|
|
Additional risks that could arise from our membership in the Lloyd's of London market (Lloyd's) and our participation in Lloyd's Syndicate 1729 (Syndicate 1729) include, but are not limited to, the following:
|
|
|
Ÿ
|
members of Lloyd's are subject to levies by the Council of Lloyd's based on a percentage of the member's underwriting capacity, currently a maximum of 3%, but can be increased by Lloyd's;
|
|
Ÿ
|
Syndicate operating results can be affected by decisions made by the Council of Lloyd's over which the management of Syndicate 1729 has little ability to control, such as a decision to not approve the business plan of the Syndicate, or a decision to increase the capital required to continue operations, and by our obligation to pay levies to Lloyd's;
|
|
Ÿ
|
Lloyd's insurance and reinsurance relationships and distribution channels could be disrupted or Lloyd's trading licenses could be revoked making it more difficult for Syndicate 1729 to distribute and market its products; and
|
|
Ÿ
|
rating agencies could downgrade their ratings of Lloyd's as a whole.
|
Our results may differ materially from those we expect and discuss in any forward-looking statements. The principal risk factors that may cause these differences are described in “Item 1A, Risk Factors” in this report.
We caution readers not to place undue reliance on any such forward-looking statements, which are based upon conditions existing only as of the date made, and advise readers that these factors could affect our financial performance and could cause actual results for future periods to differ materially from any opinions or statements expressed with respect to future periods in any current statements. Except as required by law or regulations, we do not undertake and specifically decline any obligation to publicly release the result of any revisions that may be made to any forward-looking statements to reflect events or circumstances after the date of such statements or to reflect the occurrence of anticipated or unanticipated events.
4
Overview
ProAssurance Corporation is a holding company for property and casualty insurance companies. For the year ended
December 31, 2014
, our net premiums written totaled
$701.8 million
, and at
December 31, 2014
we had total assets of
$5.2 billion
and
$2.2 billion
of shareholders' equity. We seek to be a strong and trusted partner, helping our customers to confront uncertainty through innovative loss transfer and loss mitigation solutions for liability risks. Our emphasis is on healthcare, but we also serve other types of insureds. Our wholly owned insurance subsidiaries provide professional liability insurance for healthcare professionals and facilities, professional liability insurance for attorneys, liability insurance for medical technology and life sciences risks, workers' compensation insurance, and we are the majority capital provider for Lloyd's of London Syndicate 1729, which writes a range of property and casualty insurance and reinsurance lines.
Our executive offices are located at 100 Brookwood Place, Birmingham, Alabama 35209 and our telephone number is (205) 877-4400. Our stock trades on the NYSE under the symbol “PRA.” Our website is www.ProAssurance.com and we maintain a dedicated Investor Relations section on that website (www.ProAssurance.com/InvestorRelations) to provide specialized resources for investors and others seeking to learn more about us.
As part of our disclosure through the Investor Relations section of our website, we publish our annual report on Form 10-K, our quarterly reports on Form 10-Q, and our current reports on Form 8-K and all other public SEC filings as soon as reasonably practical after filing with the SEC on its EDGAR system. These SEC filings can be found on our website at www.ProAssurance.com/InvestorRelations/reports_filings.aspx. This section also includes information regarding stock trading by corporate insiders by providing access to SEC Forms 3, 4 and 5 when they are filed with the SEC. In addition to federal filings on our website, we make available other documents that provide important additional information about our financial condition and operations. Documents available on our website include the financial statements we file with state regulators (compiled under Statutory Accounting Principles as required by regulation), news releases that we issue, a listing of our investment holdings, and certain investor presentations. The Governance section of our website provides copies of the charters for our governing committees and many of our governing policies. Printed copies of these documents may be obtained from Frank O’Neil, Senior Vice President, ProAssurance Corporation, either by mail at P.O. Box 590009, Birmingham, Alabama 35259-0009, or by telephone at (205) 877-4400 or (800) 282-6242.
Our History
We were incorporated in Delaware in 2001 as the successor to Medical Assurance, Inc. in conjunction with its merger with Professionals Group, Inc. ProAssurance has a history of growth through acquisitions. Acquisitions completed in the most recent five years include:
|
•
|
American Physicians Service Group, Inc. and subsidiaries, (APS), acquired November 30, 2010,
|
|
•
|
Independent Nevada Doctors Insurance Exchange, (IND), acquired November 30, 2012,
|
|
•
|
Medmarc Mutual Insurance Company and subsidiaries, (Medmarc), acquired January 1, 2013, and
|
|
•
|
Eastern Insurance Holdings, Inc., (Eastern), acquired January 1, 2014.
|
We provided the majority of the capital for Syndicate 1729 in November 2013, and Syndicate 1729 began active operations effective January 1, 2014.
Our Strategy
Our business objectives are to generate attractive returns on equity and book value per share growth for our shareholders. The basic components of our strategy for achieving these objectives are as follows:
|
•
|
Serve a broad spectrum of the healthcare market, providing specialized expertise to meet evolving demands
. In addition to providing traditional products to healthcare providers in a number of professions, we are also leveraging our reach, expertise and financial strength to provide innovative and customized products to meet the risk management needs of larger organizations or groups.
|
|
•
|
Effectively manage capital.
We carefully monitor use of our capital, and consider various options for capital deployment, such as business expansion by our existing subsidiaries, opportunities that arise for mergers or acquisitions, share repurchases and payment of dividends.
|
|
•
|
Pursue profitable underwriting opportunities.
We emphasize profitability, not market share. Key elements of our approach are prudent risk selection using established underwriting guidelines, appropriate pricing and adjusting our business mix as appropriate to effectively utilize capital and achieve market synergies.
|
5
|
•
|
Emphasize risk management.
We seek to reduce risk at the corporate level by actively managing our enterprise risk and by maintaining strong internal controls. We also emphasize the importance of risk management to our insureds and offer training in the use of risk reduction tools and techniques.
|
|
•
|
Manage claims effectively.
Our experienced claims teams have industry and insurance expertise that, with our extensive local knowledge, allows us to resolve claims in an effective manner, considering the circumstances of each claim. When practical, we utilize formalized claims management processes and protocols as a means of reducing claim costs.
|
|
•
|
Provide superior customer service.
Our mission statement, We Exist to Protect Others, goes hand-in-hand with our corporate motto, "Treated Fairly." Our employees demonstrate our core values of integrity, respect, involvement of our insureds, collaboration, communication and enthusiasm every day and are focused on meeting the needs of our customers.
|
|
•
|
Maintain a conservative investment strategy.
We believe that we follow a conservative investment strategy designed to emphasize the preservation of our capital and provide adequate liquidity for the prompt payment of claims. Our investment portfolio consists primarily of investment-grade, fixed-maturity securities of short-to medium-term duration.
|
|
•
|
Maintain financial stability
. We are committed to maintaining claims paying ratings of "A" or better.
|
Organization and Segment Information
We operate through multiple insurance organizations and report our operating results in four segments, as follows:
|
•
|
Specialty Property and Casualty Segment
- This segment includes our professional liability business and our medical technology and life sciences business.
|
|
•
|
Workers' Compensation Segment
- This segment includes our workers' compensation business which we provide for employers, groups and associations.
|
|
•
|
Lloyd's Syndicate Segment
- This segment includes operating results from our participation in Lloyd's Syndicate 1729.
|
|
•
|
Corporate Segment -
This segment includes our investing operations managed at the corporate level, non-premium revenues generated outside of our insurance entities, and corporate expenses, including interest and U. S. income taxes.
|
Gross Premiums Written
Gross premiums written for the years ended
December 31, 2014
,
2013
and
2012
were comprised as follows:
|
Year Ended December 31
|
|||||||||||||||||
|
($ in thousands)
|
2014
|
2013
|
2012
|
||||||||||||||
|
Professional liability:
|
|||||||||||||||||
|
Healthcare related (1) (2)
|
$
|
449,115
|
|
58
|
%
|
$
|
483,494
|
|
85
|
%
|
$
|
488,261
|
|
91
|
%
|
||
|
Legal professionals
|
27,776
|
|
4
|
%
|
27,060
|
|
5
|
%
|
17,146
|
|
3
|
%
|
|||||
|
Medical technology and life sciences products liability
|
35,265
|
|
5
|
%
|
34,190
|
|
6
|
%
|
—
|
|
—
|
%
|
|||||
|
Workers' compensation
|
225,363
|
|
29
|
%
|
—
|
|
—
|
%
|
—
|
|
—
|
%
|
|||||
|
Syndicate 1729: (3)
|
|||||||||||||||||
|
Casualty
|
21,703
|
|
3
|
%
|
—
|
|
—
|
%
|
—
|
|
—
|
%
|
|||||
|
Property
|
6,110
|
|
1
|
%
|
—
|
|
—
|
%
|
—
|
|
—
|
%
|
|||||
|
Catastrophe
|
5,918
|
|
1
|
%
|
—
|
|
—
|
%
|
—
|
|
—
|
%
|
|||||
|
All other, primarily tail
|
20,452
|
|
3
|
%
|
22,803
|
|
4
|
%
|
31,024
|
|
6
|
%
|
|||||
|
Inter-segment revenues (2)
|
(12,093
|
)
|
(2
|
%)
|
—
|
|
—
|
%
|
—
|
|
—
|
%
|
|||||
|
Total
|
$
|
779,609
|
|
100
|
%
|
$
|
567,547
|
|
100
|
%
|
$
|
536,431
|
|
100
|
%
|
||
(1) Primarily comprised of one-year term policies, but includes premium related to policies with a two-year term of
$19.9 million
in
2014
,
$25.6 million
in
2013
and
$13.1 million
in
2012
.
|
(2)
|
In 2014, Lloyd's Syndicate 1729 casualty premiums included
$12.1 million
of healthcare related premiums assumed from our Specialty P&C segment. The assumption was eliminated on a consolidated basis.
|
|
(3)
|
Attributable to our 58% share of premiums written by Syndicate 1729.
|
6
Prior to the acquisition of Medmarc on January 1, 2013 we did not have any medical technology and life sciences products liability premium. Prior to the acquisition of Eastern and the commencement of Syndicate 1729 operations on January 1, 2014 we did not write any significant amounts of workers' compensation premium. Additional detailed information regarding premium by individual product type within each of our insurance segments is provided in Item 7, Management's Discussion and Analysis, Results of Operations, under the heading "Premiums Written".
Prior to 2014, substantially all of our insurance exposures were within the United States. As a result of our participation in Syndicate 1729, approximately
$1.9 million
of our
2014
premium written is related to insurance exposures that were outside of the United States, see segment discussion below.
Specialty Property and Casualty Segment
Professional Liability Insurance
Our professional liability business is primarily focused on providing professional liability insurance to healthcare providers. We target the full spectrum of the healthcare professional liability market, covering multiple categories of healthcare professionals and healthcare entities, including hospitals and other healthcare facilities. While most of our business is written in the standard market, we also offer professional liability insurance on an excess and surplus lines basis, and we offer alternative risk and self-insurance products on a custom basis. We also provide professional liability coverage to attorneys, but this is a less significant portion of our business, accounting for approximately
4%
of our
2014
gross premiums written. We are licensed to do business in every state.
We utilize independent agencies and brokers as well as an internal sales force to write our healthcare professional liability (HCPL) business. For the year ended
December 31, 2014
approximately
63%
of our healthcare professional liability gross premiums written were produced through independent insurance agencies or brokers. The agencies and brokers we use typically sell through professional liability insurance specialists who are able to convey the factors that differentiate our professional liability insurance products. In
2014
, our ten largest agencies, brokers or brokerage agencies produced approximately
24%
of our healthcare related professional liability premium; individually, no one agency produced more than
10%
of our healthcare related professional liability premium.
In marketing our professional liability products we emphasize our financial strength, product flexibility, excellent claims and underwriting services, and risk resource services. We market our insurance products through our direct sales force and through our agents, as well as direct mailings, and advertising in industry-related publications. We also are involved in professional societies and related organizations and support legislation that will have a positive effect on healthcare and legal liability issues. We maintain regional underwriting centers which permit us to consistently provide a high level of customer service to both small and large accounts.
We maintain claim processing centers where our internal claims personnel investigate and monitor the processing of our professional liability claims. We engage experienced, independent litigation attorneys in each venue to assist with the claims process as we believe this practice aids us in providing a defense that is aggressive, effective and cost-efficient. We evaluate the merit of each claim and determine the appropriate strategy for resolution of the claim, either seeking a reasonable good faith settlement appropriate for the circumstance of the claim or aggressively defending the claim. As part of the evaluation and preparation process for healthcare professional liability claims, we meet regularly with medical advisory committees in our key markets to examine claims, attempt to identify potentially troubling practice patterns and make recommendations to our staff.
Medical Technology and Life Sciences Insurance
Our Medical Technology and Life Sciences business, acquired January 1, 2013 through the acquisition of Medmarc, offers products liability insurance for medical technology and life sciences companies that manufacture or distribute products that are almost all regulated by the United States Food and Drug Administration. Products insured include imaging and non-invasive diagnostic medical devices, orthopedic implants, pharmaceuticals, clinical lab instruments, medical instruments, dental products, and animal pharmaceuticals and medical devices. We also provide coverage for clinical trials and contract manufacturers.
Underwriting decisions for our products liability coverages consider the type of risk, the amount of coverage being sought, the expertise and experience of the applicant, and the expected volume of product sales. Close to 100% of our products liability business is written through independent brokers. In
2014
, our top ten brokers generated approximately
44%
of our medical technology and life sciences gross written premium, with no one agent representing more than
12%
. We do not appoint agents for our products liability business.
Our products liability claims are centrally processed in Chantilly, Virginia. We strongly defend these claims, with a negotiated settlement being the most frequent means of resolution.
7
Workers' Compensation Segment
Effective January 1, 2014 ProAssurance acquired Eastern, which offers workers' compensation products in the Mid-Atlantic (primarily in Pennsylvania), Southeast, and Midwest regions of the continental United States. Our workers' compensation business consists of two major business activities:
|
•
|
Traditional workers' compensation insurance coverages provided to employers, generally those with 1,000 employees or less. Types of policies offered include guaranteed cost policies, policyholder dividend policies, retrospectively-rated policies, and deductible policies.
|
|
•
|
Alternative market workers’ compensation solutions provided to individual companies, groups and associations whereby the policy written is 100% reinsured though a reinsurance entity owned by or related to the policyholder. Most often this reinsurance entity is a segregated portfolio cell (SPC) operated through Eastern Re Ltd., SPC (Eastern Re), our subsidiary domiciled in the Cayman Islands. Each SPC is owned, fully or in part, by the policyholder or affiliates of the policyholder, hereafter referred to as cell participants. The SPC is operated solely for the benefit of cell participants of that particular cell, and the pool of assets of one segregated portfolio cell are statutorily protected from the creditors of any other SPC. The underwriting results and investment income of the segregated portfolio cells are shared with the cell participants in accordance with the terms of the cell agreements. We are a partial owner in selected SPCs and receive a share of the earnings of these SPCs. We generally hold a 50% participation, but our interest ranges from 25% to 82.5%. Our share of SPC profits for the year ended
December 31, 2014
was approximately
27%
.
|
Both groups of workers' compensation products are distributed through a group of appointed independent agents.
We utilize an individual account underwriting strategy for our workers' compensation business that is focused on selecting quality accounts. The goal of our workers’ compensation underwriters is to select a diverse book of business with respect to risk classification, hazard level and geographic location. We target accounts with strong return to work and safety programs in low to middle hazard levels such as clerical office, light manufacturing, healthcare, auto dealers and service industries and maintain a strong risk management unit in order to better serve our customers' needs.
We actively seek to reduce our workers' compensation loss costs by placing a concentrated focus on returning injured workers to work as quickly as possible. We emphasize early intervention and aggressive disability management, utilizing in-house and third-party specialists for case management, including medical cost management. Strategic vendor relationships have been established to reduce medical claim costs and include preferred provider, physical therapy, prescription drug, and catastrophic medical services.
Lloyd's Syndicate Segment
We are the majority (
58%
) capital provider to Lloyd's of London Syndicate 1729, which began writing business as of January 1, 2014. The remaining capital for Syndicate 1729 is provided by unrelated third parties, including private names and other corporate members. We have committed capital of
£50.2 million
(approximately
$78.2 million
at
December 31, 2014
) for the Syndicate's
2015
underwriting year and have a total capital commitment through 2019 of up to $200 million. Syndicate 1729 covers a range of property and casualty insurance and reinsurance lines, and has a maximum underwriting capacity of
£75.0 million
(approximately
$116.8 million
at
December 31, 2014
) for the
2015
underwriting year, of which
£43.2 million
(approximately
$67.2 million
at
December 31, 2014
) is our allocated underwriting capacity as a corporate member.
Corporate Segment
We manage our investments at the corporate level and we apply a consistent management strategy to the entire portfolio. Accordingly, we report our investment results and net realized investment gains and losses within our corporate segment. Our corporate segment also includes non-premium revenues generated outside of our insurance entities, and corporate expenses, including interest expense and U. S. income taxes. Our overall investment strategy is to maximize current income from our investment portfolio while maintaining safety, liquidity, duration targets and portfolio diversification. The portfolio is generally managed by professional third party asset managers whose results we monitor and evaluate. The asset managers typically have the authority to make investment decisions within the asset classes they are responsible for managing, subject to our investment policy and oversight, including a requirement that securities in a loss position cannot be sold without specific authorization from us. See Note 4 of the Notes to Consolidated Financial Statements for more information on our investments.
Competition
The marketplace for all our lines of business includes many insurers and is very competitive. Within the U. S. our competitors are primarily domestic and range from large national insurers whose financial strength and resources may be greater than ours to smaller insurance entities that concentrate on a single state and as a result have an extensive knowledge of the local markets. Additionally, there are many providers, domestic and international, of alternative risk management solutions. Syndicate 1729, which is based in the U.K., faces significant competition from other Lloyd's syndicates as well as other
8
international and domestic insurance firms operating in the country of the insured. Competitive distinctions include pricing, size, name recognition, service quality, market commitment, market conditions, breadth and flexibility of coverage, method of sale, financial stability, ratings assigned by rating agencies and regulatory conditions.
The healthcare market is the largest industry segment that we serve and the changing healthcare environment within the U. S. presents us with both competitive challenges and opportunities. Many physicians now practice as employees of larger healthcare entities. Further, healthcare services are increasingly being provided by professionals other than physicians and outside of a traditional hospital or clinic setting. Such trends are widely expected to continue. Larger healthcare entities have differing customer service and risk management needs than the traditional solo or small physician group. Larger entities are more likely to combine risks such as workers' compensation and professional liability when purchasing insurance and are also more likely to manage all or a part of their risk through alternative insurance mechanisms. We have addressed these issues by refining our existing hospital/physician insurance programs, expanding our coverage of healthcare providers other than physician or hospitals, expanding our coverages to include workers' compensation and product liability, and by enhancing our customer service capabilities, particularly with regard to the needs of larger accounts. We have also increased our focus on offering unique, joint or cooperative insurance programs that are attractive to larger healthcare entities.
We recognize the importance of providing our products at competitive rates, but we do not underwrite at rates that will not permit us to meet our profit targets. We base our rates on current loss projections, maintaining a long-term focus even when this approach reduces our top line growth. We believe that our size, reputation for effective claims management, unique customer service focus, multi-state presence, and broad spectrum of coverages offered provides us with competitive advantages, even as the needs of our insureds change.
Rating Agencies
Our claims paying ability is regularly evaluated and rated by three major rating agencies: A.M. Best, Fitch and Moody’s. In developing their claims paying ratings, these agencies make an independent evaluation of an insurer’s ability to meet its obligations to policyholders. See "Risk Factors" for a table presenting the claims paying ratings of our principal insurance operations.
Four
rating agencies evaluate and rate our ability to service current debt and potential debt. These financial strength ratings reflect each agency’s independent evaluation of our ability to meet our obligation to holders of our debt, if any. While financial strength ratings may be of greater interest to investors than our claims paying ratings, these ratings are not evaluations of our equity securities nor a recommendation to buy, hold or sell our equity securities.
Insurance Regulatory Matters
We are subject to regulation under the insurance and insurance holding company statutes of various jurisdictions, including the domiciliary states of our insurance subsidiaries and other states in which our insurance subsidiaries do business. Our insurance subsidiaries are primarily domiciled in the United States. Our states of domicile include Alabama, Illinois, Michigan, Pennsylvania, and Vermont. We have reinsurance operations based in the Cayman Islands, a territory of the United Kingdom (U.K.), as well as U.K. based insurance and reinsurance operations.
United States
Our insurance subsidiaries are required to file detailed annual statements in their states of domicile and with the state insurance regulators in each of the states in which they do business. The laws of the various states establish agencies with broad authority to regulate, among other things, licenses to transact business, premium rates for certain types of coverage, trade practices, agent licensing, policy forms, underwriting and claims practices, reserve adequacy, transactions with affiliates, and insurer solvency. Such regulations may hamper our ability to meet operating or profitability goals, including preventing us from establishing premium rates for some classes of insureds that adequately reflects the level of risk assumed for those classes. Many states also regulate investment activities on the basis of quality, distribution and other quantitative criteria. States have also enacted legislation, including the Risk Management and Own Risk and Solvency Assessment Model Act (ORSA), which regulates insurance holding company systems, including acquisitions, the payment of dividends, the terms of affiliate transactions, enterprise risk and solvency management, and other related matters.
Applicable state insurance laws, rather than federal bankruptcy laws, apply to the liquidation or reorganization of insurance companies.
Insurance companies are also subject to state and federal legislative and regulatory measures and judicial decisions. These could include new or updated definitions of risk exposure and limitations on business practices.
9
Insurance Regulation Concerning Change or Acquisition of Control
The insurance regulatory codes in each of the domiciliary states of our operating subsidiaries contain provisions (subject to certain variations) to the effect that the acquisition of “control” of a domestic insurer or of any person that directly or indirectly controls a domestic insurer cannot be consummated without the prior approval of the domiciliary insurance regulator. In general, a presumption of “control” arises from the direct or indirect ownership, control or possession with the power to vote or possession of proxies with respect to 10% (5% in Alabama) or more of the voting securities of a domestic insurer or of a person that controls a domestic insurer. Because of these regulatory requirements, any party seeking to acquire control of ProAssurance or any other domestic insurance company, whether directly or indirectly, would usually be required to obtain such approvals.
In addition, certain state insurance laws contain provisions that require pre-acquisition notification to state agencies of a change in control of a non-domestic insurance company admitted in that state. While such pre-acquisition notification statutes do not authorize the state agency to disapprove the change of control, such statutes do authorize certain remedies, including the issuance of a cease and desist order with respect to the non-domestic admitted insurers doing business in the state if certain conditions exist, such as undue market concentration.
Statutory Accounting and Reporting
Insurance companies are required to file detailed quarterly and annual reports with state insurance regulators in their state of domicile and each of the states in which they do business; and their business and accounts are subject to examination by such regulators at any time. The financial information in these reports is prepared in accordance with Statutory Accounting Principles (SAP). Insurance regulators periodically examine each insurer’s adherence to SAP, financial condition, and compliance with insurance department rules and regulations.
Regulation of Dividends and Other Payments from Our Operating Subsidiaries
Our operating subsidiaries are subject to various state statutory and regulatory restrictions that limit the amount of dividends or distributions an insurance company may pay to its shareholders, including our insurance holding company, without prior regulatory approval. Generally, dividends may be paid only out of unassigned earned surplus. In every case, surplus subsequent to the payment of any dividends must be reasonable in relation to an insurance company’s outstanding liabilities and must be adequate to meet its financial needs.
State insurance holding company regulations generally require domestic insurers to obtain prior approval of extraordinary dividends. Insurance holding company regulations that govern our principal operating subsidiaries deem a dividend as extraordinary if the combined dividends and distributions to the parent holding company in any twelve-month period exceed prescribed thresholds. Such thresholds are statutorily prescribed by the state of domicile and currently are based on either net income for the prior fiscal year (reduced by realized capital gains in certain domiciliary states) or a percentage of unassigned surplus at the end of the prior fiscal year, depending upon the wording of the statute.
If insurance regulators determine that payment of a dividend or any other payments within a holding company group, (such as payments under a tax-sharing agreement or payments for employee or other services) would, because of the financial condition of the paying insurance company or otherwise, be a detriment to such insurance company’s policyholders, the regulators may prohibit such payments that would otherwise be permitted.
Risk-Based Capital and Risk Assessment
In order to enhance the regulation of insurer solvency, the NAIC specifies risk-based capital requirements for property and casualty insurance companies. At
December 31, 2014
, all of ProAssurance’s insurance subsidiaries substantially exceeded the minimum required risk-based capital levels.
In late 2010, the National Association of Insurance Commissioners (the NAIC) adopted the Model Insurance and Holding Company System Regulatory Act and Regulation (“Model Law”). The Model Law, as compared to previous NAIC guidance, increases regulatory oversight of and reporting by insurance holding companies, including reporting related to non-insurance entities, and requires reporting of risks affecting the holding company group. Additionally, in 2012 the NAIC adopted ORSA, which requires insurers to maintain a framework for identifying, assessing, monitoring, managing and reporting on the “material and relevant risks” associated with the insurer's (or insurance group's) current and future business plans. ORSA will also require insurers to file an internal assessment of solvency with insurance regulators annually beginning in 2015. Although no specific capital adequacy standard is currently articulated in ORSA, it is possible that such standard will be developed over time. The Model Law and ORSA will be binding only if adopted by state legislatures and/or state insurance regulatory authorities and actual regulations adopted by any state may differ from the Model Law.
10
The NAIC revised the Model Law to include provisions which allow regulatory supervision of the holding company group through supervisory colleges and which require reporting of risk and solvency assessments for the group. The NAIC expects states to adopt these revisions no later than January 1, 2016. Certain states in which the Company operates adopted these revisions early and the Company began filing its risk and solvency assessment in 2014.
Investment Regulation
Our operating subsidiaries are subject to state laws and regulations that require diversification of investment portfolios and that limit the amount of investments in certain investment categories. Failure to comply with these laws and regulations may cause non-conforming investments to be treated as non-admitted assets for purposes of measuring statutory surplus and, in some instances, would require divestiture of investments. We monitor the practices used by our operating subsidiaries for compliance with applicable state investment regulations and take corrective measures when deficiencies are identified.
Guaranty Funds
Admitted insurance companies are required to be members of guaranty associations which administer state guaranty funds. To fund the payment of claims (up to prescribed limits) against insurance companies that become insolvent, these associations levy assessments on all member insurers in a particular state on the basis of the proportionate share of the premiums written by member insurers in the covered lines of business in that state. Maximum assessments permitted by law in any one year generally vary between
1%
and
2%
of annual premiums written by a member in that state, although state regulations may permit larger assessments if insolvency losses reach specified levels. Some states permit member insurers to recover assessments paid through surcharges on policyholders or through full or partial premium tax offsets, while other states permit recovery of assessments through the rate filing process. In recent years, participation in guaranty funds has not had a material effect on our results of operations.
Shared Markets
State insurance regulations may force us to participate in mandatory property and casualty shared market mechanisms or pooling arrangements that provide certain insurance coverage to individuals or other entities that are otherwise unable to purchase such coverage in the commercial insurance marketplace. Our operating subsidiaries’ participation in such shared markets or pooling mechanisms is not material to our business at this time.
Changes in Legislation and Regulation
Tort reforms generally restrict the ability of a plaintiff to recover damages by, among other limitations, eliminating certain claims that may be heard in a court, limiting the amount or types of damages, changing statutes of limitation or the period of time to make a claim, and limiting venue or court selection. A number of states in which we do business have previously enacted tort reform legislation in an effort to reduce escalating loss trends. These reforms are generally thought to have contributed to the improvement in the overall loss trends in those states, although loss trends have also been favorable in states that did not pass any type of tort reform. In states where these reforms are perceived to have improved the legal climate for liability defendants, we have experienced an increase in competition.
Challenges to tort reform have been undertaken in most states where tort reforms have been enacted, and in some states the reforms have been fully or partially overturned. Additional state reforms may also be overturned, although we cannot predict with any certainty how appellate courts will rule. We monitor developments on a state-by-state basis and make business decisions accordingly.
Tort reform proposals are considered from time to time at the Federal level. As in the states, passage of a Federal tort reform package would likely be subject to judicial challenge and we cannot be certain that it would be upheld by the courts.
The Affordable Care Act (ACA) was passed and signed into law in March 2010. All of the provisions of ACA have not yet become fully effective, and effects from enacted provisions may gradually increase. We do not expect that the provisions thus far enacted will have a significant direct effect on our business, but specific regulations to implement the law are still being written.
ACA is expected to have a significant impact on the practice of medicine in future years and could have unanticipated or indirect effects on our business or alter the risk and cost environments in which we and our insureds operate. These risks include: reduced operating margins that may cause physicians and hospitals to join in larger groupings which are more likely to utilize alternative risk mechanisms to manage their professional liability risks; use of electronic medical records may lead to additional medical malpractice litigation or increase the cost of litigation; patient dissatisfaction may increase due to greater strain on the patient-physician relationship; there may be an overall increase in healthcare costs which would increase loss costs for claims involving bodily injury; and additional health conditions may be identified as being work-related which could increase the number of workers' compensation claims. Conversely, it is anticipated that there will be growth in the number of
11
ancillary healthcare providers that will become customers for professional liability products. We are unable to predict with any certainty the effect that ACA or future related legislation will have on our insureds or our business.
The Dodd-Frank Wall Street Reform and Consumer Protection Act (Dodd-Frank Act) was passed in July 2010. The Act establishes new regulatory oversight of financial institutions and regulations are still in the process of development for various portions of the Act. Although provisions of the Act do not appear to affect our business materially, as new regulations are implemented, there could be changes in the regulatory environment that affect the way we conduct our operations or the cost of compliance, or both.
One of the federal government bodies created by the Dodd-Frank Act was the Federal Insurance Office (FIO) which, in December 2013, released a proposal on insurance modernization and improvement of the system of insurance regulation in the United States. Although the FIO is prohibited from directly regulating the business of insurance, it has authority to represent the United States in international insurance matters and has limited power to preempt certain types of state insurance laws. The recent proposal advocates significantly greater federal involvement in insurance regulation and identifies necessary reforms by the states to preclude further consideration of direct federal regulation. While the proposal does not necessarily imply that the federal government will displace state regulation completely, it does recommend more of a hybrid approach to insurance regulation. In response to the FIO proposal, the NAIC and a number of state legislatures have considered or adopted legislative proposals that alter and, in many cases, increase the authority of state agencies to regulate insurance companies and insurance holding company systems. We cannot predict whether the proposals will be adopted or what impact, if any, subsequently enacted laws might have on our business, financial condition or results of operations.
Terrorism Risk Insurance Act
The Federal Terrorism Risk Insurance Act (TRIA), initially enacted in 2002 and reauthorized in 2007 and 2015, ensures the availability of insurance coverage for certain acts of terrorism, as defined in the legislation. The 2015 reauthorization extended the program through 2020. TRIA currently provides that during 2015 a loss event must exceed
$100 million
to trigger coverage and that Federal government will reimburse
85%
of an insurer’s losses in excess of the insurer’s deductible, up to the maximum annual Federal liability of
$100 billion
. The event trigger will gradually increase to
$200 million
in 2020 and the reimbursement percentage will gradually decline to
80%
in 2020. TRIA requires that we offer terrorism coverage to our commercial policyholders in our workers' compensation line of business, for which we may, when warranted, charge an additional premium. The policyholders may or may not accept such coverage.
International
Cayman Islands
Our segregated portfolio cell business operates through our subsidiary, Eastern Re, which is organized and licensed as a Cayman Islands unrestricted Class B insurance company. Eastern Re is subject to regulation by the Cayman Islands Monetary Authority (CIMA). Applicable laws and regulations govern the types of policies that Eastern Re can insure or reinsure, the amount of capital that it must maintain and the way it can be invested, and the payment of dividends without approval by the CIMA. Eastern Re is required to maintain minimum capital of approximately
$120,000
and must receive approval from the CIMA before it can pay any dividends.
Lloyd's Syndicate 1729
Syndicate 1729 is regulated in the U.K. by the Prudential Regulation Authority and the Financial Conduct Authority. All Lloyd's syndicates must also comply with the bylaws and regulations established by the Council of Lloyd's including submission and approval of an annual business plan and maintenance of stipulated capital levels. Also, the Council of Lloyd's may call or assess a percentage of a member's underwriting capacity (currently a maximum of
3%
) as a contribution to Lloyd's Central Fund, which, similar to state guaranty funds in the United States, meets policyholder obligations if a Lloyd's member is otherwise unable to do so.
The European Union's executive body, the European Commission, is implementing new capital adequacy and risk management regulations called Solvency II that would apply to businesses within the European Union. Solvency II is currently required to be implemented on January 1, 2016, and certain interim transition measures are required for 2014 and 2015. We comply currently with the guidelines set out by the Council of Lloyd's relative to compliance with Solvency II.
12
Enterprise Risk Management
As a large property and casualty insurance provider, we are exposed to many risks. These risks, whether taken intentionally or unintentionally, are a function of the environment within which we operate. Since certain risks can be correlated with other risks, an event or a series of events can impact multiple areas of the Company simultaneously and have a material effect on the Company's results of operations, financial position and/or liquidity. In response to these exposures we have implemented an Enterprise Risk Management (ERM) program.
Our ERM program consists of numerous processes and controls that have been designed by our senior management, with oversight by our Board of Directors, and have been implemented across our organization.
We utilize ERM to identify potential risks from all aspects of our operations and to evaluate these risks in a manner that is both prudent and balanced. Our primary objective is to develop a risk appetite that creates and preserves value for all of our stakeholders.
Employees
At December 31, 2014, we had
967
employees, none of whom were represented by a labor union. We consider our employee relations to be good.
There are a number of factors, many beyond our control, which may cause results to differ significantly from our expectations. Some of these factors are described below. Any factor described in this report could by itself, or together with one or more other factors, have a negative effect on our business, results of operations and/or financial condition. There may be factors not described in this report that could also cause results to differ from our expectations.
Insurance market conditions may alter the effectiveness of our current business strategy and impact our revenues.
The property and casualty insurance business is highly competitive. We compete in a fragmented market comprised of many insurers, ranging from smaller single state mono-line insurers who have an extensive knowledge of local markets to large national insurers who offer multiple product lines and whose financial strength and resources may be greater than ours. In many instances, coverage we offer is also available through mutual entities whose return on equity objectives may be lower than ours. Also, there are many opportunities for self-insurance and for participation in an alternative risk transfer mechanism, such as captive insurers or risk retention groups.
Competition in the property and casualty insurance business is based on many factors, including premiums charged and other terms and conditions of coverage, services provided, financial ratings assigned by independent rating agencies, claims services, reputation, geographic scope, local presence, agent and client relationships, financial strength and the experience of the insurance company in the line of insurance to be written. Actions of competitors could adversely affect our ability to attract and retain business at current premium levels, impact our market share and reduce the profits that would otherwise arise from operations.
Because we are a property and casualty insurer, our business may suffer as a result of unforeseen catastrophe losses.
As a property and casualty insurer we are exposed to claims arising out of catastrophes, primarily through our workers' compensation and Syndicate 1729 operations. Catastrophes can be caused by various events, including hurricanes, tsunamis, tornadoes, windstorms, earthquakes, hailstorms, explosions, flooding, severe winter weather and fires and may include man-made events, such as terrorist attacks or a wide-spread financial crisis. The incidence, frequency and severity of catastrophes are inherently unpredictable. While we use historical data and modeling tools to assess our potential exposure to catastrophic losses under various conditions and probability scenarios, such assessments do not necessarily accurately predict future losses or accurately measure our potential exposure. The extent of losses from a catastrophe is a function of both the total amount of insured exposure in the area affected by the event and the severity of the event.
Our loss exposure for a terrorist act meeting the TRIA definition is mitigated by our coverage provided by this program as described in Part I under the caption Insurance Regulatory Matters. Congress has the ability to alter or repeal the provisions of TRIA at its discretion, and if altered or repealed our exposure could further increase and result in premium increases for those types of coverages. Workers' compensation coverages cannot exclude damages related to an act of terrorism and if TRIA were repealed or the benefits were substantially reduced, this might affect our ability to offer these coverages at a reasonable rate.
Insurance companies are not permitted to reserve for a catastrophe until it has occurred. Although we purchase reinsurance protection for risks we believe bear a significant level of catastrophe exposure, actual losses resulting from a catastrophic event or events may exceed our reinsurance protection. It is therefore possible that a catastrophic event or multiple catastrophic events could have a material adverse effect on our financial position, results of operations and liquidity.
13
Our results of operations and financial condition may be affected if actual insured losses differ from our loss reserves or if actual amounts recoverable under reinsurance agreements differ from our estimated recoverables.
We establish reserves as balance sheet liabilities representing our estimates of amounts needed to resolve reported and unreported losses and pay related loss adjustment expenses. Our largest liability is our reserve for loss and loss adjustment expenses. Due to the size of our reserve for loss and loss adjustment expenses, even a small percentage adjustment to our reserve can have a material effect on our results of operations for the period in which the change is made.
The process of estimating loss reserves is complex. Significant periods of time may elapse between the occurrence of an insured loss, the reporting of the loss by the insured and payment of that loss. Ultimate loss costs, even for claims with similar characteristics, can vary significantly depending upon many factors, including but not limited to, the nature of the claim, including whether or not the claim is an individual or a mass tort claim, and the personal situation of the claimant or the claimant’s family, the outcome of jury trials, the legislative and judicial climate where the insured event occurred, general economic conditions and, for claims involving bodily injury, the trend of healthcare costs. Consequently, the loss cost estimation process requires actuarial skill and the application of judgment, and such estimates require periodic revision. As part of the reserving process, we review the known facts surrounding reported claims as well as historical claims data and consider the impact of various factors such as:
|
•
|
for reported claims, the nature of the claim and the jurisdiction in which the claim occurred;
|
|
•
|
trends in paid and incurred loss development;
|
|
•
|
trends in claim frequency and severity;
|
|
•
|
emerging economic and social trends;
|
|
•
|
trend of healthcare costs for claims involving bodily injury;
|
|
•
|
inflation and levels of employment; and
|
|
•
|
changes in the regulatory, legal and political environment.
|
This process assumes that past experience, adjusted for the effects of current developments and anticipated trends, is an appropriate, but not necessarily accurate, basis for predicting future events. There is no precise method for evaluating the impact of any specific factor on the adequacy of reserves, and actual results are likely to differ from original estimates. We evaluate our reserves each period and increase or decrease reserves as necessary based on our estimate of future claims payments. An increase to reserves has a negative effect on our results of operations in the period of increase; a reduction to reserves has a positive effect on our results of operations in the period of reduction.
Our loss reserves also may be affected by court decisions that expand liability of our policies after they have been issued and priced. In addition, a significant jury award or series of awards against one or more of our insureds could require us to pay large sums of money in excess of our reserved amounts. Due to uncertainties inherent in the jury system, any case that is litigated to a jury verdict has the potential to incur a loss that has a material adverse effect on our results of operations.
We purchase reinsurance to mitigate the effect of large losses. Our receivable from reinsurers on unpaid losses and loss adjustment expenses represents our estimate of the amount of our reserve for losses that will be recoverable under our reinsurance programs. We base our estimate of funds recoverable upon our expectation of ultimate losses and the portion of those losses that we estimate to be allocable to reinsurers based upon the terms and conditions of our reinsurance agreements. Given the uncertainty of the ultimate amounts of our losses, our estimates of losses and related amounts recoverable may vary significantly from the eventual outcome. Also, we estimate premiums ceded under reinsurance agreements wherein the premium due to the reinsurer, subject to certain maximums and minimums, is based in part on losses reimbursed or to be reimbursed under the agreement. Due to the size of our reinsurance balances, changes to our estimate of the amount of reinsurance that is due to us could have a material effect on our results of operations in the period for which the change is made.
We
are exposed to and may face adverse developments involving mass tort claims arising from coverages provided to our insureds.
Establishing claim and claim adjustment expense reserves for mass tort claims is subject to uncertainties due to many factors, including expanded theories of liability, geographical location and jurisdiction of the lawsuits. Moreover, it is difficult to estimate our ultimate liability for such claims due to evolving judicial interpretations of various tort theories of liability and defense theories, such as federal preemption and joint and several liability, as well as the application of insurance coverage to these claims.
14
If market conditions cause reinsurance to be more costly or unavailable, we may be required to bear increased risk or reduce the level of our underwriting commitments.
As part of our overall risk and capacity management strategy, we purchase reinsurance for significant amounts of risk underwritten by our insurance company subsidiaries. Market conditions beyond our control determine the availability and cost of the reinsurance. We may be unable to maintain current reinsurance coverage or to obtain other reinsurance coverage in adequate amounts and at favorable rates. If we are unable to renew our expiring coverage or to obtain new reinsurance coverage, either our net exposure to risk would increase or, if we are unwilling to bear an increase in net risk exposures, we would need to reduce the amount of our underwritten risk.
We cannot guarantee that our reinsurers will pay in a timely fashion or at all, and, as a result, we could experience losses
.
We transfer part of our risks to reinsurance companies in exchange for part of the premium we receive in connection with the risk. Although our reinsurance agreements make the reinsurer liable to us to the extent the risk is transferred, our liability to our policyholders remains our responsibility. Reinsurers may periodically dispute our demand for reimbursement from them based upon their interpretation of the terms of our agreements or may fail to pay us for financial or other reasons. If reinsurers refuse or fail to pay us or fail to pay on a timely basis, our financial results and/or cash flows would be adversely affected and could have a material effect on our results of operations in the period in which uncollectible amounts are identified.
At
December 31, 2014
our Receivable from reinsurers on unpaid losses is
$238.0 million
and our Receivable from reinsurers on paid losses is
$6.5 million
. As of
December 31, 2014
the estimated net amount due from
three
of our reinsurers exceeded $20 million, on an individual basis, with the largest estimated amount due from an individual reinsurer being
$23.1 million
. A table listing significant reinsurers is provided in Item 7. Management's Discussion and Analysis, as a part of the Liquidity section, under the caption "Reinsurance".
Our claims handling could result in a bad faith claim against us.
We have been, from time to time, sued for allegedly acting in bad faith during our handling of a claim. The damages claimed in actions for bad faith may include amounts owed by the insured in excess of the policy limits as well as consequential and punitive damages. Awards above policy limits are possible whenever a case is taken to trial. These actions have the potential to have a material adverse effect on our financial condition and results of operations.
Changes in healthcare policy could have a material effect on our operations.
ACA was passed and signed into law in March 2010. While the primary provisions of ACA do not appear to directly affect our business, specific regulations to implement the law are still being written.
ACA is expected to have a significant impact on the practice of medicine in future years and could have unanticipated or indirect effects on our business or alter the risk and cost environments in which we and our insureds operate. These risks include: reduced operating margins that may cause physicians and hospitals to join in larger groupings which are more likely to utilize self-insured solutions for HCPL insurance products; use of electronic medical records may lead to additional medical malpractice litigation or increase the cost of litigation; patient dissatisfaction may increase due to greater strain on the patient-physician relationship; there may be an overall increase in healthcare costs which would increase loss costs for claims involving bodily injury; and additional health conditions may be identified as work-related which could increase the number of workers' compensation claims. Conversely, it is anticipated that there will be growth in the number of ancillary healthcare providers that will become customers for HCPL products. We are unable to predict with any certainty the effect that ACA or future related legislation will have on our insureds or our business.
Changes due to financial reform legislation could have a material effect on our operations.
The Dodd-Frank Act (the Act) was passed and signed into law in July 2010. The Act establishes new regulatory oversight of financial institutions, and regulations are still in development for various portions of the Act. As detailed regulations are developed to implement the provisions of the Act, there may be changes in the regulatory environment that affect the way we conduct our operations or the cost of regulatory compliance, or both. We are unable to predict with any certainty the effect that the Dodd-Frank Act will have on our business.
15
One of the federal government bodies created by the Dodd-Frank Act was the Federal Insurance Office (FIO) which, in December 2013, released a proposal on insurance modernization and improvement of the system of insurance regulation in the United States. Although the FIO is prohibited from directly regulating the business of insurance, it has authority to represent the United States in international insurance matters and has limited powered to preempt certain types of state insurance laws. The recent proposal advocates significantly greater federal involvement in insurance regulation and identifies necessary reforms by the states to preclude further consideration of direct federal regulation. While the proposal does not necessarily imply that the federal government will displace state regulation completely, it does recommend more of a hybrid approach to insurance regulation. We cannot predict whether the proposals will be adopted or what impact, if any, enacted laws may have on our business, financial condition or results of operations.
The passage of tort reform or other legislation, and the subsequent review of such laws by the courts could have a material impact on our operations.
Tort reforms generally restrict the ability of a plaintiff to recover damages by, among other limitations, eliminating certain claims that may be heard in a court, limiting the amount or types of damages, changing statutes of limitation or the period of time to make a claim, and limiting venue or court selection. A number of states in which we do business previously enacted tort reform legislation in an effort to reduce escalating loss trends.
Challenges to tort reform have been undertaken in most states where tort reforms have been enacted, and in some states the reforms have been fully or partially overturned. Additional challenges to tort reform may be undertaken. We cannot predict with any certainty how state appellate courts will rule on these laws. While the effects of tort reform have been generally beneficial to our business in states where these laws have been enacted, there can be no assurance that such reforms will be ultimately upheld by the courts. Further, if tort reforms are effective, the business of providing professional liability insurance may become more attractive, thereby causing an increase in competition. In addition, the enactment of tort reforms could be accompanied by legislation or regulatory actions that may be detrimental to our business because of expected benefits which may or may not be realized. These expectations could result in regulatory or legislative action limiting the ability of professional liability insurers to maintain rates at adequate levels.
Coverage mandates or other expanded insurance requirements could also be imposed. States may also consider state-sponsored insurance entities that could remove our potential insureds from the private insurance market.
We continue to monitor developments on a state-by-state basis, and make business decisions accordingly.
Our performance is dependent on the business, economic, regulatory and legislative conditions of states where we have a significant amount of business.
Our top five states, Pennsylvania, Alabama, Texas, Indiana and Michigan, represented
42%
of our direct premiums written for the year ended
December 31, 2014
. Moreover, on a combined basis, Pennsylvania, Alabama and Texas accounted for
31%
,
23%
, and
23%
of our direct premiums written for the years ended
December 31, 2014
,
2013
and
2012
, respectively. As Eastern has only been a part of our consolidated numbers since January 1, 2014, direct premiums written for our workers' compensation business are only included in the 2014 by state information. Unfavorable business, economic or regulatory conditions in any of these states could have a disproportionately greater effect on us than they would if we were less geographically concentrated.
We may be unable to identify future strategic acquisitions or expected benefits from completed and proposed acquisitions may not be achieved or may be delayed longer than expected.
Our corporate strategy anticipates growth through the acquisition of other companies or books of business. However, such expansion is opportunistic and sporadic, and there is no guarantee that we will be able to identify strategic acquisition targets in the future. Additionally, if we are able to identify a strategic target for acquisition, state insurance regulation concerning change or acquisition of control could delay or prevent us from growing through acquisitions. State insurance regulatory codes provide that the acquisition of “control” of a domestic insurer or of any person that directly or indirectly controls a domestic insurer cannot be consummated without the prior approval of the domiciliary insurance regulator. There is no assurance that we will receive such approval from the respective insurance regulator or that such approvals will not be conditioned in a manner that materially and adversely affects the aggregate economic value and business benefits expected to be obtained and cause us to not complete the acquisition.
The Company performs thorough due diligence before agreeing to a merger or acquisition, however there is no guarantee that the procedures we perform will adequately identify all potential weaknesses or liabilities of the target company or potential risks to the consolidated entity.
16
There is also no guarantee that businesses acquired in the future will be successfully integrated. Ineffective integration of our businesses and processes may result in substantial costs or delays and adversely affect our ability to compete. The process of integrating an acquired company or business can be complex and costly, and may create unforeseen operating difficulties and expenditures. Potential problems that may arise include, but are not limited to, business disruption, loss of customers and employees, the ineffective integration of underwriting, claims handling and actuarial practices, the increase in the inherent uncertainty of reserve estimates for a period of time until stable trends reestablish themselves within the combined organization, diversion of management time and resources to acquisition integration challenges, the cultural challenges associated with integrating employees, increased operating costs, assumption of greater than expected liabilities, or inability to achieve cost savings. Furthermore, claims may be asserted by either the policyholders or shareholders of any acquired entity related to payments or other issues associated with the acquisition and merger into the consolidated entity. Such claims may prove costly or difficult to resolve or may have unanticipated consequences.
If we are unable to maintain favorable financial strength ratings, it may be more difficult for us to write new business or renew our existing business.
Independent rating agencies assess and rate the claims-paying ability and the financial strength of insurers based upon criteria established by the agencies. Periodically the rating agencies evaluate us to confirm that we continue to meet the criteria of previously assigned ratings. The financial strength ratings assigned by rating agencies to insurance companies represent independent opinions of financial strength and ability to meet policyholder and debt obligations and are not directed toward the protection of equity investors.
Our principal operating subsidiaries hold favorable claims paying ratings with A.M. Best, Fitch and Moody’s. Claims paying ratings are used by agents and customers as an important means of assessing the financial strength and quality of insurers. If our financial position deteriorates or the rating agencies significantly change the rating criteria that are used to determine ratings, we may not maintain our favorable financial strength ratings from the rating agencies. A downgrade or involuntary withdrawal of any such rating could limit or prevent us from writing desirable business.
The following table presents the claims paying ratings of our core insurance subsidiaries as of
February 20, 2015
.
|
|
|
Rating Agency (1)
|
||||
|
|
|
A.M. Best
(www.ambest.com) |
|
Fitch
(www.fitchratings.com) |
|
Moody’s
(www.moodys.com) |
|
ProAssurance Indemnity Company, Inc.
|
|
A+ (Superior)
|
|
A (Strong)
|
|
A2
|
|
ProAssurance Casualty Company
|
|
A+ (Superior)
|
|
A (Strong)
|
|
A2
|
|
ProAssurance Specialty Insurance Company, Inc.
|
|
A+ (Superior)
|
|
A (Strong)
|
|
NR
|
|
Podiatry Insurance Company of America
|
|
A (Excellent)
|
|
A (Strong)
|
|
A2
|
|
PACO Assurance Company, Inc.
|
|
A- (Excellent)
|
|
A (Strong)
|
|
NR
|
|
Noetic Specialty Insurance Company
|
A (Excellent)
|
A (Strong)
|
NR
|
|||
|
Medmarc Casualty Insurance Company
|
A (Excellent)
|
A (Strong)
|
NR
|
|||
|
Lloyd's Syndicate 1729 (2)
|
A (Excellent)
|
AA- (Strong)
|
NR
|
|||
|
Eastern Alliance Insurance Company
|
A (Excellent)
|
A (Strong)
|
NR
|
|||
|
Allied Eastern Indemnity Company
|
A (Excellent)
|
A (Strong)
|
NR
|
|||
|
Eastern Advantage Assurance Company
|
A (Excellent)
|
A (Strong)
|
NR
|
|||
|
Eastern Re Ltd., SPC
|
A (Excellent)
|
NR
|
NR
|
|||
|
(1)
NR indicates that the subsidiary has not been rated by the listed rating agency.
|
||||||
|
(2)
Rating provided is the rating applicable to all Lloyd's syndicates.
|
||||||
Four
rating agencies evaluate and rate our ability to service current debt and potential debt. These financial strength ratings reflect each agency’s independent evaluation of our ability to meet our obligation to holders of our debt, if any. While these ratings may be of greater interest to investors than our claims paying ratings, these are not ratings of our equity securities nor a recommendation to buy, hold or sell our equity securities.
Our business could be adversely affected by the loss or consolidation of independent agents, agencies, or brokers or brokerage firms.
We heavily depend on the services of independent agents and brokers in the marketing of our insurance products. We face competition from other insurance companies for their services and allegiance. These agents and brokers may choose to direct business to competing insurance companies.
17
Our success is dependent upon our ability to effectively design and execute our business strategy and to adequately and appropriately serve our customers.
The Company depends upon the skill and work product of our officers and employees in executing our business strategy. While management and the Board of Directors ("the Board" or "our Board") monitor the strategic direction of the Company, strategic changes could be made that are not supportable by our capital base. In addition, our business could potentially be impacted if we are unable to align our strategy with the expectations of our stakeholders. The operations of the Company are also heavily dependent upon the delivery of superior customer service across a broad customer base, by which negative feedback from agents, insureds or internal staff could result in a loss of revenue for the Company.
Our business could be affected by the loss of one or more of our senior executives.
We are heavily dependent upon our senior management, and the loss of services of our senior executives could adversely affect our business. Our success has been, and will continue to be, dependent on our ability to retain the services of existing key employees and to attract and retain additional qualified personnel in the future. The loss of the services of key employees or senior managers, or the inability to identify, hire and retain other highly qualified personnel in the future, could adversely affect the quality and profitability of our business operations.
Our Board regularly reviews succession planning relating to our Chief Executive Officer as well as other senior officers. Mr. Starnes, our Chief Executive Officer and President, has indicated to the Board that he has no immediate plans for retirement.
Provisions in our charter documents, Delaware law and state insurance law may impede attempts to replace or remove management or may impede a takeover, which could adversely affect the value of our common stock.
Our certificate of incorporation, bylaws and Delaware law contain provisions that may have the effect of inhibiting a non-negotiated merger or other business combination. We currently have no preferred stock outstanding, and no present intention to issue any shares of preferred stock. In addition, our Corporate Governance Principles provide that the Board, subject to its fiduciary duties, will not issue any series of preferred stock for any defense or anti-takeover purpose, for the purpose of implementing any stockholders rights plan, or with features intended to make any acquisition more difficult or costly without obtaining stockholder approval. However, because the rights and preferences of any series of preferred stock may be set by the Board in its sole discretion, the rights and preferences of any such preferred stock may be superior to those of our common stock and thus may adversely affect the rights of the holders of common stock.
The voting structure of common stock and other provisions of our certificate of incorporation are intended to encourage a person interested in acquiring us to negotiate with, and to obtain the approval of, the Board in connection with a transaction. However, certain of these provisions may discourage our future acquisition, including an acquisition in which stockholders might otherwise receive a premium for their shares. As a result, stockholders who might desire to participate in such a transaction may not have the opportunity to do so.
In addition, state insurance laws provide that no person or entity may directly or indirectly acquire control of an insurance company unless that person or entity has received approval from the insurance regulator. An acquisition of control of ProAssurance would be presumed if any person or entity acquires 10% (5% in Alabama) or more of our outstanding common stock, unless the applicable insurance regulator determines otherwise. These provisions apply even if the offer may be considered beneficial by stockholders.
We are a holding company and are dependent on dividends and other payments from our operating subsidiaries, which are subject to dividend restrictions.
We are a holding company whose principal source of funds is cash dividends and other permitted payments from operating subsidiaries. If our subsidiaries are unable to make payments to us, or are able to pay only limited amounts, we may be unable to make payments on our indebtedness, meet other holding company financial obligations, or pay dividends to shareholders. The payment of dividends by these operating subsidiaries is subject to restrictions set forth in the insurance laws and regulations of their respective states of domicile, as discussed under the caption "Insurance Regulatory Matters".
18
Regulatory requirements or changes to regulatory requirements could have a material effect on our operations.
Our insurance businesses are subject to extensive regulation by state insurance authorities in each state in which they operate. Regulation is intended for the benefit of policyholders rather than shareholders. In addition to the amount of dividends and other payments that can be made to a holding company by insurance subsidiaries, these regulatory authorities have broad administrative and supervisory power relating to:
|
•
|
licensing requirements;
|
|
•
|
trade practices;
|
|
•
|
capital and surplus requirements;
|
|
•
|
investment practices; and
|
|
•
|
rates charged to insurance customers.
|
These regulations may impede or impose burdensome conditions on rate changes or other actions that we may desire to take in order to enhance our results of operations. In addition, we may incur significant costs in the course of complying with regulatory requirements. Most states also regulate insurance holding companies like us in a variety of matters such as acquisitions, solvency and risk assessment, changes of control and the terms of affiliated transactions.
Also, certain states sponsor insurance entities which affect the amount and type of liability coverages purchased in the sponsoring state. Changes to the number of state sponsored entities of this type could result in a large number of insureds changing the amount and type of coverage purchased from private insurance entities such as ProAssurance.
As a result of our acquisition of Eastern, we own a subsidiary domiciled in the Cayman Islands and subject to the laws of the Cayman Islands and regulations promulgated by the CIMA. Failure to comply with these laws, regulations and requirements could result in consequences ranging from a regulatory examination to a regulatory takeover of our Cayman subsidiary, which could potentially impact profitability of alternative market solutions offered through this subsidiary.
Syndicate 1729 is regulated in the U.K. by the Prudential Regulation Authority and the Financial Conduct Authority. All Lloyd's syndicates must also comply with the bylaws and regulations established by the Council of Lloyd's. Failure to comply with bylaws and regulations could affect our ability to underwrite as a Lloyd's Syndicate in the future and therefore affect our profitability. Changes in bylaws and regulations could also affect the profitability of the operations.
The European Union's executive body, the European Commission, is implementing new capital adequacy and risk management regulations called Solvency II that would apply to businesses within the European Union. Solvency II is currently required to be implemented on January 1, 2016, and certain interim transition measures were required for 2014 and 2015. We are unable to predict with any certainty the effect that such regulations will have on the profitability of Lloyd's or Syndicate 1729.
As a member of the Lloyd's market and a capital provider to Lloyd's Syndicate 1729 we are subject to certain risks which could materially and adversely affect us.
As a member of the Lloyd's market we are obligated to contribute to the Lloyd's Central Fund and to pay levies to Lloyd's and also have our ongoing exposure to levies and charges in order to underwrite at Lloyd's. Whenever a member of Lloyd's is unable to pay its policyholder obligations, such obligations may be payable by the Lloyd's Central Fund. If Lloyd's determines that the Central Fund needs to be increased, it has the power to assess premium levies on current Lloyd's members up to
3%
of a member's underwriting capacity in any one year. We do not believe that any assessment is likely in the foreseeable future and have not provided an allowance for such an assessment. However, based on our 2015 estimated underwriting capacity at Lloyd's of
£43.2 million
(
$67.2 million
), the
December 31, 2014
exchange rate of
1.5577
dollars per GBP and assuming the maximum
3%
assessment, we could be assessed up to
$2.0 million
for the 2015 underwriting year.
As a participant in Lloyd's of London, Syndicate 1729 is subject to certain risks and uncertainties, including the following:
|
•
|
its reliance on insurance and reinsurance brokers and distribution channels to distribute and market its products;
|
|
•
|
its obligation to pay levies to Lloyds;
|
|
•
|
its obligations to maintain funds to support its underwriting activities in that its risk-based capital requirements are assessed periodically by Lloyd's and subject to variation;
|
|
•
|
its reliance on ongoing approvals from Lloyd's and various regulators to conduct its business, including a requirement that its Annual Business Plan be approved by Lloyd's before the start of underwriting for each account year;
|
|
•
|
its financial strength rating is derived from the rating assigned to Lloyd's, although it has limited ability to directly affect the overall Lloyd's rating; and
|
|
•
|
its reliance on Lloyd's trading licenses in order to underwrite business outside the U.K.
|
19
The guaranty fund assessments that we are required to pay to state guaranty associations may increase or our participation in mandatory risk retention pools could be expanded and our results of operations and financial condition could suffer as a result.
Each state in which we operate has separate insurance guaranty fund laws requiring admitted property and casualty insurance companies doing business within their respective jurisdictions to be members of their guaranty associations. These associations are organized to pay covered claims (as defined and limited by the various guaranty association statutes) under insurance policies issued by insurance companies that have become insolvent. Most guaranty association laws enable the associations to make assessments against member insurers to obtain funds to pay covered claims after a member insurer becomes insolvent. These associations levy assessments (up to prescribed limits) on all member insurers in a particular state on the basis of the proportionate share of the premiums written by member insurers in the covered lines of business in that state. Maximum assessments generally vary between
1%
and
2%
of annual premiums written by a member in that state. Some states permit member insurers to recover assessments paid through surcharges on policyholders or through full or partial premium tax offsets, while other states permit recovery of assessments through the rate filing process. We had net guaranty fund recoupments of
$0.2 million
in
2014
and net guaranty fund assessments of
less than $0.1 million
in
2013
. Our practice is to accrue for insurance insolvencies when notified of assessments. We are not able to reasonably estimate assessments or develop a meaningful range of possible assessments prior to notice because the guaranty funds do not provide sufficient information for development of such estimates or ranges.
Certain states have established risk pooling mechanisms that offer insurance coverage to individuals or entities who are otherwise unable to purchase coverage from private insurers. Authorized property and casualty insurers in these states are generally required to share in the underwriting results of these pooled risks, which are typically adverse. Should our mandatory participation in such pools be increased or if the assessments from such pools increased, our results of operations and financial condition would be negatively affected, although that was not the case in 2014, 2013 or 2012.
Our investment results will fluctuate as interest rates change.
Our investment portfolio is primarily comprised of interest-earning assets, marked to market each period. Thus, prevailing economic conditions, particularly changes in market interest rates, may significantly affect our results of operations. Significant movements in interest rates potentially expose us to lower yields or lower asset values. Changes in market interest rate levels generally affect our net income to the extent that reinvestment yields are different than the yields on maturing securities. Changes in interest rates also can affect the value of our interest-earning assets, which are principally comprised of fixed and adjustable-rate investment securities. Generally, the values of fixed-rate investment securities fluctuate inversely with changes in interest rates. Interest rate fluctuations could adversely affect our stockholders’ equity, income and/or cash flows.
Our investments are subject to credit, prepayment and other risks.
A significant portion of our total assets (
$4.0 billion
or
78%
) at
December 31, 2014
are financial instruments whose value can be significantly affected by economic and market factors beyond our control including, among others, the unemployment rate, the strength of the domestic housing market, the price of oil, changes in interest rates and spreads, consumer confidence, investor confidence regarding the economic prospects of the entities in which we invest, corrective or remedial actions taken by the entities in which we invest, including mergers, spin-offs and bankruptcy filings, the actions of the U.S. government, and global perceptions regarding the stability of the U.S. economy. Adverse economic and market conditions could cause investment losses or other-than-temporary impairments of our securities, which could affect our financial condition, results of operations, or cash flows.
At
December 31, 2014
approximately
11%
of our investment portfolio is invested in mortgage and asset-backed securities. We utilize ratings determined by Nationally Recognized Statistical Rating Organizations (NRSROs) (Moody’s, Standard & Poor’s, and Fitch) as an element of our evaluation of the credit worthiness of our securities. The ratings are subject to error by the agencies; therefore, we may be subject to additional credit exposure should the rating be misstated.
Our asset-backed securities are also subject to prepayment risk. A prepayment is the unscheduled return of principal. When rates decline, the propensity for refinancing may increase and the period of time we hold our asset-backed securities may shorten due to prepayments. Prepayments may cause us to reinvest cash proceeds at lower yields than the retired security. Conversely, as rates increase, and motivations for prepayments lessen, the period of time over which our asset-backed securities are repaid may lengthen, causing us to not reinvest cash flows at the higher available yields.
At
December 31, 2014
the fair value of our state/municipal portfolio was
$1.1 billion
(amortized cost basis of
$1.0 billion
). While our state/municipal portfolio had a high credit rating (
AA
on average), which indicates a strong ability to pay, there is no assurance that there will not be a credit related event which would cause fair values to decline. An economic downturn could lessen tax receipts and other revenues in many states and their municipalities and the frequency of credit downgrades of these entities has increased.
20
Our tax credit partnership interests are subject to risks related to the potential forfeiture of the tax credits and all or a portion of the previously claimed tax credits. Loss of the tax credits might occur if the property owner fails to meet the specified requirements of planning, constructing and operating the property or if the property fails to generate the projected tax credits. At
December 31, 2014
the carrying value of our tax credit partnership interests was approximately
$133.1 million
.
U.S. Government debt rating.
U.S Government securities are no longer rated with the highest possible rating by one of the major rating agencies, and there is potential for a further downgrade or for additional rating agencies to also downgrade U. S. Government securities. The rating agencies have also indicated that debt instruments of issuers dependent upon federal support and distributions, including state and local municipalities, may also be downgraded, but this has not yet occurred to any widespread extent except with respect to U.S. Agency debt or U.S. Agency guaranteed debt. If ratings downgrades occur, the average credit rating of our investment portfolio will be reduced. Due to the unpredictable nature of this situation, we are unable to provide a reliable estimate regarding the extent to which our portfolio might be affected. As of
December 31, 2014
debt securities represented
78%
of our total investments and included U.S. Government debt, U.S. Agency debt, and U.S. Agency guaranteed debt having a combined fair value of
$491 million
and state and municipal securities having a combined fair value of
$1.1 billion
.
In a period of market illiquidity and instability, the fair values of our investments are more difficult to assess and our assessments may prove to be greater or less than amounts received in actual transactions.
In accordance with applicable GAAP, we value
94%
of our investments at fair value and the remaining
6%
at cost, equity, or cash surrender value. See Notes 1, 3 and 4 of the Notes to Consolidated Financial Statements for additional information.
We determine the fair value of our investments using quoted exchange or over-the-counter (OTC) prices, when available. At
December 31, 2014
, we valued approximately
10%
of our investments in this manner. When exchange or OTC quotes are not available, we estimate fair values based on broker dealer quotes and various other valuation methodologies, which may require us to choose among various input assumptions and which requires us to utilize judgment. At
December 31, 2014
approximately
84%
of our investments were valued in this manner. When markets exhibit significant volatility, there is more risk that we may utilize a quoted market price, broker dealer quote, valuation technique or input assumption that results in a fair value estimate that is either over or understated as compared to actual amounts that would be received upon disposition or maturity of the security.
Our Board may decide that our financial condition does not allow the continued payment of a quarterly cash dividend, or requires that we reduce the amount of our quarterly cash dividend.
Our Board approved a cash dividend policy in September 2011, and most recently paid a
$0.31
per share dividend for the three months ended
December 31, 2014
. However, any decision to pay future cash dividends is subject to the Board’s final determination after a comprehensive review of the Company’s financial performance, future expectations and other factors
deemed relevant by the Board.
Our ability to issue additional debt or letters of credit or other types of indebtedness on terms consistent with current debt is subject to market conditions, economic conditions at the time of proposed issuance, and the results of ratings reviews. Also, our current credit agreement requires that our debt to capital ratio be
0.35
to 1.0 or less, and the issuance of debt by one of our insurance subsidiaries requires regulatory approval, both of which may limit or prohibit the issuance of additional debt.
D
uring 2013 we issued
$250 million
of unsecured Senior Notes Payable due in 2023 at a
5.3%
interest rate. There is no guarantee that additional debt could be issued on similar terms in the future as rates available to us may change due to changes in the economic climate or shifts in the yield curve may occur or an increase in our level of debt may result in rating agencies lowering our debt rating. Also, our insurance subsidiaries must obtain regulatory approval before incurring additional debt. A further restriction is that our credit facility agreement requires that our consolidated debt to capital ratio (
0.12
to 1.0 at
December 31, 2014
) be
0.35
to 1.0 or less.
21
Resolution of uncertain tax matters and changes in tax laws or taxing authority interpretations of tax laws could result in actual tax benefits or deductions that are different than we have estimated, both with regard to amounts recognized and the timing of recognition. Such differences could affect our results of operations or cash flows.
Our provision for income taxes, our recorded tax liabilities and net deferred tax assets, including any valuation allowances, are recorded based on estimates. These estimates require us to make significant judgments regarding a number of factors, including, among others, the applicability of various federal and state laws, the interpretations given to those tax laws by taxing authorities, courts and the Company, the timing of future income and deductions, and our expected levels and sources of future taxable income. We believe our tax positions are supportable under tax laws and that our estimates are prepared in accordance with GAAP. Additionally, from time to time there are changes to tax laws and interpretations of tax laws which could change our estimates of the amount of tax benefits or deductions expected to be available to us in future periods. In either case, changes to our prior estimates would be reflected in the period changed and could have a material effect on our effective tax rate, financial position, results of operations and cash flow. The reinsurance portion of our workers' compensation business is domiciled in the Cayman Islands. Changes in Cayman Island tax laws could result in the loss of profitability of that business.
We are subject to U.S. federal and various state income taxes. We are periodically under routine examination by various federal, state and local authorities regarding income tax matters and our tax positions could be successfully challenged; the costs of defending our tax positions could be considerable. Our estimate of our potential liability for known uncertain tax positions is reflected in our financial statements. As of
December 31, 2014
we had a federal income tax receivable of approximately
$1 million
. We also had a liability for unrecognized current tax benefits of
$0.6 million
, and we had a net deferred tax liability of approximately
$18.8 million
. Unrecognized tax benefits at
December 31, 2014
, if recognized, would not affect the effective tax rate but would accelerate the payment of tax.
New or changes in existing accounting standards, practices and/or policies, as well as subjective assumptions, estimates and judgments by management related to complex accounting matters could significantly affect our financial results or our ability to maintain investor confidence and shareholder value.
U.S. generally accepted accounting principles (GAAP) and related accounting pronouncements, implementation guidelines and interpretations with regard to a wide range of matters that are relevant to our business, such as revenue recognition, estimation of losses, determination of fair value, asset impairment (particularly investment securities and goodwill) and tax matters, are highly complex and involve many subjective assumptions, estimates and judgments. Changes in these rules or their interpretation or changes in underlying assumptions, estimates, or judgments could significantly change our reported or expected financial performance or financial condition. See Note 1 of the Notes to Consolidated Financial Statements for a description of our significant accounting policies.
ProAssurance is primarily a holding company of insurance subsidiaries which are required to comply with statutory accounting principles (SAP). SAP and its components are subject to review by the NAIC and state insurance departments. The NAIC Accounting Practices and Procedures Manual provides that a state insurance department may allow insurance companies that are domiciled in that state to depart from SAP by granting them permitted non-SAP accounting practices. This permission may permit a competitor or competitors to use a more favorable accounting policy.
It is uncertain whether or how SAP might be revised or whether any revisions will have a positive or negative effect. It is also uncertain whether any changes to SAP or its components or any permitted non-SAP accounting practices granted to our competitors will negatively affect our financial results or operations. See the Insurance Regulatory Matters section in Item 1 for the full discussion on regulatory matters.
Our interpretation, integration and/or compliance with new or changes to existing pronouncements by GAAP or SAP could materially impact us as a publicly traded company as it relates to investor confidence and shareholder value.
We are subject to numerous NYSE and SEC regulations including insider trading regulations, Regulation FD, and regulations requiring timely and accurate reporting of our operating results as well as certain events and transactions. Non-compliance with these regulations could subject us to enforcement actions by the NYSE or the SEC, and could affect the value of our shares and our ability to raise additional capital.
The Company carefully adheres to NYSE and SEC requirements as the loss of trading privileges on the NYSE or an SEC enforcement action could have a significant financial impact on the Company. Failure to comply with various SEC reporting and record keeping requirements could result in a decline in the value of our stock or a decline in investor confidence which could directly impact our ability to efficiently raise capital. Failure to adhere to NYSE requirements could result in fines, trading restriction or delisting.
22
The operations of the Company are heavily reliant upon the Company's reputation as an ethical business organization providing needed services to its customers.
The Company's positive reputation is critical to its role as an insurance provider and as a publicly traded company. The Board adopted a Code of Ethics and Conduct and management is heavily focused on the integrity of our employees and third party suppliers, agents or brokers. Illegal, unethical or fraudulent activities perpetrated by an employee or one of our third party agencies or brokers for personal gain could expose the Company to a potential financial loss.
A natural disaster or pandemic event, or closely related series of events, could cause loss of lives or a substantial loss of property or operational ability at one or more of the Company's facilities.
The Company's disaster preparedness encompasses our Business Continuity Plan, Disaster Recovery Plan, Operations Plan, and Pandemic Response Plan. Our disaster preparedness is focused on maintaining the continuity of the Company's data processing and telephone capabilities as well as the use of alternate and temporary facilities in the event of a natural disaster or medical event. The Company's plans are reviewed during the insurance department examinations of the statutory insurance companies. While the Company has plans in place to respond to both short- and long-term disaster scenarios, the loss of certain key operating facilities or data processing capabilities could have a significant impact on Company operations.
The operations of the Company are dependent upon the availability, integrity and security of our internal technology infrastructure and that of certain third parties. Any significant disruption of these infrastructures could result in unauthorized access to Company data or reduce our ability to conduct business effectively, or both.
The Company is dependent upon its technology infrastructure and that of certain third parties to operate and report financial and other Company information accurately and timely. The Company has focused resources on securing and preserving the integrity of our data processing systems and related data. Additionally, the Company evaluates the integrity and security of the technology infrastructure of third parties that process or store data that the Company considers to be significant. However, there is no guarantee that measures taken to date will completely prevent possible disruption, damage or destruction by intentional or unintentional acts or events such as cyber-attacks, viruses, sabotage, human error, system failure or the occurrence of numerous other human or natural events. Disruption, damage or destruction of any of our systems or data could cause our normal operations to be disrupted or unauthorized internal or external knowledge or misuse of confidential Company data could occur, all of which could be harmful to the Company from both a financial and reputational perspective.
|
ITEM 1B.
|
UNRESOLVED STAFF COMMENTS.
|
None.
|
ITEM 2.
|
PROPERTIES.
|
We own five office properties, all of which are unencumbered:
|
|
Square Footage of Properties
|
||||||||
|
Property Location
|
Occupied by
ProAssurance |
Leased or Available
for Lease |
Total
|
||||||
|
Birmingham, AL*
|
104,000
|
|
61,000
|
|
165,000
|
|
|||
|
Franklin, TN
|
52,000
|
|
51,000
|
|
103,000
|
|
|||
|
Okemos, MI
|
53,000
|
|
—
|
|
53,000
|
|
|||
|
Madison, WI
|
38,000
|
|
—
|
|
38,000
|
|
|||
|
Las Vegas, NV
|
4,640
|
|
—
|
|
4,640
|
|
|||
* Corporate Headquarters
|
ITEM 3.
|
LEGAL PROCEEDINGS.
|
Our insurance subsidiaries are involved in various legal actions, a substantial number of which arise from claims made under insurance policies. While the outcome of all legal actions is not presently determinable, management and its legal counsel are of the opinion that these actions will not have a material adverse effect on our financial position or results of operations. See Note 9 of the Notes to Consolidated Financial Statements included herein.
23
EXECUTIVE OFFICERS OF PROASSURANCE CORPORATION
The executive officers of ProAssurance Corporation (ProAssurance) serve at the pleasure of the Board. We have a knowledgeable and experienced management team with established track records in building and managing successful insurance operations. Following is a brief description of each executive officer of ProAssurance, including their principal occupation, and relevant background with ProAssurance and former employers.
|
W. Stancil Starnes
|
|
Mr. Starnes was appointed as Chief Executive Officer in 2007 and has served as the Chairman of the Board since 2008. In 2012 he was appointed President of ProAssurance. Mr. Starnes previously served as President, Corporate Planning and Administration of Brasfield & Gorrie, Inc., a large national commercial contractor. Prior to 2006, Mr. Starnes served as the Senior and Managing Partner of the law firm of Starnes & Atchison, LLP, where he was extensively involved with ProAssurance and its predecessors in the defense of healthcare professional liability claims for over 25 years. Mr. Starnes currently serves as a director of Infinity Property and Casualty Corporation, a public insurance holding company, where he serves on the audit, compensation and executive committees. He is also on the Board of Directors of The National Bank of Commerce, located in Birmingham, Alabama, where he serves as Chairman of the Nominating and Corporate Governance Committee and is a member of the compensation committee. (Age 66)
|
|
Howard H. Friedman
|
|
Mr. Friedman was appointed as President of our Healthcare Professional Liability Group in 2014, and is also our Chief Underwriting Officer and Chief Actuary. Mr. Friedman has previously served as a Co-President of our Professional Liability Group, Chief Financial Officer, Corporate Secretary, and as the Senior Vice President of Corporate Development. Mr. Friedman joined our predecessor in 1996. Mr. Friedman is an Associate of the Casualty Actuarial Society and a member of the American Academy of Actuaries. (Age 56)
|
|
Jeffrey P. Lisenby
|
|
Mr. Lisenby was appointed as an Executive Vice President in 2014 and is also our General Counsel, Corporate Secretary and head of the corporate Legal Department. Mr. Lisenby has previously served as Senior Vice President. Prior to joining ProAssurance, Mr. Lisenby practiced law privately in Birmingham, Alabama. Mr. Lisenby is a member of the Alabama State Bar and the United States Supreme Court Bar and is a Chartered Property Casualty Underwriter. (Age 46)
|
|
Edward L. Rand, Jr.
|
|
Mr. Rand was appointed as an Executive Vice President in 2014 and is also our Chief Financial Officer. Mr. Rand previously served as our Senior Vice President of Finance upon joining ProAssurance in 2004. Prior to joining ProAssurance, Mr. Rand was the Chief Accounting Officer and Head of Corporate Finance for PartnerRe Ltd. Prior to that time Mr. Rand served as the Chief Financial Officer of Atlantic American Corporation. (Age 48)
|
|
Frank B. O’Neil
|
|
Mr. O’Neil was appointed as our Senior Vice President and Chief Communications Officer in 2001. Mr. O’Neil has previously served as our Senior Vice President of Corporate Communications, having joined our predecessor in 1987. (Age 61)
|
|
Michael L. Boguski
|
Mr. Boguski is President of our Eastern subsidiary. Prior to the acquisition of Eastern, Mr. Boguski served as President and Chief Executive Officer of Eastern, and first joined Eastern in 1997. (Age 52)
|
|
|
Mary Todd Peterson
|
Ms. Peterson is President of our Medmarc subsidiary. Prior to the acquisition of Medmarc, Ms. Peterson served as Medmarc's President and CEO. She previously served as Medmarc's Senior Vice President and Chief Operating Officer as well as its Senior Vice President, Chief Financial Officer and Treasurer. Ms. Peterson serves on the Board of Governors for the Property Casualty Insurance Association of America where she chairs the Investment Committee and serves on the Executive and Finance Committees. Ms. Peterson also serves on the Board of Directors of The Community Financial Corporation where she chairs the Audit Committee. (Age 60)
|
|
|
Ross E. Taubman
|
Dr. Taubman is President and Chief Medical Officer of our PICA subsidiary. Prior to joining PICA, Dr. Taubman practiced podiatry for 26 years. During that time, Dr. Taubman served as Treasurer, Vice-President and President of the Maryland Podiatric Medical Association. Dr. Taubman is a diplomate in the American Board of Podiatric Surgery. (Age 57)
|
|
|
Kelly B. Brewer
|
Ms. Brewer was appointed as our Chief Accounting Officer in 2014 and has served as our Vice President of Finance since joining ProAssurance in 2008. Prior to joining ProAssurance, Ms. Brewer was a Senior Manager for PricewaterhouseCoopers for four years. Prior to that time Ms. Brewer served financial services clients in audit and forensic accounting engagements for five years. Ms. Brewer is a Certified Public Accountant. (Age 39)
|
|
24
We have adopted a Code of Ethics and Conduct that applies to our directors and executive officers, including but not limited to our principal executive officers, principal financial officer, and principal accounting officer. We also have share ownership guidelines in place to ensure that management maintains a significant portion of their personal investments in the stock of ProAssurance. Both our Code of Ethics and Conduct and our Share Ownership Guidelines are available on the Governance section of our website. Printed copies of these documents may be obtained from Frank O’Neil, Senior Vice President, ProAssurance Corporation, either by mail at P.O. Box 590009, Birmingham, Alabama 35259-0009, or by telephone at (205) 877-4400 or (800) 282-6242.
Not applicable.
At
February 20, 2015
, ProAssurance Corporation (PRA) had
2,861
stockholders of record and
55,814,475
shares of common stock outstanding. ProAssurance’s common stock currently trades on the NYSE under the symbol “PRA”.
|
|
2014
|
2013
|
||||||||||||||||||
|
Quarter
|
High
|
Low
|
High
|
Low
|
||||||||||||||||
|
First
|
$
|
48.11
|
|
$
|
42.90
|
|
$
|
47.92
|
|
$
|
43.06
|
|
||||||||
|
Second
|
45.79
|
|
43.71
|
|
52.73
|
|
47.11
|
|
||||||||||||
|
Third
|
46.58
|
|
43.63
|
|
55.28
|
|
45.06
|
|
||||||||||||
|
Fourth
|
48.08
|
|
43.78
|
|
49.38
|
|
42.70
|
|
||||||||||||
|
Dividends Declared
|
Dividends Paid
|
|||||||||||||||||||
|
Quarter
|
2014
|
2013
|
2014
|
2013
|
||||||||||||||||
|
First
|
$
|
0.30
|
|
$
|
0.25
|
|
$
|
0.30
|
|
$
|
—
|
|
||||||||
|
Second
|
0.30
|
|
0.25
|
|
0.30
|
|
0.25
|
|
||||||||||||
|
Third
|
0.30
|
|
0.25
|
|
0.30
|
|
0.25
|
|
||||||||||||
|
Fourth*
|
2.96
|
|
0.30
|
|
0.30
|
|
0.25
|
|
||||||||||||
* Includes a special dividend of
$2.65
per common share in 2014.
The Board declared a quarterly dividend in each quarter of 2014 and 2013. The dividends were paid in the month after the quarter ended. The Board also declared a special dividend of
$2.65
per common share in the fourth quarter of
2014
that was paid in January
2015
. Any decision to pay regular or special cash dividends in the future is subject to the Board’s final determination after a comprehensive review of financial performance, future expectations and other factors deemed relevant by the Board.
ProAssurance’s insurance subsidiaries are subject to restrictions on the payment of dividends to the parent. Information regarding restrictions on the ability of the insurance subsidiaries to pay dividends is incorporated herein by reference from the paragraphs under the caption “Insurance Regulatory Matters–Regulation of Dividends and Other Payments from Our Operating Subsidiaries” in Item 1 of this 10-K.
25
Securities Authorized for Issuance Under Equity Compensation Plans
The following table provides information regarding ProAssurance’s equity compensation plans as of
December 31, 2014
.
|
Plan Category
|
Number of securities to be
issued upon exercise of outstanding options, warrants and rights |
Weighted-average
exercise price of outstanding options, warrants and rights |
|
Number of securities
remaining available for future issuance under equity compensation plans (excluding securities reflected in column (a)) |
||
|
|
(a)
|
(b)
|
|
(c)
|
||
|
Equity compensation plans approved by security holders
|
796,934
|
$24.64
|
*
|
2,680,075
|
||
|
Equity compensation plans not approved by security holders
|
—
|
—
|
|
—
|
||
*Applicable only to approximately
4,000
outstanding options. Other outstanding share units have no exercise price.
Issuer Purchases of Equity Securities
|
Period
|
Total Number of
Shares Purchased |
Average
Price Paid per Share |
Total Number
of Shares Purchased as Part of Publicly Announced Plans or Programs |
Approximate Dollar
Value of Shares that May Yet Be Purchased Under the Plans or Programs * (in thousands) |
||||
|
October 1 - 31, 2014
|
496,623
|
$44.77
|
496,623
|
$111,869
|
||||
|
November 1 - 30, 2014
|
363,388
|
$45.48
|
363,388
|
$97,880
|
||||
|
December 1 - 31, 2014
|
348,474
|
$46.86
|
348,474
|
$181,542
|
||||
|
Total
|
1,208,485
|
$45.59
|
1,208,485
|
|||||
* Under its current plan begun in November 2010, the ProAssurance Board of Directors has authorized
$500 million
for the repurchase of common shares or the retirement of outstanding debt, including
$200 million
authorized in 2014. This is ProAssurance's only plan for the repurchase of common shares, and the plan has no expiration date.
26
|
|
Year Ended December 31
|
|||||||||||||||||||
|
|
2014
|
2013
|
2012
|
2011
|
2010
|
|||||||||||||||
|
|
(In thousands except per share data)
|
|||||||||||||||||||
|
Selected Financial Data
(1)
|
||||||||||||||||||||
|
Gross premiums written
|
$
|
779,609
|
|
$
|
567,547
|
|
$
|
536,431
|
|
$
|
565,895
|
|
$
|
533,205
|
|
|||||
|
Net premiums earned
|
699,731
|
|
527,919
|
|
550,664
|
|
565,415
|
|
519,107
|
|
||||||||||
|
Net investment income
|
125,557
|
|
129,265
|
|
136,094
|
|
140,956
|
|
146,380
|
|
||||||||||
|
Equity in earnings (loss) of unconsolidated subsidiaries
|
3,986
|
|
7,539
|
|
(6,873
|
)
|
(9,147
|
)
|
1,245
|
|
||||||||||
|
Net realized investment gains (losses)
|
14,654
|
|
67,904
|
|
28,863
|
|
5,994
|
|
17,342
|
|
||||||||||
|
Other revenues
|
8,398
|
|
7,551
|
|
7,106
|
|
13,566
|
|
7,991
|
|
||||||||||
|
Total revenues
|
852,326
|
|
740,178
|
|
715,854
|
|
716,784
|
|
692,065
|
|
||||||||||
|
Net losses and loss adjustment expenses
|
363,084
|
|
224,761
|
|
179,913
|
|
162,287
|
|
221,115
|
|
||||||||||
|
Net income (2)
|
$
|
196,565
|
|
$
|
297,523
|
|
$
|
275,470
|
|
$
|
287,096
|
|
$
|
231,598
|
|
|||||
|
Net income per share (3):
|
||||||||||||||||||||
|
Basic
|
$
|
3.32
|
|
$
|
4.82
|
|
$
|
4.49
|
|
$
|
4.70
|
|
$
|
3.64
|
|
|||||
|
Diluted
|
$
|
3.30
|
|
$
|
4.80
|
|
$
|
4.46
|
|
$
|
4.65
|
|
$
|
3.60
|
|
|||||
|
Weighted average shares outstanding (3):
|
||||||||||||||||||||
|
Basic
|
59,285
|
|
61,761
|
|
61,342
|
|
61,140
|
|
63,576
|
|
||||||||||
|
Diluted
|
59,525
|
|
62,020
|
|
61,833
|
|
61,684
|
|
64,351
|
|
||||||||||
|
Balance Sheet Data, as of December 31
|
||||||||||||||||||||
|
Total investments
|
$
|
4,009,707
|
|
$
|
3,941,045
|
|
$
|
3,926,902
|
|
$
|
4,090,541
|
|
$
|
3,990,431
|
|
|||||
|
Total assets
|
5,169,160
|
|
5,150,099
|
|
4,876,578
|
|
4,998,878
|
|
4,875,056
|
|
||||||||||
|
Reserve for losses and loss adjustment expenses
|
2,058,266
|
|
2,072,822
|
|
2,054,994
|
|
2,247,772
|
|
2,414,100
|
|
||||||||||
|
Long-term debt
|
250,000
|
|
250,000
|
|
125,000
|
|
49,687
|
|
51,104
|
|
||||||||||
|
Total liabilities
|
3,011,216
|
|
2,755,685
|
|
2,605,998
|
|
2,834,425
|
|
3,019,193
|
|
||||||||||
|
Total capital
|
$
|
2,157,944
|
|
$
|
2,394,414
|
|
$
|
2,270,580
|
|
$
|
2,164,453
|
|
$
|
1,855,863
|
|
|||||
|
Total capital per share of common stock outstanding (3)
|
$
|
38.17
|
|
$
|
39.13
|
|
$
|
36.85
|
|
$
|
35.42
|
|
$
|
30.17
|
|
|||||
|
Common stock outstanding, period end (3)
|
56,534
|
|
61,197
|
|
61,624
|
|
61,107
|
|
61,506
|
|
||||||||||
|
(1)
|
Includes acquired entities since date of acquisition only.
|
|
(2)
|
Includes a loss on extinguishment of debt of
$2.2 million
for the year ended December 31, 2012.
|
|
(3)
|
For all periods presented, share and per share amounts reflect the effect of the two-for-one stock split effected in the form of a stock dividend that was effective December 27, 2012.
|
27
The following discussion should be read in conjunction with the Consolidated Financial Statements and Notes to those statements which accompany this report. A glossary of insurance terms and phrases is available on the investor section of our website. Throughout the discussion, references to “ProAssurance”, “PRA”, “Company”, “we”, “us” and “our” refer to ProAssurance Corporation and its consolidated subsidiaries. The discussion contains certain forward-looking information that involves risks and uncertainties. As discussed under the heading "Forward-Looking Statements”, our actual financial condition and operating results could differ significantly from these forward-looking statements.
ProAssurance Overview
We are an insurance holding company and our operating results are primarily derived from the operations of our insurance subsidiaries, which provide professional liability insurance for healthcare professionals and facilities, professional liability insurance for attorneys, liability insurance for medical technology and life sciences risks, and, effective January 1, 2014, workers' compensation insurance. We are also a
58%
capital provider to Syndicate 1729, which began underwriting and reinsuring a range of property and casualty insurance lines effective January 1, 2014.
We report our results in four distinct segments, based on the operational focus of the segment. Our Specialty Property and Casualty (Specialty P&C) segment includes our professional liability business and our medical technology and life sciences business. Our Workers' Compensation segment includes the business acquired through our January 1, 2014 purchase of Eastern and includes workers' compensation insurance for employers, groups and associations. Our Lloyd's Syndicate segment includes operating results from our participation in Lloyd's Syndicate 1729, which began operations January 1, 2014. Information regarding Lloyd's operations derived from U.K. based entities is reported on a quarter delay, although investment results associated with our Funds at Lloyd's (FAL) investments are reported concurrently as those results are available on an earlier time frame. Our Corporate segment includes our U.S. investment operations which are managed at the corporate level, non-premium revenues generated outside of our insurance entities, corporate expenses, interest and U.S. income taxes. Additional information regarding our segments is included in Note 15 of the Notes to Consolidated Financial Statements and in Part I.
Growth Opportunities and Outlook
We expect our long-term growth to come through controlled expansion of our existing operations and through the acquisition of other specialty insurance companies or books of business. Growth through acquisition is often opportunistic and cannot be predicted.
We operate in very competitive markets and face strong competition from other insurance companies for all of our insurance products. Healthcare professional liability insurance represents a significant portion of our gross premiums written (
58%
in 2014, excluding tail) and the healthcare market has been trending toward the formation of larger medical practice groups, and the employment of physicians by hospitals. Large medical groups and facilities frequently manage their healthcare professional liability exposure outside of the traditional insurance marketplace using self-insured mechanisms and other risk sharing arrangements. In response to these trends, we offer products designed to provide greater risk sharing options to hospitals and large physician groups.
We have expanded our lines of business in new directions by acquiring Eastern, a provider of workers' compensation insurance, on January 1, 2014 and Medmarc, an underwriter of products liability insurance for medical technology and life sciences companies, on January 1, 2013. We have also been a consistent acquirer of other physician insurers, most recently IND in 2012, APS in 2010 and PICA in 2009. Other 2009 acquisitions included an agency largely focused on the professional liability needs of allied healthcare providers and an insurer focused on the legal professional liability market. We continue to see new opportunities from each of the acquisitions and believe each will provide organic growth through expansion in their existing markets and relationships.
Late in 2013, we completed the process of becoming a corporate member of Lloyd's of London, an internationally recognized specialist insurance market. We are the majority (
58%
) capital provider to Syndicate 1729, which began underwriting and reinsuring business as of January 1, 2014. Syndicate 1729 will cover a range of property and casualty insurance and reinsurance lines, and has a maximum underwriting capacity of
£75 million
for the 2015 underwriting year, of which
£43.2 million
(
$67.2 million
at
December 31, 2014
) is our allocated underwriting capacity as a corporate member.
We believe our emphasis on fair treatment of our insureds and other important stakeholders through our commitment to “Treated Fairly” has enhanced our market position and differentiated us from other insurers. We will continue to practice the values of “Treated Fairly” in all of our activities, and we believe that as we reach more customers with this message we will continue to improve retention and add new insureds.
28
Key Performance Measures
We have sustained our financial stability during difficult market conditions through responsible underwriting, pricing and loss reserving practices and through conservative investment practices. We are committed to maintaining prudent operating and financial leverage and to conservatively investing our assets. We recognize the importance that our customers and producers place on the financial strength of our principal insurance subsidiaries and we manage our business to protect our financial security.
We consider a number of performance measures, including the following:
|
•
|
The
net loss ratio
is calculated as net losses incurred divided by net premiums earned and is a component of underwriting profitability.
|
|
•
|
The
underwriting expense ratio
is calculated as underwriting, policy acquisition and operating expenses incurred divided by net premiums earned and is a component of underwriting profitability.
|
|
•
|
The
combined ratio
is the sum of the underwriting expense ratio and the net loss ratio and measures underwriting profitability.
|
|
•
|
The
investment income ratio
is calculated as net investment income divided by net premiums earned and measures the contribution investment earnings provides to our overall profitability.
|
|
•
|
The
operating ratio
is the combined ratio, less the investment income ratio. This ratio provides the combined effect of investment income and underwriting profitability.
|
|
•
|
The
tax ratio
is calculated as total income tax expense divided by income (loss) before income taxes and measures our effective tax rate.
|
|
•
|
Return on equity (ROE)
is calculated as net income for the period divided by the average of beginning and ending shareholders’ equity. This ratio measures our overall after-tax profitability and shows how efficiently invested capital is being used.
|
|
•
|
Growth in book value.
Book value per share is calculated as total shareholders’ equity at the balance sheet date divided by the total number of common shares outstanding. This ratio measures the net worth of the company to shareholders on a per-share basis. The declaration of dividends decreases book value per share. Growth in book value per share adjusted for dividends declared is an indicator of overall profitability.
|
We particularly focus on our combined ratio and investment returns, both of which directly affect our ROE and growth in our book value. Historically we have targeted a long-term average ROE of 12% to 14%. Given the persistent low interest rate environment which prevails in the United States and the soft pricing environment for our products, the realization of this long-term ROE target in the next few years will likely prove difficult.
Our emphasis on rate adequacy, selective underwriting, effective claims management and prudent investments is a key factor in our achievement of our ROE target. We closely monitor premium revenues, losses and loss adjustment costs, and underwriting and policy acquisition expenses. Our overall investment strategy is to focus on maximizing current income from our investment portfolio while maintaining safety, liquidity, duration and portfolio diversification. While we engage in activities that generate other income, such activities, principally insurance agency services, do not constitute a significant use of our resources or a significant source of revenues or profits.
Critical Accounting Estimates
Our Consolidated Financial Statements are prepared in conformity with U.S. generally accepted accounting principles (GAAP). Preparation of these financial statements requires us to make estimates and assumptions that affect the amounts we report on those statements. We evaluate these estimates and assumptions on an ongoing basis based on current and historical developments, market conditions, industry trends and other information that we believe to be reasonable under the circumstances. There can be no assurance that actual results will conform to our estimates and assumptions; reported results of operations may be materially affected by changes in these estimates and assumptions.
Management considers the following accounting estimates to be critical because they involve significant judgment by management and the effect of those judgments could result in a material effect on our financial statements.
Reserve for Losses and Loss Adjustment Expenses
The largest component of our liabilities is our reserve for losses and loss adjustment expenses ("reserve for losses" or "reserve"), and the largest component of expense for our operations is incurred losses and loss adjustment expenses (also referred to as “losses and loss adjustment expenses”, “incurred losses”, “losses incurred”, and “losses”). Incurred losses reported in any period reflect our estimate of losses incurred related to the premiums earned in that period as well as any changes to our previous estimate of the reserve required for prior periods.
29
As of
December 31, 2014
our reserve is almost entirely comprised of long-tail exposures. The estimation of long-tailed losses is inherently difficult and is subject to significant judgment on the part of management. Due to the nature of our claims, our loss costs, even for claims with similar characteristics, can vary significantly depending upon many factors, including but not limited to: the specific characteristics of the claim and the manner in which the claim is resolved. Long-tailed insurance is characterized by the extended period of time typically required to assess the viability of a claim, potential damages, if any, and to then reach a resolution of the claim. The claims resolution process may extend to more than five years. The combination of continually changing conditions and the extended time required for claim resolution results in a loss cost estimation process that requires actuarial skill and the application of significant judgment, and such estimates require periodic modification.
Our reserve is established by management after taking into consideration a variety of factors including premium rates, claims frequency, historical paid and incurred loss development trends, the expected effect of inflation, general economic trends, the legal and political environment, and the conclusions reached by our internal and consulting actuaries. We update and review the data underlying the estimation of our reserve for losses each reporting period and make adjustments to loss estimation assumptions that we believe best reflect emerging data. Both our internal and consulting actuaries perform an in-depth review of our reserve for losses on at least a semi-annual basis using the loss and exposure data of our insurance subsidiaries.
We partition our reserves by accident year, which is the year in which the claim becomes our liability. As claims are incurred (reported) and claim payments are made, they are aggregated by accident year for analysis purposes. We also partition our reserves by reserve type: case reserves and IBNR reserves. Case reserves are established by our claims department based upon the particular circumstances of each reported claim and represent our estimate of the future loss costs (often referred to as expected losses) that will be paid on reported claims. Case reserves are decremented as claim payments are made and are periodically adjusted upward or downward as estimates regarding the amount of future losses are revised; reported loss is the case reserve at any point in time plus the claim payments that have been made to date. IBNR reserves represent our estimate of future development on losses that have been reported to us and our estimate of losses that have been incurred but not reported to us.
Our reserving process can be broadly grouped into three areas: the establishment of the initial reserve for risks assumed in business combinations (the acquired reserve), the establishment of the reserve for the current accident year (the initial reserve) and the re-estimation of the reserve for prior accident years (development of prior accident years). A summary of the activity in our net reserve for losses during
2014
,
2013
and
2012
is provided in the Liquidity and Capital Resources and Financial Condition section that follows under the heading "Losses."
Acquired Reserve
The acquisition of Eastern, which specializes in workers' compensation insurance and reinsurance, on January 1, 2014 increased our loss reserve by
$153.2 million
which represented the fair value of Eastern's loss reserve at the time of the acquisition. The fair value of the reserve for losses and loss adjustment expenses and related reinsurance recoverables was based on an actuarial estimate of the expected future net cash flows, a reduction of those cash flows for the time value of money determined utilizing the U.S. Treasury Yield Curve, and a risk adjustment to reflect the net present value of profit that an investor would demand in return for the assumption of the associated risks. Expected net cash flows were derived from the expected loss payment patterns included in an actuarial analysis of Eastern's reserve performed as of December 31, 2013. The fair value of the reserve, including the risk margin discussed above, exceeded the undiscounted loss reserve previously established by Eastern by
$9.3 million
; this fair value adjustment is being amortized over the average expected life of the reserve of
6
years.
Current Accident Year - Initial Reserve
Considerable judgment is required in establishing our initial reserve for any current accident year period, as there is limited data available upon which to base our case reserves. Our process for setting an initial reserve considers the unique characteristics of each line of business, but in general we rely heavily on the loss assumptions that were used to price business, as our pricing reflects our analysis of loss costs that we expect to incur relative to the business being priced.
Specialty P&C Segment.
Professional and product liability loss costs are impacted by many factors, including but not limited to, the nature of the claim, including whether or not the claim is an individual or a mass tort claim, the personal situation of the claimant or the claimant's family, the outcome of jury trials, the legislative and judicial climate where any potential litigation may occur, general economic conditions and, for claims involving bodily injury, the trend of healthcare costs. Within our Specialty P&C segment, for our healthcare professional liability (HCPL) business (
62%
of consolidated gross premiums earned for the
year ended
December 31, 2014
), we set an initial reserve using the average loss ratio used in our pricing, plus an additional provision in consideration of the historical loss volatility we and others in the industry have experienced. For our HCPL business our target loss ratio during recent accident years has approximated 75% and the provision for loss volatility has ranged from 8 to 10 percentage points, producing an overall average initial loss ratio for our HCPL
30
business of approximately 85%. We believe use of a provision for volatility considers inherent risks associated with our rate development process and the historic volatility of professional liability losses (the industry has experienced accident year loss ratios as high as 163% and as low as 53% over the past 30 years) and produces a reasonable best estimate of the reserve required to cover actual ultimate unpaid losses. A similar practice is followed for our legal professional liability business (
4%
of consolidated gross premiums earned for the
year ended
December 31, 2014
).
The risks insured in our medical technology and life sciences products liability business (
5%
of consolidated gross premiums earned for the
year ended
December 31, 2014
) are more varied, and policies are individually priced based on the risk characteristics of the policy. Therefore, for this business we establish an initial reserve using our most recently developed actuarial estimates of losses expected to be incurred based on factors which include: results from prior analysis of similar business, industry indications, observed trends and judgment. The products liability line of business exhibits similar volatility to HCPL, and the actuarial pricing estimate includes a provision for this volatility.
Workers' Compensation Segment
. Many factors affect the ultimate losses incurred for our workers' compensation coverages (
28%
of consolidated gross premiums earned for the
year ended
December 31, 2014
), including, but not limited to, the type and severity of the injury, age and occupation of the injured worker, the estimated length of disability, medical treatment and related costs, and the jurisdiction of the injury occurrence. We use various actuarial methodologies in developing our workers’ compensation reserve combined with a review of the exposure base generally based upon payroll. For the current accident year, given the lack of seasoned information, the different actuarial methodologies produce results with significant variability; therefore, more emphasis is placed on supplementing the actuarial methodologies used with trends in exposure base, medical expense inflation, general inflation, severity, and claim counts, among other things, to select an expected loss ratio.
Development of Prior Accident Years
In addition to setting the initial reserve for the current accident year, each period we reassess the amount of reserve required for prior accident years.
The foundation of our reserve re-estimation process is an actuarial analysis that is performed by both our internal and consulting actuaries. This very detailed analysis projects ultimate losses on a line of business, geographic, coverage layer and accident year basis. The procedure uses of the most representative data for each partition, capturing its unique patterns of development and trends. In all there are over 140 different partitions of our business for purposes of this analysis. We believe that the use of consulting actuaries provides an independent view of our loss data as well as a broader perspective on industry loss trends.
For both the Specialty P&C and Workers' Compensation segments the analysis performed by the consulting actuaries analyzes each partition of our business in a variety of ways and uses multiple actuarial methodologies in performing these analyses, including:
|
•
|
Bornhuetter-Ferguson (Paid and Reported) Method
|
|
•
|
Paid Development Method
|
|
•
|
Reported Development Method
|
|
•
|
Average Paid Value Method
|
|
•
|
Average Reported Value Method
|
|
•
|
Backward Recursive Development Method
|
|
•
|
The Adjusted Reported and the Adjusted Paid Methods
|
A brief description of each method follows.
Bornhuetter-Ferguson Method
. We use both the Paid and the Reported Bornhuetter-Ferguson methods. The Paid method assigns partial weight to initial expected losses for each accident year (initial expected losses being the first established case and IBNR reserves for a specific accident year) and partial weight to paid to-date losses. The Reported method assigns partial weight to the initial expected losses and partial weight to current expected losses. The weights assigned to the initial expected losses decrease as the accident year matures.
Paid Development and Reported Development Method
. These methods use historical, cumulative losses (paid losses for the Paid Development Method, reported losses for the Reported Development Method) by accident year and develop those actual losses to estimated ultimate losses based upon the assumption that each accident year will develop to estimated ultimate cost in a manner that is analogous to prior years, adjusted as deemed appropriate for the expected effects of known changes in the claim payment environment (and case reserving environment for the Reported Development Method), and, to the extent necessary, supplemented by analyses of the development of broader industry data.
31
Average Paid Value
and
Average Reported Value Methods.
In these methods, average claim cost data (paid claim cost for the Average Paid Value Method and reported claim cost for the Reported Value Method) is developed to an ultimate average cost level by report year based on historical data. Claim counts are similarly developed to an ultimate count level. The average claim cost (after rounding and adjustment, if necessary, to accommodate report year data that is not considered to be predictive) is then multiplied by the ultimate claim counts by report year to derive ultimate loss and ALAE.
Backward Recursive Development Method
. This method is an extrapolation of the movements in case reserve adequacy in order to estimate unpaid loss costs. Historical data showing incremental changes to case reserves over progressive time periods is used to derive factors that represent the ratio of case reserve values at successive maturities. Historical claims payment data showing the additional payments in progressive time periods is used to derive factors that represent the portion of a case reserve paid in the following period. Starting from the most mature period, after which all of the case reserve is paid and the case reserve is exhausted, the next prior ultimate development factor for the prior case reserve can be calculated as the case factor times the established ultimate development factor plus the paid factor. For each successive prior maturity, the ultimate development factor is calculated similarly. The result of multiplying the ultimate development factor times the case reserve is the total indicated unpaid amount.
The Adjusted Reported and the Adjusted Paid Methods.
These methods
are based on the premise that the relative change in a given accident year's adjusted reported loss estimates (Adjusted Reported Method) or adjusted paid losses (Adjusted Paid Method) from one evaluation point to the next is similar to changes observed for earlier accident years at the same evaluation points. In the Adjusted Reported Method reported loss estimates are adjusted to reflect a common case reserve adequacy basis. In the Adjusted Paid Method, the historical paid loss experience is adjusted to reflect a common claim settlement rate basis. We principally use these methods to evaluate reserves for our legal liability coverages.
Generally, methods such as the Bornhuetter-Ferguson method are used on more recent accident years where we have less data on which to base our analysis. As time progresses and we have an increased amount of data for a given accident year, we begin to give more confidence to the development and average methods, as these methods typically rely more heavily on our own historical data. These methods emphasize different aspects of loss reserve estimation and provide a variety of perspectives for our decisions.
Certain of the methodologies utilized to estimate the ultimate losses for each partition of our reserves consider the actual amounts paid. Paid data is particularly influential when a large portion of known claims have been closed, as is the case for older accident years. In selecting a point estimate for each partition, management considers the extent to which trends are emerging consistently for all partitions and known industry trends. Thus, actual, rather than estimated severity trends are given more consideration. If actual severity trends are lower than those estimated at the time that reserves were previously established, the recognition of favorable development is indicated. This is particularly true for older accident years where our actuarial methodologies give more weight to actual loss costs (severity).
The various actuarial methods discussed above are applied in a consistent manner from period to period. In addition, we perform statistical reviews of claims data such as claim counts, average settlement costs and severity trends when establishing our reserves.
We utilize the selected point estimates of ultimate losses to develop estimates of ultimate losses recoverable from reinsurers, based on the terms and conditions of our reinsurance agreements. An overall estimate of the amount receivable from reinsurers is determined by combining the individual estimates. Our net reserve estimate is the gross reserve point estimate less the estimated reinsurance recovery.
For our workers’ compensation segment we utilize the various actuarial methodologies discussed above, with particular reliance on incurred development, paid loss development and Bornhuetter-Ferguson, to develop our reserve for each accident year. The actuarial review includes the stratification of claims data (lost item claims, medical only claims) using different variations that allow us to identify trends that may not be readily identifiable if the data was evaluated only in the aggregate. Incurred and paid loss development factors are key assumptions in the reserve estimation process and are based on our historical incurred and paid loss development patterns. As accident years mature, the various actuarial methodologies produce more consistent loss estimates.
Use of Judgment
Even though the actuarial process is highly technical, it is also highly judgmental, both as to the selection of the data used in the various actuarial methodologies (e.g., initial expected loss ratios and loss development factors) and in the interpretation of the output of the various methods used. Each actuarial method generally returns a different value and for the more recent accident years the variations among the various methodologies can be significant. For each partition of our reserves, the results of the various methods, along with the supplementary statistical data regarding such factors as closed with and without indemnity ratios, claim severity trends, the expected duration of such trends, changes in the legal and legislative environment and the current economic environment, are used to develop a point estimate based upon management's judgment and past
32
experience. The process of selecting the point estimate is based upon the judgment of management taking into consideration the actuarial methods and other environmental factors discussed previously. The series of selected point estimates is then combined to produce an overall point estimate for ultimate losses.
Given the potential for unanticipated volatility for long-tailed lines of business, we are cautious in giving full credibility to emerging trends that, when more fully mature, may lead to the recognition of either favorable or adverse development of our losses. There may be trends, both positive and negative, reflected in the numerical data both within our own information and in the broader marketplace that mitigate or reverse as time progresses and additional data becomes available. This is particularly true for our HCPL business which has historically exhibited significant volatility as previously discussed.
HCPL.
Over the past several years the most influential factor affecting the analysis of our HCPL reserves and the related development recognized has been the change, or lack thereof, in the severity of claims. The severity trend is an explicit component of our pricing models, whereas in our reserving process the severity trend's impact is implicit. Our estimate of this trend and our expectations about changes in this trend impact a variety of factors, from the selection of expected loss ratios to the ultimate point estimates established by management.
Because of the implicit and wide-ranging nature of severity trend assumptions on the loss reserving process it is not practical to specifically isolate the impact of changing severity trends. However, because severity is an explicit component of our HCPL pricing process we can better isolate the impact that changing severity can have on our loss costs and loss ratios as regards our pricing models for this business component. Our current HCPL pricing models assume a severity trend of 2% to 3% in most states and lines of business. If the severity trend were to be higher by 1 percentage point, the impact would be an increase in our expected loss ratio for this business of 3.2 percentage points, based on current claim disposition patterns. An increase in the severity trend of 3 percentage points would result in a 10.1 percentage point increase in our expected loss ratio. Due to the long tailed nature of our claims and the previously discussed historical volatility of loss costs, selection of a severity trend assumption is a subjective process that is inherently likely to prove inaccurate over time. Given the long-tail and volatility, we are generally cautious in making changes to the severity assumptions within our pricing models. Also of note is that all open claims and accident years are generally impacted by a change in the severity trend, which compounds the effect of such a change.
For the 2004 to 2009 accident years, both our internal and consulting actuaries observed an unprecedented reduction in the frequency of HCPL claims (or number of claims per exposure unit) that cannot be attributed to any single factor. We believe that much of the reduction in claim frequency is the result of a decline in the filing of non-meritorious lawsuits that have historically been dismissed or otherwise resulted in no payment of indemnity on behalf of our insureds. With fewer non-meritorious claims being filed we expect that the claims that are filed have the potential for greater average losses, or greater severity. As a result, we cannot be certain as to the impact this decline will ultimately have on the average cost of claims, and this has complicated the selection or an appropriate severity trend for our pricing model for these lines. It has also made it more challenging to factor severity into the various actuarial methodologies we use to evaluate our reserve. Based on weighted average of payments, typically 85% of our HCPL claims are resolved after eight years for a given accident year. Due to this long tail, we continue to be uncertain of the full impact of the observed decline in frequency and whether the expected increase in severity will materialize.
Although we remain uncertain regarding the ultimate severity trend to project into the future due to the long-tailed nature of our business, we have given consideration to observed loss costs in setting our rates. For our HCPL business this practice has resulted in rate reductions in recent years. For example, on average, excluding our podiatry business acquired in 2009, we have gradually reduced the premium rates we charge on our standard physician renewal business (our largest HCPL line) by approximately
17%
from the beginning of
2006
to
December 31, 2014
. Loss ratios for the current accident years have thus remained fairly constant because expected loss reductions have been reflected in our rates.
Workers' Compensation.
Severity has not historically been an influential factor affecting our workers' compensation analysis of reserves, as claims are typically resolved more quickly. As previously mentioned, the determination and calculation of loss development factors requires considerable judgment. In particular the selection of tail factors requires considerable judgment as they are determined in the absence of direct loss development history and thus require reliance upon industry data which may not be representative of the Company’s data and experience.
33
Loss Development
We recognized net favorable reserve development of
$182 million
for the
year ended
December 31, 2014
, of which
$181 million
related to our Specialty P&C segment and
$1 million
related to our Workers' Compensation segment. The development recognized within the Specialty P&C segment was primarily attributable to the favorable resolution of HCPL claims during the period and an evaluation of established case reserves and paid claims data that indicated that the actual severity trend associated with the remaining HCPL claims is less than we had previously estimated. The Specialty P&C segment also reflects, to a lesser degree, favorable development attributable to the products liability line. Favorable reserve development recognized within the traditional business of our Workers' Compensation segment includes the amortization of the purchase accounting fair value adjustment of
$1.6 million
for
2014
, and was partially offset by unfavorable reserve development of
$0.3 million
for the annual period recognized by our segregated portfolio cells (SPCs), which are evaluated at the cell level. Because a relatively small number of claims are open per cell, the closing of claims can affect the actuarial projections for the remaining open claims in the cell to an extent that indicates development should be recognized for the cell.
Specialty P&C Segment
Professional Liability
Our professional liability line of business includes both our HCPL and legal professional lines, with our HCPL line representing the largest component of our reserve. In support of our concern that the decline in frequency will result in a higher severity trend for our HCPL claims, we saw our closed-with-indemnity-payment ratio (i.e., the number of claims closed with an indemnity or loss payment as compared to the total number of closed claims) for our claims increase from 10% in 2005 to
15%
in
2014
. While this trend has been in keeping with our expectations, the anticipated increase in severity incorporated into our loss assumptions has not occurred. Rather, we have experienced lower than expected severity which has been the primary driver of the favorable development recognized in recent years.
The following table presents additional information about the loss development for our professional liability line of business:
|
(In thousands)
|
2014
|
2013
|
2012
|
||||||||||
|
Accident Years
|
Estimated Ultimate Losses, Net of Reinsurance at December 31, 2014
|
Reserve Development (favorable) unfavorable
|
% of Known Claims Closed
|
Reserve Development (favorable) unfavorable
|
% of Known Claims Closed
|
Reserve Development (favorable) unfavorable
|
% of Known Claims Closed
|
||||||
|
2014
|
$395,067
|
N/A
|
19.8%
|
N/A
|
N/A
|
N/A
|
N/A
|
||||||
|
2013
|
435,516
|
$14
|
53.4%
|
N/A
|
18.7%
|
N/A
|
N/A
|
||||||
|
2012
|
465,722
|
(7,528)
|
73.2%
|
$5,905
|
46.6%
|
N/A
|
13.5%
|
||||||
|
2011
|
450,124
|
(37,246)
|
84.5%
|
(11,022)
|
69.5%
|
$(4,889)
|
45.0%
|
||||||
|
2010
|
434,458
|
(34,399)
|
91.8%
|
(26,032)
|
82.4%
|
(13,612)
|
68.8%
|
||||||
|
2009
|
395,560
|
(24,995)
|
94.9%
|
(44,086)
|
89.0%
|
(24,378)
|
80.6%
|
||||||
|
2008
|
370,919
|
(14,598)
|
97.5%
|
(38,233)
|
94.6%
|
(55,659)
|
90.3%
|
||||||
|
2007
|
355,276
|
(11,476)
|
98.7%
|
(34,199)
|
97.2%
|
(51,047)
|
93.9%
|
||||||
|
2006
|
337,357
|
(4,673)
|
99.2%
|
(19,680)
|
98.5%
|
(38,708)
|
97.1%
|
||||||
|
2005
|
360,029
|
(5,092)
|
99.4%
|
(14,232)
|
99.0%
|
(24,961)
|
98.4%
|
||||||
|
Prior to 2005
|
$5,891,013
|
(28,862)
|
(27,420)
|
(58,785)
|
|||||||||
An extended period of time is required to get a clear estimate of the loss cost for a given accident year. As an example, looking at the 2009 accident year for our professional liability reserves, we had resolved
80.6%
of the known claims by the end of
2012
,
89%
of the known claims by the end of
2013
, and
94.9%
of the known claims by the end of
2014
. These statistics are based on the number of reported claims; since many non-meritorious claims are resolved early, percentages of ultimate loss payments known at the same points in time are considerably lower. A similar pattern can be seen in each open accident year as demonstrated in the above table.
Historically we have resolved more than 85% of our physician and hospital professional liability claims with no indemnity payment and generally these claims are the first to be resolved. As an accident year matures, the number of claims resolved with indemnity payments progressively increases. In a similar fashion, we typically expend more in loss adjustment expenses (legal fees) as claims mature.
Based upon the additional claims closed during
2014
,
2013
and
2012
, as shown above, and better than expected severity trends, management reduced its expected ultimate losses in each of these years resulting in the recognition of corresponding amounts of favorable development in the income statements of those periods. At
December 31, 2014
,
2013
and 2012
34
management reserve estimates for the three most recent prior accident years (which have closed claim percentages below 85%) were influenced by the initial reserve estimate set for these years, moderated to reflect consideration of better than anticipated claims experience observed during the periods. Estimates for older accident years with higher percentages of closed claims were more heavily influenced by the more moderate severity trend, particularly with regard to claims closed during the periods.
This can be seen in looking at both the absolute amount of favorable reserve development recognized for the less developed accident years as well as the size of such development when compared to established ultimates for those same accident years at the end of the preceding calendar year. The following table provides this information for years ended
December 31, 2014
,
2013
and
2012
with respect to the three then most recent prior accident years:
|
($ in millions)
|
2014
|
2013
|
2012
|
||
|
Prior accident years
|
2011-2013
|
2010-2012
|
2009-2011
|
||
|
Net favorable development recognized for the specified years
|
$44.8
|
$31.1
|
$42.9
|
||
|
Development as a % of established ultimates, prior calendar year end
|
3.2%
|
2.1%
|
2.9%
|
||
Medical Technology and Life Sciences Products Liability
The following table presents additional information about the loss development for our medical technology and life sciences products liability line of business:
|
(In thousands)
|
2014
|
2013
|
|||||||
|
Accident Years
|
Estimated Ultimate Losses, Net of Reinsurance at December 31, 2014
|
Reserve Development (favorable) unfavorable
|
% of Known Claims Closed
|
Reserve Development (favorable) unfavorable
|
% of Known Claims Closed
|
||||
|
2014
|
$13,920
|
N/A
|
48.6%
|
N/A
|
N/A
|
||||
|
2013
|
12,032
|
$(2)
|
74.1%
|
N/A
|
36.1%
|
||||
|
2012
|
13,456
|
1,891
|
84.8%
|
$(1,521)
|
66.7%
|
||||
|
2011
|
18,695
|
(3,635)
|
75.8%
|
(1,330)
|
63.6%
|
||||
|
2010
|
27,169
|
(4,997)
|
94.9%
|
(371)
|
65.1%
|
||||
|
2009
|
25,740
|
(4,693)
|
95.4%
|
(3,264)
|
92.4%
|
||||
|
2008
|
46,645
|
2,997
|
99.7%
|
(3,645)
|
98.3%
|
||||
|
Prior to 2008
|
498,970
|
(3,492)
|
|
(3,619)
|
|
||||
Approximately
$10.3 million
of the total net favorable development recognized in 2014 of
$11.9 million
related to the 2008 to 2011 accident years. The development for the 2008 to 2011 accident years represents an
8.0%
reduction to the ultimates established for those reserves at December 31, 2013. Approximately
$10.1 million
of the total net favorable development recognized in 2013 of
$13.8 million
related to the 2008 to 2012 accident years. The development for the 2008 to 2012 accident years represents a
6.8%
reduction to the ultimates established for those reserves at January 1, 2013, the date the reserves were acquired. In both 2014 and 2013 the development was largely attributable to favorable results from claims closed during the year. As time has elapsed we have recognized that actual loss experience has on average been better than what we estimated. We have been cautious in recognizing the improvement, but as claims have matured and outcomes are known (claims are closed) or have become more certain for the remaining open claims, we have revised reserve estimates. We believe the need for a cautious approach is required as outcomes are uncertain and results can be significantly affected by outcomes for a small number of cases, as evidenced by the unfavorable experience shown for specific accident years in the table above.
35
Workers' Compensation Segment
The following table presents additional information about the loss development for our workers' compensation line of business:
|
(In thousands)
|
2014
|
||||
|
Accident Years
|
Estimated Ultimate Losses, Net of Reinsurance at December 31, 2014
|
Reserve Development (favorable) unfavorable
|
% of Known Claims Closed
|
||
|
2014
|
$126,854
|
N/A
|
41.4%
|
||
|
2013
|
117,314
|
$1,519
|
82.9%
|
||
|
2012
|
101,986
|
(463)
|
93.6%
|
||
|
2011
|
95,398
|
854
|
97.4%
|
||
|
2010
|
76,011
|
(288)
|
98.8%
|
||
|
2009
|
66,061
|
(412)
|
99.1%
|
||
|
Prior to 2009
|
351,705
|
(955)
|
|
||
We recognized
$0.3 million
of net unfavorable development at our SPC's related to the reserve acquired from Eastern, primarily reflecting medical severity-related claims activity in the 2013 accident year. More than offsetting this unfavorable development was
$1.6 million
in favorable reserve development in our traditional workers' compensation business related to the amortization of the purchase accounting fair value adjustment for 2014.
Variability of Loss Reserves
As previously noted, the number of data points and variables considered and the subjective process followed in establishing our loss reserve makes it impractical to isolate individual variables and demonstrate their impact on our estimate of loss reserves. However, to provide a better understanding of the potential variability in our reserves, we have modeled implied reserve ranges around our single point net reserve estimates for our various lines of business assuming different confidence levels. The ranges have been developed by aggregating the expected volatility of losses across partitions of our business to obtain a consolidated distribution of potential reserve outcomes. The aggregation of this data takes into consideration correlations among our geographic and specialty mix of business. The result of the correlation approach to aggregation is that the ranges are narrower than the sum of the ranges determined for each partition.
We have used this modeled statistical distribution to calculate an 80% and 60% confidence interval for the potential outcome of our consolidated net reserve for losses. The high and low end points of the distributions are as follows:
|
Low End Point
|
Carried Net Reserve
|
High End Point
|
|||
|
80% Confidence Level
|
$1.402 billion
|
$1.820 billion
|
$2.294 billion
|
||
|
60% Confidence Level
|
$1.516 billion
|
$1.820 billion
|
$2.102 billion
|
||
Any change in our estimate of net ultimate losses for prior years is reflected in net income in the period in which such changes are made. Over the past several years such changes reduced our estimate of net ultimate losses, resulting in a reduction of reported losses for the period and a corresponding increase in consolidated pre-tax income.
Due to the size of our consolidated reserve for losses and the large number of claims outstanding at any point in time, even a small percentage adjustment to our total reserve estimate could have a material effect on our results of operations for the period in which the adjustment is made.
36
Reinsurance
We use insurance and reinsurance (collectively, “reinsurance”) to provide capacity to write larger limits of liability, to provide protection against losses in excess of policy limits, to stabilize underwriting results in years in which higher losses occur, and to provide a mechanism for sharing risk with insureds or their affiliates. The purchase of reinsurance does not relieve us from the ultimate risk on our policies, but it does provide reimbursement for certain losses we pay.
We make a determination of the amount of insurance risk we choose to retain based upon numerous factors, including our risk tolerance and the capital we have to support it, the price and availability of reinsurance, volume of business, level of experience with a particular set of claims and our analysis of the potential underwriting results. We purchase reinsurance from a number of companies to mitigate concentrations of credit risk. We utilize a reinsurance broker to assist us in the placement of our reinsurance programs and in the analysis of the credit quality of our reinsurers. The determination of which reinsurers we choose to do business with is based upon an evaluation of their then-current financial strength, rating and stability.
We evaluate each of our ceded reinsurance contracts at inception to confirm that there is sufficient risk transfer to allow the contract to be accounted for as reinsurance under current accounting guidance. At
December 31, 2014
, all ceded contracts were accounted for as risk transferring contracts.
Our receivable from reinsurers on unpaid losses and loss adjustment expenses represents our estimate of the amount of our reserve for losses that will be recoverable under our reinsurance programs. We base our estimate of funds recoverable upon our expectation of ultimate losses and the portion of those losses that we estimate to be allocable to reinsurers based upon the terms and conditions of our reinsurance agreements. Our assessment of the collectability of the recorded amounts receivable from reinsurers considers the payment history of the reinsurer, publicly available financial and rating agency data, our interpretation of the underlying contracts and policies, and responses by reinsurers.
Given the uncertainty inherent in our estimates of losses and related amounts recoverable from reinsurers, these estimates may vary significantly from the ultimate outcome.
Under the terms of certain of our reinsurance agreements, the amount of premium that we cede to our reinsurers is based in part on the losses we recover under the agreements. Therefore we make an estimate of premiums ceded under these reinsurance agreements subject to certain maximums and minimums. Any adjustments to our estimates of losses recoverable under our reinsurance agreements or the premiums owed under our agreements are reflected in then-current operations. Due to the size of our reinsurance balances, an adjustment to these estimates could have a material effect on our results of operations for the period in which the adjustment is made.
The financial strength of our reinsurers and their ability to pay us may change in the future due to forces or events we cannot control or anticipate. We have not experienced significant collection difficulties due to the financial condition of any reinsurer as of
December 31, 2014
; however, reinsurers may periodically dispute our demand for reimbursement from them based upon their interpretation of the terms of our agreements. We have established appropriate reserves for any balances that we believe may not be ultimately collected. Should future events lead us to believe that any reinsurer will not meet its obligations to us, adjustments to the amounts recoverable would be reflected in the results of current operations. Such an adjustment has the potential to be material to the results of operations in the period in which it is recorded; however, we would not expect such an adjustment to have a material effect on our capital position or our liquidity.
Investment Valuations
We record the majority of our investments at fair value as shown in the table below. The distribution of our investments based on GAAP fair value hierarchies (levels) was as follows:
|
|
Distribution by GAAP Fair Value Hierarchy
|
December 31, 2014
|
|||||
|
|
Level 1
|
Level 2
|
Level 3
|
Total
Investments |
|||
|
Investments recorded at:
|
|||||||
|
Fair value
|
10%
|
80%
|
4%
|
94%
|
|||
|
Other valuations
|
6%
|
||||||
|
Total Investments
|
100%
|
||||||
Fair value is defined as the price that would be received to sell an asset or paid to transfer a liability in an orderly transaction between market participants at the measurement date. All of our fixed maturity and equity security investments are carried at fair value. Our short-term securities are carried at amortized cost, which approximates fair value.
Because of the number of securities we own and the complexity and cost of developing accurate fair values, we utilize multiple independent pricing services to assist us in establishing the fair value of individual securities. The pricing services provide fair values based on exchange traded prices, if available. If an exchange traded price is not available, the pricing
37
services, if possible, provide a fair value that is based on multiple broker/dealer quotes or that has been developed using pricing models. Pricing models vary by asset class and utilize currently available market data for securities comparable to ours to estimate the fair value for our security. The pricing services scrutinize market data for consistency with other relevant market information before including the data in the pricing models. The pricing services disclose the types of pricing models used and the inputs used for each asset class. Determining fair values using these pricing models requires the use of judgment to identify appropriate comparable securities and to choose a valuation methodology that is appropriate for the asset class and available data.
The pricing services provide a single value per instrument quoted. We review the values provided for reasonableness each quarter by comparing market yields generated by the supplied value versus market yields observed in the market place. We also compare yields indicated by the provided values to appropriate benchmark yields and review for values that are unchanged or that reflect an unanticipated variation as compared to prior period values. In addition, we compare provided information for consistency with our other pricing services, known market data and information from our own trades, considering both values and valuation trends. We also review weekly trades versus the prices supplied by the services. If a supplied value appears unreasonable, we discuss the valuation in question with the pricing service and make adjustments if deemed necessary. To date, our review has not resulted in any changes to the values supplied by the pricing services.
The pricing services do not provide a fair value unless an exchange traded price or multiple observable inputs are available. As a result, the pricing services may provide a fair value for a security in some periods but not others, depending upon the level of recent market activity for the security or comparable securities.
Level 1 Investments
Fair values for our equity securities and a portion of our convertible securities and short-term securities are determined using exchange traded prices. There is little judgment involved when fair value is determined using an exchange traded price. In accordance with GAAP, for disclosure purposes we classify securities valued using an exchange traded price as Level 1 securities.
Level 2 Investments
Most fixed income securities do not trade daily, and thus exchange traded prices are generally not available for these securities. However, market information (often referred to as observable inputs or market data, including but not limited to, last reported trade, non-binding broker quotes, bids, benchmark yield curves, issuer spreads, two sided markets, benchmark securities, offers and recent data regarding assumed prepayment speeds, cash flow and loan performance data) is available for most of our fixed income securities. We determine fair value for a large portion of our fixed income securities using available market information. In accordance with GAAP, for disclosure purposes we classify securities valued based on multiple market observable inputs as Level 2 securities.
Level 3 Investments
When a pricing service does not provide a value for one of our fixed maturity securities, management estimates fair value using either a single non-binding broker quote or pricing models that utilize market based assumptions which have limited observable inputs. The process involves significant judgment in selecting the appropriate data and modeling techniques to use in the valuation process. For disclosure purposes we classify fixed maturity securities valued using limited observable inputs as Level 3 securities.
We also classify as Level 3 our investment interests that are carried at equity, valued using a fund-provided net asset value (NAV) for our interest, which approximates fair value. All investments valued in this manner are LP or LLC interests that hold debt and equity securities. At
December 31, 2014
interests valued using a fund-provided NAV totaled
$133.3 million
, or
3%
of total investments, and were classified as part of our Investment in Unconsolidated Subsidiaries.
38
Investments - Other Valuation Methodologies
Certain of our investments, in accordance with GAAP for the type of investment, are measured using methodologies other than fair value. At
December 31, 2014
these investments represented approximately
6%
of total investments, and are detailed in the following table. Additional information about these investments is provided in Notes 3 and 4 of the Notes to Consolidated Financial Statements.
|
(In millions)
|
Carrying Value
|
GAAP Measurement
Method |
|||
|
Other investments:
|
|||||
|
Investments in LPs, at cost
|
$
|
53.3
|
|
Cost
|
|
|
Other, principally Federal Home Loan Bank capital stock
|
3.8
|
|
Cost
|
||
|
Total other investments
|
57.1
|
|
|||
|
Investment in unconsolidated subsidiaries:
|
|||||
|
Investments in tax credit partnerships
|
133.1
|
|
Equity
|
||
|
Equity method LPs/LLCs
|
10.1
|
|
Equity
|
||
|
Total investment in unconsolidated
|
143.2
|
|
|||
|
Business owned life insurance
|
56.4
|
|
Cash surrender value
|
||
|
Total investments - Other valuation methodologies
|
$
|
256.7
|
|
||
Investment Impairments
We evaluate our investments on at least a quarterly basis for declines in fair value that represent other than temporary impairment (OTTI). We consider an impairment to be an OTTI if we intend to sell the security or if we believe we will be required to sell the security before we fully recover the amortized cost basis of the security. Otherwise, we consider various factors in our evaluation, as discussed below.
For debt securities, we consider whether we expect to fully recover the amortized cost basis of the security, based upon consideration of some or all of the following:
|
•
|
third party research and credit rating reports;
|
|
•
|
the current credit standing of the issuer, including credit rating downgrades;
|
|
•
|
the extent to which the decline in fair value is attributable to credit risk specifically associated with the security or its issuer;
|
|
•
|
our internal assessments and those of our external portfolio managers regarding specific circumstances surrounding a security, which can cause us to believe the security is more or less likely to recover its value than other securities with a similar structure;
|
|
•
|
for asset-backed securities, the origination date of the underlying loans, the remaining average life, the probability that credit performance of the underlying loans will deteriorate in the future, and our assessment of the quality of the collateral underlying the loan;
|
|
•
|
failure of the issuer of the security to make scheduled interest or principal payments;
|
|
•
|
any changes to the rating of the security by a rating agency;
|
|
•
|
recoveries or additional declines in fair value subsequent to the balance sheet date; and
|
|
•
|
our intent to sell and whether it is more likely than not we will be required to sell the security before the recovery of its amortized cost basis.
|
In assessing whether we expect to recover the cost basis of debt securities, particularly asset-backed securities, we must make a number of assumptions regarding the cash flows that we expect to receive from the security in future periods. These judgments are subjective in nature and may subsequently be proved to be inaccurate.
We evaluate our cost method interests in LPs/LLCs for OTTI by considering whether there has been a decline in fair value below the recorded value, which involves assumptions and estimates. We receive a report from each of the LPs/LLCs at least quarterly which provides us a NAV for our interest. The NAV is based on the fair values of securities held by the LP/LLC as determined by the LP/LLC manager. We consider the most recent NAV provided, the performance of the LP/LLC relative to the market, the stated objectives of the LP/LLC, the cash flows expected from the LP/LLC and audited financial statements of the entity, if available, in considering whether an OTTI exists.
39
Our investments in tax credit partnerships are evaluated for OTTI by considering both qualitative and quantitative factors which include: whether cash flows currently expected from the investment, primarily tax benefits, equal or exceed the carrying value of the investment, whether currently expected cash flows are less than those expected at the time the investment was acquired, and our ability and intent to hold the investment until the recovery of its carrying value.
We also evaluate our holdings of Federal Home Loan Bank (FHLB) capital stock for impairment. We consider the current capital status of the FHLB, whether the FHLB is in compliance with regulatory minimum capital requirements, and the FHLB’s most recently reported operating results.
Deferred Policy Acquisition Costs
Policy acquisition costs (primarily commissions, premium taxes and underwriting salaries) which are directly related to the successful acquisition of new and renewal premiums are capitalized as deferred policy acquisition costs and charged to expense, net of ceding commissions earned, as the related premium revenue is recognized. We evaluate the recoverability of our deferred policy acquisition costs each reporting period, and any amounts estimated to be unrecoverable are charged to expense in the current period. As of
December 31, 2014
we have not determined that any amounts are unrecoverable.
ProAssurance's fair value estimate of the value of business acquired (VOBA), calculated as the present value of future earnings expected from the insurance contracts acquired, approximated the carrying value of Eastern's asset for deferred policy acquisition costs as of the acquisition date. Consequently, Eastern's asset for deferred policy acquisition costs was recognized in the purchase price allocation in lieu of recognizing an intangible asset for VOBA.
Deferred Taxes
Deferred federal income taxes arise from the recognition of temporary differences between the bases of assets and liabilities determined for financial reporting purposes and the bases determined for income tax purposes. Our temporary differences principally relate to our loss reserve, unearned premiums, deferred policy acquisition costs, unrealized investment gains (losses), and basis differences on investment assets. Deferred tax assets and liabilities are measured using the enacted tax rates expected to be in effect when such benefits are realized. We review our deferred tax assets quarterly for impairment. If we determine that it is more likely than not that some or all of a deferred tax asset will not be realized, a valuation allowance is recorded to reduce the carrying value of the asset. In assessing the need for a valuation allowance, management is required to make certain judgments and assumptions about our future operations based on historical experience and information as of the measurement period regarding reversal of existing temporary differences, carryback capacity, future taxable income (including its capital and operating characteristics) and tax planning strategies. We did not have any significant valuation allowances as of
December 31, 2014
.
Unrecognized Tax Benefits
We evaluate tax positions taken on tax returns and recognize positions in our financial statements when it is more likely than not that we will sustain the position upon resolution with a taxing authority. If recognized, the benefit is measured as the largest amount of benefit that has a greater than fifty percent probability of being realized. We review uncertain tax positions each period, considering changes in facts and circumstances, such as changes in tax law, interactions with taxing authorities and developments in case law, and make adjustments as we consider necessary. Adjustments to our unrecognized tax benefits may affect our income tax expense, and settlement of uncertain tax positions may require the use of cash. At
December 31, 2014
, our liability for unrecognized tax benefits approximated
$0.6 million
.
Goodwill
Goodwill is recognized in conjunction with acquisitions as the excess of the purchase consideration for the acquisition over the fair value of identifiable assets acquired and liabilities assumed. The fair value of identifiable assets and liabilities, and thus goodwill, is subject to redetermination within a measurement period of up to one year following completion of an acquisition.
Management evaluates the carrying value of goodwill at the segment (or reporting unit) level annually as of October 1st. If, at any time during the year, events occur or circumstances change that would more likely than not reduce the fair value below the carrying value, we also evaluate goodwill at that time.
The goodwill impairment assessment requires evaluating qualitative factors or performing a quantitative assessment to determine if a reporting unit’s carrying value is likely to exceed its fair value. For our reporting units, we elected to assess qualitative factors to determine whether it is more likely than not that the fair value of a reporting unit is less than its carrying amount. When using the qualitative approach, we considered macroeconomic factors such as industry and market conditions. We also considered reporting unit-specific events, actual financial performance versus expectations and management’s future
40
business expectations. As part of our qualitative evaluation of recently acquired reporting units with material goodwill, we considered the fact that the business had been recently acquired in an orderly transaction between market participants, and our purchase price represented fair value at acquisition. A significant amount of judgment is required in performing goodwill impairment analysis. We concluded as of our last evaluation date,
October 1, 2014
, that the fair value of our reporting units exceeded the carrying value and deemed it unnecessary to perform further testing.
Intangibles
Intangible assets with definite lives are amortized over the estimated useful life of the asset. Amortizable intangible assets primarily consist of agency and policyholder relationships, renewal rights and trade names. Intangible assets with an indefinite life, primarily state licenses, are not amortized. Increases in both amortizable and non-amortizable intangible assets during 2014 were attributable to intangible assets recognized related to the 2014 acquisition of Eastern. Intangible assets are evaluated for impairment on an annual basis. Additional information regarding intangible assets is included in Note 1 of the Notes to Consolidated Financial Statements.
Audit Premium
Workers’ compensation premiums are determined based upon the payroll of the insured, the applicable premium rates and, where applicable, an experience based modification factor. An audit of the policyholders’ records is conducted after policy expiration to make a final determination of applicable premiums. Audit premium due from or due to a policyholder as a result of an audit is reflected in net premiums earned when billed. We track, by policy, the amount of additional premium billed in final audit invoices as a percentage of payroll exposure and use this information to estimate the probable additional amount of earned, but unbilled, (EBUB) premium as of the balance sheet date. We include changes to the EBUB premium estimate in net premiums earned in the period recognized.
Accounting Changes
We did not adopt any accounting changes during
2014
that had a material effect on our results of operations nor are we aware of any accounting changes not yet adopted as of
December 31, 2014
that would have a material effect on our results of operations or financial position. Note 1 of the Notes to Consolidated Financial Statements provides additional detail regarding accounting changes.
41
Liquidity and Capital Resources and Financial Condition
Overview
ProAssurance Corporation is a holding company and is a legal entity separate and distinct from its subsidiaries. Dividends from its operating subsidiaries represent a significant source of funds for holding company obligations, including debt service and shareholder dividends. At
December 31, 2014
, we held cash and liquid investments of approximately
$402.5 million
outside our insurance subsidiaries that were available for use by the holding company without regulatory or other restriction. The holding company paid shareholder dividends totaling
$167.3 million
in January 2015.
During
2014
, our insurance subsidiaries paid dividends of
$285 million
, including extraordinary dividends of
$56 million
. Our insurance subsidiaries, in aggregate, are permitted to pay dividends of approximately
$230 million
over the course of
2015
without the prior approval of state insurance regulators. The payment of any dividend requires prior notice to the insurance regulator in the state of domicile, and the regulator may prevent the dividend if, in its judgment, payment of the dividend would have an adverse effect on the surplus of the insurance subsidiary.
Operating Activities and Related Cash Flows
The principal components of our operating cash flows are the excess of premiums collected and net investment income over losses paid and operating costs, including income taxes. Timing delays exist between the collection of premiums and the payment of losses associated with the premiums. Premiums are generally collected within the twelve-month period after the policy is written, while our claim payments are generally paid over a more extended period of time. Likewise, timing delays exist between the payment of claims and the collection of any associated reinsurance recoveries.
Operating cash flows for the years ended
December 31, 2014
,
2013
and
2012
compare as follows:
|
Operating Cash Flow
|
|||||||||||
|
Year Ended December 31,
|
|||||||||||
|
(In millions)
|
2014
|
2013
|
2012
|
||||||||
|
Cash provided by operating activities
|
$
|
96
|
|
$
|
39
|
|
$
|
91
|
|
||
|
Reconciliation of Operating Cash Flows
|
2014 vs 2013
|
2013 vs 2012
|
2012 vs 2011
|
||||||||
|
Cash provided by operating activities, prior year
|
$
|
39
|
|
$
|
91
|
|
$
|
159
|
|
||
|
Increase (decrease) in operating cash flows attributable to:
|
|||||||||||
|
Premium receipts
|
(30
|
)
|
(33
|
)
|
(12
|
)
|
|||||
|
Payments to reinsurers
|
(14
|
)
|
3
|
|
(8
|
)
|
|||||
|
Losses paid, net of reinsurance recoveries
|
(3
|
)
|
(3
|
)
|
(35
|
)
|
|||||
|
Deposit contracts
|
—
|
|
(4
|
)
|
3
|
|
|||||
|
Cash received from investments
|
(10
|
)
|
(9
|
)
|
(8
|
)
|
|||||
|
Cash paid for other expenses and operating liabilities
|
(5
|
)
|
6
|
|
13
|
|
|||||
|
Cash paid for interest on long-term debt
|
(13
|
)
|
2
|
|
1
|
|
|||||
|
Federal and state income tax payments
|
95
|
|
(3
|
)
|
(18
|
)
|
|||||
|
Operations acquired or begun during the period
|
34
|
|
(11
|
)
|
—
|
|
|||||
|
Other amounts not individually significant, net
|
3
|
|
—
|
|
(4
|
)
|
|||||
|
Cash provided by operating activities, current year
|
$
|
96
|
|
$
|
39
|
|
$
|
91
|
|
||
The comparative effect resulting from operations acquired or begun in the current year is shown separately in the reconciliation and is therefore excluded from the other amounts in the reconciliation and the related explanations below.
Premium receipt
s. The reductions in premium receipts for
2014
,
2013
and
2012
are each primarily attributable to lower premium volume in the current year as compared to the prior year. The decline for 2013 was also affected by timing changes on several large policies. Comparatively, both 2013 and 2012 were affected by a single $8 million tail policy written and fully collected in 2012; there was no similar tail policy in either 2013 or in 2011.
Payments to reinsurers
. Reinsurance contracts are generally for premiums written in a specific annual period, but, absent a commutation agreement, remain in effect until all claims under the contract have been resolved. Some contracts require annual settlements while others require settlement only after a number of years have elapsed, thus the amounts paid can vary widely from period to period. The increase in payments to reinsurers in 2014 was primarily attributable to expansion of our
42
shared risk arrangements and to payments made pursuant to our quota share reinsurance agreement with Syndicate 1729. Our 58% share of Syndicate 1729 net cash flows, identified below, reflects receipt of these payments.
Losses paid, net of reinsurance recoveries
. The timing of our net loss payments varies from period to period because the process for resolving claims is complex and occurs at an uneven pace depending upon the circumstances of the individual claim. The increase in loss payments in 2012 primarily related to the number of large settlements paid and the timing of reinsurance collections on those settlements as compared to claim settlement activity in the 2011.
Deposit contracts
. We are party to certain contracts that involve claims handling but do not transfer insurance risk. These contracts do not constitute a significant business activity for us, but did affect comparative cash flows in 2013 and 2012.
Cash received from investments
. Receipts from fixed income securities have declined due to both lower yields and a smaller fixed income portfolio. Also, the timing of dividend receipts and income distributions from our investment LPs/LLCs is uneven.
Cash paid for other expenses and operating liabilities
. Variations were attributable to the following:
|
(In millions)
|
2014 vs 2013
|
2013 vs 2012
|
2012 vs 2011
|
||||||||
|
Effect of Syndicate 1729 reporting lag (1)
|
$
|
(8.0
|
)
|
$
|
—
|
|
$
|
—
|
|
||
|
Other (2)
|
3.5
|
|
6.4
|
|
13.0
|
|
|||||
|
$
|
(4.5
|
)
|
$
|
6.4
|
|
$
|
13.0
|
|
|||
|
(1)
|
We report Syndicate 1729 activity on a one quarter lag, and, for consistency, have reported the reinsurance payment made to Syndicate 1729 during the fourth quarter of 2014 as an operating liability payment.
|
|
(2)
|
The increase for 2012 primarily reflects the effect of acquisition payments made during 2011 related to the integration costs of an entity acquired in 2010.
|
Federal and state income tax payments
. Variations in tax payments were attributable to the following:
|
(In millions)
|
2014 vs 2013
|
2013 vs 2012
|
2012 vs 2011
|
||||||||
|
Refunds and payments related to Internal Revenue Service (IRS) examination settled in 2014 (1)
|
$
|
51.1
|
|
$
|
(20.6
|
)
|
$
|
—
|
|
||
|
Final tax payments made in the current year for the prior fiscal year
|
29.6
|
|
8.3
|
|
(7.4
|
)
|
|||||
|
Estimated tax payments for the current fiscal year
|
17.0
|
|
3.4
|
|
4.8
|
|
|||||
|
Change in excess tax benefits associated with share-based compensation (2)
|
0.4
|
|
4.9
|
|
(5.3
|
)
|
|||||
|
Refunds and payments related to prior years (3)
|
(3.3
|
)
|
|
(11.4
|
)
|
||||||
|
State and other tax payments
|
0.5
|
|
1.0
|
|
1.8
|
|
|||||
|
$
|
95.3
|
|
$
|
(3.0
|
)
|
$
|
(17.5
|
)
|
|||
|
(1)
|
The effect of funds returned in 2014 and a protective tax payment made in 2013 related to an IRS examination of our 2009 and 2010 tax returns. See discussion that follows under the heading "Taxes."
|
|
(2)
|
GAAP requires that excess tax benefits recognized when shares are issued under stock compensation plans be reflected as a reduction to operating cash flows and as an increase to financing cash flows in the period the shares are issued.
|
|
(3)
|
Both 2014 and 2013 were affected by a refund received in 2013 of
$3.3 million
related to pre-acquisition tax periods of acquired entities. Comparatively, our 2012 cash flows were lower than in 2011 due to refunds received in 2011 of
$17.3 million
related to pre-acquisition tax periods of acquired entities and capital loss carry backs, and a payment made in 2011 of
$5.9 million
which related to previously recorded tax liabilities for the 2008 and 2007 tax years.
|
43
Operations acquired or begun during the period.
Expansion of our business operations has affected our operating cash flows as follows:
|
(In millions)
|
2014 vs 2013
|
2013 vs 2012
|
2012 vs 2011
|
||||||||
|
Cash flows contributed in the year operations commenced or were acquired, including the effect of transaction-related costs paid in the fiscal year in which the transaction is closed:
|
|||||||||||
|
Eastern acquisition
|
$
|
31.2
|
|
$
|
—
|
|
$
|
—
|
|
||
|
Lloyd's Syndicate operations
|
(0.9
|
)
|
—
|
|
—
|
|
|||||
|
Medmarc and IND acquisitions (1)
|
—
|
|
(7.7
|
)
|
—
|
|
|||||
|
Transaction costs (2)
|
3.2
|
|
(3.2
|
)
|
—
|
|
|||||
|
$
|
33.5
|
|
$
|
(10.9
|
)
|
$
|
—
|
|
|||
|
(1)
|
Primarily attributable to transaction costs, loss payments related to accident years prior to the acquisition, and normal expense payments for which the timing of the payment differs from the recognition of the expense.
|
|
(2)
|
In 2013 we paid approximately $3.2 million related to the formation of Syndicate 1729, which, comparatively, increased 2014 cash flows.
|
Losses
The following table, known as the Analysis of Reserve Development, presents information over the preceding ten years regarding the payment of our losses as well as changes to (the development of) our estimates of losses during that time period. As noted in the table, ProAssurance has completed various acquisitions over the ten year period which have affected original and re-estimated gross and net reserve balances as well as loss payments.
The table includes losses on both a direct and an assumed basis and is net of anticipated reinsurance recoverables. The gross liability for losses before reinsurance, as shown on the balance sheet, and the reconciliation of that gross liability to amounts net of reinsurance are reflected below the table. We do not discount our reserve for losses to present value. Information presented in the table is cumulative and, accordingly, each amount includes the effects of all changes in amounts for prior years. The table presents the development of our balance sheet reserve for losses; it does not present accident year or policy year development data. Conditions and trends that have affected the development of liabilities in the past may not necessarily occur in the future. Accordingly, it is not appropriate to extrapolate future redundancies or deficiencies based on this table.
The following may be helpful in understanding the Analysis of Reserve Development:
|
•
|
The line entitled “Reserve for losses, undiscounted and net of reinsurance recoverables” reflects our reserve for losses and loss adjustment expense, less the receivables from reinsurers, each as reported in our consolidated financial statements at the end of each year (the Balance Sheet Reserves).
|
|
•
|
The section entitled “Cumulative net paid, as of” reflects the cumulative amounts paid as of the end of each succeeding year with respect to the previously recorded Balance Sheet Reserves.
|
|
•
|
The section entitled “Re-estimated net liability as of” reflects the re-estimated amount of the liability previously recorded as Balance Sheet Reserves that includes the cumulative amounts paid and an estimate of the remaining net liability based upon claims experience as of the end of each succeeding year (the Net Re-estimated Liability).
|
|
•
|
The line entitled “Net cumulative redundancy (deficiency)” reflects the difference between the previously recorded Balance Sheet Reserve for each applicable year and the Net Re-estimated Liability relating thereto as of the end of the most recent fiscal year.
|
44
|
Analysis of Reserve Development
|
|||||||||||||||||||||||||||||||||||||||||||
|
(in thousands)
|
|||||||||||||||||||||||||||||||||||||||||||
|
December 31,
|
|||||||||||||||||||||||||||||||||||||||||||
|
|
2004
|
2005
|
2006
|
2007
|
2008
|
2009
|
2010
|
2011
|
2012
|
2013
|
2014
|
||||||||||||||||||||||||||||||||
|
Reserve for losses, undiscounted and net of reinsurance recoverables
|
$
|
1,544,981
|
|
$
|
1,896,743
|
|
$
|
2,236,385
|
|
$
|
2,232,596
|
|
$
|
2,111,112
|
|
$
|
2,159,571
|
|
$
|
2,136,664
|
|
$
|
2,000,114
|
|
$
|
1,860,076
|
|
$
|
1,825,304
|
|
$
|
1,820,300
|
|
||||||||||
|
Cumulative net paid, as of:
|
|||||||||||||||||||||||||||||||||||||||||||
|
One Year Later
|
199,617
|
|
242,608
|
|
331,295
|
|
312,348
|
|
278,655
|
|
291,654
|
|
264,597
|
|
300,703
|
|
311,835
|
|
343,197
|
|
|||||||||||||||||||||||
|
Two Years Later
|
384,050
|
|
503,271
|
|
600,500
|
|
550,042
|
|
468,277
|
|
476,682
|
|
491,657
|
|
526,903
|
|
563,805
|
|
|||||||||||||||||||||||||
|
Three Years Later
|
578,455
|
|
697,349
|
|
787,347
|
|
694,113
|
|
584,410
|
|
614,369
|
|
639,220
|
|
682,576
|
|
|||||||||||||||||||||||||||
|
Four Years Later
|
728,582
|
|
825,139
|
|
897,814
|
|
777,114
|
|
666,105
|
|
706,091
|
|
737,253
|
|
|||||||||||||||||||||||||||||
|
Five Years Later
|
805,270
|
|
901,644
|
|
955,728
|
|
833,471
|
|
724,377
|
|
761,659
|
|
|||||||||||||||||||||||||||||||
|
Six Years Later
|
861,512
|
|
937,984
|
|
995,921
|
|
874,479
|
|
758,863
|
|
|||||||||||||||||||||||||||||||||
|
Seven Years Later
|
888,065
|
|
959,870
|
|
1,022,273
|
|
898,646
|
|
|||||||||||||||||||||||||||||||||||
|
Eight Years Later
|
901,867
|
|
980,665
|
|
1,038,821
|
|
|||||||||||||||||||||||||||||||||||||
|
Nine Years Later
|
919,840
|
|
996,393
|
|
|||||||||||||||||||||||||||||||||||||||
|
Ten Years Later
|
930,128
|
|
|||||||||||||||||||||||||||||||||||||||||
|
Re-estimated net liability as of:
|
|||||||||||||||||||||||||||||||||||||||||||
|
End of Year
|
1,544,981
|
|
1,896,743
|
|
2,236,385
|
|
2,232,596
|
|
2,111,112
|
|
2,159,571
|
|
2,136,664
|
|
2,000,114
|
|
1,860,076
|
|
1,825,304
|
|
|||||||||||||||||||||||
|
One Year Later
|
1,522,000
|
|
1,860,451
|
|
2,131,400
|
|
2,047,344
|
|
1,903,812
|
|
1,925,581
|
|
1,810,799
|
|
1,728,076
|
|
1,644,203
|
|
1,644,516
|
|
|||||||||||||||||||||||
|
Two Years Later
|
1,479,773
|
|
1,764,076
|
|
1,955,903
|
|
1,829,140
|
|
1,665,832
|
|
1,615,603
|
|
1,543,650
|
|
1,498,158
|
|
1,472,259
|
|
|||||||||||||||||||||||||
|
Three Years Later
|
1,418,802
|
|
1,615,125
|
|
1,747,459
|
|
1,596,508
|
|
1,383,189
|
|
1,362,538
|
|
1,324,906
|
|
1,342,996
|
|
|||||||||||||||||||||||||||
|
Four Years Later
|
1,340,061
|
|
1,450,275
|
|
1,548,605
|
|
1,357,126
|
|
1,154,552
|
|
1,172,091
|
|
1,205,737
|
|
|||||||||||||||||||||||||||||
|
Five Years Later
|
1,234,223
|
|
1,330,039
|
|
1,366,793
|
|
1,185,051
|
|
1,019,407
|
|
1,086,027
|
|
|||||||||||||||||||||||||||||||
|
Six Years Later
|
1,158,590
|
|
1,225,114
|
|
1,249,234
|
|
1,084,422
|
|
961,808
|
|
|||||||||||||||||||||||||||||||||
|
Seven Years Later
|
1,092,186
|
|
1,148,102
|
|
1,180,804
|
|
1,041,623
|
|
|||||||||||||||||||||||||||||||||||
|
Eight Years Later
|
1,040,035
|
|
1,104,687
|
|
1,147,096
|
|
|||||||||||||||||||||||||||||||||||||
|
Nine Years Later
|
1,012,643
|
|
1,084,527
|
|
|||||||||||||||||||||||||||||||||||||||
|
Ten Years Later
|
996,312
|
|
|||||||||||||||||||||||||||||||||||||||||
|
Net cumulative redundancy (deficiency)
|
$
|
548,669
|
|
$
|
812,216
|
|
$
|
1,089,289
|
|
$
|
1,190,973
|
|
$
|
1,149,304
|
|
$
|
1,073,544
|
|
$
|
930,927
|
|
$
|
657,118
|
|
$
|
387,817
|
|
$
|
180,788
|
|
|||||||||||||
|
Original gross liability - end of year
|
$
|
1,818,635
|
|
$
|
2,224,436
|
|
$
|
2,607,148
|
|
$
|
2,559,707
|
|
$
|
2,379,468
|
|
$
|
2,422,230
|
|
$
|
2,414,100
|
|
$
|
2,247,772
|
|
$
|
2,051,428
|
|
$
|
2,072,822
|
|
|||||||||||||
|
Less: reinsurance recoverables
|
(273,654
|
)
|
(327,693
|
)
|
(370,763
|
)
|
(327,111
|
)
|
(268,356
|
)
|
(262,659
|
)
|
(277,436
|
)
|
(247,658
|
)
|
(191,352
|
)
|
(247,518
|
)
|
|||||||||||||||||||||||
|
Original net liability - end of year
|
$
|
1,544,981
|
|
$
|
1,896,743
|
|
$
|
2,236,385
|
|
$
|
2,232,596
|
|
$
|
2,111,112
|
|
$
|
2,159,571
|
|
$
|
2,136,664
|
|
$
|
2,000,114
|
|
$
|
1,860,076
|
|
$
|
1,825,304
|
|
|||||||||||||
|
Gross re-estimated liability - latest
|
$
|
1,267,771
|
|
$
|
1,400,859
|
|
$
|
1,505,436
|
|
$
|
1,283,526
|
|
$
|
1,112,413
|
|
$
|
1,214,995
|
|
$
|
1,342,924
|
|
$
|
1,482,497
|
|
$
|
1,614,541
|
|
$
|
1,859,076
|
|
|||||||||||||
|
Re-estimated reinsurance recoverables
|
(271,459
|
)
|
(316,332
|
)
|
(358,340
|
)
|
(241,903
|
)
|
(150,605
|
)
|
(128,968
|
)
|
(137,187
|
)
|
(139,501
|
)
|
(142,282
|
)
|
(214,560
|
)
|
|||||||||||||||||||||||
|
Net re-estimated liability - latest
|
$
|
996,312
|
|
$
|
1,084,527
|
|
$
|
1,147,096
|
|
$
|
1,041,623
|
|
$
|
961,808
|
|
$
|
1,086,027
|
|
$
|
1,205,737
|
|
$
|
1,342,996
|
|
$
|
1,472,259
|
|
$
|
1,644,516
|
|
|||||||||||||
|
Gross cumulative redundancy (deficiency)
|
$
|
550,864
|
|
$
|
823,577
|
|
$
|
1,101,712
|
|
$
|
1,276,181
|
|
$
|
1,267,055
|
|
$
|
1,207,235
|
|
$
|
1,071,176
|
|
$
|
765,275
|
|
$
|
436,887
|
|
$
|
213,746
|
|
|||||||||||||
* See table notes on following page.
45
Table Notes
|
•
|
Reserves for 2005 and thereafter include gross and net reserves acquired in 2005 business combinations of $183.2 million and $139.7 million, respectively.
|
|
•
|
Reserves for 2006 and thereafter include gross and net reserves acquired in 2006 business combinations of $228.4 million and $171.2 million, respectively.
|
|
•
|
Reserves for 2009 and thereafter include gross and net reserves acquired in 2009 business combinations of $169.4 million and $163.9 million, respectively.
|
|
•
|
Reserves for 2010 and thereafter include gross and net reserves acquired in 2010 business combinations of $88.1 million and $82.2 million, respectively.
|
|
•
|
Reserves for 2012 and thereafter include gross and net reserves acquired in 2012 business combinations of
$21.8 million
and
$19.2 million
, respectively, which considers reductions of
$3.6 million
and
$3.3 million
, respectively, recorded in 2013 due to the re-estimation of the fair value of the acquired reserves.
|
|
•
|
Reserves for 2013 include gross and net reserves acquired in 2013 business combinations of
$201.1 million
and
$126.0 million
, respectively.
|
|
•
|
Reserves for 2014 include gross and net reserves acquired in 2014 business combinations of
$153.2 million
and
$139.5 million
, respectively.
|
In each year reflected in the table, we have estimated our reserve for losses utilizing the management and actuarial processes discussed in Critical Accounting Estimates. Factors that have contributed to the variation in loss development are primarily related to the extended period of time required to resolve professional liability claims and include the following:
|
•
|
The HCPL legal environment deteriorated in the late 1990’s and severity began to increase at a greater pace than anticipated in our rates and reserve estimates. We addressed the adverse severity trends through increased rates, stricter underwriting and modifications to claims handling procedures, and reflected this adverse severity trend when we established our initial reserves for subsequent years.
|
|
•
|
These adverse severity trends later moderated with that moderation becoming more pronounced beginning in 2009. We have been cautious in giving full recognition to indications that the pace of severity increase had slowed, but have given measured recognition of the improved trend in our reserve estimates, as discussed more fully under “Critical Accounting Estimates—Reserve for Losses and Loss Adjustment Expenses (reserve for losses or reserve).” The favorable development was most pronounced for years 2004 to 2008, as the initial reserves for these accident years were established prior to substantial indication that severity trends were moderating. We have given stronger recognition to the lower severity trend as time has elapsed and a greater percentage of claims have closed.
|
|
•
|
A general decline in claim frequency has also been a contributor to favorable loss development. A significant portion of our policies through 2003 were issued on an occurrence basis, and a smaller portion of our ongoing business results from the issuance of extended reporting endorsements which have occurrence-like exposure. As claim frequency declined, the number of reported claims related to these coverages was less than originally expected.
|
46
Activity in our net reserve for losses during
2014
,
2013
and
2012
is summarized below:
|
|
Year Ended December 31
|
||||||||||
|
(In thousands)
|
2014
|
2013
|
2012
|
||||||||
|
Balance, beginning of year
|
$
|
2,072,822
|
|
$
|
2,054,994
|
|
$
|
2,247,772
|
|
||
|
Less reinsurance recoverables on unpaid losses and loss adjustment expenses
|
247,518
|
|
191,645
|
|
247,658
|
|
|||||
|
Net balance, beginning of year
|
1,825,304
|
|
1,863,349
|
|
2,000,114
|
|
|||||
|
Reserves acquired from acquisitions (1)
|
139,549
|
|
126,007
|
|
22,464
|
|
|||||
|
Incurred related to:
|
|||||||||||
|
Current year
|
545,168
|
|
447,510
|
|
451,951
|
|
|||||
|
Favorable development of reserves established in prior years, net (2)
|
(182,084
|
)
|
(222,749
|
)
|
(272,038
|
)
|
|||||
|
Total incurred
|
363,084
|
|
224,761
|
|
179,913
|
|
|||||
|
Paid related to:
|
|||||||||||
|
Current year
|
(93,737
|
)
|
(43,616
|
)
|
(38,439
|
)
|
|||||
|
Prior years (3)
|
(413,900
|
)
|
(345,197
|
)
|
(300,703
|
)
|
|||||
|
Total paid
|
(507,637
|
)
|
(388,813
|
)
|
(339,142
|
)
|
|||||
|
Net balance, end of year
|
1,820,300
|
|
1,825,304
|
|
1,863,349
|
|
|||||
|
Plus reinsurance recoverables on unpaid losses and loss adjustment expenses
|
237,966
|
|
247,518
|
|
191,645
|
|
|||||
|
Balance, end of year
|
$
|
2,058,266
|
|
$
|
2,072,822
|
|
$
|
2,054,994
|
|
||
(1) Includes a net reserve reduction of
$3.3 million
in 2013 due to the re-estimation of reserves acquired in a 2012 business combination.
(2) Includes net favorable development of
$1.3 million
attributable to the reserves acquired in a business combination completed in 2014.
(3) Includes prior year paid losses of
$70.7 million
in 2014 and
$33.4 million
for 2013 attributable to reserves acquired in a business combination completed in 2014 and 2013, respectively.
At
December 31, 2014
our gross reserve for losses included case reserves of approximately
$1.2 billion
and IBNR reserves of approximately
$0.9 billion
. Our consolidated gross reserve for losses on a GAAP basis exceeds the combined gross reserves of our insurance subsidiaries on a statutory basis by approximately
$0.1 billion
, which is principally due to the portion of the GAAP reserve for losses that is reflected for statutory accounting purposes as unearned premiums. These unearned premiums are applicable to extended reporting endorsements (“tail” coverage) issued without a premium charge upon death, disability or retirement of an insured who meets certain qualifications.
47
Reinsurance
Within our Specialty P&C Segment, we use insurance and reinsurance (collectively, “reinsurance”) to provide capacity to write larger limits of liability, to provide reimbursement for losses incurred under the higher limit coverages we offer, to provide protection against losses in excess of policy limits, and, in the case of risk sharing arrangements, to provide custom insurance solutions for large customer groups. Within our Workers' Compensation segment, we use reinsurance to reduce our net liability on individual risks, to mitigate the effect of significant loss occurrences (including catastrophic events), to stabilize underwriting results, and to increase underwriting capacity by decreasing leverage. The purchase of reinsurance does not relieve us from the ultimate risk on our policies, but it does provide reimbursement for certain losses we pay.
We generally reinsure risks under annual treaties (our excess of loss reinsurance arrangements) pursuant to which the reinsurers agree to assume all or a portion of all risks that we insure above our individual risk retention levels, up to the maximum individual limits offered. These arrangements are negotiated and renewed annually. Renewal dates for our professional liability, products liability and workers' compensation treaties are October 1, January 1 and May 1, respectively. There were no significant changes in the cost or structure of the agreements upon the latest renewal of each. The significant terms of our excess of loss reinsurance arrangements are detailed in the following table.
Excess of Loss Reinsurance Agreements
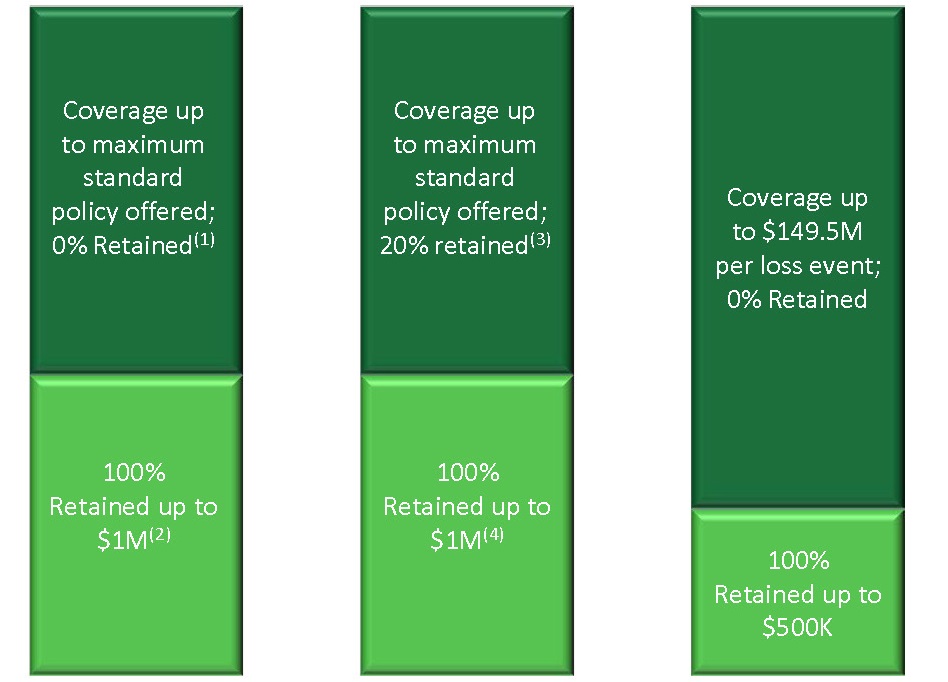
|
Professional
Liability
|
Medical Technology & Life Sciences Products
|
Workers'
Compensation - Traditional
|
|||
(1) Historically, up to 5% retained
(2) Historically, retention has been as low as 90%
(3) Historically, retention has ranged from 5% to 33%
(4) Historically, retention has been as high as $2M
Large professional liability risks that are above the limits of our basic reinsurance treaties are reinsured on a facultative basis, whereby the reinsurer agrees to insure a particular risk up to a designated limit. We also have in place a number of risk sharing arrangements that apply to the first $1 million of losses for certain large healthcare systems and other insurance entities.
We wrote workers' compensation policies in our alternative market business generating premium of approximately
$53.0 million
under custom programs whereby the policies written are fully reinsured under 100% quota share agreements to the SPCs of our wholly owned subsidiary, Eastern Re Ltd., SPC (Eastern Re), domiciled in the Cayman Islands, net of a ceding commission. Each SPC has preferred shareholders and the underwriting profit or loss of each cell accrues fully to these
48
preferred shareholders. We participate as a preferred shareholder in certain SPCs. Our ownership interest in the segregated portfolio cells for which we participate is generally 50%, but we have ownership interests as low as 25% and as high as 82.5%.
Each SPC has in place its own reinsurance arrangements, which are illustrated in the table below.
Segregated Portfolio Cell Reinsurance
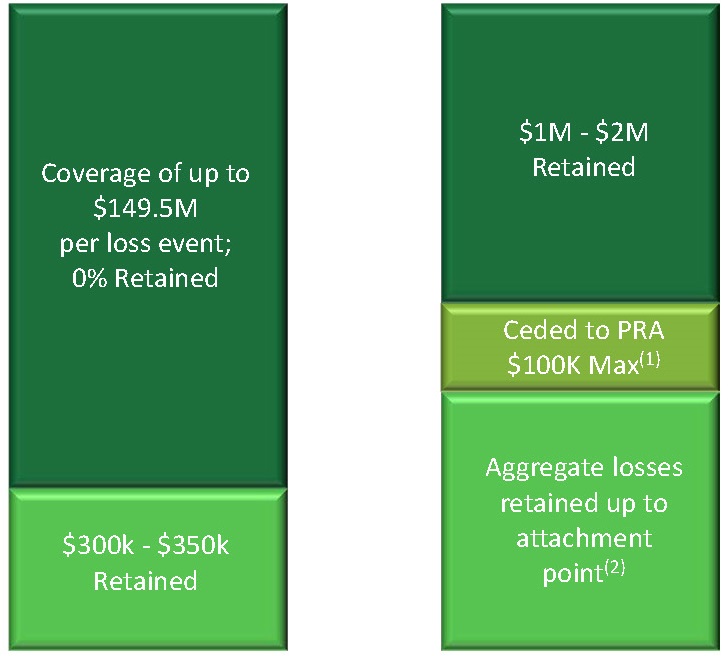
|
Per Occurrence Coverage
|
Aggregate Coverage
|
||
(1) ProAssurance assumes 100% of aggregate losses in excess of an aggregate attachment point with a maximum loss limit $100K.
(2) The attachment point is based on a percentage of premium (average is 89%) and varies by cell.
Each SPC maintains a loss fund for the cell initially equal to the difference between premium assumed by the cell and the ceding commission. The external participants of each cell provide a letter of credit to us that is equal to the difference between the loss fund (amount of funds available to pay losses after deduction of ceding commission) and the aggregate attachment point of the reinsurance.
The remaining premium written in our alternative market business of
$6.3 million
is 100% ceded to an unaffiliated captive insurer.
Within our Lloyd's Syndicate segment, Syndicate 1729 purchases reinsurance to limit its liability on individual risks and to protect against catastrophic loss. The level of reinsurance that the Syndicate purchases is dependent on a number of factors, including its underwriting risk appetite for catastrophe risk, the specific risks inherent in each line or class of business risk written and the pricing, coverage and terms and conditions available from the reinsurance market. Both quota share reinsurance and excess of loss reinsurance is utilized to manage the net loss exposure. The Syndicate may still be exposed to loss that exceeds the level of reinsurance purchased, as well as to reinstatement premiums triggered by additional loss events.
For all of our segments, we make a determination of the amount of insurance risk we choose to retain based upon numerous factors, including our risk tolerance and the capital we have to support it, the price and availability of reinsurance, the volume of business, our level of experience with a particular set of claims and our analysis of the potential underwriting results. We purchase reinsurance from a number of companies to mitigate concentrations of credit risk. We utilize reinsurance brokers to assist us in the placement of our reinsurance program and in the analysis of the credit quality of our reinsurers. The determination of which reinsurers we choose to do business with is based upon an evaluation of their then-current financial strength, rating and stability. However, the financial strength of our reinsurers, and their corresponding ability to pay us, may change in the future due to forces or events we cannot control or anticipate.
49
The following table identifies those reinsurers for which our recoverables for both paid and unpaid claims (net of amounts due to the reinsurer) and our prepaid balances are aggregately $20 million or more as of
December 31, 2014
:
|
Reinsurer
|
Domiciliary
Country |
A.M. Best
Company Rating |
Net Amounts Due
From Reinsurer |
|||
|
(In thousands)
|
||||||
|
Hannover Rück SE
|
Germany
|
A+
|
$
|
23,081
|
|
|
|
Everest Reinsurance Company
|
United States
|
A+
|
$
|
21,582
|
|
|
|
Aspen Insurance UK, Ltd.
|
United Kingdom
|
A
|
$
|
22,236
|
|
|
Taxes
In 2013 we received a Notice of Proposed Adjustment (NOPA) from the IRS related to the examination of our 2009 and 2010 tax years. We subsequently protested certain issues in the NOPA, all of which related to the timing of deductions, and also made a related
$20.6 million
protective payment. In April 2014, we reached a final settlement with the IRS on all contested issues, which did not increase our tax liability. We received refunds from the IRS related to the NOPA in July 2014 of
$30.6 million
in total, exclusive of interest, which included a refund from the settlement of non-contested issues addressed by the NOPA and the return of the protective payment.
Litigation
We are involved in various legal actions related to insurance policies and claims handling including, but not limited to, claims asserted against us by policyholders. These types of legal actions arise in the ordinary course of business and, in accordance with GAAP for insurance entities, are generally considered as a part of our loss reserving process, which is described in detail in our Critical Accounting Estimates section under the heading "Reserve for Losses and Loss Adjustment Expenses." We also have other direct actions against the Company unrelated to our claims activity which we evaluate and account for as a part of our other liabilities. For these corporate legal actions, we evaluate each case separately and establish what we believe is an appropriate reserve based on GAAP guidance related to contingent liabilities. As of
December 31, 2014
there were no material reserves established for corporate legal actions.
50
Investing Activities and Related Cash Flows
Our investments at
December 31, 2014
are comprised as follows:
|
|
|
Included in Carrying Value:
|
|
|
|
|||||||||||||
|
($ in thousands)
|
Carrying
Value
|
Unrealized
Gains
|
Unrealized
Losses
|
Average
Rating
|
(1)
|
% Total
Investments |
||||||||||||
|
Fixed Maturities, Available for Sale
|
||||||||||||||||||
|
Government
|
||||||||||||||||||
|
U.S. Treasury
|
$
|
166,512
|
|
$
|
3,785
|
|
$
|
987
|
|
AA+
|
(2)
|
4
|
%
|
|||||
|
U.S. Government-sponsored enterprise
|
39,563
|
|
1,641
|
|
100
|
|
AA+
|
(2)
|
1
|
%
|
||||||||
|
Total government
|
206,075
|
|
5,426
|
|
1,087
|
|
AA+
|
(2)
|
5
|
%
|
||||||||
|
State and Municipal Bonds
|
||||||||||||||||||
|
Pre-refunded
|
178,419
|
|
7,475
|
|
24
|
|
AA
|
4
|
%
|
|||||||||
|
General obligation
|
245,465
|
|
11,748
|
|
35
|
|
AA
|
6
|
%
|
|||||||||
|
Special revenue
|
638,731
|
|
28,172
|
|
276
|
|
AA
|
17
|
%
|
|||||||||
|
Total state and municipal bonds
|
1,062,615
|
|
47,395
|
|
335
|
|
AA
|
27
|
%
|
|||||||||
|
Corporate Debt
|
||||||||||||||||||
|
Financial
|
426,983
|
|
12,789
|
|
589
|
|
A
|
11
|
%
|
|||||||||
|
Consumer oriented
|
302,049
|
|
9,621
|
|
2,873
|
|
A-
|
8
|
%
|
|||||||||
|
Utilities/Energy
|
274,844
|
|
9,817
|
|
10,292
|
|
BBB+
|
7
|
%
|
|||||||||
|
Industrial
|
394,782
|
|
11,711
|
|
3,340
|
|
BBB+
|
10
|
%
|
|||||||||
|
Other
|
18,443
|
|
296
|
|
9
|
|
AA-
|
<1%
|
|
|||||||||
|
Total corporate debt
|
1,417,101
|
|
44,234
|
|
17,103
|
|
A-
|
35
|
%
|
|||||||||
|
Securities backed by:
|
||||||||||||||||||
|
Agency mortgages
|
269,430
|
|
10,186
|
|
436
|
|
AA+
|
(2)
|
7
|
%
|
||||||||
|
Non-agency mortgages
|
6,626
|
|
12
|
|
12
|
|
AA+
|
<1%
|
|
|||||||||
|
Agency commercial mortgages
|
15,493
|
|
208
|
|
59
|
|
AA+
|
(2)
|
<1%
|
|
||||||||
|
Other commercial mortgages
|
51,063
|
|
1,137
|
|
99
|
|
AAA
|
1
|
%
|
|||||||||
|
Automobile loans
|
50,185
|
|
48
|
|
60
|
|
AAA
|
1
|
%
|
|||||||||
|
Other asset loans
|
66,439
|
|
240
|
|
145
|
|
AA+
|
2
|
%
|
|||||||||
|
Total asset-backed securities
|
459,236
|
|
11,831
|
|
811
|
|
AAA
|
11
|
%
|
|||||||||
|
Total fixed maturities
|
3,145,027
|
|
108,886
|
|
19,336
|
|
A+
|
78
|
%
|
|||||||||
|
Equity Securities, Trading
|
||||||||||||||||||
|
Financial
|
79,341
|
|
—
|
|
—
|
|
2
|
%
|
||||||||||
|
Utilities/Energy
|
25,629
|
|
—
|
|
—
|
|
1
|
%
|
||||||||||
|
Industrial
|
55,460
|
|
—
|
|
—
|
|
1
|
%
|
||||||||||
|
Consumer oriented
|
65,670
|
|
—
|
|
—
|
|
2
|
%
|
||||||||||
|
Bond Funds
|
55,196
|
|
—
|
|
—
|
|
1
|
%
|
||||||||||
|
All Other
|
33,186
|
|
—
|
|
—
|
|
1
|
%
|
||||||||||
|
Total equities
|
314,482
|
|
—
|
|
—
|
|
8
|
%
|
||||||||||
|
Short-Term Investments
|
131,259
|
|
—
|
|
—
|
|
3
|
%
|
||||||||||
|
Business-owned Life Insurance
|
56,381
|
|
—
|
|
—
|
|
1
|
%
|
||||||||||
|
Investment in Unconsolidated Subsidiaries
|
||||||||||||||||||
|
Investment in qualified affordable housing tax credit partnerships
|
133,143
|
|
—
|
|
—
|
|
3
|
%
|
||||||||||
|
Investments in LPs/LLCs, equity method
|
143,358
|
|
—
|
|
—
|
|
4
|
%
|
||||||||||
|
Total investment in unconsolidated subsidiaries
|
276,501
|
|
—
|
|
—
|
|
7
|
%
|
||||||||||
|
Other Investments
|
||||||||||||||||||
|
Investments in LPs/LLCs, cost method
|
53,258
|
|
—
|
|
—
|
|
1
|
%
|
||||||||||
|
Convertible securities, at fair value
|
28,958
|
|
—
|
|
—
|
|
1
|
%
|
||||||||||
|
FHLB capital stock and other
|
3,841
|
|
—
|
|
—
|
|
<1%
|
|
||||||||||
|
Total other investments
|
86,057
|
|
—
|
|
—
|
|
2
|
%
|
||||||||||
|
Total Investments
|
$
|
4,009,707
|
|
$
|
108,886
|
|
$
|
19,336
|
|
100
|
%
|
|||||||
|
(1)
|
A weighted average rating is calculated using available ratings from Standard & Poor’s, Moody’s and Fitch. The table presents the Standard & Poor’s rating that is equivalent to the computed average.
|
|
(2)
|
The rating presented is the Standard & Poor’s rating rather than the average. The Moody’s rating is
Aaa
and the Fitch rating is
AAA
.
|
51
A detailed listing of our investment holdings as of
December 31, 2014
is provided in the Investor Supplement we make available in the Investor Relations section of our website, www.ProAssurance.com, or directly at www.ProAssurance.com/investorrelations/supplemental.aspx.
We manage our investments to ensure that we will have sufficient liquidity to meet our obligations, taking into consideration the timing of cash flows from our investments, including interest payments, dividends and principal payments, as well as the expected cash flows to be generated by our operations. In addition to the interest and dividends we will receive, we anticipate that between
$70 million
and
$140 million
of our investments will mature (or be paid down) each quarter of the next year and become available, if needed, to meet our cash flow requirements. The primary outflow of cash at our insurance subsidiaries is related to paid losses and operating costs, including income taxes. The payment of individual claims cannot be predicted with certainty; therefore, we rely upon the history of paid claims in estimating the timing of future claims payments. To the extent that we may have an unanticipated shortfall in cash we may either liquidate securities or borrow funds under existing borrowing arrangements through our credit facility and the FHLB system. Currently,
$100 million
is available for use through our credit facility, as discussed in this section under the heading "Debt". Given the duration of our investments, we do not foresee a shortfall that would require us to meet operating cash needs through additional borrowings. Additional information regarding the credit facility is detailed in Note 10 of the Notes to Consolidated Financial Statements.
Our acquisition of Eastern added the following to our investment holdings as of January 1, 2014, the date of acquisition:
|
(In thousands)
|
|||
|
Fixed maturities
|
$
|
107,131
|
|
|
Equities
|
65,945
|
|
|
|
Short-Term
|
23,931
|
|
|
|
Equity Method LPs/LLCs
|
11,994
|
|
|
|
Convertible Securities
|
30,139
|
|
|
|
Total
|
$
|
239,140
|
|
As discussed under the heading "Business Combinations and Ventures" and in Note 4 of the Notes to Consolidated Financial Statements, our fixed maturity and short term investments include securities deposited with Lloyd's in order to meet our FAL requirement. At
December 31, 2014
securities on deposit with Lloyd's included fixed maturities having a fair value of
$85.0 million
and short term investments with a fair value of
$0.2 million
.
Our investment portfolio continues to be primarily composed of high quality fixed income securities with approximately
93%
of our fixed maturities being investment grade securities as determined by national rating agencies. The weighted average effective duration of our fixed maturity securities at
December 31, 2014
was
3.5
years; the weighted average effective duration of our fixed maturity securities combined with our short-term securities was
3.4
years.
The carrying value of our qualified affordable housing tax credit partnerships reflects both funded and unfunded commitments to the partnerships, less amortization, since our initial investment. The carrying value of these investments was approximately
$133.1 million
at
December 31, 2014
and
$142.2 million
at
December 31, 2013
. We fund these investments based on funding schedules maintained by the partnerships. During the years ended
December 31, 2014
,
2013
and
2012
we funded approximately
$8.6 million
,
$63.5 million
and
$35.7 million
, respectively. As of
December 31, 2014
, approximately
$15.5 million
of our total commitments to these partnerships had not yet been funded.
The carrying values of our equity and cost method Investments in LPs/LLCs, reflects amounts funded to the entities but does not include unfunded commitments. The total carrying value of these investments at
December 31, 2014
and
December 31, 2013
was approximately
$196.6 million
and
$119.3 million
, respectively. During the years ended
December 31, 2014
,
2013
and
2012
, we funded, net of capital returned,
$40.1 million
,
$37.8 million
and
$18.5 million
, respectively, relative to these investments. As of
December 31, 2014
, we had active unfunded commitments to these investments of approximately
$153.8 million
.
European Debt Exposure
We have no direct European sovereign debt exposure. We have indirect exposure through our investments in debt securities and through our reinsurance receivables. Issuers of our debt or equity securities and our reinsurers may hold European sovereign debt or have counterparty exposure to European banks or European corporations or may have a reliance on Eurocurrency denominated business. Should Europe suffer a severe recession or the Euro-zone or Eurocurrency fail, issuers may suffer credit or profitability losses or may experience a credit downgrade by rating agencies.
52
Our debt securities at
December 31, 2014
included investments of
$174.2 million
(
4%
of our total investments) where the issuer is domiciled in Europe or the underlying revenue stream supporting the security is European. Of our European issuers, we believe those in the financial sector are most likely to suffer loss in the event of a European economic crisis. A summary of these debt securities by country follows (country designation is based on the underlying revenue stream of the security):
|
|
European Debt Exposure by Country and Industry Type
|
|||||||||||||||
|
(In millions)
|
Total
Exposure |
Financial
Institutions |
Industrial &
Utilities |
Energy &
Communication |
||||||||||||
|
United Kingdom
|
$
|
73.4
|
|
$
|
26.0
|
|
$
|
36.2
|
|
$
|
11.2
|
|
||||
|
Sweden
|
4.5
|
|
0.5
|
|
4.0
|
|
—
|
|
||||||||
|
France
|
10.0
|
|
7.0
|
|
—
|
|
3.0
|
|
||||||||
|
Germany
|
14.5
|
|
5.6
|
|
6.4
|
|
2.5
|
|
||||||||
|
Finland
|
1.5
|
|
—
|
|
1.5
|
|
—
|
|
||||||||
|
Denmark
|
3.8
|
|
1.8
|
|
2.0
|
|
—
|
|
||||||||
|
Netherlands
|
23.2
|
|
11.9
|
|
2.3
|
|
9.0
|
|
||||||||
|
Norway
|
8.9
|
|
1.3
|
|
2.8
|
|
4.8
|
|
||||||||
|
Belgium
|
10.2
|
|
—
|
|
10.2
|
|
—
|
|
||||||||
|
Switzerland
|
13.6
|
|
6.4
|
|
6.8
|
|
0.4
|
|
||||||||
|
Ireland
|
1.6
|
|
—
|
|
1.6
|
|
—
|
|
||||||||
|
Spain
|
2.1
|
|
—
|
|
—
|
|
2.1
|
|
||||||||
|
Luxembourg
|
5.6
|
|
—
|
|
2.3
|
|
3.3
|
|
||||||||
|
Cyprus
|
1.3
|
|
—
|
|
—
|
|
1.3
|
|
||||||||
|
$
|
174.2
|
|
$
|
60.5
|
|
$
|
76.1
|
|
$
|
37.6
|
|
|||||
Our reinsurers typically operate globally and have large investment portfolios which may be linked directly or indirectly to the European economy. As of
December 31, 2014
, two of our largest reinsurers were domiciled in Europe; our net receivables with these reinsurers totaled approximately
$45 million
. Net amounts due from reinsurers approximated
$259.1 million
at
December 31, 2014
.
Business Combinations and Ventures
We paid cash of approximately
$205 million
to acquire Eastern on January 1, 2014 and cash of
$153.7 million
to acquire Medmarc on January 1, 2013. Funds for both transactions were deposited with an intermediate third-party several days prior to the close dates; the deposits were included in Other Assets on our Consolidated Balance Sheet at December 31, 2013 and 2012.
Late in 2013, we became a Lloyd's member and a primary (
58%
) capital provider to Syndicate 1729, which began active operations effective January 1, 2014. We are required to provide capital, referred to as FAL, to support Syndicate 1729. As of December 31, 2013, we met the FAL requirements through a fully secured standby letter of credit (LOC) (
£41.9 million
or approximately
$69.3 million
at December 31, 2013) and a deposit of approximately
$8.7 million
(included in Other assets at December 31, 2013). During 2014 we began to satisfy the FAL requirement by placing securities on deposit with Lloyd's (see "Investment Exposures"). We canceled the LOC and our deposit and funds which had secured the LOC (classified as restricted cash at December 31, 2013) were returned to us. As discussed in Note 9 of the Notes to Consolidated Financial Statements, we have agreed to provide Syndicate 1729 with operating funds of up to
£10 million
(approximately
$16 million
at
December 31, 2014
) under an unconditional revolving credit agreement (the "Syndicate Credit Agreement"). As of
December 31, 2014
, we had advanced
£6.6 million
(
$11.0 million
) under the Syndicate Credit Agreement.
53
Financing Activities and Related Cash Flows
Treasury Shares
Treasury share activity for
2014
,
2013
and
2012
was as follows:
|
(In thousands)
|
2014
|
2013
|
2012
|
||
|
Treasury shares at the beginning of the period
|
900
|
244
|
7,996
|
||
|
Shares reissued in conjunction with stock split
|
—
|
—
|
(7,729)
|
||
|
Shares reacquired, at cost of $222 million and $32 million, respectively
|
4,909
|
681
|
—
|
||
|
Shares reissued, primarily those reissued pursuant to the ProAssurance 2011 Employee Stock Ownership Plan, fair value of $2.1 million, $1.1 million and $1 million, respectively
|
(46)
|
(25)
|
(23)
|
||
|
Treasury shares at the end of the period
|
5,763
|
900
|
244
|
||
During 2014 our Board increased its authorization for the repurchase of common shares or the retirement of outstanding debt by
$200 million
. From January 1, 2015 through February 20, 2015, through our 10b5-1 plan, we reacquired approximately
725,000
additional common shares at a cost of approximately
$32.8 million
. As of
February 20, 2015
our remaining Board authorization was approximately
$148.7 million
.
Shareholder Dividends
Our Board of Directors declared cash dividends during 2014, 2013 and 2012 as follows:
|
Quarterly Cash Dividends Declared, per Share
|
||||||
|
2014
|
2013
|
2012
|
||||
|
First Quarter
|
$0.300
|
$0.250
|
$0.125
|
|||
|
Second Quarter
|
$0.300
|
$0.250
|
$0.125
|
|||
|
Third Quarter
|
$0.300
|
$0.250
|
$0.125
|
|||
|
Fourth Quarter - Regular
|
$0.310
|
$0.300
|
$0.250
|
|||
|
Fourth Quarter - Special dividend
|
$2.650
|
—
|
$2.500
|
|||
Each dividend was paid the month following the quarter in which it was declared except that payment of dividends declared for the fourth quarter of 2012 was accelerated into December 2012. Any decision to pay future cash dividends is subject to the Board’s final determination after a comprehensive review of financial performance, future expectations and other factors deemed relevant by the Board.
Debt
At
December 31, 2014
our only outstanding long-term debt was
$250 million
of unsecured senior notes, issued in the fourth quarter of 2013. The notes bear interest at
5.3%
annually and are due in 2023 although they may be redeemed in whole or part prior to maturity. There are no financial covenants associated with these notes.
We have available a revolving credit agreement (the "Credit Agreement") of up to
$200 million
which may be used for general corporate purposes, including, but not limited to, short-term working capital, share repurchases as authorized by the Board, and support for other activities we enter into in the normal course of business. The Credit Agreement expires in April 2016. No borrowings were outstanding under the Credit Agreement during 2014. We drew
$125.0 million
against the line from December 2012 to September 2013 on a secured basis to partially fund our acquisition of Medmarc, as this permitted us to continue to hold rather than liquidate certain higher yielding securities. Similarly, we drew
$100 million
against the line in January 2015 on a secured basis to partially fund our special dividend. We are in compliance with the financial covenants of the Credit Agreement.
During 2012, we repaid long-term debt totaling
$57.7 million
, including a note payable carried at fair value. We recognized a loss on the repayment of the note payable of
$2.2 million
.
Additional information regarding our long-term debt is provided in Note 10 of the Notes to Consolidated Financial Statements.
We are a member of a number of FHLBs. Through membership, we have access to secured cash advances which can be used for liquidity purposes or other operational needs. To date, we have not established a FHLB line of credit or materially utilized our membership.
54
Off-Balance Sheet Arrangements/Guarantees
We have a revolving credit agreement with Syndicate 1729 to provide operating funds of up to
£10.0 million
, of which
£3.4 million
(
$5.3 million
) had not yet been funded as of
December 31, 2014
. The revolving credit agreement expires on December 31, 2016. See Note 9 of the Notes to Consolidated Financial Statement for more information on this arrangement. We have no other off-balance sheet arrangements that have or are reasonably likely to have a current or future effect on the Company’s financial condition, changes in financial condition, revenues or expenses, results of operations, liquidity, capital expenditures or capital resources.
Contractual Obligations
A schedule of our non-cancellable contractual obligations at
December 31, 2014
follows:
|
|
Payments due by period
|
|||||||||||||||||||
|
(In thousands)
|
Total
|
Less than
1 year
|
1-3 years
|
3-5 years
|
More than
5 years
|
|||||||||||||||
|
Loss and loss adjustment expenses
|
$
|
2,058,266
|
|
$
|
559,905
|
|
$
|
704,351
|
|
$
|
386,630
|
|
$
|
407,380
|
|
|||||
|
Long-term debt obligations including interest
|
367,594
|
|
13,250
|
|
26,500
|
|
26,500
|
|
301,344
|
|
||||||||||
|
Revolving credit agreement fees
|
438
|
|
350
|
|
88
|
|
—
|
|
—
|
|
||||||||||
|
Operating lease obligations
|
24,309
|
|
5,024
|
|
8,516
|
|
5,537
|
|
5,232
|
|
||||||||||
|
Funding commitments primarily related to non-public investment entities
|
169,375
|
|
98,757
|
|
69,236
|
|
640
|
|
742
|
|
||||||||||
|
Total
|
$
|
2,619,982
|
|
$
|
677,286
|
|
$
|
808,691
|
|
$
|
419,307
|
|
$
|
714,698
|
|
|||||
We believe that our operating cash flow and funds from our investment portfolio are adequate to meet our contractual obligations.
The above table presumes no borrowings or related interest under our revolving credit agreement through expiration of the agreement as the obligation is presented as of
December 31, 2014
. In January 2015, we drew
$100 million
on the revolving credit agreement. For more information regarding these agreements see Note 10 of the Notes to Consolidated Financial Statements.
The anticipated payout of loss and loss adjustment expenses is based upon our historical payout patterns. Both the timing and amount of these payments may vary from the payments indicated. Our operating lease obligations are primarily for the rental of office space and office equipment.
55
Results of Operations–Year Ended
December 31, 2014
Compared to Year Ended
December 31, 2013
Selected consolidated financial data for each period is summarized in the table below.
|
Year Ended December 31
|
|||||||||||
|
($ in thousands, except per share data)
|
2014
|
2013
|
Change
|
||||||||
|
Revenues:
|
|||||||||||
|
Net premiums written
|
$
|
701,849
|
|
$
|
525,182
|
|
$
|
176,667
|
|
||
|
Net premiums earned
|
$
|
699,731
|
|
$
|
527,919
|
|
$
|
171,812
|
|
||
|
Net investment result
|
129,543
|
|
136,804
|
|
(7,261
|
)
|
|||||
|
Net realized investment gains (losses)
|
14,654
|
|
67,904
|
|
(53,250
|
)
|
|||||
|
Other income
|
8,398
|
|
7,551
|
|
847
|
|
|||||
|
Total revenues
|
852,326
|
|
740,178
|
|
112,148
|
|
|||||
|
Expenses:
|
|||||||||||
|
Losses and loss adjustment expenses
|
379,232
|
|
243,015
|
|
136,217
|
|
|||||
|
Reinsurance recoveries
|
(16,148
|
)
|
(18,254
|
)
|
2,106
|
|
|||||
|
Net losses and loss adjustment expenses
|
363,084
|
|
224,761
|
|
138,323
|
|
|||||
|
Underwriting, policy acquisition and operating expenses
|
211,311
|
|
147,817
|
|
63,494
|
|
|||||
|
Segregated portfolio cells dividend expense
|
1,842
|
|
—
|
|
1,842
|
|
|||||
|
Interest expense
|
14,084
|
|
2,755
|
|
11,329
|
|
|||||
|
Total expenses
|
590,321
|
|
375,333
|
|
214,988
|
|
|||||
|
Gain on acquisition
|
—
|
|
32,314
|
|
(32,314
|
)
|
|||||
|
Income before income taxes
|
262,005
|
|
397,159
|
|
(135,154
|
)
|
|||||
|
Income taxes
|
65,440
|
|
99,636
|
|
(34,196
|
)
|
|||||
|
Net income
|
$
|
196,565
|
|
$
|
297,523
|
|
$
|
(100,958
|
)
|
||
|
Operating income
|
$
|
186,367
|
|
$
|
221,097
|
|
$
|
(34,730
|
)
|
||
|
Earnings per share:
|
|||||||||||
|
Basic
|
$
|
3.32
|
|
$
|
4.82
|
|
$
|
(1.50
|
)
|
||
|
Diluted
|
$
|
3.30
|
|
$
|
4.80
|
|
$
|
(1.50
|
)
|
||
|
Operating earnings per share:
|
|||||||||||
|
Basic
|
$
|
3.14
|
|
$
|
3.58
|
|
$
|
(0.44
|
)
|
||
|
Diluted
|
$
|
3.13
|
|
$
|
3.56
|
|
$
|
(0.43
|
)
|
||
|
Net loss ratio
|
51.9
|
%
|
42.6
|
%
|
9.3
|
|
|||||
|
Underwriting expense ratio
|
30.2
|
%
|
28.0
|
%
|
2.2
|
|
|||||
|
Combined ratio
|
82.1
|
%
|
70.6
|
%
|
11.5
|
|
|||||
|
Operating ratio
|
64.2
|
%
|
46.1
|
%
|
18.1
|
|
|||||
|
Effective tax rate
|
25.0
|
%
|
25.1
|
%
|
(0.1
|
)
|
|||||
|
Return on equity*
|
8.6
|
%
|
11.4
|
%
|
(2.8
|
)
|
|||||
|
* Gain on acquisition is excluded from the calculation of return on equity for 2013.
|
|||||||||||
In all tables that follow, the abbreviation “nm” indicates that the percentage change is not meaningful.
56
Revenues
Our consolidated net premiums earned were as follows:
|
Year Ended December 31
|
||||||||||||||
|
($ in thousands)
|
2014
|
2013
|
Change
|
|||||||||||
|
Net Premiums Earned
|
||||||||||||||
|
Specialty P&C
|
$
|
492,733
|
|
$
|
527,919
|
|
$
|
(35,186
|
)
|
(6.7
|
%)
|
|||
|
Workers' Compensation
|
194,540
|
|
—
|
|
194,540
|
|
nm
|
|
||||||
|
Lloyd's Syndicate
|
12,458
|
|
—
|
|
12,458
|
|
nm
|
|
||||||
|
Consolidated total
|
$
|
699,731
|
|
$
|
527,919
|
|
$
|
171,812
|
|
32.5
|
%
|
|||
Consolidated net premiums earned increased in
2014
as compared to
2013
primarily due to the contribution of our recently acquired Workers' Compensation segment. The decline in net premiums earned for our Specialty P&C segment was primarily attributable to the pro rata effect of lower physician premiums written during the preceding twelve months and also reflected an increase in ceded premiums earned. Given the start-up nature of Syndicate 1729 it added only
$12.5 million
in net premiums earned for the
year ended
December 31, 2014
(as compared to net written premium of
$32.1 million
for the
year ended
December 31, 2014
).
Our net investment result (which includes both net investment income and earnings from unconsolidated subsidiaries)
decrease
d
$7.3 million
or
5.3%
for the
year ended
December 31, 2014
. Approximately
$3.7 million
was a decrease in Net investment income primarily due to reduced earnings on our fixed income portfolio, which was partially offset by increased earnings from our Other investments. Earnings from unconsolidated subsidiaries
decrease
d
$3.6 million
in the
year ended
December 31, 2014
, primarily due to earnings recognized in 2013 as a result of a change of an LP from the cost method to the equity method. Otherwise, earnings from our other investment LPs were higher in 2014. Amortization of qualified affordable housing tax credit partnerships was relatively flat as compared to 2013.
Net realized investment gains (losses)
decrease
d
$53.3 million
for the
year ended
December 31, 2014
as compared to
2013
. The changes primarily related to trading securities carried at fair value. Net impairments were approximately
$1.2 million
in the
year ended
December 31, 2014
and nominal in the
year ended
December 31, 2013
.
Expenses
The following table shows our net loss ratio by segment:
|
Year Ended December 31
|
|||||||||||
|
($ in millions)
|
2014
|
2013
|
Change
|
||||||||
|
Current accident year net loss ratio
|
|||||||||||
|
Consolidated ratio
|
77.9
|
%
|
84.8
|
%
|
(6.9
|
)
|
|||||
|
Specialty P&C
|
83.0
|
%
|
84.8
|
%
|
(1.8
|
)
|
|||||
|
Workers' Compensation
|
65.7
|
%
|
—
|
%
|
nm
|
|
|||||
|
Lloyd's Syndicate
|
67.7
|
%
|
—
|
%
|
nm
|
|
|||||
|
Calendar year net loss ratio
|
|||||||||||
|
Consolidated ratio
|
51.9
|
%
|
42.6
|
%
|
9.3
|
|
|||||
|
Specialty P&C
|
46.3
|
%
|
42.6
|
%
|
3.7
|
|
|||||
|
Workers' Compensation
|
65.0
|
%
|
—
|
%
|
nm
|
|
|||||
|
Lloyd's Syndicate
|
67.7
|
%
|
—
|
%
|
nm
|
|
|||||
|
Favorable net loss development, prior accident years
|
|||||||||||
|
Consolidated
|
$
|
182.1
|
|
$
|
222.7
|
|
$
|
(40.6
|
)
|
||
|
Specialty P&C
|
$
|
180.8
|
|
$
|
222.7
|
|
$
|
(41.9
|
)
|
||
|
Workers' Compensation
|
$
|
1.3
|
|
$
|
—
|
|
$
|
1.3
|
|
||
|
Lloyd's Syndicate
|
$
|
—
|
|
$
|
—
|
|
$
|
—
|
|
||
57
The decrease in our consolidated current accident year net loss ratio for the
year ended
December 31, 2014
was primarily attributable to the addition of our workers' compensation business. The start-up of Syndicate 1729 during 2014 had only a nominal effect on the consolidated ratio. Combined, these new operations
decrease
d our
2014
consolidated current accident year net loss ratio by
5.1
percentage points. The current accident year net loss ratio of our Specialty P&C segment (our historical business) reflected a decrease primarily attributable to a reduction to our estimate of the reserve required for our death, disability and retirement (DDR) coverage, partially offset by the effect of a higher accrual for internal claims adjustment expenses on a lower volume of premiums earned.
Our consolidated calendar year net loss ratio is lower than our consolidated current accident year net loss ratio due to the recognition of net favorable loss development in our Specialty P&C and Workers' Compensation segments as shown in the table above.
Our underwriting expense ratio reflected the following:
|
Year Ended December 31
|
|||||||
|
2014
|
2013
|
Change
|
|||||
|
Underwriting Expense Ratio, as reported
|
|||||||
|
Consolidated
|
30.2
|
%
|
28.0
|
%
|
2.2
|
||
|
Underwriting Expense Ratio, excluding the effect of discrete events and Syndicate 1729
|
|||||||
|
Consolidated
|
28.4
|
%
|
26.3
|
%
|
2.1
|
||
|
Specialty P&C
|
26.5
|
%
|
24.2
|
%
|
2.3
|
||
|
Workers' Compensation
|
29.6
|
%
|
—
|
%
|
nm
|
||
Our consolidated expense ratio
increase
d in
2014
due to a number of factors, including the acquisition of Eastern and additional expenses associated with our participation in Syndicate 1729. The ratios for both
2014
and
2013
were also affected by expenses attributable to discrete events, such as transaction and other costs associated with business combinations or expansions, and costs associated with technology initiatives. Our 2014 ratio also reflects an increase due to the effect of purchase accounting on deferred policy acquisition cost amortization in 2013. Exclusive of expenses attributable to discrete events, we estimate that the addition of our Workers' Compensation segment, which carries a higher expense ratio, and our Lloyd's Syndicate segment, which had a high expense ratio due to its start-up phase,
increase
d our consolidated expense ratio by approximately
1.3
percentage points for the
year ended
December 31, 2014
. Otherwise, our consolidated ratio increased in 2014 due to lower earned premium from our Specialty P&C segment and the aforementioned effect of purchase accounting on the 2013 ratio.
Exclusive of the effect of discrete events and the effect of purchase accounting on 2013 DPAC amortization, our Specialty P&C segment ratio increased because the decline in our operating costs did not keep pace with the decline in net premiums earned. Approximately
2.7
percentage points of the Workers' Compensation segment expense ratio for the
year ended
December 31, 2014
was attributable to the amortization of intangible assets recognized in the acquisition of Eastern.
Taxes
Our effective tax rate was
25.0%
for the
year ended
December 31, 2014
, comparable to our
2013
effective tax rate of
25.1%
. Tax-exempt income decreased during
2014
but had a greater effect on our effective rate as our total income was lower in
2014
. Tax credits also had an increased effect but were approximately the same amount in
2014
as in
2013
. Our
2013
effective tax rate was reduced due to a gain on acquisition that was not taxable; there was no similar non-taxable gain in
2014
.
58
Operating Ratio and Return on Equity
Our operating ratio (calculated as our combined ratio, less our investment income ratio)
increase
d by
18.1
percentage points in the
year ended
December 31, 2014
, reflecting higher net loss and expense ratios, and a
decline
in our investment ratio of
6.6
percentage points for the
year ended
December 31, 2014
, primarily due to the acquisition of Eastern. Compared to our professional liability business, workers' compensation generally requires lower reserves which necessitates lower investment assets to support those reserves in proportion to earned premium.
Return on equity (ROE) was
8.6%
for the
year ended
December 31, 2014
and was
11.4%
for the
year ended
December 31, 2013
. Our calculation of return on equity for the
year ended
December 31, 2013
excluded the effect of the
$32.3 million
gain on acquisition.
Book Value per Share
Our book value per share at
December 31, 2014
as compared to
December 31, 2013
is shown in the following table.
|
Book Value Per Share
|
|||
|
Book Value Per Share at December 31, 2013
|
$
|
39.13
|
|
|
Increase (decrease) to book value per share during the year ended December 31, 2014 attributable to:
|
|||
|
Net income
|
3.32
|
|
|
|
Decrease in accumulated other comprehensive income
|
(0.02
|
)
|
|
|
Dividends declared
|
(3.86
|
)
|
|
|
Other, primarily the repurchase of shares
|
(0.40
|
)
|
|
|
Book Value Per Share at December 31, 2014
|
$
|
38.17
|
|
Non-GAAP Financial Measures
Operating income is a non-GAAP financial measure that is widely used to evaluate performance within the insurance sector. In calculating operating income, we have excluded the after-tax effects of net realized investment gains or losses, guaranty fund assessments or recoupments gain on acquisition and the effect of confidential settlements that do not reflect normal operating results. We believe operating income presents a useful view of the performance of our insurance operations, but should be considered in conjunction with net income computed in accordance with GAAP.
The following table is a reconciliation of Net income to Operating income:
|
Year Ended December 31
|
|||||||
|
(In thousands, except per share data)
|
2014
|
2013
|
|||||
|
Net income
|
$
|
196,565
|
|
$
|
297,523
|
|
|
|
Items excluded in the calculation of operating income:
|
|||||||
|
Net realized investment (gains) losses
|
(14,654
|
)
|
(67,904
|
)
|
|||
|
Guaranty fund assessments (recoupments)
|
(169
|
)
|
40
|
|
|||
|
Gain on acquisition
|
—
|
|
(32,314
|
)
|
|||
|
Effect of confidential settlements, net
|
(866
|
)
|
—
|
|
|||
|
Pre-tax effect of exclusions
|
(15,689
|
)
|
(100,178
|
)
|
|||
|
Tax effect, at 35%, exclusive of non-taxable gain on acquisition
|
5,491
|
|
23,752
|
|
|||
|
Operating income
|
$
|
186,367
|
|
$
|
221,097
|
|
|
|
Per diluted common share:
|
|||||||
|
Net income
|
$
|
3.30
|
|
$
|
4.80
|
|
|
|
Effect of exclusions
|
(0.17
|
)
|
(1.24
|
)
|
|||
|
Operating income per diluted common share
|
$
|
3.13
|
|
$
|
3.56
|
|
|
Note: The 35% rate above is the annual expected incremental tax rate associated with the taxable or tax deductible items listed.
59
Segment Operating Results - Specialty Property & Casualty
Our Specialty P&C segment focuses on professional liability insurance and medical technology and life sciences products liability insurance as discussed in Note 15 of the Notes to Consolidated Financial Statements. Specialty P&C segment operating results reflect pre-tax underwriting profit or loss from these insurance lines, and does not include investment results, which are included in our Corporate segment. Segment operating results for the
year ended
December 31, 2014
were
$137.2 million
as compared to
$176.7 million
for the
year ended
December 31, 2013
, and included the following:
|
Year Ended December 31
|
||||||||||||||
|
($ in thousands)
|
2014
|
2013
|
Change
|
|||||||||||
|
Net premiums written
|
$
|
467,046
|
|
$
|
525,182
|
|
$
|
(58,136
|
)
|
(11.1
|
%)
|
|||
|
Net premiums earned
|
$
|
492,733
|
|
$
|
527,919
|
|
$
|
(35,186
|
)
|
(6.7
|
%)
|
|||
|
Net losses and loss adjustment expenses
|
$
|
228,199
|
|
$
|
224,761
|
|
$
|
3,438
|
|
1.5
|
%
|
|||
|
Underwriting, policy acquisition and operating expenses
|
$
|
133,132
|
|
$
|
132,076
|
|
$
|
1,056
|
|
0.8
|
%
|
|||
|
Net loss ratio
|
46.3
|
%
|
42.6
|
%
|
3.7
|
|
||||||||
|
Underwriting expense ratio
|
27.0
|
%
|
25.0
|
%
|
2.0
|
|
||||||||
Premiums Written
Changes in our premium volume within our Specialty P&C segment are driven by four primary factors: (1) the amount of new business, (2) our retention of existing business, (3) the premium charged for business that is renewed, which is affected by rates charged and by the amount and type of coverage an insured chooses to purchase, and (4) the timing of premium written through multi-period policies. In addition, premium volume may periodically be affected by shifts in the timing of renewals between periods. The healthcare professional liability market, which accounts for a majority of the revenues in this segment, remains challenging as physicians continue joining hospitals or larger group practices and are thus no longer purchasing insurance in the standard market. In addition, some competitors have chosen to compete primarily on price; both factors impact our ability to write new business and retain existing business.
Gross, ceded and net premiums written were as follows:
|
Year Ended December 31
|
||||||||||||||
|
($ in thousands)
|
2014
|
2013
|
Change
|
|||||||||||
|
Gross premiums written
|
$
|
532,608
|
|
$
|
567,547
|
|
$
|
(34,939
|
)
|
(6.2
|
%)
|
|||
|
Ceded premiums written
|
(65,562
|
)
|
(42,365
|
)
|
(23,197
|
)
|
(54.8
|
%)
|
||||||
|
Net premiums written
|
$
|
467,046
|
|
$
|
525,182
|
|
$
|
(58,136
|
)
|
(11.1
|
%)
|
|||
Gross Premiums Written
Gross premiums written by component were as follows:
|
Year Ended December 31
|
||||||||||||||
|
($ in thousands)
|
2014
|
2013
|
Change
|
|||||||||||
|
Professional liability
|
||||||||||||||
|
Physicians (1):
|
||||||||||||||
|
Twelve month term
|
$
|
362,056
|
|
$
|
388,583
|
|
$
|
(26,527
|
)
|
(6.8
|
%)
|
|||
|
Twenty-four month term
|
19,949
|
|
25,584
|
|
(5,635
|
)
|
(22.0
|
%)
|
||||||
|
Total Physicians
|
382,005
|
|
414,167
|
|
(32,162
|
)
|
(7.8
|
%)
|
||||||
|
Other healthcare providers (2)
|
33,589
|
|
33,971
|
|
(382
|
)
|
(1.1
|
%)
|
||||||
|
Healthcare facilities (3)
|
33,521
|
|
35,356
|
|
(1,835
|
)
|
(5.2
|
%)
|
||||||
|
Legal professionals (4)
|
27,776
|
|
27,060
|
|
716
|
|
2.6
|
%
|
||||||
|
Tail coverages (5)
|
18,745
|
|
20,920
|
|
(2,175
|
)
|
(10.4
|
%)
|
||||||
|
Total professional liability
|
495,636
|
|
531,474
|
|
(35,838
|
)
|
(6.7
|
%)
|
||||||
|
Medical technology and life sciences products liability (6)
|
35,265
|
|
34,190
|
|
1,075
|
|
3.1
|
%
|
||||||
|
Other
|
1,707
|
|
1,883
|
|
(176
|
)
|
(9.3
|
%)
|
||||||
|
Total
|
$
|
532,608
|
|
$
|
567,547
|
|
$
|
(34,939
|
)
|
(6.2
|
%)
|
|||
60
|
(1)
|
Physician policies were our greatest source of premium revenues in both
2014
and
2013
. We offer twenty-four month term policies to our physician insureds in one selected jurisdiction. The
decline
in twenty-four month premium, as compared to
2013
, primarily reflects the normal cycle of renewals (policies subject to renewal in
2014
were previously written in
2012
rather than in
2013
). There was no significant volume change associated with twenty-four month policies during the
year ended
December 31, 2014
.
|
|
(2)
|
Our other healthcare providers are primarily dentists, chiropractors and allied health professionals.
|
|
(3)
|
Our healthcare facilities premium (which includes hospitals, surgery centers and other facilities)
decline
d in
2014
, principally due to the non-renewal of certain business.
|
|
(4)
|
Our legal professionals policies are offered throughout the United States, principally through agent and brokerage arrangements.
|
|
(5)
|
We offer extended reporting endorsement or "tail" coverage to insureds who discontinue their claims-made coverage with us, and we also periodically offer "tail" coverage through custom policies. The amount of tail coverage premium written can vary widely from period to period.
|
|
(6)
|
Our medical technology and life sciences products liability (products liability) business is marketed throughout the United States; coverage is offered on a primary basis, within specified limits, to manufacturers and distributors of medical technology and life sciences products. In addition to the previously listed factors that affect our premium volume, our products liability premium volume is impacted by the sales volume of insureds.
|
New business written by component was as follows:
|
Year Ended December 31
|
|||||||
|
(In millions)
|
2014
|
2013
|
|||||
|
Physicians
|
$
|
16.2
|
|
$
|
18.0
|
|
|
|
Other healthcare providers
|
$
|
2.8
|
|
$
|
2.5
|
|
|
|
Healthcare facilities
|
$
|
4.5
|
|
$
|
6.2
|
|
|
|
Legal professionals *
|
$
|
4.2
|
|
$
|
2.0
|
|
|
|
Medical technology and life sciences products liability *
|
$
|
5.4
|
|
na
|
|
||
|
* Excludes new business attributable to our Medmarc acquisition for the year ended December 31, 2013, as the entire Medmarc book of business was new to us in 2013.
|
|||||||
We calculate our retention rate as annualized renewed premium divided by all annualized premium subject to renewal. Retention rates are affected by a number of factors. We may lose insureds to competitors or to alternative insurance mechanisms such as risk retention groups or self-insurance entities (often when physicians join hospitals or large group practices) or due to pricing or other issues. We may choose not to renew an insured as a result of our underwriting evaluation. Insureds may also terminate coverage because they have left active practice for various reasons, principally for retirement but also for personal reasons or due to disability or death.
Premium retention by component is shown in the following table.
|
Year Ended December 31
|
|||||
|
2014
|
2013
|
||||
|
Physicians, standard lines only
|
89
|
%
|
89
|
%
|
|
|
Other healthcare providers
|
81
|
%
|
82
|
%
|
|
|
Healthcare facilities
|
83
|
%
|
79
|
%
|
|
|
Legal professionals *
|
82
|
%
|
88
|
%
|
|
|
Medical technology and life sciences products liability *
|
85
|
%
|
na
|
|
|
|
* Premiums contributed by our Medmarc acquisition are excluded from the calculation of retention for the year ended December 31, 2013, as the entire Medmarc book of business was new to us in 2013.
|
|||||
61
The pricing of our business includes the effects of filed rates, surcharges, and discounts. We continue to base our pricing on expected losses, as indicated by our historical loss data and available industry loss data. We are committed to a rate structure that will allow us to fulfill our obligations to our insureds, while generating competitive returns for our shareholders.
The changes in renewal pricing shown for healthcare facilities and products liability lines of business in particular are reflective of changes in our exposure base, deductibles, self-insurance retention limits and other policy terms. Changes in renewal pricing by component are as follows:
|
Year Ended December 31
|
||
|
2014
|
||
|
Physicians
|
1
|
%
|
|
Other healthcare providers
|
4
|
%
|
|
Healthcare facilities
|
(3
|
%)
|
|
Legal professionals
|
6
|
%
|
|
Medical technology and life sciences products liability
|
2
|
%
|
Ceded Premiums Written
Ceded premiums represent the amounts owed to our reinsurers for their assumption of a portion of our losses. Through our current excess of loss reinsurance arrangements we retain the first $1 million in risk insured by us and cede any coverages in excess of this amount, and for our products liability coverages, we also retain 20% of the next $9 million of risk for coverages in excess of $1 million. We pay our reinsurers a ceding premium in exchange for their accepting the risk, the ultimate amount of which is determined by the loss experience of the business ceded, subject to certain minimum and maximum amounts.
Ceded premiums written for the years ended
December 31, 2014
and
2013
were comprised as follows:
|
Year Ended December 31
|
||||||||||||||
|
($ in thousands)
|
2014
|
2013
|
Change
|
|||||||||||
|
Excess of loss reinsurance arrangements
|
$
|
31,031
|
|
$
|
30,571
|
|
$
|
460
|
|
1.5
|
%
|
|||
|
Premium ceded to Syndicate 1729 (1)
|
20,899
|
|
—
|
|
20,899
|
|
nm
|
|
||||||
|
Other shared risk arrangements (2)
|
20,642
|
|
19,040
|
|
1,602
|
|
8.4
|
%
|
||||||
|
Other ceded premiums written
|
8,705
|
|
9,157
|
|
(452
|
)
|
(4.9
|
%)
|
||||||
|
Reduction in premiums owed under reinsurance agreements, prior accident years, net (3)
|
(15,715
|
)
|
(16,403
|
)
|
688
|
|
4.2
|
%
|
||||||
|
Total ceded premiums written
|
$
|
65,562
|
|
$
|
42,365
|
|
$
|
23,197
|
|
54.8
|
%
|
|||
|
(1)
|
Effective January 1, 2014, one of our subsidiaries began ceding premium to Syndicate 1729 under a quota share agreement, net of a related ceding commission. As previously discussed, we are a 58% participant in Syndicate 1729 and record our pro rata share of its operating results in our Lloyd's Syndicate segment on a quarter delay. We also record the Specialty P&C segment results for this agreement on a quarter delay as the amounts are not material and this permits the cession to be reported by both the Lloyd's Syndicate segment and the Specialty P&C segment in the same reporting period. Premium ceded to Syndicate 1729 reported for the
year ended
December 31, 2014
in the table above reflects cessions that occurred during the nine-months ended
September 30, 2014
. The related ceding commission income recorded as an offset to deferred policy acquisition costs for the
year ended
December 31, 2014
was
$5.6 million
. The
fourth
quarter cession of
$4.8 million
and the related ceding commission income of
$1.3 million
will be recorded in the first quarter of
2015
. Eliminations of the inter-segment portion (58% of the Specialty P&C cession) of the transactions are also recorded on a quarter delay.
|
|
(2)
|
We have entered into various shared risk arrangements, including quota share, fronting, and captive arrangements, with certain large healthcare systems and other insurance entities. These arrangements include our Ascension Health Certitude and CAPAssurance Programs. The increase in ceded premiums written under our shared risk arrangements for the
year ended
December 31, 2014
principally reflected premiums ceded under arrangements begun during 2014, partially offset by a large policy under one of the arrangements that did not renew in 2014.
|
62
|
(3)
|
Given the length of time that it takes to resolve our claims, many years may elapse before all losses recoverable under a reinsurance arrangement are known. As a part of the process of estimating our loss reserve we also make estimates regarding the amounts recoverable under our reinsurance arrangements. As previously discussed, the premiums ultimately ceded under our excess of loss reinsurance arrangements are subject to the losses ceded under the arrangements. In both
2014
and
2013
, we reduced our estimate of expected losses and associated recoveries for prior year ceded losses, as well as our estimate of ceded premiums owed to reinsurers. Changes to estimates of premiums ceded related to prior accident years are fully earned in the period the change in estimates occur.
|
Ceded Premiums Ratio
As shown in the table below, our ceded premiums ratio was affected in both
2014
and
2013
by revisions to our estimate of premiums owed to reinsurers related to coverages provided in prior accident years.
|
Year Ended December 31
|
||||||||
|
|
2014
|
2013
|
Change
|
|||||
|
Ceded premiums ratio, as reported
|
12.3
|
%
|
7.5
|
%
|
4.8
|
|
||
|
Less the effect of reduction in premiums owed under reinsurance agreements, prior accident years (as previously discussed)*
|
(3.0
|
%)
|
(2.9
|
%)
|
(0.1
|
)
|
||
|
Ratio, current accident year
|
15.3
|
%
|
10.4
|
%
|
4.9
|
|
||
* Effect shown for 2013 is net of an increase to the ratio of approximately 0.3 percentage points attributable to business combinations.
The remaining increase in the current accident year ceded premiums ratio for the
year ended
December 31, 2014
was primarily attributable to the increase in ceded premiums written under the quota share arrangement with Syndicate 1729 and our shared risk arrangements, as previously discussed. Additionally, premium volume from retained coverages was lower in
2014
than in
2013
, which reduced gross premiums written but had no effect on ceded premiums written, and thus increased the ratio.
Net Premiums Earned
Net premiums earned were as follows:
|
Year Ended December 31
|
||||||||||||||
|
($ in thousands)
|
2014
|
2013
|
Change
|
|||||||||||
|
Gross premiums earned
|
$
|
543,052
|
|
$
|
569,433
|
|
$
|
(26,381
|
)
|
(4.6
|
%)
|
|||
|
Ceded premiums earned
|
(50,319
|
)
|
(41,514
|
)
|
(8,805
|
)
|
(21.2
|
%)
|
||||||
|
Net premiums earned
|
$
|
492,733
|
|
$
|
527,919
|
|
$
|
(35,186
|
)
|
(6.7
|
%)
|
|||
Net premiums earned consist of gross premiums earned less the portion of earned premiums that we cede to our reinsurers for their assumption of a portion of our losses. Because premiums are generally earned pro rata over the entire policy period, fluctuations in premiums earned tend to lag those of premiums written. Generally, our policies carry a term of one year, but as discussed above, we write certain policies with a twenty-four month term, and certain of our medical technology and life sciences products liability policies carry a multi-year term. Tail coverage premiums are generally 100% earned in the period written because the policies insure only incidents that occurred in prior periods and are not cancellable. Additionally, ceded premium changes due to changes to estimates of premiums owed under reinsurance agreements are fully earned in the period of change.
The
decrease
in gross premiums earned in
2014
primarily reflects the pro rata effect of lower physician premiums written during the preceding twelve months, partially offset by an increase in premiums earned due to growth associated with our shared risk arrangements. The
increase
in premiums ceded during
2014
primarily reflects growth associated with certain shared risk arrangements that were either new in 2014 or not in effect for all of 2013 and premiums ceded under the quota share arrangement with Syndicate 1729. Also, prior accident year ceded premiums reductions were
$0.7 million
lower in
2014
than in
2013
(see discussion under the heading "Ceded Premiums Written").
63
Losses and Loss Adjustment Expenses
The determination of calendar year losses involves the actuarial evaluation of incurred losses for the current accident year and the actuarial re-evaluation of incurred losses for prior accident years, including an evaluation of the reserve amounts required for losses in excess of policy limits.
Accident year refers to the accounting period in which the insured event becomes a liability of the insurer. For claims-made policies, which represent over
90%
of the premiums written in our Specialty P&C segment, the insured event generally becomes a liability when the event is first reported to the insurer. For occurrence policies the insured event becomes a liability when the event takes place. We believe that measuring losses on an accident year basis is the best measure of the underlying profitability of the premiums earned in that period, since it associates policy premiums earned with the estimate of the losses incurred related to those policy premiums.
The following table summarizes calendar year net loss ratios by separating losses between the current accident year and all prior accident years. Additionally, the table shows our current accident year net loss ratio was significantly affected by revisions to our estimate of premiums owed to reinsurers related to coverages provided in prior accident years. Our current accident year net loss ratios for
2014
and
2013
compare as follows:
|
Net Loss Ratios (1)
|
||||||||
|
Year Ended December 31
|
||||||||
|
2014
|
2013
|
Change
|
||||||
|
Calendar year net loss ratio
|
46.3
|
%
|
42.6
|
%
|
3.7
|
|
||
|
Less impact of prior accident years on the net loss ratio
|
(36.7
|
%)
|
(42.2
|
%)
|
5.5
|
|
||
|
Current accident year net loss ratio
|
83.0
|
%
|
84.8
|
%
|
(1.8
|
)
|
||
|
Less estimated ratio increase (decrease) attributable to:
|
||||||||
|
Ceded premium reductions, prior accident years (2)
|
(2.7
|
%)
|
(2.7
|
%)
|
—
|
|
||
|
Current accident year net loss ratio, excluding the effect of prior year ceded premium (3)
|
85.7
|
%
|
87.5
|
%
|
(1.8
|
)
|
||
|
(1)
|
Net losses as specified divided by net premiums earned.
|
|
(2)
|
Reductions to premiums owed under reinsurance agreements for prior accident years increased net premiums earned (the denominator of the current accident year ratio) in both
2014
and
2013
. The net increase to the ratio in 2013 reflects an offset of 0.3 percentage points that is attributable to loss reserves acquired in business combinations. See the discussion in the Premiums section for our Specialty P&C segment under the heading “Ceded Premiums Written” for additional information.
|
|
(3)
|
The remaining decrease in the current accident year net loss ratio primarily reflects a
decrease
in our loss reserves related to death, disability and retirement (DDR) coverage endorsements provided to our insureds. The reserve for DDR is actuarially estimated and is affected by changes in the number of insureds expected to benefit from the coverage endorsement. This decrease was partially offset by the effect of a higher accrual for internal claims adjustment expenses on a lower volume of premiums earned.
|
We recognized favorable loss development related to our previously established reserve, on a gross basis, of
$213.7 million
for the
year ended
December 31, 2014
. On a net basis, we recognized favorable development of
$180.8 million
for the
year ended
December 31, 2014
. The net basis reflects the favorable development recognized with respect to our ceded coverage layers. We re-evaluate our previously established reserve each quarter based on our most recently available claims data and currently available industry trend information. Development recognized during
2014
principally related to accident years
2007 through 2011
.
We recognized favorable loss development related to our previously established reserve, on a gross basis, of
$248.5 million
for the
year ended
December 31, 2013
. On a net basis, we recognized favorable development of
$222.7 million
for the
year ended
December 31, 2013
. Development recognized during
2013
principally related to accident years
2005 through 2011
.
A detailed discussion of factors influencing our recognition of loss development recognized is included in our Critical Accounting Estimates section under the heading "Reserve for Losses and Loss Adjustment Expenses." Assumptions used in establishing our reserve are regularly reviewed and updated by management as new data becomes available. Any adjustments necessary are reflected in the then current operations. Due to the size of our reserve, even a small percentage adjustment to the assumptions can have a material effect on our results of operations for the period in which the change is made, as was the case in both
2014
and
2013
.
64
Underwriting, Policy Acquisition and Operating Expenses
The table below provides a comparison of
2014
and
2013
underwriting, policy acquisition and operating expenses:
|
Year Ended December 31
|
||||||||||||||
|
($ in thousands)
|
2014
|
2013
|
Change
|
|||||||||||
|
Underwriting, policy acquisition and operating expenses
|
$
|
133,132
|
|
$
|
132,076
|
|
$
|
1,056
|
|
0.8
|
%
|
|||
The following table highlights the more significant items affecting the comparability of expenses between
2014
and
2013
:
|
(In millions)
|
Increase (Decrease) 2014 vs 2013
|
||
|
Excluding the effect from purchase accounting listed separately below, DPAC amortization decreased in 2014. The amortization decrease was primarily attributable to a $2.8 million increase in ceding commission income. Ceding commissions are an offset to acquisition costs.
|
$
|
(1.9
|
)
|
|
Amortization of deferred policy acquisition costs was lower due to the application of GAAP purchase accounting rules in 2013, but was at a normal level in 2014.
|
3.8
|
|
|
|
Costs associated with ongoing technology enhancement initiatives
|
1.2
|
|
|
|
Other variances not individually significant
|
(0.3
|
)
|
|
|
Expenses associated with discrete events:
|
|||
|
Transaction-related costs associated with entities acquired in 2013, principally professional fees and one time compensation costs
|
(2.7
|
)
|
|
|
Discontinued technology initiatives
|
0.9
|
|
|
|
Net change in expenses
|
$
|
1.0
|
|
Underwriting Expense Ratio (the Expense Ratio)
As shown in the following table, our expense ratio was affected in both
2014
and
2013
by expenses associated with discrete events (see table above):
|
|
Underwriting Expense Ratio
|
|||||||
|
|
Year Ended December 31
|
|||||||
|
|
2014
|
2013
|
Change
|
|||||
|
Underwriting expense ratio, as reported
|
27.0
|
%
|
25.0
|
%
|
2.0
|
|
||
|
Less estimated ratio increase (decrease) attributable to expenses associated with discrete events (see table above)
|
0.5
|
%
|
0.8
|
%
|
(0.3
|
)
|
||
|
Underwriting expense ratio, less listed effects
|
26.5
|
%
|
24.2
|
%
|
2.3
|
|
||
The remaining increase in the ratio is due to the
$3.8 million
increase in deferred policy acquisition cost amortization identified in the previous table (approximately a
0.8
percentage point increase in the ratio), other operating cost increases during
2014
(approximately a
0.7
percentage point increase in the ratio), and the effect of a reduction in net earned premium as compared to
2013
(approximately a
0.8
percentage point increase in the ratio).
65
Segment Operating Results - Workers' Compensation
Our Workers' Compensation segment provides traditional workers' compensation insurance products primarily to employers with 1,000 employees or fewer and alternative market solutions, as discussed in Note 15 to the Notes to Consolidated Financial Statements. Our Workers' Compensation operations are the primary business operations acquired through our purchase of Eastern in 2014. Segment operating results reflect pre-tax underwriting profit or loss, and does not include investment results which are reported in our Corporate segment. Segment operating results for the year ended
December 31, 2014
were
$6.5 million
and included the following:
|
Year Ended
|
||||
|
($ in thousands)
|
December 31, 2014
|
|||
|
Net premiums written
|
$
|
202,697
|
|
|
|
Net premiums earned
|
$
|
194,540
|
|
|
|
Net losses and loss adjustment expenses
|
$
|
126,447
|
|
|
|
Underwriting, policy acquisition and operating expenses
|
$
|
60,357
|
|
|
|
Segregated portfolio cell dividend expense
|
$
|
1,842
|
|
|
|
Net loss ratio
|
65.0
|
%
|
||
|
Underwriting expense ratio
|
31.0
|
%
|
||
Premiums Written
Our workers’ compensation premium volume is driven by four primary factors: 1) the amount of new business written, 2) retention of our existing book of business, 3) premium rates charged on our renewal book of business, and 4) audit premium.
Gross, ceded and net premiums written for the year ended
December 31, 2014
were as follows:
|
Year Ended December 31, 2014
|
|||||||||||
|
(In thousands)
|
Traditional Business
|
Alternative Market Business
|
Segment
Results
|
||||||||
|
Gross premiums written
|
$
|
166,004
|
|
$
|
59,359
|
|
$
|
225,363
|
|
||
|
Ceded premiums written
|
(10,401
|
)
|
(12,265
|
)
|
(22,666
|
)
|
|||||
|
Net premiums written
|
$
|
155,603
|
|
$
|
47,094
|
|
$
|
202,697
|
|
||
Our traditional workers’ compensation insurance products include guaranteed cost, dividend, deductible, and retrospectively-rated policies. Our alternative market business is ceded 100% either to the segregated portfolio cells at our wholly owned Cayman Islands reinsurance subsidiary, Eastern Re, or to an unaffiliated captive insurer. As of
December 31, 2014
, there were 21 (17 active) segregated portfolio cells at Eastern Re and 3 active alternative market programs with an unaffiliated captive insurer.
Additional information regarding the operations of the segregated portfolio cells is included in the Underwriting, policy acquisition and operating expense section below.
Gross Premiums Written
Gross premiums written in our traditional and alternative market business for
2014
reflected the following:
|
Year Ended December 31, 2014
|
|||||||||||
|
(In thousands)
|
Traditional Business
|
Alternative Market Business
|
Segment
Results |
||||||||
|
Gross premiums written
|
$
|
166,004
|
|
$
|
59,359
|
|
$
|
225,363
|
|
||
66
Retention, renewal price change, new business and audit premium for both the traditional business and the alternative market business for
2014
are shown in the table below:
|
Year Ended December 31, 2014
|
|||||||||||
|
($ in thousands)
|
Traditional Business
|
Alternative Market Business
|
Segment
Results |
||||||||
|
Retention rate (1)
|
82
|
%
|
86
|
%
|
83
|
%
|
|||||
|
Change in renewal pricing (2)
|
2
|
%
|
—
|
%
|
1
|
%
|
|||||
|
New business
|
$
|
35,111
|
|
$
|
8,614
|
|
$
|
43,725
|
|
||
|
Audit premium
|
$
|
3,057
|
|
$
|
347
|
|
$
|
3,404
|
|
||
(1) Our retention rate reflected the impact of price competition in the marketplace. We calculate our workers' compensation retention rate as annualized renewed premium divided by all annualized premium subject to renewal.
(2) The pricing of our business includes an assessment of the underlying policy exposure and the effects of current market conditions. We continue to base our pricing on expected losses, as indicated by our historical loss data.
Ceded Premiums Written
Ceded premiums written reflect our external reinsurance programs and alternative market business ceded to an unaffiliated captive insurance company.
Ceded premiums written for the year ended
December 31, 2014
were as follows:
|
Year Ended December 31, 2014
|
|||||||||||
|
(In thousands)
|
Traditional Business
|
Alternative Market Business
|
Segment
Results
|
||||||||
|
Premiums ceded to external reinsurers
|
$
|
10,720
|
|
$
|
5,927
|
|
$
|
16,647
|
|
||
|
Return premium estimate under external reinsurance
|
(319
|
)
|
—
|
|
(319
|
)
|
|||||
|
Premiums ceded to unaffiliated captive insurers
|
—
|
|
6,338
|
|
6,338
|
|
|||||
|
Total ceded premiums written
|
$
|
10,401
|
|
$
|
12,265
|
|
$
|
22,666
|
|
||
We retain the first $0.5 million in risk insured by us on our traditional business and cede losses in excess of this amount on each loss occurrence under our primary external reinsurance contract. The traditional external reinsurance contract contains a return premium provision under which we estimate return premium based on the underlying loss experience of policies covered under the contract. Changes in the return premium estimate reflect the loss experience under the reinsurance contract for the year ended
December 31, 2014
. In our alternative market business, the risk retention for each loss occurrence ranges from $0.3 to $0.35 million based on the alternative market program. We cede 100% of premiums written under three alternative market programs to an unaffiliated captive insurer.
Ceded Premiums Ratio
|
Year Ended December 31, 2014
|
|||||
|
Traditional Business
|
Alternative Market Business
|
Segment
Results
|
|||
|
Ceded premiums ratio, as reported
|
6.3%
|
20.7%
|
10.1%
|
||
|
Less the effect of:
|
|||||
|
Return premium estimated under external reinsurance
|
(0.2%)
|
—%
|
(0.1%)
|
||
|
Premiums ceded to unaffiliated captive insurer (100%)
|
—%
|
10.7%
|
2.8%
|
||
|
Ceded premiums ratio, less the effects of above
|
6.5%
|
10.0%
|
7.4%
|
||
Ceded premiums under our primary external reinsurance contract represented
7.4%
of gross premiums written for the year ended
December 31, 2014
. We cede premiums related to our traditional business on an earned premium basis, whereas alternative market premiums are ceded on a written premium basis.
67
Net Premiums Earned
Net premiums earned for the year ended
December 31, 2014
were as follows:
|
Year Ended December 31, 2014
|
|||||||||||
|
(In thousands)
|
Traditional Business
|
Alternative Market Business
|
Segment
Results
|
||||||||
|
Gross premiums earned
|
$
|
160,717
|
|
$
|
55,616
|
|
$
|
216,333
|
|
||
|
Ceded premiums earned
|
(9,849
|
)
|
(11,944
|
)
|
(21,793
|
)
|
|||||
|
Net premiums earned
|
$
|
150,868
|
|
$
|
43,672
|
|
$
|
194,540
|
|
||
Net premiums earned consists of gross premiums earned less the portion of earned premiums that we cede to our reinsurers for their assumption of a portion of our losses. Our workers’ compensation policies are twelve-month policies and premiums are earned on a pro rata basis over the policy period. Net premiums earned also include premium adjustments related to the audit of our insureds' payrolls. Payroll audits are conducted subsequent to the end of the policy period and any related adjustments are recorded in the current period. In addition, we record an estimate for EBUB and evaluate the estimate on a quarterly basis. We increased the EBUB estimate by
$0.4 million
during
2014
, and the impact of that change is included in Audit premium.
Losses and Loss Adjustment Expenses
The following table summarizes calendar year net loss ratios by separating losses between the current accident year and all prior accident years. The components of the calendar year loss ratio were as follows:
|
Net Loss Ratios
|
||||||||
|
December 31, 2014
|
||||||||
|
Traditional Business
|
Alternative Market Business
|
Segment
Results
|
||||||
|
Calendar year net loss ratio
|
65.0
|
%
|
65.1
|
%
|
65.0
|
%
|
||
|
Less impact of prior accident years on the net loss ratio
|
(1.0
|
%)
|
0.6
|
%
|
(0.7
|
%)
|
||
|
Current accident year net loss ratio
|
66.0
|
%
|
64.5
|
%
|
65.7
|
%
|
||
|
Less impact of audit premium on loss ratio
|
(1.3
|
%)
|
(0.5
|
%)
|
(1.2
|
%)
|
||
|
Current accident year net loss ratio, excluding the effect of audit premium
|
67.3
|
%
|
65.0
|
%
|
66.9
|
%
|
||
We recognized favorable prior year development at the segment level for our workers' compensation business of
$1.3 million
for the year ended December 31, 2014. Our traditional business produced
$1.6 million
in favorable development related to amortization associated with the purchase accounting fair value adjustment, which was offset by unfavorable development of
$0.3 million
related to our alternative market business, primarily reflecting medical severity-related claims activity in the 2013 accident year.
We recognized audit premium from customers in both our traditional and alternative market business during
2014
, which reduced the current accident year net loss ratio. Audit premium from customers results in a decrease in the net loss ratio, whereas audit premium returned to customers results in an increase in the net loss ratio.
68
Underwriting, Policy Acquisition and Operating Expenses
Underwriting, policy acquisition and operating expenses for the year ended
December 31, 2014
were
$60.4 million
. These expenses include commissions, premium taxes, and underwriter salaries, which are capitalized and deferred over the related workers’ compensation policy period, net of external ceding commissions earned. The capitalization of these costs can vary as they are subject to the success rate of our contract acquisition efforts.
|
Year Ended
|
|||
|
(In thousands)
|
December 31, 2014
|
||
|
Traditional business
|
$
|
46,717
|
|
|
Alternative market business
|
13,640
|
|
|
|
Underwriting, policy acquisition and operating expenses
|
$
|
60,357
|
|
The following table highlights certain discrete events affecting expenses, entirely in our traditional business in
2014
:
|
Expense Increase (Decrease)
|
|||
|
Year Ended
|
|||
|
(In thousands)
|
December 31, 2014
|
||
|
One-time professional fees
|
$
|
661
|
|
|
Transaction-related expenses
|
$
|
2,180
|
|
Underwriting Expense Ratio (the Expense Ratio)
Our expense ratio for the year ended
December 31, 2014
, including the impact of audit premium and certain discrete items in our traditional and alternative market business, was as follows:
|
Year Ended December 31, 2014
|
||||||||
|
Traditional Business
|
Alternative Market Business*
|
Segment Results
|
||||||
|
Underwriting expense ratio, as reported
|
31.0
|
%
|
31.2
|
%
|
31.0
|
%
|
||
|
Less estimated ratio increase (decrease) attributable to:
|
||||||||
|
Transaction-related expenses
|
1.4
|
%
|
—
|
%
|
1.1
|
%
|
||
|
One-time professional fees
|
0.4
|
%
|
—
|
%
|
0.3
|
%
|
||
|
Amortization of intangible assets
|
3.4
|
%
|
—
|
%
|
2.7
|
%
|
||
|
Impact of return premium estimate
|
(0.1
|
%)
|
—
|
%
|
(0.1
|
%)
|
||
|
Impact of audit premium
|
(0.6
|
%)
|
(0.3
|
%)
|
(0.6
|
%)
|
||
|
Underwriting expense ratio, less listed effects
|
26.5
|
%
|
31.5
|
%
|
27.6
|
%
|
||
*The expense ratio of our alternative market business approximates the ceding commissions paid to Eastern.
69
Segregated Portfolio Cell (SPC) Dividend Expense
Our Workers' Compensation segment provides turn-key workers' compensation alternative market solutions that include program design, fronting, claims administration, risk management, SPC rental, asset management and SPC management services. The asset management and SPC management services are outsourced to a third party. Alternative market customers include individual companies, groups and/or associations (known as SPC dividend participants). SPC dividend expense for each period represents the profit or loss attributable to the alternative market business ceded to the SPC's of Eastern Re, net of any participation we have taken in the SPC's.
The SPC's are segregated pools of assets and liabilities that provide an insurance facility for a defined set of risks. Assets of each SPC are solely for the benefit of that individual cell and each SPC is solely responsible for the liabilities of that individual cell. Assets of one SPC are statutorily protected from the creditors of the others. We participate to a varying degree in the results of selected SPC's. Our ownership interest in the SPC's in which we participate is generally 50%, but we have ownership interests as low as 25% and as high as 82.5%. Under the SPC structure, the net operating results of each cell, net of our participation, are due to the SPC participants of that cell.
SPC dividend expense for the year ended
December 31, 2014
was as follows:
|
Year Ended
|
|||
|
(In thousands)
|
December 31, 2014
|
||
|
Segregated portfolio cell net operating results
|
$
|
2,539
|
|
|
Eastern participation - (profit)/loss retained
|
(697
|
)
|
|
|
Segregated portfolio cell dividend expense
|
$
|
1,842
|
|
70
Segment Operating Results - Lloyd's Syndicate
Through a wholly owned and consolidated subsidiary (the Corporate Member), we are a Corporate Member of Lloyd's of London. Our Corporate Member is the majority (58%) capital provider to Syndicate 1729, which began writing and reinsuring property and casualty business as of January 1, 2014. The remaining capital for Syndicate 1729 is provided by unrelated third parties, including private names and other corporate members.
Syndicate 1729 covers a range of property and casualty insurance and reinsurance lines, and has a maximum underwriting capacity of
£75 million
for the 2015 underwriting year, of which
£43 million
(
$67 million
based on
December 31, 2014
exchange rates) is our allocated underwriting capacity as a corporate member.
Syndicate 1729 functions as the medium through which we and the other capital providers participate in the property and casualty business underwritten by the Syndicate. Syndicate 1729 is led by Duncan Dale, an underwriter with more than 30 years of experience at Lloyd’s and in the London insurance and reinsurance market. A service company, 70% owned by Mr. Dale and 30% owned by ProAssurance, provides underwriting and other services to Syndicate 1729 on a fee basis. We account for our interest in the service company using the equity method as we do not control the service company.
Our Lloyd's Syndicate segment (comprised of our
58%
participation in Syndicate 1729 operating results and 100% of the operating results of our wholly owned subsidiaries that support Syndicate 1729) reported net operating losses for the
year ended
December 31, 2014
of
$5.0 million
. We report results from our Syndicate 1729 involvement on a quarter delay, except that investment results associated with our FAL investments and certain U.S. paid administrative expenses, principally start-up costs, are reported concurrently as that information is available on an earlier time frame.
Segment results reported for the
year ended
December 31, 2014
included the following:
|
Year Ended
|
|||
|
($ in thousands)
|
December 31, 2014
|
||
|
Net premiums written
|
$
|
32,106
|
|
|
Net premiums earned
|
$
|
12,458
|
|
|
Net investment income
|
$
|
410
|
|
|
Net losses and loss adjustment expenses
|
$
|
8,438
|
|
|
Underwriting, policy acquisition and operating expenses
|
$
|
9,535
|
|
|
Net loss ratio
|
67.7
|
%
|
|
|
Underwriting expense ratio
|
76.5
|
%
|
|
Segment gross premiums written by component as well as a reconciliation to net premiums written are shown in the following table.
|
Year Ended
|
|||
|
($ in thousands)
|
December 31, 2014
|
||
|
Gross premiums written:
|
|||
|
Casualty
|
$
|
21,703
|
|
|
Property
|
6,110
|
|
|
|
Catastrophe
|
5,918
|
|
|
|
Ceded premiums written
|
(1,625
|
)
|
|
|
Net premiums written
|
$
|
32,106
|
|
As discussed in our Specialty P&C segment operating results, effective January 1, 2014, Syndicate 1729 entered into a quota share reinsurance agreement with one of our Specialty P&C wholly owned insurance subsidiaries and pays a ceding commission related to the amount assumed. Our Specialty P&C segment reports this ceding arrangement on a quarter delay as the effect of the delay is not material and this permits the cession to be reported by both the Lloyd's Syndicate segment and the Specialty P&C segment in the same reporting period. The above table includes casualty premiums of
$12.0 million
(our
58%
share of total premium ceded to Syndicate 1729) that are attributable to this arrangement.
71
Net premiums earned consist of gross premiums earned less the portion of earned premiums ceded to external reinsurers for their assumption of a portion of our losses. Because premiums are generally earned pro rata over the entire policy period, fluctuations in premiums earned tend to lag those of premiums written. Syndicate 1729 policies written to date primarily carry a term of one year.
The net loss ratio was
67.7%
for the
year ended
December 31, 2014
. Losses for the year were recorded using the loss assumptions incorporated into the business plan submitted to Lloyd's for Syndicate 1729; these assumptions are consistent with loss results reflected in Lloyd's historical data for similar risks.
Underwriting expenses were
$9.5 million
for the
year ended
December 31, 2014
, and primarily consisted of underwriting and administrative salaries and benefits, professional fees and amortization of policy acquisition costs (approximately
$3.2 million
). No underwriting salaries or benefits were deferred during the period due to the Syndicate being in a start-up phase. The high expense ratio for the segment reflects these and other start-up costs expensed during the year, as well as reduced levels of earned premium due to Syndicate 1729 being in its initial stage of operations.
Net investment income for the
year ended
December 31, 2014
primarily related to the income earned on the FAL investments. Our FAL investments are primarily in the form of short-term investments and investment-grade corporate debt securities.
Operating results of this segment are subject to both U.K and U.S. income tax law. No tax benefit has been recognized related to the operations of this segment as the loss is not currently deductible for tax purposes in either the U.K. or the U.S. and does not meet GAAP criteria for recognition of a deferred tax asset.
72
Segment Operating Results - Corporate
Segment operating results for our Corporate segment were
$57.8 million
and
$120.8 million
for the years ended
December 31, 2014
and
December 31, 2013
, respectively. Results included the following:
|
Year Ended December 31
|
||||||||||||||
|
($ in thousands)
|
2014
|
2013
|
Change
|
|||||||||||
|
Net investment income
|
$
|
125,147
|
|
$
|
129,265
|
|
$
|
(4,118
|
)
|
(3.2
|
%)
|
|||
|
Equity in earnings (loss) of unconsolidated subsidiaries
|
3,986
|
|
7,539
|
|
(3,553
|
)
|
(47.1
|
%)
|
||||||
|
Net investment result
|
$
|
129,133
|
|
$
|
136,804
|
|
$
|
(7,671
|
)
|
(5.6
|
%)
|
|||
|
Total net realized investment gains (losses)
|
$
|
14,650
|
|
$
|
67,904
|
|
$
|
(53,254
|
)
|
(78.4
|
%)
|
|||
|
Operating expense
|
$
|
8,768
|
|
$
|
15,748
|
|
$
|
(6,980
|
)
|
(44.3
|
%)
|
|||
|
Interest expense
|
$
|
14,084
|
|
$
|
2,755
|
|
$
|
11,329
|
|
>100%
|
|
|||
|
Income taxes
|
$
|
65,440
|
|
$
|
99,636
|
|
$
|
(34,196
|
)
|
(34.3
|
%)
|
|||
|
Gain on acquisition
|
$
|
—
|
|
$
|
32,314
|
|
$
|
(32,314
|
)
|
(100
|
%)
|
|||
Net Investment Income, Equity in Earnings (Loss) of Unconsolidated Subsidiaries, Net Realized Investment Gains (Losses)
Net Investment Income
Net investment income is primarily derived from the income earned by our fixed maturity securities and also includes dividend income from equity securities, income from our short-term and cash equivalent investments earnings from other investments and increases in the cash surrender value of business owned life insurance (BOLI) contracts. Investment fees and expenses are deducted from investment income.
Net investment income by investment category was as follows:
|
Year Ended December 31
|
||||||||||||||
|
($ in thousands)
|
2014
|
2013
|
Change
|
|||||||||||
|
Fixed maturities
|
$
|
111,442
|
|
$
|
122,065
|
|
$
|
(10,623
|
)
|
(8.7
|
%)
|
|||
|
Equities
|
10,817
|
|
9,454
|
|
1,363
|
|
14.4
|
%
|
||||||
|
Short-term and Other investments
|
8,833
|
|
2,584
|
|
6,249
|
|
>100%
|
|
||||||
|
Business owned life insurance
|
2,006
|
|
1,960
|
|
46
|
|
2.3
|
%
|
||||||
|
Investment fees and expenses
|
(7,951
|
)
|
(6,798
|
)
|
(1,153
|
)
|
(17.0
|
%)
|
||||||
|
Net investment income
|
$
|
125,147
|
|
$
|
129,265
|
|
$
|
(4,118
|
)
|
(3.2
|
%)
|
|||
Fixed Maturities
The decrease in our income from fixed maturity securities was primarily due to lower average investment balances. Although we added fixed securities valued at
$107 million
to our portfolio in 2014 as a result of the Eastern acquisition, we reduced the size of our fixed portfolio over the last year in order to purchase Eastern, repay debt, repurchase stock, pay dividends and invest in other asset classes. On an overall basis our average investment in fixed securities was approximately
6%
lower in
2014
as compared to
2013
.
Average yields for our fixed maturity portfolio were as follows.
|
Year Ended December 31
|
|||
|
|
2014
|
2013
|
|
|
Average income yield
|
3.6%
|
3.7%
|
|
|
Average tax equivalent income yield
|
4.2%
|
4.3%
|
|
Yields on fixed maturity securities decreased as compared to the same period in the prior year. Average income yields for the
year ended
December 31, 2014
primarily reflected a
6
basis point decline resulting from fixed maturity securities acquired in the Eastern transaction. In accordance with purchase accounting guidance, all Eastern securities were valued at fair value on the date acquired, which resulted in these securities having a lower yield on average than our other securities.
73
Equities
Income from our equity portfolio increased approximately
14%
for the
year ended
December 31, 2014
, as compared to
2013
. Average investment balances increased
25%
for the
year ended
December 31, 2014
primarily due to the acquisition of Eastern. The equities acquired in the Eastern transaction were predominately bond funds which produce lower average yields than our traditional equities.
Short-term Investments and Other Investments
Income from our Other investments increased for the
year ended
December 31, 2014
, principally due to increased distributions received from our interests in LPs that we account for using the cost method.
Investment Fees and Expenses
Investment fees and expenses increased for the
year ended
December 31, 2014
due to the addition of Eastern and some associated transition expenses in 2014.
Equity in Earnings (Loss) of Unconsolidated Subsidiaries
Equity in earnings (loss) of unconsolidated subsidiaries is derived from our investment interests accounted for under the equity method. Results were as follows:
|
Year Ended December 31
|
|||||||||||
|
(In thousands)
|
2014
|
2013
|
Change
|
||||||||
|
Investment LPs/LLCs
|
$
|
14,714
|
|
$
|
17,673
|
|
$
|
(2,959
|
)
|
||
|
Tax credit partnerships
|
(10,728
|
)
|
(10,134
|
)
|
(594
|
)
|
|||||
|
Equity in earnings (loss) of unconsolidated subsidiaries
|
$
|
3,986
|
|
$
|
7,539
|
|
$
|
(3,553
|
)
|
||
We hold interests in certain LPs/LLCs that generate earnings from trading portfolios, secured debt, debt securities, multi-strategy funds and private equity investments. Our 2013 earnings included
$8.4 million
that related to periods prior to 2013 but was recognized in 2013 as the result of converting one LP investment from the cost to the equity method. The equity method was considered preferable as our ownership percentage in the LP had increased. Exclusive of the effect of this conversion, LP earnings were higher in 2014 as compared to 2013.
Our tax credit partnerships, which currently contain qualified affordable housing projects, are designed to generate returns by providing tax benefits in the form of tax credits and tax-deductible project operating losses. We account for our tax credit investments on the equity method and record amortization of our investment each period based on our allocable portion of the projected operating losses of the underlying properties. Amortization is adjusted periodically as actual operating results of the underlying properties become available. Our amortization remained relatively flat in 2014 as compared to the prior year.
The tax benefits received from our tax credit partnerships, which are not reflected in our investment results above, reduced our tax expenses in 2014 and 2013 as follows:
|
Year Ended December 31
|
|||||||
|
(In thousands)
|
2014
|
2013
|
|||||
|
Tax credits recognized during the period
|
$
|
17,918
|
|
$
|
17,888
|
|
|
|
Tax benefit of amortization
|
$
|
3,755
|
|
$
|
3,547
|
|
|
74
Non-GAAP Financial Measure – Tax Equivalent Investment Result
We believe that to fully understand our investment returns it is important to consider the current tax benefits associated with certain investments as the tax benefit received represents a portion of the return provided by our tax-exempt bonds, BOLI, common and preferred stocks, and tax credit partnership investments (our tax-preferred investments). We impute a pro forma tax-equivalent result by estimating the amount of fully-taxable income needed to achieve the same after-tax result as is currently provided by our tax-preferred investments. We believe this better reflects the economics behind our decision to invest in certain asset classes that are either taxed at lower rates and/or result in reductions to our current federal income tax expense. Our pro forma tax-equivalent investment result is shown in the table that follows as is a reconciliation of our tax equivalent result to our GAAP net investment result.
|
Year Ended December 31
|
|||||||
|
(In thousands)
|
2014
|
2013
|
|||||
|
GAAP net investment result:
|
|||||||
|
Net investment income
|
$
|
125,147
|
|
$
|
129,265
|
|
|
|
Equity in earnings (loss) of unconsolidated subsidiaries
|
3,986
|
|
7,539
|
|
|||
|
GAAP net investment result, as reported
|
$
|
129,133
|
|
$
|
136,804
|
|
|
|
Pro forma tax-equivalent investment results
|
$
|
175,344
|
|
$
|
184,628
|
|
|
|
Reconciliation of pro forma and GAAP tax-equivalent investment results:
|
|||||||
|
Pro forma tax-equivalent investment results
|
$
|
175,344
|
|
$
|
184,628
|
|
|
|
Less taxable equivalent adjustments, calculated using the 35% federal statutory tax rate:
|
|||||||
|
State and municipal bonds
|
15,727
|
|
17,590
|
|
|||
|
BOLI
|
1,080
|
|
1,056
|
|
|||
|
Dividends received
|
1,754
|
|
1,674
|
|
|||
|
Tax credit partnerships
|
27,566
|
|
27,504
|
|
|||
|
Other investments
|
84
|
|
—
|
|
|||
|
GAAP net investment result, as reported
|
$
|
129,133
|
|
$
|
136,804
|
|
|
75
Net Realized Investment Gains (Losses)
The following table provides detailed information regarding our net realized investment gains (losses).
|
Year Ended December 31
|
|||||||
|
(In thousands)
|
2014
|
2013
|
|||||
|
Other-than-temporary impairment losses, total:
|
|||||||
|
State and municipal bonds
|
$
|
(50
|
)
|
$
|
(71
|
)
|
|
|
Corporate debt
|
(1,425
|
)
|
—
|
|
|||
|
Portion recognized in (reclassified from) Other Comprehensive Income:
|
|||||||
|
Corporate debt
|
268
|
|
—
|
|
|||
|
Net impairments recognized in earnings
|
(1,207
|
)
|
(71
|
)
|
|||
|
Gross realized gains, available-for-sale securities
|
5,623
|
|
18,130
|
|
|||
|
Gross realized (losses), available-for-sale securities
|
(1,103
|
)
|
(7,031
|
)
|
|||
|
Net realized gains (losses), trading securities
|
28,018
|
|
20,444
|
|
|||
|
Net realized gains (losses), other investments
|
326
|
|
—
|
|
|||
|
Change in unrealized holding gains (losses), trading securities
|
(18,883
|
)
|
35,507
|
|
|||
|
Change in unrealized holding gains (losses), convertible securities, carried at fair value as a part of Other investments
|
1,876
|
|
—
|
|
|||
|
Other
|
—
|
|
925
|
|
|||
|
Net realized investment gains (losses)
|
$
|
14,650
|
|
$
|
67,904
|
|
|
During 2014, we recognized credit-related impairments of
$1.4 million
related to two corporate debt instruments. Additionally, we recognized a non-credit impairment related to one of the instruments of
$0.3 million
as the instrument's fair value was less than the expected future cash flows from the security. All impairments of debt securities recognized during 2013 were credit-related.
In both 2014 and 2013, sales of securities in our trading portfolio generated realized gains which reduced trading security unrealized holding gains (losses). On the whole, market valuations improved in both 2014 and 2013. In 2013, the improvement more than offset the effect of sales during the period, but only partially offset the effect of sales during 2014.
Operating Expenses
Operating expenses were
$8.8 million
for the
year ended
December 31, 2014
, and
$15.7 million
for the
year ended
December 31, 2013
. Corporate expenses in
2014
reflected cost reductions of approximately
$3.1 million
that were attributable to discrete events of one period or the other, including in
2013
costs associated with business combinations or expansions, and in
2014
, recoveries associated with the settlement of litigation and a reserve established related to discontinued operations of an acquired entity. Otherwise, Corporate segment expenses were approximately
$3.9 million
lower in
2014
than in
2013
.
Interest Expense
Interest expense increased during
2014
as compared to
2013
primarily due to the issuance of unsecured senior notes in the fourth quarter of 2013 which carry a higher interest rate and are greater in amount than our average borrowing outstanding in
2013
. Our weighted average outstanding debt approximated
$250 million
for the
year ended
December 31, 2014
as compared to
$119 million
for the
year ended
December 31, 2013
.
Interest expense for
2014
and
2013
is provided in the following table:
|
Year Ended December 31
|
|||||||||||
|
(In thousands)
|
2014
|
2013
|
Change
|
||||||||
|
Senior notes due 2023
|
$
|
13,433
|
|
$
|
1,502
|
|
$
|
11,931
|
|
||
|
Revolving credit agreement (including fees and amortization)
|
507
|
|
1,245
|
|
(738
|
)
|
|||||
|
Other
|
144
|
|
8
|
|
136
|
|
|||||
|
$
|
14,084
|
|
$
|
2,755
|
|
$
|
11,329
|
|
|||
76
Taxes
We calculate our effective tax rate on a consolidated basis, dividing consolidated tax expense by consolidated pre-tax income. Factors affecting our effective tax rate include the following:
|
Year Ended December 31
|
|||||
|
|
2014
|
2013
|
|||
|
Statutory rate
|
35.0
|
%
|
35.0
|
%
|
|
|
Tax-exempt income
|
(5.0
|
%)
|
(3.7
|
%)
|
|
|
Tax credits
|
(6.8
|
%)
|
(4.5
|
%)
|
|
|
Non-taxable gain on acquisition
|
—%
|
|
(2.8
|
%)
|
|
|
Non-U.S. loss
|
0.7
|
%
|
—
|
%
|
|
|
Other
|
1.1
|
%
|
1.1
|
%
|
|
|
Effective tax rate
|
25.0
|
%
|
25.1
|
%
|
|
Our effective tax rates for both
2014
and
2013
were different from the statutory Federal income tax rate primarily due to the following:
|
•
|
a portion of our investment income was tax-exempt
|
|
•
|
we utilized tax credits transferred to us from our tax credit partnership investments
|
|
•
|
we did not recognize a tax benefit related to the operating loss associated with our participation in Lloyd's Syndicate 1729, a U.K. tax entity
|
|
•
|
the gain on acquisition recognized in 2013 was not taxable
|
The increased effect of tax-exempt income and the tax-credits was primarily because the total amount of pre-tax income declined in 2014 as compared to 2013. Tax credits approximated
$17.9 million
for both the
year ended
December 31, 2014
and the
year ended
December 31, 2013
77
Results of Operations–Year Ended December 31, 2013 Compared to Year Ended December 31, 2012
Selected consolidated financial data for each period is summarized in the table below.
|
Year Ended December 31
|
|||||||||||
|
($ in thousands, except per share data)
|
2013
|
2012
|
Change
|
||||||||
|
Revenues:
|
|||||||||||
|
Net premiums earned
|
$
|
527,919
|
|
$
|
550,664
|
|
$
|
(22,745
|
)
|
||
|
Net investment income
|
129,265
|
|
136,094
|
|
(6,829
|
)
|
|||||
|
Equity in earnings (loss) of unconsolidated subsidiaries
|
7,539
|
|
(6,873
|
)
|
14,412
|
|
|||||
|
Net investment result
|
136,804
|
|
129,221
|
|
7,583
|
|
|||||
|
Net realized investment gains (losses)
|
67,904
|
|
28,863
|
|
39,041
|
|
|||||
|
Other income
|
7,551
|
|
7,106
|
|
445
|
|
|||||
|
Total revenues
|
740,178
|
|
715,854
|
|
24,324
|
|
|||||
|
Expenses:
|
|||||||||||
|
Losses and loss adjustment expenses
|
243,015
|
|
161,726
|
|
81,289
|
|
|||||
|
Reinsurance recoveries
|
(18,254
|
)
|
18,187
|
|
(36,441
|
)
|
|||||
|
Net losses and loss adjustment expenses
|
224,761
|
|
179,913
|
|
44,848
|
|
|||||
|
Underwriting, policy acquisition and operating expenses
|
147,817
|
|
135,631
|
|
12,186
|
|
|||||
|
Interest expense
|
2,755
|
|
2,181
|
|
574
|
|
|||||
|
Loss on extinguishment of debt
|
—
|
|
2,163
|
|
(2,163
|
)
|
|||||
|
Total expenses
|
375,333
|
|
319,888
|
|
55,445
|
|
|||||
|
Gain on acquisition
|
32,314
|
|
—
|
|
32,314
|
|
|||||
|
Income before income taxes
|
397,159
|
|
395,966
|
|
1,193
|
|
|||||
|
Income taxes
|
99,636
|
|
120,496
|
|
(20,860
|
)
|
|||||
|
Net income
|
$
|
297,523
|
|
$
|
275,470
|
|
$
|
22,053
|
|
||
|
Earnings per share:
|
|||||||||||
|
Basic
|
$
|
4.82
|
|
$
|
4.49
|
|
$
|
0.33
|
|
||
|
Diluted
|
$
|
4.80
|
|
$
|
4.46
|
|
$
|
0.34
|
|
||
|
Net loss ratio
|
42.6
|
%
|
32.7
|
%
|
9.9
|
|
|||||
|
Underwriting expense ratio
|
28.0
|
%
|
24.6
|
%
|
3.4
|
|
|||||
|
Combined ratio
|
70.6
|
%
|
57.3
|
%
|
13.3
|
|
|||||
|
Operating ratio
|
46.1
|
%
|
32.6
|
%
|
13.5
|
|
|||||
|
Effective tax rate
|
25.1
|
%
|
30.4
|
%
|
(5.3
|
)
|
|||||
|
Return on equity*
|
11.4
|
%
|
12.4
|
%
|
(1.0
|
)
|
|||||
|
* Gain on acquisition is excluded from the calculation of return on equity.
|
|||||||||||
In all tables that follow, the abbreviation “nm” indicates that the percentage change is not meaningful.
78
Revenues
Net premiums earned decreased during 2013 by approximately $22.7 million or 4.1%. Our acquisitions of Medmarc and IND contributed $38.1 million of additional net premiums earned during 2013. In addition, reductions to ceded premium attributable to the favorable emergence of losses ceded to our reinsurers under the variable components of our reinsurance arrangements were approximately $17.9 million lower for 2013. Excluding acquired entities, losses of premium attributable to non-renewals were greater than premium gains from new business in 2013 and there was a reduced amount of premium from tail policies.
Our net investment result (which includes both net investment income and earnings from unconsolidated subsidiaries) increased $7.6 million or 5.9%. Net investment income decreased during 2013, primarily due to reduced earnings on our fixed income portfolio, partially offset by increased earnings from our equities portfolio and distributions received from a cost method investment LP in 2013. Earnings from unconsolidated subsidiaries increased $14.4 million in 2013. Earnings from unconsolidated subsidiaries principally reflects earnings recognized as a result of a change of an LP from the cost method to the equity method in the fourth quarter of 2013 as well as higher earnings from a private equity LP, slightly offset by higher tax credit partnership amortization.
Net realized investment gains in 2013 were approximately $39.0 million higher than in 2012. The improvement was principally attributable to an increase in our average equity trading portfolio investment and improved stock market yields. Impairments were nominal for 2013 and were $1.8 million for 2012.
Expenses
The calendar year net loss ratio for 2013 was 42.6%, a 9.9 percentage point increase as compared to 2012. The increase was principally attributable to lower favorable loss development in 2013 as compared to 2012 by $49.3 million. Our current accident year net loss ratio increased by 2.7 percentage points for 2013 primarily due to a reduced effect from prior accident year ceded premiums.
Our underwriting expense ratio increased 3.4 percentage points for 2013. The expense ratio is impacted by a number of factors that potentially distort a run rate expense ratio. In particular, start-up expenses associated with Syndicate 1729 and transaction expenses associated with our acquisitions increased our ratio in 2013. Also, ceded premiums related to prior accident years decreased our ratio in both 2013 and 2012, but had a greater effect on the 2012 ratio.
Operating Ratio and Return on Equity
Our operating ratio (calculated as our combined ratio, less our investment income ratio) increased by 13.5 percentage points in 2013. The increase primarily reflected both a higher net loss ratio and a higher underwriting expense ratio.
Return on equity was 11.4% in 2013, and 12.4% in 2012. Our calculation of return on equity for 2013 excluded the effect of the $32.3 million gain on acquisition.
Book Value per Share
Our book value per share at December 31, 2013 as compared to December 31, 2012 is shown in the following table. The past growth rates of our book value per share do not necessarily predict similar future results.
|
Book Value Per Share
|
|||
|
Book Value Per Share at December 31, 2012
|
$
|
36.85
|
|
|
Increase (decrease) to book value per share during the year ended December 31, 2013 attributable to:
|
|||
|
Net income
|
4.82
|
|
|
|
Decline in accumulated other comprehensive income
|
(1.40
|
)
|
|
|
Dividends declared
|
(1.05
|
)
|
|
|
Other
|
(0.09
|
)
|
|
|
Book Value Per Share at December 31, 2013
|
$
|
39.13
|
|
79
Non-GAAP Financial Measures
Operating income is a non-GAAP financial measure that is widely used to evaluate performance within the insurance sector. In calculating operating income, we have excluded the after-tax effects of net realized investment gains or losses, guaranty fund assessments or recoupments, loss on extinguishment of debt, gain on acquisition and the effect of confidential settlements that do not reflect normal operating results. We believe operating income presents a useful view of the performance of our insurance operations, but should be considered in conjunction with net income computed in accordance with GAAP.
The following table is a reconciliation of Net income to Operating income:
|
Year Ended December 31
|
|||||||
|
(In thousands, except per share data)
|
2013
|
2012
|
|||||
|
Net income
|
$
|
297,523
|
|
$
|
275,470
|
|
|
|
Items excluded in the calculation of operating income:
|
|||||||
|
(Gain) loss on extinguishment of debt
|
—
|
|
2,163
|
|
|||
|
Net realized investment (gains) losses
|
(67,904
|
)
|
(28,863
|
)
|
|||
|
Guaranty fund assessments (recoupments)
|
40
|
|
345
|
|
|||
|
Gain on acquisition
|
(32,314
|
)
|
—
|
|
|||
|
Effect of confidential settlements, net
|
—
|
|
(1,694
|
)
|
|||
|
Pre-tax effect of exclusions
|
(100,178
|
)
|
(28,049
|
)
|
|||
|
Tax effect, at 35%, exclusive of non-taxable gain on acquisition
|
23,752
|
|
9,817
|
|
|||
|
Operating income
|
$
|
221,097
|
|
$
|
257,238
|
|
|
|
Per diluted common share:
|
|||||||
|
Net income
|
$
|
4.80
|
|
$
|
4.46
|
|
|
|
Effect of exclusions
|
(1.24
|
)
|
(0.30
|
)
|
|||
|
Operating income per diluted common share
|
$
|
3.56
|
|
$
|
4.16
|
|
|
Note: The 35% rate above is the annual expected incremental tax rate associated with the taxable or tax deductible items listed.
80
Segment Operating Results - Specialty Property & Casualty
Our Specialty P&C segment focuses on professional liability insurance and medical technology and life sciences products liability insurance as discussed in Note 13 of the Notes to Condensed Consolidated Financial Statements. Specialty P&C segment operating results reflect pre-tax underwriting profit or loss from these insurance lines, exclusive of investment results, which are included in our Corporate segment. Segment operating results for the years ended December 31, 2013 were
$176.7 million
, as compared to
$250.8 million
for 2012, and included the following:
|
Year Ended December 31
|
||||||||||||||
|
($ in thousands)
|
2013
|
2012
|
Change
|
|||||||||||
|
Net premiums written
|
$
|
525,182
|
|
$
|
528,298
|
|
$
|
(3,116
|
)
|
(0.6
|
%)
|
|||
|
Net premiums earned
|
$
|
527,919
|
|
$
|
550,664
|
|
$
|
(22,745
|
)
|
(4.1
|
%)
|
|||
|
Net losses and loss adjustment expenses
|
$
|
224,761
|
|
$
|
179,913
|
|
$
|
44,848
|
|
24.9
|
%
|
|||
|
Underwriting, policy acquisition and operating expenses
|
$
|
132,076
|
|
$
|
125,292
|
|
$
|
6,784
|
|
5.4
|
%
|
|||
|
Net loss ratio
|
42.6
|
%
|
32.7
|
%
|
9.9
|
|
||||||||
|
Underwriting expense ratio
|
25.0
|
%
|
22.8
|
%
|
2.2
|
|
||||||||
Premiums Written
Changes in our premium volume are driven by four primary factors: (1) the amount of new business generated both as a result of acquisitions and through our existing books of business, (2) our retention of existing business, (3) the premium charged for business that is renewed, which is affected by rates charged and by the amount and type of coverage an insured chooses to purchase, and (4) the timing of premium written through multi-period policies. In addition, premium volume may periodically be affected by shifts in the timing of renewals between periods. The healthcare professional liability market remains competitive as physicians continue joining hospitals or larger group practices and thus are no longer purchasing insurance in the standard market. In addition, some competitors have chosen to compete primarily on price; both factors impact our ability to write new business and retain existing business.
Gross, ceded and net premiums written were as follows:
|
Year Ended December 31
|
||||||||||||||
|
($ in thousands)
|
2013
|
2012
|
Change
|
|||||||||||
|
Gross premiums written
|
$
|
567,547
|
|
$
|
536,431
|
|
$
|
31,116
|
|
5.8
|
%
|
|||
|
Ceded premiums written
|
(42,365
|
)
|
(8,133
|
)
|
(34,232
|
)
|
>100%
|
|
||||||
|
Net premiums written
|
$
|
525,182
|
|
$
|
528,298
|
|
$
|
(3,116
|
)
|
(0.6
|
%)
|
|||
81
Gross Premiums Written
Gross premiums written by component were as follows:
|
Year Ended December 31
|
||||||||||||||
|
($ in thousands)
|
2013
|
2012
|
Change
|
|||||||||||
|
Professional liability
|
||||||||||||||
|
Physicians:
|
||||||||||||||
|
Twelve month term
|
$
|
388,583
|
|
$
|
403,429
|
|
$
|
(14,846
|
)
|
(3.7
|
%)
|
|||
|
Twenty-four month term
|
25,584
|
|
13,081
|
|
12,503
|
|
95.6
|
%
|
||||||
|
Total Physicians
|
414,167
|
|
416,510
|
|
(2,343
|
)
|
(0.6
|
%)
|
||||||
|
Other healthcare providers
|
43,125
|
|
43,492
|
|
(367
|
)
|
(0.8
|
%)
|
||||||
|
Healthcare facilities
|
26,202
|
|
28,259
|
|
(2,057
|
)
|
(7.3
|
%)
|
||||||
|
Legal professionals
|
27,060
|
|
17,146
|
|
9,914
|
|
57.8
|
%
|
||||||
|
Tail coverages
|
20,920
|
|
29,394
|
|
(8,474
|
)
|
(28.8
|
%)
|
||||||
|
Total professional liability
|
531,474
|
|
534,801
|
|
(3,327
|
)
|
(0.6
|
%)
|
||||||
|
Medical technology and life sciences products liability
|
34,190
|
|
—
|
|
34,190
|
|
nm
|
|
||||||
|
Other
|
1,883
|
|
1,630
|
|
253
|
|
15.5
|
%
|
||||||
|
Total
|
$
|
567,547
|
|
$
|
536,431
|
|
$
|
31,116
|
|
5.8
|
%
|
|||
The above table includes gross written premium for 2013 that was attributable to IND and Medmarc, as shown in the following table. Neither acquisition contributed premium in 2012.
|
Year Ended December 31
|
|||
|
($ in thousands)
|
2013
|
||
|
Gross premiums written:
|
|||
|
Professional liability
|
|||
|
Physicians, twelve month term
|
$
|
10,474
|
|
|
Other healthcare providers
|
280
|
|
|
|
Legal professionals
|
9,418
|
|
|
|
Total professional liability
|
20,172
|
|
|
|
Medical technology and life sciences products liability
|
34,190
|
|
|
|
Total
|
$
|
54,362
|
|
Our retention rate for our standard physician business was approximately 89% for 2013, as compared to 90% for 2012. We calculate our retention rate as retained premium divided by all premium subject to renewal. Retention rates are affected by a number of factors. We may lose insureds to competitors or to alternative insurance mechanisms such as risk retention groups or self-insurance entities (often when physicians join hospitals or large group practices) or due to pricing or other issues. We may choose not to renew an insured as a result of our underwriting evaluation. Insureds may also terminate coverage because they have left the practice of medicine for various reasons, principally for retirement but also for personal reasons or due to disability or death.
The pricing of our renewed physician business remained relatively flat with expiring premiums during 2013. The pricing of our business includes the effects of filed rates, surcharges and discounts. We continue to base our pricing on expected losses, as indicated by our historical loss data and available industry loss data. We are committed to a rate structure that will allow us to fulfill our obligations to our insureds, while generating competitive returns for our shareholders.
Physician policies were our greatest source of premium revenues in both 2013 and 2012. In addition to the effects of retention and renewal pricing discussed above, our 2013 twelve month term physician premium volume reflected the following:
|
•
|
The acquisition of IND contributed approximately $10.5 million of physician premium to 2013.
|
|
•
|
In addition to premium contributed by IND, we wrote new physician business of approximately $18 million in 2013.
|
82
We offer twenty-four month term policies to our physician insureds in one selected jurisdiction. The premium associated with both years is included in written premium in the period the policy is written; comparison of gross written premium between successive years reflects volume differences that have no effect on earned premium. Thus, twenty-four month term policies subject to renewal in 2013 were previously written in 2011 rather than in 2012, as is the case for our twelve-month term policies. There was no significant volume change associated with twenty-four month policies during 2013.
Our other healthcare providers are primarily dentists, chiropractors and allied health professionals. The decline in premium volume for these coverages during 2013 was primarily attributable to the 2012 discontinuation of a program that offered coverage to optometrists.
Our healthcare facilities premium (which includes hospitals, surgery centers and other facilities) declined in 2013, principally due to retention losses. The competitive pressures that affect our physician business also affect our facilities business.
The increase in legal professionals premium for 2013 is principally attributable to our acquisition of Medmarc. Our legal professionals policies are offered throughout the United States, principally through agent and brokerage arrangements.
We offer extended reporting endorsement or “tail” coverage to insureds who discontinue their claims-made coverage with us, and we also periodically offer “tail” coverage through custom policies. The amount of tail coverage premium written can vary widely from period to period. The decrease in tail premium for 2013 was principally due to a large single custom policy issued in the first quarter of 2012 for which there was no counterpart in 2013.
All medical technology and life sciences products liability premium is attributable to our acquisition of Medmarc. Our medical technology and life sciences products liability (products liability) business is marketed throughout the United States; coverage is offered on a primary basis, within specified limits, to manufacturers and distributors of medical technology and life sciences products.
Ceded Premiums Written
Ceded premiums written compare as follows:
|
Year Ended December 31
|
||||||||||||||
|
($ in thousands)
|
2013
|
2012
|
Change
|
|||||||||||
|
Primary reinsurance arrangements (1)
|
$
|
16,177
|
|
$
|
21,997
|
|
$
|
(5,820
|
)
|
(26.5
|
%)
|
|||
|
Secondary reinsurance arrangements (2)
|
17,279
|
|
9,116
|
|
8,163
|
|
89.5
|
%
|
||||||
|
Reduction in premiums owed under reinsurance agreements, prior accident years, net (3)
|
(16,403
|
)
|
(34,328
|
)
|
17,925
|
|
52.2
|
%
|
||||||
|
Premiums ceded associated with acquired entities
|
14,308
|
|
—
|
|
14,308
|
|
nm
|
|
||||||
|
Other ceded premiums written
|
11,004
|
|
11,348
|
|
(344
|
)
|
(3.0
|
%)
|
||||||
|
Total ceded premiums written
|
$
|
42,365
|
|
$
|
8,133
|
|
$
|
34,232
|
|
>100%
|
|
|||
Ceded premiums represent the amounts owed to our reinsurers for their assumption of a portion of our losses. In general we retain the first $1 million in risk insured by us and cede any coverages in excess of this amount. We pay our reinsurers a ceding premium in exchange for their accepting the risk, the ultimate amount of which is determined by the loss experience of the business ceded, subject to certain minimum and maximum amounts.
Ceded premiums for 2013 and 2012 compare as follows:
|
(1)
|
As discussed previously, the premium that we cede under our reinsurance arrangements is determined, in part, by the losses ceded under these arrangements. Ceded premiums decreased due to lower premiums in 2013, and beginning with the second quarter of 2012, we projected (estimated) lower losses for our ceded coverages and reduced our estimate of the associated ceded premium for the current accident year. The year ended December 31, 2013 reflected those lower projections for the full period in 2013 as compared to two quarters in 2012.
|
|
(2)
|
We have secondary arrangements with certain large healthcare groups that include quota share, fronting and other risk sharing arrangements. Growth in these arrangements increased ceded premium in 2013 as compared to 2012. These arrangements are primarily comprised of the following:
|
|
•
|
We share risk of loss for policies written or renewed under the Ascension Health (Ascension) Certitude program with an Ascension affiliate under a quota share arrangement.
|
83
|
•
|
We have entered into fronting arrangements with certain large healthcare groups. Under the arrangements we provide specified underwriting, claims and risk management services but cede a large portion of the risk of the coverages provided back to the group or affiliates of the group. Volume under such arrangements can vary between periods.
|
|
•
|
During 2013, we entered into quota share arrangements under which we share the risk of loss with captive insurers affiliated with one of our agents.
|
|
(3)
|
Given the length of time that it takes to resolve our claims, many years may elapse before all losses recoverable under a reinsurance agreement are known. As a part of the process of estimating our loss reserves we also make estimates regarding the amounts recoverable under our reinsurance agreements. As previously discussed, the amounts ultimately owed under our reinsurance agreements are subject to the losses ceded under the agreements. In both 2013 and 2012, on a net basis, we reduced our estimate of expected losses and associated recoveries for prior year ceded losses, as well as our estimate of ceded premiums owed to reinsurers. The reductions were substantially less in 2013 than in 2012. The net reduction for 2013 includes an offsetting increase of $1.6 million that was attributable to loss reserves acquired in business combinations. In 2012 we also revised the expected amount receivable under certain older reinsurance agreements for which there were limited remaining open items. Changes to estimates of premiums ceded related to prior accident years are fully earned in the period the change in estimates occur.
|
Ceded Premiums Ratio
As shown in the table below, our ceded premium ratio was significantly affected in both 2013 and 2012 by revisions to our estimate of premiums owed to reinsurers related to coverages provided in prior accident years.
|
Year Ended December 31
|
|||||||
|
|
2013
|
2012
|
Change
|
||||
|
Ceded premiums ratio, as reported
|
7.5
|
%
|
1.5
|
%
|
6.0
|
||
|
Less the effect of reduction in premiums owed under reinsurance agreements, prior accident years (as previously discussed)*
|
(2.9
|
%)
|
(6.4
|
%)
|
3.5
|
||
|
Ratio, current accident year
|
10.4
|
%
|
7.9
|
%
|
2.5
|
||
* Effect shown for 2013 is net of an increase to the ratio of approximately 0.3 percentage points attributable to business combinations.
The increase in the ceded premium ratio, current accident year, for 2013 as compared to 2012 is attributable to the following:
|
|
Increase (decrease) 2013 versus 2012
|
|
|
Effect on ceded premium ratio, current accident year:
|
||
|
Secondary reinsurance arrangements, increased volume
|
1.3
|
|
|
Acquisitions
|
1.6
|
|
|
Other
|
(0.4
|
)
|
|
Net increase in ratio
|
2.5
|
|
Net Premiums Earned
Net premiums earned were as follows:
|
Year Ended December 31
|
||||||||||||||
|
($ in thousands)
|
2013
|
2012
|
Change
|
|||||||||||
|
Gross premiums earned
|
$
|
569,433
|
|
$
|
558,316
|
|
$
|
11,117
|
|
2.0
|
%
|
|||
|
Premiums ceded
|
(41,514
|
)
|
(7,652
|
)
|
(33,862
|
)
|
>100%
|
|
||||||
|
Net premiums earned
|
$
|
527,919
|
|
$
|
550,664
|
|
$
|
(22,745
|
)
|
(4.1
|
%)
|
|||
Net premiums earned consist of gross premiums earned less the portion of earned premiums that we cede to our reinsurers for their assumption of a portion of our losses. Because premiums are generally earned pro rata over the entire policy period, fluctuations in premiums earned tend to lag those of premiums written. Generally, our policies carry a term of one year, but as discussed above, we renew certain policies with a twenty-four month term, and certain of our medical technology and life sciences products liability policies carry a multi-year term. Tail coverage premiums are generally 100% earned in the period
84
written because the policies insure only incidents that occurred in prior periods and are not cancellable. Additionally, ceded premium changes due to changes to estimates of premiums owed under reinsurance agreements are fully earned in the period of change.
Gross premiums earned in 2013 reflected additional premiums contributed by acquisitions of approximately $53.9 million offset by the pro rata effect of lower physician premiums written by our other subsidiaries during the preceding twelve months, and a decline in tail premium of $8.9 million. Our 2013 gross premiums earned includes approximately $25.1 million in gross premiums earned associated with Medmarc and IND policies written prior to our acquisition of these operations. We expect Medmarc and IND policies written pre-acquisition to contribute gross premiums earned of approximately $3.0 million in 2014 and beyond.
The increase in premiums ceded during 2013 reflected ceded premium reductions related to prior accident years, exclusive of acquisitions, that were $16.3 million lower in 2013 than in 2012, as previously discussed, and contributions from our acquisitions of approximately $15.8 million.
Losses and Loss Adjustment Expenses
The determination of calendar year losses involves the actuarial evaluation of incurred losses for the current accident year and the actuarial re-evaluation of incurred losses for prior accident years, including an evaluation of the reserve amounts required for losses in excess of policy limits.
Accident year refers to the accounting period in which the insured event becomes a liability of the insurer. For claims-made policies, which represent over 90% of the Company’s business, the insured event generally becomes a liability when the event is first reported to the insurer. For occurrence policies the insured event becomes a liability when the event takes place. We believe that measuring losses on an accident year basis is the best measure of the underlying profitability of the premiums earned in that period, since it associates policy premiums earned with the estimate of the losses incurred related to those policy premiums.
The following table summarizes calendar year net loss ratios by separating losses between the current accident year and all prior accident years. Additionally, the table shows our current accident year net loss ratio was significantly affected by revisions to our estimate of premiums owed to reinsurers related to coverages provided in prior accident years. Our current accident year net loss ratios for December 31, 2013 and 2012 compare as follows:
|
Net Loss Ratios (1)
|
|||||||
|
Year Ended December 31
|
|||||||
|
2013
|
2012
|
Change
|
|||||
|
Calendar year net loss ratio
|
42.6
|
%
|
32.7
|
%
|
9.9
|
||
|
Less prior accident year net loss ratio
|
(42.2
|
%)
|
(49.4
|
%)
|
7.2
|
||
|
Current accident year net loss ratio
|
84.8
|
%
|
82.1
|
%
|
2.7
|
||
|
Less estimated ratio increase (decrease) attributable to:
|
|||||||
|
Ceded premium reductions, prior accident years, net (2)
|
(2.7
|
%)
|
(5.4
|
%)
|
2.7
|
||
|
Current accident year net loss ratio, less ceded premium effect above (3)
|
87.5
|
%
|
87.5
|
%
|
—
|
||
|
(1)
|
Net losses as specified divided by net premiums earned.
|
|
(2)
|
Reductions to premiums owed under reinsurance agreements for prior accident years increased net earned premiums (the denominator of the current accident year ratio) in both 2013 and 2012. The net increase to the ratio in 2013 reflects an offset of 0.3 percentage points that is attributable to loss reserves acquired in business combinations. See the discussion under the heading “Ceded Premiums Written” for additional information.
|
|
(3)
|
In addition to the effect of ceded premiums associated with prior accident years, the loss ratio for the current period reflects an increase due to higher unallocated loss adjustment expenses in 2013, the effect of which was offset by decreases to the ratio attributable to a lower amount of tail premium in 2013, a greater benefit from current accident year reinsurance in 2013, and lower average loss ratios for the business acquired from Medmarc and IND. The amount of tail premium affects the average ratio because we generally expect higher losses from tail coverages.
|
We recognized favorable loss development related to previously established reserves, on a gross basis, of $248.5 million in 2013 and $321.5 million in 2012. On a net basis, we recognized favorable development of $222.7 million in 2013 and $272.0 million in 2012. The net basis reflects the favorable development recognized with respect to our ceded coverage layers.
85
A detailed discussion of factors influencing our recognition of loss development recognized is included in the Critical Accounting Estimates section of Item 7, under the caption "Reserve for Losses and Loss Adjustment Expenses." Information provided includes the amount of development recognized by accident year and the factors considered and judgments made to determine the amount of development recognized.
Assumptions used in establishing our reserve are regularly reviewed and updated by management as new data becomes available. Any adjustments necessary are reflected in the current operations. Due to the size of our reserve, even a small percentage adjustment to the assumptions can have a material effect on our results of operations for the period in which the change is made, as was the case in both 2013 and 2012.
Underwriting, Policy Acquisition and Operating Expenses
The table below provides a comparison of 2013 and 2012 underwriting, policy acquisition and operating expenses:
|
Year Ended December 31
|
||||||||||||||
|
($ in thousands)
|
2013
|
2012
|
Change
|
|||||||||||
|
Underwriting, policy acquisition and operating expenses
|
$
|
132,076
|
|
$
|
125,292
|
|
$
|
6,784
|
|
5.4
|
%
|
|||
The following table highlights the items affecting expenses for the years ended December 31, 2013 and 2012.
|
(In millions)
|
Expense Increase (Decrease)
2013 versus 2012 |
||
|
Expenses of operations from acquired entities *
|
$
|
12.8
|
|
|
Higher compensation costs during 2013, principally attributable to incentive compensation
|
3.1
|
|
|
|
Increase in compensation costs allocated to ULAE or capitalized as deferred policy acquisition costs during 2013
|
(9.1
|
)
|
|
|
Amortization of deferred policy acquisition costs reflects a reduction in 2013 attributable to lower premium volume and a reduction attributable to the adoption of new accounting guidance at the beginning of 2012. The effect of lower premium volume was somewhat offset in 2013 by underwriting compensation costs which were higher in 2013 than in 2012.
|
(2.6
|
)
|
|
|
Other variances not individually significant
|
(0.7
|
)
|
|
|
Expenses associated with discrete events:
|
|||
|
Medmarc and IND transaction-related costs, principally professional fees and one time compensation costs
|
4.0
|
|
|
|
Compensation costs associated with employee relocation and severance, principally related to the enhancement of our customer service capabilities in 2012
|
(0.7
|
)
|
|
|
Net change in expenses
|
$
|
6.8
|
|
|
*
|
The impact of purchase accounting related to deferred policy acquisition costs reduced the reported expenses by approximately $4.4 million in 2013.
|
86
Underwriting Expense Ratio (the Expense Ratio)
Our expense ratio was affected in both 2013 and 2012 by ceded premium reductions related to prior accident years, as discussed under the heading "Ceded Premiums Written", and by expenses associated with business expansion and discrete events (see table above):
|
|
Underwriting Expense Ratio
|
||||||
|
|
Year Ended December 31
|
||||||
|
|
2013
|
2012
|
Change
|
||||
|
Underwriting expense ratio, as reported
|
25.0
|
%
|
22.8
|
%
|
2.2
|
||
|
Less estimated ratio increase (decrease) attributable to:
|
|||||||
|
Net ceded premium reductions, prior accident years*
|
(0.8
|
%)
|
(1.5
|
%)
|
0.7
|
||
|
Expenses associated with other discrete events (see table above)
|
0.8
|
%
|
0.2
|
%
|
0.6
|
||
|
Underwriting expense ratio, less listed effects
|
25.0
|
%
|
24.1
|
%
|
0.9
|
||
*Effect shown for 2013 is net of an increase to the ratio of approximately 0.1 percentage
points attributable to business combinations.
As compared to 2012, our 2013 underwriting expense ratio was also affected by the following:
|
|
Increase (decrease), 2013 versus 2012
|
|
|
Estimated ratio increase (decrease) attributable to:
|
||
|
Lower net earned premiums, exclusive of acquisitions
|
1.5
|
|
|
Acquisitions, see discussion below
|
0.7
|
|
|
Increased compensation costs
|
0.6
|
|
|
Increase in costs allocated to ULAE or capitalized as deferred policy acquisition costs
|
(1.7
|
)
|
|
Other
|
(0.2
|
)
|
|
Net increase/(decrease) in ratio
|
0.9
|
|
The operating expenses of Medmarc and IND, exclusive of transaction costs, had a minor effect on our 2013 ratio as these entities also increased net premium earned. However, as previously discussed, recorded deferred policy acquisition cost amortization for these entities was lower in 2013 than would be considered normal due to the application of GAAP purchase accounting rules. Normalizing these costs increases our 2013 ratio by approximately 0.8 percentage points.
87
Segment Operating Results - Corporate
Segment operating results for our Corporate segment for the year ended December 31, 2013 were
$120.8 million
and were
$24.7 million
for 2012. Results included the following:
|
Year Ended December 31
|
||||||||||||||
|
($ in thousands)
|
2013
|
2012
|
Change
|
|||||||||||
|
Net investment income
|
$
|
129,265
|
|
$
|
136,094
|
|
$
|
(6,829
|
)
|
(5.0
|
%)
|
|||
|
Equity in earnings (loss) of unconsolidated subsidiaries
|
$
|
7,539
|
|
$
|
(6,873
|
)
|
$
|
14,412
|
|
>100%
|
|
|||
|
Total net realized investment gains (losses)
|
$
|
67,904
|
|
$
|
28,863
|
|
$
|
39,041
|
|
>100%
|
|
|||
|
Operating expense
|
$
|
15,748
|
|
$
|
10,389
|
|
$
|
5,359
|
|
51.6
|
%
|
|||
|
Interest expense
|
$
|
2,755
|
|
$
|
2,181
|
|
$
|
574
|
|
26.3
|
%
|
|||
|
Income taxes
|
$
|
99,636
|
|
$
|
120,496
|
|
$
|
(20,860
|
)
|
(17.3
|
%)
|
|||
|
Gain on acquisition
|
$
|
32,314
|
|
$
|
—
|
|
$
|
32,314
|
|
nm
|
|
|||
Net Investment Income, Equity in Earnings (Loss) of Unconsolidated Subsidiaries, Net Realized Investment Gains (Losses)
Net Investment Income
Net investment income is primarily derived from the income earned by our fixed maturity securities and also includes income from our short-term and cash equivalent investments, dividend income from equity securities, earnings from other investments and increases in the cash surrender value of business owned life insurance contracts. Investment fees and expenses are deducted from investment income.
Net investment income by investment category was as follows:
|
Year Ended December 31
|
||||||||||||||
|
($ in thousands)
|
2013
|
2012
|
Change
|
|||||||||||
|
Fixed maturities
|
$
|
122,065
|
|
$
|
133,088
|
|
$
|
(11,023
|
)
|
(8.3
|
%)
|
|||
|
Equities
|
9,454
|
|
6,947
|
|
2,507
|
|
36.1
|
%
|
||||||
|
Short-term investments and Other invested assets
|
2,584
|
|
660
|
|
1,924
|
|
>100%
|
|
||||||
|
Business owned life insurance
|
1,960
|
|
2,008
|
|
(48
|
)
|
(2.4
|
%)
|
||||||
|
Investment fees and expenses
|
(6,798
|
)
|
(6,609
|
)
|
(189
|
)
|
(2.9
|
%)
|
||||||
|
Net investment income
|
$
|
129,265
|
|
$
|
136,094
|
|
$
|
(6,829
|
)
|
(5.0
|
%)
|
|||
Fixed Maturities
The decrease in our income from fixed maturity securities was primarily due to both lower average yields and average investment balances (exclusive of acquisitions) as compared to 2012. Although we added fixed securities valued at $314 million to our portfolio in 2013 as a result of the Medmarc and IND mergers, we reduced the size of our fixed portfolio in 2013 in order to repay debt, pay dividends and invest in other asset classes. On an overall basis our average investment in fixed securities was approximately 3% lower in 2013 as compared to 2012.
Average yields for our fixed maturity portfolio were generally lower in 2013, as shown in the table below.
|
Year Ended December 31
|
|||
|
|
2013
|
2012
|
|
|
Average income yield
|
3.7%
|
3.9%
|
|
|
Average tax equivalent income yield
|
4.3%
|
4.5%
|
|
Yields on fixed maturity securities acquired in the Medmarc and IND transactions were lower than our average yield in 2012, which reduced our 2013 average consolidated tax equivalent yield by approximately 15 basis points. Yields for 2013 also reflected lower income from Treasury Inflation-Protected Securities of $1.0 million. The remaining decline in yield is primarily attributable to market conditions. Throughout 2012 and to a declining degree in 2013, in order to maintain the quality and duration of our portfolio, we have reinvested maturities, paydowns and proceeds from sales in our fixed income portfolio at yields that were lower than the average yield on our portfolio.
88
Equities
Income from our equity portfolio increased in 2013 as compared to 2012 due to average investment balances that were approximately 59% higher in 2013. Given the challenge in finding compelling returns in the fixed income portfolio as discussed above and the sensitivity of the value of the fixed income portfolio to rising interest rates, we have increased our allocation to dividend yielding equities and other non-fixed income investments.
Short-term Investments and Other Invested Assets
The increased income from our short-term investments and other invested assets in 2013 principally reflected distributions received from an interest in an LP that we account for using the cost method. No distributions were received from this investment in 2012.
Equity in Earnings (Loss) of Unconsolidated Subsidiaries
Equity in earnings (loss) of unconsolidated subsidiaries is derived from our investment interests accounted for under the equity method. Results were as follows:
|
Year Ended December 31
|
|||||||||||
|
(In thousands)
|
2013
|
2012
|
Change
|
||||||||
|
Investment LPs
|
$
|
17,673
|
|
$
|
278
|
|
$
|
17,395
|
|
||
|
Business LLC interest
|
—
|
|
(728
|
)
|
728
|
|
|||||
|
Tax credit partnerships
|
(10,134
|
)
|
(6,423
|
)
|
(3,711
|
)
|
|||||
|
Equity in earnings (loss) of unconsolidated subsidiaries
|
$
|
7,539
|
|
$
|
(6,873
|
)
|
$
|
14,412
|
|
||
We hold interests in certain LPs that generate earnings from trading portfolios, secured debt, and private equity investments. The improved results for 2013 principally reflect earnings recognized as a result of a change of an LP from the cost method to the equity method as well as higher earnings from a private equity LP. When there is a change from the cost to the equity method, GAAP requires retroactive recording of accumulated earnings since the origination of the investment. As the amounts are not material in the current period or any of the prior periods affected, prior period financial statements have not been restated. Earnings included our portion of the LP’s accumulated earnings from the date of initial investment, which totaled $10.5 million, $8.4 million of which was related to prior periods.
Our business LLC interest was a non-controlling interest in a start-up entity, which produced operating losses in 2012. We dissolved our interest in the entity during 2013.
Our tax credit investments are designed to generate returns by providing tax benefits in the form of tax credits and tax-deductible project operating losses. We account for our tax credit investments on the equity method and record amortization of our investment each period based on our allocable portion of the projected operating losses of the underlying properties. Amortization is adjusted periodically as actual operating results of the underlying properties become available. The increase in tax credit partnership amortization during 2013 reflects an overall increase in our investment in these partnerships, the increasing maturity of the underlying projects, and reductions to amortization during 2012 that were attributable to the re-estimation of inception-to-date amortization of certain partnership interests.
The tax benefits received from our tax credit partnerships, which are not reflected in our investment results above, reduced our tax expenses in 2013 and 2012 as follows:
|
Year Ended December 31
|
|||||||
|
(In thousands)
|
2013
|
2012
|
|||||
|
Tax credits recognized during the period
|
$
|
17,888
|
|
$
|
10,005
|
|
|
|
Deferred tax benefit of amortization
|
$
|
3,547
|
|
$
|
2,248
|
|
|
89
Non-GAAP Financial Measure – Tax Equivalent Investment Result
We believe that to fully understand our investment returns it is important to consider the current tax benefits associated with certain investments as the tax benefit received represents a portion of the return provided by our tax-exempt bonds, BOLI, common and preferred stocks, and tax credit partnership investments (our tax-preferred investments). We impute a pro forma tax-equivalent result by estimating the amount of fully-taxable income needed to achieve the same after-tax result as is currently provided by our tax-preferred investments. We believe this better reflects the economics behind our decision to invest in certain asset classes that are either taxed at lower rates and/or result in reductions to our current federal income tax expense. Our pro forma tax-equivalent investment result is shown in the table that follows as is a reconciliation of our tax equivalent result to our GAAP net investment result.
|
Year Ended December 31
|
|||||||
|
(In thousands)
|
2013
|
2012
|
|||||
|
GAAP net investment result:
|
|||||||
|
Net investment income
|
$
|
129,265
|
|
$
|
136,094
|
|
|
|
Equity in earnings (loss) of unconsolidated subsidiaries
|
7,539
|
|
(6,873
|
)
|
|||
|
GAAP net investment result
|
$
|
136,804
|
|
$
|
129,221
|
|
|
|
Pro forma tax-equivalent investment results
|
$
|
184,628
|
|
$
|
165,632
|
|
|
|
Reconciliation of pro forma and GAAP tax-equivalent investment results:
|
|||||||
|
Pro forma tax-equivalent investment results
|
$
|
184,628
|
|
$
|
165,632
|
|
|
|
Taxable equivalent adjustments, calculated using the 35% federal statutory tax rate:
|
|||||||
|
State and municipal bonds
|
(17,590
|
)
|
(18,482
|
)
|
|||
|
BOLI
|
(1,056
|
)
|
(1,081
|
)
|
|||
|
Dividends received
|
(1,674
|
)
|
(1,456
|
)
|
|||
|
Tax credit partnerships
|
(27,504
|
)
|
(15,392
|
)
|
|||
|
GAAP net investment result
|
$
|
136,804
|
|
$
|
129,221
|
|
|
90
Net Realized Investment Gains (Losses)
The following table provides detailed information regarding our net realized investment gains (losses).
|
Year Ended December 31
|
|||||||
|
(In thousands)
|
2013
|
2012
|
|||||
|
Other-than-temporary impairment losses, total:
|
|||||||
|
State and municipal bonds
|
$
|
(71
|
)
|
$
|
—
|
|
|
|
Residential mortgage-backed securities
|
—
|
|
(557
|
)
|
|||
|
Corporate debt
|
—
|
|
(878
|
)
|
|||
|
Other investments
|
—
|
|
(131
|
)
|
|||
|
Portion recognized in (reclassified from) Other Comprehensive Income:
|
|||||||
|
Residential mortgage-backed securities
|
—
|
|
(201
|
)
|
|||
|
Net impairment losses recognized in earnings
|
(71
|
)
|
(1,767
|
)
|
|||
|
Gross realized gains, available-for-sale securities
|
18,130
|
|
18,645
|
|
|||
|
Gross realized (losses), available-for-sale securities
|
(7,031
|
)
|
(2,076
|
)
|
|||
|
Net realized gains (losses), trading securities
|
20,444
|
|
1,485
|
|
|||
|
Change in unrealized holding gains (losses), trading securities
|
35,507
|
|
12,673
|
|
|||
|
Decrease (increase) in the fair value of liabilities carried at fair value
|
—
|
|
(1,245
|
)
|
|||
|
Other
|
925
|
|
1,148
|
|
|||
|
Net realized investment gains (losses)
|
$
|
67,904
|
|
$
|
28,863
|
|
|
All impairments of debt securities recognized during 2013 and 2012 were credit-related.
The impairment recognized as part of Other investments related to an interest in an LLC which converted to a public fund during 2012.
Realized losses on sales of available-for-sale securities in 2013 and 2012 related to securities which we carried either at no loss or a small loss, relative to the amortized cost basis of the security, at the end of the prior reporting period. Further, at the end of the prior reporting period, we had no intent to sell the securities nor did we expect to be required to sell the securities prior to recovery of their amortized cost basis. Approximately $5.3 million of the 2013 realized loss related to securities sold in the third quarter of 2013 to meet cash needs for the purchase of Eastern, terms of which were agreed upon late in the third quarter. Unrealized losses on these securities at the end of the second quarter were less than 3% of their amortized cost basis.
We substantially increased the size of our equity trading portfolio during the first quarter of 2013 and last three quarters of 2012. Unrealized trading portfolio gains in 2013 reflected both higher average balances and improved stock market valuations in 2013 as compared to 2012.
Gains (losses) from changes in the fair value of liabilities in 2012 were entirely attributable to our note payable due 2019 and related interest rate swap, both of which we repaid in July 2012.
91
Operating Expenses
Operating expenses were
$15.7 million
and
$10.4 million
for the years ended
December 31, 2013
and
2012
, respectively. Corporate expenses in
2013
reflected cost increases as compared to
2012
of approximately
$4.7 million
that were attributable to discrete events of one period or the other, including costs associated with business combinations or expansions, and in 2012, recoveries associated with the settlement of litigation. Otherwise, corporate expenses increased by approximately
$0.6 million
during 2013.
Interest Expense
Interest expense increased during 2013 as compared to 2012. The increase reflects higher average outstanding debt in 2013 but lower average rates. Our weighted average outstanding debt approximated $119 million for 2013, while our average outstanding debt approximated $29 million for 2012.
Interest expense for 2013 and 2012 is provided in the following table:
|
Year Ended December 31
|
|||||||||||
|
(In thousands)
|
2013
|
2012
|
Change
|
||||||||
|
Senior notes due 2023
|
$
|
1,502
|
|
$
|
—
|
|
$
|
1,502
|
|
||
|
Revolving credit agreement (including fees and amortization)
|
1,187
|
|
630
|
|
557
|
|
|||||
|
Letter of credit fees
|
58
|
|
—
|
|
58
|
|
|||||
|
Other debt instruments, principally long-term debt repaid in 2012
|
8
|
|
1,551
|
|
(1,543
|
)
|
|||||
|
$
|
2,755
|
|
$
|
2,181
|
|
$
|
574
|
|
|||
Taxes
Factors affecting our effective tax rate include the following:
|
Year Ended December 31
|
|||||
|
|
2013
|
2012
|
|||
|
Statutory rate
|
35.0
|
%
|
35.0
|
%
|
|
|
Tax-exempt income
|
(3.7
|
%)
|
(3.7
|
%)
|
|
|
Tax credits
|
(4.5
|
%)
|
(2.5
|
%)
|
|
|
Non-taxable gain on acquisition
|
(2.8
|
%)
|
—
|
%
|
|
|
Other
|
1.1
|
%
|
1.6
|
%
|
|
|
Effective tax rate
|
25.1
|
%
|
30.4
|
%
|
|
Our effective tax rates for both 2013 and 2012 were different from the statutory Federal income tax rate primarily because a portion of our investment income and the 2013 gain on acquisition are not taxable and because we utilized tax credit benefits transferred from our tax credit partnership investments.
Tax benefits recognized, related to the tax credits, approximated $17.9 million and $10.0 million in 2013 and 2012, respectively.
92
We believe that we are principally exposed to three types of market risk related to our investment operations. These risks are interest rate risk, credit risk and equity price risk. We have limited exposure to foreign currency risk as we issue few insurance contracts denominated in currencies other than the U.S. dollar and we have few monetary assets or obligations denominated in foreign currencies.
Interest Rate Risk
Our fixed maturities portfolio is exposed to interest rate risk. Fluctuations in interest rates have a direct impact on the market valuation of these securities. As interest rates rise, market values of fixed income portfolios fall and vice versa. Certain of the securities are held in an unrealized loss position; we do not intend to sell and believe we will not be required to sell any of the debt securities held in an unrealized loss position before its anticipated recovery.
The following table summarizes estimated changes in the fair value of our available-for-sale fixed maturity securities for specific hypothetical changes in interest rates by asset class at
December 31, 2014
and
December 31, 2013
. There are principally two factors that determine interest rates on a given security: market interest rates and credit spreads. As different asset classes can be affected in different ways by movements in those two factors, we have broken out our portfolio by asset class in the following table.
93
|
Interest Rate Shift in Basis Points
|
|||||||||||||||||||
|
December 31, 2014
|
|||||||||||||||||||
|
|
(200)
|
(100)
|
Current
|
100
|
200
|
||||||||||||||
|
Fair Value (in millions):
|
|||||||||||||||||||
|
U.S. Treasury obligations
|
$
|
176
|
|
$
|
172
|
|
$
|
167
|
|
$
|
161
|
|
$
|
156
|
|
||||
|
U.S. Government-sponsored enterprise obligations
|
41
|
|
40
|
|
40
|
|
38
|
|
37
|
|
|||||||||
|
State and municipal bonds
|
1,114
|
|
1,097
|
|
1,063
|
|
1,024
|
|
985
|
|
|||||||||
|
Corporate debt
|
1,503
|
|
1,468
|
|
1,417
|
|
1,365
|
|
1,316
|
|
|||||||||
|
Asset-backed securities
|
468
|
|
467
|
|
458
|
|
447
|
|
432
|
|
|||||||||
|
All fixed maturity securities
|
$
|
3,302
|
|
$
|
3,244
|
|
$
|
3,145
|
|
$
|
3,035
|
|
$
|
2,926
|
|
||||
|
Duration:
|
|||||||||||||||||||
|
U.S. Treasury obligations
|
3.56
|
|
3.50
|
|
3.43
|
|
3.36
|
|
3.30
|
|
|||||||||
|
U.S. Government-sponsored enterprise obligations
|
2.53
|
|
2.49
|
|
2.80
|
|
3.08
|
|
3.12
|
|
|||||||||
|
State and municipal bonds
|
3.40
|
|
3.49
|
|
3.60
|
|
3.73
|
|
3.85
|
|
|||||||||
|
Corporate debt
|
3.71
|
|
3.73
|
|
3.82
|
|
3.76
|
|
3.70
|
|
|||||||||
|
Asset-backed securities
|
1.51
|
|
1.69
|
|
2.36
|
|
3.08
|
|
3.47
|
|
|||||||||
|
All fixed maturity securities
|
3.30
|
|
3.30
|
|
3.50
|
|
3.60
|
|
3.70
|
|
|||||||||
|
|
December 31, 2013
|
||||||||||||||||||
|
Fair Value (in millions):
|
|||||||||||||||||||
|
U.S. Treasury obligations
|
$
|
176
|
|
$
|
174
|
|
$
|
171
|
|
$
|
168
|
|
$
|
165
|
|
||||
|
U.S. Government-sponsored enterprise obligations
|
34
|
|
34
|
|
33
|
|
32
|
|
30
|
|
|||||||||
|
State and municipal bonds
|
1,220
|
|
1,195
|
|
1,155
|
|
1,107
|
|
1,061
|
|
|||||||||
|
Corporate debt
|
1,453
|
|
1,413
|
|
1,361
|
|
1,308
|
|
1,257
|
|
|||||||||
|
Asset-backed securities
|
410
|
|
406
|
|
398
|
|
385
|
|
371
|
|
|||||||||
|
All fixed maturity securities
|
$
|
3,293
|
|
$
|
3,222
|
|
$
|
3,118
|
|
$
|
3,000
|
|
$
|
2,884
|
|
||||
|
Duration:
|
|||||||||||||||||||
|
U.S. Treasury obligations
|
3.85
|
|
3.81
|
|
3.77
|
|
3.72
|
|
3.68
|
|
|||||||||
|
U.S. Government-sponsored enterprise obligations
|
2.82
|
|
3.07
|
|
3.15
|
|
3.12
|
|
3.07
|
|
|||||||||
|
State and municipal bonds
|
3.61
|
|
3.84
|
|
4.07
|
|
4.20
|
|
4.25
|
|
|||||||||
|
Corporate debt
|
4.10
|
|
4.13
|
|
4.09
|
|
4.03
|
|
3.96
|
|
|||||||||
|
Asset-backed securities
|
2.08
|
|
2.55
|
|
3.12
|
|
3.57
|
|
3.80
|
|
|||||||||
|
All fixed maturity securities
|
3.60
|
|
3.80
|
|
3.90
|
|
4.00
|
|
4.00
|
|
|||||||||
Computations of prospective effects of hypothetical interest rate changes are based on numerous assumptions, including the maintenance of the existing level and composition of fixed income security assets, and should not be relied on as indicative of future results.
Certain shortcomings are inherent in the method of analysis presented in the computation of the fair value of fixed rate instruments. Actual values may differ from the projections presented should market conditions vary from assumptions used in the calculation of the fair value of individual securities, including non-parallel shifts in the term structure of interest rates and changing individual issuer credit spreads.
Our cash and short-term investment portfolio at
December 31, 2014
was carried on a cost basis which approximates its fair value. Our portfolio lacks significant interest rate sensitivity due to its short duration.
94
Credit Risk
We have exposure to credit risk primarily as a holder of fixed income securities. We control this exposure by emphasizing investment grade credit quality in the fixed income securities we purchase.
As of
December 31, 2014
,
93%
of our fixed maturity securities were rated investment grade as determined by Nationally Recognized Statistical Rating Organizations (NRSROs), such as Fitch, Moody’s and Standard & Poor’s. We believe that this concentration in investment grade securities reduces our exposure to credit risk on our fixed income investments to an acceptable level. However, investment grade securities, in spite of their rating, can rapidly deteriorate and result in significant losses. Ratings published by the NRSROs are one of the tools used to evaluate the credit worthiness of our securities. The ratings reflect the subjective opinion of the rating agencies as to the credit worthiness of the securities, and therefore, we may be subject to additional credit exposure should the rating prove to be unreliable.
We also have exposure to credit risk related to our receivables from reinsurers. Our receivables from reinsurers (with regard to both paid and unpaid losses) approximated
$244 million
at
December 31, 2014
and
$251 million
at
December 31, 2013
. We monitor the credit risk associated with our reinsurers using publicly available financial and rating agency data.
Equity Price Risk
At
December 31, 2014
the fair value of our equity investments, excluding our equity investments in bond investment funds as discussed below, was
$259 million
. These equity securities are subject to equity price risk, which is defined as the potential for loss in fair value due to a decline in equity prices. The weighted average beta of this group of securities was
0.95
. Beta measures the price sensitivity of an equity security or group of equity securities to a change in the broader equity market, in this case the S&P 500 Index. If the value of the S&P 500 Index increased by 10%, the fair value of these securities would be expected to increase by
9.5%
to
$284 million
. Conversely, a 10% decrease in the S&P 500 Index would imply a decrease of
9.5%
in the fair value of these securities to
$235 million
. The selected hypothetical changes of plus or minus 10% do not reflect what could be considered the best or worst case scenarios and are used for illustrative purposes only.
Our equity investments include equity investments in certain bond investment funds which are not significantly subject to equity price risk, and thus we have excluded these investments from the above analysis. Furthermore, these bond fund investments are primarily held by the segregated portfolio cells of our Eastern Re insurance subsidiary and changes in the fair value of these investments, when realized, primarily accrue to the preferred stockholders of the related portfolio cell.
95
|
Index to Consolidated Financial Statements
|
|
The Supplementary Financial Information required by Item 302 of Regulation S-K is included in Note 17 of the Notes to Consolidated Financial Statements of ProAssurance and its subsidiaries.
Not Applicable.
96
Disclosure Controls
Under the supervision and with the participation of management, including the Chief Executive Officer and Chief Financial Officer, the Company has evaluated the effectiveness of the design and operation of our disclosure controls and procedures as of the end of the fiscal year ended
December 31, 2014
. Based on that evaluation, the Chief Executive Officer and Chief Financial Officer have concluded that these controls and procedures are effective.
Disclosure controls and procedures are defined in Exchange Act Rule 13a-15(e) and include the Company’s controls and other procedures that are designed to ensure that information, required to be disclosed by the Company in the reports that it files or submits under the Exchange Act, is accumulated and communicated to management, including the Chief Executive Officer and Chief Financial Officer, as appropriate, to allow timely decisions regarding required disclosure.
Management’s Report on Internal Control over Financial Reporting
Our management is responsible for establishing and maintaining adequate internal control over financial reporting, as such term is defined in Exchange Act Rules 13a-15(f) and 15d-15(f). Under the supervision and with the participation of our management, including our Chief Executive Officer and Chief Financial Officer, we conducted an evaluation of the effectiveness of our internal control over financial reporting as of
December 31, 2014
based on the framework in Internal Control–Integrated Framework issued by the Committee of Sponsoring Organizations of the Treadway Commission (COSO) (1992 Framework). Based on that evaluation, our management concluded that our internal control over financial reporting was effective as of
December 31, 2014
and that there was no change in the Company’s internal controls during the fiscal year then ended that has materially affected, or is reasonably likely to materially affect, the Company’s internal control over financial reporting.
Management has compared our internal controls implemented under the COSO 1992 framework to the newly issued COSO 2013 framework and determined based on our business no material gaps exist in internal control. We plan to complete our implementation of the 2013 framework in 2015.
On January 1, 2014 we completed the acquisition of Eastern Insurance Holdings, Inc. (Eastern). Our management has excluded Eastern's systems and processes from the scope of ProAssurance's assessment of internal control over financial reporting as of December 31, 2014 in reliance on the guidance set forth in Question 3 of a "Frequently Asked Questions" interpretive release issued by the staff of the Securities and Exchange Commission's Office of the Chief Accountant and the Division of Corporation Finance in September 2004 (and revised on October 6, 2004). We have excluded Eastern from our scope because as of December 31, 2014 we have not yet completed our assessment of Eastern's systems and processes. At
December 31, 2014
Eastern represented
$538.8 million
or
10.4%
of total assets, and
$202.2 million
or
23.7%
of total revenues for the year then ended.
Ernst & Young LLP, an independent registered public accounting firm, has audited the effectiveness of our internal controls over financial reporting as of
December 31, 2014
as stated in their report which is included elsewhere herein.
None.
97
Report of Independent Registered Public Accounting Firm
The Board of Directors and Shareholders of ProAssurance Corporation
We have audited ProAssurance Corporation and subsidiaries’ internal control over financial reporting as of December 31, 2014, based on criteria established in Internal Control-Integrated Framework issued by the Committee of Sponsoring Organizations of the Treadway Commission (1992 framework) (the COSO criteria). ProAssurance Corporation and subsidiaries’ management is responsible for maintaining effective internal control over financial reporting, and for its assessment of the effectiveness of internal control over financial reporting included in the accompanying Management’s Report on Internal Control over Financial Reporting. Our responsibility is to express an opinion on the Company’s internal control over financial reporting based on our audit.
We conducted our audit in accordance with the standards of the Public Company Accounting Oversight Board (United States). Those standards require that we plan and perform the audit to obtain reasonable assurance about whether effective internal control over financial reporting was maintained in all material respects. Our audit included obtaining an understanding of internal control over financial reporting, assessing the risk that a material weakness exists, testing and evaluating the design and operating effectiveness of internal control based on the assessed risk, and performing such other procedures as we considered necessary in the circumstances. We believe that our audit provides a reasonable basis for our opinion.
A company’s internal control over financial reporting is a process designed to provide reasonable assurance regarding the reliability of financial reporting and the preparation of financial statements for external purposes in accordance with generally accepted accounting principles. A company’s internal control over financial reporting includes those policies and procedures that (1) pertain to the maintenance of records that, in reasonable detail, accurately and fairly reflect the transactions and dispositions of the assets of the company; (2) provide reasonable assurance that transactions are recorded as necessary to permit preparation of financial statements in accordance with generally accepted accounting principles, and that receipts and expenditures of the company are being made only in accordance with authorizations of management and directors of the company; and (3) provide reasonable assurance regarding prevention or timely detection of unauthorized acquisition, use, or disposition of the company’s assets that could have a material effect on the financial statements.
Because of its inherent limitations, internal control over financial reporting may not prevent or detect misstatements. Also, projections of any evaluation of effectiveness to future periods are subject to the risk that controls may become inadequate because of changes in conditions, or that the degree of compliance with the policies or procedures may deteriorate.
As indicated in the accompanying Management’s Report on Internal Control over Financial Reporting, management’s assessment of and conclusion on the effectiveness of internal control over financial reporting did not include the internal controls of Eastern Insurance Holding, Inc., now Eastern Insurance Alliance Group (Eastern), which is included in the 2014 consolidated financial statements of ProAssurance Corporation and subsidiaries and constituted
10.4%
of total assets as of December 31, 2014 and
23.7%
of total revenues for the year then ended. Our audit of internal control over financial reporting of ProAssurance Corporation and subsidiaries also did not include an evaluation of the internal control over financial reporting of Eastern.
In our opinion, ProAssurance Corporation and subsidiaries maintained, in all material respects, effective internal control over financial reporting as of December 31, 2014, based on the COSO criteria.
We have also audited, in accordance with the standards of the Public Company Accounting Oversight Board (United States), the consolidated balance sheets as of December 31, 2014 and 2013, and the related consolidated statements of changes in capital, income and comprehensive income and cash flows for each of the three years in the period ended December 31, 2014, of ProAssurance Corporation and subsidiaries and our report dated February 24, 2015 expressed an unqualified opinion thereon.
/s/ Ernst & Young LLP
Birmingham, Alabama
February 24, 2015
98
The information required by this Item regarding executive officers is included in Part I of the Form 10-K in accordance with Instruction 3 of the Instructions to Paragraph (b) of Item 401 of Regulation S-K.
The information required by this Item regarding directors is incorporated by reference pursuant to General Instruction G (3) of Form 10-K from ProAssurance’s definitive proxy statement for the
2015
Annual Meeting of its Stockholders to be filed with the Securities and Exchange Commission pursuant to Regulation 14A on or about
April 15, 2015
.
The information required by this Item is incorporated by reference pursuant to General Instruction G (3) of Form 10-K from ProAssurance’s definitive proxy statement for the
2015
Annual Meeting of its Stockholders to be filed with the Securities and Exchange Commission pursuant to Regulation 14A on or about
April 15, 2015
.
99
|
(a)
|
Financial Statements
. The following consolidated financial statements of ProAssurance Corporation and subsidiaries are included herein in accordance with Item 8 of Part II of this report.
|
Report of Registered Public Accounting Firm
Consolidated Balance Sheets –
December 31, 2014
and
2013
Consolidated Statements of Changes in Capital – years ended
December 31, 2014
,
2013
and
2012
Consolidated Statements of Income and Comprehensive Income – years ended
December 31, 2014
,
2013
and
2012
Consolidated Statements of Cash Flows – years ended
December 31, 2014
,
2013
and
2012
Notes to Consolidated Financial Statements
Financial Statement Schedules
. The following consolidated financial statement schedules of ProAssurance Corporation and subsidiaries are included herein in accordance with Item 14(d):
Schedule I – Summary of Investments – Other than Investments in Related Parties
Schedule II – Condensed Financial Information of ProAssurance Corporation (Registrant Only)
Schedule III – Supplementary Insurance Information
Schedule IV – Reinsurance
All other schedules to the consolidated financial statements required by Article 7 of Regulation S-X are not required under the related instructions or are inapplicable and therefore have been omitted.
|
(b)
|
The exhibits required to be filed by Item 15(b) are listed herein in the Exhibit Index.
|
100
SIGNATURES
Pursuant to the requirements of Section 13 of 15(d) of the Securities Exchange Act of 1934, the Registrant has duly caused this report to be signed on its behalf by the undersigned, thereunto duly authorized, on this the
24
th day of
February 2015
.
|
PROASSURANCE CORPORATION
|
|
|
By:
|
/
S
/ W. S
TANCIL
S
TARNES
|
|
W. Stancil Starnes
|
|
Pursuant to the requirements of the Securities Exchange Act of 1934, this report has been signed below by the following persons on behalf of the Registrant and in the capacities and on the dates indicated.
|
Name
|
|
Title
|
|
Date
|
|
|
/
S
/ W. S
TANCIL
S
TARNES
, J.D.
|
|
Chairman of the Board, Chief Executive Officer
|
February 24, 2015
|
||
|
W. Stancil Starnes, J.D.
|
|
(Principal Executive Officer) and President
|
|
||
|
/
S
/ E
DWARD
L. R
AND
, J
R
.
|
|
Chief Financial Officer
|
February 24, 2015
|
||
|
Edward L. Rand, Jr.
|
|
|
|||
|
/
S
/ K
ELLY
B. B
REWER
|
|
Chief Accounting Officer
|
February 24, 2015
|
||
|
Kelly B. Brewer
|
|
|
|||
|
/
S
/ S
AMUEL
A. D
I
P
IAZZA,
J
R.
|
|
Director
|
February 24, 2015
|
||
|
Samuel A. Di Piazza, Jr.
|
|
|
|||
|
/
S
/ R
OBERT
E. F
LOWERS,
M.D
.
|
|
Director
|
February 24, 2015
|
||
|
Robert E. Flowers, M.D.
|
|
|
|||
|
/
S
/ M. J
AMES
G
ORRIE
|
|
Director
|
February 24, 2015
|
||
|
M. James Gorrie
|
|
|
|||
|
/
S
/ W
ILLIAM
J. L
ISTWAN
, M.D.
|
|
Director
|
February 24, 2015
|
||
|
William J. Listwan, M.D.
|
|
|
|||
|
/
S
/ J
OHN
J. M
C
M
AHON
|
|
Director
|
February 24, 2015
|
||
|
John J. McMahon
|
|
|
|||
|
/
S
/ A
NN
F. P
UTALLAZ
, P
H
.D.
|
|
Director
|
February 24, 2015
|
||
|
Ann F. Putallaz, Ph.D.
|
|
|
|||
|
/
S
/ F
RANK
A. S
PINOSA
, D.P.M.
|
|
Director
|
February 24, 2015
|
||
|
Frank A. Spinosa, D.P.M.
|
|
|
|||
|
/
S
/ A
NTHONY
R. T
ERSIGNI
, E
D
.D., FACHE
|
|
Director
|
February 24, 2015
|
||
|
Anthony R. Tersigni, Ed.D., FACHE
|
|
|
|||
|
/
S
/ T
HOMAS
A. S. W
ILSON
, J
R
., M.D.
|
|
Director
|
February 24, 2015
|
||
|
Thomas A. S. Wilson, Jr., M.D.
|
|
|
|||
101
Report of Independent Registered Public Accounting Firm
To the Board of Directors and Stockholders of ProAssurance Corporation
We have audited the accompanying consolidated balance sheets of ProAssurance Corporation and subsidiaries as of December 31, 2014 and 2013, and the related consolidated statements of changes in capital, income and comprehensive income, and cash flows for each of the three years in the period ended December 31, 2014. Our audits also included the financial statement schedules listed in the Index at Item 15(a). These financial statements and schedules are the responsibility of the Company's management. Our responsibility is to express an opinion on these financial statements and schedules based on our audits.
We conducted our audits in accordance with the standards of the Public Company Accounting Oversight Board (United States). Those standards require that we plan and perform the audit to obtain reasonable assurance about whether the financial statements are free of material misstatement. An audit includes examining, on a test basis, evidence supporting the amounts and disclosures in the financial statements. An audit also includes assessing the accounting principles used and significant estimates made by management, as well as evaluating the overall financial statement presentation. We believe that our audits provide a reasonable basis for our opinion.
In our opinion, the financial statements referred to above present fairly, in all material respects, the consolidated financial position of ProAssurance Corporation and subsidiaries at December 31, 2014 and 2013, and the consolidated results of their operations and their cash flows for each of the three years in the period ended December 31, 2014, in conformity with U.S. generally accepted accounting principles. Also, in our opinion, the related financial statement schedules, when considered in relation to the basic financial statements taken as a whole, present fairly in all material respects the information set forth therein.
We also have audited, in accordance with the standards of the Public Company Accounting Oversight Board (United States), ProAssurance Corporation’s internal control over financial reporting as of December 31, 2014, based on criteria established in Internal Control-Integrated Framework issued by the Committee of Sponsoring Organizations of the Treadway Commission (1992 framework) and our report dated February 24, 2015 expressed an unqualified opinion thereon.
/s/ Ernst & Young, LLP
Birmingham, Alabama
February 24, 2015
102
ProAssurance Corporation and Subsidiaries
(In thousands, except share data)
|
December 31,
2014 |
December 31,
2013 |
||||||
|
Assets
|
|||||||
|
Investments
|
|||||||
|
Fixed maturities, available for sale, at fair value; amortized cost, $3,055,477 and $3,026,256, respectively
|
$
|
3,145,027
|
|
$
|
3,118,049
|
|
|
|
Equity securities, trading, at fair value; cost, $283,107 and $203,308, respectively
|
314,482
|
|
253,541
|
|
|||
|
Short-term investments
|
131,259
|
|
248,605
|
|
|||
|
Business owned life insurance
|
56,381
|
|
54,374
|
|
|||
|
Investment in unconsolidated subsidiaries
|
276,501
|
|
214,236
|
|
|||
|
Other investments, $28,958 at fair value at December 31, 2014, otherwise at cost or amortized cost
|
86,057
|
|
52,240
|
|
|||
|
Total Investments
|
4,009,707
|
|
3,941,045
|
|
|||
|
Cash and cash equivalents
|
197,040
|
|
129,383
|
|
|||
|
Restricted cash
|
—
|
|
78,000
|
|
|||
|
Premiums receivable
|
202,528
|
|
115,403
|
|
|||
|
Receivable from reinsurers on paid losses and loss adjustment expenses
|
6,494
|
|
3,231
|
|
|||
|
Receivable from reinsurers on unpaid losses and loss adjustment expenses
|
237,966
|
|
247,518
|
|
|||
|
Prepaid reinsurance premiums
|
32,115
|
|
21,449
|
|
|||
|
Deferred policy acquisition costs
|
38,790
|
|
28,207
|
|
|||
|
Deferred tax asset
|
—
|
|
1,757
|
|
|||
|
Real estate, net
|
39,799
|
|
41,010
|
|
|||
|
Intangible assets
|
100,733
|
|
52,002
|
|
|||
|
Goodwill
|
210,725
|
|
161,115
|
|
|||
|
Other assets
|
93,263
|
|
329,979
|
|
|||
|
Total Assets
|
$
|
5,169,160
|
|
$
|
5,150,099
|
|
|
|
Liabilities and Shareholders’ Equity
|
|||||||
|
Liabilities
|
|||||||
|
Policy liabilities and accruals
|
|||||||
|
Reserve for losses and loss adjustment expenses
|
$
|
2,058,266
|
|
$
|
2,072,822
|
|
|
|
Unearned premiums
|
345,828
|
|
255,463
|
|
|||
|
Reinsurance premiums payable
|
17,451
|
|
34,321
|
|
|||
|
Total Policy Liabilities
|
2,421,545
|
|
2,362,606
|
|
|||
|
Deferred tax liability
|
18,818
|
|
—
|
|
|||
|
Other liabilities
|
320,853
|
|
143,079
|
|
|||
|
Long-term debt
|
250,000
|
|
250,000
|
|
|||
|
Total Liabilities
|
3,011,216
|
|
2,755,685
|
|
|||
|
Shareholders’ Equity
|
|||||||
|
Common shares, par value $0.01 per share, 100,000,000 shares authorized, 62,297,214 and 62,096,787 shares issued, respectively
|
623
|
|
621
|
|
|||
|
Additional paid-in capital
|
359,577
|
|
349,894
|
|
|||
|
Accumulated other comprehensive income (loss), net of deferred tax expense (benefit) of $31,342 and $32,127, respectively
|
58,204
|
|
59,661
|
|
|||
|
Retained earnings
|
1,991,704
|
|
2,015,603
|
|
|||
|
Treasury shares, at cost, 5,763,388 shares and 900,281 shares, respectively
|
(252,164
|
)
|
(31,365
|
)
|
|||
|
Total Shareholders’ Equity
|
2,157,944
|
|
2,394,414
|
|
|||
|
Total Liabilities and Shareholders’ Equity
|
$
|
5,169,160
|
|
$
|
5,150,099
|
|
|
103
ProAssurance Corporation and Subsidiaries
Consolidated Statements of Changes in Capital
(In thousands)
|
Common Stock
|
Additional Paid-in Capital
|
Accumulated Other Comprehensive Income (Loss)
|
Retained Earnings
|
Treasury Stock
|
Total
|
||||||||||||||||||
|
Balance at January 1, 2012
|
$
|
346
|
|
$
|
538,625
|
|
$
|
130,037
|
|
$
|
1,699,853
|
|
$
|
(204,408
|
)
|
$
|
2,164,453
|
|
|||||
|
Common shares issued for compensation
|
—
|
|
3,041
|
|
—
|
|
—
|
|
553
|
|
3,594
|
|
|||||||||||
|
Share-based compensation
|
—
|
|
8,639
|
|
—
|
|
—
|
|
—
|
|
8,639
|
|
|||||||||||
|
Net effect of restricted and performance shares issued and stock options exercised
|
2
|
|
(4,455
|
)
|
—
|
|
—
|
|
—
|
|
(4,453
|
)
|
|||||||||||
|
Dividends to shareholders
|
—
|
|
—
|
|
—
|
|
(192,466
|
)
|
—
|
|
(192,466
|
)
|
|||||||||||
|
Two-for-one stock split effected in the form of a stock dividend
|
271
|
|
(204,070
|
)
|
—
|
|
—
|
|
203,799
|
|
—
|
|
|||||||||||
|
Other comprehensive income (loss)
|
—
|
|
—
|
|
15,343
|
|
—
|
|
—
|
|
15,343
|
|
|||||||||||
|
Net income
|
—
|
|
—
|
|
—
|
|
275,470
|
|
—
|
|
275,470
|
|
|||||||||||
|
Balance at December 31, 2012
|
619
|
|
341,780
|
|
145,380
|
|
1,782,857
|
|
(56
|
)
|
2,270,580
|
|
|||||||||||
|
Common shares reacquired
|
—
|
|
—
|
|
—
|
|
—
|
|
(32,454
|
)
|
(32,454
|
)
|
|||||||||||
|
Common shares issued for compensation and effect of shares reissued to stock purchase plan
|
—
|
|
2,940
|
|
—
|
|
—
|
|
1,145
|
|
4,085
|
|
|||||||||||
|
Share-based compensation
|
—
|
|
9,242
|
|
—
|
|
—
|
|
—
|
|
9,242
|
|
|||||||||||
|
Net effect of restricted and performance shares issued and stock options exercised
|
2
|
|
(4,068
|
)
|
—
|
|
—
|
|
—
|
|
(4,066
|
)
|
|||||||||||
|
Dividends to shareholders
|
—
|
|
—
|
|
—
|
|
(64,777
|
)
|
—
|
|
(64,777
|
)
|
|||||||||||
|
Other comprehensive income (loss)
|
—
|
|
—
|
|
(85,719
|
)
|
—
|
|
—
|
|
(85,719
|
)
|
|||||||||||
|
Net income
|
—
|
|
—
|
|
—
|
|
297,523
|
|
—
|
|
297,523
|
|
|||||||||||
|
Balance at December 31, 2013
|
621
|
|
349,894
|
|
59,661
|
|
2,015,603
|
|
(31,365
|
)
|
2,394,414
|
|
|||||||||||
|
Common shares reacquired
|
—
|
|
—
|
|
—
|
|
—
|
|
(222,360
|
)
|
(222,360
|
)
|
|||||||||||
|
Common shares issued for compensation and effect of shares reissued to stock purchase plan
|
—
|
|
2,639
|
|
|
|
—
|
|
1,561
|
|
4,200
|
|
|||||||||||
|
Share-based compensation
|
—
|
|
10,056
|
|
—
|
|
—
|
|
—
|
|
10,056
|
|
|||||||||||
|
Net effect of restricted and performance shares issued and stock options exercised
|
2
|
|
(3,012
|
)
|
—
|
|
—
|
|
—
|
|
(3,010
|
)
|
|||||||||||
|
Dividends to shareholders
|
—
|
|
—
|
|
—
|
|
(220,464
|
)
|
—
|
|
(220,464
|
)
|
|||||||||||
|
Other comprehensive income (loss)
|
—
|
|
—
|
|
(1,457
|
)
|
—
|
|
—
|
|
(1,457
|
)
|
|||||||||||
|
Net income
|
—
|
|
—
|
|
—
|
|
196,565
|
|
—
|
|
196,565
|
|
|||||||||||
|
Balance at December 31, 2014
|
$
|
623
|
|
$
|
359,577
|
|
$
|
58,204
|
|
$
|
1,991,704
|
|
$
|
(252,164
|
)
|
$
|
2,157,944
|
|
|||||
See accompanying notes.
104
ProAssurance Corporation and Subsidiaries
(In thousands, except per share data)
|
Year Ended December 31
|
|||||||||||
|
|
2014
|
2013
|
2012
|
||||||||
|
Revenues
|
|||||||||||
|
Net premiums earned
|
$
|
699,731
|
|
$
|
527,919
|
|
$
|
550,664
|
|
||
|
Net investment income
|
125,557
|
|
129,265
|
|
136,094
|
|
|||||
|
Equity in earnings (loss) of unconsolidated subsidiaries
|
3,986
|
|
7,539
|
|
(6,873
|
)
|
|||||
|
Net realized investment gains (losses):
|
|||||||||||
|
Other-than-temporary impairment (OTTI) losses
|
(1,475
|
)
|
(71
|
)
|
(1,566
|
)
|
|||||
|
Portion of OTTI losses recognized in (reclassified from) other comprehensive income before taxes
|
268
|
|
—
|
|
(201
|
)
|
|||||
|
Net impairment losses recognized in earnings
|
(1,207
|
)
|
(71
|
)
|
(1,767
|
)
|
|||||
|
Other net realized investment gains (losses)
|
15,861
|
|
67,975
|
|
30,630
|
|
|||||
|
Total net realized investment gains (losses)
|
14,654
|
|
67,904
|
|
28,863
|
|
|||||
|
Other income
|
8,398
|
|
7,551
|
|
7,106
|
|
|||||
|
Total revenues
|
852,326
|
|
740,178
|
|
715,854
|
|
|||||
|
Expenses
|
|||||||||||
|
Losses and loss adjustment expenses
|
379,232
|
|
243,015
|
|
161,726
|
|
|||||
|
Reinsurance recoveries
|
(16,148
|
)
|
(18,254
|
)
|
18,187
|
|
|||||
|
Net losses and loss adjustment expenses
|
363,084
|
|
224,761
|
|
179,913
|
|
|||||
|
Underwriting, policy acquisition and operating expenses
|
211,311
|
|
147,817
|
|
135,631
|
|
|||||
|
Segregated portfolio cells dividend expense
|
1,842
|
|
—
|
|
—
|
|
|||||
|
Interest expense
|
14,084
|
|
2,755
|
|
2,181
|
|
|||||
|
Loss on extinguishment of debt
|
—
|
|
—
|
|
2,163
|
|
|||||
|
Total expenses
|
590,321
|
|
375,333
|
|
319,888
|
|
|||||
|
Gain on acquisition
|
—
|
|
32,314
|
|
—
|
|
|||||
|
Income before income taxes
|
262,005
|
|
397,159
|
|
395,966
|
|
|||||
|
Provision for income taxes
|
|||||||||||
|
Current expense (benefit)
|
58,645
|
|
74,977
|
|
82,752
|
|
|||||
|
Deferred expense (benefit)
|
6,795
|
|
24,659
|
|
37,744
|
|
|||||
|
Total income tax expense (benefit)
|
65,440
|
|
99,636
|
|
120,496
|
|
|||||
|
Net income
|
196,565
|
|
297,523
|
|
275,470
|
|
|||||
|
Other comprehensive income (loss), after tax, net of reclassification adjustments
|
(1,457
|
)
|
(85,719
|
)
|
15,343
|
|
|||||
|
Comprehensive income
|
$
|
195,108
|
|
$
|
211,804
|
|
$
|
290,813
|
|
||
|
Earnings per share:
|
|||||||||||
|
Basic
|
$
|
3.32
|
|
$
|
4.82
|
|
$
|
4.49
|
|
||
|
Diluted
|
$
|
3.30
|
|
$
|
4.80
|
|
$
|
4.46
|
|
||
|
Weighted average number of common shares outstanding:
|
|||||||||||
|
Basic
|
59,285
|
|
61,761
|
|
61,342
|
|
|||||
|
Diluted
|
59,525
|
|
62,020
|
|
61,833
|
|
|||||
|
Cash dividends declared per common share
|
$
|
3.86
|
|
$
|
1.05
|
|
$
|
3.13
|
|
||
See accompanying notes.
105
ProAssurance Corporation and Subsidiaries
(In thousands)
|
Year Ended December 31
|
|||||||||||
|
|
2014
|
2013
|
2012
|
||||||||
|
Operating Activities
|
|||||||||||
|
Net income
|
$
|
196,565
|
|
$
|
297,523
|
|
$
|
275,470
|
|
||
|
Adjustments to reconcile income to net cash provided by operating activities:
|
|||||||||||
|
Amortization, net of accretion
|
43,367
|
|
41,429
|
|
32,832
|
|
|||||
|
Depreciation
|
6,956
|
|
4,538
|
|
4,741
|
|
|||||
|
Loss (gain) on extinguishment of debt
|
—
|
|
—
|
|
2,163
|
|
|||||
|
Gain on acquisition
|
—
|
|
(32,314
|
)
|
—
|
|
|||||
|
(Increase) decrease in cash surrender value of business owned life insurance
|
(2,007
|
)
|
(1,960
|
)
|
(2,008
|
)
|
|||||
|
Net realized investment gains
|
(14,654
|
)
|
(67,904
|
)
|
(28,863
|
)
|
|||||
|
Share-based compensation
|
10,056
|
|
9,242
|
|
8,639
|
|
|||||
|
Deferred income taxes
|
6,795
|
|
24,659
|
|
37,744
|
|
|||||
|
Policy acquisition costs, net amortization (net deferral)
|
10
|
|
(5,820
|
)
|
3,448
|
|
|||||
|
Equity in earnings of unconsolidated subsidiaries, excluding distributions received and tax credit partnership amortization
|
(10,700
|
)
|
(17,376
|
)
|
450
|
|
|||||
|
Other
|
(8,784
|
)
|
(3,014
|
)
|
(2,957
|
)
|
|||||
|
Other changes in assets and liabilities, excluding effect of business combinations:
|
|||||||||||
|
Premiums receivable
|
(15,136
|
)
|
(6,105
|
)
|
16,494
|
|
|||||
|
Receivable from reinsurers on paid losses and loss adjustment expenses
|
3,263
|
|
2,601
|
|
(342
|
)
|
|||||
|
Receivable from reinsurers on unpaid losses and loss adjustment expenses
|
27,114
|
|
15,625
|
|
58,870
|
|
|||||
|
Prepaid reinsurance premiums
|
(5,672
|
)
|
(849
|
)
|
(482
|
)
|
|||||
|
Other assets
|
36,924
|
|
9,582
|
|
(11,231
|
)
|
|||||
|
Reserve for losses and loss adjustment expenses
|
(167,747
|
)
|
(179,677
|
)
|
(218,100
|
)
|
|||||
|
Unearned premiums
|
10,097
|
|
(1,740
|
)
|
(21,919
|
)
|
|||||
|
Reinsurance premiums payable
|
(26,377
|
)
|
(13,269
|
)
|
(36,583
|
)
|
|||||
|
Other liabilities
|
5,932
|
|
(36,569
|
)
|
(27,116
|
)
|
|||||
|
Net cash provided (used) by operating activities
|
$
|
96,002
|
|
$
|
38,602
|
|
$
|
91,250
|
|
||
|
Continued on following page.
|
|||||||||||
106
|
Year Ended December 31
|
|||||||||||
|
|
2014
|
2013
|
2012
|
||||||||
|
Continued from previous page
|
|||||||||||
|
Investing Activities
|
|||||||||||
|
Purchases of:
|
|||||||||||
|
Fixed maturities, available for sale
|
$
|
(645,114
|
)
|
$
|
(519,161
|
)
|
$
|
(646,198
|
)
|
||
|
Equity securities, trading
|
(119,865
|
)
|
(87,604
|
)
|
(120,555
|
)
|
|||||
|
Other investments
|
(25,109
|
)
|
(34,699
|
)
|
(9,977
|
)
|
|||||
|
Funding of tax credit limited partnerships
|
(8,611
|
)
|
(63,489
|
)
|
(35,745
|
)
|
|||||
|
Investment in unconsolidated subsidiaries
|
(52,295
|
)
|
(19,228
|
)
|
(11,009
|
)
|
|||||
|
Proceeds from sales or maturities of:
|
|||||||||||
|
Fixed maturities, available for sale
|
703,828
|
|
970,708
|
|
926,221
|
|
|||||
|
Equity securities, trading
|
134,005
|
|
123,645
|
|
54,670
|
|
|||||
|
Other investments
|
19,942
|
|
2,352
|
|
1,180
|
|
|||||
|
Distributions from unconsolidated subsidiaries
|
5,428
|
|
14,632
|
|
1,387
|
|
|||||
|
Net sales or maturities (purchases) of short-term investments
|
140,411
|
|
(176,092
|
)
|
48,565
|
|
|||||
|
Cash received in (paid in) acquisition
|
35,013
|
|
22,780
|
|
(28,439
|
)
|
|||||
|
Deposit made for future acquisition
|
—
|
|
(205,244
|
)
|
(153,700
|
)
|
|||||
|
Unsettled security transactions, net change
|
(2,953
|
)
|
205
|
|
4,852
|
|
|||||
|
Funds at Lloyd's in support of Syndicate 1729, returned (deposited)
|
8,690
|
|
(8,699
|
)
|
—
|
|
|||||
|
(Increase) decrease in restricted cash
|
78,000
|
|
(78,000
|
)
|
—
|
|
|||||
|
Other
|
(4,390
|
)
|
(9,909
|
)
|
(4,409
|
)
|
|||||
|
Net cash provided (used) by investing activities
|
266,980
|
|
(67,803
|
)
|
26,843
|
|
|||||
|
Financing Activities
|
|||||||||||
|
Proceeds from long-term debt
|
—
|
|
250,000
|
|
125,000
|
|
|||||
|
Repayment of long-term debt
|
—
|
|
(127,183
|
)
|
(57,660
|
)
|
|||||
|
Repurchase of common stock
|
(222,360
|
)
|
(29,089
|
)
|
—
|
|
|||||
|
Excess tax benefit from share-based payment arrangements
|
2,702
|
|
2,128
|
|
7,022
|
|
|||||
|
Dividends to shareholders
|
(71,252
|
)
|
(46,375
|
)
|
(200,118
|
)
|
|||||
|
Other
|
(4,415
|
)
|
(9,448
|
)
|
(4,186
|
)
|
|||||
|
Net cash provided (used) by financing activities
|
(295,325
|
)
|
40,033
|
|
(129,942
|
)
|
|||||
|
Increase (decrease) in cash and cash equivalents
|
67,657
|
|
10,832
|
|
(11,849
|
)
|
|||||
|
Cash and cash equivalents at beginning of period
|
129,383
|
|
118,551
|
|
130,400
|
|
|||||
|
Cash and cash equivalents at end of period
|
$
|
197,040
|
|
$
|
129,383
|
|
$
|
118,551
|
|
||
|
Supplemental Disclosure of Cash Flow Information
|
|||||||||||
|
Cash paid during the year for income taxes, net of refunds
|
$
|
26,061
|
|
$
|
117,107
|
|
$
|
110,278
|
|
||
|
Cash paid during the year for interest
|
$
|
13,408
|
|
$
|
913
|
|
$
|
2,342
|
|
||
|
Significant non-cash transactions
|
|||||||||||
|
Deposit transferred as consideration for acquisition
|
$
|
205,244
|
|
$
|
153,700
|
|
$
|
—
|
|
||
|
Dividends declared and not yet paid
|
$
|
167,744
|
|
$
|
18,532
|
|
$
|
—
|
|
||
|
Other investment interest converted to equity securities
|
$
|
—
|
|
$
|
—
|
|
$
|
15,742
|
|
||
See accompanying notes.
107
ProAssurance Corporation and Subsidiaries
Notes to Consolidated Financial Statements
December 31, 2014
1. Accounting Policies
Organization and Nature of Business
ProAssurance Corporation (ProAssurance, PRA or the Company), a Delaware corporation, is an insurance holding company primarily for wholly owned specialty property and casualty insurance entities including an entity that is the majority capital provider to Syndicate 1729 at Lloyd's of London. Risks insured are primarily liability risks located within the United States of America (U.S.). As described in more detail in Note 15, ProAssurance operates in
four
reportable segments: Specialty Property and Casualty (Specialty P&C), Workers' Compensation, Lloyd's Syndicate, and Corporate.
Principles of Consolidation
The accompanying consolidated financial statements include the accounts of ProAssurance Corporation and its wholly-owned subsidiaries. Investments in entities where ProAssurance holds a greater than minor interest but does not hold a controlling interest are accounted for using the equity method. All significant intercompany accounts and transactions are eliminated in consolidation. ProAssurance subsidiaries located in the United Kingdom (U.K.) are reported on a quarter delay due to timing issues regarding the availability of information, except there is no delay related to subsidiary investments managed in the U.S. as that information is available on an earlier schedule.
Basis of Presentation
The preparation of financial statements in conformity with U.S. generally accepted accounting principles (GAAP) requires management to make estimates and assumptions that affect the reported amounts of assets and liabilities, revenues and expenses, and disclosures related to these amounts at the date of the financial statements. Actual results could differ from those estimates.
Reclassifications
On January 1, 2014, ProAssurance began reporting unearned ceding commissions as an offset to deferred policy acquisition costs (DPAC) on the Consolidated Balance Sheet, and the December 31, 2013 Consolidated Balance Sheet has been conformed to the current presentation. Previously, unearned ceding commissions (
$0.8 million
at December 31, 2013) were reported in Unearned premiums. Also, ceding commission income earned for the years ended
December 31, 2014
,
2013
and
2012
has been reported as an offset to DPAC amortization (see Note 7) which lowered DPAC amortization as previously reported for the years ended
December 31, 2013
and
2012
by
$5.9 million
and
$2.1 million
, respectively. Total underwriting, policy acquisition and operating expense for the years ended December 31, 2013 and 2012 was not affected by the change in presentation.
Stock Split
In 2012, the Board of Directors of ProAssurance Corporation (the Board) declared a
two
-for-one split of ProAssurance common shares which was effected December 27, 2012 in the form of a stock dividend. All share and per share information provided in this report reflects the effect of the split for all periods presented.
Accounting Policies
The significant accounting policies followed by ProAssurance in making estimates that materially affect financial reporting are summarized in these notes to the consolidated financial statements.
108
ProAssurance Corporation and Subsidiaries
Notes to Consolidated Financial Statements
December 31, 2014
Recognition of Revenues
Insurance premiums are recognized as revenues pro rata over the terms of the policies, which are principally
one
year in duration.
At
December 31, 2014
and
2013
ProAssurance had established allowances for credit losses related to premium and agency receivables as shown in the following table.
|
(in thousands)
|
Premium
Receivables |
Agency
Receivables |
||||||
|
Allowance for credit losses:
|
||||||||
|
Balance at December 31, 2012
|
$
|
1,000
|
|
$
|
286
|
|
||
|
Estimated credit losses
|
236
|
|
—
|
|
||||
|
Account write offs, net of recoveries
|
(246
|
)
|
(236
|
)
|
||||
|
Balance at December 31, 2013
|
990
|
|
50
|
|
||||
|
Estimated credit losses
|
299
|
|
—
|
|
||||
|
Account write offs, net of recoveries
|
(299
|
)
|
—
|
|
||||
|
Allowance acquired from acquisition
|
225
|
|
—
|
|
||||
|
Balance at December 31, 2014
|
$
|
1,215
|
|
$
|
50
|
|
||
Earned But Unbilled Premiums (EBUB)
Workers’ compensation premiums are determined based upon the payroll of the insured, the applicable premium rates and, where applicable, an experience based modification factor. An audit of the policyholders’ records is conducted after policy expiration to make a final determination of applicable premiums. Audit premium due from or due to a policyholder as a result of an audit is reflected in net premiums earned when billed. ProAssurance tracks, by policy, the amount of additional premium billed in final audit invoices as a percentage of payroll exposure and uses this information to estimate the probable additional amount that it has earned, but not yet billed, as of the balance sheet date. Changes to the EBUB estimate are included in Net premiums earned in the period recognized. As of
December 31, 2014
, ProAssurance carried earned but unbilled premiums of
$3.4 million
as a part of Premiums receivable.
Losses and Loss Adjustment Expenses
ProAssurance establishes its reserve for losses and loss adjustment expenses ("reserve for losses" or "reserve") based on estimates of the future amounts necessary to pay claims and expenses associated with the investigation and settlement of claims. The reserve for losses is determined on the basis of individual claims and payments thereon as well as actuarially determined estimates of future losses based on past loss experience, available industry data and projections as to future claims frequency, severity, inflationary trends, judicial trends, legislative changes and settlement patterns.
Management establishes the reserve for losses after taking into consideration a variety of factors including the conclusions reached by internal actuaries, premium rates, claims frequency, historical paid and incurred loss development trends, the effect of inflation, general economic trends, the legal and political environment, and the reports received from consulting actuaries. Internal actuaries perform an in-depth review of the reserve for losses at least semi-annually using the loss and exposure data of ProAssurance subsidiaries. Management engages consulting actuaries to review subsidiary loss and exposure data and provide reports to Management regarding the adequacy of reserves.
Estimating casualty insurance reserves, and particularly long-tailed insurance reserves, is a complex process. Long-tailed insurance is characterized by the extended period of time between collecting the premium for insuring a risk and the ultimate payment of losses. For a high proportion of the risks insured or reinsured by ProAssurance the period of time required to resolve a claim is often five years or more, and claims may be subject to litigation. Estimating losses for these long-tailed claims requires ProAssurance to make and revise judgments and assessments regarding multiple uncertainties over an extended period of time. As a result, reserve estimates may vary significantly from the eventual outcome. Reserve estimates and the assumptions on which these estimates are predicated are regularly reviewed and updated as new information becomes available. Any adjustments necessary are reflected in then current operations. Due to the size of ProAssurance’s reserve for losses, even a small percentage adjustment to these estimates could have a material effect on earnings in the period in which the adjustment is made, as was the case in
2014
,
2013
and
2012
.
109
ProAssurance Corporation and Subsidiaries
Notes to Consolidated Financial Statements
December 31, 2014
The effect of adjustments made to reinsured losses is mitigated by the corresponding adjustment that is made to reinsurance recoveries. Thus, in any given year, ProAssurance may make significant adjustments to gross losses that have little effect on its net losses.
Reinsurance Receivables
ProAssurance enters into reinsurance agreements whereby other insurance entities agree to assume a portion of the risk associated with certain policies issued by ProAssurance. In return, ProAssurance agrees to pay a premium to the reinsurer. ProAssurance purchases reinsurance to provide for greater diversification of business and to allow management to control exposure to potential losses arising from large risks.
Receivable from reinsurers on paid losses and loss adjustment expenses is the estimated amount of losses already paid that will be recoverable from reinsurers. Receivable from reinsurers on unpaid losses and loss adjustment expenses is the estimated amount of future loss payments that will be recoverable from reinsurers. Reinsurance recoveries are the portion of losses incurred during the period that are estimated to be allocable to reinsurers. Premiums ceded are the estimated premiums that will be due to reinsurers with respect to premiums earned and losses incurred during the period.
These estimates are based upon management’s estimates of ultimate losses and the portion of those losses that are allocable to reinsurers under the terms of the related reinsurance agreements. Given the uncertainty of the ultimate amounts of losses, these estimates may vary significantly from the eventual outcome. Management regularly reviews these estimates and any adjustments necessary are reflected in the period in which the estimate is changed. Due to the size of the receivable from reinsurers, even a small adjustment to the estimates could have a material effect on ProAssurance’s results of operations for the period in which the change is made.
Reinsurance contracts do not relieve ProAssurance from its obligations to policyholders. ProAssurance continually monitors its reinsurers to minimize its exposure to significant losses from reinsurer insolvencies. Any amount determined to be uncollectible is written off in the period in which the uncollectible amount is identified.
Investments
Fair Values
Fair values of investment securities are primarily provided by independent pricing services. The pricing services provide an exchange traded price, if available, or provide an estimated price determined using multiple observable inputs, including exchange traded prices for similar assets. Management reviews valuations of securities obtained from the pricing services for accuracy based upon the specifics of the security, including class, maturity, credit rating, durations, collateral, and comparable markets for similar securities. Multiple observable inputs are not available for certain of our investments, including municipal bonds and corporate debt not actively traded, and investments in limited partnerships/limited liability companies (LPs/LLCs). Management values these municipal bonds and corporate debt either using a single non-binding broker quote or pricing models that utilize market based assumptions that have limited observable inputs. Management values certain investments in LPs/LLCs based on the net asset value (NAV) of the interest held, as provided by the fund.
Fixed Maturities and Equity Securities
Fixed maturities and equity securities are considered as either available-for-sale or trading securities.
Available-for-sale securities
are carried at fair value, determined as described above, and unrealized gains and losses on such available-for-sale securities are included, net of related tax effects, in Shareholders’ Equity as a component of Accumulated Other Comprehensive Income (Loss).
Investment income includes amortization of premium and accretion of discount related to available-for-sale debt securities acquired at other than par value. Debt securities and mandatorily redeemable preferred stock with maturities beyond one year when purchased are classified as fixed maturities.
Trading portfolio
securities are carried at fair value, determined as described above, with the holding gains and losses included in realized investment gains and losses in the current period.
Short-term Investments
Short-term investments, which have a maturity at purchase of one year or less, are primarily comprised of investments in U.S. Treasury obligations and commercial paper. All balances are reported at amortized cost, which approximates fair value.
110
ProAssurance Corporation and Subsidiaries
Notes to Consolidated Financial Statements
December 31, 2014
Other Investments
Investments in LPs/LLCs where ProAssurance has virtually no influence over the operating and financial policies of an investee are accounted for using the cost method. Under the cost method, investments are valued at cost, with investment income recognized when received.
Investments in convertible bond securities are carried at fair value as permitted by the accounting guidance for hybrid financial instruments, with changes in fair value recognized in income as a component of Net realized investment gains (losses) during the period of change. Interest on convertible bond securities is recorded on an accrual basis based on contractual interest rates and is included in Net investment income.
Investment in Unconsolidated Subsidiaries
Investments in LPs/LLCs where ProAssurance is deemed to have influence because it holds a greater than a minor interest are accounted for using the equity method. Under the equity method, the recorded basis of the investment is adjusted each period for the investor’s pro rata share of the investee’s income or loss. Investments in unconsolidated subsidiaries include tax credit partnerships accounted for using the equity method, whereby ProAssurance’s proportionate share of income or loss is included in investment income. Tax credits received from the partnerships are recognized in the period received as a reduction to current tax expenses.
Business Owned Life Insurance (BOLI)
ProAssurance owns life insurance contracts on certain management employees. The life insurance contracts are carried at their current cash surrender value. Changes in the cash surrender value are included in income in the current period as investment income. Death proceeds from the contracts are recorded when the proceeds become payable under the policy terms.
Realized Gains and Losses
Realized investment gains and losses are recognized on the specific identification basis.
Other-than-temporary Impairments
ProAssurance evaluates its available-for-sale investment securities on at least a quarterly basis for the purpose of determining whether declines in fair value below recorded cost basis represent other-than-temporary declines. The assessment of whether the amortized cost basis of debt securities, particularly asset-backed debt securities, is expected to be recovered requires management to make assumptions regarding various matters affecting cash flows to be received in the future. The choice of assumptions is subjective and requires the use of judgment; actual credit losses experienced in future periods may differ from management’s estimates of those credit losses.
If there is intent to sell the security or if it is more likely than not that the security will be required to be sold before full recovery of its amortized cost basis, ProAssurance considers a decline in fair value to be an other-than-temporary impairment. Otherwise, ProAssurance considers the following factors in determining whether an investment’s decline is other-than-temporary:
For equity securities:
|
•
|
the length of time for which the fair value of the investment has been less than its recorded basis;
|
|
•
|
the financial condition and near-term prospects of the issuer underlying the investment, taking into consideration the economic prospects of the issuer’s industry and geographical region, to the extent that information is publicly available; and
|
|
•
|
the historical and implied volatility of the fair value of the security.
|
For debt securities, an evaluation is made as to whether the decline in fair value is due to credit loss, which is defined as the excess of the current amortized cost basis of the security over the present value of expected future cash flows. Methodologies used to estimate the present value of expected cash flows to determine if a decline is due to a credit loss are:
|
•
|
For non-structured fixed maturities (U.S. Treasury securities, obligations of U.S. Government and government agencies and authorities, obligations of states, municipalities and political subdivisions, and corporate debt) the estimate of expected cash flows is determined by projecting a recovery value and a recovery time frame and assessing whether further principal and interest will be received. ProAssurance considers various factors in projecting recovery values and recovery time frames, including the following:
|
|
•
|
third party research and credit rating reports;
|
111
ProAssurance Corporation and Subsidiaries
Notes to Consolidated Financial Statements
December 31, 2014
|
•
|
the current credit standing of the issuer, including credit rating downgrades, whether before or after the balance sheet date;
|
|
•
|
internal assessments and the assessments of external portfolio managers regarding specific circumstances surrounding an investment, which indicate the investment is more or less likely to recover its amortized cost than other investments with a similar structure;
|
|
•
|
failure of the issuer of the security to make scheduled interest or principal payments;
|
|
•
|
For structured securities (primarily asset-backed securities), ProAssurance estimates the present value of the security’s cash flows using the effective yield of the security at the date of acquisition (or the most recent implied rate used to accrete the security if the implied rate has changed as a result of a previous impairment or changes in expected cash flows). ProAssurance considers the most recently available six month averages of the levels of delinquencies, defaults, severities, and prepayments for the collateral (loans) underlying the securitization or, if historical data is not available, sector based assumptions, to estimate expected future cash flows of these securities.
|
Investments in tax credit partnerships are evaluated for OTTI by considering both qualitative and quantitative factors which include: whether cash flows currently expected from the investment, primarily tax benefits, equal or exceed the carrying value of the investment, whether currently expected cash flows are less than those expected at the time the investment was acquired, and ProAssurance's ability and intent to hold the investment until the recovery of its carrying value.
Investments in LPs/LLCs other than tax credit partnerships are evaluated for impairment by comparing ProAssurance’s carrying value to net asset value of ProAssurance’s interest as reported by the LP/LLC. Additionally, Management considers the performance of the LP/LLC relative to the market and its stated objectives, cash flows expected from the interest, and the audited financial statements of the LP/LLC, if available.
ProAssurance recognizes other-than-temporary impairments, including impairments of debt securities due to credit loss, in earnings as a part of net realized investment gains (losses). In subsequent periods, any measurement of gain or loss or impairment is based on the revised amortized basis of the security. Declines in fair value, including non-credit impairments of debt securities, not considered to be other-than-temporary are recognized in other comprehensive income.
Asset-backed securities that have been impaired due to credit or are below investment grade quality are accounted for under the effective yield method. Under the effective yield method estimates of cash flows expected over the life of asset-backed securities are then used to recognize income on the investment balance for subsequent accounting periods.
Foreign Currency
The functional currency of all ProAssurance foreign subsidiaries is the U.S. Dollar.
Cash and Cash Equivalents
For purposes of the consolidated balance sheets and statements of cash flows, ProAssurance considers all demand deposits and overnight investments to be cash equivalents.
Restricted Cash
Restricted cash represents cash balances which are not available for immediate or general use. At December 31, 2013 ProAssurance's Restricted cash was comprised entirely of a deposit collateralizing a standby letter of credit entered into as partial funding at Lloyd's for Syndicate 1729.
Deferred Policy Acquisition Costs; Ceding Commission Income
Costs that vary with and are directly related to the successful production of new and renewal premiums (primarily premium taxes, commissions and underwriting salaries) are deferred to the extent they are recoverable against unearned premiums and are amortized as related premiums are earned. Unearned ceding commission income is reported as an offset to deferred policy acquisition costs. Ceding commission earned is reported as an offset to DPAC amortization.
Income Taxes/Deferred Taxes
ProAssurance files a consolidated federal income tax return. Tax-related interest and penalties are recognized as components of tax expense.
ProAssurance evaluates tax positions taken on tax returns and recognizes positions in the financial statements when it is more likely than not that the position will be sustained upon resolution with a taxing authority. If recognized, the benefit is
112
ProAssurance Corporation and Subsidiaries
Notes to Consolidated Financial Statements
December 31, 2014
measured as the largest amount of benefit that has a greater than
fifty
percent probability of being realized. Uncertain tax positions are reviewed each period by considering changes in facts and circumstances, such as changes in tax law, interactions with taxing authorities and developments in case law, and adjustments are made as considered necessary. Adjustments to unrecognized tax benefits may affect income tax expense and the settlement of uncertain tax positions may require the use of cash.
Deferred federal income taxes arise from the recognition of temporary differences between the basis of assets and liabilities determined for financial reporting purposes and the basis determined for income tax purposes. ProAssurance’s temporary differences principally relate to loss reserves, unearned premium, deferred policy acquisition costs, unrealized investment gains (losses), basis differentials for investments, compensation accruals, and intangibles. Deferred tax assets and liabilities are measured using the enacted tax rates expected to be in effect when such benefits are realized. ProAssurance reviews its deferred tax assets quarterly for impairment. If management determines that it is more likely than not that some or all of a deferred tax asset will not be realized, a valuation allowance is recorded to reduce the carrying value of the asset. In assessing the need for a valuation allowance, management is required to make certain judgments and assumptions about the future operations of ProAssurance based on historical experience and information as of the measurement date regarding reversal of existing temporary differences, carryback capacity, future taxable income, including its capital and operating characteristics, and tax planning strategies.
Changes in tax laws and rates could also affect recorded deferred tax assets and liabilities in the future. Management is not aware of any such changes that would have a material effect on the Company’s results of operations, cash flows or financial position.
Real Estate
Real Estate balances are reported at cost or, for properties acquired in business combinations, estimated fair value on the date of acquisition, less accumulated depreciation. Real estate principally consists of properties in use as corporate offices. Depreciation is computed over the estimated useful lives of the related property using the straight-line method. Excess office capacity is leased or made available for lease; rental income is included in other income and real estate expenses are included in underwriting, policy acquisition and operating expenses.
Real estate accumulated depreciation was approximately
$23.0 million
and
$21.6 million
at
December 31, 2014
and
2013
, respectively. Real estate depreciation expense for the years ended
December 31, 2014
,
2013
and
2012
was
$1.5 million
,
$1.5 million
and
$1.4 million
, respectively.
Intangible Assets
Intangible assets with definite lives are amortized over the estimated useful life of the asset. Amortizable intangible assets primarily consist of agency and policyholder relationships. Intangible assets with an indefinite life, primarily state licenses, are not amortized. Both amortizable and non-amortizable intangible assets increased during
2014
due to intangible assets purchased in the Eastern acquisition, see Note 2. Intangible assets are evaluated for impairment on an annual basis. Information about ProAssurance's intangible assets is shown in the following table.
|
Gross Carrying Value
|
Accumulated Amortization
|
Amortization Expense
|
|||||||||||||||||||||||||
|
December 31
|
December 31
|
Year Ended December 31
|
|||||||||||||||||||||||||
|
(In millions)
|
2014
|
2013
|
2014
|
2013
|
2014
|
2013
|
2012
|
||||||||||||||||||||
|
Intangible Assets
|
|||||||||||||||||||||||||||
|
Non-amortizable
|
$
|
25.8
|
|
$
|
16.8
|
|
|||||||||||||||||||||
|
Amortizable
|
96.2
|
|
51.7
|
|
$
|
21.2
|
|
$
|
16.5
|
|
$
|
10.3
|
|
$
|
5.3
|
|
$
|
4.5
|
|
||||||||
|
Total Intangible Assets
|
$
|
122.0
|
|
$
|
68.5
|
|
|||||||||||||||||||||
Aggregate amortization expense for intangible assets is estimated to be
$8.3 million
for
2015
,
$8.0 million
for
2016
,
$5.6 million
for
2017
,
$5.6 million
for
2018
and
$5.6 million
for
2019
.
Goodwill
Goodwill is recognized in conjunction with acquisitions as the excess of the purchase consideration for the acquisition over the fair value of identifiable assets acquired and liabilities assumed. The fair value of identifiable assets and liabilities, and
113
ProAssurance Corporation and Subsidiaries
Notes to Consolidated Financial Statements
December 31, 2014
thus goodwill, is subject to redetermination within a measurement period of up to one year following completion of an acquisition.
ProAssurance evaluates the carrying value of goodwill at the segment (or reporting unit) level annually as of October 1st. If, at any time during the year, events occur or circumstances change that would more likely than not reduce the fair value below the carrying value, an additional evaluation of goodwill is made.
The goodwill impairment assessment requires evaluating qualitative factors or performing a quantitative assessment to determine if a reporting unit’s carrying value is likely to exceed its fair value. ProAssurance elected to evaluate goodwill for each of its reporting units using qualitative factors to determine whether it was more likely than not that the fair value of a reporting unit was less than its carrying amount. In applying the qualitative approach, Management considered macroeconomic factors, such as industry and market conditions, as well as reporting-unit-specific events, actual financial performance versus expectations, and management’s future business expectations. For recently acquired reporting units with material goodwill, consideration was given to the fact that the business had been recently acquired in an orderly transaction between market participants, and that the purchase price therefore represented fair value at acquisition. A significant amount of judgment is required in performing the goodwill impairment analysis. As of
October 1, 2014
, the most recent evaluation date, Management concluded that the fair value of each ProAssurance reporting unit exceeded the carrying value of the reporting unit, and deemed it unnecessary to perform further testing for impairment.
Other Assets and Other Liabilities
At
December 31, 2013
, Other assets was principally comprised of a deposit with an intermediate third-party of
$205 million
, related to the completion of the Eastern Insurance Holdings, Inc. (Eastern) acquisition which closed on January 1, 2014. See Note 2.
Other liabilities at
December 31, 2014
and
2013
consisted of the following:
|
(In millions)
|
2014
|
2013
|
||||||
|
Unpaid dividends
|
$
|
167.7
|
|
$
|
18.5
|
|
||
|
Segregated portfolio cell (SPC) dividends payable
|
15.8
|
|
—
|
|
||||
|
All other
|
137.4
|
|
124.6
|
|
||||
|
Total other liabilities
|
$
|
320.9
|
|
$
|
143.1
|
|
||
The SPC dividend payable represents the cumulative undistributed earnings of segregated portfolio cells that are contractually payable to external preferred shareholders of the cells. Unpaid dividends represents common stock dividends declared by ProAssurance's Board of Directors that have not yet been paid. Unpaid dividends increased for 2014 due to special dividends declared in the fourth quarter that were paid in 2015.
Treasury Stock
Treasury shares are reported at cost, and are reflected on the Consolidated Balance Sheets as an unallocated reduction of total equity.
Share-Based Payments
Compensation cost for share-based payments is measured based on the grant-date fair value of the award, recognized over the period in which the employee is required to provide service in exchange for the award. Excess tax benefits (tax deductions realized in excess of the compensation costs recognized for the exercise of the awards, multiplied by the incremental tax rate) are reported as financing cash inflows.
114
ProAssurance Corporation and Subsidiaries
Notes to Consolidated Financial Statements
December 31, 2014
Subsequent Events
ProAssurance evaluates events that occurred subsequent to
December 31, 2014
, for recognition or disclosure in its Consolidated Financial Statements.
Accounting Changes Adopted
Obligations Resulting from Joint and Several Liability Arrangements
Effective for fiscal years beginning after December 15, 2013, the Financial Accounting Standards Board (FASB) revised guidance related to obligations resulting from joint and several liability arrangements. The new guidance requires an entity to recognize, measure and disclose obligations resulting from joint and several liability arrangements for which the total amount of the obligation is fixed at the reporting date, except for obligations already addressed within existing GAAP guidance, with retrospective application required for such arrangements existing at the beginning of the fiscal year of adoption. ProAssurance adopted the guidance on January 1, 2014. Adoption of this guidance had no effect on ProAssurance's results of operations or financial position.
Presentation of Unrecognized Tax Benefit When a Net Operating Loss Carryforward, a Similar Tax Loss, or a Tax Credit Carryforward Exists
Effective for fiscal years beginning after December 15, 2013, the FASB issued guidance related to the financial statement presentation of unrecognized tax benefits. The new guidance requires an entity to present unrecognized tax benefits as a reduction to a deferred tax asset resulting from a net operating loss carryforward, a similar tax loss, or tax credit carryforward except in circumstances where the relevant taxing authority does not permit offset or does not require offset and the entity does not intend to use the deferred tax asset for offset. The guidance requires prospective application for all unrecognized tax benefits that exist as of the effective date, but may be applied retrospectively. ProAssurance adopted the guidance prospectively on January 1, 2014. Adoption of this guidance had no material effect on ProAssurance's results of operations or financial position.
Equity Method and Joint Ventures-Accounting for Investments in Qualified Affordable Housing Projects
Effective for fiscal years beginning after December 15, 2014, the FASB issued guidance which, if certain criteria is met, permits but does not require reporting entities to begin using a new accounting method, the proportional amortization method, for investments in qualified affordable housing projects. The guidance also includes new disclosure requirements around the nature of investments in qualified affordable housing projects and their effect on financial position and results of operations. Under the proportional amortization method the investments in such projects are amortized in proportion to the tax benefits received, and investment performance is recognized as a component of income tax expense (benefit) rather than as a component of investment income. The tax credit partnership investments held by ProAssurance are primarily investments in qualified affordable housing projects. ProAssurance has adopted the new guidance as of December 31, 2014, but has elected to continue to account for these investments using the equity method of accounting. Adoption of this guidance had no material effect on ProAssurance’s results of operations or financial position as it affected disclosures only.
Determining Whether Hybrid Financial Instruments Issued as a Share is More Akin to Debt or to Equity
Effective for fiscal years beginning after December 15, 2015, early adoption permitted, the FASB issued guidance that clarifies current U.S. GAAP regarding the evaluation of the economic characteristics and risks of a host contract in a hybrid financial instrument that is issued in the form of a share. ProAssurance adopted the guidance as of December 31, 2014. Adoption of this guidance had no effect on ProAssurance’s results of operations or financial position.
Business Combinations: Pushdown Accounting
On November 18, 2014, the FASB issued immediately effective guidance on whether and at what threshold an acquired entity can apply pushdown accounting in its separate financial statements. ProAssurance has adopted this guidance as of its effective date. Adoption of this guidance had no effect on ProAssurance’s results of operations or financial position.
Income Statement Presentation of Extraordinary Items
Effective for fiscal years beginning after December 15, 2015, early adoption permitted, the FASB issued guidance that eliminates from U.S. GAAP the concept of extraordinary items and the related presentation requirements. Under the new guidance, the effect of each event or transaction that is unusual in nature or occurs infrequently, or both, is to be presented as a
115
ProAssurance Corporation and Subsidiaries
Notes to Consolidated Financial Statements
December 31, 2014
separate component of income from continuing operations or, alternatively, disclosed in notes to the financial statements. ProAssurance adopted the guidance as of January 1, 2014. Adoption of this guidance had no effect on ProAssurance’s results of operations or financial position.
Accounting Changes Not Yet Adopted
Reporting Discontinued Operations and Disclosures of Disposals of Components of an Entity
Effective for fiscal years beginning after December 15, 2014, the FASB issued guidance which changes the requirements for reporting discontinued operations. Under the new guidance, reporting entities are required to report disposals of business components only if the disposal represents a strategic shift in the entity’s operations that will have a major effect on the entity’s operations and financial results. The new guidance expands disclosure requirements for reported discontinued operations and requires disclosure of pre-tax profit or loss attributable to significant disposals that are not reported as discontinued operations. ProAssurance plans to adopt the guidance beginning January 1, 2015. Adoption of the guidance is expected to have no effect on ProAssurance’s results of operations or financial position.
Accounting for Share-Based Payments When the Terms of an Award Provide That a Performance Target Could Be Achieved after the Requisite Service Period
Effective for fiscal years beginning after December 15, 2015, the FASB issued guidance for share-based payments in which the terms of the award provide that a performance target can be achieved after completion of the requisite service period. The new guidance provides that compensation cost for such awards should be recognized in the period in which it becomes probable that the performance target will be achieved and should represent the compensation cost attributable to the period(s) for which the requisite service has already been rendered. ProAssurance plans to adopt the guidance beginning January 1, 2016. Adoption of the guidance is expected to have no effect on ProAssurance’s results of operations or financial position as ProAssurance has no awards with performance targets extending beyond the requisite service period.
Revenue from Contracts with Customers
Effective for fiscal years beginning after December 15, 2016, the FASB issued guidance related to revenue from contracts with customers. The core principle of the new guidance is that revenue should be recognized to depict the transfer of promised goods or services to customers in an amount that reflects the consideration to which the entity expects to be entitled in exchange for those goods or services. ProAssurance plans to adopt the guidance beginning January 1, 2017. As the majority of ProAssurance's revenues come from insurance contracts which fall under the scope of other FASB standards, adoption of the guidance is expected to have no material effect on ProAssurance’s results of operations or financial position.
Disclosure of Uncertainties about an Entity's Ability to Continue as a Going Concern
Effective for fiscal years ending after December 15, 2016 and interim periods beginning after December 15, 2016, the FASB issued guidance that establishes principles and definitions related to management's evaluation of whether there is substantial doubt about the organization's ability to continue as a going concern. For each interim and annual reporting period, the new guidance requires management to evaluate the organization's ability to meet its obligations as they are due within one year of the date the financial statements are issued and requires disclosure when there is substantial doubt regarding the organization's ability to continue as a going concern. ProAssurance plans to adopt the guidance on its effective date. Adoption is expected to have no effect on ProAssurance’s results of operations or financial position.
116
ProAssurance Corporation and Subsidiaries
Notes to Consolidated Financial Statements
December 31, 2014
2. Business Combinations
All entities acquired in
2014
,
2013
and 2012 were accounted for in accordance with GAAP relating to Business Combinations.
On January 1, 2014, ProAssurance completed the acquisition of Eastern by purchasing
100%
of its outstanding common shares for cash of
$205 million
. Eastern is based in Lancaster, Pennsylvania and specializes in workers' compensation insurance and reinsurance products and services, including alternative market solutions. ProAssurance incurred expenses related to the purchase of approximately
$2.2 million
during the year ended
December 31, 2014
and approximately
$0.9 million
during the year ended
December 31, 2013
. These expenses were included as a part of operating expenses in the periods incurred.
On January 1, 2013, ProAssurance completed the acquisition of Medmarc Mutual Insurance Company, now Medmarc Casualty Insurance Company (Medmarc), through a sponsored demutualization. Medmarc is based in Chantilly, Virginia and provides products liability insurance for medical technology and life sciences companies and also provides legal professional liability insurance. ProAssurance acquired Medmarc for cash of
$153.7 million
, including the funding of future policy credits for eligible members of
$7.5 million
. ProAssurance transferred all of the cash required to complete the transaction to a third party agent for the benefit of Medmarc eligible members on December 27, 2012. ProAssurance incurred expenses related to the purchase of approximately
$2.6 million
during the year ended December 31, 2013 and approximately
$1.0 million
during the year ended December 31, 2012. These expenses were included as a part of operating expenses in the periods incurred.
During 2012, ProAssurance also completed an acquisition of a reciprocal exchange that converted to a stock insurance company upon acquisition. The acquisition was not material to ProAssurance.
The purchase consideration for both the acquisitions of Eastern and Medmarc was allocated to the assets acquired and liabilities assumed based on their estimated fair values on the acquisition dates, as shown in the table below. For the Eastern acquisition, goodwill of
$49.6 million
was recognized equal to the excess of the purchase price over the net fair value of identifiable assets acquired and liabilities assumed. Factors contributing to the recognition of goodwill include strategic and synergistic benefits that are expected to be realized as a result of the acquisition. These benefits include insurance market diversification, expanded access to alternative markets, and opportunities to reach additional insureds in the healthcare market by being a single source provider of a suite of insurance products. None of the goodwill is expected to be tax deductible.
For the Medmarc acquisition, the purchase consideration was less than the estimated fair value of the net assets acquired resulting in a gain on the acquisition of
$32.3 million
. ProAssurance believes it was able to acquire Medmarc for less than the fair value of its net assets due to Medmarc's declining premium base and its small capital position relative to other insurers in the medical technology and life sciences products liability insurance market.
|
(In thousands)
|
Eastern
|
Medmarc
|
||||||
|
Fixed maturities, available for sale
|
$
|
107,131
|
|
$
|
269,529
|
|
||
|
Equity securities, trading
|
65,945
|
|
30,976
|
|
||||
|
Cash and short-term investments
|
58,944
|
|
24,008
|
|
||||
|
Other investments
|
42,133
|
|
5,340
|
|
||||
|
Premiums receivable, net
|
71,989
|
|
2,986
|
|
||||
|
Receivable from reinsurers on paid and unpaid losses and LAE
|
18,942
|
|
73,107
|
|
||||
|
Intangible assets
|
59,000
|
|
3,630
|
|
||||
|
Deferred policy acquisition costs (see discussion below)
|
10,593
|
|
—
|
|
||||
|
Other assets
|
19,225
|
|
14,614
|
|
||||
|
Reserve for losses and loss adjustment expenses
|
(153,191
|
)
|
(201,072
|
)
|
||||
|
Unearned premiums
|
(80,268
|
)
|
(16,937
|
)
|
||||
|
Ceded balances payable
|
(9,507
|
)
|
—
|
|
||||
|
Segregated portfolio cells dividends payable
|
(14,430
|
)
|
—
|
|
||||
|
Deferred tax liabilities, net
|
(12,835
|
)
|
(4,934
|
)
|
||||
|
Other liabilities
|
(28,038
|
)
|
(15,233
|
)
|
||||
|
Fair value of net assets acquired
|
$
|
155,633
|
|
$
|
186,014
|
|
||
|
Goodwill
|
49,610
|
|
—
|
|
||||
|
Gain on acquisition
|
—
|
|
(32,314
|
)
|
||||
|
Total purchase consideration
|
$
|
205,243
|
|
$
|
153,700
|
|
||
117
ProAssurance Corporation and Subsidiaries
Notes to Consolidated Financial Statements
December 31, 2014
Intangible assets acquired from Eastern and Medmarc included the following:
|
Eastern
|
Medmarc
|
|||||||||
|
(In millions)
|
Estimated Fair Value on Acquisition Date
|
Estimated
Useful Life
|
Estimated Fair Value on Acquisition Date
|
Estimated
Useful Life
|
||||||
|
Agency relationships
|
$27.0
|
15
|
$—
|
—
|
|
|||||
|
Policyholder relationships
|
8.0
|
15
|
—
|
—
|
|
|||||
|
Trade names
|
8.0
|
15
|
—
|
—
|
|
|||||
|
Non-compete agreements
|
7.0
|
3
|
1.1
|
2
|
|
(1)
|
||||
|
Total intangibles subject to amortization
|
$50.0
|
13
|
(2)
|
$1.1
|
2
|
|
(2)
|
|||
|
Insurance license agreements
|
$9.0
|
Indefinite
|
$2.5
|
Indefinite
|
||||||
(1) Medmarc non-compete agreements were fully amortized as of
December 31, 2014
.
(2) Reflects the weighted average estimated useful life of acquired intangible assets that are subject to amortization.
ProAssurance's fair value estimate of the value of business acquired (VOBA), calculated as the present value of future earnings expected from the insurance contracts acquired, approximated the carrying value of Eastern's asset for deferred policy acquisition costs as of the acquisition date. Consequently, Eastern's asset for deferred policy acquisition costs was recognized in the purchase price allocation, as listed above, in lieu of recognizing an intangible asset for VOBA.
ProAssurance believes that all contractual cash flows related to acquired receivables of both acquisitions will be collected. For Eastern, the fair values of the reserve for losses and loss adjustment expenses and related reinsurance recoverables were based on three components: an actuarial estimate of the expected future net cash flows, a reduction to those cash flows for the time value of money determined utilizing the U.S. Treasury Yield Curve, and a risk margin adjustment to reflect the net present value of profit that an investor would demand in return for the assumption of the development risk associated with the reserve. The fair value of the reserve, including the risk margin adjustment, exceeded the undiscounted loss reserve previously established by Eastern by
$9.3 million
; this fair value adjustment is being amortized over the average expected life of the reserve of
6
years as a reduction to loss expenses. For Medmarc, the fair values of the reserve for losses and loss adjustment expenses and related reinsurance recoverables were estimated based on the present value of the expected underlying net cash flows, including a
5%
profit margin and a
5%
risk premium, and were determined to be materially the same as the recorded cost basis acquired.
118
ProAssurance Corporation and Subsidiaries
Notes to Consolidated Financial Statements
December 31, 2014
The following table provides Pro Forma Consolidated Results for the years ended
December 31, 2014
,
2013
and
2012
as if the Eastern transaction had occurred on January 1, 2013 and the Medmarc transaction had occurred on January 1, 2012. ProAssurance Actual Consolidated Results have been adjusted by the following, net of related tax effects, to reflect the Pro Forma Consolidated Results below.
|
•
|
For the year ended
December 31, 2013
, ProAssurance
2013
Actual Consolidated Results, which did not include Eastern, have been adjusted to include Eastern's 2013 operating results. ProAssurance Actual Consolidated Results for the year ended
December 31, 2014
included Eastern's operating results (Revenue of
$202.2 million
and Net income of
$9.1 million
).
|
|
•
|
For the year ended December 31, 2012, ProAssurance 2012 Actual Consolidated Results, which did not include Medmarc, have been adjusted to include Medmarc's 2012 operating results. ProAssurance Actual Consolidated Results for the years ended December 31, 2014 and 2013 included Medmarc's operating results (Revenue of
$41.4 million
and
$46.5 million
, respectively, and Net Income of
$8.1 million
and
$15.7 million
, respectively).
|
|
•
|
Certain costs included in ProAssurance Actual Consolidated Results for the years ended
December 31, 2014
and 2013 have been reported in the Pro Forma Consolidated Results as if the costs had been incurred for the years ended
December 31, 2013
and 2012, respectively. Such costs include direct transaction costs and certain compensation costs directly related to the integration of Eastern and Medmarc operations.
|
|
•
|
Prior to the acquisition date, Medmarc reported on a statutory basis and expensed policy acquisition costs associated with successful contracts as incurred. After the acquisition date, in accordance with GAAP, Medmarc policy acquisition costs associated with successful contracts were capitalized and amortized to expense as the related premium revenues were earned, but no amortization was recognized for Medmarc policies written prior to the acquisition date. The Pro Forma Consolidated Results for both 2013 and 2012 have been adjusted to reflect policy acquisition costs as if Medmarc had followed GAAP guidance for these costs in pre-acquisition periods.
|
|
•
|
Net income for the years ended
December 31, 2013
and 2012, respectively, was reduced to reflect amortization of intangible assets and debt security premiums and discounts recorded as a part of the Eastern and Medmarc purchase price allocations.
|
|
•
|
The non-taxable gain on the Medmarc acquisition of
$32.3 million
that was included in ProAssurance Actual Consolidated Results for the year ended December 31, 2013 has been reported in the Pro Forma Consolidated Results as being recognized during the year ended December 31, 2012.
|
|
|
Year Ended December 31, 2014
|
Year Ended December 31, 2013
|
Year Ended December 31, 2012
|
||||||||
|
(In thousands)
|
ProAssurance
Pro Forma Consolidated Results |
ProAssurance
Actual Consolidated Results |
ProAssurance
Pro Forma Consolidated Results |
ProAssurance
Actual Consolidated Results |
ProAssurance
Pro Forma Consolidated Results |
ProAssurance
Actual Consolidated Results |
|||||
|
Revenue
|
$852,326
|
$852,326
|
$926,873
|
$740,178
|
$757,240
|
$715,854
|
|||||
|
Net income
|
$197,533
|
$196,565
|
$263,446
|
*
|
$297,523
|
$317,097
|
$275,470
|
||||
* Includes adjustments related to Eastern of
$0.4 million
and Medmarc of
$33.7 million
.
119
ProAssurance Corporation and Subsidiaries
Notes to Consolidated Financial Statements
December 31, 2014
3. Fair Value Measurement
Fair value is defined as the price that would be received to sell an asset or paid to transfer a liability in an orderly transaction between market participants at the measurement date. A three level hierarchy has been established for valuing assets and liabilities based on how transparent (observable) the inputs are that are used to determine fair value, with the inputs considered most observable categorized as Level 1 and those that are the least observable categorized as Level 3. Hierarchy levels are defined as follows:
|
|
Level 1:
|
quoted (unadjusted) market prices in active markets for identical assets and liabilities. For ProAssurance, Level 1 inputs are generally quotes for debt or equity securities actively traded in exchange or over-the-counter markets.
|
|
|
Level 2:
|
market data obtained from sources independent of the reporting entity (observable inputs). For ProAssurance, Level 2 inputs generally include quoted prices in markets that are not active, quoted prices for similar assets or liabilities, and results from pricing models that use observable inputs such as interest rates and yield curves that are generally available at commonly quoted intervals.
|
|
|
Level 3:
|
the reporting entity’s own assumptions about market participant assumptions based on the best information available in the circumstances (non-observable inputs). For ProAssurance, Level 3 inputs are used in situations where little or no Level 1 or 2 inputs are available or are inappropriate given the particular circumstances. Level 3 inputs include results from pricing models for which some or all of the inputs are not observable, discounted cash flow methodologies, single non-binding broker quotes and adjustments to externally quoted prices that are based on management judgment or estimation.
|
Fair values of assets measured at fair value on a recurring basis as of
December 31, 2014
and
December 31, 2013
, are shown in the following tables. The tables also indicate the fair value hierarchy of the valuation techniques utilized to determine those fair values. For some assets, the inputs used to measure fair value may fall into different levels of the fair value hierarchy. When this is the case, the asset is categorized based on the level of the most significant input to the fair value measurement. Assessments of the significance of a particular input to the fair value measurement require judgment and consideration of factors specific to the assets being valued.
120
ProAssurance Corporation and Subsidiaries
Notes to Consolidated Financial Statements
December 31, 2014
|
December 31, 2014
|
|||||||||||||||
|
Fair Value Measurements Using
|
Total
|
||||||||||||||
|
(In thousands)
|
Level 1
|
Level 2
|
Level 3
|
Fair Value
|
|||||||||||
|
Assets:
|
|||||||||||||||
|
Fixed maturities, available for sale
|
|||||||||||||||
|
U.S. Treasury obligations
|
$
|
—
|
|
$
|
166,512
|
|
$
|
—
|
|
$
|
166,512
|
|
|||
|
U.S. Government-sponsored enterprise obligations
|
—
|
|
39,563
|
|
—
|
|
39,563
|
|
|||||||
|
State and municipal bonds
|
—
|
|
1,057,590
|
|
5,025
|
|
1,062,615
|
|
|||||||
|
Corporate debt, multiple observable inputs
|
—
|
|
1,404,020
|
|
—
|
|
1,404,020
|
|
|||||||
|
Corporate debt, limited observable inputs:
|
|
||||||||||||||
|
Other corporate debt, NRSRO ratings available
|
—
|
|
—
|
|
10,474
|
|
10,474
|
|
|||||||
|
Other corporate debt, NRSRO ratings not available
|
—
|
|
—
|
|
2,607
|
|
2,607
|
|
|||||||
|
Residential mortgage-backed securities
|
—
|
|
276,056
|
|
—
|
|
276,056
|
|
|||||||
|
Agency commercial mortgage-backed securities
|
—
|
|
15,493
|
|
—
|
|
15,493
|
|
|||||||
|
Other commercial mortgage-backed securities
|
—
|
|
51,063
|
|
—
|
|
51,063
|
|
|||||||
|
Other asset-backed securities
|
—
|
|
111,855
|
|
4,769
|
|
116,624
|
|
|||||||
|
Equity securities
|
|
||||||||||||||
|
Financial
|
79,341
|
|
—
|
|
—
|
|
79,341
|
|
|||||||
|
Utilities/Energy
|
25,629
|
|
—
|
|
—
|
|
25,629
|
|
|||||||
|
Consumer oriented
|
65,670
|
|
—
|
|
—
|
|
65,670
|
|
|||||||
|
Industrial
|
55,460
|
|
—
|
|
—
|
|
55,460
|
|
|||||||
|
Bond funds
|
55,196
|
|
—
|
|
—
|
|
55,196
|
|
|||||||
|
All other
|
33,186
|
|
—
|
|
—
|
|
33,186
|
|
|||||||
|
Short-term investments
|
131,199
|
|
60
|
|
—
|
|
131,259
|
|
|||||||
|
Financial instruments carried at fair value, classified as a part of:
|
|||||||||||||||
|
Investment in unconsolidated subsidiaries
|
—
|
|
—
|
|
133,250
|
|
133,250
|
|
|||||||
|
Other investments
|
$
|
6,050
|
|
$
|
22,908
|
|
$
|
—
|
|
$
|
28,958
|
|
|||
|
Total assets
|
$
|
451,731
|
|
$
|
3,145,120
|
|
$
|
156,125
|
|
$
|
3,752,976
|
|
|||
121
ProAssurance Corporation and Subsidiaries
Notes to Consolidated Financial Statements
December 31, 2014
|
December 31, 2013
|
|||||||||||||||
|
Fair Value Measurements Using
|
Total
|
||||||||||||||
|
(In thousands)
|
Level 1
|
Level 2
|
Level 3
|
Fair Value
|
|||||||||||
|
Assets:
|
|||||||||||||||
|
Fixed maturities, available for sale
|
|||||||||||||||
|
U.S. Treasury obligations
|
$
|
—
|
|
$
|
170,714
|
|
$
|
—
|
|
$
|
170,714
|
|
|||
|
U.S. Government-sponsored enterprise obligations
|
—
|
|
32,768
|
|
—
|
|
32,768
|
|
|||||||
|
State and municipal bonds
|
—
|
|
1,147,328
|
|
7,338
|
|
1,154,666
|
|
|||||||
|
Corporate debt, multiple observable inputs
|
—
|
|
1,346,977
|
|
—
|
|
1,346,977
|
|
|||||||
|
Corporate debt, limited observable inputs:
|
|
||||||||||||||
|
Other corporate debt, NRSRO ratings available
|
—
|
|
—
|
|
11,449
|
|
11,449
|
|
|||||||
|
Other corporate debt, NRSRO ratings not available
|
—
|
|
—
|
|
2,727
|
|
2,727
|
|
|||||||
|
Residential mortgage-backed securities
|
—
|
|
235,614
|
|
—
|
|
235,614
|
|
|||||||
|
Agency commercial mortgage-backed securities
|
—
|
|
27,475
|
|
—
|
|
27,475
|
|
|||||||
|
Other commercial mortgage-backed securities
|
—
|
|
61,390
|
|
—
|
|
61,390
|
|
|||||||
|
Other asset-backed securities
|
—
|
|
67,455
|
|
6,814
|
|
74,269
|
|
|||||||
|
Equity securities
|
|
||||||||||||||
|
Financial
|
81,536
|
|
—
|
|
—
|
|
81,536
|
|
|||||||
|
Utilities/Energy
|
32,350
|
|
—
|
|
—
|
|
32,350
|
|
|||||||
|
Consumer oriented
|
66,461
|
|
—
|
|
—
|
|
66,461
|
|
|||||||
|
Industrial
|
57,262
|
|
—
|
|
—
|
|
57,262
|
|
|||||||
|
All other
|
15,932
|
|
—
|
|
—
|
|
15,932
|
|
|||||||
|
Short-term investments
|
248,605
|
|
|
|
|
|
248,605
|
|
|||||||
|
Financial instruments carried at fair value, classified as a part of:
|
|
||||||||||||||
|
Investment in unconsolidated subsidiaries
|
—
|
|
—
|
|
72,062
|
|
72,062
|
|
|||||||
|
Total assets
|
$
|
502,146
|
|
$
|
3,089,721
|
|
$
|
100,390
|
|
$
|
3,692,257
|
|
|||
The fair values for securities included in the Level 2 category, with the few exceptions described below, were developed by one of several third party, nationally recognized pricing services, including services that price only certain types of securities. Each service uses complex methodologies to determine values for securities and subject the values they develop to quality control reviews. Management selected a primary source for each type of security in the portfolio, and reviewed the values provided for reasonableness by comparing data to alternate pricing services and to available market and trade data. Values that appeared inconsistent were further reviewed for appropriateness. If a value did not appear reasonable, the valuation was discussed with the service that provided the value and would have been adjusted, if necessary. No such adjustments were necessary at
December 31, 2014
or
2013
.
Level 2 Valuations
Below is a summary description of the valuation methodologies primarily used by the pricing services for securities in the Level 2 category, by security type:
U.S. Treasury obligations
were valued based on quoted prices for identical assets, or, in markets that are not active, quotes for similar assets, taking into consideration adjustments for variations in contractual cash flows and yields to maturity.
U.S. Government-sponsored enterprise obligations
were valued using pricing models that consider current and historical market data, normal trading conventions, credit ratings, and the particular structure and characteristics of the security being valued such as yield to maturity, redemption options, and contractual cash flows. Adjustments to model inputs or model results were included in the valuation process when necessary to reflect recent regulatory, government or corporate actions or significant economic, industry or geographic events affecting the security’s fair value.
State and municipal bonds
were valued using a series of matrices that considered credit ratings, the structure of the security, the sector in which the security falls, yields, and contractual cash flows. Valuations were further adjusted, when necessary, to reflect the expected effect on fair value of recent significant economic or geographic events or ratings changes.
122
ProAssurance Corporation and Subsidiaries
Notes to Consolidated Financial Statements
December 31, 2014
Corporate debt with multiple observable inputs
consisted primarily of corporate bonds, but also included a small number of bank loans. The methodology used to value Level 2 corporate bonds was the same as the methodology previously described for U.S. Government-sponsored enterprise obligations. Bank loans were valued by an outside vendor based upon a widely distributed, loan-specific listing of average bid and ask prices published daily by an investment industry group. The publisher of the listing derived the averages from data received from multiple market-makers for bank loans
.
Residential and commercial mortgage backed securities
. Agency pass-through securities were valued using a pricing matrix which considers the issuer type, coupon rate and longest cash flows outstanding. The matrix used was based on the most recently available market information. Agency and non-agency collateralized mortgage obligations were both valued using models that consider the structure of the security, current and historical information regarding prepayment speeds, ratings and ratings updates, and current and historical interest rate and interest rate spread data.
Other asset-backed securities
were valued using models that consider the structure of the security, monthly payment information, current and historical information regarding prepayment speeds, ratings and ratings updates, and current and historical interest rate and interest rate spread data. Spreads and prepayment speeds considered collateral type.
Short-term investments
are securities maturing within one year, carried at cost which approximated the fair value of the security due to the short term to maturity.
Other investments
consisted of convertible bonds valued using a pricing model that incorporated selected dealer quotes as well as current market data regarding equity prices and risk free rates. If dealer quotes were unavailable for the security being valued, quotes for securities with similar terms and credit status were used in the pricing model. Dealer quotes selected for use were those considered most accurate based on parameters such as underwriter status and historical reliability.
Level 3 Valuations
Below is a summary description of the valuation processes and methodologies used as well as quantitative information regarding securities in the Level 3 category.
Level 3 Valuation Processes
|
•
|
Level 3 securities are priced by the Chief Investment Officer.
|
|
•
|
Level 3 valuations are computed quarterly. Prices are evaluated quarterly against prior period prices and the expected change in price.
|
|
•
|
Exclusive of Investments in unconsolidated subsidiaries, which are valued at NAV, the securities noted in the disclosure are primarily NRSRO rated debt instruments for which comparable market inputs are commonly available for evaluating the securities in question. Valuation of these debt instruments is not overly sensitive to changes in the unobservable inputs used.
|
123
ProAssurance Corporation and Subsidiaries
Notes to Consolidated Financial Statements
December 31, 2014
Level 3 Valuation Methodologies
State and municipal bonds
consisted of auction rate municipal bonds valued internally using either published quotes for similar securities or values produced by discounted cash flow models using yields currently available on fixed rate securities with a similar term and collateral, adjusted to consider the effect of a floating rate and a premium for illiquidity. At
December 31, 2014
,
100%
of the securities were rated; the average rating was
A-
.
Corporate debt with limited observable inputs
consisted of corporate bonds valued using dealer quotes for similar securities or discounted cash flow models using yields currently available for similar securities. Similar securities are defined as securities of comparable credit quality that have like terms and payment features. Assessments of credit quality were based on NRSRO ratings, if available, or were subjectively determined by management if not available. At
December 31, 2014
, the average rating of rated securities was
A-
.
Other asset-backed securities
consisted of securitizations of receivables valued using dealer quotes for similar securities or discounted cash flow models using yields currently available for similar securities.
Investment in unconsolidated subsidiaries
consisted of limited partnership (LP) and limited liability company (LLC) interests valued using the NAV provided by the LP/LLC, which approximated the fair value of the interest.
Such interests include the following:
|
|
Unfunded
Commitments |
Fair Value
|
||||||
|
(In thousands)
|
December 31,
2014 |
December 31,
2014 |
December 31,
2013 |
|||||
|
Investments in LPs/LLCs:
|
||||||||
|
Private debt funds (1)
|
$27,578
|
$
|
37,296
|
|
$
|
13,233
|
|
|
|
Long equity fund (2)
|
None
|
6,747
|
|
6,574
|
|
|||
|
Long/Short equity funds (3)
|
None
|
25,301
|
|
28,385
|
|
|||
|
Non-public equity funds (4)
|
$66,545
|
51,811
|
|
23,870
|
|
|||
|
Multi-strategy fund of funds (5)
|
None
|
8,271
|
|
—
|
|
|||
|
Structured credit fund (6)
|
None
|
3,824
|
|
—
|
|
|||
|
$
|
133,250
|
|
$
|
72,062
|
|
|||
|
(1)
|
Comprised of interests in two unrelated LP funds that are structured to provide interest distributions primarily through diversified portfolios of private debt instruments. One LP allows redemption by special consent; the other does not permit redemption. Income and capital are to be periodically distributed at the discretion of the LPs over an anticipated time frame that spans from
3
to
8
years.
|
|
(2)
|
This fund is an LP that holds long equities of public international companies. Redemptions are allowed at the end of any calendar month with a prior notice requirement of
15 days
and are paid within
10 days
of the end of the calendar month of the redemption request.
|
|
(3)
|
Comprised of interests in multiple unrelated LP funds. The funds hold primarily long and short North American equities, and target absolute returns using strategies designed to take advantage of event-driven market opportunities. The funds generally permit quarterly or semi-annual redemptions of the investors' existing capital balance with notice requirements of
30
to
90
days. For some funds, redemptions above specified thresholds (lowest threshold is
90%
) may be only partially payable until after a fund audit is completed and are then payable within
30 days
.
|
|
(4)
|
Comprised of interests in three unrelated LP funds, each structured to provide capital appreciation through diversified investments in private equity, which can include investments in buyout, venture capital, mezzanine debt, distressed debt and other private equity-oriented LPs. One LP allows redemption by special consent; the others do not permit redemption. Income and capital are to be periodically distributed at the discretion of the LP over time frames that are anticipated to span up to
9
years.
|
124
ProAssurance Corporation and Subsidiaries
Notes to Consolidated Financial Statements
December 31, 2014
|
(5)
|
This fund is an LLC structured to build and manage low volatility, multi-manager portfolios that have little or no correlation to the broader fixed income and equity security markets. Redemptions are not permitted but the LLC Board is permitted discretion to periodically extend offers to repurchase units of the LLC.
|
|
(6)
|
This fund is an LP seeking to obtain superior risk-adjusted absolute returns by acquiring and actively managing a diversified portfolio of debt securities, including bonds, loans and other asset-backed instruments. Redemptions are allowed at any quarter-end with a prior notice requirement of
90 days
.
|
ProAssurance may not sell, transfer or assign its interest in any of the above LPs/LLCs without special consent from the LPs/LLCs.
Quantitative Information Regarding Level 3 Valuations
|
Quantitative Information about Level 3 Fair Value Measurements
|
||||||||||
|
Fair Value at
|
||||||||||
|
(In millions)
|
December 31, 2014
|
December 31, 2013
|
Valuation Technique
|
Unobservable Input
|
Range
(Weighted Average) |
|||||
|
Assets:
|
||||||||||
|
State and municipal bonds
|
$5.0
|
$7.3
|
Market Comparable
Securities |
Comparability Adjustment
|
0% - 10% (5%)
|
|||||
|
Discounted Cash Flows
|
Comparability Adjustment
|
0% - 10% (5%)
|
||||||||
|
Corporate debt with limited observable inputs
|
$13.1
|
$14.2
|
Market Comparable
Securities |
Comparability Adjustment
|
0% - 5% (2.5%)
|
|||||
|
Discounted Cash Flows
|
Comparability Adjustment
|
0% - 5% (2.5%)
|
||||||||
|
Other asset-backed securities
|
$4.8
|
$6.8
|
Market Comparable
Securities |
Comparability Adjustment
|
0% - 5% (2.5%)
|
|||||
|
Discounted Cash Flows
|
Comparability Adjustment
|
0% - 5% (2.5%)
|
||||||||
The significant unobservable inputs used in the fair value measurement of the above listed securities were the valuations of comparable securities with similar issuers, credit quality and maturity. Changes in the availability of comparable securities could result in changes in the fair value measurements.
125
ProAssurance Corporation and Subsidiaries
Notes to Consolidated Financial Statements
December 31, 2014
Fair Value Measurements - Level 3 Assets
The following tables (the Level 3 Tables) present summary information regarding changes in the fair value of assets measured at fair value using Level 3 inputs.
|
|
December 31, 2014
|
||||||||||||||||||||||
|
|
Level 3 Fair Value Measurements – Assets
|
||||||||||||||||||||||
|
(In thousands)
|
U.S. Government-sponsored Enterprise Obligations
|
State and Municipal Bonds
|
Corporate Debt
|
Asset-backed Securities
|
Investment in Unconsolidated Subsidiaries
|
Total
|
|||||||||||||||||
|
Balance December 31, 2013
|
$
|
—
|
|
$
|
7,338
|
|
$
|
14,176
|
|
$
|
6,814
|
|
$
|
72,062
|
|
$
|
100,390
|
|
|||||
|
Total gains (losses) realized and unrealized:
|
|||||||||||||||||||||||
|
Included in earnings, as a part of:
|
|||||||||||||||||||||||
|
Net investment income
|
—
|
|
(14
|
)
|
65
|
|
—
|
|
—
|
|
51
|
|
|||||||||||
|
Equity in earnings of unconsolidated subsidiaries
|
—
|
|
—
|
|
—
|
|
—
|
|
10,538
|
|
10,538
|
|
|||||||||||
|
Net realized investment gains (losses)
|
—
|
|
(95
|
)
|
3
|
|
—
|
|
—
|
|
(92
|
)
|
|||||||||||
|
Included in other comprehensive income
|
1
|
|
(29
|
)
|
688
|
|
59
|
|
—
|
|
719
|
|
|||||||||||
|
Purchases
|
1,000
|
|
1,861
|
|
2,000
|
|
3,340
|
|
56,340
|
|
64,541
|
|
|||||||||||
|
Sales
|
—
|
|
(1,731
|
)
|
(1,826
|
)
|
(61
|
)
|
(5,690
|
)
|
(9,308
|
)
|
|||||||||||
|
Transfers in
|
—
|
|
2,119
|
|
—
|
|
305
|
|
—
|
|
2,424
|
|
|||||||||||
|
Transfers out
|
(1,001
|
)
|
(4,424
|
)
|
(2,025
|
)
|
(5,688
|
)
|
—
|
|
(13,138
|
)
|
|||||||||||
|
Balance December 31, 2014
|
$
|
—
|
|
$
|
5,025
|
|
$
|
13,081
|
|
$
|
4,769
|
|
$
|
133,250
|
|
$
|
156,125
|
|
|||||
|
Change in unrealized gains (losses) included in earnings for the above period for Level 3 assets held at period-end
|
$
|
—
|
|
$
|
—
|
|
$
|
—
|
|
$
|
—
|
|
$
|
10,538
|
|
$
|
10,538
|
|
|||||
|
|
December 31, 2013
|
||||||||||||||||||||||
|
|
Level 3 Fair Value Measurements – Assets
|
||||||||||||||||||||||
|
(In thousands)
|
U.S. Government-sponsored Enterprise Obligations
|
State and Municipal Bonds
|
Corporate Debt
|
Asset-backed Securities
|
Investment in Unconsolidated Subsidiaries
|
Total
|
|||||||||||||||||
|
Balance December 31, 2012
|
$
|
—
|
|
$
|
7,175
|
|
$
|
15,191
|
|
$
|
4,035
|
|
$
|
33,739
|
|
$
|
60,140
|
|
|||||
|
Total gains (losses) realized and unrealized:
|
|||||||||||||||||||||||
|
Included in earnings, as a part of:
|
|||||||||||||||||||||||
|
Net investment income
|
—
|
|
—
|
|
(103
|
)
|
(17
|
)
|
—
|
|
(120
|
)
|
|||||||||||
|
Equity in earnings of unconsolidated subsidiaries
|
—
|
|
—
|
|
—
|
|
—
|
|
6,877
|
|
6,877
|
|
|||||||||||
|
Net realized investment gains (losses)
|
—
|
|
(44
|
)
|
(69
|
)
|
—
|
|
—
|
|
(113
|
)
|
|||||||||||
|
Included in other comprehensive income
|
—
|
|
1
|
|
(725
|
)
|
(61
|
)
|
—
|
|
(785
|
)
|
|||||||||||
|
Purchases
|
—
|
|
—
|
|
9,470
|
|
1,356
|
|
24,567
|
|
35,393
|
|
|||||||||||
|
Sales
|
—
|
|
(2,106
|
)
|
(1,629
|
)
|
(18
|
)
|
(14,632
|
)
|
(18,385
|
)
|
|||||||||||
|
Transfers in
|
—
|
|
2,312
|
|
2,114
|
|
3,800
|
|
21,511
|
|
29,737
|
|
|||||||||||
|
Transfers out
|
—
|
|
—
|
|
(10,073
|
)
|
(2,281
|
)
|
—
|
|
(12,354
|
)
|
|||||||||||
|
Balance December 31, 2013
|
$
|
—
|
|
$
|
7,338
|
|
$
|
14,176
|
|
$
|
6,814
|
|
$
|
72,062
|
|
$
|
100,390
|
|
|||||
|
Change in unrealized gains (losses) included in earnings for the above period for Level 3 assets held at period-end
|
$
|
—
|
|
$
|
—
|
|
$
|
—
|
|
$
|
—
|
|
$
|
6,877
|
|
$
|
6,877
|
|
|||||
126
ProAssurance Corporation and Subsidiaries
Notes to Consolidated Financial Statements
December 31, 2014
Transfers
There were
no
transfers between the Level 1 and Level 2 categories during
2014
. Short-term investments of
$7.2 million
were transferred from Level 2 to Level 1 as of the end of
2013
.
Transfers shown in the preceding Level 3 Tables were as of the end of the period and were to or from Level 2, unless otherwise noted.
The transfer in for Investment in unconsolidated subsidiaries reported in the Level 3 Tables for 2013 reflected an interest in an LP previously accounted for using the cost method and thus not carried at fair value. During 2013, the interest began to be accounted for using the equity method which approximates fair value.
All remaining transfers during
2014
and
2013
related to securities held for which the level of market activity for identical or nearly identical securities varies from period to period. The securities were valued using multiple observable inputs when those inputs were available; otherwise the securities were valued using limited observable inputs.
Financial Instruments - Methodologies Other Than Fair Value
The following table provides the estimated fair value of our financial instruments that, in accordance with GAAP for the type of investment, are measured using a methodology other than fair value. All fair values provided fall within the Level 3 fair value category.
|
|
December 31, 2014
|
December 31, 2013
|
|||||||||||||
|
(In thousands)
|
Carrying
Value |
Fair
Value |
Carrying
Value |
Fair
Value |
|||||||||||
|
Financial assets:
|
|||||||||||||||
|
BOLI
|
$
|
56,381
|
|
$
|
56,381
|
|
$
|
54,374
|
|
$
|
54,374
|
|
|||
|
Other investments
|
57,099
|
|
57,994
|
|
52,240
|
|
51,833
|
|
|||||||
|
Other assets
|
22,440
|
|
22,399
|
|
17,940
|
|
17,940
|
|
|||||||
|
Financial liabilities:
|
|||||||||||||||
|
Senior notes due 2023
|
$
|
250,000
|
|
$
|
276,503
|
|
$
|
250,000
|
|
$
|
262,500
|
|
|||
|
Other liabilities
|
14,656
|
|
14,645
|
|
13,303
|
|
13,303
|
|
|||||||
The fair value of the BOLI was equal to the cash surrender value associated with the policies on the valuation date.
Other investments listed in the table above include interests in certain investment fund LPs/LLCs accounted for using the cost method, investments in Federal Home Loan Bank (FHLB) common stock carried at cost, and an annuity investment carried at amortized cost. The estimated fair value of the LP/LLC interests was based on the NAVs provided by the LP/LLC managers. The estimated fair value of the FHLB common stock was based on the amount ProAssurance would receive if its membership were canceled, as the membership cannot be sold. The fair value of the annuity represents the present value of the expected future cash flows discounted using a rate available in active markets for similarly structured instruments.
Other assets and Other liabilities primarily consisted of related investment assets and liabilities associated with funded deferred compensation agreements. Fair values of the funded deferred compensation assets and liabilities were based on the NAVs of the underlying securities. Other assets also included a secured note receivable and an unsecured receivable under a revolving credit agreement. Fair value of these receivables was based on the present value of expected cash flows from the receivables, discounted at market rates on the valuation date for receivables with similar credit standings and similar payment structures. Other liabilities also included certain contractual liabilities related to prior business combinations. The fair values of the business combination liabilities were based on the present value of the expected future cash outflows, discounted at ProAssurance’s assumed incremental borrowing rate on the valuation date for unsecured liabilities with similar repayment structures.
The fair value of the long-term debt was estimated based on the present value of expected future cash outflows, discounted at rates available on the valuation date for similar debt issued by entities with a similar credit standing to ProAssurance.
127
ProAssurance Corporation and Subsidiaries
Notes to Consolidated Financial Statements
December 31, 2014
4. Investments
Available-for-sale securities at
December 31, 2014
and
December 31, 2013
included the following:
|
December 31, 2014
|
|||||||||||||||
|
(In thousands)
|
Amortized
Cost |
Gross Unrealized Gains
|
Gross Unrealized Losses
|
|
Estimated Fair Value
|
||||||||||
|
Fixed maturities
|
|||||||||||||||
|
U.S. Treasury obligations
|
$
|
163,714
|
|
$
|
3,785
|
|
$
|
987
|
|
$
|
166,512
|
|
|||
|
U.S. Government-sponsored enterprise obligations
|
38,022
|
|
1,641
|
|
100
|
|
39,563
|
|
|||||||
|
State and municipal bonds
|
1,015,555
|
|
47,395
|
|
335
|
|
1,062,615
|
|
|||||||
|
Corporate debt
|
1,389,970
|
|
44,234
|
|
17,103
|
|
1,417,101
|
|
|||||||
|
Residential mortgage-backed securities
|
266,306
|
|
10,198
|
|
448
|
|
276,056
|
|
|||||||
|
Agency commercial mortgage-backed securities
|
15,344
|
|
208
|
|
59
|
|
15,493
|
|
|||||||
|
Other commercial mortgage-backed securities
|
50,025
|
|
1,137
|
|
99
|
|
51,063
|
|
|||||||
|
Other asset-backed securities
|
116,541
|
|
288
|
|
205
|
|
116,624
|
|
|||||||
|
$
|
3,055,477
|
|
$
|
108,886
|
|
$
|
19,336
|
|
$
|
3,145,027
|
|
||||
|
|
December 31, 2013
|
||||||||||||||
|
(In thousands)
|
Amortized
Cost |
Gross Unrealized Gains
|
Gross Unrealized Losses
|
|
Estimated Fair Value
|
||||||||||
|
Fixed maturities
|
|||||||||||||||
|
U.S. Treasury obligations
|
$
|
166,115
|
|
$
|
6,118
|
|
$
|
1,519
|
|
$
|
170,714
|
|
|||
|
U.S. Government-sponsored enterprise obligations
|
30,942
|
|
2,251
|
|
425
|
|
32,768
|
|
|||||||
|
State and municipal bonds
|
1,116,060
|
|
46,533
|
|
7,927
|
|
1,154,666
|
|
|||||||
|
Corporate debt
|
1,321,838
|
|
53,059
|
|
13,744
|
|
1,361,153
|
|
|||||||
|
Residential mortgage-backed securities
|
230,861
|
|
7,608
|
|
2,855
|
|
235,614
|
|
|||||||
|
Agency commercial mortgage-backed securities
|
27,268
|
|
343
|
|
136
|
|
27,475
|
|
|||||||
|
Other commercial mortgage-backed securities
|
59,066
|
|
2,491
|
|
167
|
|
61,390
|
|
|||||||
|
Other asset-backed securities
|
74,106
|
|
487
|
|
324
|
|
74,269
|
|
|||||||
|
$
|
3,026,256
|
|
$
|
118,890
|
|
$
|
27,097
|
|
$
|
3,118,049
|
|
||||
128
ProAssurance Corporation and Subsidiaries
Notes to Consolidated Financial Statements
December 31, 2014
The recorded cost basis and estimated fair value of available-for-sale fixed maturities at
December 31, 2014
, by contractual maturity, are shown below. Actual maturities may differ from contractual maturities because borrowers may have the right to call or prepay obligations with or without call or prepayment penalties.
|
(In thousands)
|
Amortized
Cost |
Due in one
year or less |
Due after
one year through five years |
Due after
five years through ten years |
Due after
ten years |
Total Fair
Value |
|||||||||||||||||
|
Fixed maturities, available for sale
|
|||||||||||||||||||||||
|
U.S. Treasury obligations
|
$
|
163,714
|
|
$
|
9,584
|
|
$
|
113,489
|
|
$
|
39,264
|
|
$
|
4,175
|
|
$
|
166,512
|
|
|||||
|
U.S. Government-sponsored enterprise obligations
|
38,022
|
|
3,641
|
|
25,286
|
|
10,287
|
|
349
|
|
39,563
|
|
|||||||||||
|
State and municipal bonds
|
1,015,555
|
|
44,334
|
|
380,741
|
|
453,275
|
|
184,265
|
|
1,062,615
|
|
|||||||||||
|
Corporate debt
|
1,389,970
|
|
115,301
|
|
711,806
|
|
566,585
|
|
23,409
|
|
1,417,101
|
|
|||||||||||
|
Residential mortgage-backed securities
|
266,306
|
|
|
|
|
|
276,056
|
|
|||||||||||||||
|
Agency commercial mortgage-backed securities
|
15,344
|
|
|
|
|
|
15,493
|
|
|||||||||||||||
|
Other commercial mortgage-backed securities
|
50,025
|
|
|
|
|
|
51,063
|
|
|||||||||||||||
|
Other asset-backed securities
|
116,541
|
|
|
|
|
|
116,624
|
|
|||||||||||||||
|
$
|
3,055,477
|
|
$
|
3,145,027
|
|
||||||||||||||||||
Excluding obligations of the U.S. Government or U.S. Government-sponsored enterprises,
no
investment in any entity or its affiliates exceeded
10%
of shareholders’ equity at
December 31, 2014
.
Cash and securities with a carrying value of
$49.3 million
at
December 31, 2014
were on deposit with various state insurance departments to meet regulatory requirements.
As a member of Lloyd's and a capital provider to Syndicate 1729, ProAssurance is required to maintain capital at Lloyd's, referred to as Funds at Lloyd's (FAL). ProAssurance investments at
December 31, 2014
included fixed maturities with a fair value of
$85.0 million
and short term investments with a fair value of approximately
$0.2 million
on deposit with Lloyd's in order to satisfy these FAL requirements.
BOLI
ProAssurance holds BOLI policies on management employees that are carried at the current cash surrender value of the policies (original cost
$33 million
). The primary purpose of the program is to offset future employee benefit expenses through earnings on the cash value of the policies. ProAssurance is the owner and principal beneficiary of these policies.
Other Investments
Other investments at
December 31, 2014
and
December 31, 2013
was comprised as follows:
|
(In thousands)
|
December 31,
2014 |
December 31,
2013 |
|||||
|
Investments in LPs/LLCs, at cost
|
$
|
53,258
|
|
$
|
47,258
|
|
|
|
Convertible securities, at fair value, see Note 1
|
28,958
|
|
—
|
|
|||
|
Other, principally FHLB capital stock, at cost
|
3,841
|
|
4,982
|
|
|||
|
$
|
86,057
|
|
$
|
52,240
|
|
||
FHLB capital stock is not marketable, but may be liquidated by terminating membership in the FHLB. The liquidation process can take up to
five years
.
129
ProAssurance Corporation and Subsidiaries
Notes to Consolidated Financial Statements
December 31, 2014
Unconsolidated Subsidiaries
ProAssurance holds investments in unconsolidated subsidiaries, accounted for under the equity method. The investments include the following:
|
|
December 31, 2014
|
Carrying Value
|
||||||||||||
|
(In thousands)
|
Unfunded
Commitments* |
Percentage
Ownership |
December 31,
2014 |
December 31,
2013 |
||||||||||
|
Investment in LPs/LLCs:
|
||||||||||||||
|
Tax credit partnerships
|
$
|
15,537
|
|
See below
|
$
|
133,143
|
|
$
|
142,174
|
|
||||
|
Private debt funds
|
27,578
|
|
<
|
20%
|
37,296
|
|
13,233
|
|
||||||
|
Long equity fund
|
None
|
|
<
|
20%
|
6,747
|
|
6,574
|
|
||||||
|
Long/short equity funds
|
None
|
|
<
|
25%
|
25,301
|
|
28,385
|
|
||||||
|
Non-public equity funds
|
80,070
|
|
<
|
20%
|
58,128
|
|
23,870
|
|
||||||
|
Multi-strategy fund of funds
|
—
|
|
<
|
20%
|
8,271
|
|
—
|
|
||||||
|
Structured credit fund
|
—
|
|
<
|
20%
|
3,824
|
|
—
|
|
||||||
|
Real estate fund
|
6,526
|
|
<
|
20%
|
3,791
|
|
—
|
|
||||||
|
$
|
276,501
|
|
$
|
214,236
|
|
|||||||||
|
* Unfunded commitments are included in the carrying value of tax credit partnerships only.
|
||||||||||||||
Tax credit partnership interests held by ProAssurance generate investment returns by providing tax benefits to fund investors in the form of project operating losses and tax credits. The related properties are all qualified affordable housing projects. ProAssurance's ownership percentage relative to
two
of the tax credit partnership interests is almost
100%
; these interests had a carrying value of
$58.0 million
at
December 31, 2014
. ProAssurance's ownership percentage relative to the remaining tax credit partnership interests is less than
20%
; these interests had a carrying value of
$75.1 million
at
December 31, 2014
. All are accounted for under the equity method as ProAssurance does not have the ability to exert control over the partnerships.
The Private debt funds are structured to provide interest distributions primarily through diversified portfolios of private debt investments.
The Long equity fund targets long-term total returns through holdings in public international companies.
The Long/Short equity funds target absolute returns using strategies designed to take advantage of event-driven market opportunities.
The Non-public equity funds hold diversified private equities and are structured to provide capital appreciation.
The Multi-strategy fund of funds holds portfolios having little or no correlation to the broader fixed income and equity security markets.
The Structured credit fund seeks to obtain superior risk-adjusted absolute returns by acquiring and actively managing a diversified portfolio of debt securities.
The Real estate fund invests in multi-tenant industrial real estate with the objective of achieving superior absolute returns in all market cycles.
130
ProAssurance Corporation and Subsidiaries
Notes to Consolidated Financial Statements
December 31, 2014
Investments Held in a Loss Position
The following tables provide summarized information with respect to investments held in an unrealized loss position at
December 31, 2014
and
December 31, 2013
, including the length of time the investment had been held in a continuous unrealized loss position.
|
December 31, 2014
|
|||||||||||||||||||||||
|
|
Total
|
Less than 12 months
|
12 months or longer
|
||||||||||||||||||||
|
|
Fair
|
Unrealized
|
Fair
|
Unrealized
|
Fair
|
Unrealized
|
|||||||||||||||||
|
(In thousands)
|
Value
|
Loss
|
Value
|
Loss
|
Value
|
Loss
|
|||||||||||||||||
|
Fixed maturities, available for sale
|
|||||||||||||||||||||||
|
U.S. Treasury obligations
|
$
|
61,209
|
|
$
|
987
|
|
$
|
46,869
|
|
$
|
617
|
|
$
|
14,340
|
|
$
|
370
|
|
|||||
|
U.S. Government-sponsored enterprise obligations
|
6,268
|
|
100
|
|
2,775
|
|
44
|
|
3,493
|
|
56
|
|
|||||||||||
|
State and municipal bonds
|
39,831
|
|
335
|
|
18,910
|
|
84
|
|
20,921
|
|
251
|
|
|||||||||||
|
Corporate debt
|
423,107
|
|
17,103
|
|
326,804
|
|
13,236
|
|
96,303
|
|
3,867
|
|
|||||||||||
|
Residential mortgage-backed securities
|
45,006
|
|
448
|
|
14,406
|
|
31
|
|
30,600
|
|
417
|
|
|||||||||||
|
Agency commercial mortgage-backed securities
|
4,783
|
|
59
|
|
70
|
|
—
|
|
4,713
|
|
59
|
|
|||||||||||
|
Other commercial mortgage-backed securities
|
13,860
|
|
99
|
|
7,005
|
|
28
|
|
6,855
|
|
71
|
|
|||||||||||
|
Other asset-backed securities
|
62,577
|
|
205
|
|
59,176
|
|
109
|
|
3,401
|
|
96
|
|
|||||||||||
|
$
|
656,641
|
|
$
|
19,336
|
|
$
|
476,015
|
|
$
|
14,149
|
|
$
|
180,626
|
|
$
|
5,187
|
|
||||||
|
Other investments
|
|||||||||||||||||||||||
|
Investments in LPs/LLCs carried at cost
|
$
|
23,683
|
|
$
|
3,948
|
|
$
|
22,265
|
|
$
|
3,711
|
|
$
|
1,418
|
|
$
|
237
|
|
|||||
|
December 31, 2013
|
|||||||||||||||||||||||
|
|
Total
|
Less than 12 months
|
12 months or longer
|
||||||||||||||||||||
|
|
Fair
|
Unrealized
|
Fair
|
Unrealized
|
Fair
|
Unrealized
|
|||||||||||||||||
|
(In thousands)
|
Value
|
Loss
|
Value
|
Loss
|
Value
|
Loss
|
|||||||||||||||||
|
Fixed maturities, available for sale
|
|||||||||||||||||||||||
|
U.S. Treasury obligations
|
$
|
47,668
|
|
$
|
1,519
|
|
$
|
44,304
|
|
$
|
1,182
|
|
$
|
3,364
|
|
$
|
337
|
|
|||||
|
U.S. Goverment-sponsored enterprise obligations
|
$
|
6,640
|
|
$
|
425
|
|
$
|
5,752
|
|
$
|
321
|
|
$
|
888
|
|
$
|
104
|
|
|||||
|
State and municipal bonds
|
203,970
|
|
7,927
|
|
184,401
|
|
6,640
|
|
19,569
|
|
1,287
|
|
|||||||||||
|
Corporate debt
|
349,277
|
|
13,744
|
|
324,510
|
|
12,061
|
|
24,767
|
|
1,683
|
|
|||||||||||
|
Residential mortgage-backed securities
|
93,608
|
|
2,855
|
|
84,045
|
|
2,393
|
|
9,563
|
|
462
|
|
|||||||||||
|
Agency commercial mortgage-backed securities
|
11,658
|
|
136
|
|
11,082
|
|
116
|
|
576
|
|
20
|
|
|||||||||||
|
Other commercial mortgage-backed securities
|
11,153
|
|
167
|
|
10,215
|
|
159
|
|
938
|
|
8
|
|
|||||||||||
|
Other asset-backed securities
|
25,539
|
|
324
|
|
21,804
|
|
77
|
|
3,735
|
|
247
|
|
|||||||||||
|
$
|
749,513
|
|
$
|
27,097
|
|
$
|
686,113
|
|
$
|
22,949
|
|
$
|
63,400
|
|
$
|
4,148
|
|
||||||
|
Other investments
|
|||||||||||||||||||||||
|
Investments in LPs/LLCs carried at cost
|
$
|
14,752
|
|
$
|
1,059
|
|
$
|
13,166
|
|
$
|
1,018
|
|
$
|
1,586
|
|
$
|
41
|
|
|||||
As of
December 31, 2014
, excluding U.S. government backed securities, there were
588
debt securities (
20.5%
of all available-for-sale fixed maturity securities held) in an unrealized loss position representing
434
issuers. The greatest and second greatest unrealized loss position among those securities were approximately
$1.7 million
and
$0.7 million
, respectively. The securities were evaluated for impairment as of
December 31, 2014
.
131
ProAssurance Corporation and Subsidiaries
Notes to Consolidated Financial Statements
December 31, 2014
As of
December 31, 2013
, excluding U.S. government backed securities, there were
714
debt securities (
26.3%
of all available-for-sale fixed maturity securities held) in an unrealized loss position representing
516
issuers. Both the greatest and the second greatest unrealized loss position among those securities approximated
$0.4 million
. The securities were evaluated for impairment as of
December 31, 2013
.
Each quarter, ProAssurance performs a detailed analysis for the purpose of assessing whether any of the securities it holds in an unrealized loss position have suffered an other-than-temporary impairment in value. A detailed discussion of the factors considered in the assessment is included in Note 1.
Fixed maturity securities held in an unrealized loss position at
December 31, 2014
, excluding asset-backed securities, have paid all scheduled contractual payments and are expected to continue doing so. Expected future cash flows of asset-backed securities held in an unrealized loss position were estimated as part of the
December 31, 2014
impairment evaluation using the most recently available six-month historical performance data for the collateral (loans) underlying the security or, if historical data was not available, sector based assumptions, and equaled or exceeded the current amortized cost basis of the security.
Net Investment Income
Net investment income by investment category was as follows:
|
Year Ended December 31
|
|||||||||||
|
(In thousands)
|
2014
|
2013
|
2012
|
||||||||
|
Fixed maturities
|
$
|
111,895
|
|
$
|
122,065
|
|
$
|
133,088
|
|
||
|
Equities
|
10,817
|
|
9,454
|
|
6,947
|
|
|||||
|
Short-term and Other investments
|
8,833
|
|
2,584
|
|
660
|
|
|||||
|
Business owned life insurance
|
2,006
|
|
1,960
|
|
2,008
|
|
|||||
|
Investment fees and expenses
|
(7,994
|
)
|
(6,798
|
)
|
(6,609
|
)
|
|||||
|
Net investment income
|
$
|
125,557
|
|
$
|
129,265
|
|
$
|
136,094
|
|
||
Equity in Earnings (Loss) from Unconsolidated Subsidiaries
Equity in earnings (loss) from unconsolidated subsidiaries included losses due to amortization resulting from the allocable portion of the projected operating losses of qualified affordable housing project tax credits investments of
$10.7 million
,
$10.1 million
and
$6.4 million
for the years ended
December 31, 2014
,
2013
and
2012
, respectively.
During 2013, ProAssurance's interest in one of its LPs increased and ProAssurance therefore determined it appropriate to begin applying the equity method of accounting instead of the previously applied cost method. Under GAAP such a change from the cost to the equity method should be made on a retroactive basis with restatement of prior periods. ProAssurance did not restate prior periods related to this method change as the amounts were not material to 2013 or any of the prior periods affected. Accordingly, Equity in earnings (loss) of unconsolidated subsidiaries for 2013 included ProAssurance's portion of the LP’s accumulated earnings from the date of initial investment, which totaled
$10.5 million
, of which
$8.4 million
was related to prior periods.
132
ProAssurance Corporation and Subsidiaries
Notes to Consolidated Financial Statements
December 31, 2014
Net Realized Investment Gains (Losses)
The following table provides detailed information regarding net realized investment gains (losses):
|
Year Ended December 31
|
|||||||||||
|
(In thousands)
|
2014
|
2013
|
2012
|
||||||||
|
Total other-than-temporary impairment losses:
|
|||||||||||
|
State and municipal bonds
|
$
|
(50
|
)
|
$
|
(71
|
)
|
$
|
—
|
|
||
|
Residential mortgage-backed securities
|
—
|
|
—
|
|
(557
|
)
|
|||||
|
Corporate debt
|
(1,425
|
)
|
—
|
|
(878
|
)
|
|||||
|
Other investments
|
—
|
|
—
|
|
(131
|
)
|
|||||
|
Portion recognized in (reclassified from) Other Comprehensive Income:
|
|||||||||||
|
Corporate debt
|
268
|
|
—
|
|
(201
|
)
|
|||||
|
Net impairments recognized in earnings
|
(1,207
|
)
|
(71
|
)
|
(1,767
|
)
|
|||||
|
Gross realized gains, available-for-sale securities
|
5,627
|
|
18,130
|
|
18,645
|
|
|||||
|
Gross realized (losses), available-for-sale securities
|
(1,103
|
)
|
(7,031
|
)
|
(2,076
|
)
|
|||||
|
Net realized gains (losses), trading securities
|
28,018
|
|
20,444
|
|
1,485
|
|
|||||
|
Net realized gains (losses), Other investments
|
326
|
|
—
|
|
—
|
|
|||||
|
Change in unrealized holding gains (losses), trading securities
|
(18,883
|
)
|
35,507
|
|
12,673
|
|
|||||
|
Change in unrealized holding gains (losses), convertible securities, carried at fair value
|
1,876
|
|
—
|
|
—
|
|
|||||
|
Decrease (increase) in the fair value of liabilities carried at fair value
|
—
|
|
—
|
|
(1,245
|
)
|
|||||
|
Other
|
—
|
|
925
|
|
1,148
|
|
|||||
|
Net realized investment gains (losses)
|
$
|
14,654
|
|
$
|
67,904
|
|
$
|
28,863
|
|
||
Credit-related impairments related to two corporate debt instruments were recognized during 2014. Additionally, a non-credit impairment related to one of the instruments was recognized as the fair value of the instrument was less than the expected future cash flows from the security. No significant impairment losses were recognized during
2013
. During
2012
, impairment losses were recognized related to certain residential mortgage-backed securities because carrying values for those securities were greater than the future cash flows expected to be received from the securities, and impairment losses for corporate debt securities were recognized because the credit standing of the issuers had deteriorated.
The following table presents a roll forward of cumulative credit losses recorded in earnings related to impaired debt securities for which a portion of the other-than-temporary impairment was recorded in Other comprehensive income.
|
(In thousands)
|
2014
|
2013
|
2012
|
||||||||
|
Balance January 1
|
$
|
83
|
|
$
|
3,301
|
|
$
|
5,870
|
|
||
|
Additional credit losses recognized during the period, related to securities for which:
|
|||||||||||
|
No OTTI has been previously recognized
|
149
|
|
—
|
|
—
|
|
|||||
|
OTTI has been previously recognized
|
—
|
|
—
|
|
268
|
|
|||||
|
Reductions due to:
|
|||||||||||
|
Securities sold during the period (realized)
|
—
|
|
(3,218
|
)
|
(2,837
|
)
|
|||||
|
Balance December 31
|
$
|
232
|
|
$
|
83
|
|
$
|
3,301
|
|
||
Other information regarding sales and purchases of available-for-sale securities is as follows:
|
Year Ended December 31
|
||||||||||
|
(In millions)
|
2014
|
2013
|
2012
|
|||||||
|
Proceeds from sales (exclusive of maturities and paydowns)
|
$
|
244.9
|
|
$
|
593.3
|
|
$
|
500.2
|
|
|
|
Purchases
|
$
|
645.1
|
|
$
|
519.2
|
|
$
|
646.2
|
|
|
133
ProAssurance Corporation and Subsidiaries
Notes to Consolidated Financial Statements
December 31, 2014
5. Reinsurance
ProAssurance purchases reinsurance from third-party reinsurers and insurance enterprises in order to reduce its net exposure to losses. ProAssurance also uses reinsurance arrangements as a mechanism for sharing risk with insureds or their affiliates.
The effect of reinsurance on premiums written and earned was as follows:
|
(In thousands)
|
2014 Premiums
|
2013 Premiums
|
2012 Premiums
|
|||||||||||||||||||||
|
|
Written
|
Earned
|
Written
|
Earned
|
Written
|
Earned
|
||||||||||||||||||
|
Direct
|
$
|
761,043
|
|
$
|
755,623
|
|
$
|
566,745
|
|
$
|
568,629
|
|
$
|
536,318
|
|
$
|
558,200
|
|
||||||
|
Assumed
|
18,566
|
|
12,987
|
|
802
|
|
804
|
|
113
|
|
116
|
|
||||||||||||
|
Ceded
|
(77,760
|
)
|
(68,879
|
)
|
(42,365
|
)
|
(41,514
|
)
|
(8,133
|
)
|
(7,652
|
)
|
||||||||||||
|
Net premiums
|
$
|
701,849
|
|
$
|
699,731
|
|
$
|
525,182
|
|
$
|
527,919
|
|
$
|
528,298
|
|
$
|
550,664
|
|
||||||
The Receivable from reinsurers on unpaid losses and loss adjustment expenses represents Management’s estimate of amounts that will be recoverable under ProAssurance reinsurance agreements. Most Company reinsurance agreements base the amount of premium that is due to the reinsurer in part on losses reimbursed or to be reimbursed under the agreement, and terms may also include maximum and minimum amounts of ceded premium. Ceded premium amounts are estimated based on Management’s expectation of ultimate losses and the portion of those losses that are allocable to reinsurers according to the terms of the agreements, including any minimums or maximums. Given the uncertainty of the ultimate amounts of losses, Management’s estimates of losses and related amounts recoverable may vary significantly from the eventual outcome. During the years ended
December 31, 2014
,
2013
and
2012
ProAssurance reduced premiums ceded by
$15.7 million
,
$16.4 million
and
$34.3 million
, respectively, due to changes in Management’s estimates of amounts due to reinsurers related to prior accident year loss recoveries.
Reinsurance contracts do not relieve ProAssurance from its obligations to policyholders and ProAssurance remains liable to its policyholders whether or not reinsurers honor their contractual obligations to ProAssurance. ProAssurance continually monitors its reinsurers to minimize its exposure to significant losses from reinsurer insolvencies.
At
December 31, 2014
,
$66.9 million
of the net total amounts due from reinsurers of
$259.1 million
(including receivables related to paid and unpaid losses and LAE and prepaid reinsurance premiums, less reinsurance premiums payable) was due from
three
reinsurers which had an individual balance which exceeded
$20 million
. Each of these reinsurers had an A.M. Best credit rating of
A
or above. There were no individual reinsurers having a balance that exceeded
5%
of shareholders’ equity.
At December 31, 2014 reinsurance recoverables totaling approximately
$35 million
were collateralized by letters of credit or funds withheld. ProAssurance had
no
allowance for credit losses related to its reinsurance receivables at
December 31, 2014
or
2013
as all reinsurance balances were considered collectible. During the years ended
December 31, 2014
,
2013
and
2012
no
reinsurance balances were written off for credit reasons.
There were no significant reinsurance commutations in
2014
,
2013
or
2012
.
134
ProAssurance Corporation and Subsidiaries
Notes to Consolidated Financial Statements
December 31, 2014
6. Income Taxes
Deferred income taxes reflect the net tax effects of temporary differences between the amount of assets and liabilities for financial reporting purposes and the amounts used for income tax purposes. Significant components of ProAssurance’s deferred tax assets and liabilities were as follows:
|
(In thousands)
|
2014
|
2013
|
||||||
|
Deferred tax assets
|
||||||||
|
Unpaid loss discount
|
$
|
44,002
|
|
$
|
51,879
|
|
||
|
Unearned premium adjustment
|
23,972
|
|
21,861
|
|
||||
|
Compensation related
|
18,623
|
|
18,172
|
|
||||
|
Intangibles
|
1,957
|
|
2,074
|
|
||||
|
Total deferred tax assets
|
88,554
|
|
93,986
|
|
||||
|
Deferred tax liabilities
|
||||||||
|
Deferred acquisition costs
|
9,180
|
|
10,150
|
|
||||
|
Unrealized gains on investments, net
|
31,342
|
|
32,127
|
|
||||
|
Fixed assets
|
3,689
|
|
4,166
|
|
||||
|
Basis differentials–investments
|
31,657
|
|
31,247
|
|
||||
|
Intangibles
|
27,294
|
|
13,238
|
|
||||
|
Other
|
4,210
|
|
1,301
|
|
||||
|
Total deferred tax liabilities
|
107,372
|
|
92,229
|
|
||||
|
Net deferred tax assets (liabilities)
|
$
|
(18,818
|
)
|
$
|
1,757
|
|
||
At
December 31, 2014
, ProAssurance had
no
available net operating loss carryforwards, capital loss carryforwards, or Alternative Minimum Tax credit carryforwards. ProAssurance files income tax returns in the U.S. federal jurisdiction and various states.
During 2013 the IRS issued a Notice of Proposed Adjustment (NOPA) to ProAssurance related to the 2009 and 2010 tax years. ProAssurance subsequently protested certain issues in the NOPA, all of which related to the timing of deductions. During 2014, ProAssurance and the IRS reached a final settlement on all contested issues which resulted in no additional tax liability for ProAssurance. The IRS subsequently refunded
$30.6 million
, exclusive of interest, to ProAssurance, reflecting both a refund from the settlement of non-contested issues addressed by the NOPA and the return of a protective payment made in 2013.
ProAssurance had receivables for federal income taxes of
$1.1 million
at
December 31, 2014
and
$27.3 million
at
December 31, 2013
, both carried as a part of Other Assets.
The statute of limitations is now closed for all tax years prior to 2011.
A reconciliation of the beginning and ending amounts of unrecognized tax benefits for
2014
and
2013
was as follows:
|
(In thousands)
|
2014
|
2013
|
2012
|
|||||||||
|
Balance at January 1
|
$
|
4,823
|
|
$
|
4,823
|
|
$
|
18,585
|
|
|||
|
Increase for tax position acquired as result of a business combination
|
414
|
|
—
|
|
—
|
|
||||||
|
Increases for tax positions taken during the current year
|
163
|
|
—
|
|
—
|
|
||||||
|
(Decreases) for tax positions taken during the current year
|
(4,823
|
)
|
—
|
|
(10,206
|
)
|
||||||
|
(Decreases) for tax positions taken during prior years
|
—
|
|
—
|
|
(3,556
|
)
|
||||||
|
Balance at December 31
|
$
|
577
|
|
$
|
4,823
|
|
$
|
4,823
|
|
|||
At
December 31, 2014
, all of ProAssurance's uncertain tax positions, if recognized, would affect the effective tax rate. None of ProAssurance's uncertain tax positions at
December 31, 2013
, if recognized, would have affected the effective tax rate. As with any uncertain tax position, there is a possibility that the ultimate benefit realized could differ from the estimate Management has established. Management does not expect any portion of unrecognized benefits at
December 31, 2014
to reverse during the next twelve months.
135
ProAssurance Corporation and Subsidiaries
Notes to Consolidated Financial Statements
December 31, 2014
ProAssurance recognizes interest and/or penalties related to income tax matters in income tax expense. Interest recognized in the income statement was not significant during the years ended
December 31, 2014
, and
2013
and approximated
$0.5 million
in
2012
. The accrued liability for interest was not significant at
December 31, 2014
and approximated
$1.3 million
at
December 31, 2013
.
A reconciliation of “expected” income tax expense (
35%
of income before income taxes) to actual income tax expense for each of the years ended
December 31, 2014
,
2013
and
2012
follows:
|
(In thousands)
|
2014
|
2013
|
2012
|
|||||||||
|
Computed “expected” tax expense
|
$
|
91,702
|
|
$
|
139,005
|
|
$
|
138,588
|
|
|||
|
Tax-exempt income
|
(13,250
|
)
|
(14,509
|
)
|
(14,374
|
)
|
||||||
|
Tax credits, qualified affordable housing
|
(17,918
|
)
|
(17,888
|
)
|
(10,005
|
)
|
||||||
|
Non-taxable gain on acquisition
|
—
|
|
(11,310
|
)
|
—
|
|
||||||
|
Non-U.S. Loss
|
1,741
|
|
—
|
|
—
|
|
||||||
|
Other
|
3,165
|
|
4,338
|
|
6,287
|
|
||||||
|
Total
|
$
|
65,440
|
|
$
|
99,636
|
|
$
|
120,496
|
|
|||
7. Deferred Policy Acquisition Costs
Policy acquisition costs, that are primarily and directly related to the successful production of new and renewal insurance contracts, most significantly agent commissions, premium taxes and underwriting salaries and benefits, are capitalized as policy acquisition costs and amortized to expense, net of ceding commissions earned, as the related premium revenues are earned.
Amortization of deferred policy acquisition costs was
$68.6 million
,
$53.2 million
and
$54.9 million
for the years ended
December 31, 2014
,
2013
and
2012
, respectively.
8. Reserve for Losses and Loss Adjustment Expenses
The reserve for losses is established based on estimates of individual claims and actuarially determined estimates of future losses based on ProAssurance’s past loss experience, available industry data and projections as to future claims frequency, severity, inflationary trends and settlement patterns. Estimating the reserve, particularly the reserve appropriate for liability exposures, is a complex process. Claims may be resolved over an extended period of time, often
five
years or more, and may be subject to litigation. Estimating losses requires ProAssurance to make and revise judgments and assessments regarding multiple uncertainties over an extended period of time. As a result, the reserve estimate may vary significantly from the eventual outcome. The assumptions used in establishing ProAssurance’s reserve are regularly reviewed and updated by management as new data becomes available. Changes to estimates of previously established reserves are included in earnings in the period in which the estimate is changed.
ProAssurance believes that the methods it uses to establish reserves are reasonable and appropriate. Each year, ProAssurance uses internal actuaries to review the reserve for losses of each insurance subsidiary. ProAssurance also engages consulting actuaries to review ProAssurance claims data and provide observations regarding cost trends, rate adequacy and ultimate loss costs. ProAssurance considers the views of the actuaries as well as other factors, such as known, anticipated or estimated changes in frequency and severity of claims and loss retention levels and premium rates, in establishing the amount of its reserve for losses. The statutory filings of each insurance company with the insurance regulators must be accompanied by a consulting actuary's certification as to their respective reserves in accordance with the requirements of the NAIC.
136
ProAssurance Corporation and Subsidiaries
Notes to Consolidated Financial Statements
December 31, 2014
Activity in the reserve for losses and loss adjustment expenses is summarized as follows:
|
(In thousands)
|
2014
|
2013
|
2012
|
||||||||
|
Balance, beginning of year
|
$
|
2,072,822
|
|
$
|
2,054,994
|
|
$
|
2,247,772
|
|
||
|
Less reinsurance recoverables on unpaid losses and loss adjustment expenses
|
247,518
|
|
191,645
|
|
247,658
|
|
|||||
|
Net balance, beginning of year
|
1,825,304
|
|
1,863,349
|
|
2,000,114
|
|
|||||
|
Net reserves acquired from acquisitions
|
139,549
|
|
126,007
|
|
22,464
|
|
|||||
|
Net losses:
|
|||||||||||
|
Current year
|
545,168
|
|
447,510
|
|
451,951
|
|
|||||
|
Favorable development of reserves established in prior years, net
|
(182,084
|
)
|
(222,749
|
)
|
(272,038
|
)
|
|||||
|
Total
|
363,084
|
|
224,761
|
|
179,913
|
|
|||||
|
Paid related to:
|
|||||||||||
|
Current year
|
(93,737
|
)
|
(43,616
|
)
|
(38,439
|
)
|
|||||
|
Prior years
|
(413,900
|
)
|
(345,197
|
)
|
(300,703
|
)
|
|||||
|
Total paid
|
(507,637
|
)
|
(388,813
|
)
|
(339,142
|
)
|
|||||
|
Net balance, end of year
|
1,820,300
|
|
1,825,304
|
|
1,863,349
|
|
|||||
|
Plus reinsurance recoverables on unpaid losses and loss adjustment expenses
|
237,966
|
|
247,518
|
|
191,645
|
|
|||||
|
Balance, end of year
|
$
|
2,058,266
|
|
$
|
2,072,822
|
|
$
|
2,054,994
|
|
||
As discussed in Note 1, estimating liability reserves is complex and requires the use of many assumptions. As time passes and ultimate losses for prior years are either known or become subject to a more precise estimation, ProAssurance increases or decreases the reserve estimates established in prior periods. The favorable loss development recognized in
2014
primarily reflects a lower than anticipated claims severity trend (i.e. the average size of a claim) for accident years
2007 through 2011
. The favorable development recognized in
2013
and
2012
was primarily due to lower than anticipated claims severity trends for accident years
2005 through 2011
and accident years
2004 through 2009
, respectively.
9. Commitments and Contingencies
ProAssurance is involved in various legal actions related to insurance policies and claims handling including, but not limited to, claims asserted by policyholders. These types of legal actions arise in the Company’s ordinary course of business and, in accordance with GAAP for insurance entities, are considered as a part of the Company’s loss reserving process, which is described in detail under the heading "Losses and Loss Adjustment Expenses” in the Accounting Policies section of Note 1.
ProAssurance has funding commitments primarily related to non-public investment entities totaling approximately
$169.4 million
, expected to be paid as follows:
$98.8 million
in 2015,
$69.2 million
in 2016 and 2017 combined,
$0.6 million
in 2018 and 2019 combined, and
$0.8 million
thereafter. Of these funding commitments,
$15.5 million
are related to qualified affordable housing project tax credit investments and are expected to be paid as follows:
$14.1 million
in 2015,
$0.5 million
in 2016 and 2017 combined,
$0.3 million
in 2018 and 2019 combined and
$0.6 million
thereafter.
As a member of Lloyd's and a capital provider to Syndicate 1729, ProAssurance is required to provide capital, referred to as FAL. At
December 31, 2014
, ProAssurance is satisfying the FAL requirement with investment securities on deposit with Lloyd's with a carrying value of
$85.2 million
(see Note 4). At
December 31, 2013
, the FAL requirement was primarily met through a standby letter of credit (LOC).
ProAssurance has issued an unconditional revolving credit agreement (the "Syndicate Credit Agreement") of up to
£10 million
(
$16 million
at
December 31, 2014
) to the Premium Trust Fund of Syndicate 1729 for the purpose of providing working capital. Advances under the Syndicate Credit Agreement bear interest at
8.5%
annually, and are repayable upon demand after December 31, 2016. As of
December 31, 2014
,
£6.6 million
(
$11.0 million
) had been advanced under the Syndicate Credit Agreement.
ProAssurance is involved in a number of operating leases primarily for office space and office equipment. The following is a schedule of future minimum lease payments for operating leases that had initial or remaining non-cancelable lease terms in excess of one year as of
December 31, 2014
.
137
ProAssurance Corporation and Subsidiaries
Notes to Consolidated Financial Statements
December 31, 2014
|
Operating Leases
|
|||
|
(In thousands)
|
|||
|
2015
|
$
|
5,024
|
|
|
2016
|
4,915
|
|
|
|
2017
|
3,601
|
|
|
|
2018
|
2,965
|
|
|
|
2019
|
2,572
|
|
|
|
Thereafter
|
5,232
|
|
|
|
Total minimum lease payments
|
$
|
24,309
|
|
ProAssurance incurred rent expense of
$5.0 million
,
$3.2 million
and
$2.7 million
in the years ended
December 31, 2014
,
2013
and
2012
, respectively.
ProAssurance’s outstanding long-term debt consisted of the following:
|
(In thousands)
|
December 31,
2014 |
December 31,
2013 |
|||||
|
Senior notes due 2023, unsecured, interest at 5.3% annually
|
$
|
250,000
|
|
$
|
250,000
|
|
|
|
Revolving credit agreement, outstanding borrowings not permitted to exceed $200 million aggregately, expires in 2016
|
—
|
|
—
|
|
|||
|
$
|
250,000
|
|
$
|
250,000
|
|
||
Senior Notes due 2023 (the Senior Notes)
The Senior Notes are the unsecured obligations of ProAssurance Corporation, due in full in November 2023, unless sooner redeemed, with interest payable semiannually. Redemptions may be made prior to maturity, in whole or part, at the greater of par or the sum of the present values of the outstanding principal and remaining interest payments calculated at
40
basis points above the then-current rate for U.S. Treasury Notes with a term comparable to the remaining term of the Senior Notes. There are no financial covenants associated with the Senior Notes.
Revolving Credit Agreement
ProAssurance has entered into a revolving credit agreement (the “Credit Agreement”) with five participating lenders with an expiration date of
April 15, 2016
. The Credit Agreement permits ProAssurance to borrow, repay and reborrow from the lenders during the term of the Credit Agreement. All borrowings are required to be repaid prior to the expiration date of the Credit Agreement. ProAssurance is required to pay a commitment fee, ranging from
15
to
30
basis points based on ProAssurance’s credit ratings, on the average unused portion of the credit line during the term of the Credit Agreement. Borrowings under the Credit Agreement may be secured or unsecured and accrue interest at a selected base rate, adjusted by a margin, which can vary from
0
to
188
basis points, based on ProAssurance’s credit rating and whether the borrowing is secured or unsecured. The base rate selected may either be the current one-, three- or six-month LIBOR rate, with the LIBOR term selected fixing the interest period for which the rate is effective. If LIBOR is not selected, the
base rate
defaults to the highest of (1) the
Prime rate
(2) the
Federal Funds
rate plus
50
basis points or (3) the
one month LIBOR
rate plus
100
basis points, determined daily. Rates are reset each successive interest period until the borrowing is repaid.
The Credit Agreement contains customary representations, covenants and events constituting default, and remedies for default. Additionally, the Credit Agreement carries the following financial covenants:
|
(1)
|
ProAssurance is not permitted to have a leverage ratio of Consolidated Funded Indebtedness (principally, obligations for borrowed money, obligations evidenced by instruments such as notes or acceptances, standby and commercial Letters of Credit, and contingent obligations) to Consolidated Total Capitalization (principally, total non-trade liabilities on a consolidated basis plus consolidated shareholders’ equity, exclusive of accumulated other comprehensive income) greater than
0.35
to
1.0
, determined at the end of each fiscal quarter.
|
|
(2)
|
ProAssurance is required to maintain a minimum net worth of not less than the sum of
75%
of Consolidated Net Worth (consolidated shareholders’ equity, exclusive of accumulated other comprehensive income) at December 31, 2010, plus
|
138
ProAssurance Corporation and Subsidiaries
Notes to Consolidated Financial Statements
December 31, 2014
50%
of consolidated net income earned each fiscal quarter, if positive, beginning with the quarter ending March 31, 2011, plus
100%
of net cash proceeds resulting from the issuance of ProAssurance capital stock.
Funds borrowed under the terms of the Credit Agreement will be used for general corporate purposes, including, but not limited to, use as short-term working capital, funding for share repurchases as authorized by the Board, and for support of other activities ProAssurance enters into in the normal course of business.
Covenant Compliance
ProAssurance is currently in compliance with all covenants.
Loss on Extinguishment
ProAssurance recognized a
$2.2 million
loss on extinguishment of debt during 2012 upon repayment of a note payable carried at fair value.
11. Shareholders’ Equity
At
December 31, 2014
and
2013
, ProAssurance had
100 million
shares of authorized common stock and
50 million
shares of authorized preferred stock. The Board has the authority to determine provisions for the issuance of preferred shares, including the number of shares to be issued, the designations, powers, preferences and rights, and the qualifications, limitations or restrictions of such shares. To date, the Board has not approved the issuance of preferred stock.
The following is a summary of changes in common shares issued and outstanding during the years ended
December 31, 2014
,
2013
and
2012
:
|
(In thousands of shares)
|
2014
|
2013
|
2012
|
|||||
|
Issued and outstanding shares - January 1
|
61,197
|
|
61,624
|
|
61,107
|
|
||
|
Repurchase of shares
|
(4,909
|
)
|
(681
|
)
|
—
|
|
||
|
Shares issued due to exercise of options and vesting of share-based compensation awards
|
154
|
|
169
|
|
436
|
|
||
|
Other shares issued for compensation and shares reissued to stock purchase plan*
|
92
|
|
85
|
|
81
|
|
||
|
Issued and outstanding shares - December 31
|
56,534
|
|
61,197
|
|
61,624
|
|
||
|
*
|
Shares issued were valued at fair value (the market price of a ProAssurance common share on the date of issue).
|
As of
December 31, 2014
, approximately
2.7 million
of ProAssurance's authorized common shares were reserved by the Board for award or issuance under the incentive compensation plans described in Note 12 and an additional
0.8 million
of authorized common shares were reserved for the issuance of currently outstanding restricted share and performance share unit awards and for the exercise of outstanding stock options.
ProAssurance declared cash dividends during
2014
,
2013
and
2012
as follows:
|
Cash Dividends Declared, per Share
|
||||||||||||
|
2014
|
2013
|
2012
|
||||||||||
|
First Quarter
|
$
|
0.300
|
|
$
|
0.250
|
|
$
|
0.125
|
|
|||
|
Second Quarter
|
$
|
0.300
|
|
$
|
0.250
|
|
$
|
0.125
|
|
|||
|
Third Quarter
|
$
|
0.300
|
|
$
|
0.250
|
|
$
|
0.125
|
|
|||
|
Fourth Quarter*
|
$
|
2.960
|
|
$
|
0.300
|
|
$
|
2.750
|
|
|||
* Includes special dividends of
$2.65
per share in
2014
and
$2.50
per share in
2012
.
Dividends declared during
2014
,
2013
and
2012
totaled
$220.5 million
,
$64.8 million
and
$192.5 million
, respectively. These dividends were paid in the month following the quarter in which they were declared, except for fourth quarter 2012 dividends for which payment was accelerated into December 2012.
ProAssurance's ability to pay dividends to its shareholders is limited by its holding company structure, to the extent of the net assets held by its insurance subsidiaries, as discussed in Note 17. Otherwise, there are no other regulatory restrictions on
139
ProAssurance Corporation and Subsidiaries
Notes to Consolidated Financial Statements
December 31, 2014
ProAssurance's retained earnings or net income that materially impact its ability to pay dividends. Based on Shareholders' Equity at
December 31, 2014
, total equity of
$239 million
was free of debt covenant restrictions regarding the payment of dividends. However, any decision to pay future cash dividends is subject to the Board’s final determination after a comprehensive review of financial performance, future expectations and other factors deemed relevant by the Board.
As of
December 31, 2014
Board authorizations for the repurchase of common shares or the retirement of outstanding debt of
$181.5 million
remained available for use. The timing and quantity of purchases depends upon market conditions and changes in ProAssurance's capital requirements and is subject to limitations that may be imposed on such purchases by applicable securities laws and regulations, and the rules of the New York Stock Exchange.
Other Comprehensive Income (Loss) (OCI)
For the years ended
December 31, 2014
,
2013
and
2012
, OCI was primarily comprised of unrealized gains and losses arising during the period related to available-for-sale securities, less reclassification adjustments as shown in the table below, net of tax. At
December 31, 2014
and
2013
, accumulated other comprehensive income was comprised primarily of unrealized gains and losses from available-for-sale securities, including non-credit impairment losses of
$0.8 million
and
0.5 million
, respectively, net of tax. All tax effects were computed using a
35%
rate. OCI and accumulated other comprehensive income also included immaterial amounts of foreign currency translation adjustments.
Amounts reclassified from accumulated other comprehensive income to net income and the amounts of deferred tax expense (benefit) included in OCI were as follows:
|
(In thousands)
|
2014
|
2013
|
2012
|
||||||||
|
Reclassifications from accumulated other comprehensive income to net income, available-for-sale securities:
|
|||||||||||
|
Realized investment gains (losses)
|
$
|
3,317
|
|
$
|
11,375
|
|
$
|
17,350
|
|
||
|
Non-credit impairment losses reclassified to earnings, due to sale of securities or reclassification as a credit loss
|
—
|
|
(347
|
)
|
(2,417
|
)
|
|||||
|
Total amounts reclassified, before tax effect
|
3,317
|
|
11,028
|
|
14,933
|
|
|||||
|
Tax effect (at 35%)
|
(1,161
|
)
|
(3,860
|
)
|
(5,227
|
)
|
|||||
|
Net reclassification adjustments
|
$
|
2,156
|
|
$
|
7,168
|
|
$
|
9,706
|
|
||
|
Deferred tax expense (benefit) included in OCI
|
$
|
(785
|
)
|
$
|
(46,157
|
)
|
$
|
8,262
|
|
||
140
ProAssurance Corporation and Subsidiaries
Notes to Consolidated Financial Statements
December 31, 2014
12. Share-Based Payments
Share-based compensation costs are primarily classified as underwriting, policy acquisition and operating expenses.
Since May 2013, ProAssurance has provided share-based compensation to employees under the ProAssurance Corporation Amended and Restated 2014 Equity Incentive Plan. Previously, compensation was provided under the ProAssurance Corporation 2008 Equity Incentive Plan (2009 to May 2013), and the ProAssurance Corporation 2004 Equity Incentive Plan (2005 to 2008). The Compensation Committee of the Board is responsible for the administration of each plan.
ProAssurance has provided share-based compensation to employees utilizing
four
types of awards: stock options, restricted share units, performance share units and purchase match units. The following table provides a summary of compensation expense and compensation cost that will be charged to expense in future periods, by award type, and the total related tax benefit recognized during each period. There was no compensation expense related to stock option awards in
2014
,
2013
or
2012
.
|
|
Share-Based
Compensation Expense |
Unrecognized Compensation Cost
|
||||||||||||||||
|
|
Year Ended December 31
|
December 31, 2014
|
||||||||||||||||
|
|
2014
|
2013
|
2012
|
Amount
|
Remaining
Recognition Period |
|||||||||||||
|
|
(In millions)
|
(In millions)
|
(Weighted average years)
|
|||||||||||||||
|
Restricted Share Units
|
1.7
|
|
1.6
|
|
1.6
|
|
2.0
|
|
1.8
|
|||||||||
|
Performance Share Units
|
7.6
|
|
7.1
|
|
6.7
|
|
6.3
|
|
1.7
|
|||||||||
|
Purchase Match Units
|
0.8
|
|
0.5
|
|
0.3
|
|
1.6
|
|
2.2
|
|||||||||
|
Total share-based compensation expense
|
$
|
10.1
|
|
$
|
9.2
|
|
$
|
8.6
|
|
$
|
9.9
|
|
||||||
|
Tax benefit recognized
|
$
|
3.5
|
|
$
|
3.2
|
|
$
|
3.0
|
|
|||||||||
The above awards are charged to expense as an increase to equity over the service period (generally the vesting period) associated with the award. Awards vest in their entirety at the end of a
three
-year period following the grant date based on a continuous service requirement and, for performance share units, achievement of a performance objective. Partial vesting is permitted for retirees. A ProAssurance common share is issued for each restricted, performance or purchase match unit once vesting requirements are met, except that units sufficient to satisfy required tax withholdings are paid in cash.
141
ProAssurance Corporation and Subsidiaries
Notes to Consolidated Financial Statements
December 31, 2014
Stock Options
Activity for ProAssurance stock option awards during
2014
,
2013
and
2012
is summarized below.
|
|
2014
|
2013
|
2012
|
||||||||||||||||||
|
|
Options
|
Weighted
Average Exercise Price |
Options
|
Weighted
Average Exercise Price |
Options
|
Weighted
Average Exercise Price |
|||||||||||||||
|
Outstanding, beginning of year
|
18,082
|
|
$
|
23.00
|
|
20,302
|
|
$
|
23.15
|
|
1,014,661
|
|
$
|
22.76
|
|
||||||
|
Granted
|
—
|
|
—
|
|
—
|
|
—
|
|
—
|
|
—
|
|
|||||||||
|
Exercised
|
(13,626
|
)
|
22.47
|
|
(2,220
|
)
|
24.28
|
|
(994,148
|
)
|
22.75
|
|
|||||||||
|
Forfeited or expired
|
—
|
|
—
|
|
—
|
|
—
|
|
(211
|
)
|
25.67
|
|
|||||||||
|
Outstanding at end of year
|
4,456
|
|
24.64
|
|
18,082
|
|
23.00
|
|
20,302
|
|
23.15
|
|
|||||||||
|
Exercisable at end of year
|
4,456
|
|
24.64
|
|
18,082
|
|
23.00
|
|
20,302
|
|
23.15
|
|
|||||||||
|
Outstanding at end of year,
vested or expected to vest |
4,456
|
|
24.64
|
|
18,082
|
|
23.00
|
|
20,302
|
|
23.15
|
|
|||||||||
All options were vested as of December 31, 2012. The aggregate grant date fair value of options vested during the year ended
December 31, 2012
was
$0.9 million
. The aggregate intrinsic value of options exercised during
2014
,
2013
and
2012
was
$0.3 million
,
$0.1 million
and
$19.8 million
, respectively. ProAssurance outstanding options had an aggregate intrinsic value of
$0.1 million
and a weighted average remaining contractual term of
2.44
years at
December 31, 2014
. All ProAssurance option agreements permit cashless exercise whereby the exercise price and any required tax withholdings are allowed to be satisfied by the retention of shares that would otherwise be deliverable to the option holder. ProAssurance issues new shares for options exercised. There were
no
cash proceeds from options exercised during the years ended
December 31, 2014
,
2013
or
2012
.
Restricted Share Units
Activity for restricted share units during
2014
,
2013
and
2012
is summarized below. Grant date fair values are based on the market value of a ProAssurance common share on the date of grant.
|
|
2014
|
2013
|
2012
|
||||||||||||||||||
|
|
Units
|
Weighted
Average Grant Date Fair Value |
Units
|
Weighted
Average Grant Date Fair Value |
Units
|
Weighted
Average Grant Date Fair Value |
|||||||||||||||
|
Beginning non-vested balance
|
138,770
|
|
$
|
38.92
|
|
157,212
|
|
$
|
31.94
|
|
167,236
|
|
$
|
25.52
|
|
||||||
|
Granted
|
49,750
|
|
46.34
|
|
39,400
|
|
46.97
|
|
51,864
|
|
42.22
|
|
|||||||||
|
Forfeited
|
(2,044
|
)
|
44.88
|
|
(603
|
)
|
35.91
|
|
(2,823
|
)
|
35.23
|
|
|||||||||
|
Vested and released
|
(49,674
|
)
|
29.22
|
|
(57,239
|
)
|
25.25
|
|
(59,065
|
)
|
22.61
|
|
|||||||||
|
Ending non-vested balance
|
136,802
|
|
45.02
|
|
138,770
|
|
38.92
|
|
157,212
|
|
31.94
|
|
|||||||||
The aggregate grant date fair value of restricted share units vested and released in
2014
,
2013
and
2012
totaled
$1.5 million
,
$1.4 million
and
$1.3 million
, respectively. The aggregate intrinsic value of restricted share units vested and released in
2014
,
2013
and
2012
(including units paid in cash to cover tax withholdings) totaled
$2.3 million
,
$2.7 million
and
$2.6 million
, respectively.
142
ProAssurance Corporation and Subsidiaries
Notes to Consolidated Financial Statements
December 31, 2014
Performance Share Units
Performance share units vest only if minimum performance objectives are met, and the number of units earned varies from
75%
to
125%
of a base award depending upon the degree to which stated performance objectives are achieved. Performance share unit activity for
2014
,
2013
and
2012
is summarized below. The table reflects the base number of units; actual awards that vest depends upon the extent to which performance objectives are achieved. Grant date fair values are based on the market value of a ProAssurance common share on the date of grant.
|
|
2014
|
2013
|
2012
|
||||||||||||||||||
|
|
Base Units
|
Weighted
Average Grant Date Fair Value |
Base Units
|
Weighted
Average Grant Date Fair Value |
Base Units
|
Weighted
Average Grant Date Fair Value |
|||||||||||||||
|
Beginning non-vested balance
|
486,680
|
|
$
|
39.86
|
|
552,417
|
|
$
|
33.21
|
|
522,599
|
|
$
|
26.36
|
|
||||||
|
Granted
|
160,900
|
|
46.34
|
|
145,580
|
|
46.97
|
|
212,205
|
|
42.22
|
|
|||||||||
|
Forfeited
|
(14,221
|
)
|
45.30
|
|
(17,043
|
)
|
38.90
|
|
(20,492
|
)
|
31.44
|
|
|||||||||
|
Vested and released
|
(166,499
|
)
|
31.33
|
|
(194,274
|
)
|
26.39
|
|
(161,895
|
)
|
23.13
|
|
|||||||||
|
Ending non-vested balance
|
466,860
|
|
44.97
|
|
486,680
|
|
39.86
|
|
552,417
|
|
33.21
|
|
|||||||||
The aggregate grant date fair value of performance share units (base level) vested and released in
2014
,
2013
and
2012
totaled
$5.2 million
,
$5.1 million
and
$3.7 million
, respectively. The aggregate intrinsic value of performance share units vested and released in
2014
,
2013
and
2012
(including units paid in cash to cover tax withholdings) totaled
$7.7 million
,
$9.1 million
and
$7.2 million
, respectively. The vested units were issued at the maximum level (
125%
) based on performance levels achieved.
Purchase Match Units
The ProAssurance Corporation 2011 Employee Stock Ownership Plan provides a purchase match unit for each share purchased with contributions by eligible plan participants, with participant contributions subject to a
$5,000
annual limit per participant. Purchase match unit activity during
2014
,
2013
and
2012
is summarized below. Grant date fair values are based on the market value of a ProAssurance common share on the date of grant.
|
|
2014
|
2013
|
2012
|
||||||||||||||||||
|
|
Units
|
Weighted
Average Grant Date Fair Value |
Units
|
Weighted
Average Grant Date Fair Value |
Units
|
Weighted
Average Grant Date Fair Value |
|||||||||||||||
|
Beginning non-vested balance
|
63,125
|
|
$
|
41.34
|
|
40,985
|
|
$
|
39.85
|
|
18,900
|
|
$
|
36.20
|
|
||||||
|
Granted
|
29,069
|
|
44.55
|
|
25,151
|
|
43.57
|
|
23,799
|
|
42.59
|
|
|||||||||
|
Forfeited
|
(2,968
|
)
|
43.14
|
|
(2,456
|
)
|
40.71
|
|
(1,610
|
)
|
37.72
|
|
|||||||||
|
Vested and released
|
(17,125
|
)
|
36.61
|
|
(555
|
)
|
36.33
|
|
(104
|
)
|
36.20
|
|
|||||||||
|
Ending non-vested balance
|
72,101
|
|
43.69
|
|
63,125
|
|
41.34
|
|
40,985
|
|
39.85
|
|
|||||||||
The aggregate grant date fair value of purchase match units vested and released in
2014
totaled
$0.6 million
and the aggregate intrinsic value of purchase match share units vested and released in
2014
(including units paid in cash to cover tax withholdings) totaled
$0.8 million
. In both
2013
and
2012
the aggregate grant date fair value and the aggregate intrinsic value of units vested were nominal as 2014 was the first full vesting period.
13. Variable Interest Entities
ProAssurance holds passive interests in a number of entities that are considered to be Variable Interest Entities (VIEs) under GAAP guidance. ProAssurance's VIE interests principally consist of interests in LPs/LLCs formed for the purpose of achieving diversified equity and debt returns. ProAssurance VIE interests carried as a part of Other investments totaled
$33.3 million
at
December 31, 2014
and
$27.3 million
at
December 31, 2013
. ProAssurance VIE interests, carried as a part of Investment in unconsolidated subsidiaries, totaled
$65.0 million
at
December 31, 2014
and
$49.5 million
at
December 31, 2013
.
ProAssurance has not consolidated these VIEs because it has either very limited or no power to control the activities that most significantly affect the economic performance of these entities and is not the primary beneficiary of any of the entities. ProAssurance’s involvement with each entity is limited to its direct ownership interest in the entity. ProAssurance has no
143
ProAssurance Corporation and Subsidiaries
Notes to Consolidated Financial Statements
December 31, 2014
arrangements with any of the entities to provide other financial support to or on behalf of the entity. At
December 31, 2014
, ProAssurance’s maximum loss exposure relative to these investments was limited to the carrying value of ProAssurance’s investment in the VIE.
14. Earnings Per Share
Diluted weighted average shares is calculated as basic weighted average shares plus the effect, calculated using the treasury stock method, of assuming that dilutive stock options have been exercised and that performance, restricted, and purchase share units have vested. All outstanding stock options, performance, restricted, and purchase share units had a dilutive effect for the years ended
December 31, 2014
,
2013
and
2012
.
144
ProAssurance Corporation and Subsidiaries
Notes to Consolidated Financial Statements
December 31, 2014
15. Segment Information
ProAssurance operates in
four
segments that are organized around the nature of the products and services provided: Specialty P&C, Workers' Compensation, Lloyd's Syndicate, and Corporate. A description of each segment follows.
Specialty P&C
is primarily focused on professional liability insurance and medical technology and life sciences products liability insurance. The professional liability business primarily offers professional liability insurance to healthcare providers and institutions and to attorneys and their firms. The medical technology and life sciences business offers products liability insurance for medical technology and life sciences companies that manufacture or distribute products. The Specialty P&C segment cedes certain premium to the Lloyd's Syndicate segment under an agreement with Syndicate 1729. As discussed below, Syndicate 1729 operating results are reported on a quarter delay. The ceded premium associated with the Syndicate 1729 reinsurance agreement has been reported within the Specialty P&C segment on a similar lag, as this results in the ceded premium being reported in the same period in which the Lloyd's Syndicate segment reports the corresponding assumed premium.
Workers' Compensation
provides workers' compensation products primarily to employers with 1,000 or fewer employees. The segment also offers alternative market solutions whereby policies written are
100%
ceded either to a captive insurer unaffiliated with ProAssurance or to SPCs operated by a wholly owned subsidiary of ProAssurance. The SPCs are fully or partially owned by the employer (or employer group, association or affiliate) insured by the policies ceded. Financial results (underwriting profit or loss, plus investment income) of the SPCs accrue to the owners of that cell. Our Workers' Compensation segment is comprised entirely of the business acquired through Eastern on January 1, 2014.
Lloyd's
Syndicate
includes operating results from ProAssurance's
58%
participation in Lloyd's of London Syndicate 1729 that began writing business as of January 1, 2014. Syndicate 1729 underwrites risks over a wide range of property and casualty insurance and reinsurance lines. The results of this segment are reported on a quarter delay, except that investment results associated with the FAL investments and certain U.S. paid administrative expenses, primarily start-up costs, are reported concurrently as that information is available on an earlier time frame.
Corporate
includes ProAssurance's U.S. investment operations, interest expense and U.S. income taxes, all of which are managed at the corporate level, non-premium revenues generated outside of our insurance entities, and corporate expenses.
The accounting policies of the segments are the same as those described in Note 1. ProAssurance evaluates performance of its Specialty P&C and Workers' Compensation segments based on before tax underwriting profit or loss, and excludes investment performance. Performance of the Lloyd's Syndicate segment is evaluated based on underwriting profit or loss, and investment results of investment assets solely allocated to Syndicate 1729 operations, net of U.K. income tax expense. Performance of the Corporate segment is evaluated based on the contribution made to consolidated after tax results. ProAssurance accounts for inter-segment sales and transfers as if the sales or transfers were to third parties at current market prices. Assets are not allocated to segments because investments and assets are not managed at the segment level.
145
ProAssurance Corporation and Subsidiaries
Notes to Consolidated Financial Statements
December 31, 2014
Financial data by segment for the years
December 31, 2014
,
2013
and
2012
were as follows:
|
Year Ended December 31, 2014
|
|||||||||||||||||||||||
|
(In thousands)
|
Specialty P&C
|
Workers' Compensation
|
Lloyd's Syndicate
|
Corporate
|
Inter-segment Eliminations
|
Consolidated
|
|||||||||||||||||
|
Net premiums earned
|
$
|
492,733
|
|
$
|
194,540
|
|
$
|
12,458
|
|
$
|
—
|
|
$
|
—
|
|
$
|
699,731
|
|
|||||
|
Net investment income
|
—
|
|
—
|
|
410
|
|
125,147
|
|
—
|
|
125,557
|
|
|||||||||||
|
Equity in earnings (loss) of unconsolidated subsidiaries
|
—
|
|
—
|
|
—
|
|
3,986
|
|
—
|
|
3,986
|
|
|||||||||||
|
Net realized gains (losses)
|
—
|
|
—
|
|
4
|
|
14,650
|
|
—
|
|
14,654
|
|
|||||||||||
|
Other income
|
5,823
|
|
645
|
|
126
|
|
2,285
|
|
(481
|
)
|
8,398
|
|
|||||||||||
|
Net losses and loss adjustment expenses
|
(228,199
|
)
|
(126,447
|
)
|
(8,438
|
)
|
—
|
|
—
|
|
(363,084
|
)
|
|||||||||||
|
Underwriting, policy acquisition and operating expenses
|
(133,132
|
)
|
(60,357
|
)
|
(9,535
|
)
|
(8,768
|
)
|
481
|
|
(211,311
|
)
|
|||||||||||
|
Segregated portfolio cells dividend expense
|
—
|
|
(1,842
|
)
|
—
|
|
—
|
|
—
|
|
(1,842
|
)
|
|||||||||||
|
Interest expense
|
—
|
|
—
|
|
—
|
|
(14,084
|
)
|
—
|
|
(14,084
|
)
|
|||||||||||
|
Income tax benefit (expense)
|
—
|
|
—
|
|
—
|
|
(65,440
|
)
|
—
|
|
(65,440
|
)
|
|||||||||||
|
Segment operating results
|
$
|
137,225
|
|
$
|
6,539
|
|
$
|
(4,975
|
)
|
$
|
57,776
|
|
$
|
—
|
|
$
|
196,565
|
|
|||||
|
Significant non-cash items
|
|||||||||||||||||||||||
|
Depreciation and amortization
|
$
|
8,945
|
|
$
|
5,828
|
|
$
|
477
|
|
$
|
35,073
|
|
$
|
—
|
|
$
|
50,323
|
|
|||||
|
Year Ended December 31, 2013
|
|||||||||||||||||||||||
|
(In thousands)
|
Specialty P&C
|
Workers' Compensation
|
Lloyd's Syndicate
|
Corporate
|
Inter-segment Eliminations
|
Consolidated
|
|||||||||||||||||
|
Net premiums earned
|
$
|
527,919
|
|
$
|
—
|
|
$
|
—
|
|
$
|
—
|
|
$
|
—
|
|
$
|
527,919
|
|
|||||
|
Net investment income
|
—
|
|
—
|
|
—
|
|
129,265
|
|
—
|
|
129,265
|
|
|||||||||||
|
Equity in earnings (loss) of unconsolidated subsidiaries
|
—
|
|
—
|
|
—
|
|
7,539
|
|
—
|
|
7,539
|
|
|||||||||||
|
Net realized gains (losses)
|
—
|
|
—
|
|
—
|
|
67,904
|
|
—
|
|
67,904
|
|
|||||||||||
|
Other income
|
5,648
|
|
—
|
|
—
|
|
1,910
|
|
(7
|
)
|
7,551
|
|
|||||||||||
|
Gain on acquisition
|
—
|
|
—
|
|
—
|
|
32,314
|
|
—
|
|
32,314
|
|
|||||||||||
|
Net losses and loss adjustment expenses
|
(224,761
|
)
|
—
|
|
—
|
|
—
|
|
—
|
|
(224,761
|
)
|
|||||||||||
|
Underwriting, policy acquisition and operating expenses
|
(132,076
|
)
|
—
|
|
—
|
|
(15,748
|
)
|
7
|
|
(147,817
|
)
|
|||||||||||
|
Interest expense
|
—
|
|
—
|
|
—
|
|
(2,755
|
)
|
—
|
|
(2,755
|
)
|
|||||||||||
|
Income tax benefit (expense)
|
—
|
|
—
|
|
—
|
|
(99,636
|
)
|
—
|
|
(99,636
|
)
|
|||||||||||
|
Segment operating results
|
$
|
176,730
|
|
$
|
—
|
|
|
$
|
—
|
|
$
|
120,793
|
|
$
|
—
|
|
$
|
297,523
|
|
||||
|
Significant non-cash items
|
|||||||||||||||||||||||
|
Depreciation and amortization
|
$
|
7,199
|
|
$
|
—
|
|
$
|
—
|
|
$
|
38,768
|
|
$
|
—
|
|
$
|
45,967
|
|
|||||
146
ProAssurance Corporation and Subsidiaries
Notes to Consolidated Financial Statements
December 31, 2014
|
Year Ended December 31, 2012
|
|||||||||||||||||||||||
|
(In thousands)
|
Specialty P&C
|
Workers' Compensation
|
Lloyd's Syndicate
|
Corporate
|
Inter-segment Eliminations
|
Consolidated
|
|||||||||||||||||
|
Net premiums earned
|
$
|
550,664
|
|
$
|
—
|
|
$
|
—
|
|
$
|
—
|
|
$
|
—
|
|
$
|
550,664
|
|
|||||
|
Net investment income
|
—
|
|
—
|
|
—
|
|
136,094
|
|
—
|
|
136,094
|
|
|||||||||||
|
Equity in earnings (loss) of unconsolidated subsidiaries
|
—
|
|
—
|
|
—
|
|
(6,873
|
)
|
—
|
|
(6,873
|
)
|
|||||||||||
|
Net realized gains (losses)
|
—
|
|
—
|
|
28,863
|
|
—
|
|
28,863
|
|
|||||||||||||
|
Other income
|
5,331
|
|
—
|
|
—
|
|
1,825
|
|
(50
|
)
|
7,106
|
|
|||||||||||
|
Gain on acquisition
|
—
|
|
—
|
|
—
|
|
—
|
|
—
|
|
—
|
|
|||||||||||
|
Net losses and loss adjustment expenses
|
(179,913
|
)
|
—
|
|
—
|
|
—
|
|
—
|
|
(179,913
|
)
|
|||||||||||
|
Underwriting, policy acquisition and operating expenses
|
(125,292
|
)
|
—
|
|
—
|
|
(10,389
|
)
|
50
|
|
(135,631
|
)
|
|||||||||||
|
Interest expense
|
—
|
|
—
|
|
—
|
|
(2,181
|
)
|
—
|
|
(2,181
|
)
|
|||||||||||
|
Loss on extinguishment of debt
|
—
|
|
—
|
|
—
|
|
(2,163
|
)
|
—
|
|
(2,163
|
)
|
|||||||||||
|
Income tax benefit (expense)
|
—
|
|
(120,496
|
)
|
(120,496
|
)
|
|||||||||||||||||
|
Segment operating results
|
$
|
250,790
|
|
$
|
—
|
|
$
|
—
|
|
$
|
24,680
|
|
$
|
—
|
|
$
|
275,470
|
|
|||||
|
Significant non-cash items
|
|||||||||||||||||||||||
|
Depreciation and amortization
|
$
|
7,355
|
|
$
|
—
|
|
$
|
—
|
|
$
|
30,218
|
|
$
|
—
|
|
$
|
37,573
|
|
|||||
147
ProAssurance Corporation and Subsidiaries
Notes to Consolidated Financial Statements
December 31, 2014
The following table provides detailed information regarding gross premiums earned by major category within each segment as well as a reconciliation to net premiums earned. All gross premiums earned are from external customers except as noted. ProAssurance's insured risks are primarily within the United States.
|
Year Ended December 31
|
||||||||||||
|
(In thousands)
|
2014
|
2013
|
2012
|
|||||||||
|
Specialty P&C Segment
|
||||||||||||
|
Gross premiums earned:
|
||||||||||||
|
Healthcare professional liability
|
$
|
477,031
|
|
$
|
507,222
|
|
$
|
539,729
|
|
|||
|
Legal professional liability
|
28,278
|
|
27,162
|
|
17,042
|
|
||||||
|
Medical technology and life sciences products liability
|
35,913
|
|
33,242
|
|
—
|
|
||||||
|
Other
|
1,830
|
|
1,807
|
|
1,545
|
|
||||||
|
Ceded premiums earned*
|
(50,319
|
)
|
(41,514
|
)
|
(7,652
|
)
|
||||||
|
Segment net premiums earned
|
$
|
492,733
|
|
$
|
527,919
|
|
$
|
550,664
|
|
|||
|
Workers' Compensation Segment
|
||||||||||||
|
Gross premiums earned:
|
||||||||||||
|
Traditional business
|
$
|
160,717
|
|
$
|
—
|
|
$
|
—
|
|
|||
|
Alternative market business
|
55,616
|
|
—
|
|
—
|
|
||||||
|
Ceded premiums earned
|
(21,793
|
)
|
—
|
|
—
|
|
||||||
|
Segment net premiums earned
|
$
|
194,540
|
|
$
|
—
|
|
$
|
—
|
|
|||
|
Lloyd's Syndicate Segment
|
||||||||||||
|
Gross premiums earned:
|
||||||||||||
|
Property and casualty*
|
$
|
13,429
|
|
$
|
—
|
|
$
|
—
|
|
|||
|
Ceded premiums earned
|
(971
|
)
|
—
|
|
—
|
|
||||||
|
Segment net premiums earned
|
$
|
12,458
|
|
$
|
—
|
|
$
|
—
|
|
|||
|
Consolidated net premiums earned
|
$
|
699,731
|
|
$
|
527,919
|
|
$
|
550,664
|
|
|||
* Includes premium ceded from the Specialty P&C Segment to the Lloyd's Syndicate Segment of
$4.2 million
for year ended
December 31, 2014
.
16. Benefit Plans
ProAssurance maintains a defined contribution savings and retirement plan (the ProAssurance Savings Plan) that is intended to provide retirement income to eligible employees. The plan provides for employer contributions to the plan of between
5%
and
10%
of salary for qualified employees. During 2014 and 2013, ProAssurance also maintained similar plans of acquired entities prior to the plans being merged into the ProAssurance Savings Plan. ProAssurance incurred expense related to savings and retirement plans of
$6.0 million
,
$5.1 million
and
$4.6 million
during the years ended
December 31, 2014
,
2013
and
2012
, respectively.
ProAssurance also maintains a non-qualified deferred compensation plan (the ProAssurance Plan) that allows participating management employees to defer a portion of their current salary. ProAssurance incurred expense related to the ProAssurance Plan, as well as another plan acquired as part of a business combination, of
$0.3 million
during the year ended
December 31, 2014
and
$0.4 million
during each of the years ended
December 31, 2013
and
2012
. ProAssurance deferred compensation liabilities totaled
$14.0 million
, and
$13.1 million
at
December 31, 2014
. and
2013
, respectively. The liabilities included amounts due under the ProAssurance Plan and amounts due under individual agreements with current or former employees.
148
ProAssurance Corporation and Subsidiaries
Notes to Consolidated Financial Statements
December 31, 2014
17. Statutory Accounting and Dividend Restrictions
ProAssurance’s domestic U.S. insurance subsidiaries are required to file statutory financial statements with state insurance regulatory authorities, prepared based upon statutory accounting practices prescribed or permitted by regulatory authorities. ProAssurance did not use any prescribed or permitted statutory accounting practices that differed from the National Association of Insurance Commissioners' statutory accounting practices at
December 31, 2014
,
2013
or
2012
. Differences between net income prepared in accordance with GAAP and statutory net income are principally due to: (a) policy acquisition and certain software and equipment costs which are deferred under GAAP but expensed for statutory purposes and (b) certain deferred income taxes which are recognized under GAAP but are not recognized for statutory purposes.
The NAIC specifies risk-based capital requirements for property and casualty insurance providers. At
December 31, 2014
actual statutory capital and surplus for each of ProAssurance’s insurance subsidiaries substantially exceeded the regulatory requirements. Net earnings and capital and surplus of ProAssurance’s insurance subsidiaries on a statutory basis are shown in the following table.
|
(In millions)
|
||||||||
|
Statutory Net Earnings
|
Statutory Capital and Surplus
|
|||||||
|
2014
|
2013
|
2012
|
2014
|
2013
|
||||
|
$246
|
$256
|
$312
|
$1,681
|
$1,642
|
||||
At
December 31, 2014
$1.9 billion
of ProAssurance's consolidated net assets were held at its domestic insurance subsidiaries, of which approximately
$230 million
are permitted to be paid as dividends over the course of 2015 without prior approval of state insurance regulators. However, the payment of any dividend requires prior notice to the insurance regulator in the state of domicile and the regulator may prevent the dividend if, in its judgment, payment of the dividend would have an adverse effect on the capital and surplus of the insurance subsidiary.
18. Quarterly Results of Operations (unaudited)
The following is a summary of unaudited quarterly results of operations for
2014
and
2013
:
|
|
2014
|
|||||||||||||||
|
(In thousands, except per share data)
|
1st
|
2nd
|
3rd
|
4th
|
||||||||||||
|
Net premiums earned
|
$
|
171,730
|
|
$
|
176,303
|
|
$
|
177,028
|
|
$
|
174,670
|
|
||||
|
Net losses and loss adjustment expenses:
|
||||||||||||||||
|
Current year
|
137,647
|
|
141,126
|
|
142,124
|
|
124,271
|
|
||||||||
|
Prior year
|
(48,139
|
)
|
(42,213
|
)
|
(42,902
|
)
|
(48,830
|
)
|
||||||||
|
Net income
|
46,731
|
|
49,942
|
|
34,778
|
|
65,114
|
|
||||||||
|
Basic earnings per share*
|
0.76
|
|
0.84
|
|
0.59
|
|
1.13
|
|
||||||||
|
Diluted earnings per share*
|
0.76
|
|
0.84
|
|
0.59
|
|
1.12
|
|
||||||||
|
|
2013
|
|||||||||||||||
|
(In thousands, except per share data)
|
1st
|
2nd
|
3rd
|
4th
|
||||||||||||
|
Net premiums earned
|
$
|
134,578
|
|
$
|
130,352
|
|
$
|
133,598
|
|
$
|
129,392
|
|
||||
|
Net losses and loss adjustment expenses:
|
||||||||||||||||
|
Current year
|
110,726
|
|
109,109
|
|
110,987
|
|
116,689
|
|
||||||||
|
Prior year
|
(53,100
|
)
|
(38,500
|
)
|
(49,350
|
)
|
(81,799
|
)
|
||||||||
|
Net income
|
112,850
|
|
50,451
|
|
63,357
|
|
70,864
|
|
||||||||
|
Basic earnings per share*
|
1.83
|
|
0.82
|
|
1.02
|
|
1.15
|
|
||||||||
|
Diluted earnings per share*
|
1.82
|
|
0.81
|
|
1.02
|
|
1.14
|
|
||||||||
|
*
|
Quarterly and year-to-date computations of per share amounts are made independently; therefore, the sum of per share amounts for the quarters may not equal per share amounts for the respective year-to-date periods.
|
19. Subsequent Events
In January 2015, ProAssurance drew
$100 million
against its revolving credit agreement on a secured basis. Refer to Note 10 for further discussion of the terms of the revolving credit agreement.
149
ProAssurance Corporation and Subsidiaries
Schedule I – Summary of Investments – Other than Investments in Related Parties
December 31, 2014
|
Type of Investment
|
Recorded
Cost Basis |
Fair
Value |
Amount Which is
Presented in the Balance Sheet |
|||||||||
|
(In thousands)
|
|
|||||||||||
|
Fixed Maturities
|
||||||||||||
|
Bonds:
|
||||||||||||
|
U.S. Government or government agencies and authorities
|
$
|
201,736
|
|
$
|
206,075
|
|
$
|
206,075
|
|
|||
|
States, municipalities and political subdivisions
|
1,015,555
|
|
1,062,615
|
|
1,062,615
|
|
||||||
|
Foreign Governments
|
2,709
|
|
2,871
|
|
2,871
|
|
||||||
|
Public utilities
|
80,086
|
|
83,668
|
|
83,668
|
|
||||||
|
All other corporate bonds
|
1,307,025
|
|
1,330,412
|
|
1,330,412
|
|
||||||
|
Certificates of deposit
|
150
|
|
150
|
|
150
|
|
||||||
|
Mortgage-backed securities
|
448,216
|
|
459,236
|
|
459,236
|
|
||||||
|
Total Fixed Maturities
|
3,055,477
|
|
3,145,027
|
|
3,145,027
|
|
||||||
|
Equity Securities, trading
|
||||||||||||
|
Common Stocks:
|
||||||||||||
|
Public utilities
|
6,559
|
|
7,981
|
|
7,981
|
|
||||||
|
Banks, trusts and insurance companies
|
75,171
|
|
79,341
|
|
79,341
|
|
||||||
|
Industrial, miscellaneous and all other
|
201,377
|
|
227,160
|
|
227,160
|
|
||||||
|
Total Equity Securities, trading
|
283,107
|
|
314,482
|
|
314,482
|
|
||||||
|
Other long-term investments
|
418,939
|
|
421,655
|
|
418,939
|
|
||||||
|
Short-term investments
|
131,259
|
|
131,259
|
|
131,259
|
|
||||||
|
Total Investments
|
$
|
3,888,782
|
|
$
|
4,012,423
|
|
$
|
4,009,707
|
|
|||
150
ProAssurance Corporation and Subsidiaries
Schedule II – Condensed Financial Information of Registrant
ProAssurance Corporation – Registrant Only
Condensed Balance Sheets
|
December 31
|
||||||||
|
(In thousands)
|
2014
|
2013
|
||||||
|
Assets
|
||||||||
|
Investment in subsidiaries, at equity
|
$
|
2,145,358
|
|
$
|
1,996,721
|
|
||
|
Fixed maturities available for sale, at fair value
|
203,451
|
|
86,603
|
|
||||
|
Equity securities, trading, at fair value
|
—
|
|
12,043
|
|
||||
|
Short-term investments
|
42,790
|
|
191,991
|
|
||||
|
Cash and cash equivalents
|
87,200
|
|
37,459
|
|
||||
|
Restricted cash
|
—
|
|
78,000
|
|
||||
|
Due from subsidiaries
|
87,719
|
|
12,014
|
|
||||
|
Other assets
|
25,736
|
|
255,313
|
|
||||
|
Total Assets
|
$
|
2,592,254
|
|
$
|
2,670,144
|
|
||
|
Liabilities and Shareholders’ Equity
|
||||||||
|
Liabilities:
|
||||||||
|
Other liabilities
|
$
|
184,310
|
|
$
|
25,730
|
|
||
|
Long-term debt
|
250,000
|
|
250,000
|
|
||||
|
Total Liabilities
|
434,310
|
|
275,730
|
|
||||
|
Shareholders’ Equity:
|
||||||||
|
Common stock
|
623
|
|
621
|
|
||||
|
Other shareholders’ equity, including unrealized gains (losses) on securities of subsidiaries
|
2,157,321
|
|
2,393,793
|
|
||||
|
Total Shareholders’ Equity
|
2,157,944
|
|
2,394,414
|
|
||||
|
Total Liabilities and Shareholders’ Equity
|
$
|
2,592,254
|
|
$
|
2,670,144
|
|
||
151
ProAssurance Corporation and Subsidiaries
Schedule II – Condensed Financial Information of Registrant
ProAssurance Corporation – Registrant Only
Condensed Statements of Income
|
|
Year Ended December 31
|
|||||||||||
|
(In thousands)
|
2014
|
2013
|
2012
|
|||||||||
|
Net investment income
|
$
|
3,295
|
|
$
|
5,789
|
|
$
|
5,281
|
|
|||
|
Equity in earnings (loss) of unconsolidated subsidiaries
|
—
|
|
—
|
|
(728
|
)
|
||||||
|
Net realized investment gains (losses)
|
990
|
|
5,334
|
|
3,230
|
|
||||||
|
Other income (loss)
|
660
|
|
170
|
|
54
|
|
||||||
|
4,945
|
|
11,293
|
|
7,837
|
|
|||||||
|
Expenses:
|
||||||||||||
|
Interest expense
|
14,084
|
|
2,747
|
|
1,534
|
|
||||||
|
Other expenses
|
7,083
|
|
13,213
|
|
8,870
|
|
||||||
|
21,167
|
|
15,960
|
|
10,404
|
|
|||||||
|
Income (loss) before income tax expense (benefit) and equity in net income of consolidated subsidiaries
|
(16,222
|
)
|
(4,667
|
)
|
(2,567
|
)
|
||||||
|
Income tax expense (benefit)
|
(6,728
|
)
|
(1,007
|
)
|
773
|
|
||||||
|
Income (loss) before equity in net income of consolidated subsidiaries
|
(9,494
|
)
|
(3,660
|
)
|
(3,340
|
)
|
||||||
|
Equity in net income of consolidated subsidiaries
|
206,059
|
|
301,183
|
|
278,810
|
|
||||||
|
Net income
|
$
|
196,565
|
|
$
|
297,523
|
|
$
|
275,470
|
|
|||
|
Other comprehensive income
|
$
|
(1,457
|
)
|
$
|
(85,719
|
)
|
$
|
15,343
|
|
|||
|
Comprehensive income
|
$
|
195,108
|
|
$
|
211,804
|
|
$
|
290,813
|
|
|||
152
ProAssurance Corporation and Subsidiaries
Schedule II – Condensed Financial Information of Registrant
ProAssurance Corporation – Registrant Only
Condensed Statements of Cash Flow
|
|
Year Ended December 31
|
|||||||||||
|
(In thousands)
|
2014
|
2013
|
2012
|
|||||||||
|
Net cash provided (used) by operating activities
|
$
|
20,086
|
|
$
|
(24,654
|
)
|
$
|
3,601
|
|
|||
|
Investing activities
|
||||||||||||
|
Purchases of equity securities trading
|
(310
|
)
|
(1,265
|
)
|
(364
|
)
|
||||||
|
Proceeds from sale or maturities of:
|
||||||||||||
|
Fixed maturities, available for sale
|
104,844
|
|
224,993
|
|
150,192
|
|
||||||
|
Equity securities trading
|
12,813
|
|
1,113
|
|
616
|
|
||||||
|
Net decrease (increase) in short-term investments
|
149,202
|
|
(187,625
|
)
|
58,657
|
|
||||||
|
Dividends from subsidiaries
|
67,188
|
|
239,484
|
|
59,369
|
|
||||||
|
Contribution of capital to subsidiaries
|
(7,000
|
)
|
—
|
|
(184,330
|
)
|
||||||
|
Deposit made for future acquisition
|
—
|
|
(205,244
|
)
|
—
|
|
||||||
|
(Increase) decrease in restricted cash
|
78,000
|
|
(78,000
|
)
|
—
|
|
||||||
|
Funds advanced for Syndicate 1729 FAL deposit
|
(76,553
|
)
|
(8,699
|
)
|
—
|
|
||||||
|
Funds advanced under Syndicate 1729 credit agreement
|
(9,107
|
)
|
(1,665
|
)
|
—
|
|
||||||
|
Other
|
415
|
|
(20
|
)
|
(1
|
)
|
||||||
|
Net cash provided (used) by investing activities
|
319,492
|
|
(16,928
|
)
|
84,139
|
|
||||||
|
Financing activities
|
||||||||||||
|
Proceeds from long-term debt
|
—
|
|
250,000
|
|
125,000
|
|
||||||
|
Principal repayment of debt
|
—
|
|
(125,000
|
)
|
(32,992
|
)
|
||||||
|
Repurchase of common stock
|
(222,360
|
)
|
(29,089
|
)
|
—
|
|
||||||
|
Subsidiary payments for common shares and share-based compensation awarded to subsidiary employees
|
8,301
|
|
6,258
|
|
7,066
|
|
||||||
|
Excess of tax benefit from share-based payment arrangements
|
1,631
|
|
2,128
|
|
7,022
|
|
||||||
|
Dividends to shareholders
|
(70,490
|
)
|
(46,375
|
)
|
(200,118
|
)
|
||||||
|
Other
|
(6,919
|
)
|
(8,278
|
)
|
(12,259
|
)
|
||||||
|
Net cash provided (used) by financing activities
|
(289,837
|
)
|
49,644
|
|
(106,281
|
)
|
||||||
|
Increase (decrease) in cash and cash equivalents
|
49,741
|
|
8,062
|
|
(18,541
|
)
|
||||||
|
Cash and cash equivalents, beginning of period
|
37,459
|
|
29,397
|
|
47,938
|
|
||||||
|
Cash and cash equivalents, end of period
|
$
|
87,200
|
|
$
|
37,459
|
|
$
|
29,397
|
|
|||
|
Supplemental disclosure of cash flow information:
|
||||||||||||
|
Cash paid during the year for income taxes, net of refunds
|
$
|
26,061
|
|
$
|
117,107
|
|
$
|
110,278
|
|
|||
|
Cash paid during the year for interest
|
$
|
13,408
|
|
$
|
913
|
|
$
|
2,342
|
|
|||
|
Significant non-cash transactions:
|
||||||||||||
|
Dividends declared and not yet paid
|
$
|
167,744
|
|
$
|
18,532
|
|
$
|
—
|
|
|||
|
Securities transferred at fair value as dividends from subsidiaries
|
$
|
227,412
|
|
$
|
69,011
|
|
$
|
241,081
|
|
|||
153
ProAssurance Corporation and Subsidiaries
Schedule II – Condensed Financial Information of Registrant
Notes to Condensed Financial Statements of Registrant
1. Basis of Presentation
The registrant-only financial statements should be read in conjunction with ProAssurance Corporation’s (PRA Parent) consolidated financial statements. At
December 31, 2014
and
2013
, PRA Parent’s investment in subsidiaries is stated at the initial consolidation value plus equity in the undistributed earnings of subsidiaries since the date of acquisition.
2. Business Combinations
On January 1, 2014, ProAssurance completed the acquisition of Eastern Insurance Holdings, Inc. (Eastern) (NASDAQ: EIHI) by purchasing
100%
of its outstanding common shares. ProAssurance acquired Eastern for cash of
$205 million
. ProAssurance transferred all of the cash required to complete the transaction to a third-party agent for the benefit of Eastern eligible shareholders on December 27, 2013; the deposit was classified as a part of Other Assets at
December 31, 2013
.
On January 1, 2013, ProAssurance, through a wholly owned subsidiary, completed the acquisition of Medmarc Mutual Insurance Company, now Medmarc Casualty Insurance Company (Medmarc), through a sponsored demutualization. A gain recognized on the acquisition is included in the December 31, 2013 Consolidated Statements of Income and Comprehensive Income.
Additional information regarding business combinations is provided in Note 2 of the Notes to Consolidated Financial Statements.
3. Other Assets
At December 31, 2013 Other assets was principally comprised of a
$205 million
deposit made related to the Eastern transaction, discussed in Note 2 above.
4. Long-term Debt
Outstanding long-term debt, as of
December 31, 2014
and
2013
, consisted of the following:
|
(In thousands)
|
2014
|
2013
|
||||||
|
Senior notes due 2023, unsecured, interest at 5.3% annually
|
$
|
250,000
|
|
$
|
250,000
|
|
||
|
Revolving credit agreement, outstanding borrowings not permitted to exceed $200 million aggregately, expires in 2016
|
—
|
|
—
|
|
||||
|
$
|
250,000
|
|
$
|
250,000
|
|
|||
See Note 10 of the Notes to Consolidated Financial Statements included herein for a detailed description of the terms of the Senior Notes due 2023 and the Revolving Credit Agreement.
5. Related Party Transactions
PRA Parent received dividends from its subsidiaries of
$294.6 million
,
$308.5 million
and
$300.5 million
during the years ended
December 31, 2014
,
2013
and
2012
, respectively. PRA Parent contributed capital of
$7.0 million
, and
$184.3 million
to its subsidiaries during the years ended
December 31, 2014
and
2012
, respectively. No capital was contributed to subsidiaries during the year ended December 31, 2013. Capital contributed in 2012 was primarily for the purpose of funding the Medmarc acquisition. Additionally, advances of
$76.6 million
and
$8.7 million
were made in 2014 and 2013, respectively, to a subsidiary that is a Corporate Member at Lloyds. The subsidiary used the advances to provide capital at Lloyd's, also known as FAL, in support of Syndicate 1729.
6. Income Taxes
Under terms of PRA Parent’s tax sharing agreement with its subsidiaries, income tax provisions for individual companies are allocated on a separate company basis.
7. Commitment to Syndicate 1729
ProAssurance has provided a revolving credit agreement (the "Syndicate Credit Agreement") to Premium Trust Fund of Syndicate 1729 which will provide operating funds for the Syndicate of up to
£10 million
(approximately
$16 million
at
December 31, 2014
). At
December 31, 2014
,
£6.6 million
(
$11.0 million
) had been drawn under the Syndicate Credit Agreement. See Note 9 of the Notes to Consolidated Financial Statements for additional information regarding the Syndicate Credit Agreement.
154
ProAssurance Corporation and Subsidiaries
Schedule III – Supplementary Insurance Information
|
(In thousands)
|
2014
|
2013
|
2012
|
||||||||
|
Net premiums earned
|
|||||||||||
|
Specialty P&C
|
$
|
492,733
|
|
$
|
527,919
|
|
$
|
550,664
|
|
||
|
Workers' Compensation
|
194,540
|
|
—
|
|
—
|
|
|||||
|
Lloyd's Syndicate
|
12,458
|
|
—
|
|
—
|
|
|||||
|
Consolidated
|
699,731
|
|
527,919
|
|
550,664
|
|
|||||
|
Net investment income (1)
|
|||||||||||
|
Lloyd's Syndicate
|
410
|
|
—
|
|
—
|
|
|||||
|
Corporate
|
125,147
|
|
129,265
|
|
136,094
|
|
|||||
|
Consolidated
|
125,557
|
|
129,265
|
|
136,094
|
|
|||||
|
Losses and loss adjustment expenses incurred related to current year, net of reinsurance
|
|||||||||||
|
Specialty P&C
|
408,987
|
|
447,510
|
|
451,951
|
|
|||||
|
Workers' Compensation
|
127,743
|
|
—
|
|
—
|
|
|||||
|
Lloyd's Syndicate
|
8,438
|
|
—
|
|
—
|
|
|||||
|
Consolidated
|
545,168
|
|
447,510
|
|
451,951
|
|
|||||
|
Losses and loss adjustment expenses incurred related to prior year, net of reinsurance
|
|||||||||||
|
Specialty P&C
|
(180,788
|
)
|
(222,749
|
)
|
(272,038
|
)
|
|||||
|
Workers' Compensation
|
(1,296
|
)
|
—
|
|
—
|
|
|||||
|
Lloyd's Syndicate
|
—
|
|
—
|
|
—
|
|
|||||
|
Consolidated
|
(182,084
|
)
|
(222,749
|
)
|
(272,038
|
)
|
|||||
|
Paid losses and loss adjustment expenses, net of reinsurance
|
|||||||||||
|
Specialty P&C
|
389,458
|
|
388,813
|
|
339,142
|
|
|||||
|
Workers' Compensation
|
117,775
|
|
—
|
|
—
|
|
|||||
|
Lloyd's Syndicate
|
404
|
|
—
|
|
—
|
|
|||||
|
Consolidated
|
507,637
|
|
388,813
|
|
339,142
|
|
|||||
|
Amortization of deferred policy acquisition costs
|
|||||||||||
|
Specialty P&C
|
55,105
|
|
53,207
|
|
54,887
|
|
|||||
|
Workers' Compensation
|
10,307
|
|
—
|
|
—
|
|
|||||
|
Lloyd's Syndicate
|
3,165
|
|
—
|
|
—
|
|
|||||
|
Consolidated
|
68,577
|
|
53,207
|
|
54,887
|
|
|||||
|
Other underwriting, policy acquisition and operating expenses
|
|||||||||||
|
Specialty P&C
|
78,027
|
|
78,869
|
|
70,405
|
|
|||||
|
Workers' Compensation
|
50,050
|
|
—
|
|
—
|
|
|||||
|
Lloyd's Syndicate
|
6,370
|
|
—
|
|
—
|
|
|||||
|
Corporate
|
8,768
|
|
15,748
|
|
10,389
|
|
|||||
|
Consolidated (2)
|
142,734
|
|
94,610
|
|
80,744
|
|
|||||
|
Net premiums written
|
|||||||||||
|
Specialty P&C
|
467,046
|
|
525,182
|
|
528,298
|
|
|||||
|
Workers' Compensation
|
202,697
|
|
—
|
|
—
|
|
|||||
|
Lloyd's Syndicate
|
32,106
|
|
—
|
|
—
|
|
|||||
|
Consolidated
|
701,849
|
|
525,182
|
|
528,298
|
|
|||||
|
Deferred policy acquisition costs (1)
|
38,790
|
|
28,207
|
|
23,179
|
|
|||||
|
Reserve for losses and loss adjustment expenses (1)
|
2,058,266
|
|
2,072,822
|
|
2,054,994
|
|
|||||
|
Unearned premiums (1)
|
345,828
|
|
255,463
|
|
233,861
|
|
|||||
(1) Assets are not allocated to segments because investments and assets are not managed at the segment level, with the exception
of the FAL investments held at our Lloyd's Syndicate segment.
(2) Includes Inter-segment eliminations.
155
|
(In thousands)
|
2014
|
2013
|
2012
|
|||||||||
|
Property and Liability *
|
||||||||||||
|
Premiums earned
|
$
|
755,623
|
|
$
|
568,629
|
|
$
|
558,200
|
|
|||
|
Premiums ceded
|
(68,879
|
)
|
(41,514
|
)
|
(7,652
|
)
|
||||||
|
Premiums assumed
|
12,987
|
|
804
|
|
116
|
|
||||||
|
Net premiums earned
|
$
|
699,731
|
|
$
|
527,919
|
|
$
|
550,664
|
|
|||
|
Percentage of amount assumed to net
|
1.86
|
%
|
0.15
|
%
|
0.02
|
%
|
||||||
|
*
|
All of ProAssurance’s premiums are related to property and liability coverages.
|
156
EXHIBIT INDEX
|
Exhibit Number
|
|
Description
|
|
2
|
|
Schedules to the following documents are omitted; the contents of the schedules are generally described in the documents; and ProAssurance will upon request furnish to the Commission supplementally a copy of any omitted schedule
|
|
2.1
|
|
Agreement and Plan of Merger by and among ProAssurance Corporation, CA Bridge Corporation and American Physicians Service Group, Inc. dated August 31, 2010, filed as an Exhibit to ProAssurance’s Current Report on Form 8-K for event occurring August 31, 2010 (File No. 001-16533) and incorporated herein by reference pursuant to SEC Rule 12b-32.
|
|
2.2
|
Stock Purchase Agreement dated as of June 26, 2012, by and among ProAssurance Corporation, PRA Professional Liability Group, Inc. and Medmarc Mutual Insurance Company, filed as an Exhibit to ProAssurance's Quarterly Report on Form 10-Q for the quarter ended March 31, 2013 (File No. 001-16533) and incorporated herein by reference pursuant to SEC Rule 12b-32.
|
|
|
2.3
|
Agreement and Plan of Merger by and among ProAssurance Corporation, PA Merger Company and Eastern Insurance Holdings, Inc., dated September 23, 2013, filed as an Exhibit to ProAssurance's Current Report on Form 8-K for event occurring September 24, 2013 (File No. 001-16533) and incorporated herein by reference pursuant to SEC Rule 12b-32.
|
|
|
3.1(a)
|
|
Certificate of Incorporation of ProAssurance, filed as an Exhibit to ProAssurance’s Registration Statement on Form S-4 (File No. 333-49378) and incorporated herein by reference pursuant to SEC Rule 12b-32.
|
|
3.1(b)
|
|
Certificate of Amendment to Certificate of Incorporation of ProAssurance, filed as an Exhibit to ProAssurance’s Annual Report on Form 10-K for the year ended December 31, 2001 (File No. 001-16533) and incorporated herein by reference pursuant to SEC Rule 12b-32.
|
|
3.2
|
|
Third Restatement of the Bylaws of ProAssurance, filed as an Exhibit to ProAssurance’s Current Report on Form 8-K for event occurring December 1, 2010 (File No. 001-16533) and incorporated herein by reference pursuant to SEC Rule 12b-32.
|
|
4.1
|
Indenture, dated November 21, 2013, between ProAssurance and Wilmington Trust Company, filed as an Exhibit to ProAssurance's Current Report on Form 8-K for event occurring November 21, 2013 (File No. 001-16533) and incorporated herein by reference pursuant to SEC Rule 12b-32.
|
|
|
4.2
|
First Supplemental Indenture, dated November 21, 2013, between ProAssurance and Wilmington Trust Company relating to the $250,000 5.30% Senior Notes due 2023, filed as an Exhibit to ProAssurance's Current Report on Form 8-K for event occurring November 21, 2013 (File No. 001-16533) and incorporated herein by reference pursuant to SEC Rule 12b-32.
|
|
|
|
ProAssurance will file with the Commission upon request pursuant to the requirements of Item 601 (b)(4) of Regulation S-K documents defining rights of holders of ProAssurance’s long-term indebtedness that has not been registered. See also the documents related to long term indebtedness filed as material contracts under Exhibits 10.14(a), (b), (c), (d) and (e) to this Form 10-K.
|
|
|
10.1(a)
|
|
Medical Assurance, Inc. Incentive Compensation Stock Plan (formerly known as the Mutual Assurance, Inc. 1995 Stock Award Plan), filed as an Exhibit to MAIC Holding’s Registration Statement on Form S-4 (File No. 33-91508) and incorporated herein by reference pursuant to SEC Rule 12b-32.*
|
|
10.1(b)
|
|
Amendment and Assumption Agreement by and between ProAssurance and Medical Assurance, Inc., filed as an Exhibit to ProAssurance’s Registration Statement on Form S-4 (File No. 333-49378) and incorporated herein by reference pursuant to SEC Rule 12b-32.*
|
|
10.1(c)
|
|
Amendment and Assumption Agreement by and between Mutual Assurance, Inc. and MAIC Holdings, Inc. dated April 8, 1996, filed as an Exhibit to MAIC Holding’s Proxy Statement for the 1996 Annual Meeting (File No. 0-19439) is incorporated herein by reference pursuant to SEC Rule 12b-32.*
|
|
10.2(a)
|
|
ProAssurance Corporation 2004 Equity Incentive Plan, filed as an Exhibit to ProAssurance’s Definitive Proxy Statement (File No. 001-16533) on April 16, 2004 and incorporated herein by reference pursuant to SEC Rule 12b-32.*
|
|
10.2(b)
|
|
First amendment to 2004 Equity Incentive Plan, filed as an Exhibit to ProAssurance’s Annual Report on Form 10-K for the year ended December 31, 2007 (File No. 001-16533) and incorporated herein by this reference pursuant to SEC Rule 12b-32.*
|
157
|
10.3(a)
|
|
Form of Release and Severance Compensation Agreement dated as of January 1, 2008 between ProAssurance and each of the following named executive officers (11):*
|
|
|
Howard H. Friedman Jeffrey P. Lisenby
Frank B. O’Neil Edward L. Rand
|
|
|
Filed as an Exhibit to ProAssurance’s Annual Report on Form 10-K for the year ended December 31, 2007 (File No. 001-16533) and incorporated herein by this reference pursuant to SEC Rule 12b-32.
|
||
|
10.4(a)
|
|
Employment Agreement between ProAssurance and W. Stancil Starnes dated as of May 1, 2007, filed as an Exhibit to ProAssurance’s Current Report on Form 8-K for the event occurring May 12, 2007 (File No. 001-16533) and incorporated herein by reference pursuant to SEC Rule 12b-32.*
|
|
10.4(b)
|
|
Amendment to Employment Agreement with W. Stancil Starnes (May 1, 2007), effective as of January 1, 2008, filed as an Exhibit to ProAssurance’s Annual Report on Form 10-K for the year ended December 31, 2007 (File No. 001-16533) and incorporated herein by this reference pursuant to SEC Rule 12b-32.*
|
|
10.5
|
|
Consulting Agreement between ProAssurance and William J. Listwan, filed as an Exhibit to ProAssurance’s Annual Report on Form 10-K for the year ended December 31, 2009 (File No. 001-16533) and incorporated herein by this reference pursuant to SEC Rule 12b-32.*
|
|
10.6
|
Form of Release and Severance Compensation Agreement dated as of September 1, 2011 between ProAssurance and Ross E. Taubman, filed as an Exhibit to ProAssurance’s Definitive Proxy Statement (File No. 001-16533) on April 11, 2008 and incorporated herein by reference pursuant to SEC Rule 12b-32.*
|
|
|
10.7
|
|
Form of Indemnification Agreement between ProAssurance and each of the following named executive officers and directors of ProAssurance*:
|
|
Lucian F. Bloodworth Samuel A. Di Piazza, Jr.
Robert E. Flowers Howard H. Friedman
M. James Gorrie Jeffrey P. Lisenby
William J. Listwan John J. McMahon
Drayton Nabers Frank B. O’Neil
Ann F. Putallaz Edward L. Rand, Jr.
Frank A. Spinosa W. Stancil Starnes
Ross E. Taubman Anthony R. Tersigni
Thomas A. S. Wilson, Jr.
|
||
|
Filed as an Exhibit to ProAssurance’s Definitive Proxy Statement (File No. 001-16533) on April 11, 2008 and incorporated herein by reference pursuant to SEC Rule 12b-32.
|
||
|
10.8
|
|
ProAssurance Group Employee Benefit Plan which includes the Executive Supplemental Life Insurance Program (Article VIII), filed as an Exhibit to ProAssurance's Annual Report on Form 10-K for the year ended December 31, 2004 (File No. 001-16533) and incorporated herein by reference pursuant to SEC Rule 12b-32.*
|
|
10.9
|
|
Amendment and Restatement of the Executive Non-Qualified Excess Plan and Trust effective January 1, 2008, filed as an Exhibit to ProAssurance’s Annual Report on Form 10-K for the year ended December 31, 2007 (File No. 001-16533) and incorporated herein by this reference pursuant to SEC Rule 12b-32.*
|
|
10.10(a)
|
|
Director Deferred Compensation Plan as amended and restated December 7, 2011, filed as an Exhibit to ProAssurance's Annual Report on Form 10-K for the year ended December 31, 2011 (File No. 001-16533) and incorporated herein by reference pursuant to SEC Rule 12b-32.
|
|
10.10(b)
|
Amendment No. 1 to the Amended and Restated Director Deferred Compensation Plan dated May 22, 2013, filed as an Exhibit to ProAssurance's Quarterly Report on Form 10-Q for the quarter ended June 30, 2013 (File No. 001-16533) and incorporated herein by reference pursuant to SEC Rule 12b-32.*
|
|
|
10.12(a)
|
|
ProAssurance Corporation 2008 Equity Incentive Plan, filed as an Exhibit to ProAssurance’s Registration Statement on Form S-8 (File No. 333-156645) and incorporated by reference pursuant to SEC Rule 12b-32.*
|
|
10.12(b)
|
|
First Amendment to the 2008 Equity Incentive Plan, filed as an Exhibit to ProAssurance's Annual Report on Form 10-K for the year ended December 31, 2011 (File No. 001-16533) and incorporated herein by reference pursuant to SEC Rule 12b-32.*
|
|
10.13
|
|
ProAssurance Corporation 2008 Annual Incentive Compensation Plan, filed as an Exhibit to ProAssurance’s Definitive Proxy Statement (File No. 001-16533) on April 11, 2008 and incorporated herein by reference pursuant to SEC Rule 12b-32.*
|
158
|
10.14(a)
|
|
Revolving Credit Agreement, dated April 15, 2011, between ProAssurance and U.S. Bank National Association, Wells Fargo Bank, National Association, Branch Banking and Trust Company, First Tennessee Bank, N.A., and JP Morgan Chase Bank N.A., filed as an Exhibit to ProAssurance’s Quarterly Report on Form 10-Q for the quarter ended June 30, 2011 (File No. 001-16533) and incorporated herein by reference pursuant to SEC Rule 12b-32.
|
|
10.14(b)
|
Amendment No. 1 to Revolving Credit Agreement between ProAssurance and U.S. Bank National Association, Wells Fargo Bank, National Association, Branch Banking and Trust Company, First Tennessee Bank, N.A., and JP Morgan Chase Bank N.A., filed as an Exhibit to ProAssurance's Quarterly Report on Form 10-Q for the quarter ended September 30, 2012 (File No. 001-16533) and incorporated herein by reference pursuant to SEC Rule 12b-32.
|
|
|
10.14(c)
|
Amendment No. 2 to Revolving Credit Agreement between ProAssurance and U.S. Bank National Association, Wells Fargo Bank, National Association, Branch Banking and Trust Company, First Tennessee Bank, N.A., and JP Morgan Chase Bank N.A., filed as an Exhibit to ProAssurance's Current Report on Form 8-K for event occurring November 8, 2013 (File No. 001-16533) and incorporated herein by reference pursuant to SEC Rule 12b-32.
|
|
|
10.14(d)
|
Form of the Augmenting Lender Supplement to Revolving Credit Agreement between ProAssurance and U.S. Bank National Association, Wells Fargo Bank, National Association, Branch Banking and Trust Company, First Tennessee Bank, N.A., and JP Morgan Chase Bank N.A., filed as an Exhibit to ProAssurance's Quarterly Report on Form 10-Q for the quarter ending June 30, 2014 (File No. 001-16533) and incorporated herein by reference pursuant to SEC Rule 12b-32.
|
|
|
10.14(e)
|
|
Pledge and Security Agreement between ProAssurance and U.S. Bank National Association, filed as an Exhibit to ProAssurance’s Quarterly Report on Form 10-Q for the quarter ended June 30, 2011 (File No. 001-16533) and incorporated herein by reference pursuant to SEC Rule 12b-32.
|
|
10.15
|
ProAssurance Corporation Amended and Restated 2014 Equity Incentive Plan, filed as an Exhibit to ProAssurance’s Current Report on Form 8-K for event occurring May 14, 2013 (File No. 001-16533) and incorporated herein by reference pursuant to SEC Rule 12b-32.*
|
|
|
10.16
|
ProAssurance Corporation 2014 Annual Incentive Plan, filed as an Exhibit to ProAssurance’s Definitive Proxy Statement (File No. 001-16533) filed on April 22, 2013 and incorporated herein by reference pursuant to SEC Rule 12b-32.*
|
|
|
10.17
|
Retention and Severance Compensation Agreement effective January 1, 2013, between ProAssurance and Mary Todd Peterson, filed as an Exhibit to ProAssurance's Annual Report on Form 10-K for the year ended December 31, 2013 (File No. 001-16533) and incorporated herein by reference pursuant to SEC Rule 12b-32.*
|
|
|
10.18
|
Facility Agreement between ProAssurance and the Premiums Trust Fund of Syndicate 1729, filed as an Exhibit to ProAssurance's Annual Report on Form 10-K for the year ended December 31, 2013 (File No. 001-16533) and incorporated herein by reference pursuant to SEC Rule 12b-32.
|
|
|
10.19
|
Underwriting Agreement between ProAssurance and Goldman, Sachs & Co. and Wells Fargo Securities, LLC, filed as an Exhibit to ProAssurance's Current Report on Form 8-K for event occurring November 21, 2013 (File No. 001-16533) and incorporated herein by reference pursuant to SEC Rule 12b-32.
|
|
|
10.20
|
Retention and Severance Compensation Agreement effective January 1, 2014, between ProAssurance and Michael L. Boguski, filed as an Exhibit to ProAssurance's Annual Report on Form 10-K for the year ended December 31, 2013 (File No. 001-16533) and incorporated herein by reference pursuant to SEC Rule 12b-32.*
|
|
|
21.1
|
|
Subsidiaries of ProAssurance Corporation
|
|
23.1
|
|
Consent of Ernst & Young LLP
|
|
31.1
|
|
Certification of Principal Executive Officer of ProAssurance as required under SEC Rule 13a-14(a)
|
|
31.2
|
|
Certification of Principal Financial Officer of ProAssurance as required under SEC Rule 13a-14(a)
|
|
32.1
|
|
Certification of Principal Executive Officer of ProAssurance as required under SEC Rule 13a-14(b) and Section 1350 of Chapter 63 of Title 18 of the United States Code, as amended (18 U.S.C. 1350)
|
|
32.2
|
|
Certification of Principal Financial Officer of ProAssurance as required under SEC Rule 13a-14(b) and 18 U.S.C. 1350
|
|
101.INS
|
|
XBRL Instance Document
|
|
101.SCH
|
|
XBRL Taxonomy Extension Schema Document
|
159
|
101.CAL
|
|
XBRL Taxonomy Extension Calculation Linkbase Document
|
|
101.DEF
|
|
XBRL Taxonomy Extension Definition Linkbase Document
|
|
101.LAB
|
|
XBRL Taxonomy Extension Labels Linkbase Document
|
|
101.PRE
|
|
XBRL Taxonomy Extension Presentation Linkbase Document
|
|
* Denotes a management contract or compensatory plan, contract or arrangement required to be filed as an Exhibit to
this report
|
||
160
TABLE OF CONTENTS
Part IItem 1. BusinessItem 1A. Risk FactorsItem 1B. Unresolved Staff CommentsItem 2. PropertiesItem 3. Legal ProceedingsItem 4. Mine Safety DisclosuresPart IIItem 5. Market For Registrant S Common Equity, Related Stockholder Matters and Issuer Purchases Of Equity SecuritiesItem 6. Selected Financial DataItem 7. Management S Discussion and Analysis Of Financial Condition and Results Of OperationsItem 7A. Quantitative and Qualitative Disclosures About Market RiskItem 8. Financial Statements and Supplementary DataItem 9. Changes in and Disagreements with Accountants on Accounting and Financial DisclosureItem 9A. Controls and ProceduresItem 9B. Other InformationPart IIIItem 10. Directors, Executive Officers and Corporate Governance Of The RegistrantItem 11. Executive CompensationItem 12. Security Ownership Of Certain Beneficial Owners and Management and Related Stockholder MattersItem 13. Certain Relationships and Related Transactions, and Director IndependenceItem 14. Principal Accountant Fees and ServicesPart IVItem 15. Exhibits and Financial Statement Schedules