UNITED STATES
SECURITIES AND EXCHANGE COMMISSION
Washington, D.C. 20549
____________________________________
FORM 10-K
____________________________________
|
ý
|
ANNUAL REPORT PURSUANT TO SECTION 13 OR 15(d) OF THE SECURITIES EXCHANGE ACT OF 1934
|
For the fiscal year ended
December 31, 2014
OR
|
¨
|
TRANSITION REPORT PURSUANT TO SECTION 13 OR 15(d) OF THE SECURITIES EXCHANGE ACT OF 1934
|
For the transition period from to
Commission file number 1-14536
___________________________________
PartnerRe Ltd.
(Exact name of registrant as specified in its charter)
______________________________________
|
Bermuda
|
|
Not Applicable
|
|
(State or other jurisdiction of
incorporation or organization)
|
|
(I.R.S. Employer
Identification No.)
|
|
90 Pitts Bay Road, Pembroke, Bermuda
|
|
HM 08
|
|
(Address of principal executive offices)
|
|
(Zip Code)
|
(441) 292-0888
(Registrant’s telephone number, including area code)
_____________________________________
Securities registered pursuant to Section 12(b) of the Act:
|
Title of each class
|
|
Name of each exchange on which registered
|
|
Common Shares, $1.00 par value
|
|
New York Stock Exchange, Bermuda Stock Exchange
|
|
6.50% Series D Cumulative Preferred Shares,
$1.00 par value
|
|
New York Stock Exchange
|
|
7.25% Series E Cumulative Preferred Shares,
$1.00 par value
|
|
New York Stock Exchange
|
|
5.875% Series F Non-Cumulative Preferred Shares,
$1.00 par value
|
|
New York Stock Exchange
|
Securities registered pursuant to Section 12(g) of the Act: None
_________________________________
Indicate by check mark if the registrant is a well-known seasoned issuer, as defined in Rule 405 of the Securities Act. Yes
ý
No
¨
Indicate by check mark if the registrant is not required to file reports pursuant to Section 13 or Section 15(d) of the Act. Yes
¨
No
ý
Indicate by check mark whether the registrant (1) has filed all reports required to be filed by Section 13 or 15(d) of the Securities Exchange Act of 1934 during the preceding 12 months (or for such shorter period that the registrant was required to file such reports), and (2) has been subject to such filing requirements for the past 90 days. Yes
ý
No
¨
Indicate by check mark whether the registrant has submitted electronically and posted on its corporate Web site, if any, every Interactive Data File required to be submitted and posted pursuant to Rule 405 of Regulation S-T during the preceding 12 months (or for such shorter period that the registrant was required to submit and post such files). Yes
ý
No
¨
Indicate by check mark if disclosure of delinquent filers pursuant to Item 405 of Regulation S-K is not contained herein, and will not be contained, to the best of registrant’s knowledge, in definitive proxy or information statements incorporated by reference in Part III of this Form 10-K or any amendment to this Form 10-K.
ý
Indicate by check mark whether the registrant is a large accelerated filer, an accelerated filer, a non-accelerated filer, or a smaller reporting company. See the definitions of “large accelerated filer,” “accelerated filer” and “smaller reporting company” in Rule 12b-2 of the Exchange Act.
|
Large accelerated filer
|
|
ý
|
|
Accelerated filer
|
|
¨
|
|
Non-accelerated filer
|
|
¨
|
|
Smaller reporting company
|
|
¨
|
Indicate by check mark whether the registrant is a shell company (as defined in Rule 12b-2 of the Act.) Yes
¨
No
ý
The aggregate market value of the voting stock held by non-affiliates of the registrant as of the most recently completed second fiscal quarter (June 30, 2014) was $5,429,403,326 based on the closing sales price of the registrant’s common shares of $109.21 on that date.
The number of the registrant’s common shares (par value $1.00 per share) outstanding, net of treasury shares, as of
February 23, 2015
was
47,407,899
.
TABLE OF CONTENTS
|
|
|
Page
|
|
PART I
|
||
|
Item 1.
|
||
|
Item 1A.
|
||
|
Item 1B.
|
||
|
Item 2.
|
||
|
Item 3.
|
||
|
Item 4.
|
||
|
PART II
|
||
|
Item 5.
|
||
|
Item 6.
|
||
|
Item 7.
|
||
|
Item 7A.
|
||
|
Item 8.
|
||
|
Item 9.
|
||
|
Item 9A.
|
||
|
Item 9B.
|
||
|
PART III
|
||
|
Item 10.
|
||
|
Item 11.
|
||
|
Item 12.
|
||
|
Item 13.
|
||
|
Item 14.
|
||
|
PART IV
|
||
|
Item 15.
|
||
SPECIAL NOTE REGARDING FORWARD-LOOKING STATEMENTS
PartnerRe Ltd. has made statements under the captions Business, Risk Factors, Management’s Discussion and Analysis of Financial Condition and Results of Operations, particularly under the captions “
2015
Outlook” (or similarly captioned sections) and in other sections of this annual report on Form 10-K that are forward-looking statements. In some cases, you can identify these statements by forward-looking words such as “may,” “might,” “will,” “should,” “expects,” “plans,” “anticipates,” “believes,” “estimates,” “predicts,” “potential,” or “continue,” the negative of these terms and other comparable terminology. These forward-looking statements, which are subject to risks, uncertainties and assumptions about us, may include projections of our future financial performance, our anticipated growth strategies and anticipated trends in our business. These statements are only predictions based on our current expectations and projections about future events. There are important factors that could cause our actual results, level of activity, performance or achievements to differ materially from the results, level of activity, performance or achievements expressed or implied by the forward-looking statements, including those factors described under the caption entitled Risk Factors. You should specifically consider the numerous risks outlined under Risk Factors.
Although we believe the expectations reflected in the forward-looking statements are reasonable, we cannot guarantee future results, level of activity, performance or achievements. Moreover, neither we nor any other person assumes responsibility for the accuracy and completeness of any of these forward-looking statements. We are under no duty to update any of these forward-looking statements after the date of this annual report on Form 10-K to conform our prior statements to actual results or revised expectations.
3
|
ITEM 1.
|
BUSINESS
|
General
PartnerRe Ltd., incorporated in Bermuda in August 1993, is the ultimate holding company for our international reinsurance and insurance group (collectively, the Company, PartnerRe or we). The Company predominantly provides reinsurance and certain specialty insurance lines on a worldwide basis through its principal wholly-owned subsidiaries, including Partner Reinsurance Company Ltd. (PartnerRe Bermuda), Partner Reinsurance Europe SE (PartnerRe Europe), Partner Reinsurance Company of the U.S. (PartnerRe U.S.) and, effective April 1, 2015, as discussed below, Partner Reinsurance Asia Pte. Ltd. (PartnerRe Asia). Risks reinsured include, but are not limited to, property, casualty, motor, agriculture, aviation/space, catastrophe, credit/surety, engineering, energy, marine, specialty property, specialty casualty, multiline and other lines, mortality, longevity, accident and health and alternative risk products. The Company’s alternative risk products include weather and credit protection to financial, industrial and service companies on a worldwide basis.
In 1997, recognizing the limitation of a monoline strategy, the Company shifted its strategic focus to become a leading multiline reinsurer. In July 1997, the Company completed the acquisition of SAFR (subsequently renamed PartnerRe SA and reinsurance business transferred into PartnerRe Europe), a well-established global professional reinsurer based in Paris. In December 1998, the Company completed the acquisition of the reinsurance operations of Winterthur Re, further enhancing the Company’s expansion strategy. In December 2009, the Company completed the acquisition of PARIS RE Holdings Limited (Paris Re), a French-listed, Swiss-based holding company and its operating subsidiaries. This acquisition provided the Company with enhanced strategic and financial flexibility in a less predictable and more limited growth environment.
Effective December 31, 2012, the Company completed the acquisition of Presidio Reinsurance Group, Inc. (subsequently renamed and referred herein as PartnerRe Health), a California-based United States (U.S.) specialty accident and health reinsurance and insurance writer. The Consolidated Statements of Operations and Cash Flows include PartnerRe Health’s results from January 1, 2013.
In January 2015, the Company announced that PartnerRe Asia, a wholly owned subsidiary of PartnerRe Ltd., was licensed by the Monetary Authority of Singapore (MAS) to operate as a non-life and life reinsurer in Singapore. As of April 1, 2015, PartnerRe Asia will be the principal reinsurance carrier for the Company’s business underwritten in the Asia Pacific region. The establishment of PartnerRe Asia will enable the Company’s Asian reinsurance operations to be consolidated into one regional, well-capitalized entity and supports its growing underwriting presence in the region.
On January 25, 2015, the Company entered into an Agreement and Plan of Amalgamation (the Amalgamation Agreement) with Axis Capital Holdings Limited, a Bermuda exempted company (AXIS), pursuant to which the Company will amalgamate with AXIS (the Amalgamation) and the two companies will continue as a single Bermuda exempted company (the Amalgamated Company). The transaction, which is structured as a merger of equals, has been unanimously approved by the Boards of Directors of both companies. Under the terms of the Amalgamation Agreement, the Company’s shareholders will receive 2.18 shares of the Amalgamated Company’s common shares for each share of the Company’s common shares they own and AXIS’ shareholders will receive one share of the Amalgamated Company’s common shares for each share of AXIS’ common shares they own. Upon completion of the transaction, shareholders of the Company and shareholders of AXIS will own approximately 51.6 percent and 48.4 percent of the Amalgamated Company, respectively. The Amalgamated Company’s headquarters will be located in Bermuda. This transaction is expected to provide the Company with an opportunity to enter the primary insurance market, benefit from increased scale and enhanced market presence and to achieve substantial benefits related to capital efficiencies, expense savings and business synergies. The transaction is expected to close in the second half of 2015, subject to approval by the shareholders of both companies, regulatory clearances and customary closing conditions. Both companies will continue to operate as two independent entities until all such approvals are obtained. In connection with the Amalgamation, Costas Miranthis stepped down as the Chief Executive Officer (CEO) of the Company and as a member of the Company's Board effective January 25, 2015. At that time, David Zwiener, a member of the Company's Board, assumed the position of interim CEO of the Company until completion of the Amalgamation. Under the terms of the Amalgamation Agreement, the Company suspended its share repurchase program until completion of the Amalgamation. See Risk Factors in Item 1A of Part I of this report. Except as otherwise explicitly provided herein, all discussions in this report are with respect to PartnerRe Ltd. as a standalone entity.
4
Business Strategy
The Company is in the business of assessing and assuming risk for an appropriate return. The Company creates value through its ability to understand, evaluate, diversify and distribute risk. Its strategy is founded on a capital-based risk appetite and the selected risks that Management believes will allow the Company to meet its goals for appropriate profitability and risk management within that appetite. Management believes that this construct allows the Company to balance cedants’ need for confidence of claims payment with its shareholders’ need for an appropriate return on their capital. Compound annual growth in diluted tangible book value per common share and common share equivalents outstanding plus dividends is the prime metric used by Management to measure the Company’s performance. Other important measures include operating earnings or loss attributable to PartnerRe Ltd. common shareholders, operating earnings or loss per common share and common share equivalents outstanding (diluted operating earnings or loss per share), operating return on beginning diluted book value per common share and common share equivalents outstanding (Operating ROE) and
Group Adjusted Return on Equity (Group AROE)
. These measures are referred to as non-GAAP financial measures within the meaning of Regulation G and investors should consider these non-GAAP measures in addition to, and not as a substitute for, measures of financial performance prepared in accordance with GAAP. See Key Financial Measures in Item 7 of Part II of this report for a detailed discussion of the key measures used by the Company to evaluate its financial performance, including definitions and basis of calculation.
The Company has adopted the following five-point strategy:
We are diversified across products and insurance markets:
PartnerRe writes most lines of reinsurance and writes selected specialty insurance lines of business to further diversify its earnings stream and to provide access to risks that position the Company for future growth. Management believes diversification is a competitive advantage, which increases return per unit of risk, provides access to risk worldwide and reduces the overall volatility of results. Diversification is also the cornerstone of the Company’s risk management approach. The (re)insurance business is cyclical, but cycles by line of business and by geography are rarely synchronized.
We have an appetite for risk provided it helps us deliver superior risk-adjusted returns:
PartnerRe’s products address accumulation risks, complex coverage issues and large exposures faced by clients. The Company’s book of business is focused on severity lines of business such as casualty, catastrophe, specialized property and aviation. The Company is willing to assume such above average risk, but only if the pricing implies significantly above average risk-adjusted returns. The Company’s diversification enables it to assume risks that are individually large for our clients, but are more easily diversified within PartnerRe’s portfolio. The Company also writes frequency lines of business such as standard property, motor and life, which have historically provided modestly lower levels of returns with less volatility.
We manage our capital to optimize long-term returns while maintaining an appropriate risk profile
: PartnerRe’s business is cyclical and the Company responds to that reality. The Company seeks to manage its capital to optimize shareholder returns over the reinsurance cycle, but it will not unbalance the portfolio by writing only the business that offers the highest return at any point in time. In order to manage capital appropriately across a portfolio and over a reinsurance cycle, the Company believes two things are critical: an appropriate and common measure of risk-adjusted performance and the ability and willingness to redeploy capital for its most efficient and effective use, either within the business or by returning capital to shareholders. To achieve effective and efficient capital allocation, the Company uses Operating ROE as a portfolio management tool, supported by strong actuarial and financial analysis.
We create value through superior risk evaluation and intelligent portfolio and relationship management:
The Company’s technical underwriting, actuarial and portfolio management skills enable the Company to create value by understanding, valuing, diversifying, and distributing risk. The Company’s objective is overall portfolio profitability. The aim is not to select a few highly profitable transactions in any year, but to build sustainable portfolios that can deliver superior returns over several years. While our primary focus is assuming risk for our own account, we are open to intermediating risk in order to optimize our retained portfolio and enhance overall returns.
We enhance overall returns through prudent financial and investment management and an efficient support framework:
Strong underwriting must be complemented with prudent financial management, careful reserving, superior asset management and efficient support in order to achieve the Company’s targeted returns. The Company’s principal business is the assumption of reinsurance and insurance risk and, when selecting asset strategies and support services, the Company’s priority is to support the reinsurance operations. The Company is willing to take some additional risk on its assets if it helps us generate extra return, but this risk-taking is managed so that it will not put at risk the reinsurance operations. We will not use insurance or reinsurance as a means of raising funds to pursue other goals.
5
Reinsurance and Insurance Operations
General
The Company provides reinsurance and certain specialty insurance lines for its clients in approximately 150 countries around the world. The Company’s principal offices are located in Hamilton (Bermuda), Dublin, Greenwich (Connecticut, U.S.), Paris, Singapore and Zurich.
Through its subsidiaries and branches, the Company provides reinsurance or insurance of non-life and life risks to ceding companies (primary insurers, cedants or reinsureds). Reinsurance is offered on either a proportional or non-proportional basis through treaties or facultative reinsurance.
In a proportional (or quota share) treaty reinsurance agreement, the reinsurer assumes a proportional share of the original premiums and losses incurred by the cedant. The reinsurer pays the ceding company a commission, which is generally based on the ceding company’s cost of acquiring the business being reinsured (including commissions, premium taxes, assessments and miscellaneous administrative expenses) and may also include a profit.
In a non-proportional (or excess of loss) treaty reinsurance agreement the reinsurer indemnifies the reinsured against all or a specified portion of losses on underlying insurance policies in excess of a specified amount, which is called a retention or attachment point. Non-proportional business is written in layers and a reinsurer or group of reinsurers accepts a band of coverage up to a specified amount. The total coverage purchased by the cedant is referred to as a program and is typically placed with predetermined reinsurers in pre-negotiated layers. Any liability exceeding the upper limit of the program reverts to the ceding company.
In a facultative (proportional or non-proportional) reinsurance agreement the reinsurer assumes individual risks. The reinsurer separately rates and underwrites each risk rather than assuming all or a portion of a class of risks as in the case of treaty reinsurance.
In addition, the Company provides certain specialty insurance lines of business, which include certain business written in aviation, energy, engineering, marine, specialty casualty, specialty property, health and other lines.
The Company monitors the performance of its operations in three segments, Non-life, Life and Health and Corporate and Other. Segments and the sub-segments of the Company’s Non-life segment represent markets that are reasonably homogeneous in terms of geography, client types, buying patterns, underlying risk patterns and approach to risk management. The composition of the Non-life and Life and Health segments is described in more detail below. Corporate and Other is comprised of the capital markets and investment related activities of the Company, including principal finance transactions, insurance-linked securities and strategic investments, and its corporate activities, including other expenses. See also the description of the Company’s segments and sub-segments as well as a discussion of how the Company measures its segment results in Note 21 to Consolidated Financial Statements included in Item 8 of Part II of this report.
The Company’s gross premiums written by segment for the years ended
December 31, 2014
,
2013
and
2012
were as follows (in millions of U.S. dollars):
|
2014
|
2013
|
2012
|
||||||||||
|
Non-life segment
|
$
|
4,667
|
|
$
|
4,590
|
|
$
|
3,910
|
|
|||
|
Life and Health segment
|
1,265
|
|
972
|
|
802
|
|
||||||
|
Corporate and Other segment
|
—
|
|
8
|
|
6
|
|
||||||
|
Total
|
$
|
5,932
|
|
$
|
5,570
|
|
$
|
4,718
|
|
|||
The Company’s Non-life and Life and Health businesses are geographically diversified with premiums being written on a worldwide basis. See Note 21 to Consolidated Financial Statements in Item 8 of Part II of this report for additional disclosure of the geographic distribution of gross premiums written and financial information about segments and sub-segments.
6
Non-life Segment
The Non-life segment is divided into four sub-segments, North America, Global (Non-U.S.) Property and Casualty (Global (Non-U.S.) P&C), Global Specialty and Catastrophe. The North America sub-segment includes agriculture, casualty, credit/surety, motor, multiline, property and other risks generally originating in the U.S. The Global (Non-U.S.) P&C sub-segment includes casualty, motor and property business generally originating outside of the U.S. The Global Specialty sub-segment is comprised of business that is generally considered to be specialized due to the sophisticated technical underwriting required to analyze risks, and is global in nature. This sub-segment consists of several lines of business for which the Company believes it has developed specialized knowledge and underwriting capabilities. These lines of business include agriculture, aviation/space, credit/surety, energy, engineering, marine, specialty casualty, specialty property and other lines. The Catastrophe sub-segment is comprised of the Company’s catastrophe line of business.
The gross premiums written in each of the Company’s Non-life sub-segments for the years ended
December 31, 2014
,
2013
and
2012
were as follows (in millions of U.S. dollars):
|
Non-life sub-segment
|
2014
|
2013
|
2012
|
||||||||||||||||||
|
North America
|
$
|
1,642
|
|
35
|
%
|
$
|
1,601
|
|
35
|
%
|
$
|
1,221
|
|
31
|
%
|
||||||
|
Global (Non-U.S.) P&C
|
803
|
|
17
|
|
818
|
|
18
|
|
684
|
|
18
|
|
|||||||||
|
Global Specialty
|
1,797
|
|
39
|
|
1,676
|
|
36
|
|
1,505
|
|
38
|
|
|||||||||
|
Catastrophe
|
425
|
|
9
|
|
495
|
|
11
|
|
500
|
|
13
|
|
|||||||||
|
Total
|
$
|
4,667
|
|
100
|
%
|
$
|
4,590
|
|
100
|
%
|
$
|
3,910
|
|
100
|
%
|
||||||
The gross premiums written in each Non-life sub-segment for the years ended
December 31, 2014
,
2013
and
2012
, and the year over year comparisons, are described in Results by Segment in Item 7 of Part II of this report.
Lines of Business
The gross premiums written by line of business in the Company’s Non-life segment for the years ended
December 31, 2014
,
2013
and
2012
were as follows (in millions of U.S. dollars):
|
Line of business
|
2014
|
2013
|
2012
|
||||||||||||||||||
|
Property and casualty
|
|||||||||||||||||||||
|
Casualty
|
$
|
670
|
|
14
|
%
|
$
|
660
|
|
14
|
%
|
$
|
594
|
|
15
|
%
|
||||||
|
Motor
|
394
|
|
8
|
|
365
|
|
8
|
|
240
|
|
6
|
|
|||||||||
|
Multiline and other
|
282
|
|
6
|
|
211
|
|
4
|
|
117
|
|
3
|
|
|||||||||
|
Property
|
642
|
|
14
|
|
670
|
|
15
|
|
655
|
|
17
|
|
|||||||||
|
Specialty
|
|||||||||||||||||||||
|
Agriculture
|
673
|
|
14
|
|
627
|
|
14
|
|
311
|
|
8
|
|
|||||||||
|
Aviation / Space
|
245
|
|
5
|
|
231
|
|
5
|
|
244
|
|
6
|
|
|||||||||
|
Catastrophe
|
425
|
|
9
|
|
495
|
|
11
|
|
500
|
|
13
|
|
|||||||||
|
Credit / Surety
|
399
|
|
9
|
|
354
|
|
8
|
|
327
|
|
8
|
|
|||||||||
|
Energy
|
83
|
|
2
|
|
91
|
|
2
|
|
101
|
|
3
|
|
|||||||||
|
Engineering
|
174
|
|
4
|
|
225
|
|
5
|
|
179
|
|
5
|
|
|||||||||
|
Marine
|
329
|
|
7
|
|
360
|
|
8
|
|
363
|
|
9
|
|
|||||||||
|
Specialty casualty
|
171
|
|
4
|
|
140
|
|
3
|
|
102
|
|
3
|
|
|||||||||
|
Specialty property
|
180
|
|
4
|
|
161
|
|
3
|
|
177
|
|
4
|
|
|||||||||
|
Total Non-life segment
|
$
|
4,667
|
|
100
|
%
|
$
|
4,590
|
|
100
|
%
|
$
|
3,910
|
|
100
|
%
|
||||||
Gross premiums written and the distribution of gross premiums written by line of business in the Non-life segment vary between years as a result of changes in the allocation of capital among lines of business driven by the Company’s response to market conditions and risk assessment, the timing of renewals of treaties, a change in treaty structure, premium adjustments reported by cedants, foreign exchange fluctuations and other factors. The year over year comparison of major changes in the distribution of gross premiums written by line of business for the years ended December 31, 2014, 2013 and 2012 is described in Results by Segment — Non-life Segment in Item 7 of Part II of this report.
7
The following discussion summarizes the business written in each line of business in the Company’s Non-life segment.
Agriculture
—The Company reinsures, primarily on a proportional basis, agricultural yield and price/revenue risks related to flood, drought, hail and disease related to crops, livestock and aquaculture.
Aviation/Space
—The Company provides specialized reinsurance and insurance protection for airline, general aviation and space business. The reinsurance is provided on both a proportional and non-proportional basis and through facultative arrangements. The space business relates to coverages for satellite assembly, launch, orbit and operation for commercial space programs.
Casualty
—The Company’s casualty business includes third party liability, employers’ liability, workers’ compensation and personal accident coverages written on both a proportional and non-proportional basis.
Catastrophe
—The Company provides property catastrophe reinsurance protection, written primarily on a non-proportional basis, against the accumulation of losses caused by windstorm, earthquake, tornado, tropical cyclone, flood or by any other natural hazard that is covered under a comprehensive property policy. Through the use of underwriting tools based on proprietary computer models developed by its research team, the Company combines natural science with highly professional underwriting skills in order to offer capacity at a price commensurate with the risk.
Credit/Surety
—The Company provides credit reinsurance, written primarily on a proportional basis, to mortgage guaranty insurers and commercial credit insurers. The Company’s surety line relates primarily to bonds and other forms of security written by specialized surety insurers, and is written primarily on a proportional basis.
Energy (Energy Onshore)
—The Company provides reinsurance and insurance coverage for the onshore oil and gas industry, mining, power generation and pharmaceutical operations. The reinsurance is provided predominantly on a proportional basis and through facultative arrangements.
Engineering
—The Company provides reinsurance and insurance for engineering projects throughout the world. The reinsurance is offered mainly on a proportional basis and through facultative arrangements.
Marine (Marine/Energy Offshore)
—The Company provides reinsurance and insurance protection and technical services relating to marine hull, cargo, transit and offshore oil and gas operations. The reinsurance is offered predominantly on a proportional basis and through facultative arrangements.
Motor
—The Company’s motor business includes reinsurance coverages for third party liability and property damage risks arising from both passenger and commercial fleet automobile coverages written by cedants. This business is written on a proportional and non-proportional basis.
Multiline
—The Company’s multiline business provides both property and casualty reinsurance coverages written on both a proportional and non-proportional basis and whole account coverages written on a proportional basis.
Property
—Property business provides reinsurance coverage to insurers for property damage or business interruption losses resulting from fires, catastrophes and other perils covered in industrial and commercial property and homeowners’ policies and is written on both a proportional and non-proportional basis. The Company’s most significant exposure is typically to losses from windstorm, tornado and earthquake, although the Company is exposed to losses from sources as diverse as freezes, riots, floods, industrial explosions, fires, hail and a number of other loss events. The Company’s predominant exposure under these property coverages is to property damage. However, other risks, including business interruption and other non-property losses may also be covered under a property reinsurance contract when arising from a covered peril. In accordance with market practice, the Company’s property reinsurance treaties generally exclude certain risks such as war, nuclear, biological and chemical contamination, radiation and environmental pollution.
Specialty Casualty
—The Company provides specialized reinsurance and insurance protection primarily for non-U.S. casualty business that requires specialized underwriting expertise due to the nature of the underlying risk. The reinsurance protection is offered on a proportional, non-proportional or facultative basis.
Specialty Property
—The Company provides specialized reinsurance and insurance protection that requires specialized underwriting expertise due to the nature of the underlying risk. The reinsurance protection is offered on a proportional, non-proportional or facultative basis.
In addition to the catastrophe line of business, certain other lines of business, including, but not limited to, the property, marine, energy, specialty property and multiline lines of business, also have exposure to catastrophe losses arising from natural catastrophes, such as hurricanes, windstorms, floods, tornadoes and earthquakes.
8
Distribution
The Company’s Non-life business is produced both through brokers and through direct relationships with insurance companies. In North America, business is primarily written through brokers, while in the rest of the world, the business is written on both a direct and broker basis.
For the year ended
December 31, 2014
, the Company had two brokers that individually accounted for 10% or more of its total Non-life gross premiums written: Marsh (including Guy Carpenter) accounted for approximately 25% of total Non-life gross premiums written; and the Aon Group (including the Benfield Group) accounted for approximately 22% of total Non-life gross premiums written.
The combined percentage of gross premiums written through these two brokers by Non-life sub-segment for the year ended
December 31, 2014
was as follows:
|
Non-life sub-segment
|
Percentage
|
||
|
North America
|
59
|
%
|
|
|
Global (Non-U.S.) P&C
|
31
|
|
|
|
Global Specialty
|
38
|
|
|
|
Catastrophe
|
70
|
|
|
Competition
The Company competes with other reinsurers and certain insurers, some of which have greater financial, marketing and management resources than the Company, and it also competes with new market entrants, and, specifically in the catastrophe line of business, with alternative capital sources and insurance-linked securities. Competition in the types of reinsurance and insurance that the Company underwrites is based on many factors, including the perceived and relative financial strength, pricing and other terms and conditions, services provided, ratings assigned by independent rating agencies, speed of claims payment and reputation and experience in the lines of business to be written.
The Company’s competitors include independent reinsurance companies, subsidiaries or affiliates of established worldwide insurance companies, reinsurance departments of certain primary insurance companies and, specifically in the catastrophe line of business, alternative capital sources and insurance-linked securities. Management believes that the Company’s major competitors are the larger European, U.S. and Bermuda-based international reinsurance companies, as well as specialty reinsurers and regional companies in certain local markets. These competitors include, but are not limited to, Munich Re, Swiss Re, Everest Re, Hannover Re, SCOR and the reinsurance operations of certain primary insurance companies, such as ACE, Arch Capital, AXIS and XL Group.
Management believes the Company ranks among the world’s largest professional reinsurers and is well positioned in terms of client services and highly technical underwriting expertise. Management also believes that the Company’s global franchise and diversified platform, which allows the Company to provide broad risk solutions across many lines of business and geographies, is increasingly attractive to cedants who are choosing to utilize fewer reinsurers by consolidating their reinsurance panels and focus on those reinsurers who can cover more than one line of business. Furthermore, the Company’s capitalization and strong financial ratios allow the Company to offer security to its clients. See also discussion related to the Amalgamation with AXIS in Business—General above.
Life and Health Segment
Lines of Business
The Company’s Life and Health segment includes the mortality, longevity and health lines of business written primarily in the United Kingdom (U.K.), Ireland and France and, following the acquisition of PartnerRe Health on December 31, 2012, accident and health business written in the U.S. Gross premiums written for the Life and Health segment presented below include premiums written by PartnerRe Health from January 1, 2013.
At the time of the acquisition, PartnerRe Health operated as a Managing General Agent (MGA), writing all of its business on behalf of third-party insurance companies and earning a fee for producing the business, as well as participating in a portion of the original business that was ceded to PartnerRe Health by these third parties based on quota share agreements. During 2013, the Company obtained the necessary licenses and approvals and began transitioning the portfolio to PartnerRe carriers. As of January 1, 2014, virtually all of the PartnerRe Health business was originated directly, without the use of third-party insurance companies. As a result, this transition affects the year over year comparability, with substantially increased gross premiums written in
2014
compared to
2013
.
9
The gross premiums written by line of business in the Company’s Life and Health segment for the years ended
December 31, 2014
,
2013
and
2012
(in millions of U.S. dollars) were as follows:
|
Line of business
|
2014
|
2013
|
2012
|
||||||||||||||||||
|
Accident and health
|
$
|
325
|
|
26
|
%
|
$
|
144
|
|
15
|
%
|
$
|
21
|
|
2
|
%
|
||||||
|
Longevity
|
299
|
|
23
|
|
249
|
|
26
|
|
247
|
|
31
|
|
|||||||||
|
Mortality
|
641
|
|
51
|
|
579
|
|
59
|
|
534
|
|
67
|
|
|||||||||
|
Total Life and Health segment
|
$
|
1,265
|
|
100
|
%
|
$
|
972
|
|
100
|
%
|
$
|
802
|
|
100
|
%
|
||||||
The gross premiums written in the Life and Health segment for the years ended
December 31, 2014
,
2013
and
2012
, and the year over year comparisons, are described in Results by Segment in Item 7 of Part II of this report.
The following discussion summarizes the business written in the Company’s Life and Health segment by line of business.
Accident and health—
The Company provides reinsurance coverage to primary life insurers with respect to individual and group health risks. PartnerRe Health writes specialty accident and health business, predominantly in the U.S., including Health Maintenance Organizations (HMO) reinsurance, medical reinsurance and provider and employer excess of loss programs.
Longevity—
The Company provides reinsurance coverage to employer sponsored pension schemes and primary life insurers who issue annuity contracts offering long-term retirement benefits to consumers, who seek protection against outliving their financial resources. Longevity business is written on a long-term, proportional basis primarily in the U.K. The Company’s longevity portfolio is subdivided into standard and non-standard annuities. The non-standard annuities are annuities sold to consumers with aggravated health conditions and are usually medically underwritten on an individual basis. The main risk the Company is exposed to by writing longevity business is an increase in the future life span of the insured compared to the expected life span.
Mortality
—The Company provides reinsurance coverage to primary life insurers and pension funds to protect against individual and group mortality and disability risks. Mortality business is written primarily on a proportional basis through treaty agreements. Mortality business is subdivided into death and disability covers (with various riders) primarily written in Continental Europe, term assurance and critical illness (TCI) primarily written in the U.K. and Ireland, and guaranteed minimum death benefit (GMDB) primarily written in Continental Europe. The Company also writes certain treaties on a non-proportional basis, primarily in France.
Other than gross premiums written, Management uses reinsurance business in force to measure the growth of the Company’s mortality business. Reinsurance business in force reflects the addition or acquisition of new mortality business, offset by terminations (e.g., voluntary surrenders of underlying life insurance policies, lapses of underlying policies, deaths of insureds, and the exercises of recapture option by cedants), changes in foreign exchange, and any other changes in the amount of insurance in force. The term “in force” refers to the aggregate insurance policy face amounts, or net amounts at risk. The net assumed business in force for the mortality line of business was $196 billion, $210 billion and $212 billion at
December 31, 2014
,
2013
and
2012
, respectively. The business in force at
December 31, 2014
has increased compared to
2013
and
2012
primarily due to foreign exchange, partially offset by an increase in short-term mortality business written primarily in Central Europe and Asia in 2014.
Distribution
The Company’s Life and Health business is produced both through brokers and through direct relationships with insurance companies. For the year ended
December 31, 2014
, one broker, the Aon Group (including the Benfield Group), accounted for 10% of the Life and Health segment’s total gross premiums written. No other broker contributed more than 10% and no one cedant accounted for more than 8% of the Life and Health segment’s total gross premiums written.
Competition
For the Company's Life business, the competition differs by location but generally includes multi-national reinsurers and local reinsurers or state-owned insurers in the U.K., Ireland and Continental Europe for its mortality and longevity lines of business. The competition specifically related to the PartnerRe Health business generally includes other specialty accident and health insurance and reinsurance providers in the U.S. and departments of worldwide insurance and reinsurance companies.
Reserves
General
Loss reserves represent estimates of amounts an insurer or reinsurer ultimately expects to pay in the future on claims incurred at a given time, based on facts and circumstances known at the time that the loss reserves are established. It is possible that the total
10
future payments may exceed, or be less than, such estimates. The estimates are not precise in that, among other things, they are based on predictions of future developments and estimates of future trends in claim severity, frequency and other variable factors such as inflation. During the loss settlement period, it often becomes necessary to refine and adjust the estimates of liability on a claim either upward or downward. Despite such adjustments, the ultimate future liability may exceed or be less than the revised estimates.
As part of the reserving process, insurers and reinsurers review historical data and anticipate the impact of various factors such as legislative enactments and judicial decisions that may affect potential losses from casualty claims, changes in social and political attitudes that may increase exposure to losses, mortality and morbidity trends and trends in general economic conditions. This process assumes that past experience, adjusted for the effects of current developments, is an appropriate basis for anticipating future events.
See Critical Accounting Policies and Estimates in Item 7 of Part II of this report for a discussion of the Company’s reserving process.
Non-life Reserves
The reconciliation of the gross and net Non-life reserves for unpaid losses and loss expenses for the years ended
December 31, 2014
,
2013
and
2012
was as follows (in millions of U.S. dollars):
|
2014
|
2013
|
2012
|
||||||||||
|
Gross liability at beginning of year
|
$
|
10,646
|
|
$
|
10,709
|
|
$
|
11,273
|
|
|||
|
Reinsurance recoverable at beginning of year
|
(267
|
)
|
(291
|
)
|
(353
|
)
|
||||||
|
Net liability at beginning of year
|
10,379
|
|
10,418
|
|
10,920
|
|
||||||
|
Net incurred losses related to:
|
||||||||||||
|
Current year
|
3,123
|
|
3,119
|
|
2,786
|
|
||||||
|
Prior years
|
(660
|
)
|
(721
|
)
|
(628
|
)
|
||||||
|
2,463
|
|
2,398
|
|
2,158
|
|
|||||||
|
Change in Paris Re Reserve Agreement
|
(26
|
)
|
(50
|
)
|
(86
|
)
|
||||||
|
Net paid losses
|
(2,799
|
)
|
(2,402
|
)
|
(2,705
|
)
|
||||||
|
Effects of foreign exchange rate changes
|
(486
|
)
|
15
|
|
131
|
|
||||||
|
Net liability at end of year
|
9,531
|
|
10,379
|
|
10,418
|
|
||||||
|
Reinsurance recoverable at end of year
|
215
|
|
267
|
|
291
|
|
||||||
|
Gross liability at end of year
|
$
|
9,746
|
|
$
|
10,646
|
|
$
|
10,709
|
|
|||
Net Non-life reserves for unpaid losses and loss expenses decreased from
$10,379 million
at December 31,
2013
to
$9,531 million
at December 31,
2014
and reflect the impact of foreign exchange and a relatively higher level of loss payments, mainly driven by the settlement of the 2013 crop year in the agriculture line of business of the North America sub-segment, which were partially offset by a modest increase in net losses incurred. Net Non-life reserves for unpaid losses and loss expenses of $10,418 million at December 31,
2012
and $10,379 million at December 31,
2013
were comparable and reflect the payment of losses, which was partially offset by net losses incurred.
The net incurred losses for the year ended
December 31, 2014
relating to the current and prior accident years by Non-life sub-segment were as follows (in millions of U.S. dollars):
|
North America
|
Global
(Non-U.S.)
P&C
|
Global
Specialty
|
Catastrophe
|
Total
Non-life
segment
|
||||||||||||||||
|
Net incurred losses related to:
|
||||||||||||||||||||
|
Current year
|
$
|
1,251
|
|
$
|
572
|
|
$
|
1,221
|
|
$
|
79
|
|
$
|
3,123
|
|
|||||
|
Net prior year favorable loss development
|
(251
|
)
|
(134
|
)
|
(258
|
)
|
(17
|
)
|
(660
|
)
|
||||||||||
|
Total net incurred losses
|
$
|
1,000
|
|
$
|
438
|
|
$
|
963
|
|
$
|
62
|
|
$
|
2,463
|
|
|||||
The net favorable loss development on prior accident years of
$660
million for the year ended
December 31, 2014
primarily resulted from favorable loss emergence, as losses reported by cedants were lower than expected. The most significant drivers of the Non-life net prior year favorable loss development during the year ended
December 31, 2014
were the casualty line of business in the North America sub-segment, the property line of business in the Global (Non-U.S.) P&C and Global Specialty sub-segments and
11
the marine and aviation lines of business in the Global Specialty sub-segment. See Management’s Discussion and Analysis of Financial Condition and Results of Operations for a more detailed discussion of net prior year favorable loss development by Non-life sub-segment and Critical Accounting Policies and Estimates—Losses and Loss Expenses and Life Policy Benefits in Item 7 of Part II of this report for a discussion of the net prior year favorable loss development by reserving lines for the Company’s Non-life operations.
Reserve Agreement
On December 21, 2006, Colisée Re (formerly known as AXA RE), a subsidiary of AXA SA (AXA) transferred substantially all of its assets and liabilities, other than specified reinsurance and retrocession agreements and certain other excluded assets and liabilities, to PARIS RE Holdings SA’s French operating subsidiary Paris Re France (AXA Transfer) (Paris Re France). The AXA Transfer was immediately followed by the acquisition by Paris Re of all the outstanding capital stock of Paris Re France (AXA Acquisition). In connection with the AXA Acquisition, AXA, Colisée Re and Paris Re entered into various agreements (2006 Acquisition Agreements).
On the closing of the AXA Acquisition, AXA, Colisée Re and Paris Re France entered into a reserve agreement (Reserve Agreement). The Reserve Agreement provides that AXA and Colisée Re shall guarantee reserves in respect of Paris Re France and subsidiaries acquired in the AXA Acquisition. The Reserve Agreement covers losses incurred prior to December 31, 2005, including any adverse development in respect thereof, by the subsidiaries of Colisée Re transferred to Paris Re France as part of the 2006 Acquisition Agreements, in respect of reinsurance policies issued or renewed, and in respect of which premiums were earned, on or prior to December 31, 2005 (but excluding any amendments thereto effected after the closing of the 2006 Acquisition Agreements).
Pursuant to the Reserve Agreement, AXA has agreed to cause AXA Liabilities Managers, an affiliate of Colisée Re (AXA LM), to provide Paris Re France with periodic reports setting forth the amount of losses incurred in respect of the business guaranteed by AXA. The reserve guarantee provided by AXA and Colisée Re is conditioned upon, among other things, the guaranteed business, including all related ceded reinsurance, being managed by AXA LM. The Reserve Agreement further contemplates that Colisée Re or Paris Re France, as the case may be, shall pay to the other party amounts equal to any deficiency or surplus in the transferred reserves with respect to losses incurred, such losses being net of any recovery by Colisée Re including through retrocessional protection, salvage or subrogation. During the year ended December 31, 2012, pursuant to the terms of the Reserve Agreement with Colisée Re, the Company settled the payable to Colisée Re of approximately $265 million based on the estimated cumulative balance of net favorable prior year loss development related to the guaranteed reserves. The settlement was funded by the sale of assets underlying the funds held – directly managed account. During the year ended December 31, 2014, the Company commuted
a portion of the Reserve Agreement with Colisée Re, which resulted in a portion
of reserves and investments underlying the funds held – directly managed account being returned to Colisée Re.
See Financial Condition, Liquidity and Capital Resources—Funds Held – Directly Managed in Item 7 of Part II and Note 8 to Consolidated Financial Statements in Item 8 of Part II of this report for more detail.
The rights and obligations of AXA LM with respect to the management of this business are set forth in a run off services and management agreement among AXA LM, Colisée Re and Paris Re France (Run Off Services and Management Agreement). Under the Run Off Services and Management Agreement, Paris Re has agreed that AXA LM will manage claims arising from all reinsurance and retrocession contracts subject to the Reserve Agreement, either directly or, for contracts that were issued by certain Colisée Re entities identified in the agreement, by delegation to certain other specified entities, including Paris Re France. This includes contract administration, the administration of ceded reinsurance, claims handling, settlements and business commutations. Although Paris Re France has certain consultation rights in connection with the management of the run-off of the contracts subject to the Reserve Agreement, AXA LM does not need to obtain Paris Re France’s prior consent in connection with claims handling and settlements, and no consent is required for business commutations if the amount of case reserves related to contracts does not exceed €100 million in any twelve month period.
On October 1, 2010, PartnerRe Europe and Paris Re France effected a cross border merger whereby all the assets and liabilities of Paris Re France were transferred to PartnerRe Europe, including the agreements between Paris Re France and Colisée Re.
Changes in Non-life Reserves
The gross, retroceded and net reserves for unpaid losses and loss expenses for the Company’s Non-life business, and the portion of the gross, retroceded and net reserves that relates to the reserves subject to the Reserve Agreement (Guaranteed Reserves), at
December 31, 2014
and
2013
were as follows (in thousands of U.S. dollars):
12
|
2014
|
2013
|
|||||||
|
Gross reserves
|
$
|
9,745,806
|
|
$
|
10,646,318
|
|
||
|
Less: Guaranteed Reserves
|
581,173
|
|
732,386
|
|
||||
|
Gross reserves, excluding Guaranteed Reserves
|
9,164,633
|
|
9,913,932
|
|
||||
|
Retroceded reserves
|
214,349
|
|
267,384
|
|
||||
|
Less: Guaranteed Reserves
|
6,212
|
|
5,549
|
|
||||
|
Retroceded reserves, excluding Guaranteed Reserves
|
208,137
|
|
261,835
|
|
||||
|
Net reserves
|
$
|
9,531,457
|
|
$
|
10,378,934
|
|
||
|
Net reserves, excluding Guaranteed Reserves
|
$
|
8,956,496
|
|
$
|
9,652,097
|
|
||
The reconciliation of the net paid losses related to prior years and the net paid losses related to prior years, excluding the paid losses for the Guaranteed Reserves, for the years ended
December 31, 2014
,
2013
and
2012
was as follows (in thousands of U.S. dollars):
|
2014
|
2013
|
2012
|
||||||||||
|
Net paid losses related to prior years
|
$
|
2,530,743
|
|
$
|
2,159,506
|
|
$
|
2,467,279
|
|
|||
|
Less: net paid losses on Guaranteed Reserves
|
97,407
|
|
82,997
|
|
90,407
|
|
||||||
|
Net paid losses related to prior years, excluding Guaranteed Reserves
|
$
|
2,433,336
|
|
$
|
2,076,509
|
|
$
|
2,376,872
|
|
|||
The Guaranteed Reserves have been excluded from the following tables that analyze the development of the Company’s net reserves for unpaid losses and loss expenses for the Company’s Non-life business given the Reserve Agreement covers any adverse or favorable development related to the reserves acquired by Paris Re in the AXA Acquisition, and therefore, they have no impact on the development of the Company’s gross and net reserves for unpaid losses and loss expenses.
The development of net reserves for unpaid losses and loss expenses for the Company’s Non-life business, excluding Guaranteed Reserves, is shown in the following table. The table begins by showing the initial reported year-end gross and net reserves, including incurred but not reported (IBNR) reserves, recorded at the balance sheet date for each of the ten years presented.
The next section of the table shows the re-estimated amount of the initial reported net reserves, excluding Guaranteed Reserves, for up to ten subsequent years, based on experience at the end of each subsequent year. The re-estimated net liabilities reflect additional information, received from cedants or obtained through reviews of industry trends, regarding claims incurred prior to the end of the preceding financial year. A redundancy (or deficiency) arises when the re-estimation of reserves is less (or greater) than its estimation at the preceding year-end. The cumulative redundancies (or deficiencies) reflect cumulative differences between the initial reported net reserves and the currently re-estimated net reserves. Annual changes in the estimates are reflected in the income statement for each year as the liabilities are re-estimated. Reserves denominated in foreign currencies are revalued at each year-end’s foreign exchange rates.
The lower section of the table shows the portion of the initial year-end net reserves, excluding Guaranteed Reserves, that were paid (claims paid) as of the end of subsequent years. This section of the table provides an indication of the portion of the re-estimated net liability that is settled and is unlikely to develop in the future. Claims paid are converted to U.S. dollars at the average foreign exchange rates during the year of payment and are not revalued at the current year foreign exchange rates. Because claims paid in prior years are not revalued at the current year’s foreign exchange rates, the difference between the cumulative claims paid at the end of any given year and the immediately previous year represents the claims paid during the year.
13
Development of Loss and Loss Expense Reserves (Excluding Guaranteed Reserves subject to the Reserve Agreement)
(in thousands of U.S. dollars)
|
2004
|
2005
|
2006
|
2007
|
2008
|
2009
(1)
|
2010
|
2011
|
2012
|
2013
|
2014
|
||||||||||||||||||||||||||||||||||
|
Gross liability for unpaid losses and loss expenses, excluding Guaranteed Reserves
|
$
|
5,766,629
|
|
$
|
6,737,661
|
|
$
|
6,870,785
|
|
$
|
7,231,436
|
|
$
|
7,510,666
|
|
$
|
9,248,529
|
|
$
|
9,379,028
|
|
$
|
10,234,291
|
|
$
|
9,845,255
|
|
$
|
9,913,932
|
|
$
|
9,164,633
|
|
|||||||||||
|
Retroceded liability for unpaid losses and loss expenses, excluding Guaranteed Reserves
|
153,018
|
|
185,280
|
|
138,585
|
|
132,479
|
|
125,215
|
|
270,938
|
|
300,648
|
|
325,841
|
|
283,955
|
|
261,835
|
|
208,137
|
|
||||||||||||||||||||||
|
Net liability for unpaid losses and loss expenses, excluding Guaranteed Reserves
|
$
|
5,613,611
|
|
$
|
6,552,381
|
|
$
|
6,732,200
|
|
$
|
7,098,957
|
|
$
|
7,385,451
|
|
$
|
8,977,591
|
|
$
|
9,078,380
|
|
$
|
9,908,450
|
|
$
|
9,561,300
|
|
$
|
9,652,097
|
|
$
|
8,956,496
|
|
|||||||||||
|
Net liability re-estimated, excluding Guaranteed Reserves at:
|
||||||||||||||||||||||||||||||||||||||||||||
|
One year later
|
5,006,767
|
|
6,602,832
|
|
6,715,107
|
|
6,343,714
|
|
7,076,796
|
|
8,354,221
|
|
8,505,130
|
|
9,409,795
|
|
8,853,321
|
|
8,542,349
|
|
||||||||||||||||||||||||
|
Two years later
|
5,044,922
|
|
6,618,112
|
|
6,165,297
|
|
6,009,194
|
|
6,686,926
|
|
7,877,438
|
|
8,076,932
|
|
8,885,350
|
|
8,047,122
|
|
||||||||||||||||||||||||||
|
Three years later
|
5,092,289
|
|
6,168,445
|
|
5,897,044
|
|
5,674,509
|
|
6,351,663
|
|
7,595,556
|
|
7,751,543
|
|
8,340,019
|
|
||||||||||||||||||||||||||||
|
Four years later
|
4,845,644
|
|
6,002,031
|
|
5,645,132
|
|
5,409,460
|
|
6,195,352
|
|
7,346,493
|
|
7,309,864
|
|
||||||||||||||||||||||||||||||
|
Five years later
|
4,731,856
|
|
5,802,799
|
|
5,436,353
|
|
5,282,511
|
|
6,074,551
|
|
6,981,981
|
|
||||||||||||||||||||||||||||||||
|
Six years later
|
4,595,232
|
|
5,627,952
|
|
5,323,062
|
|
5,200,087
|
|
5,853,573
|
|
||||||||||||||||||||||||||||||||||
|
Seven years later
|
4,467,678
|
|
5,551,669
|
|
5,264,917
|
|
5,042,978
|
|
||||||||||||||||||||||||||||||||||||
|
Eight years later
|
4,426,580
|
|
5,507,151
|
|
5,141,047
|
|
||||||||||||||||||||||||||||||||||||||
|
Nine years later
|
4,399,890
|
|
5,421,683
|
|
||||||||||||||||||||||||||||||||||||||||
|
Ten years later
|
4,351,382
|
|
||||||||||||||||||||||||||||||||||||||||||
|
Cumulative net redundancy
|
$
|
1,262,229
|
|
$
|
1,130,698
|
|
$
|
1,591,153
|
|
$
|
2,055,979
|
|
$
|
1,531,878
|
|
$
|
1,995,610
|
|
$
|
1,768,516
|
|
$
|
1,568,431
|
|
$
|
1,514,178
|
|
$
|
1,109,748
|
|
||||||||||||||
|
Cumulative amount of net liability paid through:
|
||||||||||||||||||||||||||||||||||||||||||||
|
One year later
|
$
|
1,250,534
|
|
$
|
1,718,996
|
|
$
|
1,473,964
|
|
$
|
1,340,788
|
|
$
|
1,716,798
|
|
$
|
2,094,379
|
|
$
|
1,923,267
|
|
$
|
2,376,872
|
|
$
|
2,076,509
|
|
$
|
2,433,336
|
|
||||||||||||||
|
Two years later
|
1,821,773
|
|
2,482,695
|
|
2,116,025
|
|
1,971,376
|
|
2,448,950
|
|
2,983,833
|
|
2,872,951
|
|
3,494,429
|
|
3,203,562
|
|
||||||||||||||||||||||||||
|
Three years later
|
2,207,692
|
|
2,948,837
|
|
2,581,022
|
|
2,470,068
|
|
2,991,497
|
|
3,599,683
|
|
3,548,021
|
|
4,317,484
|
|
||||||||||||||||||||||||||||
|
Four years later
|
2,511,446
|
|
3,273,808
|
|
2,932,356
|
|
2,818,018
|
|
3,359,297
|
|
4,060,903
|
|
4,065,611
|
|
||||||||||||||||||||||||||||||
|
Five years later
|
2,721,266
|
|
3,534,003
|
|
3,183,573
|
|
3,070,717
|
|
3,636,744
|
|
4,415,890
|
|
||||||||||||||||||||||||||||||||
|
Six years later
|
2,898,779
|
|
3,713,402
|
|
3,349,279
|
|
3,268,994
|
|
3,866,859
|
|
||||||||||||||||||||||||||||||||||
|
Seven years later
|
3,043,151
|
|
3,834,448
|
|
3,494,055
|
|
3,450,927
|
|
||||||||||||||||||||||||||||||||||||
|
Eight years later
|
3,128,606
|
|
3,940,622
|
|
3,639,726
|
|
||||||||||||||||||||||||||||||||||||||
|
Nine years later
|
3,215,722
|
|
4,057,649
|
|
||||||||||||||||||||||||||||||||||||||||
|
Ten years later
|
3,316,454
|
|
||||||||||||||||||||||||||||||||||||||||||
|
(1)
|
Paris Re’s liability for unpaid losses and loss expenses was included at December 31, 2009 for the first time. For years prior to 2009, this table excludes the reserves of the Paris Re companies acquired. Accordingly, the reserve development (net liability for unpaid losses and loss expenses at the end of the year, as originally estimated, less net liability for unpaid losses and loss expenses re-estimated as of subsequent years) for years prior to 2009 relates only to losses recorded by PartnerRe and subsidiaries not acquired in the Paris Re acquisition.
|
14
The reconciliation of the Company’s re-estimated gross year-end reserves with the re-estimated net year-end reserves at
December 31, 2014
provided above was as follows (in thousands of U.S. dollars):
|
2004
|
2005
|
2006
|
2007
|
2008
|
2009
|
2010
|
2011
|
2012
|
2013
|
|||||||||||||||||||||||||||||||
|
Reconciliation of gross reserves:
|
||||||||||||||||||||||||||||||||||||||||
|
Gross liability re-estimated, excluding Guaranteed Reserves
|
$
|
4,454,453
|
|
$
|
5,589,078
|
|
$
|
5,240,847
|
|
$
|
5,126,917
|
|
$
|
5,958,878
|
|
$
|
7,187,161
|
|
$
|
7,546,010
|
|
$
|
8,614,425
|
|
$
|
8,322,626
|
|
$
|
8,772,864
|
|
||||||||||
|
Re-estimated retroceded liability, excluding Guaranteed Reserves
|
103,071
|
|
167,395
|
|
99,800
|
|
83,939
|
|
105,305
|
|
205,180
|
|
236,146
|
|
274,406
|
|
275,504
|
|
230,515
|
|
||||||||||||||||||||
|
Net liability re-estimated, excluding Guaranteed Reserves
|
$
|
4,351,382
|
|
$
|
5,421,683
|
|
$
|
5,141,047
|
|
$
|
5,042,978
|
|
$
|
5,853,573
|
|
$
|
6,981,981
|
|
$
|
7,309,864
|
|
$
|
8,340,019
|
|
$
|
8,047,122
|
|
$
|
8,542,349
|
|
||||||||||
|
Cumulative gross redundancy
|
$
|
1,312,176
|
|
|
$
|
1,148,583
|
|
|
$
|
1,629,938
|
|
|
$
|
2,104,519
|
|
|
$
|
1,551,788
|
|
|
$
|
2,061,368
|
|
|
$
|
1,833,018
|
|
|
$
|
1,619,866
|
|
|
$
|
1,522,629
|
|
|
$
|
1,141,068
|
|
|
The Company’s reserve development is composed of the change in ultimate losses from what the Company originally estimated as well as the impact of the foreign exchange revaluation on reserves. The Company conducts its reinsurance operations in a variety of non-U.S. currencies and records its net reserves in the currency of the treaty, with the principal exposures being the euro, Canadian dollar, British pound and New Zealand dollar. The impact of reporting the Company’s net reserves based on the foreign exchange rates at the balance sheet date can be a significant component of the cumulative redundancy or deficiency in net reserves and in some years can be the principal component. The amount of foreign exchange included in the cumulative net redundancy reported above as well as the net redundancy excluding the impact of foreign exchange movements on net reserves were as follows (in thousands of U.S. dollars):
|
2004
|
2005
|
2006
|
2007
|
2008
|
2009
|
2010
|
2011
|
2012
|
2013
|
|||||||||||||||||||||||||||||||
|
Cumulative net redundancy
|
$
|
1,262,229
|
|
$
|
1,130,698
|
|
$
|
1,591,153
|
|
$
|
2,055,979
|
|
$
|
1,531,878
|
|
$
|
1,995,610
|
|
$
|
1,768,516
|
|
$
|
1,568,431
|
|
$
|
1,514,178
|
|
$
|
1,109,748
|
|
||||||||||
|
Less: Cumulative net redundancy (deficiency) due to foreign exchange
|
163,633
|
|
|
(355,937
|
)
|
|
(110,240
|
)
|
|
377,849
|
|
|
7,928
|
|
|
266,604
|
|
|
161,388
|
|
|
139,350
|
|
|
315,415
|
|
|
449,335
|
|
|||||||||||
|
Cumulative net redundancy excluding the impact of foreign exchange
|
$
|
1,098,596
|
|
|
$
|
1,486,635
|
|
|
$
|
1,701,393
|
|
|
$
|
1,678,130
|
|
|
$
|
1,523,950
|
|
|
$
|
1,729,006
|
|
|
$
|
1,607,128
|
|
|
$
|
1,429,081
|
|
|
$
|
1,198,763
|
|
|
$
|
660,413
|
|
|
Movements in foreign exchange rates between accounting periods have typically resulted in significant variations in the Company’s loss reserves as the U.S. dollar, the Company’s reporting currency, appreciated/depreciated against multiple currencies. The Company, however, generally holds investments in the same currencies as its net reserves, or enters into derivative foreign exchange contracts, with the intent of matching the foreign exchange movements on its assets and liabilities. See Quantitative and Qualitative Disclosures about Market Risk contained in Item 7A of Part II of this report for a more detailed discussion of the foreign currency risk of the Company’s assets and liabilities.
The Company believes that in order to enhance the understanding of its reserve development, it is useful for investors to evaluate the Company’s reserve development excluding the impact of foreign exchange. The development of initial net reserves converted at each year’s average foreign exchange rates is shown in the following table (in thousands of U.S. dollars). Using the historical average foreign exchange rates for the development lines of the table has the effect of linking each year’s development with that year’s income statement. This table should not be considered as a substitute for the table provided above as it does not reflect a significant portion of the initial net reserve development that is due to foreign exchange revaluation.
15
|
2004
|
2005
|
2006
|
2007
|
2008
|
2009
|
2010
|
2011
|
2012
|
2013
|
|||||||||||||||||||||||||||||||
|
Net liability for unpaid losses and loss expenses, excluding Guaranteed Reserves
|
$
|
5,613,611
|
|
$
|
6,552,381
|
|
$
|
6,732,200
|
|
$
|
7,098,957
|
|
$
|
7,385,451
|
|
$
|
8,977,591
|
|
$
|
9,078,380
|
|
$
|
9,908,450
|
|
$
|
9,561,300
|
|
$
|
9,652,097
|
|
||||||||||
|
Net liability re-estimated, excluding Guaranteed Reserves at:
|
||||||||||||||||||||||||||||||||||||||||
|
One year later
|
5,382,101
|
|
6,300,633
|
|
6,318,157
|
|
6,681,021
|
|
6,899,642
|
|
8,499,708
|
|
8,547,923
|
|
9,280,385
|
|
8,839,801
|
|
8,991,684
|
|
||||||||||||||||||||
|
Two years later
|
5,232,707
|
|
6,023,025
|
|
6,014,782
|
|
6,222,150
|
|
6,597,688
|
|
8,052,350
|
|
8,035,622
|
|
8,754,182
|
|
8,362,537
|
|
||||||||||||||||||||||
|
Three years later
|
5,076,765
|
|
5,774,643
|
|
5,640,480
|
|
5,961,748
|
|
6,300,375
|
|
7,705,719
|
|
7,696,432
|
|
8,479,369
|
|
||||||||||||||||||||||||
|
Four years later
|
4,972,632
|
|
5,521,034
|
|
5,451,479
|
|
5,738,024
|
|
6,098,886
|
|
7,441,966
|
|
7,471,252
|
|
||||||||||||||||||||||||||
|
Five years later
|
4,794,445
|
|
5,376,045
|
|
5,278,886
|
|
5,575,292
|
|
5,951,968
|
|
7,248,585
|
|
||||||||||||||||||||||||||||
|
Six years later
|
4,704,184
|
|
5,232,117
|
|
5,132,300
|
|
5,470,571
|
|
5,861,501
|
|
||||||||||||||||||||||||||||||
|
Seven years later
|
4,604,022
|
|
5,126,778
|
|
5,053,740
|
|
5,420,827
|
|
||||||||||||||||||||||||||||||||
|
Eight years later
|
4,541,584
|
|
5,064,029
|
|
5,030,807
|
|
||||||||||||||||||||||||||||||||||
|
Nine years later
|
4,498,996
|
|
5,065,746
|
|
||||||||||||||||||||||||||||||||||||
|
Ten years later
|
4,515,015
|
|
||||||||||||||||||||||||||||||||||||||
|
Cumulative net redundancy
|
$
|
1,098,596
|
|
$
|
1,486,635
|
|
$
|
1,701,393
|
|
$
|
1,678,130
|
|
$
|
1,523,950
|
|
$
|
1,729,006
|
|
$
|
1,607,128
|
|
$
|
1,429,081
|
|
$
|
1,198,763
|
|
$
|
660,413
|
|
||||||||||
16
Other P&C Exposures
The Company’s reserve for unpaid losses and loss expenses at
December 31, 2014
includes reserves that are difficult to estimate using traditional reserving methodologies. See Critical Accounting Policies and Estimates—Losses and Loss Expenses and Life Policy Benefits in Item 7 of Part II of this report for additional information and discussion of the uncertainties and complexities related to the Japan Earthquake, 2010 New Zealand Earthquake and 2011 New Zealand Earthquakes and the Company’s exposure to claims arising from asbestos and environmental exposures.
There can be no assurance that the reserves established by the Company will not be adversely affected by development of other latent exposures, and further, there can be no assurance that the reserves established by the Company will be adequate. However, they represent Management’s best estimate for ultimate losses based on available information at this time.
Life and Health Reserves
The reconciliation of the gross and
net life and health reserves
for the years ended
December 31, 2014
,
2013
and
2012
was as follows (in millions of U.S. dollars):
|
2014
|
2013
|
2012
|
||||||||||
|
Gross liability at beginning of year
|
$
|
1,974
|
|
$
|
1,813
|
|
$
|
1,646
|
|
|||
|
Reinsurance recoverable at beginning of year
|
(7
|
)
|
(20
|
)
|
(10
|
)
|
||||||
|
Net liability at beginning of year
|
1,967
|
|
1,793
|
|
1,636
|
|
||||||
|
Net liability acquired related to PartnerRe Health
|
—
|
|
—
|
|
54
|
|
||||||
|
Net incurred losses related to:
|
||||||||||||
|
Current year
|
1,019
|
|
800
|
|
661
|
|
||||||
|
Prior years
|
(19
|
)
|
(39
|
)
|
(14
|
)
|
||||||
|
1,000
|
|
761
|
|
647
|
|
|||||||
|
Net paid losses
|
(781
|
)
|
(626
|
)
|
(594
|
)
|
||||||
|
Effects of foreign exchange rate changes
|
(165
|
)
|
39
|
|
50
|
|
||||||
|
Net liability at end of year
|
2,021
|
|
1,967
|
|
1,793
|
|
||||||
|
Reinsurance recoverable at end of year
|
29
|
|
7
|
|
20
|
|
||||||
|
Gross liability at end of year
|
$
|
2,050
|
|
$
|
1,974
|
|
$
|
1,813
|
|
|||
The increase in
net life and health reserves
from
$1,967
million at
December 31, 2013
to
$2,021 million
at
December 31, 2014
was primarily due to net incurred losses, driven mainly by an increase in business written, which were partially offset by paid losses and the impact of foreign exchange. The increase in
net life and health reserves
from $1,793 million at December 31, 2012 to $1,967 million at December 31, 2013 is primarily due to net incurred losses and the impact of foreign exchange, which were partially offset by paid losses. The net incurred losses for the Company’s life and health reserves will generally exceed net paid losses in any one given year due to the long-term nature of the liabilities and the growth in the book of business.
For the year ended
December 31, 2014
, the Company experienced net prior year favorable loss development of
$19 million
, which was
primarily related to the GMDB business and certain short-term treaties in the mortality line of business and PartnerRe Health in the health and accident line of business.
There was no prior year loss development in 2014 related to the Company’s longevity line of business.
The Company’s gross, ceded and
net life and health reserves
by line of business at
December 31, 2014
and
2013
were as follows (in millions of U.S. dollars):
|
Line of business
|
2014
|
2013
|
||||||
|
Accident and health
|
$
|
228
|
|
$
|
99
|
|
||
|
Longevity
|
510
|
|
556
|
|
||||
|
Mortality
|
1,312
|
|
1,319
|
|
||||
|
Gross
life and health reserves
|
2,050
|
|
1,974
|
|
||||
|
Ceded
life and health reserves
|
(29
|
)
|
(7
|
)
|
||||
|
Net
life and health reserves
|
$
|
2,021
|
|
$
|
1,967
|
|
||
17
Investments and Investments underlying the Funds Held—Directly Managed Account
The Company has developed specific investment objectives and guidelines for the management of its investment portfolio and the investments underlying the funds held – directly managed account (see below for details). These objectives and guidelines stress diversification of risk, matching of the underlying liability payments, low credit risk and stability of portfolio income. Despite the prudent focus of these objectives and guidelines, the Company’s investments are subject to general market risk, as well as to risks inherent in particular securities.
The Company’s investment strategy is largely consistent with previous years. To ensure that the Company will have sufficient assets to pay its clients’ claims, the Company’s investment philosophy distinguishes between those assets, including the investments underlying the funds held – directly managed account, that are matched against existing liabilities (liability funds) and those that represent shareholders’ equity (capital funds). Liability funds are invested in high quality fixed income securities and cash and cash equivalents. Capital funds are available for investing in a broadly diversified portfolio, which includes investments in preferred and common stocks, private bond and equity investments, investment grade and below investment grade securities and other asset classes that offer potentially higher returns.
Investments
The Company’s investment portfolio, excluding the funds held – directly managed account which is discussed below, includes fixed maturities, short-term investments and equities that are classified as trading securities and recorded at fair value, and other invested assets. The carrying values of the Company’s investments at
December 31, 2014
and
2013
were as follows (in millions of U.S. dollars):
|
|
2014
|
2013
|
||||||||||||
|
Fixed maturities
|
||||||||||||||
|
U.S. government and government sponsored enterprises
|
$
|
2,316
|
|
15
|
%
|
$
|
1,624
|
|
11
|
%
|
||||
|
U.S. states, territories and municipalities
|
531
|
|
3
|
|
124
|
|
1
|
|
||||||
|
Non-U.S. sovereign government, supranational and government related
|
1,976
|
|
13
|
|
2,354
|
|
15
|
|
||||||
|
Corporate
|
5,604
|
|
37
|
|
6,049
|
|
40
|
|
||||||
|
Asset-backed securities
|
1,131
|
|
8
|
|
1,138
|
|
8
|
|
||||||
|
Residential mortgage-backed securities
|
2,306
|
|
15
|
|
2,268
|
|
15
|
|
||||||
|
Other mortgage-backed securities
|
55
|
|
—
|
|
36
|
|
—
|
|
||||||
|
Total fixed maturities
|
$
|
13,919
|
|
91
|
%
|
$
|
13,593
|
|
90
|
%
|
||||
|
Short-term investments
|
25
|
|
—
|
|
14
|
|
—
|
|
||||||
|
Equities
|
1,057
|
|
7
|
|
1,221
|
|
8
|
|
||||||
|
Other invested assets
|
299
|
|
2
|
|
321
|
|
2
|
|
||||||
|
Total investments
|
$
|
15,300
|
|
100
|
%
|
$
|
15,149
|
|
100
|
%
|
||||
|
(1)
|
In addition to the total investments shown in the above table of
$15.3 billion
and
$15.1 billion
at
December 31, 2014
and
2013
, respectively, the Company held cash and cash equivalents of
$1.3 billion
and
$1.5 billion
, respectively.
|
The increase in the fair value of the Company’s fixed maturities at
December 31, 2014
compared to
December 31, 2013
, primarily reflects decreases in U.S. and European risk-free interest rates, the reinvestment of cash flows from operations and net investment income, which were partially offset by the impact of the strengthening of the U.S. dollar against most major currencies. At
December 31, 2014
, there has been a shift in the distribution of the fixed maturity portfolio compared to
December 31, 2013
as the Company decreased its holdings of corporate bonds (primarily due to modestly narrowing credit spreads) and non-U.S. sovereign government fixed maturities and increased its holdings of U.S. government and U.S. states, territories and municipalities securities.
The overall average credit rating of the portfolio at
December 31, 2014
was
A
, and
92%
of the fixed maturities and short-term investments were rated investment grade (BBB- or higher) by Standard & Poor’s. For further discussion of the composition of the investment portfolio, see Financial Condition, Liquidity and Capital Resources—Investments in Item 7 of Part II of this report.
The investment portfolio is divided and managed by strategy and legal entity. Each segregated portfolio is managed against a specific benchmark to properly control the risk of each portfolio as well as the aggregate risks of the combined portfolio. The performance of each portfolio and the aggregate investment portfolio is measured against several benchmarks to ensure that they have the appropriate risk and return characteristics.
18
In order to manage the risks of the investment portfolio, several controls are in place. First, the overall duration (interest rate risk) of the portfolio is managed relative to the duration of the net reinsurance liabilities, defined as reinsurance liabilities net of all reinsurance assets, so that the economic value of changes in interest rates have offsetting effects on the Company’s assets and liabilities. Second, to ensure diversification and avoid aggregation of risks, limits on assets types, economic sector exposure, industry exposure and individual security exposure are placed on the investment portfolio. These exposures are monitored on an ongoing basis and reported at least quarterly to the Risk and Finance Committee of the Board of Directors (Board). See Risk Management below for a discussion of Market Risk, Interest Rate Risk and Default and Credit Spread Risk. See Quantitative and Qualitative Disclosures About Market Risk in Item 7A of Part II of this report for a discussion of the Company’s interest rate, equity and foreign currency management strategies.
Investments underlying the Funds Held—Directly Managed Account
Following the AXA Acquisition, Paris Re France and certain subsidiaries entered into an Issuance Agreement with Colisée Re to enable Colisée Re to write business on behalf of Paris Re France between January 1, 2006 and September 30, 2007. In addition, effective January 1, 2006, Paris Re France and Colisée Re entered into 100% quota share retrocession agreements to transfer the benefits and risks of Colisée Re’s reinsurance agreements to Paris Re and provide for the payment of premiums to Paris Re France in consideration for reinsuring the covered liabilities (the Quota Share Retrocession Agreement). The Quota Share Retrocession Agreement provides that these premiums will be on a funds withheld basis. Paris Re France will receive any surplus, and be responsible for any deficits remaining with respect to the funds held – directly managed account, after all liabilities have been discharged and payments pursuant to the Reserve Agreement have been settled. In addition, realized and unrealized investment gains and losses and net investment income related to the investment portfolio underlying the funds held – directly managed account inure to the benefit of Paris Re France. The investments underlying the funds held – directly managed account were predominantly maintained by Colisée Re in a segregated investment portfolio and managed by the Company. The Company’s strategy related to the management of the funds held – directly managed account is as described above related to the Company’s investment portfolio.
The Company’s investment portfolio underlying the funds held – directly managed account includes fixed maturities and short-term investments that are recorded at fair value, and other invested assets. The carrying values of the investments underlying the funds held – directly managed account at
December 31, 2014
and
2013
were as follows (in millions of U.S. dollars):
|
|
2014
|
2013
|
||||||||||||
|
Fixed maturities
|
||||||||||||||
|
U.S. government and government sponsored enterprises
|
$
|
154
|
|
32
|
%
|
$
|
158
|
|
28
|
%
|
||||
|
Non-U.S. sovereign government, supranational and government related
|
128
|
|
27
|
|
137
|
|
25
|
|
||||||
|
Corporate
|
177
|
|
38
|
|
249
|
|
44
|
|
||||||
|
Total fixed maturities
|
$
|
459
|
|
97
|
%
|
$
|
544
|
|
97
|
%
|
||||
|
Short-term investments
|
—
|
|
—
|
|
2
|
|
—
|
|
||||||
|
Other invested assets
|
14
|
|
3
|
|
15
|
|
3
|
|
||||||
|
Total investments
|
$
|
473
|
|
100
|
%
|
$
|
561
|
|
100
|
%
|
||||
|
(1)
|
In addition to the investments underlying the funds held – directly managed account shown in the above table of
$473
million and
$561
million at
December 31, 2014
and
2013
, respectively, the funds held – directly managed account also included cash and cash equivalents of
$42 million
and $85 million, respectively, accrued investment income of
$6 million
and $7 million, respectively, and other assets and liabilities held by Colisée Re related to the underlying business of
$88 million
and $133 million, respectively.
|
The decrease in the fair value of the investment portfolio underlying the funds held – directly managed account at
December 31, 2014
compared to
December 31, 2013
was primarily related to the commutation of a portion of the Reserve Agreement with Colisée Re, the run-off of the underlying liabilities associated with this account and, to a lesser extent, the impact of the strengthening of the U.S. dollar against most major currencies.
The overall average credit rating of the portfolio at
December 31, 2014
was AA, and substantially all (more than 99%) of the fixed maturities were rated investment grade (BBB- or higher) by Standard & Poor’s.
For further discussion of the composition of the investment portfolio underlying the funds held – directly managed account, see Financial Condition, Liquidity and Capital Resources—Funds Held – Directly Managed in Item 7 of Part II of this report. The credit risk of Colisée Re in the event of its insolvency or its failure to honor the value of the funds held balances for any other reason is discussed in Quantitative and Qualitative Disclosures About Market Risk—Counterparty Credit Risk in Item 7A of Part II of this report.
19
Risk Management
In the insurance and reinsurance industry, the core of the business model is the assumption and management of risk. A key challenge is to create total shareholder value through the intelligent and optimal assumption and management of reinsurance, insurance and investment risks while limiting and mitigating those risks that can destroy tangible as well as intangible value, those risks for which the organization is not sufficiently compensated, and those risks that could threaten the ability of the Company to achieve its objectives. While many companies start with a return goal, the Company starts with a capital-based risk appetite and then looks for risks that meet its return targets within that framework. Management believes that this construct allows the Company to balance the cedants’ need for certainty of claims payment with the shareholders’ need for an adequate total return.
All business decisions entail a risk/return trade-off, and these decisions are applicable to the Company’s risks. In the context of assumed business risks, this requires an accurate evaluation of risks to be assumed, and a determination of the appropriate economic returns required as fair compensation for such risks. In the context of other than voluntarily assumed business risks, the decision relates to comparing the probability and potential severity of a risk event against the costs of risk mitigation strategies. In many cases, the potential impact of a risk event is so severe as to warrant significant, and potentially expensive, risk mitigation strategies. In other cases, the probability and potential severity of a risk does not warrant extensive risk mitigation.
The Company’s results are primarily determined by how well the Company understands, prices and manages assumed risk. Management also believes that every organization faces numerous risks that could threaten the successful achievement of a company’s goals and objectives. These include all factors which can be viewed as either strategic, financial or operational risks that are common to any industry, such as choice of strategy and markets, economic and business cycles, competition, changes in regulation, data quality and security, fraud, business interruption and management continuity. See Risk Factors in Item 1A of Part I of this report.
The Company has a clearly defined governance structure for risk management. Executive Management and the Board are responsible for setting the overall vision and goals of the Company, which include the Company’s risk appetite and return expectations. The Company’s risk framework, including key risk policies, is recommended by Executive Management and approved by the Risk and Finance Committee of the Board (Risk and Finance Committee). Each of the Company’s risk policies relates to a specific risk and describes the Company’s approach to risk management, defines roles and responsibilities relating to the assumption, mitigation, and control processes for that risk, and an escalation process for exceptions. Key policies are established by the CEO and operating policies and risk controls at the next level down are established by Business Unit and Support Unit management as appropriate. Key policies are approved by the relevant Committee of the Board. Risk management policies and processes are coordinated by Group Risk Management and compliance is verified by Internal Audit on a periodic basis. The results of audits are monitored by the Audit Committee of the Board.
The Company utilizes a multi-level risk management structure, whereby critical exposure limits, return requirement guidelines, capital at risk and key policies are established by the Executive Management and Board, but day-to-day execution of risk assumption activities and related risk mitigation strategies are delegated to the Business Units and Support Units. Reporting on risk management activities is integrated within the Company’s annual planning process, quarterly operations reports, periodic reports on exposures and large losses, and presentations to the Executive Management and Board. Individual Business Units and Support Units employ, and are responsible for reporting on, operating risk management procedures and controls, while Internal Audit periodically evaluates the effectiveness of such procedures and controls.
Strategic Risks
Strategic risks are managed by the CEO and include the direction and governance of the Company, as well as its response to key external factors faced by the reinsurance industry, such as changes in cedants’ risk retention behavior, regulation, competitive structure and macroeconomic, legal and social trends. Management considers that strong governance procedures, including a robust system of processes and internal controls is appropriate to manage risks related to its reputation and risks related to new initiatives, including acquisitions, new products or markets. The Company seeks to preserve its reputation through high professional and ethical standards and manages the impact of identified risks through the adoption and implementation of a sound and comprehensive Assumed Risk Framework.
Assumed Risks
Central to the Company’s assumed risk framework is its risk appetite. The Company’s risk appetite is a statement of how much and how often the Company will tolerate economic losses during an annual period. The Company’s risk appetite is expressed as the maximum economic loss that the Board is willing to incur based on both a once in 10 years and a once in 250 years modeled probability. The Company’s risk appetite is approved by the Board on an annual basis. Definitions for the maximum economic loss and available economic capital are as follows:
Economic Loss.
The Company defines an economic loss as a decrease in the Company’s economic value, which is defined as common shareholders’ equity attributable to PartnerRe Ltd. plus the “time value of money” discount of the Non-life reserves that is
20
not recognized in the consolidated financial statements in accordance with accounting principles generally accepted in the United States (U.S. GAAP), net of tax, plus the embedded value of the Life portfolio that is not recognized in the consolidated financial statements in accordance with U.S. GAAP, net of tax, less goodwill and intangible assets, net of tax.
Available Economic Capital.
The Company defines economic capital as the economic value, as defined above, plus preferred shareholders’ equity and the carrying value of debt recognized in the consolidated financial statements in accordance with U.S. GAAP.
The Maximum Economic Loss.
The maximum economic loss is a loss expressed as a percentage of economic capital for both a once in 10 years and a once in 250 years modeled probability.
The Company manages exposure levels from multiple risk sources to provide reasonable assurance that modeled operating or economic losses are contained within the risk appetite approved by the Board. The Company utilizes an internal model to evaluate capital at risk levels and compliance with the Company’s risk appetite. The results of the Company’s assessment of capital at risk levels in relation to the risk appetite are reported to the Board on a periodic basis.
To mitigate the chance of operating losses and economic losses exceeding the risk appetite, the Company relies upon diversification of risk sources and risk limits to manage exposures. Diversification enables losses from one risk source to be offset by profits from other risk sources so that the chance of overall losses exceeding the Company’s risk appetite is reduced. However, if multiple losses from multiple risk sources occur within the same year, there is the potential that operating and economic losses can exceed the risk appetite. In addition, there is the chance that the Company’s internal assessment of capital at risk for a single source of risk or for multiple sources of risk proves insufficient resulting in actual losses exceeding the Company’s risk appetite. To reduce the chance of either of these unfavorable outcomes, the Company uses risk limits to minimize the chance that losses from a single risk source or from multiple risk sources will cause operating losses and economic losses to exceed the Company’s risk appetite.
The Company establishes key risk limits for any risk source deemed by Management to have the potential to cause operating losses or economic losses greater than the Company’s risk appetite. The Company may also establish risk limits for any risk source deemed to have the possibility of causing reputational damage. The Risk and Finance Committee approves the key risk limits. Executive and Business and Support Unit Management may set additional specific and aggregate risk limits within the key risk limits approved by the Risk and Finance Committee. The actual level of risk is dependent on current market conditions and the need for balance in the Company’s portfolio of risks. On a quarterly basis, Management reviews and reports to the Risk and Finance Committee the actual limits deployed against the approved limits.
Individual Business and Support Units manage assumed risks, subject to the appetite and principles approved by the Board, limits approved by the Risk and Finance Committee, and policies established by Executive and Business Unit Management. At an operational level, Business and Support Units manage assumed risk through risk mitigation strategies including strong processes, technical risk assessment and collaboration among different groups of professionals who each contribute a particular area of expertise.
21
Management established key risk limits that are approved by the Risk and Finance Committee for ten risk sources at
December 31, 2014
. The limits approved by the Risk and Finance Committee and the actual limits deployed at
December 31, 2014
and
2013
were as follows (in billions of U.S. dollars, except interest rate risk data):
|
|
December 31, 2014
|
December 31, 2013
|
|||||||||||||
|
|
Limit
approved
(2)
|
Actual
deployed
(2)
|
Limit
approved
(2)
|
Actual
deployed
(2)
|
|||||||||||
|
Natural Catastrophe Risk
|
$
|
2.3
|
|
$
|
1.5
|
|
$
|
2.3
|
|
$
|
1.5
|
|
|||
|
Long Tail Reinsurance Risk
|
1.2
|
|
0.9
|
|
1.2
|
|
0.8
|
|
|||||||
|
Market Risk
|
3.4
|
|
2.6
|
|
3.4
|
|
2.6
|
|
|||||||
|
Equity and equity-like sublimit
|
2.8
|
|
2.0
|
|
2.8
|
|
1.8
|
|
|||||||
|
Interest Rate Risk (duration)—excess fixed income investment portfolio
(1)
|
6.0 years
|
|
2.7 years
|
|
6.0 years
|
|
1.5 years
|
|
|||||||
|
Default and Credit Spread Risk
|
$
|
9.5
|
|
$
|
6.3
|
|
$
|
9.5
|
|
$
|
6.8
|
|
|||
|
Trade Credit Underwriting Risk
|
0.9
|
|
0.7
|
|
0.9
|
|
0.7
|
|
|||||||
|
Longevity Risk
|
2.0
|
|
1.4
|
|
2.0
|
|
1.2
|
|
|||||||
|
Pandemic Risk
|
1.3
|
|
0.7
|
|
1.3
|
|
0.6
|
|
|||||||
|
Agriculture Risk
|
0.3
|
|
0.1
|
|
0.3
|
|
0.1
|
|
|||||||
|
Mortgage Reinsurance Risk
(3)
|
1.0
|
|
0.4
|
|
0.7
|
|
0.2
|
|
|||||||
|
Any one country sub-limit
(3)
|
0.8
|
|
0.4
|
|
0.5
|
|
0.2
|
|
|||||||
|
(1)
|
The excess fixed income investment portfolio relates to fixed income securities included in the Company’s capital funds, which are in excess of those included in the Company’s liability funds and which support the net reinsurance liabilities.
|
|
(2)
|
The limits approved and the actual limits deployed in the table above are shown net of retrocession.
|
|
(3)
|
In September 2014, the Risk and Finance Committee approved the increase in limits for mortgage reinsurance risk and the associated any one country sub-limit.
|
Natural Catastrophe Risk
The Company defines this risk as the risk that the aggregate losses from natural perils materially exceed the net premiums that are received to cover such risks, which may result in operating and economic losses to the Company. The Company considers both catastrophe losses due to a single large event and catastrophe losses that would occur from multiple (but potentially smaller) events in any year.
Natural catastrophe risk is managed through the allocation of catastrophe exposure capacity in each exposure zone to different Business Units, regular catastrophe modeling and a combination of quantitative and qualitative analysis. The Company considers a peril zone to be an area within a geographic region, continent or country in which losses from insurance exposures are likely to be highly correlated to a single catastrophic event. Not all peril zones have the same limit and zones are broadly defined so that it would be unlikely for any single event to substantially erode the aggregate exposure limits from more than one peril zone. Even extremely high severity/low likelihood events will only partially exhaust the limits in any peril zone, as they are likely to only affect a part of the area covered by a wide peril zone.
The Company imposes a limit to natural catastrophe risk from any single loss through exposure limits, net of retrocession, in each zone and to each peril and also utilises probable maximum loss estimates to manage its exposures to specific peril zones. Limits from catastrophe exposed business include limits on both reinsurance treaties and insurance-linked securities. Specifically, the Company uses the lesser of any contractually defined limits or the probable maximum loss per contract as the measure of capacity per treaty including proportional exposures for the key peak exposures. This capacity measure is aggregated by contract within a peril zone to establish the total exposures. Actual exposure limits deployed and estimated probable maximum loss in a specific peril zone will vary from period to period depending on Management’s assessment of current market conditions, the results of the Company’s exposure modeling, and other analysis. See Natural Catastrophe Probable Maximum Loss below for a discussion of the Company’s estimated exposures for selected peak industry natural catastrophe perils at December 31, 2014.
Long Tail Insurance and Reinsurance Risk
The Company defines this risk as the risk that the estimates of ultimate losses for casualty and other long-tail lines will prove to be too low, leading to the need for substantial reserve strengthening, which may result in operating and economic losses to the Company. One of the greatest risks in long-tail lines of business, and particularly in U.S. casualty, is that loss trends are higher than the assumptions underlying the Company’s ultimate loss estimates, resulting in ultimate losses that exceed recorded loss reserves. When loss trends prove to be higher than those underlying the reserving assumptions, the impact can be large because of an
22
accumulation effect: for long-tail lines, the Company carries reserves to cover claims arising from several years of underwriting activity and these reserves are likely to be similarly affected by unfavorable loss trends. The effect is likely to be more pronounced for recent underwriting years because, with the passage of time, actual loss emergence and data provide greater confidence around the adequacy of ultimate liability estimates for older underwriting years. Management believes that the volume of long-tail business most exposed to these reserving uncertainties is limited.
The Company manages and mitigates the reserving risk for long-tail lines in a variety of ways. Underwriters and pricing actuaries follow a disciplined underwriting process that utilizes all available data and information, including industry trends, and the Company establishes prudent reserving policies for determining recorded reserves. These policies are systematic and Management endeavors to apply them consistently over time. The Company’s limit for long tail reinsurance risk represents the written premiums for casualty and other long-tail lines for the four most recent calendar quarters. See Critical Accounting Policies and Estimates-Losses and Loss Expenses and Life Policy Benefits in Item 7 of Part II of this report.
Market Risk
The Company defines this risk as the risk of a substantial decline in the value of its Risk Assets. Risk Assets comprise the Company’s equity and equity-like securities which include all invested assets that are not investment grade standard fixed income securities and certain fixed income asset classes that are not liquid (but excludes insurance-linked securities as that risk is aggregated with liability risks). The Company limits the market value of Risk Assets as well as sub-limits the market value of equity and equity-like securities that it will hold in its investment portfolio.
Assuming equity and equity-like risks within that part of the investment portfolio that is not required to support the Company’s reinsurance liabilities provides valuable diversification from other risk classes, along with the potential for higher returns. However, overexposure to equity risk could lead to a large loss in the value of equity and equity-like securities and non-standard fixed income securities in the case of a market crash. The Company sets strict limits on investments in any one name and any one industry, which creates a diversified portfolio and allows Management to focus on the systemic effects of equity risks. Systemic risk is managed by asset allocation, subject to strict caps on Risk Assets as a percentage of shareholders’ equity. The Company’s fully integrated information system provides real-time investment data, allowing for continuous monitoring and decision support. Each portfolio is managed against a pre-determined benchmark to enable alignment with appropriate risk parameters and achievement of desired returns. See Quantitative and Qualitative Disclosures about Market Risk-Equity Price Risk in Item 7A of Part II of this report.
Interest Rate Risk
The Company defines this risk as the risk of a substantial mismatch of asset and liability durations, which may result in economic losses to the Company. Economically, the Company is hedged against changes in asset and liability values resulting from small parallel changes in the risk free yield curve to the degree asset and liability durations are matched. Non-parallel shifts in the yield curve or extremely large changes in yields can introduce interest rate risk and investment losses to the degree asset maturity and coupon payments are not exactly matched to liability payments. Investment losses associated with interest rate risk of a magnitude that have the potential to exceed the Company’s risk appetite are associated with extremely large increases in interest rates over an annual period. The Company limits and monitors the interest rate exposure on its fixed income assets held in excess of those that are matched against liabilities. The Company both matches assets and liabilities to hedge against changes in interest rates and limits the total amount of interest rate exposure. See Quantitative and Qualitative Disclosures About Market Risk-Interest Rate Risk in Item 7A of Part II of this report.
Default and Credit Spread Risk
The Company defines this risk as the risk of a substantial increase in defaults in the Company’s standard fixed income credit securities (which includes investment grade corporate bonds and asset-backed securities) leading to realized investment losses or a significant widening of credit spreads resulting in realized or unrealized investment losses, either of which may result in economic losses to the Company. Investment losses of the magnitude that have the potential to exceed the Company’s risk appetite are associated with the systemic impacts of severe economic and financial stress. As a result, the Company limits the market value of the standard fixed income credit securities so that investment losses will be mitigated in an extreme economic or financial crisis. See Quantitative and Qualitative Disclosures About Market Risk-Credit Spread Risk in Item 7A of Part II of this report.
Trade Credit Underwriting Risk
The Company defines this risk as the risk that aggregated trade credit losses materially exceed the net premiums that are received to cover such risks, which may result in operating and economic losses to the Company. Trade credit underwriting losses of the magnitude that have the potential to exceed the Company’s risk appetite are associated with the systemic impacts of severe economic and financial stress. In these events, underwriting losses may arise from defaults of single large named insureds and from a high frequency of defaults of smaller insureds. In addition, trade credit underwriting risk is highly correlated with default and
23
credit spread widening risk of the standard investment grade fixed income portfolio during times of economic stress or financial crises.
In order to determine a trade credit underwriting limit metric for the purposes of risk accumulation, the Company examines extreme scenarios and measures its exposure to loss under those scenarios. Examples of these scenarios include historical losses from the largest trade credit defaults, prior periods of financial crisis and economic stress (e.g. 1990-1991 recession and 2008-2009 financial crisis) and potential impacts of financial crisis and economic stress scenarios. The Company does not rely upon modeled losses to determine the limit metric, but benchmarks the scenario results against existing tests, scenarios and models. For risk accumulation purposes, the Company examines the extreme scenario that would result in 100% of loss ratio adverse deviation on the trade credit portfolio written on a proportional basis (which far exceeds any adverse deviation of the loss ratio experienced in past periods of economic stress or financial crises) increased by the net probable maximum losses of the two largest named insureds in the Company's trade credit portfolio.
Longevity Risk
The Company considers longevity exposure to have a material accumulation potential and has established a limit to manage the risk of loss associated with this exposure, which may result in operating and economic losses to the Company. The Company defines longevity risk as the potential for increased actual and future expected annuity payments resulting from annuitants living longer than expected, or the expectation that annuitants will live longer in the future. Assuming longevity risk, through reinsurance or capital markets transactions, is part of the Company’s strategy of building a diversified portfolio of risks. While longevity risk is highly diversifying in relation to other risks in the Company’s portfolio (e.g. mortality products), longevity risk itself is a systemic risk with little opportunity to diversify within the risk class. Longevity risk accumulates across cedants, geographies, and over time because mortality trends can impact diverse populations in the same manner. Longevity risk can manifest slowly over time as experience proves annuitants are living longer than original expectations, or abruptly as in the case of a “miracle drug” that increases the life expectancy of all annuitants simultaneously.
In order to determine a longevity limit metric for the purposes of risk accumulation, the Company examines extreme scenarios and measures its exposure to loss under those scenarios. Examples of these scenarios include immediate elimination of major causes of death and an extreme improvement in mortality continuing indefinitely. For risk accumulation purposes, the Company selects the most financially adverse scenario and adds an additional margin for potential deviation. To measure utilization of the longevity limit (accumulation of longevity exposure) the Company accumulates the net present value of adverse losses resulting from the application of the selected most extreme scenario, adds an additional margin to every in-force longevity treaty for potential delays in recognizing that an observed mortality deviation is not short term in nature and, where appropriate, includes the notional value of longevity insurance-linked securities.
Pandemic Risk
The Company considers mortality exposure to have a material accumulation potential to common risk drivers, in particular to pandemic events, which may result in operating and economic losses to the Company. The Company defines pandemic risk as the increase in mortality over an annual period associated with a rapidly spreading virus (either within a highly populated geographic area or on a global basis) with a high mortality rate. Assuming mortality risk, through reinsurance or capital markets transactions, is part of the Company’s strategy of building a diversified portfolio of risks. While mortality risk is highly diversifying in relation to other risks in the Company’s portfolio (e.g. longevity products), mortality risk itself is a systemic risk when the risk driver is a pandemic with little opportunity to diversify within the risk class. Mortality risk from pandemics can accumulate across cedants and geographies.
In order to determine a pandemic limit metric for the purposes of risk accumulation, the Company examines extreme scenarios and measures its exposure to loss under those scenarios. Examples of these scenarios include increased mortality associated with past pandemic events (e.g. 1918 Spanish flu) and potential mortality outcomes from transmission scenarios across differing age groups, and across developed and developing countries. For risk accumulation purposes, the Company selects an extreme mortality scenario applied to the insured portfolio in developing and developed countries that would have twice the assumed fatality rate of the 1918 Spanish flu recurring today, combined with an adverse mortality age pattern, and with the same transmissibility characteristics.
Agriculture Risk
The Company defines this risk as the risk that losses from multi-peril crop insurance materially exceed the net premiums that are received to cover such risks, which may result in operating and economic losses to the Company. Multi-peril crop underwriting losses of the magnitude that have the potential to exceed the Company’s risk appetite are associated with the systemic impacts of severe weather events, particularly drought or flooding, over a large geographic area. Localized events such as convective thunderstorms or hail, while potentially devastating, are unlikely to have the large geographic footprint necessary to create material losses exceeding the net premiums collected.
24
Multi-peril crop risk is managed through geographic diversification both within individual countries and across countries. This is accomplished through the allocation and tracking of capacity across exposure zones (defined as individual countries) and is accompanied by regular extreme event modeling, and a combination of quantitative and qualitative analysis.
The Company utilizes probable maximum loss estimates, net of retrocession, to manage its exposures. The limit approved measure is aggregated by contract within an exposure zone to establish the total exposures. Actual exposures deployed and estimated probable maximum losses in a specific zone will vary from period to period depending on Management’s assessment of current market conditions, the results from exposure modeling, and other analysis.
Mortgage Insurance and Reinsurance Risk
The Company defines this risk as the risk that losses from mortgage insurance materially exceed the net premiums that are received to cover such risks, which may result in operating and economic losses to the Company. Mortgage insurance underwriting losses that have the potential to exceed the Company’s risk appetite are associated with the systemic impacts of severe mortgage defaults, driven by large scale economic downturns and high unemployment. Localized or regional economic downturns are unlikely to have a large enough geographic footprint necessary to create material losses exceeding the net premiums collected.
At December 31, 2014, the majority of the Company’s exposure to mortgage risk related to risks in the U.S. All of the Company’s U.S. mortgage portfolio is considered to consist of prime mortgages, with most of the underlying risks related to policies written post-financial crisis and subject to enhanced post-financial crisis underwriting procedures that differentiate between risks. Mortgage insurance is managed through geographic diversification both within countries and across countries. This is accomplished through the allocation and tracking of capacity across exposure zones (defined as individual countries) and is accompanied by regular extreme event modeling, and a combination of quantitative and qualitative analysis
The Company utilizes total limits deployed, net of retrocession, to manage its exposures. The limits per individual contract are aggregated within an exposure zone to establish the total exposures. Actual exposures deployed and estimated probable maximum losses in a specific zone will vary from period to period depending on Management’s assessment of current market conditions, the results from exposure modeling, and other analysis.
Operational and Financial Risks
Operational and financial risks are managed by designated functions within the organization. These risks include, but are not limited to, failures or weaknesses in financial reporting and controls, regulatory non-compliance, poor cash management, fraud, breach of information technology security, disaster recovery planning and reliance on third party vendors. The Company seeks to minimize these risks through robust processes and monitoring throughout the organization.
Other Underwriting Risk and Exposure Controls
The Company’s underwriting is conducted at the Business Unit level through specialized underwriting teams with the support of technical staff in disciplines such as actuarial, claims, legal, risk management and finance.
The Company’s underwriters generally speak the local language and/or are native to their country or area of specialization. They develop close working relationships with their ceding company counterparts and brokers through regular visits, gathering detailed information about the cedant’s business and local market conditions and practices. As part of the underwriting process, the underwriters also focus on the reputation and quality of the proposed cedant, the likelihood of establishing a long-term relationship with the cedant, the geographic area in which the cedant does business and the cedant’s market share, historical loss data for the cedant and, where available, historical loss data for the industry as a whole in the relevant regions, in order to compare the cedant’s historical loss experience to industry averages, and to gauge the perceived insurance and reinsurance expertise and financial strength of the cedant. The Company trains its underwriters extensively and strives to maintain continuity of underwriters within specific geographic markets and areas of specialty.
Given the Company underwrites volatile lines of business, such as catastrophe reinsurance, the operating results and financial condition of the Company can be adversely affected by catastrophes and other large losses that may give rise to claims under reinsurance coverages provided by the Company. The Company manages its exposure to catastrophic and other large losses by (i) limiting its aggregate exposure on catastrophe reinsurance in any particular geographic zone, (ii) selective underwriting practices, (iii) diversification of risks by geographic area and by lines and classes of business, and (iv) by purchasing retrocessional reinsurance.
The Company generally underwrites risks with specified limits per treaty program. Like other reinsurance companies, the Company is exposed to multiple insured losses arising out of a single occurrence, whether a natural event such as hurricane, windstorm, tornado, flood or earthquake, or man-made events. Any such catastrophic event could generate insured losses in one or many of the Company’s reinsurance treaties and facultative contracts in one or more lines of business. The Company considers such event scenarios as part of its evaluation and monitoring of its aggregate exposures to catastrophic events.
25
Retrocessional reinsurance
The Company uses retrocessional reinsurance agreements to reduce its exposure on certain reinsurance risks assumed and to mitigate the effect of any single major event or the frequency of medium-sized events. These agreements provide for the recovery of a portion of losses and loss expenses from retrocessionaires. The majority of the Company’s retrocessional reinsurance agreements cover property and specialty lines (e.g., aviation or marine) exposures, predominantly those that are catastrophe exposed. The Company also utilizes retrocessions in the Life and Health segment to manage the amount of per-event and per-life risks to which it is exposed. Retrocessionaires must be pre-approved based on their financial condition and business practices, with stability, solvency and credit ratings being important criteria. Strict limits per retrocessionaire are also put into place and monitored to mitigate counter party credit risk.
The Company remains liable to its cedants to the extent that the retrocessionaires do not meet their obligations under retrocessional agreements, and therefore retrocessions are subject to credit risk in all cases and to aggregate loss limits in certain cases. The Company holds collateral, including escrow funds, trusts, securities and letters of credit under certain retrocessional agreements. Provisions are made for amounts considered potentially uncollectible and reinsurance losses recoverable from retrocessionaires are reported after allowances for uncollectible amounts.
In addition to the retrocessional agreements, PartnerRe Europe has a Reserve Agreement in place with Colisée Re (see Business-Reserves-Non-life Reserves-Reserve Agreement in Item 1 of Part I of this report).
Claims
In addition to managing and settling reported claims and consulting with ceding companies on claims matters, the Company conducts periodic audits of specific claims and the overall claims procedures at the offices of ceding companies. The Company attempts to evaluate the ceding company’s claim adjusting techniques and reserve adequacy and whether it follows proper claims processing procedures. The Company also provides recommendations regarding procedures and processes to the ceding company.
Natural Catastrophe Probable Maximum Loss (PML)
The following discussion of the Company’s natural catastrophe probable maximum loss (PML) information contains forward-looking statements based upon assumptions and expectations concerning the potential effect of future events that are subject to uncertainties. See Item 1A of Part I of this report for a list of the Company’s risk factors. Any of these risk factors could result in actual losses that are materially different from the Company’s PML estimates below.
Natural catastrophe risk is a source of significant aggregate exposure for the Company and is managed by setting risk appetite and limits, as discussed above. Natural catastrophe perils can impact geographic regions of varying size and can have economic repercussions beyond the geographic region directly impacted.
The Company considers a peril zone to be an area within a geographic region, continent or country in which losses from insurance exposures are likely to be highly correlated to a single catastrophic event. The Company defines peril zones to capture the vast majority of exposures likely to be incorporated by typical modeled events. There is, however, no industry standard and the Company’s definitions of peril zones may differ from those of other parties.
The Company has exposures in other peril zones that can potentially generate losses greater than the PML estimates below. The Company’s PMLs represent an estimate of loss for a single event for a given return period. The table below discloses the Company’s 1-in-250 and 1-in-500 year return period estimated loss for a single occurrence of a natural catastrophe event in a one-year period. In other words, the 1-in-250 and 1-in-500 year return period PMLs mean that there is a 0.4% and 0.2% chance, respectively, in any given year that an occurrence of a natural catastrophe in a specific peril zone will lead to losses exceeding the stated estimate.
The PML estimates below include all significant exposure from our Non-life and Life and Health business operations. This includes coverage for property, marine, energy, engineering, workers’ compensation and mortality and exposure to catastrophe from insurance-linked securities. The PML estimates do not include casualty coverage that could be exposed as a result of a catastrophic event. In addition, they do not include estimates for contingent losses to insureds that are not directly impacted by the event (e.g. loss of earnings due to disruption in supply lines).
26
The Company’s single occurrence estimated net PML exposures (pre-tax and net of retrocession and reinstatement premiums) for certain selected peak industry natural catastrophe perils at October 1, 2014 were as follows (in millions of U.S. dollars):
|
|
|
Single Occurrence
Estimated Net PML Exposure
|
|||||||||||
|
Zone
|
Peril
|
1-in-250 year PML
|
1-in-500 year PML
(Earthquake Perils Only)
|
||||||||||
|
U.S. Southeast
|
Hurricane
|
$
|
757
|
|
—
|
|
|||||||
|
U.S. Northeast
|
Hurricane
|
909
|
|
—
|
|
||||||||
|
U.S. Gulf Coast
|
Hurricane
|
870
|
|
—
|
|
||||||||
|
Caribbean
|
Hurricane
|
189
|
|
—
|
|
||||||||
|
Europe
|
Windstorm
|
722
|
|
—
|
|
||||||||
|
Japan
|
Typhoon
|
145
|
|
—
|
|
||||||||
|
California
|
Earthquake
|
588
|
|
$
|
675
|
|
|||||||
|
British Columbia
|
Earthquake
|
204
|
|
391
|
|
||||||||
|
Japan
|
Earthquake
|
427
|
|
481
|
|
||||||||
|
Australia
|
Earthquake
|
367
|
|
495
|
|
||||||||
|
New Zealand
|
Earthquake
|
218
|
|
279
|
|
||||||||
Other Key Issues of Management
Capital Adequacy
A key challenge for Management is to maintain an appropriate level of capital. Management’s first priority is to hold sufficient capital to meet all of the Company’s obligations to cedants, meet regulatory requirements and support its position as one of the stronger reinsurers in the industry. Holding an excessive amount of capital, however, will reduce the Company’s compound annual growth in diluted tangible book value per share and Operating ROE. Consequently, Management closely monitors its capital needs and capital level throughout the reinsurance cycle and in times of volatility and turmoil in global capital markets, and actively takes steps to increase or decrease the Company’s capital in order to achieve an appropriate balance of financial strength and shareholder returns. Capital management is achieved by either deploying capital to fund attractive business opportunities, or in times of excess capital and times when business opportunities are not so attractive, returning capital to its common shareholders by way of share repurchases and dividends. During
2014
, the Company repurchased approximately
5.2 million
of its common shares under its authorized share repurchase program at a total cost of
$551 million
, representing an average cost of
$106.30
per share. In addition, the Company increased the quarterly dividends on its common shares by 5% during
2014
, from $0.64 per share to $0.67 per share, and a further 4% increase for 2015 from $0.67 per share to $0.70 per share. For further discussion of capital adequacy, see Shareholders' Equity and Capital Resources Management in Item 7 of Part II of this report.
Liquidity and Cash Flows
The Company aims to be a reliable and financially secure partner to its cedants. This means that the Company must maintain sufficient liquidity at all times so that it can support its cedants by settling claims quickly. The Company generates cash flows primarily from its underwriting and investment operations. Management believes that a profitable, well-run reinsurance organization will generate sufficient cash from premium receipts to pay claims, acquisition costs and other expenses in most years. To the extent that underwriting cash flows are not sufficient to cover operating cash outflows in any year, the Company may utilize cash flows generated from investments and may ultimately liquidate assets from its investment portfolio. Management ensures that its liquidity requirements are supported by maintaining a high quality, well balanced and liquid investment portfolio, and by matching the duration and currency of its investments and investments underlying the funds held—directly managed account with that of its net reinsurance liabilities. In
2015
, the Company expects to continue to generate positive operating cash flows, absent a series of unusual catastrophic events. For further discussion of liquidity and cash flows, see Shareholders' Equity and Capital Resources Management — Liquidity in Item 7 of Part II of this report.
Enterprise Culture
Management is focused on ensuring that the structure and culture of the organization promote intelligent, prudent, transparent and ethical decision-making. Management believes that a sound enterprise culture starts with the tone at the top. Management holds regular company-wide information sessions to present and review Management’s latest decisions, whether operational, financial or structural, as well as the financial results of the Company. Employees are encouraged to address questions related to the Company’s results, strategy or Management decisions, either anonymously or otherwise to Management so that they can be answered during these information sessions. Management believes that these sessions provide a consistent message to all employees about the
27
Company’s value of transparency. Management also strives to promote a work environment that (i) aligns the skill set of individuals with challenges encountered by the Company, (ii) includes segregation of duties to ensure objectivity in decision-making, and (iii) provides a compensation structure that encourages and rewards intelligent risk taking and ethical behavior. To that effect, the Company has a written Code of Business Conduct and Ethics and provides employees with a direct communication channel to the Audit Committee of the Board in the event they become aware of questionable behavior of Management or any other employee. Finally, Management believes that building a sound internal control environment, including a strong Internal Audit function, helps ensure that behaviors are consistent with the Company’s cultural values.
Employees
The Company had 1,069 employees at
December 31, 2014
. The Company believes that its relations with its employees are good.
Regulation
The business of reinsurance is regulated in all countries in which we operate, although the degree and type of regulation varies significantly from one jurisdiction to another. Some jurisdictions impose complex regulatory requirements on insurance businesses while other jurisdictions impose fewer requirements. In certain foreign countries, reinsurers are required to be licensed by governmental authorities. These licenses may be subject to modification, suspension or revocation dependent on such factors as amount and types of reserves and minimum capital and solvency tests. The violation of regulatory requirements may result in fines, censures and/or criminal sanctions in various jurisdictions. See Risk Factors in Item 1A of Part I of this report.
As a holding company, PartnerRe Ltd. is not directly subject to (re)insurance regulations, but its various material operating subsidiaries are subject to regulation as follows:
Bermuda
The Insurance Act 1978 of Bermuda and related regulations, as amended (the Insurance Act), regulates the insurance business of PartnerRe Bermuda. The Insurance Act imposes solvency and liquidity standards and auditing and reporting requirements on Bermuda insurance companies and grants the Bermuda Monetary Authority (BMA) powers to supervise, investigate and intervene in the affairs of insurance companies. The Insurance Act makes no distinction between insurance and reinsurance business.
PartnerRe Bermuda is licensed as a Class 4 and Class E insurer in Bermuda and is therefore authorized to carry on general and long-term insurance business, respectively. Significant aspects of the Bermuda insurance regulatory framework and requirements imposed on Class 4 and Class E insurers such as PartnerRe Bermuda include the following:
Minimum Capital Requirements.
The BMA imposes certain minimum capital regulatory requirements on PartnerRe Bermuda, which are to hold statutory capital and surplus equal to or exceeding the Target Capital Level, which is equivalent to 120% of the Enhanced Capital Requirement (ECR). PartnerRe Bermuda’s Enhanced Capital Requirement (ECR) should be calculated by either (a) the model developed by the BMA, or (b) an internal capital model which the BMA has approved for use for this purpose. PartnerRe Bermuda currently uses the BMA model in calculating its solvency requirements. The Bermuda risk-based regulatory capital adequacy and solvency margin regime provides a risk-based capital model (termed the Bermuda Solvency Capital Requirement (BSCR)) as a tool to assist the BMA both in measuring risk and in determining appropriate levels of capitalization. The BSCR employs a standard mathematical model that correlates the risk underwritten by Bermuda insurers to the capital that is dedicated to their business;
Solvency Assessment.
PartnerRe Bermuda must perform an assessment of its own risk and solvency requirements, referred to as a Commercial Insurer’s Solvency Self Assessment (CISSA). The CISSA allows the BMA to obtain an insurer’s view of the capital resources required to achieve its business objectives and to assess a company’s governance, risk management and controls surrounding this process. In addition, PartnerRe Bermuda must file with the BMA a Catastrophe Risk Return which assesses an insurer’s reliance on vendor models in assessing catastrophe exposure;
Reporting Requirements.
PartnerRe Bermuda must prepare audited annual statutory financial statements and file them with the BMA, together with audited annual financial statements which are prepared in accordance with the accounting principles generally accepted in the United States (U.S. GAAP); and
Dividends and Distributions.
PartnerRe Bermuda is prohibited from declaring or paying any dividends of more than 25% of its total statutory capital and surplus, as shown in its previous financial year statutory balance sheet, unless at least seven days before payment of the dividends it files with the BMA an affidavit that it will continue to meet its minimum capital requirements as described above. In addition, PartnerRe Bermuda must obtain the BMA’s prior approval before reducing its total statutory capital, as shown in its previous financial year statutory balance sheet, by 15% or more.
28
In addition to the above regulatory requirements impacting PartnerRe Bermuda, current international initiatives in the regulation of global insurance and reinsurance groups, such as the European Union’s Solvency II initiative (Solvency II), are trending towards the imposition of group supervisory regimes, introducing one principal “home” regulator over all the operating entities in a particular insurance or reinsurance group (referred to as Group Supervision). The Insurance Act sets out provisions regarding Group Supervision, including the power of the BMA to include or exclude specified entities from Group Supervision, the power of the BMA to withdraw as group supervisor, the functions of the BMA as group supervisor and the power of the BMA to make rules regarding Group Supervision. This Group Supervision regime is in addition to the regulation of the Company’s various operating subsidiaries in their local jurisdictions. The BMA’s Group Supervision rules set out the rules in respect of the assessment of the financial situation and solvency of an insurance group, the system of governance and risk management, and supervisory reporting and disclosures of an insurance group. The group solvency rules set out the rules in respect of the capital and solvency return and enhanced capital requirements for an insurance group. The BMA has chosen PartnerRe Bermuda as the designated insurer for the purposes of Group Supervision, and the BMA will act as group supervisor of the PartnerRe group. As group supervisor, the BMA will gather relevant and essential information on and assess the financial situation of the PartnerRe group, and coordinate the dissemination of such information to other relevant competent authorities for the purposes of assisting in their regulatory functions and the enforcement of regulatory action against the PartnerRe group or any of its members. PartnerRe is not an insurer and, as such, is not regulated in Bermuda. However, pursuant to its functions as group supervisor, the BMA may include any member of the group within its Group Supervision, including PartnerRe.
Significant aspects of the Bermuda insurance regulatory framework and requirements imposed on Insurance Groups include the solvency assessment. The PartnerRe group must annually perform an assessment of its own risk and solvency requirements, referred to as a Group’s Solvency Self Assessment (GSSA). The GSSA allows the BMA to obtain an insurance group’s view of the capital resources required to achieve its business objectives and to assess a group’s governance, risk management and controls surrounding this process. In addition, the PartnerRe group must file with the BMA a Catastrophe Risk Return which assesses an insurer’s reliance on vendor models in assessing catastrophe exposure.
Effective January 1, 2014, the BMA imposed the ECR on the PartnerRe group pursuant to its function as the Company's group supervisor. The PartnerRe group’s ECR may be calculated by either (a) the standard model developed by the BMA, or (b) an internal capital model which the BMA has approved for use for this purpose. PartnerRe currently uses the BMA standard model in calculating its group ECR requirements. In addition, the PartnerRe group is required to prepare and submit annual audited group U.S. GAAP financial statements, annual group statutory financial statements, annual group statutory financial return, annual group capital and solvency return and quarterly group unaudited financial returns.
In addition to the above, PartnerRe Bermuda maintains an operating branch in Canada and representative offices in Chile, China and Mexico. The Canadian branch is subject to regulation in Canada by the Office of the Superintendent of Financial Institutions. For a further discussion of the regulations pertaining to the Canadian branch see below.
Ireland
The Central Bank of Ireland (the Central Bank) regulates insurance and reinsurance companies authorized in Ireland, including PartnerRe Europe and PartnerRe Ireland Insurance Limited (PartnerRe Ireland). PartnerRe Holdings Europe Limited, a holding company for PartnerRe Europe and PartnerRe Ireland, is not subject to regulation by the Central Bank.
PartnerRe Europe is a reinsurance company incorporated under the laws of Ireland and is duly authorized as a reinsurance undertaking to carry on non-life and life reinsurance business in accordance with the European Communities (Reinsurance) Regulations 2006. PartnerRe Ireland is an insurance company incorporated under the laws of Ireland and is duly authorized as an insurance undertaking to carry on non-life insurance business in accordance with the European Communities (Non-Life Insurance) Framework Regulations 1994.
Significant aspects of the Irish re/insurance regulatory framework and requirements imposed on PartnerRe Europe and PartnerRe Ireland include the following:
Solvency Requirements.
As a composite reinsurer, PartnerRe Europe is required to maintain a minimum capital (Solvency I) requirement throughout the year. This solvency margin is determined on a premium or claims basis that covers the total sum of required solvency margins in respect of both non-life and life business activities. In addition, the Central Bank requires PartnerRe Europe to specify their Strategic Solvency Target, in excess of the minimum capital requirement. As a non-life insurer PartnerRe Ireland is required to maintain assets free of liabilities to cover the higher of 200% of the EU Solvency margin or 100% of the minimum guaranteed funds (€3.7 million).The EU Solvency margin is determined on a premium or claims basis that covers the total sum of required solvency margins in respect of non-life business activities;
Reporting Requirements.
PartnerRe Europe and PartnerRe Ireland must file and submit annual audited financial statements in accordance with International Financial Reporting Standards (IFRS) and related reports to the Irish Companies Registration Office (CRO) together with an annual return of certain core corporate information. Changes to core corporate information during the year
29
must also be notified to the CRO. These requirements are in addition to the regulatory returns required to be filed annually with the Central Bank and additionally, in the case of PartnerRe Ireland, with the National Association of Insurance Commissioners (NAIC) in the U.S.; and
Dividends and Distributions.
Pursuant to Irish company law, PartnerRe Europe and PartnerRe Ireland are restricted to declaring dividends only out of “profits available for distribution”. Profits available for distribution are, broadly, a company’s accumulated realized profits less its accumulated realized losses. Such profits may not include profits previously utilized.
In addition to the above, PartnerRe Europe has also established operating branches in the United Kingdom, France, Switzerland, Canada, Singapore, Labuan and Hong Kong and a representative office in Brazil, which are subject to Irish reinsurance supervision regulations. In addition, the Canadian branch is subject to regulation in Canada by the Office of the Superintendent of Financial Institutions, the Singapore branch is subject to regulation by the Monetary Authority of Singapore, the Labuan branch is subject to regulation by the Labuan Financial Services Authority and the Hong Kong branch to regulation by the Office of the Commissioner of Insurance of Hong Kong. For a further discussion of the regulations pertaining to the Canadian branch see below. PartnerRe Ireland, pursuant to the Nonadmitted and Reinsurance Reform Act of 2010 (part of the Dodd-Frank Act), is a nonadmitted alien insurer in the U.S. and is eligible to write business as an excess and surplus lines insurer in all U.S. states. PartnerRe Ireland has also established an operating branch in the United Kingdom which is subject to Irish reinsurance supervision regulations.
United States
PartnerRe U.S. Corporation is a Delaware domiciled holding company for its wholly owned (re)insurance subsidiaries, PartnerRe U.S., PartnerRe Insurance Company of New York (PRNY) and PartnerRe America Insurance Company (PRAIC) (PartnerRe U.S., PRNY and PRAIC together being the PartnerRe U.S. Insurance Companies). The PartnerRe U.S. Insurance Companies are subject to regulation under the insurance statutes and regulations of their domiciliary states, New York in the case of PartnerRe U.S. and PRNY, and Delaware in the case of PRAIC, and all states where they are licensed, accredited or approved to underwrite insurance and reinsurance.
PartnerRe U.S. Corporation is also the owner of the Presidio Reinsurance Group, Inc. and its 100% owned subsidiaries Presidio Excess Insurance Services, Inc. (PXS), PartnerRe Management Ltd. (PRM) and Presidio Reinsurance Corporation Inc. (PRC). PXS is a managing general underwriter licensed in a number of states. PRM is domiciled in the U.K. and regulated by the Financial Services Authority. PRC is a Montana domiciled captive reinsurer.
Currently, the PartnerRe U.S. Insurance Companies are licensed, accredited or approved reinsurers and/or insurers in all fifty states and the District of Columbia, and are subject to the requirements described below:
Risk-Based Capital Requirements.
The Risk-Based Capital (RBC) for Insurers Model Act (the Model RBC Act), as it applies to property and casualty insurers and reinsurers, was initially adopted by the NAIC in December 1993. The Model RBC Act or similar legislation has been adopted by the majority of states in the U.S. The main purpose of the Model RBC Act is to provide a tool for insurance regulators to evaluate the capital of insurers with respect to the risks assumed by them and to determine whether there is a need for possible corrective action. U.S. insurers and reinsurers are required to report the results of their RBC calculations as part of the statutory annual statements that such insurers and reinsurers file with state insurance regulatory authorities. The Model RBC Act provides for four different levels of regulatory actions, each of which may be triggered if an insurer’s Total Adjusted Capital (as defined in the Model RBC Act) is less than a corresponding level of risk-based capital. Decreases in an insurer’s Total Adjusted Capital as a percentage of its Annualized Control Level (as defined in the Model RBC Act) triggers increasing regulatory actions. Such regulatory actions include but are not limited to issuance of orders for corrective action by the insurer, rehabilitation or liquidation of the insurer.
Insurance Regulatory Information System (IRIS) Ratios.
A committee of state insurance regulators developed the NAIC’s IRIS primarily to assist state insurance departments in executing their statutory mandates to oversee the financial condition of insurance or reinsurance companies operating in their respective states. IRIS identifies thirteen industry ratios and specifies usual values for each ratio. Generally, a company will become subject to regulatory scrutiny if it falls outside the usual ranges with respect to four or more of the ratios, and regulators may then act, if the company has insufficient capital, to constrain the company’s underwriting capacity. No such action has been taken with respect to the PartnerRe U.S. Companies.
Reporting Requirements.
Regulations vary from state to state, but generally require insurance holding companies and insurers and reinsurers that are subsidiaries of insurance holding companies to register and file with their state domiciliary regulatory authorities certain reports, including information concerning their capital structure, ownership, financial condition and general business operations. State regulatory authorities monitor compliance with, and periodically conduct examinations with respect to, state mandated standards of solvency, licensing requirements, investment limitations, and restrictions on the size of risks which may be reinsured, deposits of securities for the benefit of reinsureds, methods of accounting for assets, reserves for unearned premiums and losses, and other purposes. In general, such regulations are for the protection of reinsureds and, ultimately, their policyholders,
30
rather than security holders. In the U.S., the New York State Department of Financial Services is the domiciliary regulator of PartnerRe U.S. and PRNY, and the Delaware Department of Insurance is the domiciliary regulator of PRAIC.
Dividends and Distributions.
Under New York law, the New York State Department of Financial Services must approve any dividend declared or paid by PartnerRe U.S. or PRNY that, together with all dividends declared or distributed by each of them during the preceding twelve months, exceeds the lesser of 10% of their respective statutory surplus as shown on the latest statutory financial statements on file with the New York Department of Financial Services, or 100% of their respective adjusted net investment income during that period. Under Delaware law the Delaware Commissioner of Insurance must approve any dividend declared or paid by PRAIC that, together with all dividends or distributions made within the preceding 12 months exceeds the greater of (i) ten percent of PRAIC’s surplus as regards policyholders as of the preceding December 31 or (ii) the net income, not including realized capital gains, for the 12-month period ending the preceding December 31. Both Delaware and New York do not permit a dividend to be declared or distributed, except out of earned surplus.
In addition to the above, the Dodd-Frank Wall Street Reform and Consumer Protection Act of 2010 (the Dodd-Frank Act) currently impacts the PartnerRe U.S. Insurance Companies. The Dodd-Frank Act represents a comprehensive overhaul of the financial services industry in the U.S. and establishes a Federal Insurance Office (FIO) within the U.S. Treasury Department. Although the FIO does not have general supervisory or regulatory authority over the business of insurance or reinsurance, it is charged with monitoring all aspects of the insurance industry, consulting with state insurance regulators, assisting in administration of the Terrorism Risk Insurance Act of 2002 (TRIA) and other duties. The FIO is also responsible for issuing certain reports to Congress, the President and/or others, such as the FIO’s December 2013 report which recommended limited federal regulatory involvement in areas such as the development of a uniform agreement on reinsurance collateral requirements, its September 2014 annual report on the insurance industry and its December 2014 report on the role of the global reinsurance market in supporting insurance in the U.S. Furthermore, the director of the Federal Insurance Office is a non-voting member of the multi-agency Financial Stability Oversight Council (FSOC), and the FSOC may, among other things, subject an insurance company or an insurance holding company to heightened prudential standards in accordance with Title I of the Dodd Frank Act following an extended determination process (which can require that such insurance company be subject also to supervision by the Board of Governors of the Federal Reserve System). The Dodd-Frank Act also made small changes to the regulation of credit for reinsurance and surplus lines insurance in the U.S. See Risk Factors in Item 1A of Part I of this report.
Canada
Canadian branches of PartnerRe Bermuda, PartnerRe Europe and PartnerRe U.S. hold licenses to write reinsurance business in Canada. Each Canadian branch is authorized to insure, in Canada, risks falling within the classes of insurance as specified in their respective licenses and is limited to the business of reinsurance. The Canadian branch of PartnerRe Bermuda is licensed to write life business in Ontario. The Canadian branch of PartnerRe Europe is licensed to write life business in Ontario and Quebec. The Canadian branch of PartnerRe U.S. is licensed to write property and casualty business in Ontario and Quebec. Each Canadian branch is subject to local regulation for its Canadian branch business, specified principally pursuant to Part XIII of the Insurance Companies Act (the Canadian Insurance Act) applicable to foreign property and casualty companies and to foreign life companies as well as relevant provincial insurance acts. The Office of the Superintendent of Financial Institutions, Canada (OSFI) supervises the application of the Canadian Insurance Act.
PartnerRe Bermuda, PartnerRe Europe and PartnerRe U.S. maintain sufficient assets, vested in trust at a Canadian financial institution approved by OSFI, to allow their branches to meet minimum statutory solvency requirements as required by the Act and the regulations made under it. Certain statutory information is filed with federal and provincial insurance regulators in respect of both property and casualty and life business written by branches. This information includes, among other things, a yearly business plan and an annual Dynamic Capital Adequacy Test (DCAT) report from the Appointed Actuary of the branch that tests the adequacy of the assets that are vested under various adverse scenarios.
Singapore
The Monetary Authority of Singapore (MAS) regulates insurance and reinsurance companies authorized in Singapore, including PartnerRe Asia and, to a more limited extent, PartnerRe Europe’s Singapore Branch.
PartnerRe Asia is a reinsurance company incorporated under the laws of Singapore. With effect from December 26, 2014, the MAS reactivated PartnerRe Asia’s license to conduct general insurance business as a reinsurer and granted it a license to carry on life insurance business as a reinsurer. Prior to this date PartnerRe Asia was in run-off (trading as PARIS RE Asia Pacific Pte. Ltd.). As of April 1, 2015, PartnerRe Asia will be the principal reinsurance carrier for PartnerRe’s business underwritten in the Asia Pacific region. PartnerRe Asia has an established operating branch in Labuan which is subject to regulation by the Labuan Financial Services Authority.
31
Significant aspects of the Singapore reinsurance regulatory framework and requirements include the following:
Solvency Requirements:
As a licensed reinsurer, PartnerRe Asia is required to maintain minimum capital of SGD25 million. In addition, PartnerRe Asia is required to establish and maintain separate insurance funds for each class of business that it carries on for both Singapore and offshore policies. The solvency requirement in respect of each insurance fund shall at all times be not less than the total risk requirement of the fund (determined by reference to three components being insurance risks, asset portfolio risks and asset concentration risks). The MAS is entitled to require that a licensed reinsurer holds assets of a certain type and prescribed value in Singapore.
Reporting Requirements:
PartnerRe Asia must file and submit annual audited financial statements in accordance with Singapore Financial Reporting Standards (SFRS) and related report to the Accounting and Corporate Regulatory Authority (ACRA) together with an annual return of certain core corporate information. Changes to core corporate information during the year must also be notified to ACRA. These requirements are in addition to the regulatory returns required to be filed annually with the MAS.
Dividends and Distribution:
Dividends are generally declared from unappropriated profits. The declaration of a dividend by PartnerRe Asia may be subject to relevant conditions and requirements being met as specified under the Insurance Act (Singapore) and its associated regulations. Any proposed reduction of capital or redemption of preference shares requires the prior approval of the MAS. In addition to the above, the laws and initiatives issued by the MAS regarding Corporate Governance, Outsourcings and Technology Risk Management currently impact or may impact Partner Re Asia in the future.
Other Regulatory Considerations
Moreover, there are various regulatory bodies and initiatives that impact PartnerRe in multiple international jurisdictions and the potential for significant impact on PartnerRe could be heightened as a result of recent industry and economic developments. In particular, Solvency II, adopted in the European Union but yet to be finalized, aims to establish a revised set of risk-based capital requirements and risk management standards that will replace the current Solvency I requirements. Once implementing measures are finalized, with implementation scheduled to take effect on January 1, 2016, Solvency II is expected to set out new, strengthened requirements applicable to the entire European Union relating to capital adequacy and risk management for insurers. Other similar measures, such as the International Association of Insurance Supervisors’ (IAIS) announced plans to include a risk-based global insurance capital standard within the common supervision framework it is currently developing, also have the potential for significant impact on PartnerRe. Furthermore, the IAIS has developed policy measures for institutions it designates as globally systemically important insurers (G-SIIs), including enhanced supervision standards, measures to facilitate resolution, and capital requirements to increase loss absorption capacity.
Taxation of the Company and its Subsidiaries
The following summary of the taxation of PartnerRe Ltd., PartnerRe Bermuda, PartnerRe Europe, PartnerRe Asia and the PartnerRe U.S. Corporation and its subsidiaries (collectively PartnerRe U.S. Companies) is based upon current law. Legislative, judicial or administrative changes may be forthcoming that could affect this summary. Certain subsidiaries, branch offices and representative offices of the Company are subject to taxation related to operations in Brazil, Canada, Chile, China, France, Hong Kong, Ireland, Labuan, Singapore, Switzerland and the U.S. The discussion below covers the significant locations for which the Company or its subsidiaries are subject to taxation.
Bermuda
PartnerRe Ltd. and PartnerRe Bermuda have each received from the Minister of Finance an assurance under The Exempted Undertakings Tax Protection Act, 1966 of Bermuda, to the effect that in the event that there is any legislation enacted in Bermuda imposing tax computed on profits or income, or computed on any capital asset, gain or appreciation, or any tax in the nature of estate duty or inheritance tax, then the imposition of any such tax shall not be applicable to PartnerRe Ltd. or PartnerRe Bermuda or to any of their operations or the shares, debentures or other obligations of PartnerRe Ltd. or PartnerRe Bermuda until March 2035. These assurances are subject to the proviso that they are not construed to prevent the application of any tax or duty to such persons as are ordinarily resident in Bermuda (PartnerRe Ltd. and PartnerRe Bermuda are not currently so designated) or to prevent the application of any tax payable in accordance with the provisions of The Land Tax Act, 1967 of Bermuda or otherwise payable in relation to the property leased to PartnerRe Bermuda.
Canada
The Canadian life branch of PartnerRe Bermuda, the Canadian life branch of PartnerRe Europe and the Canadian non-life branch of PartnerRe U.S. are subject to Canadian taxation on their profits.
32
The profits of the Canadian life branch of PartnerRe Bermuda are taxed at the federal level as well as the Ontario provincial level at a total rate that was 26.50% in 2013. The profits of the Canadian life branch of PartnerRe Europe are taxed at the federal level as well as the Ontario and Quebec provincial level at a total rate that was 26.50% in 2014. The Canadian non-life branch of PartnerRe U.S. is subject to taxation on its profits at the federal level as well as the Ontario and Quebec provincial level at a total rate that was an average of 26.58% in 2014. See also the discussion of taxation in the United States and Ireland below.
France
The French branch of PartnerRe Europe is conducting business in and is subject to taxation in France. The French Parliament approved the 2014 Finance Bill, which increased the statutory rate of tax on corporate profits in France from 36.1% to 38.0%, effective for 2013 and 2014. The 2015 Finance Bill subsequently extended this measure to 2015. See also the discussion of taxation in Ireland below.
Ireland
The Company’s Irish subsidiaries, PartnerRe Holdings Europe Ltd., PartnerRe Europe and PartnerRe Ireland Insurance Ltd, conduct business in and are subject to taxation in Ireland. Profits of an Irish trade or business are subject to Irish corporation tax at the rate of 12.5%, whereas profits arising from other than a trade or business are taxable at the rate of 25%. The Swiss, U.S., French, Singaporean and Canadian branches of PartnerRe Europe are subject to taxation in Ireland at the Irish corporation tax rate of 12.5%. However, under Irish domestic tax law, the amount of tax paid in Switzerland, U.S., France, Singapore and Canada can be credited or deducted against the Irish corporation tax. As a result, the Company does not expect to incur significant taxation in Ireland with respect to the Swiss, U.S., French, Singaporean and Canadian branches.
Singapore
The Company’s Singaporean subsidiary, PartnerRe Asia, and the Singaporean branch of PartnerRe Europe are subject to corporate taxation in Singapore at the rate of 17% on profits arising from onshore business and 10% on profits arising from offshore business. However, tax exemption may apply to qualifying profits derived from certain lines of business.
Switzerland
The Swiss branch of PartnerRe Europe is subject to Swiss taxation, mainly on profits and capital. To the extent that net profits are generated, profits are taxed at a rate of approximately 21%. The branch pays capital taxes at a rate of approximately 0.17% on its imputed branch capital calculated according to a procured taxation ruling. See also the discussion of taxation in Ireland above.
United States
PartnerRe U.S. Corporation and its subsidiaries (collectively the PartnerRe U.S. Companies) transact business in Canada and in the U.S. and are subject to taxation in the U.S.
In addition, PartnerRe Europe writes certain U.S. Facultative and Latin American business, through its reinsurance intermediaries, PartnerRe Miami Inc. (PartnerRe Miami) in Miami, Florida and PartnerRe Connecticut Inc. (PartnerRe Connecticut) in Greenwich, Connecticut. As a result, PartnerRe Europe is deemed to be engaged in a U.S. trade or business and thus is subject to taxation in the U.S. Finally, PartnerRe Capital Investments Corporation is also a U.S. corporation subject to taxation in the U.S. The current statutory rate of tax on corporate profits in the U.S. is 35%. See the discussion of U.S. branch taxation below and the discussion of taxation in Ireland above.
On this basis, the Company does not expect that it and its subsidiaries, other than the PartnerRe U.S. Companies and PartnerRe Europe for its U.S. branches (PartnerRe Miami and PartnerRe Connecticut), will be required to pay U.S. corporate income taxes (other than withholding taxes as described below). However, because there is considerable uncertainty as to the activities that constitute a trade or business in the U.S., there can be no assurance that the Internal Revenue Service (the IRS) will not contend successfully that the Company or its non-U.S. subsidiaries are engaged in a trade or business in the U.S. The maximum federal tax rate is currently 35% for a corporation’s income that is effectively connected with a trade or business in the U.S. In addition, U.S. branches of foreign corporations may be subject to the branch profits tax, which imposes a tax on U.S. branch after-tax earnings that are deemed repatriated out of the U.S., for a potential maximum effective federal tax rate of approximately 54% on the net income connected with a U.S. trade or business.
Foreign corporations not engaged in a trade or business in the U.S. are subject to U.S. income tax, effected through withholding by the payer, on certain fixed or determinable annual or periodic gains, profits and income derived from sources within the U.S. as enumerated in Section 881(a) of the Internal Revenue Code, such as dividends and interest on certain investments.
The U.S. also imposes an excise tax on insurance and reinsurance premiums paid to foreign insurers or reinsurers with respect to risks located in the U.S. The rate of tax applicable to reinsurance premiums paid to PartnerRe Bermuda is 1% of gross premiums.
33
Where You Can Find More Information
The Company’s Annual Reports on Form 10-K, quarterly reports on Form 10-Q, current reports on Form 8-K, and amendments to those reports filed or furnished pursuant to Section 13(a) or 15(d) of the Securities Exchange Act are available free of charge through the investor information pages of its website, located at http://www.partnerre.com. Alternatively, the public may read or copy the Company’s filings with the Securities and Exchange Commission (SEC) at the SEC’s Public Reference Room at 100 F Street, N.E., Room 1580, Washington, D.C. 20549. The public may obtain information on the operation of the Public Reference Room by calling the SEC at 1-800-SEC-0330. The SEC also maintains an internet site that contains reports, proxy and information statements, and other information regarding issuers that file electronically with the SEC (http://www.sec.gov). None of the information on the Company’s website or on the SEC’s website is incorporated into this report except to the extent explicitly incorporated by reference in this report.
34
|
ITEM 1A.
|
RISK FACTORS
|
Introduction
Current and potential investors in the Company should be aware that, as with any publicly traded company, investing in our securities carries risk. Managing risk effectively is paramount to our success, and our organization is built around intelligent risk assumptions and careful risk management, as evidenced by our development of the PartnerRe risk management framework, which provides an integrated approach to risk across the entire organization. We have identified what we believe reflect key significant risks to the organization, and, in turn, the shareholders. These risks should be read in conjunction with other Risk Factors described in more detail below under the heading Risk Factors.
First, in order to achieve an appropriate compound annual growth in diluted tangible book value per share over the reinsurance cycle, we believe we must be able to generate an appropriate operating return on beginning diluted book value per share over the reinsurance cycle. Our ability to do that over a reinsurance cycle is dependent on our individual performance, but also on industry factors that impact the level of competition and the price of risk. The level of competition is determined by supply of and demand for capacity. Demand is determined by client buying behavior, which varies based on the client’s perception of the amount and volatility of risk, its financial capacity to bear it and the cost of risk transfer. Supply is determined by the existing reinsurance companies’ level of financial strength and the introduction of capacity from new start-ups or capital markets. Significant new capacity or significant reduction in demand will depress industry profitability until the supply/demand balance is redressed. Extended periods of imbalance could depress industry profitability to a point where we would fail to meet our targets.
Second, we knowingly expose ourselves to significant volatility in our quarterly and annual net income. We create shareholder value by assuming risk from the insurance and capital markets. This exposes us to volatile earnings as untoward events happen to our clients and in the capital markets. Examples of potential large loss events include, without limitation:
|
•
|
Natural catastrophes such as hurricane, windstorm, flood, tornado, earthquake, etc.;
|
|
•
|
Man-made disasters such as terrorism;
|
|
•
|
Declines in the equity and credit markets;
|
|
•
|
Systemic increases in the frequency or severity of casualty losses; and
|
|
•
|
New mass tort actions or reemergence of old mass torts such as cases related to asbestosis.
|
We manage large loss events through evaluation processes, which are designed to enable proper pricing of these risks over time, but which do little to moderate short-term earnings volatility. The only effective tool to dampen earnings volatility is through diversification by building a portfolio of uncorrelated risks. We do not currently buy significant amounts of retrocessional coverage, nor do we use significant capital market hedges or trading strategies in the pursuit of stability in earnings.
Third, we expose ourselves to several very significant risks that are of a size that can impact our financial strength as measured by U.S. GAAP or regulatory capital. We believe that the following can be categorized as very significant risks:
|
•
|
Natural catastrophe risk;
|
|
•
|
Long tail reinsurance risk;
|
|
•
|
Market risk;
|
|
•
|
Interest rate risk;
|
|
•
|
Default and credit spread risk;
|
|
•
|
Trade credit underwriting risk;
|
|
•
|
Longevity risk;
|
|
•
|
Pandemic risk;
|
|
•
|
Agriculture risk; and
|
|
•
|
Mortgage reinsurance risk.
|
35
Most of these risks can accumulate to the point that they exceed a year’s worth of earnings and affect the capital base of the Company (for further information about these risks see Risk Management in Item 1 of Part I of this report).
We rely on our internal risk management processes, models and systems to manage these risks at the nominal exposure levels approved by the Company’s Board. However, because these models and processes may fail, we also impose limits on our exposure to these risks.
In addition to these enumerated risks, we face numerous other strategic and operational risks that could in the aggregate lead to shortfalls to our long-term goals or add to short-term volatility in our earnings, as described in Risk Management in Item 1 of Part I of this report. The following review of important risk factors should not be construed as exhaustive and should be read in conjunction with other cautionary statements that are included herein or elsewhere. The words or phrases believe, anticipate, estimate, project, plan, expect, intend, hope, forecast, evaluate, will likely result or will continue or words or phrases of similar import generally involve forward-looking statements. As used in these Risk Factors, the terms “the Company”, “PartnerRe”, “we”, “our” or “us” may, depending upon the context, refer solely to the Company, to one or more of the Company’s consolidated subsidiaries or to all of them taken as a whole.
Risk Factors
Risks Related to Our Amalgamation with AXIS
Failure to complete our Amalgamation with AXIS could negatively impact the price of our common shares, as well as our future business and financial results, and could have a material and adverse effect on us.
On January 25, 2015, we entered into the Amalgamation Agreement with AXIS, pursuant to which we will amalgamate with AXIS and the Amalgamated Company will continue as a Bermuda exempted company. The Amalgamation Agreement contains a number of conditions precedent that must be satisfied or waived prior to the completion of the amalgamation. There are no assurances that all of the conditions to the amalgamation will be so satisfied or waived. If the conditions to the Amalgamation are not satisfied or waived, then we and AXIS may be unable to complete the Amalgamation.
If the Amalgamation is not completed, our ongoing business may be adversely affected as follows:
|
•
|
the attention of management will have been diverted to the Amalgamation instead of being directed solely to our operations and the pursuit of other opportunities that could have been beneficial to us;
|
|
•
|
the manner in which brokers, insurers, cedants and other third parties perceive us may be negatively impacted, which in turn could affect our ability to compete for or write new business or obtain renewals in the marketplace;
|
|
•
|
under certain circumstances, we may be required to pay AXIS a fee of $55 million or $250 million in the event the Amalgamation Agreement is terminated, and costs and expenses incurred in connection with the transaction in an amount not to exceed $35 million;
|
|
•
|
uncertainties associated with the amalgamation may cause a loss of management personnel and other key employees or result in the departure of our customers, which could adversely affect our business or leave us less able to operate as effectively as before the transaction was announced;
|
|
•
|
we would have incurred substantial fees and costs such as legal, accounting and financial advisor fees;
|
|
•
|
we will be subject to business uncertainties and contractual restrictions while the proposed amalgamation is pending, which could adversely affect our business; and
|
|
•
|
the loss of time and resources.
|
Additionally, in approving the Amalgamation Agreement and the transactions contemplated thereby, our board of directors considered a number of factors and potential benefits, including:
|
•
|
possible synergies in the areas of reduced public company costs, consolidated corporate governance, reduced labor and shared platform costs;
|
|
•
|
greater capital flexibility and enhanced ability to respond to competitive pressures;
|
|
•
|
a more diversified pool of underwriting risk by product and geography;
|
|
•
|
less concentrated distribution relationships and an improved trading relevance; and
|
|
•
|
an increased customer base and potential to attract new customers because of the Amalgamated Company’s greater scale, scope and reach.
|
If the Amalgamation is not completed, we will not realize these and other anticipated benefits of the Amalgamation. See also discussion related to rating agencies below
.
36
Risks Related to Our Company
The volatility of the catastrophe business that we underwrite will result in volatility of our earnings.
Catastrophe reinsurance comprised approximately 6% of our net premiums written for the year ended
December 31, 2014
and a larger percentage of our capital at risk. Catastrophe losses result from events such as windstorms, hurricanes, tsunamis, earthquakes, floods, hailstorms, tornadoes, severe winter weather, fires, drought, explosions and other natural and man-made disasters, the incidence and severity of which are inherently unpredictable. Because catastrophe reinsurance accumulates large aggregate exposures to man-made and natural disasters, our loss experience in this line of business could be characterized as low frequency and high severity. This is likely to result in substantial volatility in our financial results for any fiscal quarter or year, and may create downward pressure on the market price of our common shares and limit our ability to make dividend payments and payments on our debt securities.
Notwithstanding our endeavors to manage our exposure to catastrophic and other large losses, the effect of a single catastrophic event or series of events affecting one or more geographic zones, or changes in the relative frequency or severity of catastrophic or other large loss events, could reduce our earnings and limit the funds available to make payments on future claims. The effect of an increase in frequency of mid-size losses in any one reporting period affecting one or more geographic zones, such as an unusual level of hurricane activity, could also reduce our earnings. Should we incur more than one very large catastrophe loss, our ability to write future business may be adversely impacted if we are unable to replenish our capital.
By way of illustration, during the past five calendar years, the Company incurred the following pre-tax large catastrophic losses and large losses, net of any related reinstatement premiums, reinsurance and profit commissions (in millions of U.S. dollars):
|
Calendar year
|
Pre-tax large catastrophic losses
and large losses
|
||
|
2014
|
$
|
—
|
|
|
2013
|
142
|
|
|
|
2012
|
318
|
|
|
|
2011
|
1,790
|
|
|
|
2010
|
559
|
|
|
Examples of pre-tax large catastrophic losses and large losses reflected in the illustration above include losses in 2013, 2012, 2011 and 2010 which were incurred, to varying extents, as the result of multiple medium and large catastrophic events. In 2013, these events included the extensive flooding in Alberta, Canada in June 2013 (Alberta Floods), the hailstorm that affected large parts of Germany in July 2013 (German Hailstorm) and the floods that impacted large areas of Central Europe in June 2013 (European Floods). In 2012, these events included Superstorm Sandy and the U.S. drought which impacted the agriculture line of business in the North America sub-segment. In 2011, these events included the Japan earthquake and resulting tsunami (Japan Earthquake), the New Zealand earthquakes that occurred in February and June 2011 (the 2011 New Zealand Earthquakes), the floods that impacted Thailand following unusually heavy monsoon rains in October 2011 (Thailand Floods), tornadoes that caused severe destruction to large areas of southern, mid-western and northeastern United States in April and May 2011 (U.S. tornadoes) and the floods in Queensland, Australia (Australian Floods) (collectively, 2011 catastrophic events). In 2010, these events included the earthquake that hit Chile in February 2010, the New Zealand earthquake that occurred in September 2010 (2010 New Zealand Earthquake) and large losses related to the explosion and subsequent sinking of the Deepwater Horizon Drilling Platform.
A significant amount of judgment was used to estimate the range of potential losses related to the 2010 New Zealand Earthquake and 2011 New Zealand Earthquakes (collectively, the New Zealand Earthquakes) and the Japan Earthquake, and there remains a considerable degree of uncertainty related to the range of possible ultimate losses. Loss estimates arising from earthquakes are inherently more uncertain than those from other catastrophic events and the Company believes the ultimate losses arising from the New Zealand Earthquakes and the Japan Earthquake may be materially in excess of, or less than, the amounts provided for in the Consolidated Balance Sheet at
December 31, 2014
. The remaining significant risks and uncertainties related to the New Zealand Earthquakes include the ongoing cedant revisions of loss estimates for each of these events, the degree to which inflation impacts construction materials required to rebuild affected properties, the characteristics of the Company’s program participation for certain affected cedants and potentially affected cedants, and the expected length of the claims settlement period. In addition, there is further complexity related to the New Zealand Earthquakes given multiple earthquakes occurred in the same region in a relatively short period of time, resulting in cedants continuing to revise their allocation of losses between the various events and between different treaties, under which the Company may provide different amounts of coverage.
While the Company remains cautious regarding the estimated ultimate losses from the Japan Earthquake, as time has passed the estimates received from the Company’s cedants have stabilized, paid losses have increased and the remaining complexities have been reduced. However, there can be no assurance that ultimate losses will not exceed our estimates.
37
We believe, and recent scientific studies have indicated, that the frequency of Atlantic basin hurricanes has increased and may change further in the future relative to the historical experience over the past 100 years. As a result of changing climate conditions, such as global warming, there may be increases in the frequency and severity of natural catastrophes and the losses that result from them. We monitor and adjust, as we believe appropriate, our risk management models to reflect our judgment of how to interpret current developments and information, such as these studies. We believe that factors including increases in the value and geographic concentration of insured property, particularly along coastal regions, the increasing risk of extreme weather events reflecting changes in climate and ocean temperatures, and the effects of inflation may continue to increase the severity of claims from catastrophic events in the future.
We could face unanticipated losses from man-made catastrophic events and these or other unanticipated losses could impair our financial condition, reduce our profitability and decrease the market price of our shares.
We may have substantial exposure to unexpected, large losses resulting from future man-made catastrophic events, such as acts of terrorism, acts of war, nuclear accidents and political instability, or from other perils. Although we may attempt to exclude losses from terrorism and certain other similar risks from some coverage we write, we may continue to have exposure to such unforeseen or unpredictable events. This may be because, irrespective of the clarity and inclusiveness of policy language, there can be no assurance that a court or arbitration panel will not limit enforceability of policy language or otherwise issue a ruling adverse to us.
It is also difficult to predict the timing of such events with statistical certainty, or estimate the amount of loss any given occurrence will generate. Under U.S. GAAP, we are not permitted to establish reserves for potential losses associated with man-made or other catastrophic events until an event that may give rise to such losses occurs. If such an event were to occur, our reported income would decrease in the affected period. In particular, unforeseen large losses could reduce our profitability or impair our financial condition. See Political, regulatory, governmental and industry initiatives could adversely affect our business below for a summary of relevant U.S. federal initiatives regarding supply of commercial insurance coverage for certain types of terrorist acts in the U.S.
Given the inherent uncertainty of models, the usefulness of such models as a tool to evaluate risk is subject to a high degree of uncertainty that could result in actual losses that are materially different than our estimates including probable maximum losses (PMLs), and our financial results may be adversely impacted, perhaps significantly.
In addition to our own proprietary catastrophe models, we use third party vendor analytic and modeling capabilities to provide us with objective risk assessment relating to other risks in our reinsurance portfolio. We use these models to help us control risk accumulation, inform management and other stakeholders of capital requirements and to improve the risk/return profile or minimize the amount of capital required to cover the risks in each reinsurance contract in our overall portfolio of reinsurance contracts. However, given the inherent uncertainty of modeling techniques and the application of such techniques, these models and databases may not accurately address a variety of matters which might be deemed to impact certain of our coverages.
For example, catastrophe models that simulate loss estimates based on a set of assumptions are important tools used by us to estimate our PMLs. These assumptions address a number of factors that impact loss potential including, but not limited to, the characteristics of the natural catastrophe event; demand surge resulting from an event; the types, function, location and characteristics of exposed risks; susceptibility of exposed risks to damage from an event with specific characteristics; and the financial and contractual provisions of the (re)insurance contracts that cover losses arising from an event. We run many model simulations in order to understand the impact of these assumptions on its catastrophe loss potential. Furthermore, there are risks associated with catastrophe events, which are either poorly represented or not represented at all by catastrophe models. Each modeling assumption or un-modeled risk introduces uncertainty into PML estimates that management must consider. These uncertainties can include, but are not limited to, the following:
|
•
|
The models do not address all the possible hazard characteristics of a catastrophe peril (e.g. the precise path and wind speed of a hurricane);
|
|
•
|
The models may not accurately reflect the true frequency of events;
|
|
•
|
The models may not accurately reflect a risk’s vulnerability or susceptibility to damage for a given event characteristic;
|
|
•
|
The models may not accurately represent loss potential to insurance or reinsurance contract coverage limits, terms and conditions; and
|
|
•
|
The models may not accurately reflect the impact on the economy of the area affected or the financial, judicial, political, or regulatory impact on insurance claim payments during or following a catastrophe event.
|
Our PMLs are selected after assessment of multiple third party vendor model output, internally constructed independent models, including the Company’s CatFocus
®
suite of models, and other qualitative and quantitative assessments by management,
38
including assessments of exposure not typically modeled in vendor or internal models. Our methodology for estimating PMLs may differ from methods used by other companies and external parties given the various assumptions and judgments required to estimate a PML.
As a result of these factors and contingencies, our reliance on assumptions and data used to evaluate our entire reinsurance portfolio and specifically to estimate a PML, is subject to a high degree of uncertainty that could result in actual losses that are materially different from our PML estimates and our financial results may be adversely impacted, perhaps significantly.
Our net income may be volatile because certain products sold by our Life business unit expose us to reserve and fair value liability changes that are directly affected by market and other factors and assumptions.
Our pricing, establishment of reserves for future policy benefits and valuation of life insurance and annuity products, including reinsurance programs, are based upon various assumptions, including but not limited to market changes, mortality rates, morbidity rates, and policyholder behavior. The process of establishing reserves for future policy benefits relies on our ability to accurately estimate insured events that have not yet occurred but that are expected to occur in future periods. Significant deviations in actual experience from assumptions used for pricing and for reserves for future policy benefits could have an adverse effect on the profitability of our products and our business.
Under reinsurance programs covering variable annuity guarantees we assumed the risk of guaranteed minimum death benefits (GMDB). Our net income is directly impacted by changes in the reserves calculated in connection with the reinsurance of GMDB liabilities. Reported liabilities for GMDB reinsurance are determined using internal valuation models. Such valuations require considerable judgment and are subject to significant uncertainty. The valuation of these products is subject to fluctuations arising from, among other factors, changes in interest rates, changes in equity markets, changes in credit markets, changes in the allocation of the investments underlying annuitant’s account values, and assumptions regarding future policyholder behavior. Significant changes in behavior as a result of policyholder reactions to market or economic conditions could be material. Adverse changes in market factors and policyholder behavior will have an impact on both life underwriting income and net income. When evaluating these risks, we expect to be compensated for taking both the risk of a cumulative long-term economic net loss, as well as the short-term accounting variations caused by these market movements. Therefore, we evaluate this business in terms of its long-term economic risk and reward. For further information see Life Policy Benefits in Item 7 of Part II of this report.
If actual losses exceed our estimated loss reserves, our net income and capital position will be reduced.
Our success depends upon our ability to accurately assess the risks associated with the businesses that we reinsure. We establish loss reserves to cover our estimated liability for the payment of all losses and loss expenses incurred with respect to premiums earned on the contracts that we write. Loss reserves are estimates involving actuarial and statistical projections at a given time to reflect our expectation of the costs of the ultimate settlement and administration of claims. Although we use actuarial and computer models as well as historical reinsurance and insurance industry loss statistics, we also rely heavily on management’s experience and judgment to assist in the establishment of appropriate claims and claim expense reserves. Because of the many assumptions and estimates involved in establishing reserves, the reserving process is inherently uncertain. Our estimates and judgments are based on numerous factors, and may be revised as additional experience and other data become available and are reviewed as new or improved methodologies are developed, as loss trends and claims inflation impact future payments, or as current laws or interpretations thereof change.
Estimates of losses are based on, among other things, a review of potentially exposed contracts, information reported by and discussions with counterparties, and our estimate of losses related to those contracts and are subject to change as more information is reported and becomes available. Losses for casualty and liability lines often take a long time to be reported, and frequently can be impacted by lengthy, unpredictable litigation and by the inflation of loss costs over time. Changes in the level of inflation also result in an increased level of uncertainty in our estimation of loss reserves, particularly for long tail lines of business. As a consequence, actual losses and loss expenses paid may deviate substantially from the reserve estimates reflected in our financial statements.
39
Although we did not operate prior to 1993, we assumed certain asbestos and environmental exposures through our acquisitions. Our reserves for losses and loss expenses include an estimate of our ultimate liability for asbestos and environmental claims for which we cannot estimate the ultimate value using traditional reserving techniques, and for which there are significant uncertainties in estimating the amount of our potential losses. These liabilities are especially hard to estimate for many reasons, including the long delays between exposure and manifestation of any bodily injury or property damage, difficulty in identifying the source of the asbestos or environmental contamination, long reporting delays and difficulty in properly allocating liability for the asbestos or environmental damage. Certain of our subsidiaries have received and continue to receive notices of potential reinsurance claims from ceding insurance companies, which have in turn received claims asserting asbestos and environmental losses under primary insurance policies, in part reinsured by us. Such claims notices are often precautionary in nature and are generally unspecific, and the primary insurers often do not attempt to quantify the amount, timing or nature of the exposure. Given the lack of specificity in some of these notices, and the legal and tort environment that affects the development of claims reserves, the uncertainties inherent in valuing asbestos and environmental claims are not likely to be resolved in the near future. In addition, the reserves that we have established may be inadequate. If ultimate losses and loss expenses exceed the reserves currently established, we will be required to increase loss reserves in the period in which we identify the deficiency to cover any such claims. As a result, even when losses are identified and reserves are established for any line of business, ultimate losses and loss expenses may deviate, perhaps substantially, from estimates reflected in loss reserves in our financial statements. Variations between our loss reserve estimates and actual emergence of losses could be material and could have a material adverse effect on our results of operations and financial condition.
Since we rely on a few reinsurance brokers for a large percentage of our business, loss of business provided by these brokers could reduce our premium volume and net income.
We produce our business both through brokers and through direct relationships with insurance company clients. For the year ended
December 31, 2014
, approximately
69%
of our gross premiums written were produced through brokers. In
2014
, we had two brokers that accounted for 40% of our gross premiums written. Because broker-produced business is concentrated with a small number of brokers, we are exposed to concentration risk. A significant reduction in the business produced by these brokers could potentially reduce our premium volume and net income.
We are exposed to credit risk relating to our reinsurance brokers and cedants.
In accordance with industry practice, we may pay amounts owed under our policies to brokers, and they in turn pay these amounts to the ceding insurer. In some jurisdictions, if the broker fails to make such an onward payment, we might remain liable to the ceding insurer for the deficiency. Conversely, the ceding insurer may pay premiums to the broker, for onward payment to us in respect of reinsurance policies issued by us. In certain jurisdictions, these premiums are considered to have been paid to us at the time that payment is made to the broker, and the ceding insurer will no longer be liable to us for those amounts, whether or not we have actually received the premiums. We may not be able to collect all premiums receivable due from any particular broker at any given time. We also assume credit risk by writing business on a funds withheld basis. Under such arrangements, the cedant retains the premium they would otherwise pay to us to cover future loss payments.
If we are significantly downgraded by rating agencies, our standing with brokers and customers could be negatively impacted and may adversely impact our results of operations.
Third party rating agencies assess and rate the claims paying ability and financial strength of insurers and reinsurers, such as the Company’s principal operating subsidiaries. These ratings are based upon criteria established by the rating agencies and have become an important factor in establishing our competitive position in the market. Insured, insurers, ceding insurers and intermediaries use these ratings as one measure by which to assess the financial strength and quality of insurers and reinsurers. They are not an evaluation directed to investors in our common shares, preferred shares or debt securities, and are not a recommendation to buy, sell or hold our common shares, preferred shares or debt securities.
Our financial strength ratings are subject to periodic review as rating agencies evaluate us to confirm that we continue to meet their criteria for ratings assigned to us by them. Such ratings may be revised downward or revoked at the sole discretion of such ratings agencies in response to a variety of factors, including capital adequacy, management strategy, operating earnings and risk profile. In addition, from time to time one or more rating agencies may effect changes in their capital models and rating methodologies that could have a detrimental impact on our ratings. It is also possible that rating agencies may in the future heighten the level of scrutiny they apply when analyzing companies in our industry, may increase the frequency and scope of their reviews, may request additional information from the companies that they rate, and may adjust upward the capital and other requirements employed in their models for maintenance of certain rating levels. We can offer no assurances that our ratings will remain at their current levels.
If our ratings were significantly downgraded, our competitive position in the reinsurance industry may suffer, and it could result in a reduction in demand for our products. In addition, certain business that we write contains terms that give the ceding company or derivative counterparty the right to terminate cover and/or require collateral if our ratings are downgraded significantly.
40
Our current financial strength ratings are:
|
Standard & Poor’s
|
A+
|
Credit Watch Negative
|
|
Moody’s
|
A1
|
|
|
A.M. Best
|
A+
|
Under Review with Negative Implications
|
|
Fitch
|
AA-
|
Ratings Watch Negative
|
Following the announcement of the Company's proposed Amalgamation with AXIS, Moody's affirmed the Company's rating with a stable outlook. Standard & Poor's, A.M. Best and Fitch placed the Company’s rating on credit watch negative, under review with negative implications and ratings watch negative, respectively (collectively, negative outlooks). All three agencies cited concerns over the transaction, including the risks associated with the execution and integration, along with management retention risk in light of the complexity and scale of the Amalgamation. The Company is in dialogue with each rating agency to address their rating concerns. The status of any further changes to ratings or outlooks will depend on various factors, including the timing of the closing, if and when it occurs, and success of the integration. We can offer no assurances that our ratings will remain at their current levels or that we will be able to remove the negative outlooks prior to the transaction with AXIS and after as the Amalgamated Company.
We may require additional capital in the future, which may not be available or may only be available on unfavorable terms.
Our future capital requirements depend on many factors, including regulatory requirements, our ability to write new business successfully, the frequency and severity of catastrophic events, and our ability to establish premium rates and reserves at levels sufficient to cover losses. We may need to raise additional funds through financings or curtail our growth and reduce our assets. Any equity or debt financing, if available at all, may be on terms that are not favorable to us. Equity financings could be dilutive to our existing shareholders and could result in the issuance of securities that have rights, preferences and privileges that are senior to those of our other securities. Financial markets in the U.S., Europe and elsewhere have experienced extreme volatility and disruption in recent times, resulting in part from financial stresses affecting the liquidity of the banking system. Continued disruption in the financial markets may limit our ability to access capital required to operate our business and we may be forced to delay raising capital or bear a higher cost of capital, which could decrease our profitability and significantly reduce our financial flexibility. In addition, if we experience a credit rating downgrade, withdrawal or negative watch/outlook in the future, we could incur higher borrowing costs and may have more limited means to access capital. If we cannot obtain adequate capital on favorable terms or at all, our business, operating results and financial condition could be adversely affected.
The exposure of our investments to interest rate, credit and equity risks may limit our net income and may affect the adequacy of our capital.
We invest the net premiums we receive unless and until such time as we pay out losses and/or until they are made available for distribution to shareholders and /or otherwise used for general corporate purposes. Investment results comprise a substantial portion of our income. For the year ended
December 31, 2014
, we had net investment income of
$480
million, which represented approximately 7% of total revenues. In addition, we recorded realized and unrealized gains on investments during
2014
, and we record all realized and unrealized gains or losses through net income. While the Board has implemented what it believes to be prudent risk management and investment asset allocation practices, we are exposed to significant financial and capital market risks, including changes in interest rates, credit spreads, equity prices, foreign exchange rates, market volatility, the performance of the economy in general and other factors outside our control.
Interest rates are highly sensitive to many factors, including fiscal and monetary policies of major economies, inflation, economic and political conditions and other factors outside our control. Changes in interest rates can negatively affect us in two ways. In a declining interest rate environment, we will be required to invest our funds at lower rates, which would have a negative impact on investment income. We may be forced to liquidate investments prior to maturity at a loss in order to cover liabilities. In a rising interest rate environment, the market value of our fixed income portfolio may decline.
Our fixed maturity portfolio is primarily invested in high quality, investment grade securities. However, we invest a portion of the portfolio in securities that are below investment grade, including high yield fixed maturity investments and convertible fixed maturity investments. We also invest a portion of our portfolio in other investments such as fixed income type mutual funds, notes receivable, loans receivable, private placement bond investments, derivative exposure assumed and other specialty asset classes. These securities generally pay a higher rate of interest and have a higher degree of credit or default risk. These securities may also be less liquid in times of economic weakness or market disruptions.
We invest a portion of our portfolio in preferred and common stocks or equity-like securities. The value of these assets fluctuates with equity markets. In times of economic weakness, the market value and liquidity of these assets may decline, and may impact net income and capital.
41
We use the term equity-like investments to describe our investments that have market risk characteristics similar to equities and are not investment grade fixed maturity securities. This category includes high yield and convertible fixed maturity investments and private placement equity investments. Fluctuations in the fair value of our equity-like investments may reduce our income in any period or year and cause a reduction in our capital.
Foreign currency fluctuations may reduce our net income and our capital levels.
Through our multinational reinsurance operations, we conduct business in a variety of foreign (non-U.S.) currencies, the principal exposures being the
euro, Canadian dollar, British pound and New Zealand dollar
. Assets and liabilities denominated in foreign currencies are exposed to changes in currency exchange rates, which may be material. Our reporting currency is the U.S. dollar, and exchange rate fluctuations relative to the U.S. dollar may materially impact our results and financial position. We employ various strategies (including hedging) to manage our exposure to foreign currency exchange risk. To the extent that these exposures are not fully hedged or the hedges are ineffective, our results or equity may be reduced by fluctuations in foreign currency exchange rates. The sovereign debt crisis in Europe and the related financial restructuring efforts, which may cause the value of the euro to deteriorate, may magnify these risks.
The current state of the global economy and capital markets increases the possibility of adverse effects on our financial position and results of operations. Economic downturns could impair our investment portfolio and affect the primary insurance market, which could, in turn, harm our operating results and reduce our volume of new business.
Global capital markets in the U.S., Europe and other leading markets continue to experience volatility and certain economies remain in recession. Although conditions may be improving, the longer this economic dislocation persists, the greater the probability that these risks could have an adverse effect on our financial results. This may be evidenced in several ways including, but not limited to, a potential reduction in our premium income, financial losses in our investment portfolio and decreases in revenue and net income.
Unfavorable economic conditions also could increase our funding costs, limit our access to the capital markets or result in a decision by lenders not to extend credit to us. These events could prevent us from increasing our underwriting activities and negatively impact our operating results. In addition, our cedants and other counterparties may be affected by such developments in the financial markets, which could adversely affect their ability to meet their obligations to us.
The global sovereign debt crisis has resulted in financial market restructuring efforts. The impact of these efforts is unclear, however, they may cause a further deterioration in the value of various currencies and consequently exacerbating instability in global credit markets, and increased credit concerns resulting in the widening of bond yield spreads. In addition, recent rating agency downgrades on certain sovereign debt and a possible concern of the potential default of government issuers has contributed to this uncertainty. The impact of these developments, while potentially severe, remains extremely difficult to predict. However, should governments default on their obligations, there will be a negative impact on government and non-government issued bonds, government guaranteed corporate bonds and bonds and equities issued by financial institutions and other financial instruments held within the country of default which in turn could adversely impact assets held in our investment portfolio.
We may suffer losses due to defaults by others, including issuers of investment securities, reinsurance and derivative counterparties.
Issuers or borrowers whose securities we hold, reinsurers, clearing agents, clearing houses, derivative instrument counterparties and other financial intermediaries may default on their obligations to us due to bankruptcy, insolvency, lack of liquidity, adverse economic conditions, operational failure, fraud or other reasons. Even if we are entitled to collateral when a counterparty defaults, such collateral may be illiquid or proceeds from such collateral when liquidated may not be sufficient to recover the full amount of the obligation. Our investment portfolio may include investment securities in the financial services sector that have recently experienced defaults. All or any of these types of default could have a material adverse effect on our results of operations, financial condition and liquidity.
We may be adversely affected if Colisée Re, AXA or their affiliates fail to honor their obligations to Paris Re or its clients.
As part of the AXA Acquisition, Paris Re entered into the 2006 Acquisition Agreements. See Business—Reserves—Non-life Reserves—Reserve Agreement in Item 1 of Part I of this report.
Pursuant to the Quota Share Retrocession Agreement, the benefits and risks of Colisée Re’s reinsurance agreements were ceded to Paris Re France (now PartnerRe Europe), but Colisée Re remains both the legal counterparty for all such reinsurance contracts and the legal holder of the assets relating to such reserves.
Under the Run Off Services and Management Agreement, Paris Re France (now PartnerRe Europe) has agreed that AXA LM will manage claims arising from all reinsurance and retrocession contracts subject to the Reserve Agreement. If AXA LM does not take into account Paris Re France’s commercial concerns in the context of Paris Re France’s on-going business relations with the
42
relevant ceding companies and retrocessionaires, our ability to renew reinsurance and retrocession contracts with them may be adversely affected.
There can be no assurance that our business activities, financial condition, results or future prospects may not be adversely affected in spite of the existence of the 2006 Acquisition Agreements. In general, if AXA or its affiliates breach or do not satisfy their obligations under the 2006 Acquisition Agreements (potentially as a result of insolvency or inability or unwillingness to make payments under the terms of the 2006 Acquisition Agreements), we could be materially adversely affected.
Our debt, credit and International Swap Dealers Association (ISDA) agreements may limit our financial and operational flexibility, which may affect our ability to conduct our business.
We have incurred indebtedness, and may incur additional indebtedness in the future. Additionally, we have entered into credit facilities and ISDA agreements with various institutions. Under these credit facilities, the institutions provide revolving lines of credit to us and our major operating subsidiaries and issue letters of credit to our clients in the ordinary course of business.
The agreements relating to our debt, credit facilities and ISDA agreements contain various covenants that may limit our ability, among other things, to borrow money, make particular types of investments or other restricted payments, sell assets, merge or consolidate. Some of these agreements also require us to maintain specified ratings and financial ratios, including a minimum net worth covenant. If we fail to comply with these covenants or meet required financial ratios, the lenders or counterparties under these agreements could declare a default and demand immediate repayment of all amounts owed to them.
If we are in default under the terms of these agreements, then we would also be restricted in our ability to declare or pay any dividends, redeem, purchase or acquire any shares or make a liquidation payment.
If any one of the financial institutions that we use in our operations, including those that participate in our credit facilities, fails or is otherwise unable to meet their commitments, we could incur substantial losses and reduced liquidity.
We maintain cash balances significantly in excess of the U.S. Federal Deposit Insurance Corporation insurance limits at various depository institutions. We also have funding commitments from a number of banks and financial institutions that participate in our credit facilities. See Item 7—Management’s Discussion and Analysis of Financial Condition and Results of Operations—Credit Facilities. Access to funds under these existing credit facilities is dependent on the ability of the banks that are parties to the facilities to meet their funding requirements. Those banks may not be able to meet their funding requirements if they experience shortages of capital and liquidity or if they experience excessive volumes of borrowing requests within a short period of time, and we might be forced to replace credit sources in a difficult market. There have also been recent consolidations in the banking industry which could lead to increased reliance on and exposure to a limited number of institutions. If we cannot obtain adequate financing or sources of credit on favorable terms, or at all, our business, operating results and financial condition could be adversely impacted.
Changes in current accounting practices and future pronouncements may materially impact our reported financial results.
Developments in accounting practices, for example a convergence of U.S. GAAP with International Financial Reporting Standards (IFRS), may require considerable additional expense to comply, particularly if we are required to prepare information relating to prior periods for comparative purposes or to apply the new requirements retroactively. The impact of changes in current accounting practices and future pronouncements may be significant. The impact may affect the results of our operations, including among other things, the calculation of net income, and may affect our financial position, including among other things, the calculation of unpaid losses and loss expenses, policy benefits for life and annuity contracts and total shareholders’ equity. In particular, recent guidance and ongoing projects put in place by standard setters globally have indicated a move away from the current insurance accounting models toward more “fair value” based models which could introduce significant volatility in the earnings of insurance industry participants.
Operational risks, including human or systems failures, are inherent in our business.
Operational risks and losses can result from many sources including fraud, errors by employees, failure to document transactions properly or to obtain proper internal authorization, failure to comply with regulatory requirements or information technology failures.
We believe our modeling, underwriting and information technology and application systems are critical to our business and reputation. Moreover, our technology and applications have been an important part of our underwriting process and our ability to compete successfully. Such technology is and will continue to be a very important part of our underwriting process. We have also licensed certain systems and data from third parties. We cannot be certain that we will have access to these, or comparable service providers, or that our technology or applications will continue to operate as intended. In addition, we cannot be certain that we would be able to replace these service providers or consultants without slowing our underwriting response time. A major defect or
43
failure in our internal controls or information technology and application systems could result in management distraction, harm to our reputation, a loss or delay of revenues or increased expense.
Cybersecurity events could disrupt business operations, result in the loss of critical and confidential information, and adversely impact our reputation and results of operations.
We are dependent upon the effective functioning and availability of our information technology and application systems platforms. These platforms include, but are not limited to, our proprietary software programs such as catastrophe models as well as those licensed from third-party vendors including analytic and modeling systems. We rely on the security of such platforms for the secure processing, storage and transmission of confidential information. Examples of significant cybersecurity events are unauthorized access, computer viruses, deceptive communications (phishing), malware or other malicious code or cyber-attack, catastrophic events, system failures and disruptions and other events that could have security consequences (each, Cybersecurity Event). A Cybersecurity Event could materially impact our ability to adequately price products and services, establish reserves, provide efficient and secure services to our clients, brokers, vendors and regulators, value our investments and to timely and accurately report our financial results. Although we have implemented controls and have taken protective measures to reduce the risk of Cybersecurity Events, we cannot reasonably anticipate or prevent rapidly evolving types of cyber attacks and such measures may be insufficient to prevent a Cybersecurity Event. Cybersecurity Events could expose us to a risk of loss or misuse of our information, litigation, reputational damage, violations of applicable privacy and other laws, fines, penalties or losses that are either not insured against or not fully covered by insurance maintained. We may be required to expend significant additional resources to modify our protective measures or to investigate and remediate vulnerabilities.
The loss of key executive officers could adversely affect us.
Our success has depended, and will continue to depend, partly upon our ability to attract and retain executive officers. If any of these executives ceased to continue in his or her present role, we could be adversely affected.
We believe there are only a limited number of available qualified executives in the business lines in which we compete. Our ability to execute our business strategy is dependent on our ability to attract and retain a staff of qualified executive officers, underwriters and other key personnel. The skills, experience and knowledge of the reinsurance industry of our management team constitute important competitive strengths. If some or all of these managers leave their positions, and even if we were able to find persons with suitable skills to replace them, our operations could be adversely affected.
We may be adversely impacted by inflation.
Recent deficit spending by governments in the Company’s major markets exposes the Company to heightened risk of inflation. We monitor the risk that the principal markets in which we operate could experience increased inflationary conditions, which would, among other things, cause loss costs to increase, and impact the performance of our investment portfolio. Inflation related to medical costs, construction costs and tort issues in particular impact the property and casualty industry and broader market inflation has the potential risk of increasing overall loss costs. The impact of inflation on loss costs could be more pronounced for those lines of business that are considered to be long tail in nature, as they require a relatively long period of time to finalize and settle claims. Changes in the level of inflation also result in an increased level of uncertainty in our estimation of loss reserves, particularly for long tail lines of business. The onset, duration and severity of an inflationary period cannot be estimated with precision. The global sovereign debt crisis and the related financial restructuring efforts have, among other factors, made it more difficult to predict the inflationary environment.
Risks Related to Our Industry
Our profitability is affected by the cyclical nature of the reinsurance industry.
Historically, the reinsurance industry has experienced significant fluctuations in operating results due to competition, levels of available capacity, trends in cash flows and losses, general economic conditions and other factors. Demand for reinsurance is influenced significantly by underwriting results of primary insurers, including catastrophe losses, and prevailing general economic conditions. The supply of reinsurance is related directly to prevailing prices and levels of capacity that, in turn, may fluctuate in response to changes in rates of return on investments being realized in the reinsurance industry. If any of these factors were to result in a decline in the demand for reinsurance or an overall increase in reinsurance capacity, our profitability could be impacted. In recent years, we have experienced a generally softening market cycle, with increased competition, surplus underwriting capacity, deteriorating rates and less favorable terms and conditions all having an impact on our ability to write business.
Currently, the Company is facing a challenging and limited growth environment, which is driven by price decreases in most markets and lines of business, reflecting increased competition and excess capacity in the industry, cedants choosing to utilize fewer reinsurers by consolidating their reinsurance panels, relatively low loss experience and a prolonged period of low interest rates, which has impacted our investment portfolio. In addition, we may experience increased competition as a result of the consolidation
44
in the (re)insurance industry. These consolidated entities may try to use their enhanced market power to negotiate price reductions for our products and services and/or obtain a larger market share through increased line sizes.
We anticipate that competition and pricing pressure may adversely affect our profitability and results of operations in future periods, and the impact may be material.
We operate in a highly competitive environment.
The reinsurance industry is highly competitive and we compete with a number of worldwide reinsurance companies, including, but not limited to, Munich Re, Swiss Re, Everest Re, Hannover Re, SCOR and reinsurance and insurance operations of certain primary insurance companies, such as ACE, Arch Capital, AXIS and XL Group. The lack of strong barriers to entry into the reinsurance business means that we also compete with new companies that continue to be formed to enter the insurance and reinsurance markets. In addition, we may experience increased competition as a result of the consolidation in the (re)insurance industry. These consolidated entities may try to use their enhanced market power to negotiate price reductions for our products and services and/or obtain a larger market share through increased line sizes.
Competition in the types of reinsurance and insurance that we underwrite is based on many factors, including the perceived and relative financial strength, pricing and other terms and conditions, services provided, ratings assigned by independent rating agencies, speed of claims payment, geographic scope of business, client and broker relationships, reputation and experience in the lines of business to be written. If competitive pressures reduce our prices, we would expect to write less business. In addition, competition for customers would become more intense and we could incur additional expenses relating to customer acquisition and retention, further reducing our operating margins.
Further, insurance-linked securities and derivative and other non-traditional risk transfer mechanisms and alternative vehicles are being developed and offered by other parties, which could impact the demand for traditional insurance or reinsurance. A number of new, proposed or potential industry or legislative developments could further increase competition in our industry. New competition from these developments could cause the demand for insurance or reinsurance to fall or the expense of customer acquisition and retention to increase, either of which could have a material adverse effect on our growth and profitability. As a result of new and alternative capital inflows into the industry and cedants retaining more business, there is an excess supply of reinsurance capital which is also driving pricing lower and putting pressure on terms and conditions.
All of the above factors may adversely affect our profitability and results of operations in future periods, the impact of which may be material, and may adversely affect our ability to successfully execute our strategy as a global diversified reinsurance and specialty insurance company.
Legal and Regulatory Risks
Political, regulatory, governmental and industry initiatives could adversely affect our business.
Our reinsurance operations are subject to extensive laws and regulations that are administered and enforced by a number of different governmental and non-governmental self-regulatory authorities and associations in each of their respective jurisdictions and internationally. Our businesses in each jurisdiction are subject to varying degrees of regulation and supervision. The laws and regulations of the jurisdictions in which our insurance and reinsurance subsidiaries are domiciled require, among other things, maintenance of minimum levels of statutory capital, surplus, and liquidity; various solvency standards; and periodic examinations of subsidiaries’ financial condition. In some jurisdictions, laws and regulations also restrict payments of dividends and reductions of capital. Applicable statutes, regulations, and policies may also restrict the ability of these subsidiaries to write insurance and reinsurance policies, to make certain investments, and to distribute funds.
As a result of the current financial crisis, some of these authorities regularly consider enhanced or new regulatory requirements intended to prevent future crises or otherwise assure the stability of institutions under their supervision. These authorities may also seek to exercise their supervisory authority in new and more robust ways, and new regulators could become authorized to oversee parts of our business. For example, the European Union’s Solvency II initiative (see below Solvency II could adversely impact our financial results and operations) and the NAIC’s Solvency Modernization Initiative include meaningful changes in consolidated supervision and corporate governance requirements as they apply to insurance and reinsurance corporate groups, which could lead to increases in regulatory capital requirements, reduced operational flexibility and increased compliance costs. We cannot predict what regulations will finally be adopted.
In addition, in 2010 the International Association of Insurance Supervisors (IAIS) introduced a concept paper promoting a common framework for the supervision of internationally active insurance groups (IAIGs). Through the common framework, still in its development phase, the IAIS aims to: (i) develop methods of operating group-wide supervision of IAIGs, (ii) establish a comprehensive framework for supervisors to address group-wide activities and risks and also set grounds for better supervisory cooperation, and (iii) foster global convergence of regulatory and supervisory measures and approaches. In addition, in October
45
2013 the IAIS announced its plan to include a risk-based global insurance capital standard within its common framework by 2016. Furthermore, the IAIS has developed policy measures for institutions it designates as globally systemically important insurers (G-SIIs), including enhanced supervision standards, measures to facilitate resolution, and capital requirements to increase loss absorption capacity. The IAIS initially announced that it will decide in 2014 on potential designation of major reinsurers as G-SIIs but this decision has been deferred until 2015, pending further analysis and consultation.
It is not possible to predict all future impacts of these types of changes but they could affect the way we conduct our business and manage our capital, and may require us to satisfy increased capital requirements, any of which, in turn, could affect our results of operations, financial condition and liquidity. Our material subsidiaries’ regulatory environments are described in detail under the heading Business—Regulation. Regulations relating to each of our material subsidiaries may in effect restrict each of those subsidiaries’ ability to write new business, to make certain investments and to distribute funds or assets to us.
Recent government intervention and the possibility of future government intervention have created uncertainty in the insurance and reinsurance markets. Government regulators are generally concerned with the protection of policyholders to the exclusion of other interested parties, including shareholders of reinsurers. We believe it is likely there will continue to be increased regulation of, and other forms of government participation in, our industry in the future, which could adversely affect our business by, among other things:
|
•
|
Providing reinsurance capacity in markets and to clients that we target or requiring our participation in industry pools and guaranty associations;
|
|
•
|
Further restricting our operational or capital flexibility;
|
|
•
|
Expanding the scope of coverage under existing policies;
|
|
•
|
Regulating the terms of reinsurance policies; or
|
|
•
|
Disproportionately benefiting the companies domiciled in one country over those domiciled in another.
|
Such a U.S. federal initiative was put forward in response to the tightening of supply in certain insurance and reinsurance markets resulting from, among other things, the September 11th tragedy, and consequently the TRIA was enacted to ensure the availability of commercial insurance coverage for certain types of terrorist acts in the U.S. In December 2007, the Terrorism Risk Insurance Program Reauthorization Act (TRIPRA) was enacted, which further renewed TRIA for another 7 years ending December 31, 2014. This law established a federal program to help the commercial property and casualty insurance industry cover claims related to future terrorism-related losses and required that coverage for terrorist acts be offered by insurers. We cannot provide assurance that TRIPRA will be extended beyond 2014, and its expiration or a significant change in terms could have an adverse effect on us, our clients or the insurance industry.
Such a state initiative in the U.S. was put forward by the Florida Legislature in response to the tightening of supply in certain insurance and reinsurance markets in Florida resulting from, among other things, hurricane damage in Florida, which enacted the Hurricane Preparedness and Insurance Act to ensure the availability of catastrophe insurance coverage for catastrophes in the state of Florida. More recent legislative proposals would limit the reinsurance coverage available from the Florida Hurricane Catastrophe Fund and limit exposure to assessments from the state-run Citizens Property Insurance Company.
The insurance industry is also affected by political, judicial and legal developments that may create new and expanded theories of liability, which may result in unexpected claim frequency and severity and delays or cancellations of products and services we provide, which could adversely affect our business.
We are unable to predict the effect that governmental actions for the purpose of stabilizing the financial markets will have on such markets generally or on the Company in particular.
In response to the financial crisis affecting the banking system and financial markets, the U.S. federal government, the European Central Bank and other governmental and regulatory bodies have taken or are considering taking other actions to address the governance of those industries that are viewed as presenting a systemic risk to economic stability. Such actions include the International Monetary Fund’s proposal to levy a financial stability tax on all financial institutions, the proposals for enhanced regulation and supervision contained in the most recently published Organization for Economic Co-operation and Development (OECD) paper on the impact of the financial crisis on the Insurance sector and the financial regulatory reform provisions contained within the Dodd-Frank Wall Street Reform and Consumer Protection Act of 2010 (Dodd-Frank Act). Measures taken in Europe include the European Market Infrastructure Regulation (EMIR), as well as the proposed revisions to the Markets in Financial Instruments Directive (MiFID) and the proposed new Markets in Financial Instruments Regulation (MiFIR). We are unable to predict the effect that the enactment of any such proposals will have on the financial markets generally or on the Company’s competitive position, business and financial condition in particular, though we are monitoring these and similar proposals as they evolve.
46
The Dodd-Frank Act and other U.S. regulatory changes may adversely impact our business.
The U.S. Congress and the current administration have made, or called for consideration of, several additional proposals relating to a variety of issues with respect to financial regulation reform, including regulation of the over-the-counter derivatives market, the establishment of a single-state system of licensure for U.S. and foreign reinsurers, further regulation of executive compensation and others. One of those initiatives, the Dodd-Frank Act, was signed into law by the President of the U.S. on July 21, 2010. The Dodd-Frank Act represents a comprehensive overhaul of the financial services industry within the U.S. and establishes a Federal Insurance Office under the U.S. Treasury Department. Although the Federal Insurance Office does not have general supervisory or regulatory authority over the business of insurance or reinsurance, it is charged with monitoring all aspects of the insurance industry, consulting with state insurance regulators, assisting in administration of the TRIA, and other duties. The Federal Insurance Office is also responsible for issuing certain reports to Congress such as a December 2013 report which recommended limited federal regulatory involvement in areas such as the development of a uniform agreement on reinsurance collateral requirements, as well as an upcoming report on the role of the global reinsurance market in supporting insurance in the U.S. Furthermore, the director of the Federal Insurance Office may recommend that the multi-agency Financial Stability Oversight Council (FSOC) subject an insurance company or an insurance holding company to heightened prudential standards following an extended designation process, and FSOC itself may make such designations. Proposed U.S. regulatory changes outside the scope of the Dodd-Frank Act include legislation to repeal the insurance company exemption from certain U.S. federal antitrust laws, which has been introduced in the past. It is not possible to predict whether this or similar legislation may be enacted in the future.
Compliance with these new laws and regulations may result in additional costs which may adversely impact our results of operations, financial condition and liquidity. However, at this time, it is not possible to predict with any degree of certainty whether any other proposed legislation, rules or regulatory changes will be adopted or what impact, if any, the Dodd-Frank Act or any other such legislation, rules or changes could have on our business, financial condition or results of operations.
Solvency II could adversely impact our financial results and operations.
Solvency II, a European Union directive concerning the capital adequacy, risk management and regulatory reporting for insurers, was adopted by the European Parliament and the European Council in April of 2009 and may adversely affect our reinsurance businesses. The implementation of Solvency II by the European Commission will replace current solvency requirements and is scheduled to take effect January 1, 2016. Solvency II adopts a risk-based approach to insurance regulation. Its principal goals are to improve the correlation between capital and risk, effect group supervision of insurance and reinsurance affiliates, implement a uniform capital adequacy structure for insurers across the European Union Member States, establish consistent corporate governance standards for insurance and reinsurance companies, and establish transparency through standard reporting of insurance operations. Implementation of Solvency II will require us to utilize a significant amount of resources to ensure compliance. The measures implementing Solvency II have not been finalized and may be subject to change; consequently, our implementation plans, which are based on our current understanding of the Solvency II requirements, may need to change. The current uncertainty as to timing and requirements may add to the cost of compliance. The European Union is in the process of considering the Solvency II equivalence of Bermuda’s insurance regulatory and supervisory regime. The European Union equivalence assessment considers whether Bermuda’s regulatory regime provides a similar level of policyholder protection as provided under Solvency II. A finding that Bermuda’s insurance regulatory regime is not equivalent to the European Union’s Solvency II could have an adverse effect on the cost of PartnerRe Bermuda’s European business due to the potential of having to post collateral. It would not affect PartnerRe Europe’s ability to operate in Europe. Such a finding could also have adverse indirect commercial impacts on our operations. An interim assessment has determined that the Bermuda regime applicable to Class 3A, 3B and 4 Companies is equivalent with certain caveats, but a final determination is yet to be made and it is not known when a final determination will be made. In addition, European policymakers have recently drafted a set of criteria by which the European Commission will be able to assess unilaterally whether the solvency regime of a third country such as Bermuda is broadly equivalent to Solvency II. If Bermuda is considered broadly equivalent then it could be granted “provisional equivalence” to Solvency II for a period of 10 years with the possibility that such period could be extended. We are monitoring the ongoing legislative and regulatory steps associated with the adoption of Solvency II and the equivalence system, as well as other standards such as the IAIS’s planned risk-based global insurance capital standard. The principles, standards and requirements of Solvency II may also, directly or indirectly through its impact on other market participants, including ceding insurers, impact the future supervision of additional operating subsidiaries of ours.
Legislative and regulatory activity in health care and other employee benefits could increase the costs or administrative burdens of providing benefits to our employees or hinder or prevent us from attracting and retaining employees, or affect our profitability as a provider of accident and health insurance benefit products.
We derive revenues from the provision of accident and health premiums in the U.S., that is, providing insurance to institutions that participate in the U.S. healthcare delivery infrastructure. Changes in U.S. healthcare legislation, specifically the Patient Protection and Affordable Care Act of 2010 (Healthcare Act), have made significant changes to the regulation of health insurance and may negatively affect our healthcare liability business including, but not limited to, the healthcare delivery system and the healthcare cost reimbursement structure in the U.S. In addition, the Company may be subject to regulations, guidance or
47
determinations emanating from the various regulatory authorities authorized under the Healthcare Act. It is difficult to predict the effect that the Healthcare Act, or any regulatory pronouncement made thereunder, will have on its results of operations or financial condition. Additionally, future healthcare proposals could include tort reform provisions under which plaintiffs would be restricted in their ability to bring suit against healthcare providers, which could negatively impact the demand for our healthcare liability products. Any material changes in how healthcare providers insure their malpractice liability risks could have a material adverse effect on our results of operations.
Legal and enforcement activities relating to the insurance industry could affect our business and our industry.
The insurance industry has experienced substantial volatility as a result of litigation, investigations and regulatory activity by various insurance, governmental and enforcement authorities concerning certain practices within the insurance industry. These practices include the accounting treatment for finite reinsurance or other non-traditional or loss mitigation insurance and reinsurance products.
These investigations have resulted in changes in the insurance and reinsurance markets and industry business practices. While at this time, none of these changes have caused an adverse effect on our business, we are unable to predict the potential effects, if any, that future investigations may have upon our industry. As noted above, because we frequently assume the credit risk of the counterparties with whom we do business throughout our insurance and reinsurance operations, our results of operations could be adversely affected if the credit quality of these counterparties is severely impacted by investigations in the insurance industry or by changes to industry practices.
Emerging claim and coverage issues could adversely affect our business.
Unanticipated developments in the law, as well as changes in social and environmental conditions could potentially result in unexpected claims for coverage under our insurance, reinsurance and other contracts. These developments and changes may adversely affect our business by either extending coverage beyond our underwriting intent or by increasing the number or size of claims. With respect to our casualty businesses, these legal, social and environmental changes may not become apparent until sometime after their occurrence. Our exposure to these uncertainties could be exacerbated by an increase in insurance and reinsurance contract disputes, arbitration and litigation.
The full effects of these and other unforeseen emerging claim and coverage issues are extremely hard to predict. As a result, the full extent of our liability under our coverages, and in particular, our casualty reinsurance contracts, may not be known for many years after a contract is issued.
The insurance industry is also affected by political, judicial and legal developments that may create new and expanded theories of liability, which may result in unexpected claim frequency and severity and delays or cancellations of products and services we provide, which could adversely affect our business.
Investors may encounter difficulties in service of process and enforcement of judgments against us in the United States.
We are a Bermuda company and some of our directors and officers are residents of various jurisdictions outside the U.S. All, or a substantial portion, of the assets of our officers and directors and of our assets are or may be located in jurisdictions outside the U.S. Although we have appointed an agent and irrevocably agreed that the agent may be served with process in New York with respect to actions against us arising out of violations of the U.S. Federal securities laws in any Federal or state court in the U.S., it could be difficult for investors to effect service of process within the U.S. on our directors and officers who reside outside the U.S. It could also be difficult for investors to enforce against us or our directors and officers judgments of a U.S. court predicated upon civil liability provisions of U.S. Federal securities laws.
There is no treaty in force between the U.S. and Bermuda providing for the reciprocal recognition and enforcement of judgments in civil and commercial matters. As a result, whether a U.S. judgment would be enforceable in Bermuda against us or our directors and officers depends on whether the U.S. court that entered the judgment is recognized by the Bermuda court as having jurisdiction over us or our directors and officers, as determined by reference to Bermuda conflict of law rules. A judgment debt from a U.S. court that is final and for a sum certain based on U.S. Federal securities laws will not be enforceable in Bermuda unless the judgment debtor had submitted to the jurisdiction of the U.S. court, and the issue of submission and jurisdiction is a matter of Bermuda law and not U.S. law.
In addition to and irrespective of jurisdictional issues, Bermuda courts will not enforce a U.S. Federal securities law that is either penal or contrary to public policy. An action brought pursuant to a public or penal law, the purpose of which is the enforcement of a sanction, power or right at the instance of the state in its sovereign capacity will not be entered by a Bermuda court. Certain remedies available under the laws of U.S. jurisdictions, including certain remedies under U.S. Federal securities laws, would not be available under Bermuda law or enforceable in a Bermuda court, as they would be contrary to Bermuda public policy. Further, no claim can be brought in Bermuda against us or our directors and officers in the first instance for violation of U.S. Federal securities laws because these laws have no extra jurisdictional effect under Bermuda law and do not have force of law in Bermuda.
48
A Bermuda court may, however, impose civil liability on us or our directors and officers if the facts alleged in a complaint constitute or give rise to a cause of action under Bermuda law.
Our international business is subject to applicable laws and regulations relating to sanctions and foreign corrupt practices, the violation of which could adversely affect our operations.
We must comply with all applicable economic sanctions and anti-bribery laws and regulations of the U.S. and other foreign jurisdictions where we operate, including the U.K. and the European Community. U.S. laws and regulations applicable to us include the economic trade sanctions laws and regulations administered by the United States Department of the Treasury’s Office of Foreign Assets Control as well as certain laws administered by the United States Department of State. In addition, we are subject to the Foreign Corrupt Practices Act and other anti-bribery laws such as the U.K. Bribery Act that generally bar corrupt payments or unreasonable gifts to foreign governments or officials. Although we have policies and controls in place that are designed to ensure compliance with these laws and regulations, it is possible that an employee or intermediary could fail to comply with applicable laws and regulations. In such event, we could be exposed to civil penalties, criminal penalties and other sanctions, including fines or other punitive actions. In addition, such violations could damage our business and/or our reputation. Such criminal or civil sanctions, penalties, other sanctions, and damage to our business and/or reputation could have a material adverse effect on our financial condition and results of operations.
Risks Related to Our Common Shares and Preferred Shares
We are a holding company, and if our subsidiaries do not make dividend and other payments to us, we may not be able to pay dividends or make payments on our common and preferred shares and other obligations.
We are a holding company with no operations or significant assets other than the capital stock of our subsidiaries and other intercompany balances. We have cash outflows in the form of other expenses, dividends to both common and preferred shareholders and, from time to time, cash outflows for the repurchase of common shares under our share repurchase program. We rely primarily on cash dividends and payments from our subsidiaries to meet our cash outflows. We expect future dividends and other permitted payments from our subsidiaries to be the principal source of funds to pay expenses and dividends. The ability of our subsidiaries to pay dividends or to advance or repay funds to us is subject to general economic, financial, competitive, regulatory and other factors beyond our control. In particular, the payment of dividends by our reinsurance subsidiaries is limited under Bermuda and Irish laws and certain statutes of various U.S. states in which our U.S. subsidiaries are licensed to transact business and include minimum solvency and liquidity thresholds. As of
December 31, 2014
, there were no significant restrictions on the payment of dividends by the Company’s subsidiaries that would limit the Company’s ability to pay common and preferred shareholders’ dividends and its corporate expenses.
Because we are a holding company, our right, and hence the right of our creditors and shareholders, to participate in any distribution of assets of any subsidiary of ours, upon our liquidation or reorganization or otherwise, is subject to the prior claims of policyholders and creditors of these subsidiaries.
Provisions in our bye-laws may restrict the voting rights of our shares and may restrict the transferability of our shares.
Our bye-laws generally provide that if any person owns, directly, indirectly or by attribution, more than 9.9% of the total combined voting power of our shares entitled to vote, the voting rights attached to such shares will be reduced so that such person may not exercise and is not attributed more than 9.9% of the total combined voting power. In addition, our board of directors may limit a shareholder’s exercise of voting rights where it deems it necessary to do so to avoid non-de minimis adverse tax, legal or regulatory consequences to us, any of our subsidiaries or any of our shareholders.
Under our bye-laws, subject to waiver by our board of directors, no transfer of our shares is permitted if such transfer would result in a shareholder controlling more than 9.9% determined by value or by voting power of our outstanding shares. Our bye-laws also provide that if our board of directors determines that share ownership by a person may result in (i) shareholder owning directly, indirectly or by retribution, more than 9.9% of the total combined voting power of our shares entitled to vote, or (ii) any non-de minimis adverse tax, legal or regulatory consequences to us, any of our subsidiaries or any of our shareholders, then we have the option, but not the obligation, to require that shareholder to sell to us for fair market value the minimum number of shares held by such person which is necessary so that after such purchase such shareholder will not own more than 9.9% of the total combined voting power, or is necessary to eliminate the non-de minimis adverse tax, legal or regulatory consequences.
We also have the authority under our bye-laws to request information from any shareholder for the purpose of determining whether a shareholder’s voting rights are to be limited pursuant to our bye-laws. If a shareholder fails to timely respond to our request for information or submits incomplete or inaccurate information in response to a request by us, we may, in our sole discretion, eliminate or reduce the shareholder’s voting rights.
49
Taxation Risks
Changes in our effective income tax rate could affect our results of operations.
Our effective income tax rate could be adversely affected in the future by net income being lower than anticipated in jurisdictions where we have a relatively lower statutory tax rate and net income being higher than anticipated in jurisdictions where we have a relatively higher statutory tax rate, or by changes in corporate tax rates and tax regulations in any of the jurisdictions in which we operate. We are subject to regular audit by tax authorities in the various jurisdictions in which we operate. Any adverse outcome of such an audit could have an adverse effect on our net income, effective income tax rate and financial condition.
In addition, the determination of our provisions for income taxes requires significant judgment, and the ultimate tax determination related to certain positions taken is uncertain. Although we believe our provisions are reasonable, the ultimate tax outcome may differ from the amounts recorded in our consolidated financial statements and may materially affect our net income and effective income tax rate in the period such determination is made.
If our non-U.S. operations become subject to U.S. income taxation, our net income will decrease.
We believe that we and our non-U.S. subsidiaries (other than business sourced by PartnerRe Europe through PartnerRe Miami and PartnerRe Connecticut) have operated, and will continue to operate, our respective businesses in a manner that will not cause us to be viewed as engaged in a trade or business in the U.S. and, on this basis, we do not expect that either we or our non-U.S. subsidiaries will be required to pay U.S. corporate income taxes (other than potential withholding taxes on certain types of U.S. source passive income) or branch profits taxes. Because there is considerable uncertainty as to the activities that constitute being engaged in a trade or business within the U.S., the IRS may contend that either we or our non-U.S. subsidiaries are engaged in a trade or business in the U.S. In addition, legislation regarding the scope of non-U.S. entities and operations subject to U.S. income tax has been proposed in the past, and may be proposed again in the future. If either we or our non-U.S. subsidiaries are subject to U.S. income tax, our shareholders’ equity and net income will be reduced by the amount of such taxes, which might be material.
The impact of Bermuda’s letter of commitment to the Organization for Economic Cooperation and Development to eliminate harmful tax practices is uncertain and could adversely affect our tax status in Bermuda.
The Organization for Economic Cooperation and Development (OECD) has published reports and launched a global initiative among member and non-member countries on measures to limit harmful tax competition. These measures are largely directed at counteracting the effects of tax havens and preferential tax regimes in countries around the world. Bermuda was not listed in the most recent report as an uncooperative tax haven jurisdiction because it had previously committed to eliminate harmful tax practices, to embrace international tax standards for transparency, to exchange information and to eliminate an environment that attracts business with no substantial domestic activity. We are not able to predict what changes will arise from the commitment or whether such changes will subject us to additional taxes.
If proposed U.S. legislation is passed, our U.S. reinsurance subsidiary may be subject to higher U.S. taxation and our net income would decrease.
Currently, our U.S. reinsurance subsidiary retrocedes or may retrocede a portion of its U.S. business to our non-U.S. reinsurance subsidiaries and is generally entitled to deductions for premiums paid for such retrocessions. Proposed legislation has been introduced that if enacted would impose a limitation on such deductions, which could result in increased U.S. tax on this business and decreased net income. It is not possible to predict whether this or similar legislation may be enacted in the future. In addition, it is possible that other legislative proposals could be introduced in the future that could have an adverse impact on us or our shareholders.
|
ITEM 1B.
|
UNRESOLVED STAFF COMMENTS
|
None.
|
ITEM 2.
|
PROPERTIES
|
The Company leases office space in Hamilton (Bermuda) where the Company’s principal executive offices are located. Additionally, the Company leases office space in various locations, principally in Dublin, Greenwich (Connecticut U.S.), Paris and Zurich.
50
|
ITEM 3.
|
LEGAL PROCEEDINGS
|
Litigation
The Company’s reinsurance subsidiaries, and the insurance and reinsurance industry in general, are subject to litigation and arbitration in the normal course of their business operations. In addition to claims litigation, the Company and its subsidiaries may be subject to lawsuits and regulatory actions in the normal course of business that do not arise from or directly relate to claims on reinsurance treaties. This category of business litigation typically involves, among other things, allegations of underwriting errors or omissions, employment claims or regulatory activity. While the outcome of business litigation cannot be predicted with certainty, the Company will dispute all allegations against the Company and/or its subsidiaries that Management believes are without merit.
At
December 31, 2014
, the Company was not a party to any litigation or arbitration that it believes could have a material effect on the financial condition, results of operations or liquidity of the Company.
|
ITEM 4.
|
MINE SAFETY DISCLOSURES
|
Not applicable.
51
|
ITEM 5.
|
MARKET FOR REGISTRANT’S COMMON EQUITY, RELATED STOCKHOLDER MATTERS AND ISSUER PURCHASES OF EQUITY SECURITIES
|
The Company has the following securities (with their related symbols) traded on the New York Stock Exchange (NYSE):
|
Common shares
|
|
PRE
|
|
6.50% Series D cumulative preferred shares
|
|
PRE-PrD
|
|
7.25% Series E cumulative preferred shares
|
|
PRE-PrE
|
|
5.875% Series F non-cumulative preferred shares
|
|
PRE-PrF
|
The Company’s common shares are also traded on the Bermuda Stock Exchange under the symbol PRE.
As of February 13, 2015, the approximate number of common shareholders was 92,967.
The following table provides information about purchases by the Company during the quarter ended
December 31, 2014
, of equity securities that are registered by the Company pursuant to Section 12 of the Exchange Act.
Issuer Purchases of Equity Securities
|
Period
|
Total number of
shares purchased
|
Average price paid
per share
|
Total number of shares purchased as part of a publicly announced program
(1) (2)
|
Maximum number of shares that may yet be purchased under the program
(1)
|
|||||||||
|
10/1/2014 - 10/31/2014
|
475,000
|
|
$
|
111.31
|
|
475,000
|
|
4,510,000
|
|
||||
|
11/01/2014 - 11/30/2014
|
317,325
|
|
115.54
|
|
317,325
|
|
4,192,675
|
|
|||||
|
12/01/2014 - 12/31/2014
|
814,000
|
|
114.83
|
|
814,000
|
|
3,378,675
|
|
|||||
|
Total
|
1,606,325
|
|
$
|
113.93
|
|
1,606,325
|
|
||||||
|
(1)
|
On September 4, 2014, the Company’s Board of Directors approved and announced a new share repurchase authorization up to a total of 5 million common shares. Unless terminated earlier by resolution of the Company’s Board of Directors, the program will expire when the Company has repurchased all shares authorized for repurchase thereunder. Under the terms of the Amalgamation Agreement, the Company suspended its share repurchase program until completion of the Amalgamation (see Business in Item 1 of Part I of this report).
|
|
(2)
|
At
December 31, 2014
, approximately 39.4 million common shares were held in treasury and available for reissuance.
|
The high and low sales prices per share of the Company’s common shares for each of the fiscal quarters in the last two fiscal years as reported on the New York Stock Exchange Composite Tape and dividends declared by the Company were as follows:
|
|
2014
|
2013
|
||||||||||||||||||||||
|
Period
|
High
|
Low
|
Dividends
Declared
|
High
|
Low
|
Dividends
Declared
|
||||||||||||||||||
|
Three months ended March 31
|
$
|
103.50
|
|
$
|
96.77
|
|
$
|
0.67
|
|
$
|
93.83
|
|
$
|
81.45
|
|
$
|
0.64
|
|
||||||
|
Three months ended June 30
|
109.21
|
|
100.41
|
|
0.67
|
|
96.05
|
|
86.86
|
|
0.64
|
|
||||||||||||
|
Three months ended September 30
|
113.07
|
|
104.36
|
|
0.67
|
|
93.23
|
|
86.64
|
|
0.64
|
|
||||||||||||
|
Three months ended December 31
|
118.10
|
|
108.40
|
|
0.67
|
|
105.43
|
|
90.50
|
|
0.64
|
|
||||||||||||
Other information with respect to the Company’s common shares, dividends and other related shareholder matters is contained in Notes 11, 12, 14 and 16 to Consolidated Financial Statements in Item 8 of Part II of this report and in Item 12 of Part III of this report.
52
Comparison of 5-Year Cumulative Total Return
The graph below compares the cumulative shareholder return, including reinvestment of dividends, on the Company’s common shares to such return for Standard & Poor’s (S&P) 500 Composite Stock Price Index and S&P’s 1500 Composite Property & Casualty Insurance Index for the period commencing on December 31, 2009 and ending on
December 31, 2014
, assuming $100 was invested on December 31, 2009. Each measurement point on the graph below represents the cumulative shareholder return as measured by the last sale price at the end of each year during the period from December 31, 2009 through
December 31, 2014
. As depicted in the graph below, during this period the cumulative total shareholder return on the Company’s common shares was 77%, the cumulative total return for the S&P 500 Composite Stock Price Index was 105% and the cumulative total return for the S&P 1500 Composite Property & Casualty Insurance Index was 136%.
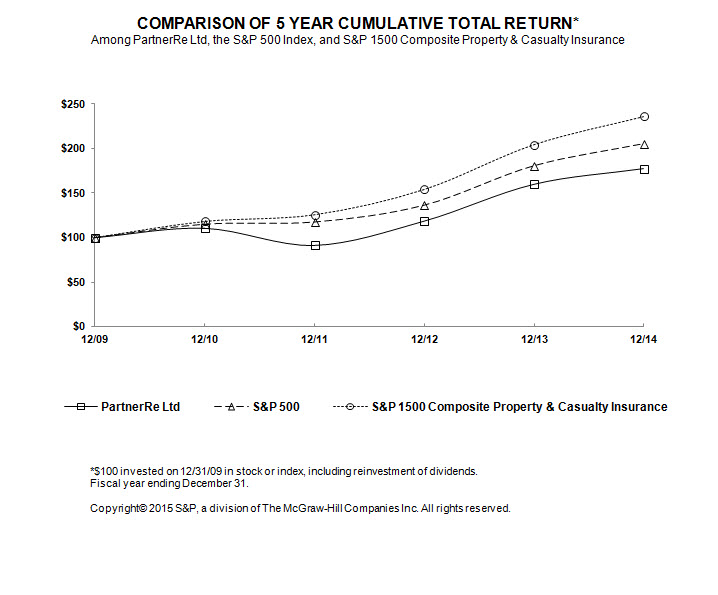
The Company has attempted to identify an index which most closely matches its business. There are no indices that properly reflect the returns of the reinsurance industry. The S&P 1500 Composite Property & Casualty Insurance Index is used as it is the broadest index of companies in the property and casualty industry. We caution the reader that this index of 27 companies does not include any companies primarily engaged in the reinsurance business, and therefore it is provided to offer context for evaluating performance, rather than direct comparison.
|
ITEM 6.
|
SELECTED FINANCIAL DATA
|
Selected Consolidated Financial Data
This data should be read in conjunction with the Consolidated Financial Statements and the accompanying Notes to Consolidated Financial Statements in Item 8 of Part II of this report and with other information contained in this report, including Management’s Discussion and Analysis of Financial Condition and Results of Operations in Item 7 of Part II of this report.
The Statement of Operations Data reflects the consolidated results of the Company and its subsidiaries for
2014
,
2013
,
2012
,
2011
and
2010
, including PartnerRe Health’s results from January 1, 2013. The Balance Sheet Data reflects the consolidated financial position of the Company and its subsidiaries at December 31,
2014
,
2013
,
2012
,
2011
and
2010
, including PartnerRe Health from December 31, 2012 (in millions of U.S. dollars or shares, except per share data):
53
|
|
For the years ended December 31,
|
|||||||||||||||||||
|
Statement of Operations Data
|
2014
|
2013
|
2012
|
2011
|
2010
|
|||||||||||||||
|
Gross premiums written
|
$
|
5,932
|
|
$
|
5,570
|
|
$
|
4,718
|
|
$
|
4,633
|
|
$
|
4,885
|
|
|||||
|
Net premiums written
|
5,720
|
|
5,397
|
|
4,573
|
|
4,486
|
|
4,705
|
|
||||||||||
|
Net premiums earned
|
$
|
5,609
|
|
$
|
5,198
|
|
$
|
4,486
|
|
$
|
4,648
|
|
$
|
4,776
|
|
|||||
|
Net investment income
|
480
|
|
484
|
|
571
|
|
629
|
|
673
|
|
||||||||||
|
Net realized and unrealized investment gains (losses)
|
372
|
|
(161
|
)
|
494
|
|
67
|
|
402
|
|
||||||||||
|
Other income
|
16
|
|
17
|
|
12
|
|
8
|
|
10
|
|
||||||||||
|
Total revenues
|
6,477
|
|
5,538
|
|
5,563
|
|
5,352
|
|
5,861
|
|
||||||||||
|
Losses and loss expenses and life policy benefits
|
3,463
|
|
3,158
|
|
2,805
|
|
4,373
|
|
3,284
|
|
||||||||||
|
Total expenses
|
5,185
|
|
4,830
|
|
4,234
|
|
5,797
|
|
4,892
|
|
||||||||||
|
Income (loss) before taxes and interest in earnings (losses) of equity method investments
|
1,292
|
|
708
|
|
1,329
|
|
(445
|
)
|
969
|
|
||||||||||
|
Income tax expense
|
239
|
|
49
|
|
204
|
|
69
|
|
129
|
|
||||||||||
|
Interest in earnings (losses) of equity method investments
|
15
|
|
14
|
|
10
|
|
(6
|
)
|
13
|
|
||||||||||
|
Net income (loss)
|
$
|
1,068
|
|
$
|
673
|
|
$
|
1,135
|
|
$
|
(520
|
)
|
$
|
853
|
|
|||||
|
Net income (loss) attributable to noncontrolling interests
|
13
|
|
9
|
|
—
|
|
—
|
|
—
|
|
||||||||||
|
Net income (loss) attributable to PartnerRe Ltd.
|
$
|
1,055
|
|
$
|
664
|
|
$
|
1,135
|
|
$
|
(520
|
)
|
$
|
853
|
|
|||||
|
Preferred dividends
|
57
|
|
58
|
|
62
|
|
47
|
|
35
|
|
||||||||||
|
Loss on redemption of preferred shares
|
—
|
|
9
|
|
—
|
|
—
|
|
—
|
|
||||||||||
|
Net income (loss) attributable to PartnerRe Ltd. common shareholders
|
$
|
998
|
|
$
|
597
|
|
$
|
1,073
|
|
$
|
(567
|
)
|
$
|
818
|
|
|||||
|
Basic net income (loss) per common share
|
$
|
19.96
|
|
$
|
10.78
|
|
$
|
17.05
|
|
$
|
(8.40
|
)
|
$
|
10.65
|
|
|||||
|
Diluted net income (loss) per common share
|
$
|
19.51
|
|
$
|
10.58
|
|
$
|
16.87
|
|
$
|
(8.40
|
)
|
$
|
10.46
|
|
|||||
|
Dividends declared and paid per common share
|
$
|
2.68
|
|
$
|
2.56
|
|
$
|
2.48
|
|
$
|
2.35
|
|
$
|
2.05
|
|
|||||
|
Operating earnings (loss) attributable to PartnerRe Ltd. common shareholders
(1) (4)
|
$
|
755
|
|
$
|
722
|
|
$
|
664
|
|
$
|
(642
|
)
|
$
|
492
|
|
|||||
|
Diluted operating earnings (loss) per common share and common share equivalents outstanding
(1)
|
$
|
14.76
|
|
$
|
12.79
|
|
$
|
10.43
|
|
$
|
(9.50
|
)
|
$
|
6.29
|
|
|||||
|
Operating return on beginning diluted book value per common share and common share equivalents outstanding
(2) (4)
|
13.5
|
%
|
12.7
|
%
|
12.3
|
%
|
(10.1
|
)%
|
7.4
|
%
|
||||||||||
|
Weighted average number of common shares and common share equivalents outstanding
|
51.2
|
|
56.4
|
|
63.6
|
|
67.6
|
|
78.2
|
|
||||||||||
|
Non-life ratios
|
||||||||||||||||||||
|
Loss ratio
|
56.1
|
%
|
56.7
|
%
|
58.5
|
%
|
96.7
|
%
|
65.9
|
%
|
||||||||||
|
Acquisition ratio
|
24.3
|
|
22.5
|
|
22.3
|
|
21.3
|
|
21.3
|
|
||||||||||
|
Other expense ratio
|
5.8
|
|
6.1
|
|
7.0
|
|
7.4
|
|
7.8
|
|
||||||||||
|
Combined ratio
|
86.2
|
%
|
85.3
|
%
|
87.8
|
%
|
125.4
|
%
|
95.0
|
%
|
||||||||||
54
|
|
At December 31,
|
|||||||||||||||||||
|
Balance Sheet Data
|
2014
|
2013
|
2012
|
2011
|
2010
|
|||||||||||||||
|
Total investments, funds held—directly managed and cash and cash equivalents
|
$
|
17,222
|
|
$
|
17,431
|
|
$
|
18,026
|
|
$
|
17,898
|
|
$
|
18,181
|
|
|||||
|
Total assets
|
22,270
|
|
23,038
|
|
22,980
|
|
22,855
|
|
23,364
|
|
||||||||||
|
Unpaid losses and loss expenses and policy benefits for life and annuity contracts
|
11,796
|
|
12,620
|
|
12,523
|
|
12,919
|
|
12,417
|
|
||||||||||
|
Debt related to senior notes
|
750
|
|
750
|
|
750
|
|
750
|
|
750
|
|
||||||||||
|
Debt related to capital efficient notes
|
71
|
|
71
|
|
71
|
|
71
|
|
71
|
|
||||||||||
|
Total shareholders’ equity attributable to PartnerRe Ltd.
|
7,049
|
|
6,710
|
|
6,933
|
|
6,468
|
|
7,207
|
|
||||||||||
|
Diluted book value per common share and common share equivalents outstanding
|
$
|
126.21
|
|
$
|
109.26
|
|
$
|
100.84
|
|
$
|
84.82
|
|
$
|
93.77
|
|
|||||
|
Diluted tangible book value per common share and common share equivalents outstanding
(3)
|
$
|
114.76
|
|
$
|
98.49
|
|
$
|
90.86
|
|
$
|
76.47
|
|
$
|
85.53
|
|
|||||
|
Number of common shares outstanding, net of treasury shares
|
49.1
|
|
53.6
|
|
58.9
|
|
65.3
|
|
70.0
|
|
||||||||||
|
(1)
|
Operating earnings or loss attributable to PartnerRe Ltd. common shareholders (operating earnings or loss) is calculated as net income or loss attributable to PartnerRe Ltd. common shareholders excluding net realized and unrealized gains or losses on investments, net of tax (except where the Company has made a strategic investment in an insurance or reinsurance related investee), net foreign exchange gains or losses, net of tax, loss on redemption of preferred shares, the interest in earnings or losses of equity investments, net of tax (except where the Company has made a strategic investment in an insurance or reinsurance related investee and where the Company does not control the investee’s activities) and certain withholding taxes on inter-company dividends (included in other expenses), net of tax, and is calculated after preferred dividends. Diluted operating earnings or loss per common share and common share equivalent outstanding (diluted operating earnings or loss per share) are calculated using operating earnings or loss for the period divided by the weighted average number of common shares and common share equivalents outstanding. The presentation of operating earnings or loss or diluted operating earnings or loss per share are non-GAAP financial measures within the meaning of Regulation G. See Key Financial Measures in Item 7 of Part II of this report for a detailed discussion of the measures used by the Company to evaluate its financial performance.
|
|
(2)
|
Operating return on beginning diluted book value per common share and common share equivalents outstanding (Operating ROE) is calculated using diluted operating earnings or loss per share, as defined above, divided by diluted book value per common share and common share equivalents outstanding at the beginning of the year. The presentation of Operating ROE is a non-GAAP financial measure within the meaning of Regulation G. See Key Financial Measures in Item 7 of Part II of this report for a detailed discussion of the measures used by the Company to evaluate its financial performance.
|
|
(3)
|
Diluted tangible book value per common share and common share equivalents outstanding (Diluted Tangible Book Value per Share) is calculated using common shareholders’ equity attributable to PartnerRe Ltd. (total shareholders’ equity less noncontrolling interests and the aggregate liquidation value of preferred shares) less goodwill and intangible assets, net of tax, divided by the weighted average number of common shares and common share equivalents outstanding (assuming exercise of all stock-based awards and other dilutive securities). The presentation of Diluted Tangible Book Value per Share is a non-GAAP financial measure within the meaning of Regulation G. See Key Financial Measures in Item 7 of Part II of this report for a detailed discussion of the measures used by the Company to evaluate its financial performance.
|
|
(4)
|
Effective January 1, 2011, Management redefined its operating earnings or loss available to common shareholders calculation to additionally exclude net foreign exchange gains or losses. In addition, Management redefined its Operating return on beginning diluted book value per share and common share equivalents outstanding calculation to measure operating return on a diluted per share basis (Operating ROE, previously referred to as operating return on beginning common shareholders’ equity). Operating earnings or loss and Operating ROE for the year ended December 31, 2010 have been recast to reflect the Company’s redefined non-GAAP measures.
|
55
|
ITEM 7.
|
MANAGEMENT’S DISCUSSION AND ANALYSIS OF FINANCIAL CONDITION AND RESULTS OF OPERATIONS
|
The following discussion and analysis reflects the consolidated results of the Company and its subsidiaries for the years ended
December 31, 2014
,
2013
and
2012
.
Executive Overview
The Company is a leading global reinsurer and insurer, with a broadly diversified and balanced portfolio of traditional reinsurance and insurance risks and capital markets risks.
Successful risk management is the foundation of the Company’s value proposition, with diversification of risks at the core of its risk management strategy. The Company’s ability to succeed in the risk assumption and management business is dependent on its ability to accurately analyze and quantify risk, to understand volatility and how risks aggregate or correlate, and to establish the appropriate capital requirements and limits for the risks assumed. All risks, whether they are reinsurance related risks or capital market risks, are managed by the Company within an integrated framework of policies and processes to ensure the intelligent and consistent evaluation and valuation of risk, and to ultimately provide an appropriate return to shareholders. For further discussion of the Company’s Risk Management framework see Risk Management in Item 1 of Part I of this report.
The Company’s long-term objective is to manage a portfolio of diversified risks that will create total shareholder value. The Company measures its success in achieving its long-term objective by targeting a return, which is variable and can be adjusted by Management, in excess of a referenced risk-free rate over the reinsurance cycle. The return is calculated using compound annual growth in diluted tangible book value per common share and common share equivalents outstanding plus dividends per common share (growth in Diluted Tangible Book Value per Share plus dividends) as its prime measure of long-term financial performance and believes this measure aligns the Company’s stated long-term objective with the measure most investors use to evaluate total shareholder value creation.
See below in Key Financial Measures for further discussion.
Industry Environment, Strategic Initiatives and Capital Management
As described in more detail below, the Company's Non-life operations are facing a challenging and limited growth environment, which is driven by price decreases and significant pressure on terms and conditions in most markets and lines of business. These drivers reflect increased competition and excess capacity in the industry, relatively low loss experience and a prolonged period of low interest rates. While Management believes that the Company’s strong global franchise and geographical footprint position the Company well for the future, Management has also focused on various initiatives to further diversify the Company's business.
O
n January 25, 2015, the Company announced that it has signed the Amalgamation Agreement with AXIS. This transaction is expected to provide the Company with an opportunity to enter the primary insurance market, benefit from increased scale and enhanced market presence and to achieve substantial benefits related to capital efficiencies, expense savings and business synergies. The AXIS transaction is further described in Business
in Item 1 of Part I of this report.
Among other initiatives, in 2013, Management announced the restructuring of its business support operations into a single integrated worldwide support platform and changes to the structure of certain of its Non-life operations, both of which provided greater operational efficiency. In 2012, the Company completed the acquisition of PartnerRe Health, a U.S. specialty accident and health reinsurance and insurance writer, to diversify into new lines of business and to access and benefit from opportunities relates to the reform of the medical insurance in the U.S.
As a result of the challenging business environment described above, during
2014
the Company returned approximately $551 million to its common shareholders through share repurchases and $134 million through common share dividends. As the Company looks to
2015
and beyond, despite the challenging environment, Management remains confident that with the recently announced merger, its strong global franchise, geographical footprint and technical underwriting skills the Company's operations will continue to provide strong results and remains focused on maintaining its strong relationships with clients.
The following discussion provides an overview of the Company’s business and trends and commentary regarding the outlook for
2015
in each business.
56
Non-life reinsurance and insurance business, trends and
2015
outlook
The Company generates its Non-life reinsurance and insurance revenue from premiums. Premium rates and terms and conditions vary by line of business depending on market conditions. Pricing cycles are driven by supply of capital in the industry and demand for reinsurance and insurance and other risk transfer products. The reinsurance and insurance business is also influenced by several other factors, including variations in interest rates and financial markets, changes in legal, regulatory and judicial environments, loss trends, inflation and general economic conditions.
In its reinsurance portfolio, the Company writes all lines of business in virtually all markets worldwide. In addition, the Company provides certain specialty insurance lines of business. The Company differentiates itself through its risk management strategy, its financial strength and its strong global franchise. In assuming its clients’ risks, the Company removes the volatility associated with those risks from the client, and then manages those risks and the risk-related volatility. Through its broad product and geographic diversification, its execution capabilities and its local presence in most major markets, the Company is able to stabilize returns, respond quickly to market needs, and capitalize on business opportunities virtually anywhere in the world.
A key challenge facing the Company is to successfully manage risk through all phases of the reinsurance cycle. The Company believes that its long-term strategy of closely monitoring the progression of each line of business, being selective in the business that it writes, and maintaining the diversification and balance of its portfolio, will optimize returns over the reinsurance cycle. Individual lines of business and markets have their own unique characteristics and are at different stages of the reinsurance pricing cycle at any given point in time. Management believes it has achieved appropriate portfolio diversification by product, geography, line and type of business, length of tail, and distribution channel. Further, Management believes that this diversification, in addition to the financial strength of the Company and its strong global franchise, will help to mitigate cyclical declines in underwriting profitability and achieve a more stable return over the reinsurance cycle.
The Non-life reinsurance market has historically been highly cyclical in nature as evidenced by hard and soft markets. Since late 2003, the Company began to see the emergence of a soft market across most lines of business with general decreases in pricing and profitability. With the exception of lines and markets impacted by specific catastrophic or large loss events, this trend continued throughout the next decade.
During the January 1,
2015
renewals, the Company experienced a decrease of approximately 1% in renewable Non-life treaty business, on a constant foreign exchange basis. The decrease in renewable premium volume was driven by all Non-life sub-segments, except for the Global (Non-U.S.) P&C sub-segment, and reflects a very challenging renewal season, with clients retaining more business,
further reductions in pricing, significant pressure on terms and conditions as a result of excess capital and limited new opportunities
. The excess capacity in the industry and cedants retaining more business and decreasing the available premium in the global industry, combined with the growth in insurance-linked securities and other alternative capital flows into the industry, continue to provide a challenge to writing business that meets our profitability requirements. Despite these persistent challenging market conditions, the Company believes that its strong global franchise and geographic footprint, long track record, broad yet highly technical capabilities over many lines of business, position the Company well.
The Company writes a large majority of its business on a treaty basis and renewed approximately 70% of its total annual Non-life treaty business on January 1, 2015. The remainder of the Non-life treaty business renews at other times during the year. In addition to treaty business, the Company writes approximately $400 million of direct and facultative business which renews throughout the year.
Life and Health reinsurance business, trends and
2015
outlook
The Company’s Life and Health segment derives revenues primarily from renewal premiums from existing reinsurance treaties and new premiums from existing or new reinsurance treaties. Within the Life and Health segment, the Company writes mortality (including disability), longevity and, following the acquisition of PartnerRe Health, U.S. accident and health products. Management believes the existing life business and PartnerRe Health business provide the Company with diversification benefits and balance to its portfolio as they are generally not correlated to the Company’s Non-life business.
The long-term profitability of the life business (including the mortality and longevity lines of business) mainly depends on the volume and amount of death claims incurred and the ability to adequately price the risk the Company assumes. The life reinsurance policies are often in force for the remaining lifetime of the underlying individuals insured, with premiums earned typically over a period of 10 to 30 years. The volume of the business may be reduced each year by terminations of the underlying treaties related to lapses, voluntary surrenders, death of insureds and recaptures by ceding companies. While death claims are reasonably predictable over a period of many years, claims become less predictable over shorter periods and can fluctuate significantly from quarter to quarter or from year to year.
The long-term profitability of the accident and health business mainly depends on the volume and amount of medical claims and expenses. While the volume of medical claims can be predicted to a certain extent, the amount of claims and expenses depends
57
on various factors, primarily health care inflation rates, driven by a shift towards the older population, reliance on expensive medical equipment and technology, and changes in demand for health care services over time.
The acquisition of the PartnerRe Health business resulted in substantial overall premium growth in the Company’s Life and Health segment in 2013 and 2014, primarily as a result of its transition from a Managing General Agent (MGA) to an insurance carrier in 2013 (see Business
in Item 1 of Part I of this report for more details)
and the opportunities arising from the implementation of the Healthcare Act in the U.S. At the January 1,
2015
renewals, t
he expected premium volume, at constant foreign exchange rates, increased compared to the prior year renewal despite increased competition. Growth originated primarily from employer markets and reinsurance products that support the Healthcare Act.
Management expects continued although more modest growth in
2015
.
In terms of the Company's Life portfolio, the active January 1 renewals only impact the short-term in-force premium in the mortality line, which is a relatively limited portion of the overall Life portfolio. For those treaties that actively renewed, pricing conditions and terms were modestly softer from the January 1,
2014
renewals. Management expects moderate continued growth in the Company’s Life portfolio in
2015
from new business initiatives, assuming constant foreign exchange rates.
Investment business, trends and
2015
outlook
The Company generates revenue from its high quality investment portfolio, as well as the investments underlying the funds held - directly managed account, through net investment income, including coupon interest on fixed maturities and dividends on equities, and realized and unrealized gains and losses on investments.
For the Company’s investment risks, which include both public and private market investments, diversification of risk is critical to achieving the risk and return objectives of the Company. The Company’s investment policy distinguishes between liquid, high quality assets that support the Company’s liabilities, and the more diversified, higher risk asset classes that make up the Company’s capital funds. While there will be years where investment markets risks achieve less than the risk-free rate of return, or potentially even negative results, the Company believes the rewards for assuming these risks in a disciplined and measured way will produce a positive excess return to the Company over time. Additionally, since investment risks are not fully correlated with the Company’s reinsurance risks, this increases the overall diversification of the Company’s total risk portfolio.
The Company follows prudent investment guidelines through a strategy that seeks to maximize returns while managing investment risk in line with the Company’s overall objectives of earnings stability and long-term book value growth. The Company allocates its invested assets into two categories: liability funds and capital funds (see the discussion of liability funds and capital funds in Financial Condition, Liquidity and Capital Resources). A key challenge for the Company is achieving the right balance between current investment income and total returns (that include price appreciation or depreciation) in changing market conditions. The Company regularly reviews the allocation of investments to asset classes within its investment portfolio and its funds held - directly managed account and allocates investments to those asset classes the Company anticipates will outperform in the near future, subject to limits and guidelines. Similarly, the Company reduces its exposure to risk asset classes where returns are deemed unattractive. The Company may also lengthen or shorten the duration of its fixed maturity portfolio in anticipation of changes in interest rates, or increase or decrease the amount of credit risk it assumes, depending on credit spreads and anticipated economic conditions.
The Company’s investment operations have experienced volatile market conditions since the middle of 2007. The market conditions remained volatile in
2014
, primarily due to
decreases in U.S. and European risk-free interest rates and improvements in worldwide equity markets
. Assuming constant foreign exchange rates, Management expects net investment income to continue to decrease in
2015
compared to
2014
primarily due to lower reinvestment rates with low yields expected to continue throughout
2015
. Management expects this decrease to be partially offset by expected positive cash flow from operations (including net investment income).
Overview of the Results of Operations
The Company measures its performance in several ways. Among the performance measures accepted under U.S. GAAP is diluted net income or loss per share, a measure that focuses on the return provided to the Company’s common shareholders. Diluted net income or loss per share is obtained by dividing net income or loss attributable to PartnerRe Ltd. common shareholders by the weighted average number of common shares and common share equivalents outstanding. Net income or loss attributable to PartnerRe Ltd. common shareholders is defined as net income or loss less preferred dividends and loss on redemption of preferred shares. The Company's net income, net income attributable to PartnerRe Ltd., net income attributable to PartnerRe Ltd. common shareholders and diluted net income per share are discussed below in Review of Net Income.
The Company also utilizes certain non-GAAP measures to assess performance (see the discussion of these non-GAAP measures and the reconciliation to the most directly comparable GAAP measures in Key Financial Measures below).
58
Overview of Net Income
Net income, net income attributable to noncontrolling interests, net income attributable to ParterRe Ltd., preferred dividends, loss on redemption of preferred shares, net income attributable to PartnerRe Ltd. common shareholders and diluted net income per share for the years ended
December 31, 2014
,
2013
and
2012
were as follows (in millions of U.S. dollars, except per share data):
|
2014
|
2013
|
2012
|
|||||||||
|
Net income
|
$
|
1,068
|
|
$
|
673
|
|
$
|
1,135
|
|
||
|
Net income attributable to noncontrolling interests
|
(13
|
)
|
(9
|
)
|
—
|
|
|||||
|
Net income attributable to PartnerRe Ltd.
|
1,055
|
|
664
|
|
1,135
|
|
|||||
|
Less:
|
|||||||||||
|
Preferred dividends
|
57
|
|
58
|
|
62
|
|
|||||
|
Loss on redemption of preferred shares
|
—
|
|
9
|
|
—
|
|
|||||
|
Net income attributable to PartnerRe Ltd. common shareholders
|
$
|
998
|
|
$
|
597
|
|
$
|
1,073
|
|
||
|
Diluted net income per share attributable to PartnerRe Ltd. common shareholders
|
$
|
19.51
|
|
$
|
10.58
|
|
$
|
16.87
|
|
||
2014 compared to 2013
The increase in net income, net income attributable to PartnerRe Ltd., net income attributable to PartnerRe Ltd. common shareholders and diluted net income per share in
2014
compared to
2013
was primarily due to:
|
•
|
an increase in pre-tax net realized and unrealized investment gains of $533 million; and
|
|
•
|
a decrease in other expenses included in Corporate and Other of $40 million; partially offset by
|
|
•
|
an increase in income tax expense of $190 million, which was primarily related to the increase in pre-tax
net realized and unrealized investment gains
.
|
For diluted net income per share specifically, the increase was also due to the accretive impact of a reduction in the diluted number of common shares and common share equivalents outstanding as a result of share repurchases. The factors driving these increases and decreases are described in more detail in Review of Net Income below.
2013 compared to 2012
The decrease in net income, net income attributable to PartnerRe Ltd., net income attributable to PartnerRe Ltd. common shareholders and diluted net income per share in
2013
compared to
2012
was primarily due to:
|
•
|
an increase in pre-tax net realized and unrealized investment losses of $655 million; and
|
|
•
|
a decrease in net investment income of $87 million and higher other expenses included in Corporate and Other of $68 million; partially offset by
|
|
•
|
a combined increase in the Non-life and Life underwriting result of $198 million; and
|
|
•
|
a decrease in income tax expense of $155 million.
|
For diluted net income per share specifically, the decrease was partially offset by the accretive impact of a reduction in the diluted number of common shares and common share equivalents outstanding as a result of share repurchases. The factors driving these increases and decreases are described in more detail in Review of Net Income below.
Key Factors Affecting Year over Year Comparability
The following key factors affected the year over year comparison of the Company’s results for the year ended December 31, 2014, 2013 and 2012 and may continue to affect our results of operations and financial condition in the future.
59
Volatility in capital markets
The results for the years ended
December 31, 2014
,
2013
and 2012 were significantly impacted by the volatility in the capital markets with the Company reporting net realized and unrealized gains (losses) on investments in net income as follows (in millions U.S. $):
|
Year ended December 31,
|
Total
|
|||
|
2014
|
$
|
372
|
|
|
|
2013
|
(161
|
)
|
||
|
2012
|
494
|
|
||
In 2014, U.S. and European risk-free interest rates decreased and worldwide equity markets improved, while the U.S. dollar ending exchange rate at December 31, 2014 strengthened against most major currencies compared to December 31,
2013
. The net result of these movements was a net realized and unrealized gain on investments recorded in net income.
In 2013, U.S. and European risk-free interest rates increased and equity markets improved and credit spreads narrowed, while the U.S. dollar ending exchange rate at December 31, 2013 weakened against most major currencies compared to December 31, 2012. The net result of these movements was a net realized and unrealized loss on investments recorded in net income, which was partially offset by an unrealized gain related to the initial public offering of an investment in a mortgage guaranty insurance company.
In 2012, credit spreads narrowed, equity markets improved and U.S. and European risk-free interest rates decreased, while the U.S. dollar ending exchange rate at December 31, 2012 weakened against most major currencies compared to December 31, 2011. The net result of these movements was a net realized and unrealized gain on investments recorded in net income.
Large catastrophic and large loss events
As the Company’s reinsurance operations are exposed to low frequency and high severity risk events, some of which are seasonal, results for certain periods may include unusually low loss experience, while results for other periods may include significant catastrophic losses. For example, the Company's results for 2014 included no significant catastrophic losses, while in 2013 the Company incurred losses of
$142 million
, net of retrocession and reinstatement premiums, related to the combined impact of the German Hailstorm, Alberta Floods and the European Floods, and in 2012 the Company incurred losses of $318 million, net of retrocession and reinstatement premiums, related to the combined impact of Superstorm Sandy and the U.S. drought. As a reference point, the Company's results for 2011 included an unusually high frequency of high severity catastrophic events, including the Japan Earthquake and 2011 New Zealand Earthquakes, with incurred losses of $1,790 million, net of retrocession and reinstatement premiums.
|
Total
(1)
|
||||
|
Year ended December 31,
|
(in millions U.S. $)
|
|||
|
2014
|
$
|
—
|
|
|
|
2013
|
142
|
|
||
|
2012
|
318
|
|
||
|
(1)
|
Large catastrophic losses and large losses are shown net of any reinsurance, reinstatement premiums and profit commissions.
|
60
The combined impact of large catastrophic losses on the Company’s technical result, net realized and unrealized investment gains or losses, pre-tax net income, loss ratio, technical ratio and combined ratio by segment and sub-segment and the large catastrophic losses by event for the years ended December 31, 2013 and 2012 were as follows (in millions of U.S. dollars):
|
2013
|
North America
|
Global (Non-U.S.) P&C
|
Global Specialty
|
Catastrophe
|
Total Non-life segment
|
Life and Health segment
|
Corporate and Other
|
Total
|
||||||||||||||||||||||||
|
Net losses and loss expenses and life policy benefits
|
$
|
14
|
|
$
|
11
|
|
$
|
15
|
|
$
|
115
|
|
$
|
155
|
|
$
|
—
|
|
$
|
—
|
|
$
|
155
|
|
||||||||
|
Reinstatement premiums
|
—
|
|
—
|
|
—
|
|
(13
|
)
|
(13
|
)
|
—
|
|
—
|
|
(13
|
)
|
||||||||||||||||
|
Impact on technical result and pre-tax net income
|
$
|
14
|
|
$
|
11
|
|
$
|
15
|
|
$
|
102
|
|
$
|
142
|
|
$
|
—
|
|
$
|
—
|
|
$
|
142
|
|
||||||||
|
Impact on the loss ratio
|
0.9
|
%
|
1.5
|
%
|
1.0
|
%
|
25.0
|
%
|
3.5
|
%
|
||||||||||||||||||||||
|
Impact on the technical ratio
|
0.9
|
%
|
1.5
|
%
|
1.0
|
%
|
25.0
|
%
|
3.4
|
%
|
||||||||||||||||||||||
|
Impact on the combined ratio
|
3.4
|
%
|
||||||||||||||||||||||||||||||
|
2013
|
Total
(1)
|
|||||||||||||||||||||||||||||||
|
German Hailstorm
|
$
|
58
|
|
|||||||||||||||||||||||||||||
|
Alberta Floods
|
48
|
|
||||||||||||||||||||||||||||||
|
European Floods
|
36
|
|
||||||||||||||||||||||||||||||
|
Impact on pre-tax net income
|
$
|
142
|
|
|||||||||||||||||||||||||||||
|
(1)
|
Large catastrophic losses are shown net of any reinsurance, reinstatement premiums and profit commissions.
|
|
2012
|
North America
|
Global (Non-U.S.) P&C
|
Global Specialty
|
Catastrophe
|
Total Non-life segment
|
Life and Health segment
|
Corporate and Other
|
Total
|
||||||||||||||||||||||||
|
Net losses and loss expenses and life policy benefits
|
$
|
157
|
|
$
|
2
|
|
$
|
87
|
|
$
|
82
|
|
$
|
328
|
|
$
|
—
|
|
$
|
—
|
|
$
|
328
|
|
||||||||
|
Reinstatement premiums
|
—
|
|
—
|
|
(1
|
)
|
(11
|
)
|
(12
|
)
|
—
|
|
—
|
|
(12
|
)
|
||||||||||||||||
|
Impact on technical result
|
$
|
157
|
|
$
|
2
|
|
$
|
86
|
|
$
|
71
|
|
$
|
316
|
|
$
|
—
|
|
$
|
—
|
|
$
|
316
|
|
||||||||
|
Net realized and unrealized investment losses
|
—
|
|
—
|
|
2
|
|
2
|
|
||||||||||||||||||||||||
|
Impact on pre-tax net-income
|
$
|
316
|
|
$
|
—
|
|
$
|
2
|
|
$
|
318
|
|
||||||||||||||||||||
|
Impact on the loss ratio
|
13.4
|
%
|
0.3
|
%
|
6.3
|
%
|
17.8
|
%
|
8.7
|
%
|
||||||||||||||||||||||
|
Impact on the technical ratio
|
13.4
|
%
|
0.3
|
%
|
6.3
|
%
|
17.6
|
%
|
8.7
|
%
|
||||||||||||||||||||||
|
Impact on the combined ratio
|
8.7
|
%
|
||||||||||||||||||||||||||||||
|
2012
|
Total
(1)
|
|||||||||||||||||||||||||||||||
|
Superstorm Sandy
|
$
|
227
|
|
|||||||||||||||||||||||||||||
|
U.S. drought
|
91
|
|
||||||||||||||||||||||||||||||
|
Impact on pre-tax net income
|
$
|
318
|
|
|||||||||||||||||||||||||||||
|
(1)
|
Large catastrophic losses and large losses are shown net of any reinsurance, reinstatement premiums and profit commissions.
|
Restructuring charges
The results for the years ended
December 31, 2014
and
2013
were also impacted by the restructuring of the Company's business support operations into a single integrated worldwide support platform and changes to the structure of its Global Non-life Operations (the restructuring) announced in April 2013. The restructuring included involuntary and voluntary employee termination plans in certain jurisdictions (collectively, termination plans) and certain real estate related costs.
61
During the years ended
December 31, 2014
and
2013
, the Company recorded within Other expenses a pre-tax restructuring charge of
$11 million
and $58 million, respectively. These restructuring charges were primarily related to the termination plans in 2013 and to certain real estate costs in 2014.
Acquisition of PartnerRe Health
Effective December 31, 2012, the Company completed the acquisition of PartnerRe Health. The Consolidated Statements of Operations and Cash Flows, and the Life and Health segment, include the results of PartnerRe Health from January 1, 2013.
At the time of the acquisition, PartnerRe Health operated as an MGA, writing all of its business on behalf of third-party insurance companies and earning a fee for producing the business, as well as participating in a portion of the original business that was ceded to PartnerRe Health by these third parties based on quota share agreements. During 2013, the Company obtained the necessary licenses and approvals and began transitioning the portfolio to PartnerRe carriers. As of January 1, 2014, virtually all of the PartnerRe Health business was originated directly, without the use of third party insurance companies. As a result, this transition affects the year over year comparability with increased gross and net premiums written, net premiums earned, losses and loss expenses and acquisition costs, and reduced MGA fee income, which is recorded in Other income, in
2014
compared to
2013
.
Key Financial Measures
In addition to the Consolidated Balance Sheets and Consolidated Statements of Operations and Comprehensive Income, Management uses certain other key measures, some of which are non-GAAP financial measures within the meaning of Regulation G (see below), to evaluate its financial performance and the overall growth in value generated for the Company’s common shareholders.
The Company’s long-term objective is to manage a portfolio of diversified risks that will create total shareholder value. The Company measures its success in achieving its long-term objective by targeting a return, which is variable and can be adjusted by Management, in excess of a referenced risk-free rate over the reinsurance cycle. The return, which is currently targeted to exceed 700 basis points in excess of the referenced risk-free rate, is calculated using compound annual growth in diluted tangible book value per common share and common share equivalents outstanding plus dividends per common share (growth in Diluted Tangible Book Value per Share plus dividends). Management uses growth in Diluted Tangible Book Value per Share plus dividends as its prime measure of long-term financial performance and believes this measure aligns the Company’s stated long-term objective with the measure most investors use to evaluate total shareholder value creation given that it focuses on the tangible value of total shareholder returns, excluding the impact of goodwill and intangibles.
Given the Company’s profitability in any particular quarterly or annual period can be significantly affected by the level of large catastrophic losses, Management assesses this long-term objective over the reinsurance cycle as the Company’s performance during any particular quarterly or annual period is not necessarily indicative of its performance over the longer-term reinsurance cycle.
While growth in Diluted Tangible Book Value per Share plus dividends is the Company’s prime financial measure, Management also uses other key financial measures to monitor performance. At
December 31, 2014
and
2013
and for the years ended
December 31, 2014
,
2013
and
2012
these were as follows:
|
December 31, 2014
|
December 31, 2013
|
||||||||||
|
Diluted tangible book value per common share and common share equivalents outstanding
(1)
|
$
|
114.76
|
|
$
|
98.49
|
|
|||||
|
Growth in diluted tangible book value per common share and common share equivalents outstanding plus dividends
(2)
|
19.2
|
%
|
|||||||||
|
|
2014
|
2013
|
2012
|
||||||||
|
Operating earnings attributable to PartnerRe Ltd. common shareholders (in millions of U.S. dollars)
(3)
|
$
|
755
|
|
$
|
722
|
|
$
|
664
|
|
||
|
Diluted operating earnings per common share and common share equivalents outstanding attributable to PartnerRe Ltd. common shareholders
(3)
|
$
|
14.76
|
|
$
|
12.79
|
|
$
|
10.43
|
|
||
|
Operating return on beginning diluted book value per common share and common share equivalents outstanding
(4)
|
13.5
|
%
|
12.7
|
%
|
12.3
|
%
|
|||||
|
Combined ratio
(5)
|
86.2
|
%
|
85.3
|
%
|
87.8
|
%
|
|||||
62
|
(1)
|
Diluted tangible book value per common share and common share equivalents outstanding (Diluted Tangible Book Value per Share) is calculated using common shareholders’ equity attributable to PartnerRe Ltd. (total shareholders’ equity less noncontrolling interests and the aggregate liquidation value of preferred shares) less goodwill and intangible assets, net of tax, divided by the number of common shares and common share equivalents outstanding (assuming exercise of all stock-based awards and other dilutive securities). The presentation of Diluted Tangible Book Value per Share is a non-GAAP financial measure within the meaning of Regulation G (see Comment on Non-GAAP Measures below) and is reconciled to the most directly comparable GAAP financial measure below.
|
|
(2)
|
Growth in diluted tangible book value per common share and common share equivalents outstanding plus dividends (growth in Diluted Tangible Book Value per Share plus dividends) is calculated using Diluted Tangible Book Value per Share plus dividends per common share divided by Diluted Tangible Book Value per Share at the beginning of the year. The presentation of growth in Diluted Tangible Book Value per Share plus dividends is a non-GAAP financial measure within the meaning of Regulation G (see Comment on Non-GAAP Measures below) and is reconciled to the most directly comparable GAAP financial measure below.
|
|
(3)
|
Operating earnings or loss attributable to PartnerRe Ltd. common shareholders (operating earnings or loss) is calculated as net income or loss attributable to PartnerRe Ltd. common shareholders excluding net realized and unrealized gains or losses on investments, net of tax (except where the Company has made a strategic investment in an insurance or reinsurance related investee), net foreign exchange gains or losses, net of tax, loss on redemption of preferred shares, the interest in earnings or losses of equity method investments, net of tax (except where the Company has made a strategic investment in an insurance or reinsurance related investee and where the Company does not control the investee’s activities) and certain withholding taxes on inter-company dividends (included in other expenses), net of tax, and is calculated after preferred dividends. Operating earnings or loss per common share and common share equivalent outstanding (diluted operating earnings or loss per share) are calculated using operating earnings or loss for the period divided by the weighted average number of common shares and common share equivalents outstanding. The presentation of operating earnings or loss and diluted operating earnings or loss per share are non-GAAP financial measures within the meaning of Regulation G (see Comment on Non-GAAP Measures below) and are reconciled to the most directly comparable GAAP financial measure below.
|
|
(4)
|
Operating return on beginning diluted book value per common share and common share equivalents outstanding (Operating ROE) is calculated using operating earnings or loss, as defined above, per diluted common share and common share equivalents outstanding, divided by diluted book value per common share and common share equivalents outstanding as of the beginning of the year, as defined above. The presentation of Operating ROE is a non-GAAP financial measure within the meaning of Regulation G (see Comment on Non-GAAP Measures below) and is reconciled to the most directly comparable GAAP financial measure below.
|
|
(5)
|
The combined ratio of the Non-life segment is calculated as the sum of the technical ratio (losses and loss expenses and acquisition costs divided by net premiums earned) and the other expense ratio (other expenses divided by net premiums earned).
|
Diluted Tangible Book Value per Share:
Diluted Tangible Book Value per Share focuses on the underlying fundamentals of the Company’s financial position and performance without the impact of goodwill or intangible assets. As discussed above, the Company uses this measure as the basis for its prime measure of long-term shareholder value creation, growth in Diluted Tangible Book Value per Share plus dividends. Management believes that Diluted Tangible Book Value per Share aligns the Company’s stated long-term objectives with the measure most investors use to evaluate total shareholder value creation and that it focuses on the tangible value of shareholder returns, excluding the impact of goodwill and intangibles. Diluted Tangible Book Value per Share is impacted by the Company’s net income or loss, capital resources management and external factors such as foreign exchange, interest rates, credit spreads and equity markets, which can drive changes in realized and unrealized gains or losses on its investment portfolio.
Diluted Tangible Book Value per Share at
December 31, 2014
and
2013
and the calculation of the growth in Diluted Tangible Book Value per Share plus dividends for the year ended
December 31, 2014
were as follows. As described above, this metric is a long-term performance measure, however, the below table shows the total shareholder value creation for the year ended
December 31, 2014
in order for the shareholders to monitor performance.
|
December 31, 2014
|
December 31, 2013
|
||||||
|
Diluted tangible book value per share
|
$
|
114.76
|
|
$
|
98.49
|
|
|
|
Dividends declared per common share during the year ended December 31, 2014
|
2.68
|
|
|||||
|
Diluted tangible book value per share plus dividends
|
$
|
117.44
|
|
||||
|
Growth in diluted tangible book value per share plus dividends
|
19.2
|
%
|
|||||
The Company’s Diluted Tangible Book Value per Share increased by
16.5%
, from $98.49 at
December 31, 2013
to
$114.76
at
December 31, 2014
, primarily due to net income attributable to PartnerRe Ltd. and the accretive impact of share repurchases, which
63
was partially offset by dividends on the common and preferred shares. The growth in Diluted Tangible Book Value per Share plus dividends was
19.2%
during the year ended
December 31, 2014
. This growth was driven by net income attributable to PartnerRe Ltd. and dividends declared on the common shares.
Over the past five years, since
December 31,
2009, the Company has generated a compound annual growth in Diluted Tangible Book Value per Share plus dividends in excess of 10%. Over the past ten years, since December 31, 2004, the Company has generated a compound annual growth in Diluted Tangible Book Value per Share plus dividends in excess of 12%.
The presentation of Diluted Tangible Book Value per Share is a non-GAAP financial measure within the meaning of Regulation G and should be considered in addition to, and not as a substitute for, measures of financial performance prepared in accordance with GAAP (see Comment on Non-GAAP Measures). The reconciliation of Diluted Tangible Book Value per Share to the most directly comparable GAAP financial measure, diluted book value per common share and common share equivalents outstanding, at
December 31, 2014
and
2013
was as follows (in millions of U.S. dollars):
|
December 31, 2014
|
December 31, 2013
|
||||||
|
Diluted book value per common share and common share equivalents outstanding
(1)
|
$
|
126.21
|
|
$
|
109.26
|
|
|
|
Less: goodwill and other intangible assets, net of tax, per share
|
11.45
|
|
10.77
|
|
|||
|
Diluted tangible book value per share
|
$
|
114.76
|
|
$
|
98.49
|
|
|
|
(1)
|
Diluted book value per common share and common share equivalents outstanding (Diluted Book Value per Share) is calculated using common shareholders’ equity attributable to PartnerRe Ltd. (total shareholders’ equity less noncontrolling interests and the aggregate liquidation value of preferred shares) divided by the number of common shares and common share equivalents outstanding (assuming exercise of all stock-based awards and other dilutive securities).
|
Operating earnings or loss attributable to PartnerRe Ltd. common shareholders (operating earnings or loss) and operating earnings or loss per common share and common share equivalent outstanding (diluted operating earnings or loss per share):
Management uses operating earnings or loss and diluted operating earnings or loss per share to measure its financial performance as these measures focus on the underlying fundamentals of the Company’s operations by excluding net realized and unrealized gains or losses on investments (except where the Company has made a strategic investment in an investee whose operations are insurance or reinsurance related and where the Company does not control the investee’s activities), net foreign exchange gains or losses, loss on redemption of preferred shares, certain interest in earnings or losses of equity method investments (except where the Company has made a strategic investment in an investee whose operations are insurance or reinsurance related and where the Company does not control the investee’s activities) and certain withholding taxes on inter-company dividends. Net realized and unrealized gains or losses on investments in any particular period are not indicative of the performance of, and distort trends in, the Company’s business as they predominantly result from general economic and financial market conditions, and the timing of realized gains or losses on investments is largely opportunistic. Net foreign exchange gains or losses are not indicative of the performance of, and distort trends in, the Company’s business as they predominantly result from general economic and foreign exchange market conditions. Loss on the redemption of preferred shares is not indicative of the performance of, and distorts trends in, the Company’s business as it resulted from general economic and financial market conditions, and the timing of the loss on redemption was largely opportunistic. Interest in earnings or losses of equity method investments are also not indicative of the performance of, or trends in, the Company’s business where the investee’s operations are not insurance or reinsurance related and where the Company does not control the investee companies’ activities. Withholding taxes on inter-company dividends are not indicative of the performance of, and distort trends in, the Company’s business as they relate to an inter-company transaction rather than the Company's core operating performance. Management believes that the use of operating earnings or loss and diluted operating earnings or loss per share enables investors and other users of the Company’s financial information to analyze its performance in a manner similar to how Management analyzes performance. Management also believes that these measures follow industry practice and, therefore, allow the users of financial information to compare the Company’s performance with its industry peer group, and that the equity analysts and certain rating agencies which follow the Company, and the insurance industry as a whole, generally exclude these items from their analyses for the same reasons.
Operating earnings increased by $
33 million
, from $
722 million
in
2013
to $
755 million
in
2014
. The increase in operating earnings was primarily due to:
|
•
|
a decrease of $
40 million
in other expenses included in Corporate and Other, driven by the restructuring charge recorded in 2013; and
|
|
•
|
a decrease of $9 million in operating tax expense, primarily driven by a higher distribution of the Company's pre-tax net income recorded in non-taxable jurisdictions in 2014 compared to 2013; partially offset by
|
|
•
|
a decrease of $
16 million
in the Non-life underwriting result, which was mainly driven by a decrease in the current accident year technical result in the North America, Global (Non-U.S.) P&C and Catastrophe sub-segments, and a decrease in favorable prior year loss development. These decreases were partially offset by the absence of large
|
64
catastrophic losses in 2014 compared to losses related to the German Hailstorm, Alberta Floods and European Floods in 2013. Additional detail of the Non-life underwriting result is provided in the discussion of individual sub-segments in Results by Segment and Review of Net Income below.
Diluted operating earnings per share increased from $
12.79
in
2013
to $
14.76
in
2014
, primarily due to the increase in operating earnings and the accretive impact of share repurchases.
Operating earnings increased by $58 million, from $664 million in 2012 to $722 million in 2013. The increase was primarily due to:
|
•
|
an improvement in the Non-life and Life and Health underwriting results, driven by a lower level of large catastrophic and large losses and a higher level of favorable prior year loss development, reduced by a higher level of mid-sized loss activity; partially offset by
|
|
•
|
a decline in net investment income driven by lower reinvestment rates; and
|
|
•
|
higher other expenses driven by restructuring charges.
|
Diluted operating earnings per share increased from $10.43 in 2012 to $12.79 in 2013, primarily due to the increase in operating earnings and the accretive impact of share repurchases.
The other lesser factors contributing to the increases or decreases in operating earnings and diluted operating earnings per share in
2014
compared to
2013
and in
2013
compared to
2012
are further described in Review of Net Income below.
Operating earnings or loss attributable to PartnerRe Ltd. common shareholders and diluted operating earnings or loss per share are non-GAAP financial measures within the meaning of Regulation G and should be considered in addition to, and not as a substitute for, measures of financial performance prepared in accordance with GAAP (see Comment on Non-GAAP Measures). The reconciliation of operating earnings and diluted operating earnings per share to the most directly comparable GAAP financial measure for the years ended
December 31, 2014
,
2013
and
2012
was as follows (in millions of U.S. dollars):
|
2014
|
2013
|
2012
|
|||||||||
|
Net income attributable to PartnerRe Ltd.
|
$
|
1,055
|
|
$
|
664
|
|
$
|
1,135
|
|
||
|
Less:
|
|||||||||||
|
Net realized and unrealized investment gains (losses), net of tax
|
286
|
|
(127
|
)
|
392
|
|
|||||
|
Net foreign exchange (losses) gains, net of tax
|
(46
|
)
|
2
|
|
8
|
|
|||||
|
Interest in earnings of equity method investments, net of tax
|
9
|
|
9
|
|
9
|
|
|||||
|
Withholding tax on inter-company dividends, net of tax
|
(6
|
)
|
—
|
|
—
|
|
|||||
|
Dividends to preferred shareholders
|
57
|
|
58
|
|
62
|
|
|||||
|
Operating earnings attributable to PartnerRe Ltd. common shareholders
|
$
|
755
|
|
$
|
722
|
|
$
|
664
|
|
||
|
Per diluted share:
|
|||||||||||
|
Net income attributable to PartnerRe Ltd. common shareholders
|
$
|
19.51
|
|
$
|
10.58
|
|
$
|
16.87
|
|
||
|
Less:
|
|||||||||||
|
Net realized and unrealized investment gains (losses), net of tax
|
5.60
|
|
(2.25
|
)
|
6.17
|
|
|||||
|
Net foreign exchange (losses) gains, net of tax
|
(0.90
|
)
|
0.04
|
|
0.13
|
|
|||||
|
Interest in earnings of equity method investments, net of tax
|
0.17
|
|
0.16
|
|
0.14
|
|
|||||
|
Withholding tax on inter-company dividends, net of tax
|
(0.12
|
)
|
—
|
|
—
|
|
|||||
|
Loss on redemption of preferred shares
|
—
|
|
(0.16
|
)
|
—
|
|
|||||
|
Operating earnings attributable to PartnerRe Ltd. common shareholders
|
$
|
14.76
|
|
$
|
12.79
|
|
$
|
10.43
|
|
||
65
Operating ROE:
Management uses Operating ROE as a measure of profitability that focuses on the return to common shareholders on an annual basis. To support the Company’s growth objectives, most economic decisions, including capital attribution and underwriting pricing decisions, incorporate an Operating ROE impact analysis. For the purpose of that analysis, an appropriate amount of capital (equity) is attributed to each transaction for determining the transaction’s priced return on attributed capital. Subject to an adequate return for the risk level as well as other factors, such as the contribution of each risk to the overall risk level and risk diversification, capital is attributed to the transactions generating the highest priced return on deployed capital. Management’s challenge consists of (i) attributing an appropriate amount of capital to each transaction based on the risk created by the transaction, (ii) properly estimating the Company’s overall risk level and the impact of each transaction on the overall risk level, (iii) assessing the diversification benefit, if any, of each transaction, and (iv) deploying available capital. The risk for the Company lies in misestimating any one of these factors, which are critical in calculating a meaningful priced return on deployed capital, and entering into transactions that do not contribute to the Company’s growth objectives.
Operating ROE increased from
12.7%
in
2013
to
13.5%
in
2014
. The increase in Operating ROE was due to higher operating earnings, driven by the reasons described above, partially offset by a higher diluted book value per share at January 1, 2014 compared to January 1, 2013. The factors contributing to increases or decreases in operating earnings are described further in Review of Net Income below.
Operating ROE increased modestly from 12.3% in 2012 to 12.7% in 2013. The increase in Operating ROE was primarily due to higher operating earnings in 2013 compared to 2012, as described above, and the accretive impact of share repurchases, which were partially offset by a higher beginning diluted book value per share at January 1, 2013 compared to January 1, 2012.
The factors contributing to increases or decreases in operating earnings are described further in Review of Net Income below.
The average Operating ROE for the last five years and ten years was 7.2% and 11.1%, respectively. Both the five-year and the ten-year averages primarily reflect some years that were impacted by significant catastrophic losses and other years that were not impacted by catastrophes. Due to the volatility related to the level of catastrophic losses incurred, Management believes that it is more appropriate to measure performance based on an average Operating ROE target over the reinsurance cycle rather than focusing on the results for single periods.
The presentation of Operating ROE is a non-GAAP financial measure within the meaning of Regulation G and should be considered in addition to, and not as a substitute for, measures of financial performance prepared in accordance with GAAP (see Comment on Non-GAAP Measures). The reconciliation of Operating ROE to the most directly comparable GAAP financial measure for the years ended
December 31, 2014
,
2013
and
2012
was as follows:
|
2014
|
2013
|
2012
|
||||||
|
Return on beginning diluted book value per common share calculated with net income per share attributable to common shareholders
|
17.9
|
%
|
10.5
|
%
|
19.9
|
%
|
||
|
Less:
|
||||||||
|
Net realized and unrealized investment gains (losses), net of tax, on beginning diluted book value per common share
|
5.1
|
|
(2.2
|
)
|
7.3
|
|
||
|
Net foreign exchange (losses) gains, net of tax, on beginning diluted book value per common share
|
(0.8
|
)
|
—
|
|
0.1
|
|
||
|
Net interest in earnings of equity method investments, net of tax, on beginning diluted book value per common share
|
0.2
|
|
0.2
|
|
0.2
|
|
||
|
Withholding tax on inter-company dividends, net of tax, on beginning diluted book value per common share
|
(0.1
|
)
|
—
|
|
—
|
|
||
|
Loss on redemption of preferred shares, on beginning diluted book value per common share
|
—
|
|
(0.2
|
)
|
—
|
|
||
|
Operating return on beginning diluted book value per common share
|
13.5
|
%
|
12.7
|
%
|
12.3
|
%
|
||
Combined ratio:
The combined ratio is used industry-wide as a measure of underwriting profitability for Non-life business. A combined ratio under 100% indicates underwriting profitability, as the total losses and loss expenses, acquisition costs and other expenses are less than the premiums earned on that business. While an important metric of underwriting profitability, the combined ratio does not reflect all components of profitability, as it does not recognize the impact of investment income earned on premiums between the time premiums are received and the time loss payments are ultimately made to clients. The key challenges in managing the combined ratio metric consist of (i) focusing on underwriting profitable business even in the weaker part of the reinsurance cycle, as opposed to growing the book of business at the cost of profitability, (ii) diversifying the portfolio to achieve a good balance of business, with the expectation that underwriting losses in certain lines or markets may potentially be offset by underwriting profits in other lines or markets, and (iii) maintaining control over expenses.
66
Since 2004, the Company has had underwriting profitability reflected in combined ratios of less than 100% for its Non-life segment in each year, except for 2005 and 2011. In 2005, when the industry recorded its worst year in history in terms of catastrophe losses in the U.S., with Hurricane Katrina being the largest insured event ever, the Company recorded a net underwriting loss and Non-life combined ratio of 116.3%. In 2011, when the industry incurred a high frequency of large losses related to the 2011 catastrophic events the Company recorded a net underwriting loss and Non-life combined ratio of 125.4%.
The Non-life combined ratio increased by
0.9
points, from
85.3%
in
2013
to
86.2%
in
2014
. The increase in the combined ratio in
2014
compared to
2013
was mainly driven by a decrease in the current accident year technical result and a decrease in favorable prior year loss development. These decreases in the combined ratio were partially offset by the absence of large catastrophic losses in 2014 compared to losses related to the German Hailstorm, Alberta Floods and European Floods in 2013. The impact on the combined ratio of the catastrophic events for each year is analyzed above. Additional detail of the Non-life underwriting result is provided in the discussion of individual sub-segments in Results by Segment and Review of Net Income below.
The Non-life combined ratio decreased by 2.5 points, from 87.8% in 2012 to 85.3% in 2013. The decrease in the combined ratio in 2013 compared to 2012 was primarily due to a lower level of large catastrophic losses and large losses and a lower other expense ratio driven by an increased level of net premiums earned, which were partially offset by a higher level of mid-sized loss activity. The impact on the combined ratio of the catastrophic events for each year is analyzed above.
The other lesser factors contributing to increases or decreases in the combined ratio for all years presented are described further in Review of Net Income below.
The Company uses the combined ratio to measure its overall underwriting profitability for its Non-life segment as a whole. Given the Company does not allocate other expenses to its Non-life sub-segments, Management measures the underwriting profitability of the Non-life sub-segments by using the technical result and technical ratio as described in Results by Segment below.
Other Key Financial Measures
In addition to using the growth in Diluted Tangible Book Value per Share plus dividends as the Company’s prime financial long-term measure, and diluted tangible book value per common share and common share equivalents outstanding (Diluted Tangible Book Value per Share) as the basis for this measure, the Company uses other metrics to monitor its financial performance and to measure total shareholder value. Other such metrics used by Management include, but are not limited to, diluted book value per common share and common share equivalents outstanding (Diluted Book Value per Share) and Diluted Tangible Book Value per Share plus the discount in Non-life loss reserves per common share and common share equivalents outstanding (Diluted Tangible Book Value plus the discount in Non-life reserves). Diluted Book Value per Share is a similar metric to Diluted Tangible Book Value per Share, except that it includes the impact on book value of goodwill and intangible assets. Diluted Tangible Book Value plus the discount in Non-life loss reserves is a shorter-term metric that adjusts the Company’s Diluted Tangible Book Value per Share for the impact that changes in interest rates have on the time value of money that is embedded in the Company’s Non-life loss reserves.
Comment on Non-GAAP Measures
Throughout this filing, the Company’s results of operations have been presented in the way that Management believes will be the most meaningful and useful to investors, analysts, rating agencies and others who use financial information in evaluating the performance of the Company. This presentation includes the use of Diluted Tangible Book Value per Share, Diluted Tangible Book Value per Share plus dividends, operating earnings or loss, diluted operating earnings or loss per share and Operating ROE that are not calculated under standards or rules that comprise U.S. GAAP. These measures are referred to as non-GAAP financial measures within the meaning of Regulation G. Management believes that these non-GAAP financial measures are important to investors, analysts, rating agencies and others who use the Company’s financial information and will help provide a consistent basis for comparison between years and for comparison with the Company’s peer group, although non-GAAP measures may be defined or calculated differently by other companies. Investors should consider these non-GAAP measures in addition to, and not as a substitute for, measures of financial performance prepared in accordance with GAAP. A reconciliation of these measures to the most directly comparable U.S. GAAP financial measures, diluted book value per share, net income or loss and return on beginning common shareholders’ equity calculated with net income or loss attributable to common shareholders, is presented above.
Critical Accounting Policies and Estimates
The Company’s Consolidated Financial Statements have been prepared in accordance with accounting principles generally accepted in the United States (U.S. GAAP). The preparation of financial statements in conformity with U.S. GAAP requires Management to make estimates and assumptions that affect the reported amounts of assets and liabilities at the date of the financial statements and the reported amounts of revenues and expenses during the reporting period. The following presents a discussion of those accounting policies and estimates that Management believes are the most critical to its operations and require the most
67
difficult, subjective and complex judgment. If actual events differ significantly from the underlying assumptions and estimates used by Management, there could be material adjustments to prior estimates that could potentially adversely affect the Company’s results of operations, financial condition and liquidity. These critical accounting policies and estimates should be read in conjunction with the Notes to Consolidated Financial Statements, including Note 2 - Significant Accounting Policies, for a full understanding of the Company’s accounting policies. The sensitivity estimates that follow are based on outcomes that the Company considers reasonably likely to occur.
Unpaid Losses and Loss Expenses
Because a significant amount of time can elapse between the assumption of risk, occurrence of a loss event, the reporting of the event to an insurance company (the primary company or the cedant), the subsequent reporting to the reinsurance company (the reinsurer) and the ultimate payment of the claim on the loss event by the reinsurer, the Company’s liability for unpaid losses and loss expenses (loss reserves) is based largely upon estimates. The Company categorizes loss reserves into three types of reserves: reported outstanding loss reserves (case reserves), additional case reserves (ACRs) and IBNR. The Company updates its estimates for each of the aforementioned categories on a quarterly basis using information received from its cedants. Case reserves represent unpaid losses reported by the Company’s cedants and recorded by the Company. ACRs are established for particular circumstances where, on the basis of individual loss reports, the Company estimates that the particular loss or collection of losses covered by a treaty may be greater than those advised by the cedant. IBNR reserves represent a provision for claims that have been incurred but not yet reported to the Company, as well as future loss development on losses already reported, in excess of the case reserves and ACRs. Unlike case reserves and ACRs, IBNR reserves are often calculated at an aggregated level and cannot usually be directly identified as reserves for a particular loss or treaty. The Company also estimates the future unallocated loss adjustment expenses (ULAE) associated with the loss reserves and these form part of the Company’s loss adjustment expense reserves. The Company’s Non-life loss reserves for each category, line and sub-segment are reported in the tables included later in this section.
The amount of time that elapses before a claim is reported to the cedant and then subsequently reported to the reinsurer is commonly referred to in the industry as the reporting tail. Lines of business for which claims are reported quickly are commonly referred to as short-tail lines; and lines of business for which a longer period of time elapses before claims are reported to the reinsurer are commonly referred to as long-tail lines. In general, for reinsurance, the time lags are longer than for primary business due to the delay that occurs between the cedant becoming aware of a loss and reporting the information to its reinsurer(s). The delay varies by reinsurance market (country of cedant), type of treaty, whether losses are first paid by the cedant and the size of the loss. The delay could vary from a few weeks to a year or sometimes longer. The Company considers agriculture, catastrophe, energy, property, motor business written in the U.S., proportional motor business written outside of the U.S., specialty property and structured property to be short-tail lines; aviation/space, credit/surety, engineering, marine and multiline to be medium-tail lines; and casualty, non-proportional motor business written outside of the U.S. and specialty casualty to be long-tail lines of business. For all lines, the Company’s objective is to estimate ultimate losses and loss expenses. Total loss reserves are then calculated by subtracting losses paid. Similarly, IBNR reserves are calculated by subtraction of case reserves and ACRs from total loss reserves.
The Company analyzes its ultimate losses and loss expenses after consideration of the loss experience of various reserving cells. The Company assigns treaties to reserving cells and allocates losses from the treaty to the reserving cell. The reserving cells are selected in order to ensure that the underlying treaties have homogeneous loss development characteristics (e.g., reporting tail) but are large enough to make estimation of trends credible. The selection of reserving cells is reviewed annually and changes over time as the business of the Company evolves. For each reserving cell, the Company tabulates losses in reserving triangles that show the total reported or paid claims at each financial year end by underwriting year cohort. An underwriting year is the year during which the reinsurance treaty was entered into as opposed to the year in which the loss occurred (accident year), or the calendar year for which financial results are reported. For each reserving cell, the Company’s estimates of loss reserves are reached after a review of the results of several commonly accepted actuarial projection methodologies. In selecting its best estimate, the Company considers the appropriateness of each methodology to the individual circumstances of the reserving cell and underwriting year for which the projection is made. The methodologies that the Company employs include, but may not be limited to, paid and reported Chain Ladder methods, Expected Loss Ratio method, paid and reported Bornhuetter-Ferguson (B-F) methods, and paid and reported Benktander methods. In addition, the Company uses other methodologies to estimate liabilities for specific types of claims. For example, reserves established for the catastrophe line are primarily a function of the presence or absence of catastrophic events during the year, and the complexity and uncertainty associated with estimating unpaid losses from these large disclosed events. Internal and vendor catastrophe models are typically used in the estimation of loss and loss expenses at the early stages of catastrophe losses before loss information is reported to the reinsurer. In addition, reserves are also established in consideration of mid-sized and attritional loss events that occur during a year. In the case of asbestos and environmental claims, the Company has established reserves for future losses and allocated loss expenses based on the results of periodic actuarial studies, which consider the underlying exposures of the Company’s cedants.
The reserve methodologies employed by the Company are dependent on data that the Company collects. This data consists primarily of loss amounts and loss payments reported by the Company’s cedants, and premiums written and earned reported by
68
cedants or estimated by the Company. The actuarial methods used by the Company to project loss reserves that it will pay in the future do not generally include methodologies that are dependent on claim counts reported, claim counts settled or claim counts open as, due to the nature of the Company’s business, this information is not routinely provided by cedants for every treaty.
A brief description of the reserving methods commonly employed by the Company and a discussion of their particular advantages and disadvantages follows:
Chain Ladder (CL) Development Methods (Reported or Paid)
These methods use the underlying assumption that losses reported (paid) for each underwriting year at a particular development stage follow a stable pattern. For example, the CL development method assumes that on average, every underwriting year will display the same percentage of ultimate liabilities reported by the Company’s cedants (say x%) at 24 months after the inception of the underwriting year. The percentages reported (paid) are established for each development stage (e.g., at 12 months, 24 months, etc.) after examining historical averages from the loss development data. These are sometimes supplemented by external benchmark information. Ultimate liabilities are estimated by multiplying the actual reported (paid) losses by the reciprocal of the assumed reported (paid) percentage (e.g., 1/x%). Reserves are then calculated by subtracting paid claims from the estimated ultimate liabilities.
The main strengths of the method are that it is reactive to loss emergence (payments) and that it makes full use of historical experience on claim emergence (payments). For homogeneous low volatility lines, under stable economic conditions the method can often produce good estimates of ultimate liabilities and reserves. However, the method has weaknesses when the underlying assumption of stable patterns is not true. This may be the consequence of changes in the mix of business, changes in claim inflation trends, changes in claim reporting practices or the presence of large claims, among other things. Furthermore, the method tends to produce volatile estimates of ultimate liabilities in situations where there is volatility in reported (paid) patterns. In particular, when the expected percentage reported (paid) is low, small deviations between actual and expected claims can lead to very volatile estimates of ultimate liabilities and reserves. Consequently, this method is often unsuitable for projections at early development stages of an underwriting year. Finally, the method fails to incorporate any information regarding market conditions, pricing, etc., which could improve the estimate of liabilities and reserves. It therefore tends not to perform very well in situations where there are rapidly changing market conditions.
Expected Loss Ratio (ELR) Method
This method estimates ultimate losses for an underwriting year by applying an estimated loss ratio to the earned premium for that underwriting year. Although the method is insensitive to actual reported or paid losses, it can often be useful at the early stages of development when very few losses have been reported or paid, and the principal sources of information available to the Company consist of information obtained during pricing and qualitative information supplied by the cedant. However, the lack of sensitivity to reported or paid losses means that the method is usually inappropriate at later stages of development.
Bornhuetter-Ferguson (B-F) Methods (Reported or Paid)
These methods aim to address the concerns of the Chain Ladder Development methods, which are the variability at early stages of development and the failure to incorporate external information such as pricing. However, the B-F methods are more sensitive to reported and paid losses than the Expected Loss Ratio method, and can be seen as a blend of the Expected Loss Ratio and Chain Ladder development methods. Unreported (unpaid) claims are calculated using an expected reporting (payment) pattern and an externally determined estimate of ultimate liabilities (usually determined by multiplying an
a priori
loss ratio with estimates of premium volume). The accuracy of the
a priori
loss ratio is a critical assumption in this method. Usually
a priori
loss ratios are initially determined on the basis of pricing information, but may also be adjusted to reflect other information that subsequently emerges about underlying loss experience. Although the method tends to provide less volatile indications at early stages of development and reflects changes in the external environment, this method can be slow to react to emerging loss development (payment). In particular, to the extent that the
a priori
loss ratios prove to be inaccurate (and are not revised), the B-F methods will produce loss estimates that take longer to converge with the final settlement value of loss liabilities.
Benktander (B-K) Methods (Reported or Paid)
These methods can be viewed as a blend between the Chain Ladder Development and the B-F methods described above. The blend is based on predetermined weights at each development stage that depend on the reported (paid) development patterns.
Although mitigated to some extent, this method still exhibits the same advantages and disadvantages as the B-F method, but the mechanics of the calculation imply that it is more reactive to loss emergence (payment) than the B-F method.
Loss Event Specific Method
69
The ultimate losses estimated under this method are derived from estimates of specific events based on reported claims, client and broker discussions, review of potential exposures, market loss estimates, modeled analysis and other event specific criteria.
Method Weights
In determining the loss reserves, the Company often relies on a blend of the results from two or more methods (e.g., weighted averages). The judgment as to which of the above method(s) is most appropriate for a particular underwriting year and reserving cell could change over time as new information emerges regarding underlying loss activity and other data issues. Furthermore, as each line is typically composed of several reserving cells, it is likely that the reserves for the line will be dependent on several reserving methods. This is because reserves for a line are the result of aggregating the reserves for each constituent reserving cell and that a different method could be selected for each reserving cell. Although it is not appropriate to refer to reserves for a line as being determined by a particular method, the table below summarizes the methods that were given principal weight in selecting the best estimates of reserves in each reserving line and can therefore be viewed as key drivers of selected reserves. The table distinguishes methods for mature and immature underwriting years, as they are often different. The definition of maturity is specific to a line and is related to the reporting tail. If at the reserve evaluation date, a significant proportion of losses for the underwriting year are expected to have been reported, then the underwriting year is deemed to be mature, otherwise it is deemed to be immature. For short-tail lines, such as property or agriculture, immature years can refer to the one or two most recent underwriting years, while for longer tail lines, such as casualty, immature years can refer to the three or four most recent underwriting years.
The principal reserving methods used for the major components of each reserving line are as follows:
|
Reserving line
|
|
Non-life sub-segment
|
|
Immature Underwriting Years
|
|
Mature Underwriting Years
|
|
Agriculture
|
|
North America and
Global Specialty
|
|
Expected Loss Ratio /
Reported B-F / Paid B-F
|
|
Reported B-F / Reported CL
|
|
Aviation / Space
|
|
Global Specialty
|
|
Expected Loss Ratio / Reported B-F
|
|
Reported B-F / Reported CL
|
|
Casualty
|
|
North America
|
|
Expected Loss Ratio
|
|
Reported B-F / Reported CL
|
|
Casualty / Specialty Casualty
|
|
Global (Non-U.S.) P&C and
Global Specialty
|
|
Expected Loss Ratio / Reported B-F
|
|
Reported B-F / Reported CL /
Paid B-F
|
|
Catastrophe
|
|
Catastrophe
|
|
Expected Loss Ratio
based on exposure analysis /
Loss event specific
|
|
Loss event specific
|
|
Credit / Surety
|
|
North America and
Global Specialty
|
|
Expected Loss Ratio / Reported B-F / Paid B-F
|
|
Reported B-F / Reported CL
|
|
Energy Onshore
|
|
Global Specialty
|
|
Expected Loss Ratio / Reported B-F
|
|
Reported CL / Reported B-F/
Reported B-K
|
|
Engineering
|
|
Global Specialty
|
|
Expected Loss Ratio / Reported B-F
|
|
Reported B-F / Reported CL
|
|
Marine / Energy Offshore
|
|
Global Specialty
|
|
Reported B-F / Expected Loss Ratio
|
|
Reported B-F / Reported CL
|
|
Motor
|
|
North America
|
|
Expected Loss Ratio
|
|
Expected Loss Ratio /Reported B-F
|
|
Motor—Non-proportional
|
|
Global (Non-U.S.) P&C
|
|
Expected Loss Ratio /
Reported B-F / Paid B-F
|
|
Reported B-F / Reported CL
|
|
Motor—Proportional
|
|
Global (Non-U.S.) P&C
|
|
Expected Loss Ratio /
Reported B-F / Paid B-F
|
|
Reported B-F / Reported CL
|
|
Multiline
|
|
North America and Global Specialty
|
|
Expected Loss Ratio / Reported B-F
|
|
Reported B-F
|
|
Property
|
|
North America
|
|
Reported B-F / Expected Loss Ratio
|
|
Reported B-F / Loss event specific
|
|
Property / Specialty Property
|
|
Global (Non-U.S.) P&C and
Global Specialty
|
|
Expected Loss Ratio /
Reported B-F / Reported B-K /
Paid B-F
|
|
Reported CL / Reported B-F / Reported B-K / Paid B-F
|
|
Other
|
|
North America, Global (Non-U.S.) P&C and Global Specialty
|
|
Periodic actuarial studies
|
|
Periodic actuarial studies
|
The reserving methods used by the Company are dependent on a number of key parameter assumptions. The principal parameter assumptions underlying the methods used by the Company are:
|
•
|
the loss development factors used to form an expectation of the evolution of reported and paid claims for several years following the inception of the underwriting year. These are often derived by examining the Company’s data after due consideration of the underlying factors listed below. In some cases, where the Company lacks sufficient volume to have statistical credibility, external benchmarks are used to supplement the Company’s data;
|
|
•
|
the tail factors used to reflect development of paid and reported losses after several years have elapsed since the inception of the underwriting year;
|
|
•
|
the
a priori
loss ratios used as inputs in the B-F methods; and
|
|
•
|
the selected loss ratios used as inputs in the Expected Loss Ratio method.
|
70
As an example of the sensitivity of the Company’s reserves to reserving parameter assumptions by reserving line, the effect on the Company’s reserves of higher/lower
a priori
loss ratio selections, higher/lower loss development factors and higher/lower tail factors based on amounts recorded at
December 31, 2014
was as follows:
|
Reserving lines selected assumptions
|
Higher
a priori
loss ratios
|
Higher loss development factors
|
Higher tail factors
(1)
|
Lower
a priori
loss ratios
|
Lower loss development factors
|
Lower tail factors
(1)
|
||||||||||||
|
Agriculture
|
5 points
|
|
3 months
|
|
2
|
%
|
(5) points
|
|
(3) months
|
|
(2
|
)%
|
||||||
|
Aviation / Space
|
5
|
|
3
|
|
5
|
|
(5
|
)
|
(3
|
)
|
(5
|
)
|
||||||
|
Casualty / Specialty Casualty
|
10
|
|
6
|
|
10
|
|
(10
|
)
|
(6
|
)
|
(10
|
)
|
||||||
|
Catastrophe
|
5
|
|
3
|
|
2
|
|
(5
|
)
|
(3
|
)
|
(2
|
)
|
||||||
|
Credit / Surety
|
5
|
|
3
|
|
2
|
|
(5
|
)
|
(3
|
)
|
(2
|
)
|
||||||
|
Energy Onshore
|
5
|
|
3
|
|
2
|
|
(5
|
)
|
(3
|
)
|
(2
|
)
|
||||||
|
Engineering
|
10
|
|
6
|
|
5
|
|
(10
|
)
|
(6
|
)
|
(5
|
)
|
||||||
|
Marine / Energy Offshore
|
5
|
|
3
|
|
5
|
|
(5
|
)
|
(3
|
)
|
(5
|
)
|
||||||
|
Motor—Non-U.S. Non-proportional business
|
10
|
|
12
|
|
10
|
|
(10
|
)
|
(12
|
)
|
(10
|
)
|
||||||
|
Motor—Non-U.S. Proportional business
|
5
|
|
3
|
|
2
|
|
(5
|
)
|
(3
|
)
|
(2
|
)
|
||||||
|
Motor—North America business
|
5
|
|
3
|
|
2
|
|
(5
|
)
|
(3
|
)
|
(2
|
)
|
||||||
|
Multiline
|
5
|
|
6
|
|
5
|
|
(5
|
)
|
(6
|
)
|
(5
|
)
|
||||||
|
Property / Specialty Property
|
5
|
|
3
|
|
2
|
|
(5
|
)
|
(3
|
)
|
(2
|
)
|
||||||
|
Reserving lines selected sensitivity
(in millions of U.S. dollars)
|
Higher
a priori
loss ratios
|
Higher loss development factors
|
Higher tail factors
(1)
|
Lower
a priori
loss ratios
|
Lower loss
development
factors
|
Lower tail factors
(1)
|
||||||||||||||||||
|
Agriculture
|
$
|
30
|
|
$
|
10
|
|
$
|
—
|
|
$
|
(30
|
)
|
$
|
—
|
|
$
|
—
|
|
||||||
|
Aviation / Space
|
15
|
|
35
|
|
5
|
|
(15
|
)
|
(20
|
)
|
—
|
|
||||||||||||
|
Casualty / Specialty Casualty
|
380
|
|
90
|
|
245
|
|
(380
|
)
|
(60
|
)
|
(225
|
)
|
||||||||||||
|
Catastrophe
|
5
|
|
—
|
|
—
|
|
(5
|
)
|
—
|
|
—
|
|
||||||||||||
|
Credit / Surety
|
30
|
|
25
|
|
5
|
|
(30
|
)
|
(10
|
)
|
—
|
|
||||||||||||
|
Energy Onshore
|
5
|
|
10
|
|
—
|
|
(5
|
)
|
(5
|
)
|
—
|
|
||||||||||||
|
Engineering
|
40
|
|
35
|
|
50
|
|
(40
|
)
|
(25
|
)
|
(35
|
)
|
||||||||||||
|
Marine / Energy Offshore
|
25
|
|
35
|
|
—
|
|
(25
|
)
|
(20
|
)
|
—
|
|
||||||||||||
|
Motor—Non-U.S. Non-proportional business
|
30
|
|
15
|
|
60
|
|
(30
|
)
|
(15
|
)
|
(55
|
)
|
||||||||||||
|
Motor—Non-U.S. Proportional business
|
20
|
|
15
|
|
—
|
|
(20
|
)
|
(5
|
)
|
—
|
|
||||||||||||
|
Motor—North America business
|
10
|
|
5
|
|
10
|
|
(10
|
)
|
(5
|
)
|
(5
|
)
|
||||||||||||
|
Multiline
|
15
|
|
15
|
|
25
|
|
(10
|
)
|
(10
|
)
|
(20
|
)
|
||||||||||||
|
Property / Specialty Property
|
40
|
|
85
|
|
—
|
|
(40
|
)
|
(30
|
)
|
—
|
|
||||||||||||
|
(1)
|
Tail factors are defined as aggregate development factors after 10 years from the inception of an underwriting year.
|
The Company believes that the illustrated sensitivities to the reserving parameter assumptions are indicative of the potential variability inherent in the estimation process of those parameters. Some reserving lines show little sensitivity to
a priori
loss ratio, loss development factor or tail factor as the Company may use reserving methods such as the Expected Loss Ratio method in several of its reserving cells within those lines. It is not appropriate to sum the total impact for a specific factor or the total impact for a specific reserving line as the lines of business are not perfectly correlated.
The validity of all parameter assumptions used in the reserving process is reaffirmed on a quarterly basis. Reaffirmation of the parameter assumptions means that the actuaries determine that the parameter assumptions continue to form a sound basis for projection of future liabilities. Parameter assumptions used in projecting future liabilities are themselves estimates based on historical information. As new information becomes available (e.g., additional losses reported), the Company’s actuaries determine
71
whether a revised estimate of the parameter assumptions that reflects all available information is consistent with the previous parameter assumptions employed. In general, to the extent that the revised estimate of the parameter assumptions are within a close range of the original assumptions, the Company determines that the parameter assumptions employed continue to form an appropriate basis for projections and continue to use the original assumptions in its models. In this case, any differences could be attributed to the imprecise nature of the parameter estimation process. However, to the extent that the deviations between the two sets of estimates are not within a close range of the original assumptions, the Company reacts by adopting the revised assumptions as a basis for its reserve models. Notwithstanding the above, even where the Company has experienced no material deviations from its original assumptions during any quarter, the Company will generally revise the reserving parameter assumptions at least once a year to reflect all accumulated available information.
In addition to examining the data, the selection of the parameter assumptions is dependent on several underlying factors. The Company’s actuaries review these underlying factors and determine the extent to which these are likely to be stable over the time frame during which losses are projected, and the extent to which these factors are consistent with the Company’s data. If these factors are determined to be stable and consistent with the data, the estimation of the reserving parameter assumptions are mainly carried out using actuarial and statistical techniques applied to the Company’s data. To the extent that the actuaries determine that they cannot continue to rely on the stability of these factors, the statistical estimates of parameter assumptions are modified to reflect the direction of the change. The main underlying factors upon which the estimates of reserving parameters are predicated are:
|
•
|
the cedant’s business practices will proceed as in the past with no material changes either in submission of accounts or cash flows;
|
|
•
|
any internal delays in processing accounts received by the cedant are not materially different from that experienced historically, and hence the implicit reserving allowance made in loss reserves through the methods continues to be appropriate;
|
|
•
|
case reserve reporting practices, particularly the methodologies used to establish and report case reserves, are unchanged from historical practices;
|
|
•
|
the Company’s internal claim practices, particularly the level and extent of use of ACRs are unchanged;
|
|
•
|
historical levels of claim inflation can be projected into the future and will have no material effect on either the acceleration or deceleration of claim reporting and payment patterns;
|
|
•
|
the selection of reserving cells results in homogeneous and credible future expectations for all business in the cell and any changes in underlying treaty terms are either reflected in cell selection or explicitly allowed in the selection of trends;
|
|
•
|
in cases where benchmarks are used, they are derived from the experience of similar business; and
|
|
•
|
the Company can form a credible initial expectation of the ultimate loss ratio of recent underwriting years through a review of pricing information, supplemented by qualitative information on market events.
|
The Company’s best estimate of total loss reserves is typically in excess of the midpoint of the actuarial ultimate liability estimate. The Company believes that there is potentially significant risk in estimating loss reserves for long-tail lines of business and for immature underwriting years that may not be adequately captured through traditional actuarial projection methodologies as these methodologies usually rely heavily on projections of prior year trends into the future. In selecting its best estimate of future liabilities, the Company considers both the results of actuarial point estimates of loss reserves as well as the potential variability of these estimates as captured by a reasonable range of actuarial liability estimates. The selected best estimates of reserves are always
within the reasonable range of estimates indicated by the Company’s actuaries. In determining the appropriate best estimate, the Company reviews (i) the position of overall reserves within the actuarial reserve range, (ii) the result of bottom up analysis by underwriting year reflecting the impact of parameter uncertainty in actuarial calculations, and (iii) specific qualitative information on events that may have an effect on future claims but which may not have been adequately reflected in actuarial estimates, such as potential for outstanding litigation, claims practices of cedants, etc.
During 2014,
2013
and 2012, the Company reviewed its estimate for prior year losses for the Non-life segment (defined below in Results by Segment) and, in light of developing data, adjusted its ultimate loss ratios for prior accident years. The net prior year favorable loss development for each sub-segment of the Company’s Non-life segment for the years ended
December 31, 2014
,
2013
and
2012
was as follows (in millions of U.S. dollars):
72
|
2014
|
2013
|
2012
|
||||||||||
|
Net Non-life prior year favorable loss development:
|
||||||||||||
|
North America
|
$
|
251
|
|
$
|
223
|
|
$
|
218
|
|
|||
|
Global (Non-U.S.) P&C
|
134
|
|
180
|
|
114
|
|
||||||
|
Global Specialty
|
258
|
|
227
|
|
251
|
|
||||||
|
Catastrophe
|
17
|
|
91
|
|
45
|
|
||||||
|
Total net Non-life prior year favorable loss development
|
$
|
660
|
|
$
|
721
|
|
$
|
628
|
|
|||
The net Non-life prior year favorable loss development for the years ended
December 31, 2014
,
2013
and
2012
was driven by the following factors (in millions of U.S. dollars):
|
2014
|
2013
|
2012
|
||||||||||
|
Net Non-life prior year (adverse) favorable loss development:
|
||||||||||||
|
Net prior year loss development due to changes in premiums
(1)
|
$
|
(38
|
)
|
$
|
(71
|
)
|
$
|
(94
|
)
|
|||
|
Net prior year loss development due to all other factors
(2)
|
698
|
|
792
|
|
722
|
|
||||||
|
Total net Non-life prior year favorable loss development
|
$
|
660
|
|
$
|
721
|
|
$
|
628
|
|
|||
|
(1)
|
Net prior year loss development due to changes in premiums includes, but it is not limited to, the impact to prior years’ reserves associated with (increases) decreases in the estimated or actual premium exposure reported by cedants.
|
|
(2)
|
Net prior year loss development due to all other factors includes, but is not limited to, loss experience, changes in assumptions and changes in methodology.
|
For a discussion of net prior year favorable loss development by Non-life sub-segment, see Results by Segment below and Note 8 to Consolidated Financial Statements in Item 8 of Part II of this report.
The net prior year favorable loss development for the year ended
December 31, 2014
by reserving line for the Company’s Non-life segment was as follows (in millions of U.S. dollars):
|
Reserving lines
|
Net favorable
prior year
loss
development
|
|||
|
Agriculture
|
$
|
2
|
|
|
|
Aviation / Space
|
62
|
|
||
|
Casualty / Specialty Casualty
|
245
|
|
||
|
Catastrophe
|
17
|
|
||
|
Credit / Surety
|
(12
|
)
|
||
|
Energy Onshore
|
21
|
|
||
|
Engineering
|
(9
|
)
|
||
|
Marine / Energy Offshore
|
120
|
|
||
|
Motor—Non-U.S. Non-proportional business
|
34
|
|
||
|
Motor—Non-U.S. Proportional business
|
(5
|
)
|
||
|
Motor—North America business
|
(9
|
)
|
||
|
Multiline
|
—
|
|
||
|
Property / Specialty Property
|
195
|
|
||
|
Other
|
(1
|
)
|
||
|
Total net Non-life prior year favorable loss development
|
$
|
660
|
|
|
Actual losses paid and reported compared with the Company’s expectations, and the changes of the Company’s reserving parameter assumptions in response to the emerging development for each reserving line during the year ended
December 31, 2014
were as follows:
|
•
|
Agriculture:
Losses reported in 2014 for North America business and Global Specialty business in aggregate were close to expectations which resulted in insignificant change in loss ratios.
|
73
|
•
|
Aviation / Space
: Aggregate losses reported in 2014 were significantly lower than the Company’s expectations. The Company reflected this experience by selecting lower loss ratios for underwriting years 2013 and prior.
|
|
•
|
Casualty / Specialty Casualty
: Aggregate losses reported in 2014 for North America business were below the Company’s expectations as losses for underwriting years 2009 and prior continue to emerge below expectations. Aggregate losses reported in 2014 for both Global (Non-U.S.) P&C and Global Specialty sub-segments were below the Company’s expectations for most prior underwriting years. The Company reflected this experience by reducing the selected loss ratios for these underwriting years.
|
|
•
|
Catastrophe
: In aggregate, the Company has recorded reductions in ultimate loss estimates during 2014 for a number of prior year loss events across several underwriting years to reflect lower loss emergence. This was partially offset by an increase in the loss estimates for the 2011 New Zealand Earthquakes during 2014 (see below for more details).
|
|
•
|
Credit / Surety
: Aggregate losses reported in 2014 were higher than expected for the Company’s Global (Non-U.S.) surety business mainly on underwriting years 2009 and prior, which led the Company to increase its loss ratios accordingly. This was partially offset by favorable activity in the Company’s Global (Non-U.S.) credit business and North America surety business. For the Company’s Global (Non-U.S.) credit business, loss development during 2014 which was significantly better than expected across several underwriting years but mainly from underwriting years 2011 and 2012. The Company reduced its loss ratios for these underwriting years to reflect the lower than expected loss emergence. Aggregate losses reported in 2014 were slightly lower than expected for North America Surety business, giving rise to a modest level of favorable development.
|
|
•
|
Energy Onshore
: Aggregate losses reported in 2014 were lower than expected across most underwriting years. The Company reflected the favorable development by reducing its loss ratios for these underwriting years.
|
|
•
|
Engineering:
Aggregate losses reported in 2014 were higher than expected across several underwriting years reflecting increased exposure for proportional business
.
These increases were partially offset by lower loss ratios resulting from aggregate losses reported in 2014 being slightly lower than expected for several underwriting years.
|
|
•
|
Marine / Energy Offshore
: Aggregate losses reported in 2014 were significantly lower than expected across all underwriting years driven entirely by the Energy Offshore business. The Company reduced its loss ratios for these underwriting years to reflect the lower than expected loss emergence.
|
|
•
|
Motor:
|
|
▪
|
Non-U.S. Non Proportional:
Aggregate losses reported in 2014 for the Global (Non-U.S.) P&C motor non-proportional line were lower than expected across all underwriting years but primarily for underwriting years 2009 and prior resulting in the Company reducing its loss ratios for these underwriting years.
|
|
▪
|
Non-U.S. Proportional
: Aggregate losses reported in 2014 for the Global (Non-U.S.) P&C motor proportional line were slightly higher than expectations in aggregate, which led to modest increases in loss ratios by the Company on certain underwriting years.
|
|
▪
|
North America
: Aggregate losses reported in 2014 for the North America motor line were higher than expected primarily from underwriting years 2011 to 2013 resulting in the Company increasing its loss ratios for these underwriting years.
|
|
•
|
Multiline:
Reported losses in 2014 were as expected for North America business in aggregate. Higher than expected activity in underwriting year 2013 was offset by favorable activity primarily from underwriting years 2010 to 2012 which in aggregate resulted in insignificant change in loss ratios.
|
|
•
|
Property / Specialty Property
: Aggregate reported losses in 2014 were significantly lower than expected for Global (Non-U.S.) P&C, Global Specialty and North America property lines business and were driven by loss activity related to large property events and attritional property losses primarily from underwriting years 2012 and 2013. The Company reflected this experience by reducing its loss ratios for these underwriting years.
|
74
The gross reserves reported by cedants (case reserves), those estimated by the Company (ACRs and IBNR) and the total gross, ceded and net loss reserves recorded at
December 31, 2014
by reserving line for the Company's Non-life operations were as follows (in millions of U.S. dollars):
|
Reserving lines
|
Case reserves
|
ACRs
|
IBNR
reserves
|
Total gross
loss reserves
recorded
|
Ceded loss
reserves
|
Total net
loss reserves
recorded
|
||||||||||||||||||
|
Agriculture
|
$
|
38
|
|
$
|
4
|
|
$
|
492
|
|
$
|
534
|
|
$
|
(1
|
)
|
$
|
533
|
|
||||||
|
Aviation / Space
|
246
|
|
14
|
|
189
|
|
449
|
|
(39
|
)
|
410
|
|
||||||||||||
|
Casualty / Specialty Casualty
|
1,395
|
|
131
|
|
2,457
|
|
3,983
|
|
(26
|
)
|
3,957
|
|
||||||||||||
|
Catastrophe
|
312
|
|
57
|
|
123
|
|
492
|
|
(37
|
)
|
455
|
|
||||||||||||
|
Credit / Surety
|
258
|
|
(5
|
)
|
223
|
|
476
|
|
—
|
|
476
|
|
||||||||||||
|
Energy Onshore
|
108
|
|
4
|
|
85
|
|
197
|
|
(6
|
)
|
191
|
|
||||||||||||
|
Engineering
|
279
|
|
—
|
|
231
|
|
510
|
|
(14
|
)
|
496
|
|
||||||||||||
|
Marine / Energy Offshore
|
300
|
|
14
|
|
356
|
|
670
|
|
(82
|
)
|
588
|
|
||||||||||||
|
Motor—Non-U.S. Non-proportional business
|
422
|
|
2
|
|
339
|
|
763
|
|
(5
|
)
|
758
|
|
||||||||||||
|
Motor—Non-U.S. Proportional business
|
141
|
|
1
|
|
113
|
|
255
|
|
(1
|
)
|
254
|
|
||||||||||||
|
Motor—North America business
|
76
|
|
2
|
|
92
|
|
170
|
|
—
|
|
170
|
|
||||||||||||
|
Multiline
|
83
|
|
13
|
|
171
|
|
267
|
|
—
|
|
267
|
|
||||||||||||
|
Property / Specialty Property
|
577
|
|
17
|
|
385
|
|
979
|
|
(4
|
)
|
975
|
|
||||||||||||
|
Other
|
1
|
|
—
|
|
—
|
|
1
|
|
—
|
|
1
|
|
||||||||||||
|
Total Non-life reserves
|
$
|
4,236
|
|
$
|
254
|
|
$
|
5,256
|
|
$
|
9,746
|
|
$
|
(215
|
)
|
$
|
9,531
|
|
||||||
The net loss reserves represent the Company’s best estimate of future losses and loss expense amounts based on the information available at
December 31, 2014
. Loss reserves rely upon estimates involving actuarial and statistical projections at a given time that reflect the Company’s expectations of the costs of the ultimate settlement and administration of claims. Estimates of ultimate liabilities are contingent on many future events and the eventual outcome of these events may be different from the assumptions underlying the reserve estimates. In the event that the business environment and social trends diverge from historical trends, the Company may have to adjust its loss reserves to amounts falling significantly outside its current estimate. These estimates are regularly reviewed and the ultimate liability may be in excess of, or less than, the amounts provided, for which any adjustments will be reflected in the period in which the need for an adjustment is determined.
The Company’s best estimates are point estimates within a reasonable range of actuarial liability estimates. These ranges are developed using stochastic simulations and techniques and provide an indication as to the degree of variability of the loss reserves. The Company interprets the ranges produced by these techniques as confidence intervals around the point estimates for each Non-life sub-segment. However, due to the inherent volatility in the business written by the Company, there can be no assurance that the final settlement of the loss reserves will fall within these ranges.
The point estimates related to net loss reserves recorded by the Company and the range of actuarial estimates at
December 31, 2014
and
2013
for each Non-life sub-segment were as follows (in millions of U.S. dollars):
|
Recorded Point
Estimate
|
High
|
Low
|
||||||||||
|
2014 Net Non-life sub-segment loss reserves:
|
||||||||||||
|
North America
|
$
|
3,289
|
|
$
|
3,597
|
|
$
|
2,610
|
|
|||
|
Global (Non-U.S.) P&C
|
2,161
|
|
2,459
|
|
1,770
|
|
||||||
|
Global Specialty
|
3,626
|
|
4,108
|
|
2,905
|
|
||||||
|
Catastrophe
|
455
|
|
503
|
|
403
|
|
||||||
|
2013 Net Non-life sub-segment loss reserves:
|
||||||||||||
|
North America
|
$
|
3,517
|
|
$
|
3,644
|
|
$
|
2,879
|
|
|||
|
Global (Non-U.S.) P&C
|
2,427
|
|
2,644
|
|
2,045
|
|
||||||
|
Global Specialty
|
3,772
|
|
3,984
|
|
3,250
|
|
||||||
|
Catastrophe
|
663
|
|
675
|
|
534
|
|
||||||
75
It is not appropriate to add together the ranges of each sub-segment in an effort to determine a high and low range around the Company’s total Non-life carried loss reserves.
Of the Company’s
$9,531 million
of net Non-life loss reserves at
December 31, 2014
, net loss reserves for accident years 2005 and prior of $
575 million
are guaranteed by Colisée Re, pursuant to the Reserve Agreement. The Company is not subject to any loss reserve variability associated with the guaranteed reserves. See Business—Reserves in Item 1 of Part I of this report for a discussion of the Reserve Agreement.
A significant amount of judgment was used to estimate the range of potential losses related to the 2010 New Zealand Earthquake, 2011 New Zealand Earthquakes (collectively, New Zealand Earthquakes) and the Japan Earthquake and there remains a considerable degree of uncertainty related to the range of possible ultimate losses associated with these events and, in particular, the New Zealand Earthquakes. Loss estimates arising from earthquakes are inherently more uncertain than those from other catastrophic events and the Company believes the ultimate losses arising from the New Zealand Earthquakes and the Japan Earthquake may be materially in excess of, or less than, the amounts provided for in the Consolidated Balance Sheet at
December 31, 2014
.
The remaining significant risks and uncertainties related to the New Zealand Earthquakes include the ongoing cedant revisions of loss estimates for each of these events, the degree to which inflation impacts construction materials required to rebuild affected properties, the characteristics of the Company’s program participation for certain affected cedants and potentially affected cedants, and the expected length of the claims settlement period. In addition, there is further complexity related to the New Zealand Earthquakes given multiple earthquakes occurred in the same region in a relatively short period of time, resulting in cedants continuing to revise their allocation of losses between the various events and between different treaties, under which the Company may provide different amounts of coverage.
While the Company remains cautious regarding the estimated ultimate losses from the Japan Earthquake, as time has passed the estimates received from the Company’s cedants have stabilized, paid losses have increased and the remaining complexities have been reduced.
In addition to the sum of the point estimates originally recorded for each of the New Zealand Earthquakes and Japan Earthquake, at December 31, 2011 the Company recorded additional gross reserves of $50 million (net reserves of $48 million after the impact of retrocession) specifically related to these events within its Catastrophe sub-segment. The additional gross reserves recorded were in consideration of the number of events, the complexity of certain events and the continuing uncertainties in estimating the ultimate losses for these events in the aggregate. The Company continues to evaluate the additional gross reserves that were recorded as part of its periodic reserving process and changes to the amounts recorded may either result in: (i) the reallocation of some or all of the additional reserves to one or more of the these events; or (ii) the release of some or all of the additional reserves to net income in future periods; or (iii) an increase in additional reserves recorded.
During the year ended December 31, 2013, the Company cautiously reduced the additional gross reserves by $10 million to $40 million, primarily reflecting the reduced level of uncertainty associated with the Japan Earthquake in the first half of 2013. As a result of further cedant revisions to loss estimates and cedants reallocating their losses between the different New Zealand Earthquakes during the latter half of 2013, the Company maintained the additional gross reserves of $40 million at December 31, 2013 and primarily allocated this remaining reserve to the New Zealand Earthquakes to reflect the continuing uncertainty related to these events described above. During the year ended
December 31, 2014
, the Company increased its loss estimates related to the New Zealand Earthquakes following the receipt of updated cedant information. Concurrent with increasing its loss estimate, and partially offsetting the impact, the Company reduced the additional gross reserves by $40 million. At December 31 2014, the Company does not have any remaining unallocated IBNR related to the Japan Earthquake and New Zealand Earthquakes.
Included in the business that is considered to have a long reporting tail is the Company’s exposure to asbestos and environmental claims. The Company’s net reserves for unpaid losses and loss expenses at
December 31, 2014
included
$189 million
that represents estimates of its net ultimate liability for asbestos and environmental claims. The gross liability for such claims at
December 31, 2014
was
$201 million
, which primarily relates to Paris Re’s gross liability for asbestos and environmental claims for accident years 2005 and prior of
$127 million
, with any favorable or adverse development being subject to the Reserve Agreement. Of the remaining
$74 million
in gross reserves, the majority relates to casualty exposures in the United States arising from business written by the French branch of PartnerRe Europe and PartnerRe U.S.
Ultimate loss estimates for such claims cannot be estimated using traditional reserving techniques and there are significant uncertainties in estimating the amount of the Company’s potential losses for these claims. In view of the legal and tort environment that affect the development of such claims, the uncertainties inherent in estimating asbestos and environmental claims are not likely to be resolved in the near future. There can be no assurance that the reserves established by the Company will not be adversely affected by development of other latent exposures, and further, there can be no assurance that the reserves established by the Company will be adequate. The Company does, however, actively evaluate potential exposure to asbestos and environmental claims
76
and establishes additional reserves as appropriate. The Company believes that it has made a reasonable provision for these exposures and is unaware of any specific issues that would materially affect its unpaid losses and loss expense reserves related to this exposure (see Note 8 to Consolidated Financial Statements in Item 8 of Part II of this report).
Policy Benefits for Life and Annuity Contracts
Policy benefits for life and annuity contracts relate to the Company’s Life and Health segment, which predominantly includes:
|
•
|
reinsurance of longevity, subdivided into standard and non-standard annuities;
|
|
•
|
mortality business, which includes death and disability covers (with various riders) primarily written in Continental Europe, TCI primarily written in the U.K. and Ireland, and GMDB business primarily written in Continental Europe; and
|
|
•
|
following the acquisition of PartnerRe Health, specialty accident and health business, including Health Maintenance Organizations (HMO) reinsurance, medical reinsurance and provider and employer excess of loss programs.
|
The Company categorizes life reserves into three types of reserves: case reserves, IBNR and reserves for future policy benefits. Case reserves represent unpaid losses reported by the Company’s cedants and recorded by the Company. IBNR reserves represent a provision for claims that have been incurred but not yet reported to the Company, as well as future loss development on losses already reported, in excess of the case reserves. Reserves for future policy benefits, which relate to future events occurring on policies in force over an extended period of time, are calculated as the present value of future expected benefits to be paid, reduced by the present value of future expected premiums. Such liabilities are established based on methods and underlying assumptions in accordance with U.S. GAAP and applicable actuarial standards. Principal assumptions used in the establishment of reserves for future policy benefits have been determined based upon information reported by ceding companies, supplemented by the Company’s actuarial estimates of mortality, critical illness, persistency and future investment income, with appropriate provision to reflect uncertainty. Case reserves, IBNR reserves and reserves for future policy benefits are generally calculated at the treaty level. The Company updates its estimates for each of the aforementioned categories on a periodic basis using information received from its cedants.
The Company’s reserving practices begin with the categorization of the contracts written as short duration, long duration, or universal life business for U.S. GAAP reserving purposes. This categorization determines the Company’s reserving methodology which is described by line of business below.
|
•
|
Longevity:
The reserves for the annuity portfolio of reinsurance contracts within the longevity book are established in accordance with the provisions for long duration insurance contracts under U.S. GAAP. Many of these contracts subject the Company to risks arising from policyholder mortality over a period that extends beyond the periods in which premiums are collected. For long duration contracts, the Company establishes initial reserves based upon Management’s best estimate of policy benefits and includes a provision for adverse deviation. Management’s best estimate relies upon actuarial indications of future policy benefits. The provision for adverse deviation contemplates reasonable deviations from the best estimate assumptions for the key risk elements relevant to the product being evaluated, including mortality expenses, and discount rate among others, and are recorded in accordance with U.S. GAAP and applicable actuarial standards. The Company’s actuaries annually verify the current reserving assumptions in consideration of evolving experience and the actuarial indications for assumptions relating to future policy benefits, including mortality and future investment income, among others. Management makes no adjustments to recorded deferred acquisition costs or future policy benefits if the actuarial indications conclude that current recorded U.S. GAAP policy benefits are adequate. The Company establishes a premium deficiency reserve, or an increase to future policy benefits to the extent that deferred acquisition costs are insufficient to cover the premium deficiency reserve, if the actuarial indication of life policy benefits is greater than current recorded aggregate amounts for policy benefits, settlement costs, and deferred acquisition costs.
|
For standard annuities, the main risk is a faster increase in future life span than expected in the medium to long term. Non-standard annuities are annuities sold to people with aggravated health conditions and are usually medically underwritten on an individual basis and the main risk is the inadequate assessment of the future life span of the insured.
|
•
|
Mortality:
The reserves for the short-term mortality business are established in accordance with the provisions for short duration insurance contracts under U.S. GAAP. They consist of case reserves and IBNR, calculated at the treaty level based upon cedant information. The Company’s reserving methodology includes a quarterly review of actual experience against expected experience and the use of the Expected Loss Ratio method described in Losses and Loss Expenses above. Given the very short-term loss development of this portion of the portfolio, this method is considered appropriate.
|
The reserves for the long-term traditional mortality and TCI reinsurance portfolio are established in accordance with the provisions for long duration insurance contracts under U.S. GAAP and follow the reserving methodology discussed under
77
the Longevity section above. In addition to the assumptions discussed above, persistency and critical illness assumptions are considered in the reserving process for mortality lines.
The reserves for the GMDB reinsurance business are established in accordance with the provisions for universal life contracts under U.S. GAAP. Key actuarial assumptions for this business are mortality, lapses, interest rates, expected returns on cash and bonds and stock market performance. For the last parameter, a stochastic option pricing approach is used and the benefits used in calculating the liabilities are based on the average benefits payable over a range of scenarios. The assumptions of investment performance and volatility are consistent with expected future experience of the respective underlying funds available for policyholder investment options. Recorded reserves for GMDB reflect Management’s best estimate which relies upon the quarterly actuarial indications.
|
•
|
Accident and Health:
The unpaid loss and loss expense reserves for accident and health business are established in accordance with the provisions for short duration insurance contracts under U.S. GAAP. Reserves are initially calculated using the Expected Loss Ratio method. Subsequently, the Company’s reserving methodology utilizes actual reported loss experience and the Bornhuetter-Ferguson method to calculate IBNR.
|
The Company’s gross and net
reserves for life and health contracts
by reserving line at
December 31, 2014
were as follows (in millions of U.S. dollars):
|
Case
reserves
|
IBNR
reserves
|
Reserves for
future policy
benefits
|
Total gross Life
and Health
reserves
|
Ceded
reserves
|
Total net Life
and Health
reserves
|
||||||||||||||||||
|
Accident and Health
|
$
|
8
|
|
$
|
220
|
|
$
|
—
|
|
$
|
228
|
|
$
|
(25
|
)
|
$
|
203
|
|
|||||
|
Longevity
|
1
|
|
121
|
|
388
|
|
510
|
|
(3
|
)
|
507
|
|
|||||||||||
|
Mortality
|
237
|
|
532
|
|
543
|
|
1,312
|
|
(1
|
)
|
1,311
|
|
|||||||||||
|
Total
|
$
|
246
|
|
$
|
873
|
|
$
|
931
|
|
$
|
2,050
|
|
$
|
(29
|
)
|
$
|
2,021
|
|
|||||
Gross reserves for future policy benefits for life contracts includes a provision for adverse deviation of $126 million and $127 million at
December 31, 2014
and
2013
, respectively.
As an example of the sensitivity of the Company’s
reserves for life and health contracts
to reserving parameter assumptions by reserving line, the effect of different assumption selections based on the gross reserves recorded at
December 31, 2014
was as follows (in millions of U.S. dollars):
|
Reserving lines
|
Factors
|
Change
|
Impact on total
Life and Health reserves
|
|||||
|
Longevity
|
||||||||
|
Standard and non-standard annuities
|
Mortality improvements per annum
|
1%
|
$
|
265
|
|
|||
|
Mortality
|
||||||||
|
Long-term and TCI
|
Mortality
|
10%
|
$
|
176
|
|
|||
|
GMDB
|
Stock market performance
|
10% / -10%
|
$
|
(2)/3
|
|
|||
|
Health
|
Expected loss ratio
|
10% / -10%
|
$
|
26/(26)
|
|
|||
It is not appropriate to sum the total impact for a specific reserving line or the total impact for a specific factor because the reinsurance portfolios are not perfectly correlated.
Premiums and Acquisition Costs
The Company provides proportional and non-proportional reinsurance coverage to cedants (insurance companies). In most cases, cedants seek protection for business that they have not yet written at the time they enter into reinsurance agreements and thus have to estimate the volume of premiums they will cede to the Company. Reporting delays are inherent in the reinsurance industry and vary in length by reinsurance market (country of cedant) and type of treaty. As delays can vary from a few weeks to a year or sometimes longer, the Company produces accounting estimates to report premiums and acquisition costs until it receives the cedants’ actual premium reported data. Approximately 46%, 48% and 43% of the Company’s reported net premiums written for the years ended
December 31, 2014
,
2013
and
2012
, respectively, were based upon estimates.
Under proportional treaties, which represented 79% of the Company’s total gross premiums written for the year ended
December 31, 2014
, the Company shares proportionally in both the premiums and losses of the cedant and pays the cedant a commission to cover the cedant’s acquisition costs. Under this type of treaty, the Company’s ultimate premiums written and earned and acquisition costs are not known at the inception of the treaty. As such, reported premiums written and earned and acquisition
78
costs on proportional treaties are generally based upon reports received from cedants and brokers, supplemented by the Company’s own estimates of premiums written and acquisition costs for which ceding company reports have not been received. Premium and acquisition cost estimates are determined at the individual treaty level. The determination of premium estimates requires a review of the Company’s experience with cedants, familiarity with each market, an understanding of the characteristics of each line of business and Management’s assessment of the impact of various other factors on the volume of business written and ceded to the Company. Premium and acquisition cost estimates are updated as new information is received from the cedants and differences between such estimates and actual amounts are recorded in the period in which estimates are changed or the actual amounts are determined.
Under non-proportional treaties, which represented 21% of the Company’s total gross premiums written for the year ended
December 31, 2014
, the Company is typically exposed to loss events in excess of a predetermined dollar amount or loss ratio and receives a fixed or minimum premium, which is subject to upward adjustment depending on the premium volume written by the cedant. In addition, many of the non-proportional treaties include reinstatement premium provisions. Reinstatement premiums are recognized as written and earned at the time a loss event occurs, where coverage limits for the remaining life of the contract are reinstated under pre-defined contract terms. The accrual of reinstatement premiums is based on Management’s estimate of losses and loss expenses associated with the loss event.
The magnitude and impact of changes in premium estimates differs for proportional and non-proportional treaties. Although proportional treaties may be subject to larger changes in premium estimates compared to non-proportional treaties, as the Company generally receives cedant statements in arrears and must estimate all premiums for periods ranging from one month to more than one year (depending on the frequency of cedant statements), the pre-tax impact is mitigated by changes in the cedant’s related reported acquisition costs and losses. The impact of the change in estimate on premiums earned and pre-tax results varies depending on when the change becomes known during the risk period and the underlying profitability of the treaty. Non-proportional treaties generally include a fixed minimum premium and an adjustment premium. While the fixed minimum premiums require no estimation, adjustment premiums are estimated and could be subject to changes in estimates.
The amounts recorded within net premiums written and earned that related to changes in prior year premium estimates reported by cedants for each Non-life sub-segment for the year ended
December 31, 2014
were as follows (in millions of U.S. dollars):
|
Non-life sub-segment
|
Net premiums written
|
Net premiums earned
|
||||||
|
North America
|
$
|
19
|
|
$
|
15
|
|
||
|
Global (Non-U.S.) P&C
|
15
|
|
10
|
|
||||
|
Global Specialty
|
61
|
|
33
|
|
||||
|
Catastrophe
|
(4
|
)
|
(5
|
)
|
||||
|
Total
|
$
|
91
|
|
$
|
53
|
|
||
These increases in net premiums written and earned, after the corresponding adjustments to acquisition costs and losses and loss expenses, did not have a material impact on the Company’s consolidated pre-tax net income.
As an example of the sensitivity of the Company’s Non-life net premiums written and acquisition costs to changes in estimates, the effect of different assumption selections on pre-tax net income based on amounts recorded for the year ended
December 31, 2014
was as follows (in millions of U.S. dollars):
|
|
Change
|
Impact on pre-tax net income
|
||
|
Net premiums written—Non-life proportional treaties
(1)
|
+/-5%
|
$
|
+/-17
|
|
|
Net premiums written—Non-life non-proportional treaties
(2)
|
+/-5%
|
$
|
+/-21
|
|
|
Acquisition costs—all Non-life treaties
(3)
|
+/-1%
|
$
|
-/+5
|
|
|
(1)
|
The estimate assumes that the changes in net premiums written become known at the mid-point of the risk period and is made by applying the reported technical ratio for the year ended
December 31, 2014
.
|
|
(2)
|
The estimate assumes that the changes in net premiums written become known at the mid-point of the risk period and also assume there is no change in losses and loss expenses and is made by applying the reported acquisition ratio for the year ended
December 31, 2014
.
|
|
(3)
|
The estimate relates to all of the Company’s Non-life treaties (both proportional and non-proportional) and assumes that the changes become known at the mid-point of the risk period and also assumes there is no change in premium estimates.
|
79
Acquisition costs, comprising only incremental brokerage fees, commissions and excise taxes, which vary directly with, and are related to, the acquisition of reinsurance contracts, are capitalized and charged to expense as the related premium is earned. All other acquisition-related costs, including all indirect costs, are expensed as incurred. The recovery of deferred policy acquisition costs is dependent upon the future profitability of the related business. Deferred policy acquisition costs recoverability testing is performed periodically together with the reserve adequacy test, based on the latest best estimate assumptions by line of business.
Income Taxes
Under U.S. GAAP, a deferred tax asset or liability is to be recognized for the estimated future tax effects attributable to temporary differences and carryforwards. U.S. GAAP also establishes procedures to assess whether a valuation allowance should be established for deferred tax assets. All available evidence, both positive and negative, is considered to determine whether, based on the weight of that evidence, a valuation allowance is needed for some portion or all of a deferred tax asset. Management must use its judgment in considering the relative impact of positive and negative evidence. The Company has also established tax liabilities relating to uncertain tax positions as defined under U.S. GAAP of
$19 million
at
December 31, 2014
(see Notes 2(l) and 15 to Consolidated Financial Statements in Item 8 of Part II of this report).
The Company has estimated the future tax effects attributed to temporary differences and has a deferred tax asset at
December 31, 2014
of
$157 million
, after a valuation allowance of
$68 million
. The most significant component of the deferred tax asset (after valuation allowance) relates to loss reserve discounting for tax purposes.
The Company has projected future taxable income in the tax jurisdictions in which the deferred tax assets arise. These projections are based on Management’s projections of premium and investment income, capital gains and losses, and technical and expense ratios. Based on these projections and an analysis of the ability to utilize loss and foreign tax credits carryforwards at the taxable entity level, Management evaluates the need for a valuation allowance. The valuation allowance of
$68 million
, recorded at
December 31, 2014
, primarily related to a foreign tax credit carryforward of
$47 million
in Ireland and to tax loss carryforwards of
$20 million
and
$1 million
in Singapore and Canada, respectively.
In accordance with U.S. GAAP, the Company has assumed that the future reversal of deferred tax liabilities will result in an increase in taxes payable in future years. Underlying this assumption is an expectation that the Company will continue to be subject to taxation in the various tax jurisdictions and that the Company will continue to generate taxable revenues in excess of deductions.
As an example of the sensitivity of the Company’s unrecognized tax benefit related to uncertain tax positions, deferred tax asset and net deferred tax liability, the impact of different assumption selections on the Company’s net income and the corresponding impact on net assets based on amounts recorded at
December 31, 2014
was as follows (in millions of U.S. dollars):
|
2014
|
Change
|
Impact on net income
and net assets
|
|||||||||
|
Unrecognized tax benefit related to uncertain tax positions
|
$
|
(19
|
)
|
10
|
%
|
$
|
(2
|
)
|
|||
|
Deferred tax asset
|
157
|
|
(10
|
)%
|
(16
|
)
|
|||||
|
Net deferred tax liability
|
(206
|
)
|
10
|
%
|
(21
|
)
|
|||||
Valuation of Investments and Funds Held – Directly Managed, including certain Derivative Financial Instruments
The Company defines fair value as the price received to sell an asset or paid to transfer a liability in an orderly transaction between market participants at the measurement date. The Company measures the fair value of its financial instruments according to a fair value hierarchy that prioritizes the information used to measure fair value into three broad levels.
The fair value hierarchy prioritizes the inputs to valuation techniques used to measure fair value by maximizing the use of observable inputs and minimizing the use of unobservable inputs by requiring that the most observable inputs be used when available. Observable inputs are inputs that market participants would use in pricing an asset or liability based on market data obtained from sources independent of the Company. Unobservable inputs are inputs that reflect the Company’s assumptions about what market participants would use in pricing the asset or liability based on the best information available in the circumstances. The level in the hierarchy within which a given fair value measurement falls is determined based on the lowest level input that is significant to the measurement.
The Company must determine the appropriate level in the hierarchy for each financial instrument that it measures at fair value. In determining fair value, the Company uses various valuation approaches, including market, income and cost approaches. See Note 3 to Consolidated Financial Statements in Item 8 of Part II of this report for more detail on the valuation techniques, methods and assumptions that were used by the Company to estimate the fair value of its fixed maturities and short-term investments, equities, other invested assets and its fixed maturities and other invested assets underlying the funds held – directly
80
managed account. See Note 6 to Consolidated Financial Statements in Item 8 of Part II of this report for more discussion of the Company’s use of derivative financial instruments.
The Company records all of its fixed maturities, short-term investments and equities, certain other invested assets, including derivative financial instruments, and its fixed maturities and certain other invested assets underlying the funds held – directly managed account at fair value in its Consolidated Balance Sheets. The changes in the fair value of all of the Company’s investments and derivatives, carried at fair value, are recorded in net realized and unrealized investment gains and losses, except for certain foreign exchange related derivatives that are recorded in net foreign exchange gains and losses, in the Consolidated Statements of Operations and are included in the determination of net income or loss in the period in which they are recorded.
Under the fair value hierarchy, Management uses certain assumptions and judgments to derive the fair value of its investments, particularly for those assets with significant unobservable inputs, commonly referred to as Level 3 assets. At
December 31, 2014
, the Company’s financial instruments that were measured at fair value and categorized as Level 3 were as follows (in millions of U.S. dollars):
|
|
December 31, 2014
|
||
|
Fixed maturities
|
$
|
600
|
|
|
Equities
|
40
|
|
|
|
Other invested assets (including certain derivatives)
|
116
|
|
|
|
Funds held – directly managed account
|
13
|
|
|
|
Total
|
$
|
769
|
|
For the Company’s fixed maturities, equities, other invested assets and investments underlying the funds held – directly managed account categorized as Level 3, a 10% decline in the fair value of these investments at
December 31, 2014
would result in a
$77 million
pre-tax charge to net income or loss and a corresponding reduction in total assets.
In addition to other invested assets included in the table above for Level 3 of $116 million and the combined fair value of Level 1 and Level 2 derivative liabilities of $4 million, the Company’s other invested assets also include various investments which are accounted for using the cost method of accounting or equity method of accounting of $187 million at
December 31, 2014
. The Company does not measure its investments that are accounted for using any of these methods at fair value. For investments that are accounted for using the cost method of accounting or equity method of accounting, a 10% decline in the carrying value of these investments at
December 31, 2014
would result in a $19 million pre-tax charge to net income or loss and a corresponding reduction in investments and total assets.
The Company utilizes derivatives for a variety of purposes. The Company’s derivatives are carried at fair value, which is based on quoted market prices or internal valuation models where quoted market prices are not available. Most of the Company’s derivatives are fair valued using significant other observable inputs (fair value of $5 million net liability position at
December 31, 2014
), referred to as Level 2 assets, and included foreign exchange forward contracts, interest rate swaps, foreign currency options and to-be-announced mortgage-backed securities (TBAs). The Company’s derivatives that are fair valued using quoted prices in active markets, referred to as Level 1 assets, had fair value of less than $1 million at
December 31, 2014
, and included treasury and equity futures. In addition, the Company has certain total return swaps and insurance-linked securities that are fair valued using significant other unobservable inputs, and are included in the Level 3 other invested assets. The total return swaps and insurance-linked securities that are classified as Level 3 were in a net liability position with a combined fair value of $2 million at
December 31, 2014
, based on a combined notional exposure of $188 million.
In aggregate, the Company is not significantly exposed to changes in the valuation of its total return and interest rate swap portfolio due to changes in the general level of interest rates. At
December 31, 2014
, the Company estimated that a 100 basis point increase or decrease in all risk spread assumptions used in the Company’s internal valuation models would result in a $3 million decrease or increase, respectively, in the fair value of its total return and interest rate swap portfolio categorized as Level 3.
The Company is exposed to changes in the expected amount of future cash flows of the reference assets in its total return swap portfolio. The Company’s total return swap portfolio primarily references certain bonds issued by U.S. municipalities. At
December 31, 2014
, the notional value of the total return swap portfolio categorized as Level 3 was $43 million and the fair value of the assets underlying the total return swap portfolio categorized as Level 3 was $41 million. The Company estimated that each 1% increase or decrease in the amount of all expected future cash flows related to the reference assets would result in a $2 million increase or decrease, respectively, in the fair value of its total return swap portfolio at
December 31, 2014
.
At
December 31, 2014
, the Company’s insurance-linked securities that are classified as Level 3 include longevity swaps and weather derivatives, with an insignificant combined fair value. At
December 31, 2014
, the notional exposure of the longevity swaps and weather derivatives classified as Level 3 was $133 million and $12 million, respectively. At
December 31, 2014
, the Company estimated that a 10% improvement in the mortality assumption used in the Company’s internal valuation models for its longevity
81
swaps would result in a $4 million decrease in the fair value of its longevity swap portfolio. The weather derivatives categorized as Level 3 are exposed to wind events, and any change in the assumptions used in the Company’s internal models would have an insignificant impact on the fair value of weather derivatives at
December 31, 2014
.
Goodwill
Goodwill represents the excess of the purchase price over the fair value of the net assets acquired in a business combination (PartnerRe SA, Winterthur Re, Paris Re and PartnerRe Health). The Company assesses the appropriateness of its valuation of goodwill on at least an annual basis or more frequently if events or changes in circumstances indicate that the carrying amount may not be recoverable. If, as a result of the assessment, the Company determines that the value of its goodwill is impaired, goodwill will be written down in the period in which the determination is made. Based upon the Company's assessment, there was no impairment of the Company’s goodwill asset of
$456 million
at
December 31, 2014
.
In making an assessment of the value of its goodwill, the Company uses both market based and non-market based valuations. The fair value of the reporting units is determined based on the earnings multiple, price to tangible book value multiple, present value of estimated cash flows and present value of future profits methods. Significant changes in the data underlying these assumptions could result in an assessment of impairment of the Company’s goodwill asset. In addition, if the current economic environment and/or the Company’s financial performance were to deteriorate significantly, this could lead to an impairment of goodwill, the write-off of which would be recorded against net income in the period such deterioration occurred.
Intangible Assets
Intangible assets represent the fair value adjustments related to unpaid losses and loss expenses and the fair values of renewal rights, customer relationships and U.S. licenses arising from acquisitions. Definite-lived intangible assets are amortized over their useful lives. The Company recognizes the amortization of all intangible assets in the Consolidated Statement of Operations. Indefinite-lived intangible assets are not subject to amortization. The carrying values of intangible assets are reviewed for indicators of impairment on at least an annual basis, or more frequently if events or changes in circumstances indicate that impairment may exist. Impairment is recognized if the carrying values of the intangible assets are not recoverable from their undiscounted cash flows and are measured as the difference between the carrying value and the fair value. Based upon the Company’s assessment, there was no impairment of its intangible assets of
$160 million
at
December 31, 2014
.
Results of Operations
The following discussion of Results of Operations contains forward-looking statements based upon assumptions and expectations concerning the potential effect of future events that are subject to uncertainties. See Item 1A of this report for a complete list of the Company’s risk factors. Any of these risk factors could cause actual results to differ materially from those reflected in such forward-looking statements.
The Company’s reporting currency is the U.S. dollar. The Company’s significant subsidiaries and branches have one of the following functional currencies: U.S. dollar, euro or Canadian dollar. As a significant portion of the Company’s operations is transacted in foreign currencies, fluctuations in foreign exchange rates may affect year over year comparisons. To the extent that fluctuations in foreign exchange rates affect comparisons, their impact has been quantified, when possible, and discussed in each of the relevant sections. See Note 2(m) to Consolidated Financial Statements in Item 8 of Part II of this report for a discussion of translation of foreign currencies.
The foreign exchange fluctuations for the principal currencies in which the Company transacts business were as follows:
|
•
|
the U.S. dollar average exchange rate was weaker against most currencies, except the Japanese yen and Canadian dollar, in
2014
compared to
2013
and was stronger against most currencies, except the euro and Swiss franc, in 2013 compared to 2012; and
|
|
•
|
the U.S. dollar ending exchange rate strengthened against most currencies at
December 31, 2014
compared to
December 31, 2013
.
|
Review of Net Income
Management analyzes the Company’s net income or loss in three parts: underwriting result, investment result and other components of net income or loss. Underwriting result consists of net premiums earned and other income or loss less losses and loss expenses and life policy benefits, acquisition costs and other expenses. Investment result consists of net investment income, net realized and unrealized investment gains or losses and interest in earnings or losses of equity method investments. Net investment income includes interest, dividends and amortization, net of investment expenses, generated by the Company’s investment activities, as well as interest income generated on funds held assets. Net realized and unrealized investment gains or losses include sales of the
82
Company’s fixed income, equity and other invested assets and investments underlying the funds held – directly managed account and changes in net unrealized gains or losses. Interest in earnings or losses of equity method investments includes the Company’s strategic investments. Other components of net income or loss include technical result and other income or loss, other expenses, interest expense, amortization of intangible assets, net foreign exchange gains or losses and income tax expense or benefit.
The components of net income for the years ended
December 31, 2014
,
2013
and
2012
were as follows (in millions of U.S. dollars, except per share data):
|
2014
|
2013
|
2012
|
|||||||||
|
Underwriting result:
|
|||||||||||
|
Non-life
|
$
|
610
|
|
$
|
626
|
|
$
|
456
|
|
||
|
Life and Health
|
13
|
|
12
|
|
(16
|
)
|
|||||
|
Investment result:
|
|||||||||||
|
Net investment income
|
480
|
|
484
|
|
571
|
|
|||||
|
Net realized and unrealized investment gains (losses)
|
372
|
|
(161
|
)
|
494
|
|
|||||
|
Interest in earnings of equity method investments
(1)
|
15
|
|
14
|
|
10
|
|
|||||
|
Corporate and Other:
|
|||||||||||
|
Technical result
(2)
|
—
|
|
8
|
|
4
|
|
|||||
|
Other income
(2)
|
5
|
|
3
|
|
3
|
|
|||||
|
Other expenses
|
(130
|
)
|
(170
|
)
|
(102
|
)
|
|||||
|
Interest expense
|
(49
|
)
|
(49
|
)
|
(49
|
)
|
|||||
|
Amortization of intangible assets
(3)
|
(27
|
)
|
(27
|
)
|
(32
|
)
|
|||||
|
Net foreign exchange gains (losses)
|
18
|
|
(18
|
)
|
—
|
|
|||||
|
Income tax expense
|
(239
|
)
|
(49
|
)
|
(204
|
)
|
|||||
|
Net income
|
$
|
1,068
|
|
$
|
673
|
|
$
|
1,135
|
|
||
|
(1)
|
Interest in earnings or losses of equity method investments represents the Company’s aggregate share of earnings or losses related to several private placement investments and limited partnerships within the Corporate and Other segment.
|
|
(2)
|
Technical result and other income primarily relate to income on insurance-linked securities and principal finance transactions within the Corporate and Other segment.
|
|
(3)
|
Amortization of intangible assets relates to intangible assets acquired in the acquisition of Paris Re in 2009 and PartnerRe Health in 2012. The acquisition of PartnerRe Health was effective December 31, 2012 and, accordingly, no amortization expense related to the intangible assets acquired has been recorded during the year ended December 31, 2012.
|
Underwriting result is a measurement that the Company uses to manage and evaluate its Non-life and Life and Health segments, as it is a primary measure of underlying profitability for the Company’s core reinsurance operations, separate from the investment results. The Company believes that in order to enhance the understanding of its profitability, it is useful for investors to evaluate the components of net income or loss separately and in the aggregate. Underwriting result should not be considered a substitute for net income or loss and does not reflect the overall profitability of the business, which is also impacted by investment results and other items.
The components of the underwriting result and combined ratio for the Non-life segment for the years ended
December 31, 2014
,
2013
and
2012
were as follows (in millions of U.S. dollars):
|
|
2014
|
2013
|
2012
|
|||||||||||||||||
|
Current accident year technical result and ratio
|
||||||||||||||||||||
|
Adjusted for large catastrophic losses and large losses
|
$
|
199
|
|
95.5
|
%
|
$
|
303
|
|
92.8
|
%
|
$
|
396
|
|
89.1
|
%
|
|||||
|
Large catastrophic losses and large losses
(1)
|
—
|
|
—
|
|
(142
|
)
|
3.4
|
|
(316
|
)
|
8.7
|
|
||||||||
|
Prior accident years technical result and ratio
|
||||||||||||||||||||
|
Net favorable prior year loss development
|
660
|
|
(15.1
|
)
|
721
|
|
(17.0
|
)
|
628
|
|
(17.0
|
)
|
||||||||
|
Technical result and ratio, as reported
|
$
|
859
|
|
80.4
|
%
|
$
|
882
|
|
79.2
|
%
|
$
|
708
|
|
80.8
|
%
|
|||||
|
Other income
|
3
|
|
—
|
|
3
|
|
—
|
|
5
|
|
—
|
|
||||||||
|
Other expenses
|
(252
|
)
|
5.8
|
|
(259
|
)
|
6.1
|
|
(257
|
)
|
7.0
|
|
||||||||
|
Underwriting result and combined ratio, as reported
|
$
|
610
|
|
86.2
|
%
|
$
|
626
|
|
85.3
|
%
|
$
|
456
|
|
87.8
|
%
|
|||||
83
|
(1)
|
Large catastrophic losses and large losses are shown net of any related reinsurance, reinstatement premiums and profit commissions.
|
2014 compared to 2013
The underwriting result for the Non-life segment decreased by $
16 million
(corresponding to an increase of
0.9
points in the combined ratio), from $
626 million
(
85.3
points on the combined ratio) in
2013
to $
610 million
(
86.2
points on the combined ratio) in
2014
primarily due to:
|
•
|
The current accident year technical result, adjusted for large catastrophic losses
—a decrease in the technical result (and corresponding increase in the technical ratio) primarily due to the North America, Global (Non-U.S.) P&C and Catastrophe sub-segments. These decreases were driven by higher acquisition cost ratio in the North America and Global (Non-U.S.) P&C sub-segments and a decrease in net premiums earned, which in the absence of catastrophic losses directly impacts the technical result, in the Catastrophe sub-segment.
|
|
•
|
Net favorable prior year loss development
—a decrease of $
61 million
from $
721 million
(
17.0
points on the technical ratio) in
2013
to $
660 million
(
15.1
points on the technical ratio) in
2014
. The decrease in net favorable prior year loss development was due to decreases in the Catastrophe and Global (Non-U.S.) P&C sub-segments, which were partially offset by increases in the Global Specialty and North America sub-segments. The components of the net favorable prior year loss development are described in more detail in the discussion of individual sub-segments in Results by Segment below.
|
These factors driving the decrease in the Non-life underwriting result and the corresponding increase in the combined ratio in
2014
compared to
2013
were partially offset by:
|
•
|
Large catastrophic losses
—a decrease of $142 million (decrease of 3.4 points in the technical ratio) related to the German Hailstorm, Alberta Floods and European Floods in
2013
compared to no significant catastrophic losses in
2014
.
|
The underwriting result for the Life and Health segment, which does not include allocated investment income, of $
13 million
in
2014
was comparable to
2013
due to increased profitability generated from the PartnerRe Health business, almost entirely offset by a lower level of net favorable prior year loss development. See Results by Segment below.
Net investment income decreased by
$4 million
, from $
484 million
in
2013
to $
480 million
in
2014
. The decrease was primarily due to lower reinvestment rates and lower net investment income from the funds held – directly managed account, related to the lower average balance. These decreases were partially offset by
higher dividend income, the impact of the increase in the U.S. Consumer Price Index on the Company's Treasury Inflation-Protected Securities portfolio and certain other favorable non-recurring items
. See Corporate and Other – Net Investment Income below for more details.
Net realized and unrealized investment gains increased by $
533 million
, from losses of $
161 million
in
2013
to gains of $
372 million
in
2014
. The net realized and unrealized investment gains of $
372 million
in
2014
were primarily due to decreases in U.S. and European risk-free interest rates and improvements in worldwide equity markets, which were partially offset by losses on treasury note futures. See Corporate and Other – Net Realized and Unrealized Investment Gains (Losses) below for more details.
Other expenses included in Corporate and Other decreased by $
40 million
, from $
170 million
in
2013
to $
130 million
in
2014
. The decrease was primarily due to the restructuring charge in
2013
, as described in Executive Overview above, and lower personnel costs in 2014 following the restructuring.
Interest expense in
2014
was comparable to
2013
.
Net foreign exchange gains increased by $
36 million
, from losses of $
18 million
in
2013
to gains of $
18 million
in
2014
. The net foreign exchange gains of $
18 million
in
2014
resulted primarily from the difference in forward points embedded in the Company's hedges. The Company hedges a significant portion of its currency risk exposure as discussed in Quantitative and Qualitative Disclosures about Market Risk in Item 7A of Part II of this report.
Income tax expense increased by $
190 million
, from $
49 million
in
2013
to $
239 million
in
2014
, primarily reflecting an increase in the Company’s pre-tax net income in
2014
compared to
2013
. See Corporate and Other—Income Taxes below for more details.
84
2013 compared to 2012
The underwriting result for the Non-life segment increased by $170 million (corresponding to a decrease of 2.5 points in the combined ratio), from $456 million (87.8 points on the combined ratio) in 2012 to $626 million (85.3 points on the combined ratio) in 2013. The increase in the Non-life underwriting result and the corresponding decrease in the combined ratio in 2013 compared to 2012 was primarily attributable to:
|
•
|
Large catastrophic losses and large losses
- a decrease of $174 million (decrease of 5.3 points in the technical ratio) compared to no significant catastrophic losses from $316 million (8.7 points on the technical ratio) in 2012 related to Superstorm Sandy and the U.S. drought that impacted the agriculture line of the North America sub-segment to $142 million (3.4 points on the technical ratio) in 2013 related to the German Hailstorm, Alberta Floods and European Floods.
|
|
•
|
Net favorable prior year loss development
- an increase of $93 million from $628 million (17.0 points on the technical ratio) in 2012 to $721 million (17.0 points on the technical ratio) in 2013. The increase in net favorable prior year loss development was primarily driven by increases in the Global (Non-U.S.) P&C and Catastrophe sub-segments, which were partially offset by a decrease in the Global Specialty sub-segment. While net favorable prior year loss development increased in 2013 compared to 2012, this did not decrease the technical ratio as a result of higher net premiums earned in 2013. The components of the net favorable prior year loss development are described in more detail in the discussion of individual sub-segments in Results by Segment below.
|
These factors driving the increase in the Non-life underwriting result and the corresponding decrease in the combined ratio in 2013 compared to 2012 were partially offset by:
|
•
|
The current accident year technical result, adjusted for large catastrophic losses and large losses
- a decrease in the technical result (and a corresponding increase in the technical ratio) primarily driven by higher losses reported by a large cedant in the agriculture line of business of the Company’s North America sub-segment and a higher level of mid-sized loss activity in the Global Specialty and Catastrophe sub-segments. These decreases were partially offset by higher upward premium adjustments in the Global (Non-U.S.) P&C sub-segment and a modestly lower level of mid-sized loss activity in the Global (Non-U.S.) P&C and North America sub-segments.
|
The underwriting result for the Life and Health segment, which does not include allocated investment income, improved by $28 million, from a loss of $16 million in 2012 to a gain of $12 million in 2013. The improvement in the Life and Health underwriting result was primarily due to higher net favorable prior year loss development, driven by the mortality line of business. See Results by Segment below.
Net investment income decreased by $87 million, from $571 million in 2012 to $484 million in 2013. The decrease in net investment income was primarily attributable to a decrease in net investment income from fixed maturities due to lower reinvestment rates. See Corporate and Other - Net Investment Income below for more details.
Net realized and unrealized investment losses increased by $655 million, from gains of $494 million in 2012 to losses of $161 million in 2013. The net realized and unrealized investment losses of $161 million in 2013 were primarily due to increases in risk-free interest rates and were partially offset by improvements in worldwide equity markets and narrower credit spreads. See Corporate and Other - Net Realized and Unrealized Investment Gains (Losses) below for more details.
Other expenses included in Corporate and Other increased by $68 million, from $102 million in 2012 to $170 million in 2013. The increase was primarily due to restructuring charges described in Overview above.
Interest expense in 2013 was comparable to 2012.
Net foreign exchange losses increased by $18 million, from breakeven in 2012 to losses of $18 million in 2013. The net foreign exchange losses in 2013 resulted primarily from currency movements on certain unhedged equity securities. The Company hedges a significant portion of its currency risk exposure as discussed in Quantitative and Qualitative Disclosures about Market Risk in Item 7A of Part II of this report.
Income tax expense decreased by $155 million, from $204 million in 2012 to $49 million in 2013, reflecting a decrease in pre-tax net income and a higher distribution of pre-tax net income recorded in non-taxable jurisdictions in 2013 compared to 2012. See Corporate and Other - Income Taxes below for more details.
Results by Segment
The Company monitors the performance of its operations in three segments, Non-life, Life and Health and Corporate and Other. The Non-life segment is further divided into four sub-segments, North America, Global (Non-U.S.) Property and Casualty (Global (Non-U.S.) P&C), Global Specialty and Catastrophe. Segments and sub-segments represent markets that are reasonably homogeneous in terms of geography, client types, buying patterns, underlying risk patterns and approach to risk management. See the description of the Company’s segments and sub-segments as well as a discussion of how the Company measures its segment
85
results in Note 21 to Consolidated Financial Statements included in Item 8 of Part II of this report. Effective January 1, 2013, the Life segment is referred to as Life and Health to reflect the inclusion of PartnerRe Health’s results and the Global (Non-U.S.) Specialty sub-segment is referred to as Global Specialty.
Non-life Segment
North America
The North America sub-segment is comprised of lines of business that are considered to be either short, medium or long-tail. The short-tail lines consist primarily of agriculture, property and motor business. Casualty is considered to be long-tail, while credit/surety and multiline are considered to have a medium tail. The casualty line typically tends to have a higher loss ratio and a lower technical result due to the long-tail nature of the risks involved. Casualty treaties typically provide for investment income on premiums invested over a longer period as losses are typically paid later than for other lines. Investment income, however, is not considered in the calculation of technical result.
The components of the technical result and the corresponding ratios for this sub-segment for the years ended
December 31, 2014
,
2013
and
2012
were as follows (in millions of U.S. dollars):
|
2014
|
2013
|
2012
|
|||||||||
|
Gross premiums written
|
$
|
1,642
|
|
$
|
1,601
|
|
$
|
1,221
|
|
||
|
Net premiums written
|
1,630
|
|
1,587
|
|
1,219
|
|
|||||
|
Net premiums earned
|
$
|
1,597
|
|
$
|
1,533
|
|
$
|
1,176
|
|
||
|
Losses and loss expenses
|
(1,000
|
)
|
(975
|
)
|
(816
|
)
|
|||||
|
Acquisition costs
|
(401
|
)
|
(351
|
)
|
(291
|
)
|
|||||
|
Technical result
(1)
|
$
|
196
|
|
$
|
207
|
|
$
|
69
|
|
||
|
Loss ratio
(2)
|
62.6
|
%
|
63.6
|
%
|
69.4
|
%
|
|||||
|
Acquisition ratio
(3)
|
25.1
|
|
22.9
|
|
24.7
|
|
|||||
|
Technical ratio
(4)
|
87.7
|
%
|
86.5
|
%
|
94.1
|
%
|
|||||
|
(1)
|
Technical result is defined as net premiums earned less losses and loss expenses and acquisition costs.
|
|
(2)
|
Loss ratio is obtained by dividing losses and loss expenses by net premiums earned.
|
|
(3)
|
Acquisition ratio is obtained by dividing acquisition costs by net premiums earned.
|
|
(4)
|
Technical ratio is defined as the sum of the loss ratio and the acquisition ratio
.
|
Premiums
The North America sub-segment represented 29%, 30% and 27% of total net premiums written in
2014
,
2013
and
2012
, respectively. The net premiums written and net premiums earned by line of business for this sub-segment for the years ended
December 31, 2014
,
2013
and
2012
were as follows (in millions of U.S. dollars):
|
|
2014
|
2013
|
2012
|
||||||||||||||||||||||||||||||||||||||
|
|
Net premiums
written |
Net premiums
earned |
Net premiums
written |
Net premiums
earned |
Net premiums
written |
Net premiums
earned |
|||||||||||||||||||||||||||||||||||
|
Agriculture
|
$
|
452
|
|
28
|
%
|
$
|
452
|
|
28
|
%
|
$
|
478
|
|
30
|
%
|
$
|
478
|
|
31
|
%
|
$
|
231
|
|
19
|
%
|
$
|
231
|
|
20
|
%
|
|||||||||||
|
Casualty
|
606
|
|
37
|
|
589
|
|
37
|
|
588
|
|
37
|
|
564
|
|
37
|
|
520
|
|
43
|
|
484
|
|
41
|
|
|||||||||||||||||
|
Credit/Surety
|
112
|
|
7
|
|
103
|
|
6
|
|
54
|
|
3
|
|
48
|
|
3
|
|
54
|
|
4
|
|
54
|
|
5
|
|
|||||||||||||||||
|
Motor
|
76
|
|
4
|
|
72
|
|
5
|
|
58
|
|
4
|
|
49
|
|
3
|
|
51
|
|
4
|
|
65
|
|
6
|
|
|||||||||||||||||
|
Multiline
|
126
|
|
8
|
|
111
|
|
7
|
|
97
|
|
6
|
|
96
|
|
6
|
|
89
|
|
7
|
|
87
|
|
7
|
|
|||||||||||||||||
|
Property
|
223
|
|
14
|
|
226
|
|
14
|
|
241
|
|
15
|
|
235
|
|
16
|
|
238
|
|
20
|
|
227
|
|
19
|
|
|||||||||||||||||
|
Other
|
35
|
|
2
|
|
44
|
|
3
|
|
71
|
|
5
|
|
63
|
|
4
|
|
36
|
|
3
|
|
28
|
|
2
|
|
|||||||||||||||||
|
Total
|
$
|
1,630
|
|
100
|
%
|
$
|
1,597
|
|
100
|
%
|
$
|
1,587
|
|
100
|
%
|
$
|
1,533
|
|
100
|
%
|
$
|
1,219
|
|
100
|
%
|
$
|
1,176
|
|
100
|
%
|
|||||||||||
86
Business reported in this sub-segment is, to an extent, originally denominated in foreign currencies and is reported in U.S. dollars. The U.S. dollar can fluctuate significantly against other currencies and this should be considered when making year to year comparisons. The effect of foreign exchange fluctuations, described in the Results of Operations above, on gross and net premiums written and net premiums earned in
2014
compared to
2013
and in
2013
compared to
2012
was as follows:
|
2014 compared to 2013
|
Gross premiums
written
|
Net premiums
written
|
Net premiums
earned
|
||||||
|
Increase in original currency
|
3
|
%
|
3
|
%
|
5
|
%
|
|||
|
Foreign exchange effect
|
—
|
|
—
|
|
(1
|
)
|
|||
|
Increase as reported in U.S. dollars
|
3
|
%
|
3
|
%
|
4
|
%
|
|||
|
2013 compared to 2012
|
|||||||||
|
Increase in original currency
|
31
|
%
|
30
|
%
|
31
|
%
|
|||
|
Foreign exchange effect
|
—
|
|
—
|
|
(1
|
)
|
|||
|
Increase as reported in U.S. dollars
|
31
|
%
|
30
|
%
|
30
|
%
|
|||
2014 compared to 2013
Gross and net premiums written increased by
3%
and net premiums earned increased by
5%
on a constant foreign exchange basis in
2014
compared to
2013
. The increases in gross and net premiums written and net premiums earned were primarily driven by new business written in the credit/surety, multiline and motor lines of business. These increases were partially offset by non-renewals in the structured property line of business, and renewal decreases and lower upward premium adjustments in the agriculture line of business. Notwithstanding the competitive conditions prevailing in various markets within this sub-segment, the Company was able to write business that met its portfolio objectives.
2013 compared to 2012
Gross and net premiums written and net premiums earned increased by
31%
,
30%
,
31%
on a constant foreign exchange basis, respectively, in 2013 compared to 2012. The increases in gross and net premiums written and net premiums earned were primarily driven by the increase in the agriculture line of business, and, to a lesser extent, the casualty line of business, which were the result of new business written.
Technical result and technical ratio
The components of the technical result and ratio for this sub-segment for the years ended
December 31, 2014
,
2013
and
2012
were as follows (in millions of U.S. dollars):
|
|
2014
|
2013
|
2012
|
|||||||||||||||||
|
Current accident year technical result and ratio
|
||||||||||||||||||||
|
Adjusted for large catastrophic losses and large losses
|
$
|
(55
|
)
|
103.4
|
%
|
$
|
(2
|
)
|
100.1
|
%
|
$
|
8
|
|
99.3
|
%
|
|||||
|
Large catastrophic losses and large losses
(1)
|
—
|
|
—
|
|
(14
|
)
|
0.9
|
|
(157
|
)
|
13.4
|
|
||||||||
|
Prior accident years technical result and ratio
|
||||||||||||||||||||
|
Net favorable prior year loss development
|
251
|
|
(15.7
|
)
|
223
|
|
(14.5
|
)
|
218
|
|
(18.6
|
)
|
||||||||
|
Technical result and ratio, as reported
|
$
|
196
|
|
87.7
|
%
|
$
|
207
|
|
86.5
|
%
|
$
|
69
|
|
94.1
|
%
|
|||||
|
(1)
|
Large catastrophic losses and large losses are shown net of any related reinsurance, reinstatement premiums and profit commissions
.
|
2014 compared to 2013
The decrease of $
11 million
in the technical result (and the corresponding increase of
1.2
points in the technical ratio) in
2014
compared to
2013
was primarily attributable to:
|
•
|
The current accident year technical result, adjusted for large catastrophic losses
— a decline in the technical result (and corresponding increase in the technical ratio) mainly due to a higher acquisition cost ratio, driven by increasingly competitive conditions and pricing observed in most lines of business, losses recorded in the agriculture line of business primarily related to hailstorms impacting the 2014 crop year, and normal fluctuations in profitability between periods.
|
87
This factor driving the decrease in the technical result in
2014
compared to
2013
was partially offset by:
|
•
|
Net favorable prior year loss development
— an increase of $
28 million
(decrease of
1.2
points in the technical ratio) from $
223 million
(
14.5
points on the technical ratio) in
2013
to $
251 million
(
15.7
points on the technical ratio) in
2014
. The net favorable loss development for prior accident years in
2014
was driven primarily by the casualty line, while the motor line experienced adverse loss development for prior accident years of $9 million. The net favorable loss development for prior accident years in 2013 is described below.
|
|
•
|
Large catastrophic losses
— a decrease of $14 million (decrease of 0.9 points in the technical ratio) related to the Alberta Floods in
2013
compared to no significant catastrophic losses in 2014.
|
2013 compared to 2012
The increase of $138 million in the technical result (and the corresponding decrease of 7.6 points in the technical ratio) in 2013 compared to 2012 was primarily attributable to:
|
•
|
Large catastrophic losses and large losses
— a decrease of $143 million (decrease of 12.5 points in the technical ratio) from $157 million (13.4 points on the technical ratio) related to the U.S. drought and Superstorm Sandy in 2012 to $14 million (0.9 points on the technical ratio) related to the Alberta Floods in 2013.
|
|
•
|
Net favorable prior year loss development
— an increase of $5 million (increase of 4.1 points in the technical ratio) from $218 million (18.6 points on the technical ratio) in 2012 to $223 million (14.5 points on the technical ratio) in 2013. The net favorable loss development for prior accident years in 2013 and 2012 was driven by most lines of business, with the casualty line being the most pronounced. While net favorable prior year loss development increased in 2013 compared to the 2012, this had a reduced impact on the technical ratio as a result of higher net premiums earned in 2013 compared to 2012.
|
These factors driving the increase in the technical result in 2013 compared to 2012 were partially offset by:
|
•
|
The current accident year technical result, adjusted for large catastrophic losses and large losses
— a decrease in the technical result (and corresponding increase in the technical ratio) primarily due to higher losses reported by a large cedant in the agriculture line of business, partially offset by normal fluctuations in profitability between periods.
|
2015
Outlook
During the January 1,
2015
renewals, the Company observed increasingly competitive markets with cedants retaining more business and terms and conditions deteriorating due to an excess supply of reinsurance capital. As a result of these factors, the expected premium volume from the Company’s January 1, 2015 renewal, excluding the agriculture premiums, modestly decreased compared to the prior year. The agriculture business remains in process, however, management expects a modest decrease in the agriculture premiums reflecting lower commodity prices. Management expects a continuation of the observed trends in competition and conditions during the remainder of 2015.
Global (Non-U.S.) P&C
The Global (Non-U.S.) P&C sub-segment is composed of short-tail business, in the form of property and proportional motor business, that represented approximately 84%, 85% and 83% of net premiums written in
2014
,
2013
and
2012
, respectively, and long-tail business, in the form of casualty and non-proportional motor business, that represented the balance of net premiums written.
88
The components of the technical result and the corresponding ratios for this sub-segment for the years ended
December 31, 2014
,
2013
and
2012
were as follows (in millions of U.S. dollars):
|
2014
|
2013
|
2012
|
|||||||||
|
Gross premiums written
|
$
|
803
|
|
$
|
818
|
|
$
|
684
|
|
||
|
Net premiums written
|
794
|
|
811
|
|
681
|
|
|||||
|
Net premiums earned
|
$
|
768
|
|
$
|
743
|
|
$
|
678
|
|
||
|
Losses and loss expenses
|
(438
|
)
|
(373
|
)
|
(415
|
)
|
|||||
|
Acquisition costs
|
(222
|
)
|
(196
|
)
|
(167
|
)
|
|||||
|
Technical result
|
$
|
108
|
|
$
|
174
|
|
$
|
96
|
|
||
|
Loss ratio
|
57.0
|
%
|
50.2
|
%
|
61.3
|
%
|
|||||
|
Acquisition ratio
|
28.9
|
|
26.4
|
|
24.6
|
|
|||||
|
Technical ratio
|
85.9
|
%
|
76.6
|
%
|
85.9
|
%
|
|||||
Premiums
The Global (Non-U.S.) P&C sub-segment represented
14%
, 15% and 15% of total net premiums written in
2014
,
2013
and
2012
, respectively. The net premiums written and net premiums earned by line of business for this sub-segment for the years ended
December 31, 2014
,
2013
and
2012
were as follows (in millions of U.S. dollars):
|
|
2014
|
2013
|
2012
|
||||||||||||||||||||||||||||||||||||||
|
|
Net premiums
written |
Net premiums
earned |
Net premiums
written |
Net premiums
earned |
Net premiums
written |
Net premiums
earned |
|||||||||||||||||||||||||||||||||||
|
Casualty
|
$
|
68
|
|
8
|
%
|
$
|
70
|
|
9
|
%
|
$
|
74
|
|
9
|
%
|
$
|
75
|
|
10
|
%
|
$
|
75
|
|
11
|
%
|
$
|
74
|
|
11
|
%
|
|||||||||||
|
Motor
|
316
|
|
40
|
|
307
|
|
40
|
|
304
|
|
37
|
|
238
|
|
32
|
|
187
|
|
28
|
|
164
|
|
24
|
|
|||||||||||||||||
|
Property
|
410
|
|
52
|
|
391
|
|
51
|
|
433
|
|
54
|
|
430
|
|
58
|
|
419
|
|
61
|
|
440
|
|
65
|
|
|||||||||||||||||
|
Total
|
$
|
794
|
|
100
|
%
|
$
|
768
|
|
100
|
%
|
$
|
811
|
|
100
|
%
|
$
|
743
|
|
100
|
%
|
$
|
681
|
|
100
|
%
|
$
|
678
|
|
100
|
%
|
|||||||||||
Business reported in this sub-segment is, to a significant extent, originally denominated in foreign currencies and is reported in U.S. dollars. The U.S. dollar can fluctuate significantly against other currencies and this should be considered when making year to year comparisons. The effect of foreign exchange fluctuations, described in the Results of Operations above, on gross and net premiums written and net premiums earned in
2014
compared to
2013
and in
2013
compared to
2012
was as follows:
|
2014 compared to 2013
|
Gross premiums
written
|
Net premiums
written
|
Net premiums
earned
|
||||||
|
(Decrease) increase in original currency
|
(2
|
)%
|
(2
|
)%
|
4
|
%
|
|||
|
Foreign exchange effect
|
—
|
|
—
|
|
(1
|
)
|
|||
|
(Decrease) increase as reported in U.S. dollars
|
(2
|
)%
|
(2
|
)%
|
3
|
%
|
|||
|
2013 compared to 2012
|
|||||||||
|
Increase in original currency
|
20
|
%
|
19
|
%
|
9
|
%
|
|||
|
Foreign exchange effect
|
—
|
|
—
|
|
1
|
|
|||
|
Increase as reported in U.S. dollars
|
20
|
%
|
19
|
%
|
10
|
%
|
|||
2014 compared to 2013
Gross and net premiums written decreased by
2%
and net premiums earned increased by
4%
on a constant foreign exchange basis in
2014
compared to
2013
. The decreases in gross and net premiums written resulted primarily from cancellations due to pricing, increased retentions and share decreases in the property line of business, which were partially offset by new business written in the motor line of business. The increase in net premiums earned compared to the decreases in gross and net premiums written was primarily driven by the earning of the new motor business that was written on a proportional basis in 2013. Notwithstanding the continued competitive conditions in most markets, the Company was able to write business that met its portfolio objectives.
89
2013 compared to 2012
Gross and net premiums written and net premiums earned increased by 20%, 19% and 9% on a constant foreign exchange basis, respectively, in 2013 compared to 2012. The increases in gross and net premiums written and net premiums earned resulted primarily from new motor business. The increase in net premiums earned was lower than the increases in gross and net premiums written as the new motor business in 2013 was written on a proportional basis and is yet to be fully reflected in net premiums earned.
Technical result and technical ratio
The components of the technical result and ratio for this sub-segment for the years ended
December 31, 2014
,
2013
and
2012
were as follows (in millions of U.S. dollars):
|
|
2014
|
2013
|
2012
|
|||||||||||||||||
|
Current accident year technical result and ratio
|
||||||||||||||||||||
|
Adjusted for large catastrophic losses
|
$
|
(26
|
)
|
103.4
|
%
|
$
|
5
|
|
99.3
|
%
|
$
|
(16
|
)
|
102.5
|
%
|
|||||
|
Large catastrophic losses
(1)
|
—
|
|
—
|
|
(11
|
)
|
1.5
|
|
(2
|
)
|
0.3
|
|
||||||||
|
Prior accident years technical result and ratio
|
||||||||||||||||||||
|
Net favorable prior year loss development
|
134
|
|
(17.5
|
)
|
180
|
|
(24.2
|
)
|
114
|
|
(16.9
|
)
|
||||||||
|
Technical result and ratio, as reported
|
$
|
108
|
|
85.9
|
%
|
$
|
174
|
|
76.6
|
%
|
$
|
96
|
|
85.9
|
%
|
|||||
|
(1)
|
Large catastrophic losses are shown net of any related reinsurance, reinstatement premiums and profit commissions
.
|
2014 compared to 2013
The decrease of $
66 million
in the technical result (and the corresponding increase of
9.3
points in the technical ratio) in
2014
compared to
2013
was primarily attributable to:
|
•
|
Net favorable prior year loss development
— a decrease of $
46 million
(increase of
6.7
points in the technical ratio) from $
180 million
(
24.2
points on the technical ratio) in
2013
to $
134 million
(
17.5
points on the technical ratio) in
2014
. The net favorable loss development for prior accident years in
2014
was driven by all lines of business, with the property line being the most pronounced. The net favorable loss development for prior accident years in
2013
is described below.
|
|
•
|
The current accident year technical result, adjusted for large catastrophic losses
— a decline in the technical result (and a corresponding increase in the technical ratio) mainly due to an increase in the acquisition cost ratio and lower upward premium adjustments, partially offset by normal fluctuations in profitability between periods. The increase in the acquisition cost ratio was driven by favorable adjustments recorded in the property and casualty lines of business in 2013 and higher ceding commissions recorded due to the competitive market conditions in 2014.
|
These factors driving the decrease in the technical result in
2014
compared to
2013
were partially offset by:
|
•
|
Large catastrophic losses
— a decrease of $11 million (decrease of 1.5 points in the technical ratio) related to the European Floods and German Hailstorm in
2013
compared to no significant catastrophic losses in
2014
.
|
2013 compared to 2012
The increase of $78 million in the technical result (and the corresponding decrease of 9.3 points in the technical ratio) in 2013 compared to 2012 was primarily attributable to:
|
•
|
Net favorable prior year loss development
— an increase of $66 million (decrease of 7.3 points in the technical ratio) from $114 million (16.9 points on the technical ratio) in 2012 to $180 million (24.2 points on the technical ratio) in 2013. The net favorable loss development for prior accident years in 2013 was driven by all lines of business, with the property line being the most pronounced, and included favorable loss emergence related to certain catastrophic and large loss events. The net favorable loss development for prior accident years in 2012 was driven by all lines of business, with the property line being the most pronounced.
|
|
•
|
The current accident year technical result, adjusted for large catastrophic losses
— an increase in the technical result (and a corresponding decrease in the technical ratio) due to higher upward premium adjustments reported by cedants in 2013 compared to 2012, modestly lower level of mid-sized loss activity and lower loss picks in certain lines of business, partially offset by a higher acquisition cost ratio.
|
These factors driving the increase in the technical result in 2013 compared to 2012 were partially offset by:
90
|
•
|
Large catastrophic losses
— an increase of $9 million (increase of 1.2 points in the technical ratio) from $2 million (0.3 points on the technical ratio) related to Superstorm Sandy in 2012 to $11 million (1.5 points on the technical ratio) in 2013 related to the European Floods and German Hailstorm.
|
2015
Outlook
During the January 1,
2015
renewals, the Company observed challenging market conditions primarily driven by increased competition, increased retentions by cedants and reduced pricing in most markets. Overall, and despite these conditions, the expected premium volume from the Company’s January 1, 2015 renewal, at constant foreign exchange rates, increased modestly compared to the prior year renewal as a result of certain new business opportunities in high growth markets. Management expects a continuation of the observed trends in competition, retentions and pricing during the remainder of 2015.
Global Specialty
The Global Specialty sub-segment is primarily comprised of lines of business that are considered to be either short, medium or long-tail. The short-tail lines consist of agriculture, energy and specialty property. Aviation/space, credit/surety, engineering, marine and multiline are considered to have a medium tail, while specialty casualty is considered to be long-tail.
The components of the technical result and the corresponding ratios for this sub-segment for the years ended
December 31, 2014
,
2013
and
2012
were as follows (in millions of U.S. dollars):
|
2014
|
2013
|
2012
|
|||||||||
|
Gross premiums written
|
$
|
1,797
|
|
$
|
1,676
|
|
$
|
1,505
|
|
||
|
Net premiums written
|
1,696
|
|
1,579
|
|
1,415
|
|
|||||
|
Net premiums earned
|
$
|
1,638
|
|
$
|
1,506
|
|
$
|
1,373
|
|
||
|
Losses and loss expenses
|
(963
|
)
|
(920
|
)
|
(821
|
)
|
|||||
|
Acquisition costs
|
(400
|
)
|
(362
|
)
|
(321
|
)
|
|||||
|
Technical result
|
$
|
275
|
|
$
|
224
|
|
$
|
231
|
|
||
|
Loss ratio
|
58.8
|
%
|
61.1
|
%
|
59.8
|
%
|
|||||
|
Acquisition ratio
|
24.4
|
|
24.0
|
|
23.4
|
|
|||||
|
Technical ratio
|
83.2
|
%
|
85.1
|
%
|
83.2
|
%
|
|||||
Premiums
The Global Specialty sub-segment represented
30%
, 29% and 31% of total net premiums written in
2014
,
2013
and
2012
, respectively. The net premiums written and net premiums earned by line of business for this sub-segment for the years ended
December 31, 2014
,
2013
and
2012
were as follows (in millions of U.S. dollars):
|
|
2014
|
2013
|
2012
|
||||||||||||||||||||||||||||||||||||||
|
|
Net premiums
written |
Net premiums
earned |
Net premiums
written |
Net premiums
earned |
Net premiums
written |
Net premiums
earned |
|||||||||||||||||||||||||||||||||||
|
Agriculture
|
$
|
213
|
|
13
|
%
|
$
|
203
|
|
12
|
%
|
$
|
138
|
|
9
|
%
|
$
|
130
|
|
9
|
%
|
$
|
80
|
|
6
|
%
|
$
|
81
|
|
6
|
%
|
|||||||||||
|
Aviation/
Space
|
212
|
|
13
|
|
210
|
|
13
|
|
204
|
|
13
|
|
198
|
|
13
|
|
217
|
|
15
|
|
215
|
|
15
|
|
|||||||||||||||||
|
Credit/
Surety
|
282
|
|
16
|
|
273
|
|
17
|
|
292
|
|
19
|
|
285
|
|
19
|
|
273
|
|
19
|
|
261
|
|
19
|
|
|||||||||||||||||
|
Energy
|
73
|
|
4
|
|
75
|
|
5
|
|
86
|
|
5
|
|
95
|
|
6
|
|
95
|
|
7
|
|
100
|
|
7
|
|
|||||||||||||||||
|
Engineering
|
169
|
|
10
|
|
185
|
|
11
|
|
221
|
|
14
|
|
212
|
|
14
|
|
171
|
|
12
|
|
176
|
|
13
|
|
|||||||||||||||||
|
Marine
|
284
|
|
17
|
|
292
|
|
18
|
|
306
|
|
19
|
|
299
|
|
20
|
|
313
|
|
22
|
|
298
|
|
22
|
|
|||||||||||||||||
|
Multiline
|
135
|
|
8
|
|
93
|
|
6
|
|
47
|
|
3
|
|
23
|
|
2
|
|
—
|
|
—
|
|
—
|
|
—
|
|
|||||||||||||||||
|
Specialty casualty
|
168
|
|
10
|
|
153
|
|
9
|
|
138
|
|
9
|
|
110
|
|
7
|
|
101
|
|
7
|
|
90
|
|
7
|
|
|||||||||||||||||
|
Specialty property
|
160
|
|
9
|
|
154
|
|
9
|
|
147
|
|
9
|
|
154
|
|
10
|
|
164
|
|
12
|
|
150
|
|
11
|
|
|||||||||||||||||
|
Other
|
—
|
|
—
|
|
—
|
|
—
|
|
—
|
|
—
|
|
—
|
|
—
|
|
1
|
|
—
|
|
2
|
|
—
|
|
|||||||||||||||||
|
Total
|
$
|
1,696
|
|
100
|
%
|
$
|
1,638
|
|
100
|
%
|
$
|
1,579
|
|
100
|
%
|
$
|
1,506
|
|
100
|
%
|
$
|
1,415
|
|
100
|
%
|
$
|
1,373
|
|
100
|
%
|
|||||||||||
91
Business reported in this sub-segment is, to a significant extent, originally denominated in foreign currencies and is reported in U.S. dollars. The U.S. dollar can fluctuate significantly against other currencies and this should be considered when making year to year comparisons. The effect of foreign exchange fluctuations, described in the Results of Operations above, on gross and net premiums written and net premiums earned in
2014
compared to
2013
and in
2013
compared to
2012
was as follows:
|
2014 compared to 2013
|
Gross premiums
written
|
Net premiums
written
|
Net premiums
earned
|
||||||
|
Increase in original currency
|
7
|
%
|
7
|
%
|
9
|
%
|
|||
|
Foreign exchange effect
|
—
|
|
—
|
|
—
|
|
|||
|
Increase as reported in U.S. dollars
|
7
|
%
|
7
|
%
|
9
|
%
|
|||
|
2013 compared to 2012
|
|||||||||
|
Increase in original currency
|
11
|
%
|
11
|
%
|
9
|
%
|
|||
|
Foreign exchange effect
|
—
|
|
1
|
|
1
|
|
|||
|
Increase as reported in U.S. dollars
|
11
|
%
|
12
|
%
|
10
|
%
|
|||
2014 compared to 2013
Gross and net premiums written increased by
7%
and net premiums earned increased by
9%
on a constant foreign exchange basis in
2014
compared to
2013
. The increases in gross and net premiums written and net premiums earned were primarily driven by new business written and increases in the January 1, 2014 renewal premiums in the multiline and agriculture lines of business. These increases were partially offset by the impact of lower upward prior year premium adjustments in the engineering line of business. Notwithstanding the diverse conditions prevailing in various markets within this sub-segment, the Company was able to write business that met its portfolio objectives.
2013 compared to 2012
Gross and net premiums written increased by 11% and net premiums earned increased by 9% on a constant foreign exchange basis in 2013 compared to 2012. The increases in gross and net premiums written and net premiums earned were primarily driven by new business written in the agriculture, multiline and specialty casualty lines of business and upward premium adjustments in the engineering line of business.
Technical result and technical ratio
The components of the technical result and ratio for this sub-segment for the years ended
December 31, 2014
,
2013
and
2012
were as follows (in millions of U.S. dollars):
|
|
2014
|
2013
|
2012
|
|||||||||||||||||
|
Current accident year technical result and ratio
|
||||||||||||||||||||
|
Adjusted for large catastrophic losses
|
$
|
17
|
|
98.9
|
%
|
$
|
12
|
|
99.2
|
%
|
$
|
66
|
|
95.1
|
%
|
|||||
|
Large catastrophic losses
(1)
|
—
|
|
—
|
|
(15
|
)
|
1.0
|
|
(86
|
)
|
6.3
|
|
||||||||
|
Prior accident years technical result and ratio
|
||||||||||||||||||||
|
Net favorable prior year loss development
|
258
|
|
(15.7
|
)
|
227
|
|
(15.1
|
)
|
251
|
|
(18.2
|
)
|
||||||||
|
Technical result and ratio, as reported
|
$
|
275
|
|
83.2
|
%
|
$
|
224
|
|
85.1
|
%
|
$
|
231
|
|
83.2
|
%
|
|||||
|
(1)
|
Large catastrophic losses are shown net of any related reinsurance, reinstatement premiums and profit commissions
.
|
92
2014 compared to 2013
The increase of $
51 million
in the technical result (and the corresponding decrease of
1.9
points in the technical ratio) in
2014
compared to
2013
was primarily attributable to:
|
•
|
Net favorable prior year loss development
— an increase of $
31 million
(a decrease of
0.6
points in the technical ratio) from $
227 million
(
15.1
points on the technical ratio) in
2013
to $
258 million
(
15.7
points on the technical ratio) in
2014
. The net favorable loss development for prior accident years in
2014
was driven by most lines of business, predominantly the marine, specialty property and aviation/space lines, while the credit/surety and engineering lines experienced combined adverse loss development for prior accident years of $26 million. The net favorable loss development for prior accident years in
2013
is described below.
|
|
•
|
Large catastrophic losses
— a decrease of $15 million (decrease of 1.0 points in the technical ratio) related to the Alberta Floods and European Floods in
2013
compared to no large catastrophic losses in
2014
.
|
|
•
|
The current accident year technical result, adjusted for large catastrophic losses
— a modest improvement in the technical result (and corresponding decrease in the technical ratio) primarily due to modestly higher loss picks recorded in certain lines of business in 2013, almost entirely offset by lower upward premium adjustments and normal fluctuations in profitability between periods.
|
2013 compared to 2012
The decrease of $7 million in the technical result (and the corresponding increase of 1.9 points in the technical ratio) in 2013 compared to 2012 was primarily attributable to:
|
•
|
The current accident year technical result, adjusted for large catastrophic losses
— a decrease in the technical result (and corresponding increase in the technical ratio) due to a higher level of mid-sized loss activity, a modest increase in the acquisition cost ratio due to higher commissions and normal fluctuations in profitability between periods.
|
|
•
|
Net favorable prior year loss development
— a decrease of $24 million (increase of 3.1 points in the technical ratio) from $251 million (18.2 points on the technical ratio) in 2012 to $227 million (15.1 points on the technical ratio) in 2013. The net favorable loss development for prior accident years in 2013 was driven by all lines of business, predominantly the aviation/space, marine and specialty property lines. The net favorable loss development for prior accident years in 2012 was driven by most lines of business, predominantly the specialty property, aviation/space and marine lines.
|
These factors driving the decrease in the technical result in 2013 compared to 2012 were partially offset by:
|
•
|
Large catastrophic losses
— a decrease of $71 million (decrease of 5.3 points in the technical ratio) from $86 million (6.3 points on the technical ratio) related to Superstorm Sandy in 2012 to $15 million (1.0 points on the technical ratio) related to the Alberta and European Floods in 2013.
|
2015
Outlook
During the January 1,
2015
renewals, the Company generally observed continued competitive conditions across all markets, with increased retentions and pressure on pricing and terms due to an excess supply of reinsurance capital. As a result of these factors and limited new business or growth opportunities, the expected premium volume from the Company’s January 1, 2015 renewal, at constant foreign exchange rates, decreased compared to the prior year renewal. Management expects a continuation of the observed trends in competition, pricing, terms and retentions during the remainder of 2015.
Catastrophe
The Catastrophe sub-segment writes business predominantly on a non-proportional basis and is exposed to volatility from catastrophic losses, as demonstrated by the sub-segment results for
2014
,
2013
and
2012
, and, as a result, profitability in any one year is not necessarily predictive of future profitability. While the results for
2014
included no significant catastrophic losses, the results for 2013 included a modest level of large catastrophic losses resulting from the German Hailstorm, European Floods and Alberta Floods and the results for 2012 included a modest level of large catastrophic losses resulting from Superstorm Sandy.
The Catastrophe sub-segment results are presented before the inter-company quota share of a diversified portfolio of catastrophe treaties to the Company’s fully collateralized reinsurance vehicle, Lorenz Re Ltd. (see Note 13 to the Consolidated Financial Statements included in Item 8 of Part II of this report).
93
The components of the technical result and the corresponding ratios for this sub-segment for the years ended
December 31, 2014
,
2013
and
2012
were as follows (in millions of U.S. dollars):
|
2014
|
|
2013
|
2012
|
||||||||
|
Gross premiums written
|
$
|
425
|
|
$
|
495
|
|
$
|
500
|
|
||
|
Net premiums written
|
380
|
|
450
|
|
453
|
|
|||||
|
Net premiums earned
|
$
|
384
|
|
$
|
453
|
|
$
|
457
|
|
||
|
Losses and loss expenses
|
(62
|
)
|
(132
|
)
|
(103
|
)
|
|||||
|
Acquisition costs
|
(42
|
)
|
(44
|
)
|
(42
|
)
|
|||||
|
Technical result
|
$
|
280
|
|
$
|
277
|
|
$
|
312
|
|
||
|
Loss ratio
|
16.1
|
%
|
29.0
|
%
|
22.4
|
%
|
|||||
|
Acquisition ratio
|
11.0
|
|
9.7
|
|
9.3
|
|
|||||
|
Technical ratio
|
27.1
|
%
|
38.7
|
%
|
31.7
|
%
|
|||||
Premiums
The Catastrophe sub-segment represented 6%, 8% and 10% of total net premiums written in
2014
,
2013
and
2012
, respectively. Business reported in this sub-segment is, to an extent, originally denominated in foreign currencies and is reported in U.S. dollars. The U.S. dollar can fluctuate significantly against other currencies and this should be considered when making year to year comparisons. The effect of foreign exchange fluctuations, described in the Results of Operations above, on gross and net premiums written and net premiums earned in
2014
compared to
2013
and in
2013
compared to
2012
was as follows:
|
2014 compared to 2013
|
Gross premiums
written
|
Net premiums
written
|
Net premiums
earned
|
||||||
|
Decrease in original currency
|
(13
|
)%
|
(15
|
)%
|
(14
|
)%
|
|||
|
Foreign exchange effect
|
(1
|
)
|
—
|
|
(1
|
)
|
|||
|
Decrease as reported in U.S. dollars
|
(14
|
)%
|
(15
|
)%
|
(15
|
)%
|
|||
|
2013 compared to 2012
|
|||||||||
|
Increase in original currency
|
1
|
%
|
1
|
%
|
1
|
%
|
|||
|
Foreign exchange effect
|
(2
|
)
|
(2
|
)
|
(2
|
)
|
|||
|
Decrease as reported in U.S. dollars
|
(1
|
)%
|
(1
|
)%
|
(1
|
)%
|
|||
2014 compared to 2013
Gross and net premiums written and net premiums earned decreased by
13%
,
15%
and
14%
on a constant foreign exchange basis, respectively, in
2014
compared to
2013
. The decreases in gross and net premiums written and net premiums earned were primarily driven by cancellations due to reduced pricing, non-renewals, share decreases and the impact of the reinstatement premiums related to the European Floods and Alberta Floods in 2013. These decreases were partially offset by new business written.
2013 compared to 2012
Gross and net premiums written and net premiums earned increased modestly by 1% on a constant foreign exchange basis in 2013 compared to 2012. The increases in gross and net premiums written and net premiums earned were primarily due to certain new business written and were partially offset by cancellations and non-renewals.
94
Technical result and technical ratio
The components of the technical result and ratio for this sub-segment for the years ended
December 31, 2014
,
2013
and
2012
were as follows (in millions of U.S. dollars):
|
|
2014
|
2013
|
2012
|
|||||||||||||||||
|
Current accident year technical result and ratio
|
||||||||||||||||||||
|
Adjusted for large catastrophic losses
|
$
|
263
|
|
31.6
|
%
|
$
|
288
|
|
33.8
|
%
|
$
|
338
|
|
23.9
|
%
|
|||||
|
Large catastrophic losses
(1)
|
—
|
|
—
|
|
(102
|
)
|
25.0
|
|
(71
|
)
|
17.6
|
|
||||||||
|
Prior accident years technical result and ratio
|
||||||||||||||||||||
|
Net favorable prior year loss development
|
17
|
|
(4.5
|
)
|
91
|
|
(20.1
|
)
|
45
|
|
(9.8
|
)
|
||||||||
|
Technical result and ratio, as reported
|
$
|
280
|
|
27.1
|
%
|
$
|
277
|
|
38.7
|
%
|
$
|
312
|
|
31.7
|
%
|
|||||
|
(1)
|
Large catastrophic losses are shown net of any related reinsurance, reinstatement premiums and profit commissions
.
|
2014 compared to 2013
The modest increase of $
3 million
in the technical result (a decrease of
11.6
points in the technical ratio) in
2014
compared to
2013
was primarily attributable to:
|
•
|
Large catastrophic losses
— a decrease of $102 million (decrease of 25.0 points in the technical ratio) related the German Hailstorm, European Floods and Alberta Floods in
2013
compared to no significant catastrophic losses in
2014
.
|
This factor driving the increase in the technical result in
2014
compared to
2013
was partially offset by:
|
•
|
Net favorable prior year loss development
— a decrease of $
74 million
(increase of
15.6
points on the technical ratio) from $
91 million
(
20.1
points on the technical ratio) in
2013
to $
17 million
(
4.5
points on the technical ratio) in
2014
. The net favorable loss development for prior accident years in
2014
was primarily due to favorable loss emergence, and was partially offset by the adverse development related to the New Zealand Earthquakes of $71 million in 2014 as described in Critical Accounting Policies and Estimates—Losses and Loss Expenses and Life Policy Benefits—Losses and Loss Expenses above. The net favorable loss development for prior accident years in
2013
is described below.
|
|
•
|
The current accident year technical result, adjusted for large catastrophic losses
— a decrease in the technical result primarily due to the impact of lower net premiums earned in
2014
compared to
2013
, partially offset by a lower level of mid-sized loss activity.
|
2013 compared to 2012
The decrease of $35 million in the technical result (and the corresponding increase of 7.0 points in the technical ratio) in 2013 compared to 2012 was primarily attributable to:
|
•
|
The current accident year technical result, adjusted for large catastrophic losses
— a decrease in the technical result (and corresponding increase in the technical ratio) primarily due to a higher level of mid-sized loss activity and normal fluctuations in profitability between periods.
|
|
•
|
Large catastrophic losses
— an increase of $31 million (increase of 7.4 points in the technical ratio) from $71 million (17.6 points on the technical ratio) related to Superstorm Sandy in 2012 to $102 million (25.0 points on the technical ratio) related to the German Hailstorm, European Floods and Alberta Floods in 2013.
|
These factors driving the decrease in the technical result in 2013 compared to 2012 were partially offset by:
|
•
|
Net favorable prior year loss development
— an increase of $46 million (decrease of 10.3 points in the technical ratio) from $45 million (9.8 points on the technical ratio) in 2012 to $91 million (20.1 points on the technical ratio) in 2013. The net favorable loss development for prior accident years in 2013 and 2012 was primarily due to favorable loss emergence.
|
2015
Outlook
During the January 1,
2015
renewals, the Company continued to observe a challenging and competitive market environment with further deterioration in pricing and pressure on terms and conditions in most markets driven by excess reinsurance capacity. The expected premium volume from the Company’s January 1, 2015 renewal, at constant foreign exchange rates, decreased modestly compared to the prior year renewal primarily due to cancellations and non-renewals as a result of deteriorations in pricing
95
and overall market conditions, which was partially offset by new business opportunities. Management expects a continuation of these trends for the remainder of 2015.
Life and Health Segment
The Company’s Life and Health segment includes the mortality, longevity and health lines of business written primarily in the U.K., Ireland and France and, following the acquisition of PartnerRe Health on December 31, 2012, accident and health business written in the U.S.
At the time of the acquisition, PartnerRe Health operated as an MGA, writing all of its business on behalf of third-party insurance companies and earning a fee for producing the business, as well as participating in a portion of the original business that was ceded to PartnerRe Health by these third parties based on quota share agreements. During 2013, the Company obtained the necessary licenses and approvals and began transitioning the portfolio to PartnerRe carriers. As of January 1, 2014, virtually all of the PartnerRe Health business is originated directly, without the use of third-party insurance companies. As a result, this transition affects the year over year comparability with increased gross and net premiums written, net premiums earned, losses and loss expenses and acquisition costs, and reduced MGA fee income, which is recorded in Other income, in
2014
compared to
2013
.
The components of the allocated underwriting result for this segment for the years ended
December 31, 2014
,
2013
and
2012
were as follows (in millions of U.S. dollars):
|
2014
|
2013
|
2012
|
|||||||||
|
Gross premiums written
|
$
|
1,265
|
|
$
|
972
|
|
$
|
802
|
|
||
|
Net premiums written
|
1,220
|
|
964
|
|
799
|
|
|||||
|
Net premiums earned
|
$
|
1,222
|
|
$
|
957
|
|
$
|
795
|
|
||
|
Losses and loss expenses and life policy benefits
|
(1,000
|
)
|
(760
|
)
|
(647
|
)
|
|||||
|
Acquisition costs
|
(149
|
)
|
(125
|
)
|
(116
|
)
|
|||||
|
Technical result
|
$
|
73
|
|
$
|
72
|
|
$
|
32
|
|
||
|
Other income
|
8
|
|
11
|
|
4
|
|
|||||
|
Other expenses
|
(68
|
)
|
(71
|
)
|
(52
|
)
|
|||||
|
Net investment income
|
60
|
|
61
|
|
64
|
|
|||||
|
Allocated underwriting result
(1)
|
$
|
73
|
|
$
|
73
|
|
$
|
48
|
|
||
(1) Allocated underwriting result is defined as net premiums earned, other income or loss and allocated net investment income less losses and loss expenses and life policy benefits, acquisition costs and other expenses.
Premiums
The Life and Health segment represented
21%
, 18% and 17% of total net premiums written in
2014
,
2013
and
2012
, respectively. The net premiums written and net premiums earned by line of business for this segment for the years ended
December 31, 2014
,
2013
and
2012
were as follows (in millions of U.S. dollars):
|
|
2014
|
2013
|
2012
|
||||||||||||||||||||||||||||||||||||||
|
|
Net premiums
written |
Net premiums
earned |
Net premiums
written |
Net premiums
earned |
Net premiums
written |
Net premiums
earned |
|||||||||||||||||||||||||||||||||||
|
Accident and Health
|
$
|
285
|
|
23
|
%
|
$
|
284
|
|
23
|
%
|
$
|
141
|
|
15
|
%
|
$
|
140
|
|
15
|
%
|
$
|
21
|
|
3
|
%
|
$
|
20
|
|
3
|
%
|
|||||||||||
|
Longevity
|
299
|
|
25
|
|
299
|
|
25
|
|
249
|
|
26
|
|
249
|
|
26
|
|
247
|
|
31
|
|
247
|
|
31
|
|
|||||||||||||||||
|
Mortality
|
636
|
|
52
|
|
639
|
|
52
|
|
574
|
|
59
|
|
568
|
|
59
|
|
531
|
|
66
|
|
528
|
|
66
|
|
|||||||||||||||||
|
Total
|
$
|
1,220
|
|
100
|
%
|
$
|
1,222
|
|
100
|
%
|
$
|
964
|
|
100
|
%
|
$
|
957
|
|
100
|
%
|
$
|
799
|
|
100
|
%
|
$
|
795
|
|
100
|
%
|
|||||||||||
Business reported in this segment is, to a significant extent, originally denominated in foreign currencies and is reported in U.S. dollars. The U.S. dollar can fluctuate significantly against other currencies and this should be considered when making year to year comparisons. The effect of foreign exchange fluctuations, described in the Results of Operations above, on gross and net premiums written and net premiums earned in
2014
compared to
2013
and in
2013
compared to
2012
was as follows:
96
|
2014 compared to 2013
|
Gross premiums
written
|
Net premiums
written
|
Net premiums
earned
|
||||||
|
Increase in original currency
|
28
|
%
|
24
|
%
|
25
|
%
|
|||
|
Foreign exchange effect
|
2
|
|
3
|
|
3
|
|
|||
|
Increase as reported in U.S. dollars
|
30
|
%
|
27
|
%
|
28
|
%
|
|||
|
2013 compared to 2012
|
|||||||||
|
Increase in original currency
|
21
|
%
|
20
|
%
|
20
|
%
|
|||
|
Foreign exchange effect
|
—
|
|
1
|
|
—
|
|
|||
|
Increase as reported in U.S. dollars
|
21
|
%
|
21
|
%
|
20
|
%
|
|||
2014 compared to 2013
Gross and net premiums written and net premiums earned increased by
28%
,
24%
and
25%
on a constant foreign exchange basis, respectively, in
2014
compared to
2013
. The increases in gross and net premiums written and net premiums earned were driven by PartnerRe Health's accident and health business and, to a lesser extent, new business written in the mortality and longevity lines. The increase in the accident and health line was primarily driven by PartnerRe Health’s transition from an MGA to a carrier, as described above, and new opportunities arising from the implementation of the Healthcare Act in the U.S. in 2014.
2013 compared to 2012
Gross premiums written increased by 21% and net premiums written and earned increased by 20% on a constant foreign exchange basis in 2013 compared to 2012. The increases in gross and net premiums written and net premiums earned were primarily due to the inclusion of PartnerRe Health’s accident and health business in 2013 and, to a lesser extent, growth in the mortality line of business.
Allocated underwriting result
2014 compared to 2013
The allocated underwriting result of $
73 million
in 2014 was comparable to
2013
as a result of increased profitability generated from the PartnerRe Health business due to the transition from an MGA to a carrier, as described above, being offset by a lower level of net favorable prior year loss development from the mortality and longevity lines of business.
The decrease in net favorable prior year loss development of
$20 million
resulted from net favorable loss development of $
19 million
in
2014
compared to $
39 million
in
2013
and was almost entirely driven by a lower level of favorable development from the GMDB business. The net favorable prior year loss development of $
19 million
in
2014
was primarily related to the GMDB business, PartnerRe Health and certain short-term treaties in the mortality line. The net favorable loss development for prior accident years in
2013
is described below.
2013 compared to 2012
The allocated underwriting result increased by $25 million, from $48 million in 2012 to $73 million in 2013. The increase was primarily driven by a higher level of net favorable prior year loss development in 2013 compared to 2012, the inclusion of PartnerRe Health’s results and an increase in other income. These factors driving the increase in the allocated underwriting result were partially offset by higher other expenses.
The increase in net favorable prior year loss development of $25 million reflects net favorable loss development of $39 million in 2013 compared to $14 million in 2012. The net favorable prior year loss development of $39 million in 2013 was primarily related to the GMDB business and, to a lesser extent, certain short-term treaties in the mortality line of business. The favorable development was primarily due to favorable claims experience, data updates received from cedants and improvements in the capital markets related to the GMDB business. The net favorable prior year loss development in 2012 was primarily due to the GMDB business, mainly driven by improvements in the capital markets, and certain short-term treaties in the mortality line.
Other income increased by $7 million, from $4 million in 2012 to $11 million in 2013 primarily due to the inclusion of the MGA fees earned by PartnerRe Health.
Other expenses increased by $19 million, from $52 million in 2012 to $71 million in 2013 primarily due to the inclusion of PartnerRe Health’s other expenses and higher bonus accruals. The overall impact on the allocated underwriting result of including PartnerRe Health’s other expenses was partially offset by the MGA fees earned by PartnerRe Health, which are included in other income.
97
2015
Outlook
PartnerRe Health's business is expected to continue contributing to overall premium growth in the Life and Health segment in 2015. At the January 1, 2015 renewals, the expected premium volume, at constant foreign exchange rates, increased compared to the prior year renewal despite increased competition. Growth originated primarily from employer markets and reinsurance products that support the Healthcare Act.
In terms of the Company's Life portfolio, the majority of the premium arises from long-term in-force contracts. The active January 1 renewals only impact the short-term in-force premium in the mortality line, which is a relatively limited portion of the Life portfolio. For those treaties that actively renewed, pricing conditions and terms were under moderate pressure compared to the January 1, 2014 renewals. Management expects moderate continued growth in the Company’s Life portfolio in 2015, assuming constant foreign exchange rates.
Premium Distribution by Line of Business
The distribution of net premiums written by line of business for the years ended
December 31, 2014
,
2013
and
2012
was as follows:
|
2014
|
2013
|
2012
|
||||||
|
Non-life
|
||||||||
|
Property and casualty
|
||||||||
|
Casualty
|
12
|
%
|
12
|
%
|
13
|
%
|
||
|
Motor
|
7
|
|
7
|
|
5
|
|
||
|
Multiline and other
|
5
|
|
4
|
|
3
|
|
||
|
Property
|
11
|
|
12
|
|
14
|
|
||
|
Specialty
|
||||||||
|
Agriculture
|
12
|
|
11
|
|
7
|
|
||
|
Aviation / Space
|
4
|
|
4
|
|
5
|
|
||
|
Catastrophe
|
6
|
|
8
|
|
10
|
|
||
|
Credit / Surety
|
7
|
|
6
|
|
7
|
|
||
|
Energy
|
1
|
|
2
|
|
2
|
|
||
|
Engineering
|
3
|
|
4
|
|
4
|
|
||
|
Marine
|
5
|
|
6
|
|
7
|
|
||
|
Specialty casualty
|
3
|
|
3
|
|
2
|
|
||
|
Specialty property
|
3
|
|
3
|
|
4
|
|
||
|
Life and Health
|
21
|
|
18
|
|
17
|
|
||
|
Total
|
100
|
%
|
100
|
%
|
100
|
%
|
||
The changes in the distribution of net premiums written by line of business between
2014
,
2013
and
2012
reflected the Company’s response to existing market conditions and may also be affected by the timing of renewals of treaties, a change in treaty structure, premium adjustments reported by cedants and significant increases or decreases in other lines of business. In addition, foreign exchange fluctuations affected the comparison for all lines.
|
•
|
Property: the decrease in the distribution of net premiums written in
2014
compared to
2013
and 2012 was primarily due to
cancellations due to pricing, increased retentions and share decreases in the property line of the Company's Global (Non-U.S.) P&C sub-segment in 2014 and by more significant increases in other lines of business relative to the absolute increase in property premiums in 2013.
|
|
•
|
Agriculture: the increase in the distribution of net premiums written in
2014
compared to
2013
was due to new business written in the Global Specialty sub-segment. The increase in the distribution in
2013
compared to
2012
was due to new business written in the North America and, to a lesser extent, Global Specialty sub-segments.
|
|
•
|
Catastrophe: the decrease in the distribution of net premiums written in
2014
compared to
2013
was primarily driven by cancellations due to pricing, non-renewals and share decreases, as described in the Catastrophe sub-segment above. The decrease in the distribution of net premiums written in 2013 compared to 2012 was primarily driven by more significant increases in other lines of business relative to catastrophe premiums which were essentially flat.
|
|
•
|
Life and Health: the increase in the distribution of net premiums written in
2014
compared to
2013
and 2012 was driven primarily by PartnerRe Health’s business and, to a lesser extent, new business in the mortality and longevity lines of business, as described in the Life and Health segment above.
|
98
2015
Outlook
Based on information received from cedants and brokers during the January 1,
2015
renewals, and assuming that similar trends and conditions to those experienced during the January 1,
2015
renewals continue through the year, Management expects the distribution of net premiums written by line of business to be broadly comparable to
2014
. The Company writes a large majority of its business on a treaty basis and renews approximately 70% of its total annual Non-life treaty business on January 1. The remainder of the Non-life treaty business renews at other times during the year, therefore this outlook is based only on limited information related to the treaty business primarily renewing on January 1, 2015.
Premium Distribution by Reinsurance Type
The Company typically writes business on either a proportional or non-proportional basis. On proportional business, the Company shares proportionally in both the premiums and losses of the cedant. On non-proportional business, the Company is typically exposed to loss events in excess of a predetermined dollar amount or loss ratio. In both proportional and non-proportional business, the Company typically reinsures a large group of primary insurance contracts written by the ceding company. In addition, the Company writes business on a facultative basis. Facultative arrangements are generally specific to an individual risk and can be written on either a proportional or non-proportional basis. Generally, the Company has more influence over pricing, as well as terms and conditions, in non-proportional and facultative arrangements.
The distribution of gross premiums written by reinsurance type for the years ended
December 31, 2014
,
2013
and
2012
was as follows:
|
2014
|
2013
|
2012
|
||||||
|
Non-life segment
|
||||||||
|
Proportional
|
54
|
%
|
55
|
%
|
50
|
%
|
||
|
Non-proportional
|
18
|
|
20
|
|
25
|
|
||
|
Facultative
|
7
|
|
7
|
|
8
|
|
||
|
Life and Health segment
|
||||||||
|
Proportional
|
20
|
|
17
|
|
16
|
|
||
|
Non-proportional
|
1
|
|
1
|
|
1
|
|
||
|
Total
|
100
|
%
|
100
|
%
|
100
|
%
|
||
The distribution of gross premiums written by reinsurance type is affected by changes in the allocation of capacity among lines of business, the timing of receipt by the Company of cedant accounts and premium adjustments reported by cedants. In addition, foreign exchange fluctuations affected the comparison for all treaty types.
The changes in the distribution of gross premiums written by reinsurance type between
2014
and
2013
primarily reflect
an increase in gross premiums written in the Life and Health segment, driven by PartnerRe Health business written on proportional basis, and a decrease in gross premiums written in the Non-life segment on a non-proportional basis, which was primarily driven by decreases in the Catastrophe sub-segment. These factors are further discussed in the Results by Segment above.
The changes in the distribution of gross premiums written by reinsurance type between 2013 and 2012 primarily reflect a shift from non-proportional business to proportional business in the Non-life segment. This shift was driven by all Non-life sub-segments, except for the Catastrophe sub-segment, and specifically included an increase in gross premiums written in the agriculture line of business, which is predominantly written on a proportional basis. In addition, the shift was also driven by a relative decrease as a percentage of total gross premiums written, as discussed in Premium Distribution by Line of business above, in the Catastrophe sub-segment’s gross premiums written, which are predominantly written on a non-proportional basis.
2015
Outlook
Based on renewal information from cedants and brokers during the January 1,
2015
renewals, and assuming that similar trends and conditions to those experienced during the January 1,
2015
renewals continue through the year, Management expects the relative distribution of gross premiums written by reinsurance type to be broadly comparable to 2014. The Company writes a large majority of its business on a treaty basis and renews approximately 70% of its total annual Non-life treaty business on January 1. The remainder of the Non-life treaty business renews at other times during the year, therefore this outlook is based only on limited information related to the treaty business primarily renewing on January 1, 2015.
99
Premium Distribution by Geographic Region
The geographic distribution of gross premiums written based on the location of the underlying risk for the years ended
December 31, 2014
,
2013
and
2012
was as follows:
|
2014
|
2013
|
2012
|
||||||
|
Asia, Australia and New Zealand
|
11
|
%
|
11
|
%
|
11
|
%
|
||
|
Europe
|
40
|
|
40
|
|
41
|
|
||
|
Latin America, Caribbean and Africa
|
10
|
|
10
|
|
11
|
|
||
|
North America
|
39
|
|
39
|
|
37
|
|
||
|
Total
|
100
|
%
|
100
|
%
|
100
|
%
|
||
The distribution of gross premiums written in
2014
was comparable to
2013
.
The increase in the distribution of gross premiums written in North America in 2013 compared to 2012 was primarily due to an increase in gross premiums written in the Company’s North America Non-life sub-segment and in the Life and Health segment. The increase in the North America sub-segment was primarily driven by the agriculture line. The increase in the Life and Health segment was driven by the inclusion of PartnerRe Health business from January 1, 2013.
2015
Outlook
Based on information received from cedants and brokers during the January 1,
2015
renewals, and assuming that similar trends and conditions to those experienced during the January 1,
2015
renewals continue through the year, Management expects the distribution of gross premiums written by geographic region in
2015
to be broadly comparable to 2014.
Premium Distribution by Production Source
The Company generates its gross premiums written both through brokers and through direct relationships with cedants. The percentage of gross premiums written by production source for the years ended
December 31, 2014
,
2013
and
2012
was as follows:
|
2014
|
2013
|
2012
|
||||||
|
Broker
|
69
|
%
|
71
|
%
|
69
|
%
|
||
|
Direct
|
31
|
|
29
|
|
31
|
|
||
|
Total
|
100
|
%
|
100
|
%
|
100
|
%
|
||
The percentage of gross premiums written through brokers in
2014
decreased slightly compared to 2013 primarily due to an increase in business written directly in the Global Specialty sub-segment and a decrease in the catastrophe business, which is primarily written through brokers.
The percentage of gross premiums written through brokers in 2013 compared to 2012 increased slightly due to an increase in the percentage of gross premiums written through brokers in Europe and North America and the inclusion of PartnerRe Health business, which is solely written through brokers.
2015
Outlook
Based on information received from cedants and brokers during the January 1,
2015
renewals, and assuming that similar trends and conditions to those experienced during the January 1,
2015
renewals continue through the year, Management expects the production source of gross premiums written in
2015
to be comparable to
2014
.
Corporate and Other
Corporate and Other is comprised of the Company’s investment related activities, including principal finance transactions, insurance-linked securities and strategic investments, and its corporate activities, including other expenses.
100
Net Investment Income
Net investment income by asset source for the years ended
December 31, 2014
,
2013
and
2012
was as follows (in millions of U.S. dollars):
|
2014
|
2013
|
2012
|
|||||||||
|
Fixed maturities
|
$
|
444
|
|
$
|
446
|
|
$
|
513
|
|
||
|
Short-term investments, cash and cash equivalents
|
1
|
|
2
|
|
3
|
|
|||||
|
Equities
|
40
|
|
33
|
|
26
|
|
|||||
|
Funds held and other
|
33
|
|
34
|
|
44
|
|
|||||
|
Funds held – directly managed
|
14
|
|
21
|
|
29
|
|
|||||
|
Investment expenses
|
(52
|
)
|
(52
|
)
|
(44
|
)
|
|||||
|
Net investment income
|
$
|
480
|
|
$
|
484
|
|
$
|
571
|
|
||
Because of the interest-sensitive nature of some of the Company’s life products, net investment income is considered in Management’s assessment of the profitability of the Life and Health segment (see Life and Health segment above). The following discussion includes net investment income from all investment activities, including the net investment income allocated to the Life and Health segment.
2014 compared to 2013
Net investment income decreased modestly in
2014
compared to
2013
due to:
|
•
|
a decrease in net investment income from funds held – directly managed primarily related to the lower average balance in the funds held - directly managed account, which was driven by a release of assets related to the commutation of a portion the Reserve Agreement with Colisée Re, the run-off of the remaining underlying liabilities and lower reinvestment rates; and
|
|
•
|
a decrease in net investment income from fixed maturities primarily due to lower reinvestment rates, which was reduced by the impact of the increase in the U.S. Consumer Price Index on the Company's Treasury Inflation-Protected Securities portfolio and certain other favorable non-recurring items; partially offset by
|
|
•
|
an increase in net investment income from equities primarily as a result of higher dividend income.
|
2013 compared to 2012
Net investment income decreased in 2013 compared to 2012 due to:
|
•
|
a decrease in net investment income from fixed maturities primarily as a result of lower reinvestment rates and, to a lesser extent, cash outflows from the fixed maturity portfolio primarily to finance the Company’s share repurchase activity;
|
|
•
|
a decrease in net investment income from funds held and other primarily due to lower investment income reported by cedants; and
|
|
•
|
a decrease in net investment income from funds held - directly managed primarily related to the lower average balance in the funds held directly managed account, which was driven by the release of assets due to the run-off of the underlying liabilities and lower reinvestment rates; partially offset by
|
|
•
|
an increase in net investment income from equities primarily as a result of higher dividend income.
|
2015
Outlook
Assuming constant foreign exchange rates, Management expects net investment income to decrease in
2015
compared to
2014
primarily due to lower reinvestment rates with low yields expected to continue throughout
2015
. Management expects this decrease to be partially offset by expected positive cash flow from operations (including net investment income).
Net Realized and Unrealized Investment Gains (Losses)
The Company’s portfolio managers have dual investment objectives of optimizing current investment income and achieving capital appreciation. To meet these objectives, it is often desirable to buy and sell securities to take advantage of changing market conditions and to reposition the investment portfolios. Accordingly, recognition of realized gains and losses is considered by the Company to be a normal consequence of its ongoing investment management activities. In addition, the
101
Company records changes in fair value for substantially all of its investments as unrealized investment gains or losses in its Consolidated Statements of Operations. Realized and unrealized investment gains and losses are generally a function of multiple factors, with the most significant being prevailing interest rates, credit spreads and equity market conditions.
The components of net realized and unrealized investment gains (losses) for the years ended
December 31, 2014
,
2013
and
2012
were as follows (in millions of U.S. dollars):
|
2014
|
2013
|
2012
|
|||||||||
|
Net realized investment gains on fixed maturities and short-term investments
|
$
|
121
|
|
$
|
119
|
|
$
|
173
|
|
||
|
Net realized investment gains on equities
|
99
|
|
75
|
|
72
|
|
|||||
|
Net realized investment (losses) gains on other invested assets
|
(21
|
)
|
20
|
|
(16
|
)
|
|||||
|
Change in net unrealized investment (losses) gains on other invested assets
|
(58
|
)
|
57
|
|
(9
|
)
|
|||||
|
Change in net unrealized investment gains (losses) on fixed maturities and short-term investments
|
229
|
|
(526
|
)
|
186
|
|
|||||
|
Change in net unrealized investment gains on equities
|
3
|
|
118
|
|
66
|
|
|||||
|
Net other realized and unrealized investment (losses) gains
|
(4
|
)
|
(2
|
)
|
6
|
|
|||||
|
Net realized and unrealized investment gains (losses) on funds held – directly managed
|
3
|
|
(22
|
)
|
16
|
|
|||||
|
Net realized and unrealized investment gains (losses)
|
$
|
372
|
|
$
|
(161
|
)
|
$
|
494
|
|
||
2014 compared to 2013
Net realized and unrealized investment gains increased by
$533 million
, from losses of
$161 million
in
2013
to gains of
$372 million
in
2014
. The net realized and unrealized investment gains of
$372 million
in
2014
were primarily due to decreases in U.S. and European risk-free interest rates and improvements in worldwide equity markets, which were partially offset by losses on treasury note futures and widening credit spreads. Net realized and unrealized investment losses were
$161 million
in
2013
and are described below.
Net realized losses and the change in net unrealized investment losses on other invested assets were a combined loss of
$79 million
in
2014
and primarily related to treasury note futures.
2013 compared to 2012
Net realized and unrealized investment losses increased by $655 million, from a gain of $494 million in 2012 to a loss of $161 million in 2013. The net realized and unrealized investment losses of
$161 million
in
2013
were primarily due to increases in U.S. and European risk-free interest rates, which were partially offset by improvements in worldwide equity markets, gains on treasury note futures, narrowing credit spreads and an unrealized gain related to the initial public offering of an investment in a mortgage guaranty insurance company.
Net realized and unrealized investment gains were $494 million in 2012 and were primarily due to narrowing credit spreads, improvements in worldwide equity markets and decreases in U.S. and European risk-free interest rates.
Net realized and the change in net unrealized investment gains (losses) on other invested assets were a combined gain of $77 million in 2013 and a combined loss of $25 million in 2012 and were primarily related to treasury note futures.
Net realized and unrealized investment (losses) gains on funds held - directly managed of $22 million loss and $16 million gain in 2013 and 2012, respectively, primarily related to the change in net unrealized investment (losses) gains on fixed maturities in the segregated investment portfolio underlying the funds held - directly managed account and were driven by changes in risk-free interest rates.
Other Expenses
The Company’s total other expenses for the years ended
December 31, 2014
,
2013
and
2012
were as follows (in millions of U.S. dollars):
|
2014
|
2013
|
2012
|
|||||||||
|
Other expenses
|
$
|
450
|
|
$
|
500
|
|
$
|
411
|
|
||
|
Other expenses as a % of total net premiums earned (Non-life and Life and Health)
|
8.0
|
%
|
9.6
|
%
|
9.2
|
%
|
|||||
102
2014 compared to 2013
Other expenses decreased by
$50 million
, or
10%
, in
2014
compared to
2013
primarily due to the restructuring charge in
2013
, as described in Executive Overview above,
and lower personnel costs in 2014 following the restructuring.
2013 compared to 2012
Other expenses increased by $89 million, or 22%, in 2013 compared to 2012 primarily due to the restructuring charge and higher bonus accruals.
Income Taxes
The effective income tax rate, which the Company calculates as income tax expense or benefit divided by net income or loss before taxes, may fluctuate significantly from period to period depending on the geographic distribution of pre-tax net income or loss in any given period between different jurisdictions with comparatively higher tax rates and those with comparatively lower tax rates. The geographic distribution of pre-tax net income or loss can vary significantly between periods due to, but not limited to, the following factors: the business mix of net premiums written and earned, the geographic location, quantum and nature of net losses and loss expenses incurred, the quantum and geographic location of other expenses, net investment income, net realized and unrealized investment gains and losses and the quantum of specific adjustments to determine the income tax basis in each of the Company’s operating jurisdictions. In addition, a significant portion of the Company’s gross and net premiums are currently written and earned in Bermuda, a non-taxable jurisdiction, including the majority of the Company’s catastrophe business, which can result in significant volatility in the Company’s pre-tax net income or loss from period to period.
The Company’s income tax expense and effective income tax rate for the years ended
December 31, 2014
,
2013
and
2012
were as follows (in millions of U.S. dollars):
|
2014
|
2013
|
2012
|
|||||||||
|
Income tax expense
|
$
|
239
|
|
$
|
49
|
|
$
|
204
|
|
||
|
Effective income tax rate
|
18.3
|
%
|
6.7
|
%
|
15.3
|
%
|
|||||
2014 compared to 2013
Income tax expense and the effective income tax rate during
2014
were $
239 million
and
18.3%
, respectively. Income tax expense and the effective income tax rate during
2014
were primarily driven by the geographic distribution of the Company’s pre-tax net income between its various taxable and non-taxable jurisdictions. Specifically, the income tax expense and the effective income tax rate included
a relatively even distribution of the Company’s pre-tax net income between its various jurisdictions
. The Company’s pre-tax net income recorded in non-taxable jurisdictions and jurisdictions with comparatively lower tax rates was driven by net favorable prior year loss development and the absence of large catastrophic losses. The Company’s pre-tax net income recorded in jurisdictions with comparatively higher tax rates was driven by net realized and unrealized investment gains, net favorable prior year loss development and the absence of large catastrophic losses.
Income tax expense and the effective income tax rate during 2013 were $49 million and 6.7%, respectively. Income tax expense and the effective income tax rate during 2013 were primarily driven by the geographic distribution of the Company’s pre-tax net income between its various taxable and non-taxable jurisdictions. Specifically, the income tax expense and the effective income tax rate included a significant portion of the Company’s pre-tax net income recorded in non-taxable jurisdictions and jurisdictions with comparatively lower tax rates driven by net favorable prior year loss development, which were partially offset by catastrophe losses. The Company’s pre-tax net income recorded in jurisdictions with comparatively higher tax rates was driven by net favorable prior year loss development, which was partially offset by net realized and unrealized investment losses, catastrophe losses and restructuring charges. In addition, the income tax expense recorded in jurisdictions with comparatively higher tax rates included certain true-up to tax return adjustments and certain one-time charges related to changes in the French tax code.
2013 compared to 2012
Income tax expense and the effective income tax rate during 2013 were $49 million and 6.7%, respectively, as described above.
103
Income tax expense and the effective income tax rate during 2012 were $204 million and 15.3%, respectively. Income tax expense and the effective income tax rate during 2012 were primarily driven by the geographic distribution of the Company’s pre-tax net income between its various taxable and non-taxable jurisdictions. Specifically, the income tax expense and the effective income tax rate included a relatively even distribution of the Company’s pre-tax net income between its various jurisdictions. The Company’s pre-tax net income recorded in non-taxable jurisdictions and jurisdictions with comparatively lower tax rates reflects net favorable prior year loss development and net realized and unrealized investment gains, which were partially offset by catastrophe losses. The Company’s pre-tax net income recorded in jurisdictions with comparatively higher tax rates was driven by net favorable prior year loss development and net realized and unrealized investment gains, which were partially offset by catastrophe losses.
Financial Condition, Liquidity and Capital Resources
The Company purchased, as part of its acquisition of Paris Re, an investment portfolio and a funds held – directly managed account. The discussion of the acquired Paris Re investment portfolio is included in the discussion of Investments below. The discussion of the segregated investment portfolio underlying the funds held – directly managed account is included separately in Funds Held – Directly Managed below.
Investments
Investment philosophy
The Company employs a prudent investment philosophy. It maintains a high quality, well balanced and liquid portfolio having the dual objectives of optimizing current investment income and achieving capital appreciation. The Company’s invested assets are comprised of total investments, cash and cash equivalents and accrued investment income. From a risk management perspective, the Company allocates its invested assets into two categories: liability funds and capital funds.
Liability funds (including funds held - directly managed) represent invested assets supporting the net reinsurance liabilities, defined as the Company’s operating and reinsurance liabilities net of reinsurance assets, and are invested primarily in high quality fixed maturity securities. The preservation of liquidity and protection of capital are the primary investment objectives for these assets. The portfolio managers are required to adhere to investment guidelines as to minimum ratings and issuer and sector concentration limitations. Liability funds are invested in a way that generally matches them to the corresponding liabilities (referred to as asset-liability matching) in terms of both duration and major currency composition to provide the Company with a natural hedge against changes in interest and foreign exchange rates. In addition, the Company utilizes certain derivatives to further protect against changes in interest and foreign exchange rates.
Capital funds represent shareholder capital of the Company and are invested in a diversified portfolio with the objective of maximizing investment return, subject to prudent risk constraints. Capital funds contain most of the asset classes typically viewed as offering a higher risk and higher return profile, subject to risk assumption and portfolio diversification guidelines which include issuer and sector concentration limitations. Capital funds may be invested in investment grade and below investment grade fixed maturity securities, preferred and common stocks, private placement equity and bond investments, emerging markets and high-yield fixed income securities and certain other specialty asset classes. The Company believes that an allocation of a portion of its investments to equities is both prudent and desirable, as it helps to achieve broader asset diversification (lower risk) and maximizes the portfolio’s total return over time.
The Company’s total invested assets (including funds held – directly managed) at
December 31, 2014
and
2013
were split between liability and capital funds as follows (in millions of U.S. dollars):
|
|
2014
|
|
% of Total
Invested Assets
|
|
2013
|
|
% of Total
Invested Assets
|
||||||
|
Liability funds
|
$
|
9,723
|
|
56
|
%
|
$
|
10,366
|
|
59
|
%
|
|||
|
Capital funds
|
7,570
|
|
44
|
|
7,118
|
|
41
|
|
|||||
|
Total invested assets
|
$
|
17,293
|
|
100
|
%
|
$
|
17,484
|
|
100
|
%
|
|||
The decrease of $191 million in total invested assets at
December 31, 2014
compared to
December 31, 2013
was primarily related to decreases in the funds held – directly managed account (see Funds Held – Directly Managed below), with changes in the fixed maturities and equities largely offsetting each other. Further details of changes in the fixed maturity and equity portfolios are provided below.
104
The decrease in the liability funds at
December 31, 2014
compared to
December 31, 2013
was primarily related to a decrease in unpaid losses and loss expenses which was driven by an increase in losses paid and the strengthening of the U.S. dollar against most major currencies during
2014
.
The increase in the capital funds at
December 31, 2014
compared to
December 31, 2013
was primarily driven by the decrease in liability funds, as described above. At
December 31, 2014
, approximately
64%
of the capital funds were invested in cash and cash equivalents and investment grade fixed income securities.
The Company’s investment strategy allows for the use of derivative instruments, subject to strict limitations. The Company utilizes various derivative instruments such as treasury note and equity futures contracts, credit default swaps, foreign currency option contracts, foreign exchange forward contracts, total return and interest rate swaps, insurance-linked securities and TBAs for the purpose of managing and hedging currency risk, market exposure and portfolio duration, hedging certain investments, mitigating the risk associated with underwriting operations, or enhancing investment performance that would be allowed under the Company’s investment policy if implemented in other ways. The use of financial leverage, whether achieved through derivatives or margin borrowing, requires approval from the Risk and Finance Committee of the Board.
Overview
Total investments and cash and cash equivalents (excluding the funds held – directly managed account) of $
16.6 billion
at
December 31, 2014
were comparable to
December 31, 2013
due to:
|
•
|
a net decrease of
$503 million
, due to the repurchase of common shares of $
551 million
under the Company’s share repurchase program, partially offset by the issuance of common shares under the Company’s employee equity plans of
$48 million
;
|
|
•
|
dividend payments on common and preferred shares totaling $
191 million
; and
|
|
•
|
various other factors which net to approximately $662 million, the largest being the impact of foreign exchange and, to a lesser extent, the amortization of net premium on investments; almost entirely offset by
|
|
•
|
net cash provided by operating activities of
$853 million
;
|
|
•
|
net realized and unrealized investment gains of $
368 million
, primarily resulting from the fixed maturity and short-term investment portfolios of
$350 million
, driven by decreases in U.S. and European risk-free interest rates, and from the equity portfolio of $
101 million
. These factors were partially offset by net realized and unrealized losses from other invested assets of
$79 million
, primarily driven by losses on treasury note futures (see discussion related to duration below); and
|
|
•
|
an increase in net payable for securities purchased of $
103 million
.
|
Trading securities
The following discussion relates to the composition of the Company’s trading securities. The Company’s other invested assets and the investments underlying the funds held – directly managed account are discussed separately below. Trading securities are carried at fair value with changes in fair value included in net realized and unrealized investment gains and losses in the Consolidated Statements of Operations.
At
December 31, 2014
, approximately
95%
of the Company’s fixed maturity and short-term investments, which includes fixed income type mutual funds, were publicly traded and approximately
92%
were rated investment grade (BBB- or higher) by Standard & Poor’s (or estimated equivalent).
The average credit quality, the average yield to maturity and the expected average duration of the Company’s fixed maturities and short-term investments, which includes fixed income type mutual funds, at
December 31, 2014
and
2013
were as follows:
|
2014
|
2013
|
||||||
|
Average credit quality
|
A
|
|
A
|
|
|||
|
Average yield to maturity
|
2.4
|
|
%
|
2.5
|
|
%
|
|
|
Expected average duration
|
3.7
|
|
years
|
3.0
|
|
years
|
|
The average credit quality and yield to maturity of fixed maturities and short-term investments at
December 31, 2014
were comparable to
December 31, 2013
.
The expected average duration of fixed maturities and short-term investments increased to
3.7
years at
December 31, 2014
compared to
3.0
years at
December 31, 2013
, primarily due to an increase in the measured duration of the underlying reinsurance
105
liabilities due to a refinement in the methodology for calculating the duration of life liabilities and an increase in the life liabilities. For the purposes of managing portfolio duration, the Company uses exchange traded treasury note futures. The use of treasury note futures reduced the expected average duration of the investment portfolio from
4.2
years to
3.7
years at
December 31, 2014
, and reflects the Company’s decision to continue to hedge against potential further rises in risk-free interest rates.
The Company’s investment portfolio generated a total accounting return (calculated based on the carrying value of all investments in local currency) of
5.4%
in
2014
compared to 1.8% in
2013
. The total accounting return in
2014
was primarily due to decreases in U.S. and European risk-free interest rates and improvements in worldwide equity markets, while
2013
was primarily impacted by improvements in equity markets and narrowing credit spreads which were partially offset by increases in U.S. and European risk-free interest rates.
The cost, fair value and credit ratings of the Company’s fixed maturities, short-term investments and equities classified as trading at
December 31, 2014
were as follows (in millions of U.S. dollars):
|
|
|
|
Credit Rating
(2)
|
|||||||||||||||||||||||||
|
December 31, 2014
|
Cost
(1)
|
Fair
Value
|
AAA
|
AA
|
A
|
BBB
|
Below
investment
grade/
Unrated
|
|||||||||||||||||||||
|
Fixed maturities
|
||||||||||||||||||||||||||||
|
U.S. government
|
$
|
2,270
|
|
$
|
2,277
|
|
$
|
—
|
|
$
|
2,277
|
|
$
|
—
|
|
$
|
—
|
|
$
|
—
|
|
|||||||
|
U.S. government sponsored enterprises
|
38
|
|
39
|
|
—
|
|
39
|
|
—
|
|
—
|
|
—
|
|
||||||||||||||
|
U.S. states, territories and municipalities
|
511
|
|
531
|
|
83
|
|
266
|
|
—
|
|
—
|
|
182
|
|
||||||||||||||
|
Non-U.S. sovereign government, supranational and government related
|
1,867
|
|
1,976
|
|
626
|
|
1,082
|
|
173
|
|
73
|
|
22
|
|
||||||||||||||
|
Corporate
|
5,363
|
|
5,604
|
|
218
|
|
510
|
|
2,277
|
|
2,141
|
|
458
|
|
||||||||||||||
|
Asset-backed securities
|
1,110
|
|
1,131
|
|
264
|
|
205
|
|
161
|
|
14
|
|
487
|
|
||||||||||||||
|
Residential mortgage-backed securities
|
2,276
|
|
2,306
|
|
298
|
|
1,940
|
|
53
|
|
—
|
|
15
|
|
||||||||||||||
|
Other mortgage-backed securities
|
54
|
|
55
|
|
16
|
|
18
|
|
19
|
|
—
|
|
2
|
|
||||||||||||||
|
Fixed maturities
|
13,489
|
|
13,919
|
|
1,505
|
|
6,337
|
|
2,683
|
|
2,228
|
|
1,166
|
|
||||||||||||||
|
Short-term investments
|
26
|
|
25
|
|
1
|
|
20
|
|
—
|
|
4
|
|
—
|
|
||||||||||||||
|
Total fixed maturities and short-term investments
|
13,515
|
|
13,944
|
|
$
|
1,506
|
|
$
|
6,357
|
|
$
|
2,683
|
|
$
|
2,232
|
|
$
|
1,166
|
|
|||||||||
|
Equities
|
844
|
|
1,057
|
|
||||||||||||||||||||||||
|
Total
|
$
|
14,359
|
|
$
|
15,001
|
|
||||||||||||||||||||||
|
% of Total fixed maturities and short-term investments
|
11
|
%
|
46
|
%
|
19
|
%
|
16
|
%
|
8
|
%
|
||||||||||||||||||
106
|
|
|
|
Credit Rating
(2)
|
|||||||||||||||||||||||||
|
December 31, 2013
|
Cost
(1)
|
Fair
Value
|
AAA
|
AA
|
A
|
BBB
|
Below
investment
grade/
Unrated
|
|||||||||||||||||||||
|
Fixed maturities
|
||||||||||||||||||||||||||||
|
U.S. government
|
$
|
1,610
|
|
$
|
1,599
|
|
$
|
—
|
|
$
|
1,599
|
|
$
|
—
|
|
$
|
—
|
|
$
|
—
|
|
|||||||
|
U.S. government sponsored enterprises
|
25
|
|
25
|
|
—
|
|
25
|
|
—
|
|
—
|
|
—
|
|
||||||||||||||
|
U.S. states, territories and municipalities
|
122
|
|
124
|
|
7
|
|
6
|
|
—
|
|
3
|
|
108
|
|
||||||||||||||
|
Non-U.S. sovereign government, supranational and government related
|
2,295
|
|
2,354
|
|
950
|
|
1,295
|
|
99
|
|
10
|
|
—
|
|
||||||||||||||
|
Corporate
|
5,867
|
|
6,049
|
|
226
|
|
576
|
|
2,640
|
|
2,150
|
|
457
|
|
||||||||||||||
|
Asset-backed securities
|
1,127
|
|
1,138
|
|
319
|
|
187
|
|
140
|
|
8
|
|
484
|
|
||||||||||||||
|
Residential mortgage-backed securities
|
2,295
|
|
2,268
|
|
369
|
|
1,844
|
|
37
|
|
3
|
|
15
|
|
||||||||||||||
|
Other mortgage-backed securities
|
35
|
|
36
|
|
27
|
|
6
|
|
—
|
|
1
|
|
2
|
|
||||||||||||||
|
Fixed maturities
|
13,376
|
|
13,593
|
|
1,898
|
|
5,538
|
|
2,916
|
|
2,175
|
|
1,066
|
|
||||||||||||||
|
Short-term investments
|
14
|
|
14
|
|
11
|
|
—
|
|
1
|
|
2
|
|
—
|
|
||||||||||||||
|
Total fixed maturities and short-term investments
|
13,390
|
|
13,607
|
|
$
|
1,909
|
|
$
|
5,538
|
|
$
|
2,917
|
|
$
|
2,177
|
|
$
|
1,066
|
|
|||||||||
|
Equities
|
1,009
|
|
1,221
|
|
||||||||||||||||||||||||
|
Total
|
$
|
14,399
|
|
$
|
14,828
|
|
||||||||||||||||||||||
|
% of Total fixed maturities and short-term investments
|
14
|
%
|
41
|
%
|
21
|
%
|
16
|
%
|
8
|
%
|
||||||||||||||||||
|
(1)
|
Cost is amortized cost for fixed maturities and short-term investments and cost for equity securities.
|
|
(2)
|
All references to credit rating reflect Standard & Poor’s (or estimated equivalent). Investment grade reflects a rating of BBB- or above.
|
The increase of
$0.3 billion
in the fair value of the Company’s fixed maturities from
$13.6 billion
at
December 31, 2013
to $
13.9 billion
at
December 31, 2014
primarily reflects decreases in U.S. and European risk-free interest rates, the reinvestment of cash flows from operations and net investment income, which were partially offset by the impact of the strengthening of the U.S. dollar against most major currencies. At
December 31, 2014
, there has been a shift in the distribution of the fixed maturity portfolio compared to
December 31, 2013
as the Company decreased its holdings of corporate bonds (primarily due to modestly narrowing credit spreads) and non-U.S. sovereign government fixed maturities (primarily due to the strengthening of the U.S. dollar) and increased its holdings of U.S. government and U.S. states, territories and municipalities securities.
The U.S. government category includes U.S. treasuries which are not rated, however, they are generally considered to have a credit quality equivalent to or greater than AA+ corporate issues.
The U.S. government sponsored enterprises (GSEs) category includes securities that carry the implicit backing of the U.S. government and securities issued by U.S. government agencies (such as the Federal Home Loan Mortgage Corporation, or Freddie Mac as it is commonly known, and the Federal National Mortgage Association, or Fannie Mae as it is commonly known, and other federally owned or established corporations). At
December 31, 2014
,
50%
of this category was rated AA with the remaining
50%
, although not specifically rated, generally considered to have a credit quality equivalent to AA+ corporate issues.
The U.S. states, territories and municipalities category includes obligations of U.S. states, territories or counties.
107
The non-U.S. sovereign government, supranational and government related category includes obligations of non-U.S. sovereign governments, political subdivisions, agencies and supranational debt. The fair value and credit ratings of non-U.S. sovereign government, supranational and government related obligations at
December 31, 2014
were as follows (in millions of U.S. dollars):
|
|
Non-U.S.
Sovereign
Government
|
Supranational
Debt
|
Non-U.S.
Government
Related
|
Fair
Value
|
Credit Rating
(1)
|
|||||||||||||||||||||||||||||||
|
December 31, 2014
|
AAA
|
AA
|
A
|
BBB
|
Below investment grade /Unrated
|
|||||||||||||||||||||||||||||||
|
Non-European Union
|
||||||||||||||||||||||||||||||||||||
|
Canada
|
$
|
125
|
|
$
|
—
|
|
$
|
338
|
|
$
|
463
|
|
$
|
172
|
|
$
|
188
|
|
$
|
103
|
|
$
|
—
|
|
$
|
—
|
|
|||||||||
|
Singapore
|
97
|
|
—
|
|
—
|
|
97
|
|
97
|
|
—
|
|
—
|
|
—
|
|
—
|
|
||||||||||||||||||
|
New Zealand
|
83
|
|
—
|
|
—
|
|
83
|
|
—
|
|
83
|
|
—
|
|
—
|
|
—
|
|
||||||||||||||||||
|
All Other
|
171
|
|
5
|
|
—
|
|
176
|
|
6
|
|
33
|
|
53
|
|
73
|
|
11
|
|
||||||||||||||||||
|
Total Non-European Union
|
$
|
476
|
|
$
|
5
|
|
$
|
338
|
|
$
|
819
|
|
$
|
275
|
|
$
|
304
|
|
$
|
156
|
|
$
|
73
|
|
$
|
11
|
|
|||||||||
|
European Union
|
||||||||||||||||||||||||||||||||||||
|
France
|
$
|
369
|
|
$
|
—
|
|
$
|
6
|
|
$
|
375
|
|
$
|
—
|
|
$
|
375
|
|
$
|
—
|
|
$
|
—
|
|
$
|
—
|
|
|||||||||
|
Germany
|
180
|
|
—
|
|
—
|
|
180
|
|
180
|
|
—
|
|
—
|
|
—
|
|
—
|
|
||||||||||||||||||
|
Netherlands
|
154
|
|
—
|
|
—
|
|
154
|
|
154
|
|
—
|
|
—
|
|
—
|
|
—
|
|
||||||||||||||||||
|
Austria
|
153
|
|
—
|
|
—
|
|
153
|
|
—
|
|
153
|
|
—
|
|
—
|
|
—
|
|
||||||||||||||||||
|
Belgium
|
141
|
|
—
|
|
—
|
|
141
|
|
—
|
|
141
|
|
—
|
|
—
|
|
—
|
|
||||||||||||||||||
|
Supranational
|
—
|
|
104
|
|
—
|
|
104
|
|
6
|
|
98
|
|
—
|
|
—
|
|
—
|
|
||||||||||||||||||
|
All Other
|
50
|
|
—
|
|
—
|
|
50
|
|
11
|
|
11
|
|
17
|
|
—
|
|
11
|
|
||||||||||||||||||
|
Total European Union
|
$
|
1,047
|
|
$
|
104
|
|
$
|
6
|
|
$
|
1,157
|
|
$
|
351
|
|
$
|
778
|
|
$
|
17
|
|
$
|
—
|
|
$
|
11
|
|
|||||||||
|
Total
|
$
|
1,523
|
|
$
|
109
|
|
$
|
344
|
|
$
|
1,976
|
|
$
|
626
|
|
$
|
1,082
|
|
$
|
173
|
|
$
|
73
|
|
$
|
22
|
|
|||||||||
|
% of Total
|
77
|
%
|
6
|
%
|
17
|
%
|
100
|
%
|
31
|
%
|
55
|
%
|
9
|
%
|
4
|
%
|
1
|
%
|
||||||||||||||||||
|
(1)
|
All references to credit rating reflect Standard & Poor’s (or estimated equivalent).
|
At
December 31, 2014
, the Company did not have any investments in securities issued by peripheral European Union (EU) sovereign governments (Portugal, Italy, Ireland, Greece and Spain) or in securities issued by the Russian Federation.
108
Corporate bonds are comprised of obligations of U.S. and foreign corporations. The fair values of corporate bonds issued by U.S. and foreign corporations by economic sector at
December 31, 2014
were as follows (in millions of U.S. dollars):
|
December 31, 2014
|
U.S.
|
Foreign
|
Fair
Value
|
Percentage to
Total Fair
Value of
Corporate
Bonds
|
|||||||||||
|
Sector
|
|||||||||||||||
|
Finance
|
$
|
881
|
|
$
|
437
|
|
$
|
1,318
|
|
24
|
%
|
||||
|
Consumer noncyclical
|
543
|
|
237
|
|
780
|
|
14
|
|
|||||||
|
Communications
|
359
|
|
276
|
|
635
|
|
11
|
|
|||||||
|
Utilities
|
281
|
|
322
|
|
603
|
|
11
|
|
|||||||
|
Industrials
|
342
|
|
120
|
|
462
|
|
8
|
|
|||||||
|
Energy
|
246
|
|
178
|
|
424
|
|
8
|
|
|||||||
|
Consumer cyclical
|
270
|
|
88
|
|
358
|
|
6
|
|
|||||||
|
Insurance
|
215
|
|
55
|
|
270
|
|
5
|
|
|||||||
|
Basic materials
|
68
|
|
107
|
|
175
|
|
3
|
|
|||||||
|
Real estate investment trusts
|
136
|
|
8
|
|
144
|
|
3
|
|
|||||||
|
Government guaranteed corporate debt
|
—
|
|
140
|
|
140
|
|
2
|
|
|||||||
|
Technology
|
132
|
|
—
|
|
132
|
|
2
|
|
|||||||
|
All Other
|
35
|
|
128
|
|
163
|
|
3
|
|
|||||||
|
Total
|
$
|
3,508
|
|
$
|
2,096
|
|
$
|
5,604
|
|
100
|
%
|
||||
|
% of Total
|
63
|
%
|
37
|
%
|
|
|
|||||||||
At
December 31, 2014
, other than the U.S., no other country accounted for more than 10% of the Company’s corporate bonds. At
December 31, 2014
, the ten largest issuers accounted for
18%
of the corporate bonds held by the Company (
6%
of total investments and cash) and no single issuer accounted for more than
3%
of total corporate bonds (
1%
of total investments and cash).
Within the finance sector,
97%
of corporate bonds were rated investment grade and
78%
were rated A- or better at
December 31, 2014
.
Within the energy sector, 86% of the Company's corporate bonds were rated investment grade at
December 31, 2014
. While corporate bonds in the energy sector have the potential for future mark-to-market losses if oil prices stay at current levels or are further suppressed, the Company's exposure to these losses is to a certain extent mitigated by the high percentage of the corporate bond holdings in the energy sector being investment grade.
At
December 31, 2014
, the fair value of the Company’s corporate bond portfolio issued by companies in the European Union was as follows (in millions of U.S. dollars):
|
December 31, 2014
|
Government
Guaranteed
Corporate Debt
|
Finance Sector
Corporate Bonds
|
Non-Finance
Sector Corporate
Bonds
|
Fair Value
|
||||||||||||
|
European Union
|
||||||||||||||||
|
United Kingdom
|
$
|
—
|
|
$
|
108
|
|
$
|
388
|
|
$
|
496
|
|
||||
|
Netherlands
|
—
|
|
138
|
|
156
|
|
294
|
|
||||||||
|
France
|
—
|
|
29
|
|
163
|
|
192
|
|
||||||||
|
Germany
|
135
|
|
6
|
|
15
|
|
156
|
|
||||||||
|
Italy
|
—
|
|
17
|
|
73
|
|
90
|
|
||||||||
|
Spain
|
—
|
|
16
|
|
69
|
|
85
|
|
||||||||
|
Luxembourg
|
—
|
|
—
|
|
57
|
|
57
|
|
||||||||
|
Ireland
|
—
|
|
15
|
|
40
|
|
55
|
|
||||||||
|
All Other
|
5
|
|
5
|
|
56
|
|
66
|
|
||||||||
|
Total
|
$
|
140
|
|
$
|
334
|
|
$
|
1,017
|
|
$
|
1,491
|
|
||||
|
% of Total
|
9
|
%
|
22
|
%
|
69
|
%
|
100
|
%
|
||||||||
At
December 31, 2014
, the Company did not hold any government guaranteed corporate debt issued in peripheral EU countries (Portugal, Italy, Ireland, Greece and Spain) or the Russian Federation.
109
Asset-backed securities, residential mortgage-backed securities and other mortgage-backed securities include U.S. and non-U.S. originations. The fair value and credit ratings of asset-backed securities, residential mortgage-backed securities and other mortgage-backed securities at
December 31, 2014
were as follows (in millions of U.S. dollars):
|
|
Credit Rating
(1)
|
|||||||||||||||||||||||||||||||
|
December 31, 2014
|
GNMA
(2)
|
GSEs
(3)
|
AAA
|
AA
|
A
|
BBB
|
Below
investment
grade /
Unrated
|
Fair
Value
|
||||||||||||||||||||||||
|
Asset-backed securities
|
||||||||||||||||||||||||||||||||
|
U.S.
|
$
|
—
|
|
$
|
—
|
|
$
|
133
|
|
$
|
136
|
|
$
|
97
|
|
$
|
—
|
|
$
|
466
|
|
$
|
832
|
|
||||||||
|
Non-U.S.
|
—
|
|
—
|
|
131
|
|
69
|
|
64
|
|
14
|
|
21
|
|
299
|
|
||||||||||||||||
|
Asset-backed securities
|
$
|
—
|
|
$
|
—
|
|
$
|
264
|
|
$
|
205
|
|
$
|
161
|
|
$
|
14
|
|
$
|
487
|
|
$
|
1,131
|
|
||||||||
|
Residential mortgage-backed securities
|
||||||||||||||||||||||||||||||||
|
U.S.
|
$
|
428
|
|
$
|
1,458
|
|
$
|
7
|
|
$
|
—
|
|
$
|
—
|
|
$
|
—
|
|
$
|
15
|
|
$
|
1,908
|
|
||||||||
|
Non-U.S.
|
—
|
|
—
|
|
291
|
|
54
|
|
53
|
|
—
|
|
—
|
|
398
|
|
||||||||||||||||
|
Residential mortgage-backed securities
|
$
|
428
|
|
$
|
1,458
|
|
$
|
298
|
|
$
|
54
|
|
$
|
53
|
|
$
|
—
|
|
$
|
15
|
|
$
|
2,306
|
|
||||||||
|
Other mortgage-backed securities
|
||||||||||||||||||||||||||||||||
|
U.S.
|
$
|
6
|
|
$
|
—
|
|
$
|
8
|
|
$
|
12
|
|
$
|
19
|
|
$
|
—
|
|
$
|
2
|
|
$
|
47
|
|
||||||||
|
Non-U.S.
|
—
|
|
—
|
|
8
|
|
—
|
|
—
|
|
—
|
|
—
|
|
8
|
|
||||||||||||||||
|
Other mortgage-backed securities
|
$
|
6
|
|
$
|
—
|
|
$
|
16
|
|
$
|
12
|
|
$
|
19
|
|
$
|
—
|
|
$
|
2
|
|
$
|
55
|
|
||||||||
|
Total
|
$
|
434
|
|
$
|
1,458
|
|
$
|
578
|
|
$
|
271
|
|
$
|
233
|
|
$
|
14
|
|
$
|
504
|
|
$
|
3,492
|
|
||||||||
|
% of Total
|
12
|
%
|
|
42
|
%
|
|
16
|
%
|
|
8
|
%
|
|
7
|
%
|
|
1
|
%
|
|
14
|
%
|
100
|
%
|
||||||||||
|
(1)
|
All references to credit rating reflect Standard & Poor’s (or estimated equivalent).
|
|
(2)
|
GNMA represents the Government National Mortgage Association. The GNMA, or Ginnie Mae as it is commonly known, is a wholly owned U.S. government corporation within the Department of Housing and Urban Development which guarantees mortgage loans of qualifying first-time home buyers and low-income borrowers.
|
|
(3)
|
GSEs, or government sponsored enterprises, includes securities that are issued by U.S. government agencies, such as Freddie Mac and Fannie Mae.
|
Residential mortgage-backed securities includes U.S. residential mortgage-backed securities, which generally have a low risk of default and carry the implicit backing of the U.S. government. The issuers of these securities are U.S. government agencies or GSEs, which set standards on the mortgages before accepting them into the program. Although these U.S. government backed securities do not carry a formal rating, they are generally considered to have a credit quality equivalent to or greater than AA+ corporate issues. They are considered prime mortgages and the major risk is uncertainty of the timing of prepayments. While there have been market concerns regarding sub-prime mortgages, the Company did not have direct exposure to these types of securities in its own investment portfolio at
December 31, 2014
, other than
$20 million
of investments in distressed asset vehicles (included in Other invested assets). At
December 31, 2014
, the Company’s U.S. residential mortgage-backed securities included approximately $
10 million
(less than
1%
of U.S. residential mortgage-backed securities) of collateralized mortgage obligations, where the Company deemed the entry point and price of the investment to be attractive.
Other mortgage-backed securities includes U.S. and non-U.S. commercial mortgage-backed securities.
110
Short-term investments consisted of U.S. and non-U.S. government obligations and foreign corporate bonds. At
December 31, 2014
, the fair value and credit ratings of short-term investments were as follows (in millions of U.S. dollars):
|
|
|
|
|
|
Credit Rating
(1)
|
|||||||||||||||||||||||||||
|
December 31, 2014
|
U.S.
Government
|
Non-U.S.
Government
|
Corporate
|
Fair
Value
|
AAA
|
AA
|
A
|
BBB
|
||||||||||||||||||||||||
|
Country
|
||||||||||||||||||||||||||||||||
|
U.S.
|
$
|
20
|
|
$
|
—
|
|
$
|
—
|
|
$
|
20
|
|
$
|
—
|
|
$
|
20
|
|
$
|
—
|
|
$
|
—
|
|
||||||||
|
All Other
|
—
|
|
1
|
|
4
|
|
5
|
|
1
|
|
—
|
|
—
|
|
4
|
|
||||||||||||||||
|
Total
|
$
|
20
|
|
$
|
1
|
|
$
|
4
|
|
$
|
25
|
|
$
|
1
|
|
$
|
20
|
|
$
|
—
|
|
$
|
4
|
|
||||||||
|
% of Total
|
81
|
%
|
4
|
%
|
15
|
%
|
100
|
%
|
4
|
%
|
81
|
%
|
—
|
|
15
|
%
|
||||||||||||||||
|
(1)
|
All references to credit rating reflect Standard & Poor’s (or estimated equivalent). Investment grade reflects a rating of BBB- or above.
|
Equities are comprised of publicly traded common stocks, public exchange traded funds (ETFs), real estate investment trusts (REITs) and funds holding fixed income securities. The fair value of equities (including equities held in ETFs, REITs and funds holding fixed income securities) at
December 31, 2014
were as follows (in millions of U.S. dollars):
|
December 31, 2014
|
Fair
Value
|
Percentage to
Total Fair
Value of
Equities
|
|||||
|
Sector
|
|||||||
|
Real estate investment trusts
|
$
|
214
|
|
23
|
%
|
||
|
Insurance
|
146
|
|
16
|
|
|||
|
Energy
|
124
|
|
13
|
|
|||
|
Consumer noncyclical
|
100
|
|
11
|
|
|||
|
Finance
|
98
|
|
10
|
|
|||
|
Technology
|
61
|
|
7
|
|
|||
|
Communications
|
55
|
|
6
|
|
|||
|
Industrials
|
50
|
|
5
|
|
|||
|
Consumer cyclical
|
39
|
|
4
|
|
|||
|
All Other
|
43
|
|
5
|
|
|||
|
Total
|
$
|
930
|
|
100
|
%
|
||
|
Mutual funds and exchange traded funds
|
|||||||
|
Funds and ETFs holding equities
|
118
|
|
|||||
|
Funds holding fixed income securities
|
9
|
|
|||||
|
Total equities
|
$
|
1,057
|
|
||||
At
December 31, 2014
, the Company’s “insurance sector” equities included an investment of
$120 million
in
Essent Group Ltd
(Essent), the U.S. mortgage guaranty insurance company that conducted an initial public offering in the fourth quarter of 2013.
At
December 31, 2014
, U.S. issuers represented
65%
of the publicly traded common stocks and ETFs. At
December 31, 2014
, the ten largest common stocks accounted for
29%
of equities (excluding equities held in ETFs and funds holding fixed income securities). At
December 31, 2014
, other than the Company’s investment in Essent, no single common stock issuer accounted for more than
4%
of total equities (excluding equities held in ETFs and funds holding fixed income securities) or more than
1%
of the Company’s total investments and cash and cash equivalents. At
December 31, 2014
, approximately
60%
(or
$71 million
) of funds and ETFs holding equities were emerging markets funds. At
December 31, 2014
, the Company did not hold any emerging markets funds within the funds holding fixed income securities category. At
December 31, 2014
, the Company held less than
$2 million
of equities (excluding equities held in ETFs and funds holding fixed income securities) issued by finance sector institutions based in peripheral EU countries (Portugal, Ireland, Italy, Greece and Spain).
111
Maturity Distribution
The distribution of fixed maturities and short-term investments at
December 31, 2014
by contractual maturity date was as follows (in millions of U.S. dollars):
|
December 31, 2014
|
Cost
|
Fair
Value
|
||||||
|
One year or less
|
$
|
313
|
|
$
|
313
|
|
||
|
More than one year through five years
|
5,042
|
|
5,169
|
|
||||
|
More than five years through ten years
|
3,593
|
|
3,719
|
|
||||
|
More than ten years
|
1,127
|
|
1,251
|
|
||||
|
Subtotal
|
10,075
|
|
10,452
|
|
||||
|
Mortgage/asset-backed securities
|
3,440
|
|
3,492
|
|
||||
|
Total
|
$
|
13,515
|
|
$
|
13,944
|
|
||
Actual maturities may differ from contractual maturities because certain borrowers have the right to call or prepay certain obligations with or without call or prepayment penalties.
Other Invested Assets
At
December 31, 2014
, the Company’s other invested assets consisted primarily of investments in non-publicly traded companies, asset-backed securities, notes and loan receivables, note securitizations, annuities and residuals and other specialty asset classes. These assets, together with the Company’s derivative financial instruments that were in a net unrealized gain or loss position are reported within Other invested assets in the Company’s Consolidated Balance Sheets. The fair value and notional value (if applicable) of other invested assets at
December 31, 2014
were as follows (in millions of U.S. dollars):
|
December 31, 2014
|
Carrying
Value
(1)
|
Notional Value
of Derivatives
|
||||||
|
Strategic investments
|
$
|
195
|
|
$
|
n/a
|
|
||
|
Asset-backed securities (including annuities and residuals)
|
19
|
|
n/a
|
|
||||
|
Notes and loan receivables and notes securitizations
|
44
|
|
n/a
|
|
||||
|
Total return swaps
|
(2
|
)
|
43
|
|
||||
|
Interest rate swaps
(2)
|
(16
|
)
|
201
|
|
||||
|
Insurance-linked securities
(3)
|
—
|
|
145
|
|
||||
|
Futures contracts
|
—
|
|
2,349
|
|
||||
|
Foreign exchange forward contracts
|
13
|
|
2,080
|
|
||||
|
Foreign currency option contracts
|
(1
|
)
|
43
|
|
||||
|
To-be-announced mortgage-backed securities (TBAs)
|
—
|
|
235
|
|
||||
|
Other
|
47
|
|
n/a
|
|
||||
|
Total
|
$
|
299
|
|
|||||
n/a: Not applicable
|
(1)
|
Included in Other invested assets are investments that are accounted for using the cost method of accounting, equity method of accounting or fair value accounting.
|
|
(2)
|
The Company enters into interest rate swaps to mitigate notional exposures on certain total return swaps and certain fixed maturities. Only the notional value of interest rate swaps on fixed maturities is presented separately in the table.
|
|
(3)
|
Insurance-linked securities include a longevity swap for which the notional amount is not reflective of the overall potential exposure of the swap. As such, the Company has included the probable maximum loss under the swap within the net notional exposure as an approximation of the notional amount.
|
At
December 31, 2014
, the Company’s strategic investments included $
195 million
of investments classified in other invested assets. These strategic investments include investments in non-publicly traded companies, private placement equity and bond investments, other specialty asset classes and the investments in distressed asset vehicles comprised of sub-prime mortgages, which were discussed above in the residential mortgage-backed securities category of Investments—Trading Securities. In addition to the Company’s strategic investments that are classified in other invested assets, strategic investments of
$158 million
are recorded in equities and other assets at
December 31, 2014
.
112
At
December 31, 2014
, the Company’s principal finance activities included
$83 million
of investments classified in Other invested assets, which were comprised primarily of asset-backed securities, notes and loan receivables, notes securitizations, annuities and residuals, private placement equity investments and total return and interest rate swaps related to principal finance activities.
For total return swaps within the principal finance portfolio, the Company uses internal valuation models to estimate the fair value of these derivatives and develops assumptions that require significant judgment, such as the timing of future cash flows, credit spreads and the general level of interest rates. For interest rate swaps, the Company uses externally modeled quoted prices that use observable market inputs. At
December 31, 2014
, all of the Company’s principal finance total return and interest rate swap portfolio was related to tax advantaged real estate backed transactions.
Although the Company has not entered into any credit default swaps at
December 31, 2014
, from time to time the Company also utilizes credit default swaps to mitigate the risk associated with certain of its underwriting obligations, most notably in the credit/surety line, to replicate investment positions or to manage market exposures and to reduce the credit risk for specific fixed maturities in its investment portfolio. The Company uses externally modeled quoted prices that use observable market inputs to estimate the fair value of these swaps.
The Company has entered into various weather derivatives and longevity total return swaps for which the underlying risks reference parametric weather risks and longevity risks, respectively. The Company uses internal valuation models to estimate the fair value of these derivatives and develops assumptions that require significant judgment, except for exchange traded weather derivatives. In determining the fair value of exchange traded weather derivatives, the Company uses quoted market prices.
The Company uses exchange traded treasury note futures for the purposes of managing portfolio duration. The Company also uses equity futures to replicate equity investment positions.
The Company utilizes foreign exchange forward contracts and foreign currency option contracts as part of its overall currency risk management and investment strategies.
The Company utilizes TBAs as part of its overall investment strategy and to enhance investment performance. TBAs represent commitments to purchase future issuances of U.S. government agency mortgage-backed securities. For the period between purchase of a TBA and issuance of the underlying security, the Company’s position is accounted for as a derivative. The Company’s policy is to maintain designated cash balances at least equal to the amount of outstanding TBA purchases.
At
December 31, 2014
, the Company’s other invested assets did not include any exposure to peripheral EU countries (Portugal, Italy, Ireland, Greece and Spain) and included direct exposure to mutual fund investments in other EU countries of less than
$2 million
. The counterparties to the Company’s foreign exchange forward contracts and foreign currency option contracts include European finance sector institutions rated A- or better by Standard & Poor’s and the Company manages its exposure to individual institutions. The Company also has exposure to the euro related to the utilization of foreign exchange forward contracts and other derivative financial instruments in its hedging strategy (see Quantitative and Qualitative Disclosures About Market Risk—Foreign Currency Risk
in Item 7A of Part II of this report
).
Funds Held – Directly Managed
Following Paris Re’s acquisition of substantially all of the reinsurance operations of Colisée Re (previously known as AXA RE), a subsidiary of AXA SA (AXA), in 2006, Paris Re and its subsidiaries entered into an issuance agreement and a quota share retrocession agreement to assume business written by Colisée Re from January 1, 2006 to September 30, 2007 as well as the in-force business at December 31, 2005. The agreements provided that the premium related to the transferred business was retained by Colisée Re and credited to a funds held account. The assets underlying the funds held – directly managed account are maintained by Colisée Re in a segregated investment portfolio and managed by the Company.
Substantially all of the investments in the segregated investment portfolio underlying the funds held – directly managed account are carried at fair value. Realized and unrealized investment gains and losses and net investment income related to this account inure to the benefit of the Company. The Company elects the fair value option for all of the fixed maturities, short-term investments and certain other invested assets in the segregated investment portfolio underlying this account, and accordingly, all changes in fair value are recorded in net realized and unrealized investment gains and losses in the Consolidated Statements of Operations.
The composition of the investments underlying the funds held – directly managed account at December 31, 2014 is discussed below. See also the discussion in Counterparty Credit Risk in Item 7A of Part II of this report.
At
December 31, 2014
, approximately
99%
of the fixed income investments underlying the funds held – directly managed account were publicly traded and substantially all (more than 99%) were rated investment grade (BBB- or higher) by Standard & Poor’s (or estimated equivalent).
113
The average credit quality, the average yield to maturity and the expected average duration of the fixed maturities underlying the funds held – directly managed account at
December 31, 2014
and
2013
were as follows:
|
December 31, 2014
|
December 31, 2013
|
||||||
|
Average credit quality
|
AA
|
|
AA
|
|
|||
|
Average yield to maturity
|
1.0
|
|
%
|
1.2
|
|
%
|
|
|
Expected average duration
|
3.4
|
|
years
|
2.9
|
|
years
|
|
The decrease in the average yield to maturity of fixed maturities underlying the funds held – directly managed account at
December 31, 2014
compared to
December 31, 2013
was primarily due to the sale and maturity of higher yielding investments (which were used to finance the commutation of a portion of the Reserve Agreement with Colisée Re and to pay losses related to the run-off of the underlying reserves) and decreases in U.S. and European risk-free interest rates.
The increase in the expected average duration of fixed maturities underlying the funds held – directly managed account at
December 31, 2014
compared to
December 31, 2013
was primarily due to the release of certain shorter duration investments due to the commutation of a portion of the Reserve Agreement with Colisée Re.
The cost, fair value and credit rating of the investments underlying the funds held – directly managed account at
December 31, 2014
were as follows (in millions of U.S. dollars):
|
|
|
|
Credit Rating
(2)
|
|||||||||||||||||||||
|
December 31, 2014
|
Cost
(1)
|
Fair
Value
|
AAA
|
AA
|
A
|
BBB
|
||||||||||||||||||
|
Fixed maturities
|
||||||||||||||||||||||||
|
U.S. government
|
$
|
103
|
|
$
|
105
|
|
$
|
—
|
|
$
|
105
|
|
$
|
—
|
|
$
|
—
|
|
||||||
|
U.S. government sponsored enterprises
|
47
|
|
49
|
|
—
|
|
49
|
|
—
|
|
—
|
|
||||||||||||
|
Non-U.S. sovereign government, supranational and government related
|
120
|
|
128
|
|
32
|
|
81
|
|
15
|
|
—
|
|
||||||||||||
|
Corporate
|
169
|
|
177
|
|
21
|
|
61
|
|
64
|
|
31
|
|
||||||||||||
|
Fixed maturities
|
439
|
|
459
|
|
$
|
53
|
|
$
|
296
|
|
$
|
79
|
|
$
|
31
|
|
||||||||
|
Other invested assets
|
25
|
|
14
|
|
||||||||||||||||||||
|
Total
(3)
|
$
|
464
|
|
$
|
473
|
|
||||||||||||||||||
|
% of Total fixed maturities
|
12
|
%
|
64
|
%
|
17
|
%
|
7
|
%
|
||||||||||||||||
|
|
|
|
Credit Rating
(2)
|
|||||||||||||||||||||
|
December 31, 2013
|
Cost
(1)
|
Fair
Value
|
AAA
|
AA
|
A
|
BBB
|
||||||||||||||||||
|
Fixed maturities
|
||||||||||||||||||||||||
|
U.S. government
|
$
|
107
|
|
$
|
108
|
|
$
|
—
|
|
$
|
108
|
|
$
|
—
|
|
$
|
—
|
|
||||||
|
U.S. government sponsored enterprises
|
47
|
|
50
|
|
—
|
|
50
|
|
—
|
|
—
|
|
||||||||||||
|
Non-U.S. sovereign government, supranational and government related
|
132
|
|
137
|
|
44
|
|
69
|
|
24
|
|
—
|
|
||||||||||||
|
Corporate
|
238
|
|
249
|
|
23
|
|
89
|
|
100
|
|
37
|
|
||||||||||||
|
Fixed maturities
|
524
|
|
544
|
|
67
|
|
316
|
|
124
|
|
37
|
|
||||||||||||
|
Short-term investments
|
2
|
|
2
|
|
2
|
|
—
|
|
—
|
|
—
|
|
||||||||||||
|
Total fixed maturities and short-term investments
|
526
|
|
546
|
|
$
|
69
|
|
$
|
316
|
|
$
|
124
|
|
$
|
37
|
|
||||||||
|
Other invested assets
|
28
|
|
15
|
|
||||||||||||||||||||
|
Total
|
$
|
554
|
|
$
|
561
|
|
||||||||||||||||||
|
% of Total fixed maturities and short-term investments
|
13
|
%
|
58
|
%
|
22
|
%
|
7
|
%
|
||||||||||||||||
|
(1)
|
Cost is amortized cost for fixed maturities.
|
|
(2)
|
All references to credit rating reflect Standard & Poor’s (or estimated equivalent).
|
|
(3)
|
In addition to the fair value of
$473 million
of investments underlying the funds held – directly managed account at
December 31, 2014
, the funds held – directly managed account also includes cash and cash equivalents of
$42 million
, accrued investment income of
$6 million
and other assets and liabilities related to the underlying business of $
88 million
. Accordingly, the total balance in the funds held – directly managed account was
$609 million
at
December 31, 2014
.
|
114
The decrease in the fair value of the investment portfolio underlying the funds held – directly managed account from $561 million at December 31, 2013 to
$473 million
at
December 31, 2014
was primarily related to the commutation of a portion of the Reserve Agreement with Colisée Re, the run-off of the underlying liabilities associated with this account and, to a lesser extent, the impact of the strengthening of the U.S. dollar against most major currencies.
The U.S. government category includes U.S. treasuries which are not rated, however, they are generally considered to have a credit quality equivalent to or greater than AA+ corporate issues.
The U.S. government sponsored enterprises (GSEs) category includes securities that carry the implicit backing of the U.S. government and securities issued by U.S. government agencies (such as Freddie Mac and Fannie Mae). At
December 31, 2014
,
83%
of this category was rated AA with the remaining
17%
, although not specifically rated, generally considered to have a credit quality equivalent to AA+ corporate issues.
The non-U.S. sovereign government, supranational and government related category includes obligations of non-U.S. sovereign governments, political subdivisions, agencies and supranational debt. The fair value and credit ratings of non-U.S. sovereign government, supranational and government related obligations underlying the funds held – directly managed account at
December 31, 2014
were as follows (in millions of U.S. dollars):
|
|
|
|
|
|
Credit Rating
(1)
|
|||||||||||||||||||||||
|
December 31, 2014
|
Non-U.S.
Sovereign
Government
|
Supranational
Debt
|
Non-U.S.
Government
Related
|
Fair
Value
|
AAA
|
AA
|
A
|
|||||||||||||||||||||
|
Non-European Union
|
||||||||||||||||||||||||||||
|
Canada
|
$
|
3
|
|
$
|
—
|
|
$
|
18
|
|
$
|
21
|
|
$
|
5
|
|
$
|
6
|
|
$
|
10
|
|
|||||||
|
All Other
|
—
|
|
3
|
|
—
|
|
3
|
|
3
|
|
—
|
|
—
|
|
||||||||||||||
|
Total Non-European Union
|
$
|
3
|
|
|
$
|
3
|
|
|
$
|
18
|
|
|
$
|
24
|
|
|
$
|
8
|
|
|
$
|
6
|
|
|
$
|
10
|
|
|
|
European Union
|
—
|
|
||||||||||||||||||||||||||
|
France
|
$
|
21
|
|
$
|
—
|
|
$
|
22
|
|
$
|
43
|
|
$
|
—
|
|
$
|
43
|
|
$
|
—
|
|
|||||||
|
Belgium
|
18
|
|
—
|
|
—
|
|
18
|
|
—
|
|
18
|
|
—
|
|
||||||||||||||
|
All Other
|
10
|
|
32
|
|
1
|
|
43
|
|
24
|
|
14
|
|
5
|
|
||||||||||||||
|
Total European Union
|
$
|
49
|
|
|
$
|
32
|
|
|
$
|
23
|
|
|
$
|
104
|
|
|
$
|
24
|
|
|
$
|
75
|
|
|
$
|
5
|
|
|
|
Total
|
$
|
52
|
|
|
$
|
35
|
|
|
$
|
41
|
|
|
$
|
128
|
|
|
$
|
32
|
|
|
$
|
81
|
|
|
$
|
15
|
|
|
|
% of Total
|
41
|
%
|
27
|
%
|
32
|
%
|
100
|
%
|
25
|
%
|
63
|
%
|
12
|
%
|
||||||||||||||
|
(1)
|
All references to credit rating reflect Standard & Poor’s (or estimated equivalent).
|
At
December 31, 2014
, the investments underlying the funds held – directly managed account included less than
$1 million
of securities issued by peripheral European Union (EU) sovereign governments (Portugal, Italy, Ireland, Greece and Spain).
115
Corporate bonds underlying the funds held – directly managed account are comprised of obligations of U.S. and foreign corporations. The fair value of corporate bonds issued by U.S. and foreign corporations underlying funds held – directly managed account by economic sector at
December 31, 2014
were as follows (in millions of U.S. dollars):
|
December 31, 2014
|
U.S.
|
Foreign
|
Fair
Value
|
Percentage to
Total Fair
Value of
Corporate
Bonds
|
|||||||||||
|
Sector
|
|||||||||||||||
|
Finance
|
$
|
9
|
|
$
|
43
|
|
$
|
52
|
|
30
|
%
|
||||
|
Energy
|
6
|
|
24
|
|
30
|
|
17
|
|
|||||||
|
Consumer noncyclical
|
23
|
|
6
|
|
29
|
|
16
|
|
|||||||
|
Utilities
|
4
|
|
14
|
|
18
|
|
10
|
|
|||||||
|
Communications
|
4
|
|
8
|
|
12
|
|
7
|
|
|||||||
|
Basic materials
|
5
|
|
5
|
|
10
|
|
6
|
|
|||||||
|
Consumer cyclical
|
7
|
|
1
|
|
8
|
|
5
|
|
|||||||
|
Government guaranteed corporate debt
|
—
|
|
6
|
|
6
|
|
3
|
|
|||||||
|
All Other
|
11
|
|
1
|
|
12
|
|
6
|
|
|||||||
|
Total
|
$
|
69
|
|
$
|
108
|
|
$
|
177
|
|
100
|
%
|
||||
|
% of Total
|
39
|
%
|
61
|
%
|
100
|
%
|
|||||||||
At
December 31, 2014
, other than the U.S., France and the Netherlands, which accounted for 39%, 13% and 13%, respectively, no other country accounted for more than 10% of the Company’s corporate bonds underlying the funds held – directly managed account.
At
December 31, 2014
, the ten largest issuers accounted for
37%
of the corporate bonds underlying the funds held – directly managed account and no single issuer accounted for more than
6%
of corporate bonds underlying the funds held – directly managed account (or more than
2%
of the investments and cash underlying the funds held – directly managed account). At
December 31, 2014
, all of the finance sector corporate bonds held were rated investment grade (BBB- or higher) by Standard & Poor’s (or estimated equivalent) and
97%
were rated A- or better.
At
December 31, 2014
, the fair value of corporate bonds underlying the funds held – directly managed account that were issued by companies in the European Union were as follows (in millions of U.S. dollars):
|
December 31, 2014
|
Government
Guaranteed
Corporate
Debt
|
Finance Sector
Corporate
Bonds
|
Non-Finance
Sector
Corporate
Bonds
|
Fair
Value
|
||||||||||||
|
European Union
|
||||||||||||||||
|
France
|
$
|
—
|
|
$
|
7
|
|
$
|
17
|
|
$
|
24
|
|
||||
|
Netherlands
|
—
|
|
8
|
|
15
|
|
23
|
|
||||||||
|
United Kingdom
|
1
|
|
5
|
|
6
|
|
12
|
|
||||||||
|
Germany
|
5
|
|
—
|
|
2
|
|
7
|
|
||||||||
|
All Other
|
—
|
|
6
|
|
5
|
|
11
|
|
||||||||
|
Total
|
$
|
6
|
|
$
|
26
|
|
$
|
45
|
|
$
|
77
|
|
||||
|
% of Total
|
8
|
%
|
34
|
%
|
58
|
%
|
100
|
%
|
||||||||
At
December 31, 2014
, corporate bonds underlying the funds held – directly managed account included less than
$5 million
of finance sector corporate bonds issued by companies in peripheral EU countries (Portugal, Italy, Ireland, Greece and Spain).
Other invested assets underlying the funds held – directly managed account primarily consists of real estate fund investments.
116
Maturity Distribution
The distribution of fixed maturities underlying the funds held – directly managed account at
December 31, 2014
by contractual maturity date was as follows (in millions of U.S. dollars):
|
December 31, 2014
|
Cost
|
Fair
Value
|
||||||
|
One year or less
|
$
|
76
|
|
$
|
77
|
|
||
|
More than one year through five years
|
231
|
|
241
|
|
||||
|
More than five years through ten years
|
132
|
|
141
|
|
||||
|
Total
|
$
|
439
|
|
$
|
459
|
|
||
Actual maturities may differ from contractual maturities because certain borrowers have the right to call or prepay certain obligations with or without call or prepayment penalties.
European Exposures
As discussed in Item 1 of Part I of this report, the Company conducts its operations in various countries and in a variety of non-U.S. denominated currencies. A significant portion of the Company’s reinsurance business is conducted with cedants in Europe, with the collection of premiums and the payment of claims denominated in the euro. As described above, the currency composition of the Company’s liability funds generally matches the underlying net reinsurance liabilities to protect against changes in foreign exchange rates. Accordingly, the Company’s liability funds that are held to match net reinsurance liabilities that are denominated in the euro, expose the Company’s investment portfolio and the investments underlying the funds held – directly managed account to bonds that are denominated in the euro that are issued by European sovereign governments and government agencies, corporate bonds that are issued by companies in Europe (including those that are also guaranteed by a European sovereign government) and equities issued by companies in Europe.
As a result of the uncertainties related to European sovereign government debt exposures, and uncertainties surrounding Europe in general, the Company implemented additional risk management guidelines to reduce and mitigate potential risks arising from these exposures in its investment portfolio and in the investments underlying the funds held – directly managed account. These guidelines reflect the Company’s response to current conditions and the guidelines may change as the dynamics of the underlying conditions and uncertainties change. The Company’s current guidelines include, but are not limited to, the following:
|
•
|
since the beginning of 2010 the Company has eliminated substantially all of its investment exposure to bonds issued by European sovereign governments in the peripheral countries (Portugal, Italy, Ireland, Greece and Spain); and
|
|
•
|
during the second half of 2011, the Company focused its European sovereign government exposure to five highly-rated countries. These five countries, Germany, France, Netherlands, Belgium, and Austria, are rated AAA, AA, AA+, AA and AA+ by Standard & Poor’s.
|
The Company’s exposures to European sovereign governments and other European related investment risks are discussed above within each category of the Company’s investment portfolio and the investments underlying the funds held – directly managed account. In addition, the Company’s other investment and derivative exposures to European counterparties are discussed in Other Invested Assets above. See Risk Factors in Item 1A of Part I of this report for further discussion on the Company’s exposure to the European sovereign debt crisis.
Funds Held by Reinsured Companies (Cedants)
In addition to the funds held – directly managed account described above, the Company writes certain business on a funds held basis. The following discussion excludes the funds held – directly managed account. Under funds held contractual arrangements, the cedant retains the net funds that would have otherwise been remitted to the Company and credits the net fund balance with investment income.
At
December 31, 2014
and
2013
, the Company recorded
$766 million
and
$843 million
, respectively, of funds held assets in its Consolidated Balance Sheets. At
December 31, 2014
, the five largest cedants represented 61% of the funds held balance. Approximately 81% of the funds held balance at
December 31, 2014
related to contracts that earned investment income based upon a predetermined interest rate, either fixed contractually at the inception of the contract or based upon a recognized market index (e.g., LIBOR). Interest rates ranged from
2.1%
to
5.4%
for the year ended
December 31, 2014
. Under these contractual arrangements, there are no specific assets linked to the funds held assets, and the Company is only exposed to the credit risk of the cedant. These arrangements include three of the five cedants with the largest funds held assets, which represented 46% of the Company’s total funds held balance.
117
With respect to the remaining 19% of the funds held balance at
December 31, 2014
, the Company receives an investment return based upon either the results of a pool of assets held by the cedant, or the investment return earned by the cedant on its entire investment portfolio. This portion of the Company’s funds held assets at
December 31, 2014
included two of the five cedants with the largest funds held assets, which represented 15% of the Company’s total funds held balance. The Company does not legally own or directly control the investments underlying its funds held assets and only has recourse to the cedant for the receivable balances and no claim to the underlying securities that support the balances. Decisions as to purchases and sales of assets underlying the funds held balances are made by the cedant; in some circumstances, investment guidelines regarding the minimum credit quality of the underlying assets may be agreed upon between the cedant and the Company as part of the reinsurance agreement, or the Company may participate in an investment oversight committee regarding the investment of the net funds, but investment decisions are not otherwise influenced by the Company.
Within this portion of the funds held assets, the Company has several annuity treaties which are structured so that the return on the funds held balances is tied to the performance of an underlying group of assets held by the cedant, including fluctuations in the market value of the underlying assets. One such treaty is a retrocessional agreement under which the Company receives more limited data than what is generally received under a direct reinsurance agreement. In these arrangements, the objective of the reinsurance agreement is to provide for the covered longevity risk and to earn a net investment return on an underlying pool of assets greater than is contractually due to the annuity holders. While the Company is also exposed to the creditworthiness of the cedant, the Company’s credit risk in some jurisdictions is mitigated by a mandatory right of offset of amounts payable by the Company to a cedant against amounts due to the Company. In certain other jurisdictions the Company is able to mitigate this risk, depending on the nature of the funds held arrangements, to the extent that the Company has the contractual ability to offset any shortfall in the payment of the funds held balances with amounts owed by the Company to cedants for losses payable and other amounts contractually due. The Company also has non-life treaties in which the investment performance of the net funds held asset corresponds to the interest income on the assets held by the cedant; however, the Company is not directly exposed to the underlying credit risk of these investments, as they serve only as collateral for the Company’s receivables. That is, the amount owed to the Company is unaffected by changes in the market value of the investments underlying the funds held.
Unpaid Losses and Loss Expenses
The Company establishes loss reserves to cover the estimated liability for the payment of all losses and loss expenses incurred with respect to premiums earned on the contracts that the Company writes. Loss reserves do not represent an exact calculation of the liability. Estimates of ultimate liabilities are contingent on many future events and the eventual outcome of these events may be different from the assumptions underlying the reserve estimates. The Company believes that the recorded unpaid losses and loss expenses represent Management’s best estimate of the cost to settle the ultimate liabilities based on information available at
December 31, 2014
.
The Non-life reserves for unpaid losses and loss expenses at
December 31, 2014
and
2013
include reserves guaranteed by Colisée Re (see Business—Reserves in Item 1 of Part I and Note 8 to Consolidated Financial Statements included in Item 8 of Part II of this report for a discussion of the Reserve Agreement). At
December 31, 2014
and
2013
, the Company recorded gross and net Non-life reserves for unpaid losses and loss expenses as follows (in millions of U.S. dollars):
|
December 31, 2014
|
December 31, 2013
|
||||||
|
Gross Non-life reserves for unpaid losses and loss expenses
|
$
|
9,746
|
|
$
|
10,646
|
|
|
|
Net Non-life reserves for unpaid losses and loss expenses
|
9,531
|
|
10,379
|
|
|||
|
Net reserves guaranteed by Colisée Re
|
575
|
|
727
|
|
|||
See Business—Reserves—Non-life Reserves in Item 1 of Part I of this report for a reconciliation of the net Non-life reserves for unpaid losses and loss expenses for the years ended
December 31, 2014
,
2013
and
2012
and a discussion of the impact of foreign exchange on unpaid losses and loss expenses.
See Critical Accounting Policies and Estimates—Losses and Loss Expenses and Life Policy Benefits and Review of Net Income —Results by Segment above for a discussion of losses and loss expenses.
118
Policy Benefits for Life and Annuity Contracts
At
December 31, 2014
and
2013
, the Company recorded gross and net policy benefits for life and annuity contracts as follows (in millions of U.S. dollars):
|
December 31, 2014
|
December 31, 2013
|
||||||
|
Gross policy benefits for life and annuity contracts
|
$
|
2,050
|
|
$
|
1,974
|
|
|
|
Net policy benefits for life and annuity contracts
|
2,021
|
|
1,967
|
|
|||
See Business—Reserves in Item 1 of Part I of this report for a reconciliation of the net life and health reserves for the years ended
December 31, 2014
,
2013
and
2012
.
See Critical Accounting Policies and Estimates—Losses and Loss Expenses and Life Policy Benefits and Results by Segment above for a discussion of life policy benefits and health reserves.
Reinsurance Recoverable on Paid and Unpaid Losses
The Company has exposure to credit risk related to reinsurance recoverable on paid and unpaid losses. See Note 9 to Consolidated Financial Statements in Item 8 of Part II of this report and Quantitative and Qualitative Disclosures about Market Risk—Counterparty Credit Risk in Item 7A of Part II of this report for a discussion of the Company’s risk related to reinsurance recoverable on paid and unpaid losses and the Company’s process to evaluate the financial condition of its reinsurers.
At
December 31, 2014
and
2013
, the Company recorded
$244 million
and $274 million, respectively, of reinsurance recoverable on paid and unpaid losses in its Consolidated Balance Sheets. At
December 31, 2014
, the distribution of the Company’s gross reinsurance recoverable on paid and unpaid losses categorized by the reinsurer’s Standard & Poor’s rating was as follows:
|
Rating Category
|
% of total reinsurance recoverable on paid and unpaid losses
|
||
|
AA- or better
|
12
|
%
|
|
|
A- to
A+
|
58
|
|
|
|
Less than A-/Unrated/Other
|
30
|
|
|
|
Total
|
100
|
%
|
|
At
December 31, 2014
, 70% of the Company’s reinsurance recoverable on paid and unpaid losses were due from reinsurers with A- or better rating from Standard & Poor’s, compared to 72% at
December 31, 2013
.
119
Contractual Obligations and Commitments
In the normal course of its business, the Company is a party to a variety of contractual obligations as summarized below. These contractual obligations are considered by the Company when assessing its liquidity requirements and the Company is confident in its ability to meet all of its obligations. Contractual obligations at December 31, 2014 were as follows (in millions of U.S. dollars):
|
Total
|
< 1 year
|
1-3 years
|
3-5 years
|
> 5 years
|
|||||||||||
|
Contractual obligations:
|
|||||||||||||||
|
Operating leases
|
97.1
|
|
27.4
|
|
51.6
|
|
17.4
|
|
0.7
|
|
|||||
|
Other operating agreements
|
13.8
|
|
8.9
|
|
4.0
|
|
0.9
|
|
—
|
|
|||||
|
Other invested assets
(1)
|
136.7
|
|
48.6
|
|
73.2
|
|
9.8
|
|
5.1
|
|
|||||
|
Unpaid losses and loss expenses
(2)
|
9,745.8
|
|
3,203.6
|
|
2,736.9
|
|
1,433.8
|
|
2,371.5
|
|
|||||
|
Policy benefits for life and annuity contracts
(3)
|
2,915.9
|
|
394.9
|
|
613.9
|
|
267.0
|
|
1,640.1
|
|
|||||
|
Deposit liabilities
(3)
|
70.3
|
|
39.2
|
|
25.4
|
|
1.7
|
|
4.0
|
|
|||||
|
Employment agreements
(4)
|
11.3
|
|
5.7
|
|
4.5
|
|
1.0
|
|
0.1
|
|
|||||
|
Other long-term liabilities:
|
|||||||||||||||
|
Senior Notes—principal
(5)
|
750
|
|
—
|
|
—
|
|
250
|
|
500
|
|
|||||
|
Senior Notes—interest
|
211.5
|
|
44.7
|
|
89.4
|
|
63.6
|
|
13.8
|
|
|||||
|
Capital Efficient Notes—principal
(6)
|
63.4
|
|
—
|
|
—
|
|
—
|
|
63.4
|
|
|||||
|
Capital Efficient Notes—interest
|
n/a
|
|
4.1
|
|
8.2
|
|
8.2
|
|
4.1 per annum
|
|
|||||
|
Series D cumulative preferred shares—principal
(7)
|
230
|
|
—
|
|
—
|
|
—
|
|
230
|
|
|||||
|
Series D cumulative preferred shares—dividends
|
n/a
|
|
15.0
|
|
29.9
|
|
29.9
|
|
15.0 per annum
|
|
|||||
|
Series E cumulative preferred shares—principal
(7)
|
374
|
|
—
|
|
—
|
|
—
|
|
374
|
|
|||||
|
Series E cumulative preferred shares—dividends
|
n/a
|
|
27.1
|
|
54.2
|
|
54.2
|
|
27.1 per annum
|
|
|||||
|
Series F non-cumulative preferred shares—principal
(8)
|
250
|
|
—
|
|
—
|
|
—
|
|
250
|
|
|||||
|
Series F non-cumulative preferred shares—dividends
|
n/a
|
|
14.7
|
|
29.4
|
|
29.4
|
|
14.7 per annum
|
|
|||||
n/a: Not applicable
|
(1)
|
The amounts above for other invested assets represent the Company’s expected timing of funding capital commitments related to its strategic investments.
|
|
(2)
|
The Company’s unpaid losses and loss expenses represent Management’s best estimate of the cost to settle the ultimate liabilities based on information available at
December 31, 2014
, and are not fixed amounts payable pursuant to contractual commitments. The timing and amounts of actual loss payments related to these reserves might vary significantly from the Company’s current estimate of the expected timing and amounts of loss payments based on many factors, including large individual losses as well as general market conditions.
|
|
(3)
|
Policy benefits for life and annuity contracts recorded in the Company’s Consolidated Balance Sheet at
December 31, 2014
of
$2,050 million
are computed on a discounted basis, whereas the expected payments by period in the table above are the estimated payments at a future time and do not reflect a discount of the amount payable.
|
|
(4)
|
In 2010, as part of the Company’s integration of Paris Re, the Company announced a voluntary termination plan available to certain eligible employees in France. In April 2013, the Company announced the restructuring of its business support operations into a single integrated worldwide support platform and changes to the structure of its Global Non-life Operations. The restructuring includes involuntary and voluntary employee termination plans in certain jurisdictions (collectively, termination plans). The continuing salary and other employment benefit costs related to the affected employees will be expensed as the employee remains with the Company and provides service. Following their departure from the Company, employees participating in the termination plans continue to receive pre-determined payments related to employment benefits, which were accrued for by the Company under the terms of the termination plans during the years ended December 31, 2010 and 2013, respectively. The amounts in the table above reflect the Company’s remaining obligations to the eligible employees under all of these plans that will be paid through 2021. For further details related to the restructuring in 2013, see Overview above.
|
|
(5)
|
PartnerRe Finance A LLC and PartnerRe Finance B LLC, the issuers of the Senior Notes, do not meet consolidation requirements under U.S. GAAP. Accordingly, the Company shows the related intercompany debt of $750 million in its Consolidated Balance Sheets at December 31, 2014 and 2013. The 6.875% Senior Notes with aggregate principal outstanding of $250 million mature on June 1, 2018 and the 5.500% Senior Notes with aggregate principal outstanding of $500 million mature on June 1, 2020.
|
120
|
(6)
|
PartnerRe Finance II Inc., the issuer of the CENts, does not meet consolidation requirements under U.S. GAAP. Accordingly, the Company shows the related intercompany debt of $71 million in its Consolidated Balance Sheets at
December 31, 2014
and 2013. The CENts will mature on
December 1, 2066
and may be redeemed at the option of the issuer, in whole or in part, after
December 1, 2016
or earlier upon occurrence of specific rating agency or tax events.
|
|
(7)
|
The Company’s Series D and Series E preferred shares are cumulative, perpetual and have no mandatory redemption requirement, but may be redeemed at our option under certain circumstances. The Series D preferred shares can be redeemed at the Company’s option at any time or in part from time to time and the Series E preferred shares can be redeemed at the Company’s option on or after June 1, 2016 or at any time upon certain changes in tax law.
|
|
(8)
|
The Company’s Series F preferred shares are non-cumulative, perpetual and have no mandatory redemption requirement, but may be redeemed at our option under certain circumstances. The Series F preferred shares can be redeemed at the Company’s option at any time or in part from time to time on or after March 1, 2018.
|
The Contractual Obligations and Commitments table above does not include an estimate of the period of cash settlement of its tax liabilities with the respective taxing authorities given the Company cannot make a reasonably reliable estimate of the timing of cash settlements.
Due to the limited nature of the information presented above, it should not be considered indicative of the Company’s liquidity or capital needs. See Liquidity below.
The Company has committed to a
10
year structured letter of credit facility issued by a high credit quality international bank, which has a final maturity of
December 29, 2020
. At December 31, 2014 and 2013, the Company's participation in the facility was
$61 million
and $100 million, respectively. At
December 31, 2014
, the letter of credit facility has not been drawn down and can only be drawn down in the event of certain specific scenarios, which the Company considers remote. Unless cancelled by the bank, the credit facility automatically extends for one year, each year until maturity.
Shareholders’ Equity and Capital Resources Management
Shareholders’ equity attributable to PartnerRe Ltd. common shareholders was
$7.0 billion
at
December 31, 2014
, a 5% increase compared to $6.7 billion at
December 31, 2013
. The major factors contributing to the increase in shareholders’ equity
during the year ended December 31, 2014
were:
|
•
|
comprehensive income of
$1,033 million
, which was primarily related to net income; partially offset by
|
|
•
|
a net decrease of
$503 million
, due to the repurchase of common shares of $
551 million
under the Company’s share repurchase program, partially offset by the issuance of common shares under the Company’s employee equity plans of $
48 million
; and
|
|
•
|
dividend payments of $
191 million
related to the Company’s common and preferred shares.
|
See Results of Operations and Review of Net Income above for a discussion of the Company’s net income for the
year ended December 31, 2014
.
As part of its long-term strategy, the Company will continue to actively manage capital resources to support its operations throughout the reinsurance cycle and for the benefit of its shareholders, subject to the ability to maintain strong ratings from the major rating agencies and the unquestioned ability to pay claims as they arise. Generally, the Company seeks to increase its capital when its current capital position is not sufficient to support the volume of attractive business opportunities available. Conversely, the Company will seek to reduce its capital, through the payment of dividends on its common shares or share repurchases, when available business opportunities are insufficient or unattractive to fully utilize the Company’s capital at adequate returns. The Company may also seek to reduce or restructure its capital through the repayment or purchase of debt obligations, or increase or restructure its capital through the issuance of debt, when opportunities arise.
Management uses certain key measures to evaluate its financial performance and the overall growth in value generated for the Company’s common shareholders. For a discussion related to growth in Diluted Tangible Book Value per Share plus dividends see Key Financial Measures above.
121
The capital structure of the Company at
December 31, 2014
and
2013
was as follows (in millions of U.S. dollars):
|
|
December 31, 2014
|
December 31, 2013
|
|||||||||||
|
Capital Structure:
|
|||||||||||||
|
Senior notes
(1)
|
$
|
750
|
|
9
|
%
|
$
|
750
|
|
10
|
%
|
|||
|
Capital efficient notes
(2)
|
63
|
|
1
|
|
63
|
|
1
|
|
|||||
|
Preferred shares, aggregate liquidation value
|
854
|
|
11
|
|
854
|
|
11
|
|
|||||
|
Common shareholders’ equity attributable to PartnerRe Ltd.
|
6,195
|
|
79
|
|
5,856
|
|
78
|
|
|||||
|
Total Capital
|
$
|
7,862
|
|
100
|
%
|
$
|
7,523
|
|
100
|
%
|
|||
|
(1)
|
PartnerRe Finance A LLC and PartnerRe Finance B LLC, the issuers of the Senior Notes, do not meet consolidation requirements under U.S. GAAP. Accordingly, the Company shows the related intercompany debt of $750 million in its Consolidated Balance Sheets at
December 31, 2014
and
2013
.
|
|
(2)
|
PartnerRe Finance II Inc., the issuer of the CENts, does not meet consolidation requirements under U.S. GAAP. Accordingly, the Company shows the related intercompany debt of $71 million in its Consolidated Balance Sheets at
December 31, 2014
and
2013
.
|
The increase in total capital during
2014
was related to the same factors above describing the increase in shareholders’ equity attributable to PartnerRe Ltd.
Senior Notes
In March 2010, PartnerRe Finance B LLC (PartnerRe Finance B), an indirect
100%
owned subsidiary of the parent company, issued
$500 million
aggregate principal amount of
5.500%
Senior Notes (2010 Senior Notes, or collectively with the 2008 Senior Notes defined below referred to as Senior Notes). The 2010 Senior Notes will mature on
June 1, 2020
and may be redeemed at the option of the issuer, in whole or in part, at any time. Interest on the 2010 Senior Notes is payable
semi-annually
and commenced on
June 1, 2010
at an annual fixed rate of
5.500%
, and cannot be deferred.
The 2010 Senior Notes are ranked as senior unsecured obligations of PartnerRe Finance B. The parent company has fully and unconditionally guaranteed all obligations of PartnerRe Finance B under the 2010 Senior Notes. The parent company’s obligations under this guarantee are senior and unsecured and rank equally with all other senior unsecured indebtedness of the parent company.
Contemporaneously, PartnerRe U.S. Holdings, a wholly-owned subsidiary of the parent company, issued a
5.500%
promissory note, with a principal amount of
$500 million
to PartnerRe Finance B. Under the terms of the promissory note, PartnerRe U.S. Holdings promises to pay to PartnerRe Finance B the principal amount on
June 1, 2020
, unless previously paid. Interest on the promissory note commenced on
June 1, 2010
and is payable
semi-annually
at an annual fixed rate of
5.500%
, and cannot be deferred.
For each of the years ended
December 31, 2014
,
2013
and
2012
, the Company incurred interest expense and paid interest of $27.5 million in relation to the 2010 Senior Notes issued by PartnerRe Finance B.
In May 2008, PartnerRe Finance A LLC (PartnerRe Finance A), an indirect
100%
owned subsidiary of the parent company, issued
$250 million
aggregate principal amount of
6.875%
Senior Notes (2008 Senior Notes, or collectively with 2010 Senior Notes referred to as Senior Notes). The 2008 Senior Notes will mature on
June 1, 2018
and may be redeemed at the option of the issuer, in whole or in part, at any time. Interest on the 2008 Senior Notes is payable
semi-annually
and commenced on
December 1, 2008
at an annual fixed rate of
6.875%
, and cannot be deferred.
The 2008 Senior Notes are ranked as senior unsecured obligations of PartnerRe Finance A. The parent company has fully and unconditionally guaranteed all obligations of PartnerRe Finance A under the 2008 Senior Notes. The parent company’s obligations under this guarantee are senior and unsecured and rank equally with all other senior unsecured indebtedness of the parent company.
Contemporaneously, PartnerRe U.S. Holdings issued a
6.875%
promissory note, with a principal amount of
$250 million
to PartnerRe Finance A. Under the terms of the promissory note, PartnerRe U.S. Holdings promises to pay to PartnerRe Finance A the principal amount on
June 1, 2018
, unless previously paid. Interest on the promissory note is payable
semi-annually
and commenced on
December 1, 2008
at an annual fixed rate of
6.875%
, and cannot be deferred.
For each of the years ended
December 31, 2014
,
2013
and
2012
, the Company incurred interest expense and paid interest of $17.2 million in relation to the 2008 Senior Notes issued by PartnerRe Finance A.
122
Capital Efficient Notes (CENts)
In November 2006, PartnerRe Finance II Inc. (PartnerRe Finance II), an indirect
100%
owned subsidiary of the parent company, issued
$250 million
aggregate principal amount of
6.440%
Fixed-to-Floating Rate Junior Subordinated CENts. The CENts will mature on
December 1, 2066
and may be redeemed at the option of the issuer, in whole or in part, after
December 1, 2016
or earlier upon occurrence of specific rating agency or tax events. Interest on the CENts is payable
semi-annually
and commenced on
June 1, 2007
through to
December 1, 2016
at an annual fixed rate of
6.440%
and will be payable
quarterly
thereafter until maturity at an annual rate of
3-month LIBOR
plus a margin equal to
2.325%
.
PartnerRe Finance II may elect to defer one or more interest payments for up to ten years, although interest will continue to accrue and compound at the rate of interest applicable to the CENts. The CENts are ranked as junior subordinated unsecured obligations of PartnerRe Finance II. The parent company has fully and unconditionally guaranteed on a subordinated basis all obligations of PartnerRe Finance II under the CENts. The parent company’s obligations under this guarantee are unsecured and rank junior in priority of payments to the parent company’s Senior Notes.
Contemporaneously, PartnerRe U.S. Holdings issued a
6.440%
Fixed-to-Floating Rate promissory note, with a principal amount of
$257.6 million
to PartnerRe Finance II. Under the terms of the promissory note, PartnerRe U.S. Holdings promises to pay to PartnerRe Finance II the principal amount on
December 1, 2066
, unless previously paid. Interest on the promissory note is payable
semi-annually
and commenced on
June 1, 2007
through to
December 1, 2016
at an annual fixed rate of
6.440%
and will be payable
quarterly
thereafter until maturity at an annual rate of
3-month LIBOR
plus a margin equal to
2.325%
.
On March 13, 2009, PartnerRe Finance II, under the terms of a tender offer, paid holders
$500
per
$1,000
principal amount of CENts tendered, and purchased approximately
75%
of the issue, or
$186.6 million
, for
$93.3 million
. Contemporaneously, under the terms of a cross receipt agreement, PartnerRe U.S. Holdings paid PartnerRe Finance II consideration of
$93.3 million
for the extinguishment of
$186.6 million
of the principal amount of PartnerRe U.S. Holdings’ 6.440% Fixed-to-Floating Rate promissory note due December 1, 2066. All other terms and conditions of the remaining CENts and promissory note remain unchanged. A pre-tax gain of
$88.4 million
, net of deferred issuance costs and fees, was realized on the foregoing transactions during the year ended December 31, 2009. At
December 31, 2014
and
2013
, the aggregate principal amount of the CENts and promissory note outstanding was
$63.4 million
and
$71.0 million
, respectively.
For each of the years ended
December 31, 2014
,
2013
and
2012
, the Company incurred interest expense and paid interest of $4.6 million in relation to the CENts.
The Company did not enter into any short-term borrowing arrangements during the year ended
December 31, 2014
.
Shareholders’ Equity
Share Repurchases
In September 2014, the Board approved a new share repurchase authorization of up to a total of 5 million common shares, which replaced the prior authorization of 6 million common shares approved in September 2013. Unless terminated earlier by resolution of the Board, the program expires when the authorization limits are exhausted. At
December 31, 2014
, the Company had approximately 3.4 million common shares remaining under its current share repurchase authorization and approximately
39.4 million
common shares were held in treasury and are available for reissuance. Following the announcement of the Amalgamation with AXIS, the Company suspended its repurchase activities.
During
2014
, the Company repurchased approximately
5.2 million
of its common shares under its authorized share repurchase program at a total cost of
$551 million
, representing an average cost of
$106.30
per share. These shares were repurchased at a discount to diluted book value per share at
December 31, 2013
of approximately 3%.
Subsequently, during the period from January 1, 2015 to the announcement of the Amalgamation with AXIS on January 25, 2015, the Company repurchased 0.5 million common shares at a total cost of $59 million, representing an average cost of $112.89 per share. Following these repurchases, the Company had approximately 2.9 million common shares remaining under its current share repurchase authorization and approximately 39.9 million common shares are held in treasury and are available for reissuance.
Redeemable Preferred Shares
At
December 31, 2014
, the Company had Series D and Series E cumulative redeemable preferred shares and Series F non-cumulative redeemable preferred shares outstanding as follows (in millions of U.S. dollars or shares, except percentage amounts):
123
|
Series D
|
Series E
|
Series F
|
||||||||||
|
Date of issuance
|
November 2004
|
|
June 2011
|
|
February 2013
|
|
||||||
|
Number of preferred shares issued
|
9.2
|
|
15.0
|
|
10.0
|
|
||||||
|
Annual dividend rate
|
6.5
|
%
|
7.25
|
%
|
5.875
|
%
|
||||||
|
Total consideration
|
$
|
222.3
|
|
$
|
361.7
|
|
$
|
242.3
|
|
|||
|
Underwriting discounts and commissions
|
$
|
7.7
|
|
$
|
12.1
|
|
$
|
7.7
|
|
|||
|
Aggregate liquidation value
|
$
|
230.0
|
|
$
|
373.8
|
|
$
|
250.0
|
|
|||
|
Date of redemption
|
n/a
|
|
n/a
|
|
n/a
|
|
||||||
n/a: Not applicable
The Company may redeem each of the Series D, E and F preferred shares at $25.00 per share plus accrued and unpaid dividends without interest as follows: (i) the Series D preferred shares can be redeemed at the Company’s option at any time or in part from time to time; (ii) the Series E preferred shares can be redeemed at the Company’s option on or after June 1, 2016 or at any time upon certain changes in tax law and (iii) the Series F preferred shares can be redeemed at the Company’s option at any time or in part from time to time on or after March 1, 2018. The Company may also redeem the Series F preferred shares at any time upon the occurrence of a certain “capital disqualification event” or certain changes in tax law. Dividends on the Series F preferred shares are non-cumulative and are payable quarterly.
Dividends on each of the Series D and E preferred shares are cumulative from the date of issuance and are payable quarterly in arrears. Dividends on Series F preferred shares are non-cumulative and are payable quarterly.
In the event of liquidation of the Company, each of the Series D, E and F preferred shares rank on parity with each of the other series of preferred shares and would rank senior to the common shares. The holders of the Series D and E preferred shares would receive a distribution of $25.00 per share, or the aggregate liquidation value, plus accrued but unpaid dividends, if any. The holders of the Series F would receive a distribution of $25.00 per share, or the aggregate liquidation value, plus declared and unpaid dividends, if any.
Liquidity
Liquidity is a measure of the Company’s ability to access sufficient cash flows to meet the short-term and long-term cash requirements of its business operations. Management believes that its significant cash flows from operations and high quality liquid investment portfolio will provide sufficient liquidity for the foreseeable future. At
December 31, 2014
and
2013
, cash and cash equivalents were $
1.3 billion
and
$1.5 billion, respectively
. The decrease in cash and cash equivalents of $183 million was primarily due to the Company’s share repurchases, dividend payments and taxes paid, which was partially offset by cash provided by underwriting activities and investment income.
Net cash provided by operating activities of
$853 million
in
2014
increased from $827 million in
2013
. The net cash provided by operating activities in
2014
was due to higher underwriting cash flows, which were offset by higher taxes paid and lower investment income compared to
2013
.
Net cash used in investing activities was $250 million in
2014
compared to net cash provided by investing activities of $418 million in
2013
. The net cash used in investing activities in
2014
primarily reflects the investment of net cash flows from operating activities after the net cash flows from operating activities used to fund financing activities, as described below. The net cash provided by investing activities in
2013
reflects the sale and maturity of investments to fund financing activities.
Net cash used in financing activities was
$736 million
in
2014
compared to $866 million in
2013
. Net cash used in financing activities in
2014
and
2013
was primarily related to the Company’s share repurchases and dividend payments on common and preferred shares, which was primarily sourced from net cash provided by operating activities. Net cash used in financing activities in
2013
was also related to the Company’s redemption of the Series C preferred shares, which was partially offset by proceeds from the issuance of the Series F preferred shares.
The parent company is a holding company with no operations or significant assets other than its investments in its subsidiaries and other intercompany balances. The parent company has cash outflows in the form of other expenses, interest payments related to its debt, dividends to both common and preferred shareholders and, from time to time, cash outflows for principal repayments related to its debt, and the repurchase of its common shares under its share repurchase program. For the year ended
December 31, 2014
, the parent company incurred other expenses of $58 million, common dividends were $134 million, preferred dividends were
$57 million
and share repurchases were
$551 million
. In February
2015
, the Company announced that it was increasing its quarterly dividend to $0.70 per common share or approximately $134 million in total for
2015
, assuming a constant number of common
124
shares outstanding and a constant dividend rate, and it will declare approximately $57 million in dividends to preferred shareholders in
2015
.
The Company’s ability to pay common and preferred shareholders’ dividends and its corporate expenses is dependent mainly on cash dividends from PartnerRe Bermuda, PartnerRe Europe and PartnerRe U.S. (collectively, the reinsurance subsidiaries), which are the Company’s most significant subsidiaries. The payment of such dividends by the reinsurance subsidiaries to the Company is limited under Bermuda and Irish laws and certain statutes of various U.S. states in which PartnerRe U.S. is licensed to transact business. The restrictions are generally based on net income and/or certain levels of policyholders’ earned surplus as determined in accordance with the relevant statutory accounting practices. At
December 31, 2014
, there were no restrictions on the Company’s ability to pay common and preferred shareholders’ dividends from its retained earnings, except for the reinsurance subsidiaries’ dividend restrictions as described in Note 14 to Consolidated Financial Statements in Item 8 of Part II of this report.
The reinsurance subsidiaries of the Company depend upon cash inflows from the collection of premiums as well as investment income and proceeds from the sales and maturities of investments to meet their obligations. Cash outflows are in the form of claims payments, purchase of investments, other expenses, income tax payments, intercompany payments as well as dividend payments to the holding company, and additionally, in the case of PartnerRe U.S. Holdings, interest payments on the Senior Notes and the CENts. At
December 31, 2014
, PartnerRe U.S. Holdings and its subsidiaries have $750 million in Senior Notes and $63 million of CENts outstanding and will pay approximately $49 million in aggregate interest payments in
2015
related to this debt.
Historically, the operating subsidiaries of the Company have generated sufficient cash flows to meet all of their obligations. Because of the inherent volatility of the business written by the Company, the seasonality in the timing of payments by cedants, the irregular timing of loss payments, the impact of a change in interest rates and credit spreads on the investment income as well as seasonality in coupon payment dates for fixed income securities, cash flows from operating activities may vary significantly between periods. The Company believes that annual positive cash flows from operating activities will be sufficient to cover claims payments, absent a series of additional large catastrophic loss activity. In the event that paid losses accelerate beyond the ability to fund such payments from operating cash flows, the Company would use its cash and cash equivalents balances available, liquidate a portion of its high quality and liquid investment portfolio or access certain uncommitted credit facilities. As discussed in Investments above, the Company’s investments and cash and cash equivalents (excluding the funds held - directly managed account) totaled $
16.6 billion
at
December 31, 2014
, the main components of which were investment grade fixed maturities, short-term investments and cash and cash equivalents totaling $14.1 billion.
Financial strength ratings and senior unsecured debt ratings represent the opinions of rating agencies on the Company’s capacity to meet its obligations. In the event of a significant downgrade in ratings, the Company’s ability to write business and to access the capital markets could be impacted. Some of the Company’s reinsurance treaties contain special funding and termination clauses that would be triggered in the event the Company or one of its subsidiaries is downgraded by one of the major rating agencies to levels specified in the treaties, or the Company’s capital is significantly reduced. If such an event were to occur, the Company would be required, in certain instances, to post collateral in the form of letters of credit and/or trust accounts against existing outstanding losses, if any, related to the treaty. In a limited number of instances, the subject treaties could be canceled retroactively or commuted by the cedant.
The Company’s current financial strength ratings are as follows:
|
Standard & Poor’s
|
|
A+
|
Credit Watch Negative
|
|
Moody’s
|
|
A1
|
|
|
A.M. Best
|
|
A+
|
Under Review with Negative Implications
|
|
Fitch
|
|
AA-
|
Ratings Watch Negative
|
Following the announcement of the Company's proposed Amalgamation with AXIS, Moody's affirmed the Company's rating with a stable outlook. Standard & Poor's, A.M. Best and Fitch placed the Company’s rating on credit watch negative, under review with negative implications and ratings watch negative, respectively. All three agencies cited concerns over the transaction, including the risks associated with the execution and integration, along with management retention risk in light of the complexity and scale of the Amalgamation. The Company is in dialogue with each rating agency to address their rating concerns. The status of any further changes to ratings or outlooks will depend on various factors, including the timing of the closing, if and when it occurs, and success of the integration.
Credit Agreements
In the normal course of its operations, the Company enters into agreements with financial institutions to obtain unsecured and secured letter of credit facilities. At
December 31, 2014
, the total amount of such credit facilities available to the Company was approximately
$843 million
, with each of the significant facilities described below. Under the terms of certain reinsurance
125
agreements, irrevocable letters of credit were issued on an unsecured and secured basis in the amount of
$122 million
and
$420 million
, respectively, at
December 31, 2014
, in respect of reported loss and unearned premium reserves.
The Company maintains a
$300 million
combined credit facility, with the first
$100 million
being unsecured and any utilization above the initial $100 million being secured. This credit facility matures on
November 14, 2015
.
In addition, the Company maintains committed secured letter of credit facilities. These facilities are used for the issuance of letters of credit, which must be fully secured with cash and/or government bonds and/or investment grade bonds. The agreements include default covenants, which could require the Company to fully secure the outstanding letters of credit to the extent that the facility is not already fully secured, and disallow the issuance of any new letters of credit. Included in the Company’s secured credit facilities at
December 31, 2014
is a
$300 million
secured credit facility, which matures on
December 31, 2018
, and a
$140 million
secured credit facility, which matures on
December 31, 2017
. At
December 31, 2014
, no conditions of default existed under these facilities.
Currency
The Company’s reporting currency is the U.S. dollar. The Company has exposure to foreign currency risk due to both its ownership of its Irish, French and Canadian subsidiaries and branches, whose functional currencies are the euro and the Canadian dollar, and to underwriting reinsurance exposures, collecting premiums and paying claims and other expenses in currencies other than the U.S. dollar and holding certain net assets in such currencies, where the Company’s most significant foreign currency exposure is to the euro.
At
December 31, 2014, the value of the U.S. dollar strengthened against most major currencies compared to December 31, 2013, which resulted in a decrease in the U.S. dollar value of the assets and liabilities denominated in non-U.S. dollar currencies. See Results of Operations and Review of Net Income above for a discussion of the impact of foreign exchan
ge and net foreign exchange gains and losses during the years ended
December 31, 2014
,
2013
and
2012
.
The foreign exchange gain or loss resulting from the translation of the Company’s subsidiaries’ and branches’ financial statements (expressed in euro or Canadian dollar functional currency) into U.S. dollars is classified in the currency translation adjustment account, which is a component of accumulated other comprehensive income or loss in shareholders’ equity. The currency translation adjustment account decreased by $
9 million
during the year ended December 31,
2014
compared to a decrease of $32 million and an increase of $29 million during the years ended December 31, 2013 and 2012, respectively, primarily due to the translation of the Company’s subsidiaries and branches, whose functional currencies are the Canadian dollar and the euro.
The reconciliation of the currency translation adjustment for the years ended
December 31, 2014
,
2013
and
2012
was as follows (in millions of U.S. dollars):
|
2014
|
2013
|
2012
|
||||||||||
|
Currency translation adjustment at beginning of year
|
$
|
1
|
|
$
|
33
|
|
$
|
4
|
|
|||
|
Change in currency translation adjustment
|
(9
|
)
|
(32
|
)
|
29
|
|
||||||
|
Currency translation adjustment at end of year
|
$
|
(8
|
)
|
$
|
1
|
|
$
|
33
|
|
|||
From time to time, the Company enters into net investment hedges. At
December 31, 2014
, there were no outstanding foreign exchange contracts hedging the Company’s net investment exposure.
See Quantitative and Qualitative Disclosures About Market Risk—Foreign Currency Risk in Item in Item 7A of Part II below for a discussion of the Company’s risk related to changes in foreign currency movements.
Effects of Inflation
The effects of inflation are considered implicitly in pricing and estimating reserves for unpaid losses and loss expenses. The actual effects of inflation on the results of operations of the Company cannot be accurately known until claims are ultimately settled.
New Accounting Pronouncements
See Note 2(u) to the Consolidated Financial Statements included in Item 8 of Part II of this report.
126
|
ITEM 7A.
|
QUANTITATIVE AND QUALITATIVE DISCLOSURES ABOUT MARKET RISK
|
Overview
Management believes that the Company is principally exposed to five types of market related risk: interest rate risk, credit spread risk, foreign currency risk, counterparty credit risk and equity price risk. How these risks relate to the Company, and the process used to manage them, is discussed below.
As discussed above in this report, the Company’s investment philosophy distinguishes between assets that are generally matched against the estimated net reinsurance liabilities (liability funds) and those assets that represent shareholder capital (capital funds). Liability funds are invested in a way that generally matches them to the corresponding liabilities in both duration and currency composition to provide a natural hedge against changes in interest rates and foreign exchange rates.
The Company’s investment philosophy is to reduce foreign currency risk on capital funds by investing primarily in U.S. dollar denominated investments. In considering the market risk of capital funds, it is important to recognize the benefits of portfolio diversification. Although these asset classes in isolation may introduce more risk into the portfolio, market forces have a tendency to influence each class in different ways and at different times. Consequently, the aggregate risk introduced by a portfolio of these assets should be less than might be estimated by summing the individual risks.
Although the focus of this discussion is to identify risk exposures that impact the market value of assets alone, it is important to recognize that the risks discussed herein are significantly mitigated to the extent that the Company’s investment strategy allows market forces to influence the economic valuation of assets and liabilities in a way that is generally offsetting.
As described above in this report, the Company’s investment strategy allows the use of derivative investments, subject to strict limitations. The Company also imposes a high standard for the credit quality of counterparties in all derivative transactions and aims to diversify its counterparty credit risk exposure. See Note 6 to the Consolidated Financial Statements in Item 8 of Part II of this report for additional information related to derivatives.
The following addresses those areas where the Company believes it has exposure to material market risk in its operations.
Interest Rate Risk
The Company’s fixed maturity portfolio and the fixed maturity securities in the investment portfolio underlying the funds held - directly managed account are exposed to interest rate risk. Fluctuations in interest rates have a direct impact on the market valuation of these securities. The Company manages interest rate risk on liability funds by constructing bond portfolios in which the economic impact of a general interest rate shift is comparable to the impact on the related liabilities. The Company believes that this process of matching the duration mitigates the overall interest rate risk on an economic basis. For unpaid loss reserves and policy benefits related to non-life and traditional life business, the estimated duration of the Company’s liabilities is based on projected claims payout patterns. For policy benefits related to annuity business, the Company estimates duration based on its commitment to annuitants. The Company manages the exposure to interest rate volatility on capital funds by choosing a duration profile that it believes will optimize the risk-reward relationship.
While this matching of duration insulates the Company from the economic impact of interest rate changes, changes in interest rates do impact the Company’s shareholders’ equity. The Company’s liabilities are carried at their nominal value, and are not adjusted for changes in interest rates, with the exception of certain policy benefits for life and annuity contracts and deposit liabilities that are interest rate sensitive. However, substantially all of the Company’s invested assets (including the investments underlying the funds held - directly managed account) are carried at fair value, which reflects such changes. As a result, an increase in interest rates will result in a decrease in the fair value of the Company’s investments (including the investments underlying the funds held - directly managed account) and a corresponding decrease, net of applicable taxes, in the Company’s shareholders’ equity. A decrease in interest rates would have the opposite effect.
At
December 31, 2014
, the Company held approximately
$3,492 million
of its total invested assets in mortgage/asset-backed securities. These assets are exposed to prepayment risk, the adverse impact of which is more evident in a declining interest rate environment.
127
At
December 31, 2014
, the Company estimates that the hypothetical case of an immediate 100 basis points or 200 basis points parallel shift in global bond curves would result in a change in the fair value of investments exposed to interest rate risk, the fair value of funds held – directly managed account exposed to interest rate risk, total invested assets, and shareholders’ equity attributable to PartnerRe Ltd. as follows (in millions of U.S. dollars):
|
-200 Basis
Points |
%
Change
|
-100 Basis
Points |
%
Change
|
December 31,
2014 |
+100 Basis
Points |
%
Change
|
+200 Basis
Points |
%
Change
|
|||||||||||||||||||||||
|
Fair value of investments exposed to interest rate risk
(1)(2)
|
$
|
15,906
|
|
7
|
%
|
$
|
15,364
|
|
4
|
%
|
$
|
14,822
|
|
$
|
14,280
|
|
(4
|
)%
|
$
|
13,738
|
|
(7
|
)%
|
||||||||
|
Fair value of funds held – directly managed account exposed to interest rate risk
(2)
|
536
|
|
7
|
|
519
|
|
3
|
|
502
|
|
485
|
|
(3
|
)
|
468
|
|
(7
|
)
|
|||||||||||||
|
Total invested assets
(3)
|
18,411
|
|
6
|
|
17,852
|
|
3
|
|
17,293
|
|
16,734
|
|
(3
|
)
|
16,175
|
|
(6
|
)
|
|||||||||||||
|
Shareholders’ equity attributable to PartnerRe Ltd.
|
8,167
|
|
16
|
|
7,608
|
|
8
|
|
7,049
|
|
6,490
|
|
(8
|
)
|
5,931
|
|
(16
|
)
|
|||||||||||||
|
(1)
|
Includes certain other invested assets, certain cash and cash equivalents and funds holding fixed income securities.
|
|
(2)
|
Excludes accrued interest.
|
|
(3)
|
Includes total investments, cash and cash equivalents, the investment portfolio underlying the funds held – directly managed account and accrued interest.
|
The changes do not take into account any potential mitigating impact from the equity market, taxes or the corresponding change in the economic value of the Company’s reinsurance liabilities, which, as noted above, would substantially offset the economic impact on invested assets, although the offset would not be reflected in the Consolidated Balance Sheet.
As discussed above, the Company strives to match the foreign currency exposure in its fixed income portfolio to its multicurrency liabilities. The Company believes that this matching process creates a diversification benefit. Consequently, the exact market value effect of a change in interest rates will depend on which countries experience interest rate changes and the foreign currency mix of the Company’s fixed maturity portfolio at the time of the interest rate changes. See Foreign Currency Risk below.
The impact of an immediate change in interest rates on the fair value of investments and funds held – directly managed exposed to interest rate risk, the Company’s total invested assets and shareholders’ equity attributable to PartnerRe Ltd., as a percentage of total invested assets and shareholders’ equity attributable to PartnerRe Ltd., has not changed significantly at
December 31, 2014
compared to
December 31, 2013
, and has increased in absolute terms at
December 31, 2014
compared to
December 31, 2013
as a result of an increase in the duration of fixed income investments.
Interest rate movements also affect the economic value of the Company’s outstanding debt obligations and preferred securities in the same way that they affect the Company’s fixed maturity investments. This can result in a liability whose economic value is different from the carrying value reported in the Consolidated Balance Sheet given the Company records the carrying value of its outstanding debt obligations and preferred securities at the original issued principal amount. The Company believes that the economic fair value of its outstanding Senior Notes, CENts and preferred shares at
December 31, 2014
was as follows (in millions of U.S. dollars):
|
Carrying Value
|
Fair Value
|
|||||||
|
Debt related to Senior Notes
(1)
|
$
|
750
|
|
$
|
854
|
|
||
|
Debt related to Capital Efficient Notes
(2)
|
63
|
|
62
|
|
||||
|
Series D cumulative preferred shares
|
230
|
|
247
|
|
||||
|
Series E cumulative preferred shares
|
374
|
|
398
|
|
||||
|
Series F non-cumulative preferred shares
|
250
|
|
234
|
|
||||
|
(1)
|
PartnerRe Finance A LLC and PartnerRe Finance B LLC, the issuers of the Senior Notes, do not meet consolidation requirements under U.S. GAAP. Accordingly, the Company shows the related intercompany debt of $750 million in its Consolidated Balance Sheets at
December 31, 2014
and
2013
.
|
|
(2)
|
PartnerRe Finance II Inc., the issuer of the CENts, does not meet consolidation requirements under U.S. GAAP. Accordingly, the Company shows the related intercompany debt of $71 million in its Consolidated Balance Sheets at
December 31, 2014
and
2013
.
|
128
The fair value of the debt related to Senior Notes issued by PartnerRe Finance B LLC, PartnerRe Finance A LLC and the CENts was calculated based on discounted cash flow models using observable market yields and contractual cash flows based on the aggregate principal amount outstanding of $500 million from PartnerRe Finance B LLC, $250 million from PartnerRe Finance A and $63 million from PartnerRe Finance II, respectively. For the Company’s Series D and Series E cumulative preferred shares, and the Series F non-cumulative preferred shares, fair value is based on quoted market prices, while carrying value is based on the aggregate liquidation value of the shares.
The fair value of the Company’s preferred shares and outstanding debt obligations increased at
December 31, 2014
compared to
December 31, 2013
, primarily due to a decrease in risk-free interest rates.
Credit Spread Risk
The Company’s fixed maturity portfolio and the fixed maturity securities in the investment portfolio underlying the funds held – directly managed account are exposed to credit spread risk. Fluctuations in market credit spreads have a direct impact on the market valuation of these securities. The Company manages credit spread risk by the selection of securities within its fixed maturity portfolio. Changes in credit spreads directly affect the market value of certain fixed maturity securities, but do not necessarily result in a change in the future expected cash flows associated with holding individual securities. Other factors, including liquidity, supply and demand, and changing risk preferences of investors, may affect market credit spreads without any change in the underlying credit quality of the security.
As with interest rates, changes in credit spreads impact the shareholders’ equity of the Company as invested assets are carried at fair value, which includes changes in credit spreads. As a result, an increase in credit spreads will result in a decrease in the fair value of the Company’s investments (including the investment portfolio underlying the funds held – directly managed account) and a corresponding decrease, net of applicable taxes, in the Company’s shareholders’ equity. A decrease in credit spreads would have the opposite effect.
At
December 31, 2014
, the Company estimates that the hypothetical case of an immediate 100 basis points or 200 basis points parallel shift in global credit spreads would result in a change in the fair value of investments and the fair value of funds held –directly managed account exposed to credit spread risk, total invested assets and shareholders’ equity attributable to PartnerRe Ltd. as follows (in millions of U.S. dollars):
|
-200 Basis
Points |
%
Change
|
-100 Basis
Points |
%
Change
|
December 31,
2014 |
+100 Basis
Points |
%
Change
|
+200 Basis
Points |
%
Change
|
|||||||||||||||||||||||
|
Fair value of investments exposed to credit spread risk
(1)(2)
|
$
|
15,688
|
|
6
|
%
|
$
|
15,255
|
|
3
|
%
|
$
|
14,822
|
|
$
|
14,389
|
|
(3
|
)%
|
$
|
13,956
|
|
(6
|
)%
|
||||||||
|
Fair value of funds held – directly managed account exposed to credit spread risk
(2)
|
518
|
|
3
|
|
510
|
|
2
|
|
502
|
|
494
|
|
(2
|
)
|
486
|
|
(3
|
)
|
|||||||||||||
|
Total invested assets
(3)
|
18,175
|
|
5
|
|
17,734
|
|
3
|
|
17,293
|
|
16,852
|
|
(3
|
)
|
16,411
|
|
(5
|
)
|
|||||||||||||
|
Shareholders’ equity attributable to PartnerRe Ltd.
|
7,931
|
|
13
|
|
7,490
|
|
6
|
|
7,049
|
|
6,608
|
|
(6
|
)
|
6,167
|
|
(13
|
)
|
|||||||||||||
|
(1)
|
Includes certain other invested assets, certain cash and cash equivalents and funds holding fixed income securities.
|
|
(2)
|
Excludes accrued interest.
|
|
(3)
|
Includes total investments, cash and cash equivalents, the investment portfolio underlying the funds held – directly managed account and accrued interest.
|
The changes above also do not take into account any potential mitigating impact from the equity market, taxes, and the change in the economic value of the Company’s reinsurance liabilities, which may offset the economic impact on invested assets.
The impact of an immediate change in credit spreads on the fair value of investments and funds held – directly managed exposed to credit spread risk, the Company’s total invested assets and shareholders’ equity attributable to PartnerRe Ltd., in both absolute terms and as a percentage of total invested assets and shareholders’ equity attributable to PartnerRe Ltd., has not changed significantly at
December 31, 2014
compared to
December 31, 2013
.
Foreign Currency Risk
Through its multinational reinsurance operations, the Company conducts business in a variety of non-U.S. currencies, with the principal exposures being the euro, British pound, Canadian dollar, Singapore dollar and New Zealand dollar. As the Company’s
129
reporting currency is the U.S. dollar, foreign exchange rate fluctuations may materially impact the Company’s Consolidated Financial Statements.
The Company is generally able to match its liability funds against its net reinsurance liabilities both by currency and duration to protect the Company against foreign exchange and interest rate risks. However, a natural offset does not exist for all currencies. For the non-U.S. dollar currencies for which the Company deems the net asset or liability exposures to be material, the Company employs a hedging strategy utilizing foreign exchange forward contracts and other derivative financial instruments, as appropriate, to reduce exposure and more appropriately match the liability funds by currency. The Company does not hedge currencies for which its asset or liability exposures are not material or where it is unable or impractical to do so. In such cases, the Company is exposed to foreign currency risk. However, the Company does not believe that the foreign currency risks corresponding to these unhedged positions are material, except for those related to the Company’s capital funds.
For the Company’s capital funds, including its net investment in foreign subsidiaries and branches and equity securities, the Company does not typically employ hedging strategies. However, from time to time the Company does enter into net investment hedges to offset foreign exchange volatility (see Currency in Item 7 of Part II of this report).
The Company’s gross and net exposure in its Consolidated Balance Sheet at
December 31, 2014
to foreign currency as well as the associated foreign currency derivatives the Company has entered into to manage this exposure, was as follows (in millions of U.S. dollars):
|
euro
|
GBP
|
CAD
|
SGD
|
NZD
|
Other
|
Total
(1)
|
|||||||||||||||||||||
|
Total assets
|
$
|
3,582
|
|
$
|
1,813
|
|
$
|
932
|
|
$
|
156
|
|
$
|
117
|
|
$
|
746
|
|
$
|
7,346
|
|
||||||
|
Total liabilities
|
(3,724
|
)
|
(1,237
|
)
|
(446
|
)
|
(23
|
)
|
(241
|
)
|
(1,480
|
)
|
(7,151
|
)
|
|||||||||||||
|
Total gross foreign currency exposure
|
(142
|
)
|
576
|
|
486
|
|
133
|
|
(124
|
)
|
(734
|
)
|
195
|
|
|||||||||||||
|
Total derivative amount
|
(406
|
)
|
(535
|
)
|
(19
|
)
|
(19
|
)
|
78
|
|
817
|
|
(84
|
)
|
|||||||||||||
|
Net foreign currency exposure
|
$
|
(548
|
)
|
$
|
41
|
|
$
|
467
|
|
$
|
114
|
|
$
|
(46
|
)
|
$
|
83
|
|
$
|
111
|
|
||||||
|
(1)
|
As the U.S. dollar is the Company’s reporting currency, there is no currency risk attached to the U.S. dollar and it is excluded from this table. The U.S. dollar accounted for the difference between the Company’s total foreign currency exposure in this table and the total assets and total liabilities in the Company’s Consolidated Balance Sheet at
December 31, 2014
.
|
The above numbers include the Company’s investment in certain of its subsidiaries and branches, whose functional currencies are the euro or Canadian dollar.
At
December 31, 2014
, the Company’s net foreign currency exposure in its Consolidated Balance Sheet, after the effect of derivatives, was
$111 million
. The Company’s most significant net foreign currency exposures at
December 31, 2014
were to the euro and Canadian dollar which reflect the unhedged net investment in its European subsidiaries and branches and Canadian branches, respectively. The decrease of $130 million in the Company’s net foreign currency exposure to
$111 million
at
December 31, 2014
compared to $241 million at
December 31, 2013
is primarily related to a decrease in the Company’s net foreign currency exposure to the euro.
At
December 31, 2014
, assuming all other variables remain constant and disregarding any tax effects, a change in the U.S. dollar of 10% or 20% relative to all of the other currencies held by the Company simultaneously would result in a change in the Company’s net foreign currency exposure of $
11 million
and $
22 million
, respectively, inclusive of the effect of foreign exchange forward contracts and other derivative financial instruments.
Counterparty Credit Risk
Investments and Cash
The Company has exposure to credit risk primarily as a holder of fixed maturity securities. The Company controls this exposure by emphasizing investment grade credit quality in the fixed maturity securities it purchases. At
December 31, 2014
, approximately 57% of the Company’s fixed maturity portfolio (including the funds held – directly managed account and funds holding fixed maturity securities) was rated AA (or equivalent rating) or better.
At
December 31, 2014
, approximately
76%
of the Company’s fixed maturity and short-term investments (including funds holding fixed maturity securities and excluding the funds held – directly managed account) were rated A- or better and
8%
were rated below investment grade or not rated. The Company believes this high quality concentration reduces its exposure to credit risk
130
on fixed maturity investments to an acceptable level.
At
December 31, 2014
, the Company was not exposed to any significant credit concentration risk on its investments, excluding securities issued by the U.S. government which are rated AA+. The single largest non-U.S. sovereign government issuer accounted for less than
19%
of the Company’s total non-U.S. sovereign government, supranational and government related category (excluding the funds held – directly managed account) and less than
3%
of total investments and cash (excluding the funds held – directly managed account) at
December 31, 2014
. In addition, the single largest corporate issuer and the top 10 corporate issuers accounted for less than
3%
and less than
18%
of the Company’s total corporate fixed maturity securities (excluding the funds held – directly managed account), respectively, at
December 31, 2014
. Within the segregated investment portfolio underlying the funds held – directly managed account, the single largest corporate issuer and the top 10 corporate issuers accounted for less than
6%
and less than
38%
of total corporate fixed maturity securities underlying the funds held – directly managed account at
December 31, 2014
, respectively.
The Company keeps cash and cash equivalents in several banks and ensures that there are no significant concentrations at any point in time, in any one bank.
Funds held – directly managed account
The funds held – directly managed account due to the Company is related to one cedant, Colisée Re (see Investments underlying the Funds Held – Directly Managed Account in Item 1 of Part I of this report). The Company is subject to the credit risk of this cedant in the event of insolvency or Colisée Re’s failure to honor the value of the funds held balances for any other reason. However, the Company’s credit risk is somewhat mitigated by the fact that the Company generally has the right to offset any shortfall in the payment of the funds held balances with amounts owed by the Company to the cedant for losses payable and other amounts contractually due. See also Risk Factors in Item 1A of Part I of this report for additional discussion of the Company’s exposure if Colisée Re, or its affiliates, breach or do not satisfy their obligations. In addition to exposure to Colisée Re, the Company is also subject to the credit risk of AXA or its affiliates in the event of their insolvency or their failure to honor their obligations under the acquisition agreements.
Derivatives
To a lesser extent, the Company also has credit risk exposure as a party to foreign exchange forward contracts and other derivative contracts. To mitigate this risk, the Company monitors its exposure by counterparty, aims to diversify its counterparty credit risk and ensures that counterparties to these contracts are high credit quality international banks or counterparties. These contracts are generally of short duration (approximately 90 days) and settle on a net basis, which means that the Company is exposed to the movement of one currency against the other, as opposed to the notional amount of the contracts. At
December 31, 2014
, the Company’s absolute notional value of foreign exchange forward contracts and foreign currency option contracts was
$2,124 million
, while the net fair value of those contracts was an asset position of
$11 million
.
Underwriting Operations
The Company is also exposed to credit risk in its underwriting operations, most notably in the credit/surety line. Loss experience in these lines of business is cyclical and is affected by the general economic environment. The Company provides its clients in these lines of business with protection against credit deterioration, defaults or other types of financial non-performance of or by the underlying credits that are the subject of the protection provided and, accordingly, the Company is exposed to the credit risk of those credits. As with all of the Company’s business, these risks are subject to rigorous underwriting and pricing standards. In addition, the Company strives to mitigate the risks associated with these credit-sensitive lines of business through the use of risk management techniques such as risk diversification, careful monitoring of risk aggregations and accumulations and, at times, through the use of retrocessional reinsurance protection and the purchase of credit default swaps and total return and interest rate swaps.
The Company is subject to the credit risk of its cedants in the event of their insolvency or their failure to honor the value of the funds held balances due to the Company for any other reason. However, the Company’s credit risk in some jurisdictions is mitigated by a mandatory right of offset of amounts payable by the Company to a cedant against amounts due to the Company. In certain other jurisdictions the Company is able to mitigate this risk, depending on the nature of the funds held arrangements, to the extent that the Company has the contractual ability to offset any shortfall in the payment of the funds held balances with amounts owed by the Company to cedants for losses payable and other amounts contractually due. Funds held balances for which the Company receives an investment return based upon either the results of a pool of assets held by the cedant or the investment return earned by the cedant on its investment portfolio are exposed to an additional layer of credit risk. The Company is also exposed, to some extent, to the underlying financial market risk of the pool of assets, inasmuch as the underlying policies may have guaranteed minimum returns.
The Company has exposure to credit risk as it relates to its business written through brokers if any of the Company’s brokers is unable to fulfill their contractual obligations with respect to payments to the Company. In addition, in some jurisdictions, if the
131
broker fails to make payments to the insured under the Company’s policy, the Company might remain liable to the insured for the deficiency. The Company’s exposure to such credit risk is somewhat mitigated in certain jurisdictions by contractual terms. See Risk Factors in Item 1A of Part I of this report for information related to two brokers that accounted for approximately
40%
of the Company’s gross premiums written for the year ended
December 31, 2014
.
The Company has exposure to credit risk as it relates to its reinsurance balances receivable and reinsurance recoverable on paid and unpaid losses. Reinsurance balances receivable from the Company’s cedants at
December 31, 2014
were
$2,455 million
, including balances both currently due and accrued. The Company believes that credit risk related to these balances is mitigated by several factors, including but not limited to, credit checks performed as part of the underwriting process and monitoring of aged receivable balances. In addition, as the majority of its reinsurance agreements permit the Company the right to offset reinsurance balances receivable from clients against losses payable to them, the Company believes that the credit risk in this area is substantially reduced. Provisions are made for amounts considered potentially uncollectible and the allowance for uncollectible premiums receivable was
$8 million
at
December 31, 2014
.
The Company purchases retrocessional reinsurance and requires its reinsurers to have adequate financial strength. The Company evaluates the financial condition of its reinsurers and monitors its concentration of credit risk on an ongoing basis. Provisions are made for amounts considered potentially uncollectible. At
December 31, 2014
, the balance of reinsurance recoverable on paid and unpaid non-life and life reserves was
$244 million
, which is net of the allowance provided for uncollectible reinsurance recoverables of
$13 million
. At
December 31, 2014
,
70%
of the Company’s reinsurance recoverable on paid and unpaid non-life and life reserves were either due from reinsurers with an A- or better rating from Standard & Poor’s. See Financial Condition, Liquidity and Capital Resources—Reinsurance Recoverable on Paid and Unpaid Losses above for details of the Company’s reinsurance recoverable on paid and unpaid losses categorized by the reinsurer’s Standard & Poor’s rating.
Other than the items discussed above, the concentrations of the Company’s counterparty credit risk exposures have not changed materially at
December 31, 2014
compared to
December 31, 2013
.
Equity Price Risk
The Company invests a portion of its capital funds in equity securities (fair market value of
$1,048 million
, excluding funds holding fixed income securities of $
9 million
) at
December 31, 2014
. These equity investments are exposed to equity price risk, defined as the potential for loss in market value due to a decline in equity prices. The Company believes that the effects of diversification and the relatively small size of its investments in equities relative to total invested assets mitigate its exposure to equity price risk. The Company estimates that its equity investment portfolio has a beta versus the S&P 500 Index of approximately
0.90
on average. Portfolio beta measures the response of a portfolio’s performance relative to a market return, where a beta of 1 would be an equivalent return to the index. Given the estimated beta for the Company’s equity portfolio, a 10% and 20% movement in the S&P 500 Index would result in a change in the fair value of the Company’s equity portfolio, total invested assets and shareholders’ equity attributable to PartnerRe Ltd. at
December 31, 2014
as follows (in millions of U.S. dollars):
|
20%
Decrease
|
%
Change
|
10%
Decrease
|
%
Change
|
December 31, 2014
|
10%
Increase
|
%
Change
|
20%
Increase
|
%
Change
|
|||||||||||||||||||||||
|
Equities
(1)
|
$
|
860
|
|
(18
|
)%
|
$
|
954
|
|
(9
|
)%
|
$
|
1,048
|
|
$
|
1,142
|
|
9
|
%
|
$
|
1,236
|
|
18
|
%
|
||||||||
|
Total invested assets
(2)
|
17,105
|
|
(1
|
)
|
17,199
|
|
(1
|
)
|
17,293
|
|
17,387
|
|
1
|
|
17,481
|
|
1
|
|
|||||||||||||
|
Shareholders’ equity attributable to PartnerRe Ltd.
|
6,861
|
|
(3
|
)
|
6,955
|
|
(1
|
)
|
7,049
|
|
7,143
|
|
1
|
|
7,237
|
|
3
|
|
|||||||||||||
|
(1)
|
Excludes funds holding fixed income securities of $
9 million
.
|
|
(2)
|
Includes total investments, cash and cash equivalents, the investment portfolio underlying the funds held – directly managed account and accrued interest.
|
This change does not take into account any potential mitigating impact from the fixed maturity securities or taxes.
There was no material change in the absolute or percentage impact of an immediate change of 10% in the S&P 500 Index on the Company’s equity portfolio, total invested assets and shareholders’ equity attributable to PartnerRe Ltd. at
December 31, 2014
compared to
December 31, 2013
.
132
|
ITEM 8.
|
FINANCIAL STATEMENTS AND SUPPLEMENTARY DATA
|
PartnerRe Ltd.
(Expressed in thousands of U.S. dollars, except parenthetical share and per share data)
|
December 31,
2014 |
December 31,
2013 |
||||||
|
Assets
|
|||||||
|
Investments:
|
|||||||
|
Fixed maturities, at fair value (amortized cost: 2014,
$13,489,633
; 2013, $13,376,455)
|
$
|
13,918,745
|
|
$
|
13,593,303
|
|
|
|
Short-term investments, at fair value (amortized cost: 2014, $25,699; 2013, $13,543)
|
25,678
|
|
13,546
|
|
|||
|
Equities, at fair value (cost: 2014, $
843,429
; 2013, $1,009,286)
|
1,056,514
|
|
1,221,053
|
|
|||
|
Other invested assets
|
298,827
|
|
320,981
|
|
|||
|
Total investments
|
15,299,764
|
|
15,148,883
|
|
|||
|
Funds held – directly managed (cost: 2014, $
600,379
; 2013, $778,569)
|
608,853
|
|
785,768
|
|
|||
|
Cash and cash equivalents
|
1,313,468
|
|
1,496,485
|
|
|||
|
Accrued investment income
|
158,737
|
|
185,717
|
|
|||
|
Reinsurance balances receivable
|
2,454,850
|
|
2,465,713
|
|
|||
|
Reinsurance recoverable on paid and unpaid losses
|
246,158
|
|
308,892
|
|
|||
|
Funds held by reinsured companies
|
765,905
|
|
843,081
|
|
|||
|
Deferred acquisition costs
|
661,186
|
|
644,952
|
|
|||
|
Deposit assets
|
92,973
|
|
351,905
|
|
|||
|
Net tax assets
|
6,876
|
|
14,133
|
|
|||
|
Goodwill
|
456,380
|
|
456,380
|
|
|||
|
Intangible assets
|
159,604
|
|
187,090
|
|
|||
|
Other assets
|
45,603
|
|
149,296
|
|
|||
|
Total assets
|
$
|
22,270,357
|
|
$
|
23,038,295
|
|
|
|
Liabilities
|
|||||||
|
Unpaid losses and loss expenses
|
$
|
9,745,806
|
|
$
|
10,646,318
|
|
|
|
Policy benefits for life and annuity contracts
|
2,050,107
|
|
1,974,133
|
|
|||
|
Unearned premiums
|
1,750,607
|
|
1,723,767
|
|
|||
|
Other reinsurance balances payable
|
182,395
|
|
202,549
|
|
|||
|
Deposit liabilities
|
70,325
|
|
328,588
|
|
|||
|
Net tax liabilities
|
240,989
|
|
284,442
|
|
|||
|
Accounts payable, accrued expenses and other
|
304,728
|
|
291,350
|
|
|||
|
Debt related to senior notes
|
750,000
|
|
750,000
|
|
|||
|
Debt related to capital efficient notes
|
70,989
|
|
70,989
|
|
|||
|
Total liabilities
|
15,165,946
|
|
16,272,136
|
|
|||
|
Shareholders’ Equity
|
|||||||
|
Common shares (par value $1.00; issued: 2014, 87,237,220 shares; 2013, 86,657,045 shares)
|
87,237
|
|
86,657
|
|
|||
|
Preferred shares (par value $1.00; issued and outstanding: 2014 and 2013, 34,150,000 shares; aggregate liquidation value: 2014 and 2013, $853,750)
|
34,150
|
|
34,150
|
|
|||
|
Additional paid-in capital
|
3,949,665
|
|
3,901,627
|
|
|||
|
Accumulated other comprehensive loss
|
(34,083
|
)
|
(12,238
|
)
|
|||
|
Retained earnings
|
6,270,811
|
|
5,406,797
|
|
|||
|
Common shares held in treasury, at cost (2014,
39,400,936
shares; 2013, 34,213,611 shares)
|
(3,258,870
|
)
|
(2,707,461
|
)
|
|||
|
Total shareholders’ equity attributable to PartnerRe Ltd.
|
7,048,910
|
|
6,709,532
|
|
|||
|
Noncontrolling interests
|
55,501
|
|
56,627
|
|
|||
|
Total shareholders’ equity
|
7,104,411
|
|
6,766,159
|
|
|||
|
Total liabilities and shareholders’ equity
|
$
|
22,270,357
|
|
$
|
23,038,295
|
|
|
See accompanying Notes to Consolidated Financial Statements.
133
PartnerRe Ltd.
(Expressed in thousands of U.S. dollars, except share and per share data)
|
For the year ended December 31, 2014
|
For the year ended December 31, 2013
|
For the year ended December 31, 2012
|
||||||||||
|
Revenues
|
||||||||||||
|
Gross premiums written
|
$
|
5,932,003
|
|
$
|
5,569,706
|
|
$
|
4,718,235
|
|
|||
|
Net premiums written
|
$
|
5,719,884
|
|
$
|
5,396,526
|
|
$
|
4,572,860
|
|
|||
|
Increase in unearned premiums
|
(110,689
|
)
|
(198,316
|
)
|
(86,921
|
)
|
||||||
|
Net premiums earned
|
5,609,195
|
|
5,198,210
|
|
4,485,939
|
|
||||||
|
Net investment income
|
479,696
|
|
484,367
|
|
571,338
|
|
||||||
|
Net realized and unrealized investment gains (losses)
|
371,796
|
|
(160,735
|
)
|
493,409
|
|
||||||
|
Other income
|
16,190
|
|
16,565
|
|
11,920
|
|
||||||
|
Total revenues
|
6,476,877
|
|
5,538,407
|
|
5,562,606
|
|
||||||
|
Expenses
|
||||||||||||
|
Losses and loss expenses and life policy benefits
|
3,462,770
|
|
3,157,808
|
|
2,804,610
|
|
||||||
|
Acquisition costs
|
1,213,822
|
|
1,077,628
|
|
936,909
|
|
||||||
|
Other expenses
|
449,688
|
|
500,466
|
|
411,374
|
|
||||||
|
Interest expense
|
48,963
|
|
48,929
|
|
48,895
|
|
||||||
|
Amortization of intangible assets
|
27,486
|
|
27,180
|
|
31,799
|
|
||||||
|
Net foreign exchange (gains) losses
|
(18,201
|
)
|
18,203
|
|
175
|
|
||||||
|
Total expenses
|
5,184,528
|
|
4,830,214
|
|
4,233,762
|
|
||||||
|
Income before taxes and interest in earnings of equity method investments
|
1,292,349
|
|
708,193
|
|
1,328,844
|
|
||||||
|
Income tax expense
|
239,506
|
|
48,416
|
|
204,284
|
|
||||||
|
Interest in earnings of equity method investments
|
15,270
|
|
13,665
|
|
9,954
|
|
||||||
|
Net income
|
1,068,113
|
|
673,442
|
|
1,134,514
|
|
||||||
|
Net income attributable to noncontrolling interests
|
(13,139
|
)
|
(9,434
|
)
|
—
|
|
||||||
|
Net income attributable to PartnerRe Ltd.
|
1,054,974
|
|
664,008
|
|
1,134,514
|
|
||||||
|
Preferred dividends
|
56,735
|
|
57,861
|
|
61,622
|
|
||||||
|
Loss on redemption of preferred shares
|
—
|
|
9,135
|
|
—
|
|
||||||
|
Net income attributable to PartnerRe Ltd. common shareholders
|
$
|
998,239
|
|
$
|
597,012
|
|
$
|
1,072,892
|
|
|||
|
Comprehensive income
|
||||||||||||
|
Net income attributable to PartnerRe Ltd.
|
$
|
1,054,974
|
|
$
|
664,008
|
|
$
|
1,134,514
|
|
|||
|
Change in currency translation adjustment
|
(8,892
|
)
|
(31,778
|
)
|
28,488
|
|
||||||
|
Change in unfunded pension obligation, net of tax
|
(12,067
|
)
|
9,861
|
|
(4,294
|
)
|
||||||
|
Change in unrealized losses on investments, net of tax
|
(886
|
)
|
(918
|
)
|
(953
|
)
|
||||||
|
Total other comprehensive (loss) income, net of tax
|
(21,845
|
)
|
(22,835
|
)
|
23,241
|
|
||||||
|
Comprehensive income attributable to PartnerRe Ltd.
|
$
|
1,033,129
|
|
$
|
641,173
|
|
$
|
1,157,755
|
|
|||
|
Per share data attributable to PartnerRe Ltd. common shareholders
|
||||||||||||
|
Net income per common share:
|
||||||||||||
|
Basic net income
|
$
|
19.96
|
|
$
|
10.78
|
|
$
|
17.05
|
|
|||
|
Diluted net income
|
$
|
19.51
|
|
$
|
10.58
|
|
$
|
16.87
|
|
|||
|
Weighted average number of common shares outstanding
|
50,019,480
|
|
55,378,980
|
|
62,915,992
|
|
||||||
|
Weighted average number of common shares and common share equivalents outstanding
|
51,174,225
|
|
56,448,105
|
|
63,615,748
|
|
||||||
See accompanying Notes to Consolidated Financial Statements.
134
PartnerRe Ltd.
Consolidated Statements of Shareholders’ Equity
(Expressed in thousands of U.S. dollars)
|
For the year ended December 31, 2014
|
For the year ended December 31, 2013
|
For the year ended December 31, 2012
|
|||||||||
|
Common shares
|
|||||||||||
|
Balance at beginning of year
|
$
|
86,657
|
|
$
|
85,460
|
|
$
|
84,767
|
|
||
|
Issuance of common shares
|
580
|
|
1,197
|
|
693
|
|
|||||
|
Balance at end of year
|
87,237
|
|
86,657
|
|
85,460
|
|
|||||
|
Preferred shares
|
|||||||||||
|
Balance at beginning of year
|
34,150
|
|
35,750
|
|
35,750
|
|
|||||
|
Issuance of preferred shares
|
—
|
|
10,000
|
|
—
|
|
|||||
|
Redemption of preferred shares
|
—
|
|
(11,600
|
)
|
—
|
|
|||||
|
Balance at end of year
|
34,150
|
|
34,150
|
|
35,750
|
|
|||||
|
Additional paid-in capital
|
|||||||||||
|
Balance at beginning of year
|
3,901,627
|
|
3,861,844
|
|
3,803,796
|
|
|||||
|
Issuance of common shares
|
48,038
|
|
77,783
|
|
58,048
|
|
|||||
|
Issuance of preferred shares
|
—
|
|
231,265
|
|
—
|
|
|||||
|
Redemption of preferred shares
|
—
|
|
(269,265
|
)
|
—
|
|
|||||
|
Balance at end of year
|
3,949,665
|
|
3,901,627
|
|
3,861,844
|
|
|||||
|
Accumulated other comprehensive (loss) income
|
|||||||||||
|
Balance at beginning of year
|
(12,238
|
)
|
10,597
|
|
(12,644
|
)
|
|||||
|
Currency translation adjustment
|
|||||||||||
|
Balance at beginning of year
|
977
|
|
32,755
|
|
4,267
|
|
|||||
|
Change in currency translation adjustment
|
(8,892
|
)
|
(31,778
|
)
|
28,488
|
|
|||||
|
Balance at end of year
|
(7,915
|
)
|
977
|
|
32,755
|
|
|||||
|
Unfunded pension obligation
|
|||||||||||
|
Balance at beginning of year
|
(17,509
|
)
|
(27,370
|
)
|
(23,076
|
)
|
|||||
|
Change in unfunded pension obligation, net of tax
|
(12,067
|
)
|
9,861
|
|
(4,294
|
)
|
|||||
|
Balance at end of year (net of tax: 2014, $8,301; 2013, $5,029; 2012, $7,731)
|
(29,576
|
)
|
(17,509
|
)
|
(27,370
|
)
|
|||||
|
Unrealized gain on investments
|
|||||||||||
|
Balance at beginning of year
|
4,294
|
|
5,212
|
|
6,165
|
|
|||||
|
Change in unrealized losses on investments, net of tax
|
(886
|
)
|
(918
|
)
|
(953
|
)
|
|||||
|
Balance at end of year (net of tax: 2014, 2013 and 2012: $nil)
|
3,408
|
|
4,294
|
|
5,212
|
|
|||||
|
Balance at end of year
|
(34,083
|
)
|
(12,238
|
)
|
10,597
|
|
|||||
|
Retained earnings
|
|||||||||||
|
Balance at beginning of year
|
5,406,797
|
|
4,952,002
|
|
4,035,103
|
|
|||||
|
Net income
|
1,068,113
|
|
673,442
|
|
1,134,514
|
|
|||||
|
Net income attributable to noncontrolling interests
|
(13,139
|
)
|
(9,434
|
)
|
—
|
|
|||||
|
Dividends on common shares
|
(134,225
|
)
|
(142,217
|
)
|
(155,993
|
)
|
|||||
|
Dividends on preferred shares
|
(56,735
|
)
|
(57,861
|
)
|
(61,622
|
)
|
|||||
|
Loss on redemption of preferred shares
|
—
|
|
(9,135
|
)
|
—
|
|
|||||
|
Balance at end of year
|
6,270,811
|
|
5,406,797
|
|
4,952,002
|
|
|||||
|
Common shares held in treasury
|
|||||||||||
|
Balance at beginning of year
|
(2,707,461
|
)
|
(2,012,157
|
)
|
(1,479,230
|
)
|
|||||
|
Repurchase of common shares
|
(551,409
|
)
|
(695,304
|
)
|
(532,927
|
)
|
|||||
|
Balance at end of year
|
(3,258,870
|
)
|
(2,707,461
|
)
|
(2,012,157
|
)
|
|||||
|
Total shareholders’ equity attributable to PartnerRe Ltd.
|
$
|
7,048,910
|
|
$
|
6,709,532
|
|
$
|
6,933,496
|
|
||
|
Noncontrolling interests
|
55,501
|
|
56,627
|
|
—
|
|
|||||
|
Total shareholders’ equity
|
$
|
7,104,411
|
|
$
|
6,766,159
|
|
$
|
6,933,496
|
|
||
See accompanying Notes to Consolidated Financial Statements.
135
PartnerRe Ltd.
(Expressed in thousands of U.S. dollars)
|
For the year ended December 31, 2014
|
For the year ended December 31, 2013
|
For the year ended December 31, 2012
|
|||||||||
|
Cash flows from operating activities
|
|||||||||||
|
Net income
|
$
|
1,068,113
|
|
$
|
673,442
|
|
$
|
1,134,514
|
|
||
|
Adjustments to reconcile net income to net cash provided by operating activities:
|
|||||||||||
|
Amortization of net premium on investments
|
107,047
|
|
151,666
|
|
137,313
|
|
|||||
|
Amortization of intangible assets
|
27,486
|
|
27,180
|
|
31,799
|
|
|||||
|
Net realized and unrealized investment (gains) losses
|
(371,796
|
)
|
160,735
|
|
(493,409
|
)
|
|||||
|
Changes in:
|
|||||||||||
|
Reinsurance balances, net
|
(142,268
|
)
|
(507,346
|
)
|
(102,009
|
)
|
|||||
|
Reinsurance recoverable on paid and unpaid losses, net of ceded premiums payable
|
46,857
|
|
45,422
|
|
31,730
|
|
|||||
|
Funds held by reinsured companies and funds held – directly managed
|
188,902
|
|
99,394
|
|
381,733
|
|
|||||
|
Deferred acquisition costs
|
(55,786
|
)
|
(72,956
|
)
|
(13,437
|
)
|
|||||
|
Net tax assets and liabilities
|
(10,951
|
)
|
(99,067
|
)
|
80,628
|
|
|||||
|
Unpaid losses and loss expenses including life policy benefits
|
(168,490
|
)
|
41,956
|
|
(634,736
|
)
|
|||||
|
Unearned premiums
|
110,689
|
|
198,316
|
|
86,921
|
|
|||||
|
Other net changes in operating assets and liabilities
|
52,796
|
|
108,525
|
|
52,246
|
|
|||||
|
Net cash provided by operating activities
|
852,599
|
|
827,267
|
|
693,293
|
|
|||||
|
Cash flows from investing activities
|
|||||||||||
|
Sales of fixed maturities
|
8,730,831
|
|
7,887,186
|
|
6,969,074
|
|
|||||
|
Redemptions of fixed maturities
|
696,301
|
|
1,167,483
|
|
1,000,181
|
|
|||||
|
Purchases of fixed maturities
|
(9,844,660
|
)
|
(8,872,874
|
)
|
(8,067,087
|
)
|
|||||
|
Sales and redemptions of short-term investments
|
92,956
|
|
312,376
|
|
110,360
|
|
|||||
|
Purchases of short-term investments
|
(106,364
|
)
|
(176,339
|
)
|
(215,473
|
)
|
|||||
|
Sales of equities
|
691,970
|
|
796,403
|
|
821,977
|
|
|||||
|
Purchases of equities
|
(452,201
|
)
|
(695,456
|
)
|
(830,323
|
)
|
|||||
|
Consideration paid, related to the acquisition of Presidio, net of cash acquired
|
—
|
|
—
|
|
(9,242
|
)
|
|||||
|
Other, net
|
(58,840
|
)
|
(786
|
)
|
995
|
|
|||||
|
Net cash (used in) provided by investing activities
|
(250,007
|
)
|
417,993
|
|
(219,538
|
)
|
|||||
|
Cash flows from financing activities
|
|||||||||||
|
Dividends paid to common and preferred shareholders
|
(190,960
|
)
|
(200,078
|
)
|
(217,615
|
)
|
|||||
|
Repurchase of common shares
|
(547,120
|
)
|
(715,421
|
)
|
(504,991
|
)
|
|||||
|
Issuance of common shares, net of taxes paid
|
16,785
|
|
51,111
|
|
34,323
|
|
|||||
|
(Distribution) sale of shares to noncontrolling interests
|
(14,265
|
)
|
47,193
|
|
—
|
|
|||||
|
Net proceeds from issuance of preferred shares
|
—
|
|
241,265
|
|
—
|
|
|||||
|
Repurchase of preferred shares
|
—
|
|
(290,000
|
)
|
—
|
|
|||||
|
Net cash used in financing activities
|
(735,560
|
)
|
(865,930
|
)
|
(688,283
|
)
|
|||||
|
Effect of foreign exchange rate changes on cash
|
(50,049
|
)
|
(4,550
|
)
|
(6,024
|
)
|
|||||
|
(Decrease) increase in cash and cash equivalents
|
(183,017
|
)
|
374,780
|
|
(220,552
|
)
|
|||||
|
Cash and cash equivalents—beginning of year
|
1,496,485
|
|
1,121,705
|
|
1,342,257
|
|
|||||
|
Cash and cash equivalents—end of year
|
$
|
1,313,468
|
|
$
|
1,496,485
|
|
$
|
1,121,705
|
|
||
|
Supplemental cash flow information:
|
|||||||||||
|
Taxes paid
|
$
|
284,798
|
|
$
|
174,031
|
|
$
|
186,970
|
|
||
|
Interest paid
|
49,259
|
|
49,259
|
|
49,259
|
|
|||||
See accompanying Notes to Consolidated Financial Statements.
136
PartnerRe Ltd.
Notes to Consolidated Financial Statements
1. Organization
PartnerRe Ltd. (PartnerRe or the Company) predominantly provides reinsurance and certain specialty insurance lines on a worldwide basis through its principal wholly-owned subsidiaries, including Partner Reinsurance Company Ltd. (PartnerRe Bermuda), Partner Reinsurance Europe SE (PartnerRe Europe), Partner Reinsurance Company of the U.S. (PartnerRe U.S.) and, effective April 1, 2015, Partner Reinsurance Asia Pte. Ltd. (PartnerRe Asia). Risks reinsured include, but are not limited to, property, casualty, motor, agriculture, aviation/space, catastrophe, credit/surety, engineering, energy, marine, specialty property, specialty casualty, multiline and other lines, mortality, longevity, accident and health and alternative risk products. The Company’s alternative risk products include weather and credit protection to financial, industrial and service companies on a worldwide basis.
The Company was incorporated in August 1993 under the laws of Bermuda. The Company commenced operations in November 1993 upon completion of the sale of common shares and warrants pursuant to subscription agreements and an initial public offering.
The Company completed the acquisition of SAFR (subsequently renamed PartnerRe SA and reinsurance business transferred into PartnerRe Europe) in 1997, the acquisition of the reinsurance operations of Winterthur Group (Winterthur Re) in 1998, and the acquisition of PARIS RE Holdings Limited (Paris Re) in 2009.
Effective December 31, 2012, the Company completed the acquisition of Presidio Reinsurance Group, Inc. (subsequently renamed and referred to herein as PartnerRe Health), a California-based U.S. specialty accident and health reinsurance and insurance writer. The Consolidated Statements of Operations and Cash Flows include PartnerRe Health’s results from January 1, 2013.
In January 2015, the Company announced that PartnerRe Asia, a wholly owned subsidiary of PartnerRe Ltd., was licensed by the Monetary Authority of Singapore (MAS) to operate as a non-life and life reinsurer in Singapore. As of April 1, 2015, PartnerRe Asia will be the principal reinsurance carrier for the Company’s business underwritten in the Asia Pacific region. The establishment of PartnerRe Asia will enable the Company's Asian reinsurance operations to be consolidated into one regional, well-capitalized entity and supports its growing underwriting presence in the region.
On January 25, 2015, the Company entered into an Agreement and Plan of Amalgamation (the Amalgamation Agreement) with Axis Capital Holdings Limited, a Bermuda exempted company (AXIS), pursuant to which the Company will amalgamate with AXIS (the Amalgamation) and the two companies will continue as a single Bermuda exempted company (Amalgamated Company). The Amalgamation has been approved by the Company's Board of Directors (Board) and is subject to shareholder and regulatory approvals with respect to the Company and AXIS. See Note 23 for further details.
2. Significant Accounting Policies
The Company’s Consolidated Financial Statements have been prepared in accordance with accounting principles generally accepted in the United States (U.S. GAAP). The Consolidated Financial Statements include the accounts of the Company and its subsidiaries. Intercompany accounts and transactions have been eliminated.
The preparation of financial statements in conformity with U.S. GAAP requires Management to make estimates and assumptions that affect the reported amounts of assets and liabilities at the date of the financial statements and the reported amounts of revenues and expenses during the reporting period. While Management believes that the amounts included in the Consolidated Financial Statements reflect its best estimates and assumptions, actual results could differ from those estimates. The Company’s principal estimates include:
|
•
|
Unpaid losses and loss expenses;
|
|
•
|
Policy benefits for life and annuity contracts;
|
|
•
|
Gross and net premiums written and net premiums earned;
|
|
•
|
Recoverability of deferred acquisition costs;
|
|
•
|
Recoverability of deferred tax assets;
|
|
•
|
Valuation of goodwill and intangible assets; and
|
|
•
|
Valuation of certain assets and derivative financial instruments that are measured using significant unobservable inputs.
|
137
The following are the Company’s significant accounting policies:
(a) Premiums
Gross premiums written and earned are based upon reports received from ceding companies, supplemented by the Company’s own estimates of premiums written and earned for which ceding company reports have not been received. The determination of premium estimates requires a review of the Company’s experience with cedants, familiarity with each market, an understanding of the characteristics of each line of business and Management’s assessment of the impact of various other factors on the volume of business written and ceded to the Company. Premium estimates are updated as new information is received from cedants and differences between such estimates and actual amounts are recorded in the period in which the estimates are changed or the actual amounts are determined. Net premiums written and earned are presented net of ceded premiums, which represent the cost of retrocessional protection purchased by the Company. Premiums are earned on a basis that is consistent with the risks covered under the terms of the reinsurance contracts, which is generally one to two years. For U.S. and European wind and certain other risks, premiums are earned commensurate with the seasonality of the underlying exposure. Reinstatement premiums are recognized as written and earned at the time a loss event occurs, where coverage limits for the remaining life of the contract are reinstated under pre-defined contract terms. The accrual of reinstatement premiums is based on Management’s estimate of losses and loss expenses associated with the loss event. Unearned premiums represent the portion of premiums written which is applicable to the unexpired risks under contracts in force.
Premiums related to individual life and annuity business are recorded over the premium-paying period on the underlying policies. Premiums on annuity and universal life contracts for which there is no significant mortality or critical illness risk are accounted for in a manner consistent with accounting for interest-bearing financial instruments and are not reported as revenues, but rather as direct deposits to the contract. Amounts assessed against annuity and universal life policyholders are recognized as revenue in the period assessed.
(b) Losses and Loss Expenses and Life Policy Benefits
The liability for unpaid losses and loss expenses includes amounts determined from loss reports on individual treaties (case reserves), additional case reserves when the Company’s loss estimate is higher than reported by the cedants (ACRs) and amounts for losses incurred but not yet reported to the Company (IBNR). Such reserves are estimated by Management based upon reports received from ceding companies, supplemented by the Company’s own actuarial estimates of reserves for which ceding company reports have not been received, and based on the Company’s own historical experience. To the extent that the Company’s own historical experience is inadequate for estimating reserves, such estimates may be determined based upon industry experience and Management’s judgment. The estimates are continually reviewed and the ultimate liability may be in excess of, or less than, the amounts provided. Any adjustments are reflected in the periods in which they are determined, which may affect the Company’s operating results in future periods.
The liabilities for policy benefits for ordinary life and accident and health policies have been established based upon information reported by ceding companies, supplemented by the Company’s actuarial estimates of mortality, critical illness, persistency and future investment income, with appropriate provision to reflect uncertainty. Future policy benefit reserves for annuity and universal life contracts are carried at their accumulated values. Reserves for policy claims and benefits include both mortality and critical illness claims in the process of settlement, and claims that have been incurred but not yet reported.
The Company purchases retrocessional contracts to reduce its exposure to risk of losses on reinsurance assumed. Reinsurance recoverable on paid and unpaid losses involves actuarial estimates consistent with those used to establish the associated liabilities for unpaid losses and loss expenses and life policy benefits.
(c) Deferred Acquisition Costs
Acquisition costs, comprising only incremental brokerage fees, commissions and excise taxes, which vary directly with, and are related to, the acquisition of reinsurance contracts, are capitalized and charged to expense as the related premium is earned. All other acquisition related costs, including all indirect costs, are expensed as incurred.
Acquisition costs related to individual life and annuity contracts are deferred and amortized over the premium-paying periods in proportion to anticipated premium income, allowing for lapses, terminations and anticipated investment income. Acquisition costs related to universal life and single premium annuity contracts for which there is no significant mortality or critical illness risk are deferred and amortized over the lives of the contracts as a percentage of the estimated gross profits expected to be realized on the contracts.
Actual and anticipated losses and loss expenses, other costs and investment income related to underlying premiums are considered in determining the recoverability of deferred acquisition costs related to the Company’s Non-life business. Actual and anticipated loss experience, together with the present value of future gross premiums, the present value of future benefits, settlement
138
and maintenance costs are considered in determining the recoverability of deferred acquisition costs related to the Company’s Life business
.
(d) Funds Held by Reinsured Companies (Cedants)
The Company writes certain business on a funds held basis. Under such contractual arrangements, the cedant retains the premiums that would have otherwise been paid to the Company and the Company earns interest on these funds. With the exception of those arrangements discussed below, the Company generally earns investment income on the funds held balances based upon a predetermined interest rate, either fixed contractually at the inception of the contract or based upon a recognized index (e.g., LIBOR).
In certain circumstances, the Company may receive an investment return based upon either the result of a pool of assets held by the cedant, generally used to collateralize the funds held balance, or the investment return earned by the cedant on its entire investment portfolio. In these arrangements, gross investment returns are typically reflected in net investment income with a corresponding increase or decrease (net of a spread) being recorded as life policy benefits in the Company’s Consolidated Statements of Operations. In these arrangements, the Company is exposed, to a limited extent, to the underlying credit risk of the pool of assets inasmuch as the underlying life policies may have guaranteed minimum returns. In such cases, an embedded derivative exists and its fair value is recorded by the Company as an increase or decrease to the funds held balance.
(e) Deposit Assets and Liabilities
In the normal course of its operations, the Company writes certain contracts that do not meet the risk transfer provisions of U.S. GAAP. While these contracts do not meet risk transfer provisions for accounting purposes, there is a remote possibility that the Company will suffer a loss. The Company accounts for these contracts using the deposit accounting method, originally recording deposit liabilities for an amount equivalent to the consideration received. The consideration to be retained by the Company, irrespective of the experience of the contracts, is earned over the expected settlement period of the contracts, with any unearned portion recorded as a component of deposit liabilities. Actuarial studies are used to estimate the final liabilities under these contracts and the appropriate accretion rates to increase or decrease the liabilities over the term of the contracts. The change for the period is recorded in other income or loss in the Consolidated Statements of Operations.
Under some of these contracts, cedants retain the assets on a funds-held basis. In those cases, the Company records those assets as deposit assets and records the related income in net investment income in the Consolidated Statements of Operations.
(f) Investments
The Company elects the fair value option for all of its fixed maturities, short-term investments, equities and certain other invested assets (excluding those that are accounted for using the cost or equity methods of accounting). All changes in the fair value of investments are recorded in net realized and unrealized investment gains and losses in the Consolidated Statements of Operations. The Company defines fair value as the price received to sell an asset or paid to transfer a liability in an orderly transaction between market participants at the measurement date. The Company measures the fair value of financial instruments according to a fair value hierarchy that prioritizes the information used to measure fair value into three broad levels. The Company’s policy is to recognize transfers between the hierarchy levels at the beginning of the period. See Note 3 for additional information on fair value.
Short-term investments comprise securities with a maturity greater than three months but less than one year from the date of purchase.
Other invested assets consist primarily of investments in non-publicly traded companies, private placement equity and fixed maturity investments, derivative financial instruments and other specialty asset classes. Non-publicly traded entities in which the Company has an ownership of more than 20% and less than 50% of the voting shares, and limited partnerships in which the Company has more than a minor interest, are accounted for using either the equity method or the fair value option. The remaining other invested assets are recorded based on valuation techniques depending on the nature of the individual assets. The valuation techniques used by the Company are generally commensurate with standard valuation techniques for each asset class.
Net investment income includes interest and dividend income, amortization of premiums and discounts on fixed maturities and short-term investments and investment income on funds held and funds held – directly managed, and is net of investment expenses and withholding taxes. Investment income is recognized when earned. Realized gains and losses on the disposal of investments are determined on a first-in, first-out basis. Investment purchases and sales are recorded on a trade-date basis.
(g) Funds Held – Directly Managed
The Company elects the fair value option for substantially all of the fixed maturities, short-term investments and certain other invested assets in the segregated investment portfolio underlying the funds held – directly managed account. Accordingly, all
139
changes in the fair value of the segregated investment portfolio underlying the funds held – directly managed account are recorded in net realized and unrealized investment gains and losses in the Consolidated Statements of Operations.
(h) Cash and Cash Equivalents
Cash equivalents are carried at fair value and include fixed income securities that, at purchase, have a maturity of three months or less.
(i) Business Combinations
The Company accounts for transactions in which it obtains control over one or more businesses using the acquisition method. The purchase price is allocated to identifiable assets and liabilities, including any intangible assets, based on their estimated fair value at the acquisition date. The estimates of fair values for assets and liabilities acquired are determined based on various market and income analyses and appraisals. Any excess of the purchase price over the fair value of net assets acquired is recorded as goodwill in the Company’s Consolidated Balance Sheets. All costs associated with an acquisition are expensed as incurred.
(j) Goodwill
Goodwill represents the excess of the purchase price over the fair value of the net assets acquired in a business combination. The Company assesses the appropriateness of its valuation of goodwill on at least an annual basis or more frequently if events or changes in circumstances indicate that the carrying amount may not be recoverable. If, as a result of the assessment, the Company determines that the value of its goodwill is impaired, goodwill will be written down in the period in which the determination is made.
(k) Intangible Assets
Intangible assets represent the fair value adjustments related to unpaid losses and loss expenses and the fair values of renewal rights, customer relationships and U.S. licenses arising from acquisitions. Definite-lived intangible assets are amortized over their useful lives. The Company recognizes the amortization of all definite-lived intangible assets in the Consolidated Statement of Operations. Indefinite-lived intangible assets are not subject to amortization. The carrying values of indefinite-lived intangible assets are reviewed for indicators of impairment on at least an annual basis or more frequently if events or changes in circumstances indicate that impairment may exist. Impairment is recognized if the carrying values of the intangible assets are not recoverable from their undiscounted cash flows and is measured as the difference between the carrying value and the fair value.
(l) Income Taxes
Certain subsidiaries and branches of the Company operate in jurisdictions where they are subject to taxation. Current and deferred income taxes are charged or credited to net income or, in certain cases, to accumulated other comprehensive income, based upon enacted tax laws and rates applicable in the relevant jurisdiction in the period in which the tax becomes accruable or realizable. Deferred income taxes are provided for all temporary differences between the bases of assets and liabilities used in the Consolidated Balance Sheets and those used in the various jurisdictional tax returns. When Management’s assessment indicates that it is more likely than not that deferred tax assets will not be realized, a valuation allowance is recorded against the deferred tax assets.
The Company recognizes a tax benefit relating to uncertain tax positions only where the position is more likely than not to be sustained assuming examination by tax authorities. A liability is recognized for any tax benefit (along with any interest and penalty, if applicable) claimed in a tax return in excess of the amount recognized in the financial statements under U.S. GAAP. Any changes in amounts recognized are recorded in the period in which they are determined.
(m) Translation of Foreign Currencies
The reporting currency of the Company is the U.S. dollar. The national currencies of the Company’s subsidiaries and branches are generally their functional currencies, except for the Company’s Bermuda subsidiaries and its Swiss subsidiaries and branch, whose functional currency is the U.S. dollar. In translating the financial statements of those subsidiaries or branches whose functional currency is other than the U.S. dollar, assets and liabilities are converted into U.S. dollars using the rates of exchange in effect at the balance sheet dates, and revenues and expenses are converted using the average foreign exchange rates for the period. The effect of translation adjustments are reported in the Consolidated Balance Sheets as currency translation adjustment, a separate component of accumulated other comprehensive income or loss.
In recording foreign currency transactions, revenue and expense items are converted into the functional currency at the average rates of exchange for the period. Assets and liabilities originating in currencies other than the functional currency are translated into the functional currency at the rates of exchange in effect at the balance sheet dates. The resulting foreign exchange gains or losses are included in net foreign exchange gains and losses in the Consolidated Statements of Operations. The Company
140
also records realized and unrealized foreign exchange gains and losses on certain hedged items in net foreign exchange gains and losses in the Consolidated Statements of Operations (see Note 2(n)).
(n) Derivatives
Derivatives Used in Hedging Activities
The Company utilizes derivative financial instruments as part of its overall currency risk management strategy. The Company recognizes all derivative financial instruments, including embedded derivative instruments, as either assets or liabilities in the Consolidated Balance Sheets and measures those instruments at fair value. On the date the Company enters into a derivative contract, Management designates whether the derivative is to be used as a hedge of an identified underlying exposure (a designated hedge). The accounting for gains and losses associated with changes in the fair value of a derivative and the effect on the Consolidated Financial Statements depends on its hedge designation and whether the hedge is highly effective in achieving offsetting changes in the fair value of the asset or liability being hedged.
The derivatives employed by the Company to hedge currency exposure related to fixed income securities and other reinsurance assets and liabilities are not designated as hedges, with the exception of any hedges of the Company’s net investment in certain subsidiaries and branches whose functional currencies are not the U.S. dollar. The changes in fair value of these derivatives not designated as hedges are recognized in net foreign exchange gains and losses in the Consolidated Statements of Operations.
As part of its overall strategy to manage its level of currency exposure, from time to time the Company uses forward foreign exchange derivatives to hedge or partially hedge the net investment in certain subsidiaries and branches whose functional currencies are not the U.S. dollar. These derivatives are designated as net investment hedges, and accordingly, the changes in fair value of the derivative and the hedged item related to foreign currency are recognized in currency translation adjustment in the Consolidated Balance Sheets. The Company also uses, from time to time, interest rate derivatives to mitigate exposure to interest rate volatility.
The Company formally documents all relationships between designated hedging instruments and hedged items, as well as its risk management objective and strategy for undertaking various hedge transactions. In this documentation, the Company specifically identifies the asset or liability that has been designated as a hedged item and states how the hedging instrument is expected to hedge the risks related to the hedged item. The Company formally measures effectiveness of its designated hedging relationships both at the hedge inception and on an ongoing basis. The Company assesses the effectiveness of its designated hedges using the period-to-period dollar offset method on an individual currency basis. If the ratio obtained with this method is within the range of 80% to 125%, the Company considers the hedge effective. The time value component of the designated net investment hedges is included in the assessment of hedge effectiveness.
The Company will discontinue hedge accounting prospectively if it is determined that the derivative is no longer effective in offsetting changes in the fair value of a hedged item. To the extent that the Company discontinues hedge accounting related to its net investment in subsidiaries and branches whose functional currencies are not the U.S. dollar, because, based on Management’s assessment, the derivative no longer qualifies as an effective hedge, the derivative will continue to be carried in the Consolidated Balance Sheets at its fair value, with changes in its fair value recognized in net foreign exchange gains and losses.
Other Derivatives
The Company’s investment strategy allows for the use of derivative instruments, subject to strict limitations. The Company utilizes various derivative instruments such as foreign exchange forward contracts, foreign currency option contracts, futures contracts, to-be-announced mortgage-backed securities (TBAs) and credit default swaps for the purpose of managing overall currency risk, market exposures and portfolio duration, for hedging certain investments, or for enhancing investment performance that would be allowed under the Company’s investment policy if implemented in other ways. These instruments are recorded at fair value as assets and liabilities in the Consolidated Balance Sheets. Changes in fair value are included in net realized and unrealized investment gains and losses in the Consolidated Statements of Operations, except changes in the fair value of foreign currency option contracts and foreign exchange forward contracts which are included in net foreign exchange gains and losses in the Consolidated Statements of Operations. Margin balances required by counterparties, which are equal to a percentage of the total value of open futures contracts, are included in cash and cash equivalents.
The Company enters from time to time into weather and longevity related transactions that are structured as derivatives, which are recorded at fair value with the changes in fair value reported in net realized and unrealized investment gains and losses in the Consolidated Statements of Operations.
The Company enters from time to time into total return and interest rate swaps. Margins related to these swaps are included in other income or loss in the Consolidated Statements of Operations and any changes in the fair value of the swaps are included in net realized and unrealized investment gains and losses in the Consolidated Statements of Operations.
141
(o) Treasury Shares
Common shares repurchased by the Company and not canceled are classified as treasury shares, and are recorded at cost. This results in a reduction of shareholders’ equity in the Consolidated Balance Sheets. When shares are reissued from treasury, the Company uses the average cost method to determine the cost of the reissued shares. Gains on sales of treasury shares are credited to additional paid-in capital, while losses are charged to additional paid-in capital to the extent that previous net gains from sales of treasury shares are included therein, otherwise losses are charged to retained earnings.
(p) Net Income or Loss per Common Share
Diluted net income or loss per common share is defined as net income or loss attributable to PartnerRe Ltd. common shareholders divided by the weighted average number of common shares and common share equivalents outstanding, calculated using the treasury stock method for all potentially dilutive securities. Net income or loss attributable to PartnerRe Ltd. common shareholders is defined as net income or loss attributable to PartnerRe Ltd. less preferred share dividends. When the effect of dilutive securities would be anti-dilutive, these securities are excluded from the calculation of diluted net income or loss per share. Basic net income or loss per share is defined as net income or loss attributable to PartnerRe Ltd. common shareholders divided by the weighted average number of common shares outstanding for the period, giving no effect to dilutive securities.
(q) Share-Based Compensation
The Company currently uses six types of share-based compensation: share options, restricted shares (RS), restricted share units (RSUs), performance-based RSUs (PSUs), share-settled share appreciation rights (SSARs) and shares issued under the Company’s employee share purchase plans.
The majority of the Company’s share-based compensation awards qualify for equity classification. The fair value of the compensation cost is measured at the grant date and is expensed over the period for which the employee is required to provide services in exchange for the award. Awards of PSUs provide performance-based equity awards based on pre-established targets relating to certain performance measures achieved by the Company. The compensation expense for PSUs is initially based on the target performance measure at the time of award and is subject to periodic review and adjustment based on expected actual performance. Forfeiture benefits on all awards are estimated at the time of grant and incorporated in the determination of share-based compensation costs. Awards granted to employees who are eligible for retirement and do not have to provide additional services are expensed at the date of grant.
Those share-based compensation awards that do not meet the equity classification criteria are classified as liability awards. Liability-classified awards are recorded at fair value in the Accounts payable, accrued expenses and other in the Consolidated Balance Sheets with changes in fair value relating to the vested portion of the award recorded within Other expenses in the Consolidated Statements of Operations.
(r) Pensions
The Company recognizes an asset or a liability in the Consolidated Balance Sheets for the funded status of its defined benefit plans that are overfunded or underfunded, respectively, measured as the difference between the fair value of plan assets and the pension obligation and recognizes changes in the funded status of defined benefit plans in the year in which the changes occur as a component of accumulated other comprehensive income or loss, net of tax.
(s) Variable Interest Entities and Noncontrolling Interests
The Company is involved in the normal course of business with variable interest entities (VIEs) as a passive investor in certain limited partnerships, fixed maturity investments and asset-backed securities, that are issued by third party VIEs. The Company performs a qualitative assessment at the date when it becomes initially involved in the VIE followed by ongoing reassessments related to its involvement in VIEs. The Company’s maximum exposure to loss with respect to these investments is limited to the amounts invested in and advanced to the VIEs at
December 31, 2014
that are reported within fixed maturities and other invested assets in the Company’s Consolidated Balance Sheets and any unfunded commitments.
The Company also has three indirect 100% owned subsidiaries, PartnerRe Finance A LLC, PartnerRe Finance B LLC and PartnerRe Finance II Inc., that are considered to be VIEs, which were utilized to issue the Company’s Senior Notes and Capital Efficient Notes (CENts). The Company determined that it was not the primary beneficiary of any of these VIEs at
December 31, 2014
. As a result, the Company has not consolidated PartnerRe Finance A LLC, PartnerRe Finance B LLC and PartnerRe Finance II Inc., and has reflected the debt issued by the Company related to the Senior Notes and CENts as liabilities in the Consolidated Balance Sheets (see Note 10). The interest on the debt related to the Senior Notes and CENts is reported as interest expense in the Consolidated Statements of Operations.
142
The Company has also formed a subsidiary with other third party investors, Lorenz Re Ltd. (Lorenz Re), that is considered to be a VIE. The Company determined that it is the primary beneficiary as it has the power to direct and has more than an insignificant economic interest in the activities of Lorenz Re. Lorenz Re is consolidated by the Company and all inter-company balances and transactions are eliminated. Net income or loss and shareholders’ equity attributable to Lorenz Re’s third party investors are recorded in the Consolidated Financial Statements as noncontrolling interests (see Note 13).
(t) Segment Reporting
The Company monitors the performance of its operations in three segments, Non-life, Life and Health and Corporate and Other. The Non-life segment is further divided into four sub-segments: North America, Global (Non-U.S.) Property and Casualty (Global (Non-U.S.) P&C), Global Specialty and Catastrophe.
Segments and sub-segments represent markets that are reasonably homogeneous in terms of geography, client types, buying patterns, underlying risk patterns or approach to risk management.
(u) Recent Accounting Pronouncements
In January 2014, the Financial Accounting Standards Board (FASB) issued updated guidance on the accounting for investments in affordable housing projects that qualify for low-income housing tax credits by entities that manage or invest in such projects. The update modifies the conditions that an entity must meet to elect the effective yield or proportional amortization method to account for such investments. The guidance is effective for interim and annual periods beginning after December 15, 2014, with early adoption permitted. The Company does not expect the adoption of this guidance to have a significant impact on its Consolidated Financial Statements or disclosures.
In June 2014, the FASB issued updated guidance on the accounting for share-based payments when the terms of an award provide that a performance target could be achieved after the requisite service period. The guidance is effective for interim and annual periods beginning after December 15, 2015, with early adoption permitted. The Company does not expect the adoption of this guidance to have a significant impact on its Consolidated Financial Statements or disclosures.
In February 2015, the FASB issued updated guidance on the consolidation of voting interest entities and variable interest entities. The guidance is effective for interim and annual periods beginning after December 15, 2015, with early adoption permitted. The Company is currently evaluating the impact of the adoption of this guidance on its Consolidated Financial Statements and disclosures.
3. Fair Value
(a) Fair Value of Financial Instrument Assets
The fair value hierarchy prioritizes the inputs to valuation techniques used to measure fair value by maximizing the use of observable inputs and minimizing the use of unobservable inputs by requiring that the most observable inputs be used when available. Observable inputs are inputs that market participants would use in pricing an asset or liability based on market data obtained from sources independent of the Company. Unobservable inputs are inputs that reflect the Company’s assumptions about what market participants would use in pricing the asset or liability based on the best information available in the circumstances. The level in the hierarchy within which a given fair value measurement falls is determined based on the lowest level input that is significant to the measurement.
The Company determines the appropriate level in the hierarchy for each financial instrument that it measures at fair value. In determining fair value, the Company uses various valuation approaches, including market, income and cost approaches. The hierarchy is broken down into three levels based on the observability of inputs as follows:
|
•
|
Level 1 inputs—Unadjusted, quoted prices in active markets for identical assets or liabilities that the Company has the ability to access.
|
The Company’s financial instruments that it measures at fair value using Level 1 inputs generally include: equities and real estate investment trusts listed on a major exchange, exchange traded funds and exchange traded derivatives, including futures that are actively traded.
|
•
|
Level 2 inputs—Quoted prices in active markets for similar assets or liabilities, quoted prices for identical or similar assets or liabilities in inactive markets and significant directly or indirectly observable inputs, other than quoted prices, used in industry accepted models.
|
The Company’s financial instruments that it measures at fair value using Level 2 inputs generally include: U.S. government issued bonds; U.S. government sponsored enterprises bonds; U.S. state, territory and municipal entities
143
bonds; non-U.S. sovereign government, supranational and government related bonds consisting primarily of bonds issued by non-U.S. national governments and their agencies, non-U.S. regional governments and supranational organizations; investment grade and high yield corporate bonds; asset-backed securities; mortgage-backed securities; short-term investments; certain equities traded on foreign exchanges; certain fixed income mutual funds; foreign exchange forward contracts and over-the-counter derivatives such as foreign currency option contracts, credit default swaps, interest rate swaps and TBAs.
|
•
|
Level 3 inputs—Unobservable inputs.
|
The Company’s financial instruments that it measures at fair value using Level 3 inputs generally include: inactively traded fixed maturities including U.S. state, territory and municipal bonds; special purpose financing asset-backed bonds; unlisted equities; real estate and certain other mutual fund investments; inactively traded weather derivatives; notes and loan receivables, notes securitizations, annuities and residuals, private equities and longevity and other total return swaps.
The Company’s financial instruments measured at fair value include investments and the segregated investment portfolio underlying the funds held – directly managed account (see Notes 4 and 5). At
December 31, 2014
and
2013
, the Company’s financial instruments measured at fair value were classified between Levels 1, 2 and 3 as follows (in thousands of U.S. dollars):
144
|
December 31, 2014
|
Quoted prices in
active markets for
identical assets
(Level 1)
|
Significant
other observable
inputs
(Level 2)
|
Significant
unobservable
inputs
(Level 3)
|
Total
|
||||||||||||
|
Fixed maturities
|
||||||||||||||||
|
U.S. government and government sponsored enterprises
|
$
|
—
|
|
$
|
2,315,422
|
|
$
|
—
|
|
$
|
2,315,422
|
|
||||
|
U.S. states, territories and municipalities
|
—
|
|
380,875
|
|
149,728
|
|
530,603
|
|
||||||||
|
Non-U.S. sovereign government, supranational and government related
|
—
|
|
1,976,202
|
|
—
|
|
1,976,202
|
|
||||||||
|
Corporate
|
—
|
|
5,604,160
|
|
—
|
|
5,604,160
|
|
||||||||
|
Asset-backed securities
|
—
|
|
681,502
|
|
449,918
|
|
1,131,420
|
|
||||||||
|
Residential mortgage-backed securities
|
—
|
|
2,306,476
|
|
—
|
|
2,306,476
|
|
||||||||
|
Other mortgage-backed securities
|
—
|
|
54,462
|
|
—
|
|
54,462
|
|
||||||||
|
Fixed maturities
|
$
|
—
|
|
$
|
13,319,099
|
|
$
|
599,646
|
|
$
|
13,918,745
|
|
||||
|
Short-term investments
|
$
|
—
|
|
$
|
25,678
|
|
$
|
—
|
|
$
|
25,678
|
|
||||
|
Equities
|
||||||||||||||||
|
Real estate investment trusts
|
$
|
213,770
|
|
$
|
—
|
|
$
|
—
|
|
$
|
213,770
|
|
||||
|
Insurance
|
140,916
|
|
4,521
|
|
—
|
|
145,437
|
|
||||||||
|
Energy
|
123,978
|
|
—
|
|
—
|
|
123,978
|
|
||||||||
|
Consumer noncyclical
|
100,134
|
|
—
|
|
—
|
|
100,134
|
|
||||||||
|
Finance
|
70,621
|
|
7,354
|
|
20,353
|
|
98,328
|
|
||||||||
|
Technology
|
52,707
|
|
—
|
|
8,555
|
|
61,262
|
|
||||||||
|
Communications
|
51,829
|
|
—
|
|
2,640
|
|
54,469
|
|
||||||||
|
Industrials
|
49,983
|
|
—
|
|
—
|
|
49,983
|
|
||||||||
|
Consumer cyclical
|
39,002
|
|
—
|
|
—
|
|
39,002
|
|
||||||||
|
Utilities
|
31,748
|
|
—
|
|
—
|
|
31,748
|
|
||||||||
|
Other
|
11,571
|
|
—
|
|
—
|
|
11,571
|
|
||||||||
|
Mutual funds and exchange traded funds
|
118,246
|
|
—
|
|
8,586
|
|
126,832
|
|
||||||||
|
Equities
|
$
|
1,004,505
|
|
$
|
11,875
|
|
$
|
40,134
|
|
$
|
1,056,514
|
|
||||
|
Other invested assets
|
||||||||||||||||
|
Derivative assets
|
||||||||||||||||
|
Foreign exchange forward contracts
|
$
|
—
|
|
$
|
20,033
|
|
$
|
—
|
|
$
|
20,033
|
|
||||
|
Futures contracts
|
846
|
|
—
|
|
—
|
|
846
|
|
||||||||
|
Insurance-linked securities
|
—
|
|
—
|
|
3
|
|
3
|
|
||||||||
|
Total return swaps
|
—
|
|
—
|
|
485
|
|
485
|
|
||||||||
|
TBAs
|
—
|
|
154
|
|
—
|
|
154
|
|
||||||||
|
Other
|
||||||||||||||||
|
Notes and loan receivables and notes securitization
|
—
|
|
—
|
|
44,817
|
|
44,817
|
|
||||||||
|
Annuities and residuals
|
—
|
|
—
|
|
13,243
|
|
13,243
|
|
||||||||
|
Private equities
|
—
|
|
—
|
|
59,872
|
|
59,872
|
|
||||||||
|
Derivative liabilities
|
||||||||||||||||
|
Foreign exchange forward contracts
|
—
|
|
(7,446
|
)
|
—
|
|
(7,446
|
)
|
||||||||
|
Foreign currency option contracts
|
—
|
|
(1,196
|
)
|
—
|
|
(1,196
|
)
|
||||||||
|
Futures contracts
|
(467
|
)
|
—
|
|
—
|
|
(467
|
)
|
||||||||
|
Insurance-linked securities
|
—
|
|
—
|
|
(339
|
)
|
(339
|
)
|
||||||||
|
Total return swaps
|
—
|
|
—
|
|
(2,007
|
)
|
(2,007
|
)
|
||||||||
|
Interest rate swaps
|
—
|
|
(16,282
|
)
|
—
|
|
(16,282
|
)
|
||||||||
|
TBAs
|
—
|
|
(240
|
)
|
—
|
|
(240
|
)
|
||||||||
|
Other invested assets
|
$
|
379
|
|
$
|
(4,977
|
)
|
$
|
116,074
|
|
$
|
111,476
|
|
||||
|
Funds held – directly managed
|
||||||||||||||||
|
U.S. government and government sponsored enterprises
|
$
|
—
|
|
$
|
153,483
|
|
$
|
—
|
|
$
|
153,483
|
|
||||
|
U.S. states, territories and municipalities
|
—
|
|
—
|
|
132
|
|
132
|
|
||||||||
|
Non-U.S. sovereign government, supranational and government related
|
—
|
|
128,233
|
|
—
|
|
128,233
|
|
||||||||
|
Corporate
|
—
|
|
177,347
|
|
—
|
|
177,347
|
|
||||||||
|
Other invested assets
|
—
|
|
—
|
|
13,398
|
|
13,398
|
|
||||||||
|
Funds held – directly managed
|
$
|
—
|
|
$
|
459,063
|
|
$
|
13,530
|
|
$
|
472,593
|
|
||||
|
Total
|
$
|
1,004,884
|
|
$
|
13,810,738
|
|
$
|
769,384
|
|
$
|
15,585,006
|
|
||||
145
|
December 31, 2013
|
Quoted prices in
active markets for
identical assets
(Level 1)
|
Significant other
observable
inputs
(Level 2)
|
Significant
unobservable
inputs
(Level 3)
|
Total
|
||||||||||||
|
Fixed maturities
|
||||||||||||||||
|
U.S. government and government sponsored enterprises
|
$
|
—
|
|
$
|
1,623,859
|
|
$
|
—
|
|
$
|
1,623,859
|
|
||||
|
U.S. states, territories and municipalities
|
—
|
|
16,207
|
|
108,380
|
|
124,587
|
|
||||||||
|
Non-U.S. sovereign government, supranational and government related
|
—
|
|
2,353,699
|
|
—
|
|
2,353,699
|
|
||||||||
|
Corporate
|
—
|
|
6,048,663
|
|
—
|
|
6,048,663
|
|
||||||||
|
Asset-backed securities
|
—
|
|
691,654
|
|
446,577
|
|
1,138,231
|
|
||||||||
|
Residential mortgage-backed securities
|
—
|
|
2,268,517
|
|
—
|
|
2,268,517
|
|
||||||||
|
Other mortgage-backed securities
|
—
|
|
35,747
|
|
—
|
|
35,747
|
|
||||||||
|
Fixed maturities
|
$
|
—
|
|
$
|
13,038,346
|
|
$
|
554,957
|
|
$
|
13,593,303
|
|
||||
|
Short-term investments
|
$
|
—
|
|
$
|
13,546
|
|
$
|
—
|
|
$
|
13,546
|
|
||||
|
Equities
|
||||||||||||||||
|
Real estate investment trusts
|
$
|
175,796
|
|
$
|
—
|
|
$
|
—
|
|
$
|
175,796
|
|
||||
|
Energy
|
159,509
|
|
—
|
|
—
|
|
159,509
|
|
||||||||
|
Insurance
|
144,020
|
|
—
|
|
—
|
|
144,020
|
|
||||||||
|
Finance
|
108,944
|
|
9,556
|
|
20,207
|
|
138,707
|
|
||||||||
|
Consumer noncyclical
|
108,663
|
|
—
|
|
—
|
|
108,663
|
|
||||||||
|
Communications
|
70,792
|
|
—
|
|
2,199
|
|
72,991
|
|
||||||||
|
Technology
|
53,768
|
|
—
|
|
7,752
|
|
61,520
|
|
||||||||
|
Industrials
|
47,677
|
|
—
|
|
—
|
|
47,677
|
|
||||||||
|
Consumer cyclical
|
45,915
|
|
—
|
|
—
|
|
45,915
|
|
||||||||
|
Utilities
|
37,151
|
|
—
|
|
—
|
|
37,151
|
|
||||||||
|
Other
|
19,993
|
|
—
|
|
—
|
|
19,993
|
|
||||||||
|
Mutual funds and exchange traded funds
|
61,902
|
|
139,322
|
|
7,887
|
|
209,111
|
|
||||||||
|
Equities
|
$
|
1,034,130
|
|
$
|
148,878
|
|
$
|
38,045
|
|
$
|
1,221,053
|
|
||||
|
Other invested assets
|
||||||||||||||||
|
Derivative assets
|
||||||||||||||||
|
Foreign exchange forward contracts
|
$
|
—
|
|
$
|
1,249
|
|
$
|
—
|
|
$
|
1,249
|
|
||||
|
Futures contracts
|
41,031
|
|
—
|
|
—
|
|
41,031
|
|
||||||||
|
Total return swaps
|
—
|
|
—
|
|
79
|
|
79
|
|
||||||||
|
Interest rate swaps
|
—
|
|
2,147
|
|
—
|
|
2,147
|
|
||||||||
|
TBAs
|
—
|
|
2
|
|
—
|
|
2
|
|
||||||||
|
Other
|
||||||||||||||||
|
Notes and loan receivables and notes securitization
|
—
|
|
—
|
|
41,446
|
|
41,446
|
|
||||||||
|
Annuities and residuals
|
—
|
|
—
|
|
24,064
|
|
24,064
|
|
||||||||
|
Private equities
|
—
|
|
—
|
|
39,131
|
|
39,131
|
|
||||||||
|
Derivative liabilities
|
||||||||||||||||
|
Foreign exchange forward contracts
|
—
|
|
(8,648
|
)
|
—
|
|
(8,648
|
)
|
||||||||
|
Foreign currency option contracts
|
—
|
|
(535
|
)
|
—
|
|
(535
|
)
|
||||||||
|
Credit default swaps (protection purchased)
|
—
|
|
(71
|
)
|
—
|
|
(71
|
)
|
||||||||
|
Insurance-linked securities
|
—
|
|
—
|
|
(268
|
)
|
(268
|
)
|
||||||||
|
Total return swaps
|
—
|
|
—
|
|
(599
|
)
|
(599
|
)
|
||||||||
|
Interest rate swaps
|
—
|
|
(2,558
|
)
|
—
|
|
(2,558
|
)
|
||||||||
|
TBAs
|
—
|
|
(1,331
|
)
|
—
|
|
(1,331
|
)
|
||||||||
|
Other invested assets
|
$
|
41,031
|
|
$
|
(9,745
|
)
|
$
|
103,853
|
|
$
|
135,139
|
|
||||
|
Funds held – directly managed
|
||||||||||||||||
|
U.S. government and government sponsored enterprises
|
$
|
—
|
|
$
|
157,296
|
|
$
|
—
|
|
$
|
157,296
|
|
||||
|
U.S. states, territories and municipalities
|
—
|
|
—
|
|
286
|
|
286
|
|
||||||||
|
Non-U.S. sovereign government, supranational and government related
|
—
|
|
137,186
|
|
—
|
|
137,186
|
|
||||||||
|
Corporate
|
—
|
|
248,947
|
|
—
|
|
248,947
|
|
||||||||
|
Short-term investments
|
—
|
|
2,426
|
|
—
|
|
2,426
|
|
||||||||
|
Other invested assets
|
—
|
|
—
|
|
15,165
|
|
15,165
|
|
||||||||
|
Funds held – directly managed
|
$
|
—
|
|
$
|
545,855
|
|
$
|
15,451
|
|
$
|
561,306
|
|
||||
|
Total
|
$
|
1,075,161
|
|
$
|
13,736,880
|
|
$
|
712,306
|
|
$
|
15,524,347
|
|
||||
146
At
December 31, 2014
and
2013
, the aggregate carrying amounts of items included in Other invested assets that the Company did not measure at fair value were
$187.3 million
and
$185.8 million
, respectively, which related to the Company’s investments that are accounted for using the cost method of accounting or equity method of accounting.
In addition to the investments underlying the funds held – directly managed account held at fair value of
$472.6 million
and
$561.3 million
at
December 31, 2014
and
2013
, respectively, the funds held – directly managed account also included cash and cash equivalents, carried at fair value, of
$42.3 million
and
$84.8 million
, respectively, and accrued investment income of
$5.7 million
and
$6.7 million
, respectively. At
December 31, 2014
and
2013
, the aggregate carrying amounts of items included in the funds held – directly managed account that the Company did not measure at fair value were
$88.3 million
and
$133.0 million
, respectively, which primarily related to other assets and liabilities held by Colisée Re related to the underlying business, which are carried at cost (see Note 5).
At
December 31, 2014
and
2013
, substantially all of the accrued investment income in the Consolidated Balance Sheets related to the Company’s investments and the investments underlying the funds held – directly managed account for which the fair value option was elected.
During the years ended
December 31, 2014
and
2013
, there were no transfers between Level 1 and Level 2.
Disclosures about the fair value of financial instruments that the Company does not measure at fair value exclude insurance contracts and certain other financial instruments. At
December 31, 2014
and
2013
, the fair values of financial instrument assets recorded in the Consolidated Balance Sheets not described above, approximate their carrying values.
147
The reconciliations of the beginning and ending balances for all financial instruments measured at fair value using Level 3 inputs for the years ended
December 31, 2014
and
2013
, were as follows (in thousands of U.S. dollars):
|
For the year ended
December 31, 2014
|
Balance at
beginning
of year
|
Realized and
unrealized
investment
gains (losses)
included in
net income
|
Purchases
and
issuances
(1)
|
Settlements
and
sales (2) |
Net
transfers
into/(out of)
Level 3
|
Balance
at end of
year
|
Change in
unrealized investment gains (losses)
relating to
assets held at end of year |
|||||||||||||||||||||
|
Fixed maturities
|
||||||||||||||||||||||||||||
|
U.S. states, territories and municipalities
|
$
|
108,380
|
|
$
|
12,322
|
|
$
|
31,470
|
|
$
|
(2,444
|
)
|
$
|
—
|
|
$
|
149,728
|
|
$
|
12,315
|
|
|||||||
|
Asset-backed securities
|
446,577
|
|
8,169
|
|
192,940
|
|
(197,768
|
)
|
—
|
|
449,918
|
|
8,616
|
|
||||||||||||||
|
Fixed maturities
|
$
|
554,957
|
|
$
|
20,491
|
|
$
|
224,410
|
|
$
|
(200,212
|
)
|
$
|
—
|
|
$
|
599,646
|
|
$
|
20,931
|
|
|||||||
|
Equities
|
||||||||||||||||||||||||||||
|
Finance
|
$
|
20,207
|
|
$
|
146
|
|
$
|
—
|
|
$
|
—
|
|
$
|
—
|
|
$
|
20,353
|
|
$
|
146
|
|
|||||||
|
Technology
|
7,752
|
|
803
|
|
—
|
|
—
|
|
—
|
|
8,555
|
|
803
|
|
||||||||||||||
|
Communications
|
2,199
|
|
441
|
|
—
|
|
—
|
|
—
|
|
2,640
|
|
441
|
|
||||||||||||||
|
Other
|
—
|
|
—
|
|
8
|
|
(8
|
)
|
—
|
|
—
|
|
—
|
|
||||||||||||||
|
Mutual funds and exchange traded funds
|
7,887
|
|
699
|
|
—
|
|
—
|
|
—
|
|
8,586
|
|
699
|
|
||||||||||||||
|
Equities
|
$
|
38,045
|
|
$
|
2,089
|
|
$
|
8
|
|
$
|
(8
|
)
|
$
|
—
|
|
$
|
40,134
|
|
$
|
2,089
|
|
|||||||
|
Other invested assets
|
||||||||||||||||||||||||||||
|
Derivatives, net
|
$
|
(788
|
)
|
$
|
(759
|
)
|
$
|
(871
|
)
|
$
|
560
|
|
$
|
—
|
|
$
|
(1,858
|
)
|
$
|
(759
|
)
|
|||||||
|
Notes and loan receivables and notes securitization
|
41,446
|
|
(372
|
)
|
35,988
|
|
(32,245
|
)
|
—
|
|
44,817
|
|
1,147
|
|
||||||||||||||
|
Annuities and residuals
|
24,064
|
|
(207
|
)
|
—
|
|
(10,614
|
)
|
—
|
|
13,243
|
|
(167
|
)
|
||||||||||||||
|
Private equities
|
39,131
|
|
(3,149
|
)
|
28,410
|
|
(4,520
|
)
|
—
|
|
59,872
|
|
(3,180
|
)
|
||||||||||||||
|
Other invested assets
|
$
|
103,853
|
|
$
|
(4,487
|
)
|
$
|
63,527
|
|
$
|
(46,819
|
)
|
$
|
—
|
|
$
|
116,074
|
|
$
|
(2,959
|
)
|
|||||||
|
Funds held – directly managed
|
||||||||||||||||||||||||||||
|
U.S. states, territories and municipalities
|
$
|
286
|
|
$
|
1
|
|
$
|
—
|
|
$
|
(155
|
)
|
$
|
—
|
|
$
|
132
|
|
$
|
13
|
|
|||||||
|
Other invested assets
|
15,165
|
|
(2,102
|
)
|
781
|
|
(446
|
)
|
—
|
|
13,398
|
|
(2,102
|
)
|
||||||||||||||
|
Funds held – directly managed
|
$
|
15,451
|
|
$
|
(2,101
|
)
|
$
|
781
|
|
$
|
(601
|
)
|
$
|
—
|
|
$
|
13,530
|
|
$
|
(2,089
|
)
|
|||||||
|
Total
|
$
|
712,306
|
|
$
|
15,992
|
|
$
|
288,726
|
|
$
|
(247,640
|
)
|
$
|
—
|
|
$
|
769,384
|
|
$
|
17,972
|
|
|||||||
|
(1)
|
Purchases and issuances of derivatives include issuances of
$0.9 million
.
|
|
(2)
|
There were no sales for the year ended
December 31, 2014
.
|
148
|
For the year ended
December 31, 2013
|
Balance at
beginning
of year
|
Realized and
unrealized
investment
(losses) gains
included in
net income
|
Purchases
and
issuances
(1)
|
Settlements
and
sales (2) |
Net
transfers
into/(out of)
Level 3
|
Balance
at end of
year
|
Change in
unrealized investment
gains (losses) relating to
assets held at end of year |
|||||||||||||||||||||
|
Fixed maturities
|
||||||||||||||||||||||||||||
|
U.S. states, territories and municipalities
|
$
|
233,235
|
|
$
|
(4,440
|
)
|
$
|
103,860
|
|
$
|
(224,275
|
)
|
$
|
—
|
|
$
|
108,380
|
|
$
|
1,234
|
|
|||||||
|
Corporate
|
100,904
|
|
(2,271
|
)
|
—
|
|
(98,633
|
)
|
—
|
|
—
|
|
—
|
|
||||||||||||||
|
Asset-backed securities
|
323,134
|
|
(1,339
|
)
|
301,477
|
|
(176,695
|
)
|
—
|
|
446,577
|
|
(9,018
|
)
|
||||||||||||||
|
Fixed maturities
|
$
|
657,273
|
|
$
|
(8,050
|
)
|
$
|
405,337
|
|
$
|
(499,603
|
)
|
$
|
—
|
|
$
|
554,957
|
|
$
|
(7,784
|
)
|
|||||||
|
Equities
|
||||||||||||||||||||||||||||
|
Finance
|
$
|
13,477
|
|
$
|
1,730
|
|
$
|
5,000
|
|
$
|
—
|
|
$
|
—
|
|
$
|
20,207
|
|
$
|
1,730
|
|
|||||||
|
Communications
|
—
|
|
159
|
|
2,040
|
|
—
|
|
—
|
|
2,199
|
|
159
|
|
||||||||||||||
|
Technology
|
6,987
|
|
765
|
|
—
|
|
—
|
|
—
|
|
7,752
|
|
765
|
|
||||||||||||||
|
Mutual funds and exchange traded funds
|
7,264
|
|
623
|
|
—
|
|
—
|
|
—
|
|
7,887
|
|
623
|
|
||||||||||||||
|
Equities
|
$
|
27,728
|
|
$
|
3,277
|
|
$
|
7,040
|
|
$
|
—
|
|
$
|
—
|
|
$
|
38,045
|
|
$
|
3,277
|
|
|||||||
|
Other invested assets
|
||||||||||||||||||||||||||||
|
Derivatives, net
|
$
|
3,911
|
|
$
|
(6,136
|
)
|
$
|
121
|
|
$
|
1,316
|
|
$
|
—
|
|
$
|
(788
|
)
|
$
|
(69
|
)
|
|||||||
|
Notes and loan receivables and notes securitization
|
34,902
|
|
936
|
|
15,732
|
|
(10,124
|
)
|
—
|
|
41,446
|
|
936
|
|
||||||||||||||
|
Annuities and residuals
|
46,882
|
|
1,107
|
|
—
|
|
(23,925
|
)
|
—
|
|
24,064
|
|
877
|
|
||||||||||||||
|
Private equities
|
1,404
|
|
(6,358
|
)
|
44,085
|
|
—
|
|
—
|
|
39,131
|
|
(6,358
|
)
|
||||||||||||||
|
Other invested assets
|
$
|
87,099
|
|
$
|
(10,451
|
)
|
$
|
59,938
|
|
$
|
(32,733
|
)
|
$
|
—
|
|
$
|
103,853
|
|
$
|
(4,614
|
)
|
|||||||
|
Funds held – directly managed
|
||||||||||||||||||||||||||||
|
U.S. states, territories and municipalities
|
$
|
345
|
|
$
|
(59
|
)
|
$
|
—
|
|
$
|
—
|
|
$
|
—
|
|
$
|
286
|
|
$
|
(59
|
)
|
|||||||
|
Other invested assets
|
17,976
|
|
(2,054
|
)
|
—
|
|
(757
|
)
|
—
|
|
15,165
|
|
(990
|
)
|
||||||||||||||
|
Funds held – directly managed
|
$
|
18,321
|
|
$
|
(2,113
|
)
|
$
|
—
|
|
$
|
(757
|
)
|
$
|
—
|
|
$
|
15,451
|
|
$
|
(1,049
|
)
|
|||||||
|
Total
|
$
|
790,421
|
|
$
|
(17,337
|
)
|
$
|
472,315
|
|
$
|
(533,093
|
)
|
$
|
—
|
|
$
|
712,306
|
|
$
|
(10,170
|
)
|
|||||||
|
(1)
|
Purchases and issuances of derivatives include issuances of
$0.8 million
.
|
|
(2)
|
Settlements and sales of U.S. states, territories and municipalities, asset-backed securities, derivatives and annuities and residuals include sales of
$223.7 million
,
$13.7 million
,
$1.2 million
and
$6.3 million
, respectively.
|
149
The significant unobservable inputs used in the valuation of financial instruments measured at fair value using Level 3 inputs at
December 31, 2014
and
2013
were as follows (fair value in thousands of U.S. dollars):
|
December 31, 2014
|
Fair value
|
Valuation techniques
|
Unobservable inputs
|
Range
(Weighted average)
|
||||||
|
Fixed maturities
|
||||||||||
|
U.S. states, territories and municipalities
|
$
|
149,728
|
|
Discounted cash flow
|
Credit spreads
|
2.2% – 10.1% (4.6%)
|
||||
|
Asset-backed securities – other
|
449,918
|
|
Discounted cash flow
|
Credit spreads
|
4.0% – 12.1% (7.1%)
|
|||||
|
Equities
|
||||||||||
|
Finance
|
14,561
|
|
Weighted market comparables
|
Net income multiple
|
19.0 (19.0)
|
|||||
|
Tangible book value multiple
|
1.3 (1.3)
|
|||||||||
|
Liquidity discount
|
25.0% (25.0%)
|
|||||||||
|
Comparable return
|
7.3% (7.3%)
|
|||||||||
|
Finance
|
5,792
|
|
Profitability analysis
|
Projected return on equity
|
14.0% (14.0%)
|
|||||
|
Technology
|
8,555
|
|
Weighted market comparables
|
Revenue multiple
|
1.6 (1.6)
|
|||||
|
Adjusted earnings multiple
|
10.2 (10.2)
|
|||||||||
|
Communications
|
2,640
|
|
Weighted market comparables
|
Adjusted earnings multiple
|
9.4 (9.4)
|
|||||
|
Comparable return
|
-10.6% (-10.6%)
|
|||||||||
|
Other invested assets
|
||||||||||
|
Total return swaps
|
(1,522
|
)
|
Discounted cash flow
|
Credit spreads
|
3.6% – 19.3% (16.3%)
|
|||||
|
Notes and loan receivables
|
8,068
|
|
Discounted cash flow
|
Credit spreads
|
12.6% (12.6%)
|
|||||
|
Notes and loan receivables
|
13,237
|
|
Discounted cash flow
|
Credit spreads
|
17.5% (17.5%)
|
|||||
|
Gross revenue/fair value
|
1.5 – 1.7 (1.7)
|
|||||||||
|
Notes securitization
|
23,512
|
|
Discounted cash flow
|
Credit spreads
|
3.5% – 6.6% (6.4%)
|
|||||
|
Annuities and residuals
|
13,243
|
|
Discounted cash flow
|
Credit spreads
|
4.9% – 9.6% (7.8%)
|
|||||
|
Prepayment speed
|
0% – 15.0% (4.3%)
|
|||||||||
|
Constant default rate
|
0.3% – 17.5% (6.3%)
|
|||||||||
|
Private equity – direct
|
8,536
|
|
Discounted cash flow and weighted market comparables
|
Net income multiple
|
9.0 (9.0)
|
|||||
|
Tangible book value multiple
|
2.0 (2.0)
|
|||||||||
|
Recoverability of intangible assets
|
0% (0%)
|
|||||||||
|
Private equity funds
|
18,494
|
|
Reported market value
|
Net asset value, as reported
|
100.0% (100.0%)
|
|||||
|
Market adjustments
|
-7.6% – 11.0% (-1.6%)
|
|||||||||
|
Private equity – other
|
32,842
|
|
Discounted cash flow
|
Effective yield
|
5.8% (5.8%)
|
|||||
|
Funds held – directly managed
|
||||||||||
|
Other invested assets
|
13,398
|
|
Reported market value
|
Net asset value, as reported
|
100.0% (100.0%)
|
|||||
|
Market adjustments
|
-15.4% – 0% (-14.5%)
|
|||||||||
150
|
December 31, 2013
|
Fair value
|
Valuation techniques
|
Unobservable inputs
|
Range
(Weighted average)
|
||||||
|
Fixed maturities
|
||||||||||
|
U.S. states, territories and municipalities
|
$
|
108,380
|
|
Discounted cash flow
|
Credit spreads
|
2.9% – 9.9% (5.3%)
|
||||
|
Asset-backed securities – interest only
|
21
|
|
Discounted cash flow
|
Credit spreads
|
5.5% – 10.7% (8.8%)
|
|||||
|
Asset-backed securities – other
|
446,556
|
|
Discounted cash flow
|
Credit spreads
|
4.0% – 12.2% (7.1%)
|
|||||
|
Equities
|
||||||||||
|
Finance
|
15,483
|
|
Weighted market comparables
|
Net income multiple
|
14.6 (14.6)
|
|||||
|
Tangible book value multiple
|
1.1 (1.1)
|
|||||||||
|
Liquidity discount
|
25.0% (25.0%)
|
|||||||||
|
Comparable return
|
8.5% (8.5%)
|
|||||||||
|
Finance
|
4,724
|
|
Profitability analysis
|
Projected return on equity
|
14.0% (14.0%)
|
|||||
|
Communications
|
2,199
|
|
Weighted market comparables
|
Adjusted earnings multiple
|
9.4 (9.4)
|
|||||
|
Comparable return
|
0% (0%)
|
|||||||||
|
Technology
|
7,752
|
|
Weighted market comparables
|
Revenue multiple
|
0.9 (0.9)
|
|||||
|
Adjusted earnings multiple
|
4.4 (4.4)
|
|||||||||
|
Other invested assets
|
||||||||||
|
Total return swaps
|
(520
|
)
|
Discounted cash flow
|
Credit spreads
|
2.8% – 18.9% (17.0%)
|
|||||
|
Notes and loan receivables
|
21,280
|
|
Discounted cash flow
|
Credit spreads
|
17.5% (17.5%)
|
|||||
|
Gross revenue/fair value
|
1.5 (1.5)
|
|||||||||
|
Notes securitization
|
20,166
|
|
Discounted cash flow
|
Credit spreads
|
6.2% (6.2%)
|
|||||
|
Annuities and residuals
|
24,064
|
|
Discounted cash flow
|
Credit spreads
|
4.0% – 7.9% (5.8%)
|
|||||
|
Prepayment speed
|
0% – 15.0% (6.4%)
|
|||||||||
|
Constant default rate
|
0.3% – 35.0% (12.4%)
|
|||||||||
|
Private equity – direct
|
11,742
|
|
Discounted cash flow and weighted market comparables
|
Net income multiple
|
8.3 (8.3)
|
|||||
|
Tangible book value multiple
|
1.6 (1.6)
|
|||||||||
|
Recoverability of intangible assets
|
0% (0%)
|
|||||||||
|
Private equity funds
|
8,993
|
|
Reported market value
|
Net asset value, as reported
|
100.0% (100.0%)
|
|||||
|
Market adjustments
|
1.8% – 9.8% (8.3%)
|
|||||||||
|
Private equity – other
|
18,396
|
|
Discounted cash flow
|
Credit spreads
|
3.8% (3.8%)
|
|||||
|
Funds held – directly managed
|
||||||||||
|
Other invested assets
|
15,165
|
|
Reported market value
|
Net asset value, as reported
|
100.0% (100.0%)
|
|||||
|
Market adjustments
|
-22.9% – 0% (-15.5%)
|
|||||||||
The tables above do not include financial instruments that are measured using unobservable inputs (Level 3) where the unobservable inputs were obtained from external sources and used without adjustment. These financial instruments include mutual fund investments (included within equities) and certain derivatives.
The Company has established a Valuation Committee which is responsible for determining the Company’s invested asset valuation policy and related procedures, for reviewing significant changes in the fair value measurements of securities classified as Level 3 from period to period, and for reviewing in accordance with the invested asset valuation policy an independent internal peer analysis that is performed on the fair value measurements of significant securities that are classified as Level 3. The Valuation Committee is comprised of members of the Company’s senior management team and meets on a quarterly basis. The Company’s invested asset valuation policy is monitored by the Company’s Audit Committee of the Board and approved annually by the Company’s Risk and Finance Committee of the Board.
151
Changes in the fair value of the Company’s financial instruments subject to the fair value option during the years ended
December 31, 2014
,
2013
and
2012
were as follows (in thousands of U.S. dollars):
|
2014
|
2013
|
2012
|
|||||||||
|
Fixed maturities and short-term investments
|
$
|
228,781
|
|
$
|
(525,787
|
)
|
$
|
186,063
|
|
||
|
Equities
|
2,605
|
|
118,010
|
|
66,253
|
|
|||||
|
Other invested assets
|
(2,664
|
)
|
(6,970
|
)
|
18,732
|
|
|||||
|
Funds held – directly managed
|
1,382
|
|
(27,850
|
)
|
7,969
|
|
|||||
|
Total
|
$
|
230,104
|
|
$
|
(442,597
|
)
|
$
|
279,017
|
|
||
Substantially all of the above changes in fair value are included in the Consolidated Statements of Operations under the caption Net realized and unrealized investment gains (losses).
The following methods and assumptions were used by the Company in estimating the fair value of each class of financial instrument recorded in the Consolidated Balance Sheets. There have been no material changes in the Company’s valuation techniques during the periods presented.
Fixed maturities
|
•
|
U.S. government and government sponsored enterprises
—U.S. government and government sponsored enterprises securities consist primarily of bonds issued by the U.S. Treasury and corporate debt securities issued by government sponsored enterprises and federally owned or established corporations. These securities are generally priced by independent pricing services. The independent pricing services may use actual transaction prices for securities that have been actively traded. For securities that have not been actively traded, each pricing source has its own proprietary method to determine the fair value, which may incorporate option adjusted spreads (OAS), interest rate data and market news. The Company generally classifies these securities in Level 2.
|
|
•
|
U.S. states, territories and municipalities
—U.S. states, territories and municipalities securities consist primarily of bonds issued by U.S. states, territories and municipalities and the Federal Home Loan Mortgage Corporation. These securities are generally priced by independent pricing services using the techniques described for U.S. government and government sponsored enterprises above. The Company generally classifies these securities in Level 2. Certain of the bonds that are issued by municipal housing authorities and the Federal Home Loan Mortgage Corporation are not actively traded and are priced based on internal models using unobservable inputs. Accordingly, the Company classifies these securities in Level 3. The significant unobservable input used in the fair value measurement of these U.S. states, territories and municipalities securities classified as Level 3 is credit spreads. A significant increase (decrease) in credit spreads in isolation could result in a significantly lower (higher) fair value measurement.
|
|
•
|
Non-U.S. sovereign government, supranational and government related
—Non-U.S. sovereign government, supranational and government related securities consist primarily of bonds issued by non-U.S. national governments and their agencies, non-U.S. regional governments and supranational organizations. These securities are generally priced by independent pricing services using the techniques described for U.S. government and government sponsored enterprises above. The Company generally classifies these securities in Level 2.
|
|
•
|
Corporate
—Corporate securities consist primarily of bonds issued by U.S. and foreign corporations covering a variety of industries and issuing countries. These securities are generally priced by independent pricing services and brokers. The pricing provider incorporates information including credit spreads, interest rate data and market news into the valuation of each security. The Company generally classifies these securities in Level 2. When a corporate security is inactively traded or the valuation model uses unobservable inputs, the Company classifies the security in Level 3.
|
|
•
|
Asset-backed securities
—Asset
-
backed securities primarily consist of bonds issued by U.S. and foreign corporations that are predominantly backed by student loans, automobile loans, credit card receivables, equipment leases, and special purpose financing. With the exception of special purpose financing, these asset-backed securities are generally priced by independent pricing services and brokers. The pricing provider applies dealer quotes and other available trade information, prepayment speeds, yield curves and credit spreads to the valuation. The Company generally classifies these securities in Level 2. Special purpose financing securities are generally inactively traded and are priced based on valuation models using unobservable inputs. The Company generally classifies these securities in Level 3. The significant unobservable input used in the fair value measurement of these asset-backed securities classified as Level 3 is credit spreads. A significant increase (decrease) in credit spreads in isolation could result in a significantly lower (higher) fair value measurement.
|
|
•
|
Residential mortgage-backed securities
—Residential mortgage-backed securities primarily consist of bonds issued by the Government National Mortgage Association, the Federal National Mortgage Association, the Federal Home Loan
|
152
Mortgage Corporation, as well as private, non-agency issuers. These residential mortgage-backed securities are generally priced by independent pricing services and brokers. When current market trades are not available, the pricing provider or the Company will employ proprietary models with observable inputs including other trade information, prepayment speeds, yield curves and credit spreads. The Company generally classifies these securities in Level 2.
|
•
|
Other mortgage-backed securities
—Other mortgage-backed securities primarily consist of commercial mortgage-backed securities. These securities are generally priced by independent pricing services and brokers. The pricing provider applies dealer quotes and other available trade information, prepayment speeds, yield curves and credit spreads to the valuation. The Company generally classifies these securities in Level 2.
|
In general, the methods employed by the independent pricing services to determine the fair value of the securities that have not been actively traded primarily involve the use of “matrix pricing” in which the independent pricing source applies the credit spread for a comparable security that has traded recently to the current yield curve to determine a reasonable fair value. The Company generally uses one pricing source per security and uses a pricing service ranking to consistently select the most appropriate pricing service in instances where it receives multiple quotes on the same security. When fair values are unavailable from these independent pricing sources, quotes are obtained directly from broker-dealers who are active in the corresponding markets. Most of the Company’s fixed maturities are priced from the pricing services or dealer quotes. The Company will typically not make adjustments to prices received from pricing services or dealer quotes; however, in instances where the quoted external price for a security uses significant unobservable inputs, the Company will classify that security as Level 3. The methods used to develop and substantiate the unobservable inputs used are based on the Company’s valuation policy and are dependent upon the facts and circumstances surrounding the individual investments which are generally transaction specific. The Company’s inactively traded fixed maturities are classified as Level 3. For all fixed maturity investments, the bid price is used for estimating fair value.
To validate prices, the Company compares the fair value estimates to its knowledge of the current market and will investigate prices that it considers not to be representative of fair value. The Company also reviews an internally generated fixed maturity price validation report which converts prices received for fixed maturity investments from the independent pricing sources and from broker-dealers quotes and plots OAS and duration on a sector and rating basis. The OAS is calculated using established algorithms developed by an independent risk analytics platform vendor. The OAS on the fixed maturity price validation report are compared for securities in a similar sector and having a similar rating, and outliers are identified and investigated for price reasonableness. In addition, the Company completes quantitative analyses to compare the performance of each fixed maturity investment portfolio to the performance of an appropriate benchmark, with significant differences identified and investigated.
Short-term investments
Short-term investments are valued in a manner similar to the Company’s fixed maturity investments and are generally classified in Level 2.
Equities
Equity securities include U.S. and foreign common and preferred stocks, real estate investment trusts, mutual funds and exchange traded funds. Equities, real estate investment trusts and exchange traded funds are generally classified in Level 1 as the Company uses prices received from independent pricing sources based on quoted prices in active markets. Equities classified as Level 2 are generally mutual funds invested in fixed income securities, where the net asset value of the fund is provided on a daily basis, and common stocks traded in inactive markets. Equities classified as Level 3 are generally mutual funds invested in securities other than the common stock of publicly traded companies, where the net asset value is not provided on a daily basis, and inactively traded common stocks. The significant unobservable inputs used in the fair value measurement of inactively traded common stocks classified as Level 3 include market return information, weighted using management’s judgment, from comparable selected publicly traded companies in the same industry, in a similar region and of a similar size, including net income multiples, tangible book value multiples, comparable returns, revenue multiples, adjusted earnings multiples and projected return on equity ratios. Significant increases (decreases) in any of these inputs could result in a significantly higher (lower) fair value measurement. Significant unobservable inputs used in measuring the fair value measurement of inactively traded common stocks also include a liquidity discount. A significant increase (decrease) in the liquidity discount could result in a significantly lower (higher) fair value measurement.
To validate prices, the Company completes quantitative analyses to compare the performance of each equity investment portfolio to the performance of an appropriate benchmark, with significant differences identified and investigated.
153
Other invested assets
The Company’s exchange traded derivatives, such as futures, are generally classified as Level 1 as their fair values are quoted prices in active markets. The Company’s foreign exchange forward contracts, foreign currency option contracts, credit default swaps, interest rate swaps and TBAs are generally classified as Level 2 within the fair value hierarchy and are priced by independent pricing services.
Included in the Company’s Level 3 classification, in general, are certain inactively traded weather derivatives, notes and loan receivables, notes securitizations, annuities and residuals, private equities and longevity and other total return swaps. For Level 3 instruments, the Company will generally (i) receive a price based on a manager’s or trustee’s valuation for the asset; (ii) develop an internal discounted cash flow model to measure fair value; or (iii) use market return information, adjusted if necessary and weighted using management’s judgment, from comparable selected publicly traded equity funds in a similar region and of a similar size. Where the Company receives prices from the manager or trustee, these prices are based on the manager’s or trustee’s estimate of fair value for the assets and are generally audited on an annual basis. Where the Company develops its own discounted cash flow models, the inputs will be specific to the asset in question, based on appropriate historical information, adjusted as necessary, and using appropriate discount rates. The significant unobservable inputs used in the fair value measurement of other invested assets classified as Level 3 include credit spreads, prepayment speeds, constant default rates, gross revenue to fair value ratios, net income multiples, effective yields, tangible book value multiples and other valuation ratios. Significant increases (decreases) in any of these inputs in isolation could result in a significantly lower (higher) fair value measurement. Significant unobservable inputs used in the fair value measurement of other invested assets classified as Level 3 also include an assessment of the recoverability of intangible assets and market return information, weighted using management’s judgment, from comparable selected publicly traded companies in the same industry, in a similar region and of a similar size. Significant increases (decreases) in these inputs in isolation could result in a significantly higher (lower) fair value measurement. As part of the Company’s modeling to determine the fair value of an investment, the Company considers counterparty credit risk as an input to the model, however, the majority of the Company’s counterparties are investment grade rated institutions and the failure of any one counterparty would not have a significant impact on the Company’s consolidated financial statements.
To validate prices, the Company will compare them to benchmarks, where appropriate, or to the business results generally within that asset class and specifically to those particular assets.
Funds held – directly managed
The segregated investment portfolio underlying the funds held – directly managed account is comprised of fixed maturities, short-term investments and other invested assets which are fair valued on a basis consistent with the methods described above. Substantially all fixed maturities and short-term investments within the funds held – directly managed account are classified as Level 2 within the fair value hierarchy.
The other invested assets within the segregated investment portfolio underlying the funds held – directly managed account, which are classified as Level 3 investments, are primarily real estate mutual fund investments carried at fair value. For the real estate mutual fund investments, the Company receives a price based on the real estate fund manager’s valuation for the asset and further adjusts the price, if necessary, based on appropriate current information on the real estate market. A significant increase (decrease) to the adjustment to the real estate fund manager’s valuation could result in a significantly lower (higher) fair value measurement.
To validate prices within the segregated investment portfolio underlying the funds held – directly managed account, the Company utilizes the methods described above.
(b) Fair Value of Financial Instrument Liabilities
At
December 31, 2014
and
2013
, the fair values of financial instrument liabilities recorded in the Consolidated Balance Sheets approximate their carrying values, with the exception of the debt related to senior notes (Senior Notes) and the debt related to CENts.
The methods and assumptions used by the Company in estimating the fair value of each class of financial instrument liability recorded in the Consolidated Balance Sheets for which the Company does not measure that instrument at fair value were as follows:
154
|
•
|
the fair value of the Senior Notes was calculated based on discounted cash flow models using observable market yields and contractual cash flows based on the aggregate principal amount outstanding of
$250 million
from PartnerRe Finance A LLC and
$500 million
from PartnerRe Finance B LLC at
December 31, 2014
and
2013
; and
|
|
•
|
the fair value of the CENts was calculated based on discounted cash flow models using observable market yields and contractual cash flows based on the aggregate principal amount outstanding of
$63 million
from PartnerRe Finance II Inc. at
December 31, 2014
and
2013
.
|
The carrying values and fair values of the Senior Notes and CENts at
December 31, 2014
and
2013
were as follows (in thousands of U.S. dollars):
|
|
December 31, 2014
|
December 31, 2013
|
|||||||||||||
|
|
Carrying Value
|
Fair Value
|
Carrying Value
|
Fair Value
|
|||||||||||
|
Debt related to senior notes
(1)
|
$
|
750,000
|
|
$
|
853,792
|
|
$
|
750,000
|
|
$
|
844,331
|
|
|||
|
Debt related to CENts
(2)
|
63,384
|
|
62,309
|
|
63,384
|
|
61,094
|
|
|||||||
|
(1)
|
PartnerRe Finance A LLC and PartnerRe Finance B LLC, the issuers of the Senior Notes, do not meet consolidation requirements under U.S. GAAP. Accordingly, the Company shows the related intercompany debt of
$750 million
in its Consolidated Balance Sheets at
December 31, 2014
and
2013
.
|
|
(2)
|
PartnerRe Finance II Inc., the issuer of the CENts, does not meet consolidation requirements under U.S. GAAP. Accordingly, the Company shows the related intercompany debt of
$71 million
in its Consolidated Balance Sheets at
December 31, 2014
and
2013
.
|
At
December 31, 2014
and
2013
, the Company’s debt related to the Senior Notes and CENts was classified as Level 2 in the fair value hierarchy.
Disclosures about the fair value of financial instrument liabilities exclude insurance contracts and certain other financial instruments.
4. Investments
(a) Fixed Maturities, Short-Term Investments and Equities
The cost, gross unrealized gains, gross unrealized losses and fair value of investments classified as trading securities at
December 31, 2014
and
2013
were as follows (in thousands of U.S. dollars):
|
December 31, 2014
|
Cost
(1)
|
Gross
Unrealized
Gains
|
Gross
Unrealized
Losses
|
Fair Value
|
||||||||||||
|
Fixed maturities
|
||||||||||||||||
|
U.S. government and government sponsored enterprises
|
$
|
2,308,264
|
|
$
|
13,350
|
|
$
|
(6,192
|
)
|
$
|
2,315,422
|
|
||||
|
U.S. states, territories and municipalities
|
511,228
|
|
21,058
|
|
(1,683
|
)
|
530,603
|
|
||||||||
|
Non-U.S. sovereign government, supranational and government related
|
1,866,915
|
|
112,029
|
|
(2,742
|
)
|
1,976,202
|
|
||||||||
|
Corporate
|
5,363,006
|
|
263,349
|
|
(22,195
|
)
|
5,604,160
|
|
||||||||
|
Asset-backed securities
|
1,110,393
|
|
23,131
|
|
(2,104
|
)
|
1,131,420
|
|
||||||||
|
Residential mortgage-backed securities
|
2,276,200
|
|
56,875
|
|
(26,599
|
)
|
2,306,476
|
|
||||||||
|
Other mortgage-backed securities
|
53,627
|
|
1,487
|
|
(652
|
)
|
54,462
|
|
||||||||
|
Fixed maturities
|
$
|
13,489,633
|
|
$
|
491,279
|
|
$
|
(62,167
|
)
|
$
|
13,918,745
|
|
||||
|
Short-term investments
|
25,699
|
|
4
|
|
(25
|
)
|
25,678
|
|
||||||||
|
Equities
|
843,429
|
|
240,667
|
|
(27,582
|
)
|
1,056,514
|
|
||||||||
|
Total
|
$
|
14,358,761
|
|
$
|
731,950
|
|
$
|
(89,774
|
)
|
$
|
15,000,937
|
|
||||
155
|
December 31, 2013
|
Cost
(1)
|
Gross
Unrealized
Gains
|
Gross
Unrealized
Losses
|
Fair Value
|
||||||||||||
|
Fixed maturities
|
||||||||||||||||
|
U.S. government and government sponsored enterprises
|
$
|
1,635,578
|
|
$
|
7,211
|
|
$
|
(18,930
|
)
|
$
|
1,623,859
|
|
||||
|
U.S. states, territories and municipalities
|
121,697
|
|
4,395
|
|
(1,505
|
)
|
124,587
|
|
||||||||
|
Non-U.S. sovereign government, supranational and government related
|
2,295,608
|
|
67,453
|
|
(9,362
|
)
|
2,353,699
|
|
||||||||
|
Corporate
|
5,866,991
|
|
243,522
|
|
(61,850
|
)
|
6,048,663
|
|
||||||||
|
Asset-backed securities
|
1,126,812
|
|
15,232
|
|
(3,813
|
)
|
1,138,231
|
|
||||||||
|
Residential mortgage-backed securities
|
2,294,870
|
|
31,810
|
|
(58,163
|
)
|
2,268,517
|
|
||||||||
|
Other mortgage-backed securities
|
34,899
|
|
1,590
|
|
(742
|
)
|
35,747
|
|
||||||||
|
Fixed maturities
|
$
|
13,376,455
|
|
$
|
371,213
|
|
$
|
(154,365
|
)
|
$
|
13,593,303
|
|
||||
|
Short-term investments
|
13,543
|
|
4
|
|
(1
|
)
|
13,546
|
|
||||||||
|
Equities
|
1,009,286
|
|
250,288
|
|
(38,521
|
)
|
1,221,053
|
|
||||||||
|
Total
|
$
|
14,399,284
|
|
$
|
621,505
|
|
$
|
(192,887
|
)
|
$
|
14,827,902
|
|
||||
|
(1)
|
Cost is amortized cost for fixed maturities and short-term investments and cost for equity securities.
|
(b) Maturity Distribution of Fixed Maturities and Short-Term Investments
The distribution of fixed maturities and short-term investments at
December 31, 2014
, by contractual maturity date, is shown below (in thousands of U.S. dollars). Actual maturities may differ from contractual maturities because certain borrowers have the right to call or prepay certain obligations with or without call or prepayment penalties.
|
Cost
|
Fair Value
|
|||||||
|
One year or less
|
$
|
312,599
|
|
$
|
313,261
|
|
||
|
More than one year through five years
|
5,042,314
|
|
5,168,357
|
|
||||
|
More than five years through ten years
|
3,592,725
|
|
3,719,234
|
|
||||
|
More than ten years
|
1,127,474
|
|
1,251,213
|
|
||||
|
Subtotal
|
$
|
10,075,112
|
|
$
|
10,452,065
|
|
||
|
Mortgage/asset-backed securities
|
3,440,220
|
|
3,492,358
|
|
||||
|
Total
|
$
|
13,515,332
|
|
$
|
13,944,423
|
|
||
(c) Net Realized and Unrealized Investment Gains (Losses)
The components of the net realized and unrealized investment gains (losses) for the years ended
December 31, 2014
,
2013
and
2012
were as follows (in thousands of U.S. dollars):
|
2014
|
2013
|
2012
|
||||||||||
|
Net realized investment gains on fixed maturities and short-term investments
|
$
|
120,734
|
|
$
|
118,575
|
|
$
|
172,987
|
|
|||
|
Net realized investment gains on equities
|
98,733
|
|
75,217
|
|
72,155
|
|
||||||
|
Net realized investment (losses) gains on other invested assets
|
(20,686
|
)
|
20,497
|
|
(16,691
|
)
|
||||||
|
Change in net unrealized investment (losses) gains on other invested assets
|
(58,180
|
)
|
56,652
|
|
(9,568
|
)
|
||||||
|
Change in net unrealized investment gains (losses) on fixed maturities and short-term investments
|
228,781
|
|
(525,787
|
)
|
186,063
|
|
||||||
|
Change in net unrealized investment gains on equities
|
2,605
|
|
118,010
|
|
66,253
|
|
||||||
|
Net other realized and unrealized investment (losses) gains
|
(3,624
|
)
|
(2,107
|
)
|
5,843
|
|
||||||
|
Net realized and unrealized investment gains (losses) on funds held – directly managed
|
3,433
|
|
(21,792
|
)
|
16,367
|
|
||||||
|
Total net realized and unrealized investment gains (losses)
|
$
|
371,796
|
|
$
|
(160,735
|
)
|
$
|
493,409
|
|
|||
156
(d) Net Investment Income
The components of net investment income for the years ended
December 31, 2014
,
2013
and
2012
were as follows (in thousands of U.S. dollars):
|
2014
|
2013
|
2012
|
||||||||||
|
Fixed maturities
|
$
|
443,414
|
|
$
|
446,299
|
|
$
|
512,833
|
|
|||
|
Short-term investments, cash and cash equivalents
|
868
|
|
1,886
|
|
2,905
|
|
||||||
|
Equities
|
40,326
|
|
32,989
|
|
26,207
|
|
||||||
|
Funds held and other
|
33,192
|
|
34,215
|
|
44,109
|
|
||||||
|
Funds held – directly managed
|
13,841
|
|
20,502
|
|
29,031
|
|
||||||
|
Investment expenses
|
(51,945
|
)
|
(51,524
|
)
|
(43,747
|
)
|
||||||
|
Net investment income
|
$
|
479,696
|
|
$
|
484,367
|
|
$
|
571,338
|
|
|||
Other than the funds held – directly managed account, the Company generally earns investment income on funds held by reinsured companies based upon a predetermined interest rate, either fixed contractually at the inception of the contract or based upon a recognized index (e.g., LIBOR). Interest rates ranged from
2.1%
to
5.4%
for the year ended
December 31, 2014
, from
1.8%
to
4.3%
for the year ended
December 31, 2013
and from
2.0%
to
5.0%
for the year ended
December 31, 2012
. See Note 5 for additional information on the funds held – directly managed account.
(e) Pledged and Restricted Assets
At
December 31, 2014
and
2013
, approximately
$172.3 million
and
$200.6 million
, respectively, of cash and cash equivalents and approximately
$2,455.6 million
and
$2,477.8 million
, respectively, of securities were deposited, pledged or held in escrow accounts in favor of ceding companies and other counterparties or government authorities to comply with reinsurance contract provisions and insurance laws.
The Company has agreed, subject to certain exceptions, not to dispose of or hedge any of the common shares in an investment with a fair value of
$120 million
, which is included in equities. As of February 19, 2015, this restriction no longer exists.
(f) Net (Payable) Receivable for Securities Purchased/Sold
Included within Accounts payable, accrued expenses and other in the Consolidated Balance Sheet at
December 31, 2014
and within Other assets in the Consolidated Balance Sheet at
December 31, 2013
were amounts of gross receivable balances for securities sold and gross payable balances for securities purchased as follows (in thousands of U.S. dollars):
|
2014
|
2013
|
|||||||
|
Receivable for securities sold
|
$
|
51,586
|
|
$
|
150,816
|
|
||
|
Payable for securities purchased
|
(63,779
|
)
|
(60,153
|
)
|
||||
|
Net (payable) receivable for securities purchased/sold
|
$
|
(12,193
|
)
|
$
|
90,663
|
|
||
5. Funds Held – Directly Managed
Following Paris Re’s acquisition of substantially all of the reinsurance operations of Colisée Re (previously known as AXA RE), a subsidiary of AXA SA (AXA), in 2006, Paris Re and its subsidiaries entered into an issuance agreement and a quota share retrocession agreement to assume business written by Colisée Re from January 1, 2006 to September 30, 2007 as well as the in-force business at December 31, 2005. The agreements provided that the premium related to the transferred business was retained by Colisée Re and credited to a funds held account. The decrease from
$561 million
at December 31, 2013 to
$473 million
at December 31, 2014 in the fair value of the investment portfolio underlying the funds held – directly managed account was primarily related to the commutation of a portion of the Reserve Agreement with Colisée Re, the run-off of the underlying loss reserves associated with this account and, to a lesser extent, the impact of the strengthening of the U.S. dollar against most major currencies.
The assets underlying the funds held – directly managed account are maintained by Colisée Re in a segregated investment portfolio and managed by the Company. The segregated investment portfolio underlying the funds held – directly managed account is carried at fair value. Realized and unrealized investment gains and losses and net investment income related to the underlying investment portfolio in the funds held – directly managed account inure to the benefit of the Company.
157
(a) Fixed Maturities, Short-Term Investments, Other Invested Assets and Other Assets and Liabilities
The cost, gross unrealized gains, gross unrealized losses and fair value of investments underlying the funds held – directly managed account at
December 31, 2014
and
2013
were as follows (in thousands of U.S. dollars):
|
December 31, 2014
|
Cost
(1)
|
Gross
Unrealized
Gains
|
Gross
Unrealized
Losses
|
Fair Value
|
||||||||||||
|
Fixed maturities
|
||||||||||||||||
|
U.S. government and government sponsored enterprises
|
$
|
150,242
|
|
$
|
3,302
|
|
$
|
(61
|
)
|
$
|
153,483
|
|
||||
|
U.S. states, territories and municipalities
|
214
|
|
—
|
|
(82
|
)
|
132
|
|
||||||||
|
Non-U.S. sovereign government, supranational and government related
|
119,732
|
|
8,536
|
|
(35
|
)
|
128,233
|
|
||||||||
|
Corporate
|
168,697
|
|
8,650
|
|
—
|
|
177,347
|
|
||||||||
|
Fixed maturities
|
$
|
438,885
|
|
$
|
20,488
|
|
$
|
(178
|
)
|
$
|
459,195
|
|
||||
|
Other invested assets
|
25,388
|
|
—
|
|
(11,837
|
)
|
13,551
|
|
||||||||
|
Total
|
$
|
464,273
|
|
$
|
20,488
|
|
$
|
(12,015
|
)
|
$
|
472,746
|
|
||||
|
December 31, 2013
|
Cost
(1)
|
Gross
Unrealized
Gains
|
Gross
Unrealized
Losses
|
Fair Value
|
||||||||||||
|
Fixed maturities
|
||||||||||||||||
|
U.S. government and government sponsored enterprises
|
$
|
153,951
|
|
$
|
3,789
|
|
$
|
(444
|
)
|
$
|
157,296
|
|
||||
|
U.S. states, territories and municipalities
|
372
|
|
—
|
|
(86
|
)
|
286
|
|
||||||||
|
Non-U.S. sovereign government, supranational and government related
|
131,488
|
|
6,708
|
|
(1,010
|
)
|
137,186
|
|
||||||||
|
Corporate
|
237,947
|
|
11,000
|
|
—
|
|
248,947
|
|
||||||||
|
Fixed maturities
|
$
|
523,758
|
|
$
|
21,497
|
|
$
|
(1,540
|
)
|
$
|
543,715
|
|
||||
|
Short-term investments
|
2,426
|
|
—
|
|
—
|
|
2,426
|
|
||||||||
|
Other invested assets
|
28,091
|
|
—
|
|
(12,787
|
)
|
15,304
|
|
||||||||
|
Total
|
$
|
554,275
|
|
$
|
21,497
|
|
$
|
(14,327
|
)
|
$
|
561,445
|
|
||||
|
(1)
|
Cost is amortized cost for fixed maturities and short-term investments.
|
In addition to the investments underlying the funds held – directly managed account in the above table at
December 31, 2014
and
2013
, were cash and cash equivalents of
$42.3 million
and
$84.8 million
, respectively, other assets and liabilities of
$88.2 million
and
$132.9 million
, respectively, and accrued investment income of
$5.7 million
and
$6.7 million
, respectively. The other assets and liabilities represent working capital assets held by Colisée Re related to the underlying business.
(b) Maturity Distribution of Fixed Maturities
The distribution of fixed maturities underlying the funds held – directly managed account at
December 31, 2014
, by contractual maturity date, is shown below (in thousands of U.S. dollars). Actual maturities may differ from contractual maturities because certain borrowers have the right to call or prepay certain obligations with or without call or prepayment penalties.
|
Cost
|
Fair Value
|
|||||||
|
One year or less
|
$
|
75,985
|
|
$
|
76,822
|
|
||
|
More than one year through five years
|
230,696
|
|
241,496
|
|
||||
|
More than five years through ten years
|
131,917
|
|
140,644
|
|
||||
|
More than ten years
|
287
|
|
233
|
|
||||
|
Total
|
$
|
438,885
|
|
$
|
459,195
|
|
||
158
(c) Net Realized and Unrealized Investment Gains (Losses)
The components of the net realized and unrealized investment gains (losses) on the funds held – directly managed account for the years ended
December 31, 2014
,
2013
and
2012
were as follows (in thousands of U.S. dollars):
|
2014
|
2013
|
2012
|
||||||||||
|
Net realized investment gains on fixed maturities and short-term investments
|
$
|
1,959
|
|
$
|
6,021
|
|
$
|
8,405
|
|
|||
|
Net realized investment gains on other invested assets
|
53
|
|
19
|
|
—
|
|
||||||
|
Change in net unrealized investment gains (losses) on fixed maturities and short-term investments
|
1,938
|
|
(24,176
|
)
|
6,583
|
|
||||||
|
Change in net unrealized investment (losses) gains on other invested assets
|
(517
|
)
|
(3,656
|
)
|
1,379
|
|
||||||
|
Net realized and unrealized investment gains (losses) on funds held – directly managed
|
$
|
3,433
|
|
$
|
(21,792
|
)
|
$
|
16,367
|
|
|||
(d) Net Investment Income
The components of net investment income underlying the funds held – directly managed account for the years ended
December 31, 2014
,
2013
and
2012
were as follows (in thousands of U.S. dollars):
|
2014
|
2013
|
2012
|
||||||||||
|
Fixed maturities
|
$
|
12,789
|
|
$
|
18,804
|
|
$
|
27,760
|
|
|||
|
Short-term investments, cash and cash equivalents
|
59
|
|
1,246
|
|
1,046
|
|
||||||
|
Other
|
1,760
|
|
1,287
|
|
1,647
|
|
||||||
|
Investment expenses
|
(767
|
)
|
(835
|
)
|
(1,422
|
)
|
||||||
|
Net investment income on funds held – directly managed
|
$
|
13,841
|
|
$
|
20,502
|
|
$
|
29,031
|
|
|||
6. Derivatives
The Company’s derivative instruments are recorded in the Consolidated Balance Sheets at fair value, with changes in fair value recognized in either net foreign exchange gains and losses or net realized and unrealized investment gains and losses in the Consolidated Statements of Operations or accumulated other comprehensive income or loss in the Consolidated Balance Sheets, depending on the nature of the derivative instrument. The Company’s objectives for holding or issuing these derivatives are as follows:
Foreign Exchange Forward Contracts
The Company utilizes foreign exchange forward contracts as part of its overall currency risk management and investment strategies. From time to time, the Company also utilizes foreign exchange forward contracts to hedge a portion of its net investment exposure resulting from the translation of its foreign subsidiaries and branches whose functional currency is other than the U.S. dollar.
Foreign Currency Option Contracts and Futures Contracts
The Company utilizes foreign currency option contracts to mitigate foreign currency risk. The Company uses exchange traded treasury note futures contracts to manage portfolio duration and equity futures to hedge certain investments.
Credit Default Swaps
The Company purchases protection through credit default swaps to mitigate the risk associated with its underwriting operations, most notably in the credit/surety line, and to manage market exposures.
The Company also assumes credit risk through credit default swaps to replicate investment positions. The original term of these credit default swaps is generally five years or less and there are no recourse provisions associated with these swaps. The counterparties on the Company’s assumed credit default swaps are all investment grade rated financial institutions, however, the Company would be required to perform in the event of a default by the underlying issuer.
159
Insurance-Linked Securities
The Company enters into various weather derivatives and longevity total return swaps for which the underlying risks reference parametric weather risks for the weather derivatives and longevity risk for the longevity total return swaps.
Total Return and Interest Rate Swaps and Interest Rate Derivatives
The Company enters into total return swaps referencing various project, investments and principal finance obligations. The Company enters into interest rate swaps to mitigate the interest rate risk on certain of the total return swaps and certain fixed maturity investments. The Company also uses other interest rate derivatives to mitigate exposure to interest rate volatility.
To
-
Be-Announced Mortgage-Backed Securities
The Company utilizes TBAs as part of its overall investment strategy and to enhance investment performance.
The net fair values and the related net notional values of derivatives included in the Company’s Consolidated Balance Sheets at
December 31, 2014
and
2013
were as follows (in thousands of U.S. dollars):
|
|
Asset
derivatives
at fair value
|
|
Liability
derivatives
at fair value
|
|
Net derivatives
|
|||||||||||
|
December 31, 2014
|
Net notional
exposure
|
|
Fair value
|
|||||||||||||
|
Foreign exchange forward contracts
|
$
|
20,033
|
|
$
|
(7,446
|
)
|
$
|
2,080,276
|
|
$
|
12,587
|
|
||||
|
Foreign currency option contracts
|
—
|
|
(1,196
|
)
|
43,380
|
|
(1,196
|
)
|
||||||||
|
Futures contracts
|
846
|
|
(467
|
)
|
2,348,735
|
|
379
|
|
||||||||
|
Insurance-linked securities
(1)
|
3
|
|
(339
|
)
|
145,481
|
|
(336
|
)
|
||||||||
|
Total return swaps
|
485
|
|
(2,007
|
)
|
42,524
|
|
(1,522
|
)
|
||||||||
|
Interest rate swaps
(2)
|
—
|
|
(16,282
|
)
|
201,160
|
|
(16,282
|
)
|
||||||||
|
TBAs
|
154
|
|
(240
|
)
|
235,105
|
|
(86
|
)
|
||||||||
|
Total derivatives
|
$
|
21,521
|
|
$
|
(27,977
|
)
|
$
|
(6,456
|
)
|
|||||||
|
|
Asset
derivatives
at fair value
|
Liability
derivatives
at fair value
|
Net derivatives
|
|||||||||||||
|
December 31, 2013
|
Net notional
exposure
|
Fair value
|
||||||||||||||
|
Foreign exchange forward contracts
|
$
|
1,249
|
|
$
|
(8,648
|
)
|
$
|
1,957,409
|
|
$
|
(7,399
|
)
|
||||
|
Foreign currency option contracts
|
—
|
|
(535
|
)
|
87,620
|
|
(535
|
)
|
||||||||
|
Futures contracts
|
41,031
|
|
—
|
|
3,266,004
|
|
41,031
|
|
||||||||
|
Credit default swaps (protection purchased)
|
—
|
|
(71
|
)
|
14,000
|
|
(71
|
)
|
||||||||
|
Insurance-linked securities
(1)
|
—
|
|
(268
|
)
|
168,724
|
|
(268
|
)
|
||||||||
|
Total return swaps
|
79
|
|
(599
|
)
|
31,740
|
|
(520
|
)
|
||||||||
|
Interest rate swaps
(2)
|
2,147
|
|
(2,558
|
)
|
202,859
|
|
(411
|
)
|
||||||||
|
TBAs
|
2
|
|
(1,331
|
)
|
183,835
|
|
(1,329
|
)
|
||||||||
|
Total derivatives
|
$
|
44,508
|
|
$
|
(14,010
|
)
|
$
|
30,498
|
|
|||||||
|
(1)
|
At
December 31, 2014
and
2013
, insurance-linked securities include a longevity swap for which the notional amount is not reflective of the overall potential exposure of the swap. As such, the Company has included the probable maximum loss under the swap within the net notional exposure as an approximation of the notional amount.
|
|
(2)
|
The Company enters into interest rate swaps to mitigate notional exposures on certain total return swaps and certain fixed maturities. Only the notional value of interest rate swaps on fixed maturities is presented separately in the table.
|
The fair value of all derivatives at
December 31, 2014
and
2013
is recorded in Other invested assets in the Company’s Consolidated Balance Sheets. At
December 31, 2014
and
2013
, none of the Company’s derivatives were designated as hedges.
160
The gains and losses in the Consolidated Statements of Operations for derivatives for the years ended
December 31, 2014
,
2013
and
2012
were as follows (in thousands of U.S. dollars):
|
|
2014
|
2013
|
2012
|
||||||||
|
Foreign exchange forward contracts
|
$
|
39,399
|
|
$
|
(59,019
|
)
|
$
|
23,474
|
|
||
|
Foreign currency option contracts
|
(810
|
)
|
(5,164
|
)
|
3,789
|
|
|||||
|
Total included in net foreign exchange gains and losses
|
$
|
38,589
|
|
$
|
(64,183
|
)
|
$
|
27,263
|
|
||
|
Futures contracts
|
$
|
(72,146
|
)
|
$
|
78,841
|
|
$
|
(31,757
|
)
|
||
|
Credit default swaps (protection purchased)
|
(3
|
)
|
(134
|
)
|
(907
|
)
|
|||||
|
Credit default swaps (assumed risks)
|
—
|
|
123
|
|
2,016
|
|
|||||
|
Insurance-linked securities
|
230
|
|
(707
|
)
|
4,343
|
|
|||||
|
Total return swaps
|
(1,002
|
)
|
(6,597
|
)
|
(749
|
)
|
|||||
|
Interest rate swaps
|
(15,871
|
)
|
7,469
|
|
112
|
|
|||||
|
TBAs
|
13,166
|
|
(8,808
|
)
|
7,045
|
|
|||||
|
Total included in net realized and unrealized investment gains and losses
|
$
|
(75,626
|
)
|
$
|
70,187
|
|
$
|
(19,897
|
)
|
||
|
Total derivatives
|
$
|
(37,037
|
)
|
$
|
6,004
|
|
$
|
7,366
|
|
||
Offsetting of Derivatives
The gross and net fair values of derivatives that are subject to offsetting in the Consolidated Balance Sheets at
December 31, 2014
and
2013
were as follows (in thousands of U.S. dollars):
|
|
|
Gross
amounts
offset in the
balance sheet
|
Net amounts of
assets/liabilities
presented in the
balance sheet
|
Gross amounts not offset
in the balance sheet
|
|
|||||||||||||||||||
|
December 31, 2014
|
Gross
amounts
recognized
(1)
|
Financial
instruments
|
Cash collateral
received/pledged
|
Net amount
|
||||||||||||||||||||
|
Total derivative assets
|
$
|
21,521
|
|
$
|
—
|
|
$
|
21,521
|
|
$
|
(766
|
)
|
$
|
(8,536
|
)
|
$
|
12,219
|
|
||||||
|
Total derivative liabilities
|
$
|
(27,977
|
)
|
$
|
—
|
|
$
|
(27,977
|
)
|
$
|
766
|
|
$
|
14,858
|
|
$
|
(12,353
|
)
|
||||||
|
December 31, 2013
|
|
|
|
|
|
|
||||||||||||||||||
|
Total derivative assets
|
$
|
44,508
|
|
$
|
—
|
|
$
|
44,508
|
|
$
|
(2
|
)
|
$
|
—
|
|
$
|
44,506
|
|
||||||
|
Total derivative liabilities
|
$
|
(14,010
|
)
|
$
|
—
|
|
$
|
(14,010
|
)
|
$
|
2
|
|
$
|
4,341
|
|
$
|
(9,667
|
)
|
||||||
|
(1)
|
Amounts include all derivative instruments, irrespective of whether there is a legally enforceable master netting arrangement in place.
|
161
7. Goodwill and Intangible Assets
The Company’s goodwill related to the acquisitions of PartnerRe SA, Winterthur Re, Paris Re and PartnerRe Health and intangible assets related to the acquisitions of Paris Re and PartnerRe Health at
December 31, 2014
and
2013
were as follows (in thousands of U.S. dollars):
|
2014
|
Goodwill
|
Definite-
lived intangible
assets
|
Indefinite-
lived intangible
asset
|
Total
intangible assets
|
||||||||||||
|
Balance at January 1
|
$
|
456,380
|
|
$
|
179,740
|
|
$
|
7,350
|
|
$
|
187,090
|
|
||||
|
Intangible assets amortization
|
n/a
|
|
(27,486
|
)
|
n/a
|
|
(27,486
|
)
|
||||||||
|
Balance at December 31
|
$
|
456,380
|
|
$
|
152,254
|
|
$
|
7,350
|
|
$
|
159,604
|
|
||||
|
2013
|
Goodwill
|
Definite-
lived intangible
assets
|
Indefinite-
lived intangible
asset
|
Total
intangible assets
|
||||||||||||
|
Balance at January 1
|
$
|
456,380
|
|
$
|
206,920
|
|
$
|
7,350
|
|
$
|
214,270
|
|
||||
|
Intangible assets amortization
|
n/a
|
|
(27,180
|
)
|
n/a
|
|
(27,180
|
)
|
||||||||
|
Balance at December 31
|
$
|
456,380
|
|
$
|
179,740
|
|
$
|
7,350
|
|
$
|
187,090
|
|
||||
n/a: Not applicable
Definite-lived intangible assets are amortized over a period ranging from eleven to thirteen years. The gross carrying value and accumulated amortization of intangible assets by type that are yet to be fully amortized at
December 31, 2014
and
2013
is as follows (in thousands of U.S. dollars):
|
|
December 31, 2014
|
December 31, 2013
|
||||||||||||||
|
|
Gross carrying
value
|
Accumulated
amortization
|
Gross carrying
value
|
Accumulated
amortization
|
||||||||||||
|
Definite-lived intangible assets:
|
||||||||||||||||
|
Unpaid losses and loss expenses
|
$
|
191,196
|
|
$
|
131,908
|
|
$
|
191,196
|
|
$
|
115,958
|
|
||||
|
Renewal rights
|
48,163
|
|
12,273
|
|
48,163
|
|
5,432
|
|
||||||||
|
Customer relationships
|
63,408
|
|
6,332
|
|
63,408
|
|
1,637
|
|
||||||||
|
Total definite-lived intangible assets
|
$
|
302,767
|
|
$
|
150,513
|
|
$
|
302,767
|
|
$
|
123,027
|
|
||||
|
Indefinite-lived intangible asset:
|
||||||||||||||||
|
U.S. insurance licenses
|
7,350
|
|
n/a
|
|
7,350
|
|
n/a
|
|
||||||||
|
Total intangible assets
|
$
|
310,117
|
|
$
|
150,513
|
|
$
|
310,117
|
|
$
|
123,027
|
|
||||
n/a: Not applicable
At
December 31, 2014
and
2013
, the allocation of the goodwill to the Company’s segments and sub-segments was as follows (in thousands of U.S. dollars):
|
|
Amount
|
||
|
Non-life segment:
|
|||
|
North America
|
$
|
82,026
|
|
|
Global (Non-U.S.) P&C
|
149,895
|
|
|
|
Global Specialty
|
179,641
|
|
|
|
Catastrophe
|
26,014
|
|
|
|
Life and Health segment
|
18,804
|
|
|
|
Total goodwill
|
$
|
456,380
|
|
162
The estimated amortization expense for each of the five succeeding fiscal years related to the Company’s definite-lived intangible assets is as follows (in thousands of U.S. dollars):
|
Year
|
Amount
|
|||
|
2015
|
$
|
26,593
|
|
|
|
2016
|
25,919
|
|
||
|
2017
|
22,818
|
|
||
|
2018
|
21,247
|
|
||
|
2019
|
18,153
|
|
||
|
Total
|
$
|
114,730
|
|
|
8. Unpaid Losses and Loss Expenses and Policy Benefits for Life and Annuity Contracts
(a) Unpaid Losses and Loss Expenses
Unpaid losses and loss expenses are categorized into three types of reserves: case reserves, ACRs and IBNR reserves. Case reserves represent unpaid losses reported by the Company’s cedants and recorded by the Company. ACRs are established for particular circumstances where, on the basis of individual loss reports, the Company estimates that the particular loss or collection of losses covered by a treaty may be greater than those advised by the cedant. IBNR reserves represent a provision for claims that have been incurred but not yet reported to the Company, as well as future loss development on losses already reported, in excess of the case reserves and ACRs. The Company’s gross liability for unpaid losses and loss expenses reported by cedants (case reserves) and those estimated by the Company (ACRs and IBNR reserves) at
December 31, 2014
and
2013
was as follows (in thousands of U.S. dollars):
|
2014
|
2013
|
|||||||
|
Case reserves
|
$
|
4,236,038
|
|
$
|
4,663,164
|
|
||
|
ACRs
|
253,890
|
|
403,145
|
|
||||
|
IBNR reserves
|
5,255,878
|
|
5,580,009
|
|
||||
|
Total unpaid losses and loss expenses
|
$
|
9,745,806
|
|
$
|
10,646,318
|
|
||
The reconciliation of the beginning and ending gross and net liability for unpaid losses and loss expenses, excluding policy benefits for life and annuity contracts, for the years ended
December 31, 2014
,
2013
and
2012
was as follows (in thousands of U.S. dollars):
|
2014
|
2013
|
2012
|
||||||||||
|
Gross liability at beginning of year
|
$
|
10,646,318
|
|
$
|
10,709,371
|
|
$
|
11,273,091
|
|
|||
|
Reinsurance recoverable at beginning of year
|
267,384
|
|
291,330
|
|
353,105
|
|
||||||
|
Net liability at beginning of year
|
10,378,934
|
|
10,418,041
|
|
10,919,986
|
|
||||||
|
Net incurred losses related to:
|
||||||||||||
|
Current year
|
3,122,981
|
|
3,118,755
|
|
2,785,694
|
|
||||||
|
Prior years
|
(660,413
|
)
|
(721,499
|
)
|
(628,065
|
)
|
||||||
|
2,462,568
|
|
2,397,256
|
|
2,157,629
|
|
|||||||
|
Change in Paris Re Reserve Agreement
|
(25,412
|
)
|
(49,544
|
)
|
(86,163
|
)
|
||||||
|
Net paid losses related to:
|
||||||||||||
|
Current year
|
267,806
|
|
242,053
|
|
237,783
|
|
||||||
|
Prior years
|
2,530,743
|
|
2,159,506
|
|
2,467,279
|
|
||||||
|
2,798,549
|
|
2,401,559
|
|
2,705,062
|
|
|||||||
|
Effects of foreign exchange rate changes
|
(486,084
|
)
|
14,740
|
|
131,651
|
|
||||||
|
Net liability at end of year
|
9,531,457
|
|
10,378,934
|
|
10,418,041
|
|
||||||
|
Reinsurance recoverable at end of year
|
214,349
|
|
267,384
|
|
291,330
|
|
||||||
|
Gross liability at end of year
|
$
|
9,745,806
|
|
$
|
10,646,318
|
|
$
|
10,709,371
|
|
|||
163
The reconciliation of losses and loss expenses including life policy benefits for the years ended
December 31, 2014
,
2013
and
2012
was as follows (in thousands of U.S. dollars):
|
2014
|
2013
|
2012
|
||||||||||
|
Net incurred losses related to:
|
||||||||||||
|
Non-life
|
$
|
2,462,568
|
|
$
|
2,397,256
|
|
$
|
2,157,629
|
|
|||
|
Life and Health
|
1,000,202
|
|
760,552
|
|
646,981
|
|
||||||
|
Losses and loss expenses and life policy benefits
|
$
|
3,462,770
|
|
$
|
3,157,808
|
|
$
|
2,804,610
|
|
|||
The net favorable prior year loss development for each of the Company’s Non-life sub-segments for the years ended
December 31, 2014
,
2013
and
2012
was as follows (in thousands of U.S. dollars):
|
2014
|
2013
|
2012
|
||||||||||
|
Net favorable prior year loss development:
|
||||||||||||
|
Non-life sub-segment
|
||||||||||||
|
North America
|
$
|
250,942
|
|
$
|
222,839
|
|
$
|
218,483
|
|
|||
|
Global (Non-U.S.) P&C
|
134,394
|
|
180,052
|
|
114,279
|
|
||||||
|
Global Specialty
|
257,696
|
|
227,383
|
|
250,523
|
|
||||||
|
Catastrophe
|
17,381
|
|
91,225
|
|
44,780
|
|
||||||
|
Total net favorable prior year loss development
|
$
|
660,413
|
|
$
|
721,499
|
|
$
|
628,065
|
|
|||
For the Company’s North America sub-segment, the Company reported net favorable loss development for prior accident years in
2014
,
2013
and
2012
. The net favorable loss development for prior accident years in
2014
,
2013
and
2012
was driven by most lines of business, with the casualty line being the most pronounced. The net favorable loss development in each year was primarily due to favorable loss emergence.
For the Global (Non-U.S.) P&C sub-segment, the Company reported net favorable loss development for prior accident years in
2014
,
2013
and
2012
. The net favorable loss development for prior accident years in
2014
, 2013 and 2012 was driven by all lines of business, with the property line being the most pronounced. The net favorable loss development in each year was primarily due to favorable loss emergence.
For the Global Specialty sub-segment, the Company reported net favorable loss development for prior accident years in
2014
,
2013
and
2012
. The net favorable loss development for prior accident years in
2014
was driven by most lines of business, predominantly the marine, specialty property and aviation/space lines, while the credit/surety and engineering lines experienced combined adverse loss development for prior accident years of
$26 million
. The net favorable loss development for prior accident years in 2013 was driven by all lines of business, predominantly the aviation/space, marine and specialty property lines. The net favorable loss development for prior accident years in 2012 was driven by most lines of business, predominantly the specialty property, aviation/space and marine lines. The net favorable loss development in each year was primarily due to favorable loss emergence.
For the Catastrophe sub-segment, the Company reported net favorable loss development for prior accident years in
2014
,
2013
and
2012
. The net favorable loss development in 2014 was primarily due to favorable loss emergence, partially offset by adverse development related to the earthquakes that occurred in New Zealand in 2010 and 2011 (see Note 8(c) for additional information on claims related to the New Zealand earthquakes). The net favorable loss development in 2013 and 2012 was primarily due to favorable loss emergence.
(b) Paris Re Reserve Agreement
Following Paris Re’s acquisition of substantially all of the reinsurance operations of Colisée Re in 2006, Paris Re’s French operating subsidiary (Paris Re France) entered into a reserve agreement (Reserve Agreement), which provides that AXA and Colisée Re shall guarantee reserves in respect of Paris Re France and subsidiaries acquired in the acquisition. The Reserve Agreement relates to losses incurred prior to December 31, 2005. Accordingly, the Company’s Consolidated Statements of Operations do not include any favorable or adverse development related to these guaranteed reserves. The reserve guarantee provided by AXA and Colisée Re is conditioned upon, among other things, the guaranteed business, including all related ceded reinsurance, being managed by AXA Liabilities Managers, an affiliate of Colisée Re.
Favorable or adverse development related to the guaranteed reserves is recorded as a change in unpaid losses and loss expenses in the Consolidated Balance Sheets and as a change in the Reserve Agreement payable or receivable balance to/from
164
Colisée Re, which is included within the Funds held – directly managed account in the Consolidated Balance Sheets at
December 31, 2014
and
2013
, respectively. Accordingly, the reconciliation of the beginning and ending gross and net liability for unpaid losses and loss expenses for the years ended
December 31, 2014
,
2013
and
2012
includes the change in the Reserve Agreement. At
December 31, 2014
and
2013
, the Company’s net liability for unpaid losses and loss expenses includes
$575 million
and
$727 million
, respectively, of guaranteed reserves, with the decrease from
December 31, 2013
to
December 31, 2014
being primarily related to the commutation of a portion of the Reserve Agreement with Colisée Re, the run-off of the underlying loss reserves associated with this account and, to a lesser extent, the impact of the strengthening of the U.S. dollar against most major currencies.
(c) Claims Related to Catastrophic Events
A significant amount of judgment was used to estimate the range of potential losses related to the 2010 and the February and June 2011 New Zealand earthquakes (collectively, the New Zealand Earthquakes) and the Japan earthquake in 2011, and there remains a considerable degree of uncertainty related to the range of possible ultimate losses associated with these events and, in particular, the New Zealand Earthquakes. Loss estimates arising from earthquakes are inherently more uncertain than those from other catastrophic events and the Company believes the ultimate losses arising from the New Zealand Earthquakes may be materially in excess of, or less than, the amounts provided for in the Consolidated Balance Sheet at
December 31, 2014
.
The remaining significant risks and uncertainties related to the New Zealand Earthquakes include the ongoing cedant revisions of loss estimates for each of these events, the degree to which inflation impacts construction materials required to rebuild affected properties, the characteristics of the Company’s program participation for certain affected cedants and potentially affected cedants, and the expected length of the claims settlement period. In addition, there is further complexity related to the New Zealand Earthquakes given multiple earthquakes occurred in the same region in a relatively short period of time, resulting in cedants continuing to review and revise their allocation of losses between the various events and between different treaties, under which the Company may provide different amounts of coverage.
(d) Asbestos and Environmental Claims
The Company’s net reserves for unpaid losses and loss expenses at
December 31, 2014
and
2013
included
$189 million
and
$193 million
, respectively, that represent estimates of its net ultimate liability for asbestos and environmental claims. The gross liability for such claims at
December 31, 2014
and
2013
was
$201 million
and
$203 million
, respectively, which primarily relate to Paris Re’s gross liability for asbestos and environmental claims for accident years 2005 and prior of
$127 million
and
$123 million
, respectively, with any favorable or adverse development being subject to the Reserve Agreement. Of the remaining
$74 million
and
$80 million
in gross reserves at
December 31, 2014
and
2013
, respectively, the majority relates to casualty exposures in the United States arising from business written by the French branch of PartnerRe Europe and PartnerRe U.S.
Ultimate loss estimates for such claims cannot be estimated using traditional reserving techniques and there are significant uncertainties in estimating the amount of the Company’s potential losses for these claims. In view of the legal and tort environment that affect the development of such claims, the uncertainties inherent in estimating asbestos and environmental claims are not likely to be resolved in the near future. There can be no assurance that the reserves established by the Company will not be adversely affected by development of other latent exposures, and further, there can be no assurance that the reserves established by the Company will be adequate. The Company does, however, actively evaluate potential exposure to asbestos and environmental claims and establishes additional reserves as appropriate. The Company believes that it has made a reasonable provision for these exposures and is unaware of any specific issues that would materially affect its unpaid losses and loss expense reserves related to this exposure.
(e) Policy Benefits for Life and Annuity Contracts
The Life and Health segment reported net favorable loss development for prior accident years of
$19 million
,
$39 million
and
$14 million
for the years ended
December 31, 2014
,
2013
and
2012
, respectively.
The net favorable prior year loss development of
$19 million
in
2014
was primarily related to the guaranteed minimum death benefit (GMDB) business, PartnerRe Health and certain short-term treaties in the mortality line of business.
The net favorable prior year loss development of
$39 million
in 2013 was primarily related to the GMDB business and, to a lesser extent, certain short-term treaties in the mortality line of business. The net favorable development was primarily due to favorable claims experience, data updates received from cedants and improvements in the capital markets related to the GMDB business.
The net favorable prior year loss development of
$14 million
in 2012 was primarily related to the GMDB business, mainly driven by improvements in the capital markets, and certain short-term treaties in the mortality line of business.
165
The Company used interest rate assumptions to estimate its liabilities for policy benefits for life and annuity contracts which ranged from
0%
to
6.8%
and
0.1%
to
6.8%
at
December 31, 2014
and
2013
, respectively.
9. Reinsurance
(a) Reinsurance Recoverable on Paid and Unpaid Losses
The Company uses retrocessional agreements to reduce its exposure to risk of loss on reinsurance assumed. These agreements provide for recovery from retrocessionaires of a portion of losses and loss expenses. The Company remains liable to its cedants to the extent that the retrocessionaires do not meet their obligations under these agreements, and therefore the Company evaluates the financial condition of its reinsurers and monitors concentration of credit risk on an ongoing basis. The Company actively manages its reinsurance exposures by generally selecting retrocessionaires having a credit rating of A- or higher. In certain cases where an otherwise suitable retrocessionaire has a credit rating lower than A-, the Company generally requires the posting of collateral, including escrow funds and letters of credit, as a condition to its entering into a retrocession agreement. The Company regularly reviews its reinsurance recoverable balances to estimate an allowance for uncollectible amounts based on quantitative and qualitative factors. The allowance for uncollectible reinsurance recoverable was
$13 million
and
$15 million
at
December 31, 2014
and
2013
, respectively.
(b) Ceded Reinsurance
Net premiums written, net premiums earned and losses and loss expenses and life policy benefits are reported net of reinsurance in the Company’s Consolidated Statements of Operations. Assumed, ceded and net amounts for the years ended
December 31, 2014
,
2013
and
2012
were as follows (in thousands of U.S. dollars):
|
Premiums
Written
|
Premiums
Earned
|
Losses and Loss
Expenses and Life
Policy Benefits
|
||||||||||
|
2014
|
|
|
|
|||||||||
|
Assumed
|
$
|
5,932,003
|
|
$
|
5,824,398
|
|
$
|
3,503,060
|
|
|||
|
Ceded
|
212,119
|
|
215,203
|
|
40,290
|
|
||||||
|
Net
|
$
|
5,719,884
|
|
$
|
5,609,195
|
|
$
|
3,462,770
|
|
|||
|
2013
|
|
|
|
|||||||||
|
Assumed
|
$
|
5,569,706
|
|
$
|
5,373,866
|
|
$
|
3,207,860
|
|
|||
|
Ceded
|
173,180
|
|
175,656
|
|
50,052
|
|
||||||
|
Net
|
$
|
5,396,526
|
|
$
|
5,198,210
|
|
$
|
3,157,808
|
|
|||
|
2012
|
|
|
|
|||||||||
|
Assumed
|
$
|
4,718,235
|
|
$
|
4,640,949
|
|
$
|
2,838,117
|
|
|||
|
Ceded
|
145,375
|
|
155,010
|
|
33,507
|
|
||||||
|
Net
|
$
|
4,572,860
|
|
$
|
4,485,939
|
|
$
|
2,804,610
|
|
|||
10. Debt
Senior Notes
In March 2010, PartnerRe Finance B LLC (PartnerRe Finance B), an indirect
100%
owned subsidiary of the parent company, issued
$500 million
aggregate principal amount of
5.500%
Senior Notes (2010 Senior Notes, or collectively with the 2008 Senior Notes defined below referred to as Senior Notes). The 2010 Senior Notes will mature on
June 1, 2020
and may be redeemed at the option of the issuer, in whole or in part, at any time. Interest on the 2010 Senior Notes is payable
semi-annually
and commenced on
June 1, 2010
at an annual fixed rate of
5.500%
, and cannot be deferred.
The 2010 Senior Notes are ranked as senior unsecured obligations of PartnerRe Finance B. The parent company has fully and unconditionally guaranteed all obligations of PartnerRe Finance B under the 2010 Senior Notes. The parent company’s obligations under this guarantee are senior and unsecured and rank equally with all other senior unsecured indebtedness of the parent company.
166
Contemporaneously, PartnerRe U.S. Holdings, a wholly-owned subsidiary of the parent company, issued a
5.500%
promissory note, with a principal amount of
$500 million
to PartnerRe Finance B. Under the terms of the promissory note, PartnerRe U.S. Holdings promises to pay to PartnerRe Finance B the principal amount on
June 1, 2020
, unless previously paid. Interest on the promissory note commenced on
June 1, 2010
and is payable
semi-annually
at an annual fixed rate of
5.500%
, and cannot be deferred.
For each of the years ended
December 31, 2014
,
2013
and
2012
, the Company incurred interest expense and paid interest of $27.5 million in relation to the 2010 Senior Notes issued by PartnerRe Finance B.
In May 2008, PartnerRe Finance A LLC (PartnerRe Finance A), an indirect
100%
owned subsidiary of the parent company, issued
$250 million
aggregate principal amount of
6.875%
Senior Notes (2008 Senior Notes, or collectively with 2010 Senior Notes referred to as Senior Notes). The 2008 Senior Notes will mature on
June 1, 2018
and may be redeemed at the option of the issuer, in whole or in part, at any time. Interest on the 2008 Senior Notes is payable
semi-annually
and commenced on
December 1, 2008
at an annual fixed rate of
6.875%
, and cannot be deferred.
The 2008 Senior Notes are ranked as senior unsecured obligations of PartnerRe Finance A. The parent company has fully and unconditionally guaranteed all obligations of PartnerRe Finance A under the 2008 Senior Notes. The parent company’s obligations under this guarantee are senior and unsecured and rank equally with all other senior unsecured indebtedness of the parent company.
Contemporaneously, PartnerRe U.S. Holdings issued a
6.875%
promissory note, with a principal amount of
$250 million
to PartnerRe Finance A. Under the terms of the promissory note, PartnerRe U.S. Holdings promises to pay to PartnerRe Finance A the principal amount on
June 1, 2018
, unless previously paid. Interest on the promissory note is payable
semi-annually
and commenced on
December 1, 2008
at an annual fixed rate of
6.875%
, and cannot be deferred.
For each of the years ended
December 31, 2014
,
2013
and
2012
, the Company incurred interest expense and paid interest of $17.2 million in relation to the 2008 Senior Notes issued by PartnerRe Finance A.
Capital Efficient Notes (CENts)
In November 2006, PartnerRe Finance II Inc. (PartnerRe Finance II), an indirect
100%
owned subsidiary of the parent company, issued
$250 million
aggregate principal amount of
6.440%
Fixed-to-Floating Rate Junior Subordinated CENts. The CENts will mature on
December 1, 2066
and may be redeemed at the option of the issuer, in whole or in part, after
December 1, 2016
or earlier upon occurrence of specific rating agency or tax events. Interest on the CENts is payable
semi-annually
and commenced on
June 1, 2007
through to
December 1, 2016
at an annual fixed rate of
6.440%
and will be payable
quarterly
thereafter until maturity at an annual rate of
3-month LIBOR
plus a margin equal to
2.325%
.
PartnerRe Finance II may elect to defer one or more interest payments for up to ten years, although interest will continue to accrue and compound at the rate of interest applicable to the CENts. The CENts are ranked as junior subordinated unsecured obligations of PartnerRe Finance II. The parent company has fully and unconditionally guaranteed on a subordinated basis all obligations of PartnerRe Finance II under the CENts. The parent company’s obligations under this guarantee are unsecured and rank junior in priority of payments to the parent company’s Senior Notes.
Contemporaneously, PartnerRe U.S. Holdings issued a
6.440%
Fixed-to-Floating Rate promissory note, with a principal amount of
$257.6 million
to PartnerRe Finance II. Under the terms of the promissory note, PartnerRe U.S. Holdings promises to pay to PartnerRe Finance II the principal amount on
December 1, 2066
, unless previously paid. Interest on the promissory note is payable
semi-annually
and commenced on
June 1, 2007
through to
December 1, 2016
at an annual fixed rate of
6.440%
and will be payable
quarterly
thereafter until maturity at an annual rate of
3-month LIBOR
plus a margin equal to
2.325%
.
On March 13, 2009, PartnerRe Finance II, under the terms of a tender offer, paid holders
$500
per
$1,000
principal amount of CENts tendered, and purchased approximately
75%
of the issue, or
$186.6 million
, for
$93.3 million
. Contemporaneously, under the terms of a cross receipt agreement, PartnerRe U.S. Holdings paid PartnerRe Finance II consideration of
$93.3 million
for the extinguishment of
$186.6 million
of the principal amount of PartnerRe U.S. Holdings’ 6.440% Fixed-to-Floating Rate promissory note due December 1, 2066. All other terms and conditions of the remaining CENts and promissory note remain unchanged. A pre-tax gain of
$88.4 million
, net of deferred issuance costs and fees, was realized on the foregoing transactions during the year ended December 31, 2009. At
December 31, 2014
and
2013
, the aggregate principal amount of the CENts and promissory note outstanding was
$63.4 million
and
$71.0 million
, respectively.
For each of the years ended
December 31, 2014
,
2013
and
2012
, the Company incurred interest expense and paid interest of $4.6 million in relation to the CENts.
167
11. Shareholders’ Equity
Authorized Shares
At
December 31, 2014
and
2013
, the total authorized shares of the Company were 200 million shares, par value
$1.00
per share, as follows (in millions of shares):
|
Shares
|
|||
|
Designated common shares
|
130.0
|
|
|
|
Designated 6.5% Series D cumulative redeemable preferred shares
|
9.2
|
|
|
|
Designated 7.25% Series E cumulative redeemable preferred shares
|
15.0
|
|
|
|
Designated 5.875% Series F non-cumulative redeemable preferred shares
|
10.0
|
|
|
|
Designated and redeemed preference shares
|
25.6
|
|
|
|
Undesignated
|
10.2
|
|
|
|
200.0
|
|
||
Common Shares
Share repurchases
During
2014
, the Company repurchased, under its authorized share repurchase program,
5.2 million
of its common shares at a total cost of
$551.4 million
, representing an average cost of
$106.30
per share. At
December 31, 2014
, the Company had approximately
3.4 million
common shares remaining under its current share repurchase authorization and approximately
39.4 million
common shares were held in treasury and are available for reissuance.
During 2013, the Company repurchased, under its authorized share repurchase program,
7.7 million
of its common shares at a total cost of
$695.3 million
, representing an average cost of
$90.73
per share.
During 2012, the Company repurchased, under its authorized share repurchase program,
7.1 million
of its common shares at a total cost of
$532.9 million
, representing an average cost of
$75.00
per share.
Redeemable Preferred Shares
During the years ended
December 31, 2014
,
2013
and
2012
, the Company had Series C, Series D and Series E cumulative redeemable preferred shares and Series F non-cumulative redeemable preferred shares outstanding as follows (in millions of U.S. dollars or shares, except percentage amounts):
|
Series C
|
Series D
|
Series E
|
Series F
|
|||||||||||||
|
Date of issuance
|
May 2003
|
|
November 2004
|
|
June 2011
|
|
February 2013
|
|
||||||||
|
Number of preferred shares issued
|
11.6
|
|
9.2
|
|
15.0
|
|
10.0
|
|
||||||||
|
Annual dividend rate
|
6.75
|
%
|
6.5
|
%
|
7.25
|
%
|
5.875
|
%
|
||||||||
|
Total consideration
|
$
|
280.9
|
|
$
|
222.3
|
|
$
|
361.7
|
|
$
|
242.3
|
|
||||
|
Underwriting discounts and commissions
|
$
|
9.1
|
|
$
|
7.7
|
|
$
|
12.1
|
|
$
|
7.7
|
|
||||
|
Aggregate liquidation value
|
$
|
290.0
|
|
$
|
230.0
|
|
$
|
373.8
|
|
$
|
250.0
|
|
||||
|
Date of redemption
|
March 2013
|
|
n/a
|
|
n/a
|
|
n/a
|
|
||||||||
n/a: Not applicable
On February 14, 2013, the Company issued the Series F preferred shares. The net proceeds received on issuance of the Series F preferred shares were used, together with available cash, to redeem the Series C preferred shares.
On March 18, 2013, the Company redeemed the Series C preferred shares for the aggregate liquidation value of $290 million plus accrued and unpaid dividends. In connection with the redemption, the Company recognized a loss of $9.1 million related to the original issuance costs of the Series C preferred shares and calculated as a difference between the redemption price and the consideration received after underwriting discounts and commissions. The loss was recognized in determining the net income attributable to PartnerRe Ltd. common shareholders.
168
The Company may redeem each of the Series D, E and F preferred shares at $25.00 per share plus accrued and unpaid dividends without interest as follows: (i) the Series D preferred shares can be redeemed at the Company’s option at any time or in part from time to time; (ii) the Series E preferred shares can be redeemed at the Company’s option on or after June 1, 2016 or at any time upon certain changes in tax law and (iii) the Series F preferred shares can be redeemed at the Company’s option at any time or in part from time to time on or after March 1, 2018. The Company may also redeem the Series F preferred shares at any time upon the occurrence of a certain “capital disqualification event” or certain changes in tax law. Dividends on the Series F preferred shares are non-cumulative and are payable quarterly.
Dividends on each of the Series D and E preferred shares are cumulative from the date of issuance and are payable quarterly in arrears. Dividends on Series F preferred shares are non-cumulative and are payable quarterly.
In the event of liquidation of the Company, each of the Series D, E and F preferred shares rank on parity with each of the other series of preferred shares and would rank senior to the common shares. The holders of the Series D and E preferred shares would receive a distribution of $25.00 per share, or the aggregate liquidation value, plus accrued but unpaid dividends, if any. The holders of the Series F would receive a distribution of $25.00 per share, or the aggregate liquidation value, plus declared and unpaid dividends, if any.
12. Net Income per Share
The reconciliation of basic and diluted net income per share and dividends declared per common share for the years ended
December 31, 2014
,
2013
and
2012
is as follows (in thousands of U.S. dollars, except share and per share data):
|
2014
|
2013
|
2012
|
|||||||||
|
Numerator:
|
|||||||||||
|
Net income attributable to PartnerRe Ltd.
|
$
|
1,054,974
|
|
$
|
664,008
|
|
$
|
1,134,514
|
|
||
|
Less: preferred dividends
|
56,735
|
|
57,861
|
|
61,622
|
|
|||||
|
Less: loss on redemption of preferred shares
|
—
|
|
9,135
|
|
—
|
|
|||||
|
Net income attributable to PartnerRe Ltd. common shareholders
|
$
|
998,239
|
|
$
|
597,012
|
|
$
|
1,072,892
|
|
||
|
Denominator:
|
|||||||||||
|
Weighted number of common shares outstanding – basic
|
50,019,480
|
|
55,378,980
|
|
62,915,992
|
|
|||||
|
Share options and other
(1)
|
1,154,745
|
|
1,069,125
|
|
699,756
|
|
|||||
|
Weighted average number of common shares and common share equivalents outstanding – diluted
|
51,174,225
|
|
56,448,105
|
|
63,615,748
|
|
|||||
|
Basic net income per share
|
$
|
19.96
|
|
$
|
10.78
|
|
$
|
17.05
|
|
||
|
Diluted net income per share
(1)
|
$
|
19.51
|
|
$
|
10.58
|
|
$
|
16.87
|
|
||
|
Dividends declared per common share
|
$
|
2.68
|
|
$
|
2.56
|
|
$
|
2.48
|
|
||
|
Anti-dilutive common shares excluded from weighted average number of common shares and common share equivalents outstanding - diluted
(1)
|
127,329
|
|
14,784
|
|
554,747
|
|
|||||
|
(1)
|
Where the exercise price of share based awards is greater than the average market price of the common shares, the common shares are considered anti-dilutive and are excluded from the calculation of weighted average number of common shares and common share equivalents outstanding - diluted.
|
13. Noncontrolling Interests
In March 2013, the Company formed with other third party investors, Lorenz Re Ltd. (Lorenz Re), a Bermuda domiciled special purpose insurer to provide additional capacity to the Company for a diversified portfolio of catastrophe reinsurance treaties over a multi-year period on a fully collateralized reinsurance basis. Lorenz Re is a segregated cell company under the laws of Bermuda. The original business was written by the Company and was ceded to Lorenz Re effective April 1, 2013.
Within Lorenz Re, distinct segregated accounts are formed, and capitalized, in order to enter into reinsurance agreements with the Company on a fully collateralized basis. In 2013, Lorenz Re issued non-voting redeemable preferred share capital on behalf of two segregated accounts which are redeemable at the option of the Company and are expected to be redeemed following the commutation of the portfolio back to the Company on or before June 1, 2016.
At
December 31, 2014
and
2013
, the total assets of Lorenz Re were
$100.8 million
and
$99.6 million
, respectively, primarily consisting of cash and investments. At
December 31, 2014
and
2013
, the total liabilities were
$13.1 million
and
$11.1 million
, respectively, primarily consisting of unearned premiums, unpaid losses and loss expenses and other reinsurance balances payable.
169
The assets of Lorenz Re can only be used to settle the liabilities of Lorenz Re and there is no recourse to the Company for any liabilities of Lorenz Re.
The reconciliation of the beginning and ending balance of the noncontrolling interests in Lorenz Re for the years ended
December 31, 2014
and
2013
was as follows (in thousands of U.S. dollars):
|
2014
|
2013
|
||||||
|
Balance at January 1
|
$
|
56,627
|
|
$
|
—
|
|
|
|
Net income attributable to noncontrolling interests
|
13,139
|
|
9,434
|
|
|||
|
Distribution to noncontrolling interests
|
(14,265
|
)
|
—
|
|
|||
|
Sale of shares to noncontrolling interests
|
—
|
|
47,193
|
|
|||
|
Balance at December 31
|
$
|
55,501
|
|
$
|
56,627
|
|
|
14. Dividend Restrictions and Statutory Requirements
The Company’s ability to pay common and preferred shareholders’ dividends and its corporate expenses is dependent mainly on cash dividends from PartnerRe Bermuda, PartnerRe Europe and PartnerRe U.S. (collectively, the reinsurance subsidiaries), which are the Company’s most significant subsidiaries. The payment of such dividends by the reinsurance subsidiaries to the Company is limited under Bermuda and Irish laws and certain statutes of various U.S. states in which PartnerRe U.S. is licensed to transact business. The restrictions are generally based on net income and/or certain levels of policyholders’ earned surplus as determined in accordance with the relevant statutory accounting practices. At
December 31, 2014
, there were no restrictions on the Company’s ability to pay common and preferred shareholders’ dividends from its retained earnings, except for the reinsurance subsidiaries’ dividend restrictions described below.
The reinsurance subsidiaries are required to file annual statements with insurance regulatory authorities prepared on an accounting basis prescribed or permitted by such authorities (statutory basis), maintain minimum levels of solvency and liquidity and comply with risk-based capital requirements and licensing rules. At
December 31, 2014
, the reinsurance subsidiaries’ solvency, liquidity and risk-based capital amounts were in excess of the minimum levels required. The typical adjustments to insurance statutory basis amounts to convert to U.S. GAAP include elimination of certain statutory reserves, deferral of certain acquisition costs, recognition of goodwill, intangible assets and deferred income taxes, valuation of bonds at fair value and presentation of ceded reinsurance balances gross of assumed balances.
PartnerRe Bermuda may declare dividends subject to it continuing to meet its minimum solvency and capital requirements, which are to hold statutory capital and surplus equal to or exceeding the Target Capital Level, which is equivalent to
120%
of the Enhanced Capital Requirement (ECR). The ECR is calculated with reference to the Bermuda Solvency Capital Requirement model, which is a risk-based capital model. At
December 31, 2014
, the maximum dividend that PartnerRe Bermuda could pay without prior regulatory approval was approximately
$1,080 million
.
PartnerRe Europe may declare dividends subject to it continuing to meet its minimum solvency and capital requirements, which are to hold statutory capital and surplus equal to or exceeding the Required Solvency Margin (RSM). The RSM is calculated with reference to Solvency I regulations. The maximum dividend is limited to “profits available for distribution”, which consist of accumulated realized profits less accumulated realized losses. At
December 31, 2014
, the maximum dividend that PartnerRe Europe could pay without prior regulatory approval was approximately
$533 million
.
PartnerRe U.S. may declare dividends subject to it continuing to meet its minimum solvency and capital requirements and is generally limited to paying dividends from earned surplus. The maximum dividend that can be declared and paid without prior approval is limited, together with all dividends declared and paid during the preceding twelve months, to the lesser of net investment income for the previous twelve months or
10%
of its total statutory capital and surplus. At
December 31, 2014
, the maximum dividend that PartnerRe U.S. could pay without prior regulatory approval was $
nil
as a result of dividends having already been declared and paid during 2014.
The statutory financial statements and returns of the Company’s reinsurance subsidiaries at, and for the year ended,
December 31, 2014
are due to be submitted to the relevant regulatory authorities later in
2015
, with different filing dates in each jurisdiction. In certain jurisdictions, the statutory financial statements and returns are subject to the review and final approval of the relevant regulatory authorities.
170
The statutory net income of the Company’s reinsurance subsidiaries for the years ended
December 31, 2014
,
2013
and
2012
was as follows (in millions of U.S. dollars):
|
2014
|
2013
|
2012
|
||||||||||
|
PartnerRe Bermuda
|
$
|
660
|
|
$
|
616
|
|
$
|
659
|
|
|||
|
PartnerRe Europe
|
298
|
|
9
|
|
323
|
|
||||||
|
PartnerRe U.S.
|
236
|
|
123
|
|
181
|
|
||||||
The required and actual statutory capital and surplus of the Company’s reinsurance subsidiaries at
December 31, 2014
and
2013
was as follows (in millions of U.S. dollars):
|
|
PartnerRe Bermuda
|
PartnerRe Europe
|
PartnerRe U.S.
|
|||||||||||||||||||||
|
|
2014
|
2013
|
2014
|
2013
|
2014
|
2013
|
||||||||||||||||||
|
Required statutory capital and surplus
|
$
|
2,092
|
|
$
|
2,169
|
|
$
|
867
|
|
$
|
947
|
|
$
|
764
|
|
$
|
852
|
|
||||||
|
Actual statutory capital and surplus
|
3,172
|
|
3,277
|
|
1,400
|
|
1,512
|
|
1,420
|
|
1,332
|
|
||||||||||||
At
December 31, 2014
and
2013
, the Company has Swiss and French branches of PartnerRe Europe that are regulated by the Central Bank of Ireland, as prescribed by the EU Reinsurance Directive.
In addition to the required statutory capital and surplus requirements in the table above, the Company assesses it own solvency capital needs both at a Group and subsidiary level taking into account factors which may not be fully reflected in statutory requirements. The Company’s solvency capital requirements determined under these self assessments may impact the level of the dividends payable by its reinsurance subsidiaries.
Of the Company’s total net assets of
$7.0 billion
at
December 31, 2014
, the total amount of restricted net assets for the Company’s consolidated subsidiaries was
$5.1 billion
and primarily related to the statutory dividend restrictions described above.
15. Taxation
The Company and its Bermuda domiciled subsidiaries are not subject to Bermuda income or capital gains tax under current Bermuda law. In the event that there is a change in current law such that taxes on income or capital gains are imposed, the Company and its Bermuda domiciled subsidiaries would be exempt from such tax until March 2035 pursuant to the Bermuda Exempted Undertakings Tax Protection Act of 1966.
The Company has subsidiaries and branches that operate in various other jurisdictions around the world that are subject to tax in the jurisdictions in which they operate. The significant jurisdictions in which the Company’s subsidiaries and branches are subject to tax are Canada, France, Ireland, Singapore, Switzerland and the United States.
Income tax returns are open for examination for the tax years 2009-2014 in Canada and Ireland, 2010-2014 in Switzerland, 2011-2014 in the United States, 2012-2014 in Singapore and 2013-2014 in France. As a global organization, the Company may be subject to a variety of transfer pricing or permanent establishment challenges by taxing authorities in various jurisdictions. While management believes that adequate provision has been made in the Consolidated Financial Statements for any potential assessments that may result from tax examinations for all open tax years, the completion of tax examinations for open years may result in changes to the amounts recognized in the Consolidated Financial Statements.
171
Income tax expense for the years ended
December 31, 2014
,
2013
and
2012
was as follows (in thousands of U.S. dollars):
|
2014
|
2013
|
2012
|
||||||||||
|
Current income tax expense
|
||||||||||||
|
U.S.
|
$
|
51,615
|
|
$
|
55,993
|
|
$
|
29,196
|
|
|||
|
Non U.S.
|
184,367
|
|
73,599
|
|
115,669
|
|
||||||
|
Total current income tax expense
|
$
|
235,982
|
|
$
|
129,592
|
|
$
|
144,865
|
|
|||
|
Deferred income tax expense (benefit)
|
||||||||||||
|
U.S.
|
$
|
20,410
|
|
$
|
(13,693
|
)
|
$
|
48,740
|
|
|||
|
Non U.S.
|
(17,636
|
)
|
(70,886
|
)
|
6,717
|
|
||||||
|
Total deferred income tax expense (benefit)
|
$
|
2,774
|
|
$
|
(84,579
|
)
|
$
|
55,457
|
|
|||
|
Unrecognized tax expense (benefit)
|
||||||||||||
|
U.S.
|
$
|
—
|
|
$
|
(335
|
)
|
$
|
(623
|
)
|
|||
|
Non U.S.
|
750
|
|
3,738
|
|
4,585
|
|
||||||
|
Total unrecognized tax expense
|
$
|
750
|
|
$
|
3,403
|
|
$
|
3,962
|
|
|||
|
Total income tax expense
|
||||||||||||
|
U.S.
|
$
|
72,025
|
|
$
|
41,965
|
|
$
|
77,313
|
|
|||
|
Non U.S.
|
167,481
|
|
6,451
|
|
126,971
|
|
||||||
|
Total income tax expense
|
$
|
239,506
|
|
$
|
48,416
|
|
$
|
204,284
|
|
|||
172
Income before taxes attributable to the Company’s domestic and foreign operations and a reconciliation of the actual income tax rate to the amount computed by applying the effective tax rate of
0%
under Bermuda (the Company’s domicile) law to income before taxes was as follows for the years ended
December 31, 2014
,
2013
and
2012
(in thousands of U.S. dollars):
|
2014
|
2013
|
2012
|
||||||||||
|
Domestic (Bermuda)
|
$
|
686,538
|
|
$
|
611,900
|
|
$
|
661,648
|
|
|||
|
Foreign
|
621,081
|
|
109,958
|
|
677,150
|
|
||||||
|
Income before taxes
|
$
|
1,307,619
|
|
$
|
721,858
|
|
$
|
1,338,798
|
|
|||
|
Reconciliation of effective tax rate (% of income before taxes)
|
|||||||||
|
Expected tax rate
|
0.0
|
%
|
0.0
|
%
|
0.0
|
%
|
|||
|
Foreign taxes at local expected tax rates
|
15.8
|
|
5.1
|
|
14.6
|
|
|||
|
Impact of foreign exchange gains (losses)
|
2.2
|
|
(1.1
|
)
|
(0.4
|
)
|
|||
|
Unrecognized tax benefit
|
0.1
|
|
0.5
|
|
0.3
|
|
|||
|
Tax-exempt income and expenses not deductible
|
(2.2
|
)
|
(0.9
|
)
|
(0.3
|
)
|
|||
|
Impact of enacted changes in tax laws
|
—
|
|
1.8
|
|
0.7
|
|
|||
|
Foreign branch tax
|
1.4
|
|
(1.4
|
)
|
(0.7
|
)
|
|||
|
Ceding commissions
|
1.8
|
|
(0.4
|
)
|
0.7
|
|
|||
|
Valuation allowance
|
(0.6
|
)
|
1.3
|
|
1.2
|
|
|||
|
Other
|
(0.2
|
)
|
1.8
|
|
(0.8
|
)
|
|||
|
Actual tax rate
|
18.3
|
%
|
6.7
|
%
|
15.3
|
%
|
|||
Deferred tax assets and liabilities reflect the tax impact of temporary differences between the carrying amounts of assets and liabilities for financial reporting and income tax purposes. Significant components of the net deferred tax assets and liabilities at
December 31, 2014
and
2013
were as follows (in thousands of U.S. dollars):
|
2014
|
2013
|
|||||||
|
Deferred tax assets
|
||||||||
|
Discounting of loss reserves and adjustment to life policy reserves
|
$
|
77,117
|
|
$
|
78,999
|
|
||
|
Foreign tax credit carryforwards
|
57,186
|
|
42,620
|
|
||||
|
Tax loss carryforwards
|
35,384
|
|
23,940
|
|
||||
|
Unearned premiums
|
23,230
|
|
23,022
|
|
||||
|
Other deferred tax assets
|
32,431
|
|
33,648
|
|
||||
|
225,348
|
|
202,229
|
|
|||||
|
Valuation allowance
|
(68,115
|
)
|
(46,111
|
)
|
||||
|
Deferred tax assets
|
157,233
|
|
156,118
|
|
||||
|
Deferred tax liabilities
|
||||||||
|
Deferred acquisition costs
|
54,718
|
|
52,165
|
|
||||
|
Goodwill and other intangibles
|
93,416
|
|
102,619
|
|
||||
|
Equalization reserves
|
77,383
|
|
128,132
|
|
||||
|
Unrealized appreciation and timing differences on investments
|
85,873
|
|
72,769
|
|
||||
|
Other deferred tax liabilities
|
51,385
|
|
23,866
|
|
||||
|
Deferred tax liabilities
|
362,775
|
|
379,551
|
|
||||
|
Net deferred tax liabilities
|
$
|
(205,542
|
)
|
$
|
(223,433
|
)
|
||
The components of net tax assets and liabilities at
December 31, 2014
and
2013
were as follows (in thousands of U.S. dollars):
|
2014
|
2013
|
|||||||
|
Net tax assets
|
$
|
6,876
|
|
$
|
14,133
|
|
||
|
Net tax liabilities
|
(240,989
|
)
|
(284,442
|
)
|
||||
|
Net tax liabilities
|
$
|
(234,113
|
)
|
$
|
(270,309
|
)
|
||
173
|
2014
|
2013
|
|||||||
|
Net current tax liabilities
|
$
|
(9,739
|
)
|
$
|
(26,308
|
)
|
||
|
Net deferred tax liabilities
|
(205,542
|
)
|
(223,433
|
)
|
||||
|
Net unrecognized tax benefit
|
(18,832
|
)
|
(20,568
|
)
|
||||
|
Net tax liabilities
|
$
|
(234,113
|
)
|
$
|
(270,309
|
)
|
||
Realization of the deferred tax assets is dependent on generating sufficient taxable income in future periods. Although realization is not assured, Management believes that it is more likely than not that the deferred tax assets will be realized. The valuation allowance recorded at
December 31, 2014
related to a foreign tax credit carryforward of
$47.0 million
in Ireland and to tax loss carryforwards of
$20.0 million
and
$1.1 million
in Singapore and Canada, respectively. The valuation allowance recorded at December 31, 2013 related to a foreign tax credit carryforward of
$24.7 million
in Ireland and to a tax loss carryforward of
$21.4 million
in Singapore.
At
December 31, 2014
, the deferred tax assets (after valuation allowance) included foreign tax credit carryforwards of
$10.1 million
in Ireland, which can be carried forward for an unlimited period of time, tax loss carryforwards of
$10.3 million
in Switzerland, which can be carried forward for
7
years, and
$3.1 million
in Ireland, which can be carried forward for an unlimited period of time. At December 31, 2013, the deferred tax assets (after valuation allowance) included foreign tax credit carryforwards of
$14.4 million
in Ireland, which can be carried forward for an unlimited period of time, and
$3.6 million
in the United States, which can be carried forward for
10
years and also included tax loss carryforwards of
$1.7 million
in Ireland, which can be carried forward for an unlimited period of time.
The total amount of unrecognized tax benefits for the years ended
December 31, 2014
,
2013
and
2012
was as follows (in thousands of U.S. dollars):
|
January 1,
2014
|
Changes in tax
positions taken
during a prior
period
|
Tax positions
taken
during the
current period
|
Change as a
result of a lapse
of the statute
of limitations
|
Impact of the
change in
foreign currency
exchange rates
|
December 31,
2014
|
|||||||||||||||||||
|
Unrecognized tax benefits that, if recognized, would impact the effective tax rate
|
$
|
19,353
|
|
$
|
1,338
|
|
$
|
5,142
|
|
$
|
(5,197
|
)
|
$
|
(2,370
|
)
|
$
|
18,266
|
|
||||||
|
Interest and penalties recognized on the above
|
1,215
|
|
259
|
|
—
|
|
(792
|
)
|
(116
|
)
|
566
|
|
||||||||||||
|
Total unrecognized tax benefits, including interest and penalties
|
$
|
20,568
|
|
$
|
1,597
|
|
$
|
5,142
|
|
$
|
(5,989
|
)
|
$
|
(2,486
|
)
|
$
|
18,832
|
|
||||||
|
January 1,
2013
|
Changes in tax
positions taken
during a prior
period
|
Tax positions
taken
during the
current period
|
Change as a
result of a lapse
of the statute
of limitations
|
Impact of the
change in
foreign currency
exchange rates
|
December 31,
2013
|
|||||||||||||||||||
|
Unrecognized tax benefits that, if recognized, would impact the effective tax rate
|
$
|
15,784
|
|
$
|
(5,038
|
)
|
$
|
10,164
|
|
$
|
(2,102
|
)
|
$
|
545
|
|
$
|
19,353
|
|
||||||
|
Interest and penalties recognized on the above
|
800
|
|
507
|
|
51
|
|
(179
|
)
|
36
|
|
1,215
|
|
||||||||||||
|
Total unrecognized tax benefits, including interest and penalties
|
$
|
16,584
|
|
$
|
(4,531
|
)
|
$
|
10,215
|
|
$
|
(2,281
|
)
|
$
|
581
|
|
$
|
20,568
|
|
||||||
174
|
January 1,
2012
|
Changes in tax
positions taken
during a prior
period
|
Tax positions
taken
during the
current period
|
Change as a
result of a lapse
of the statute
of limitations
|
Impact of the
change in
foreign currency
exchange rates
|
December 31,
2012
|
|||||||||||||||||||
|
Unrecognized tax benefits that, if recognized, would impact the effective tax rate
|
$
|
11,879
|
|
$
|
1,571
|
|
$
|
3,080
|
|
$
|
(1,057
|
)
|
$
|
311
|
|
$
|
15,784
|
|
||||||
|
Interest and penalties recognized on the above
|
411
|
|
504
|
|
8
|
|
(144
|
)
|
21
|
|
800
|
|
||||||||||||
|
Total unrecognized tax benefits, including interest and penalties
|
$
|
12,290
|
|
$
|
2,075
|
|
$
|
3,088
|
|
$
|
(1,201
|
)
|
$
|
332
|
|
$
|
16,584
|
|
||||||
For the years ended
December 31, 2014
,
2013
and
2012
, there were no unrecognized tax benefits that, if recognized, would create a temporary difference between the reported amount of an item in the Company’s Consolidated Balance Sheets and its tax basis. The Company recognizes interest and penalties as income tax expense in its Consolidated Statements of Operations.
At
December 31, 2014
, there is no unrecognized tax benefit which is reasonably possible to change within twelve months.
16. Share-Based Awards
Employee Equity Plan
The Company’s Employee Equity Plan (EEP), which was approved by the Company’s shareholders, permits the grant of share options, RS, RSUs, SSARs or other share-based awards to employees of the Company. The EEP is administered by the Compensation and Management Development Committee of the Board (the Committee). From 2013, the Company also grants PSUs to employees of the Company.
The EEP permits the grant of up to
8.3 million
shares, of which a total of
3.4 million
shares can be issued as either RS, RSUs or PSUs and
4.9 million
shares can be issued as share options or SSARs. If an award under the EEP is cancelled or forfeited without the delivery of the full number of shares underlying such award, only the net number of shares actually delivered to the participant will be counted against the EEP’s authorized shares. Under the EEP, the exercise price of the award will not be less than the fair value of the award at the time of grant. The fair value is defined in the EEP as the closing price reported on the grant date. RSU and PSU awards granted under the EEP generally cliff vest after
three
years of continuous service. Share options and SSARs vest ratably over
three
years of continuous service and have a
ten
year contractual term. Participants in the EEP are eligible to receive dividend equivalents, which the Company records as an expense, on RSUs and PSUs that are unvested. At
December 31, 2014
,
4.0 million
shares, of which a total of
1.3 million
shares can be issued as either RS, RSUs or PSUs and
2.7 million
shares can be issued as share options or SSARs, remained available for issuance under this plan.
In addition, the Committee is authorized to grant performance awards to eligible senior executives. These performance awards will, if the Committee intends such award to qualify as “qualified performance based compensation” under Section 162(m) of the Internal Revenue Code (IRC), become earned and payable only if pre-established targets relating to certain performance measures are achieved. The individual maximum number of shares underlying any such share-denominated award granted in any calendar year will be
0.5 million
shares, and the individual maximum amount of any such cash-denominated award in any calendar year shall not exceed
$5.0 million
.
Non-Employee Directors Share Plan
The Company’s Non-Employee Directors Share Plan (Directors Share Plan), which was approved by the Company’s shareholders, permits the grant of up to
1.2 million
shares, of which a total of
0.8 million
shares can be issued as either RS or RSUs and
0.4 million
shares can be issued as share options or SSARs. Under the Directors Share Plan, the exercise price of the award will not be less than the fair value of the award at the time of grant. The fair value is defined in the Directors Share Plan as the closing price reported on the grant date.
Prior to 2013, options and RSUs were awarded under the Directors Share Plan, while in 2013 and after, only RSUs were awarded. Prior to May 2012, options generally vested at the time of grant, were expensed immediately and had a
ten
year contractual term. From May 2012, options generally vest and are expensed ratably over
three
years and have a
ten
year contractual term. Prior to May 2010, RSUs generally vested at the time of grant with a delivery date restriction of
one
year and were expensed immediately. From May 2010, RSUs have a
five
year cliff vest with
no
delivery restrictions and are expensed over the vesting
175
period. Prior to the RSU grant, directors have the ability to elect to receive their awards in the form of either
100%
RSUs, or split, with
60%
of the award being RSUs and
40%
of the award being cash upon delivery.
At
December 31, 2014
,
0.3 million
shares remained available for issuance under this plan.
Employee Share Purchase Plan
The PartnerRe Ltd. Employee Share Purchase Plan (ESPP), which was approved by the Company’s shareholders, has a
twelve
month offering period with
two
purchase periods of
six
months each. All employees are eligible to participate in the ESPP and can contribute between
1%
and
10%
of their base salary toward the purchase of the Company’s shares up to the limit set by the IRC. Employees who enroll in the ESPP may purchase the Company’s shares at a
15%
discount of the lower fair value on either the enrolment date or purchase date. Participants in the ESPP are eligible to receive dividends on their shares as of the purchase date. A total of
0.6 million
common shares may be issued under the ESPP. At
December 31, 2014
,
0.2 million
shares remained available for issuance under this plan.
Swiss Share Purchase Plan
The Swiss Share Purchase Plan (SSPP) has
two
offering periods per year with
two
purchase periods of
six
months each. Swiss employees, who work at least
20
hours per week, are eligible to participate in the SSPP and can contribute between
1%
and
8%
of their base salary toward the purchase of the Company’s shares up to a maximum of
5,000
Swiss francs per annum. Employees who enroll in the SSPP may purchase the Company’s shares at a
40%
discount of the fair value on the purchase date. There is a restriction on transfer or sale of these shares for a period of
two
years following purchase. Participants in the SSPP are eligible to receive dividends on their shares as of the purchase date. A total of
0.4 million
common shares may be issued under the SSPP. At
December 31, 2014
,
0.2 million
shares remained available for issuance under this plan.
Share-Based Compensation
Under each of the Company’s equity plans, the Company issues new shares upon the exercise of share options and SSARs or the conversion of RSUs into shares.
For the years ended
December 31, 2014
,
2013
and
2012
, the Company’s share-based compensation expense was
$34.4 million
,
$29.8 million
and
$26.8 million
, respectively, with a tax benefit of
$6.9 million
,
$3.3 million
and
$3.6 million
, respectively. Included within these tax benefits are amounts related to the exercise of share options and the conversion of RSUs and SSARs into shares by employees of the Company of
$6.2 million
,
$7.0 million
and
$1.6 million
for the years ended
December 31, 2014
,
2013
and
2012
, respectively.
Share Options
The activity related to share options granted and exercised for the years ended
December 31, 2014
,
2013
and
2012
was as follows:
|
2014
|
2013
|
2012
|
||||||||||
|
Options granted
|
—
|
|
—
|
|
120,210
|
|
||||||
|
Weighted average grant date fair value of options granted
|
$
|
—
|
|
$
|
—
|
|
$
|
7.90
|
|
|||
|
Options exercised
|
225,329
|
|
819,764
|
|
518,548
|
|
||||||
|
Total intrinsic value of options exercised (in millions of U.S. dollars)
|
$
|
8.7
|
|
$
|
24.8
|
|
$
|
8.8
|
|
|||
|
Proceeds from option exercises (in millions of U.S. dollars)
|
$
|
14.7
|
|
$
|
49.6
|
|
$
|
29.3
|
|
|||
The activity related to the Company’s share options for the year ended
December 31, 2014
was as follows:
|
Options
|
Weighted Average
Exercise Price
|
||||||
|
Outstanding at January 1, 2014
|
636,279
|
|
$
|
70.28
|
|
||
|
Granted
|
—
|
|
—
|
|
|||
|
Exercised
|
(225,329
|
)
|
67.87
|
|
|||
|
Forfeited or expired
|
(603
|
)
|
108.20
|
|
|||
|
Outstanding at December 31, 2014
|
410,347
|
|
$
|
71.55
|
|
||
|
Options exercisable at December 31, 2014
|
379,799
|
|
$
|
71.62
|
|
||
|
Options vested and expected to vest at December 31, 2014
|
409,841
|
|
$
|
71.55
|
|
||
176
The weighted average remaining contractual term and the aggregate intrinsic value of share options outstanding, exercisable, vested and expected to vest at
December 31, 2014
, was
4.7
years and
$17.5 million
, respectively.
The Company values share options issued with a Black-Scholes valuation model and used the following assumptions for the year ended
December 31, 2012
. No share options were issued for the years ended
December 31, 2014
and
2013
.
|
2012
|
|||
|
Expected life
|
6 years
|
|
|
|
Expected volatility
|
17.7
|
%
|
|
|
Risk-free interest rate
|
1.0
|
%
|
|
|
Dividend yield
|
2.7
|
%
|
|
Expected volatility is based on the historical volatility of the Company’s common shares over a period equivalent to the expected life of the Company’s share options. The risk-free interest rate is based on the market yield of U.S. treasury securities with maturities equivalent to the expected life of the Company’s share options. The dividend yield is based on the average dividend yield of the Company’s shares over the expected life of the Company’s share options.
Restricted Share Units and Performance Share Units
During the years ended
December 31, 2014
,
2013
and
2012
, the Company issued
333,358
RSUs and PSUs,
329,174
RSUs and PSUs and
294,184
RSUs with a weighted average grant date fair value of
$98.86
,
$89.44
and
$65.33
, respectively. The Company values RSUs and PSUs issued under all plans at the fair value of its common shares at the date of grant, as defined by the plan document.
The activity related to the Company’s RSUs and PSUs for the year ended
December 31, 2014
was as follows:
|
|
RSUs and PSUs
|
|
|
Outstanding at January 1, 2014
|
854,898
|
|
|
Granted
|
333,358
|
|
|
Performance based adjustment
|
39,870
|
|
|
Released
|
(253,389
|
)
|
|
Forfeited
|
(42,115
|
)
|
|
Outstanding at December 31, 2014
|
932,622
|
|
The RSUs that vested during the years ended
December 31, 2014
,
2013
and
2012
had a fair value of
$20.6 million
,
$22.8 million
and
$5.5 million
, respectively.
The total unrecognized share-based compensation expense related to unvested RSUs and PSUs was approximately
$32.7 million
at
December 31, 2014
, which is expected to be recognized over a weighted-average period of
1.8
years.
Share-Settled Share Appreciation Rights (SSARs)
During the years ended
December 31, 2014
,
2013
and
2012
, the Company issued
153,797
SSARs,
125,561
SSARs and
356,900
SSARs with a weighted average grant date fair value of
$14.62
,
$11.25
and
$7.34
, respectively.
The activity related to the Company’s SSARs for the year ended
December 31, 2014
was as follows:
|
|
SSARs
|
|
|
Outstanding at January 1, 2014
|
1,621,815
|
|
|
Granted
|
153,797
|
|
|
Exercised
|
(270,392
|
)
|
|
Forfeited or expired
|
(12,294
|
)
|
|
Outstanding at December 31, 2014
|
1,492,926
|
|
|
Exercisable at December 31, 2014
|
1,147,579
|
|
The total unrecognized share-based compensation expense related to unvested SSARs was approximately
$2.0 million
at
December 31, 2014
, which is expected to be recognized over a weighted-average period of
1.7
years.
177
The Company values SSARs issued with a Black-Scholes valuation model and used the following assumptions for the years ended
December 31, 2014
,
2013
and
2012
:
|
2014
|
2013
|
2012
|
|||||||
|
Expected life
|
6 years
|
|
6 years
|
|
6 years
|
|
|||
|
Expected volatility
|
18.1
|
%
|
18.3
|
%
|
17.6
|
%
|
|||
|
Risk-free interest rate
|
1.9
|
%
|
1.0
|
%
|
1.1
|
%
|
|||
|
Dividend yield
|
2.2
|
%
|
2.3
|
%
|
2.8
|
%
|
|||
In determining the weighted average assumptions used, the Company used the same methodology as described for share options above.
Warrants
In 2009, the Company issued
27,655
replacement warrants as part of the acquisition of Paris Re. At
December 31, 2014
,
8,667
warrants are outstanding and fully vested with a weighted average remaining contractual life of
2.0
years and a weighted average exercise price of
$31.54
. During the year ended
December 31, 2014
,
186
warrants were exercised with a weighted average exercise price of
$32.12
.
17. Retirement Benefit Arrangements
For employee retirement benefits, the Company maintains certain defined contributions plans and other active and frozen defined benefit plans. The majority of the defined benefit obligation at
December 31, 2014
relates to the active defined benefit plan for the Company’s Zurich office employees (the Zurich Plan).
Defined Contribution Plans
Contributions are made by the Company, and in some locations, these contributions are supplemented by the local plan participants. Contributions are based on a percentage of the participant’s base salary depending upon competitive local market practice and vesting provisions meeting legal compliance standards and market trends. The accumulated benefits for the majority of these plans vest immediately or over a four-year period. As required by law, certain retirement plans also provide for death and disability benefits and lump sum indemnities to employees upon retirement.
The Company incurred expenses for these defined contribution arrangements of
$15.9 million
,
$14.5 million
and
$15.7 million
for the years ended
December 31, 2014
,
2013
and
2012
, respectively.
178
Active Defined Benefit Plan
The Company maintains the Zurich Plan, which is classified as a hybrid plan and accounted for as a defined benefit plan under U.S. GAAP. At
December 31, 2014
and
2013
, the funded status of the Zurich Plan was as follows (in thousands of U.S. dollars):
|
2014
|
2013
|
|||||||
|
Funded status
|
||||||||
|
Unfunded pension obligation at beginning of year
|
$
|
24,614
|
|
$
|
32,262
|
|
||
|
Change in pension obligation
|
||||||||
|
Service cost
|
6,188
|
|
6,934
|
|
||||
|
Interest cost
|
2,635
|
|
2,314
|
|
||||
|
Plan participants’ contributions
|
1,838
|
|
1,938
|
|
||||
|
Actuarial loss (gain)
|
15,796
|
|
(8,408
|
)
|
||||
|
Plan amendments
|
2,667
|
|
—
|
|
||||
|
Benefits paid
|
(7,392
|
)
|
(216
|
)
|
||||
|
Foreign currency adjustments
|
(13,493
|
)
|
2,901
|
|
||||
|
Settlements
|
—
|
|
(13,783
|
)
|
||||
|
Change in pension obligation
|
8,239
|
|
(8,320
|
)
|
||||
|
Change in fair value of plan assets
|
||||||||
|
Actual return on plan assets
|
1,707
|
|
3,119
|
|
||||
|
Employer contributions
|
5,492
|
|
5,922
|
|
||||
|
Plan participants’ contributions
|
1,838
|
|
1,938
|
|
||||
|
Benefits paid
|
(7,392
|
)
|
(216
|
)
|
||||
|
Foreign currency adjustments
|
(10,157
|
)
|
2,348
|
|
||||
|
Settlements
|
—
|
|
(13,783
|
)
|
||||
|
Change in fair value of plan assets
|
(8,512
|
)
|
(672
|
)
|
||||
|
Funded status
|
||||||||
|
Unfunded pension obligation at end of year
|
$
|
41,365
|
|
$
|
24,614
|
|
||
|
Additional information:
|
||||||||
|
Projected benefit obligation at end of year
|
$
|
134,629
|
|
$
|
126,390
|
|
||
|
Accumulated pension obligation at end of year
|
127,322
|
|
123,524
|
|
||||
|
Fair value of plan assets at end of year
|
93,264
|
|
101,776
|
|
||||
At
December 31, 2014
and
2013
, the funded status was included in Accounts payable, accrued expenses and other in the Consolidated Balance Sheets. The total amounts recognized in Accumulated other comprehensive loss at
December 31, 2014
and
2013
were
$25.4 million
(net of
$6.8 million
of taxes) and
$12.9 million
(net of
$3.4 million
of taxes), respectively.
The net periodic benefit cost for the years ended
December 31, 2014
,
2013
and
2012
was
$7.3 million
,
$10.7 million
and
$8.3 million
, respectively.
The investment strategy of the Zurich Plan’s Pension Committee is to achieve a consistent long-term return, which will provide sufficient funding for future pension obligations while limiting risk. The expected long-term rate of return on plan assets is based on the expected asset allocation and assumptions concerning long-term interest rates, inflation rates and risk premiums for equities above the risk-free rates of return. These assumptions take into consideration historical long-term rates of return for the relevant asset categories. The investment strategy is reviewed regularly.
The fair value of the Zurich Plan’s assets at
December 31, 2014
and
2013
were insured funds and cash (Level 2) of
$93.3 million
and
$101.8 million
, respectively. The insured funds comprise the accumulated pension plan contributions and investment returns thereon, which are held in an insurance arrangement that provides at least a guaranteed minimum investment return. The insured funds are held by a collective foundation of AXA Life Ltd. and are guaranteed under the insurance arrangement.
179
The assumptions used to determine the Zurich Plan’s pension obligation and net periodic benefit cost for the years ended
December 31, 2014
,
2013
and
2012
were as follows:
|
|
2014
|
2013
|
2012
|
|||||||||||||||
|
|
Pension
obligation
|
Net periodic
benefit cost
|
Pension
obligation
|
Net periodic
benefit cost
|
Pension
obligation
|
Net periodic
benefit cost
|
||||||||||||
|
Discount rate
|
1.25
|
%
|
2.25
|
%
|
2.25
|
%
|
1.75
|
%
|
1.75
|
%
|
2.50
|
%
|
||||||
|
Expected return on plan assets
|
—
|
|
2.25
|
%
|
—
|
|
1.75
|
%
|
—
|
|
2.50
|
%
|
||||||
|
Rate of compensation increase
|
2.25
|
%
|
2.50
|
%
|
2.50
|
%
|
2.50
|
%
|
2.50
|
%
|
3.50
|
%
|
||||||
At
December 31, 2014
, estimated employer contributions to be paid in
2015
related to the Zurich Plan were
$5.1 million
and future benefit payments were estimated to be paid as follows (in thousands of U.S. dollars):
|
Year
|
Amount
|
|||
|
2015
|
$
|
3,959
|
|
|
|
2016
|
4,461
|
|
||
|
2017
|
4,332
|
|
||
|
2018
|
4,108
|
|
||
|
2019
|
4,086
|
|
||
|
2020 to 2024
|
26,983
|
|
||
The Company does not believe that any of the Zurich Plan’s assets will be returned to the Company during
2015
.
18. Commitments and Contingencies
(a) Concentration of Credit Risk
Fixed maturities
The Company’s investment portfolio is managed following prudent standards of diversification and a prudent investment philosophy. The Company is not exposed to any significant credit concentration risk on its investments, except for debt securities issued by the U.S. government and other highly rated non-U.S. sovereign governments’ securities. At
December 31, 2014
and
2013
, other than the U.S. government, the Company’s fixed maturity investment portfolio did not contain exposure to any non-U.S. sovereign government or any other issuer that accounted for more than 10% of the Company’s shareholders’ equity attributable to PartnerRe. The Company keeps cash and cash equivalents in several banks and ensures that there are no significant concentrations at any point in time, in any one bank.
Derivatives
The Company’s investment strategy allows for the use of derivative instruments, subject to strict limitations. Derivative instruments may be used to replicate investment positions and for the purpose of managing overall currency risk, market exposures and portfolio duration, for hedging certain investments, or for enhancing investment performance that would be allowed under the Company’s investment policy if implemented in other ways. The Company is exposed to credit risk in the event of non-performance by the counterparties to the Company’s derivative contracts. However, the Company diversifies the counterparties to its derivative contracts to reduce credit risk, and because the counterparties to these contracts are high credit quality international banks, the Company does not anticipate non-performance. These contracts are generally of short duration and settle on a net basis. The difference between the contract amounts and the related market value represents the Company’s maximum credit exposure.
Underwriting operations
The Company is also exposed to credit risk in its underwriting operations, most notably in the credit/surety line. Loss experience in these lines of business is cyclical and is affected by the state of the general economic environment. The Company provides its clients in these lines of business with reinsurance protection against credit deterioration, defaults or other types of financial non-performance of or by the underlying credits that are the subject of the reinsurance provided and, accordingly, the Company is exposed to the credit risk of those credits. The Company mitigates the risks associated with these credit-sensitive lines of business through the use of risk management techniques such as risk diversification, careful monitoring of risk aggregations and accumulations and, at times, through the use of retrocessional reinsurance protection and the purchase of credit default, total return and interest rate swaps.
180
The Company has exposure to credit risk as it relates to its business written through brokers, if any of the Company’s brokers is unable to fulfill their contractual obligations with respect to payments to the Company. In addition, in some jurisdictions, if the broker fails to make payments to the insured under the Company’s policy, the Company might remain liable to the insured for the deficiency. The Company’s exposure to such credit risk is somewhat mitigated in certain jurisdictions by contractual terms.
The Company has exposure to credit risk related to reinsurance balances receivable and reinsurance recoverable on paid and unpaid losses. The credit risk exposure related to these balances is mitigated by several factors, including but not limited to, credit checks performed as part of the underwriting process, monitoring of aged receivable balances and the contractual right to offset premiums receivable or funds held balances against unpaid losses and loss expenses. The Company regularly reviews its reinsurance recoverable balances to estimate an allowance for uncollectible amounts based on quantitative and qualitative factors. At
December 31, 2014
and
2013
, the Company recorded a provision for uncollectible premiums receivable of
$8 million
. See also Note 9 for discussion of credit risk related to reinsurance recoverable on paid and unpaid losses.
The Company is also subject to the credit risk of its cedants in the event of insolvency or the cedant’s failure to honor the value of funds held balances for any other reason. The funds held – directly managed account is with one cedant and is supported by an underlying portfolio of investments, which are managed by the Company (see Note 5). However, the Company’s credit risk in some jurisdictions is mitigated by a mandatory right of offset of amounts payable by the Company to a cedant against amounts due to the Company. In certain other jurisdictions the Company is able to mitigate this risk, depending on the nature of the funds held arrangements, to the extent that the Company has the contractual ability to offset any shortfall in the payment of the funds held balances with amounts owed by the Company to cedants for losses payable and other amounts contractually due.
(b) Lease Arrangements
The Company leases office space under operating leases expiring in various years through 2022. The leases are renewable at the option of the lessee under certain circumstances. The following is a schedule of future minimum rental payments, exclusive of escalation clauses, on non-cancelable leases at
December 31, 2014
(in thousands of U.S. dollars):
|
Year
|
Amount
|
||
|
2015
|
$
|
27,393
|
|
|
2016
|
26,092
|
|
|
|
2017
|
25,509
|
|
|
|
2018
|
12,358
|
|
|
|
2019
|
5,068
|
|
|
|
2020 through 2022
|
685
|
|
|
|
Total future minimum rental payments
|
$
|
97,105
|
|
|
Total future sub-lease rental income through 2019
|
$
|
5,253
|
|
Rent expense for the years ended
December 31, 2014
,
2013
and
2012
was
$33.6 million
,
$33.0 million
and
$36.3 million
, respectively, excluding any restructuring charges related to real estate.
(c) Employment Agreements
The Company has entered into employment agreements with its executive officers. These agreements provide for annual compensation in the form of salary, benefits, annual incentive payments, share-based compensation, the reimbursement of certain expenses, retention incentive payments, as well as certain severance and change in control provisions.
(d) Restructuring Charges
In April 2013, the Company announced the restructuring of its business support operations into a single integrated worldwide support platform and changes to the structure of its Global Non-life Operations. The restructuring included involuntary and voluntary employee termination plans in certain jurisdictions (collectively, termination plans) and certain real estate costs. Employees affected by the termination plans had varying leaving dates, with the majority leaving by December 31, 2014.
During the year ended
December 31, 2014
and
2013
, the Company recorded a pre-tax charge of
$11 million
and
$58 million
, respectively, related to the costs of the restructuring, which was primarily related to the termination plans and certain real estate costs, within other expenses. The continuing salary and other employment benefit costs related to the affected employees will be expensed as the employee remains with the Company and provides service.
181
(e) Other Agreements
The Company has entered into service agreements and lease contracts that provide for business and information technology support and computer equipment. Future payments under these contracts amount to
$14 million
through 2019.
The Company has entered into strategic investments with unfunded capital commitments. In the next five years, the Company expects to fund capital commitments totaling
$132 million
with
$49 million
,
$39 million
,
$34 million
,
$7 million
and
$3 million
to be paid during 2015, 2016, 2017, 2018 and 2019, respectively.
The Company has committed to a
10
year structured letter of credit facility issued by a high credit quality international bank, which has a final maturity of
December 29, 2020
. At December 31, 2014 and 2013, the Company's participation in the facility was
$61 million
and
$100 million
, respectively. At
December 31, 2014
, the letter of credit facility has not been drawn down and can only be drawn down in the event of certain specific scenarios, which the Company considers remote. Unless canceled by the bank, the credit facility automatically extends for one year, each year until maturity.
(f) Legal Proceedings
Litigation
The Company’s reinsurance subsidiaries, and the insurance and reinsurance industry in general, are subject to litigation and arbitration in the normal course of their business operations. In addition to claims litigation, the Company and its subsidiaries may be subject to lawsuits and regulatory actions in the normal course of business that do not arise from or directly relate to claims on reinsurance treaties. This category of business litigation typically involves, among other things, allegations of underwriting errors or omissions, employment claims or regulatory activity. While the outcome of business litigation cannot be predicted with certainty, the Company will dispute all allegations against the Company and/or its subsidiaries that Management believes are without merit.
At
December 31, 2014
, the Company was not a party to any litigation or arbitration that it believes could have a material effect on the financial condition, results of operations or liquidity of the Company.
19. Credit Agreements
In the normal course of its operations, the Company enters into agreements with financial institutions to obtain unsecured and secured letter of credit facilities. At
December 31, 2014
, the total amount of such credit facilities available to the Company was approximately
$843 million
, with each of the significant facilities described below. Under the terms of certain reinsurance agreements, irrevocable letters of credit were issued on an unsecured and secured basis in the amount of
$122 million
and
$420 million
, respectively, at
December 31, 2014
, in respect of reported loss and unearned premium reserves.
The Company maintains a
$300 million
combined credit facility, with the first
$100 million
being unsecured and any utilization above the initial $100 million being secured. This credit facility matures on
November 14, 2015
.
In addition, the Company maintains committed secured letter of credit facilities. These facilities are used for the issuance of letters of credit, which must be fully secured with cash and/or government bonds and/or investment grade bonds. The agreements include default covenants, which could require the Company to fully secure the outstanding letters of credit to the extent that the facility is not already fully secured, and disallow the issuance of any new letters of credit. Included in the Company’s secured credit facilities at
December 31, 2014
is a
$300 million
secured credit facility, which matures on
December 31, 2018
, and a
$140 million
secured credit facility, which matures on
December 31, 2017
. At
December 31, 2014
, no conditions of default existed under these facilities.
20. Agreements with Related Parties
The Company was party to agreements with certain entities on an arm’s-length basis as follows.
Agreements with ING Group N.V.
In the normal course of its underwriting activities, the Company and certain subsidiaries entered into reinsurance contracts with ING Group N.V. (a company in which a board member of the Company was a supervisory director until July 2014). The activity included in the Consolidated Statements of Operations related to ING Group N.V. for the years ended
December 31, 2014
,
2013
and
2012
includes net premiums earned of
$1.9 million
,
$2.6 million
and
$3.4 million
, respectively, and losses and loss expenses and life policy benefits of
$0.6 million
,
$1.3 million
and
$0.8 million
, respectively. Included in the Consolidated Balance Sheets at
December 31, 2014
and
2013
were unpaid losses and loss expenses of
$10.0 million
and
$12.9 million
, respectively.
182
Agreements with Atradius N.V.
In the normal course of its underwriting activities, the Company and certain subsidiaries entered into reinsurance contracts with Atradius N.V. (a company in which a board member of the Company was a supervisory director until May 2012). The activity included in the Consolidated Statements of Operations related to Atradius N.V. for the year ended December 31, 2012 includes net premiums written of
$80.3 million
, net premiums earned of
$75.7 million
, losses and loss expenses and life policy benefits of
$35.2 million
and acquisition costs of
$28.5 million
.
Other Agreements
In the normal course of its investment operations, the Company bought or held securities of companies in which board members of the Company are also directors or non-executive directors. All transactions entered into as part of the investment portfolio were completed on market terms.
21. Segment Information
The Company monitors the performance of its operations in three segments, Non-life, Life and Health and Corporate and Other. The Non-life segment is further divided into four sub-segments: North America, Global (Non-U.S.) P&C, Global Specialty and Catastrophe. Effective January 1, 2013, the Life segment is referred to as Life and Health to reflect and include PartnerRe Health’s results following its acquisition on December 31, 2012 and the Global (Non-U.S.) Specialty sub-segment is referred to as Global Specialty. Segments and sub-segments represent markets that are reasonably homogeneous in terms of geography, client types, buying patterns, underlying risk patterns and approach to risk management.
The North America sub-segment includes agriculture, casualty, credit/surety, motor, multiline, property and other risks generally originating in the United States. The Global (Non-U.S.) P&C sub-segment includes casualty, motor and property business generally originating outside of the United States. The Global Specialty sub-segment is comprised of business that is generally considered to be specialized due to the sophisticated technical underwriting required to analyze risks, and is global in nature. This sub-segment consists of several lines of business for which the Company believes it has developed specialized knowledge and underwriting capabilities. These lines of business include agriculture, aviation/space, credit/surety, energy, engineering, marine, specialty casualty, specialty property and other lines. The Catastrophe sub-segment is comprised of the Company’s catastrophe line of business. The Life and Health segment includes mortality, longevity and accident and health lines of business. Corporate and Other is comprised of the capital markets and investment related activities of the Company, including principal finance transactions, insurance-linked securities and strategic investments, and its corporate activities, including other expenses.
Since the Company does not manage its assets by segment, net investment income is not allocated to the Non-life segment. However, because of the interest-sensitive nature of some of the Company’s Life and Health products, net investment income is considered in Management’s assessment of the profitability of the Life and Health segment. The following items are not considered in evaluating the results of the Non-life and Life and Health segments: net realized and unrealized investment gains and losses, interest expense, amortization of intangible assets, net foreign exchange gains and losses, income tax expense or benefit and interest in earnings and losses of equity method investments. Segment results are shown before consideration of intercompany transactions.
Management measures results for the Non-life segment on the basis of the loss ratio, acquisition ratio, technical ratio, other expense ratio and combined ratio (all defined below). Management measures results for the Non-life sub-segments on the basis of the loss ratio, acquisition ratio and technical ratio. Management measures results for the Life and Health segment on the basis of the allocated underwriting result, which includes revenues from net premiums earned, other income or loss and allocated net investment income for Life and Health, and expenses from life policy benefits, acquisition costs and other expenses.
The segment results for the years ended
December 31, 2014
,
2013
and
2012
, were as follows (in millions of U.S. dollars, except ratios):
183
Segment Information
For the year ended
December 31, 2014
|
North
America
|
Global
(Non-U.S.)
P&C
|
Global
Specialty
|
Catastrophe
|
Total
Non-life
segment
|
Life
and Health
segment
|
Corporate
and Other
|
Total
|
||||||||||||||||||||||||
|
Gross premiums written
|
$
|
1,642
|
|
$
|
803
|
|
$
|
1,797
|
|
$
|
425
|
|
$
|
4,667
|
|
$
|
1,265
|
|
$
|
—
|
|
$
|
5,932
|
|
|||||||
|
Net premiums written
|
$
|
1,630
|
|
$
|
794
|
|
$
|
1,696
|
|
$
|
380
|
|
$
|
4,500
|
|
$
|
1,220
|
|
$
|
—
|
|
$
|
5,720
|
|
|||||||
|
(Increase) decrease in unearned premiums
|
(33
|
)
|
(26
|
)
|
(58
|
)
|
4
|
|
(113
|
)
|
2
|
|
—
|
|
(111
|
)
|
|||||||||||||||
|
Net premiums earned
|
$
|
1,597
|
|
$
|
768
|
|
$
|
1,638
|
|
$
|
384
|
|
$
|
4,387
|
|
$
|
1,222
|
|
$
|
—
|
|
$
|
5,609
|
|
|||||||
|
Losses and loss expenses and life policy benefits
|
(1,000
|
)
|
(438
|
)
|
(963
|
)
|
(62
|
)
|
(2,463
|
)
|
(1,000
|
)
|
—
|
|
(3,463
|
)
|
|||||||||||||||
|
Acquisition costs
|
(401
|
)
|
(222
|
)
|
(400
|
)
|
(42
|
)
|
(1,065
|
)
|
(149
|
)
|
—
|
|
(1,214
|
)
|
|||||||||||||||
|
Technical result
|
$
|
196
|
|
$
|
108
|
|
$
|
275
|
|
$
|
280
|
|
$
|
859
|
|
$
|
73
|
|
$
|
—
|
|
$
|
932
|
|
|||||||
|
Other income
|
3
|
|
8
|
|
5
|
|
16
|
|
|||||||||||||||||||||||
|
Other expenses
|
(252
|
)
|
(68
|
)
|
(130
|
)
|
(450
|
)
|
|||||||||||||||||||||||
|
Underwriting result
|
$
|
610
|
|
$
|
13
|
|
n/a
|
|
$
|
498
|
|
||||||||||||||||||||
|
Net investment income
|
60
|
|
420
|
|
480
|
|
|||||||||||||||||||||||||
|
Allocated underwriting result
(1)
|
$
|
73
|
|
n/a
|
|
n/a
|
|
||||||||||||||||||||||||
|
Net realized and unrealized investment gains
|
372
|
|
372
|
|
|||||||||||||||||||||||||||
|
Interest expense
|
(49
|
)
|
(49
|
)
|
|||||||||||||||||||||||||||
|
Amortization of intangible assets
|
(27
|
)
|
(27
|
)
|
|||||||||||||||||||||||||||
|
Net foreign exchange gains
|
18
|
|
18
|
|
|||||||||||||||||||||||||||
|
Income tax expense
|
(239
|
)
|
(239
|
)
|
|||||||||||||||||||||||||||
|
Interest in earnings of equity method investments
|
15
|
|
15
|
|
|||||||||||||||||||||||||||
|
Net income
|
n/a
|
|
$
|
1,068
|
|
||||||||||||||||||||||||||
|
Loss ratio
(2)
|
62.6
|
%
|
57.0
|
%
|
58.8
|
%
|
16.1
|
%
|
56.1
|
%
|
|||||||||||||||||||||
|
Acquisition ratio
(3)
|
25.1
|
|
28.9
|
|
24.4
|
|
11.0
|
|
24.3
|
|
|||||||||||||||||||||
|
Technical ratio
(4)
|
87.7
|
%
|
85.9
|
%
|
83.2
|
%
|
27.1
|
%
|
80.4
|
%
|
|||||||||||||||||||||
|
Other expense ratio
(5)
|
5.8
|
|
|||||||||||||||||||||||||||||
|
Combined ratio
(6)
|
86.2
|
%
|
|||||||||||||||||||||||||||||
|
(1)
|
Allocated underwriting result is defined as net premiums earned, other income or loss and allocated net investment income less life policy benefits, acquisition costs and other expenses.
|
|
(2)
|
Loss ratio is obtained by dividing losses and loss expenses by net premiums earned.
|
|
(3)
|
Acquisition ratio is obtained by dividing acquisition costs by net premiums earned.
|
|
(4)
|
Technical ratio is defined as the sum of the loss ratio and the acquisition ratio.
|
|
(5)
|
Other expense ratio is obtained by dividing other expenses by net premiums earned.
|
|
(6)
|
Combined ratio is defined as the sum of the technical ratio and the other expense ratio.
|
n/a: Not applicable
184
Segment Information
For the year ended
December 31, 2013
|
North
America
|
Global
(Non-U.S.)
P&C
|
Global
Specialty
|
Catastrophe
|
Total
Non-life
segment
|
Life
and Health
segment
|
Corporate
and Other
|
Total
|
||||||||||||||||||||||||
|
Gross premiums written
|
$
|
1,601
|
|
$
|
818
|
|
$
|
1,676
|
|
$
|
495
|
|
$
|
4,590
|
|
$
|
972
|
|
$
|
8
|
|
$
|
5,570
|
|
|||||||
|
Net premiums written
|
$
|
1,587
|
|
$
|
811
|
|
$
|
1,579
|
|
$
|
450
|
|
$
|
4,427
|
|
$
|
964
|
|
$
|
6
|
|
$
|
5,397
|
|
|||||||
|
(Increase) decrease in unearned premiums
|
(54
|
)
|
(68
|
)
|
(73
|
)
|
3
|
|
(192
|
)
|
(7
|
)
|
—
|
|
(199
|
)
|
|||||||||||||||
|
Net premiums earned
|
$
|
1,533
|
|
$
|
743
|
|
$
|
1,506
|
|
$
|
453
|
|
$
|
4,235
|
|
$
|
957
|
|
$
|
6
|
|
$
|
5,198
|
|
|||||||
|
Losses and loss expenses and life policy benefits
|
(975
|
)
|
(373
|
)
|
(920
|
)
|
(132
|
)
|
(2,400
|
)
|
(760
|
)
|
2
|
|
(3,158
|
)
|
|||||||||||||||
|
Acquisition costs
|
(351
|
)
|
(196
|
)
|
(362
|
)
|
(44
|
)
|
(953
|
)
|
(125
|
)
|
—
|
|
(1,078
|
)
|
|||||||||||||||
|
Technical result
|
$
|
207
|
|
$
|
174
|
|
$
|
224
|
|
$
|
277
|
|
$
|
882
|
|
$
|
72
|
|
$
|
8
|
|
$
|
962
|
|
|||||||
|
Other income
|
3
|
|
11
|
|
3
|
|
17
|
|
|||||||||||||||||||||||
|
Other expenses
|
(259
|
)
|
(71
|
)
|
(170
|
)
|
(500
|
)
|
|||||||||||||||||||||||
|
Underwriting result
|
$
|
626
|
|
$
|
12
|
|
n/a
|
|
$
|
479
|
|
||||||||||||||||||||
|
Net investment income
|
61
|
|
423
|
|
484
|
|
|||||||||||||||||||||||||
|
Allocated underwriting result
|
$
|
73
|
|
n/a
|
|
n/a
|
|
||||||||||||||||||||||||
|
Net realized and unrealized investment losses
|
(161
|
)
|
(161
|
)
|
|||||||||||||||||||||||||||
|
Interest expense
|
(49
|
)
|
(49
|
)
|
|||||||||||||||||||||||||||
|
Amortization of intangible assets
|
(27
|
)
|
(27
|
)
|
|||||||||||||||||||||||||||
|
Net foreign exchange losses
|
(18
|
)
|
(18
|
)
|
|||||||||||||||||||||||||||
|
Income tax expense
|
(49
|
)
|
(49
|
)
|
|||||||||||||||||||||||||||
|
Interest in earnings of equity method investments
|
14
|
|
14
|
|
|||||||||||||||||||||||||||
|
Net income
|
n/a
|
|
$
|
673
|
|
||||||||||||||||||||||||||
|
Loss ratio
|
63.6
|
%
|
50.2
|
%
|
61.1
|
%
|
29.0
|
%
|
56.7
|
%
|
|||||||||||||||||||||
|
Acquisition ratio
|
22.9
|
|
26.4
|
|
24.0
|
|
9.7
|
|
22.5
|
|
|||||||||||||||||||||
|
Technical ratio
|
86.5
|
%
|
76.6
|
%
|
85.1
|
%
|
38.7
|
%
|
79.2
|
%
|
|||||||||||||||||||||
|
Other expense ratio
|
6.1
|
|
|||||||||||||||||||||||||||||
|
Combined ratio
|
85.3
|
%
|
|||||||||||||||||||||||||||||
185
Segment Information
For the year ended
December 31, 2012
|
North
America |
Global
(Non-U.S.) P&C |
Global
Specialty |
Catastrophe
|
Total
Non-life segment |
Life
and Health segment |
Corporate
and Other |
Total
|
||||||||||||||||||||||||
|
Gross premiums written
|
$
|
1,221
|
|
$
|
684
|
|
$
|
1,505
|
|
$
|
500
|
|
$
|
3,910
|
|
$
|
802
|
|
$
|
6
|
|
$
|
4,718
|
|
|||||||
|
Net premiums written
|
$
|
1,219
|
|
$
|
681
|
|
$
|
1,415
|
|
$
|
453
|
|
$
|
3,768
|
|
$
|
799
|
|
$
|
6
|
|
$
|
4,573
|
|
|||||||
|
(Increase) decrease in unearned premiums
|
(43
|
)
|
(3
|
)
|
(42
|
)
|
4
|
|
(84
|
)
|
(4
|
)
|
1
|
|
(87
|
)
|
|||||||||||||||
|
Net premiums earned
|
$
|
1,176
|
|
$
|
678
|
|
$
|
1,373
|
|
$
|
457
|
|
$
|
3,684
|
|
$
|
795
|
|
$
|
7
|
|
$
|
4,486
|
|
|||||||
|
Losses and loss expenses and life policy benefits
|
(816
|
)
|
(415
|
)
|
(821
|
)
|
(103
|
)
|
(2,155
|
)
|
(647
|
)
|
(3
|
)
|
(2,805
|
)
|
|||||||||||||||
|
Acquisition costs
|
(291
|
)
|
(167
|
)
|
(321
|
)
|
(42
|
)
|
(821
|
)
|
(116
|
)
|
—
|
|
(937
|
)
|
|||||||||||||||
|
Technical result
|
$
|
69
|
|
$
|
96
|
|
$
|
231
|
|
$
|
312
|
|
$
|
708
|
|
$
|
32
|
|
$
|
4
|
|
$
|
744
|
|
|||||||
|
Other income
|
5
|
|
4
|
|
3
|
|
12
|
|
|||||||||||||||||||||||
|
Other expenses
|
(257
|
)
|
(52
|
)
|
(102
|
)
|
(411
|
)
|
|||||||||||||||||||||||
|
Underwriting result
|
$
|
456
|
|
$
|
(16
|
)
|
n/a
|
|
$
|
345
|
|
||||||||||||||||||||
|
Net investment income
|
64
|
|
507
|
|
571
|
|
|||||||||||||||||||||||||
|
Allocated underwriting result
|
$
|
48
|
|
n/a
|
|
n/a
|
|
||||||||||||||||||||||||
|
Net realized and unrealized investment gains
|
494
|
|
494
|
|
|||||||||||||||||||||||||||
|
Interest expense
|
(49
|
)
|
(49
|
)
|
|||||||||||||||||||||||||||
|
Amortization of intangible assets
|
(32
|
)
|
(32
|
)
|
|||||||||||||||||||||||||||
|
Net foreign exchange losses
|
—
|
|
—
|
|
|||||||||||||||||||||||||||
|
Income tax expense
|
(204
|
)
|
(204
|
)
|
|||||||||||||||||||||||||||
|
Interest in earnings of equity method investments
|
10
|
|
10
|
|
|||||||||||||||||||||||||||
|
Net income
|
n/a
|
|
$
|
1,135
|
|
||||||||||||||||||||||||||
|
Loss ratio
|
69.4
|
%
|
61.3
|
%
|
59.8
|
%
|
22.4
|
%
|
58.5
|
%
|
|||||||||||||||||||||
|
Acquisition ratio
|
24.7
|
|
24.6
|
|
23.4
|
|
93.0
|
|
22.3
|
|
|||||||||||||||||||||
|
Technical ratio
|
94.1
|
%
|
85.9
|
%
|
83.2
|
%
|
115.4
|
%
|
80.8
|
%
|
|||||||||||||||||||||
|
Other expense ratio
|
7.0
|
|
|||||||||||||||||||||||||||||
|
Combined ratio
|
87.8
|
%
|
|||||||||||||||||||||||||||||
186
The following table provides the distribution of net premiums written by line of business for the years ended
December 31, 2014
,
2013
and
2012
:
|
2014
|
2013
|
2012
|
|||||||
|
Non-life
|
|||||||||
|
Property and casualty
|
|||||||||
|
Casualty
|
12
|
%
|
12
|
%
|
13
|
%
|
|||
|
Motor
|
7
|
|
7
|
|
5
|
|
|||
|
Multiline and other
|
5
|
|
4
|
|
3
|
|
|||
|
Property
|
11
|
|
12
|
|
14
|
|
|||
|
Specialty
|
|||||||||
|
Agriculture
|
12
|
|
11
|
|
7
|
|
|||
|
Aviation/Space
|
4
|
|
4
|
|
5
|
|
|||
|
Catastrophe
|
6
|
|
8
|
|
10
|
|
|||
|
Credit/Surety
|
7
|
|
6
|
|
7
|
|
|||
|
Energy
|
1
|
|
2
|
|
2
|
|
|||
|
Engineering
|
3
|
|
4
|
|
4
|
|
|||
|
Marine
|
5
|
|
6
|
|
7
|
|
|||
|
Specialty casualty
|
3
|
|
3
|
|
2
|
|
|||
|
Specialty property
|
3
|
|
3
|
|
4
|
|
|||
|
Life and Health
|
21
|
|
18
|
|
17
|
|
|||
|
Total
|
100
|
%
|
100
|
%
|
100
|
%
|
|||
The following table provides the geographic distribution of gross premiums written based on the location of the underlying risk for the years ended
December 31, 2014
,
2013
and
2012
:
|
2014
|
2013
|
2012
|
|||||||
|
Asia, Australia and New Zealand
|
11
|
%
|
11
|
%
|
11
|
%
|
|||
|
Europe
|
40
|
|
40
|
|
41
|
|
|||
|
Latin America, Caribbean and Africa
|
10
|
|
10
|
|
11
|
|
|||
|
North America
|
39
|
|
39
|
|
37
|
|
|||
|
Total
|
100
|
%
|
100
|
%
|
100
|
%
|
|||
The Company produces its business both through brokers and through direct relationships with insurance company clients. None of the Company’s cedants accounted for more than
4%
,
4%
and
5%
of total gross premiums written during the years ended
December 31, 2014
,
2013
and
2012
, respectively.
The Company had two brokers that individually accounted for 10% or more of its gross premiums written during the years ended
December 31, 2014
,
2013
and
2012
. The brokers accounted for
20%
,
22%
, and
24%
and
20%
,
21%
, and
22%
of gross premiums written for the years ended
December 31, 2014
,
2013
and
2012
, respectively.
The following table summarizes the percentage of gross premiums written through these two brokers by segment and sub-segment for the years ended
December 31, 2014
,
2013
and
2012
:
|
2014
|
2013
|
2012
|
|||||||
|
Non-life
|
|||||||||
|
North America
|
59
|
%
|
60
|
%
|
70
|
%
|
|||
|
Global (Non-U.S.) P&C
|
31
|
|
29
|
|
28
|
|
|||
|
Global Specialty
|
38
|
|
41
|
|
42
|
|
|||
|
Catastrophe
|
70
|
|
74
|
|
74
|
|
|||
|
Life and Health
|
12
|
|
12
|
|
13
|
|
|||
187
22. Unaudited Quarterly Financial Information
|
|
2014
|
2013
|
||||||||||||||||||||||||||||||
|
(in millions of U.S. dollars, except per
share amounts)
|
Fourth
Quarter
|
Third
Quarter
|
Second
Quarter
|
First
Quarter
|
Fourth
Quarter
|
Third
Quarter
|
Second
Quarter
|
First
Quarter
|
||||||||||||||||||||||||
|
Net premiums written
|
$
|
1,220
|
|
$
|
1,343
|
|
$
|
1,419
|
|
$
|
1,738
|
|
$
|
1,186
|
|
$
|
1,265
|
|
$
|
1,309
|
|
$
|
1,636
|
|
||||||||
|
Net premiums earned
|
1,446
|
|
1,557
|
|
1,353
|
|
1,254
|
|
1,421
|
|
1,421
|
|
1,209
|
|
1,147
|
|
||||||||||||||||
|
Net investment income
|
115
|
|
118
|
|
130
|
|
117
|
|
114
|
|
122
|
|
125
|
|
124
|
|
||||||||||||||||
|
Net realized and unrealized investment gains (losses)
|
98
|
|
(34
|
)
|
166
|
|
142
|
|
99
|
|
16
|
|
(299
|
)
|
23
|
|
||||||||||||||||
|
Other income
|
4
|
|
2
|
|
9
|
|
—
|
|
3
|
|
5
|
|
4
|
|
4
|
|
||||||||||||||||
|
Total revenues
|
1,663
|
|
1,643
|
|
1,658
|
|
1,513
|
|
1,637
|
|
1,564
|
|
1,039
|
|
1,298
|
|
||||||||||||||||
|
Losses and loss expenses and life policy benefits
|
870
|
|
960
|
|
884
|
|
749
|
|
879
|
|
751
|
|
867
|
|
661
|
|
||||||||||||||||
|
Acquisition costs
|
325
|
|
322
|
|
303
|
|
265
|
|
318
|
|
283
|
|
242
|
|
235
|
|
||||||||||||||||
|
Other expenses
|
123
|
|
108
|
|
107
|
|
111
|
|
131
|
|
108
|
|
145
|
|
116
|
|
||||||||||||||||
|
Interest expense
|
12
|
|
12
|
|
12
|
|
12
|
|
12
|
|
12
|
|
12
|
|
12
|
|
||||||||||||||||
|
Amortization of intangible assets
|
6
|
|
7
|
|
7
|
|
7
|
|
6
|
|
7
|
|
7
|
|
7
|
|
||||||||||||||||
|
Net foreign exchange (gains) losses
|
(7
|
)
|
(8
|
)
|
(2
|
)
|
—
|
|
8
|
|
1
|
|
11
|
|
(2
|
)
|
||||||||||||||||
|
Total expenses
|
1,329
|
|
1,401
|
|
1,311
|
|
1,144
|
|
1,354
|
|
1,162
|
|
1,284
|
|
1,029
|
|
||||||||||||||||
|
Income (loss) before taxes and interest in (losses) earnings of equity method investments
|
334
|
|
242
|
|
347
|
|
369
|
|
283
|
|
402
|
|
(245
|
)
|
269
|
|
||||||||||||||||
|
Income tax expense (benefit)
|
53
|
|
46
|
|
78
|
|
62
|
|
11
|
|
70
|
|
(75
|
)
|
42
|
|
||||||||||||||||
|
Interest in (losses) earnings of equity method investments
|
(1
|
)
|
5
|
|
5
|
|
6
|
|
4
|
|
6
|
|
(4
|
)
|
7
|
|
||||||||||||||||
|
Net income (loss)
|
280
|
|
201
|
|
274
|
|
313
|
|
276
|
|
338
|
|
(174
|
)
|
234
|
|
||||||||||||||||
|
Net income attributable to noncontrolling interests
|
(3
|
)
|
(5
|
)
|
(2
|
)
|
(3
|
)
|
(4
|
)
|
(4
|
)
|
(1
|
)
|
—
|
|
||||||||||||||||
|
Net income (loss) attributable to PartnerRe Ltd.
|
277
|
|
196
|
|
272
|
|
310
|
|
272
|
|
334
|
|
(175
|
)
|
234
|
|
||||||||||||||||
|
Preferred dividends
|
14
|
|
14
|
|
14
|
|
14
|
|
14
|
|
14
|
|
15
|
|
15
|
|
||||||||||||||||
|
Loss on redemption of preferred shares
|
—
|
|
—
|
|
—
|
|
—
|
|
—
|
|
—
|
|
—
|
|
9
|
|
||||||||||||||||
|
Net income (loss) attributable to PartnerRe Ltd. common shareholders
|
$
|
263
|
|
$
|
182
|
|
$
|
258
|
|
$
|
296
|
|
$
|
258
|
|
$
|
320
|
|
$
|
(190
|
)
|
$
|
210
|
|
||||||||
|
Basic net income (loss) per common share
|
$
|
5.39
|
|
$
|
3.68
|
|
$
|
5.13
|
|
$
|
5.72
|
|
$
|
4.86
|
|
$
|
5.95
|
|
$
|
(3.37
|
)
|
$
|
3.60
|
|
||||||||
|
Diluted net income (loss) per common share
|
$
|
5.26
|
|
$
|
3.60
|
|
$
|
5.02
|
|
$
|
5.61
|
|
$
|
4.76
|
|
$
|
5.84
|
|
$
|
(3.37
|
)
|
$
|
3.53
|
|
||||||||
|
Dividends declared per common share
|
$
|
0.67
|
|
$
|
0.67
|
|
$
|
0.67
|
|
$
|
0.67
|
|
$
|
0.64
|
|
$
|
0.64
|
|
$
|
0.64
|
|
$
|
0.64
|
|
||||||||
23. Subsequent Events
On
January 25, 2015
, the Company entered into the Amalgamation Agreement with AXIS, pursuant to which the Company will amalgamate with AXIS and the two companies will continue as a single Bermuda exempted company (Amalgamated Company). The transaction, which is structured as a merger of equals, has been unanimously approved by the Boards of Directors of both companies. Under the terms of the Amalgamation Agreement, the Company’s shareholders will receive
2.18
shares of the Amalgamated Company’s common shares for each share of the Company’s common shares they own and AXIS’ shareholders will receive
one
share of the Amalgamated Company’s common shares for each share of AXIS’ common shares they own. Upon completion of the transaction, shareholders of the Company and shareholders of AXIS will own approximately
51.6
percent and
48.4
percent of the Amalgamated Company, respectively. The Amalgamated Company's headquarters will be located in Bermuda. The transaction is expected to close in the second half of 2015, subject to approval by the shareholders of both companies, regulatory clearance and customary closing conditions. Both companies will continue to operate as two independent entities until all such approvals are obtained.
In connection with the Amalgamation, Costas Miranthis stepped down as the Chief Executive Officer (CEO) of the Company and as a member of the Company's Board effective January 25, 2015. At that time, David Zwiener, a member of the Company's Board, assumed the position of interim CEO of the Company until completion of the Amalgamation. As a result of the CEO
188
stepping down, the Company expects to recognize an additional pre-tax charge of approximately
$22 million
during the three months ending March 31, 2015.
Under the terms of the Amalgamation Agreement, the Company suspended its share repurchase program until completion of the Amalgamation.
Following the announcement of the Amalgamation, Moody's affirmed the Company's rating with a stable outlook. Standard & Poor's (S&P), A.M. Best and Fitch placed the Company’s rating on credit watch negative, under review with negative implications and ratings watch negative, respectively. All three agencies cited concerns over the transaction, including the risks associated with the execution and integration, along with management retention risk in light of the complexity and scale of the Amalgamation. The Company is in dialogue with each rating agency to address their rating concerns. The status of any further changes to ratings or outlooks will depend on various factors, including the timing of the closing, if and when it occurs, and success of the integration.
189
REPORT OF INDEPENDENT REGISTERED PUBLIC ACCOUNTING FIRM
To the Board of Directors and Shareholders of PartnerRe Ltd.
We have audited the accompanying consolidated balance sheets of PartnerRe Ltd. and subsidiaries (the Company) as of
December 31, 2014
and
2013
, and the related consolidated statements of operations and comprehensive income, shareholders’ equity, and cash flows for each of the three years in the period ended
December 31, 2014
. These financial statements are the responsibility of the Company’s management. Our responsibility is to express an opinion on these financial statements based on our audits.
We conducted our audits in accordance with the standards of the Public Company Accounting Oversight Board (United States). Those standards require that we plan and perform the audit to obtain reasonable assurance about whether the financial statements are free of material misstatement. An audit includes examining, on a test basis, evidence supporting the amounts and disclosures in the financial statements. An audit also includes assessing the accounting principles used and significant estimates made by management, as well as evaluating the overall financial statement presentation. We believe that our audits provide a reasonable basis for our opinion.
In our opinion, such consolidated financial statements present fairly, in all material respects, the financial position of PartnerRe Ltd. and subsidiaries as of
December 31, 2014
and
2013
, and the results of their operations and their cash flows for each of the three years in the period ended
December 31, 2014
, in conformity with accounting principles generally accepted in the United States of America.
We have also audited, in accordance with the standards of the Public Company Accounting Oversight Board (United States), the Company’s internal control over financial reporting as of
December 31, 2014
, based on the criteria established in Internal Control—Integrated Framework (2013) issued by the Committee of Sponsoring Organizations of the Treadway Commission and our report dated
February 26, 2015
expressed an unqualified opinion on the Company’s internal control over financial reporting.
|
/
S
/ D
ELOITTE
L
TD
.
|
|
Deloitte Ltd.
|
Hamilton, Bermuda
February 26, 2015
190
|
ITEM 9.
|
CHANGES IN AND DISAGREEMENTS WITH ACCOUNTANTS ON ACCOUNTING AND FINANCIAL DISCLOSURE
|
None.
|
ITEM 9A.
|
CONTROLS AND PROCEDURES
|
Disclosure Controls and Procedures
The Company carried out an evaluation, under the supervision and with the participation of Management, including the Chief Executive Officer and Chief Financial Officer, as of
December 31, 2014
, of the effectiveness of the design and operation of its disclosure controls and procedures, as defined in Rules 13a-15(e) and 15d-15(e) under the Securities Exchange Act of 1934, as amended. Based upon that evaluation, the Chief Executive Officer and Chief Financial Officer concluded that, as of
December 31, 2014
, the disclosure controls and procedures are effective such that information required to be disclosed by the Company in reports that it files or submits pursuant to the Securities Exchange Act is recorded, processed, summarized and reported within the time periods specified in the rules and forms of the Securities and Exchange Commission and is accumulated and communicated to Management, including its principal executive and principal financial officers, as appropriate, to allow timely decisions regarding required disclosures.
Management’s Report on Internal Control over Financial Reporting
Management is responsible for establishing and maintaining adequate internal control over financial reporting as defined in Rules 13a-15(f) and 15d-15(f) under the Securities Exchange Act of 1934, as amended. Internal control over financial reporting is designed to provide reasonable assurance regarding the reliability of financial reporting and the preparation of financial statements for external purposes in accordance with generally accepted accounting principles. Internal control over financial reporting includes those policies and procedures that:
|
(i)
|
pertain to the maintenance of records that, in reasonable detail, accurately and fairly reflect the transactions and dispositions of the assets of the Company;
|
|
(ii)
|
provide reasonable assurance that transactions are recorded as necessary to permit preparation of financial statements in accordance with generally accepted accounting principles, and that receipts and expenditures are being made only in accordance with authorizations of Management and directors; and
|
|
(iii)
|
provide reasonable assurance regarding prevention or timely detection of unauthorized acquisition, use, or disposition of assets that could have a material effect on the financial statements.
|
Because of its inherent limitations, internal control over financial reporting may not prevent or detect material misstatements. Also, projections of any evaluation of effectiveness to future periods are subject to the risk that the controls may become inadequate because of changes in conditions, or that the degree of compliance with the policies or procedures may deteriorate.
Management has assessed the effectiveness of internal control over financial reporting as of
December 31, 2014
. In making this assessment, Management used the criteria set forth by the Committee of Sponsoring Organizations of the Treadway Commission in Internal Control-Integrated Framework (2013).
Based on our assessment and those criteria Management believes that the Company maintained effective internal control over financial reporting as of
December 31, 2014
.
Deloitte Ltd., the Company’s independent registered public accounting firm, has issued a report on the effectiveness of the Company’s internal control over financial reporting, and its report appears below.
Internal Control Over Financial Reporting
There have been no changes in the Company’s internal control over financial reporting identified in connection with such evaluation that occurred during the three months ended
December 31, 2014
that have materially affected, or are reasonably likely to materially affect, the Company’s internal controls over financial reporting.
191
REPORT OF INDEPENDENT REGISTERED PUBLIC ACCOUNTING FIRM
To the Board of Directors and Shareholders of PartnerRe Ltd.
We have audited the internal control over financial reporting of PartnerRe Ltd. and subsidiaries (the Company) as of
December 31, 2014
, based on criteria established in Internal Control—Integrated Framework (2013) issued by the Committee of Sponsoring Organizations of the Treadway Commission. The Company’s management is responsible for maintaining effective internal control over financial reporting and for its assessment of the effectiveness of internal control over financial reporting, included in the accompanying Management’s Report on Internal Control over Financial Reporting. Our responsibility is to express an opinion on the Company’s internal control over financial reporting based on our audit.
We conducted our audit in accordance with the standards of the Public Company Accounting Oversight Board (United States). Those standards require that we plan and perform the audit to obtain reasonable assurance about whether effective internal control over financial reporting was maintained in all material respects. Our audit included obtaining an understanding of internal control over financial reporting, assessing the risk that a material weakness exists, testing and evaluating the design and operating effectiveness of internal control based on the assessed risk, and performing such other procedures as we considered necessary in the circumstances. We believe that our audit provides a reasonable basis for our opinion.
A company’s internal control over financial reporting is a process designed by, or under the supervision of, the company’s principal executive and principal financial officers, or persons performing similar functions, and effected by the company’s board of directors, management, and other personnel to provide reasonable assurance regarding the reliability of financial reporting and the preparation of financial statements for external purposes in accordance with generally accepted accounting principles. A company’s internal control over financial reporting includes those policies and procedures that (1) pertain to the maintenance of records that, in reasonable detail, accurately and fairly reflect the transactions and dispositions of the assets of the company; (2) provide reasonable assurance that transactions are recorded as necessary to permit preparation of financial statements in accordance with generally accepted accounting principles, and that receipts and expenditures of the company are being made only in accordance with authorizations of management and directors of the company; and (3) provide reasonable assurance regarding prevention or timely detection of unauthorized acquisition, use, or disposition of the company’s assets that could have a material effect on the financial statements.
Because of the inherent limitations of internal control over financial reporting, including the possibility of collusion or improper management override of controls, material misstatements due to error or fraud may not be prevented or detected on a timely basis. Also, projections of any evaluation of the effectiveness of the internal control over financial reporting to future periods are subject to the risk that the controls may become inadequate because of changes in conditions, or that the degree of compliance with the policies or procedures may deteriorate.
In our opinion, the Company maintained, in all material respects, effective internal control over financial reporting as of
December 31, 2014
, based on the criteria established in Internal Control—Integrated Framework (2013) issued by the Committee of Sponsoring Organizations of the Treadway Commission.
We have also audited, in accordance with the standards of the Public Company Accounting Oversight Board (United States), the consolidated financial statements as of and for the year ended
December 31, 2014
of the Company and our report dated
February 26, 2015
expressed an unqualified opinion on those financial statements.
|
/
S
/ D
ELOITTE
L
TD
.
|
|
Deloitte Ltd.
|
|
Hamilton, Bermuda
|
|
February 26, 2015
|
192
|
ITEM 9B.
|
OTHER INFORMATION
|
None.
|
ITEM 10.
|
DIRECTORS, EXECUTIVE OFFICERS AND CORPORATE GOVERNANCE
|
The information set forth below details the name, age, nationality, qualifications and committee memberships of our directors and our executive officers as of February 17, 2015.
OUR DIRECTORS
Jean-Paul L. Montupet, Chairman of the Board

|
Current Directorships
Lexmark International, Inc.
Wabco Holdings, Inc.
Assurant, Inc.
IHS
Committees
Compensation & Management Development-Chairman
Risk & Finance
|
Former Directorships (previous 5 years)
Leroy Somer (2012)
|
|
Age:
67
Nationality:
American
Director Since:
February 2002
|
Mr. Montupet retired as Executive Vice President of Emerson Electric Co. in July 2012 a position he had held since 1990. He also retired as President of Emerson Europe in December 2012 and as an advisory director of Emerson Electric Co. in February 2013. Mr. Montupet was a director of National Electrical Manufacturers Association from 1993 to 2008.
Mr. Montupet’s qualifications to sit on our Board include his years of experience in international business including his previous experience as an executive for a major public company.
|
|
Judith Hanratty, CVO, OBE

|
Current Directorships
England Golf Union Limited
Committees
Audit
Nominating & Governance
|
Former Directorships (previous 5 years)
Charles Taylor Consulting plc (2012)
Gas & Electricity Markets Authority (2010)
|
|
Age:
71
Nationality:
British/New Zealander
Director Since:
January 2005
|
Ms. Hanratty is Chairman of the Commonwealth Education Trust and a director of the English Golf Union. Ms. Hanratty practiced law from 1967 to 2004 and for 28 years was an Executive of the British Petroleum plc until her retirement in 2004. She was a director of Partnerships UK plc until 2005 and British Standards Group until 2006 and was also a member of the Council of Lloyds of London until 2007. In the United Kingdom she has been a member of the Competition Commission, the Takeover Panel, the Gas and Electricity Marketing Authority and the Listing Advisory Committee of the London Stock Exchange. Ms. Hanratty is a Commander of the Royal Victorian Order and is an Officer of the Order of the British Empire.
Ms. Hanratty’s qualifications to sit on our Board include her years of experience in international finance and the (re)insurance industries including her previous experience as an executive of a major multi-national public company, her experience in central government regulation and prudential supervision and her legal and governance background.
|
|
193
Jan H. Holsboer

|
Current Directorships
TD Bank N.V. - Chairman
YAFA S.p.A
Yam Invest N.V.
Stichting Imtech - Chairman
NN Group N.V. (Nationale- Nederlandend) - Chairman
Committees
Nominating & Governance - Chairman
Audit
|
Former Directorships (previous 5 years)
ING Group N.V. (2014)
Atradius N.V/Atradius Credit Insurance N.V. (2012)
Stichting Vie d’Or (2012)
Stichting Corporate Express (2012)
Delta Lloyd Group N.V. (2011)
|
|
Age:
68
Nationality:
Dutch
Director Since:
May 2000
|
Mr. Holsboer was the Chief Executive Officer of Netherlands Reinsurance Group N.V. until 1989 and was an Executive Director with ING N.V. until 1999 and with Univar N.V. until 2007. He also served as President of the Geneva Association from 1993 to 1999 of which he is still an honorary member/President. Mr. Holsboer retired as Chairman of Vereniging Pro Senectute (elderly care) in 2012 and Panorama Mesdag (museum) in 2013.
Mr. Holsboer’s qualifications to sit on our Board include his years of experience in the international financial and (re)insurance industries.
|
|
Roberto Mendoza

|
Current Directorships
Western Union, Inc.
ManpowerGroup Inc.
Atlas Advisors LLC
Rocco Forte & Family Limited
Quinpario Acquisition Corp 2
Committees
Compensation & Management
Development
Risk & Finance
|
Former Directorships (previous 5 years)
None
|
|
Age:
69
Nationality:
American
Director Since:
October 2009
|
Mr. Mendoza is a Senior Managing Director of Atlas Advisors LLC. Mr. Mendoza was Vice Chairman of the Board of J.P. Morgan & Co from 1990 to 2000 and Managing Director of Goldman Sachs Services Ltd. from 2000 to 2001. Mr. Mendoza was Chairman of XL Capital Ltd. until 1993 and a Non-Executive Director of ACE Ltd. from 1999 to 2002. He was also Chairman and a Non-Executive Director of Egg plc until 2006, Non-Executive Director of Prudential plc and Chairman of Integrated Finance Ltd. until 2007. Mr. Mendoza was Co-Chairman of Trinsum Group Inc
1
from 2007 to 2008 and was a Non-Executive Director of PARIS RE Holdings Ltd from 2007-2009. Mr. Mendoza was also a partner in Deming Mendoza & Co. from 2009 to 2010.
Mr. Mendoza’s qualifications to sit on our Board include his years of experience in the international financial and (re)insurance industries as well as his previous experience as a director on the boards of U.S. listed companies including (re)insurance companies.
1
Trinsum Group Inc had an involuntary petition for liquidation under Chapter 7 of the U.S. Bankruptcy Code filed against it in July 2008; subsequently it filed a voluntary petition for reorganization under Chapter 11 of the U.S. Bankruptcy Code in January 2009.
|
|
194
Debra Perry

|
Current Directorships
Korn/Ferry International
Committees
Compensation & Management Development
Audit - Chairman
|
Former Directorships (previous 5 years)
CNO Financial Group, Inc. (2011)
|
|
Age:
63
Nationality:
American
Director Since:
June 2013
|
Ms. Perry currently serves on the board of Korn/Ferry International where she chairs the audit committee. She also serves as a trustee of the Bank of America Funds Series Trust, where she chaired the governance committee from 2011 through 2014, and is a trustee of the Sanford C. Bernstein Fund Inc. where she chairs the governance committee. Ms. Perry is now a trustee and was a member of the Executive Committee of the Committee for Economic Development in Washington D.C. from 2012 through 2014. Ms. Perry was a director of MBIA Inc.
1
from 2004 to 2008 and she was a director of CNO Financial Group Inc. from 2004 to 2011. She also occupied various positions at Moody’s Investors Service Inc., a subsidiary of Moody’s Corporation, between 1992 and 2004. Ms. Perry was an advisory director on the Wisconsin School of Business board from 2009 to 2013.
Ms. Perry’s qualifications to sit on our Board include her years of experience in the financial services industry specifically following the insurance industry, and her extensive governance experience; having served on the boards of public and private companies. Ms. Perry's experience qualifies her as an "audit committee financial expert".
1
In 2007 MBIA Inc. concluded civil settlements with the SEC, New York State Attorney General’s Office and the New York State Insurance Department with respect to financial reinsurance transactions that MBIA Inc. had entered into in 1998.
|
|
Rémy Sautter

|
Current Directorships
Métropole Télévision (M6) SA
Solocal Groupe (fka Pages Jaunes SA)
RTL Radio France
Committees
Compensation & Management Development
Risk & Finance
|
Former Directorships (previous 5 years)
Channel 5, UK (2010)
Technicolor Multimedia PLC (2014)
|
|
Age:
69
Nationality:
French
Director Since:
November 2001
|
Mr. Sautter is Chairman of the supervisory board of RTL Radio France. Mr. Sautter was Chief Executive Officer of CLT-UFA (today RTL Group) from 1996 to 2000 and a director of Taylor Nelson Sofres plc from 2002 to 2008 and operating partner of Duke Street Capital from 2001 to 2013. He was a director of Technicolor Multimedia PLC from 2006 to 2014 and was their non-executive chairman from 2012 to 2014.
Mr. Sautter’s qualifications to sit on our Board include his years of experience as an executive and board member in major European companies.
|
|
195
Greg Seow

|
Current Directorships
Wheelock Properties (Singapore) Limited
AIA Singapore Private Limited
Singapore Government Council for Estate Agencies
Committees
Nominating & Governance
Risk & Finance
|
Former Directorships (previous 5 years)
Singapore Land Transport Authority (2014)
AMP Capital Investors (Singapore) Pte. Ltd. (2012)
|
|
Age:
61
Nationality:
Singaporean
Director Since:
June 2013
|
Mr. Seow currently serves on the board of AIA Singapore Private Limited, and as President of the Singapore’s Government Council for Estate Agencies. In 2008 Mr. Seow joined the board of Wheelock Properties (Singapore) Limited. In 1999 Mr. Seow joined DBS Bank, and was responsible for its regional fund management business until March 2006. Mr. Seow served with the Government of Singapore Investment Corporation from 1986 to 1995 overseeing its global fixed income and real estate portfolios and with the Monetary Authority of Singapore from 1982 to 1986 managing its U.S. fixed income portfolio from New York. From 2007 to 2012 he was non-executive Chairman of AMP Capital Investors (Singapore) Pte Ltd. Mr. Seow served as a board member of Singapore’s Land Transport Authority from 2007 until 2014.
Mr. Seow’s qualifications to sit on our Board include his years in the finance and investment industry, his knowledge of the insurance sector and his business experience in Asia.
|
|
Kevin M. Twomey

|
Current Directorships
Prime Property Fund LLC
Committees
Risk & Finance-Chairman
Nominating & Governance
|
Former Directorships (previous 5 years)
The Club at Las Campanas (2014)
Acxiom Corporation (2013)
|
|
Age:
68
Nationality:
American
Director Since:
May 2003
|
Mr. Twomey was President and Chief Operating Officer of The St. Joe Company until his retirement in 2006. Mr. Twomey was Vice-Chairman of the Board of Directors and Chief Financial Officer of H.F. Ahmanson & Company and its principal subsidiary, Home Savings of America until 1998. He was also a Director of Intergraph Corporation until 2006 and Novelis Inc. until 2007. Mr. Twomey was on the Board of Trustees of the University of North Florida and the University of North Florida Funding Corporation until 2011 and was on the Board of Trustees of United Way Northeast Florida until 2010.
Mr. Twomey’s qualifications to sit on our Board include his years of executive experience in the international financial industry as well as his previous experience as a director on the boards of U.S. listed companies.
|
|
196
Egbert Willam

|
Current Directorships
CICSA Reaseguros S.A.
Humanitas AG
BDB Insurance S.A.
Insurance Brokers Investments Ltd
Committees
Audit
Nominating & Governance
|
Former Directorships (previous 5 years)
None
|
|
Age:
66
Nationality:
German
Director Since:
June 2012
|
Dr. Willam is the founder and Chairman of KEN Investments K.K., a private equity firm operating in Japan. Dr. Willam held a senior position in Munich Re and was a member of the executive board of Cologne Re where he led the transition of the group into General Cologne Re now known as Gen Re.
Dr. Willam’s qualifications to sit on our Board include his years in the (re)insurance industry as well as his broad international experience in the financial services industry.
|
|
David Zwiener, President and Interim Chief Executive Officer

|
Current Directorships
VOYA Financial Inc. (formerly ING U.S.)
Committees
Risk & Finance
|
Former Directorships (previous 5 years)
CNO Financial Group (2011)
|
|
Age:
60
Nationality:
American
Director Since:
July 2009
|
Mr. Zwiener was appointed as PartnerRe's Interim Chief Executive Officer in January 2015. He is a Principal in Dowling Capital Partners and was appointed as a director of VOYA Financial Inc. in 2013 and is chairman of their audit committee. Mr. Zwiener is also a trustee of the New Britain Museum of American Art. Mr. Zwiener was President and Chief Operating Officer of the property and casualty operations at Hartford Financial Services Group Inc. from 1997 to 2007, Managing Director and Co-Head of the financial institutions group of the Carlyle Group from 2007 to 2008 and Chief Financial Officer of Wachovia Corporation in 2009.
Mr. Zwiener’s qualifications to sit on our Board include his years of experience in the international financial and (re)insurance industries including a leading insurance group.
|
|
197
OUR EXECUTIVE OFFICERS
|
William Babcock
|
||||||

|
Age:
|
47
|
Position
|
|||
|
Nationality:
|
American
|
Executive Vice President and Chief Financial Officer
|
||||
|
Executive Officer Since:
|
October 2010
|
|||||
|
Mr. Babcock joined PartnerRe in 2008 as Group Finance Director. Effective October 1, 2010, Mr. Babcock was appointed as Executive Vice President and Chief Financial Officer of PartnerRe Ltd. Prior to joining PartnerRe, Mr. Babcock held the position of Chief Accounting Officer and Director of Financial Operations at Endurance Specialty Ltd.
|
||||||
|
Emmanuel Clarke
|
||||||

|
Age:
|
45
|
Position
|
|||
|
Nationality:
|
French
|
Chief Executive Officer, PartnerRe Global
|
||||
|
Executive Officer Since:
|
September 2010
|
|||||
|
Mr. Clarke joined PartnerRe in 1997 and was appointed as Head of Credit & Surety PartnerRe Global in 2002 and Head of Property and Casualty, PartnerRe Global in 2006. In 2008 Mr. Clarke was appointed as Head of Specialty Lines, PartnerRe Global and Deputy Chief Executive Officer, PartnerRe Global. Effective September 1, 2010, Mr. Clarke was appointed as Chief Executive Officer of PartnerRe Global.
|
||||||
|
Laurie Desmet
|
||||||

|
Age:
|
52
|
Position
|
|||
|
Nationality:
|
American
|
Executive Vice President and Chief Operations Officer, Group
|
||||
|
Executive Officer Since:
|
April 2013
|
|||||
|
Ms. Desmet joined PartnerRe in 2004 as Chief Accounting Officer, PartnerRe Ltd. and was appointed Chief Operations Officer of PartnerRe’s Global operations in 2010. Effective April 1, 2013, Ms. Desmet was appointed Executive Vice President and Chief Operations Officer, PartnerRe Ltd. Prior to joining PartnerRe, Ms. Desmet was employed by Converium as Chief Accounting Officer and by Ernst & Young as a Senior Manager.
|
||||||
|
Theodore C. Walker
|
||||||

|
Age:
|
54
|
Position
|
|||
|
Nationality:
|
American
|
Chief Executive Officer, PartnerRe North America
|
||||
|
Executive Officer Since:
|
January 2009
|
|||||
|
Mr. Walker joined PartnerRe in 2002 as Head of the worldwide catastrophe underwriting operations. In 2007, Mr. Walker assumed the role of Chief Underwriting Officer for PartnerRe North America. Effective January 1, 2009, Mr. Walker was appointed as Chief Executive Officer, PartnerRe North America.
|
||||||
198
SECTION 16(a) BENEFICIAL OWNERSHIP REPORTING COMPLIANCE
Section 16(a) of the Securities Exchange Act of 1934, as amended, requires our directors and executive officers and persons that beneficially own more than 10% of a registered class of our equity securities to file initial reports of ownership and reports of changes in beneficial ownership with the SEC. PartnerRe assists its directors and executive officers by monitoring transactions and completing and filing Section 16 reports on their behalf.
Based solely on a review of the reports filed by individuals subject to Section 16(a) during 2014, no director or executive officer failed to file his or her required reports on a timely basis.
CODE OF ETHICS
The Board of PartnerRe has adopted the Code of Business Conduct and Ethics, which applies to all directors, officers and employees. Any specific waiver of its provisions requires the approval of the Board or a Committee of the Board, and any such waiver must be disclosed to shareholders promptly. We will disclose any such waiver on our website at www.partnerre.com within four business days of such waiver being granted. There were no waivers of the Code of Business Conduct and Ethics in 2014. Any reported violation to the Code of Business Conduct and Ethics will be investigated and may result in disciplinary action, as appropriate.
PROCEDURES BY WHICH STOCKHOLDER MAY NOMINATE DIRECTORS
There have been no material changes in the procedures by which shareholders may nominate directors from those that were disclosed in the Company's Proxy Statement, filed on April 1, 2014.
AUDIT COMMITTEE
The Board of PartnerRe has established a standing Audit Committee, the members of which are independent in accordance with the definition of the New York Stock Exchange Rules. The Audit Committee is comprised of Ms. Perry, Ms. Hanratty, Mr. Holsboer and Mr. Willam. Ms. Perry is the Chairman of the Audit Committee and meets the definition of an “audit committee financial expert” as adopted by the SEC, and she has agreed to be designated as such. The Board of PartnerRe has determined that Ms. Perry is independent under New York Stock Exchange Rules. Ms. Perry also serves as chairman of Korn/Ferry International's audit committee. The other members of the Audit Committee meet the financial literacy requirements of the New York Stock Exchange Rules. They each have a broad range of experience in senior executive positions in their respective industries. The Board of PartnerRe has determined that each member of the Audit Committee has appropriate accounting and financial management expertise.
Pursuant to its charter, the Audit Committee’s primary responsibilities are to assist Board oversight of:
|
•
|
the integrity of PartnerRe’s financial statements;
|
|
•
|
PartnerRe’s compliance with legal and regulatory requirements, including the receipt of reports arising in respect of the Code of Business Conduct and Ethics;
|
|
•
|
the independent auditor’s qualifications and independence; and
|
|
•
|
the performance of PartnerRe’s internal audit function and independent auditors.
|
The Audit Committee regularly meets with management, the Chief Audit Officer and our independent registered public accounting firm to review matters relating to the quality of financial reporting and internal accounting controls, including the nature, extent and results of their audits. In addition, the Audit Committee discusses PartnerRe’s policies with respect to risk assessment and risk management processes.
EXECUTIVE SESSIONS
Following every physical Board meeting in 2014, the Chief Executive Officer recused himself from the meeting to allow the Board to meet in executive sessions. The independent directors are at liberty to raise whatever issues they wish during these sessions. The Chairman presides over the executive sessions.
CORPORATE DOCUMENTATION
The documentation listed below is available on our website at www.partnerre.com. To obtain a hard copy please write to the Secretary, PartnerRe Ltd., Wellesley House South, 90 Pitts Bay Road, Pembroke HM 08, Bermuda, or call 1-441-292-0888. We will
199
also provide, upon payment of a reasonable fee to cover reproduction and mailing expenses, a copy of all exhibits to our Annual Report on Form 10-K.
|
•
|
Annual Report on Form 10-K for the year ended December 31, 2014, as filed on February 26, 2015;
|
|
•
|
Corporate Governance Principles and Application Guidelines;
|
|
•
|
Audit Committee Charter;
|
|
•
|
Compensation & Management Development Committee Charter;
|
|
•
|
Nominating & Governance Committee Charter;
|
|
•
|
Risk & Finance Committee Charter; and
|
|
•
|
Code of Business Conduct and Ethics.
|
Information contained on our website is not incorporated by reference into this Form 10-K or any other report filed with the SEC.
200
|
ITEM 11.
|
EXECUTIVE COMPENSATION
|
Compensation Discussion and Analysis
Executive Summary
This Compensation Discussion and Analysis provides an overview of how our Named Executive Officers (NEOs) were compensated in 2014, and how their compensation aligns with our established pay-for-performance compensation philosophy. The Compensation Discussion and Analysis describes the compensation of the following NEOs.
|
Name
|
Title
|
|
|
Costas Miranthis
|
President and Chief Executive Officer
(1)
|
|
|
William Babcock
|
Executive Vice President and Chief Financial Officer
|
|
|
Emmanuel Clarke
|
Chief Executive Officer, PartnerRe Global
|
|
|
Laurie Desmet
|
Executive Vice President and Chief Operations Officer, Group
|
|
|
Theodore C. Walker
|
Chief Executive Officer, PartnerRe North America
|
|
(1) As described in further detail below. Mr. Miranthis ceased serving as the President and Chief Executive Officer on January 25, 2015. David Zwiener currently serves as the Interim Chief Executive Officer.
PartnerRe’s Executive Total Compensation Program is based on our compensation philosophy of providing market competitive programs which are designed to attract and retain top talent, align remuneration to value creation, and incent positive behaviors as well as motivating employees and paying for performance, while discouraging excessive risk-taking. To support this philosophy, PartnerRe uses a mix of both short and long-term based compensation elements inclusive of base salary, annual cash incentives, long-term equity awards and benefits. PartnerRe provides clear alignment between financial and non-financial performance to encourage employees to help PartnerRe achieve long-term financial objectives. The Compensation & Management Development Committee (Compensation Committee) reviews the Executive Total Compensation Program components annually to ensure there is a clear alignment with our pay-for-performance compensation philosophy.
For 2014, the result of the Adjusted Return on Equity (AROE, as described under Group Adjusted Return on Equity below), was 15.1% and is PartnerRe’s primary financial metric, for the purposes of evaluating at-risk compensation. This performance exceeded the Company’s target of 8% - 9% in a continually challenging economic and operating environment. The Company’s diversified platform and performance culture allowed the Company to meet these challenges and remain financially strong.
In May 2014, our shareholders voted on executive compensation for the 2013 performance year. In this non-binding advisory say-on-pay vote, shareholders, representing 93% of the total shares voted, voted in favor of PartnerRe’s compensation philosophy and practices. PartnerRe will continue to focus on the philosophy which guides the compensation decisions that were so strongly supported by our shareholders.
The Compensation Committee regularly evaluates the alignment of the compensation of our NEOs with Company performance while also giving consideration to total compensation relative to that of peer companies. The Compensation Committee considers a number of factors in their evaluation, including periodic reviews of market data provided by Frederic W. Cook & Co., Inc., the Compensation Committee’s independent consultant. In addition, the Compensation Committee considers ways of providing the shareholders with adequate protection following a potential termination of the NEOs by putting in place restrictive covenants (including non-compete clauses) to ensure that NEOs are not able to put the Company at a competitive disadvantage.
Amalgamation of PartnerRe and AXIS and Chief Executive Officer Change
On January 25, 2015, the Company entered into the Amalgamation Agreement with AXIS, pursuant to which the Company will amalgamate with AXIS and continue as an Amalgamated Company, as further described in Business—General in Item 1 of Part I of this report.
In connection with the Amalgamation, Mr. Miranthis resigned as a Director and as the Company’s President and Chief Executive Officer, effective as of January 25, 2015, and will continue his employment as an non-executive employee of the Company until March 31, 2015. David Zwiener was appointed as the Company’s interim President and Chief Executive Officer, effective as of January 25, 2015, and will remain in this role through the earlier of the closing of the Amalgamation or April 30, 2016. In connection with his appointment, Mr. Zwiener ceased serving as the chairman of the Audit Committee and a member of the Compensation Committee, but remained a member of the Company’s Board of Directors.
201
Under the terms of a letter agreement between Mr. Miranthis and the Company, dated January 25, 2015, Mr. Miranthis received, in connection with his resignation, a cash payment totaling $16,594,007, two-thirds of which was paid on February 4, 2015 following his execution of a general release, and the remaining one-third will be paid following the earlier of the closing date of the Amalgamation or December 1, 2015, subject to his execution of an additional release. All of Mr. Miranthis’ unvested equity awards that he holds on March 31, 2015 will become fully vested as of March 31, 2015 (with any performance share units being earned at the maximum level of performance achievement), and any share options and share appreciation rights will remain exercisable for their original terms. He will also be entitled to certain other benefits, including a supplemental contribution of $150,000 to the Bermuda Non-Registered Pension Plan; continued allowances for housing, tax advice fees and a club membership; and payment of his attorneys’ fees. Mr. Miranthis will be subject to a non-competition covenant for the period between January 25, 2015 and the payment date of the second payment described above, a one-year non-solicitation covenant, a confidentiality covenant and a non-disparagement covenant.
As the interim President and Chief Executive Officer, Mr. Zwiener’s annual base salary will be $1,000,000, and he received a grant of sign-on restricted share units with a value of $1,500,000, which will vest and settle on the earlier of closing date of the Amalgamation or April 30, 2016. He will receive a cash service bonus of $3,500,000, which will be paid on the closing date of the Amalgamation, and he will be eligible for a discretionary cash bonus based on the board’s assessment of Mr. Zwiener’s execution of the transaction or his efforts in relation thereto. If his employment is terminated without cause or for good reason, Mr. Zwiener will be entitled to an amount equal to the base salary that he would otherwise have earned between the date of his termination and April 30, 2016; a cash payment equal to the value of his sign-on restricted share unit award, subject to his execution of a general release; and payment of the cash service bonus, provided that the Amalgamation closes on or prior to April 30, 2016. While he will receive certain executive-level perquisites, he will not be entitled to participate in the Company’s Change in Control Policy or any other change in control or severance plan or policy. Mr. Zwiener will be subject to a one-year post-termination non-solicitation covenant, a confidentiality covenant and a non-disparagement covenant. In this role, Mr. Zwiener will be a member of the Board.
Elements of Total Compensation
The three principal types of compensation paid to the NEOs (each of which is described in more detail below) are:
(1) Base salary
(2) Annual Cash Incentive
(3) Annual Equity Awards
When analyzing the NEO's mix of compensation with respect to the 2014 performance year and setting amounts for each of these components, the Compensation Committee is guided by the philosophy outlined in the Executive Total Compensation Program. To allocate the three principal forms of compensation optimally, the Compensation Committee focuses on, amongst other things, the following:
|
•
|
clearly linking pay to performance;
|
|
•
|
achieving a balance between fixed compensation (base salary) and at-risk compensation (annual cash incentive and equity awards). At-risk compensation supports a pay-for-performance approach and links predetermined objectives, including Company performance, with at-risk compensation; however, caps are in place to ensure that NEOs are not inappropriately motivated to maximize their at-risk earnings;
|
|
•
|
ensuring that long-term incentive awards in the form of equity are designed to align the NEO's interests with shareholders’ interests by emphasizing long-term business performance and overall PartnerRe success;
|
|
•
|
promoting the retention of NEOs by providing long-term incentives; and
|
|
•
|
providing flexibility in the form and structure of compensation to meet individual goals and time horizons.
|
Balance of Fixed and At-Risk Compensation
For the 2014 performance year, the total compensation (base salary, annual cash incentive and equity awards) that was at-risk for the Chief Executive Officer was 88.6% (32.0% comprised of annual cash incentive and 56.6% comprised of equity awards) and 11.4% was base salary. For the NEOs (excluding the Chief Executive Officer) compensation that was at-risk was 80.3% (34.7% comprised of annual cash incentive and 45.6% comprised of equity awards) with the balance of their total compensation, 19.7%, being base salary. At-risk compensation is considered by the PartnerRe Board to include annual incentive and equity grants. The breakdown of the Chief Executive Officer's and other NEOs' compensation mix is as follows:
202
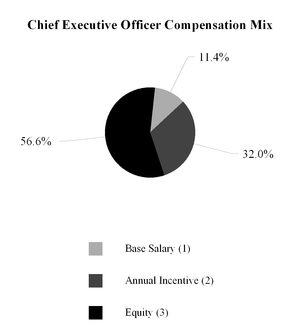
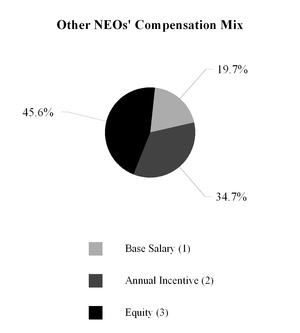
|
(1)
|
Base salary at December 31, 2014.
|
|
(2)
|
Actual annual cash incentive award for the 2014 performance year, paid in March 2015.
|
|
(3)
|
Actual annual equity dollar value for the 2014 performance year, granted on February 17, 2015. In connection with his resignation, Mr. Miranthis received the value of his equity awards for the 2014 performance year in cash as part of his termination payments.
|
|
(1)
|
Base Salary
|
Base salary is reviewed annually by the Compensation Committee, and is the fixed component of the total compensation package. The level of base salary is intended to reflect the expertise, level of experience and scope of responsibilities of the NEO. Base salary targets the market median based on market competitive data (as discussed in Competitive Peer Group and Pay Analysis below) and is the base component of overall compensation. In line with company philosophy and as shown in the graph above, base salary is the smallest component of total compensation for the NEOs. Mr. Miranthis’ base salary has not changed since he was appointed to the role of Chief Executive Officer effective January 1, 2011.
The base salary for each NEO is reviewed at the first Compensation Committee meeting of the calendar year and fixed as of April 1 of each year. The base salaries as of April 1, 2014 were as follows:
|
Costas
Miranthis
|
William
Babcock
|
Emmanuel
Clarke
(1)
|
Laurie
Desmet
|
Theodore
C. Walker
|
||||||||||||||
|
2014 Base Salary
|
$
|
1,000,000
|
|
$
|
599,167
|
|
CHF629,287
|
$
|
537,950
|
|
$
|
607,957
|
|
|||||
(1) US dollar equivalent is $635,643. Exchange rate of 1USD = 0.99CHF used to calculate dollar value.
|
(2)
|
Annual Cash Incentive
|
Annual cash incentive is an “at-risk” performance based component of compensation and has been designed to align NEO and shareholder interests through the attainment of predetermined metrics and objectives.
Pursuant to PartnerRe’s annual cash incentive program, each employee has a target annual cash incentive that is expressed as a percentage of base salary. The annual cash incentive payout ranges from 0% to 200% of the target, depending upon actual performance compared with predetermined performance metrics. The table below shows actual annual cash incentive paid against the target annual incentive for the 2014 performance year.
203
|
Costas
Miranthis
|
William
Babcock
|
Emmanuel
Clarke
|
Laurie
Desmet
|
Theodore
C. Walker
|
|||||||||||||||
|
Target Annual Cash Incentive (% of salary)
|
150
|
%
|
100
|
%
|
100
|
%
|
100
|
%
|
100
|
%
|
|||||||||
|
Target Annual Cash Incentive (Value)
(1) (2)
|
$
|
1,500,000
|
|
$
|
599,167
|
|
CHF629,287
|
|
$
|
537,950
|
|
$
|
607,957
|
|
|||||
|
Actual Annual Cash Incentive
(1) (3)
|
$
|
2,793,750
|
|
$
|
1,101,718
|
|
CHF1,144,525
|
|
$
|
978,397
|
|
$
|
948,869
|
|
|||||
|
(1)
|
Amounts relate to the 2014 performance year. The actual annual cash incentive is paid in March 2015.
|
|
(2)
|
US dollar equivalent for Emmanuel Clarke's target annual cash incentive is $635,643. Exchange rate of 1USD = 0.99CHF used to calculate dollar value.
|
|
(3)
|
US dollar equivalent for Emmanuel Clarke's actual annual cash incentive is $1,156,086. Exchange rate of 1USD = 0.99CHF used to calculate dollar value.
|
The metrics for the following performance measures are predetermined by the Compensation Committee:
|
i)
|
Total Group Performance (Group AROE + Group Organizational Objectives)
|
|
ii)
|
Business Unit Financial Performance, which includes Operating Expenses for the Chief Financial Officer (CFO) and the Chief Operations Officer (COO)
|
|
iii)
|
Personal Objectives
|
The AROE metric is PartnerRe’s primary financial metric, for the purposes of evaluating compensation, as it focuses on the value provided to shareholders and is a reliable indicator of Company performance and profitability. Business Unit Financial Performance and Operating Expense Performance are financial metrics that are also used for NEOs in determining their Annual Incentive payout. The inclusion of qualitative objectives provides the ability to assess performance which may not be quantifiable but impacts the overall performance of the Company.
The Compensation Committee annually approves the metrics within the Total Group Performance measure and the weighting of each measure for each NEO. Each measure is weighted to reflect the contributions of each NEO toward our strategy, the current business environment, as well as the behaviors which the Compensation Committee wishes to encourage and reward. The Compensation Committee places significant emphasis on quantitative performance measures (i.e., combined Group AROE, Business Unit Financial Performance and Operating Expense Performance). The Compensation Committee approved the weight of financial performance in a range of 72.5% - 75% for NEOs in 2014, which remains unchanged from 2013. The qualitative objectives (Group Organizational and Personal combined) also remain unchanged within a target weight range of 25% - 27.5%. The following table outlines the 2014 weightings and measures for each NEO:
|
Costas
Miranthis
|
William
Babcock
|
Emmanuel
Clarke
|
Laurie
Desmet
|
Theodore
C. Walker
|
|||||||||||
|
Group AROE
|
75
|
%
|
62.5
|
%
|
42.5
|
%
|
52.5
|
%
|
42.5
|
%
|
|||||
|
Group Organizational Objectives
|
25
|
|
7.5
|
|
7.5
|
|
7.5
|
|
7.5
|
|
|||||
|
Total Group Performance
|
100
|
%
|
70
|
%
|
50
|
%
|
60
|
%
|
50
|
%
|
|||||
|
Business Unit Financial Performance
(1)
|
—
|
|
10
|
|
30
|
|
20
|
|
30
|
|
|||||
|
Personal Objectives
|
—
|
|
20
|
|
20
|
|
20
|
|
20
|
|
|||||
|
Total Financial Performance
|
75
|
%
|
72.5
|
%
|
72.5
|
%
|
72.5
|
%
|
72.5
|
%
|
|||||
|
Total Personal Performance
|
25
|
%
|
27.5
|
%
|
27.5
|
%
|
27.5
|
%
|
27.5
|
%
|
|||||
(1) Business Unit Return on Equity (ROE) for Mssrs. Clarke and Walker and Operating Expense Performance for Mr. Babcock and Ms. Desmet
|
i)
|
Total Group Performance
|
The Total Group Performance measure applied to all NEOs and was the most heavily-weighted measure (100% for Mr. Miranthis, 70% for Mr. Babcock, 60% for Ms. Desmet and 50% for Messrs. Clarke and Walker). The Total Group Performance measure is comprised of Group AROE and Group Organizational Objectives, with Group Adjusted Return on Equity (Group AROE) being the primary metric. Mr. Miranthis’ annual cash incentive was paid out at 186% of target, reflective of the Company’s strong financial performance in 2014.
204
The actual 2014 Total Group Performance results and resulting payout for each NEO, based on the weightings shown in the above table, are shown below:
|
|
|
|
Payout
|
|||||||||||||||
|
|
Performance
|
Scale Payout
|
CEO
|
CFO
|
COO
|
Other NEOs
(1)
|
||||||||||||
|
Group AROE
|
15
|
%
|
200
|
%
|
150
|
%
|
125
|
%
|
105
|
%
|
85
|
%
|
||||||
|
Group Organizational Objectives
|
145
|
%
|
145
|
%
|
36
|
%
|
11
|
%
|
11
|
%
|
11
|
%
|
||||||
(1) Emmanuel Clarke and Theodore C. Walker.
Group Adjusted Return on Equity (Group AROE)
The Compensation Committee assessed all the metrics used in determining the NEOs' 2014 performance year annual cash incentives. As the foregoing tables show and as discussed above, Group AROE is the most predominant component used to determine Total Group Performance and consequently the 2014 performance year annual cash incentive payouts.
Group AROE is the sum of the Company's Operating Return on Equity (ROE) and the return on the Company's Risk Assets. ROE is based on operating earnings or losses (see Key Financial Measures in Item 7 of Part II of this report a definition). ROE excludes realized and unrealized gains or losses on the Company’s Risk Assets. The return on the Company's Risk Assets includes the realized and unrealized gains and losses from a portion of the Company's investment portfolio that includes equities, asset-backed securities, insurance linked securities and other specific investments. Group AROE is not a financial measure calculated in accordance with U.S. GAAP. See Key Financial Measures in Item 7 of Part II of this report for a reconciliation of this non-GAAP financial measure to the most directly comparable GAAP financial measure.
The Group AROE scale is established annually and approved by the Compensation Committee prior to the start of the performance year. The main factors considered in establishing the Group AROE scale were the current reinsurance market outlook and a sustained period of low interest rates.
The payout scale is as follows and is subject to straight-line interpolation.
|
2014 Group AROE Performance
|
Payout of Award as a Percentage of
Target Annual Cash Incentive
|
|
|
>14%
|
200%
|
|
|
á
|
á
|
|
|
8-9%
|
100%
|
|
|
á
|
á
|
|
|
<3%
|
0%
|
|
The scale reflects PartnerRe’s compensation philosophy in the following respects:
|
•
|
The annual cash incentive target (i.e., payout at 100%) is awarded for a target Group AROE performance, which is established prior to the start of the performance year.
|
|
•
|
The annual cash incentive payout is capped at 200% because an uncapped payout could encourage risk-taking activities which are not in the best interests of our shareholders.
|
|
•
|
The scale is designed to ensure that our shareholders receive a minimum return, currently at least 3% Group AROE, before employees receive an allocation toward their annual cash incentive.
|
|
•
|
The scale is set to create challenging but realistic goals to motivate employees and provide the opportunity to pay for performance.
|
The Group AROE for 2014 was 15.1% and consequently the payout award for this component for the 2014 performance year was 200%.
Group Organizational Objectives
Non-financial objectives are recommended annually by the President and Chief Executive Officer and approved by both the Compensation Committee and the Board. For 2014, the Group Organizational Objectives were:
|
•
|
Evolve organizational structure;
|
205
|
•
|
Continue to explore options for strategic development; and
|
|
•
|
Simplify risk policy documentation and enhance ERM framework.
|
The Group Organizational Objectives will vary from year to year and the Compensation Committee does not assign specific weighting to any one individual component of the Group Organizational Objectives. No individual Group Organizational Objective was significant enough to make a meaningful impact on the maximum potential annual cash incentive payout for the 2014 performance year. As each qualitative objective was not individually material and was subjective in nature (i.e., not a quantitative measurement), the Compensation Committee reviewed the performance in the aggregate and determined that PartnerRe successfully achieved the Group Organizational Objectives, resulting in a payout of 145% of target.
|
ii)
|
Business Unit Financial Performance
|
Mr. Miranthis’s annual cash incentive does not include a Business Unit Performance measure. For Mr. Clarke and Mr. Walker, a Business Unit ROE metric accounted for 100% of their Business Unit Performance measure. The Operating Expense metric was introduced for Mr. Babcock and Ms. Desmet in 2014 to encourage PartnerRe's continued focus on expense management. The use of this financial metric emphasizes the importance of cost management as a performance indicator in today's challenging environment.
The following table shows the Non-Group Financial Performance metrics used for the 2014 performance year:
|
NEO
|
Metric used for Business Unit Performance Measure
|
Relative Weight of Business Unit Performance Measure (among all measures)
|
Actual 2014 Performance
(1)
|
Scale Payout
|
|||||||
|
William Babcock
|
CFO Operating Expense
|
10
|
%
|
160
|
%
|
160
|
%
|
||||
|
Emmanuel Clarke
|
Global ROE
|
30
|
%
|
15.1
|
%
|
180
|
%
|
||||
|
Laurie Desmet
|
COO Operating Expense
|
20
|
%
|
180
|
%
|
180
|
%
|
||||
|
Theodore C. Walker
|
North America ROE
|
30
|
%
|
7.7
|
%
|
94
|
%
|
||||
(1) The targets and payout scales are illustrated below and are subject to straight-line interpolation.
|
Global ROE Performance
|
North America ROE Performance
|
CFO Operating Expense Performance
(1)
|
COO Operating Expense Performance
(1)
|
Payout of Award as a Percentage of Target Annual Cash Incentive
|
||||
|
>16%
|
>14%
|
($2.7m)
|
($10m)
|
200%
|
||||
|
á
|
á
|
á
|
á
|
á
|
||||
|
9-10%
|
8-9%
|
$0
|
$0
|
100%
|
||||
|
á
|
á
|
á
|
á
|
á
|
||||
|
<4%
|
<3%
|
$2.7m
|
$10m
|
0%
|
||||
(1) Overage (savings) to operating expense budget.
|
iii)
|
Personal Objectives
|
Other than the Chief Executive Officer, each of our NEOs has predetermined qualitative objectives that vary from year to year. Qualitative objectives are recommended annually by the Chief Executive Officer and approved by the Compensation Committee. The weight on qualitative objectives aligns with the Compensation Committee’s goal of a 25% - 27.5% weight on qualitative objectives (Group Organizational and Personal Objectives combined), placing greater emphasis on quantitative performance measures. In 2014, the Compensation Committee considered numerous qualitative personal objectives, none of which covered all of our NEOs. For each NEO, the Compensation Committee considered all of the objectives that specifically applied to the NEO and reached a subjective view as to how well the NEO had achieved his or her personal objectives. Personal objectives cover many areas, including operational efficiency, effective capital management, maintaining good relationships with clients and success of significant projects. The Compensation Committee determined that each NEO successfully achieved their personal objectives for the 2014 performance year, resulting in a payout of between 145% and 160% of target for the Personal Objectives metric for each NEO.
|
(3)
|
Equity Awards
|
Equity awards provide “at-risk” compensation which has a long-term focus and are subject to both performance and time-based vesting mechanisms. Equity awards are intended to: (i) align the long-term interests of NEOs and shareholders; (ii) reflect long-term performance goals; and (iii) act as a talent retention vehicle.
206
Form of Equity
The NEOs blend of equity is 60% performance-based awards (PSUs and SSARs) and 40% time-based awards (RSUs). Prior to the start of the performance year, NEOs can customize their award and convert up to 25% of their PSU and RSU awards into SSARs. The performance-based equity has a greater motivational impact while the time-based equity has a greater retentive impact. The annual equity award distribution for the NEOs is as follows:
|
|
|
|
Blend of Equity
|
|||||||||||||||||
|
Equity Award Level
|
Annual Equity Target Dollar Value
|
Actual Grant for 2014 Performance Year
(1)
|
RSUs
(2)
(40%)
|
PSUs
(2)
(40%)
|
SSARs
(2)
(20%)
|
|||||||||||||||
|
CEO
|
$
|
4,500,000
|
|
$
|
4,950,000
|
|
$
|
1,980,000
|
|
$
|
1,980,000
|
|
$
|
990,000
|
|
|||||
|
CFO
(3)
|
$
|
1,250,000
|
|
$
|
1,375,000
|
|
$
|
481,250
|
|
$
|
481,250
|
|
$
|
412,500
|
|
|||||
|
Other NEOs
|
$
|
1,250,000
|
|
$
|
1,375,000
|
|
$
|
550,000
|
|
$
|
550,000
|
|
$
|
275,000
|
|
|||||
|
(1)
|
Granted on February 17, 2015 at 110% of target dollar value. In connection with his resignation, Mr. Miranthis received the value of his equity awards for the 2014 performance year in cash as part of his termination payments.
|
(2) RSUs and PSUs have a three-year cliff vest and the PSUs are subject to a performance measure; SSARs have a three-year ratable vest.
(3) Mr. Babcock customized his 2015 grant as follows: 35% RSUs / 35% PSUs / 30% SSARs.
Equity Performance Adjustment
At grant, the target dollar value of the annual equity award is adjusted (90% - 110%) based on the prior year’s Group AROE result of 15.1%:
|
•
|
Results within scale (3 -14%) – no adjustment
|
|
•
|
Results below scale (<3%) – 90% of target dollar value
|
|
•
|
Results above scale (>14%) – 110% of target dollar value
|
The 15.1% Group AROE result for 2014 exceeded the maximum range on the annual incentive scale, resulting in an adjustment of 110% to the 2014 equity target dollar values.
For the 2014 performance year grant, upon settlement, PSU awards can be adjusted upward or downward based on the average three-year growth in Tangible Book Value Per Diluted Share (TBVPS) + non-life reserve discount + life unrecognized value + dividends paid from grant date. This financial performance metric was selected by the Company because it has a high correlation to shareholder value. The following table shows the payout scale on settlement, based on performance and is subject to straight-line interpolation:
|
Level
|
PSU Metric Scale (above risk-free return)
(1)
|
PSU Adjustment %
|
||
|
Maximum
|
>1,200bps
|
150%
|
||
|
á
|
á
|
á
|
||
|
Target
|
700bps
|
100%
|
||
|
á
|
á
|
á
|
||
|
Minimum
|
<200bps
|
50%
|
||
(1)
Based on a reference portfolio of risk-free securities with three-year duration.
207
The following table shows each NEO's actual 2015 PSU grant value against the scale to show what each NEO would potentially receive when the PSUs vest if maximum, target or minimum performance is achieved at the end of the three year period:
|
Estimated PSU Value at Vest for PSU Performance
(1)
|
|||||||||
|
Name
|
Minimum
|
Target Performance
|
PSU Grant at Minimum
|
||||||
|
Costas Miranthis
(2)
|
2,970,000
|
|
1,980,000
|
|
990,000
|
|
|||
|
William Babcock
|
721,875
|
|
481,250
|
|
240,625
|
|
|||
|
Emmanuel Clarke
|
825,000
|
|
550,000
|
|
275,000
|
|
|||
|
Laurie Desmet
|
825,000
|
|
550,000
|
|
275,000
|
|
|||
|
Theodore C. Walker
|
825,000
|
|
550,000
|
|
275,000
|
|
|||
(1) Based on value at grant on February 17, 2015.
(2) See Amalgamation of PartnerRe and AXIS and Chief Executive Officer Change above for the treatment of PSUs for Mr. Miranthis in connection with his resignation.
Linking Pay for Performance
The Group AROE scale is established annually and approved by the Compensation Committee. The main factors considered in establishing the Group AROE scale were the current reinsurance market outlook and a sustained period of low interest rates. The Company’s financial results for 2014 were above target and this was reflected in the above target payment of the annual cash incentive component of at-risk compensation to the NEOs for the 2014 performance year, demonstrating a strong link between pay and performance.
The table below provides a three-year history of the Company performance.
|
2012
|
2013
|
2014
|
||||
|
Group AROE
|
15.0%
|
15.7%
|
15.1%
|
|||
|
Group AROE Scale Payout
|
150%
|
200%
|
200%
|
|||
|
Total Group Performance
(1)
|
150%
|
190%
|
186%
|
|||
(1) Based on a weighting of 75% for Group AROE and 25% for Group Organizational Objectives.
A review of Chief Executive Officer compensation was considered at the February 2014 meeting of the Compensation Committee and a decision was made to increase Mr. Miranthis's target annual incentive and target equity value to bring him closer to the market median of peer companies. In their review, the Compensation Committee considered, amongst other factors, the Company’s performance, the current reinsurance environment, alignment with peer companies’ Chief Executive Officer pay packages and maintaining a total compensation package that would continue to allow the Chief Executive Officer to focus on increasing shareholder value. Based upon these considerations, and taking into consideration the recommendation from the Compensation Committee's independent consultant Frederic W. Cook & Co., Inc, the Compensation Committee determined that it would be appropriate to increase the Chief Executive Officer’s at-risk annual incentive target from 125% to 150% of base salary and the annual target equity value from $3,000,000 to $4,500,000. Further underscoring the Compensation Committee’s commitment to align pay with performance, the Chief Executive Officer’s salary remained unchanged. Both increases took effect for the 2014 performance year, and bring the CEO near the market median of peer companies.
Executive Share Ownership and Retention
To promote the goal of aligning the interests of the NEOs and shareholders, the Executive Total Compensation Program prescribes share ownership guidelines, holding restrictions and incentives to encourage the NEOs to hold a stake in the future value of PartnerRe.
The Executive Total Compensation Program prescribes net share retention guidelines for all equity grants. For this purpose, “net shares” are the common shares remaining from a transaction (i.e., the exercise of an option or the vesting of restricted shares) after the NEO sells enough common shares to pay the applicable exercise price and any related tax or social security liabilities. The guidelines provide that:
|
•
|
NEOs who have not satisfied the applicable share ownership target must retain 100% of the net shares they acquire until they reach the target.
|
|
•
|
If an NEO has met the share ownership target, but the holdings subsequently drop below the target amount for any reason (for example, a new share issuance), the executive will have a one-year grace period to once again meet the target.
|
208
|
•
|
The net share retention guidelines do not apply to grants made prior to becoming an NEO.
|
The ownership target is expressed as a percentage of PartnerRe’s fully diluted common shares outstanding (“CSO”) at the end of each calendar year and includes all common shares and equivalents held by the NEO. The number of fully diluted CSO at December 31, 2014, was 49,087,412. The table below shows the ownership targets, common share ownership, and ownership expressed as a percentage of fully diluted CSO for each NEO as of December 31, 2014. All of the NEOs have reached their share ownership targets.
|
Name
|
Ownership Target—Common shares/equivalents as a percentage of fully diluted CSO
|
Common Share Ownership
(1)
|
Common shares/equivalents as a percentage of fully diluted CSO
|
|||||
|
Costas Miranthis
|
0.07
|
%
|
198,365
|
|
0.40
|
|||
|
William Babcock
|
0.03
|
%
|
50,351
|
|
0.10
|
|||
|
Emmanuel Clarke
|
0.03
|
%
|
61,402
|
|
0.13
|
|||
|
Laurie Desmet
|
0.03
|
%
|
42,264
|
|
0.09
|
|||
|
Theodore C. Walker
|
0.03
|
%
|
63,033
|
|
0.13
|
|||
(1) Common Share Ownership includes common shares owned outright, PSUs, RSUs, RSU equivalents of Options, SSARs (conversion ratio for 2014 was one RSU to seven SSARs) and common shares held in qualified plans. This includes vested and unvested awards.
Severance
To assist in recruiting and to ensure that PartnerRe is competitive within the market, the Company provides for severance payments to the NEOs under several different scenarios. The severance triggers, restrictive conditions, and compensation payments are governed by each NEO’s individual employment agreement and our Change in Control Policy. For more information, see Potential Payments Upon Termination or Change of Control below.
Benefits & Perquisites Review
To meet market competitive conditions, benefits and perquisites are provided to NEO’s. In line with our peers, PartnerRe provides additional perquisites for Bermuda-based executives who have relocated from their home country to the corporate headquarters. Consistent with our pay-for-performance compensation philosophy, executive perquisites are limited to personal use of corporate aircraft (for the Chief Executive Officer only, capped at 30 hours, of which zero hours were used for 2013 and 2014), housing, club membership, car and travel allowances. All other benefits for the executives are awarded to all employees in their location. The Company does not provide tax gross-ups to NEOs.
Governance Features of our Executive Compensation Program
The Compensation Committee is charged with the corporate governance of executive compensation with respect to our NEOs. All members of the Compensation Committee are non-executive directors and are considered independent pursuant to the NYSE Rule 303A.05. The Compensation Committee is authorized to retain independent consultants to give advice on compensation matters.
The Compensation Committee is responsible for the review and final approval of the compensation elements for each executive officer including the Chief Executive Officer.
In so reviewing and approving executive officers’ compensation, the Compensation Committee:
|
•
|
in consultation with the Board in executive session, establishes and approves goals and objectives relevant to the compensation of the Chief Executive Officer and evaluates the performance of the Chief Executive Officer in light of such established goals and objectives; and
|
|
•
|
in consultation with the Chief Executive Officer, establishes and approves goals and objectives relevant to the compensation of all other executive officers and evaluates their performance in light of such established goals and objectives.
|
The Compensation Committee is not involved in the consideration and determination of the directors’ compensation.
209
Independent Consultant
The Compensation Committee utilizes the services of an external compensation consultant. In 2014, the Compensation Committee utilized the services of Frederic W. Cook & Co., Inc.
In making decisions on Chief Executive Officer and other executive compensation, the Compensation Committee considered analysis and advice provided by Frederic W. Cook & Co., Inc., which was provided without consulting the Chief Executive Officer or management. Compensation Committee members have direct access to the consultant without management involvement.
During 2014, the services of Frederic W. Cook & Co., Inc. were limited to executive compensation matters. The Compensation Committee ascertained that Frederic W. Cook & Co., Inc. is an independent consultant to the Company.
Competitive Peer Group and Pay Analysis
The goal of the Compensation Committee is to ensure that the total compensation opportunity of our NEOs is competitive with the median of total compensation paid to executives of companies within the competitive peer group of (re)insurance companies which compete with us for executive talent. The Compensation Committee achieves this by conducting a competitive peer group analysis and comparing both the total compensation and each individual element of compensation to the peer group median.
The Compensation Committee considered and approved the composition of the competitive peer group with input from its independent consultant, Frederic W. Cook & Co., Inc. The competitive peer group is compiled using the following criteria: size (revenues, assets and market capitalization), corporate strategy, number of employees and business mix. Our 2014 competitive peer group (determined at the end of 2013) is comprised of ACE Ltd., Allied World Assurance Company Holdings AG, Arch Capital Group Ltd., AXIS, Everest Re Group Ltd., Munich Re, RenaissanceRe Holdings Ltd, SCOR SA, Validus Holdings and XL Group plc. Swiss Re is also part of the peer group for 2014 for the Chief Executive Officer compensation comparison; benchmark data for the other NEO’s is not available.
Each year the Compensation Committee reviews an analysis prepared by Frederic W. Cook & Co., Inc. comparing compensation within the peer group. The Compensation Committee utilizes this analysis when comparing compensation of the NEOs with that of executives with comparable responsibilities within the peer group.
Risk Management
The purpose of our business is to assume risk. As described above, our compensation programs contain a number of design features that proactively discourage excessive risk-taking. It is the view of the Compensation Committee that PartnerRe’s compensation policies and procedures do not create risks that are reasonably likely to have a material adverse effect on PartnerRe. These policies and procedures are reviewed as part of the Company’s risk management framework.
Clawback Provisions
NEOs may be required to repay some or all of any cash or equity incentive received from a grant if: (i) PartnerRe is required to restate our financial statements due to material non-compliance with financial reporting requirements; (ii) the restated financial statements would have resulted in a lower incentive award; and (iii) PartnerRe has determined that the material non-compliance causing the restatement was the result of the award recipient’s willful misconduct. The requirement to repay applies to any amounts granted, vested, obtained as the result of exercise or otherwise paid out during the 12 months following the date the financial statements subject to the restatement were filed with the SEC. Under the policy, the Board may also cancel the award recipient’s unvested equity or other unpaid bonus or incentive compensation and may cancel their vested but unexercised SSARs and options. These clawback features are in addition to the clawback provisions required under the Sarbanes-Oxley Act of 2002, which remain in effect. PartnerRe intends to further adjust our clawback policy in light of the Dodd-Frank Wall Street Reform and Consumer Protection Act of 2010 once the SEC adopts final rules implementing those requirements.
Equity Practices
Long-term incentives comprise the greatest portion of the NEO’s target compensation, encouraging executives to perform in a manner consistent with long term shareholder value. As described above under Executive Share Ownership and Retention, the Executive Total Compensation Program prescribes share ownership guidelines, holding restrictions and incentives to encourage the NEOs to hold a stake in the future value of PartnerRe. PartnerRe does not backdate, reprice or grant equity awards retroactively. Repricing of awards would require shareholder approval under our shareholder-approved long-term incentive plan.
210
Anti-Hedging and Anti-Pledging Policy
A prohibition against hedging or pledging of PartnerRe common shares is embedded within our Trading Policy. This prohibits PartnerRe directors, officers and employees from: (i) entering into hedging or monetization transactions related to PartnerRe common shares, including through the use of financial instruments, such as prepaid forwards, equity swaps, collars and exchange funds; and (ii) holding PartnerRe common shares in a margin account or otherwise pledging PartnerRe common shares as collateral for a loan.
Annual Incentive Practices
As described above under Annual Cash Incentive, the annual cash incentive award is capped at a maximum payout of 200% of target to discourage excessive risk taking. Scales are reviewed and set annually prior to the start of each performance year to create challenging but realistic targets to ensure that risk-taking behaviors are not undertaken to achieve unrealistic goals.
Impact of Regulatory and Accounting Requirements
The Compensation Committee is mindful of how regulatory requirements, particularly those described below, affect its decisions.
Internal Revenue Code Section 162(m)
Section 162(m) precludes a public company (with certain exceptions) from taking a tax deduction for compensation in excess of $1 million paid to specified NEOs. The Company believes that the tax deductibility of compensation is an important factor, but should not be the sole factor, in setting executive compensation policy. Accordingly, although the Company generally intends to avoid losing a tax deduction due to Section 162(m), the Company reserves the right, in appropriate circumstances, to pay amounts that are not deductible.
Accounting Standards
The Compensation Committee considers the accounting treatment of compensation elements in determining types and levels of compensation for our NEOs. In determining equity awards in 2014, the Compensation Committee considered the potential dilution impact of the Employee Equity Plan. The Compensation Committee concluded that the associated dilutive impact was appropriate, given the objectives of our Executive Total Compensation Program, competitive compensation practices in the reinsurance industry, our performance, and the value of the awards as tools to motivate and retain employees.
Compensation Committee Report
The Compensation Committee has reviewed and discussed the Compensation Discussion and Analysis required by Item 402(b) of Regulation S-K with management and, based on such review and discussions, the Compensation Committee recommended to the Board that the Compensation Discussion and Analysis be included in this Form 10-K.
Compensation & Management Development Committee
Jean-Paul Montupet, Chairman
Roberto Mendoza
Debra Perry
Rémy Sautter
211
COMPENSATION TABLES
2014 Summary Compensation Table
The table below summarizes the total compensation paid to or earned by each of the NEOs for the fiscal years ended December 31, 2014, 2013 and 2012. The amounts disclosed in column (d) include RSUs and PSUs and the amounts disclosed in column (e) include SSARs. The amounts related to 2014 disclosed in column (f) were determined by the Compensation Committee at its February 17, 2015 meeting and were paid out shortly thereafter. The amounts disclosed in column (g) are further detailed in footnote 5 below.
|
(a)
|
(b)
|
(c)
|
(d)
|
(e)
|
(f)
|
(g)
|
(h)
|
||||||||||||||
|
Name and Principal Position
|
Year
|
Salary
(2)
($)
|
Stock
Awards
(3)
($)
|
Option
Awards
(3)
($)
|
Non-Equity
Incentive Plan
Compensation
(4)
($)
|
All Other
Compensation
(5)
($)
|
Total
($)
|
||||||||||||||
|
Costas Miranthis
President and Chief Executive Officer, PartnerRe Ltd.
(1)
|
2014
|
|
1,000,000
|
|
2,640,096
|
|
683,090
|
|
2,793,750
|
|
1,843,613
|
|
8,960,550
|
|
|||||||
|
2013
|
|
1,000,000
|
|
2,400,015
|
|
529,706
|
|
2,375,000
|
|
567,477
|
|
6,872,198
|
|
||||||||
|
2012
|
|
1,000,000
|
|
482,144
|
|
405,270
|
|
1,953,125
|
|
478,349
|
|
4,318,888
|
|
||||||||
|
William Babcock
Executive Vice President and Chief Financial Officer, PartnerRe Ltd.
|
2014
|
|
595,514
|
|
962,498
|
|
426,933
|
|
1,101,718
|
|
385,448
|
|
3,472,111
|
|
|||||||
|
2013
|
|
578,933
|
|
999,932
|
|
220,714
|
|
1,093,114
|
|
381,460
|
|
3,274,153
|
|
||||||||
|
2012
|
|
557,978
|
|
241,072
|
|
202,635
|
|
871,210
|
|
391,895
|
|
2,264,790
|
|
||||||||
|
Emmanuel Clarke
Chief Executive Officer, PartnerRe Global
(6)
|
2014
|
|
634,794
|
|
1,099,941
|
|
284,622
|
|
1,155,970
|
|
265,396
|
|
3,440,724
|
|
|||||||
|
2013
|
|
630,855
|
|
999,932
|
|
220,714
|
|
1,207,918
|
|
253,498
|
|
3,312,917
|
|
||||||||
|
2012
|
|
621,595
|
|
241,072
|
|
202,635
|
|
1,051,941
|
|
269,806
|
|
2,387,049
|
|
||||||||
|
Laurie Desmet
Executive Vice President and Chief Operations Officer, Group
|
2014
|
|
535,962
|
|
1,099,941
|
|
284,622
|
|
978,397
|
|
182,981
|
|
3,081,904
|
|
|||||||
|
Theodore C. Walker
President and Chief Executive Officer, PartnerRe North America
|
2014
|
|
605,711
|
|
1,099,941
|
|
284,622
|
|
948,869
|
|
123,555
|
|
3,062,698
|
|
|||||||
|
2013
|
|
596,759
|
|
999,932
|
|
220,714
|
|
1,026,039
|
|
124,747
|
|
2,968,191
|
|
||||||||
|
2012
|
|
587,941
|
|
241,072
|
|
202,635
|
|
655,034
|
|
130,656
|
|
1,817,338
|
|
||||||||
|
(1)
|
As described in further detail in Amalgamation of PartnerRe and AXIS and Chief Executive Officer Change above, Mr. Miranthis ceased serving as the President and Chief Executive Officer on January 25, 2015.
|
|
(2)
|
The figures reflect the total salary received by each NEO during the applicable fiscal year. Our NEOs are not entitled to defer their salary in exchange for equity. The 2014 base salary shown above in the Elements of Total Compensation section refers to gross base salary in local currency.
|
|
(3)
|
In accordance with the SEC proxy disclosure rules, columns (d) and (e) reflect the amount of RSUs, PSUs and SSARs granted during the fiscal year by using the aggregate grant date fair value of awards, determined in accordance with FASB Accounting Standards Codification (ASC) Topic 718. For a discussion of the assumptions and methodologies used to value equity awards, see Note 16 to Consolidated Financial Statements in Item 8 of Part II of this report. Equity awards granted in 2014 relate to the 2013 performance year. For details on the equity awards granted in 2015 for the 2014 performance year, see above Form of Equity section.
|
|
(4)
|
The figures reflect the non-equity incentive compensation paid in 2015 for the 2014 performance year. For more details, see above Annual Cash Incentive section.
|
|
(5)
|
The 2014 amount for Mr. Miranthis includes $198,000 in housing allowances, $150,000 for defined contribution plans and non-qualified plans, $96,066 for corporate memberships, $89,428 for dividend equivalents, $42,576 for life insurance premiums (including AD&D and individual disability) and $39,375 for Bermuda payroll tax. The company also paid, on Mr. Miranthis' behalf, Swiss taxes in the amount of $1,214,185, due on his SSARs exercises as it related to his prior work assignment in Switzerland (from 2007 to 2010), which are reimbursable due to contractual obligations for the period of time Mr. Miranthis worked in Switzerland. The remaining $13,983 is for the following items: Bermuda government social insurance contribution, car allowance, club allowance, and spousal attendance at a director and executive officer event. Under his executive employment agreement, Mr. Miranthis is entitled to the use of a company car. The amount for Mr. Miranthis includes insurance and service fees for the company car. When the company car is not being used by him, it is utilized for other business-related purposes. The Chief Executive Officer had access to two private aircrafts in the U.S. until November 2014, from December 2014 this was reduced to one private aircraft in the U.S. and one private aircraft in Europe, of which PartnerRe has a fractional interest. The Chief Executive Officer must approve any use of any of the aircrafts by employees and directors. The Chief Executive Officer is entitled to 30 hours of personal travel on the aircrafts
|
212
and from 2012-2014 Mr. Miranthis did not use the aircrafts for personal use. Personal use of the aircrafts is reviewed annually by the Nominating & Governance Committee.
The 2014 amount for Mr. Babcock includes $204,000 in housing allowances, $65,506 for defined contribution plans and non-qualified plans, $37,256 for dividend equivalents, $30,000 in travel allowance and $7,560 for Bermuda payroll tax. The remaining $41,126 is for the following items: life insurance premiums, tax filing assistance, car allowance, club allowance and spousal attendance at a director and executive officer event.
The Bermuda government imposes a payroll tax of 14% on all employees in the Bermuda office including Messrs. Miranthis and Babcock. The salary level to which this tax applies is currently capped at $750,000. PartnerRe pays the employee payroll tax portion of 5.25% for all Bermuda employees.
The 2014 amount for Mr. Clarke includes $93,009 in housing allowances, $62,043 for defined contribution plans and non-qualified plans, $57,762 in school allowance and $37,454 for dividend equivalents. The remaining $15,128 is for the following items: tax filing assistance, Swiss Social Security and spousal attendance at a director and executive officer event.
The 2014 amount for Ms. Desmet includes company-paid Swiss income tax on RSU vesting in the amount of $83,708 for the period that Ms. Desmet worked on assignment in Switzerland, $58,956 for defined contribution plans and non-qualified plans and $36,661 for dividend equivalents. The remaining $3,656 is for the following items: life insurance premiums, tax filing assistance and spousal attendance at a director and executive officer event.
The 2014 amount for Mr. Walker includes $66,628 for defined contribution plans and non-qualified plans and $42,558 for dividend equivalents. The remaining $14,369 is for the following items: life insurance premiums, tax filing assistance, the company paid portion of the executive health benefit and spousal attendance at a director and executive officer event.
Items listed but not quantified are not individually $25,000 or higher and do not exceed 10% of the total perquisite value received by an NEO.
|
(6)
|
Mr. Clarke’s actual salary and non-equity incentive plan compensation for 2014 were CHF 628,509 and CHF 1,144,525, respectively, for 2013 were CHF 624,609 and CHF 1,195,958, respectively, and for 2012 were CHF 615,441 and CHF 1,041,526, respectively. The applicable exchange rate at December 31, 2014 of US$1.00 to CHF1.01 was used to convert amounts reported.
|
2014 Grants of Plan-Based Awards
This table discloses the target and maximum cash-based non-equity incentive payouts in respect of the 2014 performance year, and equity awards granted in 2014
.
|
|
|
Estimated Future Payouts Under Non-Equity Incentive Plan Awards
(1)
|
Estimated Future Payouts Under Equity Incentive Plan Awards
(2)
|
All Other Stock Awards: Number of Shares of Stock or Units
(3)
(#)
|
All Other Option Awards: Number of Securities Underlying Option
(4)
(#)
|
Exercise or Base Price of Option Awards
(4)
($)
|
Grant Date Fair Value of Stock and Option Awards
(5)
($)
|
||||||||||||||||||||||||||
|
Name
|
Grant
Date
|
Threshold
($)
|
Target
($)
|
Maximum
($)
|
Threshold
(#)
|
Target
(#)
|
Maximum
(#)
|
||||||||||||||||||||||||||
|
Costas Miranthis
|
2/28/2014
|
|
—
|
|
—
|
|
—
|
|
6,675
|
|
13,350
|
|
20,025
|
|
13,350
|
|
—
|
|
98.88
|
|
2,640,096
|
|
|||||||||||
|
2/28/2014
|
|
—
|
|
—
|
|
—
|
|
—
|
|
—
|
|
—
|
|
—
|
|
46,723
|
|
—
|
|
683,090
|
|
||||||||||||
|
—
|
|
—
|
|
1,500,000
|
|
3,000,000
|
|
—
|
|
—
|
|
—
|
|
—
|
|
—
|
|
—
|
|
—
|
|
||||||||||||
|
William Babcock
|
2/28/2014
|
|
—
|
|
—
|
|
—
|
|
2,781
|
|
5,562
|
|
8,343
|
|
4,172
|
|
—
|
|
98.88
|
|
962,498
|
|
|||||||||||
|
2/28/2014
|
|
—
|
|
—
|
|
—
|
|
—
|
|
—
|
|
—
|
|
—
|
|
29,202
|
|
—
|
|
426,933
|
|
||||||||||||
|
—
|
|
—
|
|
599,167
|
|
1,198,334
|
|
—
|
|
—
|
|
—
|
|
—
|
|
—
|
|
—
|
|
—
|
|
||||||||||||
|
Emmanuel Clarke
(6)
|
2/28/2014
|
|
—
|
|
—
|
|
—
|
|
2,781
|
|
5,562
|
|
8,343
|
|
5,562
|
|
—
|
|
98.88
|
|
1,099,941
|
|
|||||||||||
|
2/28/2014
|
|
—
|
|
—
|
|
—
|
|
—
|
|
—
|
|
—
|
|
—
|
|
19,468
|
|
—
|
|
284,622
|
|
||||||||||||
|
—
|
|
—
|
|
635,585
|
|
1,271,170
|
|
—
|
|
—
|
|
—
|
|
—
|
|
—
|
|
—
|
|
—
|
|
||||||||||||
|
Laurie Desmet
|
2/28/2014
|
|
—
|
|
—
|
|
—
|
|
2,781
|
|
5,562
|
|
8,343
|
|
5,562
|
|
—
|
|
98.88
|
|
1,099,941
|
|
|||||||||||
|
2/28/2014
|
|
—
|
|
—
|
|
—
|
|
—
|
|
—
|
|
—
|
|
—
|
|
19,468
|
|
—
|
|
284,622
|
|
||||||||||||
|
—
|
|
—
|
|
537,950
|
|
1,075,900
|
|
—
|
|
—
|
|
—
|
|
—
|
|
—
|
|
—
|
|
—
|
|
||||||||||||
|
Theodore C. Walker
|
2/28/2014
|
|
—
|
|
—
|
|
—
|
|
2,781
|
|
5,562
|
|
8,343
|
|
5,562
|
|
—
|
|
98.88
|
|
1,099,941
|
|
|||||||||||
|
2/28/2014
|
|
—
|
|
—
|
|
—
|
|
—
|
|
—
|
|
—
|
|
—
|
|
19,468
|
|
—
|
|
284,622
|
|
||||||||||||
|
—
|
|
—
|
|
607,957
|
|
1,215,914
|
|
—
|
|
—
|
|
—
|
|
—
|
|
—
|
|
—
|
|
—
|
|
||||||||||||
213
|
(1)
|
As described in further detail above in the Annual Cash Incentive section, all employees of PartnerRe are eligible for an annual cash incentive if predetermined performance goals are achieved. Each employee has a target annual cash incentive that is set as a percentage of base salary. The annual cash incentive payout range is 0% to 200% of target for the CEO and 0% to 200% of target for all other employees.
|
|
(2)
|
PSUs vest in their entirety three years after grant date and are subject to a performance measure, which is described in further detail above in the Equity Performance Adjustment section. Dividend equivalents are accrued quarterly on unvested PSU awards and will be paid in cash when any earned PSUs are delivered.
|
|
(3)
|
RSUs vest in their entirety three years after grant date. Dividend equivalents are paid out quarterly in cash on unvested RSU awards.
|
|
(4)
|
The Company granted SSARs to the NEOs during fiscal year 2014 in respect of the 2013 performance year. SSARs were granted under the Employee Equity Plan with an exercise price equal to the closing price of PartnerRe common shares on the date of grant. SSARs vest 33% on the first anniversary of the date of grant, 33% on the second anniversary and 34% on the third anniversary.
|
|
(5)
|
The value of SSARs on February 28, 2014 is calculated by multiplying the Black-Scholes valuation of $14.62 by the number of underlying SSARs. The value of RSUs and PSUs on February 28, 2014 is calculated by multiplying the fair market value of $98.88 by the number of RSUs and PSUs.
|
|
(6)
|
Mr. Clarke’s threshold, target and maximum annual cash incentive was CHF 0, CHF 629,292 and CHF 1,258,584, respectively. The applicable exchange rate at December 31, 2014 of US$1.00 to CHF1.01 was used to convert amounts reported.
|
The Compensation Committee of the Board reviews and approves the non-equity and equity incentive awards for the NEOs. The grant date of the annual equity awards is the date of the first Compensation Committee of the Board meeting of the year, when awards are approved. SSARs are granted with an exercise price equal to the closing price of PartnerRe common shares on the grant date.
2014 Outstanding Equity Awards at Fiscal Year-End
The following table shows all outstanding equity grants as of December 31, 2014.
|
|
Option Awards
(1)
|
Stock Awards
(2)
|
|||||||||||||||||||||||
|
Name
|
Grant
Date
|
Number of Securities Underlying Unexercised Options (#) Exercisable
|
Number of Securities Underlying Unexercised Options (#) Unexercisable
|
Option
Exercise Price
($)
|
Option
Expiration
Date
|
Number of Shares or Units of Stock That Have Not Vested
(3)
(#)
|
Market Value of Shares or Units of Stock That Have Not Vested
(3)
($)
|
Equity Incentive Plan Awards: Number of Unearned Shares, Units or Other Rights That Have Not Vested
(4)
(#)
|
Equity Incentive Plan Awards: Market or Payout Value of Unearned Shares, Units or Other Rights That Have Not Vested
(4)
($)
|
||||||||||||||||
|
Costas Miranthis
|
2/28/2014
|
—
|
|
46,723*
|
|
98.88
|
|
2/28/2024
|
13,350
|
|
1,523,636
|
|
13,350
|
|
1,523,636
|
|
|||||||||
|
3/1/2013
|
15,538*
|
|
31,547*
|
|
89.20
|
|
3/1/2023
|
13,453
|
|
1,535,391
|
|
13,453
|
|
1,535,391
|
|
||||||||||
|
2/29/2012
|
18,810*
|
|
19,380*
|
|
63.44
|
|
2/28/2022
|
7,600
|
|
867,388
|
|
—
|
|
—
|
|
||||||||||
|
2/17/2011
|
69,099*
|
|
—
|
|
81.94
|
|
2/17/2021
|
—
|
|
—
|
|
—
|
|
—
|
|
||||||||||
|
5/12/2010
|
50,000*
|
|
—
|
|
75.54
|
|
5/12/2020
|
—
|
|
—
|
|
—
|
|
—
|
|
||||||||||
|
2/26/2010
|
18,089*
|
|
—
|
|
79.61
|
|
2/26/2020
|
—
|
|
—
|
|
—
|
|
—
|
|
||||||||||
|
2/27/2008
|
24,097*
|
|
—
|
|
77.92
|
|
2/27/2018
|
—
|
|
—
|
|
—
|
|
—
|
|
||||||||||
|
William Babcock
|
2/28/2014
|
—
|
|
29,202*
|
|
98.88
|
|
2/28/2024
|
4,172
|
|
476,150
|
|
5,562
|
|
634,791
|
|
|||||||||
|
3/1/2013
|
6,474*
|
|
13,145*
|
|
89.20
|
|
3/1/2023
|
5,605
|
|
639,699
|
|
5,605
|
|
639,699
|
|
||||||||||
|
2/29/2012
|
18,810*
|
|
9,690*
|
|
63.44
|
|
2/28/2022
|
3,800
|
|
433,694
|
|
—
|
|
—
|
|
||||||||||
|
2/17/2011
|
14,395*
|
|
—
|
|
81.94
|
|
2/17/2021
|
—
|
|
—
|
|
—
|
|
—
|
|
||||||||||
|
10/1/2010
|
12,500*
|
|
—
|
|
80.45
|
|
10/1/2020
|
—
|
|
—
|
|
—
|
|
—
|
|
||||||||||
|
2/26/2010
|
10,200*
|
|
—
|
|
79.61
|
|
2/26/2020
|
—
|
|
—
|
|
—
|
|
—
|
|
||||||||||
|
2/27/2009
|
2,763*
|
|
—
|
|
61.90
|
|
2/27/2019
|
—
|
|
—
|
|
—
|
|
—
|
|
||||||||||
|
8/4/2008
|
9,375*
|
|
—
|
|
69.50
|
|
8/4/2018
|
—
|
|
—
|
|
—
|
|
—
|
|
||||||||||
214
|
|
Option Awards
(1)
|
Stock Awards
(2)
|
|||||||||||||||||||||||
|
Name
|
Grant
Date
|
Number of Securities Underlying Unexercised Options (#) Exercisable
|
Number of Securities Underlying Unexercised Options (#) Unexercisable
|
Option
Exercise Price
($)
|
Option
Expiration
Date
|
Number of Shares or Units of Stock That Have Not Vested
(3)
(#)
|
Market Value of Shares or Units of Stock That Have Not Vested
(3)
($)
|
Equity Incentive Plan Awards: Number of Unearned Shares, Units or Other Rights That Have Not Vested
(4)
(#)
|
Equity Incentive Plan Awards: Market or Payout Value of Unearned Shares, Units or Other Rights That Have Not Vested
(4)
($)
|
||||||||||||||||
|
Emmanuel Clarke
|
2/28/2014
|
—
|
|
19,468*
|
|
98.88
|
|
2/28/2024
|
5,562
|
|
634,791
|
|
5,562
|
|
634,791
|
|
|||||||||
|
3/1/2013
|
6,474*
|
|
13,145*
|
|
89.20
|
|
3/1/2023
|
5,605
|
|
639,699
|
|
5,605
|
|
639,699
|
|
||||||||||
|
2/29/2012
|
18,810*
|
|
9,690*
|
|
63.44
|
|
2/28/2022
|
3,800
|
|
433,694
|
|
—
|
|
—
|
|
||||||||||
|
2/17/2011
|
19,194*
|
|
—
|
|
81.94
|
|
2/17/2021
|
—
|
|
—
|
|
—
|
|
—
|
|
||||||||||
|
9/1/2010
|
12,500*
|
|
—
|
|
75.80
|
|
9/1/2020
|
—
|
|
—
|
|
—
|
|
—
|
|
||||||||||
|
2/26/2010
|
12,000*
|
|
—
|
|
79.61
|
|
2/26/2020
|
—
|
|
—
|
|
—
|
|
—
|
|
||||||||||
|
2/27/2009
|
2,763*
|
|
—
|
|
61.90
|
|
2/27/2019
|
—
|
|
—
|
|
—
|
|
—
|
|
||||||||||
|
3/31/2008
|
12,000
|
|
—
|
|
75.85
|
|
3/31/2018
|
—
|
|
—
|
|
—
|
|
—
|
|
||||||||||
|
2/23/2007
|
10,500*
|
|
—
|
|
71.35
|
|
2/23/2017
|
—
|
|
—
|
|
—
|
|
—
|
|
||||||||||
|
Laurie Desmet
|
2/28/2014
|
—
|
|
19,468*
|
|
98.88
|
|
2/28/2024
|
5,562
|
|
634,791
|
|
5,562
|
|
634,791
|
|
|||||||||
|
4/1/2013
|
—
|
|
—
|
|
—
|
|
3,000
|
|
342,390
|
|
|||||||||||||||
|
3/1/2013
|
—
|
|
—
|
|
—
|
|
3,083
|
|
351,863
|
|
1,962
|
|
223,923
|
|
|||||||||||
|
7/2/2012
|
6,600*
|
|
3,400*
|
|
75.67
|
|
7/2/2022
|
—
|
|
—
|
|
—
|
|
—
|
|
||||||||||
|
2/29/2012
|
4,950*
|
|
2,550*
|
|
63.44
|
|
2/28/2022
|
1,000
|
|
114,130
|
|
—
|
|
—
|
|
||||||||||
|
1/16/2012
|
—
|
|
—
|
|
—
|
|
1,500
|
|
171,195
|
|
|||||||||||||||
|
2/26/2010
|
10,200*
|
|
—
|
|
79.61
|
|
2/26/2020
|
—
|
|
—
|
|
—
|
|
—
|
|
||||||||||
|
2/27/2009
|
2,763*
|
|
—
|
|
61.90
|
|
2/27/2019
|
—
|
|
—
|
|
—
|
|
—
|
|
||||||||||
|
8/6/2008
|
10,000*
|
|
—
|
|
70.70
|
|
8/6/2018
|
||||||||||||||||||
|
2/27/2008
|
12,000*
|
|
—
|
|
77.92
|
|
2/27/2018
|
—
|
|
—
|
|
—
|
|
—
|
|
||||||||||
|
2/23/2007
|
10,500*
|
|
—
|
|
71.35
|
|
2/23/2017
|
—
|
|
—
|
|
—
|
|
—
|
|
||||||||||
|
2/24/2006
|
2,500*
|
|
—
|
|
61.20
|
|
2/24/2016
|
—
|
|
—
|
|
—
|
|
—
|
|
||||||||||
|
Theodore C. Walker
|
2/28/2014
|
—
|
|
19,468*
|
|
98.88
|
|
2/28/2024
|
5,562
|
|
634,791
|
|
5,562
|
|
634,791
|
|
|||||||||
|
3/1/2013
|
6,474*
|
|
13,145*
|
|
89.20
|
|
3/1/2023
|
5,605
|
|
639,699
|
|
5,605
|
|
639,699
|
|
||||||||||
|
2/29/2012
|
18,810*
|
|
9,690*
|
|
63.44
|
|
2/28/2022
|
3,800
|
|
433,694
|
|
—
|
|
—
|
|
||||||||||
|
2/17/2011
|
69,099*
|
|
—
|
|
81.94
|
|
2/17/2021
|
—
|
|
—
|
|
—
|
|
—
|
|
||||||||||
|
2/26/2010
|
68,089*
|
|
—
|
|
79.61
|
|
2/26/2020
|
—
|
|
—
|
|
—
|
|
—
|
|
||||||||||
|
2/27/2009
|
2,400*
|
|
—
|
|
61.90
|
|
2/27/2019
|
—
|
|
—
|
|
—
|
|
—
|
|
||||||||||
|
1/2/2009
|
10,000*
|
|
—
|
|
70.07
|
|
1/2/2019
|
—
|
|
—
|
|
—
|
|
—
|
|
||||||||||
|
2/27/2008
|
12,000*
|
|
—
|
|
77.92
|
|
2/27/2018
|
—
|
|
—
|
|
—
|
|
—
|
|
||||||||||
|
7/5/2007
|
10,000*
|
|
—
|
|
78.24
|
|
7/5/2017
|
—
|
|
—
|
|
—
|
|
—
|
|
||||||||||
|
2/23/2007
|
10,500*
|
|
—
|
|
71.35
|
|
2/23/2017
|
—
|
|
—
|
|
—
|
|
—
|
|
||||||||||
|
2/24/2006
|
2,500*
|
|
—
|
|
61.20
|
|
2/24/2016
|
—
|
|
—
|
|
—
|
|
—
|
|
||||||||||
|
2/24/2005
|
4,175
|
|
—
|
|
62.70
|
|
2/24/2015
|
—
|
|
—
|
|
—
|
|
—
|
|
||||||||||
*SSARs
|
(1)
|
All grants of options and SSARs vest 33% on the first anniversary of the grant date, 33% on the second anniversary and 34% on the third anniversary.
|
|
(2)
|
The market value of RSUs and PSUs is based on the closing price of $114.13 as at December 31, 2014, the last day of trading in 2014 . All share awards cliff vest in their entirety three years from the date of grant. Dividend equivalents are paid out quarterly in cash for RSUs and accrued quarterly and paid upon settlement for PSUs.
|
|
(3)
|
These are RSU grants.
|
|
(4)
|
These are PSU grants.
|
215
2014 Option Exercises and Shares Vested
The following table shows all options exercised and RSUs that vested in 2014.
|
|
Option Awards
|
Stock Awards
|
||||||||||
|
Name
|
Number of Shares
Acquired on
Exercise
(#)
|
Value Realized on
Exercise
($)
|
Number of Shares
Acquired on
Vesting
(#)
|
Value Realized on
Vesting
(1)
($)
|
||||||||
|
Costas Miranthis
(2)
|
123,017
|
|
4,964,075
|
|
9,213
|
|
932,724
|
|
||||
|
William Babcock
|
—
|
|
—
|
|
5,470
|
|
553,783
|
|
||||
|
Emmanuel Clarke
(3)
|
11,200
|
|
603,746
|
|
6,142
|
|
621,816
|
|
||||
|
Laurie Desmet
|
—
|
|
—
|
|
3,700
|
|
374,588
|
|
||||
|
Theodore C. Walker
|
—
|
|
—
|
|
9,213
|
|
932,724
|
|
||||
|
(1)
|
The value of the common shares is $101.24, which is based on the fair market value on the date of vesting (defined as the closing price on the vest date of February 18, 2014).
|
|
(2)
|
Mr. Miranthis’ aggregate exercise price was $9,078,011.
|
|
(3)
|
Mr. Clarke’s aggregate exercise price was $693,510.
|
2014 Non-Qualified Deferred Compensation
The following table shows the details of the NEOs’ non-qualified deferred compensation plans during 2014. It excludes contributions into 401K plans.
|
Name
|
Executive Contributions in Last Fiscal Year
($)
|
Registrant Contributions in Last Fiscal Year
(1)
($)
|
Aggregate Earnings in Last Fiscal Year
($)
|
Aggregate Balance at Last Fiscal Year-End
($)
|
||||||||
|
Costas Miranthis
|
—
|
|
150,000
|
|
16,475
|
|
1,658,025
|
|
||||
|
William Babcock
|
13,421
|
|
36,906
|
|
4,539
|
|
292,659
|
|
||||
|
Emmanuel Clarke
(2)
|
197,431
|
|
41,362
|
|
14,348
|
|
919,301
|
|
||||
|
Laurie Desmet
|
88,217
|
|
30,356
|
|
217,505
|
|
2,379,087
|
|
||||
|
Theodore C. Walker
|
13,828
|
|
38,028
|
|
91,749
|
|
1,508,152
|
|
||||
|
(1)
|
The contributions are included in the 2014 Summary Compensation Table.
|
|
(2)
|
The contributions made by and on behalf of Mr. Clarke were made in Swiss Francs. The applicable exchange rate at December 31, 2014 of US$1.00 to CHF1.01 was used to convert amounts reported.
|
The following contributions were disclosed in the Summary Compensation Table for the 2013, 2012 and 2011 proxy statements:
|
Name
|
2013
($)
|
2012
($)
|
2011
($)
|
|||||||||
|
Costas Miranthis
|
150,000
|
|
150,000
|
|
150,000
|
|
||||||
|
William Babcock
|
35,633
|
|
33,878
|
|
44,704
|
|
||||||
|
Emmanuel Clarke
|
45,699
|
|
(1)
|
44,499
|
|
(2)
|
42,225
|
|
(3)
|
|||
|
Theodore C. Walker
|
37,594
|
|
37,173
|
|
50,033
|
|
||||||
(1) Based on the exchange rate at December 31, 2013 of US$1.00 to CHF1.12.
(2) Based on the exchange rate at December 31, 2012 of US$1.00 to CHF1.10.
(3) Based on the exchange rate at December 31, 2011 of US$1.00 to CHF1.06.
Mr. Miranthis is eligible for benefits under the Bermuda Non-Registered Pension Plan. Under this plan, PartnerRe contributes 15% of annual base salary each year. Employee voluntary contributions are allowed up to a maximum of 10% of base salary.
216
Employees are vested in employer contributions 50% after one year of service and 100% at the end of two years. Payouts and withdrawals from the employer contributions may be made only upon the employee’s separation from service. Voluntary contributions made by the employee can be withdrawn twice per year at a minimum of $1,000. Payout will commence immediately after the employee ceases to work for PartnerRe, in the form of a lump sum payment.
Mr. Clarke is enrolled in the Swiss Non-Qualified Defined Contribution Plan. Under this plan, employer contributions are equal to 10% of the employee’s insured salary and employee contributions are equal to 5% of the employee’s insured salary. As required under Swiss law, the employee pension fund is required to have a guaranteed rate of return for the compulsory part and all contributions to this plan vest immediately.
Mr. Babcock, Ms. Desmet and Mr. Walker participate in the U.S. Non-Qualified Defined Contribution Plan. Under this plan, eligible participants receive an employer based contribution equal to 3% of base salary as well as an employer match equal to 200% of the first 4% of base salary upon exceeding the 2014 Internal Revenue Code compensation maximum of $255,000. All contributions to the non-qualified plan are vested immediately. Salary and annual incentive deferral elections, as well as distribution payments, are intended to comply with Section 409A of the Internal Revenue Code.
POTENTIAL PAYMENTS UPON TERMINATION OR CHANGE OF CONTROL
General
In this section, the description of termination provisions and change in control benefits, as well as the numbers in the table, are based on NEO employment agreements and a Change in Control Policy (CIC Policy) in effect as of December 31, 2014.
Each NEO employment agreement: (i) sets forth termination scenarios for death, disability, retirement, termination by us for or without cause and termination by the NEO with or without good reason (in accordance with Swiss law, Mr. Clarke’s employment agreement contemplates immediate termination for valid reason), and details what each NEO would receive upon each termination scenario; (ii) contains confidentiality provisions as well as non-competition and non-solicitation covenants which are in effect during and after employment; and (iii) incorporates our CIC Policy.
Changes in NEO Employment Agreements
Unrelated to the Amalgamation described above and prior to any consideration of any transaction that has given rise to the Amalgamation, the Compensation Committee considered amendments to the NEOs' employment agreements (Executive Agreements) to address a gap between the Company's CIC Policy and the Executive Agreements. Pursuant to the CIC Policy, termination must occur “during” the 12-month transition period following the change in control event to constitute a qualifying CIC Policy termination. Consequently, the executives could not provide 12 months notice within the transition period and still have a termination occur “during” the transition period.
In September 2014, the Compensation Committee approved modifications to the Executive Agreements to reflect the intent of the CIC Policy and provide the executives with a period of up to 6 months following a change in control event to assert “Good Reason,” thereby allowing the executives to continue to provide up to a 12 month notice following a change in control event and still be eligible for payments and benefits under the CIC Policy. In addition, it was further approved that the Executive Agreements be clarified to provide that, if the Company delivers a notice to terminate the executive for reasons other than death, disability or cause at any point during the transition period, the executive will be entitled to payments and benefits under the CIC Policy together with a 12 month notice.
Termination Provisions
This section describes for our NEOs the consequences of a termination of employment for retirement, death, disability, NEO voluntary termination without good reason or a termination by PartnerRe for cause, NEO termination for good reason or a Company termination without cause.
Each Executive Agreement contains a provision for notice periods (which can be immediate) under various termination scenarios. In the event that the Company elects to terminate the NEO’s employment before the end of the required notice period, the NEO will receive a payment that reflects the amount of compensation he or she would have earned had he or she remained an employee through the termination date originally specified in the notice of termination (collectively, Payments in lieu of notice). The descriptions under “Voluntary Termination by the NEO without good reason or termination for cause by PartnerRe” and “Termination by the NEO for good reason or by PartnerRe without cause” do not include the Payments in lieu of notice.
217
In the event the Company elects to terminate the NEO's employment before the end of the required notice period, the NEO will receive a payment that reflects the amount of compensation that would have been earned had the NEO remained an employee through the termination date originally specified in the notice of termination.
For 2014, per the amendments to the Executive Agreements and for the purposes of the severance tables below, the Average Incentive will be the greater of the target annual cash incentive for the current year or an amount that is equal to the percentage calculated by multiplying the sum of the percentage that is the payout as percentage of target, as determined by the Compensation Committee, for each of the three fiscal years prior to the fiscal year in which the transaction date occurs, divided by 3 (Average Payout Percentage), and multiplying the Average Payout Percentage by the target annual incentive value.
Termination for retirement
Each Executive Agreement provides that where the NEO’s employment terminates as a result of his or her retirement on or after attaining the retirement age (as defined by the NEO's contract), that the NEO is entitled to (i) all accrued base salary and benefits accrued or earned but unpaid through retirement date; (ii) any Annual Incentive earned in respect of the previous completed fiscal year not paid as of retirement date; (iii) the Average Incentive amount prorated based on the number of days elapsed in the current fiscal year of the date of termination (Pro Rata Average Incentive) and (iv) any other payments or benefits that may be approved by the Board in its sole discretion.
Pursuant to his or her employment agreement, if Mr. Walker’s and Ms. Desmet's employment agreement terminates as a result of his or her retirement before attaining age 65, but subject to having already attained age 55, Mr. Walker and Ms. Desmet is eligible to receive certain medical and dental coverage paid for by the Company.
Under PartnerRe’s Executive Restricted Share Unit Award Agreement, Executive Performance Share Unit Award Agreement and Executive Share-Settled Share Appreciation Right Agreement (collectively, PartnerRe Equity Agreements), any unvested equity awards held by an NEO as of his or her retirement date will continue to vest under the original vesting provisions for up to 36 months following the date of retirement. Any vested equity awards (including those that vest post-retirement) will remain exercisable for the remainder of their original term. The continuation of the vesting and exercise periods following retirement is subject to compliance with post-retirement covenants (non-competition, non-solicitation of employees and non-disclosure of confidential information until the awards have vested, or, in the case of SSARS, until the SSARS have been exercised or expired).
Termination for death
Pursuant to their Executive Agreements, upon an NEO’s death, his or her dependents are entitled to receive within 30 days of the date of termination, in aggregate:
|
•
|
Accrued base salary and benefits and any annual incentive earned in respect of the previous completed fiscal year but not paid as of the date of termination;
|
|
•
|
12 month's base salary;
|
|
•
|
A payment equal to the pro rata portion of the Average Incentive Amount, determined as of the date of termination based on the number of days elapsed in the current fiscal year;
|
|
•
|
A payment equal to the target annual incentive for the fiscal year in which the date of termination occurs;
|
|
•
|
Continued health coverage for 24 months; and
|
|
•
|
Pursuant to the NEO's PartnerRe Equity Agreements, immediate vesting of all
equity awards, with all vested SSARs remaining exercisable for 12 months following the date of termination of employment.
|
|
•
|
Other benefits:
|
|
▪
|
For Mr. Miranthis’ dependents: housing allowance for up to six months; and
|
|
▪
|
For Mr. Clarke’s dependents: housing and school allowance for up to six months.
|
Termination for disability
Pursuant to their employment agreements, each NEO whose employment is terminated for disability is entitled to:
|
•
|
Accrued base salary and benefits and any annual incentive earned in respect of the previous completed fiscal year but not paid as of the date of termination;
|
218
|
•
|
The amount of any difference between the level of long-term disability benefits required to be maintained under PartnerRe’s benefit plans and the amount actually paid in satisfaction of such benefits by insurance or any governmental authority for so long as the NEO remains disabled and therefore entitled to such benefits. Such payment shall be made no less frequently than monthly;
|
|
•
|
A payment equal to the pro rata portion of the Average Incentive Amount determined as of the date of termination based on the number of days elapsed in the current fiscal year as of the date of termination;
|
|
•
|
Immediate vesting of all equity awards, with all vested Options and SSARs remaining exercisable for 12 months following the date of termination of employment; and
|
|
•
|
Health and welfare benefit continuation for so long as the NEO remains entitled to such benefits pursuant to PartnerRe’s benefit plans.
|
|
•
|
Other benefits:
|
|
▪
|
Effective February 2013, in case of long term disability and subject to conditions, Mr. Miranthis would receive on a monthly basis the difference between 70% of his monthly base salary and the level of long-term disability benefits required to be maintained under PartnerRe’s benefit plans for five years at which time a lump sum of $5 million would be paid. The Company has subscribed to an insurance policy to cover such payments. The premium for 2014 was $36,336; and
|
|
▪
|
For Mr. Miranthis: housing allowance for up to six months; and
|
|
▪
|
For Mr. Clarke: housing and school allowance for up to six months.
|
Voluntary Termination by the NEO without good reason or termination for cause by PartnerRe (or valid reason with respect to Mr. Clarke’s employment agreement)
The NEO will only receive a lump sum corresponding to accrued base salary, benefits and annual cash incentive earned in respect of prior completed fiscal year but not paid (Accrued Benefits). All unvested equity awards will be forfeited and vested equity awards will remain exercisable for three months following the date of termination of employment.
Termination by the NEO for good reason or by PartnerRe without cause (without a change in control)
The Chief Executive Officer is entitled to an amount equal to the sum of the following, to be paid or provided on the payment date:
|
•
|
The accrued salary and benefits plus the annual incentive earned in respect of the previous completed fiscal year but not paid as of the date of termination;
|
|
•
|
12 months' base salary at the rate in effect on the date of termination, paid as a lump sum;
|
|
•
|
The pro rata portion of the Average Incentive Amount determined based on the number of days elapsed in the current fiscal year as of the date of termination;
|
|
•
|
The Average Incentive Amount;
|
|
•
|
Any unvested equity awards held at the time of termination will vest in full; and
|
|
•
|
All outstanding PSUs will vest on a pro rata basis on the date of termination.
|
|
•
|
Other benefits:
|
|
▪
|
Housing for up to six months; and
|
|
▪
|
Health and welfare benefit continuation for up to 12 months.
|
The other NEOs are entitled to an amount equal to the sum of the following to be paid or provided on the Payment Date:
|
•
|
The accrued salary and benefits plus the annual incentive earned in respect of the previous completed fiscal year but not paid as of the Date of Termination;
|
|
•
|
12 months' base salary at the rate in effect on the Date of Termination, paid as a lump sum;
|
219
|
•
|
The pro rata portion of the Average Incentive Amount determined based on the number of days elapsed in the current fiscal year as of the Date of Termination;
|
|
•
|
The Average Incentive Amount; and
|
|
•
|
Any unvested equity awards held at the time of termination will vest on a pro rata basis and, if applicable, be paid out.
|
|
•
|
Other benefits: health and welfare benefit continuation for up to 12 months.
|
Change in Control Policy
The CIC Policy has two objectives: to motivate management to act in the best interests of shareholders and to protect compensation and benefits in order to retain key executives during a change in control transaction.
Certain senior employees, including the NEOs, are eligible for severance in the form of cash compensation and benefits if two events occur:
1. There has been a change in control event, as defined in the CIC Policy, within the previous 12 months; and
2. The employee is terminated by PartnerRe for reasons other than death, disability or for cause, or the employee terminates with good reason, within 18 months of the change in control event.
Upon the occurrence of a change in control (as defined in the CIC Policy) and a qualifying termination described above, the Chief Executive Officer is entitled to the following payments and benefits, to be paid within a reasonable period as determined by the Board and/or as is administratively practical:
|
•
|
Three times base salary;
|
|
•
|
A Pro Rata Target Annual Cash Incentive;
|
|
•
|
An amount equal to three times the Average Incentive;
|
|
•
|
Housing for up to 18 months;
|
|
•
|
Health and welfare benefit continuation for three years; and
|
|
•
|
Immediate vesting of all equity awards.
|
|
•
|
All outstanding performance awards shall be paid as if the maximum performance goals established in connection therewith were fully achieved.
|
The other NEOs are entitled to:
|
•
|
Two times base salary;
|
|
•
|
A Pro Rata Target Annual Cash Incentive;
|
|
•
|
An amount equal to two times the Average Incentive;
|
|
•
|
For Mr. Clarke: housing and school allowance for up to 12 months;
|
|
•
|
Health and welfare benefit continuation for two years;
|
|
•
|
If an excise tax is triggered under U.S. Federal tax law, either a reduction of any payments and benefits to the extent required to prevent the excise tax or the payments and benefits as is with no reduction, depending on which result would be better for the NEO; this option could apply to Mr. Babcock, Ms. Desmet and Mr. Walker; and
|
|
•
|
Upon the occurrence of a change in control (as defined in the equity plan) all outstanding equity awards shall immediately vest.
|
|
•
|
All outstanding performance awards shall be paid as if the maximum performance goals established in connection therewith were fully achieved.
|
Potential Payments upon Termination or Change in Control
The following table reflects the amount of compensation that would be paid to each of our NEOs in the event such NEO’s employment is terminated under various scenarios, including disability, death, for cause or without good reason (without a change in control) and in connection with a change of control. The amounts shown have been calculated as if the NEO’s employment had been terminated as of December 31, 2014, and using the closing market price of our common shares on December 31, 2014 ($114.13).
220
The amounts shown in the tables are only estimates of the amounts that would be paid out to the NEOs upon their termination. The actual amounts to be paid out can only be determined at the time of an NEO’s termination.
The table does not include the following items:
|
•
|
All Accrued Benefits;
|
|
•
|
The effects of a retirement since none of our NEOs attained retirement age as of December 31, 2014;
|
|
•
|
Additional payments to the NEOs under PartnerRe’s benefit plans (plans providing, among other things, disability insurance, death insurance and medical insurance) which do not discriminate in scope, terms or operation in favor of the NEOs and are generally available to all employees;
|
|
•
|
The cash payment received by Mr. Miranthis in connection with the Amalgamation, which is described in further detail in Amalgamation of PartnerRe and AXIS and Chief Executive Officer Change above;
|
|
•
|
The effects of a NEO voluntary termination or a termination for cause by PartnerRe since the NEO would only be entitled to Accrued Benefits; and
|
|
•
|
In connection with the termination by the NEO or the termination by PartnerRe without cause, the Payments in lieu of notice since it is assumed that PartnerRe has not exercised its option to terminate the employment sooner.
|
The numbers in the table are based on NEO employment agreements and the CIC Policy in effect as of December 31, 2014.
|
NEOs
|
Compensation Elements
|
Death
($)
|
Disability
($)
|
Termination
without Cause
|
Executive Resignation with Good Reason
|
Change in Control and Either Involuntary Termination or Termination with Good Reason (per CIC)
|
|||||||||||
|
Costas Miranthis
|
Base Salary
|
1,000,000
|
|
—
|
|
1,000,000
|
|
1,000,000
|
|
3,000,000
|
|
||||||
|
|
Target Annual Incentive
(1)
|
1,500,000
|
|
—
|
|
—
|
|
—
|
|
—
|
|
||||||
|
|
Average Incentive (Lump Sum)
(1)
|
1,950,000
|
|
1,950,000
|
|
1,950,000
|
|
1,950,000
|
|
5,850,000
|
|
||||||
|
Average Incentive (Pro Rata)
(2)
|
—
|
|
—
|
|
1,950,000
|
|
1,950,000
|
|
1,950,000
|
|
|||||||
|
|
Other Benefits:
|
|
|
|
|
||||||||||||
|
|
Housing
|
99,000
|
|
99,000
|
|
99,000
|
|
99,000
|
|
297,000
|
|
||||||
|
|
Health and Welfare
(3)
|
60,692
|
|
60,692
|
|
28,229
|
|
28,229
|
|
98,025
|
|
||||||
|
|
Equity Awards:
|
|
|
|
|
||||||||||||
|
|
SSARs
|
2,481,365
|
|
2,481,365
|
|
2,481,365
|
|
2,481,365
|
|
2,481,365
|
|
||||||
|
|
RSUs
|
3,926,414
|
|
3,926,414
|
|
3,926,414
|
|
3,926,414
|
|
3,926,414
|
|
||||||
|
PSUs
|
3,059,026
|
|
3,059,026
|
|
1,361,527
|
|
1,361,527
|
|
4,588,540
|
|
|||||||
|
|
Total
|
14,076,497
|
|
11,576,497
|
|
12,796,535
|
|
12,796,535
|
|
22,191,344
|
|
||||||
|
William Babcock
|
Base Salary
|
599,167
|
|
—
|
|
599,167
|
|
599,167
|
|
1,198,334
|
|
||||||
|
|
Target Annual Incentive
(1)
|
599,167
|
|
—
|
|
—
|
|
—
|
|
—
|
|
||||||
|
|
Average Incentive (Lump Sum)
(1)
|
796,892
|
|
796,892
|
|
796,892
|
|
796,892
|
|
1,593,784
|
|
||||||
|
Average Incentive (Pro Rata)
(2)
|
—
|
|
—
|
|
796,892
|
|
796,892
|
|
796,892
|
|
|||||||
|
|
Other Benefits:
|
|
|
|
|
||||||||||||
|
|
Health and Welfare
(3)
|
53,077
|
|
1,650,770
|
|
24,687
|
|
24,687
|
|
53,077
|
|
||||||
|
|
Equity Awards:
|
|
|
|
|
||||||||||||
|
|
SSARs
|
1,264,221
|
|
1,264,221
|
|
787,865
|
|
787,865
|
|
1,264,221
|
|
||||||
|
|
RSUs
|
1,549,543
|
|
1,549,543
|
|
932,791
|
|
932,791
|
|
1,549,543
|
|
||||||
|
PSUs
|
1,274,490
|
|
1,274,490
|
|
567,258
|
|
567,258
|
|
1,911,735
|
|
|||||||
|
|
Total
|
6,136,557
|
|
6,535,916
|
|
4,505,552
|
|
4,505,552
|
|
8,367,586
|
|
||||||
|
Emmanuel Clarke
(4)
|
Base Salary
|
635,585
|
|
—
|
|
635,585
|
|
635,585
|
|
1,271,170
|
|
||||||
|
|
Target Annual Incentive
(1)
|
635,585
|
|
—
|
|
—
|
|
—
|
|
—
|
|
||||||
|
|
Average Incentive (Lump Sum)
(1)
|
862,277
|
|
862,277
|
|
862,277
|
|
862,277
|
|
1,724,554
|
|
||||||
|
Average Incentive (Pro Rata)
(2)
|
—
|
|
—
|
|
862,277
|
|
862,277
|
|
862,277
|
|
|||||||
|
|
Other Benefits:
|
|
|
|
|
|
|
|
|
||||||||
|
|
Housing
|
46,504
|
|
46,504
|
|
46,504
|
|
46,504
|
|
93,009
|
|
||||||
|
|
School Allowance
|
28,881
|
|
28,881
|
|
28,881
|
|
28,881
|
|
57,762
|
|
||||||
221
|
NEOs
|
Compensation Elements
|
Death
($)
|
Disability
($)
|
Termination
without Cause
|
Executive Resignation with Good Reason
|
Change in Control and Either Involuntary Termination or Termination with Good Reason (per CIC)
|
|||||||||||
|
|
Health and Welfare
(3)
|
14,955
|
|
613,590
|
|
6,956
|
|
6,956
|
|
14,955
|
|
||||||
|
|
Equity Awards:
|
|
|
|
|
|
|
|
|
||||||||
|
|
SSARs
|
1,115,778
|
|
1,115,778
|
|
746,631
|
|
746,631
|
|
1,115,778
|
|
||||||
|
|
RSUs
|
1,708,184
|
|
1,708,184
|
|
976,858
|
|
976,858
|
|
1,708,184
|
|
||||||
|
PSUs
|
1,274,490
|
|
1,274,490
|
|
567,258
|
|
567,258
|
|
1,911,735
|
|
|||||||
|
|
Total
|
6,322,239
|
|
5,649,704
|
|
4,733,227
|
|
4,733,227
|
|
8,759,424
|
|
||||||
|
Laurie Desmet
|
Base Salary
|
537,950
|
|
—
|
|
537,950
|
|
537,950
|
|
1,075,900
|
|
||||||
|
|
Target Annual Incentive
(1)
|
537,950
|
|
—
|
|
—
|
|
—
|
|
—
|
|
||||||
|
|
Average Incentive (Lump Sum)
(1)
|
884,031
|
|
884,031
|
|
884,031
|
|
884,031
|
|
1,768,062
|
|
||||||
|
Average Incentive (Pro Rata)
(2)
|
—
|
|
—
|
|
884,031
|
|
884,031
|
|
884,031
|
|
|||||||
|
|
Other Benefits:
|
|
|
|
|
|
|
|
|
||||||||
|
|
Health and Welfare
(3)
|
41,400
|
|
618,543
|
|
19,256
|
|
19,256
|
|
41,400
|
|
||||||
|
|
Equity Awards:
|
|
|
|
|
|
|
|
|
||||||||
|
|
SSARs
|
556,911
|
|
556,911
|
|
313,517
|
|
313,517
|
|
556,911
|
|
||||||
|
|
RSUs
|
1,614,369
|
|
1,614,369
|
|
867,692
|
|
867,692
|
|
1,614,369
|
|
||||||
|
PSUs
|
858,714
|
|
858,714
|
|
313,173
|
|
313,173
|
|
1,288,071
|
|
|||||||
|
|
Total
|
5,031,325
|
|
4,532,568
|
|
3,819,650
|
|
3,819,650
|
|
7,228,744
|
|
||||||
|
Theodore C. Walker
|
Base Salary
|
607,957
|
|
—
|
|
607,957
|
|
607,957
|
|
1,215,914
|
|
||||||
|
|
Target Annual Incentive
(1)
|
607,957
|
|
—
|
|
—
|
|
—
|
|
—
|
|
||||||
|
|
Average Incentive (Lump Sum)
(1)
|
668,753
|
|
668,753
|
|
668,753
|
|
668,753
|
|
1,337,505
|
|
||||||
|
Average Incentive (Pro Rata)
(2)
|
—
|
|
—
|
|
668,753
|
|
668,753
|
|
668,753
|
|
|||||||
|
|
Other Benefits:
|
|
|
|
|
|
|
|
|
||||||||
|
|
Health and Welfare
(3)
|
62,371
|
|
667,246
|
|
29,010
|
|
29,010
|
|
62,371
|
|
||||||
|
|
Equity Awards:
|
|
|
|
|
|
|
|
|
||||||||
|
|
SSARs
|
1,115,778
|
|
1,115,778
|
|
746,631
|
|
746,631
|
|
1,115,778
|
|
||||||
|
|
RSUs
|
1,708,184
|
|
1,708,184
|
|
976,858
|
|
976,858
|
|
1,708,184
|
|
||||||
|
PSUs
|
1,274,490
|
|
1,274,490
|
|
567,258
|
|
567,258
|
|
1,911,735
|
|
|||||||
|
|
Total
|
6,045,490
|
|
5,434,451
|
|
4,265,220
|
|
4,265,220
|
|
8,020,240
|
|
||||||
|
(1)
|
Includes total amount of target annual cash incentive and/or Average Incentive, as applicable. For details, see Termination Provisions and Change in Control Policy sections above.
|
|
(2)
|
Includes Pro Rata Target Annual Cash Incentive and/or Pro Rata Average Incentive, as applicable. For details, see Termination Provisions and Change in Control Policy sections above.
|
|
(3)
|
For calculation purposes, a 15% increase in premiums each year is assumed until retirement age for disability. For Mr. Miranthis, the benefit continuation period for death and disability is two years from the date of termination. Amounts would be paid to insurance companies.
|
|
(4)
|
The amounts are converted from Swiss Francs using the applicable exchange rate at December 31, 2014 of US$1.00 to CHF1.01.
|
DIRECTOR COMPENSATION
The directors’ compensation guidelines align the interests of directors and shareholders by promoting share ownership while maintaining competitive compensation levels. Compensation for PartnerRe directors reflects both the significant amount of time and the specialized skills required for the directors to fulfill their duties.
222
The total compensation package for director service consists of cash and restricted share units (RSUs). The following table outlines how the directors’ compensation was allocated in 2014:
|
Component
|
Director
Annual Amount
($)
|
Committee Chair Fee
Annual Amount
($)
|
Chairman of the Board
Annual Amount
($)
|
|||
|
Cash
|
80,000
|
15,000
|
160,000
|
|||
|
RSUs
|
150,000
|
—
|
180,000
|
|||
|
Dividend equivalents
|
Per actual dividend rate
declared by the Board
|
—
|
Per actual dividend rate
declared by the Board
|
|||
Equity Components
RSUs are awarded on an annual basis and have a five-year cliff vest with no delivery restrictions. RSUs are granted each year on June 15 or the nearest business day thereafter. All unvested RSUs will be forfeited upon the director’s termination of service, except if the termination is due to a change in control of PartnerRe, death, permanent disability, mandatory retirement from the Board, voluntary termination due to the acceptance of a public service position that would either preclude continued Board service or make such continued service impractical or failure to be re-elected by shareholders to the Board (each regarded as a “permissible reason for departure”). In the event of a permissible reason for departure, RSUs will fully vest upon termination. Dividend equivalents relating to RSU awards are paid each year in one lump sum on June 15 or the nearest business day thereafter. Prior to grant, directors can elect to receive the settlement of their RSUs, at the time of vesting, 100% in shares or 60% in shares and 40% in cash.
Prior to 2013, share option awards with a three-year ratable vest were granted to directors. Effective as of the Annual General Meeting on May 17, 2013, share options are no longer part of the directors’ equity compensation.
Directors’ equity awards are granted under the Amended and Restated Non-Employee Directors Share Plan, effective May 16, 2012. Currently, this plan provides for the issuance of up to 1,200,000 PartnerRe common shares, and prescribes a maximum annual limit for awards pursuant to the plan. Any amendment or termination for which shareholder approval is required will not be effective until such approval has been obtained. Unless terminated earlier, the plan will expire on May 16, 2022.
Elective Equity Incentive
To further align director and shareholder interests, the compensation guidelines allow directors to elect each year to defer 50% or 100% of their cash compensation. To encourage increased share ownership, deferred cash compensation is paid out in RSUs with a PartnerRe match of 25% on the value of the deferred cash compensation. The PartnerRe match is in RSU awards, which have the same terms and conditions as the other RSU grants.
Board Ownership Guidelines
Each director is required to own a minimum number of PartnerRe common shares with an aggregate value equal to four times the director’s annual cash compensation entitlement (not including committee chair fees). For these purposes, RSUs and shares held outright are included in each director’s holdings. All of the directors currently meet the ownership guidelines. Directors who do not meet the ownership guidelines are required to receive at least 50% of their cash compensation in the form of RSUs until the ownership guidelines are met. As with the elective equity incentive, mandatory deferrals receive a PartnerRe match of 25%. The PartnerRe match is paid out in RSU awards, which have the same terms and conditions as the other RSU grants.
Executive Director’s Fees and Directors’ Expenses
Effective as of the Annual General Meeting on May 17, 2013, fees are also paid to directors who serve as a chairman of a committee. In the event that a Director serves on a special committee of the Board (which special committees may be established from time to time), the Director may receive, at the discretion of the Nominating & Governance Committee, compensation in addition to the annual cash and equity compensation described above. The amount and form of such additional compensation shall be determined by the Nominating & Governance Committee and approved by the Board. Mr. Miranthis is not paid any fees or additional compensation for services as a director or as a member of the Risk & Finance Committee. All directors, including Mr. Miranthis, are reimbursed for travel and other related expenses personally incurred while attending Board or committee meetings. All directors, including Mr. Miranthis, are reimbursed for all expenses related to attending education sessions that will help them fulfill their obligations as directors or committee members. Every other year, the partners/spouses of the directors and executive officers are invited to participate in an optional spousal program at the time of a Board meeting which is paid by PartnerRe. Such a program took place in 2014 during the September Board meeting. The total cost of the program was $8,471 (see
223
the All Other Compensation table below for details on the non-executive directors’ related costs). Other than the spousal program, we do not provide any perquisites to our directors
.
2014 Director Compensation Table
The table below summarizes the compensation paid to non-executive directors for the fiscal year ended December 31, 2014.
|
Name
|
Fees Earned or Paid in Cash
($)
|
Stock Awards
(1)
($)
|
All Other Compensation
(2)
($)
|
Total
($)
|
||||
|
Jean-Paul L. Montupet, Chairman
(3)
|
175,000
|
180,000
|
20,566
|
375,566
|
||||
|
Judith Hanratty
(4)
|
80,000
|
150,000
|
17,435
|
247,435
|
||||
|
Jan H. Holsboer
(5)
|
15,000
|
250,000
|
28,043
|
293,043
|
||||
|
Roberto Mendoza
(6)
|
80,000
|
150,000
|
17,435
|
247,435
|
||||
|
Debra Perry
(7)
|
40,000
|
200,000
|
5,682
|
245,682
|
||||
|
Rémy Sautter
(8)
|
—
|
250,000
|
20,067
|
270,067
|
||||
|
Greg Seow
(9)
|
40,000
|
200,000
|
5,682
|
245,682
|
||||
|
Lucio Stanca
(10)
|
30,000
|
56,250
|
5,161
|
91,411
|
||||
|
Kevin M. Twomey
(11)
|
95,000
|
150,000
|
17,350
|
262,350
|
||||
|
Egbert Willam
(12)
|
40,000
|
200,000
|
12,029
|
252,029
|
||||
|
David Zwiener
(13)
|
95,000
|
150,000
|
17,350
|
262,350
|
||||
|
(1)
|
In accordance with the SEC proxy disclosure rules, Stock Awards in the above table reflect the amount of RSUs granted during the fiscal year by using the aggregate grant date fair value of awards, determined in accordance with FASB ASC Topic 718. The grant date fair market value for RSU awards granted in 2014 was $107.08 which was the closing price of PartnerRe common shares on June 16, 2014. The directors received the following awards:
|
|
|
June 16, 2014
|
|
|
Jean-Paul L. Montupet
|
1,681
|
|
|
Judith Hanratty
|
1,401
|
|
|
Jan H. Holsboer
|
2,335
|
|
|
Roberto Mendoza
|
1,401
|
|
|
Debra Perry
|
1,868
|
|
|
Rémy Sautter
|
2,335
|
|
|
Greg Seow
|
1,868
|
|
|
Lucio Stanca
|
—
|
|
|
Kevin M. Twomey
|
1,401
|
|
|
Egbert Willam
|
1,868
|
|
|
David Zwiener
|
1,401
|
|
(2)
All Other Compensation includes the following:
|
Name
|
Other Benefits
($)
|
Dividend Equivalents Paid
($)
|
Total
($)
|
|||
|
Jean-Paul L. Montupet
|
770
|
19,796
|
20,566
|
|||
|
Judith Hanratty
|
—
|
17,435
|
17,435
|
|||
|
Jan H. Holsboer
|
770
|
27,273
|
28,043
|
|||
|
Roberto Mendoza
|
—
|
17,435
|
17,435
|
|||
|
Debra Perry
|
—
|
5,682
|
5,682
|
|||
|
Rémy Sautter
|
770
|
19,297
|
20,067
|
|||
|
Greg Seow
|
—
|
5,682
|
5,682
|
|||
|
Lucio Stanca
|
—
|
5,161
|
5,161
|
|||
|
Kevin M. Twomey
|
770
|
16,580
|
17,350
|
|||
|
Egbert Willam
|
770
|
11,259
|
12,029
|
|||
|
David Zwiener
|
770
|
16,580
|
17,350
|
|||
224
|
(3)
|
Mr. Montupet did not defer any of his director’s fees for 2014. At December 31, 2014, he held 38,627 exercisable options, 4,305 unvested options and 8,227 unvested RSUs. As described in further detail above under the Amalgamation of PartnerRe and AXIS and Chief Executive Officer Change, Mr. Montupet received 866 RSUs on January 26, 2015 in connection with the transaction.
|
|
(4)
|
Ms. Hanratty did not defer any of her director’s fees for 2014. At December 31, 2014, she held 6,683 exercisable options, 3,444 unvested options and 7,206 unvested RSUs.
|
|
(5)
|
Mr. Holsboer elected to defer 100% of his director’s fees, which does not include his Committee Chairman’s fees for 2014 . At December 31, 2014, he held 66,062 exercisable options, 3,444 unvested options and 11,344 unvested RSUs.
|
|
(6)
|
Mr. Mendoza did not defer any of his director’s fees for 2014. At December 31, 2014, he held 23,170 exercisable options, 3,444 unvested options and 7,206 unvested RSUs. As described in further detail above under the Amalgamation of PartnerRe and AXIS and Chief Executive Officer Change, Mr. Mendoza received 866 RSUs on January 26, 2015 in connection with the transaction.
|
|
(7)
|
Ms. Perry was required to receive 50% of her 2014 director’s fees in RSUs due to the ownership guidelines of the Company. At December 31, 2014, she held 3,054 unvested RSUs.
|
|
(8)
|
Mr. Sautter elected to defer 100% of his director’s fees for 2014. At December 31, 2014, he held 17,451 exercisable options, 3,444 unvested options and 8,368 unvested RSUs.
|
|
(9)
|
Mr. Seow was required to receive 50% of his 2014 director’s fees in RSUs due to the ownership guidelines of the Company. At December 31, 2014 he held 3,054 unvested RSUs.
|
|
(10)
|
Mr. Stanca did not defer any of his director’s fees for 2014. At December 31, 2014, he did not have any exercisable options, unvested options or unvested RSUs. He retired in May 2014 at the conclusion of last year's Annual General Meeting and he received his cash compensation at that time.
|
|
(11)
|
Mr. Twomey did not defer any of his director’s fees for 2014. At December 31, 2014, he held 34,765 exercisable options, 3,444 unvested options and 6,887 unvested RSUs.
|
|
(12)
|
Dr. Willam elected to defer 50% of his director’s fees for 2014. At December 31, 2014, he held 3,899 exercisable options, 2,009 unvested options and 5,135 unvested RSUs.
|
|
(13)
|
Mr. Zwiener did not defer any of his director’s fees for 2014. At December 31, 2014, he held 25,621 exercisable options, 3,444 unvested options and 6,887 unvested RSUs. As described in further detail above under the Amalgamation of PartnerRe and AXIS and Chief Executive Officer Change, Mr. Zwiener was appointed as the Company’s interim President and Chief Executive Officer, effective as of January 25, 2015, and as a result of the appointment, he received 12,987 RSUs on January 26, 2015. Mr. Zwiener ceased serving as the chairman of the Audit Committee and a member of the Compensation Committee on that date, but remains a member of the Board.
|
225
|
ITEM 12.
|
SECURITY OWNERSHIP OF CERTAIN BENEFICIAL OWNERS AND MANAGEMENT AND RELATED STOCKHOLDER MATTERS
|
Security Ownership of Certain Beneficial Owners, Management and Directors
The following table sets forth information as of February 17, 2015 with respect to the beneficial ownership of outstanding common shares by (i) our Chief Executive Officer, our Chief Financial Officer, and each of the three remaining most highly compensated executive officers during the 2014 fiscal year (collectively, Named Executive Officers or NEOs); (ii) each of our directors; (iii) all of our executive officers and directors as a group; and (iv) each person known by us to beneficially own 5% or more of the outstanding common shares. As defined by the SEC, a person is deemed to “beneficially own” shares if such person directly or indirectly (i) has or shares the power to vote or dispose of such shares, regardless of whether such person has any pecuniary interest in the shares; or (ii) has the right to acquire the power to vote or dispose of such shares within 60 days, including through the exercise of any option, warrant, or right. Pursuant to Rule 13d-4 under the Securities Exchange Act of 1934, as amended, the statements concerning voting and dispositive power concerning PartnerRe common shares included in the footnotes to this table shall not be construed as confirmation that such persons are the beneficial owners of such common shares.
As of the February 17, 2015, the common shares owned by all directors and executive officers as a group constitute approximately 2.2% of the issued and outstanding common shares, net of treasury shares. The shares detailed in the table below are not necessarily owned by the entity named but may be owned by accounts over which it exercises discretionary investment authority.
|
Name of Beneficial Owner
|
Common
Shares
|
Exercisable
Options/SSARs
|
Amount of
Beneficial
Ownership
|
Percentage
of Outstanding
Common Shares
|
||||||||
|
David Zwiener
|
5,587
|
|
25,621
|
|
31,208
|
|
*
|
|
||||
|
William Babcock
|
7,528
|
|
74,517
|
|
82,045
|
|
*
|
|
||||
|
Emmanuel Clarke
|
19,753
|
|
83,741
|
|
103,494
|
|
*
|
|
||||
|
Laurie Desmet
|
9,957
|
|
57,013
|
|
66,970
|
|
*
|
|
||||
|
Theodore C. Walker
|
6,858
|
|
186,872
|
|
193,730
|
|
*
|
|
||||
|
Costas Miranthis
|
95,261
|
|
195,633
|
|
290,894
|
|
*
|
|
||||
|
Jean-Paul L. Montupet
|
10,166
|
|
38,627
|
|
48,793
|
|
*
|
|
||||
|
Judith Hanratty
|
1,039
|
|
6,683
|
|
7,722
|
|
*
|
|
||||
|
Jan H. Holsboer
|
20,086
|
|
66,062
|
|
86,148
|
|
*
|
|
||||
|
Roberto Mendoza
|
2,194
|
|
23,170
|
|
25,364
|
|
*
|
|
||||
|
Debra Perry
|
—
|
|
—
|
|
—
|
|
*
|
|
||||
|
Rémy Sautter
|
11,149
|
|
17,451
|
|
28,600
|
|
*
|
|
||||
|
Greg Seow
|
—
|
|
—
|
|
—
|
|
*
|
|
||||
|
Kevin M. Twomey
|
2,674
|
|
34,765
|
|
37,439
|
|
*
|
|
||||
|
Egbert Willam
|
—
|
|
3,899
|
|
3,899
|
|
*
|
|
||||
|
All directors and executive officers (15 total)
|
|
|
1,006,306
|
|
2.2
|
%
|
||||||
|
Other Beneficial Owners
(1)
|
|
|
|
|
||||||||
|
The Vanguard Group, Inc.
(2)
100 Vanguard Blvd.
Malvern, PA 19355
|
3,803,996
|
|
—
|
|
3,803,996
|
|
7.8
|
%
|
||||
|
AllianceBernstein L.P.
(3)
1345 Avenue of the Americas
New York, NY 10105
|
3,769,797
|
|
—
|
|
3,769,797
|
|
7.7
|
%
|
||||
* Denotes beneficial ownership of less than 1%
|
(1)
|
The information contained in Other Beneficial Owners is based solely on reports on Schedules 13G/A filed with the SEC; PartnerRe has not independently verified the data.
|
|
(2)
|
As of December 31, 2014, based on a report on Schedule 13G filed on February 11, 2015, The Vanguard Group, Inc. beneficially owns and has sole voting power over 45,694 common shares, sole dispositive power over 3,762,002 common shares and shared dispositive power over 41,994 common shares. Vanguard Fiduciary Trust Company a wholly-owned subsidiary of the Vanguard Group, Inc is the beneficially owner of 28,894 common shares. Vanguard Investments Australia, Ltd., a wholly-owned subsidiary of The Vanguard Group, Inc. is the beneficial owner of 29,900 common shares. The ownership percentage is based on the assumption that The Vanguard Group, Inc. continues to own the number of common shares reflected in the table above as of February 17, 2015.
|
226
|
(3)
|
As of December 31, 2014, based on a report on Schedule 13G filed on February 10, 2015, AllianceBernstein L.P. beneficially owns and has sole voting power over 3,374,724 common shares, sole dispositive power over 3,768,647 common shares and shared dispositive power over 1,150 common shares. The ownership percentage is based on the assumption that AllianceBernstein L.P. continues to own the number of common shares reflected in the table above as of February 17, 2015.
|
There are no arrangements, known to PartnerRe, including any pledge by any person of securities of PartnerRe, the operation of which may at a subsequent date result in a change in control of PartnerRe, other than the Amalgamation Agreement between PartnerRe and AXIS (see Business—General in Item 1 of Part I of this report).
Equity Compensation Plan Information
As part of the Company’s long-term incentive compensation for executives and employees, the Company maintains the PartnerRe Ltd. 2005 Employee Equity Plan. In addition, for directors, the Company maintains the PartnerRe Non-Employee Directors Share Plan. These two plans enable employees and directors to acquire and maintain share ownership, thereby strengthening their commitment to PartnerRe and promoting a commonality of interest among directors, employees and shareholders. The Company finds that the existence of such plans helps to attract and retain key employees and directors. In connection with the Paris Re acquisition, the Company assumed Paris Re’s equity compensation plans.
The following tables set out details of the Company’s equity compensation plans, both active and expired, at
December 31, 2014
. In May 2009, the Company’s shareholders approved a new Employee Share Purchase Plan (ESPP) and authorized the issuance of 600,000 shares under the new ESPP. In May 2011, the Company’s shareholders approved a new Swiss Share Purchase Plan (SSPP) which offers competitive benefits to its employees in Switzerland, and authorized the issuance of 400,000 shares under the new SSPP. All equity compensation plans, with the exception of Paris Re’s equity compensation plans, have been approved by shareholders (see Note 16 to Consolidated Financial Statements in Item 8 of Part II of this report).
|
A
|
B
|
C
|
||||||||
|
Plan Category
|
Number of Securities
To be Issued upon Exercise of Outstanding Options, Warrants and Rights
(1)
|
Weighted-Average Exercise Price of
Outstanding Options, Warrants and Rights
(2)
|
Number of Securities Remaining Available for Future Issuance under
Equity Compensation Plans(Excluding Securities Reflected in Column A)
(1)
|
|||||||
|
Equity compensation plans approved by shareholders
|
2,804,735
|
|
$
|
76.47
|
|
4,700,815
|
|
|||
|
Equity compensation plans not approved by shareholders
|
39,827
|
|
70.95
|
|
—
|
|
||||
|
Total
|
2,844,562
|
|
$
|
76.35
|
|
4,700,815
|
|
|||
Equity Compensation Plans Approved by Shareholders
|
A
|
B
|
C
|
||||||||
|
Plan
|
Number of Securities
To be Issued upon Exercise of Outstanding Options, Warrants and Rights
(1)
|
Weighted-Average Exercise Price
of Outstanding Options, Warrants and Rights
(2)
|
Number of Securities Remaining Available for Future Issuance under Equity Compensation Plans (Excluding Securities Reflected in Column A)
(1)
|
|||||||
|
Employee Incentive Plan
(3)
|
10,175
|
|
$
|
62.70
|
|
—
|
|
|||
|
2005 Employee Equity Plan (Options)
|
1,526,401
|
|
77.85
|
|
2,713,787
|
|
||||
|
2003 Non-Employee Directors Share Plan (Options)
|
335,537
|
|
70.58
|
|
290,290
|
|
||||
|
2003 Non-Employee Directors Share Plan (Restricted Stock Units)
|
53,436
|
|
n/a
|
|
38,654
|
|
||||
|
Employee Equity Plan (Restricted Stock Units and Performance Share Units)
|
879,186
|
|
n/a
|
|
1,270,604
|
|
||||
|
ESPP
|
—
|
|
n/a
|
|
185,079
|
|
||||
|
SSPP
|
—
|
|
n/a
|
|
202,401
|
|
||||
|
Total
|
2,804,735
|
|
$
|
76.47
|
|
4,700,815
|
|
|||
|
(1)
|
Does not include the estimated number of shares to be purchased pursuant to the ESPP or the SSPP during the current purchase period, which commenced on December 1,
2014
and will close on May 31,
2015
.
|
227
|
(2)
|
The weighted average exercise price does not take into account any restricted stock unit awards or the estimated number of shares to be purchased pursuant to the ESPP or SSPP during the current purchase period.
|
|
(3)
|
The Employee Incentive Plan has expired.
|
Equity Compensation Plans Not Approved by Shareholders
|
A
|
B
|
C
|
||||||||
|
Plan
|
Number of Securities
To be Issued upon Exercise of Outstanding Options, Warrants and Rights
|
Weighted-Average Exercise Price
of Outstanding Options, Warrants and Rights
|
Number of Securities Remaining Available for Future Issuance under Equity Compensation Plans(Excluding Securities Reflected in Column A)
|
|||||||
|
Paris Re 2006 Equity Purchase Plan
|
8,667
|
|
$
|
31.54
|
|
—
|
|
|||
|
Paris Re 2006 Equity Incentive Plan
|
18,141
|
|
66.27
|
|
—
|
|
||||
|
Paris Re 2007 Equity Incentive Plan
|
13,019
|
|
103.71
|
|
—
|
|
||||
|
Total
|
39,827
|
|
$
|
70.95
|
|
—
|
|
|||
|
ITEM 13.
|
CERTAIN RELATIONSHIPS AND RELATED TRANSACTIONS, AND DIRECTOR INDEPENDENCE
|
The Board of PartnerRe has adopted a written Related Person Transaction Policy to codify the practice of identifying, approving and reporting related-person transactions. The Nominating & Governance Committee is responsible for applying and enforcing this policy. Annually, each of our directors and executive officers completes a questionnaire identifying his or her board relationships outside of PartnerRe, the results of which are used to compile a list of parties which is subsequently distributed to all relevant business unit heads and support staff personnel. PartnerRe then identifies and quantifies any transaction that may have been consummated with any party on the list. In addition, the questionnaire solicits information about whether the director or executive officer or any member of his or her immediate family has a direct or indirect material interest in any transaction involving PartnerRe. The Nominating & Governance Committee determines whether the transaction should be ratified, terminated and reported. Certain types of transactions do not require approval, ratification and disclosure in this Form 10-K if they fall within permitted exceptions (such as transactions in the ordinary course of business not exceeding $120,000, transactions in which the director’s or executive officer’s or any member of his or her immediate family’s interest derives solely from his or her (i) service as a director of or (ii) ownership of less than 10% of the equity interest in another corporation or organization that is a party to the transaction, or a director or executive officer compensation arrangement already approved by the Compensation Committee). For 2014, the Nominating & Governance Committee determined that there were no related transactions involving our directors, executive officers or any of their immediate family members as well as the entities named in the Other Beneficial Owners section of the Security Ownership of Certain Beneficial Owners, Management and Directors table above.
DIRECTORS INDEPENDENCE
Pursuant to our Corporate Governance Principles and Application Guidelines, a majority of our directors must be independent. The Board, with the recommendation of the Nominating & Governance Committee, has determined that all directors are independent with the exception of Mr. Zwiener who is the interim Chief Executive Officer of PartnerRe. In making its determination, the Board, with the recommendation of the Nominating & Governance Committee, considered the New York Stock Exchange listing standards for independence and reviewed a comprehensive list of board memberships and charitable associations for each director. The Board, with the recommendation of the Nominating & Governance Committee, also considered certain other arrangements described in Note 20 to Consolidated Financial Statements in Item 8 of Part II of this report, which addresses business relationships with other companies in which a director of PartnerRe is a board member, and determined that no director other than Mr. Zwiener, as an executive of PartnerRe, had a direct or indirect material relationship with PartnerRe. In addition, there are no interlocking directorships and none of our independent directors, or any of their immediate family members received any consulting, advisory, legal, or other non-director fees from PartnerRe. If any such relationship were to arise, all relevant material fees would be disclosed and the Board, with the recommendation of the Nominating & Governance Committee, would make a new determination as to independence.
In the normal course of our operations, PartnerRe may purchase or hold securities of companies for which some of our directors also serve as members of the board or non-executive directors. All transactions entered into as part of the investment portfolio are completed on market terms.
228
|
ITEM 14.
|
PRINCIPAL ACCOUNTANT FEES AND SERVICES
|
The Audit Committee is directly responsible for the appointment, retention, compensation and oversight of the work of our public accounting firm Deloitte Ltd. (Deloitte). The Audit Committee also pre-approves the audit services and non-audit services to be provided by Deloitte, including the fees and terms for such services, before Deloitte is engaged to render such services. The Audit Committee may delegate the authority to grant such approval to one or more designated members of the Audit Committee, provided that the decisions of any member to whom authority is delegated shall be presented to the full Audit Committee at its next meeting. The Audit Committee has sole authority to approve all audit fees and terms. All services of Deloitte, the member firm of Deloitte Touche Tohmatsu Limited, and their respective affiliates (collectively, the Deloitte Entities), were pre- approved by the Audit Committee.
During fiscal year 2014, the Audit Committee had nine meetings, including informational calls, to discuss (among other things) the Company's quarterly results. The meetings were conducted to encourage communication among the members of the Audit Committee, management, the internal auditors and Deloitte. The Audit Committee also discussed with Deloitte the overall scope and plans for Deloitte’s audits and the results of such audits. The Audit Committee met with representatives from Deloitte, both with and without management present.
The following table presents fees for professional services rendered by the Deloitte Entities for the years ended December 31, 2014 and 2013 (in U.S. $):
|
2014
|
2013
|
||||||||
|
Audit Fees
(1)
|
$
|
5,455,920
|
|
6,174,078
|
|
(3)
|
|||
|
Audit-Related Fees
(2)
|
74,160
|
|
50,722
|
|
(3)
|
||||
|
Tax Fees
(4)
|
—
|
|
14,897
|
|
|||||
|
All Other Fees
|
—
|
|
—
|
|
|||||
|
Total
|
$
|
5,530,080
|
|
$
|
6,239,697
|
|
|||
|
(1)
|
These are fees for professional services rendered by the Deloitte Entities for the audit of our annual financial statements included in our annual report on Form 10-K, the review of the financial statements included in our quarterly reports on Form 10-Q and audit services provided in connection with statutory and regulatory filings.
|
|
(2)
|
These are fees for audit-related services performed by the Deloitte Entities that are reasonably related to the performance of the audit or review of our financial statements but are not described in item (1) above. These fees include an audit for an employee benefit plan and meetings with a regulator.
|
|
(3)
|
These fees were an estimate at the time of the filing of the Proxy Statement in 2014 and were finalized by the Audit Committee thereafter.
|
|
(4)
|
These are fees attached to tax instructional based training provided by Deloitte Entities on ASC 740: Tax Provisions and SSAP101: Income Taxes.
|
229
|
ITEM 15.
|
EXHIBITS AND FINANCIAL STATEMENT SCHEDULES
|
|
|
|
|
|
Incorporated by Reference
|
|
Filed
Herewith
|
|||||||
|
|
|
Exhibit Description
|
|
Form
|
|
Original
Number
|
|
Date
Filed
|
|
SEC File
Reference
Number
|
|
||
|
(a)
|
|
Exhibits and Financial Statement Schedules
|
|
|
|
|
|
||||||
|
1.
|
|
Financial Statements
|
|
|
|
|
|
||||||
|
|
Included in Part II—See Item 8 of this report
|
|
|
|
|
|
|
X
|
|||||
|
2.
|
|
Financial Statement Schedules
|
|
|
|
|
|
||||||
|
|
Included in Part IV of this report:
|
|
|
|
|
|
|||||||
|
|
Report of Independent Registered Public Accounting Firm on Financial Statement Schedules
|
|
|
|
|
|
|
X
|
|||||
|
|
Schedule I—Consolidated Summary of Investments—at December 31, 2014
|
|
|
|
|
|
|
X
|
|||||
|
|
Schedule II—Condensed Financial Information
of PartnerRe Ltd.
|
|
|
|
|
|
|
X
|
|||||
|
|
Schedule III—Supplementary Insurance Information—for the Years Ended December 31, 2014, 2013 and 2012
|
|
|
|
|
|
|
X
|
|||||
|
|
Schedule IV—Reinsurance—for the Years Ended December 31, 2014, 2013 and 2012
|
|
|
|
|
|
|
X
|
|||||
|
|
Schedule VI—Supplemental Information Concerning Property-Casualty Insurance Operations—for the Years Ended December 31, 2014, 2013 and 2012
|
|
|
|
|
|
|
X
|
|||||
|
3.
|
|
Exhibits
|
|
|
|
|
|
||||||
|
|
Included on page 240
|
|
|
|
|
|
|||||||
230
SIGNATURES
Pursuant to the requirements of Section 13 or 15(d) of the Securities Exchange Act of 1934, the Company has duly caused this report to be signed on its behalf by the undersigned, thereunto duly authorized, on
February 26, 2015
.
|
P
ARTNERRE
L
TD
.
|
||
|
By:
|
|
/
S
/ W
ILLIAM
B
ABCOCK
|
|
Name:
|
|
William Babcock
|
|
Title:
|
|
Executive Vice President & Chief Financial Officer
|
Pursuant to the requirements of the Securities Exchange Act of 1934, this report has been signed below by the following persons on behalf of the Company and in the capacities and on the dates indicated.
|
Signatures
|
|
Title
|
|
Date
|
|
/S/
D
AVID
Z
WIENER
David Zwiener
|
|
Chief Executive Officer and Director (Principal Executive Officer)
|
|
February 26, 2015
|
|
/
S
/ W
ILLIAM
B
ABCOCK
William Babcock
|
|
Executive Vice President & Chief Financial Officer (Principal Financial Officer)
|
|
February 26, 2015
|
|
/
S
/ D
AVID
J. O
UTTRIM
David J. Outtrim
|
|
Chief Accounting Officer (Principal Accounting Officer)
|
|
February 26, 2015
|
|
/
S
/ J
EAN
-
PAUL
M
ONTUPET
Jean-Paul Montupet
|
|
Chairman of the Board of Directors
|
|
February 26, 2015
|
|
/
S
/ J
UDITH
H
ANRATTY
Judith Hanratty, CVO, OBE
|
|
Director
|
|
February 26, 2015
|
|
/
S
/ J
AN
H. H
OLSBOER
Jan H. Holsboer
|
|
Director
|
|
February 26, 2015
|
|
/
S
/ R
OBERTO
M
ENDOZA
Roberto Mendoza
|
|
Director
|
|
February 26, 2015
|
|
/
S
/ D
EBRA
J. P
ERRY
Debra J. Perry
|
|
Director
|
|
February 26, 2015
|
|
/
S
/ R
ÉMY
S
AUTTER
Rémy Sautter
|
|
Director
|
|
February 26, 2015
|
|
/
S
/ G
REG
FH S
EOW
Greg FH Seow
|
|
Director
|
|
February 26, 2015
|
|
/
S
/ K
EVIN
M. T
WOMEY
Kevin M. Twomey
|
|
Director
|
|
February 26, 2015
|
|
/
S
/ E
GBERT
W
ILLAM
Egbert Willam
|
|
Director
|
|
February 26, 2015
|
231
REPORT OF INDEPENDENT REGISTERED PUBLIC ACCOUNTING FIRM
To the Board of Directors and Shareholders of PartnerRe Ltd.
We have audited the consolidated financial statements of PartnerRe Ltd. and subsidiaries (the Company) as of
December 31, 2014
and
2013
, and for each of the three years in the period ended
December 31, 2014
, and the Company’s internal control over financial reporting as of
December 31, 2014
, and have issued our reports thereon dated
February 26, 2015
; such consolidated financial statements and reports are included elsewhere in this Form 10-K and are incorporated herein by reference. Our audits also included the financial statement schedules of the Company listed in Item 15. These financial statement schedules are the responsibility of the Company’s management. Our responsibility is to express an opinion based on our audits. In our opinion, such financial statement schedules, when considered in relation to the basic consolidated financial statements taken as a whole, present fairly, in all material respects, the information set forth therein.
|
/
S
/ D
ELOITTE
L
TD
.
|
|
Deloitte Ltd.
|
|
Hamilton, Bermuda
|
|
February 26, 2015
|
232
SCHEDULE I
PartnerRe Ltd.
Consolidated Summary of Investments
Other Than Investments in Related Parties
at
December 31, 2014
(Expressed in thousands of U.S. dollars)
|
Type of investment
|
Cost
(1) (2)
|
Fair Value
(2)
|
Amount at which shown in
the balance sheet
(2)
|
|||||||||
|
Fixed maturities
|
||||||||||||
|
U.S. government and government sponsored enterprises
|
$
|
2,308,264
|
|
$
|
2,315,422
|
|
$
|
2,315,422
|
|
|||
|
U.S. states, territories and municipalities
|
511,228
|
|
530,603
|
|
530,603
|
|
||||||
|
Non-U.S. sovereign government, supranational and government related
|
1,866,915
|
|
1,976,202
|
|
1,976,202
|
|
||||||
|
Corporate
|
5,363,006
|
|
5,604,160
|
|
5,604,160
|
|
||||||
|
Asset-backed securities
|
1,110,393
|
|
1,131,420
|
|
1,131,420
|
|
||||||
|
Residential mortgage-backed securities
|
2,276,200
|
|
2,306,476
|
|
2,306,476
|
|
||||||
|
Other mortgage-backed securities
|
53,627
|
|
54,462
|
|
54,462
|
|
||||||
|
Fixed maturities
|
13,489,633
|
|
13,918,745
|
|
13,918,745
|
|
||||||
|
Equities
|
||||||||||||
|
Banks, trust and insurance companies
|
134,972
|
|
243,765
|
|
243,765
|
|
||||||
|
Public utilities
|
28,169
|
|
31,748
|
|
31,748
|
|
||||||
|
Industrial, miscellaneous and all other
|
680,288
|
|
781,001
|
|
781,001
|
|
||||||
|
Equities
|
843,429
|
|
1,056,514
|
|
1,056,514
|
|
||||||
|
Short-term investments
|
25,699
|
|
25,678
|
|
25,678
|
|
||||||
|
Other invested assets
(3)
|
111,476
|
|
111,476
|
|
||||||||
|
Total
|
$
|
15,112,413
|
|
$
|
15,112,413
|
|
||||||
|
(1)
|
Original cost of fixed maturities reduced by repayments and adjusted for amortization of premiums or accrual of discounts. Original cost of equity securities.
|
|
(2)
|
Excludes the investment portfolio underlying the funds held – directly managed account. While the net investment income and net realized and unrealized gains and losses inure to the benefit of the Company, the Company does not legally own the investments.
|
|
(3)
|
Other invested assets excludes the Company’s investments accounted for using the cost method of accounting and the equity method of accounting of
$187 million
.
|
233
SCHEDULE II
PartnerRe Ltd.
Condensed Balance Sheets—Parent Company Only
(Expressed in thousands of U.S. dollars, except parenthetical share and per share data)
|
December 31, 2014
|
December 31, 2013
|
|||||||
|
Assets
|
||||||||
|
Cash and cash equivalents
|
$
|
371
|
|
$
|
1,286
|
|
||
|
Investments in subsidiaries
|
8,242,199
|
|
8,170,653
|
|
||||
|
Intercompany loans and balances receivable
|
675,408
|
|
730,450
|
|
||||
|
Other
|
2,476
|
|
3,961
|
|
||||
|
Total assets
|
$
|
8,920,454
|
|
$
|
8,906,350
|
|
||
|
Liabilities
|
||||||||
|
Intercompany loans and balances payable
(1)
|
$
|
1,845,690
|
|
$
|
2,175,401
|
|
||
|
Accounts payable, accrued expenses and other
|
25,854
|
|
21,417
|
|
||||
|
Total liabilities
|
1,871,544
|
|
2,196,818
|
|
||||
|
Shareholders’ Equity
|
||||||||
|
Common shares (par value $1.00; issued: 2014, 87,237,220 shares; 2013, 86,657,045 shares)
|
87,237
|
|
86,657
|
|
||||
|
Preferred shares (par value $1.00; issued and outstanding: 2014 and 2013: 34,150,000 shares; aggregate liquidation value: 2014 and 2013: $853,750)
|
34,150
|
|
34,150
|
|
||||
|
Additional paid-in capital
|
3,949,665
|
|
3,901,627
|
|
||||
|
Accumulated other comprehensive loss
|
(34,083
|
)
|
(12,238
|
)
|
||||
|
Retained earnings
|
6,270,811
|
|
5,406,797
|
|
||||
|
Common shares held in treasury, at cost (2014, 39,400,936
shares; 2013, 34,213,611 shares)
|
(3,258,870
|
)
|
(2,707,461
|
)
|
||||
|
Total shareholders’ equity attributable to PartnerRe Ltd.
|
7,048,910
|
|
6,709,532
|
|
||||
|
Total liabilities and shareholders’ equity attributable to PartnerRe Ltd.
|
$
|
8,920,454
|
|
$
|
8,906,350
|
|
||
|
(1)
|
The parent has fully and unconditionally guaranteed on a subordinated basis all obligations of PartnerRe Finance II Inc., an indirect
100%
owned finance subsidiary of the parent, related to the remaining
$63.4 million
aggregate principal amount of
6.440%
Fixed-to-Floating Rate Junior Subordinated Capital Efficient Notes (CENts). The parent’s obligations under this guarantee are unsecured and rank junior in priority of payments to the parent’s Senior Notes.
|
The parent has fully and unconditionally guaranteed all obligations of PartnerRe Finance A and PartnerRe Finance B, indirect
100%
owned finance subsidiaries of the parent, related to the issuance of
$250 million
aggregate principal amount of
6.875%
Senior Notes and
$500 million
aggregate principal amount of
5.500%
Senior Notes. The parent’s obligations under these guarantees are senior and unsecured and rank equally with all other senior unsecured indebtedness of the parent.
234
SCHEDULE II
PartnerRe Ltd.
Condensed Statements of Operations and Comprehensive Income—Parent Company Only
(Expressed in thousands of U.S. dollars)
|
For the year ended December 31, 2014
|
For the year ended December 31, 2013
|
For the year ended December 31, 2012
|
||||||||||
|
Revenues
|
||||||||||||
|
Net investment income
|
$
|
—
|
|
$
|
18
|
|
$
|
1,152
|
|
|||
|
Interest income on intercompany loans
|
14,669
|
|
11,039
|
|
—
|
|
||||||
|
Net realized and unrealized investment gains
|
—
|
|
—
|
|
2,208
|
|
||||||
|
Total revenues
|
14,669
|
|
11,057
|
|
3,360
|
|
||||||
|
Expenses
|
||||||||||||
|
Other expenses
|
58,076
|
|
91,800
|
|
82,137
|
|
||||||
|
Interest expense on intercompany loans
|
1,696
|
|
1,867
|
|
730
|
|
||||||
|
Net foreign exchange (gains) losses
|
(3,192
|
)
|
9,895
|
|
1,085
|
|
||||||
|
Total expenses
|
56,580
|
|
103,562
|
|
83,952
|
|
||||||
|
Loss before equity in net income of subsidiaries
|
(41,911
|
)
|
(92,505
|
)
|
(80,592
|
)
|
||||||
|
Equity in net income of subsidiaries
|
1,096,885
|
|
756,513
|
|
1,215,106
|
|
||||||
|
Net income attributable to PartnerRe Ltd.
|
1,054,974
|
|
664,008
|
|
1,134,514
|
|
||||||
|
Preferred dividends
|
56,735
|
|
57,861
|
|
61,622
|
|
||||||
|
Loss on redemption of preferred shares
|
—
|
|
9,135
|
|
—
|
|
||||||
|
Net income attributable to PartnerRe Ltd. common shareholders
|
$
|
998,239
|
|
$
|
597,012
|
|
$
|
1,072,892
|
|
|||
|
Comprehensive income
|
||||||||||||
|
Net income attributable to PartnerRe Ltd.
|
$
|
1,054,974
|
|
$
|
664,008
|
|
$
|
1,134,514
|
|
|||
|
Total other comprehensive (loss) income, net of tax
|
(21,845
|
)
|
(22,835
|
)
|
23,241
|
|
||||||
|
Comprehensive income attributable to PartnerRe Ltd.
|
$
|
1,033,129
|
|
$
|
641,173
|
|
$
|
1,157,755
|
|
|||
235
SCHEDULE II
PartnerRe Ltd.
Condensed Statements of Cash Flows—Parent Company Only
(Expressed in thousands of U.S. dollars)
|
For the year ended December 31, 2014
|
For the year ended December 31, 2013
|
For the year ended December 31, 2012
|
||||||||||
|
Cash flows from operating activities
|
||||||||||||
|
Net income attributable to PartnerRe Ltd.
|
$
|
1,054,974
|
|
$
|
664,008
|
|
$
|
1,134,514
|
|
|||
|
Adjustments to reconcile net income to net cash used in operating activities:
|
||||||||||||
|
Equity in net income of subsidiaries
|
(1,096,885
|
)
|
(756,513
|
)
|
(1,215,106
|
)
|
||||||
|
Other, net
|
33,598
|
|
27,397
|
|
30,573
|
|
||||||
|
Net cash used in operating activities
|
(8,313
|
)
|
(65,108
|
)
|
(50,019
|
)
|
||||||
|
Cash flows from investing activities
|
||||||||||||
|
Advances to/from subsidiaries, net
|
(12,635
|
)
|
666,444
|
|
190,017
|
|
||||||
|
Net issue of intercompany loans receivable and payable
|
2,500
|
|
14,473
|
|
132,797
|
|
||||||
|
Sales and redemptions of fixed maturities
|
—
|
|
—
|
|
184,516
|
|
||||||
|
Sales and redemptions of short-term investments
|
—
|
|
—
|
|
8,543
|
|
||||||
|
Dividends received from subsidiaries
|
—
|
|
—
|
|
200,000
|
|
||||||
|
Other, net
|
60
|
|
196
|
|
775
|
|
||||||
|
Net cash (used in) provided by investing activities
|
(10,075
|
)
|
681,113
|
|
716,648
|
|
||||||
|
Cash flows from financing activities
|
||||||||||||
|
Cash dividends paid to common and preferred shareholders
(2)
|
—
|
|
(103,311
|
)
|
(217,615
|
)
|
||||||
|
Repurchase of common shares
(2)
|
—
|
|
(546,617
|
)
|
(504,991
|
)
|
||||||
|
Issuance of common shares, net of taxes paid
|
16,785
|
|
51,111
|
|
34,323
|
|
||||||
|
Net proceeds from issuance of preferred shares
|
—
|
|
241,265
|
|
—
|
|
||||||
|
Redemption of preferred shares
|
—
|
|
(290,000
|
)
|
—
|
|
||||||
|
Net cash provided by (used in) financing activities
|
16,785
|
|
(647,552
|
)
|
(688,283
|
)
|
||||||
|
Effect of foreign exchange rate changes on cash
|
688
|
|
2,461
|
|
297
|
|
||||||
|
Decrease in cash and cash equivalents
|
(915
|
)
|
(29,086
|
)
|
(21,357
|
)
|
||||||
|
Cash and cash equivalents—beginning of year
|
1,286
|
|
30,372
|
|
51,729
|
|
||||||
|
Cash and cash equivalents—end of year
|
$
|
371
|
|
$
|
1,286
|
|
$
|
30,372
|
|
|||
|
Supplemental cash flow information:
|
||||||||||||
|
Interest paid
|
$
|
—
|
|
$
|
1,528
|
|
$
|
579
|
|
|||
|
(1)
|
The parent received non-cash dividends from its subsidiaries of
$833 million
,
$1,100 million
and
$200 million
for the years ended
December 31, 2014
,
2013
and
2012
, respectively, which have been excluded from the Condensed Statements of Cash Flows—Parent Company Only.
|
|
(2)
|
During the years ended
December 31, 2014
and
2013
, dividends paid to common and preferred shareholders of
$191 million
and
$97 million
, respectively, and the repurchase of common shares of
$547 million
and
$169 million
, respectively, were paid by a subsidiary on behalf of the parent and have been excluded from the Condensed Statements of Cash Flows—Parent Company Only.
|
236
SCHEDULE III
PartnerRe Ltd.
Supplementary Insurance Information
For the years ended
December 31, 2014
,
2013
and
2012
(Expressed in thousands of U.S. dollars)
|
Deferred Policy Acquisition Costs
|
Gross Reserves
|
Unearned Premiums
|
Other Benefits Payable
|
Premium Revenue
|
Net Investment Income
(1)
|
Losses Incurred
|
Amortization of DAC
|
Other Expenses
(2)
|
Premiums Written
|
|||||||||||||||||||||||||||||||
|
2014
|
||||||||||||||||||||||||||||||||||||||||
|
Non-life
|
$
|
463,958
|
|
$
|
9,745,806
|
|
$
|
1,731,212
|
|
$
|
—
|
|
$
|
4,387,406
|
|
$ N/A
|
$
|
2,462,568
|
|
$
|
1,065,117
|
|
$
|
252,322
|
|
$
|
4,500,214
|
|
||||||||||||
|
Life and Health
|
197,228
|
|
—
|
|
19,395
|
|
2,050,107
|
|
1,221,751
|
|
60,369
|
|
1,000,202
|
|
148,689
|
|
67,811
|
|
265,693
|
|
||||||||||||||||||||
|
Corporate and Other
|
—
|
|
—
|
|
—
|
|
—
|
|
38
|
|
419,327
|
|
—
|
|
16
|
|
129,555
|
|
—
|
|
||||||||||||||||||||
|
Total
|
$
|
661,186
|
|
$
|
9,745,806
|
|
$
|
1,750,607
|
|
$
|
2,050,107
|
|
$
|
5,609,195
|
|
$
|
479,696
|
|
$
|
3,462,770
|
|
$
|
1,213,822
|
|
$
|
449,688
|
|
$
|
4,765,907
|
|
||||||||||
|
2013
|
||||||||||||||||||||||||||||||||||||||||
|
Non-life
|
$
|
434,109
|
|
$
|
10,646,318
|
|
$
|
1,699,393
|
|
$
|
—
|
|
$
|
4,234,850
|
|
$ N/A
|
$
|
2,399,867
|
|
$
|
952,570
|
|
$
|
258,997
|
|
$
|
4,426,719
|
|
||||||||||||
|
Life and Health
|
210,841
|
|
—
|
|
24,337
|
|
1,974,133
|
|
957,146
|
|
60,897
|
|
760,552
|
|
124,631
|
|
71,092
|
|
123,936
|
|
||||||||||||||||||||
|
Corporate and Other
|
2
|
|
—
|
|
37
|
|
—
|
|
6,214
|
|
423,470
|
|
(2,611
|
)
|
427
|
|
170,377
|
|
6,110
|
|
||||||||||||||||||||
|
Total
|
$
|
644,952
|
|
$
|
10,646,318
|
|
$
|
1,723,767
|
|
$
|
1,974,133
|
|
$
|
5,198,210
|
|
$
|
484,367
|
|
$
|
3,157,808
|
|
$
|
1,077,628
|
|
$
|
500,466
|
|
$
|
4,556,765
|
|
||||||||||
|
2012
|
||||||||||||||||||||||||||||||||||||||||
|
Non-life
|
$
|
363,174
|
|
$
|
10,709,371
|
|
$
|
1,517,217
|
|
$
|
—
|
|
$
|
3,684,069
|
|
$ N/A
|
$
|
2,155,147
|
|
$
|
820,464
|
|
$
|
257,256
|
|
$
|
3,768,111
|
|
||||||||||||
|
Life and Health
|
205,203
|
|
—
|
|
17,267
|
|
1,813,244
|
|
794,598
|
|
64,223
|
|
646,981
|
|
115,887
|
|
52,352
|
|
N/A
|
|
||||||||||||||||||||
|
Corporate and Other
|
14
|
|
—
|
|
141
|
|
—
|
|
7,272
|
|
507,115
|
|
2,482
|
|
558
|
|
101,766
|
|
6,363
|
|
||||||||||||||||||||
|
Total
|
$
|
568,391
|
|
$
|
10,709,371
|
|
$
|
1,534,625
|
|
$
|
1,813,244
|
|
$
|
4,485,939
|
|
$
|
571,338
|
|
$
|
2,804,610
|
|
$
|
936,909
|
|
$
|
411,374
|
|
$
|
3,774,474
|
|
||||||||||
|
(1)
|
Because the Company does not manage its assets by segment, net investment income is not allocated to the Non-life segment of the reinsurance operations. However, because of the interest-sensitive nature of some of the Company’s Life products, net investment income is considered in Management’s assessment of the profitability of the Life and Health segment.
|
|
(2)
|
Other expenses are a component of underwriting result for the Non-life and Life and Health segments. Other expenses included in Corporate and Other represent corporate expenses and other expenses related to the Company’s principal finance transactions, insurance-linked securities and strategic investments.
|
237
SCHEDULE IV
PartnerRe Ltd.
Reinsurance
For the years ended
December 31, 2014
,
2013
and
2012
(Expressed in thousands of U.S. dollars)
|
Gross amount
|
Ceded to other companies
|
Assumed from other companies
|
Net amount
|
Percentage of amount assumed to net
|
|||||||||||||||
|
2014
|
|||||||||||||||||||
|
Life reinsurance in force
|
$
|
—
|
|
$
|
2,322,845
|
|
$
|
198,284,805
|
|
$
|
195,961,960
|
|
101
|
%
|
|||||
|
Premiums earned
|
|||||||||||||||||||
|
Life
|
—
|
|
5,031
|
|
943,054
|
|
938,023
|
|
101
|
%
|
|||||||||
|
Accident and health
|
66,090
|
|
40,065
|
|
257,703
|
|
283,728
|
|
91
|
%
|
|||||||||
|
Property and casualty
|
143,389
|
|
170,107
|
|
4,414,162
|
|
4,387,444
|
|
101
|
%
|
|||||||||
|
Total premiums
|
$
|
209,479
|
|
$
|
215,203
|
|
$
|
5,614,919
|
|
$
|
5,609,195
|
|
100
|
%
|
|||||
|
2013
|
|||||||||||||||||||
|
Life reinsurance in force
|
$
|
—
|
|
$
|
1,629,920
|
|
$
|
211,247,212
|
|
$
|
209,617,292
|
|
101
|
%
|
|||||
|
Premiums earned
|
|||||||||||||||||||
|
Life
|
—
|
|
5,000
|
|
821,737
|
|
816,737
|
|
101
|
%
|
|||||||||
|
Accident and health
|
—
|
|
2,912
|
|
143,321
|
|
140,409
|
|
102
|
%
|
|||||||||
|
Property and casualty
|
93,091
|
|
167,744
|
|
4,315,717
|
|
4,241,064
|
|
102
|
%
|
|||||||||
|
Total premiums
|
$
|
93,091
|
|
$
|
175,656
|
|
$
|
5,280,775
|
|
$
|
5,198,210
|
|
102
|
%
|
|||||
|
2012
|
|||||||||||||||||||
|
Life reinsurance in force
|
$
|
—
|
|
$
|
1,782,549
|
|
$
|
214,006,823
|
|
$
|
212,224,274
|
|
101
|
%
|
|||||
|
Premiums earned
|
|||||||||||||||||||
|
Life
|
—
|
|
5,400
|
|
780,279
|
|
774,879
|
|
101
|
%
|
|||||||||
|
Accident and health
|
—
|
|
—
|
|
19,719
|
|
19,719
|
|
100
|
%
|
|||||||||
|
Property and casualty
|
84,815
|
|
149,610
|
|
3,756,136
|
|
3,691,341
|
|
102
|
%
|
|||||||||
|
Total premiums
|
$
|
84,815
|
|
$
|
155,010
|
|
$
|
4,556,134
|
|
$
|
4,485,939
|
|
102
|
%
|
|||||
238
SCHEDULE VI
PartnerRe Ltd.
Supplemental Information
Concerning Property-Casualty Insurance Operations
For the years ended
December 31, 2014
,
2013
and
2012
(Expressed in thousands of U.S. dollars)
|
Affiliation with Registrant
|
Deferred Policy Acquisition Costs
|
Liability for Unpaid Losses and Loss Expenses
|
Unearned Premiums
|
Premiums Earned
|
Losses and Loss Expenses Incurred
|
Amortization of Deferred Policy Acquisition Costs
|
Paid Losses and Loss Expenses
|
Premiums Written
|
||||||||||||||||||||||||
|
Consolidated subsidiaries
|
||||||||||||||||||||||||||||||||
|
2014
|
$
|
463,958
|
|
$
|
9,745,806
|
|
$
|
1,731,212
|
|
$
|
4,387,444
|
|
$
|
2,462,568
|
|
$
|
1,065,133
|
|
$
|
2,798,549
|
|
$
|
4,500,214
|
|
||||||||
|
2013
|
434,111
|
|
10,646,318
|
|
1,699,430
|
|
4,241,064
|
|
2,397,256
|
|
952,997
|
|
2,401,559
|
|
4,432,829
|
|
||||||||||||||||
|
2012
|
363,188
|
|
10,709,371
|
|
1,517,358
|
|
3,691,341
|
|
2,157,629
|
|
821,022
|
|
2,705,062
|
|
3,774,474
|
|
||||||||||||||||
239
EXHIBIT INDEX
|
|
|
Incorporated by Reference
|
|
|||||||||
|
Exhibit
Number
|
Exhibit Description
|
Form
|
Original
Number
|
Date Filed
|
SEC File
Reference
Number
|
Filed
Herewith
|
||||||
|
3.1
|
Amended Memorandum of Association.
|
F-3
|
3.1
|
June 20, 1997
|
333-7094
|
|||||||
|
3.2
|
Amended and Restated Bye-laws of PartnerRe Ltd., dated as of May 22, 2009.
|
8-K
|
3.1
|
May 28, 2009
|
001-14536
9856453
|
|||||||
|
4.1
|
Specimen Common Share Certificate.
|
10-Q
|
4.1
|
December 10, 1993
|
0-2253
|
|||||||
|
4.2
|
Specimen Share Certificate for the 6.50% Series D Cumulative Redeemable Preferred Shares.
|
8-K
|
99.3
|
November 12, 2004
|
001-14536
41136085
|
|||||||
|
4.2.2
|
Certificate of Designation, Preferences and Rights of the Company’s 6.50% Series D Cumulative Redeemable Preferred Shares.
|
8-K
|
99.4
|
November 12, 2004
|
001-14536
41136085
|
|||||||
|
4.3
|
Specimen Share Certificate for the 7.25% Series E Cumulative Redeemable Preferred Shares.
|
8-K
|
4.1
|
June 15, 2011
|
001-14536
11912259
|
|||||||
|
4.3.1
|
Certificate of Designation, Preferences and Rights of the Company’s 7.25% Series E Cumulative Redeemable Preferred Shares.
|
8-K
|
3.1
|
June 15, 2011
|
001-14536
11912259
|
|||||||
|
4.4
|
Specimen Share Certificate for the 5.875% Series F Non-Cumulative Redeemable Preferred Shares.
|
8-K
|
4.1
|
February 14, 2013
|
001-14536
13606991
|
|||||||
|
4.4.1
|
Certificate of Designation, Preferences and Rights of the Company’s 5.875% Series F Non-Cumulative Redeemable Preferred Shares.
|
8-K
|
3.1
|
February 14, 2013
|
001-14536
13606991
|
|||||||
|
4.5
|
Junior Subordinated Indenture dated November 2, 2006 among PartnerRe Finance II Inc., the Company, J.P. Morgan Securities Inc., Lehman Brothers Inc. and the other underwriters named therein.
|
8-K
|
4.1
|
November 7, 2006
|
001-14536
61194484
|
|||||||
|
4.5.1
|
First Supplemental Junior Subordinated Indenture (including the form of the CENts) among PartnerRe Finance II Inc., the Company and The Bank of New York.
|
8-K
|
4.2
|
November 7, 2006
|
001-14536
61194484
|
|||||||
|
4.6
|
Junior Subordinated Debt Securities Guarantee Agreement dated November 7, 2006 between the Company and The Bank of New York.
|
8-K
|
4.3
|
November 7, 2006
|
001-14536
61194484
|
|||||||
|
4.6.1
|
First Supplemental Junior Subordinated Debt Securities Guarantee Agreement dated November 7, 2006 between the Company and The Bank of New York.
|
8-K
|
4.4
|
November 7, 2006
|
001-14536
61194484 |
|||||||
|
4.7
|
Indenture dated May 27, 2008 among PartnerRe Finance A LLC, PartnerRe Ltd. and The Bank of New York.
|
8-K
|
4.1
|
May 27, 2008
|
001-14536
8860178 |
|||||||
|
4.7.1
|
First Supplemental Indenture dated May 27, 2008 among PartnerRe Finance A LLC, PartnerRe Ltd. and The Bank of New York.
|
8-K
|
4.2
|
May 27, 2008
|
001-14536
8860178 |
|||||||
|
4.8
|
Debt Securities Guarantee Agreement dated May 27, 2008 between PartnerRe Ltd. and The Bank of New York.
|
8-K
|
4.3
|
May 27, 2008
|
001-14356
8860178 |
|||||||
|
4.8.1
|
First Supplemental Debt Securities Guarantee Agreement dated May 27, 2008 between PartnerRe Ltd. and The Bank of New York.
|
8-K
|
4.4
|
May 27, 2008
|
001-14536
8860178 |
|||||||
|
4.9
|
Indenture dated March 15, 2010 among PartnerRe Finance B LLC, PartnerRe Ltd. and The Bank of New York Mellon.
|
8-K
|
4.1
|
March 15, 2010
|
001-14536
10681438 |
|||||||
|
4.9.1
|
First Supplemental Indenture dated March 15, 2010 among PartnerRe Finance B LLC, PartnerRe Ltd. and The Bank of New York Mellon.
|
8-K
|
4.2
|
March 15, 2010
|
001-14536
10681438 |
|||||||
240
|
|
|
Incorporated by Reference
|
|
|||||||||
|
Exhibit
Number
|
Exhibit Description
|
Form
|
Original
Number
|
Date Filed
|
SEC File
Reference
Number
|
Filed
Herewith
|
||||||
|
4.10
|
Senior Debt Securities Guarantee Agreement dated March 15, 2010 between PartnerRe Ltd. and The Bank of New York Mellon.
|
8-K
|
4.3
|
March 15, 2010
|
001-14536
10681438 |
|||||||
|
4.10.1
|
First Supplemental Senior Debt Securities Guarantee Agreement dated March 15, 2010 between PartnerRe Ltd. and The Bank of New York Mellon.
|
8-K
|
4.4
|
March 15, 2010
|
001-14536
10681438 |
|||||||
|
10.1
|
Credit Agreement among PartnerRe Ltd., the Designated Subsidiary Borrowers, the Lenders and JPMorgan Chase Bank, N.A. dated July 16, 2010.
|
8-K
|
10.1
|
July 21, 2010
|
001-14536
10962355 |
|||||||
|
10.2
|
Capital Management Maintenance Agreement, effective February 20, 2004, between PartnerRe Ltd., PartnerRe U.S. Corporation and Partner Reinsurance Company of the U.S.
|
10-Q
|
10.2
|
August 6, 2004
|
001-14536
4957898 |
|||||||
|
10.3
|
Capital Management Maintenance Agreement, effective July 27, 2005, between PartnerRe Ltd., PartnerRe Holdings Ireland Limited and PartnerRe Ireland Insurance Limited.
|
8-K
|
10.1
|
August 1, 2005
|
001-14536
5988483 |
|||||||
|
10.4
|
Capital Management Maintenance Agreement, effective January 1, 2008, between PartnerRe Ltd. and Partner Reinsurance Europe Limited.
|
10-K
|
10.5.2
|
February 29, 2008
|
001-14536
8653416 |
|||||||
|
10.5
|
PartnerRe Ltd. Amended Employee Incentive Plan, effective February 6, 1996.
|
10-Q
|
10.2
|
October 31, 2014
|
001-14536
141185457 |
|||||||
|
10.5.1
|
Form of PartnerRe Ltd. Amended Employee Incentive Plan Executive Stock Option Agreement and Notice of Grant.
|
8-K
|
10.1
|
February 16, 2005
|
001-14536
5621655 |
|||||||
|
10.5.2
|
Form of PartnerRe Ltd. Amended Employee Incentive Plan Executive Restricted Stock Unit Award Agreement and Notice of Restricted Stock Units.
|
8-K
|
10.2
|
February 16, 2005
|
001-14536
5621655 |
|||||||
|
10.6
|
PartnerRe Ltd. Amended and Restated Employee Equity Plan, effective May 10, 2005.
|
10-Q
|
10.1
|
October 31, 2014
|
001-14536
141185457
|
|||||||
|
10.6.1
|
Form of PartnerRe Ltd. Employee Equity Plan Executive Restricted Share Unit Award Agreement and Notice of Restricted Share Units.
|
10-K
|
10.6.1
|
February 26, 2013
|
001-14536
13643787 |
|||||||
|
10.6.2
|
Form of PartnerRe Ltd. Executive Restricted Share Unit Award Agreement.
|
8-K
|
10.2
|
March 27, 2014
|
001-14536
14721580
|
|||||||
|
10.6.3
|
Form of PartnerRe Ltd. Employee Equity Plan Executive Share-Settled Share Appreciation Right Agreement and Notice of Share-Settled Share Appreciation Rights.
|
10-K
|
10.6.2
|
February 26, 2013
|
001-14536
13643787 |
|||||||
|
10.6.4
|
Form of PartnerRe Ltd. Executive Share-Settled Share Appreciation Right Agreement
|
8-K
|
10.3
|
March 27, 2014
|
001-14536
14721580
|
|||||||
|
10.6.5
|
Form of PartnerRe Ltd. Employee Equity Plan Executive Performance Share Unit Award Agreement and Notice of Performance Share Units.
|
10-K
|
10.6.3
|
February 26, 2013
|
001-14536
13643787 |
|||||||
|
10.6.6
|
Form of PartnerRe Ltd. Executive Performance Share Unit Award Agreement
|
8-K
|
10.4
|
March 27, 2014
|
001-14536
14721580 |
|||||||
|
10.6.7
|
Form of Executive Stock Option Agreement.
|
8-K
|
10.5
|
May 16, 2005
|
001-14536
5835956 |
|||||||
|
10.7
|
PartnerRe Ltd. 2009 Employee Share Purchase Plan effective May 22, 2009.
|
10-Q
|
10.1
|
August 10, 2009
|
001-14536
9998853 |
|||||||
|
10.8
|
PartnerRe Ltd. Swiss Share Purchase Plan.
|
10-Q
|
10.4
|
August 4, 2011
|
001-14536
111010074 |
|||||||
|
10.9
|
PartnerRe Ltd. Amended and Restated Non-Employee Directors Share Plan, effective May 16, 2012.
|
10-Q
|
10.2
|
May 2, 2014
|
001-14536
14808645
|
|||||||
241
|
|
|
Incorporated by Reference
|
|
|||||||||
|
Exhibit
Number
|
Exhibit Description
|
Form
|
Original
Number
|
Date Filed
|
SEC File
Reference
Number
|
Filed
Herewith
|
||||||
|
10.9.1
|
Form of PartnerRe Ltd. Non-Employee Director Share Option Agreement.
|
10-Q
|
10.2
|
May 4, 2011
|
001-14536
11810844 |
|||||||
|
10.9.2
|
Form of PartnerRe Ltd. Non-Employee Director Restricted Share Unit Award Agreement.
|
10-Q
|
10.3
|
May 4, 2011
|
001-14536
11810844 |
|||||||
|
10.9.3
|
Form of PartnerRe Ltd. Non-Employee Directors Stock Plan Restricted Share Unit Award and Notice of Restricted Share Units.
|
8-K
|
10.2
|
September 20, 2004
|
001-14536
41037442 |
|||||||
|
10.13
|
PartnerRe Ltd. Change in Control Policy.
|
X
|
||||||||||
|
10.14
|
Amended Executive Total Compensation Program.
|
10-Q
|
10.3
|
May 2, 2014
|
001-14536
14808645 |
|||||||
|
10.15
|
Board of Directors Compensation Program for Non-Executive Directors.
|
X
|
||||||||||
|
10.16
|
Amended and Restated Employment Agreement between PartnerRe Ltd. and Costas Miranthis, effective as of October 23, 2014.
|
10-Q
|
10.4
|
October 31, 2014
|
001-14536
141185457 |
|||||||
|
10.17
|
Amended and Restated Employment Agreement between PartnerRe Holdings Europe Limited, Zurich Branch and Emmanuel Clarke, effective as of October 23, 2014.
|
10-Q
|
10.5
|
October 31, 2014
|
001-14536
141185457 |
|||||||
|
10.18
|
Amended and Restated Employment Agreement between PartnerRe Ltd. and William Babcock, effective as of October 23, 2014.
|
10-Q
|
10.6
|
October 31, 2014
|
001-14536
141185457 |
|||||||
|
10.20
|
Amended and Restated Employment Agreement between PartnerRe Ltd. and Laurie Desmet, effective as of October 23, 2014.
|
10-Q
|
10.7
|
October 31, 2014
|
001-14536
141185457 |
|||||||
|
10.21
|
Amended and Restated Employment Agreement between Partner Reinsurance Company of the U.S and Theodore C. Walker, effective as of October 23, 2014.
|
10-Q
|
10.8
|
October 31, 2014
|
001-14536
141185457 |
|||||||
|
10.22
|
Amended and Restated Consulting Agreement between PartnerRe Ltd. and Marvin Pestcoe, effective as of April 16, 2014.
|
10-Q
|
10.3
|
October 31, 2014
|
001-14536
141185457 |
|||||||
|
10.24
|
Form of Indemnification Agreement between PartnerRe Ltd. and its directors.
|
10-Q
|
10.16
|
November 4, 2009
|
001-14536
91158470 |
|||||||
|
10.32
|
Amended and Restated Run Off Services and Management Agreement dated as of December 21, 2006 between AXA Liabilities Managers, AXA RE and PARIS RE.
|
10-K
|
10.27.1
|
March 1, 2010
|
001-14536
10646399 |
|||||||
|
10.33
|
Reserve Agreement dated as of December 21, 2006 between AXA, AXA RE and PARIS RE.
|
10-K
|
10.27.2
|
March 1, 2010
|
001-14536
10646399 |
|||||||
|
10.34
|
Claims Management and Services Agreement dated as of December 21, 2006 between AXA RE and PARIS RE.
|
10-K
|
10.27.3
|
March 1, 2010
|
001-14536
10646399 |
|||||||
|
10.35
|
Canadian Quota Share Retrocession Agreement dated December 21, 2006 and effective January 1, 2006 between AXA RE and PARIS RE.
|
10-K
|
10.27.4
|
March 1, 2010
|
001-14536
10646399 |
|||||||
|
10.36
|
Quota Share Retrocession Agreement dated December 21, 2006 and effective January 1, 2006 between AXA RE and PARIS RE.
|
10-K
|
10.27.5
|
March 1, 2010
|
001-14536
10646399 |
|||||||
|
10.36.1
|
Endorsement to Quota Share Retrocession Agreement dated February 1, 2011 and effective January 1, 2006 between Colisée Re and Partner Reinsurance Europe Limited.
|
8-K
|
10.1
|
February 7, 2011
|
001-14536
11579242 |
|||||||
|
14.1
|
Code of Business Conduct and Ethics.
|
10-K
|
14.1
|
February 24, 2012
|
001-14536
12636834 |
|||||||
242
|
|
|
Incorporated by Reference
|
|
|||||||||
|
Exhibit
Number
|
Exhibit Description
|
Form
|
Original
Number
|
Date Filed
|
SEC File
Reference
Number
|
Filed
Herewith
|
||||||
|
21.1
|
Subsidiaries of the Company.
|
X
|
||||||||||
|
23.1
|
Consent of Deloitte Ltd.
|
X
|
||||||||||
|
31.1
|
Certification of David Zwiener, Chief Executive Officer, as required by Rule 13a-14(a) of the Securities Exchange Act of 1934.
|
X
|
||||||||||
|
31.2
|
Certification of William Babcock, Chief Financial Officer, as required by Rule 13a-14(a) of the Securities Exchange Act of 1934.
|
X
|
||||||||||
|
32
|
Certifications of David Zwiener, Chief Executive Officer, and William Babcock, Chief Financial Officer, as required by Rule 13a-14(b) of the Securities Exchange Act of 1934.
|
X
|
||||||||||
|
101.1
|
The following financial information from PartnerRe Ltd.’s Annual Report on Form 10–K for the year ended December 31, 2014 formatted in XBRL: (i) Consolidated Balance Sheets at December 31, 2014 and 2013; (ii) Consolidated Statements of Operations and Comprehensive Income for the years ended December 31, 2014, 2013 and 2012; (iii) Consolidated Statements of Shareholders’ Equity for the years ended December 31, 2014, 2013 and 2012; (iv) Consolidated Statements of Cash Flows for the years ended December 31, 2014, 2013 and 2012; (v) Notes to Consolidated Financial Statements and (vi) Financial Statements Schedules.
|
|||||||||||
243
TABLE OF CONTENTS
Part IItem 1. BusinessItem 1A. Risk FactorsItem 1B. Unresolved Staff CommentsItem 2. PropertiesItem 3. Legal ProceedingsItem 4. Mine Safety DisclosuresPart IIItem 5. Market For Registrant S Common Equity, Related Stockholder Matters and Issuer Purchases Of Equity SecuritiesItem 6. Selected Financial DataItem 7. Management S Discussion and Analysis Of Financial Condition and Results Of OperationsItem 7A. Quantitative and Qualitative Disclosures About Market RiskItem 8. Financial Statements and Supplementary DataItem 9. Changes in and Disagreements with Accountants on Accounting and Financial DisclosureItem 9A. Controls and ProceduresItem 9B. Other InformationPart IIIItem 10. Directors, Executive Officers and Corporate GovernanceItem 11. Executive CompensationItem 12. Security Ownership Of Certain Beneficial Owners and Management and Related Stockholder MattersItem 13. Certain Relationships and Related Transactions, and Director IndependenceItem 14. Principal Accountant Fees and ServicesPart IVItem 15. Exhibits and Financial Statement Schedules