PERRIGO CO PLC
10-Ks and 10-Qs
|
|
|
|
|
|
|
|
|
|
|
|
|
|
|
|
|
|
|
|
|
|
|
|
|
|
|
|
|
|
|
|
|
|
|
|
|
|
|
|
|
|
|
|
UNITED STATES
SECURITIES AND EXCHANGE COMMISSION
Washington, D.C. 20549
FORM 10-K
[X]
ANNUAL REPORT PURSUANT TO SECTION 13 OR 15(d) OF THE SECURITIES EXCHANGE ACT OF 1934
For the year ended
December 31, 2016
or
[ ]
TRANSITION REPORT PURSUANT TO SECTION 13 OR 15(d) OF THE SECURITIES EXCHANGE ACT OF 1934
For the transition period from _____ to _____
Commission file number
001-36353
Perrigo Company plc
(Exact name of registrant as specified in its charter)
|
Ireland
|
|
N/A
|
|
(State or other jurisdiction of incorporation or organization)
|
|
(I.R.S. Employer Identification No.)
|
|
Treasury Building, Lower Grand Canal Street, Dublin 2, Ireland
|
|
-
|
|
(Address of principal executive offices)
|
|
(Zip Code)
|
Registrant’s telephone number, including area code:
+353 1 7094000
Securities registered pursuant to Section 12(b) of the Act:
|
Ordinary shares, €0.001 par value
|
|
New York Stock Exchange
|
|
Title of each class
|
|
Name of each exchange on which registered
|
None
(Title of Class)
|
Indicate by check mark if the registrant is a well-known seasoned issuer, as defined in Rule 405 of the Securities Act.
|
YES
|
[ ]
|
NO
|
[X]
|
|
|
Indicate by check mark if the registrant is not required to file reports pursuant to Section 13 of Section 15(d) of the Act.
|
YES
|
[ ]
|
NO
|
[X]
|
|
|
Indicate by check mark whether the registrant (1) has filed all reports required to be filed by Section 13 or 15(d) of the Securities Exchange Act of 1934 during the preceding 12 months (or for such shorter period that the registrant was required to file such reports), and (2) has been subject to such filing requirements for the past 90 days.
|
YES
|
[ ]
|
NO
|
[X]
|
|
|
Indicate by check mark whether the registrant has submitted electronically and posted on its corporate Web site, if any, every Interactive Data File required to be submitted and posted pursuant to Rule 405 of Regulation S-T (§232.405 of this chapter) during the preceding 12 months (or for such shorter period that the registrant was required to submit and post such files).
|
YES
|
[ ]
|
NO
|
[X]
|
|
|
Indicate by check mark if disclosure of delinquent filers pursuant to Item 405 of Regulation S-K (§229.405 of this chapter) is not contained herein, and will not be contained, to the best of registrant’s knowledge, in definitive proxy or information statements incorporated by reference in Part III of this Form 10-K or any amendment to this Form 10-K.
|
[ ]
|
||||
|
Indicate by check mark whether the registrant is a large accelerated filer, an accelerated filer, a non-accelerated filer, a smaller reporting company, or an emerging growth company. See the definitions of "large accelerated filer", "accelerated filer", "smaller reporting company", and "emerging growth company" in Rule 12b-2 of the Exchange Act.
|
|||||
|
Large accelerated filer
|
[X]
|
Accelerated filer
|
[ ]
|
Non-accelerated filer
|
[ ]
|
Smaller reporting company
|
[ ]
|
|||
|
Emerging growth company
|
[ ]
|
|||||||||
|
If an emerging growth company, indicate by check mark if the registrant has elected not to use the extended transition period for complying with any new or revised financial accounting standards provided pursuant to Section 13(a) of the Exchange Act.
|
[ ]
|
|||||||||
|
Indicate by check mark whether the registrant is a shell company (as defined in Rule 12b-2 of the Act).
|
YES
|
[ ]
|
NO
|
[X]
|
|
The aggregate market value of the voting stock held by non-affiliates of the registrant, based upon the closing sale price of our ordinary shares on
July 1, 2016
as reported on the New York Stock Exchange, was
$13,050,594,298
. Ordinary shares held by each director or executive officer have been excluded in that such persons may be deemed to be affiliates. This determination of affiliate status is not necessarily a conclusive determination for other purposes.
As of
5/19/2017
, the registrant had
143,397,295
outstanding ordinary shares.
PERRIGO COMPANY PLC
FORM 10-K
YEAR ENDED
DECEMBER 31, 2016
TABLE OF CONTENTS
|
|
|
Page No.
|
|
Explanatory Note
|
||
|
Part I.
|
||
|
Item 1.
|
||
|
Item 1A.
|
||
|
Item 1B.
|
||
|
Item 2.
|
||
|
Item 3.
|
||
|
Item 4.
|
||
|
Additional Item.
|
||
|
Part II.
|
||
|
Item 5.
|
||
|
Item 6.
|
||
|
Item 7.
|
||
|
Item 7A.
|
||
|
Item 8.
|
||
|
Item 9.
|
||
|
Item 9A.
|
||
|
Item 9B.
|
||
|
Part III.
|
||
|
Item 10.
|
||
|
Item 11.
|
||
|
Item 12.
|
||
|
Item 13.
|
||
|
Item 14.
|
||
|
Part IV.
|
||
|
Item 15.
|
||
CAUTIONARY NOTE REGARDING FORWARD-LOOKING STATEMENTS
Certain statements in this report are “forward-looking statements” within the meaning of Section 21E of the Securities Exchange Act of 1934, as amended, and are subject to the safe harbor created thereby. These statements relate to future events or our future financial performance and involve known and unknown risks, uncertainties and other factors that may cause our, or our industry's actual results, levels of activity, performance or achievements to be materially different from those expressed or implied by any forward-looking statements.
In particular, statements about our expectations, beliefs, plans, objectives, assumptions, future events or future performance contained in this report, including certain statements contained in “Management’s Discussion and Analysis of Financial Condition and Results of Operations,” are forward-looking statements. In some cases, forward-looking statements can be identified by terminology such as “may,” “will,” “could,” “would,” “should,” “expect,” “plan,” “anticipate,” “intend,” “believe,” “estimate,” "forecast," “predict,” “potential” or the negative of those terms or other comparable terminology.
We have based these forward-looking statements on our current expectations, assumptions, estimates and projections. While we believe these expectations, assumptions, estimates and projections are reasonable, such forward-looking statements are only predictions and involve known and unknown risks and uncertainties, many of which are beyond our control, including: the timing, amount and cost of any share repurchases; future impairment charges; customer acceptance of new products; competition from other industry participants, some of whom have greater marketing resources or larger market shares in certain product categories than we do; pricing pressures from customers and consumers; potential third-party claims and litigation, including litigation relating to our restatement of previously-filed financial information; potential impacts of ongoing or future government investigations and regulatory initiatives; general economic conditions; fluctuations in currency exchange rates and interest rates; the consummation of announced acquisitions or dispositions, and our ability to realize the desired benefits thereof; and our ability to execute and achieve the desired benefits of announced cost-reduction efforts and other initiatives. In addition, we may identify and be unable to remediate one or more material weaknesses in our internal control over financial reporting, may encounter unanticipated material issues or additional adjustments that could delay the filing of required periodic reports with the United States Securities and Exchange Commission, or may be unable to regain compliance with the NYSE continued listing rules. Furthermore, we and/or our subsidiaries may incur additional tax liabilities in respect of 2016 and prior years as a result of any restatement or may be found to have breached certain provisions of Irish company legislation in respect of prior financial statements and if so may incur additional expenses and penalties. These and other important factors, including those discussed in this report under "Risk Factors" and in any subsequent filings with the Securities and Exchange Commission, may cause actual results, performance or achievements to differ materially from those expressed or implied by these forward-looking statements. The forward-looking statements in this report are made only as of the date hereof, and unless otherwise required by applicable securities laws, we disclaim any intention or obligation to update or revise any forward-looking statements, whether as a result of new information, future events, or otherwise.
TRADEMARKS, TRADENAMES AND SERVICE MARKS
This report contains trademarks, trade names and service marks that are the property of Perrigo Company plc, as well as, for informational purposes, trademarks, trade names, and service marks that are the property of other organizations. Solely for convenience, certain trademarks and trade names referred to in this report appear without the
®
,
™ and
SM
symbols, but those references are not intended to indicate that we or the applicable owner, as the case may be, will not assert, to the fullest extent under applicable law, our or their rights to such trademarks, trade names, and service marks.
NOTE REGARDING FISCAL YEAR
Our fiscal year previously consisted of a 52- or 53-week year ending on or around June 30 of each year with each quarter ending on the Saturday closest to each calendar quarter end. Beginning on January 1, 2016, we changed our fiscal year to begin on January 1 and end on December 31 of each year. As a result of our change in year end, this report on Form 10-K discloses the results of our operations for the twelve-month period from January 1, 2016 through December 31, 2016. The six months ended December 31, 2015 reflects our financial results from June 28, 2015 through December 31, 2015. The year ended June 27, 2015 reflects our financial results for the twelve-month period from June 29, 2014 to June 27, 2015, and the year ended June 28, 2014 reflects our financial results for the twelve-month period from June 30, 2013 to June 28, 2014. We cut off our quarterly accounting
1
periods on the Saturday closest to the end of the calendar quarter, with the fourth quarter ending on December 31 of each year.
EXPLANATORY NOTE
This Annual Report on Form 10-K for the year ended December 31, 2016 includes consolidated financial statements for the year ended December 31, 2016, six months ended December 31, 2015, and the years ended June 27, 2015 and June 28, 2014. The consolidated financial statements and selected financial data for the nine months
ended October 1, 2016, six months ended December 31, 2015, and the years ended June 27, 2015 and June 28, 2014 are restated (the “Restated Periods”). As described below, the restatement follows a correction in accounting under U.S. generally accepted accounting principles (“U.S. GAAP”) related to the Tysabri
®
royalty stream.
In connection with our year-end financial statement close and preparation of our Form 10-K for 2016, misstatements were identified in certain of our previous financial statements. As a result on April 19, 2017, the Board of Directors, after recommendation from the Audit Committee and consultation with Management, concluded that such financial statements, and certain financial statements for interim periods within the Restated Periods, should no longer be relied upon and would require restatement. This determination follows a correction in accounting under U.S. GAAP related to the contingent payments from Elan's May 2013 sale of Tysabri
®
to Biogen (the "Tysabri
®
royalty stream"). It was determined that the Tysabri
®
royalty stream should be recorded as a financial asset, rather than an intangible asset, on the date of acquisition. We have elected to account for the Tysabri
®
financial asset using the fair value option model.
In addition, we identified certain misstatements related to the calculation of deferred tax liabilities that existed at the time of the acquisition of Omega Pharma Invest N.V. ("Omega"). As part of this restatement we also considered other previously identified adjustments. Refer to
Item 8. Note 1
for additional information on the restatement. Refer to
Item 8. Note 10
for additional information on how this restatement affects our debt covenants.
Management and the Audit Committee evaluated the impact of these misstatements on our internal control over financial reporting and disclosure controls and procedures and have concluded that there were material weaknesses that contributed to the misstatements in the Restated Periods related to the Tysabri
®
royalty stream that was acquired in the Elan transaction, income taxes, and asset impairments. Management and our independent auditors, Ernst & Young LLP, have concluded that we did not maintain, in all material respects, effective internal control over financial reporting as of December 31, 2016, based on criteria established in
Internal Control - Integrated Framework
(2013) issued by the Committee of Sponsoring Organizations of the Treadway Commission (COSO), because the above described material weaknesses in our internal control over financial reporting existed at December 31, 2016.
We have taken, and continue to take, action to remediate the identified material weaknesses. We have identified and implemented, and continue to identify and implement, actions to improve the effectiveness of our internal control over financial reporting and disclosure controls and procedures. For more information on our material weaknesses and the status of our remediation efforts, see
Item 9A - Controls and Procedures
.
While this Annual Report contains consolidated financial statements and selected financial data for the Restated Periods, and we have filed amended Quarterly Reports on Form 10-Q for the quarterly periods ended April 2, 2016, July 2, 2016 and October 1, 2016, we have not amended, and do not intend to amend and refile, our Annual Reports on Form 10-K for periods ending prior to December 31, 2016 or Quarterly Reports on Form 10-Q for periods ending prior to April 2, 2016. The financial statements and related financial information contained in any of our reports filed prior to this Annual Report on Form 10-K for the year ended December 31, 2016 dating back to and including the Quarterly Report on Form 10-Q for the quarter ended December 28, 2013 should no longer be relied upon.
2
Perrigo Company plc
- Item 1
Business Overview
|
ITEM 1.
|
BUSINESS
|
Perrigo Company plc was incorporated under the laws of Ireland on June 28, 2013. We became the successor registrant to Perrigo Company, a Michigan corporation, on December 18, 2013 in connection with the acquisition of Elan Corporation, plc ("Elan"), which is discussed further in
Item 8. Note 2
. Unless the context requires otherwise, the terms "Perrigo", the "Company", "we," "our," "us," and similar pronouns used herein refer to Perrigo Company plc, its subsidiaries, and all predecessors of Perrigo Company plc and its subsidiaries.
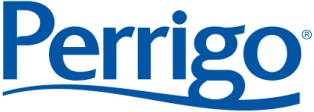
WHO WE ARE
We are a leading global over-the-counter ("OTC") consumer goods and pharmaceutical company, offering patients and customers high quality products at affordable prices. From our beginning in 1887 as a packager of home remedies, we have grown to become the world's largest manufacturer of OTC healthcare products and supplier of infant formulas for the store brand market. We are also a leading provider of generic standard topical products such as creams, lotions, and gels, as well as inhalants and injections ("extended topical") prescription products in the U.S. We also received royalties from sales of the multiple sclerosis drug Tysabri
®
but divested our rights to those royalties effective beginning January 1, 2017. We provide “Quality Affordable Healthcare Products
®
” across a wide variety of product categories and geographies, primarily in North America, Europe, and Australia, as well as in other markets, including Israel, and China.
MAJOR DEVELOPMENTS IN OUR BUSINESS
Restatement
In connection with our year-end financial statement close and preparation of our Form 10-K for 2016, we identified misstatements in our historical financial statements, including for the nine months
ended October 1, 2016, six months ended
December 31, 2015
, and the years ended
June 27, 2015
and
June 28, 2014
(the "Restated Periods"). Accordingly, we have restated the consolidated financial statements for the Restated Periods (and certain financial statements for interim periods within the Restated Periods) to reflect the correction of the misstatements, the most significant of which are described below. The segments predominantly affected by this restatement are Specialty Sciences and CHCI. Refer to
Item 8. Note 10
of the Consolidated financial statements for additional information on how this restatement affects our debt covenants.
During the 2016 year-end financial statement close process, and in anticipation of our potential sale of our royalty rights, we evaluated the potential effects of the Tysabri
®
royalty stream sale accounting and the accounting
3
Perrigo Company plc
- Item 1
Business Overview
and disclosures associated with the pending 2018 adoption of ASC 606 “Revenues from Contracts with Customers.” After an extensive evaluation of the facts and circumstances and the judgments required to determine the appropriate classification, it was determined that under existing U.S. GAAP the contingent payments from Elan's May 2013 sale of Tysabri
®
to Biogen (the "Tysabri
®
royalty stream") should have been recorded as a financial asset, rather than an intangible asset, on the date of our acquisition of Elan.
Our Tysabri
®
royalty stream is now accounted for in our consolidated financial statements for 2016 and prior restated periods as a financial asset using the fair value option. We made the election to account for the Tysabri
®
financial asset using the fair value option as we believe this method is most appropriate for an asset that does not have a par value, a stated interest stream, or a termination date. Accounting for the Tysabri
®
royalty stream as a financial asset required us to adjust our financial statements for the Restated Periods to (1) remove the Tysabri
®
royalty stream from net sales in our Consolidated Statements of Operations, (2) remove the amortization expense (reflected in cost of goods sold) associated with recording the Tysabri
®
royalty stream as an intangible asset, and (3) include the quarterly changes in fair value of the Tysabri
®
royalty stream as a component of other non-operating income/expense. The cash payments we received from the royalty stream are included in our Consolidated Statements of Cash Flows for the Restated Periods and reflect the cash received from the Tysabri
®
royalty stream as cash from investing activities, rather than as cash from operating activities.
In addition, in connection with the financial closing for the year ended December 31, 2016, we identified certain tax basis intangible assets that existed at the time of the acquisition of Omega Pharma Invest N.V. (“Omega”) on
March 30, 2015
, which reduced the deferred tax liabilities in acquired intangible assets and increased our valuation allowance resulting in a net change to our deferred taxes of approximately
$236.3 million
. The resulting balance sheet reclassification required a reduction of goodwill, offset by a corresponding reduction to net deferred taxes at the date of the Omega acquisition. Further, we have evaluated the accounting effect subsequent to the acquisition date related to the remeasured deferred tax liability, including the impairments of Omega goodwill recorded in 2016 and certain adjustments to valuation allowances, which have been reflected in the Restated Periods.
In restating our financial statements to correct the misstatements discussed above, we are also making adjustments for previously identified required corrections with respect to the Restated Periods. When these financial statements were originally issued, we assessed the impact of these unrecorded adjustments and concluded that they were not material individually or in the aggregate to our consolidated financial statements. All of the financial information presented in this Item 1 has been revised to reflect the restatement more fully described in
Item 8. Note 1
to the Consolidated Financial Statements.
Restructuring
On February 21, 2017, we approved a workforce reduction plan as part of a larger cost optimization strategy across the Company. We expect to reduce our global workforce by approximately 750 employees, which includes some actions already taken and 235 employees who have elected to participate in a voluntary early retirement program. This represents a reduction of approximately 14% of our global non-production workforce. The changes to our workforce will vary by country, based on legal requirements and required consultations with works councils and other employee representatives, as appropriate.
In connection with this plan, we estimate that we will recognize total pre-tax restructuring charges of approximately $70.0 million to $80.0 million, consisting of one-time termination benefits, severance arrangements, and other termination costs. We anticipate recognizing substantially all of these charges during the year ending December 31, 2017, with the remaining balance to be recognized during the first quarter of the year ending December 31, 2018.
4
Perrigo Company plc
- Item 1
Business Overview
Our cost optimization strategy is expected to yield approximately $130.0 million in savings per annum by mid-2018. This is in addition to the savings that our supply chain organization continues to generate for both our North American and International segments.
Segments
In the fourth quarter of 2016, we changed our reporting segments to better align with our new organizational structure. These organizational changes were made to optimize our structure to better serve our customers and to reflect the way in which our chief operating decision maker reviews our operating results and allocates resources. The changes in our reporting segments are as follows:
|
•
|
Consumer Healthcare Americas
("
CHCA
")
,
comprises our U.S., Mexico and Canada consumer healthcare business (OTC, contract, infant formula and animal health categories).
|
|
•
|
Consumer Healthcare International
("
CHCI
")
,
comprises our legacy Branded Consumer Healthcare segment and now includes our consumer focused businesses in the U.K., Australia, and Israel, which were previously reported in the legacy Consumer Healthcare segment. This segment includes our U.K. liquid licensed products business, which was previously reported in the Prescription Pharmaceuticals segment.
|
|
•
|
Prescription Pharmaceuticals
("
RX
")
,
comprises our U.S. Prescription Pharmaceuticals business.
|
|
•
|
Specialty Sciences
, continued to comprise the Tysabri
®
Royalty Stream.
|
We also have an "
Other
" reporting segment that will continue to comprise our legacy Active Pharmaceutical Ingredients ("API") business,
which does not meet the quantitative threshold required to be a separately reportable segment. On December 9, 2016, an agreement was signed to sell a portion of our India API business. See
Item 8. Note 2
for additional information. Financial information related to our business segments and geographic locations can be found in
Item 8. Note 19
.
Omega Acquisition
On
March 30, 2015
, we acquired Omega, for
$3.0 billion
in equity and cash and assumed debt of
$1.6 billion
, for a total purchase price of $4.6 billion. Prior to its acquisition, Omega was one of the largest OTC companies in Europe. The Omega acquisition expanded our OTC leadership position into continental Europe, accelerated our international expansion and geographic diversification through enhanced scale and a broader footprint, and diversified our net sales and cash flow streams.
The broader European platform established through the Omega acquisition, facilitated the acquisition of a portfolio of well-established OTC brands sold primarily in Europe from GlaxoSmithKline Consumer Healthcare (“GSK”) on August 28, 2015 and Naturwohl Pharma, GmbH ("Naturwohl"), with its leading German dietary supplement brand, Yokebe
®
,
on September 15, 2015. Additional information on the Omega, GSK, and Naturwohl acquisitions can be found in
Item 8. Note 2
. Subsequently, during the year ended December 31, 2016, we identified impairment indicators associated with certain intangible assets and goodwill which required us to test these assets for impairment. As a result, we recorded total impairments of
$2.0 billion
. Refer to
Item 8. Note 3
for additional information.
5
Perrigo Company plc
- Item 1
Business Overview
Elan Acquisition
On December 18, 2013, we acquired Elan in a cash and stock transaction totaling
$9.5 billion
. The acquisition led to the creation of our new corporate structure headquartered in Dublin, Ireland. We have utilized this structure to continue to grow in our core markets and further expand outside of the U.S. The acquisition also provided us with the Tysabri
®
royalty stream. Additional information on the Elan acquisition can be found in
Item 8. Note 2
. Subsequently, on
March 27, 2017
, we announced the completed divestment of the Tysabri
®
royalty stream to Royalty Pharma for up to
$2.85 billion
, which consists of
$2.2 billion
in cash and up to
$250.0 million
and
$400.0 million
in royalties earned if global net sales of Tysabri
®
meet specific thresholds in 2018 and 2020, respectively. As a result of this transaction, we will derecognize the Tysabri
®
financial asset in the first quarter of 2017 and we do not expect the disposition to have a material impact on our results. We initiated a strategic review of the Tysabri
®
royalty stream in November 2016. In that connection, we received indications of the fair value of that royalty stream, which led to a goodwill impairment recorded during the year ended December 31, 2016. Refer to
Item 8. Note 3
and
Note 6
for additional information on the impairment and fair value adjustments, respectively.
NEW PRODUCTS
We consider a product to be new if it was (i) reformulated, (ii) involved product line extension due to changes in characteristics such as strength, flavor, or color, (iii) involved a change in product status from "prescription only" ("Rx") to OTC, (iv) was a new generic or branded launch, (v) was provided in a new dosage form or (vi) was sold to a new geographic area with different regulatory authorities, in all cases, within 12 months prior to the end of the period for which net sales are being measured. New product sales were as follows (in millions):
|
Year Ended
|
Six Months Ended
|
Year Ended
|
||||||||||||||||||||
|
December 31,
2016 |
December 31,
2015 |
December 31,
2015 |
December 27, 2014
(1)
|
June 27,
2015 |
June 28, 2014
(1)
|
|||||||||||||||||
|
$
|
311.1
|
|
$
|
460.9
|
|
$
|
231.1
|
|
$
|
77.3
|
|
$
|
273.8
|
|
$
|
231.4
|
|
|||||
(1)
Excludes Omega activity; acquisition took place on March 30, 2015.
CONSUMER HEALTHCARE AMERICAS
Overview
The
CHCA
segment is focused primarily on the sale of OTC store brand products, including cough, cold, allergy and sinus, analgesic, gastrointestinal, smoking cessation, infant formula and food, animal health, and diagnostic products in the U.S., Mexico and Canada. We are a leading provider of consumer healthcare products sold to consumers via store brands and also sell consumer healthcare products under our own brands. Consumer awareness and knowledge of the quality and value that OTC store brand products represent continues to grow due to retailer efforts to promote their own label programs. During the
year ended
December 31, 2016
, our
CHCA
segment represented approximately
48%
of consolidated net sales.
The
CHCA
segment develops, manufactures, and markets products that are comparable in quality and effectiveness to national brands. Store brand products must meet the same U.S. Food and Drug Administration ("FDA") requirements as national brands within the U.S. and the requirements of comparable regulatory bodies outside the U.S. In most instances our product packaging is designed to invite and reinforce comparison to national brand products, while communicating store brand value to consumers.
The cost of store brand products to retailers is significantly lower than that of comparable nationally advertised brand-name products. Generally, retailers’ dollar profit per unit of store brand product is greater than the dollar profit per unit of the comparable national brand product. The retailer, therefore, can price a store brand product below the competing national brand product and realize a greater profit margin. The consumer benefits by receiving a high quality product at a price below the comparable national brand product. As a result, our business model results in consumers saving money on their healthcare spending.
We are dedicated to continuing to be the leader in developing and marketing new OTC store brand products and have a research and development ("R&D") staff that we believe is one of the most experienced in the
6
Perrigo Company plc
- Item 1
CHCA
industry at developing products comparable in formulation and quality to national brand products. Our R&D team also responds to changes in existing national brand products by reformulating existing products. For example, in the OTC pharmaceutical market, certain new products are the result of changes in product status from Rx to OTC. These “Rx-to-OTC switches” require FDA approval through a process initiated by the drug innovator. The drug innovator usually begins the process by filing a New Drug Application ("NDA"), which is often followed by filing an Abbreviated New Drug Application ("ANDA"). See "
Government Regulation and Pricing
" below for more information on these FDA processes.
New drugs are also marketed through the FDA's OTC monograph process, which allows for the production of drugs that are generally recognized as safe and effective without pre-marketing approval. The
CHCA
segment also develops, manufactures, and distributes certain branded products when the strategy is synergistic with our store brand business. Branded products include the Good Sense
®
, Sergeant's
®
, Sentry
®
, Zephrex D
®
, PetArmor
®
, and the ScarAway
®
brand names.
We manufacture a significant portion of our
CHCA
segment's products at our plants in the U.S., Mexico, and Israel, and we source our remaining needs from third parties. We rely on both internal R&D and strategic product development agreements with outside sources to develop new products. In addition, in order to maximize both our capacity and sales of proprietary formulas, we engage in contract manufacturing, which involves producing unique ANDAs and monograph
products through partnerships with major pharmaceutical and direct-to-consumer companies.
We believe the increasing age of the population will drive the need for the greater value that our store brand products provide consumers. In addition, we believe that new products and products switching from Rx to OTC (as described above) will continue to drive growth within the segment.
Recent Developments
|
•
|
In 2016, we experienced a reduction in pricing expectations within our
CHCA
segment, particularly in the cough/cold, animal health and analgesics categories due to various factors including increased focus from customers to capture supply chain productivity savings, low raw material commodity pricing, and competition in specific product categories. We expect this pricing environment to continue to impact our
CHCA
segment for the foreseeable future.
|
|
•
|
On
August 5, 2016
, we completed the sale of our U.S. Vitamin, Minerals, and Supplements ("VMS") business to International Vitamin Corporation for
$61.8 million
inclusive of an estimated working capital adjustment. See
Item 8. Note 2
for additional discussion of the divestiture.
|
Products
Our
CHCA
segment offers products in the following categories:
|
Product Category
|
Description
|
|
|
Analgesics
|
Pain relievers and fever reducers
|
|
|
Cough/cold/allergy/sinus
|
Cough, cold, allergy, and sinus products
|
|
|
Gastrointestinal
|
Antacids, anti-diarrheal, and anti-heartburn products
|
|
|
Infant nutritionals
|
Infant formula and food products
|
|
|
Smoking cessation
|
Gums, lozenges, and other products designed to help users quit smoking
|
|
|
Animal health
|
Pet health and wellness products
|
|
|
Other
|
Feminine hygiene, diabetes care, dermatological care, diagnostic products, scar management, and other miscellaneous healthcare products
|
|
7
Perrigo Company plc
- Item 1
CHCA
The chart below reflects total net sales by product category in the
CHCA
segment for the
year ended
December 31, 2016
.

We launched a number of new
CHCA
products in the
year ended
December 31, 2016
, most notably fluticasone nasal spray (store brand equivalent to Flonase
®
), certain products from the guaifenesin family of products (store brand equivalent to Mucinex
®
), several new infant formula and food products, and new animal health products. Net sales related to new
CHCA
products totaled (in millions):
|
Year Ended
|
Six Months Ended
|
Year Ended
|
||||||||||||||||||||
|
December 31,
2016 |
December 31,
2015 |
December 31,
2015 |
December 27,
2014 |
June 27,
2015 |
June 28,
2014 |
|||||||||||||||||
|
$
|
117.4
|
|
$
|
235.2
|
|
$
|
122.9
|
|
$
|
33.2
|
|
$
|
145.5
|
|
$
|
75.5
|
|
|||||
We, on our own or in conjunction with partners, received final approval from U.S. health authorities for
six
new products within the
CHCA
segment in the
year ended
December 31, 2016
, and as of
December 31, 2016
, we had
six
new product applications pending approval.
Sales and Marketing
Our customers include major global, national, and regional retail drug, supermarket, and mass merchandise chains such as Walmart, CVS, Walgreens Boots Alliance, Rite Aid, Kroger, Target, Dollar General, Sam’s Club, Costco, Petco, Petsmart, and major wholesalers, including McKesson, Cardinal Health, and Amerisource Bergen.
We seek to establish customer loyalty through superior customer service by providing a comprehensive assortment of high quality, value-priced products; timely processing, shipment and delivery of orders; assistance in managing customer inventories; and support in managing and building the customer’s store brand business. The
CHCA
segment employs its own sales force to service larger customers, and uses industry brokers for other retailers. Field sales employees, with support from marketing and customer service, are assigned to specific customers in order to work most effectively with the customer. They assist customers by developing customized brand and in-store marketing programs for customers' store brand products.
The primary objective of this store brand management approach is to enable our customers, retailers and wholesalers, to increase sales of their own store brand products by communicating store brand quality and value to the consumer and by inviting comparison to national brand products. Our sales and marketing personnel assist customers in the development and introduction of new store brand products and in the promotion of customers’
8
Perrigo Company plc
- Item 1
CHCA
existing store brand products by providing market information; establishing individualized promotions and marketing programs, which may include floor displays, bonus sizes, coupons, rebates, store signs, and promotional packs; and performing consumer research.
In contrast with national brand manufacturers, which incur considerable advertising and marketing expenditures targeted directly to the end user or consumer, the
CHCA
segment’s primary marketing efforts are channeled through retailers and wholesalers and reach the consumer through our customers’ in-store marketing programs and our digital media programs. Because the retail profit margin for store brand products is generally higher than for national brand products, retailers and wholesalers often commit funds for additional promotions.
Our animal health category, which has a greater emphasis on value-branded products, promotes product awareness through direct-to-consumer advertising including television commercials, online advertising, in-store display vehicles, and social media. In addition to in-store marketing programs, our infant formula category markets directly to consumers and healthcare professionals.
Competition
The markets for OTC pharmaceuticals and infant formula are highly competitive. Our primary competitors include manufacturers, such as LNK International, Inc., PL Developments, and Dr. Reddy's Labs, and brand-name pharmaceutical and consumer product companies, such as Johnson & Johnson, Pfizer, Bayer AG, GSK, Nestle S.A. (Gerber), Abbott Nutrition, Aurobindo Pharma, and Mead Johnson Nutrition Co. The competition is highly fragmented in terms of geographic market coverage and product categories, such that a competitor generally does not compete across all product lines. However, some competitors do have larger sales volumes in certain of our categories. Additionally, national brand companies tend to have more resources committed to marketing their products and could in the future manufacture store brands of their products at lower prices than their national brand products. Competition is based on a variety of factors, including price, quality, assortment of products, customer service, marketing support, and approvals for new products. See
Item 1A. Risk Factors - Risks Related to Operations
for additional information and risks associated with competition.
CONSUMER HEALTHCARE INTERNATIONAL
Overview
The
CHCI
segment is comprised primarily of branded OTC sales attributable to Omega and also includes our consumer focused businesses in the U.K., Australia, and Israel, which were previously reported in the legacy Consumer Healthcare segment. The
CHCI
segment develops, manufactures, markets and distributes many well-known European OTC brands in the natural health and vitamins, cough, cold and allergy, smoking cessation, personal care and derma-therapeutics, lifestyle, and anti-parasite categories. In addition, the segment leverages its broad regulatory, sales, and distribution infrastructure to in-license and sell third-party brands and generic pharmaceutical products. The
CHCI
segment distributes these products through an extensive network of customers including pharmacies, wholesalers, drug and grocery store retailers, and para pharmacies in
30
countries, primarily in Europe. Many
CHCI
products are top sellers in the markets in which they compete. During the
year ended
December 31, 2016
, the
CHCI
segment represented approximately
31%
of consolidated net sales.
Through continued investment in R&D partnerships and new technologies, the
CHCI
segment strives to offer high quality products that meet consumers' needs. The combination of internal R&D, in-licensing, acquisitions, and partnerships support the product pipeline, both in terms of brand expansion and product improvement. In the U.K., R&D focuses on oral liquid formulations for the branded Rx products for which liquid formulations are not available and development of store brand products. In the rest of Europe, most R&D is performed by external partners with oversight by our teams. The segment has
seven
plants dedicated to manufacturing certain of its products, but over
80%
of its production is outsourced to third parties. We are transitioning some of the segment's R&D and manufacturing in-house as we continue to integrate Omega into our operations. During the
year ended
December 31, 2016
, we brought the production of four major products in-house. We expect that by the end of 2017, approximately
36%
of the products that we sell in Europe would be manufactured at our own plants.
The
CHCI
segment primarily focuses on building local and national brands. In many markets outside of the U.S., a brand marketing strategy can be more effective than a store brand strategy due to the absence of mass
9
Perrigo Company plc
- Item 1
CHCI
merchandisers and large scale pharmacy chains. Additionally, the absence of a centralized regulatory environment within Europe adds to the complexity of obtaining approvals for products in these markets.
While the
CHCI
segment sells products from over
350
brands both on its own and through third parties, it focuses its resources on its "Top 20 brands", which are selected on the basis of their current sales and growth potential in the OTC market. Additional resources are allocated to these brands to build strong positions in the largest, most highly profitable categories in the OTC market, while maintaining leadership in smaller branded categories.
Recent Developments
|
•
|
As part of our strategic initiatives, management continues to drive improvements and evaluate the overall cost structures within our
CHCI
segment in the following ways:
|
|
•
|
On December 8, 2016, we announced the cancellation of the unprofitable EuroGenerics NV distribution agreement in Belgium. The cancellation, combined with the exit of certain OTC distribution agreements, is expected to reduce net sales by approximately $200.0 million in 2017.
|
|
•
|
We continue to make progress on our previously announced restructuring plans to right-size the
Omega
business due to the impact of market dynamics on sales volumes. In addition, we made several strategic leadership changes during the year ended December 31, 2016, including appointing new leaders for Belgium, France and Germany as well as a new Executive Vice President of the CHCI segment. Management continues to evaluate the overall cost structure relative to current and expected market dynamics. In 2016, we recognized
$20.9 million
of restructuring expense in the CHCI segment.
|
|
•
|
Management continues to evaluate the most effective business model for each country and has announced strategic evaluations for Russia and Argentina.
|
|
•
|
The
CHCI
segment has been impacted by market dynamics in key countries such as Belgium, France, Germany and Italy due to softness in certain brand categories and by unfavorable foreign currency impacts, primarily in the U.K. related to Brexit. In addition, the segment had been impacted in Belgium by a change in the forecast with a major wholesaler, as management implements improved supply chain efficiencies in this market. The
CHCI
segment has restructured its approach to addressing these markets including: (1) implementing a brand prioritization strategy to address these market dynamics, with an objective to balance the cost of advertising and promotional investments with expected contributions from category sales, (2) restructuring its sales force in each of these markets to more effectively serve customers, and (3) exiting certain unfavorable distribution agreements. The combination of these actions are expected to improve the segment's focus on higher value OTC products, reduce selling costs and improve operating margins in the segment.
|
10
Perrigo Company plc
- Item 1
CHCI
Products
Below are the categories in which the
CHCI
segment competes and some of the top brands in each category.
|
Product Category
|
Description
|
Top 20 Brands
|
||
|
Cough, Cold, and Allergy
|
Products that address respiratory symptoms, including traditional medications and alternative treatments such as aromatherapy solutions.
|
Bittner
®
/Aflubin
®
Bronchodual ® Physiomer ® Phytosun ® /Valda ® Prevalin ® /Beconase ® Solpadeine ® /Antigrippine ® |
||
|
Lifestyle
|
Weight management, pregnancy and fertility kits, pain relief, sleep management, smoking cessation, and eye care.
|
Paravet
®
/Clément-Thékan
®
Niquitin
®
Predictor
®
Silence
®
/Nytol
®
XLS (Medical)
®
|
||
|
Natural Health and VMS
|
Vitamins, minerals, supplements, and various other natural remedies.
|
Biover
®
/Abtei
®
Davitamon ® / Granufink ® /Bional ® |
||
|
Personal Care and Derma-Therapeutics
|
Products for the face and body, including sun care, baby-specific, and feminine hygiene products, and solutions for various skin conditions and allergies such as eczema, psoriasis and rosacea.
|
ACO
®
Bodysol
®
/Galenco
®
Dermalex
®
Lactacyd
®
Wartner
®
|
||
|
Anti-Parasite
|
Products focused on the elimination of parasites in both humans and pets including lice treatment and insect repellent.
|
Jungle Formula
®
Paranix
®
|
||
Certain brands are considered "combination brands", as they are marketed under different names depending on the market in which they are sold. For these combination brands, we select the most appropriate products from each product line for the country where they will be marketed, then adopt the brand name that best matches local consumer preference.
We launched a number of new
CHCI
products in the
year ended
December 31, 2016
, most notably products within the Yokebe
®
, Granufink
®
, and XLS Max strength
®
brands. Net sales related to new
CHCI
products totaled (in millions):
|
Year Ended
|
Six Months Ended
|
Year Ended
|
||||||||||||||||||||
|
December 31,
2016 |
December 31,
2015 |
December 31,
2015 |
December 27, 2014
(1)
|
June 27,
2015 |
June 28, 2014
(1)
|
|||||||||||||||||
|
$
|
119.0
|
|
$
|
106.8
|
|
$
|
66.8
|
|
$
|
3.7
|
|
$
|
43.8
|
|
$
|
12.2
|
|
|||||
(1)
Excludes Omega activity; acquisition took place on March 30, 2015.
The
CHCI
segment has more than 72 strategic new products in seven product categories in development, with each of its Top 20 brands having a five-year innovation master plan.
11
Perrigo Company plc
- Item 1
CHCI
Sales and Marketing
Our customers include pharmacies, drug, and grocery stores located primarily in Europe, including Boots, ASDA, Tesco, DM, Rossmann, ETOS, Kruidvat, Woolworths (Australia), and Coles (Australia). The
CHCI
segment sells its products primarily through an established pharmacy sales force and an extensive network of pharmacists. Our sales representatives visit pharmacists daily, ensuring strong in-store visibility of our brands and facilitating pharmacist education programs. Our sales, marketing, and regulatory teams use training/merchandising teams to work in conjunction with local sales representatives to improve our brands' presence and recognition. We seek to attract key talent from leading OTC, fast moving consumer goods ("FMCG"), and retailer companies
to build strong local teams throughout the countries in which the
CHCI
segment operates.
While
CHCI
products have a higher average gross margin than products sold by the
CHCA
segment, selling expenses are significantly higher due to the sales force mentioned above, as well as targeted advertising and promotional spending to enhance brand equity. Key marketing communication tools for the
CHCI
segment include TV commercials, consumer leaflets, product websites, digital and targeted promotional campaigns.
Competition
The competitive landscape of the European OTC market is highly fragmented, as local companies often hold leadership positions in individual product segments in particular countries. As a result, the relevant competition in each of the
CHCI
segment's markets is both local and global. Competitors include Reckitt Benckiser, Boehringer Ingelheim, GSK, Novartis, and Johnson & Johnson as well as additional regional competitors. We believe our key advantage lies in our unique combination of best practices in sales, marketing, and product development from FMCG and OTC/Rx, while embracing the pharmacy channel to drive self-care. See
Item 1A. Risk Factors - Risks Related to Operations
for additional information and risks associated with competition.
PRESCRIPTION PHARMACEUTICALS
Overview
The
RX
segment develops, manufactures, and markets a portfolio of generic and specialty pharmaceutical prescription drugs primarily in the U.S. We define this portfolio as predominantly "extended" topical and "specialty" as it encompasses a broad array of topical dosage forms such as creams, ointments, lotions, gels, shampoos, foams, suppositories, sprays, liquids, suspensions, solutions, and powders. The portfolio also includes select controlled substances, injectables, hormones, oral solid dosage forms, and oral liquid formulations. During the
year ended
December 31, 2016
, the
RX
segment represented approximately
20%
of consolidated net sales.
Our current development areas include other delivery systems such as oral liquids, metered dose inhalers, injectables, and transdermal products, some of which we are developing with third parties.
Our other areas of expertise include our production capabilities for controlled substances and hormonal products. R&D efforts focus on complex formulations, many of which require costly clinical endpoint trials.
We manufacture our topical, specialty, and oral products in the U.S. and Israel, and also source from various FDA-approved third parties. Rx products are manufactured, labeled, and packaged in facilities that comply with strict regulatory standards and meet customers’ stringent requirements.
In addition, the
RX
segment offers OTC products through the prescription channel (referred to as "ORx
®
", these products are marketed using the Perrigo name). ORx
®
products are OTC products that are available for pharmacy fulfillment and healthcare reimbursement when prescribed by a physician. We offer numerous ORx
®
products that are reimbursable through many health plans and the U.S. Medicaid and Medicare programs.
We actively collaborate with other pharmaceutical companies to develop, manufacture, and market certain products or groups of products. These types of agreements are common in the pharmaceutical industry. We may choose to enter into these types of agreements to, among other things, leverage our or our collaborators' scientific R&D expertise, or utilize our extensive marketing and distribution resources. See
Item 8. Note 1
for more information regarding our method for recognizing revenue and expenses related to collaboration agreements, as well as
Item 8. Note 17
for more information regarding our current collaboration agreements.
12
Perrigo Company plc
- Item 1
RX
Recent Developments
|
•
|
We continue to experience a significant reduction in pricing expectations from historical levels in our
RX
segment due to industry and competitive pressures. This softness in pricing is attributed to various factors including increased focus from customers to capture supply chain productivity savings, low raw material commodity pricing, competition in specific products, and consolidation of certain customers. We expect this softness to continue to impact the segment for the foreseeable future, and we are forecasting a 9% to 11% pricing decline in this segment for the year ended December 31, 2017 compared to the prior year.
|
|
•
|
On January 22, 2016, we acquired a portfolio of generic dosage forms and strengths of Retin-A
®
(tretinoin), a topical prescription acne treatment, from Matawan Pharmaceuticals, LLC, for
$416.4 million
in cash ("Tretinoin Products").
|
|
•
|
On March 1, 2016, we completed the acquisition of two development-stage specialty Rx products to further invest in our specialty Rx portfolio.
|
|
•
|
On August 22, 2016, we purchased the remaining 60.9% ownership rights to a generic Benzaclin
TM
product ("Generic Benzaclin
TM
"), which we developed and marketed in collaboration with Barr Laboratories. As a result of this transaction, we are now entitled to 100% of income from sales of the product.
|
|
•
|
On November 10, 2016, we announced that as part of our portfolio review process we are conducting a comprehensive internal evaluation of the
RX
segment's market position, growth opportunities, and interdependencies with our manufacturing and shared service operations to determine if strategic alternatives should be explored.
|
|
•
|
During the three months ended December 31, 2016, the U.S. market for our Entocort
®
(budesonide) capsules, including both brand and authorized generic capsules, experienced significant and unexpected increased competition, reducing our future revenue stream. This led to an impairment charge of
$342.2 million
related to the Entocort
®
intangible asset acquired in 2015. We expect our 2017 net sales to be negatively affected in an amount of approximately $72.0 million.
|
|
•
|
In December 2016, we transitioned our specialty pharmaceutical commercial activities to our partner, Exeltis, who will lead sales and marketing efforts for this portfolio of products. We do not expect this transition will have an impact on our net sales.
|
13
Perrigo Company plc
- Item 1
RX
Products
Listed below are some of the generic prescription products, including authorized generic and ORx
®
products, that we manufacture and/or distribute:
|
Generic Name
(1)
|
Comparative Brand-Name Drug
|
|
|
Adapalene cream
|
Differin
®
|
|
|
Bacitracin ophthalmic ointment
|
N/A
|
|
|
Benzoyl peroxide 5% - clindamycin 1% gel
|
BenzaClin
TM
|
|
|
Budesonide
|
Entocort
®
|
|
|
Clindamycin foam
|
Evoclin
®
|
|
|
Clindamycin phosphate and benzoyl peroxide gel
|
Duac
®
|
|
|
Clobetasol foam, lotion and shampoo
|
Olux
®
, Olux-E
®
, Clobex
®
|
|
|
Desonide cream, ointment
|
Desonate
®
, Tridesilon
®
|
|
|
Dihydroergotamine injection
|
D.H.E. 45
|
|
|
Halobetasol ointment and cream
|
Ultravate
®
|
|
|
Hydrocortisone suppositories
|
N/A
|
|
|
Mupirocin ointment
|
Bactroban
®
|
|
|
Nystatin topical powder
|
Mycostatin
®
|
|
|
Permethrin cream
|
Elimite
®
|
|
|
Potassium chloride
|
Klor-Con
®
|
|
|
Tacrolimus
|
Protopic
®
|
|
|
Testosterone 1% gel
|
Androgel
|
|
|
Testosterone cypionate injection
|
Depo
®
, Testosterone
|
|
|
Triamcinolone acetonide nasal spray
|
Nasacort
®
AQ
|
|
|
Triamcinolone cream/ointment
|
Triderm™/Kenalog™
|
|
(1)
Contains the same active ingredients present in the same dosage form as the comparable brand-name drug
Net sales related to new products totaled (in millions):
|
Year Ended
|
Six Months Ended
|
Year Ended
|
||||||||||||||||||||
|
December 31,
2016 |
December 31,
2015 |
December 31,
2015 |
December 27,
2014 |
June 27,
2015 |
June 28,
2014 |
|||||||||||||||||
|
$
|
68.0
|
|
$
|
118.6
|
|
$
|
41.2
|
|
$
|
40.4
|
|
$
|
117.8
|
|
$
|
104.1
|
|
|||||
During the
year ended
December 31, 2016
, we, on our own or in collaboration with partners, received final approval from FDA health authorities for
four
Rx drug applications, and as of
December 31, 2016
, we had
27
Rx drug applications pending approval.
Sales and Marketing
Our customers include major wholesalers, including Cardinal Health, McKesson, and AmerisourceBergen; sourcing groups such as Red Oak and ClarusOne; national and regional retail drug, supermarket and mass merchandise chains, including Walgreens, Rite Aid, Walmart, CVS, Kroger, and Safeway; hospitals; and pharmacies. ORx
®
products are sold to the consumer through the pharmacy counter of predominantly the same retail outlets as our OTC pharmaceutical products.
14
Perrigo Company plc
- Item 1
RX
Competition
The market for Rx products is subject to intense competition from other generic drug manufacturers, brand-name pharmaceutical companies launching their own generic version of their branded products (known as an authorized generic), manufacturers of branded drug products that continue to produce those products after patent expirations, and manufacturers of therapeutically similar drugs. Among our generic drug manufacturer competitors are Par Pharmeceuticals, Apotex Corp., Glenmark Generics Inc., Impax Laboratories, Inc., Mylan, Prasco, LLC, Sandoz, Sun Pharmaceuticals, Taro Pharmaceuticals, Teva Pharmaceutical Industries Ltd., Triax Pharmaceuticals, LLC, and Zydus Pharmaceuticals, Inc.
We believe that one of our primary competitive advantages is our ability to introduce difficult to develop and/or manufacture topical and other specialty generic versions to brand-name drug products. Generally, these products are exposed to less competition due to the relatively longer and more expensive development, clinical trial, and approval processes. In addition, we believe we have a favorable competitive position due primarily to our efficient distribution systems, topical production economies of scale, customer service, and overall reputation. See
Item 1A. Risk Factors - Risks Related to Operations
for more information and risks associated with competition.
SPECIALTY SCIENCES
Overview
The Specialty Sciences segment is comprised of assets focused on the treatment of multiple sclerosis, specifically in connection with the drug Tysabri
®
(natalizumab). Although we divested these assets in March 2017, during the periods covered by this report, we continued to receive contingent payments related to the Tysabri royalty stream. These contingent payments are based on a royalty percentage on sales revenue generated by the sale, distribution or other use of the drug Tysabri
®
. The Specialty Sciences segment also includes the ongoing obligations under the sale agreement between Biogen and Elan for 50% of losses and expenses arising out of any Tysabri
®
product liability claims, required insurance coverage and related expenses. We have recorded the Tysabri
®
royalty stream as a financial asset and elected to account for this asset using the fair value option method, which incorporates discounted cash flows related to the expected future cash flows to be received. We use significant judgment in determining our valuation inputs, including estimates as to the probability and timing of future sales of Tysabri
®
, as well as estimates of the expected future cash flows. The estimated fair value of the asset is subject to variation should those cash flows vary significantly from our estimates. We have performed an evaluation at each reporting period to assess those estimates, discount rates utilized and general market conditions affecting fair value.
We were entitled to contingent payments from Biogen based on its Tysabri
®
sales for all indications and geographies. We received contingent payments that were based on royalties of
12%
on worldwide Biogen sales of Tysabri
®
from December 18, 2013 through April 30, 2014. As of May 1, 2014, we received royalties of 18% on annual worldwide Biogen sales of Tysabri
®
up to
$2.0 billion
and
25%
on annual sales above
$2.0 billion
. The cash received from Biogen for the royalty percentage on Tysabri
®
sales is recorded as cash flows from investing activities in our Consolidation Statements of Cash Flow.
Recent Developments
|
•
|
In February 2016, a competitor's pipeline product, Ocrevus
®
, received breakthrough therapy designation from the FDA and was approved in 2017. The product is expected to compete with Tysabri
®
and have a significant negative impact on the Tysabri
®
royalty stream. Although the product has not launched, industry analysts believe that based on released clinical study information, Ocrevus
®
will favorably compete against Tysabri
®
in the relapsing, remitting multiple sclerosis market segment due to its high efficacy and convenient dosage form.
|
15
Perrigo Company plc
- Item 7
Specialty Sciences
|
•
|
On November 15, 2016, Biogen received additional intellectual property protection for Tysabri
®
as they were granted a new patent in the U.S. with coverage to 2027.
|
|
•
|
On
March 27, 2017
, we announced the completed divestment of our Tysabri
®
royalty stream to Royalty Pharma for up to
$2.85 billion
, which consists of
$2.2 billion
in cash and up to
$250.0 million
and
$400.0 million
in milestone payments to us if the royalties on global net sales of Tysabri
®
that are received by Royalty Pharma meet specific thresholds in 2018 and 2020, respectively. As a result of this transaction, we will derecognize the Tysabri
®
financial asset in the first quarter of 2017 and we do not expect the disposition to have a material impact on our results.
|
Competition
Tysabri
®
is a complex biological product that is administered under a strict Risk and Evaluation Mitigation Strategy ("REMS") program. The majority of its patents are protected through 2024. In the event that a patent is invalidated or is infringed upon or a biosimilar is introduced, the financial performance of our Specialty Sciences segment would be materially adversely affected. Tysabri
®
competes with many companies that are working to develop successful new therapies or alternative formulations of products for multiple sclerosis, including Ocrevus
®
as mentioned above. If any of these competing products have a similar or more attractive profile in terms of efficacy, convenience, or safety, future sales of Tysabri
®
could be impacted. See
Item 1A. Risk Factors - Risks Related to Operations
for related risks.
OTHER
Overview
We have an Other segment that is primarily comprised of sales of API products, which does not meet the quantitative threshold required to be a separate reportable segment. We develop, manufacture, and market API products, which are used worldwide by both generic and branded pharmaceutical companies. Certain of these ingredients are used in our own pharmaceutical products. The manufacturing of API occurs primarily in Israel with some production in India.
API development is focused on the synthesis of less common molecules for the U.S., European, and other global markets. We commercialize API that are critical to our pharmaceutical customers’ existing portfolios and future product launches, working closely with these customers on development processes. We are also focusing manufacturing and development activities on the synthesis of molecules for use in our own OTC and Rx pipeline products. This vertical integration may enable us to be more competitive in the pricing of our product lines.
Because our API customers depend on high quality supply and regulatory support, we focus on rigorous quality assurance, quality control, and regulatory compliance as part of our strategic positioning. Our quality system is designed to comply with the regulatory requirements of the FDA, the European Medicines Agency ("EMA"), and other regulatory agencies such as the Australian Therapeutic Goods Administration. We are regularly inspected by various regulatory authorities and customers.
Recent Developments
On April 6, 2017, we completed the divestment of our India API business to Strides Shasun Limited. As of December 31, 2016, the net assets of our India API business were classified as "held for sale" as discussed in
Item 8. Note 9
. The sale is not expected to have a material impact on our operations or result in a significant gain or (loss) when recorded in the second quarter of 2017.
On February 27, 2017, we announced we were exploring strategic alternatives for our Israel API operations.
16
Perrigo Company plc
- Item 1
Other
Competition
Since other manufacturers of API typically do not offer all of the same product lines or serve all of the same markets as we do, the business competes on a product-by-product basis with a number of different competitors. Our API category is subject to increased price competition from other manufacturers of API located mostly in India, China, and Europe. See
Item 1A. Risk Factors - Risks Related to Operations
for information and risks associated with competition.
INFORMATION APPLICABLE TO ALL REPORTABLE SEGMENTS
Research and Development
R&D is a key component
of our business strategy and is performed in various locations in the countries in which we operate. While we conduct a significant amount of our own R&D, we also enter into strategic alliance agreements to obtain the rights to manufacture and/or distribute new products. R&D investments were as follows (in millions):
|
Year Ended
|
Six Months Ended
|
Year Ended
|
||||||||||||||||||||
|
December 31,
2016 |
December 31,
2015 |
December 31,
2015 |
December 27,
2014 |
June 27,
2015 |
June 28,
2014 |
|||||||||||||||||
|
$
|
184.0
|
|
$
|
186.3
|
|
$
|
88.2
|
|
$
|
89.8
|
|
$
|
187.8
|
|
$
|
152.5
|
|
|||||
During the
years ended
December 31, 2016
and
June 28, 2014
, we wrote off capitalized in-process research and development from previous acquisitions totaling
$3.5 million
and
$6.0 million
, respectively, due to changes in the projected development and regulatory timelines for various projects.
The
year ended
December 31, 2016
included R&D expense related to clinical trial expenses primarily in our
CHCA
and
RX
segments. The
year ended
December 31, 2015
included incremental R&D expense due to the Omega acquisition, and clinical trial expenses primarily in our
CHCA
and
RX
segments. The
six months ended
December 31, 2015
included incremental R&D expense due to the Omega acquisition. The
six months ended
December 27, 2014
included a $10.0 million payment made in connection with our entry into a collaboration arrangement. The
year ended
June 27, 2015
also included incremental R&D expense due to the Omega acquisition, as well as the payment made in relation to the collaboration arrangement noted above, and an R&D contractual arrangement under which we funded $18.0 million of R&D. The
year ended
June 28, 2014
included incremental R&D expense attributable to the Sergeant's Pet Care Products, Inc. ("Sergeant's") and Velcera Inc. ("Velcera") acquisitions that closed during the previous year, as well as R&D expense related to the ELND005 Phase 2 clinical program in collaboration with Transition Therapeutics, Inc. ("Transition"), which we acquired from Elan. We ended our collaboration with Transition during the third quarter of the
year ended
June 28, 2014
and are no longer responsible for ongoing development activities and costs associated with ELND005.
We anticipate that R&D expenditures will increase in dollar terms but will remain relatively flat to slightly higher as a percentage of net sales for the foreseeable future as we continue to cultivate our presence in the Rx-to-OTC switch and generic pharmaceutical markets,
and develop our internal R&D capabilities.
See
Item 1A. Risk Factors - Risks Related to Operations
for risks associated with innovation and R&D.
Trademarks and Patents
While we own certain trademarks and patents, neither our business as a whole, nor any of our segments, is materially dependent upon our ownership of any one trademark, or patent, or group of trademarks or patents.
17
Perrigo Company plc
- Item 1
Materials Sourcing
Affordable high quality raw materials and packaging components are essential to all of our business units due to the nature of the products we manufacture. Raw materials and packaging components are generally available from multiple suppliers. Supplies of certain raw materials, bulk tablets, and components are limited, as they are available from one or only a few suppliers. While we have the ability to manufacture and supply certain API for our OTC and Rx products, an increasing number of components and finished goods are purchased rather than manufactured because of temporary production limitations, FDA restrictions, economic conditions, or other factors.
Historically, we have been able to react effectively to situations that require alternate sourcing. Should such alternate sourcing be necessary, FDA requirements placed on products approved through the ANDA or NDA process could substantially lengthen the approval of an alternate source and adversely affect financial results. We believe we have good, cooperative working relationships with substantially all of our suppliers and have historically been able to capitalize on economies of scale in the purchase of materials and supplies due to our volume of purchases. See
Item 1A. Risk Factors - Risks Related to Operations
for risks associated with materials sourcing.
Manufacturing and Distribution
Our primary manufacturing facilities are in the U.S. We also have secondary manufacturing facilities in the U.K., Belgium, France, Germany, Austria, Israel, Mexico, Australia, and India, along with a joint venture in China. See
Item 1A. Risk Factors - Risks Related to Operations
for risks associated with our manufacturing facilities. We supplement our production capabilities with the purchase of products from outside sources. The capacity of some facilities may be fully utilized at certain times for various reasons, such as customer demand, the seasonality of the cough/cold/flu, allergy, or flea and tick seasons, and new product launches. We may utilize available capacity by performing contract manufacturing for other companies. We have logistics facilities in the U.S., Israel, Mexico, Australia, and numerous locations throughout Europe. We use contract freight and common carriers to deliver our products.
Significant Customers
Our primary customer base aligns with the concentration of large drug retailers in the current global retail drug industry marketplace. Walmart is our largest customer and accounted for the following percentage of consolidated sales:
|
Year Ended
|
Six Months Ended
|
Year Ended
|
||||||||||||||
|
December 31,
2016 |
December 31,
2015 |
December 31,
2015 |
December 27,
2014 |
June 27,
2015 |
June 28,
2014 |
|||||||||||
|
13
|
%
|
14
|
%
|
13
|
%
|
19
|
%
|
16
|
%
|
19
|
%
|
|||||
Sales to Walmart are primarily in the
CHCA
segment. As a percentage of our total U.S. OTC sales, our sales to Walmart generally align with Walmart's U.S. retail market share in the products we sell to them. In addition, while no other customer individually comprises more than 10% of net sales, we do have other significant customers. We believe we generally have good relationships with all of our customers. See
Item 1A. Risk Factors - Risks Related to Operations
for risks associated with customers.
Environmental
We are subject to various environmental laws and regulations. We have made, and continue to make, expenditures necessary to comply with applicable environmental laws, but do not believe that the costs for complying with such laws and regulations have been or will be material to our business. We do not have any material remediation liabilities outstanding.
While we believe that climate change could present risks to our business, including increased operating costs due to additional regulatory requirements, physical risks to our facilities, water limitations, and disruptions to our supply chain, we do not believe these risks are material to our business in the near term.
18
Perrigo Company plc
- Item 1
Corporate Social Responsibility
We are committed to doing business in an ethical manner. We have a long history of environmentally sound and efficient operations, safe and healthy working conditions, and active participation in the communities where we are located. As reflected in our Corporate Social Responsibility Commitment Statement available on our website, we remain committed to:
|
•
|
Helping consumers access safe, effective and affordable healthcare products;
|
|
•
|
Strong corporate governance;
|
|
•
|
Complying with regulatory and legal requirements;
|
|
•
|
Demonstrating environmental stewardship;
|
|
•
|
Continuously improving packaging sustainability;
|
|
•
|
Protecting human rights of our global employees and challenging our partners to do the same;
|
|
•
|
Diversity of thought, experience and perspective;
|
|
•
|
Providing a safe and healthy work environment for our employees; and
|
|
•
|
Establishing effective community partnerships.
|
Through these efforts, we strive to minimize our impact on the environment, drive responsible business practices, and ensure the welfare of our employees, their families, and the communities in which we operate now and into the future.
GOVERNMENT REGULATION AND PRICING
The manufacturing, processing, formulation, packaging, labeling, testing, storing, distributing, advertising, and sale of our products are subject to regulation by a variety of agencies in the localities in which our products are sold. In addition, we manufacture and market certain of our products in accordance with standards set by various organizations. We believe that our policies, operations, and products comply in all material respects with existing regulations to which we are subject. See
Item 1A. Risk Factors - Risks Related to Operations
for related risks.
United States Regulation
U.S. Food and Drug Administration
The FDA has jurisdiction over our Rx, OTC drug products, API, and Infant Formula Foods. The FDA’s jurisdiction extends to the manufacturing, testing, labeling, packaging, storage, distribution, and promotion of these products. We are committed to consistently providing our customers with high quality products that adhere to "current Good Manufacturing Practices" ("cGMP") regulations promulgated by the FDA.
OTC and Rx Pharmaceuticals
All facilities where Rx and OTC products are manufactured, tested, packaged, stored, or distributed for the U.S. market must comply with FDA cGMPs and regulations promulgated by competent authorities in the countries, states and localities where the facilities are located. All of our drug products are manufactured, tested, packaged, stored, and distributed according to cGMP regulations. The FDA performs periodic audits to ensure that our facilities remain in compliance with all appropriate regulations.
Many of our OTC products are regulated under the OTC monograph system and subject to certain FDA regulations. Under this system, selected OTC drugs are generally recognized as safe and effective and do not require the approval of an ANDA or NDA prior to marketing. Products marketed under the OTC monograph system must conform to specific quality, formula, and labeling requirements, including permitted indications, required warnings and precautions, allowable combinations of ingredients, and dosage levels. It is generally less costly to develop and bring to market a product regulated under the OTC monograph system.
We also market generic prescription drugs and non-prescription products that have switched from prescription to OTC status. Prior to commercial marketing, these products require approval by the FDA of an ANDA or NDA that provides information on chemistry, manufacturing controls, clinical safety, efficacy and/or bioequivalence, packaging, and labeling. While the development process for these drugs generally requires less
19
Perrigo Company plc
- Item 1
Regulation
time and expense than the development process of a new drug, the size and duration of required studies can vary greatly. Prior to the onset of the Generic Drug User Fee Amendments of 2012 (“GDUFA”), the FDA approval of generic drug applications took approximately three to five times longer than approval of innovator drugs. Median ANDA approval times were reported at approximately
48
months. Pursuant to GDUFA, beginning October 1, 2016, year five of the program, the FDA pledged to complete a first cycle review on 90% of electronic generic applications within
10
months of submission. The FDA has ceased reporting median ANDA approval times, however the generic industry has observed continued progress in FDA performance towards reducing ANDA approval times.
Under the Federal Food, Drug and Cosmetic Act, as amended ("FFDCA") (the Hatch-Waxman amendments), a company submitting an NDA can obtain a three-year period of marketing exclusivity for a prescription or OTC product if it performs a clinical study that is essential to FDA approval. Longer periods of exclusivity are possible for new chemical entities, orphan drugs (those designated under section 526 of the FFDCA) and drugs under the Generating Antibiotic Incentives Now Act. During this exclusivity period, the FDA cannot approve any ANDAs for a similar or equivalent generic product, which can preclude another party from marketing a similar product during this period. A company may obtain an additional six months of exclusivity if it conducts pediatric studies requested by the FDA on the product. This exclusivity can delay both the FDA approval and sales of certain products.
A company may be entitled to a 180-day generic exclusivity period for certain products. This exclusivity period often follows a patent certification and litigation process whereby the product innovator may sue for infringement. The legal action does not ordinarily result in material damages, but it generally triggers a statutorily mandated delay in FDA approval of the ANDA for a period of up to 30 months from when the innovator was notified of the patent challenge.
The Food and Drug Administration Safety and Innovation Act ("FDASIA") was signed into law on July 9, 2012. The law established, among other things, new user fee statutes for generic drugs and biosimilars, FDA authority concerning drug shortages, changes to enhance the FDA's inspection authority of the drug supply chain, and a limited extension of the 30-month stay provision described above. The FDASIA also reduced the time required for FDA responses to generic-blocking citizen petitions. We implemented new systems and processes to comply with the new facility self-identification and user fee requirements of the FDASIA, and we monitor facility self-identification and fee payment compliance to mitigate the risk of potential supply chain interruptions or delays in regulatory approval of new applications.
The U.S. government's Federal Drug Supply Chain Security Act ("DSCSA") requires development of an electronic pedigree to track and trace each prescription drug at the salable unit level through the distribution system, which will be effective incrementally over a 10-year period. The serialization of all Rx products distributed in the U.S. needs to be completed by November 27, 2017, with the requirement for tracking the products commencing on November 27, 2023. Requirements for the tracing of products at the lot level through the pharmaceutical distribution supply chain went into effect on January 1, 2015 for manufacturers, wholesale distributors, and re-packagers, and on July 1, 2015 for dispensers.
Infant Formula and Foods
The FDA’s Center for Food Safety and Applied Nutrition is responsible for the regulation of infant formula. The Office of Nutrition, Labeling and Dietary Supplements ("ONLDS") has labeling responsibility for infant formula, while the Office of Food Additive Safety ("OFAS") has program responsibility for food ingredients and packaging. The ONLDS evaluates whether an infant formula manufacturer has met the requirements under the FFDCA and consults with the OFAS regarding the safety of ingredients in infant formula and of packaging materials for infant formula.
All manufacturers of pediatric nutrition products must begin with safe food ingredients, which are either generally recognized as safe or approved as food additives. The Infant Formula Act provides specific requirements for infant formula to ensure the safety and nutrition of infant formulas, including minimum and, in some cases, maximum levels of specified nutrients.
Before marketing a particular infant formula, the manufacturer must provide regulatory agencies assurance of the nutritional quality of that particular formulation consistent with the FDA’s labeling, nutrient content, and
20
Perrigo Company plc
- Item 1
Regulation
manufacturer quality control requirements. A manufacturer must notify the FDA at least 90 days before the marketing of any infant formula that differs fundamentally in processing or in composition from any previous formulation produced by the manufacturer. We actively monitor this process and make the appropriate adjustments to remain in compliance with recent FDA rules regarding cGMP, quality control procedures, quality factors, notification requirements, and reports and records for the production of infant formulas.
In addition, the FFDCA requires infant formula manufacturers to test product composition during production and shelf-life; to keep records on production, testing, and distribution of each batch of infant formula; to use cGMP and quality control procedures; and to maintain records of all complaints and adverse events, some of which may reveal the possible existence of a health hazard. The FDA conducts yearly inspections of all facilities that manufacture infant formula, inspects new facilities during early production runs, and collects and analyzes samples of infant formula.
Our infant and toddler foods are subject to the Food Safety Modernization Act ("FSMA"), which protects the safety of U.S. foods by mandating comprehensive, prevention-based controls within the food industry. Under FSMA, the FDA has mandatory recall authority for all food products and greater authority to inspect food producers and is taking steps toward product tracing to enable more efficient product source identification in the event of a safety issue.
Active Pharmaceutical Ingredients
We develop and manufacture API in Israel and India for export to the U.S. and other global markets. Before API can be commercialized in the U.S., we must submit a drug master file ("DMF") that provides the proprietary information related to the manufacturing process. The FDA inspects the manufacturing facilities to assess cGMP compliance, and the facilities and procedures must be cGMP compliant before API may be exported to the U.S.
The facilities and products are subject to regulation by the applicable regulatory bodies in the place of manufacture as well as the regulatory agency in the country from which the product is exported or imported. Our Israeli facility has been approved by the U.S. FDA, Israel Ministry of Health ("IMOH"), Federal Commission for the Protection against Sanitary Risks of Mexico, Pharmaceutical and Medical Devices Agency of Japan, and the Korean Food and Drug Administration and has received GMP certification from IMOH. Our India facility has been inspected by the U.S. FDA and has received GMP certification from the Indian FDA.
For API exported to European markets, we submit a European DMF and, where applicable, obtain a certificate of suitability from the European Directorate for the Quality of Medicines. The manufacturing facilities and production procedures for API marketed in Europe must meet EU-GMP and European Pharmacopeia standards.
U.S. Department of Agriculture
The Organic Foods Production Act enacted under Title 21 of the 1990 Farm Bill established uniform national standards for the production and handling of foods labeled as "organic." Our infant formula manufacturing sites in Vermont and Ohio adhere to the standards of the U.S. Department of Agriculture ("USDA") National Organic Program for production, handling, and processing to maintain the integrity of organic products. Our infant formula manufacturing sites in Vermont and Ohio are USDA-certified, enabling them to produce and label organic products for U.S. and Canadian markets.
U.S. Environmental Protection Agency
The U.S. Environmental Protection Agency ("EPA") is the main regulatory body in the United States for veterinary pesticides. The EPA's Office of Pesticide Programs is responsible for the regulation of pesticide products applied to animals. All manufacturers of animal health pesticides must show that their products will not cause “unreasonable adverse effects to man or the environment” as stated in the Federal Insecticide, Fungicide, and Rodenticide Act. Within the United States, pesticide products that are approved by the EPA must also be approved by individual state pesticide authorities before distribution in that state. Post-approval monitoring of products is required, with reports provided to the EPA and some state regulatory agencies.
21
Perrigo Company plc
- Item 1
Regulation
U.S. Drug Enforcement Administration
The U.S. Drug Enforcement Administration ("DEA") regulates certain drug products containing controlled substances, such as morphine, hydromorphone, opium, testosterone, midazolam, and List I chemicals, such as pseudoephedrine, pursuant to the federal Controlled Substances Act ("CSA"). The CSA and DEA regulations impose registration, security, record keeping, reporting, storage, manufacturing, distribution, importation and other requirements upon legitimate handlers under the oversight of the DEA. The DEA categorizes controlled substances into Schedules I, II, III, IV, or V, with varying qualifications for listing in each schedule. We are subject to the requirements regarding the controlled substances in Schedules II - V and the List I chemicals. Our facilities that manufacture, distribute, import, or export any controlled substances must register annually with the DEA.
The DEA inspects all manufacturing facilities to review security, record keeping, reporting, and handling prior to issuing a controlled substance registration, and it also periodically inspects facilities for compliance with the CSA and its regulations. Failure to maintain compliance with applicable requirements, particularly as manifested in the loss or diversion of controlled substances, can result in enforcement action, such as civil penalties, refusal to renew necessary registration, or the initiation of proceedings to revoke those registrations. In certain circumstances, violations could lead to criminal prosecution. We are also subject to state legislation regulating the manufacture and distribution of certain products.
Medicaid Drug Rebate Program and Other Drug Pricing Programs
U.S. law requires that a pharmaceutical manufacturer, as a condition of having federal funds being made available for the manufacturer’s drugs under Medicaid and Medicare Part B, enter into three government pricing program agreements: (i) a Medicaid rebate agreement with the Secretary of Health and Human Services (“HHS”) to pay rebates to state Medicaid programs for the manufacturer’s covered outpatient drugs that are dispensed to Medicaid beneficiaries and paid for by a state Medicaid program; (ii) a 340B program agreement with the Secretary of HHS to provide discounts to certain “covered entity” safety net health care providers; and (iii) a Master Agreement with the Department of Veterans Affairs ("VA") under which discounts are available for purchases by federal agencies. We have such agreements in effect.
The Medicaid rebate agreement requires the drug manufacturer to remit rebates to each state Medicaid agency on a quarterly basis for both fee-for-service and Medicaid managed care organization utilization. Rebate amounts are based on pricing data reported by the manufacturer to the Centers for Medicare & Medicaid Services (“CMS”), including Average Manufacturer Price ("AMP") and, in the case of innovator products, Best Price ("BP"). U.S. law also requires that a company that participates in the Medicaid rebate program report average sales price ("ASP") information to CMS for each calendar quarter for certain categories of drugs that are paid under Part B of the Medicare program. CMS uses these submissions to determine payment rates for drugs under Medicare Part B.
Under the Medicaid rebate program, the minimum rebate amounts due are as follows: (i) for noninnovator products, in general generic drugs marketed under ANDAs, the rebate amount is 13% of the AMP for the quarter; and (ii) for innovator products, in general brand-name products marketed under NDAs, the rebate amount is the greater of 23.1% of the AMP for the quarter or the difference between such AMP and the BP for that same quarter. Manufacturers also pay an “additional rebate" on innovator drugs where price increases since launch have outpaced inflation. Beginning with the first quarter of 2017, an additional rebate is due for noninnovator products, which is calculated somewhat differently from the innovator product additional rebate.
CMS issued a final regulation, generally effective April 1, 2016, to implement changes to the Medicaid rebate program under the 2010 health reform legislation (“Health Reform Law”) and otherwise to program guidance. In addition to this guidance concerning rebate program administration matters, the regulation also addressed certain related Medicaid reimbursement matters. First, under the Health Reform Law, CMS has also begun to use manufacturer AMP data to calculate reimbursement limits for pharmacies for multiple source drugs under the Medicaid program, known as the federal upper limit ("FUL"). CMS also surveys and publishes retail community pharmacy acquisition cost information to provide state Medicaid agencies with a basis for comparing their own reimbursement and pricing methodologies and rates. Second, the regulation also directs states to update their Medicaid payment methodologies to provide for payment amounts designed to reflect pharmacies’ actual acquisition costs for drugs and to provide the government with findings to support their compliance with this standard.
22
Perrigo Company plc
- Item 1
Regulation
Pricing and rebate calculations are governed by statutory and regulatory requirements that are complex, vary among products and programs, can change over time, and are subject to interpretation by us, governmental or regulatory agencies
,
and the courts. In the case of the Medicaid rebate program, if we become aware of errors in our prior price submissions, or a prior BP submission needs to be updated due to late arriving data, we must resubmit the updated data within specified time frames. Such restatements and recalculations increase our cost of compliance with the Medicaid rebate program, and corrections can result in an overage or underage of our rebate liability for past quarters, depending on the nature of the correction.
The 340B drug pricing program requires participating manufacturers to agree to charge statutorily-defined covered entities no more than the 340B “ceiling price” for the manufacturer’s covered outpatient drugs. The ceiling price is derived from the data the manufacturer reports under the Medicaid rebate program and therefore any changes to statutory or regulatory requirements applicable to the Medicaid price figures may impact the 340B ceiling price calculation as well. 340B covered entities include a variety of community health clinics and other entities that receive health services grants from the Public Health Service, as well as hospitals that serve a disproportionate share of low-income patients.
U.S. law also requires any company that participates in the Medicaid rebate program and Medicare Part B and that wants its covered drugs paid for by certain federal agencies and grantees to enter into a Master Agreement with the VA. Under the Master Agreement, the company must offer its innovator drugs for procurement under the Federal Supply Schedule (“FSS”) pricing program, and must charge certain agencies (VA, Department of Defense, Public Health Service and the Coast Guard) no more than a statutory Federal Ceiling Price (“FCP”). The FCP is calculated based on Non-Federal Average Manufacturer Price (“NFAMP”) data we submit to the VA. FSS contracts include extensive disclosure and certification requirements and standard government terms and conditions with which we must comply. Consistent with VA’s interpretation of the Master Agreement, we have also entered into an agreement to pay rebates on covered drug prescriptions dispensed to TRICARE beneficiaries by TRICARE network retail pharmacies. See
Item 1A. Risk Factors - Risks Related to Operations
for risks related to the above-mentioned programs.
Other U.S. Regulations and Organizations
We are subject to various other national, state, non-governmental, and local agency rules and regulations. Compliance with the laws and regulations regarding the manufacture and sale of our current products and the discovery, development, and introduction of new products requires substantial effort, expense and capital investment. Other regulatory agencies, organizations and legislation that may impact our business include, but are not limited to:
|
•
|
Physician Payment Sunshine Act
- This act requires certain pharmaceutical manufacturers to engage in extensive tracking of payments or transfers of value to physicians and teaching hospitals, maintenance of a payment database and public reporting of the payment data.
|
|
•
|
Foreign Corrupt Practices Act of 1977 ("FCPA")
- This act and other similar anti-bribery laws prohibit companies and their intermediaries from providing money or anything of value to officials of foreign governments, foreign political parties or international organizations with the intent to obtain or retain business or seek a business advantage.
|
|
•
|
Federal Trade Commission ("FTC")
- This agency oversees the advertising and other promotional practices of consumer products marketers. The FTC considers whether a product’s claims are substantiated, truthful and not misleading. The FTC also reviews mergers and acquisitions of companies exceeding specified thresholds and investigates certain business practices relevant to the healthcare industry.
|
|
•
|
International Organization for Standardization ("ISO")
- The ISO Standards specify requirements for a Quality Management System that demonstrates the ability to consistently provide products that meet customer and applicable regulatory standards and includes processes to ensure continuous improvement. Our infant formula manufacturing sites are ISO 9001-2008 Certified for Quality Management Systems. ISO inspections are conducted at least annually.
|
23
Perrigo Company plc
- Item 1
Regulation
|
•
|
United States Pharmacopeial Convention, Inc. ("USP")
- The USP is a non-governmental, standard-setting organization. By reference, the FFDCA incorporates the USP quality and testing standards and monographs as the standard that must be met for the listed drugs, unless compliance with those standards is specifically disclaimed on the product’s labeling. USP standards exist for most Rx and OTC pharmaceuticals and many nutritional supplements. The FDA typically requires USP compliance as part of cGMP compliance.
|
|
•
|
Health Insurance Portability and Accountability Act ("HIPAA")
- We could be subject to criminal penalties if we knowingly obtain individually identifiable health information from a covered entity in a manner that is not authorized or permitted by HIPAA or for aiding and abetting the violation of HIPAA.
|
|
•
|
Consumer Product Safety Commission ("CPSC")
- The CPSC has published regulations requiring child resistant packaging on certain products including pharmaceuticals and dietary supplements. The manufacturer of any product that is subject to any CPSC rule, ban, standard or regulation must certify that, based on a reasonable testing program, the product complies with CPSC requirements.
|
|
•
|
Other State Agencies
- We are subject to regulation by numerous other state health departments, insurance departments, boards of pharmacy, state controlled substance agencies, state consumer health and safety regulations, and other comparable state agencies, each of which have license requirements and fees that vary by state.
|
Regulation Outside the U.S.
We develop and manufacture products and market third-party manufactured products in regions outside the U.S., including Eastern and Western Europe, Israel, Mexico, Australia, countries in Asia, South America, the Middle East, and Russia, each of which has its own regulatory environment. The majority of our sales outside the U.S. are in the following categories: OTC/Rx pharmaceuticals, medical devices, dietary supplements and cosmetics.
European Union
OTC and Rx Pharmaceuticals
The European pharmaceutical industry is highly regulated and much of the legislative and regulatory framework is driven by the European Parliament and the European Commission. This has many benefits, including the potential to harmonize standards across the complex European market. However, obtaining regulatory agreement across member states presents complex challenges that can lead to delays in the regulatory process.
In the European Union (“EU”), as well as many other locations around the world, the manufacture and sale of medicinal products is regulated in a manner substantially similar to that of the U.S. requirements, which generally prohibit the handling, manufacture, marketing, and importation of any medicinal product unless it is properly registered in accordance with applicable law. The registration file relating to any particular product must contain data related to product efficacy and safety, including results of clinical testing and/or references to medical publications, as well as detailed information regarding production methods and quality control. Health ministries are authorized to cancel the registration of a product if it is found to be harmful or ineffective or if it is manufactured or marketed other than in accordance with registration conditions.
Between 1995 and 1998, the over-arching legislation that governs medicinal products was revised in an attempt to simplify and harmonize product registration. This revised legislation introduced the mutual recognition procedure (“MRP”), whereby after approval of a marketing authorization by regulatory authorities in the reference member state (“RMS”), additional marketing authorizations could be submitted to other concerned member states to obtain a product license. In November 2005, the medicinal product legislation was further revised to introduce the decentralized procedure (“DCP”) whereby marketing authorizations are submitted simultaneously to the RMS and select concerned member states. In 2005, the EMA also opened up the centralized procedure to sponsors of marketing authorizations for generic medicinal products. Unlike the MRP and DCP, the centralized procedure results in a single marketing authorization and product labeling across all member states that will allow a sponsor to file for individual country reimbursement and make the medicine available in all the EU countries listed on the application.
24
Perrigo Company plc
- Item 1
Regulation
Marketing authorizations and subsequent product licenses are granted to applicants only after the relevant health authority issues a positive assessment of quality, safety and efficacy of the product.
In addition to obtaining marketing authorization for each product, all member states require that a manufacturer’s facilities obtain approval from an EU Regulatory Authority. The EU has a code of GMP that each manufacturer must follow and comply with. Regulatory authorities in the EU may conduct inspections of the manufacturing facilities to review procedures, operating systems, and personnel qualifications. We believe that our policies, operations and products comply in all material respects with existing regulations to which our operations are subject.
EU Member States had to transpose the European Falsified Medicines Directive (the “Directive”) into national law by January 2, 2013. The transposition process is now complete. The provisions of the Directive are intended to reduce the risk of counterfeit medicines entering the supply chain and also to ensure the quality of API manufactured outside of the EU. The Directive required the serialization of all Rx and some OTC products, similar to the DSCSA in the U.S.
In the EU, member states regulate the pricing of prescription medicinal products, and in some cases, the formulation and dosing of products. This regulation is handled by individual member state national health services. These individual regulatory bodies can result in considerable price differences and product availability among member states. The implementation of tendering systems for the pricing of pharmaceuticals in several countries generally impacts drug pricing for generics; generally “tendering” refers to a system that requires bids to be submitted to the government by competing manufacturers to be the exclusive, or one of a few, suppliers of a product in a particular country.
Data exclusivity provisions exist in many countries, although the application is not uniform. In general, these exclusivity provisions prevent the approval and/or submission of generic drug applications to the health authorities for a fixed period of time following the first approval of the brand-name product in that country. As these exclusivity provisions operate independently of patent exclusivity, they may prevent the submission of generic drug applications for some products even after the patent protection has expired.
The requirements deriving from European pharmacovigilance legislation are constantly expanding due to increasing guidance on good vigilance practices and increased communication on inspectors’ expectations. Pharmacovigilance fee legislation became effective in late 2014 to support health authority assessment of pharmacovigilance safety evaluation reports, study protocols for post authorization safety studies and referrals. Once approved, the advertising of pharmaceuticals in the EU is governed by national regulations and guidelines. Within certain member states this is overseen by a self-certification process whereas in others national governance bodies approve material prior to release.
The wholesale distribution of medicinal products is an important activity in the integrated supply chain management. The quality and the integrity of medicinal products can be affected by a lack of adequate control. To this end, the EU Commission has published guidelines on Good Distribution Practice of medicinal products for human use in 2013. The present guidelines are based on Articles 84 and 85b(3) of medicinal products for human use directive.
Medical Devices
The EU has enacted into law numerous directives and adopted many harmonizing standards pertaining to a wide range of industrial products, including medical devices. Medical devices that comply with the requirements of applicable directives are entitled to bear the CE marking of conformity, which indicates that the device conforms to the applicable requirements of the directives and, accordingly, can be commercially distributed throughout Europe. The method of assessing conformity varies depending on the class of the product, but normally involves a combination of self-assessment by the manufacturer and a third-party assessment by a Notified Body, an organization accredited by a member state. Assessment by a Notified Body includes an audit of the manufacturer’s quality system and may also include specific testing of the product. This assessment is a prerequisite for a manufacturer to commercially distribute the product throughout the EU.
Dietary Supplements
25
Perrigo Company plc
- Item 1
Regulation
Dietary supplements are subject to several regulations that inform the selection of ingredient levels and how products can be described on packaging and in advertising. These regulations include: Food Supplements Directive 2002/46/EC, Food Information to Consumers Regulation (EU) No 1169/2011, Permitted Vitamins and Minerals Regulation (EC) 1170/2009, Food Additives Regulation (EC) 1333/2008, and Nutritional & Health Claims Regulation (EC) No 1924/2006, and starting in July 2016, the Foods Intended for Particular Nutritional Uses Directive 2009/39/EC & Regulation (EU) 609/2013.
EU rules on nutrition and health claims, which were established by Regulation EC 1924/2006, apply to any nutritional or health claim by a manufacturer. The objective of the regulation is to ensure that claims made in food labeling or advertising are clear, accurate and based on scientific evidence. The European Food Safety Authority, an advisory panel to the European Commission, performs all scientific assessments of health claims on food and supplement labels. An EU register of nutrition and health claims exists to document approved, pending, and rejected claims.
Cosmetics
Cosmetic products in the EU market must comply with Regulation EC No. 1223/2009. This regulation requires manufacturers to prepare a product safety report prior to placing a cosmetic product in the market. In addition, for each cosmetic product placed in the market, a “responsible person” must be designated to oversee compliance with the regulation’s reporting requirements. Commission Regulation EU No. 655/2013 establishes the common criteria and justification for claims to be used in the packaging and advertising of cosmetics products.
Employees
As of
December 31, 2016
, we had approximately
12,800
full-time and temporary employees worldwide of which a small portion of employees were covered by collective bargaining agreements. We consider our employee relations generally satisfactory.
Available Information
Our principal executive offices are located at Treasury Building, Lower Grand Canal Street, Dublin 2, Ireland and our North American base of operations is located at 515 Eastern Avenue, Allegan, Michigan 49010. Our telephone number is +353 1 7094000. Our website address is
www.perrigo.com
, where we make available free of charge our reports on Forms 10-K, 10-Q and 8-K, including any amendments to these reports, as soon as reasonably practicable after they are electronically filed with or furnished to the Securities and Exchange Commission ("SEC"). These filings are also available to the public at
www.sec.gov
and
www.isa.gov.il
.
|
ITEM 1A.
|
RISK FACTORS
|
Risks Related to Operations
We face vigorous competition from other pharmaceutical and consumer goods companies that may threaten the commercial acceptance and pricing of our products.
We operate in a highly competitive environment. Our products compete against store brand, generic, and branded pharmaceutical companies. Competition is also impacted by changes in regulations and government pricing programs that may give competitors an advantage.
|
•
|
As a manufacturer of generic versions of brand-name drugs through our
CHCA
and
RX
segments, we experience competition from brand-name drug companies that may try to prevent, discourage or delay the use of generic versions through various measures, including introduction of new branded products, legislative initiatives, changing dosage forms or dosing regimens, regulatory processes, filing new patents or patent extensions, lawsuits, citizens’ petitions, and negative publicity prior to introduction of a generic product. In addition, brand-name competitors may lower their prices to compete with generic products, increase advertising, or launch, either through an affiliate or licensing arrangements with another company, an authorized generic at or near the time the first generic product is launched, depriving the generic product potential market exclusivity.
|
26
Perrigo Company plc
- Item 1A
Risk Factors
|
•
|
Our
CHCA
and
RX
segments also experience competition from our generic competitors, some of whom are significantly larger than we are, who may develop their products more rapidly or complete regulatory approval processes sooner, or may market their products earlier than we do. In the U.S., if we are not the first to file our ANDA, the FDA may grant 180-day exclusivity to another company, which would prevent us from selling the product during the exclusivity period. Even if we are the first to file, in certain circumstances, we may not be able to fully exploit our 180-day exclusivity period.
|
|
•
|
Our
CHCA
and
RX
segments may experience increased price competition as other generic companies produce the same product, sometimes for dramatically lower margins in order to gain market share. Other generic companies may introduce new drugs and/or drug delivery techniques that make our current products less desirable. A drug may be subject to competition from alternative therapies during the period of patent protection or regulatory exclusivity, and thereafter we may be subject to further competition from generic products or biosimilars.
|
|
•
|
The pharmaceutical industry is consolidating. This creates larger competitors and places further pressure on prices, development activities, and customer retention. Our animal health category within the
CHCA
segment has seen an increase in direct to consumer advertising by several branded competitors, which may increase in the future, and our nutritionals category has experienced increased competition through alternative channels such as health food stores, direct mail, and direct sales.
|
|
•
|
We develop and distribute branded products primarily through our
CHCI
segment. We experience competition from other brand-name drug companies, many of which are larger and have more resources to devote to advertising and marketing. These direct competitors may be able to adapt more quickly to changes in customer requirements. Our current and future competitors may develop products comparable or superior to those offered by us at more competitive prices. If we are unable to compete successfully, our business will be harmed through loss of customers or increased negative pricing pressure that would adversely affect our ability to generate revenue and adversely affect our operating results.
|
If we do not continue to develop, manufacture, and market innovative products that meet customer demands, we may lose market share and our net sales may be negatively impacted.
Our continued growth is due in large part to our ability to develop, manufacture, and market products that meet customer requirements for quality, safety, efficacy, and cost effectiveness. Continuous introductions of new products and product categories are critical to our business. If we do not continue to develop, manufacture, and market new products, we could lose market share, and our net sales may be negatively impacted. See
Item 1. Business - Research and Development
for more information.
|
•
|
We maintain a diversified product line to function as a primary supplier for our customers. Capital investments are driven by growth, technological advancements, cost improvement and the need for manufacturing flexibility. Our future capital expenditures could vary materially due to the uncertainty of these factors. In addition, if we fail to stay current with the latest manufacturing, information and packaging technology, we may be unable to competitively support the launch of new product introductions.
|
|
•
|
Our product margins may decline over time due to our products' aging life cycles, changes in consumer choice, changes in competition for our existing products, or the introduction of next generation innovative products; therefore, new product introductions are necessary to maintain our current financial condition. If we are unable to continue to create new products, we may lose market share or experience pricing pressure, and our net sales may be negatively impacted.
|
|
•
|
We must prove that the regulated generic drug products in our
CHCA
and
RX
segments are bioequivalent to their branded counterparts, which requires bioequivalence studies, and in the case of topical products, even more extensive clinical endpoint trials to demonstrate their efficacy. The development and commercialization process, particularly with respect to innovative products, is both time consuming and costly, and subject to a high degree of business risk. Products currently under development may require re-design to meet evolving FDA standards, may not perform as expected, may not pass required bioequivalence studies, or may be the subject of intellectual property challenges. Necessary regulatory
|
27
Perrigo Company plc
- Item 1A
Risk Factors
approvals may not be obtained in a timely manner, if at all. Any of these events may negatively impact our net sales.
|
•
|
Our ability to attract and retain scientists proficient in emerging delivery forms and/or contracting with a third party in order to generate new products of this type is critical to our long-term plans. If we fail to attract and retain this talent, our long-term sales growth and profit could be adversely impacted.
|
|
•
|
Even upon the successful development of a product, our customers' failure to launch a product successfully, or delays in manufacturing, could adversely affect our operating results. In addition, the FDA or similar regulatory agency could impose higher standards and additional requirements, such as requiring more supporting data and clinical data than previously required, in order to gain regulatory clearance to launch new formulations into the market, which could negatively impact our future net sales.
|
Our
CHCA
and
CHCI
segments are impacted by changes in consumer preferences. If we are unable to adapt to these changes, we may lose market share and our net sales may be negatively impacted.
While the market for store brand products has grown in recent years, there can be no assurance that the pace of this growth will continue. Consumer preferences related to health and nutritional concerns may change, which could negatively impact demand for our
CHCA
and
CHCI
products or cause us to incur additional costs to change our products or product packaging.
|
•
|
The future growth and stability of U.S. store brand market share will be impacted, in part, by general economic conditions, which can influence consumers to switch to and from store brand products. Our
CHCA
segment sales could be negatively affected if economic conditions improve and consumers return to purchasing higher-priced brand-name products. Conversely, while store brand products present an alternative to higher-priced branded products, if economic conditions deteriorate, our
CHCA
segment sales could be negatively impacted if consumers forgo obtaining healthcare or reduce their healthcare spending.
|
|
•
|
Our
CHCI
segment's success is dependent on the continued growth in demand for its lifestyle products, which include weight-loss products and various dietary supplements. If demand for these products decreases, our
CHCI
segment's results of operations would be negatively impacted.
|
|
•
|
Our
CHCA
customers may request changes in packaging to meet consumer demands, which could cause us to incur inventory obsolescence charges and redesign costs, which in turn would negatively impact our
CHCA
segment's results of operations.
|
|
•
|
Our infant formula product category within our
CHCA
segment is subject to changing consumer preferences and health and nutrition-related concerns. Our business depends, in part, on consumer preferences and choices, including the number of mothers who choose to use infant formula products rather than breastfeed their babies. To the extent that private, public, and government sources may promote the benefits of breastfeeding over the use of infant formula, there could be a reduced demand for infant formula products. We could also be adversely impacted by an increase in the number of families that are provided with infant formula by the U.S. federal government through the Women, Infants and Children program, as we do not participate in this program.
|
We operate in a highly regulated industry, and any inability to timely meet current or future regulatory requirements could have a material adverse effect on our business, financial position, and operating results.
We are subject to the regulations of a variety of U.S. and non-U.S. agencies related to the manufacturing, processing, formulation, packaging, labeling, testing, storing, distribution, advertising, and sale of our products as described in detail in
Item 1. Business - Government Regulation and Pricing
. Government regulation in the markets in which we operate could impact our business, and our future results could be adversely affected by changes in such regulations or policies. Below are some of the ways in which government regulation could impact our business and/or financial results:
28
Perrigo Company plc
- Item 1A
Risk Factors
|
•
|
We must obtain approval from the appropriate regulatory agencies in order to manufacture and sell our products in the regions in which we operate. Obtaining this approval can be time consuming and costly. There can be no assurance that, in the event we submit an application for a marketing authorization to any global regulatory agency, we will obtain the approval to market a product and/or that we will obtain it on a timely basis. Laws unique to the U.S. regulatory framework encourage generic competition by providing eligibility for first generic marketing exclusivity if certain conditions are met. If we are granted generic exclusivity, the exclusivity may be shared with other generic companies, including authorized generics; or it is possible that we may forfeit 180-day exclusivity if we do not obtain regulatory approval or begin marketing the product within the statutory requirements. Finally, if we are not the first to file our ANDA, the FDA may grant 180-day exclusivity to another company, thereby effectively delaying the launch of our product.
|
|
•
|
Global regulatory agencies regularly inspect our manufacturing facilities and the facilities of our third-party suppliers. The failure of one of our facilities, or a facility of one of our third-party suppliers, to comply with applicable laws and regulations may lead to a breach of representations made to our customers, or to regulatory or government action against us related to the products made in that facility. Such action could include suspension of or delay in regulatory approvals. If the compliance violations are severe, agencies of the government may initiate product seizure, injunction, recall, suspension of production or distribution of our products, loss of certain licenses or other governmental penalties, or civil or criminal prosecution, thereby impacting the reputation of all of our products.
|
|
•
|
In the U.S., the DSCSA requires development of an electronic pedigree to track and trace each prescription drug at the salable unit level through the distribution system, which will be effective incrementally over a 10-year period beginning on January 1, 2015, for manufacturers, wholesale distributors, and re-packagers, and on July 1, 2015 for dispensers. Similarly, the European Commission passed legislation requiring new product packaging ‘safety features’ to prevent falsification of medicinal products primarily within the prescription medicines sector. The act was adopted February 9, 2016. EU member states (with the exception of Belgium, Italy and Greece), and EEA members Norway, Iceland, Liechtenstein and Switzerland must be in compliance within three years, or by February 9, 2019. Belgium, Italy, and Greece have until February 9, 2025 to comply. Marketing Authorization holders will have three years from the publication date to implement the necessary changes or risk forfeiting their product licenses. Compliance with the new U.S. and EU electronic pedigree requirements may increase our operational expenses and impose significant administrative burdens.
|
|
•
|
Global regulatory agencies highly scrutinize any product application submitted to switch a product from physician prescribed Rx to unsupervised OTC use by the general public. The expansion of Rx-to-OTC switches is critical to our future growth. Reluctance of regulatory agencies to approve Rx-to-OTC switches in new product categories could impact that growth.
|
|
•
|
Several bills have been introduced in U.S. Congress that could, if enacted, affect the manufacture and marketing of Rx and OTC drugs including labeling and packaging. For example, the FDA is proposing to change existing regulations to permit generic drug application holders to revise their labeling without prior FDA review to add new safety information that may differ from the corresponding brand drug. The FDA has delayed publication of the Final Rule until April 2017.
If this proposed regulatory change is adopted without further revision, it may eliminate the preemption of certain failure-to-warn claims, with respect to generic drugs, which could have a material adverse impact on our future operating results. Regulatory bodies outside of the U.S. could enact similar legislation. We cannot predict whether further label restrictions may be required, or whether additional regulations in the U.S. or other countries in which we operate, may be passed.
|
|
•
|
Our infant formula products may be subject to barriers or sanctions imposed by countries or international organizations limiting international trade and dictating the specific content of infant formula products. Governments could enhance regulations on the industry aimed at ensuring the safety and quality of dairy products, including, but not limited to, compulsory batch-by-batch inspection and testing for additional safety and quality issues. Such inspections and testing may increase our operating costs related to infant formula products.
|
29
Perrigo Company plc
- Item 1A
Risk Factors
|
•
|
On June 10, 2014, the FDA published a final rule ("FR") entitled "Current Good Manufacturing Practices, Quality Control Procedures, Quality Factors, Notification Requirements, and Records and Reports, for Infant Formula." The FR includes, among other things, new or modified requirements related to infant formula manufacturing, quality controls, record-keeping, and clinical trials. Our infant formula manufacturing facilities have been inspected by the FDA after the effective date of the FR and found to be in full compliance with the new GMP regulations with no corrective actions required
|
|
•
|
Some of our pharmaceutical products are marketed through direct interactions with healthcare professionals, which is known as “detailing.” This activity is subject to extensive regulation under a variety of U.S. laws and regulations, including anti-kickback, anti-bribery, and false claims laws; the FFDCA with respect to claims and off-label promotions; and similar laws in non-U.S. jurisdictions. If our marketing activities are found to be improper, we could be subject to civil and governmental actions and penalties. These risks may increase as non-U.S. jurisdictions adopt new anti-bribery laws and regulations.
|
|
•
|
If we are unable to successfully obtain the necessary quota for controlled substances and List I chemicals, we risk having delayed product launches or failing to meet commercial supply obligations. If we are unable to comply with regulatory requirements for controlled substances and List I chemicals, the DEA, or similar regulatory agency, may take regulatory actions, resulting in temporary or permanent interruption of distribution of our products, withdrawal of our products from the market, or other penalties.
|
|
•
|
Changes to the Medical Device Directive are anticipated in 2017, based on a proposal
for new European Medical Device Regulation, which has been under discussion since 2012. These changes are expected to
include increased supervision by the Notified Bodies by Competent Authorities and revisions to documentation requirements. We will monitor the regulation's progress and cannot currently predict how it will impact the future production and sale of products classified as medical devices.
At this time, work is ongoing to translate the final text of the Regulation in all the EU official languages and to correct technical inconsistencies. Final formal adoption is expected both on the Council and the Parliament sides during the first quarter of 2017
.
|
|
•
|
Our operations extend to numerous countries outside the U.S. and are subject to the risks inherent in conducting business globally and under the laws, regulations, and customs of various jurisdictions. These risks include compliance with a variety of national and local laws of countries in which we do business, such as restrictions on the import and export of certain intermediates, drugs, and technologies. We must also comply with a variety of U.S. laws related to doing business outside of the U.S., including Office of Foreign Asset Controls, United Nations and EU sanctions; the Iran Threat Reduction and Syria Human Rights Act of 2012; and rules relating to the use of certain “conflict minerals” under Section 1502 of the Dodd-Frank Wall Street Reform and Consumer Protection Act. Further changes in laws, regulations, and practices affecting the pharmaceutical industry and the healthcare system, including imports, exports, manufacturing, quality, cost, pricing, reimbursement, approval, inspection, and delivery of healthcare, may affect our business and operations.
|
Healthcare reform and related changes to reimbursement methods in and outside of the United States may have an adverse effect on our financial condition and results of operations.
Increasing healthcare expenditures have received considerable public attention in many of the countries in which we operate. In the U.S., government programs such as Medicare and Medicaid, as well as private insurers, have been focused on cost containment. In the EU and some other markets outside the U.S., the government provides healthcare at low direct cost to consumers and regulates pharmaceutical prices or patient reimbursement levels to control costs for the government-sponsored healthcare system. Both private and governmental entities are seeking ways to reduce or contain healthcare costs.
Our
RX
segment in particular could be materially adversely impacted by measures taken by governmental entities or private insurers to restrict patients' access to our products or increase pressure on drug pricing, including denial of price increases, prospective and retrospective price decreases, and increased mandatory discounts or rebates. These actions may drive us and our competitors to decrease prices or may reduce the ability of customers to pay for our products, which could materially negatively impact the
RX
segment's results of operations.
30
Perrigo Company plc
- Item 1A
Risk Factors
Significant uncertainty exists regarding the effect of the Affordable Care Act, particularly in light of the new U.S. Administration following the recent elections and campaign pledges to repeal or reform the Affordable Care Act. However, if the law is maintained in its current form, it appears likely that it would continue the downward pressure on pharmaceutical pricing, especially under the Medicare program, and may also increase our regulatory burdens and operating costs.
If we fail to comply with the reporting and payment obligations under the Medicaid rebate program or other governmental purchasing and rebate programs, we could be subject to fines or penalties, which could have an adverse effect on our financial condition and results of operations.
As described in
Item 1. Business - Medicaid Drug Rebate Programs
, we have a Medicaid rebate agreement and VA master agreement in effect with the U.S. government. There are inherent risks associated with participating in the Medicaid drug rebate program, and the VA FSS program, including the following:
|
•
|
By their nature, these programs require us to provide discounts and rebates and therefore reduce our net product revenues. Further, because the amounts of these discounts are based on our commercial sales practices, it is important that we maintain pricing practices that appropriately take into account these government pricing programs.
|
|
•
|
We are required to report pricing data to CMS, including AMP, on a monthly and quarterly basis and BP and ASP on a quarterly basis. We also are required to report quarterly and annual Non-FAMPs to the VA. If we fail to submit required information, make misrepresentations, or knowingly submit false information to the government as to AMP, ASP, or BP, we may be liable for substantial civil monetary penalties or subject to other enforcement actions, such as under the False Claims Act, and CMS may terminate our Medicaid drug rebate agreement. In that event, U.S. federal payments may not be available under Medicaid or Medicare Part B for our covered outpatient drugs.
|
|
•
|
The Health Reform Law enacted in 2010 requires the use of AMP data to calculate FULs for multiple source drugs and amends the statutory definitions of AMP and "multiple source drug" in a manner that materially affects the calculation of FULs. CMS surveys and publishes retail community pharmacy acquisition cost information to provide state Medicaid agencies with a basis for comparing their own reimbursement and pricing methodologies and rates. CMS’s final Medicaid rebate program also directs states to revise their payment methods to establish payment rates consistent with actual acquisition costs. Based on our initial evaluation, we do not believe that the changes will have a material impact on our business. However, states are continuing to evaluate their payment methods and we cannot predict how the new FUL or state payment methodologies will affect our pharmacy customers or to what extent these customers may seek additional discounts in light of reimbursement changes. We also cannot predict how the sharing of FUL data and retail survey prices may impact competition in the marketplace.
|
|
•
|
Under the 340B program, if we fail to provide required discounts to covered entities, we may be subject to refund claims or civil money penalties under that program.
|
|
•
|
If we inadvertently overcharge the government in connection with our FSS contract or TriCare Agreement, whether due to a misstated FCP or otherwise, we would be required to refund the difference. Failure to make necessary disclosures and/or to identify contract overcharges can result in False Claims Act allegations or potential violations of other laws and regulations. Unexpected refunds to the government, and responses to a government investigation or enforcement action, are expensive and time-consuming, and could have a material adverse effect on our business, financial condition, results of operations, and growth prospects.
|
|
•
|
Our reporting and payment obligations under the Medicaid rebate program and other governmental purchasing and rebate programs are complex and may involve subjective decisions. Our calculations and methodologies are subject to review by the governmental agencies, and it is possible that these reviews could result in challenges to our submissions. If we do not comply with those reporting and payment obligations, we could be subject to civil and/or criminal sanctions, including fines, penalties, and possible exclusion from U.S. federal healthcare programs (including Medicaid and Medicare).
|
31
Perrigo Company plc
- Item 1A
Risk Factors
Lack of availability, or significant increases in the cost, of raw materials used in manufacturing our products could adversely impact our profit margins and operating results.
Affordable high quality raw materials and packaging components are essential to all of our business units due to the nature of the products we manufacture. In addition, maintaining good supply relationships is essential to our ongoing operations. See
Item 1. Business - Materials Sourcing
for more information.
|
•
|
We maintain several single-source supplier relationships, either because alternative sources are not available or because the relationship is advantageous due to regulatory, performance, quality, support, or price considerations. Unavailability or delivery delays of single-source components or products could adversely affect our ability to ship the related product in a timely manner. The effect of unavailability or delivery delays would be more severe if associated with our higher-volume or more profitable products. Even where alternative sources of supply are available, qualifying the alternate suppliers and establishing reliable supplies could cost more or result in delays and a loss of net sales. Additionally, global regulatory requirements for obtaining product approvals could substantially lengthen the approval of an alternate material source. As a result, the loss of a single-source supplier could have a material adverse effect on our results of operations.
|
|
•
|
The rapid increase in cost of many raw materials from inflationary forces, such as increased energy costs, and our ability or inability to pass on these increases to our customers could have a negative material impact on our financial results.
|
|
•
|
Our infant formula products require certain key raw ingredients that are derived from raw milk, such as skim milk powder, whey protein powder, and lactose. Our supply of milk-based ingredients may be limited by the ability of individual dairy farmers and cooperatives to provide raw milk in the amount and quality we deem necessary. Raw milk production is influenced by factors beyond our control including seasonal and environmental factors, governmental agricultural and environmental policy, and global demand. We cannot guarantee that there will be sufficient supplies of these key ingredients necessary to produce infant formula.
|
|
•
|
Our products, and the raw materials used to make those products, generally have limited shelf lives. Our inventory levels are based, in part, on expectations regarding future sales. We may experience build-ups in inventory if sales slow. Any significant shortfall in sales may result in higher inventory levels of raw materials and finished products, thereby increasing the risk of inventory spoilage and corresponding inventory write-downs and write-offs. Cargo thefts and/or diversions, and economically or maliciously motivated product tampering on store shelves may occur, causing unexpected shortages, which may have a material impact on our operations.
|
|
•
|
We rely on third parties to source many of our raw materials, as well as to manufacture sterile, injectable products that we distribute. We maintain a strict program of verification and product testing throughout the ingredient sourcing and manufacturing process to identify potential counterfeit ingredients, adulterants, and toxic substances. Nevertheless, discovery of previously unknown problems with the raw materials or product manufacturing processes, or new data suggesting an unacceptable safety risk associated therewith, could result in a voluntary or mandatory withdrawal of the contaminated product from the marketplace, either temporarily or permanently. Any future recall or removal would result in additional costs and lost revenue, harm our reputation, and may give rise to product liability litigation.
|
|
•
|
Changes in regulation could impact the supply of the API and certain other raw materials used in our products. For example, the EU recently promulgated new standards requiring all API imported into the EU be certified as complying with GMP established by the EU. The regulations placed the certification requirement on the regulatory bodies of the exporting countries, which led to an API supply shortage in Europe as certain governments were not willing or able to comply with the regulation in a timely fashion, or at all. A shortage in API or other raw ingredients could cause us to have to cease manufacture of certain products, or to incur costs and delays to qualify other suppliers to substitute for those API manufacturers are unable to export. This could have a material adverse effect on our business, results of operations, financial condition, and cash flow.
|
32
Perrigo Company plc
- Item 1A
Risk Factors
A disruption at any of our main manufacturing facilities could materially and adversely affect our business, financial position, and results of operations.
Our manufacturing operations are concentrated in a few locations. See
Item 1. Business - Manufacturing and Distribution
for more information on our significant operations. A significant disruption at one or more of these facilities, whether it be due to fire, natural disaster, power loss, intentional acts of vandalism, war, terrorism, insufficient quality, or pandemic could materially and adversely affect our business.
Additionally, regulatory authorities routinely inspect all of our manufacturing facilities for cGMP compliance. While our manufacturing sites are cGMP compliant, if a regulatory authority were to identify serious adverse findings not corrected upon follow up inspections, we may be required to issue product recalls, shutdown manufacturing facilities, and take other remedial actions. If any manufacturing facility were forced to cease or limit production, our business could be adversely affected.
Any breach or disruption of our information systems or cyber security efforts could have a material adverse effect on our business.
Our systems, information, and operations, as well as our independent vendor relationships (where they support information technology and manufacturing infrastructure), are highly complex and vulnerable to disruption or damage from security breaches, hacking, data theft, denial of service attacks, human error, sabotage, industrial espionage, and computer viruses. Such events may be difficult to detect; and, once detected, their impact may be difficult to assess. While we continue to employ resources to monitor our systems and protect our infrastructure, these measures may prove insufficient depending upon the attack or threat posed. These risks include:
|
•
|
Breaches or disruptions could impair our ability to develop, meet regulatory approval efforts for, produce, and/or ship products, take and fulfill orders, and/or collect and make payments on a timely basis;
|
|
•
|
Any system issue, whether as a result of an intentional breach or a natural disaster, could damage our reputation and cause us to lose customers, experience lower sales volume, and incur significant liabilities; and
|
|
•
|
We could incur significant expense in addressing a disruption and related data security and privacy concerns.
|
Because our business depends upon certain customers for a significant portion of our sales, our business would be adversely affected by a disruption of our relationship with these customers or any material adverse change in these customers' businesses.
Sales to our largest customer, Walmart, comprised approximately
13%
of our total sales for the
year ended
December 31, 2016
. While no other customer individually comprised more than 10% of net sales, we do have other significant customers. If our relationship with Walmart or any of our other significant customers, including the terms of doing business with the customers, changes significantly, it could have a material adverse impact on us. See
Item 1. Business - Significant Customers
for more information.
Many of our customers, which include chain drug stores, wholesalers, distributors, hospital systems, and group purchasing organizations, continue to merge or consolidate. Such consolidation has provided, and may continue to provide, customers with additional purchasing leverage, and consequently may increase the pricing pressures we face. The emergence of large buying groups representing independent retail pharmacies enable those groups to extract price discounts on our products. In addition, a number of our customers have instituted sourcing programs limiting the number of suppliers of generic pharmaceutical products carried by that customer. These developments have resulted in heightened pricing pressure on our products, as well as competition among generic drug producers for business from a smaller and more selective customer base.
Additionally, if we are unable to maintain adequately high levels of customer service over time, customers may choose to assess penalties, obtain alternate sources for products, and/or end their relationships with us.
33
Perrigo Company plc
- Item 1A
Risk Factors
Although we have divested our rights to the Tysabri
®
royalty stream, we are entitled to additional milestone payments if certain specified thresholds are met
,
and any negative developments related to Tysabri
®
could have a material adverse effect on our receipt of those payments.
We occasionally enter into arrangements that entitle us to potential royalties from third parties. Our most significant royalty has been the Tysabri
®
royalty stream received quarterly from Biogen, which generated
$353.7 million
of cash received during the year ended December 31, 2016. See
Item 1. Business - Significant Customers
for more information on our Tysabri
®
royalty arrangement. On March 27, 2017, we divested our rights to the Tysabri
®
royalty stream to Royalty Pharma for
$2.2 billion
in cash at closing and up to
$250.0 million
and
$400.0 million
in milestone payments if global net sales of Tysabri
®
meet specific thresholds in 2018 and 2020, respectively. Our receipt of these milestone payments may be negatively impacted if the royalty streams decrease and are insufficient to meet the specified thresholds. Factors that may have an adverse effect on the Tysabri
®
royalty stream include:
|
•
|
Companies working to develop new therapies or alternative formulations of products for multiple sclerosis that, if successfully developed, would compete with, or could gain greater acceptance than, Tysabri
®
and damage Tysabri
®
’s market share. In February 2016, a competitor's pipeline product, Ocrevus
®
, received breakthrough therapy designation from the FDA, and was approved in 2017. The product is expected to compete with Tysabri
®
and have a significant negative impact on the Tysabri
®
royalty stream;
|
|
•
|
Biogen is the owner of the patents on Tysabri
®
. The loss of protection of these patents, such as a patent invalidation, could adversely affect the royalty stream from Tysabri
®
. In addition, once the Tysabri
®
patents expire, other generic companies may introduce products similar to Tysabri
®
that could adversely affect the royalty stream;
|
|
•
|
Foreign currency movement, which could have a negative impact on Biogen's Tysabri
®
sales, thereby reducing the royalties;
|
|
•
|
Any negative developments relating to Tysabri
®
, such as safety, efficacy, or reimbursement issues, could reduce demand for Tysabri
®
; and
|
|
•
|
Adverse regulatory or legislative developments could limit or prohibit the sale of Tysabri
®
, such as restrictions on the use of Tysabri
®
or safety-related label changes, including enhanced risk management programs, which may significantly reduce expected royalty revenue and require significant expense and management time to address the associated legal and regulatory issues.
|
Additionally, Tysabri
®
sales growth cannot be assured given the significant restrictions on its use and the significant safety warnings on the label, including the risk of developing Progressive Multifocal Leukoencephalopathy ("PML"), a serious brain infection. The risk of developing PML may
increase with prior immunosuppressant use, longer treatment duration, or the presence of certain antibodies. Increased incidence of PML could limit sales growth, prompt regulatory review, require significant changes to the label, or result in market withdrawal. In addition, the result of ongoing or future clinical trials involving Tysabri
®
or other adverse events reported in association with the use of Tysabri
®
may have an adverse impact on prescribing behavior and reduce sales of Tysabri
®
.
Furthermore, there can be no assurance that Royalty Pharma will pay either or both of the milestone payments even if the specified thresholds are met.
We are dependent on the services of certain key members of management. Recently, we replaced our chief financial officer, chief executive officer and the general managers of both our
CHCI
and
RX
segments. Our inability to successfully manage the transition with respect to these key executives, or the failure to attract and retain other key members of management, may have a material adverse impact on our results of operations.
34
Perrigo Company plc
- Item 1A
Risk Factors
We are dependent on the services of certain key employees, and our future success will depend in large part upon our ability to attract and retain highly skilled employees. Key functions for us include executive managers, operational managers, R&D scientists, information technology specialists, financial and legal specialists, regulatory professionals, quality compliance specialists, and sales/marketing personnel. If we are unable to attract or retain key qualified employees, our future operating results may be adversely impacted.
|
•
|
In April 2016, we announced that our former Chairman and Chief Executive Officer, Joseph C. Papa, resigned from the Company and that John T. Hendrickson, formerly our President, was appointed to serve as our new Chief Executive Officer. Mr. Hendrickson was later appointed to serve as a member of our Board of Directors.
|
|
•
|
In April 2016, we announced that the former Executive Vice President and General Manager of our
CHCI
segment, Marc Coucke, resigned from the Company and that our current Executive Vice President and General Manager, International, Sharon Kochan, would undertake expanded responsibilities that include providing leadership and strategic direction to our
CHCI
segment.
|
|
•
|
On November 8, 2016, we appointed John Wesolowski the General Manager, President
RX
. Mr. Wesolowski served as Acting General Manager,
RX
following the resignation of Doug Boothe on July 20, 2016.
|
|
•
|
On February 27, 2017, we announced that our Executive Vice President, Business Operations and Chief Financial Officer, Judy L. Brown resigned from the Company and Ron Winowiecki, formerly our Senior Vice President, Business Finance, was appointed acting Chief Financial Officer of the Company.
|
|
•
|
On February 27, 2017, we announced the appointment of Svend Andersen to the position of Executive Vice President and President, Consumer Healthcare International.
|
If these management transitions are not successful, or if we are unable to attract or retain other key qualified employees, our future operating results may be adversely impacted.
Unfavorable publicity or consumer perception of the safety, quality, and efficacy of our products could have a material adverse impact on our business.
We are dependent upon consumers' perception of the safety, quality, and efficacy of our products, and may be affected by changing consumer preferences. Negative consumer perception may arise from media reports, product liability claims, regulatory investigations, or recalls, regardless of whether they involve us or our products. The mere publication of information asserting defects in products or ingredients, or concerns about our products or the materials used in our products, could discourage consumers from buying our products, regardless of whether such information is scientifically supported.
|
•
|
Our products involve risks such as product contamination, spoilage, mislabeling, and tampering that could require us to recall one or more of our products. Serious product quality concerns could also result in governmental actions against us that, among other things, could result in the suspension of production or distribution of our products, product seizures, loss of certain licenses, delays in the issuance of governmental approvals for new products, or other governmental penalties, all of which could be detrimental to our reputation and reduce demand for our products.
|
|
•
|
We cannot guarantee that counterfeiting, imitation or other tampering with our products will not occur or that we will be able to detect and resolve it. Any counterfeiting or contamination of any products could negatively impact our reputation and sales, particularly if counterfeit or imitation products cause death or injury to consumers.
|
|
•
|
Many of the brands we acquired from Omega have European recognition. This recognition is the result of the large investments Omega has made in its products over many years. The quality and safety of the products are critical to our business. If we are unable to effectively manage real or perceived issues,
|
35
Perrigo Company plc
- Item 1A
Risk Factors
including concerns about safety, quality, efficacy, or similar matters, sentiments toward us and our products could be negatively impacted.
|
•
|
Our
CHCI
segment's financial success is dependent on the success of its brands, and the success of these brands can suffer if marketing plans or product initiatives do not have the desired impact on a brand’s image or its ability to attract consumers and the performance of the segment may be negatively impacted if spending on such plans and initiatives does not generate the returns we anticipate. In addition, given the association of individual products within the commercial network of our
CHCI
segment, an issue with one of our products could negatively affect the reputation of other products, thereby potentially hurting our financial results.
|
|
•
|
Powdered infant formula products are not sterile. All of our infant formula products must be prepared and maintained according to label instruction to retain their flavor and nutritional value and avoid contamination or deterioration. Depending on the product, a risk of contamination or deterioration may exist at each stage of the production cycle, including the purchase and delivery of raw materials, the processing and packaging of food products, and the use and handling by consumers, hospital personnel, and healthcare professionals. In the event that certain of our infant formula products are found or alleged to have suffered contamination or deterioration, whether or not under our control, our reputation and our infant formula product category sales could be materially adversely affected.
|
Increasing use of social media could give rise to liability, breaches of data security, or reputation damage.
The Company and our employees increasingly utilize social media as a means of internal and external communication.
|
•
|
To the extent that we seek to use social media tools as a means to communicate about our products and/or business, there are uncertainties as to the rules that apply to such communications, or as to the interpretations that authorities will apply to the rules that exist. As a result, despite our efforts to monitor evolving social media communication guidelines and comply with applicable rules, there is risk that our use of social media for such purposes may cause us to be found in violation of them. A violation of such guidelines may damage our reputation as well as cause potential lawsuits and adversely affect our operating activities.
|
|
•
|
Our employees may knowingly or inadvertently make use of social media tools in ways that may not be aligned with our social media strategy, may give rise to liability, or could lead to the loss of trade secrets or other intellectual property, or public exposure of personal information (including sensitive personal information) of our employees, clinical trial patients, customers, and others.
|
|
•
|
Negative posts or comments about us, store brands or generic pharmaceuticals, or our products in social media could seriously damage our reputation and could adversely affect the price of our securities. In addition, negative posts or comments about our products could result in increased pharmacovigilance reporting requirements, which may give rise to liability if we fail to fully comply with such requirements.
|
Our quarterly results are impacted by a number of factors, some of which are beyond the control of our management, that may result in significant quarter-to-quarter fluctuations in operating results.
Some of the factors that may impact our quarterly results include the severity, length and timing of the cough/cold/flu and allergy seasons, the flea and tick season, the timing of new product approvals and introductions by us and our competitors, price competition, changes in the regulatory environment, changes in accounting pronouncements, changes in the levels of inventories maintained by our customers, and the timing of retailer promotional programs. These and other factors may result in significant variations in our operating results from quarter to quarter.
We may not be able to improve operating results in our business segments.
36
Perrigo Company plc
- Item 1A
Risk Factors
|
•
|
We have experienced a reduction in pricing expectations during 2016 in comparison to historical patterns in our U.S. businesses, in particular in our
RX
segment, due to industry and competitive pressures in the sector. The reduced pricing is attributable to a variety of factors including increased focus from customers to capture supply chain productivity savings, low raw material commodity pricing, competition in specific product categories, the loss of exclusivity on certain products, the recent increase in the speed and number of approvals from the FDA, and consolidation of certain customers in the
RX
segment. We have seen year-over-year pricing erosion in the second half of 2016 moderate from the levels experienced in the first half of 2016. We expect this pricing environment to continue to impact the Company for the foreseeable future.
|
|
•
|
The
CHCI
segment has been impacted by market dynamics in key countries such as Belgium, France, Germany and Italy due to softness in certain brand categories and by unfavorable foreign currency impacts, primarily in the U.K. related to Brexit. In addition, the segment had been impacted in Belgium by a change in the forecast with a major wholesaler, as management implements improved supply chain efficiencies in this market. The
CHCI
segment has restructured its approach to addressing these markets including: (1) implementing a brand prioritization strategy to address these market dynamics, with an objective to balance the cost of advertising and promotional investments with expected contributions from category sales, (2) restructuring its sales force in each of these markets to more effectively serve customers, and (3) exiting certain unfavorable distribution agreements. The combination of these actions are expected to improve the segment's focus on higher value OTC products, reduce selling costs and improve operating margins in the segment.
|
There can be no assurance that we will not continue to experience challenges related to our segments, and these challenges could have a material impact on our business, cash flows, and results of operations or result in impairment charges, and the market value of our ordinary shares and/or debt securities
may decline.
We may not realize the benefits of business acquisitions and divestitures we enter into, which could have a material adverse effect on our operating results.
In the normal course of business we engage in discussions relating to possible acquisitions and divestitures. These transactions are accompanied by a number of risks. Many of these risks are beyond our control, and any one of them could result in increased cost, decreased Net sales and diversion of management’s time and energy, any or all of which could materially impact our business, financial condition, and results of operations.
Acquisitions
One of our strategies is inorganic growth through the acquisition of products and companies that we expect will benefit the Company. This strategy comes with a number of financial, managerial, and operational risks. We may not realize the benefits of an acquisition because of integration and other challenges, including, but not limited to the following:
|
•
|
Difficulty involved with managing the expanded operations of the respective parties, as well as identifying the extent of all weaknesses, risks, and contingent and other liabilities;
|
|
•
|
Uncertainties involved in assessing the value, strengths, and potential profitability of the respective parties, as well as identifying the extent of all weaknesses, risks, and contingent and other liabilities of acquisition targets;
|
|
•
|
Unanticipated changes in the business, industry, market or general economic conditions different from the assumptions underlying our rationale for pursuing the transaction;
|
|
•
|
Difficulties due to a lack of, or limited experience in, any new product or geographic markets we enter;
|
|
•
|
Inability to achieve identified operating and financial synergies, or return on investment, from an acquisition in the amounts or on the time frame anticipated;
|
|
•
|
Substantial demands on our management, operational resources, technology, and financial and internal control systems, which could lead to dissatisfaction and potential loss of key customers, management, or
|
37
Perrigo Company plc
- Item 1A
Risk Factors
employees;
|
•
|
Integration activities that may detract attention from our day-to-day business, and substantial costs associated with the transaction process or other material adverse effects as a result of these integration efforts; and
|
|
•
|
Difficulties, restrictions or increased costs associated with raising future capital in connection with an acquisition may impact our liquidity, credit ratings and financial position, thereby making it more difficult, restrictive or expensive to raise future capital. In addition, the issuance of equity to pay a portion of the purchase price for an acquisition would dilute our existing shareholders.
|
As described in
Item 1. Business - Major Recent Developments
, in March 2015 we closed on the Omega acquisition. In addition to the risks mentioned above, Omega presents the following risks:
|
•
|
Our success in the European markets in which Omega operates will depend on a number of factors, such as:
|
|
◦
|
Our ability to commercialize new products;
|
|
◦
|
Our ability to adapt to changes in economic and political conditions;
|
|
◦
|
Fluctuations in the value of foreign currencies and interest rates;
|
|
◦
|
Compliance with differing regulatory and legal requirements, including tax laws, trade laws, labor, safety, local content, consumer protection regulation, and import or export licensing requirements; and
|
|
◦
|
Consistency and transparency of foreign tax systems, transfer pricing stability across jurisdictions, and our ability to reinvest earnings and cash as appropriate.
|
|
•
|
While Omega has not historically been subject to U.S. laws and regulations, such as the FCPA, it has been subject to a wide range of European laws and regulations, including the U.K. Bribery Act of 2010. The comparable U.S. laws and regulations to which Omega is now subject may differ from those to which Omega was historically subject. Therefore, it is possible that certain Omega sales or other activities that were permitted while Omega was an independent company may no longer be permitted. While we are continuing to put into place compliance processes and controls intended to ensure compliance with U.S. and global laws that now apply to Omega, if Omega’s operations fail to comply with such laws and regulations, we could be subject to governmental investigations, legal or regulatory proceedings, substantial fines, and/or other legal or equitable penalties.
|
Divestitures
We may evaluate potential divestiture opportunities with respect to portions of our business (including specific assets or categories of assets) from time to time, and may proceed with a divestiture opportunity if and when we believe it is consistent with our business strategy and initiatives. Any future divestitures could expose us to significant risk, including without limitation:
|
•
|
Our ability to effectively transfer liabilities, contracts, facilities and personnel to any purchaser;
|
|
•
|
Fees for legal and transaction-related services;
|
|
•
|
Diversion of management resources; and
|
|
•
|
Loss of key personnel and reduction in revenue.
|
If we do not realize the expected strategic, economic or other benefits of any divestiture transaction, it could adversely affect our financial condition and results of operations.
38
Perrigo Company plc
- Item 1A
Risk Factors
We have acquired significant assets that could become impaired or subject us to losses and may result in an adverse impact on our results of operations.
We have recorded significant intangible assets and goodwill on our balance sheet as a result of previous acquisitions, which could become impaired and lead to material charges in the future.
As of the year ended December 31, 2016, we recorded the following impairments:
|
•
|
Goodwill impairment charges of
$1.1 billion
related to our Specialty Sciences, BCH-Rest of World ("ROW"), BCH-Belgium, and Animal Health Reporting Units.
|
|
•
|
Indefinite-lived and definite-lived intangible asset impairment charges of
$1.5 billion
related to: trademarks, trade names and brands; developed product technology/formulation and product rights; distribution and license agreements; and supply agreements.
|
We perform an impairment analysis on intangible assets subject to amortization when there is an indication that the carrying amount of any individual asset may not be recoverable. Any significant change in market conditions, estimates or judgments used to determine expected future cash flows that indicates a reduction in carrying value may give rise to impairment in the period that the change becomes known. As of
December 31, 2016
, the net book value of our intangible assets and goodwill were
$3.5 billion
and
$4.0 billion
, respectively. See
Item 8. Note 3
for more information on the above impairment charges.
There can be no assurance that our strategic initiatives will achieve their intended effects.
We are in the process of implementing certain initiatives designed to increase operational efficiency and improve our return on invested capital by globalizing our supply chain through global shared service arrangements, streamlining our organizational structure, making key executive employee changes, performing a strategic portfolio review, and disposing of certain assets. We believe these initiatives will enhance our net sales, operating margins, and earnings; however, there can be no assurance that these initiatives will produce the anticipated benefits. Any delay or failure to achieve the anticipated benefits could have a material adverse effect on our projected results.
On November 10, 2016, as part of our ongoing strategic portfolio review, we announced the following strategic actions: (1) exploring strategic alternatives for the potential sale our Tysabri
®
royalty asset, which is reported in our Specialty Sciences segment; (2) conducting a comprehensive internal evaluation of our businesses, including the Rx market position, growth opportunities and interdependencies with our other manufacturing and shared service operations to determine if strategic alternatives should be explored; and (3) conducting a review of segment and corporate cost structures to align with existing and future expected market dynamics. If we determine that we will pursue a strategic divestiture as a result of this portfolio review, our future business, prospects, financial condition, liquidity and operating results could be significantly different than those in historical periods or projected by our management, which may in turn have a material adverse effect on the market value of our ordinary shares or credit ratings. We cannot provide any commitment regarding if or when any such divestiture would occur.
In furtherance of these strategic actions, on
March 27, 2017
, we completed the divestment of our Tysabri
®
royalty stream to Royalty Pharma for up to
$2.85 billion
, which consists of
$2.2 billion
in cash and up to
$250.0 million
and
$400.0 million
in royalties earned if global net sales of Tysabri
®
meet specific thresholds in 2018 and 2020, respectively. There can be no assurance these thresholds can be achieved.
In addition, on February 21, 2017, we approved a workforce reduction plan as part of a larger cost optimization strategy across the Company. We expect to reduce our global workforce by approximately 750 employees which includes some actions already taken and 235 employees who have elected to participate in a voluntary early retirement program. This represents a reduction of approximately 14% of our global non-production workforce. The changes to our workforce will vary by country, based on legal requirements and required consultations with works councils and other employee representatives, as appropriate. We have announced that we expect to yield approximately $130.0 million in savings from these actions. There can be no assurance these benefits will be recognized. Further, these actions could lead to a disruption in production or loss in net sales.
39
Perrigo Company plc
- Item 1A
Risk Factors
In connection with this plan, we estimate that we will recognize total pre-tax restructuring charges of approximately $70.0 million to $80.0 million, consisting of one-time termination benefits, severance arrangements, and other termination costs. We anticipate recognizing substantially all of these charges by the year ended 2017, with the remaining balance to be recognized during the first quarter of the year ended 2018.
The filing of this Annual Report on Form 10-K will not make us “current” in our Exchange Act filing obligations, which means we retain certain potential liability and are not eligible to use certain forms or rely on certain SEC rules.
Although this is a “comprehensive” Form 10-K for the fiscal years ended December 31, 2016, June 27, 2015 and June 28, 2014, the transition period from June 28, 2015 to December 31, 2015, and the quarterly periods included within the fiscal years ended December 31, 2016 and June 27, 2015 and the transition period from June 28, 2015 to December 31, 2015, filing this report does not make us current in our filing obligations under the Exchange Act. Our failure to file all required Exchange Act reports, on a timely basis, means we remain potentially liable under the Exchange Act for those delinquencies, and the filing of this report does not preclude the enforcement staff of the SEC from taking action as a result of those filing delinquencies. Further, without the missing filings, investors may not be able to review certain financial and other disclosures that would be contained in those filings. In addition, we have not filed our Form 10-Q for the quarterly period ended April 1, 2017. We also were unable to include the required pro forma financial information in our Form 8-K filed on March 29, 2017 reporting the sale of our Tysabri
®
royalty stream. As a result, we will not be “current” for purposes of Rule 144, Regulation S, and our Form S-8 registrations statements until we file that Form 10-Q and amend the Form 8-K to include the proforma financial information.
We have incurred significant additional costs to complete the restatements of previously issued financials and to remediate our material weaknesses and failure to timely file our periodic reports, which may result in reduced operating results in future periods.
As part of this Annual Report on Form 10-K, we have restated previously filed financial statements, and we are in the process of remediating our previously existing material weaknesses and evaluating if further remedial action is appropriate. These efforts and actions related to the restatements of our financial statements have been time consuming and expensive and could expose us to a number of additional risks, which could materially adversely affect our financial position, results of operations, and cash flows.
In particular, we have incurred and will likely continue to incur significant expense, including significant audit, legal, consulting, and other professional fees in connection with the restatements of our previously issued financial statements and the ongoing remediation of material weaknesses in our internal control over financial reporting. We have taken a number of steps, including adding significant internal resources and implementing a number of additional procedures, in order to strengthen our accounting and tax functions and attempt to reduce the risk of additional misstatements in our financial statements. To the extent these steps are not successful, we could be forced to incur additional time and expense.
We identified material weaknesses in our internal controls over financial reporting; failure to remediate the material weakness could negatively impact our business and the price of our ordinary shares.
In connection with our review of certain material misstatements related to the characterization of the Tysabri
®
royalty stream acquired in the Elan transaction, as well as material misstatements related to the calculation of deferred tax liabilities that existed at the time of the acquisition of Omega, and the evaluation of long-lived assets in our Animal Health Reporting Unit for impairment testing, in each case contained in certain of our historical financial statements, we have concluded that there were material weaknesses in our internal control over financial reporting that contributed to those misstatements. As a result of the material weaknesses, which existed at December 31, 2016, we have concluded that we did not maintain, in all material respects, effective internal control over financial reporting as of December 31, 2016, based on criteria established in Internal Control - Integrated Framework (2013) issued by the Committee of Sponsoring Organizations of the Treadway Commission (“COSO”). The failure to maintain effective control over financial reporting in turn resulted in material deficiencies in our disclosure controls and procedures.
40
Perrigo Company plc
- Item 1A
Risk Factors
We have identified and begun the implementation of actions, and continue to identify and implement, actions to improve the effectiveness of our internal control over financial reporting and disclosure controls and procedures, but there can be no assurance that such remediation efforts will be successful. We have also incurred and will continue to incur substantial accounting, legal, consulting, and other costs in connection with identifying and remediating the material weaknesses. Failure to remediate the material weaknesses could have a negative impact on our business and the market for our ordinary shares. For more information on our material weaknesses and the status of our remediation efforts. See
Item 9A - Controls and Procedures
, which includes
Management's Report on Internal Control over Financial Reporting
.
Global Risks
Our business, financial condition, and results of operations are subject to risks arising from the international scope of our operations.
We manufacture, source raw materials, and sell our products in a number of countries. The percentage of our business outside the U.S. has been increasing particularly as a result of the Omega acquisition. We are subject to risks associated with international manufacturing and sales, including:
|
•
|
Unexpected changes in regulatory requirements;
|
|
•
|
Problems related to markets with different cultural biases or political systems;
|
|
•
|
Possible difficulties in enforcing agreements;
|
|
•
|
Longer payment cycles and shipping lead-times;
|
|
•
|
Difficulties obtaining export or import licenses;
|
|
•
|
Changes to U.S. and foreign trade policies, including the enactment of tariffs on goods imported into the U.S., including but not limited to, goods imported from Mexico; and
|
|
•
|
Imposition of withholding or other taxes.
|
Additionally, we are subject to periodic reviews and audits by governmental authorities responsible for administering import/export regulations. To the extent that we are unable to successfully defend against an audit or review, we may be required to pay assessments, penalties, and increased duties.
Certain of our facilities operate in a special purpose sub-zone established by the U.S. Department of Commerce Foreign Trade Zone Board, which allows us certain tax advantages on products and raw materials shipped through these facilities. If the Foreign Trade Zone Board were to revoke the sub-zone designation or limit our use, we could be subject to increased duties.
Although we believe that we conduct our business in compliance with applicable anti-corruption, anti-bribery and economic sanctions or other anti-corruption laws, if we are found to not be in compliance with such laws or other anti-corruption laws, we could be subject to governmental investigations, legal or regulatory proceedings, substantial fines, and/or other legal or equitable penalties. This risk increases in locations outside of the U.S., particularly in locations that have not previously had to comply with the FCPA, U.K. Bribery Act, and similar laws.
Current and changing global economic conditions may adversely affect our business.
A number of non-U.S. jurisdictions in which we do business have been negatively impacted by slowing growth rates or recessionary conditions, political disruptions, exchange rate and market volatility.
|
•
|
Several emerging market economies are particularly vulnerable to the impact of rising interest rates, inflationary pressures, weaker oil and other commodity prices, and large external deficits. While some of these jurisdictions are showing signs of stabilization or recovery, others, such as Ukraine, Russia and Greece, continue to experience levels of stress and volatility. Risks in one country can limit our opportunities for portfolio growth and negatively affect our operations in another country or countries. As a result, any such unfavorable conditions or developments could have an adverse impact on our operations.
|
|
•
|
While the challenging global economic environment has not had a material impact on our liquidity or capital resources, there can be no assurance that possible future changes in global financial markets and global
|
41
Perrigo Company plc
- Item 1A
Risk Factors
economic conditions will not affect our liquidity or capital resources, impact our ability to obtain financing, or decrease the value of our assets.
|
•
|
The challenging economic conditions have also impacted the movements in exchange rates, which have experienced significant recent volatility, including the unfavorable foreign currency impact on the British pound due to Brexit. Uncertainty regarding the future growth rates between countries, the influence of central bank actions, and the changing political environment globally may contribute to continued high levels of exchange rate volatility, which could have an adverse impact on our results.
|
|
•
|
Our customers could be adversely impacted if economic conditions worsen. Our
CHCA
segment does not advertise its products like national brand companies and thus is largely dependent on retailer promotional activities to drive sales volume and increase market share.
If our customers do not have the ability to invest in store brand promotional activities, our sales may suffer. Additionally, while we actively review the credit worthiness of our customers and suppliers, we cannot fully predict to what extent they may be negatively impacted by slowing economic growth.
|
The international scope of our business exposes us to risks associated with foreign exchange rates.
We report our financial results in U.S. dollars. However, a significant portion of our net sales, assets, indebtedness and other liabilities, and costs are denominated in foreign currencies. These currencies include among others the euro, Indian rupee, British pound, Canadian dollar, Israeli shekel, Australian dollar, and Mexican peso. The addition of Omega, a euro-denominated business, that represents a significant portion of our net sales and earnings, and a substantial portion of our net assets, has significantly increased our exposure to changes in the euro/U.S. dollar exchange rate. In addition, approximately
29%
of Omega’s sales are in other foreign currencies, with the majority of the product costs for these markets denominated in euros. Movements in exchange rates have experienced significant recent volatility due in part to the challenging economic conditions noted above. In 2016, the exchange rate between the U.S. dollar and British pound and the euro and British pound in particular experienced significant volatility due to Brexit and adversely impacted our results of operations. Our results of operations and, in some cases, cash flows, have in the past been, and may in the future, be adversely affected by movements in exchange rates. In addition, we may also be exposed to credit risks in some of those markets.
We may implement currency hedges or take other actions intended to reduce our exposure to changes in foreign currency exchange rates. If we are not successful in mitigating the effects of changes in exchange rates on our business, any such changes could materially impact our results.
We operate in jurisdictions that could be affected by economic and political instability, which could have a material adverse effect on our business.
Our operations could be affected by economic or political instability, embargoes, military hostilities, unstable governments and legal systems, and inter-governmental disputes. We have significant operations in Israel, which has experienced varying degrees of hostility in recent years. Doing business in Israel and certain other regions including Mexico and Eastern Europe involves the following risks:
|
•
|
Certain countries and international organizations have refused to do business with companies with Israeli operations. We are also precluded from marketing our products to certain countries due to U.S. and Israeli regulatory restrictions. International economic sanctions and boycotts of our products could negatively impact our sales and ability to export our products.
|
|
•
|
Our facilities in Israel are within a conflict zone. If terrorist acts or military actions were to result in substantial damage to our facilities, our business activities would be disrupted since, with respect to most products, we would need to obtain prior regulatory agency approval for a change in manufacturing site. In addition, our insurance may not adequately compensate us for losses that may occur, and any losses or damages incurred by us could have a material adverse effect on our business.
|
42
Perrigo Company plc
- Item 1A
Risk Factors
|
•
|
The U.S. Department of State and other governments have at times issued advisories regarding travel to certain countries in which we do business. As a result, regulatory agencies have at various times curtailed or prohibited their inspectors from traveling to inspect facilities. If these inspectors are unable to inspect our facilities, the regulatory agencies could withhold approval for new products intended to be produced at those facilities.
|
|
•
|
Our international operations may be subject to interruption due to travel restrictions, war, terrorist acts, and other armed conflicts. For example, Belgium, France, Turkey, and Eastern Europe may be exposed to further acts of terrorism, which could give rise to travel and increased security restrictions. Also, further threats of armed hostilities in Mexico could limit or disrupt markets and our operations, including disruptions resulting from the cancellation of contracts or the loss of assets. These events could have a material adverse effect on our international business operations.
|
|
•
|
The UK held a referendum on June 23, 2016 on its membership in the EU. A majority of UK voters voted to exit the EU (“Brexit”), and negotiations will commence to determine the future terms of the UK’s relationship with the EU, subject to a negotiation period that could last up to two years after the UK government formally initiates the withdraw process, including the terms of trade between the UK and the EU. Brexit has created significant instability and volatility in the global financial markets, has led to significant weakening of the British pound compared to the U.S. dollar and other currencies, and could adversely affect European or worldwide economic or market conditions. Although it is unknown what those terms will be, they may impair the ability of our operations in the EU to transact business in the future in the UK, and similarly the ability of our UK operations to transact business in the future in the EU. Specifically, it is possible that there will be greater restrictions on imports and exports between the UK and EU countries and increased regulatory complexities. These changes may adversely affect our operations and financial results. In addition, Brexit could lead to legal uncertainty and potentially divergent national laws and regulations as the UK determines which EU laws to replace or replicate. Further, among other things, Brexit could reduce consumer spending in the UK and the EU, which could result in decreased demand for our products. Any of these effects of Brexit, and others we cannot anticipate, could adversely affect our business, business opportunities, results of operations, financial condition and cash flows.
|
Risks Related to Litigation and Insurance
We are or may become involved in lawsuits and may experience unfavorable outcomes of such proceedings.
We may become involved in lawsuits arising from a wide variety of commercial, manufacturing, development, marketing, sales and other business-related matters, including, but not limited to, competitive issues, pricing, contract issues, intellectual property matters, false advertising, unfair competition, taxation matters, workers' compensation, product quality/recall, environmental remediation, securities law, disclosure, and regulatory issues. Litigation is unpredictable and can be costly. We intend to vigorously defend against any lawsuits, however, we cannot predict how the cases will be resolved. Adverse results in the cases could result in substantial monetary judgments. No assurance can be made that litigation will not have a material adverse effect on our financial position or results of operations in the future. See
Item 8. Note 16
for more information.
|
•
|
We may be subject to liability if our products violate applicable laws or regulations in the jurisdictions where our products are distributed. The successful assertion of product liability or other product-related claims against us could result in potentially significant monetary damages, and we could incur substantial legal expenses. Even if a product liability or consumer fraud claim is unsuccessful, not merited, or not fully pursued, we may still incur substantial legal expenses defending against such a claim, and our reputation may suffer.
|
|
•
|
We are a defendant in product liability lawsuits arising out of serious adverse events, including deaths, which occurred in patients taking Tysabri
®
. We expect additional product liability lawsuits related to Tysabri
®
usage to be filed. Tysabri
®
's distributor, Biogen, and Perrigo will each be responsible for 50% of losses and expenses arising out of any Tysabri
®
product liability claims. Along with Biogen, we intend to vigorously defend these lawsuits, however, we cannot predict how these cases will be resolved. Adverse results in one or more of these cases could result in substantial monetary judgments not covered by insurance.
|
43
Perrigo Company plc
- Item 1A
Risk Factors
|
•
|
We may face environmental exposures including, for example, those relating to discharges from and materials handled as part of our operations, the remediation of soil and groundwater contaminated by hazardous substances or wastes, and the health and safety of our employees. While we do not have any material remediation liabilities currently outstanding, we may in the future face liability for the costs of investigation, removal or remediation of certain hazardous substances or petroleum products on, under or in our currently or formerly owned property, or from a third-party disposal facility that we may have used, without regard to whether we knew of, or caused, the presence of the contaminants. The actual or alleged presence of these substances, or the failure to remediate them, could have adverse effects, including, for example, substantial investigative or remedial obligations and limitations on our ability to sell or rent affected property or to borrow funds using affected property as collateral. There can be no assurance that environmental liabilities and costs will not have a material adverse effect on us. See
Item 1. Business - Information Applicable to All Reportable Segments - Environmental
for more information.
|
|
•
|
Our
CHCI
segment regularly makes advertising claims regarding the effectiveness of its products, which we are responsible for defending. An unsuccessful defense of product-related claims could result in potentially significant monetary damages and substantial legal expenses. Even if a claim is unsuccessful, not merited, or not fully pursued, we may still incur substantial legal expenses defending against such a claim, and our reputation could suffer.
|
|
•
|
We are a defendant in a securities class action lawsuit filed in the US District Court for the District of New Jersey in which the complaint alleges violations of Securities Exchange Act sections 10(b) (and Rule 10b‑5) and 14(e) against both Perrigo and our former Chief Executive Officer, Joseph C. Papa, and 20(a) control person liability against Mr. Papa. In general, the allegations concern the actions taken by the Company and the former executive to defend against the hostile takeover bid by Mylan in the period April 21, 2015 through November 13, 2015. The plaintiff also alleges that we provided inadequate disclosure concerning alleged integration problems as a result of the Omega acquisition in the period April 21, 2015 through May 11, 2016. Another securities class action case was also filed in the same court making essentially the same claims on behalf of a class of persons who sold put options in Perrigo shares during the same class period. In December 2016, the court consolidated the two actions. In February 2017, the court selected the lead plaintiffs and the lead counsel to the putative class.
In March 2017, the court entered a scheduling order that sets a deadline for the lead plaintiffs to file an amended complaint. That deadline has not yet passed.
|
|
•
|
We along with certain of our current and former executive officers and board members are also defendants in a securities class action suit where the plaintiff alleges violations of Israeli law in the District Court of Tel Aviv-Jaffa
.
On June 15, 2016, we filed a motion to stay the case pending the outcome of the U.S. securities class actions. The plaintiffs did not oppose the motion. The Israeli court granted the motion on the same day, and the action is stayed.
|
|
•
|
We are a defendant in a securities claims which the complaint commenced an action in the District Court of Tel Aviv-Jaffa asserting securities claims against Perrigo and our auditor Ernst & Young LLP ("EY"). The case is styled
Keinan v. Perrigo Company plc, et al.
The action seeks certification of a class of purchasers of Perrigo shares on the Israeli exchange beginning February 6, 2014. The proposed closing date for the class is not clear. In general, the plaintiff asserts that Perrigo improperly accounted for its stream of royalty income from two drugs: Tysabri
®
and Prialt. The court filings contend that the alleged improper accounting caused the audited financial results for Perrigo to be incorrect for the year ended December 31, 2016, six months ended December 31, 2015, and the years ended June 27, 2015 and June 28, 2014 and the other financial data released by the Company over those years to also be inaccurate. The plaintiff maintains that the defendants are liable under Israeli securities law or, in the alternative, under U.S. securities law principles. The plaintiff indicates an initial, preliminary class damages estimate of
686.0 million
NIS (approximately
$187.0 million
). The response from Perrigo and EY is not yet due. Perrigo is consulting Israeli counsel about its response to these allegations.
|
Increased scrutiny on pricing practices and competition in the pharmaceutical industry, including antitrust enforcement activity by government agencies and class action litigation, may have an adverse impact on our business and results of operations.
44
Perrigo Company plc
- Item 1A
Risk Factors
There has been increased scrutiny regarding sales, marketing, and pricing practices in the pharmaceutical industry from both government agencies and the media, including allegations of “price gouging” and/or collusion. This includes recent U.S. Congressional inquiries and hearings in connection with the investigation of specific price increases by several pharmaceutical companies, proposed legislation seeking greater transparency in drug pricing, and criminal investigations regarding drug pricing. U.S. federal and state prosecutors have issued subpoenas to a number of pharmaceutical companies seeking information about their drug pricing practices, and several class action lawsuits have been filed that allege price-fixing with respect to various pharmaceutical products. In December 2016, the Antitrust Division of the U.S. Department of Justice (the “Antitrust Division”) filed criminal charges against two former executives from a competitor of the Company for their roles in conspiracies to fix prices, rig bids and allocate customers for certain generic drugs.
On May 2, 2017, we disclosed that search warrants were executed at a number of Perrigo facilities and other locations in connection with the Antitrust Division’s ongoing investigation related to drug pricing in the pharmaceutical industry. Although no charges have been brought to date against Perrigo or any of our current employees (or, to the best of our knowledge, former employees), we take the investigation very seriously.
If criminal antitrust charges are filed involving Perrigo, we would incur substantial litigation and other costs, and could face substantial monetary penalties, injunctive relief, negative publicity and damage to our reputation. Regardless of the ultimate outcome, responding to those charges would divert management’s time and attention and could impair our operations . Further, we cannot predict whether legislative or regulatory changes may result from the ongoing public scrutiny of our industry, what the nature of any such changes might be, or what impact they may have on Perrigo. Any of these developments could have a material adverse impact on our business, results of operations, and reputation.
We are cooperating fully with the government’s investigation and are committed to operating its business in compliance with all applicable laws and regulations and the highest standards of ethical conduct. We do not condone, and will not countenance, any violation of these standards by our employees, agents, and business partners.
Publishing earnings guidance subjects us to risks, including increased stock volatility that could lead to potential lawsuits by investors.
Because we publish earnings guidance, we are subject to a number of risks. Actual results may vary from the guidance we provide investors from time to time, such that our stock price may decline following, among other things, any earnings release or guidance that does not meet market expectations.
It has become increasingly commonplace for investors to file lawsuits against companies following a rapid decrease in market capitalization. We have been in the past, and may be in the future, named in these types of lawsuits. These types of lawsuits can be costly and divert management attention and other resources away from our business, regardless of their merits, and could result in adverse settlements or judgments.
Third-party patents and other intellectual property rights may limit our ability to bring new products to market and may subject us to potential legal liability, causing us to incur significant costs.
The manufacture, use and sale of new products that are the subject of conflicting patent rights have been the subject of substantial litigation in the pharmaceutical industry.
|
•
|
As a manufacturer of generic pharmaceutical products, the ability of our
CHCA
and
RX
segments to bring new products to market is often limited by third-party patents or proprietary rights and regulatory exclusivity periods awarded on products. Launching new products prior to resolution of intellectual property issues may result in us incurring legal liability if the related litigation is later resolved against us. The cost and time for us to develop prescription and Rx-to-OTC switch products is significantly greater than the rest of the new products that we introduce. Any failure to bring new products to market in a timely manner could cause us to lose market share, and our operating results could suffer.
|
|
•
|
We could have to defend against charges that we violated patents or proprietary rights of third parties. This could require us to incur substantial expense and could divert significant effort of our technical and
|
45
Perrigo Company plc
- Item 1A
Risk Factors
management personnel. If we are found to have infringed on the rights of others, we could lose our right to develop or manufacture some products or could be required to pay monetary damages or royalties to license proprietary rights from third parties. Additionally, if we choose to settle a dispute through licensing or similar arrangements, the costs associated with these arrangements may be substantial and could include ongoing royalties. An adverse determination in a judicial or administrative proceeding or failure to obtain necessary licenses could prevent us from manufacturing and selling a number of our products.
|
•
|
At times, our
CHCA
or
RX
segments may seek approval to market drug products before the expiration of patents for those products, based upon our belief that such patents are invalid, unenforceable or would not be infringed by our products. In these cases we may face significant patent litigation. Depending upon a complex analysis of a variety of legal and commercial factors, we may, in certain circumstances, elect to market a generic pharmaceutical product while litigation is pending, before any court decision, or while an appeal of a lower court decision is pending, known as an "at risk" launch. The risk involved in an "at risk" launch can be substantial because, if a patent holder ultimately prevails, the remedies available to the patent holder may include, among other things, damages measured by the profits lost by the holder, which are often significantly higher than the profits we make from selling the generic version of the product. By electing to proceed in this manner, we could face substantial damages if we receive an adverse final court decision. In the case where a patent holder is able to prove that our infringement was "willful" or "exceptional," under applicable law, the patent holder may be awarded up to three times the amount of its actual damages or we may be required to pay attorneys’ fees.
|
The success of certain of our products depends on the effectiveness of measures we take to protect our intellectual property rights and patents.
If we fail to adequately protect our intellectual property, competitors may manufacture and market similar products.
|
•
|
We have been issued patents covering certain of our products, and we have filed, and expect to continue to file, patent applications seeking to protect newly developed technologies and products in various countries. Any existing or future patents issued to or licensed by us may not provide us with any significant competitive advantages for our products or may even be challenged, invalidated, or circumvented by competitors. In addition, patent rights may not prevent our competitors from developing, using, or commercializing non-infringing products that are similar or functionally equivalent to our products.
|
|
•
|
We also rely on trade secrets, unpatented proprietary know-how, and continuing technological innovation that we seek to protect, in part by confidentiality agreements with licensees, suppliers, employees, and consultants. If these agreements are breached, we may not have adequate remedies for any such breach. Disputes may arise concerning the ownership of intellectual property or the applicability of confidentiality agreements. Furthermore, trade secrets and proprietary technology may otherwise become known or be independently developed by competitors or, if patents are not issued with respect to products arising from research, we may not be able to maintain the value of such intellectual property rights.
|
Significant increases in the cost or decreases in the availability of the insurance we maintain could adversely impact our financial condition.
To protect the Company against various potential liabilities, we maintain a variety of insurance programs, including property, general and product, and directors' and officers' liability. We may reevaluate and change the types and levels of insurance coverage that we purchase. We are self-insured when insurance is not available or not available at reasonable premiums. Risks associated with insurance plans include:
|
•
|
Insurance costs could increase significantly, or the availability of insurance may decrease, either of which could adversely impact our financial condition;
|
|
•
|
Deductible or retention amounts could increase or our coverage could be reduced in the future and to the extent losses occur, there could be an adverse effect on our financial results depending on the nature of the loss and the level of insurance coverage we maintained;
|
46
Perrigo Company plc
- Item 1A
Risk Factors
|
•
|
Product liability insurance may not be available to us at an economically reasonable cost (or at all for certain specific products) or our insurance may not adequately cover our liability in connection with product liability claims (see
Item 8. Note 16
for further information related to legal proceedings); and
|
|
•
|
As our business inherently exposes us to claims for injuries allegedly resulting from the use of our products, we may become subject to claims for which we are not adequately insured. Unanticipated payment of a large claim may have a material adverse effect on our business.
|
Tax Related Risks
The U.S. Internal Revenue Service ("IRS") may not agree with the conclusion that we are treated as a foreign corporation for U.S. federal tax purposes.
Although we are incorporated in Ireland, the IRS may assert that we should be treated as a U.S. corporation (and, therefore, a U.S. tax resident) for U.S. federal tax purposes pursuant to section 7874 of the U.S. Internal Revenue Code of 1986, as amended ("Code"). For U.S. federal tax purposes, a corporation generally is considered a tax resident in the jurisdiction of its organization or incorporation. Because we are an Irish incorporated entity, we would generally be classified as a foreign corporation (and, therefore, a non-U.S. tax resident) under these rules. Section 7874 of the Code provides an exception under which a foreign incorporated entity may, in certain circumstances, be treated as a U.S. corporation for U.S. federal tax purposes.
For Perrigo Company plc to be treated as a foreign corporation for U.S. federal tax purposes under section 7874 of the Code, either (i) the former stockholders of Perrigo Company must own (within the meaning of section 7874 of the Code) less than 80% (by both vote and value) of our stock by reason of holding shares in Perrigo Company (the "ownership test") as of the closing of the Elan acquisition or (ii) we must have substantial business activities in Ireland after the Elan acquisition (taking into account the activities of our expanded affiliated group).
Upon our acquisition of Elan, Perrigo Company stockholders held 71% (by both vote and value) of our shares. As a result, we believe that under current law, we should be treated as a foreign corporation for U.S. federal tax purposes. However, we cannot assure that the IRS will agree with our position that the ownership test is satisfied. There is limited guidance regarding the section 7874 provisions, including the application of the ownership test.
Based on the limited guidance available, we currently expect that Section 7874 of the Code likely will limit our and our U.S. affiliates’ ability to use their U.S. tax attributes such as net operating losses to offset certain U.S. taxable income, if any, generated by the Elan acquisition or certain specified transactions for a period of time following the Elan acquisition.
Changes to tax laws could have a material adverse effect on our results of operations and the ability to utilize cash in a tax efficient manner.
We believe that under current law, we should be treated as a foreign corporation for U.S. federal tax purposes. However, any of the following could adversely affect our status as a foreign corporation for U.S. federal tax purposes:
|
•
|
Changes to the inversion rules in section 7874 of the Code, the IRS Treasury regulations promulgated thereunder, or other IRS guidance; and
|
|
•
|
Legislative proposals aimed at expanding the scope of U.S. corporate tax residence.
|
47
Perrigo Company plc
- Item 1A
Risk Factors
On April 4, 2016, the United States Treasury ("Treasury") and the IRS issued a package of temporary regulations that incorporate the guidance promised in the 2014 and 2015 notices and provide other rules. These temporary regulations are generally effective for certain inversion transactions completed on or after November 19, 2015 or, in certain cases, to certain specified post-inversion transactions occurring after that date provided that an inversion transaction had occurred on or after September 22, 2014. We do not believe that those regulations would apply to our transaction, which occurred prior to those effective dates. Treasury and the IRS also issued final regulations on June 3, 2015, which address the “substantial business activities” test of Section 7874 of the Code. We believe that those regulations, which have an effective date of June 4, 2015, also do not impact the treatment of our status as a foreign corporation under Section 7874, as our transaction also occurred prior to the effective date of those final regulations.
On October 16, 2016, Treasury released final regulations regarding corporate tax inversions and related earnings stripping. These final regulations include provisions that may be interpreted to impact otherwise common tax structures including intercompany financing and obligations. Although we continue to evaluate the impacts of the new regulations to our cross-border treasury management practices and intercompany financing structures, we have no assurance that these regulations will not impact our ability to utilize existing or similar structures in the future.
The Organization for Economic Co-operation and Development, which represents a coalition of member countries, has recommended changes to numerous long-standing tax principles relating to Base Erosion and Profit Shifting ("BEPS"). These changes are being adopted and implemented by many of the countries in which we do business and may increase our taxes in these countries. In addition, the European Commission has launched several initiatives to implement BEPS actions including an anti-tax avoidance directive and having a common (consolidated) corporate tax base. It is unclear at present if all or any of these initiatives will be implemented by the EU countries. Comprehensive U.S. tax reform has been stated to be a priority by the new U.S. Administration and the U.S. Congress. Changes in U.S. tax laws or their interpretation, if adopted, could significantly increase our consolidated effective tax rate and adversely affect our financial results particularly if the proposed border tax denying corporate tax relief on imports is introduced.
Any of these changes could have a prospective or retroactive application to us, our shareholders, and affiliates, and could adversely affect us by limiting our ability to utilize cash in a tax efficient manner.
Our effective tax rate may change in the future, which could adversely impact our future results from operations.
A number of factors may adversely impact our future effective tax rates, which may impact our future results from operations. These factors include, but are not limited to:
|
•
|
Income tax rate changes by governments;
|
|
•
|
The jurisdictions in which our profits are determined to be earned and taxed;
|
|
•
|
Changes in the valuation of our deferred tax assets and liabilities;
|
|
•
|
Adjustments to estimated taxes upon finalization of various tax returns;
|
|
•
|
Adjustments to our interpretation of transfer pricing standards, changes in available tax credits, grants and other incentives;
|
|
•
|
Changes in stock-based compensation expense; changes in tax laws or the interpretation of such tax laws (such as proposals for fundamental U.S. international tax reform);
|
|
•
|
Changes in U.S. generally accepted accounting principles;
|
|
•
|
Expiration or the inability to renew tax rulings or tax holiday incentives;
|
|
•
|
Divestitures of current operations; and
|
48
Perrigo Company plc
- Item 1A
Risk Factors
|
•
|
Repatriation of non-U.S. earnings with respect to which we have not previously provided for U.S. taxes.
|
The resolution of uncertain tax positions could be unfavorable, which could have an adverse effect on our business.
Although we believe that our tax estimates are reasonable and that our tax filings are prepared in accordance with all applicable tax laws, the final determination with respect to any tax audit, and any related litigation, could be materially different from our estimates or from our historical income tax provisions and accruals. The results of an audit or litigation could have a material effect on operating results or cash flows in the periods for which that determination is made. In addition, future period earnings may be adversely impacted by litigation costs, settlements, penalties or interest assessments.
|
•
|
In the United States, the Internal Revenue Service ("IRS") audit of our fiscal years ended June 27, 2009 and June 26, 2010 had previously concluded with the issuance of a statutory notice of deficiency on August 27, 2014. While we had previously agreed on certain adjustments and made associated payments of $8.0 million (inclusive of interest) in November 2014, the statutory notice of deficiency asserted various additional adjustments, including transfer pricing adjustments. The statutory notice of deficiency's adjustments for fiscal years 2009 and 2010 asserted an incremental tax obligation of approximately $68.9 million, inclusive of interest and penalties. We disagree with the IRS’s positions asserted in the statutory notice of deficiency. To contest the IRS's adjustments, in January 2015 we paid the incremental tax obligation (a prerequisite to contesting the proposed adjustments in U.S. district court), and in June 2015, we filed an administrative request for a refund with the IRS. The IRS subsequently denied our request for a refund. We anticipate filing a complaint in U.S. district court claiming a refund of the paid amounts prior to August 2017. An unfavorable resolution of this matter could have a material impact on our consolidated financial statements in future periods.
|
|
•
|
The IRS issued a statutory notice of deficiency on April 20, 2017 for the IRS audits of our fiscal years ended June 25, 2011 and June 30, 2012. While we agreed to certain adjustments in October 2016 and made minimal associated payments, the statutory notice of deficiency asserted various additional adjustments, including transfer pricing adjustments. The statutory notice of deficiency for fiscal years 2011 and 2012 asserted an incremental tax obligation of approximately
$74.2 million
, inclusive of interest and penalties. We disagree with the IRS's positions asserted in this notice. In anticipation of contesting the IRS's adjustments, in May 2017 we paid the incremental tax obligation (a prerequisite to contesting the proposed adjustments in U.S. district court) and expect to file an administrative request for refund.
|
|
•
|
We received notices of proposed adjustments on December 22, 2016 for the IRS audit of Athena Neurosciences, Inc., a subsidiary of Elan Corporation plc, which Perrigo acquired in December 2013,
|
for the years ending December 31, 2011 and December 31, 2012. We disagree with the IRS’s positions asserted in the notices of proposed adjustments and intend to contest them. Additionally, examination of transfer pricing positions is ongoing.
There are numerous other income tax jurisdictions for which tax returns are not yet settled, none of which are individually significant. At this time, we cannot predict the outcome of any audit or related litigation. Unfavorable resolutions of the audit matters discussed above could have a material impact on our consolidated financial statements in future periods.
Risks Related to Capital and Liquidity
Our historical failure to timely file our periodic reports with the SEC may limit our options in accessing the public markets to raise debt or equity capital, which in turn may limit our ability to pursue future transactions or strategies.
We did not timely file our Annual Report on Form 10-K for the fiscal year ended December 31, 2016 or our Quarterly Report on Form 10-Q for the quarter ended April 1, 2017. Any failure by us to timely file one or more of our periodic reports or otherwise remain current in our SEC reporting requirements may inhibit our ability to access the public markets to raise capital. For example, we are not eligible to use Form S-3 until we are current in our SEC
49
Perrigo Company plc
- Item 1A
Risk Factors
reporting requirements and we establish the required history of making timely filings for 12 full calendar months. The ability to use Form S-3 to register public offerings in the United States offers certain benefits, such as relatively lower costs and shorter timeframes to prepare a registration statement and cause it to become effective, which may enhance our ability to take advantage of positive market conditions as they develop. The limited availability of access to the public markets could increase the time and costs related to raising capital or prevent us from pursuing transactions or implementing future business strategies.
As described in our Current Report on Form 8-K filed on March 16, 2017, we entered into amendments the 2014 Revolver and the 2014 Term Loan providing for additional time to deliver certain financial statements, as well as the modification of certain financial and other covenants. Also, as described in our Current Report on Form 8-K filed on April 25, 2017, we entered into additional amendments to the 2014 Revolver and the 2014 Term Loan to modify provisions of such agreements necessary as a result of the correction in accounting related to the Tysabri
®
royalty stream, as well as waivers of any default or event of default that may arise from any restatement of or deficiencies in our financial statements for the periods specified in such amendments and waivers. No default or event of default existed prior to entering into these amendments and waivers under the 2013 Notes, 2014 Notes, or 2016 Notes. We are in compliance with all covenants under those Notes as of the date of this Annual Report on Form 10-K.
As a result of the filing of this Annual Report on Form 10-K, as of the filing date, we are in compliance with all covenants, including the financial statement delivery obligations, under the 2013 Indenture and 2014 Indenture. However, if we do not file the Quarterly Report on Form 10-Q for the quarterly period ended April 1, 2017 within 15 calendar days after the due date of such report, we would not be in compliance with the financial statement delivery obligations under such indentures. See
Item 8. Note 10
for more information on all of the above debt facilities and transactions.
Our indebtedness could adversely affect our ability to implement our strategic initiatives.
We anticipate that cash, cash equivalents, cash flows from operations, and borrowings available under our credit facilities will substantially fund working capital and capital expenditures. Our business requires continuous capital investments, and there can be no assurance that financial capital will always be available on favorable terms or at all. Additionally, our leverage and debt service obligations could adversely affect the business. At
December 31, 2016
, our total indebtedness outstanding was
$5.8 billion
.
|
•
|
Our senior credit facilities, the agreements governing our senior notes, and agreements governing our other indebtedness contain a number of restrictions and covenants that limit our ability to make distributions or other payments to our investors and creditors unless certain financial tests or other criteria are satisfied.
|
|
•
|
We also must comply with certain specified financial ratios and tests. These restrictions could affect our ability to operate our business and may limit our ability to take advantage of potential business opportunities, such as acquisitions. If we do not comply with the covenants and restrictions contained in our senior credit facilities, agreements governing our senior notes, and agreements governing our other indebtedness, we could be in default under those agreements, and the debt, together with accrued interest, could then be declared immediately due and payable.
|
|
•
|
While we have announced our intention, consistent with our investment grade philosophy, to pay down a portion of our outstanding indebtedness during 2017 using the proceeds from our sale of the Tysabri
®
royalty stream and residual free cash flow, we cannot provide assurance that our debt pay down strategy will occur on the proposed time line, or at all, or that we will maintain our investment grade rating. Further, if our debt pay down strategy is delayed, we may be required to obtain further amendments or waivers of our financial covenants under our 2014 Revolver and 2014 Term Loan.
|
|
•
|
Any default under our senior credit facilities or agreements governing our senior notes or other indebtedness could lead to an acceleration of debt under other debt instruments that contain cross-acceleration or cross-default provisions. If our indebtedness is accelerated, there can be no assurance that we would be able to repay or refinance our debt or obtain sufficient new financing.
|
50
Perrigo Company plc
- Item 1A
Risk Factors
|
•
|
Downgrades to our credit ratings may limit our access to capital and materially increase borrowing costs on current or future financing, including via trade payables with vendors. Customers' inclination to purchase goods from us may also be affected by the publicity associated with deterioration of our credit ratings.
|
|
•
|
There are various maturity dates associated with our credit facilities, senior notes, and other debt facilities. There is no assurance that cash, future borrowings or equity financing will be available for the payment or refinancing of our indebtedness. Further, there is no assurance that future refinancing or renegotiation of our senior credit facilities, senior notes or other debt facilities, or additional agreements will not have materially different or more stringent terms. See
Item 7. Management’s Discussion and Analysis of Financial Condition and Results of Operations
.
|
We cannot guarantee that we will buy back our ordinary shares pursuant to our announced share repurchase plan or that our share repurchase plan will enhance long-term shareholder value.
On October 22, 2015, our Board of Directors authorized a
$2.0 billion
share repurchase plan. During the
three months ended
December 31, 2015, we repurchased shares through the plan totaling
$500.0 million
. During 2016, we did not purchase any shares in the open market. The remaining
$1.5 billion
in authorized repurchases may extend through the year ended December 31, 2018. The specific timing and amount of buybacks, if any, will depend upon several factors, including market and business conditions, the trading price of our ordinary shares, and the nature of other investment opportunities. Buybacks of our ordinary shares pursuant to our share repurchase plan could affect the market price of our ordinary shares or increase their volatility. Additionally, our share repurchase plan could diminish our cash reserves, which may impact our ability to finance future growth and to pursue possible future strategic opportunities and acquisitions. Although our share repurchase plan is intended to enhance long-term shareholder value, there is no assurance that it will do so, and short-term share price fluctuations could reduce the plan’s effectiveness.
Any additional shares we may issue could dilute your ownership in the Company.
|
•
|
Under Irish law, our authorized share capital can be increased by an ordinary resolution of our shareholders, and the directors may issue new ordinary or preferred shares up to a maximum amount equal to the authorized but unissued share capital, without shareholder approval, once authorized to do so by the articles of association or by an ordinary resolution of our shareholders.
|
|
•
|
Subject to specified exceptions, Irish law grants statutory preemption rights to existing shareholders to subscribe for new issuances of shares for cash, but allows shareholders to authorize the waiver of the statutory preemption rights by way of special resolution with respect to any particular allotment of shares.
|
|
•
|
Our articles of association contain, as permitted by Irish company law, a provision authorizing the board to issue new shares for cash without offering preemption rights. The authorization of the directors to issue shares and the authorization of the waiver of the statutory preemption rights must both be renewed by the shareholders at least every five years, and we cannot provide any assurance that these authorizations will always be approved, which could limit our ability to issue equity and thereby adversely affect the holders of our securities.
|
We are incorporated in Ireland; Irish law differs from the laws in effect in the United States and may afford less protection to, or otherwise adversely affect, our shareholders.
As an Irish company, we are governed by the Irish Companies Act 2014 (the "Act"). The Act differs in some material respects from laws generally applicable to U.S. corporations and shareholders, including the provisions relating to interested directors, mergers, amalgamations and acquisitions, takeovers, shareholder lawsuits, and indemnification of directors.
|
•
|
Under Irish law, the duties of directors and officers of a company are generally owed to the company only. As a result, shareholders of Irish companies do not have the right to bring an action against the directors or officers of a company, except in limited circumstances.
|
51
Perrigo Company plc
- Item 1A
Risk Factors
|
•
|
Depending on the circumstances, shareholders may be subject to different or additional tax consequences under Irish law as a result of the acquisition, ownership and/or disposition of ordinary shares, including, but not limited to, Irish stamp duty, dividend withholding tax, and capital acquisitions tax.
|
|
•
|
There is no treaty between Ireland and the U.S. providing for the reciprocal enforcement of foreign judgments. Before a foreign judgment would be deemed enforceable in Ireland, the judgment must be provided by a court of competent jurisdiction and be for a final and conclusive sum. An Irish court may exercise its right to refuse to recognize and enforce a foreign judgment if the foreign judgment was obtained by fraud, if it violated Irish public policy, if it is in breach of natural justice, or if it is irreconcilable with an earlier judgment.
|
|
•
|
An Irish court may stay proceedings if concurrent proceedings are being brought elsewhere. Judgments of U.S. courts of liabilities predicated upon U.S. federal securities laws may not be enforced by Irish courts if deemed to be contrary to public policy in Ireland.
|
We are subject to Irish takeover rules under which our Board of Directors is not permitted to take any action without Irish Takeover Panel
approval that might frustrate an offer for our ordinary shares once we have received an approach that may lead to an offer, or have reason to believe an offer is imminent. Further, it could be more difficult for us to obtain shareholder approval for a merger or negotiated transaction than if we were a U.S. company because the shareholder approval requirements for certain types of transactions differ, and in some cases are greater, under Irish law.
We may be limited in our ability to pay dividends in the future.
A number of factors may limit our ability to pay dividends in the future, including:
|
•
|
The availability of distributable reserves, as approved by our shareholders and the Irish High Court;
|
|
•
|
Our ability to receive cash dividends and distributions from our subsidiaries;
|
|
•
|
Compliance with applicable laws and debt covenants; and
|
|
•
|
Our financial condition, results of operations, capital requirements, general business conditions, and other factors that our Board of Directors may deem relevant.
|
|
ITEM 1B.
|
UNRESOLVED STAFF COMMENTS
|
Not applicable.
52
Perrigo Company plc
- Item 2
|
ITEM 2.
|
PROPERTIES
|
Our world headquarters is located in Dublin, Ireland, and our North American base of operations is located in Allegan, Michigan. We manufacture products at
30
worldwide locations and have R&D, logistics, and office support facilities in many of the regions in which we operate. We own approximately
75%
of our facilities and lease the remainder. Our primary facilities by geographic area were as follows at
December 31, 2016
:
|
Country
|
Number of Facilities
|
Segment(s) Supported
|
||
|
Ireland
|
1
|
CHCA, CHCI, RX, Specialty Sciences
|
||
|
United States
|
46
|
CHCA, RX, Other
|
||
|
Mexico
|
12
|
CHCA
|
||
|
United Kingdom
|
7
|
CHCI
|
||
|
India
|
7
|
Other
|
||
|
France
|
6
|
CHCI
|
||
|
Belgium
|
5
|
CHCI
|
||
|
Australia
|
4
|
CHCI
|
||
|
Israel
|
3
|
CHCA, CHCI, RX, Other
|
||
|
Austria
|
3
|
CHCI
|
||
|
Germany
|
2
|
CHCI
|
||
|
Switzerland
|
2
|
CHCI
|
||
|
Italy
|
2
|
CHCI
|
||
|
Portugal
|
1
|
CHCI
|
||
|
Russia
|
1
|
CHCI
|
||
We believe that our production facilities are adequate to support the business, and our property and equipment are well maintained. Our manufacturing plants are suitable for their intended purposes and have capacities for current and projected needs of our existing products.
|
ITEM 3.
|
LEGAL PROCEEDINGS
|
Additional information regarding our current legal proceedings is presented in
Item 8. Note 16
.
|
ITEM 4.
|
MINE SAFETY DISCLOSURES
|
Not applicable.
53
Perrigo Company plc
- Additional Item
Executive Officers
ADDITIONAL ITEM. EXECUTIVE OFFICERS OF THE REGISTRANT
Our executive officers and their ages and positions as of
May 19, 2017
were:
|
Title and Business Experience
|
Age
|
|||
|
Svend Andersen
|
Mr. Andersen was named Executive Vice President and President, Consumer Healthcare International in February 2017. Prior to joining Perrigo, Mr. Andersen served as Executive Vice President – Europe for LEO-Pharma. Prior to that, he led Hospira, Inc.’s Europe, Middle East and Africa (“EMEA”) business, was responsible for the Western European division’s pharmaceuticals, generics, OTC and hospital products businesses at Actavis, and also led Alpharma’s EMEA businesses prior to its acquisition by Actavis.
|
55
|
||
|
Thomas M. Farrington
|
Mr. Farrington was named Executive Vice President and Chief Information Officer in November 2015. He formerly served as Senior Vice President and Chief Information Officer from October 2006 to November 2015.
|
59
|
||
|
John T. Hendrickson
|
Mr. Hendrickson was appointed Chief Executive Officer in April 2016 and to the Board of Directors in June 2016. He served as President from October 2015 until April 2016. He was formerly Executive Vice President, Global Operations & Supply Chain of Perrigo Company from March 2007 to October 2015; Executive Vice President and General Manager of Perrigo Consumer Healthcare from 2003 to 2007; Executive Vice President – Operations from 1999 to 2003; Vice President of Manufacturing from 1996 to 1999; Vice President of Customer Service from 1995 to 1996; Director of Engineering from 1993 to 1995; and Process Engineering Manager from 1989 to 1993.
|
54
|
||
|
Ronald Janish
|
Mr. Janish was named Executive Vice President of Global Operations and Supply Chain in October 2015. He served as Senior Vice President of International and Rx Operations from 2012 until 2015 and as Managing Director of Perrigo’s Australian operations from 2010 to 2012. Previously, he held Senior Vice President roles for Perrigo in International Market Development, China Business Development and Global Procurement.
|
51
|
||
|
Todd W. Kingma
|
Mr. Kingma was named Executive Vice President, General Counsel and Secretary in May 2006. He served as Vice President, General Counsel and Secretary from August 2003 to May 2006.
|
57
|
||
|
Sharon Kochan
|
Mr. Kochan was named Executive Vice President and General Manager, Consumer Healthcare International in August 2012. He served as Executive Vice President, General Manager of Prescription Pharmaceuticals from March 2007 to July 2012 and as Senior Vice President of Business Development and Strategy from March 2005 to March 2007. Mr. Kochan was Vice President, Business Development of Agis Industries (1983) Ltd. from July 2001 until the acquisition of Agis by the Company in March 2005.
|
48
|
||
|
James R. Michaud
|
Mr. Michaud was named Executive Vice President, Chief Human Resources Officer in August 2016. Immediately prior to joining Perrigo, Mr. Michaud was President of Human Resources Strategies, a consulting company focused on providing business based human resource strategies to a wide variety of companies in multiple industries. His corporate career spanned senior human resource roles in Alcoa, Arcelor Mittal Steel, and most recently, Cliffs Natural Resources, where he served as Executive Vice President, Chief Human Resources Officer from 2010 to 2014.
|
61
|
||
|
Jeffrey R. Needham
|
Mr. Needham was named Executive Vice President, General Manager of Consumer Healthcare Americas in October 2009. He served as Senior Vice President of Commercial Business Development for Consumer Healthcare from March 2005 through October 2009. Previously, he served as Senior Vice President of International from November 2004 to March 2005. He served as Managing Director of Perrigo’s U.K. operations from May 2002 to November 2004 and as Vice President of Marketing from 1993 to 2002.
|
60
|
||
|
Grainne Quinn
|
Ms. Quinn was named Executive Vice President in July 2016 and has served as Chief Medical Officer since November 2015. Prior to that she served as Vice President and Head of Global Patient Safety from January 2014 until November 2015. Dr. Quinn was Vice President and Head of Global Pharmacovigilance and Risk Management for Elan from April 2009 until December 2013 when the Company acquired Elan.
|
47
|
||
|
Paul Weninger
|
Mr. Weninger was named Executive Vice President of Global Quality Operations in December 2015. He served as Senior Vice President, U.S. Quality Operations from 2013 to 2015; Vice President, Consumer Healthcare and Rx Quality Operations, U.S. and Asia Pacific from 2010 to 2013; Vice President, Global CHC Quality Operations from 2007 to 2010.
|
53
|
||
|
John Wesolowski
|
Mr. Wesolowski was named Executive Vice President, President RX in November 2016. He previously was named as Acting General Manager, RX, in July 2016 and served in that capacity until November 2016. Previously, he served as Senior Vice President of RX Commercial Operations, from 2013 until July 2016. Mr. Wesolowski joined Perrigo in February 2004 as the Vice President, RX Sales and Marketing and was subsequently promoted to the Senior Vice President of RX Sales and Marketing in 2012.
|
49
|
||
|
Ronald L. Winowiecki
|
Mr. Winowiecki was appointed Acting CFO in February 2017. He served as Senior Vice President of Business Finance at Perrigo since January 2014. Before serving as SVP, Mr. Winowiecki was Perrigo’s Vice President for Treasury and Accounting Shared Services from September 2011 to December 2013 and the company’s Corporate Vice President Treasurer from October 2008 to August 2011.
|
50
|
||
54
Perrigo Company plc
- Item 5
|
ITEM 5.
|
MARKET FOR REGISTRANT'S COMMON EQUITY, RELATED STOCKHOLDER MATTERS AND ISSUER PURCHASES OF EQUITY SECURITIES
|
On and prior to December 18, 2013, our common stock consisted of shares of Perrigo Company, a Michigan Corporation, and since December 19, 2013, our common equity consists of ordinary shares of Perrigo Company plc, incorporated under the laws of Ireland.
Prior to June 6, 2013, our common equity traded on the NASDAQ Global Select Market ("NASDAQ") under the symbol PRGO. Since June 6, 2013, our common equity has traded on the New York Stock Exchange ("NYSE") under the symbol PRGO. In association with the acquisition of Agis Industries (1983) Ltd., our common equity has been trading on the Tel Aviv Stock Exchange ("TASE") since March 16, 2005. As of
May 19, 2017
, there were
2,162
record holders of our ordinary shares.
Set forth below are the high and low sale prices for our ordinary shares by the NYSE for the periods indicated:
|
Year Ended
|
Six Months Ended
|
Year Ended
|
|||||||||||||||||||||
|
|
December 31, 2016
|
December 31, 2015
|
June 27, 2015
|
||||||||||||||||||||
|
High
|
Low
|
High
|
Low
|
High
|
Low
|
||||||||||||||||||
|
First quarter
|
$
|
152.36
|
|
$
|
122.62
|
|
$
|
198.42
|
|
$
|
158.35
|
|
$
|
160.65
|
|
$
|
135.00
|
|
|||||
|
Second quarter
|
$
|
133.53
|
|
$
|
84.85
|
|
$
|
167.92
|
|
$
|
140.40
|
|
$
|
171.57
|
|
$
|
142.38
|
|
|||||
|
Third quarter
|
$
|
99.14
|
|
$
|
82.50
|
|
N/A
|
|
N/A
|
|
$
|
174.65
|
|
$
|
147.21
|
|
|||||||
|
Fourth quarter
|
$
|
97.17
|
|
$
|
79.72
|
|
N/A
|
|
N/A
|
|
$
|
205.72
|
|
$
|
161.86
|
|
|||||||
The graph below shows a comparison of our cumulative total return with the cumulative total returns for the S&P 500 Index and the S&P Pharmaceuticals Index. The graph assumes an investment of $100 at the beginning of the period and the reinvestment of any dividends. Information in the graph is presented for the years ended December 31, 2011 through December 31, 2016.
55
Perrigo Company plc
- Item 5
COMPARISON OF 5 YEAR CUMULATIVE TOTAL RETURN*
AMONG PERRIGO COMPANY PLC**, THE S&P 500 INDEX, AND THE S&P PHARMACEUTICALS INDEX
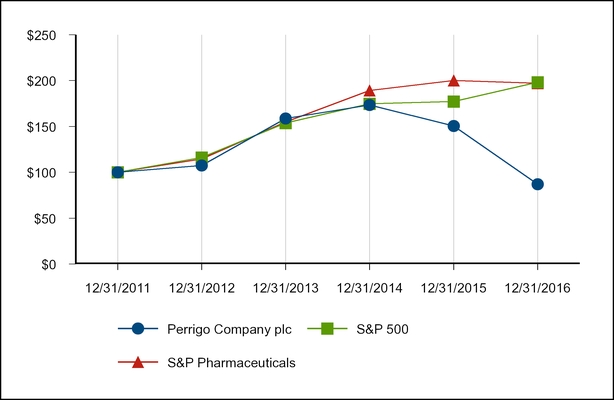
|
12/31/2011
|
12/31/2012
|
12/31/2013
|
12/31/2014
|
12/31/2015
|
12/31/2016
|
|
|
Perrigo Company plc
|
$100.00
|
$107.25
|
$158.67
|
$173.32
|
$150.48
|
$87.07
|
|
S&P 500
|
$100.00
|
$116.00
|
$153.58
|
$174.60
|
$177.01
|
$198.18
|
|
S&P Pharmaceuticals
|
$100.00
|
$114.43
|
$154.74
|
$189.12
|
$200.06
|
$196.93
|
|
*
|
$100 invested on December 31, 2011 in stock or index - including reinvestment of dividends. Indexes calculated on month-end basis.
|
|
**
|
Perrigo Company prior to December 18, 2013. Perrigo Company plc beginning December 18, 2013.
|
In January 2003, the Board of Directors adopted a policy of paying quarterly dividends. The declaration and payment of dividends and the amount paid, if any, are subject to the discretion of the Board of Directors and depend on our earnings, financial condition, capital and surplus requirements and other factors the Board of Directors may consider relevant. See
Item 8. Note 11
for additional information on dividends paid.
On October 22, 2015, the Board of Directors approved a share repurchase plan of up to
$2.0 billion
. During the
six months ended
December 31, 2015
, we repurchased
3.3 million
ordinary shares at an average repurchase price of
$151.59
per share, for a total of
$500.0 million
. We did not repurchase any shares under the share repurchase plan during the
year ended
December 31, 2016
.
56
Perrigo Company plc
- Item 6
|
ITEM 6.
|
SELECTED FINANCIAL DATA
|
The Consolidated Statements of Operations data set forth below with respect to the fiscal year ended December 31, 2016, the six months ended December 31, 2015, and the years ended June 27, 2015 and June 28, 2014, and the Consolidated Balance Sheet data at December 31, 2016, December 31, 2015 and June 27, 2015 set forth below, are derived from and are qualified by reference to the audited consolidated financial statements included in
Item 8
of this Annual Report on Form 10-K and should be read in conjunction with those financial statements and notes. The Consolidated Statements of Operations data set forth below with respect to the six months ended December 31, 2015 and December 27, 2014, and the years ended June 27, 2015 and June 28, 2014, and the Consolidated Balance Sheet data at December 31, 2015, December 27, 2014, June 27, 2015 and June 28, 2014 have been restated as set forth in this Annual Report on Form 10-K for the year ended December 31, 2016. The Consolidated Statement of Operations set forth below with respect to the six months ended December 27, 2014 and the fiscal years ended June 29, 2013 and June 30, 2012, and the Consolidated Balance Sheet data at December 27, 2014, June 28, 2014, June 29, 2013 and June 30, 2012 are derived from audited consolidated financial statements not included in this Annual Report on Form 10-K. The information set forth below is not necessarily indicative of results of future operations, and should be read in conjunction with
Item 7
and
Item 8
to fully understand factors that may affect the comparability of the information presented below. For additional information on the restatement, refer to
Item 8. Note 1
.
|
Year Ended
|
Six Months Ended
|
Year Ended
|
|||||||||||||||||||||||||
|
December 31, 2016
(1)
|
December 31, 2015
(2)
|
December 27, 2014
(3)
|
June 27, 2015
(4)
|
June 28, 2014
(5)
|
June 29, 2013
(6)
|
June 30, 2012
(7)
|
|||||||||||||||||||||
|
(in millions, except per share amounts)
|
Restated
|
Restated
|
Restated
|
Restated
|
|||||||||||||||||||||||
|
Statements of Operations Data
|
|||||||||||||||||||||||||||
|
Net sales
|
$
|
5,280.6
|
|
$
|
2,632.2
|
|
$
|
1,844.7
|
|
$
|
4,227.1
|
|
$
|
3,914.1
|
|
$
|
3,539.8
|
|
$
|
3,173.2
|
|
||||||
|
Cost of sales
|
3,228.8
|
|
1,553.3
|
|
1,170.9
|
|
2,582.9
|
|
2,462.0
|
|
2,259.8
|
|
2,077.7
|
|
|||||||||||||
|
Gross profit
|
2,051.8
|
|
1,078.9
|
|
673.8
|
|
1,644.2
|
|
1,452.1
|
|
1,280.0
|
|
1,095.6
|
|
|||||||||||||
|
Operating expenses
|
4,051.5
|
|
1,011.3
|
|
384.1
|
|
971.7
|
|
880.7
|
|
600.9
|
|
526.4
|
|
|||||||||||||
|
Operating income (loss)
|
$
|
(1,999.7
|
)
|
$
|
67.6
|
|
$
|
289.7
|
|
$
|
672.5
|
|
$
|
571.4
|
|
$
|
679.1
|
|
$
|
569.2
|
|
||||||
|
Net income (loss)
|
$
|
(4,012.8
|
)
|
$
|
42.5
|
|
$
|
180.6
|
|
$
|
136.1
|
|
$
|
232.8
|
|
$
|
441.9
|
|
$
|
401.6
|
|
||||||
|
Diluted income from continuing operations per share
|
$
|
(28.01
|
)
|
$
|
0.29
|
|
$
|
1.34
|
|
$
|
0.97
|
|
$
|
2.01
|
|
$
|
4.68
|
|
$
|
4.18
|
|
||||||
|
Dividends declared per share
|
$
|
0.58
|
|
$
|
0.25
|
|
$
|
0.21
|
|
$
|
0.46
|
|
$
|
0.39
|
|
$
|
0.35
|
|
$
|
0.31
|
|
||||||
|
(1)
|
Includes the results of operations for assets acquired from Barr Laboratories, Inc. and assets acquired from Matawan Pharmaceuticals, LLC for the five months and eleven months and one week ended
December 31, 2016
, respectively.
|
|
(2)
|
Includes the results of operations of Naturwohl and the GSK, ScarAway
®
, and Entocort
®
asset acquisitions for the two and a half months, three months, three months, and two weeks ended
December 31, 2015
, respectively.
|
|
(3)
|
Includes the results of operations for assets acquired from Lumara Health, Inc. for the two months ended
December 27, 2014
.
|
|
(4)
|
Includes the results of operations for assets acquired from Lumara Health, Inc. and the results of operations of Omega Pharma Invest N.V. and Gelcaps Exportadora de Mexico, S.A. de C.V. for the eight, three, and two months ended
June 27, 2015
, respectively.
|
|
(5)
|
Includes the results of operations for Elan Corporation, plc and results of operations for assets acquired from Fera Pharmaceuticals, LLC (Methazolomide) and Aspen Global Inc. for the six, five and four months ended
June 28, 2014
, respectively.
|
|
(6)
|
Includes the results of operations for assets acquired from Fera Pharmaceuticals, LLC, and results of operations for Velcera, Inc., Rosemont Pharmaceuticals Ltd., Cobrek Pharmaceuticals, Inc., and Sergeant's Pet Care Products, Inc. for the two weeks, and three, five, six and nine months ended
June 29, 2013
, respectively.
|
|
(7)
|
Includes the results of operations for Paddock Laboratories,Inc. and CanAm Care, LLC for the eleven and six months ended June 30, 2012, respectively.
|
57
Perrigo Company plc
- Item 6
|
December 31, 2016
|
December 31, 2015
|
December 27, 2014
|
June 27,
2015 |
June 28, 2014
(1)
|
June 29, 2013
(1)
|
June 30, 2012
(1)
|
|||||||||||||||||||||
|
(in millions)
|
Restated
|
Restated
|
Restated
|
Restated
|
|||||||||||||||||||||||
|
Balance Sheet Data
|
|||||||||||||||||||||||||||
|
Cash and cash equivalents
|
$
|
622.3
|
|
$
|
417.8
|
|
$
|
3,596.1
|
|
$
|
785.6
|
|
$
|
799.5
|
|
$
|
779.9
|
|
$
|
602.5
|
|
||||||
|
Total assets
|
13,870.1
|
|
19,349.6
|
|
16,508.4
|
|
19,591.9
|
|
13,879.1
|
|
5,336.9
|
|
4,013.6
|
|
|||||||||||||
|
Long-term debt, less current portion
|
5,224.5
|
|
4,971.6
|
|
4,439.4
|
|
5,246.9
|
|
3,063.1
|
|
1,927.8
|
|
1,329.2
|
|
|||||||||||||
|
(1)
|
Financial data has been retrospectively adjusted for the change in accounting policy to reclassify deferred financing fees from Other non-current assets to Long-term debt.
|
58
Perrigo Company plc
- Item 7
Executive Overview
|
ITEM 7.
|
MANAGEMENT'S DISCUSSION AND ANALYSIS OF FINANCIAL CONDITION AND RESULTS OF OPERATIONS
|
The following Management's Discussion and Analysis ("MD&A") is intended to provide readers with an understanding of our financial condition, results of operations, and cash flows by focusing on changes in certain key measures from year to year. This MD&A is provided as a supplement to, and should be read in conjunction with, our Consolidated Financial Statements and accompanying Notes found in
Item 8
of this report. See also "
Cautionary Note Regarding Forward-Looking Statements
."
EXECUTIVE OVERVIEW
Perrigo Company plc was incorporated under the laws of Ireland on June 28, 2013. We became the successor registrant to Perrigo Company, a Michigan corporation, on December 18, 2013 in connection with the acquisition of Elan Corporation, plc ("Elan"), which is discussed further in
Item 8. Note 2
. Unless the context requires otherwise, the terms "Perrigo", the "Company", "we," "our," "us," and similar pronouns used herein refer to Perrigo Company plc, its subsidiaries, and all predecessors of Perrigo Company plc and its subsidiaries.
We are a leading global over-the-counter ("OTC") consumer goods and pharmaceutical company, offering patients and customers high quality products at affordable prices. From our beginning in 1887 as a packager of home remedies, we have grown to become the world's largest manufacturer of OTC healthcare products and supplier of infant formulas for the store brand market. We are also a leading provider of generic standard topical products such as creams, lotions, and gels, as well as inhalants and injections ("extended topical") prescription products in the U.S. We also received royalties from sales of the multiple sclerosis drug Tysabri
®
but divested our rights to those royalties in March 2017. We provide “Quality Affordable Healthcare Products
®
” across a wide variety of product categories and geographies, primarily in North America, Europe, and Australia, as well as in other markets, including Israel, and China.
Our fiscal year previously consisted of a 52- or 53-week year ending on or around June 30 of each year with each quarter ending on the Saturday closest to each calendar quarter end. Beginning on January 1, 2016, we changed our fiscal year to begin on January 1 and end on December 31 of each year. As a result of our change in year end, this Annual Report on Form 10-K discloses the results of our operations for the twelve-month period from January 1, 2016 through December 31, 2016. The six months ended December 31, 2015 reflects our financial results from June 28, 2015 through December 31, 2015, and the six months ended December 27, 2014 reflects our financial results from June 29, 2014 through December 27, 2014. The year ended June 27, 2015 reflects our financial results for the twelve-month period from June 29, 2014 to June 27, 2015, and the year ended June 28, 2014 reflects our financial results for the twelve-month period from June 30, 2013 to June 28, 2014. Calendar-year data for 2015 was derived from our audited results for the six-month period ended December 31, 2015 and unaudited results for the fiscal quarters ended March 28, 2015 and June 27, 2015. We cut off our quarterly accounting periods on the Saturday closest to the end of the calendar quarter, with the fourth quarter ending on December 31 of each year.
Our Segments
In the fourth quarter of 2016, we changed our reporting segments to better align with our new organizational structure. These organizational changes were made to optimize our structure to better serve our customers and to reflect the way in which our chief operating decision maker reviews our operating results and allocates resources. The changes in our reporting segments are as follows:
|
•
|
Consumer Healthcare Americas
("
CHCA
")
,
comprises our U.S., Mexico and Canada consumer healthcare business (OTC, contract, infant formula and animal health categories).
|
|
•
|
Consumer Healthcare International
("
CHCI
")
,
comprises our legacy Branded Consumer Healthcare segment and now includes our consumer focused businesses in the U.K., Australia, and Israel, which were previously reported in the legacy Consumer Healthcare segment. This segment includes our U.K. liquid licensed products business, which was previously reported in the Prescription Pharmaceuticals segment.
|
|
•
|
Prescription Pharmaceuticals
("
RX
")
,
comprises our U.S. Prescription Pharmaceuticals business.
|
|
•
|
Specialty Sciences
, continued to comprise the Tysabri
®
Royalty Stream.
|
59
Perrigo Company plc
- Item 7
Executive Overview
We also have an "
Other
" reporting segment that will continue to comprise our legacy Active Pharmaceutical Ingredients ("API") business,
which does not meet the quantitative threshold required to be a separately reportable segment. Financial information related to our business segments and geographic locations can be found in
Item 8.
Note 19
.
For information on each segment, refer to
Item 1. Business - Our Segments
. For results by segment see below "Segment Results" and
Item 8. Note 19
. See
Item 1. Business
for information on our business environment and competitive landscape.
Restatement
In connection with our year-end financial statement close and preparation of our Form 10-K for 2016, we identified misstatements in our historical financial statements, including for the nine months
ended October 1, 2016, six months ended
December 31, 2015
, and the years ended
June 27, 2015
and
June 28, 2014
(the "Restated Periods"). Accordingly, we have restated the consolidated financial statements for the Restated Periods (and certain financial statements for interim periods within the Restated Periods) to reflect the correction of the misstatements, the most significant of which are described below. The segments predominantly affected by this restatement are Specialty Sciences and CHCI. Refer to
Item 8. Note 10
of the Consolidated financial statements for additional information on how this restatement affects our debt covenants.
During the 2016 year-end financial statement close process, and in anticipation of our potential sale of our royalty rights, we evaluated the potential effects of the Tysabri
®
royalty stream sale accounting and the accounting and disclosures associated with the pending 2018 adoption of ASC 606 “Revenues from Contracts with Customers.” After an extensive evaluation of the facts and circumstances and the judgments required to determine the appropriate classification, it was determined that under existing U.S. GAAP the contingent payments from Elan's May 2013 sale of Tysabri
®
to Biogen (the "Tysabri
®
royalty stream") should have been recorded as a financial asset, rather than an intangible asset, on the date of our acquisition of Elan.
Our Tysabri
®
royalty stream is now accounted for in our consolidated financial statements for 2016 and prior restated periods as a financial asset using the fair value option. We made the election to account for the Tysabri
®
financial asset using the fair value option as we believe this method is most appropriate for an asset that does not have a par value, a stated interest stream, or a termination date. Accounting for the Tysabri
®
royalty stream as a financial asset required us to adjust our financial statements for the Restated Periods to (1) remove the Tysabri
®
royalty stream from net sales in our Consolidated Statements of Operations, (2) remove the amortization expense (reflected in cost of goods sold) associated with recording the Tysabri
®
royalty stream as an intangible asset, and (3) include the quarterly changes in fair value of the Tysabri
®
royalty stream as a component of other non-operating income/expense. The cash payments we received from the royalty stream are included in our Consolidated Statements of Cash Flows for the Restated Periods and reflect the cash received from the Tysabri
®
royalty stream as cash from investing activities, rather than as cash from operating activities.
In addition, in connection with the financial closing for the year ended December 31, 2016, we identified certain tax basis intangible assets that existed at the time of the acquisition of Omega Pharma Invest N.V. (“Omega”) on
March 30, 2015
, which reduced the deferred tax liabilities in acquired intangible assets and increased our valuation allowance resulting in a net change to our deferred taxes of approximately
$236.3 million
. The resulting balance sheet reclassification required a reduction of goodwill, offset by a corresponding reduction to net deferred taxes at the date of the Omega acquisition. Further, we have evaluated the accounting effect subsequent to the acquisition date related to the remeasured deferred tax liability, including the impairments of Omega goodwill recorded in 2016 and certain adjustments to valuation allowances, which have been reflected in the Restated Periods.
In restating our financial statements to correct the misstatements discussed above, we are also making adjustments for previously identified required corrections with respect to the Restated Periods. When these financial statements were originally issued, we assessed the impact of these unrecorded adjustments and concluded that they were not material individually or in the aggregate to our consolidated financial statements. The Consolidated Statement of Shareholders' Equity was corrected for a
$36.9 million
increase
in net
income
,
$8.1 million
increase
in net
income
, and
$27.5 million
increase
in net
income
for the six months ended December 31, 2015 and for the
60
Perrigo Company plc
- Item 7
Executive Overview
years ended June 27, 2015 and June 28, 2014, respectively. There was no effect on the beginning balance of Shareholders' Equity at June 29, 2013 as a result of this restatement.
All of the financial information presented in this Item 7 has been revised to reflect the restatement more fully described in
Item 8. Note 1
to the Consolidated Financial Statements.
Strategy
Our strategy is to deliver Quality Affordable Healthcare Products
®
by leveraging our global infrastructure to expand our product offerings, thereby providing new innovative products and product line extensions to existing consumers and servicing new healthcare consumers through entry into adjacent or new markets. We accomplish this strategy by investing in and continually improving all aspects of our five strategic pillars:
|
•
|
High quality;
|
|
•
|
Superior customer service;
|
|
•
|
Leading innovation;
|
|
•
|
Best cost; and
|
|
•
|
Empowered people.
|
We utilize shared services and Research and Development ("R&D") centers of excellence in order to help ensure consistency in our processes around the world, and to maintain focus on our five strategic pillars.
We have grown rapidly in recent years through a combination of organic growth and targeted acquisitions. We continually reinvest in our R&D pipeline and work with partners as necessary to strive to be first-to-market with new products. Our organic growth has been and will continue to be driven by successful new product launches in the
CHCA
,
CHCI
, and
RX
segments. Over time, we expect to continue to grow inorganically through expansion into adjacent products, product categories, and channels, as well as potentially through entry into new geographic markets. We evaluate potential acquisition targets using a return on invested capital ("ROIC") metric.
Competitive Advantage
We believe our consumer facing business model is best-in-class in that it combines the required competencies of a fast-moving consumer goods company and a pharmaceutical manufacturing company, with the supply chain breadth necessary to support customers in the markets we serve. The durable business model competencies align with our five strategic pillars and provide us a competitive advantage in the marketplace. We fully integrate quality in our operational systems across all products. Our ability to manage our supply chain complexity across multiple dosage forms, formulations, and stock-keeping units, as well as acquisitions, integration, and hundreds of global partners provides value to our customers. Product development and life cycle management are at the core of our operational investments. Globally we have
30
plants that are all in good regulatory compliance standing and have systems and structures in place to guide our continued success. Our leadership team is fully engaged in aligning all our metrics and objectives around sustainable compliance with industry associations and regulatory agencies.
Among other things, we believe the following give us a competitive advantage and provide value to our customers:
|
•
|
Leadership in first-to-market product development and product life cycle management;
|
|
•
|
Turn-key regulatory, and promotional capabilities;
|
|
•
|
Management of supply chain complexity and utilizing economies of scale;
|
|
•
|
Quality and cost effectiveness throughout the supply chain creating a sustainable, low-cost network; and
|
|
•
|
Expansive pan-European commercial infrastructure, brand-building capabilities, and diverse product portfolio.
|
61
Perrigo Company plc
- Item 7
Executive Overview
Highlights
Year Ended
December 31, 2016
|
•
|
Consistent with previously announced actions, we added a number of positions and processes to our Dublin headquarters across a range of corporate functions, including supply chain/global operations, procurement, enterprise risk management, and corporate finance, leveraging the strength of our global platform.
|
|
•
|
We repaid
$500.0 million
outstanding under our 1.300% Senior Notes due 2016 ("1.300% 2016 Notes") on September 29, 2016.
|
|
•
|
We completed the sale of our U.S. Vitamins, Minerals, and Supplements ("VMS") business to International Vitamins Corporation ("IVC") on August 5, 2016.
|
Six Months Ended December 31, 2015
|
•
|
On November 13, 2015, our shareholders rejected an unsolicited tender offer from Mylan N.V. ("Mylan"). During the
six months ended
December 31, 2015
, the total cost to effectively defend against Mylan was
$86.9 million
, which was recorded in
Administration
expense.
|
|
•
|
We expanded our product offerings through targeted acquisitions including:
|
|
•
|
The announced acquisition of
a portfolio of generic dosage forms and strengths of
Retin-A
®
(tretinoin), a topical prescription acne treatment, from Matawan Pharmaceuticals, LLC, which closed in January 2016 and will expand our "prescription only" ("Rx") portfolio.
|
|
•
|
The acquisition of Crohn's disease treatment Entocort
®
(budesonide) capsules and its authorized generic (for sale within the U.S.), from AstraZeneca plc, which expanded our Rx portfolio.
|
|
•
|
The acquisition of Naturwohl Pharma GmbH ("Naturwohl"), a nutritional business known for its leading German dietary supplement brand, Yokebe
®
, and the acquisition of a portfolio of well-established OTC brands, such as Niquitin
®
and Coldrex
®
,
from GlaxoSmithKline Consumer Healthcare (“GSK”). Both of these acquisitions built upon the global platform we established through the Omega Pharma Invest N.V. (
"
Omega") acquisition, leveraging our European market share and expanding our product offerings.
|
|
•
|
The ScarAway
®
brand portfolio acquisition, which served as our entry into the branded OTC business in the U.S.
|
|
•
|
We launched a number of new products across our segments with sales totaling
$231.1 million
for the
six months ended
December 31, 2015
.
|
|
•
|
We repurchased $500.0 million shares as part of our authorized share repurchase plan.
|
|
•
|
We executed initiatives designed to increase operational efficiency and improve our return on invested capital by globalizing our supply chain through global shared service arrangements, streamlining our organizational structure, and disposing of certain assets. During the
six months ended
December 31, 2015
, restructuring charges totaled
$26.9 million
.
|
Year Ended
June 27, 2015
|
•
|
We realized growth in the following areas:
|
|
•
|
Total net sales of
$4.2 billion
due primarily to current year acquisitions and new products;
|
|
•
|
Gross profit percentage of
38.9%
; and
|
|
•
|
Operating cash flows of
$855.2 million
.
|
62
Perrigo Company plc
- Item 7
Executive Overview
|
•
|
We significantly expanded our geographic footprint and product portfolio through the acquisition of Omega, one of Europe's largest healthcare companies, which closed on
March 30, 2015
.
|
|
•
|
The Omega acquisition provided us with a significantly larger product portfolio, broadened our global reach through access to 34 new countries, and enhanced our scale.
|
|
•
|
We expanded our product offerings through targeted acquisitions including:
|
|
•
|
The Lumara Health Inc. ("Lumara") product acquisition, which expanded our women's health offerings within our
RX
segment; and
|
|
•
|
Patheon Inc.'s Mexican operations, Gelcaps Exportadora de Mexico, S.A. de C.V., ("Gelcaps"), which provided us with gelcap manufacturing capabilities and expanded our presence in the Mexican OTC market.
|
Year Ended
June 28, 2014
|
•
|
We established a differentiated platform for international expansion through the Elan acquisition.
|
|
•
|
The Elan acquisition led to the creation of our new parent company, Perrigo Company plc, incorporated under the laws of Ireland. Our new corporate structure has allowed us to continue to grow in core markets and further expand outside of the U.S. with the parent company serving as a global business hub and providing the scale and resources to drive our strategic initiatives and investments.
|
|
•
|
The acquisition also provided us with our Tysabri
®
royalty stream, enhancing our cash flows. See
Item 1. Business - Specialty Sciences
for more information on Tysabri
®
.
|
|
•
|
We increased our presence in the Australian market through the acquisition of a basket of OTC products from Aspen Global Inc. ("Aspen").
|
|
•
|
We further developed our ophthalmic capabilities with the acquisition of Methazolomide from Fera Pharmaceuticals, LLC ("Fera").
|
See
Item 8. Note 2
for more information on all of the above-mentioned acquisitions.
Leadership Changes
On April 24, 2016, we named Laurie Brlas as Chairman of the Board of Directors, promoted John T. Hendrickson from President to Chief Executive Officer, and accepted the resignation of Joseph C. Papa as Chairman and Chief Executive Officer.
On April 27, 2016, Sharon Kochan's role as Executive Vice President and General Manager, International, was expanded to lead the CHCI segment following the resignation of Marc Coucke as Executive Vice President and General Manager of the CHCI segment.
On August 29, 2016, Jim Michaud joined the Company as Executive Vice President, Chief Human Resources Officer.
On November 8, 2016, we appointed John Wesolowski the Executive Vice President, President,
RX
. Mr. Wesolowski served as Acting General Manager,
RX
following the resignation of Doug Boothe on July 20, 2016.
On November 10, 2016, we announced the appointment of Geoffrey M. Parker and Theodore R. Samuels to our Board of Directors. Geoffrey M. Parker's joined the board on November 7, 2016, and Mr. Samuels joined the Board on January 4, 2017.
63
Perrigo Company plc
- Item 7
Executive Overview
On February 7, 2017, Jeffrey Smith, Jeff Kindler, and Bradley Alford joined our Board of Directors, and Herman Morris, Shlomo Yanai, Michael Jandernoa, and Gary Kunkle, resigned from the Board.
On February 21, 2017, Judy L. Brown resigned as Executive Vice President, Business Operations and Chief Financial Officer and Ron Winowiecki was appointed acting Chief Financial Officer of the Company, effective February 27, 2017.
On February 27, 2017, we announced the appointment of Svend Andersen to the position of Executive Vice President and President, Consumer Healthcare International.
On May 8, 2017, Rolf Classon and Adriana Karaboutis joined our Board of Directors, and effective May 2, 2017, Ellen Hoffing resigned from our Board of Directors.
RESULTS OF OPERATIONS
CONSOLIDATED
Recent Trends and Developments
|
•
|
We continue to experience a significant reduction in pricing expectations from historical levels in our
RX
segment due to industry and competitive pressures. This softness in pricing is attributed to various factors including increased focus from customers to capture supply chain productivity savings, low raw material commodity pricing, competition in specific products, and consolidation of certain customers. We expect this softness to continue to impact the segment for the foreseeable future, and we are forecasting a 9% to 11% pricing decline in this segment for the year ended December 31, 2017 compared to the prior year.
|
|
•
|
The
CHCI
segment has been impacted by market dynamics in key countries such as Belgium, France, Germany and Italy due to softness in certain brand categories and by unfavorable foreign currency impacts, primarily in the U.K. related to Brexit. In addition, the segment has been impacted in Belgium by a change in the forecast with a major wholesaler, as management implements improved supply chain efficiencies in this market. The
CHCI
segment has restructured its approach to addressing these market dynamics including: (1) implementing a brand prioritization strategy, with an objective to balance the cost of advertising and promotional investments with expected contributions from category sales, (2) restructuring its sales force in each of these markets to more effectively serve customers, and (3) exiting certain unfavorable distribution agreements. The combination of these actions are expected to improve the segment's focus on higher value OTC products, reduce selling costs and improve operating margins in the segment.
|
|
•
|
On December 9, 2016, we announced that we had entered into a definitive agreement to sell our India API business to Strides Shasun Limited. As of December 31, 2016, the net assets of our India API business were classified as "held for sale" as discussed in
Item 8. Note 9
. The sale closed on April 6, 2017 and is not expected to have a material impact on our operations or result in a significant gain or loss when recorded in the second quarter of 2017.
|
|
•
|
During the three months ended December 31, 2016, the U.S. market for our Entocort
®
(budesonide) capsules, including both brand and authorized generic capsules, experienced significant and unexpected increased competition, reducing our future revenue stream. This led to an impairment charge of
$342.2 million
related to the Entocort
®
intangible asset acquired in 2015. We expect our 2017 net sales to be negatively affected in an amount of approximately $72.0 million.
|
64
Perrigo Company plc
- Item 7
Consolidated
|
•
|
On February 27, 2017, we announced we were exploring strategic alternatives for our Israel API operations.
|
|
•
|
On
March 27, 2017
, we announced the completed divestment of our Tysabri
®
royalty stream to Royalty Pharma for up to
$2.85 billion
, which consists of
$2.2 billion
in cash and up to
$250.0 million
and
$400.0 million
in milestone payments to us if the royalties on global net sales of Tysabri
®
that are received by Royalty Pharma meet specific thresholds in 2018 and 2020, respectively. As a result of this transaction, we will derecognize the Tysabri
®
financial asset in the first quarter of 2017 and we do not expect the disposition to have a material impact on our results.
|
|
•
|
On April 6, 2017, we completed the divestment of our India API business to Strides Shasun Limited. As of December 31, 2016, the net assets of our India API business were classified as "held for sale" as discussed in
Item 8. Note 9
. The sale is not expected to have a material impact on our operations or result in a significant gain or (loss) when recorded in the second quarter of 2017.
|
Restructuring
On February 21, 2017, we approved a workforce reduction plan as part of a larger cost optimization strategy across the Company. We expect to reduce our global workforce by approximately 750 employees, which includes some actions already taken and 235 employees who have elected to participate in a voluntary early retirement program. This represents a reduction of approximately 14% of our global non-production workforce. The changes to our workforce will vary by country, based on legal requirements and required consultations with works councils and other employee representatives, as appropriate.
In connection with this plan, we estimate that we will recognize total pre-tax restructuring charges of approximately $70.0 million to $80.0 million, consisting of one-time termination benefits, severance arrangements, and other termination costs. We anticipate recognizing substantially all of these charges during the year ending December 31, 2017, with the remaining balance to be recognized during the first quarter of the year ending December 31, 2018.
Our cost optimization strategy is expected to yield approximately $130.0 million in savings per annum by mid-2018. This is in addition to the savings that our supply chain organization continues to generate for both our North American and International segments.
Impairments
Throughout the year ended
December 31, 2016
, we identified impairment indicators for various assets across our different segments, and therefore, we performed impairment testing. Below is a summary of current year impairment charges by segment (in millions):
|
Year Ended
|
||||||||||||||||||||||||||||
|
December 31, 2016
|
||||||||||||||||||||||||||||
|
Goodwill
|
Indefinite-Lived Intangible Assets
|
Definite-Lived Intangible Assets
|
Held For Sale
|
IPR&D
|
Fixed Assets
|
Total
|
||||||||||||||||||||||
|
CHCA
(1)
|
$
|
24.5
|
|
$
|
0.4
|
|
$
|
—
|
|
$
|
9.9
|
|
$
|
—
|
|
$
|
3.5
|
|
$
|
38.3
|
|
|||||||
|
CHCI
(2)
|
868.4
|
|
849.1
|
|
321.4
|
|
—
|
|
3.5
|
|
—
|
|
2,042.4
|
|
||||||||||||||
|
RX
(3)
|
—
|
|
—
|
|
342.2
|
|
—
|
|
—
|
|
0.2
|
|
342.4
|
|
||||||||||||||
|
Specialty Sciences
(4)
|
199.6
|
|
—
|
|
—
|
|
—
|
|
—
|
|
—
|
|
199.6
|
|
||||||||||||||
|
Other
(5)
|
—
|
|
—
|
|
2.0
|
|
6.3
|
|
—
|
|
—
|
|
8.3
|
|
||||||||||||||
|
$
|
1,092.5
|
|
$
|
849.5
|
|
$
|
665.6
|
|
$
|
16.2
|
|
$
|
3.5
|
|
$
|
3.7
|
|
$
|
2,631.0
|
|
||||||||
(1)
Relates primarily to goodwill acquired through the acquisition of Sergeant’s Pet Care Products, Inc. and Velcera Inc. as well as U.S. VMS assets held for sale, which were subsequently sold on August 5, 2016.
(2)
Relates to certain intangible assets and goodwill acquired in conjunction with the Omega acquisition as well as trademarks originally acquired through the acquisition of Aspen Global Inc.
(3)
Relates primarily to our intangible assets acquired in conjunction with the Entocort
®
acquisition.
(4)
Relates to goodwill from our Elan acquisition.
65
Perrigo Company plc
- Item 7
Consolidated
(5)
Relates primarily to our India API assets held for sale, which were sold April 6, 2017.
Consolidated Results
|
Year Ended
|
Six Months Ended
|
Year Ended
|
|||||||||||||||||||||
|
June 28,
2014 |
June 27,
2015 |
December 27,
2014 |
December 31,
2015 |
December 31,
2015 |
December 31,
2016 |
||||||||||||||||||
|
($ in millions)
|
Restated
|
Restated
|
Restated
|
Restated
|
Restated
|
||||||||||||||||||
|
Net sales
|
$
|
3,914.1
|
|
$
|
4,227.1
|
|
$
|
1,844.7
|
|
$
|
2,632.2
|
|
$
|
5,014.7
|
|
$
|
5,280.6
|
|
|||||
|
Gross profit
|
$
|
1,452.1
|
|
$
|
1,644.2
|
|
$
|
673.8
|
|
$
|
1,078.9
|
|
$
|
2,049.4
|
|
$
|
2,051.8
|
|
|||||
|
Gross profit %
|
37.1
|
%
|
38.9
|
%
|
36.5
|
%
|
41.0
|
%
|
40.9
|
%
|
38.9
|
%
|
|||||||||||
|
Operating expenses
|
$
|
880.7
|
|
$
|
971.7
|
|
$
|
384.1
|
|
$
|
1,011.3
|
|
$
|
1,599.0
|
|
$
|
4,051.5
|
|
|||||
|
Operating expenses %
|
22.5
|
%
|
23.0
|
%
|
20.8
|
%
|
38.4
|
%
|
31.9
|
%
|
76.7
|
%
|
|||||||||||
|
Operating income (loss)
|
$
|
571.4
|
|
$
|
672.5
|
|
$
|
289.7
|
|
$
|
67.6
|
|
$
|
450.4
|
|
$
|
(1,999.7
|
)
|
|||||
|
Operating income (loss) %
|
14.6
|
%
|
15.9
|
%
|
15.7
|
%
|
2.6
|
%
|
9.0
|
%
|
(37.9
|
)%
|
|||||||||||
|
Interest and other, net
|
$
|
267.8
|
|
$
|
412.2
|
|
$
|
79.7
|
|
$
|
58.7
|
|
$
|
391.2
|
|
$
|
2,848.6
|
|
|||||
|
Income tax expense (benefit)
|
$
|
70.8
|
|
$
|
124.2
|
|
$
|
29.4
|
|
$
|
(33.6
|
)
|
$
|
61.1
|
|
$
|
(835.5
|
)
|
|||||
|
Net income (loss)
|
$
|
232.8
|
|
$
|
136.1
|
|
$
|
180.6
|
|
$
|
42.5
|
|
$
|
(1.9
|
)
|
$
|
(4,012.8
|
)
|
|||||

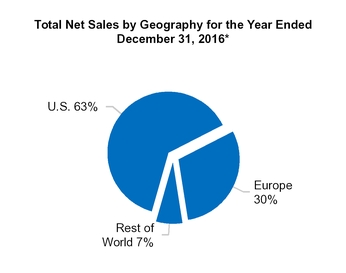
|
*
|
Net sales by geography is derived from the location of the entity that sells to a third party. For geographic information for the
six months ended
December 31, 2015
, and the
years ended
June 27, 2015
and
June 28, 2014
, refer to
Item 8. Note 19
.
|
Details and analysis of our financial results for the
years ended
December 31, 2016
and
December 31, 2015
, the
six months ended
December 31, 2015
and
December 27, 2014
, and the
years ended
June 27, 2015
and
June 28, 2014
are described below by reporting segment and line item. Refer to the
Interest, Other and Tysabri Royalty Stream
section below for discussions related to our expenses.
66
Perrigo Company plc
- Item 7
CHCA
CONSUMER HEALTHCARE AMERICAS
Recent Trends and Developments
|
•
|
In 2016, we experienced a reduction in pricing expectations within our
CHCA
segment, particularly in the cough/cold, animal health and analgesics categories due to various factors including increased focus from customers to capture supply chain productivity savings, low raw material commodity pricing, and competition in specific product categories. We expect this pricing environment to continue to impact our
CHCA
segment for the foreseeable future.
|
|
•
|
On August 5, 2016, we completed the sale of our U.S. VMS business to IVC for
$61.8 million
inclusive of an estimated working capital adjustment. The below table indicates the sales attributable to the U.S. VMS business for periods presented in this report:
|
|
Year Ended
|
Six Months Ended
|
Year Ended
|
|||||||||||||||||||||
|
($ in millions)
|
June 28,
2014 |
June 27,
2015 |
December 27,
2014 |
December 31,
2015 |
December 31,
2015 |
December 31,
2016 |
|||||||||||||||||
|
Net sales
|
$
|
189.5
|
|
$
|
157.9
|
|
$
|
80.8
|
|
$
|
85.2
|
|
$
|
162.3
|
|
$
|
110.2
|
|
|||||
Segment Results
Year Ended
December 31, 2016
vs.
Year Ended
December 31, 2015

|
|
|||||||
|
Year Ended
|
|||||||
|
December 31,
2015 |
December 31,
2016 |
||||||
|
($ in millions)
|
Restated
|
||||||
|
Net sales
|
$
|
2,554.2
|
|
$
|
2,507.1
|
|
|
|
Gross profit
|
$
|
846.7
|
|
$
|
825.2
|
|
|
|
Gross profit %
|
33.2
|
%
|
32.9
|
%
|
|||
|
Operating income
|
$
|
439.9
|
|
$
|
399.8
|
|
|
|
Operating income %
|
17.2
|
%
|
15.9
|
%
|
|||
Net sales
decreased
$47.1 million
, or
2%
, over the prior year due to:
|
•
|
Discontinued products of
$61.3 million
related primarily to a label refresh within the infant formula category; and
|
|
•
|
A net
$56.5 million
decrease in existing product sales as a result of:
|
|
•
|
Strong sales in our infant nutrition, and smoking cessation categories; more than offset by
|
|
•
|
A milder cold and flu season in the first and second quarters of 2016, which led to weaker sales in the cough/cold and analgesics categories;
|
|
•
|
Pricing pressure, which impacted sales in the cough/cold, analgesics, and animal health categories in particular;
|
|
•
|
Lower sales in the antacids category; and
|
|
•
|
Timing of promotions in the second and third quarters of 2015 and a milder allergy season in the third quarter of 2016, which had a negative impact on year-over-year sales in the cough/cold category;
|
|
•
|
Lower year-over-year sales of
$52.1 million
attributable to the U.S. VMS business, which was sold in August 2016; and
|
67
Perrigo Company plc
- Item 7
CHCA
|
•
|
Unfavorable foreign currency movement of
$15.0 million
; offset partially by
|
|
•
|
New product sales of
$117.4 million
related primarily to the launches of fluticasone nasal spray (store brand equivalent to Flonase
®
), certain guaifenesin products (store brand equivalent to Mucinex
®
), several new infant formula and food products, and new animal health products; and
|
|
•
|
Incremental net sales of
$20.3 million
related primarily to the Gelcaps and ScarAway
®
acquisitions.
|
Operating income
decreased
$40.1 million
, or
9%
, as a result of:
|
•
|
A decrease
of
$21.5 million
in gross profit due to:
|
|
•
|
Pricing pressure as noted above; and
|
|
•
|
Increased intangible asset amortization expense associated primarily with the Gelcaps and ScarAway
®
acquisitions; offset partially by
|
|
•
|
Margin contributions from new products and strong performance in the infant nutrition and smoking cessation categories; and
|
|
•
|
Continued manufacturing and supply chain efficiencies.
|
|
•
|
An increase
of
$18.6 million
in operating expenses due to:
|
|
•
|
A
$24.5 million
goodwill impairment charge related to our Animal Health business, as described in
Item 8. Note 3
;
|
|
•
|
Increased research and development investments of $6.5 million due to timing of clinical trials;
|
|
•
|
A
$6.2 million
impairment charge related to the sale of the U.S. VMS business, as described in
Item 8. Note 9
;
|
|
•
|
A
$3.7 million
impairment charge recorded on the held-for-sale assets associated with our animal health pet treats plant, as described in
Item 8. Note 9
; partially offset by
|
|
•
|
Decreased restructuring expense of $9.9 million; and
|
|
•
|
Decreased selling and administrative expenses due to cost containment.
|
Six Months Ended December 31, 2015
vs.
Six Months Ended
December 27, 2014
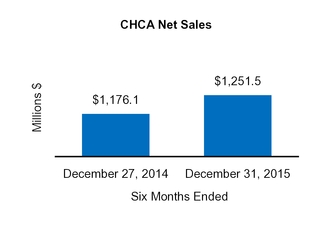
|
|
|||||||
|
Six Months Ended
|
|||||||
|
December 27,
2014 |
December 31,
2015 |
||||||
|
($ in millions)
|
Restated
|
Restated
|
|||||
|
Net sales
|
$
|
1,176.1
|
|
$
|
1,251.5
|
|
|
|
Gross profit
|
$
|
361.2
|
|
$
|
417.9
|
|
|
|
Gross profit %
|
30.7
|
%
|
33.4
|
%
|
|||
|
Operating income
|
$
|
151.1
|
|
$
|
209.2
|
|
|
|
Operating income %
|
12.9
|
%
|
16.7
|
%
|
|||
68
Perrigo Company plc
- Item 7
CHCA
Net sales
increased
$75.4 million
, or
6%
, due primarily to:
|
•
|
New product sales of
$122.9 million
related primarily to certain new infant formula products;
|
|
•
|
Incremental net sales due primarily to the Gelcaps and ScarAway
®
acquisitions of $20.2 million; and
|
|
•
|
A
$66.0 million increase in existing sales primarily attributable to increased sales volumes of smoking cessation, cough/cold, and gastrointestinal products; offset partially by
|
|
•
|
A decline of $22.9 million in sales of existing products, primarily in animal health and diabetic care;
|
|
•
|
Discontinued products of $99.6 million related primarily to reformulated infant formula, analgesic, and animal health products; and
|
|
•
|
Unfavorable foreign currency movement of $11.2 million.
|
Operating income
increased
$58.1 million
, or
38%
, as a result of:
|
•
|
An increase
of
$56.7 million
in gross profit due to:
|
|
•
|
Improved purchase prices and efficiencies in manufacturing facilities; and
|
|
•
|
Incrementally higher gross profit attributable primarily to the Gelcaps and ScarAway
®
acquisitions; and
|
|
•
|
A decrease
of
$1.4 million
in operating expenses due to:
|
|
•
|
Decreased Research and Development expense ("R&D") spend of $13.6 million due to relative timing of clinical trials; offset partially by
|
|
•
|
An increase in restructuring expense of $10.9 million related to strategic organizational enhancements; and
|
|
•
|
Increased administrative expenses of $1.9 million primarily related to the Gelcaps and ScarAway
®
acquisitions.
|
Year Ended
June 27, 2015
vs.
Year Ended
June 28, 2014

|
|
|||||||
|
Year Ended
|
|||||||
|
June 28,
2014 |
June 27,
2015 |
||||||
|
($ in millions)
|
Restated
|
Restated
|
|||||
|
Net sales
|
$
|
2,581.2
|
|
$
|
2,478.8
|
|
|
|
Gross profit
|
$
|
814.0
|
|
$
|
790.1
|
|
|
|
Gross profit %
|
31.5
|
%
|
31.9
|
%
|
|||
|
Operating income
|
$
|
402.8
|
|
$
|
381.9
|
|
|
|
Operating income %
|
15.6
|
%
|
15.4
|
%
|
|||
Net sales
decreased
$102.4 million
, or
4%
, due primarily to:
|
•
|
New product sales of
$145.5 million
related primarily to the launches of Fipronil (a generic version of Frontline
®
Plus) and certain new infant formula products;
|
|
•
|
Incremental net sales attributable to the Gelcaps acquisition of $4.5 million; and
|
|
•
|
Increased sales volumes of smoking cessation products totaling $46.9 million due in part to certain national brand products not being available to consumers due to manufacturing and supply issues; more than offset by
|
|
•
|
A decline of $186.6 million in sales of existing products, primarily in contract manufacturing, as well as in sales of VMS, cough/cold, analgesic, gastrointestinal, and animal health products. The decline in contract manufacturing and analgesics was driven by a branded competitor's return to the market. The decline in VMS sales was due primarily to increased competition in the marketplace and pricing pressures;
|
|
•
|
Discontinued products of $104.1 million related primarily to animal health and nutritional products; and
|
|
•
|
Unfavorable foreign currency movement of $7.9 million.
|
69
Perrigo Company plc
- Item 7
CHCA
Operating income
decreased
$20.9 million
, or
5%
, as a result of:
|
•
|
A decrease
of
$23.9 million
in gross profit due to:
|
|
•
|
Lower segment sales and incremental amortization expense attributable to the Gelcaps acquisition; offset partially by
|
|
•
|
Improved purchase prices and efficiencies in manufacturing facilities.
|
|
•
|
Offset partially by
a decrease
of
$3.0 million
in operating expenses due to:
|
|
•
|
Decreased animal health advertising expenses; and
|
|
•
|
A
$6.8 million
goodwill impairment charge related to our Mexico operations, as described in
Item 8. Note 3
; offset in part by
|
|
•
|
A $10.0 million option payment related to a collaboration agreement made during the year ended June 27, 2015, as described in
Item 8. Note 17
.
|
CONSUMER HEALTHCARE INTERNATIONAL
Recent Trends and Developments
|
•
|
The
CHCI
segment has been impacted by market dynamics in key countries such as Belgium, France, Germany and Italy due to softness in certain brand categories and by unfavorable foreign currency impacts, primarily in the U.K. related to Brexit. In addition, the segment had been impacted in Belgium by a change in the forecast with a major wholesaler, as management implements improved supply chain efficiencies in this market. The
CHCI
segment has restructured its approach to addressing these markets including: (1) implementing a brand prioritization strategy to address these market dynamics, with an objective to balance the cost of advertising and promotional investments with expected contributions from category sales, (2) restructuring its sales force in each of these markets to more effectively serve customers, and (3) exiting certain unfavorable distribution agreements. The combination of these actions are expected to improve the segment's focus on higher value OTC products, reduce selling costs and improve operating margins in the segment.
|
|
•
|
As part of our strategic initiatives, management continues to drive improvements and evaluate the overall cost structures within our CHCI segment in the following ways:
|
|
•
|
On December 8, 2016, we announced the cancellation of the unprofitable EuroGenerics NV distribution agreement in Belgium. The cancellation, combined with the exit of certain OTC distribution agreements, is expected to reduce net sales by approximately $200.0 million in 2017.
|
|
•
|
We continue to make progress on our previously announced restructuring plans to right-size the
Omega
business due to the impact of market dynamics on sales volumes. In addition, we made several strategic leadership changes during the year ended December 31, 2016, including appointing new leaders for Belgium, France and Germany as well as a new Executive Vice President of the CHCI segment. Management continues to evaluate the overall cost structure relative to current and expected market dynamics. In 2016, we recognized
$20.9 million
of restructuring expense in the CHCI segment.
|
|
•
|
Management continues to evaluate the most effective business model for each country and has announced strategic evaluations for Russia and Argentina.
|
Segment Results
Year Ended
December 31, 2016
vs.
Year Ended
December 31, 2015
70
Perrigo Company plc
- Item 7
CHCI

|
|
|||||||
|
Year Ended
|
|||||||
|
December 31, 2015
(1)
|
December 31,
2016 |
||||||
|
($ in millions)
|
Restated
|
||||||
|
Net sales
|
$
|
1,360.6
|
|
$
|
1,652.2
|
|
|
|
Gross profit
|
$
|
614.7
|
|
$
|
693.4
|
|
|
|
Gross profit %
|
45.2
|
%
|
42.0
|
%
|
|||
|
Operating loss
|
$
|
(124.3
|
)
|
$
|
(2,087.4
|
)
|
|
|
Operating loss %
|
(9.1
|
)%
|
(126.3
|
)%
|
|||
(1)
Includes Omega results from March 30, 2015 to December 31, 2015.
Net sales
increased
$291.6 million
, or
21%
, over the prior year due to:
|
•
|
An additional three months of results from operations attributable to Omega;
|
|
•
|
New products totaling
$119.0 million
; and
|
|
•
|
Incremental nets sales due to the Naturwohl and GSK Products acquisitions totaling
$84.2 million
; offset partially by
|
|
•
|
A net
$143.6 million
decrease in sales volumes of existing products due primarily to weaker current year sales in the lifestyle category due in part to a product launch in the prior year, and in the natural health/vitamins category due primarily to timing of promotional activities, and the divestment of a European sports brand, as well as the expiration of a distribution contract in the prior year;
|
|
•
|
Unfavorable foreign currency movement of
$44.1 million
; and
|
|
•
|
Discontinued products of
$8.4 million
.
|
Operating loss
increased
$2.0 billion
, due to:
|
•
|
A
$78.7 million
increase in gross profit due to an additional three months of operations attributable to Omega; offset partially by
|
|
•
|
Decreased sales of existing products in the higher-margin lifestyle and natural health/vitamins categories noted above;
|
|
•
|
Weaker performance in Belgium and Germany;
|
|
•
|
Unfavorable foreign currency effect; more than offset by
|
|
•
|
An increase
of
$2.0 billion
in operating expenses due primarily to:
|
|
•
|
Intangible asset and goodwill impairment charges totaling
$2.0 billion
, as described in
Item 8. Note 3
; and
|
|
•
|
Restructuring charges totaling
$20.9 million
related to strategic organizational enhancements;
|
|
•
|
An additional three months of operations from the Omega acquisition; offset partially by
|
|
•
|
Cost control measures.
|
Six Months Ended December 31, 2015
vs.
Six Months Ended
December 27, 2014
71
Perrigo Company plc
- Item 7
CHCI

|
Six Months Ended
|
|||||||
|
December 27,
2014 |
December 31,
2015 |
||||||
|
($ in millions)
|
Restated
|
||||||
|
Net sales
|
$
|
177.1
|
|
$
|
833.0
|
|
|
|
Gross profit
|
$
|
55.9
|
|
$
|
386.0
|
|
|
|
Gross profit %
|
31.6
|
%
|
46.3
|
%
|
|||
|
Operating income (loss)
|
$
|
14.1
|
|
$
|
(148.5
|
)
|
|
|
Operating income (loss) %
|
8.0
|
%
|
(17.8
|
)%
|
|||
Net sales
increased
$655.9 million
, over the prior year due to:
|
•
|
Incremental net sales attributable to the Omega, Naturwohl and GSK acquisitions totaling
$569.1 million
; and
|
|
•
|
New products totaling
$66.8 million
; offset partially by
|
|
•
|
Unfavorable foreign currency movement of
$14.8 million
; and
|
|
•
|
Discontinued products of
$3.8 million
.
|
Operating income
decreased
$162.6 million
, due to:
|
•
|
A
$330.1 million
increase
in gross profit and a
$492.7 million
increase in operating expenses due to an additional six months of operations attributable to Omega.
|
Year Ended
June 27, 2015
vs.
Year Ended
June 28, 2014
72
Perrigo Company plc
- Item 7
CHCI

(
|
Year Ended
|
|||||||
|
June 28,
2014 |
June 27, 2015
(1)
|
||||||
|
($ in millions)
|
Restated
|
||||||
|
Net sales
|
$
|
331.1
|
|
$
|
704.6
|
|
|
|
Gross profit
|
$
|
97.3
|
|
$
|
284.5
|
|
|
|
Gross profit %
|
29.4
|
%
|
40.4
|
%
|
|||
|
Operating income
|
$
|
17.0
|
|
$
|
38.2
|
|
|
|
Operating income %
|
5.1
|
%
|
5.4
|
%
|
|||
(1)
Includes Omega results from March 30, 2015 to June 27, 2015.
Net sales
increased
$373.5 million
, or
113%
, over the prior year due to:
|
•
|
Incremental net sales attributable to the Omega and Aspen Global Inc. ("Aspen") acquisitions totaling $350.2 million; and
|
|
•
|
New products totaling
$43.8 million
; offset partially by
|
|
•
|
Unfavorable foreign currency movement of
$16.9 million
.
|
Operating income
increased
$21.2 million
, or
125%
, due to:
|
•
|
A
$187.2 million
increase
in gross profit and a
$166.0 million
increase
in operating expenses due to an additional three months of operations attributable to Omega.
|
Recent Trends and Developments
|
•
|
We continue to experience a significant reduction in pricing expectations from historical levels in our
RX
segment due to industry and competitive pressures. This softness in pricing is attributed to various factors including increased focus from customers to capture supply chain productivity savings, low raw material commodity pricing, competition in specific products, and consolidation of certain customers. We expect this softness to continue to impact the segment for the foreseeable future, and we are forecasting a 9% to 11% pricing decline in this segment for the year ended December 31, 2017 compared to the prior year.
|
|
•
|
On January 22, 2016, we acquired a portfolio of generic dosage forms and strengths of Retin-A
®
(tretinoin), a topical prescription acne treatment, from Matawan Pharmaceuticals, LLC, for
$416.4 million
in cash ("Tretinoin Products").
|
|
•
|
On March 1, 2016, we completed the acquisition of two development-stage specialty Rx products to further invest in our specialty Rx portfolio.
|
|
•
|
On August 22, 2016, we purchased the remaining 60.9% ownership rights to a generic Benzaclin
TM
product ("Generic Benzaclin
TM
"), which we developed and marketed in collaboration with Barr Laboratories. As a result of this transaction, we are now entitled to 100% of income from sales of the product.
|
|
•
|
On November 10, 2016, we announced that as part of our portfolio review process we are conducting a comprehensive internal evaluation of the
RX
segment's market position, growth opportunities, and interdependencies with our manufacturing and shared service operations to determine if strategic alternatives should be explored.
|
73
Perrigo Company plc
- Item 7
RX
|
•
|
During the three months ended December 31, 2016, the U.S. market for our Entocort
®
(budesonide) capsules, including both brand and authorized generic capsules, experienced significant and unexpected increased competition, reducing our future revenue stream. This led to an impairment charge of
$342.2 million
related to the Entocort
®
intangible asset acquired in 2015. We expect our 2017 net sales to be negatively affected in an amount of approximately $72.0 million.
|
|
•
|
In December 2016, we transitioned our specialty pharmaceutical commercial activities to our partner, Exeltis, who will lead sales and marketing efforts for this portfolio of products. We do not expect that this transition will have an impact on our Net sales.
|
Segment Results
Year Ended
December 31, 2016
vs.
Year Ended
December 31, 2015

|
|
|||||||
|
Year Ended
|
|||||||
|
December 31,
2015 |
December 31,
2016 |
||||||
|
($ in millions)
|
Restated
|
||||||
|
Net sales
|
$
|
1,001.9
|
|
$
|
1,042.8
|
|
|
|
Gross profit
|
$
|
543.3
|
|
$
|
501.1
|
|
|
|
Gross profit %
|
54.2
|
%
|
48.1
|
%
|
|||
|
Operating income (loss)
|
$
|
377.8
|
|
$
|
(0.2
|
)
|
|
|
Operating income %
|
37.7
|
%
|
—
|
%
|
|||
Net sales
increased
$40.9 million
, or
4%
, due to:
|
•
|
Net sales attributable to the Entocort
®
and Tretinoin Products acquisitions totaling
$150.9 million
; and
|
|
•
|
New product sales of
$68.0 million
due primarily to sales of benzoyl peroxide 5%-clindamycin 1% gel (a generic version of Benzaclin™); offset partially by
|
|
•
|
Decreased sales of existing products of
$174.1 million
due to declined sales volume of certain products, pricing pressure across the portfolio, and the lack of exclusive market position for two key products versus the prior year; and
|
|
•
|
Discontinued products of
$3.9 million
.
|
Operating income
decreased
$378.0 million
, or
100%
, as a result of:
|
•
|
A decrease
of
$42.2 million
in gross profit due primarily to the pricing pressure noted above, as well as higher amortization expense from the Entocort
®
and Tretinoin Products acquisitions; and
|
|
•
|
An
increase
of
$335.8 million
in operating expenses due primarily to:
|
|
•
|
A
$342.2 million
impairment charge related to the Entocort
®
intangible assets, as described in
Item 8. Note 3
;
|
|
•
|
Increased selling and administration expenses of $9.3 million, and
|
|
•
|
Increased R&D investments of $3.0 million due to timing of clinical trials; offset partially by
|
|
•
|
The absence of an
$18.0 million
R&D payment made in connection with a R&D contractual arrangement in the prior year.
|
74
Perrigo Company plc
- Item 7
RX
Six Months Ended December 31, 2015
vs.
Six Months Ended
December 27, 2014

|
|
|||||||
|
Six Months Ended
|
|||||||
|
December 27,
2014 |
December 31,
2015 |
||||||
|
($ in millions)
|
Restated
|
||||||
|
Net sales
|
$
|
436.7
|
|
$
|
502.6
|
|
|
|
Gross profit
|
$
|
230.5
|
|
$
|
253.4
|
|
|
|
Gross profit %
|
52.8
|
%
|
50.4
|
%
|
|||
|
Operating income
|
$
|
168.8
|
|
$
|
181.9
|
|
|
|
Operating income %
|
38.6
|
%
|
36.2
|
%
|
|||
Net sales
increased
$65.9 million
, or
15%
, due primarily to:
|
•
|
New product sales of
$41.2 million
related primarily to the launches of clobetasol propionate 0.05% spray, tacrolimus 0.1% ointment, and testosterone gel 1%; and
|
|
•
|
Net sales attributable to the Lumara Health, Inc. ("Lumara") product acquisition of
$7.0 million
; offset partially by
|
|
•
|
A decrease in volumes of certain existing products.
|
Operating income
increased
$13.1 million
, or
8%
, as a result of:
|
•
|
An increase
of
$22.9 million
in gross profit due primarily to:
|
|
•
|
Higher net sales and favorable product mix; and
|
|
•
|
Certain pricing initiatives.
|
|
•
|
Partially offset by a
$9.8 million
increase
in operating expenses due to:
|
|
•
|
Increased selling and administration expense related to the specialty pharmaceuticals sales force; and
|
|
•
|
An increase in restructuring expense of $2.6 million related to our strategic organizational enhancements.
|
Year Ended
June 27, 2015
vs.
Year Ended
June 28, 2014

|
|
|||||||
|
Year Ended
|
|||||||
|
($ in millions)
|
June 28,
2014 |
June 27,
2015 |
|||||
|
Net sales
|
$
|
864.2
|
|
$
|
936.0
|
|
|
|
Gross profit
|
$
|
463.7
|
|
$
|
520.4
|
|
|
|
Gross profit %
|
53.7
|
%
|
55.6
|
%
|
|||
|
Operating income
|
$
|
341.5
|
|
$
|
364.7
|
|
|
|
Operating income %
|
39.5
|
%
|
39.0
|
%
|
|||
75
Perrigo Company plc
- Item 7
RX
Net sales
increased
$71.8 million
, or
8%
, due primarily to:
|
•
|
New product sales of
$117.8 million
related primarily to the launches of clobetasol propionate 0.05% spray, tacrolimus 0.1% ointment, and testosterone gel 1%; and
|
|
•
|
Net sales attributable to the Lumara product acquisition of $18.1 million; offset partially by
|
|
•
|
Discontinued products of $28.5 million;
|
|
•
|
Decrease in volumes of certain existing products; and
|
|
•
|
Unfavorable foreign exchange movement of $1.8 million for products manufactured in Israel.
|
Operating income
increased
$23.2 million
, or
7%
, as a result of:
|
•
|
An increase
of
$56.7 million
in gross profit due primarily to:
|
|
•
|
Higher net sales and favorable product mix; and
|
|
•
|
Pricing initiatives taken in the first quarter of the year ended June 28, 2014.
|
|
•
|
Partially offset by a
$33.5 million
increase
in operating expenses due to:
|
|
•
|
An R&D payment of $18.0 million made in connection with an R&D contractual arrangement during the year ended June 27, 2015;
|
|
•
|
Increased selling and administration expense related to the specialty pharmaceuticals sales force; and
|
|
•
|
Higher R&D expenses resulting from planned higher spending on new product development.
|
SPECIALTY SCIENCES
Recent Trends and Developments
|
•
|
On
March 27, 2017
, we announced the completed divestment of our Tysabri
®
royalty stream to Royalty Pharma for up to
$2.85 billion
, which consists of
$2.2 billion
in cash and up to
$250.0 million
and
$400.0 million
in milestone payments to us if the royalties on global net sales of Tysabri
®
that are received by Royalty Pharma meet specific thresholds in 2018 and 2020, respectively. As a result of this transaction, we will derecognize the Tysabri
®
financial asset in the first quarter of 2017 and we do not expect the disposition to have a material impact on our results.
|
Segment Results
Year Ended
December 31, 2016
vs.
Year Ended
December 31, 2015
Operating expenses were
$201.2 million
for the year ended December 31, 2015, compared to
$15.0 million
for the prior year period. The decreases of
$186.2 million
primarily relates to a
$199.6 million
impairment charge related to the Tysabri
®
goodwill, as described in
Item 8. Note 3
.
Six Months Ended December 31, 2015
vs.
Six Months Ended
December 27, 2014
Operating expenses were
$6.5 million
for the six months ended December 31, 2015, compared to
$9.0 million
for the prior year period. The decreases of
$2.5 million
was due to a reduction in legal expenses.
Year Ended
June 27, 2015
vs.
Year Ended
June 28, 2014
Operating expenses were
$17.6 million
for the year ended June 27, 2015, compared to
$62.5 million
for the prior year period. The decreases of
$44.9 million
primarily related to the divestiture of a product development program; and the absence of restructuring expense in the year ended June 27, 2015, which totaled $38.7 million in the year ended June 28, 2014.
See the
Interest, Other and Royalty Stream (Consolidated)
section below for discussions on the
Tysabri
®
Royalty Stream change In fair value.
76
Perrigo Company plc
- Item 7
Other
OTHER
Recent Trends and Developments
On February 27, 2017, we announced we were exploring strategic alternatives for our Israel API operations.
On April 6, 2017, we completed the divestment of our India API business to Strides Shasun Limited. As of December 31, 2016, the net assets of our India API business were classified as "held for sale" as discussed in
Item 8. Note 9
. The sale is not expected to have a material impact on our operations or result in a significant gain or loss when recorded in the second quarter of 2017.
Segment Results
Year Ended
December 31, 2016
vs.
Year Ended
December 31, 2015
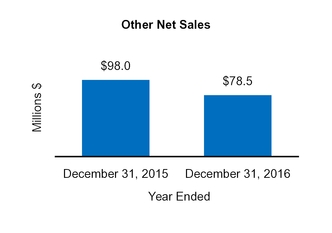
|
|
|||||||
|
Year Ended
|
|||||||
|
($ in millions)
|
December 31,
2015 |
December 31,
2016 |
|||||
|
Net sales
|
$
|
98.0
|
|
$
|
78.5
|
|
|
|
Gross profit
|
$
|
44.7
|
|
$
|
32.3
|
|
|
|
Gross profit %
|
45.5
|
%
|
41.2
|
%
|
|||
|
Operating income (loss)
|
$
|
(7.1
|
)
|
$
|
6.1
|
|
|
|
Operating income (loss) %
|
(7.3
|
)%
|
7.8
|
%
|
|||
Net sales
decreased
$19.5 million
due primarily to competition on certain products, in particular, U.S. sales of Temozolomide. Operating income
increased
$13.2 million
due primarily to the absence of a $29.0 million impairment on our India API held-for-sale assets recorded in the prior year period. Gross profit decreased
$12.4 million
as a result of increased competition, a
$6.3 million
impairment charge recorded on the India API held-for-sale business, and a
$2.0 million
impairment charge related to a definite-lived intangible asset, as described in
Item 8. Note 9
.
Six Months Ended December 31, 2015
vs.
Six Months Ended
December 27, 2014

|
|
|||||||
|
Six Months Ended
|
|||||||
|
($ in millions)
|
December 27,
2014 |
December 31,
2015 |
|||||
|
Net sales
|
$
|
54.8
|
|
$
|
45.1
|
|
|
|
Gross profit
|
$
|
26.2
|
|
$
|
21.6
|
|
|
|
Gross profit %
|
47.7
|
%
|
47.8
|
%
|
|||
|
Operating income (loss)
|
$
|
14.5
|
|
$
|
(19.5
|
)
|
|
|
Operating income (loss) %
|
26.4
|
%
|
(43.3
|
)%
|
|||
77
Perrigo Company plc
- Item 7
Other
Net sales
decreased
$9.7 million
, or
18%
, due primarily to competition on certain products and unfavorable changes in foreign currency exchange rates. Operating income
decreased
$34 million
as a result of
a decrease
of
$4.6 million
in gross profit due primarily to a decrease in sales of existing products and an impairment charge of
$29.0 million
on our India API held-for-sale assets, as described in
Item 8. Note 9
.
Year Ended
June 27, 2015
vs.
Year Ended
June 28, 2014
|
Year Ended
|
|||||||
|
($ in millions)
|
June 28,
2014 |
June 27,
2015 |
|||||
|
Net sales
|
$
|
137.6
|
|
$
|
107.7
|
|
|
|
Gross profit
|
$
|
77.1
|
|
$
|
49.2
|
|
|
|
Gross profit %
|
56.0
|
%
|
45.7
|
%
|
|||
|
Operating income
|
$
|
46.1
|
|
$
|
26.8
|
|
|
|
Operating income %
|
33.5
|
%
|
24.9
|
%
|
|||
Net sales
decreased
$29.9 million
, or
22%
, due primarily to a decrease in U.S. sales of temozolomide, which had a 180-day exclusivity period that was in effect during the first six months of the year ended
June 28, 2014,
competition on certain products, and unfavorable changes in foreign currency exchange rates. Operating income
decreased
$19.3 million
, or
42%
, due to
a decrease
of
$27.9 million
in gross profit related primarily to a decrease in sales of existing products, offset partially by
a decrease
of
$8.6 million
in operating expenses due to proactive cost controls, including headcount reduction and certain decreases in R&D spending.
Unallocated Expenses
Unallocated expenses are comprised of certain corporate services not allocated to our reporting segments and are recorded above Operating income on the Consolidated Statements of Operations. Unallocated expenses were as follows (in millions):
|
Year Ended
|
Six Months Ended
|
Year Ended
|
||||||||||||||||||||
|
June 28,
2014 |
June 27,
2015 |
December 27,
2014 |
December 31,
2015 |
December 31,
2015 |
December 31,
2016 |
|||||||||||||||||
|
Restated
|
Restated
|
|||||||||||||||||||||
|
$
|
173.5
|
|
$
|
121.5
|
|
$
|
49.6
|
|
$
|
149.0
|
|
$
|
220.9
|
|
$
|
116.6
|
|
|||||
The
$104.3 million
decrease
for the
year ended
December 31, 2016
compared to the prior year was due primarily to the absence of legal and professional fees related to our defense against the unsolicited takeover bid by Mylan of
$100.3 million
and Omega acquisition-related fees of
$18.1 million
. We also experienced a
$15.0 million
reduction in share-based compensation in the current year due primarily to the resignation of Joseph C. Papa. These decreases were offset partially by a
$36.2 million
increase in legal and professional fees in the current year.
The
$99.4 million
increase
for the
six months ended
December 31, 2015
compared to the prior year was due primarily to $86.9 million in fees incurred in our defense against the unsolicited takeover bid by Mylan and $7.5 million in corporate restructuring charges.
The
$52.0 million
decrease
for the
year ended
June 27, 2015
compared to the prior year was due primarily to incurring fewer acquisition-related costs in Administration expense for the Omega acquisition compared to the Elan acquisition, offset partially by expenses we incurred in the
year ended
June 27, 2015
related to the unsolicited takeover bid by Mylan. Acquisition-related costs recorded in Administration expense consist primarily of general transaction costs (legal, banking, and other professional fees).
78
Perrigo Company plc
- Item 7
Unallocated, Interest, Other, and Taxes
See
Item 8. Note 2
for more information on acquisition-related expenses.
Interest, Other and Royalty Stream (Consolidated)
|
Year Ended
|
Six Months Ended
|
Year Ended
|
|||||||||||||||||||||
|
June 28,
2014 |
June 27,
2015 |
December 27,
2014 |
December 31,
2015 |
December 31,
2015 |
December 31,
2016 |
||||||||||||||||||
|
($ in millions)
|
Restated
|
Restated
|
Restated
|
Restated
|
Restated
|
||||||||||||||||||
|
Tysabri
®
royalty stream - change in fair value
|
$
|
(26.6
|
)
|
$
|
(78.5
|
)
|
$
|
(46.9
|
)
|
$
|
(57.3
|
)
|
$
|
(88.8
|
)
|
$
|
2,608.2
|
|
|||||
|
Interest expense, net
|
$
|
103.5
|
|
$
|
146.0
|
|
$
|
56.7
|
|
$
|
89.9
|
|
$
|
179.1
|
|
$
|
216.6
|
|
|||||
|
Other expense, net
|
$
|
25.1
|
|
$
|
334.2
|
|
$
|
60.3
|
|
$
|
25.2
|
|
$
|
299.1
|
|
$
|
22.7
|
|
|||||
|
Loss on extinguishment of debt
|
$
|
165.8
|
|
$
|
10.5
|
|
$
|
9.6
|
|
$
|
0.9
|
|
$
|
1.8
|
|
$
|
1.1
|
|
|||||
Tysabri
®
Royalty Stream - Change In Fair Value
We are accounting for the Tysabri
®
royalty stream as a financial asset and have elected to use the fair value option model with changes in fair value presented in Net income (loss) under the caption
Tysabri
®
royalty stream - change in fair value
. Royalty rights were
$2.6 billion
of expense and
$88.8 million
of income for the years ended December 31, 2016 and December 31, 2015, respectively. Royalty rights were
$57.3 million
of income and
$46.9 million
of income for the six months ended December 31, 2015 and December 27, 2014, respectively. Royalty rights were
$78.5 million
of income and
$26.6 million
of income for the years ended June 27, 2015 and June 28, 2014, respectively, resulting in a change of
$2.7 billion
,
$10.4 million
, and
$51.9 million
for the
year ended
December 31, 2016
, six months ended December 31, 2015, and the year ended June 27, 2015 compared to the prior year periods, respectively. See
Item 8. Note 6
for additional information on the assumptions.
In the first quarter of 2016, a competitor's pipeline product, Ocrevus
®
, received breakthrough therapy designation from the FDA.
Breakthrough therapy designation is when a drug intended alone or in combination with one or more other drugs to treat a serious or life threatening disease or condition and preliminary clinical evidence indicates that the drug may demonstrate substantial improvement over existing therapies on one or more clinically significant endpoints, such as substantial treatment effects observed early in clinical development.
In June 2016 the FDA granted priority review with target action date in December 2016. A
priority review is a
designation when the FDA will direct overall attention and resources to the evaluation of applications for drugs that, if approved, would be significant improvements in the safety or effectiveness of the treatment, diagnosis, or prevention of serious conditions when compared to standard applications. The product was approved in the first quarter of 2017.
The product is expected to compete with Tysabri
®
and we expect it will have a significant negative impact on the Tysabri
®
royalty stream. Although the product has not launched, industry analysts believe that based on released clinical study information, Ocrevus
®
will favorably compete against Tysabri
®
in the relapsing, remitting multiple sclerosis market segment due to its high efficacy and convenient dosage form. Given the new market information for Ocrevus
®
, using industry analyst estimates we reduced our first ten year growth forecasts from an average of growth of approximately
3.4%
in the fourth calendar quarter of 2015 to an average decline of approximately minus
2.0%
in the third and fourth calendar quarters of 2016. In November 2016, we announced we were evaluating strategic alternatives for the Tysabri
®
asset which was completed March 27, 2017. As of December 31, 2016, the financial asset was adjusted based on the strategic review and sale process. These effects, combined with the change in discount rate each quarter, led to a reduction in fair value of
$204.4 million
,
$910.8 million
,
$377.4 million
and
$1.1 billion
in the first, second, third and fourth quarters of 2016, respectively.
Interest Expense, Net
The
$37.5 million
increase
for the
year ended
December 31, 2016
compared to the prior year was due to interest incurred on the debt assumed in the Omega acquisition and borrowings on our revolving credit agreements during the
year ended
December 31, 2016
.
79
Perrigo Company plc
- Item 7
Unallocated, Interest, Other, and Taxes
The
$33.2 million
increase
for the six months ended December 31, 2015 compared to the prior year period was due primarily to the incremental increase in borrowings resulting from the Omega acquisition, including the issuance of
$1.6 billion
of senior notes in November 2014 and assumed Omega debt, of which
$798.3 million
was outstanding at December 31, 2015, as well as amounts drawn under our revolving credit facilities, including $380.0 million and $300.0 million outstanding under the 2015 Revolver and 2014 Revolver, respectively, at December 31, 2015.
The
$42.5 million
increase
for the
year ended
June 27, 2015 compared to the prior year was due primarily to the interest on the incremental increase in borrowings resulting from the issuance of $1.6 billion of debt in November 2014 to finance the Omega acquisition, as well as the debt we assumed from Omega in the fourth quarter of the
year ended
June 27, 2015 and did not repay, which totaled $820.9 million at June 27, 2015.
See the "
Borrowings and Capital Resources
" section below and
Item 8. Note 10
for more information.
Other Expense, Net
Other expense, net
, was
$22.7 million
for the
year ended
December 31, 2016
, compared to
$299.1 million
in the prior year. The
$276.4 million
decrease was due primarily to the absence of the
$259.8 million
loss incurred in the prior year on the derivatives we used to economically hedge fluctuations in the euro-denominated purchase price of the Omega and GSK Products acquisitions. The losses on the derivatives due to the changes in the EUR/USD exchange rate prior to their settlement economically offset the final settlement of the euro-denominated Omega purchase price paid on March 30, 2015.
Other expense, net, was
$25.2 million
for the
six months ended
December 31, 2015
, comprised primarily of a
$10.7 million
other-than-temporary impairment of a marketable equity security, losses on equity method investments totaling $7.1 million, and a $4.8 million loss on a foreign currency derivative we entered into, to hedge against the change in the euro for the euro-denominated purchase price of the GSK Products acquisition. Other expense, net, was
$60.3 million
for the
six months ended
December 27, 2014
, due primarily to our derivative activity to economically hedge fluctuations in the euro-denominated purchase price of the Omega acquisition, which resulted in a loss of $64.7 million, offset partially by a gain of $12.5 million from the transfer of a rights agreement.
Other expense, net, was
$334.2 million
for the
year ended
June 27, 2015 compared to
$25.1 million
in the prior year. The increase was due primarily to $324.8 million in aggregate losses we incurred hedging the euro-denominated purchase prices of Omega and GSK Products during the
year ended
June 27, 2015, offset partially by a gain of
$12.5 million
from the transfer of a rights agreement.
See
Item 8. Note 8
for more information on the derivatives,
Item 8. Note 7
for information on the investments, and
Item 8. Note 3
for information on the goodwill impairment charge.
Loss on Extinguishment of Debt
During the
year ended
December 31, 2016, we recorded a
$1.1 million
loss on extinguishment of debt, which consisted of deferred financing fees we wrote off primarily related to the prepayment of 1.300% 2016 Notes. During the six months and year ended December 31, 2015 we recorded a
$0.9 million
and
$1.8 million
loss on extinguishment of debt, respectively, which consisted of deferred financing fees we wrote off related to the undrawn tranche of the 2014 Credit Agreements (as defined below) that we allowed to expire during the period. The
$9.6 million
and
$10.5 million
losses during the six months and year ended December 27, 2014 and June 27, 2015, respectively, consisted mainly of interest on the bridge agreement associated with financing the Omega acquisition. The
$165.8 million
loss recorded in the
year ended
June 28, 2014 consisted of make-whole payments, write-off of unamortized discounts, write-off of deferred financing fees, and interest on the bridge agreements associated with financing the Elan acquisition.
See
Item 8. Note 2
for information on the Omega and Elan acquisitions, and
Item 8. Note 10
for information on the extinguishment of debt.
Income Taxes (Consolidated)
80
Perrigo Company plc
- Item 7
Unallocated, Interest, Other, and Taxes
The effective tax rates were as follows:
|
Year Ended
|
Six Months Ended
|
Year Ended
|
||||||||||||||
|
June 28, 2014
|
June 27,
2015 |
December 27,
2014 |
December 31,
2015 |
December 31,
2015 |
December 31,
2016 |
|||||||||||
|
Restated
|
Restated
|
Restated
|
Restated
|
Restated
|
||||||||||||
|
23.3
|
%
|
47.7
|
%
|
14.0
|
%
|
(376.2
|
)%
|
103.3
|
%
|
17.2
|
%
|
|||||
The effective tax rate for the
year ended
December 31, 2016
was lower compared to the
year ended
December 31, 2015
due to the impact of the asset impairments recorded during the
year ended
December 31, 2016
. The effective tax rate for the
year ended
December 31, 2015
was impacted by the impairment of Omega's intangible assets, India API assets being classified as held for sale, the valuation allowance on deferred taxes and Omega transaction costs.
The effective tax rate for the six months ended December 31, 2015 was significantly higher than for the six months ended December 27, 2014 due mainly to the impairment of Omega’s intangible assets and the related impacts on the valuation allowance position, as well as our India API assets being classified as held for sale. The effective tax rate was favorably affected by a reduction in the reserves for uncertain tax liabilities in the amount of $
6.1 million
for the six months ended December 31, 2015 related to various audit resolutions.
The rate was higher for the
year ended
June 27, 2015 than the
year ended
June 28, 2014 due mainly to the impact of a valuation allowance on deferred taxes and Omega transaction costs. The effective tax rate for the
year ended
June 28, 2014 was impacted by the Elan transaction costs, changes to the estimated jurisdictional mix of income and the new corporate structure attributable to the Elan transaction.
In July 2013, the United Kingdom passed legislation reducing the statutory rate to 21% and 20% effective April 1, 2014 and April 1, 2015, respectively. These rates were applicable to Perrigo as of June 30, 2013 and favorably impacted the effective tax rate in the amount of
$4.7 million
for the twelve months ended June 28, 2014.
For the years ended December 31, 2016 and December 31, 2015, statutory rate changes, primarily in Europe, favorably impacted the effective tax rate by $27.9 million and $4.0 million, respectively. Refer to
Item 8. Note 14
for additional information on taxes.
FINANCIAL CONDITION, LIQUIDITY, AND CAPITAL RESOURCES
We finance our operations with internally generated funds, supplemented by credit arrangements with third parties and capital market financing. We routinely monitor current and expected operational requirements and financial market conditions to evaluate other available financing sources including revolving bank credit and securities offerings. Based on our current financial condition and credit relationships, management believes that our operations and borrowing resources are sufficient to provide for our current and foreseeable capital requirements. However, we continue to evaluate the impact of commercial and capital market conditions on liquidity and may determine that modifications to our capital structure are appropriate if market conditions deteriorate or if favorable capital market opportunities become available.
Our Tysabri
®
royalty stream is now accounted for in our financial statements for fiscal 2016 and prior restated periods as a financial asset using the fair value option. As a result, cash receipts from the royalty stream are presented in those historical financial statements as cash from investing activities, rather than as cash from operating activities in the Statement of Cash Flows for the Restated Periods presented below. In March 2017, we sold the right to receive Tysabri
®
royalties for all periods from and after January 1, 2017, for an up-front cash payment of
$2.2 billion
and the right to receive additional payments of
$250.0 million
and
$400.0 million
, if the royalty payments on global net sales of Tysabri
®
that are received by Royalty Pharma meet specific thresholds for the 12-month periods ending December 31, 2018 and December 31, 2020, respectively.
81
Perrigo Company plc
- Item 7
Financial Condition, Liquidity and Capital Resources
Cash and Cash Equivalents

*
Working capital represents current assets less current liabilities, excluding cash and cash equivalents, and current indebtedness.
Cash, cash equivalents, cash flows from operations, and borrowings available under our credit facilities are expected to be sufficient to finance the known and/or foreseeable liquidity and capital expenditures. Although our lenders have made commitments to make funds available to us in a timely fashion under our revolving credit agreements and overdraft facilities, if economic conditions worsen or new information becomes publicly available impacting the institutions’ credit rating or capital ratios, these lenders may be unable or unwilling to lend money pursuant to our existing credit facilities.
Consistent with our investment grade philosophy, we intend to pay down a portion of our outstanding indebtedness during 2017 using the proceeds from the sale of our Tysabri
®
royalty stream completed on
March 27, 2017
.
Operating Activities
Year Ended
December 31, 2016
vs.
Year Ended
December 31, 2015
|
Year Ended
|
|||||||||||
|
|
December 31,
2015 |
December 31,
2016 |
Increase/ (Decrease)
|
||||||||
|
Restated
|
|||||||||||
|
Cash Flows From (For) Operating Activities
|
|||||||||||
|
Net income (loss)
|
$
|
(1.9
|
)
|
$
|
(4,012.8
|
)
|
$
|
(4,010.9
|
)
|
||
|
Non-cash adjustments
|
745.4
|
|
4,769.2
|
|
4,023.8
|
|
|||||
|
Subtotal
|
743.5
|
|
756.4
|
|
12.9
|
|
|||||
|
Increase (decrease) in cash due to:
|
|||||||||||
|
Accounts receivable
|
4.8
|
|
(0.6
|
)
|
(5.4
|
)
|
|||||
|
Inventories
|
(21.5
|
)
|
100.7
|
|
122.2
|
|
|||||
|
Accounts payable
|
(26.7
|
)
|
(75.7
|
)
|
(49.0
|
)
|
|||||
|
Payroll and related taxes
|
(42.0
|
)
|
(41.1
|
)
|
0.9
|
|
|||||
|
Accrued customer programs
|
53.9
|
|
(13.9
|
)
|
(67.8
|
)
|
|||||
|
Accrued liabilities
|
98.9
|
|
(79.5
|
)
|
(178.4
|
)
|
|||||
|
Accrued income taxes
|
(67.9
|
)
|
20.9
|
|
88.8
|
|
|||||
|
Other
|
21.3
|
|
(12.3
|
)
|
(33.6
|
)
|
|||||
|
Subtotal
|
$
|
20.8
|
|
$
|
(101.5
|
)
|
$
|
(122.3
|
)
|
||
|
Net cash from (for) operating activities
|
$
|
764.3
|
|
$
|
654.9
|
|
$
|
(109.4
|
)
|
||
82
Perrigo Company plc
- Item 7
Financial Condition, Liquidity and Capital Resources
We generated
$654.9 million
of cash from operating activities during the
year ended
December 31, 2016
, a
$109.4 million
decrease
over the prior year, due primarily to the following:
|
•
|
Changes in accrued liabilities due primarily to payment of legal expenses associated with the Mylan defense which were accrued at December 31, 2015, deferred revenue associated with the BCH Belgium Distribution Contracts, and timing of payments;
|
|
•
|
Changes in accrued customer-related programs due to the pricing dynamics in the
RX
segment; and
|
|
•
|
Changes in accounts payable due to changes to the Omega accounts payable structure as discussed below; offset partially by
|
|
•
|
Changes in inventories due to improved inventory management in our
CHCI
and
CHCA
segments and increased sales of cough/cold products at the end of the year ended December 31, 2016; and
|
|
•
|
Changes in accrued income taxes due primarily to the prior year period including a $68.9 million incremental tax payment made in connection with the contested IRS audit described in Note 14.
|
In addition, increased net earnings after adjusting for non-cash items such as impairment charges, loss on extinguishment of debt, changes in the fair value of the Tysabri
®
royalty stream, and depreciation and amortization contributed to an increase in operating cash flow.
Due to the acquisition of Omega on March 30, 2015, our CHCI segment experienced strong operating cash inflow in the second quarter of 2015 and cash outflow in the third quarter of 2015 primarily due to accounts payable payment structures with suppliers that increased the days outstanding in the second and fourth quarter compared to the first and third quarters. In order to establish a more sustainable cash flow pattern during the calendar year, in the fourth quarter of 2015 and continuing into the first quarter of 2016, we implemented a program to standardize these payment terms such that the days outstanding will largely be consistent each reporting period. This program had an unfavorable impact on accounts payable and operating cash flow in these quarters.
83
Perrigo Company plc
- Item 7
Financial Condition, Liquidity and Capital Resources
Six Months Ended December 31, 2015
vs.
Six Months Ended
December 27, 2014
|
Six Months Ended
|
|||||||||||
|
|
December 27,
2014 |
December 31,
2015 |
Increase / (Decrease)
|
||||||||
|
Restated
|
Restated
|
||||||||||
|
Cash Flows From (For) Operating Activities
|
|||||||||||
|
Net income (loss)
|
$
|
180.6
|
|
$
|
42.5
|
|
$
|
(138.1
|
)
|
||
|
Non-cash adjustments
|
88.6
|
|
279.2
|
|
190.6
|
|
|||||
|
Subtotal
|
269.2
|
|
321.7
|
|
52.5
|
|
|||||
|
Increase (decrease) in cash due to:
|
|||||||||||
|
Accounts receivable
|
(3.4
|
)
|
52.5
|
|
55.9
|
|
|||||
|
Inventories
|
(19.4
|
)
|
(29.6
|
)
|
(10.2
|
)
|
|||||
|
Accounts payable
|
(46.8
|
)
|
(194.1
|
)
|
(147.3
|
)
|
|||||
|
Payroll and related taxes
|
(26.3
|
)
|
(38.2
|
)
|
(11.9
|
)
|
|||||
|
Accrued customer programs
|
51.8
|
|
34.4
|
|
(17.4
|
)
|
|||||
|
Accrued liabilities
|
52.1
|
|
108.1
|
|
56.0
|
|
|||||
|
Accrued income taxes
|
33.1
|
|
(56.8
|
)
|
(89.9
|
)
|
|||||
|
Other
|
(18.3
|
)
|
2.9
|
|
21.2
|
|
|||||
|
Subtotal
|
$
|
22.8
|
|
$
|
(120.8
|
)
|
$
|
(143.6
|
)
|
||
|
Net cash from (for) operating activities
|
$
|
292.0
|
|
$
|
200.9
|
|
$
|
(91.1
|
)
|
||
We generated
$200.9 million
of cash from operating activities during the six months ended December 31, 2015, a
$91.1 million
decrease over the comparable prior year period, due primarily to the following:
|
•
|
Changes in accounts payable due primarily to the addition of Omega as well as the impact of Omega's accounts payable structure described above; and
|
|
•
|
Changes in accrued income taxes due primarily to the six months ended December 31, 2015 including a $68.9 million incremental tax payment made in connection with the contested IRS audit described in Note 14; offset partially by
|
|
•
|
Increased net earnings after adjusting for non-cash items such as impairment charges, changes in the fair value of the Tysabri
®
royalty stream, losses on extinguishment of debt, and depreciation and amortization;
|
|
•
|
Changes in accounts receivable due to timing of receipt of payments; and
|
|
•
|
Changes in accrued liabilities due primarily to amounts not yet paid related to our defense against Mylan.
|
In addition, our operating cash flow was negatively impacted by $57.7 million in legal and consulting fees related to our defense against Mylan.
84
Perrigo Company plc
- Item 7
Financial Condition, Liquidity and Capital Resources
Year Ended
June 27, 2015
vs.
Year Ended
June 28, 2014
|
Year Ended
|
|||||||||||
|
|
June 28,
2014 |
June 27,
2015 |
Increase / (Decrease)
|
||||||||
|
($ in millions)
|
Restated
|
Restated
|
|||||||||
|
Cash Flows From (For) Operating Activities
|
|||||||||||
|
Net income (loss)
|
$
|
232.8
|
|
$
|
136.1
|
|
$
|
(96.7
|
)
|
||
|
Non-cash adjustments
|
379.7
|
|
554.7
|
|
175.0
|
|
|||||
|
Subtotal
|
612.5
|
|
690.8
|
|
78.3
|
|
|||||
|
Increase (decrease) in cash due to:
|
|||||||||||
|
Accounts receivable
|
(140.5
|
)
|
(51.1
|
)
|
89.4
|
|
|||||
|
Inventories
|
84.7
|
|
(11.4
|
)
|
(96.1
|
)
|
|||||
|
Accounts payable
|
(24.9
|
)
|
120.5
|
|
145.4
|
|
|||||
|
Payroll and related taxes
|
(55.5
|
)
|
(30.2
|
)
|
25.3
|
|
|||||
|
Accrued customer programs
|
113.1
|
|
71.3
|
|
(41.8
|
)
|
|||||
|
Accrued liabilities
|
23.0
|
|
42.8
|
|
19.8
|
|
|||||
|
Accrued income taxes
|
(11.3
|
)
|
21.9
|
|
33.2
|
|
|||||
|
Other
|
31.9
|
|
0.6
|
|
(31.3
|
)
|
|||||
|
Subtotal
|
$
|
20.5
|
|
$
|
164.4
|
|
$
|
143.9
|
|
||
|
Net cash from (for) operating activities
|
$
|
633.0
|
|
$
|
855.2
|
|
$
|
222.2
|
|
||
We generated
$855.2 million
of cash from operating activities during the
year ended
June 27, 2015, a
$222.2 million
increase over the prior year, due primarily to the following:
|
•
|
Changes in accounts payable due primarily to the addition of Omega in the fourth quarter, as Omega structured terms with suppliers based on seasonality of the business as noted above;
|
|
•
|
Changes in accounts receivable due to timing of sales and receipt of payments;
|
|
•
|
Increased net earnings after adjusting for non-cash items such as changes in the fair value of the Tysabri
®
royalty stream, losses on extinguishment of debt, losses on acquisition-related foreign currency derivatives, and depreciation and amortization; offset partially by
|
|
•
|
Changes in inventory due primarily to the addition of Omega.
|
85
Perrigo Company plc
- Item 7
Financial Condition, Liquidity and Capital Resources
Investing Activities
Year Ended
December 31, 2016
vs.
Year Ended
December 31, 2015
|
Year Ended
|
|||||||||||
|
|
December 31,
2015 |
December 31,
2016 |
Increase/ (Decrease)
|
||||||||
|
($ in millions)
|
Restated
|
||||||||||
|
Cash Flows From (For) Investing Activities
|
|||||||||||
|
Proceeds from royalty rights
|
$
|
335.1
|
|
$
|
353.7
|
|
$
|
18.6
|
|
||
|
Acquisitions of businesses, net of cash acquired
|
(2,886.4
|
)
|
(427.4
|
)
|
2,459.0
|
|
|||||
|
Asset acquisitions
|
(4.0
|
)
|
(65.1
|
)
|
(61.1
|
)
|
|||||
|
Settlement of acquisition-related foreign currency derivatives
|
(304.8
|
)
|
—
|
|
304.8
|
|
|||||
|
Proceeds from sale of securities
|
—
|
|
4.5
|
|
4.5
|
|
|||||
|
Additions to property, plant and equipment
|
(166.8
|
)
|
(106.2
|
)
|
60.6
|
|
|||||
|
Proceeds from sale of business
|
—
|
|
69.1
|
|
69.1
|
|
|||||
|
Other investing
|
(2.7
|
)
|
(3.6
|
)
|
(0.9
|
)
|
|||||
|
Net cash from (for) investing activities
|
$
|
(3,029.6
|
)
|
$
|
(175.0
|
)
|
$
|
2,854.6
|
|
||
Cash used for investing activities totaled
$175.0 million
for the
year ended
December 31, 2016
, a
$2.9 billion
decrease over the prior year. The outflow in the current year was due primarily to the acquisitions of the Tretinoin Products and the Generic Benzaclin™ product rights, which used
$478.4 million
in cash, offset partially by
$353.7 million
of royalty proceeds from our interest in Tysabri
®
. The outflow in the prior year was due primarily to
$2.9 billion
used for business acquisitions, most notably Omega, as well as
$304.8 million
related to the cash settlement of the non-designated foreign currency derivatives we used to hedge the euro-denominated Omega and GSK Products purchase prices. See
Item 8. Note 2
and
Item 8. Note 8
for more information on the above-mentioned acquisitions and derivatives, respectively.
Cash used for capital expenditures totaled
$106.2 million
during
year ended
December 31, 2016
compared to
$166.8 million
in the prior year. The decrease in capital expenditures over the prior year was due primarily to several large infrastructure projects nearing completion. Capital expenditures for the next twelve months are anticipated to be between $110.0 million and $140.0 million related to manufacturing productivity capacity and quality/regulatory projects. We expect to fund these estimated capital expenditures with funds from operating cash flows.
Six Months Ended December 31, 2015
vs.
Six Months Ended
December 27, 2014
|
Six Months Ended
|
|||||||||||
|
|
December 27,
2014 |
December 31,
2015 |
Increase / (Decrease)
|
||||||||
|
Restated
|
Restated
|
||||||||||
|
Cash Flows From (For) Investing Activities
|
|||||||||||
|
Proceeds from royalty rights
|
$
|
175.8
|
|
$
|
166.3
|
|
$
|
(9.5
|
)
|
||
|
Acquisitions of businesses, net of cash acquired
|
(83.0
|
)
|
(791.6
|
)
|
(708.6
|
)
|
|||||
|
Settlement of acquisition-related foreign currency derivatives
|
(26.4
|
)
|
(1.3
|
)
|
25.1
|
|
|||||
|
Additions to property, plant and equipment
|
(48.0
|
)
|
(77.8
|
)
|
(29.8
|
)
|
|||||
|
Other investing
|
0.8
|
|
(3.7
|
)
|
(4.5
|
)
|
|||||
|
Net cash from (for) investing activities
|
$
|
19.2
|
|
$
|
(708.1
|
)
|
$
|
(727.3
|
)
|
||
86
Perrigo Company plc
- Item 7
Financial Condition, Liquidity and Capital Resources
Cash used for investing activities totaled
$708.1 million
for the six months ended December 31, 2015, compared to cash from investing activities of
$19.2 million
in the prior period. The cash outflow for the six months ended December 31, 2015 was to complete the Entocort
®
, GSK and Naturwohl acquisitions, offset partially by
$166.3 million
in proceeds from our interest in the Tysabri
®
royalty stream. During the six months ended December 27, 2014, we used
$83.0 million
in cash to complete the Lumara products acquisition, and
$26.4 million
to hedge the euro-denominated Omega purchase price, and received
$175.8 million
in Tysabri royalties. See
Item 8. Note 2
and
Item 8. Note 8
for more information on the above-mentioned acquisitions and derivatives, respectively. Capital expenditures for the six months ended December 31, 2015 totaled
$77.8 million
, compared to
$48.0 million
in the comparable prior year period.
Year Ended
June 27, 2015
vs.
Year Ended
June 28, 2014
|
Year Ended
|
|||||||||||
|
|
June 28,
2014 |
June 27,
2015 |
Increase / (Decrease)
|
||||||||
|
Restated
|
Restated
|
||||||||||
|
Cash Flows From (For) Investing Activities
|
|||||||||||
|
Proceeds from royalty rights
|
$
|
60.5
|
|
$
|
344.6
|
|
$
|
284.1
|
|
||
|
Acquisitions of businesses, net of cash acquired
|
(1,605.8
|
)
|
(2,177.8
|
)
|
(572.0
|
)
|
|||||
|
Asset acquisitions
|
—
|
|
(4.0
|
)
|
(4.0
|
)
|
|||||
|
Settlement of acquisition-related foreign currency derivatives
|
—
|
|
(329.9
|
)
|
(329.9
|
)
|
|||||
|
Proceeds from sale of securities
|
81.4
|
|
—
|
|
(81.4
|
)
|
|||||
|
Additions to property, plant and equipment
|
(171.6
|
)
|
(137.0
|
)
|
34.6
|
|
|||||
|
Other investing
|
(8.8
|
)
|
1.8
|
|
10.6
|
|
|||||
|
Net cash from (for) investing activities
|
$
|
(1,644.3
|
)
|
$
|
(2,302.3
|
)
|
$
|
(658.0
|
)
|
||
Net cash used for investing activities during the
year ended
June 27, 2015 increased
$658.0 million
compared to the
year ended
June 28, 2014 due to increased acquisition activity. During the
year ended
June 27, 2015, we used
$2.2 billion
, net of cash received, to purchase Omega, Gelcaps, and the Lumara products. During the
year ended
June 28, 2014, we used
$1.6 billion
, net of cash received, to acquire Elan and products from Aspen and Fera. Investing activities for the
year ended
June 27, 2015 also included a
$329.9 million
cash outflow related to the cash settlement of non-designated foreign currency derivatives we used to hedge the euro-denominated Omega and GSK purchase prices. See
Item 8. Note 2
and
Item 8. Note 8
for more information on the above-mentioned acquisitions and derivatives, respectively.
The cash outflows were offset in part by proceeds of
$344.6 million
and
$60.5 million
from our Tysabri royalty interest during the years ended June 27, 2015 and June 28, 2014, respectively. The increase in the year ended June 27, 2015 was due to the period including four quarters of proceeds versus one quarter in the prior year as the asset was purchased in December 2013, as well as an increase in the royalty rate. Our royalties were 12% of Biogen's worldwide sales of Tysabri
®
through April 30 in the year ended June 28, 2014. The royalty subsequently increased to 18% for the entirety of the year ended June 27, 2015.
Capital expenditures totaled
$137.0 million
during the
year ended
June 27, 2015 and included many production and capacity projects and investments at newly acquired entities. Capital expenditures were
$171.6 million
for the
year ended
June 28, 2014. The decrease in the year ended June 27, 2015 was due to several large infrastructure projects nearing completion.
87
Perrigo Company plc
- Item 7
Financial Condition, Liquidity and Capital Resources
Financing Activities
Year Ended
December 31, 2016
vs.
Year Ended
December 31, 2015
|
Year Ended
|
|||||||||||
|
|
December 31,
2015 |
December 31,
2016 |
Increase / (Decrease)
|
||||||||
|
($ in millions)
|
Restated
|
||||||||||
|
Cash Flows From (For) Financing Activities
|
|||||||||||
|
Borrowings (repayments) of revolving credit agreements and other financing, net
|
$
|
666.0
|
|
$
|
(802.5
|
)
|
$
|
(1,468.5
|
)
|
||
|
Issuances of long-term debt
|
—
|
|
1,190.3
|
|
1,190.3
|
|
|||||
|
Payments on long-term debt
|
(917.3
|
)
|
(559.2
|
)
|
358.1
|
|
|||||
|
Premium on early debt retirement
|
—
|
|
(0.6
|
)
|
(0.6
|
)
|
|||||
|
Deferred financing fees
|
(3.6
|
)
|
(2.8
|
)
|
0.8
|
|
|||||
|
Issuance of ordinary shares
|
8.9
|
|
8.3
|
|
(0.6
|
)
|
|||||
|
Equity issuance costs
|
—
|
|
(10.3
|
)
|
(10.3
|
)
|
|||||
|
Repurchase of ordinary shares
|
(500.0
|
)
|
—
|
|
500.0
|
|
|||||
|
Cash dividends
|
(72.2
|
)
|
(83.2
|
)
|
(11.0
|
)
|
|||||
|
Other financing
|
(19.0
|
)
|
(8.7
|
)
|
10.3
|
|
|||||
|
Net cash from (for) financing activities
|
$
|
(837.2
|
)
|
$
|
(268.7
|
)
|
$
|
568.5
|
|
||
Cash used for financing activities totaled
$268.7 million
for the
year ended
December 31, 2016
, compared to
$837.2 million
for the prior year. In the current year, cash used for financing included
$802.5 million
to repay balances outstanding under our revolving credit agreements and other short-term financing, $500.0 million used to prepay our 1.300% 2016 Notes, and $59.2 million in scheduled debt payments. These payments were offset by the borrowing of
$1.2 billion
of long-term debt. In the prior year, the cash used for financing activities was due primarily to payments of
$917.3 million
on long-term debt, which included the repayment of debt assumed from Omega and a $300.0 million legacy Perrigo term loan, and $500.0 million used to repurchase shares under our share purchase plan. This was offset by
$666.0 million
of net borrowings under our revolving credit facilities and other short term borrowings.
Six Months Ended December 31, 2015
vs.
Six Months Ended
December 27, 2014
|
Six Months Ended
|
|||||||||||
|
|
December 27,
2014 |
December 31,
2015 |
Increase / (Decrease)
|
||||||||
|
($ in millions)
|
Restated
|
||||||||||
|
Cash Flows From (For) Financing Activities
|
|||||||||||
|
Borrowings (repayments) of revolving credit agreements and other financing, net
|
$
|
(2.1
|
)
|
$
|
718.0
|
|
$
|
720.1
|
|
||
|
Issuances of long-term debt
|
2,504.3
|
|
—
|
|
(2,504.3
|
)
|
|||||
|
Payments on long-term debt
|
(934.5
|
)
|
(28.3
|
)
|
906.2
|
|
|||||
|
Deferred financing fees
|
(24.8
|
)
|
(0.3
|
)
|
24.5
|
|
|||||
|
Issuance of ordinary shares
|
1,039.5
|
|
4.9
|
|
(1,034.6
|
)
|
|||||
|
Equity issuance costs
|
(35.7
|
)
|
—
|
|
35.7
|
|
|||||
|
Repurchase of ordinary shares
|
—
|
|
(500.0
|
)
|
(500.0
|
)
|
|||||
|
Cash dividends
|
(29.0
|
)
|
(36.3
|
)
|
(7.3
|
)
|
|||||
|
Other financing
|
(8.8
|
)
|
(8.4
|
)
|
0.4
|
|
|||||
|
Net cash from (for) financing activities
|
$
|
2,508.9
|
|
$
|
149.6
|
|
$
|
(2,359.3
|
)
|
||
88
Perrigo Company plc
- Item 7
Financial Condition, Liquidity and Capital Resources
Cash generated from financing activities totaled
$149.6 million
for the six months ended December 31,
2015, compared to
$2,508.9 million
for the comparable prior year period. The net cash inflow during the six months
ended December 31, 2015 was due to net borrowings under our revolving credit facilities of $680.0 million and net
borrowings under our overdraft facilities and other short term borrowings of $38.0 million, offset partially by
$500.0 million
used to repurchase shares under our share repurchase plan,
$36.3 million
in dividend payments, and
$28.3 million
in scheduled principal payments on our euro-denominated term loan. The cash generated during the six months ended December 27, 2014 was due to financing activities to fund the Omega acquisition. The Omega financing included raising $1.6 billion of debt, net of discount and issuance costs, and issuing 6.8 million ordinary shares, which raised $999.3 million, net of issuance costs. In addition, we refinanced certain of our debt totaling $907.6 million.
Year Ended
June 27, 2015
vs.
Year Ended
June 28, 2014
|
Year Ended
|
|||||||||||
|
|
June 28,
2014 |
June 27,
2015 |
Increase / (Decrease)
|
||||||||
|
($ in millions)
|
Restated
|
||||||||||
|
Cash Flows From (For) Financing Activities
|
|||||||||||
|
Borrowings (repayments) of revolving credit agreements and other financing, net
|
$
|
(3.0
|
)
|
$
|
(54.0
|
)
|
$
|
(51.0
|
)
|
||
|
Issuances of long-term debt
|
3,293.6
|
|
2,504.3
|
|
(789.3
|
)
|
|||||
|
Payments on long-term debt
|
(2,035.0
|
)
|
(1,823.5
|
)
|
211.5
|
|
|||||
|
Premium on early debt retirement
|
(133.5
|
)
|
—
|
|
133.5
|
|
|||||
|
Deferred financing fees
|
(48.8
|
)
|
(28.1
|
)
|
20.7
|
|
|||||
|
Issuance of ordinary shares
|
9.8
|
|
1,043.5
|
|
1,033.7
|
|
|||||
|
Equity issuance costs
|
—
|
|
(35.7
|
)
|
(35.7
|
)
|
|||||
|
Cash dividends
|
(46.1
|
)
|
(64.8
|
)
|
(18.7
|
)
|
|||||
|
Other financing
|
(9.0
|
)
|
(19.3
|
)
|
(10.3
|
)
|
|||||
|
Net cash from (for) financing activities
|
$
|
1,028.0
|
|
$
|
1,522.4
|
|
$
|
494.4
|
|
||
Net cash provided from financing activities increased
$494.4 million
in the
year ended
June 27, 2015 compared to the
year ended
June 28, 2014 due primarily to financing we undertook to purchase Omega during the
year ended
June 27, 2015 as noted above. This increase in cash was offset by repayments of short- and long-term debt totaling
$1.8 billion
. In the year ended June 28, 2014, we issued $3.2 billion of debt net of issuance costs and repaid $2.2 billion of debt, including premium on early debt retirement, primarily in connection with the Elan acquisition. The increase in cash from financing activities in the
year ended
June 27, 2015 was also offset by an increase of
$18.7 million
in dividend payments over the year ended June 28, 2014.
For more information see "Borrowings and Capital Resources" below and
Item 1. Note 10
.
Share Repurchases
On October 22, 2015, the Board of Directors approved a three year share repurchase plan of up to
$2.0 billion
. During the
year ended
December 31, 2015 we repurchased
3.3 million
ordinary shares at an average repurchase price of
$151.59
per share, for a total of
$500.0 million
. There were no share repurchases during the
year ended
December 31, 2016
.
Dividends
In January 2003, the Board of Directors adopted a policy of paying quarterly dividends. We paid dividends as follows:
89
Perrigo Company plc
- Item 7
Financial Condition, Liquidity and Capital Resources
|
|
Year Ended
|
Six Months Ended
|
Year Ended
|
|||||||||||||||||
|
|
June 28,
2014 |
June 27,
2015 |
December 31,
2015 |
December 27,
2014 |
December 31,
2016 |
|||||||||||||||
|
Dividends paid (in millions)
|
$
|
46.1
|
|
$
|
64.8
|
|
$
|
36.3
|
|
$
|
29.0
|
|
$
|
83.2
|
|
|||||
|
Dividends paid per share
|
$
|
0.39
|
|
$
|
0.46
|
|
$
|
0.25
|
|
$
|
0.21
|
|
$
|
0.58
|
|
|||||
The declaration and payment of dividends and the amount paid, if any, are subject to the discretion of the Board of Directors and depend on earnings, financial condition, capital and surplus requirements and other factors the Board of Directors may consider relevant.
Dividends paid were as follows:
|
Declaration Date
|
Record Date
|
Payable
|
Dividend Declared
|
|||||
|
Year Ended December 31, 2016
|
||||||||
|
November 8, 2016
|
November 25, 2016
|
December 13, 2016
|
$
|
0.145
|
|
|||
|
August 2, 2016
|
August 26, 2016
|
September 13, 2016
|
$
|
0.145
|
|
|||
|
April 26, 2016
|
May 27, 2016
|
June 14, 2016
|
$
|
0.145
|
|
|||
|
February 16, 2016
|
February 26, 2016
|
March 15, 2016
|
$
|
0.145
|
|
|||
|
Six Months Ended December 31, 2015
|
||||||||
|
November 4, 2015
|
November 27, 2015
|
December 15, 2015
|
$
|
0.125
|
|
|||
|
August 12, 2015
|
August 28, 2015
|
September 15, 2015
|
$
|
0.125
|
|
|||
|
Year Ended June 27, 2015
|
||||||||
|
April 28, 2015
|
May 29, 2015
|
June 16, 2015
|
$
|
0.125
|
|
|||
|
January 27, 2015
|
February 27, 2015
|
March 17, 2015
|
$
|
0.125
|
|
|||
|
November 3, 2014
|
November 28, 2014
|
December 16, 2014
|
$
|
0.105
|
|
|||
|
August 13, 2014
|
August 29, 2014
|
September 16, 2014
|
$
|
0.105
|
|
|||
Capital Resources
Overdraft Facilities
We may use overdraft facilities to increase the efficiency of our cash utilization and to meet our short-term liquidity needs. We report any balances outstanding in "Other Financing" in
Item 8, Note 10
. We repaid the balances outstanding under our overdraft facilities during the
year ended
December 31, 2016
, but retain the ability to use the facilities in our day-to-day cash operations. The balance outstanding under the facilities was
$82.9 million
at
December 31, 2015
, and there were no balances outstanding under the facilities at June 27, 2015.
On
March 30, 2015
, we assumed and repaid certain overdraft facilities totaling
€51.4 million
(
$56.0 million
) with the Omega acquisition.
Accounts Receivable Factoring
We have multiple accounts receivable factoring arrangements with non-related third-party financial institutions (the “Factors”). Pursuant to the terms of the arrangements, we sell to the Factors certain of our accounts receivable balances on a non-recourse basis for credit approved accounts. An administrative fee ranging from
0.14%
to
0.15%
per invoice is charged on the gross amount of accounts receivables assigned to the Factors, and interest is calculated at the applicable EUR LIBOR rate plus 70 basis points. The total amount factored on a non-recourse basis and excluded from accounts receivable were
$50.7 million
,
$64.5 million
, and
$82.9 million
at
December 31, 2016
,
December 31, 2015
and
June 27, 2015
, respectively.
See
Item 8. Note 4
for more information.
90
Perrigo Company plc
- Item 7
Financial Condition, Liquidity and Capital Resources
Revolving Credit Agreements
On
December 9, 2015
, our 100% owned finance subsidiary, Perrigo Finance Unlimited Company (formerly Perrigo Finance plc) ("Perrigo Finance"), entered into a
$750.0 million
revolving credit agreement (the "2015 Revolver"). On March 15, 2016, we used the proceeds of the long-term debt issuance described below under "2016 Notes" to repay the
$750.0 million
then outstanding under the 2015 Revolver and terminated the facility.
On
March 30, 2015
, we assumed a revolving credit facility with
€500.0 million
(
$544.5 million
) outstanding from Omega. On
April 8, 2015
, we repaid the
€500.0 million
(
$539.1 million
) outstanding under the assumed revolving credit facility and terminated the facility.
On
December 5, 2014
, Perrigo Finance entered into a
$600.0 million
revolving credit agreement, which we increased to
$1.0 billion
on March 30, 2015 (the "2014 Revolver"). On March 15, 2016, we used the proceeds of the long-term debt issuance described below under "2016 Notes" to repay the
$435.0 million
then outstanding under the 2014 Revolver. There were no borrowings outstanding under the 2014 Revolver as of
December 31, 2016
.
On
September 6, 2013
, Perrigo Company entered into a
$600.0 million
revolving credit agreement (the "2013 Revolver"). On December 5, 2014, we terminated the 2013 Revolver to enter into the 2014 Revolver.
Term Loans and Notes
Year Ended December 31, 2016
|
•
|
On March 7, 2016, Perrigo Finance issued
$500.0 million
in aggregate principal amount of
3.500%
senior notes due 2021 and
$700.0 million
in aggregate principal amount of
4.375%
senior notes due 2026 (together, the "2016 Notes") and received net proceeds of
$1.2 billion
after fees and market discount, which were used to repay the amounts outstanding under the 2015 Revolver and 2014 Revolver mentioned above.
|
|
•
|
We had
$5.4 billion
and
$4.7 billion
outstanding under our notes and bonds, and
$420.7 million
and
$488.8 million
outstanding under our term loan, as of
December 31, 2016
and
December 31, 2015
, respectively. On September 29, 2016, we repaid the
$500.0 million
outstanding under the 1.300% 2016 Notes.
|
Year Ended June 27, 2015
|
•
|
On September 2, 2014, we offered to exchange what were previously private placement senior notes for public bonds registered with the Securities and Exchange Commission. Substantially all of the private placement senior notes have been exchanged.
|
|
•
|
On
December 2, 2014
, Perrigo Finance, our 100% owned finance subsidiary, issued
$500.0 million
in aggregate principal amount of
3.50%
senior notes due
2021
,
$700.0 million
in aggregate principal amount of
3.90%
senior notes due
2024
, and
$400.0 million
in aggregate principal amount of
4.90%
senior notes due
2044
(collectively, the "2014 Bonds").
|
|
•
|
The 2014 Bonds are fully and unconditionally guaranteed on a senior unsecured basis by Perrigo Company plc, and no other subsidiary of Perrigo Company plc guarantees the 2014 Bonds. We may redeem the 2014 Bonds at any time under the terms of the applicable indenture, subject to the payment of a make-whole premium.
|
|
•
|
On
December 5, 2014
, Perrigo Finance entered into a term loan agreement consisting of a
€500.0 million
(
$614.3 million
) tranche maturing December 5, 2019, and Perrigo Company plc entered into a
$300.0 million
term loan tranche maturing December 18, 2015 ("2014 Term Loan").
|
|
•
|
On December 5, 2014, we repaid the remaining
$895.0 million
outstanding under our 2013 Term Loan described below, then terminated it.
|
|
•
|
On June 24, 2015, we repaid the $300.0 million portion of the 2014 Term Loan.
|
|
•
|
On March 30, 2015, we assumed
$20.0 million
in aggregate principal amount of
6.19%
senior notes due
2016
(the "2016 Notes"),
€135.0 million
(
$147.0 million
) aggregate principal amount of
5.1045%
senior notes due
2023
,
€300.0 million
(
$326.7 million
) in aggregate principal amount of
5.125%
retail bonds due
|
91
Perrigo Company plc
- Item 7
Financial Condition, Liquidity and Capital Resources
2017
,
€180.0 million
(
$196.0 million
) in aggregate principal amount of
4.500%
retail bonds due
2017
, and
€120.0 million
(
$130.7 million
) in aggregate principal amount of
5.000%
retail bonds due
2019
(collectively, the "Retail Bonds") in connection with the Omega acquisition.
|
•
|
The fair value of the 2023 Notes and Retail Bonds
exceeded par value by
€93.6 million
(
$101.9 million
) on the date of the acquisition. As a result, a fair value adjustment was recorded as part of the carrying value of the underlying debt and will be amortized as a reduction of interest expense over the remaining terms of the respective debt instruments. The adjustment does not affect cash interest payments.
|
|
•
|
On May 29, 2015, we repaid the
$20.0 million
in aggregate principal amount of the 2016 Notes.
|
As described in our Current Report on Form 8-K filed on March 16, 2017, we entered into amendments to the 2014 Revolver and the 2014 Term Loan providing for additional time to deliver certain financial statements, as well as the modification of certain financial and other covenants. Also, as described in our Current Report on Form 8-K filed on April 25, 2017, we entered into additional amendments to the 2014 Revolver and the 2014 Term Loan to modify provisions of such agreements necessary as a result of the correction in accounting related to the Tysabri
®
royalty stream, as well as waivers of any default or event of default that may arise from any restatement of or deficiencies in our financial statements for the periods specified in such amendments and waivers. No default or event of default existed prior to entering into these amendments and waivers. We are in compliance with all covenants under the 2014 Revolver and the 2014 Term Loan as of the date of this Annual Report on Form 10-K
.
As a result of the filing of this Annual Report on Form 10-K, as of the filing date, we are in compliance with all covenants, including the financial statement delivery obligations, under the 2013 Indenture and 2014 Indenture. However, if we do not file the Quarterly Report on Form 10-Q for the quarterly period ended April 1, 2017 within 15 calendar days after the due date of such report, we would not be in compliance with the financial statement delivery obligations under such indentures. However, after that date, an investor (or investors) holding 25% or more of one of our tranches under the indentures may ask the trustee (or the trustee may take action on its own) to file a notice with us stating we are in default in the financial statements delivery requirement. If such action is taken, we have 90 calendar days from the date of the notice to file our financial statements before we would have an Event of Default under the indentures. See
Item 8. Note 10
for more information on all of the above debt facilities and transactions.
Bridge Financing
In connection with the Omega acquisition, on
November 6, 2014
, we entered into a
€1.75 billion
(
$2.2 billion
) senior unsecured
364
-day bridge loan facility (the "Bridge Loan Facility"). Upon issuance of our permanent debt financing described above, the Bridge Loan Facility was terminated on December 3, 2014. At no time did we draw upon the Bridge Loan Facility.
In connection with the Elan acquisition, on
July 28, 2013
, we entered into a
$2.65 billion
debt bridge credit agreement (the "Debt Bridge") and a
$1.7 billion
cash bridge credit agreement (the "Cash Bridge") (together, the "Bridge Credit Agreements"). The commitments under the Debt Bridge and the Cash Bridge agreements were terminated on November 8, 2013 and December 24, 2013, respectively. At no time did we draw under the Bridge Credit Agreements.
Credit Ratings
Our credit ratings on
December 31, 2016
were Baa3 (negative) and BBB- (stable) by Moody's Investors Service and Standard and Poor's Rating Services, respectively.
Credit rating agencies review their ratings periodically and, therefore, the credit rating assigned to us by each agency may be subject to revision at any time. Accordingly, we are not able to predict whether current credit ratings will remain as disclosed above. Factors that can affect our credit ratings include changes in operating performance, the economic environment, our financial position, and changes in business strategy. If changes in our credit ratings were to occur, they could impact, among other things, future borrowing costs, access to capital markets, and vendor financing terms.
92
Perrigo Company plc
- Item 7
Financial Condition, Liquidity and Capital Resources
Contractual Obligations
Our enforceable and legally binding obligations as of
December 31, 2016
are set forth in the following table. Some of the amounts included in this table are based on management’s estimates and assumptions about these obligations, including the duration, the possibility of renewal, anticipated actions by third parties and other factors. Because these estimates and assumptions are necessarily subjective, the enforceable and legally binding obligations actually paid in future periods may vary from the amounts reflected in the table.
|
|
Payment Due
|
||||||||||||||||||
|
($ in millions)
|
2017
|
2018-2019
|
2020-2021
|
After 2021
|
Total
|
||||||||||||||
|
Short and long-term debt
(1)
|
$
|
781.7
|
|
$
|
1,474.8
|
|
$
|
1,332.2
|
|
$
|
4,339.7
|
|
$
|
7,928.4
|
|
||||
|
Capital lease obligations
|
1.4
|
|
1.0
|
|
0.5
|
|
—
|
|
2.9
|
|
|||||||||
|
Purchase obligations
(2)
|
781.9
|
|
9.7
|
|
—
|
|
—
|
|
791.6
|
|
|||||||||
|
Operating leases
(3)
|
40.2
|
|
54.8
|
|
29.2
|
|
19.8
|
|
144.0
|
|
|||||||||
|
Other contractual liabilities reflected on the consolidated balance sheets:
|
|||||||||||||||||||
|
Deferred compensation and benefits
(4)
|
—
|
|
—
|
|
—
|
|
85.6
|
|
85.6
|
|
|||||||||
|
Other
(5)
|
122.5
|
|
10.6
|
|
7.6
|
|
5.9
|
|
146.6
|
|
|||||||||
|
Total
|
$
|
1,727.7
|
|
$
|
1,550.9
|
|
$
|
1,369.5
|
|
$
|
4,451.0
|
|
$
|
9,099.1
|
|
||||
|
(1)
|
Short-term and long-term debt includes interest payments, which were calculated using the effective interest rate at
December 31, 2016
.
|
|
(2)
|
Consists of commitments for both materials and services.
|
|
(3)
|
Used in normal course of business, principally for warehouse facilities and computer equipment.
|
|
(4)
|
Includes amounts associated with non-qualified plans related to deferred compensation, executive retention and post-employment benefits. Of this amount, we have funded
$52.5 million
, which is recorded in Other non-current assets on the balance sheet. These amounts are assumed payable after five years, although certain circumstances, such as termination, would require earlier payment.
|
|
(5)
|
Primarily includes consulting fees, legal settlements, contingent consideration obligations, restructuring accruals and electrical and gas purchase contracts, which were accrued in Other current liabilities and Other non-current liabilities at
December 31, 2016
for all years.
|
We fund our U.S. qualified profit-sharing and investment plan in accordance with the Employee Retirement Income Security Act of 1974 regulations for the minimum annual required contribution and Internal Revenue Service regulations for the maximum annual allowable tax deduction. We are committed to making the required minimum contributions, which we expect to be approximately
$21.9 million
over the next 12 months. Future contributions are dependent upon various factors, including employees’ eligible compensation, plan participation and changes, if any, to current funding requirements. Therefore, no amounts were included in the Contractual Obligations table above. We generally expect to fund all future contributions with cash flows from operating activities.
As of
December 31, 2016
, we had approximately
$398.0 million
of liabilities for uncertain tax positions. These unrecognized tax benefits have been excluded from the Contractual Obligations table above due to uncertainty as to the amounts and timing of settlement with taxing authorities.
Net deferred income tax liabilities were
$317.8 million
as of
December 31, 2016
. This amount is not included in the Contractual Obligations table above because we believe this presentation would not be meaningful. Net deferred income tax liabilities are calculated based on temporary differences between the tax basis of assets and liabilities and their book basis, which will result in taxable amounts in future years when the book basis is settled. The results of these calculations do not have a direct connection with the amount of cash taxes to be paid in any future periods. As a result, scheduling net deferred income tax liabilities as payments due by period could be misleading because this scheduling would not relate to liquidity needs.
93
Perrigo Company plc
- Item 7
Critical Accounting Estimates
Critical Accounting Estimates
The determination of certain amounts in our financial statements requires the use of estimates. These estimates are based upon our historical experiences combined with management’s understanding of current facts and circumstances. Although the estimates are considered reasonable based on the currently available information, actual results could differ from the estimates we have used. Management considers the below accounting estimates to require the most judgment and to be the most critical in the preparation of our financial statements. These estimates are reviewed by the Audit Committee.
Revenue Recognition and Customer-Related Accruals and Allowances
We generally record revenues from product sales when the goods are shipped to the customer. For customers with Free on Board ("FOB") destination terms, a provision is recorded to exclude shipments estimated to be in-transit to these customers at the end of the reporting period. A sales allowance is recorded and accounts receivable are reduced as revenues are recognized for estimated losses on credit sales due to customer claims for discounts, price discrepancies, returned goods, and other items. Revenue is also reduced for any contractual customer program arrangements and related liabilities are recorded concurrently.
We maintain customer-related accruals and allowances that consist primarily of chargebacks, rebates, sales returns, shelf stock allowances, administrative fees, and other incentive programs. Some of these adjustments relate specifically to the
RX
segment while others relate to the
CHCA
and
CHCI
segments. The aggregate gross-to-net adjustments related to
RX
products can exceed 50% of the segment's gross sales. In contrast, the aggregate gross-to-net adjustments related to
CHCA
and
CHCI
typically do not exceed 10% of the segment's gross sales. Certain of these accruals and allowances are recorded on the balance sheet as current liabilities, and others are recorded as a reduction in accounts receivable.
Chargebacks
We market and sell products directly to wholesalers, distributors, warehousing pharmacy chains, and other direct purchasing groups. We also market products indirectly to independent pharmacies, non-warehousing chains, managed care organizations, and group purchasing organizations, collectively referred to as "indirect customers." In addition, we enter into agreements with some indirect customers to establish contract pricing for certain products. These indirect customers then independently select a wholesaler from which to purchase the products at these contracted prices. Alternatively, we may pre-authorize wholesalers to offer specified contract pricing to other indirect customers. Under either arrangement, we provide chargeback credit to the wholesaler for any difference between the contracted price with the indirect customer and the wholesaler's invoice price. The accrual for chargebacks is based on historical chargeback experience and confirmed wholesaler inventory levels, as well as estimated sell-through levels by wholesalers to retailers. We regularly assess current pricing dynamics and wholesaler inventory levels to ensure the liability for future chargebacks is fairly stated.
Medicaid Rebates
We participate in certain qualifying U.S. federal and state government programs whereby discounts and rebates are provided to participating government entities. Medicaid rebates are amounts owed based upon contractual agreements or legal requirements with public sector (Medicaid) benefit providers, after the final dispensing of the product by a pharmacy to a benefit plan participant. Medicaid reserves are based on expected payments, which are driven by patient usage, contract performance, and field inventory that will be subject to a Medicaid rebate. Medicaid rebates are typically billed up to 180 days after the product is shipped, but can be billed as many as 270 days after the quarter in which the product is dispensed to the Medicaid participant. As a result, our Medicaid rebate provision includes an estimate of outstanding claims for end-customer sales that occurred but for which the related claim has not been billed, and an estimate for future claims that will be made when inventory in the distribution channel is sold through to plan participants. Our calculation also requires other estimates, such as estimates of sales mix, to determine which sales are subject to rebates and the amount of such rebates. Our rebates are reviewed on a quarterly basis against actual claims data to ensure the liability is fairly stated.
94
Perrigo Company plc
- Item 7
Critical Accounting Estimates
Returns and Shelf Stock Allowances
Consistent with industry practice, we maintain a return policy that allows our customers to return product within a specified period prior to and subsequent to the expiration date. Generally, product may be returned for a period beginning six months prior to its expiration date to up to one year after its expiration date. The majority of our product returns are the result of product dating, which falls within the range set by our policy, and are settled through the issuance of a credit to the customer. Our estimate of the provision for returns is based upon our historical experience with actual returns, which is applied to the level of sales for the period that corresponds to the period during which our customers may return product. The period is based on the shelf life of the products at the time of shipment. Additionally, when establishing our reserves, we consider factors such as levels of inventory in the distribution channel, product dating and expiration period, size and maturity of the market prior to a product launch, entrance into the market of additional competition, and changes in formulations.
Shelf stock allowances are credits issued to reflect changes in the selling price of a product and are based upon estimates of the amount of product remaining in a customer's inventory at the time of the anticipated price change. In many cases, the customer is contractually entitled to such a credit. The allowances for shelf stock adjustments are based on specified terms with certain customers, estimated launch dates of competing products, and estimated changes in market price.
Rx Administrative Fees and Other Rebates
Consistent with pharmaceutical industry practice, rebates or administrative fees are offered to certain wholesale customers, group purchasing organizations, and end-user customers. Settlement of rebates and fees generally may occur from one to 15 months from the date of sale. We provide a provision for rebates at the time of sale based on contracted rates and historical redemption rates. Assumptions used to establish the provision include level of wholesaler inventories, contract sales volumes, and average contract pricing.
CHCA
and
CHCI
Rebates and Other Allowances
In the
CHCA
and
CHCI
segments, we offer certain customers a volume incentive rebate if specific levels of product purchases are made during a specified period. The accrual for rebates is based on contractual agreements and estimated levels of purchasing. In addition, we have a reserve for product returns, primarily related to damaged and unsaleable products. We also have agreements with certain customers to cover promotional activities related to our products such as coupon programs, new store allowances, and product displays. The accrual for these activities is based on customer agreements and is established at the time product revenue is recognized.
Allowances for customer-related programs are generally recorded at the time of sale based on the estimates and methodologies described above. We continually monitor product sales provisions and re-evaluate these estimates as additional information becomes available, which includes, among other things, an assessment of current market conditions, trade inventory levels, and customer product mix. We make adjustments to these provisions at the end of each reporting period to reflect any such updates to the relevant facts and circumstances. Current reporting period adjustments to allowance amounts established in prior reporting periods have not historically been material.
95
Perrigo Company plc
- Item 7
Critical Accounting Estimates
The following table summarizes the activity in our customer-related accrual and allowance accounts on the Consolidated Balance Sheets (restated) (in millions):
|
Customer-Related Accruals and Allowances
|
|||||||||||||||||||||||
|
Rx Americas
|
All Other Segments *
|
||||||||||||||||||||||
|
(in millions)
|
Chargebacks
|
Medicaid
Rebates |
Returns and Shelf Stock Allowances
|
Admin. Fees and Other Rebates
|
Rebates and Other Allowances
|
Total
|
|||||||||||||||||
|
Balance at June 28, 2014
|
$
|
147.9
|
|
$
|
24.4
|
|
$
|
53.6
|
|
$
|
24.9
|
|
$
|
67.2
|
|
$
|
318.0
|
|
|||||
|
Balances Acquired in Business Acquisitions
|
—
|
|
—
|
|
—
|
|
—
|
|
76.1
|
|
76.1
|
|
|||||||||||
|
Foreign currency translation adjustments
|
|
|
|
|
|
|
|
|
(8.0
|
)
|
(8.0
|
)
|
|||||||||||
|
Provisions / Adjustments
|
1,123.1
|
|
46.8
|
|
35.3
|
|
130.7
|
|
158.6
|
|
1,494.5
|
|
|||||||||||
|
Credits / Payments
|
(1,079.6
|
)
|
(39.6
|
)
|
(26.8
|
)
|
(110.3
|
)
|
(165.1
|
)
|
(1,421.4
|
)
|
|||||||||||
|
Balance at June 27, 2015
|
$
|
191.4
|
|
$
|
31.6
|
|
$
|
62.1
|
|
$
|
45.3
|
|
$
|
128.8
|
|
$
|
459.2
|
|
|||||
|
Foreign currency translation adjustments
|
—
|
|
—
|
|
—
|
|
—
|
|
(3.2
|
)
|
(3.2
|
)
|
|||||||||||
|
Provisions / Adjustments
|
666.3
|
|
11.7
|
|
21.3
|
|
47.8
|
|
144.3
|
|
891.4
|
|
|||||||||||
|
Credits / Payments
|
(632.7
|
)
|
(18.6
|
)
|
(20.6
|
)
|
(53.1
|
)
|
(133.0
|
)
|
(858.0
|
)
|
|||||||||||
|
Balance at December 31, 2015
|
$
|
225.0
|
|
$
|
24.7
|
|
$
|
62.8
|
|
$
|
40.0
|
|
$
|
136.9
|
|
$
|
489.4
|
|
|||||
|
Foreign currency translation adjustments
|
—
|
|
—
|
|
—
|
|
—
|
|
(7.5
|
)
|
(7.5
|
)
|
|||||||||||
|
Provisions / Adjustments
|
1,437.2
|
|
27.4
|
|
48.0
|
|
103.4
|
|
259.6
|
|
1,875.6
|
|
|||||||||||
|
Credits / Payments
|
(1,445.2
|
)
|
(27.5
|
)
|
(33.7
|
)
|
(108.8
|
)
|
(258.0
|
)
|
(1,873.2
|
)
|
|||||||||||
|
Balance at December 31, 2016
|
$
|
217.0
|
|
$
|
24.6
|
|
$
|
77.1
|
|
$
|
34.6
|
|
$
|
131.0
|
|
$
|
484.3
|
|
|||||
|
*
|
CHCA
,
CHCI
, and Specialty Sciences
|
Revenues from service and royalty arrangements, including revenues from collaborative agreements, consist primarily of royalty payments, payments for research and development services, up-front fees and milestone payments. If an arrangement requires the delivery or performance of multiple deliverables or service elements, we determine whether the individual elements represent "separate units of accounting". If the separate elements meet the requirements, we recognize the revenue associated with each element separately and revenue is allocated among elements based on their relative selling prices. If the elements within a multiple deliverable arrangement are not considered separate units of accounting, the delivery of an individual element is considered not to have occurred if there are undelivered elements that are considered essential to the arrangement. To the extent such arrangements contain refund clauses triggered by non-performance or other adverse circumstances, revenue is not recognized until all contractual obligations are satisfied.
Non-refundable up-front fees are deferred and amortized to revenue over the related performance period. We estimate the performance period based on the specific terms of each collaborative agreement. Revenue associated with research and development services is recognized on a proportional performance basis over the period that we perform the related activities under the terms of the agreement. Revenue resulting from the achievement of contingent milestone events stipulated in the agreements is recognized when the milestone is achieved. Milestones are based upon the occurrence of a substantive element specified in the contract.
Inventory Reserves
We maintain reserves for estimated obsolete or unmarketable inventory based on the difference between the cost of the inventory and its estimated market value. In estimating the reserves, management considers factors such as excess or slow-moving inventories, product expiration dating, products on quality hold, current and future customer demand, and market conditions. Changes in these conditions may result in additional reserves.
96
Perrigo Company plc
- Item 7
Critical Accounting Estimates
Income Taxes
Our tax rate is subject to adjustment over the balance of the year due to, among other things, income tax rate changes by governments; the jurisdictions in which our profits are determined to be earned and taxed; changes in the valuation of our deferred tax assets and liabilities; adjustments to estimated taxes upon finalization of various tax returns; adjustments to our interpretation of transfer pricing standards, changes in available tax credits, grants and other incentives; changes in stock-based compensation expense; changes in tax laws or the interpretation of such tax laws (for example, proposals for fundamental U.S. and international tax reform); changes in U.S. generally accepted accounting principles; expiration of or the inability to renew tax rulings or tax holiday incentives; and the repatriation of earnings with respect to which we have not previously provided taxes.
Although we believe that our tax estimates are reasonable and that we prepare our tax filings in accordance with all applicable tax laws, the final determination with respect to any tax audit, and any related litigation, could be materially different from our estimates or from our historical income tax provisions and accruals. The results of an audit or litigation could have a material effect on operating results and/or cash flows in the periods for which that determination is made. In addition, future period earnings may be adversely impacted by litigation costs, settlements, penalties, and/or interest assessments.
Legal Contingencies
We are involved in product liability, patent, commercial, regulatory and other legal proceedings that arise in the normal course of business. We record a liability when a loss is considered probable and the amount can be reasonably estimated. If the reasonable estimate of a probable loss is a range and no amount within that range is a better estimate, the minimum amount in the range is accrued. If a loss is not probable or a probable loss cannot be reasonably estimated, no liability is recorded. We have established reserves for certain of our legal matters, as described in
Item 8. Note 16.
We also separately record any insurance recoveries that are probable of occurring.
Acquisition Accounting
We account for acquired businesses using the acquisition method of accounting, which requires that assets acquired and liabilities assumed be recorded at fair value, with limited exceptions. Any excess of the purchase price over the fair value of the specifically identified net assets acquired is recorded as goodwill. Amounts allocated to acquired In Process Research and Development ("IPR&D") are recognized at fair value and initially characterized as indefinite-lived intangible assets, irrespective of whether the acquired IPR&D has an alternative future use. If the acquired net assets do not constitute a business, the transaction is accounted for as an asset acquisition and no goodwill is recognized. In an asset acquisition, acquired IPR&D with no alternative future use is charged to expense at the acquisition date.
The judgments made by management in determining the estimated fair value assigned to each class of asset acquired and liability assumed can materially impact our results of operations. As part of the valuation procedures, we typically consult an independent advisor. There are several methods that can be used to determine fair value. We typically use an income approach for valuing our specifically identifiable intangible assets by employing either a relief from royalty or multi-period excess earnings methodology. The relief from royalty method assumes that, if the acquired company did not own the intangible asset or intellectual property, it would be willing to pay a royalty for its use. The benefit of ownership of the intellectual property is valued as the relief from the royalty expense that would otherwise be incurred. Typically we use this method for valuing readily transferable intangible assets that have licensing appeal, such as trade names and trademarks and certain technology assets.
The multi-period excess earnings approach starts with a forecast of the net cash flows expected to be generated by the asset over its estimated useful life. These cash flows are then adjusted to present value by applying an appropriate discount rate that reflects the risk factors associated with the cash flow streams. We typically use this method for valuing intangible assets such as developed product technology, customer relationships, product formulations, and IPR&D.
97
Perrigo Company plc
- Item 7
Critical Accounting Estimates
Some of the more significant estimates and assumptions inherent in one or both of these income approaches include:
|
•
|
the amount and timing of projected future cash flows, adjusted for the probability of technical and marketing success;
|
|
•
|
the amount and timing of projected costs to develop IPR&D into commercially viable products;
|
|
•
|
the discount rate selected to measure the risks inherent in the future cash flows;
|
|
•
|
the estimate of an appropriate market royalty rate; and
|
|
•
|
an assessment of the asset's life cycle and the competitive trends impacting the asset, including consideration of any technical, legal, regulatory, or economic barriers to entry.
|
We believe the fair values assigned to the assets acquired and liabilities assumed are based on reasonable assumptions; however, unanticipated events and circumstances may occur that may affect the accuracy and validity of such assumptions, estimates or actual results.
While we use our best estimates and assumptions to accurately value assets acquired and liabilities assumed at the acquisition date, our estimates are inherently uncertain and subject to refinement. As a result, during the measurement period, we record adjustments to the assets acquired and liabilities assumed with the corresponding offset to goodwill. Upon the conclusion of the measurement period or final determination of the values of assets acquired or liabilities assumed, whichever comes first, any subsequent adjustments are recorded to our consolidated statements of operations.
Determining the useful life of an intangible asset also requires judgment, as different types of intangible assets will have different useful lives and certain assets may even be considered to have indefinite useful lives. Useful life is the period over which the intangible asset is expected to contribute directly or indirectly to our future cash flows. We determine the useful lives of intangible assets based on a number of factors, such as legal, regulatory, or contractual provisions that may limit the useful life, and the effects of obsolescence, anticipated demand, existence or absence of competition, and other economic factors on useful life.
Royalty Rights - at fair value
We are accounting for the Tysabri
®
royalty stream as a financial asset and have elected to use the fair value option model. We made the election to account for the Tysabri
®
financial asset using the fair value option as we believe this method is most appropriate for an asset that does not have a par value, a stated interest stream, or a termination date. The change in estimated fair value from investments in royalty rights is presented on our Consolidated Statements of Operations under the caption, "Tysabri
®
royalty stream."
We are entitled to quarterly payments of royalties on Tysabri
®
sales. We record our right to royalty payments from Biogen when earned and when collection is reasonably assured. We record the change in fair value of the Tysabri
®
Royalty Rights in our financial statements each period. Critical estimates in determining the fair value are the underlying revenue assumptions of Tysabri
®
sales and the discount rates. The revenue assumptions are impacted by product demand and market growth assumptions, inventory target levels, product approval and pricing assumptions. Factors that could cause a change in estimates of future cash flows include a change in estimated market size, entry of a competitive product that would erode market share, manufacturing and approval of a biosimilar equivalent product, a change in pricing strategy or reimbursement coverage, a delay in obtaining regulatory approval, a change in dosage of the product, and a change in the number of treatments.
The Tysabri
®
royalty stream financial asset acquired in 2013 as part of the Elan acquisition represents a single unit of accounting. The fair value of the financial asset acquired was determined by using a discounted cash flow analysis related to the expected future cash flows to be generated by the royalty stream from Biogen based on the royalty percentage payments of Tysabri
®
sales. The financial asset is classified as a Level 3 asset within the fair value hierarchy, as our valuation utilized significant unobservable inputs, including industry analyst estimates for global Tysabri
®
sales, probability weighted as to the timing and amount of future cash flows along with certain discount rate assumptions. Cash flow forecasts included the estimated effect and timing of future competition, considering patents in effect for Tysabri
®
through 2024 and contractual rights to receive cash flows into perpetuity. The discounted cash flows are based upon the expected royalty stream forecasted into perpetuity using a
20
-year
98
Perrigo Company plc
- Item 7
Critical Accounting Estimates
discrete period with a declining rate terminal value. The pre-tax discount rate utilized was
7.72%
and
7.83%
at December 31, 2015, and June 27, 2015, respectively. Significant judgment is required in selecting appropriate discount rates. At December 31, 2015, and June 27, 2015, an evaluation was performed to assess the discount rate and general market conditions potentially affecting the fair value. As of December 31, 2015, had this discount rate increased or decreased by
0.5%
, the fair value of the asset would have increased by
$270.0 million
or decreased by
$260.0 million
, respectively. As of June 27, 2015, had this discount rate increased or decreased by
0.5%
, the fair value of the asset would have decreased by
$260.0 million
or increased by
$290.0 million
, respectively. The estimated fair value of the asset is subject to variation should those cash flows vary significantly from those estimates. Quarterly, we assess the expected future cash flows and to the extent such payments are greater or less than initial estimates, or the timing of such payments is materially different than the original estimates, we will adjust the estimated fair value of the asset. As of December 31, 2015 if the expected royalty cash flows used in the estimation process had increased or decreased by
5.0%
, the fair value of the asset would have increased by
$270.0 million
or decreased by
$280.0 million
, respectively. As of June 27, 2015 if the expected royalty cash flows used in the estimation process had increased or decreased by
5.0%
, the fair value of the asset would have increased by
$280.0 million
or decreased by
$280.0 million
, respectively. As of December 31, 2016, the financial asset was adjusted based on the strategic review and sale process. Refer to
Note 22
for additional information on the divestiture.
The following table summarizes the change in our Consolidated Balance Sheet for the Tysabri
®
Royalty Stream, which includes our fair value adjustment that is a Level 3 measurement under ASC 820 and is included in our Consolidated Statement of Operations for the year ended December 31, 2016, six months ended December 31, 2015, and year ended June 27, 2015 (in millions):
|
Year Ended
|
Six Months Ended
|
Year Ended
|
|||||||||
|
December 31,
2016 |
December 31,
2015 |
June 27,
2015 |
|||||||||
|
Tysabri
®
Royalty Stream - at fair value
|
|||||||||||
|
Beginning balance
|
$
|
5,310.0
|
|
$
|
5,420.0
|
|
$
|
5,680.0
|
|
||
|
Royalties earned
|
(351.8
|
)
|
(167.3
|
)
|
(338.5
|
)
|
|||||
|
Change in fair value
|
(2,608.2
|
)
|
57.3
|
|
78.5
|
|
|||||
|
Ending balance
|
$
|
2,350.0
|
|
$
|
5,310.0
|
|
$
|
5,420.0
|
|
||
Goodwill and Other Indefinite-Lived Intangible Assets
Goodwill represents amounts paid for an acquisition in excess of the fair value of net assets received. We test goodwill for impairment annually, or more frequently if changes in circumstances or the occurrence of events suggest an impairment exists. Effective in the year ended
December 31, 2016
, we changed our segment structure. In order to align the testing with our new segments, we performed our annual goodwill testing as of October 2, 2016 for both the new and old segment structures, the first day of the fourth quarter of the year ended
December 31, 2016
. The test for impairment requires us to make several estimates about fair value, most of which are based on projected future cash flows and market valuation multiples. The estimates associated with the goodwill impairment tests are considered critical due to the judgments required in determining fair value amounts, including projected future cash flows. Changes in these estimates may result in the recognition of an impairment loss.
In addition, because the fair values of the BCH-Belgium, BCH-ROW, and Animal Health Reporting Units were determined to be less than their respective net book values during the three months ended October 1, 2016 and December 31, 2016, respectively, these reporting units are inherently at risk for future impairments if they experience further deterioration in business performance or market multiples, or increases in discount rates. The reporting units had the following remaining goodwill balances as of December 31, 2016:
99
Perrigo Company plc
- Item 7
Critical Accounting Estimates
|
Reporting Unit
|
Goodwill Remaining in Reporting Unit
|
Segment
|
||||
|
Animal Health
|
$
|
178.9
|
|
CHCA
|
||
|
BCH-Belgium
|
$
|
63.2
|
|
CHCI
|
||
|
BCH-ROW
|
$
|
816.5
|
|
CHCI
|
||
The discounted cash flow forecasts used for these reporting units in goodwill impairment testing include assumptions about the expected future impacts of the reduced activity levels and the anticipated future recovery of activity levels in the longer-term. If the duration of the recovery is slower than expected, we may experience further deterioration in our cash flow forecasts that may indicate goodwill in the reporting units may be impaired in future impairment tests. We continue to monitor the progress and assess the reporting units for potential impairment should impairment indicators arise, as applicable, and at least annually during our fourth quarter impairment testing.
Certain trade names, trademarks, brands, as well as IPR&D assets, are determined to have an indefinite useful life and are not subject to amortization. We review them for impairment on an annual basis, or more frequently if events or changes in circumstances indicate that any individual asset might be impaired, and adjust the carrying value of the asset as necessary. IPR&D assets are initially recognized at fair value and classified as indefinite-lived assets until the successful completion or abandonment of the associated research and development efforts. We recorded
Impairment charges
on the Consolidated Statements of Operations related to Goodwill and indefinite-lived intangible assets of
$1.1 billion
and
$849.5 million
, respectively, for the
year ended
December 31, 2016
. We recorded
Impairment charges
on the Consolidated Statements of Operations related to indefinite-lived intangible assets of
$185.1 million
for the
year ended
December 31, 2015
. As of December 31, 2016, the remaining goodwill and indefinite-lived asset balances are
$4.0 billion
and
$114.5 million
, respectively. See
Item 8. Note 3
and
Note 6
for additional information regarding goodwill and indefinite-lived intangible asset impairment testing results and assumptions used.
Definite-Lived Intangible Assets
Definite-lived intangible assets consist of a portfolio of developed product technology/formulation and product rights, distribution and license agreements, customer relationships, non-compete agreements, and certain trademarks, trade names, and brands. The assets are amortized on either a straight-line basis or proportionately to the benefits derived from those relationships or agreements.
For intangible assets subject to amortization, an impairment analysis is performed whenever events or changes in circumstances indicate that the carrying amount of any individual asset may not be recoverable. The carrying amount of an intangible asset is not recoverable if it exceeds the sum of the undiscounted cash flows expected to result from the use and eventual disposition of the asset. An impairment loss is recognized if the carrying amount of the asset is not recoverable and its carrying amount exceeds its fair value. We recorded
Impairment charges
on the Consolidated Statements of Operations related to definite-lived intangible assets of
$665.6 million
during the year ended
December 31, 2016
. To the extent we experience additional unanticipated competitive market entrants or major adverse macro-economic events, we may incur additional impairment losses.
See
Item 8. Note 3
and
Note 6
for a more detailed discussion of the impaired definite-lived intangible assets and assumptions used.
Assets Held for Sale
We classify assets as "held for sale" when management approves and commits to a formal plan of sale with the expectation the sale will be completed within one year. The net assets of the business held for sale are then recorded at the lower of their current carrying value and the fair market value, less costs to sell. See
Item 8. Note 9
for further information on our assets held for sale.
Recently Issued Accounting Standards
See
Item 8. Note 1
for information regarding recently issued accounting standards.
100
Perrigo Company plc
- Item 7A
|
ITEM 7A.
|
QUANTITATIVE AND QUALITATIVE DISCLOSURES ABOUT MARKET RISK
|
Foreign Exchange Risk
We are a global company with operations throughout North America, Europe, Australia, Mexico, and Israel. We transact business in each location's local currency and in foreign currencies, thereby creating exposures to changes in exchange rates. Our largest exposure is the movement of the U.S. dollar relative to the euro, which has increased due to the Omega acquisition. In addition, our U.S. operations continue to expand their export business, primarily in Canada, China, and Europe, and are subject to fluctuations in the respective exchange rates relative to the U.S. dollar. A large portion of the sales of our Israeli operations is in foreign currencies, primarily U.S. dollars and euros, while these operations largely incur costs in their local currency. Further, a portion of Biogen's global sales of Tysabri
®
are denominated in local currencies creating exposures to changes in exchange rates relative to the U.S. dollar and thereby impacting the amount of U.S. dollar royalties we receive.
Due to different sales and cost structures, certain segments experience a negative impact and certain segments a positive impact as a result of changes in exchange rates. We estimate the translation effect of a ten percent devaluation of the U.S. dollar relative to the other foreign currencies in which we transact business would have increased operating income of our non-U.S. operating units by approximately
$29.1 million
for the
year ended
December 31, 2016
. This sensitivity analysis has inherent limitations. The analysis disregards the possibility that rates of multiple foreign currencies will not always move in the same direction relative to the value of the U.S. dollar over time and does not account for foreign exchange derivatives that we utilize to mitigate fluctuations in exchange rates.
In addition, we enter into certain purchase commitments for materials that, although denominated in U.S. dollars, are linked to foreign currency valuations. These commitments generally contain a range for which the price of materials may fluctuate over time given the value of a foreign currency.
The translation of the assets and liabilities of our non-U.S. dollar denominated operations is made using local currency exchange rates as of the end of the year. Translation adjustments are not included in determining net income but are disclosed in Accumulated Other Comprehensive Income ("AOCI") within shareholders’ equity on the Consolidated Balance Sheets until a sale or substantially complete liquidation of the net investment in the subsidiary takes place. In certain markets, we could recognize a significant gain or loss related to unrealized cumulative translation adjustments if we were to exit the market and liquidate our net investment. As of
December 31, 2016
, cumulative net currency translation adjustments decreased shareholders’ equity by
$67.9 million
.
We monitor and strive to manage risk related to foreign currency exchange rates. Exposures that cannot be
naturally offset within a local entity to an immaterial amount are often hedged with foreign exchange derivatives or netted with offsetting exposures at other entities. See
Item 8. Note 8
for further information regarding our derivative and hedging activities. We cannot predict future changes in foreign currency movements and fluctuations could materially impact earnings.
Interest Rate Risk
We are exposed to interest rate changes primarily as a result of interest income earned on our investment of cash on hand and interest expense on borrowings used to finance acquisitions and working capital requirements.
We have in the past, and may in the future, enter into certain derivative financial instruments related to the management of interest rate risk, when available on a cost-effective basis. See
Item 8. Note 8
for further information regarding our derivative and hedging activities. These instruments are managed on a consolidated basis to efficiently net exposures and thus take advantage of any natural offsets. We do not use derivative financial instruments for speculative purposes. Gains and losses on hedging transactions are offset by gains and losses on the underlying exposures being hedged.
101
Perrigo Company plc
- Item 8
|
ITEM 8.
|
FINANCIAL STATEMENTS AND SUPPLEMENTARY DATA
|
|
INDEX TO CONSOLIDATED FINANCIAL STATEMENTS
|
PAGE NO.
|
|
|
1
|
||
|
2
|
||
|
3
|
||
|
4
|
||
|
5
|
||
|
6
|
||
|
7
|
||
|
8
|
||
|
9
|
||
|
10
|
||
|
11
|
||
|
12
|
||
|
13
|
||
|
14
|
||
|
15
|
||
|
16
|
||
|
17
|
||
|
18
|
||
|
19
|
||
|
20
|
||
|
21
|
||
|
22
|
||
102
Perrigo Company plc
- Item 8
Report of Independent Registered Public Accounting Firm
Board of Directors and Shareholders
Perrigo Company plc
We have audited the accompanying consolidated balance sheets of Perrigo Company plc as of December 31, 2016, December 31, 2015 and June 27, 2015, and the related consolidated statements of operations, comprehensive income (loss), shareholders' equity and cash flows for the year ended December 31, 2016, the period from June 28, 2015 to December 31, 2015, and each of the two fiscal years in the period ended June 27, 2015. Our audits also included the financial statement schedule listed in Item 15(a). These financial statements and schedule are the responsibility of the Company's management. Our responsibility is to express an opinion on these financial statements and schedule based on our audits.
We conducted our audits in accordance with the standards of the Public Company Accounting Oversight Board (United States). Those standards require that we plan and perform the audit to obtain reasonable assurance about whether the financial statements are free of material misstatement. An audit includes examining, on a test basis, evidence supporting the amounts and disclosures in the financial statements. An audit also includes assessing the accounting principles used and significant estimates made by management, as well as evaluating the overall financial statement presentation. We believe that our audits provide a reasonable basis for our opinion.
In our opinion, the financial statements referred to above present fairly, in all material respects, the consolidated financial position of Perrigo Company plc at December 31, 2016, December 31, 2015 and June 27, 2015, and the consolidated results of its operations and its cash flows for each of the year ended December 31, 2016, the period from June 28, 2015 to December 31, 2015, and each of the two fiscal years in the period ended June 27, 2015, in conformity with U.S. generally accepted accounting principles. Also, in our opinion, the financial statement schedule, when considered in relation to the basic financial statements taken as a whole, presents fairly in all material respects the information set forth therein.
As discussed in
Note 1
to the consolidated financial statements, the financial statements for the period from June 28, 2015 to December 31, 2015, and financial statements for the years ended June 27, 2015 and June 28, 2014 have been restated to reflect (1) corrections related to the accounting for an acquired contingent payment , (2) corrections related to goodwill and deferred tax liabilities associated with acquired intangible assets and (3) other individually insignificant adjustments for previously identified uncorrected misstatements.
We also have audited, in accordance with the standards of the Public Company Accounting Oversight Board (United States), Perrigo Company plc’s internal control over financial reporting as of December 31, 2016, based on criteria established in Internal Control-Integrated Framework issued by the Committee of Sponsoring Organizations of the Treadway Commission (2013 framework), and our report dated May 22, 2017 expressed an adverse opinion thereon.
/s/ Ernst & Young LLP
Grand Rapids, Michigan
May 22, 2017
103
Perrigo Company plc
- Item 8
PERRIGO COMPANY PLC
(in millions, except per share amounts)
|
|
Year Ended
|
Six Months Ended
|
Year Ended
|
||||||||||||
|
|
December 31, 2016
|
December 31,
2015 |
June 27,
2015 |
June 28,
2014 |
|||||||||||
|
Restated
|
Restated
|
Restated
|
|||||||||||||
|
Net sales
|
$
|
5,280.6
|
|
$
|
2,632.2
|
|
$
|
4,227.1
|
|
$
|
3,914.1
|
|
|||
|
Cost of sales
|
3,228.8
|
|
1,553.3
|
|
2,582.9
|
|
2,462.0
|
|
|||||||
|
Gross profit
|
2,051.8
|
|
1,078.9
|
|
1,644.2
|
|
1,452.1
|
|
|||||||
|
Operating expenses
|
|||||||||||||||
|
Distribution
|
88.3
|
|
47.9
|
|
67.7
|
|
55.3
|
|
|||||||
|
Research and development
|
184.0
|
|
88.2
|
|
187.8
|
|
152.5
|
|
|||||||
|
Selling
|
665.0
|
|
325.9
|
|
319.0
|
|
208.6
|
|
|||||||
|
Administration
|
452.2
|
|
306.8
|
|
385.3
|
|
411.3
|
|
|||||||
|
Impairment charges
|
2,631.0
|
|
215.6
|
|
6.8
|
|
6.0
|
|
|||||||
|
Restructuring
|
31.0
|
|
26.9
|
|
5.1
|
|
47.0
|
|
|||||||
|
Total operating expenses
|
4,051.5
|
|
1,011.3
|
|
971.7
|
|
880.7
|
|
|||||||
|
Operating income (loss)
|
(1,999.7
|
)
|
67.6
|
|
672.5
|
|
571.4
|
|
|||||||
|
Tysabri
®
royalty stream - change in fair value
|
2,608.2
|
|
(57.3
|
)
|
(78.5
|
)
|
(26.6
|
)
|
|||||||
|
Interest expense, net
|
216.6
|
|
89.9
|
|
146.0
|
|
103.5
|
|
|||||||
|
Other expense, net
|
22.7
|
|
25.2
|
|
334.2
|
|
25.1
|
|
|||||||
|
Loss on extinguishment of debt
|
1.1
|
|
0.9
|
|
10.5
|
|
165.8
|
|
|||||||
|
Income (loss) before income taxes
|
(4,848.3
|
)
|
8.9
|
|
260.3
|
|
303.6
|
|
|||||||
|
Income tax expense (benefit)
|
(835.5
|
)
|
(33.6
|
)
|
124.2
|
|
70.8
|
|
|||||||
|
Net income (loss)
|
$
|
(4,012.8
|
)
|
$
|
42.5
|
|
$
|
136.1
|
|
$
|
232.8
|
|
|||
|
Income (loss) per share
|
|||||||||||||||
|
Basic
|
$
|
(28.01
|
)
|
$
|
0.29
|
|
$
|
0.97
|
|
$
|
2.02
|
|
|||
|
Diluted
|
$
|
(28.01
|
)
|
$
|
0.29
|
|
$
|
0.97
|
|
$
|
2.01
|
|
|||
|
Weighted-average shares outstanding
|
|||||||||||||||
|
Basic
|
143.3
|
|
145.6
|
|
139.3
|
|
115.1
|
|
|||||||
|
Diluted
|
143.3
|
|
146.1
|
|
139.8
|
|
115.6
|
|
|||||||
|
Dividends declared per share
|
$
|
0.58
|
|
$
|
0.25
|
|
$
|
0.46
|
|
$
|
0.39
|
|
|||
See accompanying Notes to the Consolidated Financial Statements.
104
Perrigo Company plc
- Item 8
PERRIGO COMPANY PLC
CONSOLIDATED STATEMENTS OF COMPREHENSIVE INCOME (LOSS)
(in millions)
|
Year Ended
|
Six Months Ended
|
Year Ended
|
|||||||||||||
|
December 31, 2016
|
December 31,
2015 |
June 27,
2015 |
June 28,
2014 |
||||||||||||
|
Restated
|
Restated
|
Restated
|
|||||||||||||
|
Net income (loss)
|
$
|
(4,012.8
|
)
|
$
|
42.5
|
|
$
|
136.1
|
|
$
|
232.8
|
|
|||
|
Other comprehensive income (loss):
|
|||||||||||||||
|
Foreign currency translation adjustments
|
(63.3
|
)
|
(135.5
|
)
|
(33.5
|
)
|
83.8
|
|
|||||||
|
Change in fair value of derivative financial instruments
(1)
|
(5.3
|
)
|
2.1
|
|
(0.2
|
)
|
(11.6
|
)
|
|||||||
|
Change in fair value of investment securities
(2)
|
8.7
|
|
9.3
|
|
(5.3
|
)
|
2.4
|
|
|||||||
|
Change in post-retirement and pension liability
(3)
|
(6.6
|
)
|
5.3
|
|
2.9
|
|
(12.0
|
)
|
|||||||
|
Other comprehensive income (loss), net of tax
|
(66.5
|
)
|
(118.8
|
)
|
(36.1
|
)
|
62.6
|
|
|||||||
|
Comprehensive income (loss)
|
$
|
(4,079.3
|
)
|
$
|
(76.3
|
)
|
$
|
100.0
|
|
$
|
295.4
|
|
|||
|
(1)
|
Includes tax effect of
$2.1 million
,
$0.4 million
,
$5.7 million
and
$(1.2) million
for the
year ended
December 31, 2016
, the
six months ended
December 31, 2015
, and the
years ended
June 27, 2015
, and
June 28, 2014
, respectively.
|
|
(2)
|
Includes tax effect of
$4.1 million
,
$3.6 million
,
$2.7 million
and
$1.2 million
for the
year ended
December 31, 2016
, the
six months ended
December 31, 2015
, and the
years ended
June 27, 2015
, and
June 28, 2014
, respectively.
|
|
(3)
|
Includes tax effect of
$2.5 million
,
$2.8 million
,
$0.6 million
and
$0.0 million
for the
year ended
December 31, 2016
, the
six months ended
December 31, 2015
, and the
years ended
June 27, 2015
, and
June 28, 2014
, respectively.
|
See accompanying Notes to the Consolidated Financial Statements.
105
Perrigo Company plc
- Item 8
PERRIGO COMPANY PLC
(in millions
)
|
December 31,
2016 |
December 31,
2015 |
June 27,
2015 |
|||||||||
|
Restated
|
Restated
|
||||||||||
|
Assets
|
|||||||||||
|
Cash and cash equivalents
|
$
|
622.3
|
|
$
|
417.8
|
|
$
|
785.6
|
|
||
|
Accounts receivable, net of allowance for doubtful accounts of $6.3 million, $4.5 million, and $2.6 million, respectively
|
1,176.0
|
|
1,189.0
|
|
1,209.4
|
|
|||||
|
Inventories
|
795.0
|
|
898.7
|
|
935.7
|
|
|||||
|
Current deferred income taxes
|
—
|
|
—
|
|
148.2
|
|
|||||
|
Prepaid expenses and other current assets
|
212.0
|
|
286.1
|
|
150.1
|
|
|||||
|
Total current assets
|
2,805.3
|
|
2,791.6
|
|
3,229.0
|
|
|||||
|
Property, plant and equipment, net
|
870.1
|
|
886.2
|
|
932.4
|
|
|||||
|
Tysabri
®
royalty stream - at fair value
|
2,350.0
|
|
5,310.0
|
|
5,420.0
|
|
|||||
|
Goodwill and other indefinite-lived intangible assets
|
4,163.9
|
|
7,069.0
|
|
6,984.3
|
|
|||||
|
Other intangible assets, net
|
3,396.8
|
|
2,973.1
|
|
2,742.8
|
|
|||||
|
Non-current deferred income taxes
|
72.1
|
|
71.4
|
|
50.1
|
|
|||||
|
Other non-current assets
|
211.9
|
|
248.3
|
|
233.3
|
|
|||||
|
Total non-current assets
|
11,064.8
|
|
16,558.0
|
|
16,362.9
|
|
|||||
|
Total assets
|
$
|
13,870.1
|
|
$
|
19,349.6
|
|
$
|
19,591.9
|
|
||
|
Liabilities and Shareholders’ Equity
|
|||||||||||
|
Accounts payable
|
$
|
471.7
|
|
$
|
555.8
|
|
$
|
709.3
|
|
||
|
Payroll and related taxes
|
115.8
|
|
125.3
|
|
133.9
|
|
|||||
|
Accrued customer programs
|
380.3
|
|
396.0
|
|
358.5
|
|
|||||
|
Accrued liabilities
|
263.3
|
|
351.9
|
|
257.5
|
|
|||||
|
Accrued income taxes
|
32.4
|
|
62.7
|
|
56.3
|
|
|||||
|
Current deferred income taxes
|
—
|
|
—
|
|
79.7
|
|
|||||
|
Current indebtedness
|
572.8
|
|
1,060.5
|
|
153.3
|
|
|||||
|
Total current liabilities
|
1,836.3
|
|
2,552.2
|
|
1,748.5
|
|
|||||
|
Long-term debt, less current portion
|
5,224.5
|
|
4,971.6
|
|
5,246.9
|
|
|||||
|
Non-current deferred income taxes
|
389.9
|
|
1,372.7
|
|
1,514.3
|
|
|||||
|
Other non-current liabilities
|
461.8
|
|
346.3
|
|
382.7
|
|
|||||
|
Total non-current liabilities
|
6,076.2
|
|
6,690.6
|
|
7,143.9
|
|
|||||
|
Total liabilities
|
7,912.5
|
|
9,242.8
|
|
8,892.4
|
|
|||||
|
Commitments and contingencies - Note 16
|
|||||||||||
|
Shareholders’ equity
|
|||||||||||
|
Controlling interest:
|
|||||||||||
|
Preferred shares, $0.0001 par value, 10 million shares authorized
|
—
|
|
—
|
|
—
|
|
|||||
|
Ordinary shares, €0.001 par value, 10 billion shares authorized
|
8,135.0
|
|
8,142.6
|
|
8,621.9
|
|
|||||
|
Accumulated other comprehensive income (loss)
|
(81.8
|
)
|
(15.3
|
)
|
103.5
|
|
|||||
|
Retained earnings (accumulated deficit)
|
(2,095.1
|
)
|
1,980.1
|
|
1,973.9
|
|
|||||
|
Total controlling interest
|
5,958.1
|
|
10,107.4
|
|
10,699.3
|
|
|||||
|
Noncontrolling interest
|
(0.5
|
)
|
(0.6
|
)
|
0.2
|
|
|||||
|
Total shareholders’ equity
|
5,957.6
|
|
10,106.8
|
|
10,699.5
|
|
|||||
|
Total liabilities and shareholders' equity
|
$
|
13,870.1
|
|
$
|
19,349.6
|
|
$
|
19,591.9
|
|
||
|
Supplemental Disclosures of Balance Sheet Information
|
|||||||||||
|
Preferred shares, issued and outstanding
|
—
|
|
—
|
|
—
|
|
|||||
|
Ordinary shares, issued and outstanding
|
143.4
|
|
143.1
|
|
146.3
|
|
|||||
See accompanying Notes to the Consolidated Financial Statements.
106
Perrigo Company plc
- Item 8
PERRIGO COMPANY PLC
(in millions)
|
|
Year Ended
|
Six Months Ended
|
Year Ended
|
||||||||||||
|
|
December 31,
2016 |
December 31,
2015 |
|
June 27,
2015 |
|
June 28,
2014 |
|||||||||
|
Restated
|
Restated
|
Restated
|
|||||||||||||
|
Cash Flows From (For) Operating Activities
|
|
|
|
|
|||||||||||
|
Net income (loss)
|
$
|
(4,012.8
|
)
|
$
|
42.5
|
|
|
$
|
136.1
|
|
|
$
|
232.8
|
|
|
|
Adjustments to derive cash flows
|
|
|
|
|
|||||||||||
|
Depreciation and amortization
|
457.0
|
|
182.4
|
|
|
258.7
|
|
|
206.1
|
|
|||||
|
Loss on acquisition-related foreign currency derivatives
|
—
|
|
—
|
|
326.4
|
|
—
|
|
|||||||
|
Share-based compensation
|
23.0
|
|
22.8
|
|
|
31.6
|
|
|
24.6
|
|
|||||
|
Impairment charges
|
2,631.0
|
|
215.6
|
|
6.8
|
|
6.0
|
|
|||||||
|
Tysabri
®
royalty stream - change in fair value
|
2,608.2
|
|
(57.3
|
)
|
(78.5
|
)
|
(26.6
|
)
|
|||||||
|
Loss on extinguishment of debt
|
1.1
|
|
0.9
|
|
|
10.5
|
|
|
165.8
|
|
|||||
|
Restructuring charges
|
31.0
|
|
26.9
|
|
|
5.1
|
|
|
47.0
|
|
|||||
|
Deferred income taxes
|
(990.9
|
)
|
(120.0
|
)
|
|
(16.3
|
)
|
|
(49.7
|
)
|
|||||
|
Amortization of financing fees and debt discount (premium)
|
(24.7
|
)
|
(10.2
|
)
|
0.2
|
|
2.0
|
|
|||||||
|
Other non-cash adjustments
|
33.5
|
|
18.1
|
|
10.2
|
|
4.5
|
|
|||||||
|
Subtotal
|
756.4
|
|
321.7
|
|
|
690.8
|
|
|
612.5
|
|
|||||
|
Increase (decrease) in cash due to:
|
|
|
|
|
|||||||||||
|
Accounts receivable
|
(0.6
|
)
|
52.5
|
|
|
(51.1
|
)
|
|
(140.5
|
)
|
|||||
|
Inventories
|
100.7
|
|
(29.6
|
)
|
|
(11.4
|
)
|
|
84.7
|
|
|||||
|
Accounts payable
|
(75.7
|
)
|
(194.1
|
)
|
|
120.5
|
|
|
(24.9
|
)
|
|||||
|
Payroll and related taxes
|
(41.1
|
)
|
(38.2
|
)
|
|
(30.2
|
)
|
|
(55.5
|
)
|
|||||
|
Accrued customer programs
|
(13.9
|
)
|
34.4
|
|
|
71.3
|
|
|
113.1
|
|
|||||
|
Accrued liabilities
|
(79.5
|
)
|
108.1
|
|
|
42.8
|
|
|
23.0
|
|
|||||
|
Accrued income taxes
|
20.9
|
|
(56.8
|
)
|
|
21.9
|
|
|
(11.3
|
)
|
|||||
|
Other
|
(12.3
|
)
|
2.9
|
|
|
0.6
|
|
|
31.9
|
|
|||||
|
Subtotal
|
(101.5
|
)
|
(120.8
|
)
|
|
164.4
|
|
|
20.5
|
|
|||||
|
Net cash from (for) operating activities
|
654.9
|
|
200.9
|
|
|
855.2
|
|
|
633.0
|
|
|||||
|
Cash Flows From (For) Investing Activities
|
|
|
|
|
|||||||||||
|
Proceeds from royalty rights
|
353.7
|
|
166.3
|
|
344.6
|
|
60.5
|
|
|||||||
|
Acquisitions of businesses, net of cash acquired
|
(427.4
|
)
|
(791.6
|
)
|
|
(2,177.8
|
)
|
|
(1,605.8
|
)
|
|||||
|
Asset acquisitions
|
(65.1
|
)
|
—
|
|
(4.0
|
)
|
—
|
|
|||||||
|
Settlement of acquisition-related foreign currency derivatives
|
—
|
|
(1.3
|
)
|
(329.9
|
)
|
—
|
|
|||||||
|
Proceeds from sale of securities
|
4.5
|
|
—
|
|
|
—
|
|
|
81.4
|
|
|||||
|
Additions to property, plant and equipment
|
(106.2
|
)
|
(77.8
|
)
|
|
(137.0
|
)
|
|
(171.6
|
)
|
|||||
|
Proceeds from sale of business
|
69.1
|
|
—
|
|
|
—
|
|
|
—
|
|
|||||
|
Other investing
|
(3.6
|
)
|
(3.7
|
)
|
1.8
|
|
(8.8
|
)
|
|||||||
|
Net cash from (for) investing activities
|
(175.0
|
)
|
(708.1
|
)
|
|
(2,302.3
|
)
|
|
(1,644.3
|
)
|
|||||
|
Cash Flows From (For) Financing Activities
|
|
|
|
|
|||||||||||
|
Borrowings (repayments) of revolving credit agreements and other financing, net
|
(802.5
|
)
|
718.0
|
|
|
(54.0
|
)
|
|
(3.0
|
)
|
|||||
|
Issuances of long-term debt
|
1,190.3
|
|
—
|
|
|
2,504.3
|
|
|
3,293.6
|
|
|||||
|
Payments on long-term debt
|
(559.2
|
)
|
(28.3
|
)
|
|
(1,823.5
|
)
|
|
(2,035.0
|
)
|
|||||
|
Premium on early debt retirement
|
(0.6
|
)
|
—
|
|
|
—
|
|
|
(133.5
|
)
|
|||||
|
Deferred financing fees
|
(2.8
|
)
|
(0.3
|
)
|
|
(28.1
|
)
|
|
(48.8
|
)
|
|||||
|
Issuance of ordinary shares
|
8.3
|
|
4.9
|
|
|
1,043.5
|
|
|
9.8
|
|
|||||
|
Equity issuance costs
|
(10.3
|
)
|
—
|
|
|
(35.7
|
)
|
|
—
|
|
|||||
|
Repurchase of ordinary shares
|
—
|
|
(500.0
|
)
|
—
|
|
—
|
|
|||||||
|
Cash dividends
|
(83.2
|
)
|
(36.3
|
)
|
|
(64.8
|
)
|
|
(46.1
|
)
|
|||||
|
Other financing
|
(8.7
|
)
|
(8.4
|
)
|
(19.3
|
)
|
(9.0
|
)
|
|||||||
|
Net cash from (for) financing activities
|
(268.7
|
)
|
149.6
|
|
|
1,522.4
|
|
|
1,028.0
|
|
|||||
|
Effect of exchange rate changes on cash and cash equivalents
|
(6.7
|
)
|
(10.2
|
)
|
|
(89.2
|
)
|
|
2.9
|
|
|||||
|
Net increase (decrease) in cash and cash equivalents
|
204.5
|
|
(367.8
|
)
|
|
(13.9
|
)
|
|
19.6
|
|
|||||
|
Cash and cash equivalents, beginning of period
|
417.8
|
|
785.6
|
|
|
799.5
|
|
|
779.9
|
|
|||||
|
Cash and cash equivalents, end of period
|
$
|
622.3
|
|
$
|
417.8
|
|
|
$
|
785.6
|
|
|
$
|
799.5
|
|
|
107
Perrigo Company plc
- Item 8
|
Year Ended
|
Six Months Ended
|
Year Ended
|
|||||||||||||
|
December 31,
2016 |
December 31,
2015 |
June 27,
2015 |
June 28,
2014 |
||||||||||||
|
Supplemental Disclosures of Cash Flow Information
|
|||||||||||||||
|
Cash paid/received during the year for:
|
|||||||||||||||
|
Interest paid
|
$
|
205.1
|
|
$
|
84.2
|
|
$
|
143.2
|
|
$
|
98.4
|
|
|||
|
Interest received
|
$
|
1.2
|
|
$
|
0.7
|
|
$
|
1.1
|
|
$
|
2.4
|
|
|||
|
Income taxes paid
|
$
|
139.5
|
|
$
|
87.8
|
|
$
|
131.0
|
|
$
|
93.2
|
|
|||
|
Income taxes refunded
|
$
|
9.3
|
|
$
|
1.7
|
|
$
|
9.6
|
|
$
|
4.3
|
|
|||
See accompanying Notes to the Consolidated Financial Statements.
108
Perrigo Company plc
- Item 8
PERRIGO COMPANY PLC
CONSOLIDATED STATEMENTS OF SHAREHOLDERS’ EQUITY
(in millions, except per share amounts)
|
|
Ordinary Shares
Issued |
Accumulated
Other Comprehensive Income |
Retained
Earnings (Accumulated Deficit) |
Total
|
||||||||||||||
|
|
Shares
|
Amount
|
||||||||||||||||
|
Balance at June 29, 2013
|
94.1
|
|
$
|
538.5
|
|
$
|
77.0
|
|
$
|
1,715.9
|
|
$
|
2,331.4
|
|
||||
|
|
|
|||||||||||||||||
|
Net income (restated)
|
—
|
|
—
|
|
—
|
|
232.8
|
|
232.8
|
|
||||||||
|
Other comprehensive income (restated)
|
—
|
|
—
|
|
62.6
|
|
—
|
|
62.6
|
|
||||||||
|
Issuance of common stock under:
|
||||||||||||||||||
|
Elan acquisition
|
39.4
|
|
6,117.2
|
|
—
|
|
—
|
|
6,117.2
|
|
||||||||
|
Stock options
|
0.2
|
|
9.8
|
|
—
|
|
—
|
|
9.8
|
|
||||||||
|
Restricted stock plan
|
0.2
|
|
—
|
|
—
|
|
—
|
|
—
|
|
||||||||
|
Compensation for stock options
|
—
|
|
6.5
|
|
—
|
|
—
|
|
6.5
|
|
||||||||
|
Compensation for restricted stock
|
—
|
|
18.1
|
|
—
|
|
—
|
|
18.1
|
|
||||||||
|
Cash dividends, $0.39 per share
|
—
|
|
—
|
|
—
|
|
(46.1
|
)
|
(46.1
|
)
|
||||||||
|
Tax effect from stock transactions
|
—
|
|
8.2
|
|
—
|
|
—
|
|
8.2
|
|
||||||||
|
Shares withheld for payment employee's withholding tax liability
|
(0.1
|
)
|
(7.5
|
)
|
—
|
|
—
|
|
(7.5
|
)
|
||||||||
|
Registration of ordinary shares
|
—
|
|
(5.4
|
)
|
—
|
|
—
|
|
(5.4
|
)
|
||||||||
|
Purchase of noncontrolling interest
|
—
|
|
(7.2
|
)
|
—
|
|
—
|
|
(7.2
|
)
|
||||||||
|
Balance at June 28, 2014 (restated)
|
133.8
|
|
6,678.2
|
|
139.6
|
|
1,902.6
|
|
8,720.4
|
|
||||||||
|
|
|
|
|
|
|
|
||||||||||||
|
Net income (restated)
|
—
|
|
—
|
|
—
|
|
136.1
|
|
136.1
|
|
||||||||
|
Other comprehensive loss (restated)
|
—
|
|
—
|
|
(36.1
|
)
|
—
|
|
(36.1
|
)
|
||||||||
|
Issuance of ordinary shares under:
|
||||||||||||||||||
|
Equity offering
|
6.8
|
|
|
1,035.0
|
|
|
—
|
|
|
—
|
|
|
1,035.0
|
|
||||
|
Omega acquisition
|
5.4
|
|
904.9
|
|
—
|
|
—
|
|
904.9
|
|
||||||||
|
Stock options
|
0.2
|
|
8.5
|
|
—
|
|
—
|
|
8.5
|
|
||||||||
|
Restricted stock plan
|
0.2
|
|
—
|
|
—
|
|
—
|
|
—
|
|
||||||||
|
Compensation for stock options
|
—
|
|
6.9
|
|
—
|
|
—
|
|
6.9
|
|
||||||||
|
Compensation for restricted stock
|
—
|
|
24.7
|
|
—
|
|
—
|
|
24.7
|
|
||||||||
|
Cash dividends, $0.46 per share
|
—
|
|
—
|
|
—
|
|
(64.8
|
)
|
(64.8
|
)
|
||||||||
|
Tax effect from stock transactions
|
—
|
|
7.0
|
|
—
|
|
—
|
|
7.0
|
|
||||||||
|
Shares withheld for payment of employee's withholding tax liability
|
(0.1
|
)
|
(7.6
|
)
|
—
|
|
—
|
|
(7.6
|
)
|
||||||||
|
Equity issuance costs
|
—
|
|
|
(35.7
|
)
|
|
—
|
|
|
—
|
|
|
(35.7
|
)
|
||||
|
Balance at June 27, 2015 (restated)
|
146.3
|
|
8,621.9
|
|
103.5
|
|
1,973.9
|
|
10,699.3
|
|
||||||||
|
Net income (restated)
|
—
|
|
—
|
|
—
|
|
42.5
|
|
42.5
|
|
||||||||
|
Other comprehensive loss (restated)
|
—
|
|
—
|
|
(118.8
|
)
|
—
|
|
(118.8
|
)
|
||||||||
|
Issuance of ordinary shares under:
|
||||||||||||||||||
|
Stock options
|
0.1
|
|
4.9
|
|
—
|
|
—
|
|
4.9
|
|
||||||||
|
Restricted stock plan
|
0.1
|
|
—
|
|
—
|
|
—
|
|
—
|
|
||||||||
|
Compensation for stock options
|
—
|
|
2.5
|
|
—
|
|
—
|
|
2.5
|
|
||||||||
|
Compensation for restricted stock (restated)
|
—
|
|
20.3
|
|
—
|
|
—
|
|
20.3
|
|
||||||||
|
Cash dividends, $0.25 per share
|
—
|
|
—
|
|
—
|
|
(36.3
|
)
|
(36.3
|
)
|
||||||||
|
Tax effect from stock transactions
|
—
|
|
3.3
|
|
—
|
|
—
|
|
3.3
|
|
||||||||
|
Shares withheld for payment of employee's withholding tax liability
|
(0.1
|
)
|
(10.3
|
)
|
—
|
|
—
|
|
(10.3
|
)
|
||||||||
|
Repurchases of ordinary shares
|
(3.3
|
)
|
(500.0
|
)
|
—
|
|
—
|
|
(500.0
|
)
|
||||||||
|
Balance at December 31, 2015 (restated)
|
143.1
|
|
8,142.6
|
|
(15.3
|
)
|
1,980.1
|
|
10,107.4
|
|
||||||||
|
Net loss
|
—
|
|
—
|
|
—
|
|
(4,012.8
|
)
|
(4,012.8
|
)
|
||||||||
|
Other comprehensive loss
|
—
|
|
—
|
|
(66.5
|
)
|
—
|
|
(66.5
|
)
|
||||||||
|
Stock options
|
0.2
|
|
8.3
|
|
—
|
|
—
|
|
8.3
|
|
||||||||
109
Perrigo Company plc
- Item 8
|
|
Ordinary Shares
Issued |
Accumulated
Other Comprehensive Income |
Retained
Earnings (Accumulated Deficit) |
Total
|
||||||||||||||
|
|
Shares
|
Amount
|
||||||||||||||||
|
Restricted stock plan
|
0.2
|
|
—
|
|
—
|
|
—
|
|
—
|
|
||||||||
|
Compensation for stock options
|
—
|
|
5.0
|
|
—
|
|
—
|
|
5.0
|
|
||||||||
|
Compensation for restricted stock
|
—
|
|
18.0
|
|
—
|
|
—
|
|
18.0
|
|
||||||||
|
Cash dividends, $0.58 per share
|
—
|
|
(20.8
|
)
|
—
|
|
(62.4
|
)
|
(83.2
|
)
|
||||||||
|
Tax effect from stock transactions
|
—
|
|
(1.5
|
)
|
—
|
|
—
|
|
(1.5
|
)
|
||||||||
|
Shares withheld for payment of employee's
withholding tax liability |
(0.1
|
)
|
(6.3
|
)
|
—
|
|
—
|
|
(6.3
|
)
|
||||||||
|
Equity issuance costs
|
—
|
|
(10.3
|
)
|
—
|
|
—
|
|
(10.3
|
)
|
||||||||
|
Balance at December 31, 2016
|
143.4
|
|
$
|
8,135.0
|
|
$
|
(81.8
|
)
|
$
|
(2,095.1
|
)
|
$
|
5,958.1
|
|
||||
See accompanying Notes to the Consolidated Financial Statements.
110
Perrigo Company plc
- Item 8
Note 1
NOTE 1 -
SUMMARY OF SIGNIFICANT ACCOUNTING POLICIES
General Information
The Company
Perrigo Company plc was incorporated under the laws of Ireland on June 28, 2013 and became the successor registrant of Perrigo Company, a Michigan corporation, on December 18, 2013 in connection with the acquisition of Elan Corporation, plc ("Elan"). Unless the context requires otherwise, the terms "Perrigo," the "Company," "we," "our," "us," and similar pronouns used herein refer to Perrigo Company plc, its subsidiaries, and all predecessors of Perrigo Company plc and its subsidiaries. We are a leading global over-the-counter ("OTC") consumer goods and pharmaceutical company, offering patients and customers high quality products at affordable prices. From our beginning in 1887 as a packager of home remedies, we have grown to become the world's largest manufacturer of OTC healthcare products and supplier of infant formulas for the store brand market. We are also a leading provider of generic standard topical products such as creams, lotions, and gels, as well as inhalants and injections ("extended topical") prescription products in the U.S. We also received royalties from sales of the multiple sclerosis drug Tysabri
®
but divested our rights to those royalties in March 2017. We provide “Quality Affordable Healthcare Products
®
” across a wide variety of product categories and geographies, primarily in North America, Europe, and Australia, as well as in other markets, including Israel, China, and Latin America.
Basis of Presentation
Our fiscal year previously consisted of a 52- or 53-week year ending on or around June 30 of each year with each quarter ending on the Saturday closest to each calendar quarter end. Beginning on January 1, 2016, we changed our fiscal year to begin on January 1 and end on December 31 of each year. As a result of our change in year end, this report on Form 10-K discloses the results of our operations for the twelve-month period from January 1, 2016 through December 31, 2016. The six months ended December 31, 2015 reflects our financial results from June 28, 2015 through December 31, 2015, and the six months ended December 27, 2014 reflects our financial results from June 29, 2014 through December 27, 2014. The year ended June 27, 2015 reflects our financial results for the twelve-month period from June 29, 2014 to June 27, 2015, and the year ended June 28, 2014 reflects our financial results for the twelve-month period from June 30, 2013 to June 28, 2014. Calendar-year data for 2015 was derived from our audited results for the six-month period ended December 31, 2015 and unaudited results for the fiscal quarters ended March 28, 2015 and June 27, 2015. We cut off our quarterly accounting periods on the Saturday closest to the end of the calendar quarter, with the fourth quarter ending on December 31 of each year.
Segment Reporting
During the quarter ended December 31, 2016, we changed our reporting segments to better align with our new organizational structure. These organizational changes were made to optimize our structure to better serve our customers and to reflect the way in which our chief operating decision maker reviews our operating results and allocates resources. The changes in our reporting segments are as follows:
|
•
|
Consumer Healthcare Americas
("
CHCA
")
,
comprises our U.S., Mexico and Canada consumer healthcare business (OTC, contract, infant formula and animal health categories).
|
|
•
|
Consumer Healthcare International
("
CHCI
")
,
comprises our legacy Branded Consumer Healthcare ("BCH") segment and now includes our consumer focused businesses in the U.K., Australia, and Israel, which were previously reported in the legacy Consumer Healthcare segment. This segment includes our U.K. liquid licensed products business, which was previously reported in the Prescription Pharmaceuticals segment.
|
|
•
|
Prescription Pharmaceuticals
("
RX
")
,
comprises our U.S. Prescription Pharmaceuticals business.
|
|
•
|
Specialty Sciences
, continued to comprise the Tysabri
®
Royalty Stream.
|
We also have an "
Other
" reporting segment that will continue to comprise our legacy Active Pharmaceutical Ingredients ("API") business,
which does not meet the quantitative threshold required to be a separately reportable segment. Financial information related to our business segments and geographic locations can be found in
Note 19
.
111
Perrigo Company plc
- Item 8
Note 1
Principles of Consolidation
The consolidated financial statements include our accounts and accounts of all majority-owned subsidiaries. All intercompany transactions and balances have been eliminated in consolidation.
Unconsolidated Variable Interest Entities
We have research and development ("R&D") arrangements with certain biotechnology companies that we determined to be variable interest entities ("VIEs"). We did not consolidate the VIEs in our financial statements because we lack the power to direct the activities that most significantly impact their economic performance and thus are not considered the primary beneficiaries of these entities. These arrangements provide us with certain rights and obligations to purchase product candidates from the VIEs, dependent upon the outcome of the development activities.
Use of Estimates
The preparation of financial statements in conformity with U.S. generally accepted accounting principles ("GAAP") requires management to make estimates and assumptions, which affect the reported earnings, financial position and various disclosures. Although the estimates are considered reasonable, actual results could differ from the estimates.
Non-U.S. Operations
We translate our non-U.S. dollar-denominated operations’ assets and liabilities denominated in foreign currencies into U.S. dollars at current rates of exchange as of the balance sheet date and income and expense items at the average exchange rate for the reporting period. Translation adjustments resulting from exchange rate fluctuations are recorded in the cumulative translation account, a component of Accumulated Other Comprehensive Income ("AOCI"). Gains or losses from foreign currency transactions are included in Other expense, net.
Restatement
In connection with our year-end financial statement close and preparation of our Form 10-K for 2016, we identified misstatements in our historical financial statements, including for the nine months
ended October 1, 2016, six months ended
December 31, 2015
, and the years ended
June 27, 2015
and
June 28, 2014
(the "Restated Periods"). Accordingly, we have restated the consolidated financial statements for the Restated Periods (and certain financial statements for interim periods within the Restated Periods) to reflect the correction of the misstatements, the most significant of which are described below. The segments predominantly affected by this restatement are Specialty Sciences and CHCI. Refer to
Note 10
for additional information on how this restatement affects our debt covenants.
During the 2016 year-end financial statement close process, and in anticipation of our potential sale of our royalty rights, we evaluated the potential effects of the Tysabri
®
royalty stream sale accounting and the accounting and disclosures associated with the pending 2018 adoption of ASC 606 “Revenues from Contracts with Customers.” After an extensive evaluation of the facts and circumstances and the judgments required to determine the appropriate classification, it was determined that under existing U.S. GAAP the contingent payments from Elan's May 2013 sale of Tysabri
®
to Biogen (the "Tysabri
®
royalty stream") should have been recorded as a financial asset, rather than an intangible asset, on the date of our acquisition of Elan.
Our Tysabri
®
royalty stream is now accounted for in our consolidated financial statements for 2016 and prior restated periods as a financial asset using the fair value option. We made the election to account for the Tysabri
®
financial asset using the fair value option as we believe this method is most appropriate for an asset that does not have a par value, a stated interest stream, or a termination date. Accounting for the Tysabri
®
royalty stream as a financial asset required us to adjust our financial statements for the Restated Periods to (1) remove the Tysabri
®
royalty stream from net sales in our Consolidated Statements of Operations, (2) remove the amortization expense (reflected in cost of goods sold) associated with recording the Tysabri
®
royalty stream as an intangible asset, and (3) include the quarterly changes in fair value of the Tysabri
®
royalty stream as a component of other non-operating
112
Perrigo Company plc
- Item 8
Note 1
income/expense. The cash payments we received from the royalty stream are included in our Consolidated Statements of Cash Flows for the Restated Periods and reflect the cash received from the Tysabri
®
royalty stream as cash from investing activities, rather than as cash from operating activities.
In addition, in connection with the financial closing for the year ended December 31, 2016, we identified certain tax basis intangible assets that existed at the time of the acquisition of Omega Pharma Invest N.V. (“Omega”) on
March 30, 2015
, which reduced the deferred tax liabilities in acquired intangible assets and increased our valuation allowance resulting in a net change to our deferred taxes of approximately
$236.3 million
. The resulting balance sheet reclassification required a reduction of goodwill, offset by a corresponding reduction to net deferred taxes at the date of the Omega acquisition. Further, we have evaluated the accounting effect subsequent to the acquisition date related to the remeasured deferred tax liability, including the impairments of Omega goodwill recorded in 2016 and certain adjustments to valuation allowances, which have been reflected in the Restated Periods.
In restating our financial statements to correct the misstatements discussed above, we are also making adjustments for previously identified required corrections with respect to the Restated Periods. When these financial statements were originally issued, we assessed the impact of these unrecorded adjustments and concluded that they were not material individually or in the aggregate to our consolidated financial statements.
The tables below present the impact of the changes to our Consolidated Financial Statement line items in our Original Filing:
113
Perrigo Company plc
- Item 8
Note 1
Consolidated Statement of Operations
(in millions, except per share amounts)
|
|
Six Months Ended
|
||||||||||||||
|
|
December 31, 2015
|
||||||||||||||
|
Adjustments
|
|||||||||||||||
|
Previously Reported
|
Tysabri
®
|
Other
|
Restated
|
||||||||||||
|
Net sales
|
$
|
2,769.5
|
|
$
|
(166.4
|
)
|
$
|
29.1
|
|
(b)
|
$
|
2,632.2
|
|
||
|
Cost of sales
|
1,661.4
|
|
(145.0
|
)
|
36.9
|
|
(b)
|
1,553.3
|
|
||||||
|
Gross profit (loss)
|
1,108.1
|
|
(21.4
|
)
|
(7.8
|
)
|
1,078.9
|
|
|||||||
|
Operating expenses
|
|||||||||||||||
|
Distribution
|
47.9
|
|
—
|
|
—
|
|
47.9
|
|
|||||||
|
Research and development
|
88.2
|
|
—
|
|
—
|
|
88.2
|
|
|||||||
|
Selling
|
325.9
|
|
—
|
|
—
|
|
325.9
|
|
|||||||
|
Administration
|
309.1
|
|
—
|
|
(2.3
|
)
|
306.8
|
|
|||||||
|
Impairment charges
|
215.6
|
|
—
|
|
—
|
|
215.6
|
|
|||||||
|
Restructuring
|
26.9
|
|
—
|
|
—
|
|
26.9
|
|
|||||||
|
Total operating expenses
|
1,013.6
|
|
—
|
|
(2.3
|
)
|
1,011.3
|
|
|||||||
|
Operating income (loss)
|
94.5
|
|
(21.4
|
)
|
(5.5
|
)
|
67.6
|
|
|||||||
|
Tysabri
®
royalty stream - change in fair value
|
—
|
|
(57.3
|
)
|
—
|
|
(57.3
|
)
|
|||||||
|
Interest expense, net
|
89.9
|
|
—
|
|
—
|
|
89.9
|
|
|||||||
|
Other expense (income), net
|
26.9
|
|
0.9
|
|
(2.6
|
)
|
25.2
|
|
|||||||
|
Loss on extinguishment of debt
|
0.9
|
|
—
|
|
—
|
|
0.9
|
|
|||||||
|
Income (loss) before income taxes
|
(23.2
|
)
|
35.0
|
|
(2.9
|
)
|
8.9
|
|
|||||||
|
Income tax expense (benefit)
|
(28.8
|
)
|
4.4
|
|
(9.2
|
)
|
(a)
|
(33.6
|
)
|
||||||
|
Net income
|
$
|
5.6
|
|
$
|
30.6
|
|
$
|
6.3
|
|
$
|
42.5
|
|
|||
|
Income per share
|
|||||||||||||||
|
Basic
|
$
|
0.04
|
|
$
|
0.21
|
|
$
|
0.04
|
|
$
|
0.29
|
|
|||
|
Diluted
|
$
|
0.04
|
|
$
|
0.21
|
|
$
|
0.04
|
|
$
|
0.29
|
|
|||
|
Weighted-average shares outstanding
|
|||||||||||||||
|
Basic
|
145.6
|
|
145.6
|
|
|||||||||||
|
Diluted
|
146.1
|
|
146.1
|
|
|||||||||||
|
(a)
|
Adjustments primarily related to certain tax basis intangible assets that existed at the time of the acquisition of Omega on
March 30, 2015
, which reduced the deferred tax liabilities in acquired intangible assets and increased our valuation allowance resulting in a net change to our deferred taxes. The resulting balance sheet reclassification required a reduction of goodwill, offset by a corresponding reduction to net deferred taxes at the date of the Omega acquisition. The adjustment made at the date of the Omega acquisition also had an impact on previously reported goodwill impairment charges. ("BCH Deferred Tax Matters").
|
|
(b)
|
Adjustments primarily related to certain contracts related to a specific Belgium distributor that were consignment in nature due to an option for the distributor to return the product if it was not sold timely. The characterization of the contracts as consignment impacted the timing of revenue recognition in the Consolidated Statement of Operations and, due to the impact on factoring arrangements, required a reclassification between accounts receivable and current liabilities for the amounts factored for these contracts. (“BCH Belgium Distribution Contracts”)
|
114
Perrigo Company plc
- Item 8
Note 1
Consolidated Statement of Operations
(in millions, except per share amounts)
|
|
Year Ended
|
||||||||||||||
|
|
June 27, 2015
|
||||||||||||||
|
Adjustments
|
|||||||||||||||
|
Previously Reported
|
Tysabri
®
|
Other
|
Restated
|
||||||||||||
|
Net sales
|
$
|
4,603.9
|
|
$
|
(338.5
|
)
|
$
|
(38.3
|
)
|
(b)
|
$
|
4,227.1
|
|
||
|
Cost of sales
|
2,891.4
|
|
(290.1
|
)
|
(18.4
|
)
|
(b)
|
2,582.9
|
|
||||||
|
Gross profit (loss)
|
1,712.5
|
|
(48.4
|
)
|
(19.9
|
)
|
1,644.2
|
|
|||||||
|
Operating expenses
|
|||||||||||||||
|
Distribution
|
67.7
|
|
—
|
|
—
|
|
67.7
|
|
|||||||
|
Research and development
|
187.8
|
|
—
|
|
—
|
|
187.8
|
|
|||||||
|
Selling
|
319.0
|
|
—
|
|
—
|
|
319.0
|
|
|||||||
|
Administration
|
385.2
|
|
—
|
|
0.1
|
|
385.3
|
|
|||||||
|
Impairment charges
|
—
|
|
—
|
|
6.8
|
|
6.8
|
|
|||||||
|
Restructuring
|
5.1
|
|
—
|
|
—
|
|
5.1
|
|
|||||||
|
Total operating expenses
|
964.8
|
|
—
|
|
6.9
|
|
971.7
|
|
|||||||
|
Operating income (loss)
|
747.7
|
|
(48.4
|
)
|
(26.8
|
)
|
672.5
|
|
|||||||
|
Tysabri
®
royalty stream - change in fair value
|
—
|
|
(78.5
|
)
|
—
|
|
(78.5
|
)
|
|||||||
|
Interest expense, net
|
146.0
|
|
—
|
|
—
|
|
146.0
|
|
|||||||
|
Other expense (income), net
|
343.2
|
|
—
|
|
(9.0
|
)
|
334.2
|
|
|||||||
|
Loss on extinguishment of debt
|
10.5
|
|
—
|
|
—
|
|
10.5
|
|
|||||||
|
Income (loss) before income taxes
|
248.0
|
|
30.1
|
|
(17.8
|
)
|
260.3
|
|
|||||||
|
Income tax expense
|
120.0
|
|
3.8
|
|
0.4
|
|
124.2
|
|
|||||||
|
Net income (loss)
|
$
|
128.0
|
|
$
|
26.3
|
|
$
|
(18.2
|
)
|
$
|
136.1
|
|
|||
|
Income per share
|
|||||||||||||||
|
Basic
|
$
|
0.92
|
|
$
|
0.18
|
|
$
|
(0.13
|
)
|
$
|
0.97
|
|
|||
|
Diluted
|
$
|
0.92
|
|
$
|
0.18
|
|
$
|
(0.13
|
)
|
$
|
0.97
|
|
|||
|
Weighted-average shares outstanding
|
|||||||||||||||
|
Basic
|
139.3
|
|
139.3
|
|
|||||||||||
|
Diluted
|
139.8
|
|
139.8
|
|
|||||||||||
|
(b)
|
Adjustments primarily related to BCH Belgium Distribution Contracts as described above.
|
115
Perrigo Company plc
- Item 8
Note 1
Consolidated Statement of Operations
(in millions, except per share amounts)
|
|
Year Ended
|
||||||||||||||
|
|
June 28, 2014
|
||||||||||||||
|
Adjustments
|
|||||||||||||||
|
Previously Reported
|
Tysabri
®
|
Other
|
Restated
|
||||||||||||
|
Net sales
|
$
|
4,060.8
|
|
$
|
(146.7
|
)
|
$
|
—
|
|
$
|
3,914.1
|
|
|||
|
Cost of sales
|
2,613.1
|
|
(152.8
|
)
|
1.7
|
|
2,462.0
|
|
|||||||
|
Gross profit (loss)
|
1,447.7
|
|
6.1
|
|
(1.7
|
)
|
1,452.1
|
|
|||||||
|
Operating expenses
|
|||||||||||||||
|
Distribution
|
55.3
|
|
—
|
|
—
|
|
55.3
|
|
|||||||
|
Research and development
|
158.5
|
|
—
|
|
(6.0
|
)
|
152.5
|
|
|||||||
|
Selling
|
208.6
|
|
—
|
|
—
|
|
208.6
|
|
|||||||
|
Administration
|
411.3
|
|
—
|
|
—
|
|
411.3
|
|
|||||||
|
Impairment charges
|
—
|
|
—
|
|
6.0
|
|
6.0
|
|
|||||||
|
Restructuring
|
47.0
|
|
—
|
|
—
|
|
47.0
|
|
|||||||
|
Total operating expenses
|
880.7
|
|
—
|
|
—
|
|
880.7
|
|
|||||||
|
Operating income (loss)
|
567.0
|
|
6.1
|
|
(1.7
|
)
|
571.4
|
|
|||||||
|
Tysabri
®
royalty stream - change in fair value
|
—
|
|
(26.6
|
)
|
—
|
|
(26.6
|
)
|
|||||||
|
Interest expense, net
|
103.5
|
|
—
|
|
—
|
|
103.5
|
|
|||||||
|
Other expense, net
|
25.1
|
|
—
|
|
—
|
|
25.1
|
|
|||||||
|
Loss on extinguishment of debt
|
165.8
|
|
—
|
|
—
|
|
165.8
|
|
|||||||
|
Income (loss) before income taxes
|
272.6
|
|
32.7
|
|
(1.7
|
)
|
303.6
|
|
|||||||
|
Income tax expense (benefit)
|
67.3
|
|
4.1
|
|
(0.6
|
)
|
70.8
|
|
|||||||
|
Net income (loss)
|
$
|
205.3
|
|
$
|
28.6
|
|
$
|
(1.1
|
)
|
$
|
232.8
|
|
|||
|
Income per share
|
|||||||||||||||
|
Basic
|
$
|
1.78
|
|
$
|
0.25
|
|
$
|
(0.01
|
)
|
$
|
2.02
|
|
|||
|
Diluted
|
$
|
1.77
|
|
$
|
0.25
|
|
$
|
(0.01
|
)
|
$
|
2.01
|
|
|||
|
Weighted-average shares outstanding
|
|||||||||||||||
|
Basic
|
115.1
|
|
115.1
|
|
|||||||||||
|
Diluted
|
115.6
|
|
115.6
|
|
|||||||||||
116
Perrigo Company plc
- Item 8
Note 1
Consolidated Balance Sheet
(in millions)
|
December 31, 2015
|
|||||||||||||||
|
Adjustments
|
|||||||||||||||
|
Previously Reported
|
Tysabri
®
|
Other
|
Restated
|
||||||||||||
|
Assets
|
|||||||||||||||
|
Cash and cash equivalents
|
$
|
417.8
|
|
$
|
—
|
|
$
|
—
|
|
$
|
417.8
|
|
|||
|
Accounts receivable, net of allowance for doubtful accounts of $4.5 million
|
1,193.1
|
|
—
|
|
(4.1
|
)
|
(b)
|
1,189.0
|
|
||||||
|
Inventories
|
844.4
|
|
—
|
|
54.3
|
|
(b)
|
898.7
|
|
||||||
|
Prepaid expenses and other current assets
|
289.1
|
|
—
|
|
(3.0
|
)
|
286.1
|
|
|||||||
|
Total current assets
|
2,744.4
|
|
—
|
|
47.2
|
|
2,791.6
|
|
|||||||
|
Property, plant and equipment, net
|
886.2
|
|
—
|
|
—
|
|
886.2
|
|
|||||||
|
Tysabri
®
royalty stream - at fair value
|
—
|
|
5,310.0
|
|
—
|
|
5,310.0
|
|
|||||||
|
Goodwill and other indefinite-lived intangible assets
|
7,281.2
|
|
—
|
|
(212.2
|
)
|
(a)(b)
|
7,069.0
|
|
||||||
|
Other intangible assets, net
|
8,190.5
|
|
(5,212.2
|
)
|
(5.2
|
)
|
2,973.1
|
|
|||||||
|
Non-current deferred income taxes
|
54.6
|
|
—
|
|
16.8
|
|
(a)(c)
|
71.4
|
|
||||||
|
Other non-current assets
|
237.0
|
|
—
|
|
11.3
|
|
248.3
|
|
|||||||
|
Total non-current assets
|
16,649.5
|
|
97.8
|
|
(189.3
|
)
|
16,558.0
|
|
|||||||
|
Total assets
|
$
|
19,393.9
|
|
$
|
97.8
|
|
$
|
(142.1
|
)
|
$
|
19,349.6
|
|
|||
|
Liabilities and Shareholders’ Equity
|
|||||||||||||||
|
Accounts payable
|
$
|
554.9
|
|
$
|
—
|
|
$
|
0.9
|
|
(b)
|
$
|
555.8
|
|
||
|
Payroll and related taxes
|
125.3
|
|
—
|
|
—
|
|
125.3
|
|
|||||||
|
Accrued customer programs
|
398.0
|
|
—
|
|
(2.0
|
)
|
(b)
|
396.0
|
|
||||||
|
Accrued liabilities
|
308.4
|
|
—
|
|
43.5
|
|
(b)
|
351.9
|
|
||||||
|
Accrued income taxes
|
85.2
|
|
—
|
|
(22.5
|
)
|
(a)
|
62.7
|
|
||||||
|
Current indebtedness
|
1,018.3
|
|
—
|
|
42.2
|
|
(b)
|
1,060.5
|
|
||||||
|
Total current liabilities
|
2,490.1
|
|
—
|
|
62.1
|
|
2,552.2
|
|
|||||||
|
Long-term debt, less current portion
|
4,971.6
|
|
—
|
|
—
|
|
4,971.6
|
|
|||||||
|
Non-current deferred income taxes
|
1,563.7
|
|
12.2
|
|
(203.2
|
)
|
(a)(b)(c)
|
1,372.7
|
|
||||||
|
Other non-current liabilities
|
332.4
|
|
—
|
|
13.9
|
|
(a)
|
346.3
|
|
||||||
|
Total non-current liabilities
|
6,867.7
|
|
12.2
|
|
(189.3
|
)
|
6,690.6
|
|
|||||||
|
Total liabilities
|
9,357.8
|
|
12.2
|
|
(127.2
|
)
|
9,242.8
|
|
|||||||
|
Commitments and contingencies - Note 16
|
|
|
|
|
|||||||||||
|
Shareholders’ equity
|
|||||||||||||||
|
Controlling interest:
|
|||||||||||||||
|
Preferred shares, $0.0001 par value, 10 million shares authorized
|
—
|
|
—
|
|
—
|
|
—
|
|
|||||||
|
Ordinary shares, €0.001 par value, 10 billion shares authorized
|
8,144.6
|
|
—
|
|
(2.0
|
)
|
8,142.6
|
|
|||||||
|
Accumulated other comprehensive (loss)
|
(15.5
|
)
|
—
|
|
0.2
|
|
(b)
|
(15.3
|
)
|
||||||
|
Retained earnings
|
1,907.6
|
|
85.6
|
|
(13.1
|
)
|
1,980.1
|
|
|||||||
|
Total controlling interest
|
10,036.7
|
|
85.6
|
|
(14.9
|
)
|
10,107.4
|
|
|||||||
|
Noncontrolling interest
|
(0.6
|
)
|
—
|
|
—
|
|
(0.6
|
)
|
|||||||
|
Total shareholders’ equity
|
10,036.1
|
|
85.6
|
|
(14.9
|
)
|
10,106.8
|
|
|||||||
|
Total liabilities and shareholders' equity
|
$
|
19,393.9
|
|
$
|
97.8
|
|
$
|
(142.1
|
)
|
$
|
19,349.6
|
|
|||
|
(a)
|
Adjustments primarily related to the BCH Deferred Tax Matters as described above.(Goodwill and other indefinite-lived intangible assets:
$(223.3) million
, Non-current deferred income tax asset:
$272.2 million
, and Non-current deferred income tax liability
$65.4 million
)
|
|
(b)
|
Adjustments primarily related to BCH Belgium Distribution Contracts as described above. (Goodwill and other indefinite-lived intangible assets:
$10.2 million
and Non-current deferred income tax liabili:
$8.7 million
)
|
|
(c)
|
Adjustment related to income tax expense (benefit) for interim period tax accounting required under ASC 740, Accounting for Income Taxes. The balance of the adjustment to deferred taxes relates to jurisdictional netting.
|
117
Perrigo Company plc
- Item 8
Note 1
Consolidated Balance Sheet
(in millions)
|
June 27, 2015
|
|||||||||||||||
|
Adjustments
|
|||||||||||||||
|
Previously Reported
|
Tysabri
®
|
Other
|
Restated
|
||||||||||||
|
Assets
|
|||||||||||||||
|
Cash and cash equivalents
|
$
|
785.6
|
|
$
|
—
|
|
$
|
—
|
|
$
|
785.6
|
|
|||
|
Accounts receivable, net of allowance for doubtful accounts of $2.6 million
|
1,282.1
|
|
—
|
|
(72.7
|
)
|
(b)(d)
|
1,209.4
|
|
||||||
|
Inventories
|
838.9
|
|
—
|
|
96.8
|
|
(b)
|
935.7
|
|
||||||
|
Current deferred income taxes
|
122.3
|
|
—
|
|
25.9
|
|
(c)
|
148.2
|
|
||||||
|
Prepaid expenses and other current assets
|
154.0
|
|
—
|
|
(3.9
|
)
|
150.1
|
|
|||||||
|
Total current assets
|
3,182.9
|
|
—
|
|
46.1
|
|
3,229.0
|
|
|||||||
|
Property, plant and equipment, net
|
932.4
|
|
—
|
|
—
|
|
932.4
|
|
|||||||
|
Tysabri
®
royalty stream - at fair value
|
—
|
|
5,420.0
|
|
—
|
|
5,420.0
|
|
|||||||
|
Goodwill and other indefinite-lived intangible assets
|
7,235.0
|
|
—
|
|
(250.7
|
)
|
(a)(b)
|
6,984.3
|
|
||||||
|
Other intangible assets, net
|
8,105.6
|
|
(5,357.2
|
)
|
(5.6
|
)
|
2,742.8
|
|
|||||||
|
Non-current deferred income taxes
|
39.6
|
|
—
|
|
10.5
|
|
(a)(c)
|
50.1
|
|
||||||
|
Other non-current assets
|
225.1
|
|
—
|
|
8.2
|
|
233.3
|
|
|||||||
|
Total non-current assets
|
16,537.7
|
|
62.8
|
|
(237.6
|
)
|
16,362.9
|
|
|||||||
|
Total assets
|
$
|
19,720.6
|
|
$
|
62.8
|
|
$
|
(191.5
|
)
|
$
|
19,591.9
|
|
|||
|
Liabilities and Shareholders’ Equity
|
|||||||||||||||
|
Accounts payable
|
$
|
747.5
|
|
$
|
—
|
|
$
|
(38.2
|
)
|
(b)(d)
|
$
|
709.3
|
|
||
|
Payroll and related taxes
|
133.9
|
|
—
|
|
—
|
|
133.9
|
|
|||||||
|
Accrued customer programs
|
368.1
|
|
—
|
|
(9.6
|
)
|
(b)
|
358.5
|
|
||||||
|
Accrued liabilities
|
246.4
|
|
—
|
|
11.1
|
|
(b)
|
257.5
|
|
||||||
|
Accrued income taxes
|
52.6
|
|
—
|
|
3.7
|
|
(a)
|
56.3
|
|
||||||
|
Current deferred income taxes
|
80.6
|
|
—
|
|
(0.9
|
)
|
79.7
|
|
|||||||
|
Current indebtedness
|
64.6
|
|
—
|
|
88.7
|
|
(b)
|
153.3
|
|
||||||
|
Total current liabilities
|
1,693.7
|
|
—
|
|
54.8
|
|
1,748.5
|
|
|||||||
|
Long-term debt, less current portion
|
5,246.9
|
|
—
|
|
—
|
|
5,246.9
|
|
|||||||
|
Non-current deferred income taxes
|
1,745.1
|
|
7.9
|
|
(238.7
|
)
|
(a)(b)(c)
|
1,514.3
|
|
||||||
|
Other non-current liabilities
|
372.1
|
|
—
|
|
10.6
|
|
382.7
|
|
|||||||
|
Total non-current liabilities
|
7,364.1
|
|
7.9
|
|
(228.1
|
)
|
7,143.9
|
|
|||||||
|
Total liabilities
|
9,057.8
|
|
7.9
|
|
(173.3
|
)
|
8,892.4
|
|
|||||||
|
Commitments and contingencies - Note 16
|
|
|
|||||||||||||
|
Shareholders’ equity
|
|||||||||||||||
|
Controlling interest:
|
|||||||||||||||
|
Preferred shares, $0.0001 par value, 10 million shares authorized
|
—
|
|
—
|
|
—
|
|
—
|
|
|||||||
|
Ordinary shares, €0.001 par value, 10 billion shares authorized
|
8,621.9
|
|
—
|
|
—
|
|
8,621.9
|
|
|||||||
|
Accumulated other comprehensive income
|
102.4
|
|
—
|
|
1.1
|
|
103.5
|
|
|||||||
|
Retained earnings
|
1,938.3
|
|
54.9
|
|
(19.3
|
)
|
1,973.9
|
|
|||||||
|
Total controlling interest
|
10,662.6
|
|
54.9
|
|
(18.2
|
)
|
10,699.3
|
|
|||||||
|
Noncontrolling interest
|
0.2
|
|
—
|
|
—
|
|
0.2
|
|
|||||||
|
Total shareholders’ equity
|
10,662.8
|
|
54.9
|
|
(18.2
|
)
|
10,699.5
|
|
|||||||
|
Total liabilities and shareholders' equity
|
$
|
19,720.6
|
|
$
|
62.8
|
|
$
|
(191.5
|
)
|
$
|
19,591.9
|
|
|||
|
(a)
|
Adjustments primarily related to the BCH Deferred Tax Matters as described above. (Goodwill and other indefinite-lived intangible assets:
$(262.3) million
, Non-current deferred income tax asset:
$268.9 million
, and Non-current deferred tax liability
$4.0 million
)
|
|
(b)
|
Adjustments primarily related to BCH Belgium Distribution Contracts as described above. (Accounts receivable:
$(39.5) million
, Goodwill and other indefinite-lived intangible assets:
$10.5 million
, Accounts payable:
$(1.0) million
, and Non-current deferred income taxes:
$(8.6) million
)
|
|
(c)
|
Adjustment related to income tax expense (benefit) for interim period tax accounting required under ASC 740, Accounting for Income Taxes. The balance of the adjustment to deferred taxes relates to jurisdictional netting.
|
|
(d)
|
The balance of the adjustments in this category relate to other identified required corrections related to balance sheet reclassifications.
|
118
Perrigo Company plc
- Item 8
Note 1
Consolidated Balance Sheet
(in millions)
|
June 28, 2014
|
|||||||||||||||
|
Adjustments
|
|||||||||||||||
|
Previously Reported
|
Tysabri
®
|
Other
|
Restated
|
||||||||||||
|
Assets
|
|||||||||||||||
|
Cash and cash equivalents
|
$
|
799.5
|
|
$
|
—
|
|
$
|
—
|
|
$
|
799.5
|
|
|||
|
Accounts receivable, net of allowance for doubtful accounts of $2.7 million
|
935.1
|
|
—
|
|
(3.6
|
)
|
931.5
|
|
|||||||
|
Inventories
|
631.6
|
|
—
|
|
(1.7
|
)
|
629.9
|
|
|||||||
|
Current deferred income taxes
|
62.8
|
|
—
|
|
—
|
|
62.8
|
|
|||||||
|
Prepaid expenses and other current assets
|
121.9
|
|
—
|
|
—
|
|
121.9
|
|
|||||||
|
Total current assets
|
2,550.9
|
|
—
|
|
(5.3
|
)
|
2,545.6
|
|
|||||||
|
Property, plant and equipment, net
|
779.9
|
|
—
|
|
—
|
|
779.9
|
|
|||||||
|
Tysabri
®
royalty stream - at fair value
|
—
|
|
5,680.0
|
|
—
|
|
5,680.0
|
|
|||||||
|
Goodwill and other indefinite-lived intangible assets
|
3,543.8
|
|
—
|
|
(1.1
|
)
|
3,542.7
|
|
|||||||
|
Other intangible assets, net
|
6,787.0
|
|
(5,647.3
|
)
|
(11.0
|
)
|
|
1,128.7
|
|
||||||
|
Non-current deferred income taxes
|
23.6
|
|
—
|
|
—
|
|
23.6
|
|
|||||||
|
Other non-current assets
|
167.6
|
|
—
|
|
11.0
|
|
178.6
|
|
|||||||
|
Total non-current assets
|
11,301.9
|
|
32.7
|
|
(1.1
|
)
|
11,333.5
|
|
|||||||
|
Total assets
|
$
|
13,852.8
|
|
$
|
32.7
|
|
$
|
(6.4
|
)
|
$
|
13,879.1
|
|
|||
|
Liabilities and Shareholders’ Equity
|
|||||||||||||||
|
Accounts payable
|
$
|
364.3
|
|
$
|
—
|
|
$
|
—
|
|
$
|
364.3
|
|
|||
|
Payroll and related taxes
|
112.3
|
|
—
|
|
—
|
|
112.3
|
|
|||||||
|
Accrued customer programs
|
256.5
|
|
—
|
|
—
|
|
256.5
|
|
|||||||
|
Accrued liabilities
|
179.4
|
|
—
|
|
(5.3
|
)
|
174.1
|
|
|||||||
|
Accrued income taxes
|
17.4
|
|
—
|
|
(0.6
|
)
|
16.8
|
|
|||||||
|
Current deferred income taxes
|
1.1
|
|
—
|
|
—
|
|
1.1
|
|
|||||||
|
Current indebtedness
|
143.7
|
|
—
|
|
—
|
|
143.7
|
|
|||||||
|
Total current liabilities
|
1,074.7
|
|
—
|
|
(5.9
|
)
|
1,068.8
|
|
|||||||
|
Long-term debt, less current portion
|
3,063.1
|
|
—
|
|
—
|
|
3,063.1
|
|
|||||||
|
Non-current deferred income taxes
|
727.9
|
|
4.1
|
|
0.6
|
|
732.6
|
|
|||||||
|
Other non-current liabilities
|
293.4
|
|
—
|
|
—
|
|
293.4
|
|
|||||||
|
Total non-current liabilities
|
4,084.4
|
|
4.1
|
|
0.6
|
|
4,089.1
|
|
|||||||
|
Total liabilities
|
5,159.1
|
|
4.1
|
|
(5.3
|
)
|
5,157.9
|
|
|||||||
|
Commitments and contingencies - Note 16
|
|
|
|||||||||||||
|
Shareholders’ equity
|
|||||||||||||||
|
Controlling interest:
|
|||||||||||||||
|
Preferred shares, $0.0001 par value, 10 million shares authorized
|
—
|
|
—
|
|
—
|
|
—
|
|
|||||||
|
Ordinary shares, €0.001 par value, 10 billion shares authorized
|
6,678.2
|
|
—
|
|
—
|
|
6,678.2
|
|
|||||||
|
Accumulated other comprehensive income
|
139.6
|
|
—
|
|
—
|
|
139.6
|
|
|||||||
|
Retained earnings
|
1,875.1
|
|
28.6
|
|
(1.1
|
)
|
1,902.6
|
|
|||||||
|
Total controlling interest
|
8,692.9
|
|
28.6
|
|
(1.1
|
)
|
8,720.4
|
|
|||||||
|
Noncontrolling interest
|
0.8
|
|
—
|
|
—
|
|
0.8
|
|
|||||||
|
Total shareholders’ equity
|
8,693.7
|
|
28.6
|
|
(1.1
|
)
|
8,721.2
|
|
|||||||
|
Total liabilities and shareholders' equity
|
$
|
13,852.8
|
|
$
|
32.7
|
|
$
|
(6.4
|
)
|
$
|
13,879.1
|
|
|||
119
Perrigo Company plc
- Item 8
Note 1
Consolidated Statement of Cash Flows
(in millions)
|
Six Months Ended
|
|||||||||||||||
|
December 31, 2015
|
|||||||||||||||
|
Adjustments
|
|||||||||||||||
|
Previously Reported
|
Tysabri
®
|
Other
|
Restated
|
||||||||||||
|
Cash Flows From (For) Operating Activities
|
|||||||||||||||
|
Net income
|
$
|
5.6
|
|
$
|
30.6
|
|
$
|
6.3
|
|
$
|
42.5
|
|
|||
|
Adjustments to derive cash flows
|
|||||||||||||||
|
Loss on extinguishment of debt
|
0.9
|
|
—
|
|
—
|
|
0.9
|
|
|||||||
|
Restructuring charges
|
26.9
|
|
—
|
|
—
|
|
26.9
|
|
|||||||
|
Depreciation and amortization
|
328.0
|
|
(145.0
|
)
|
(0.6
|
)
|
182.4
|
|
|||||||
|
Impairment charges
|
215.6
|
|
—
|
|
—
|
|
215.6
|
|
|||||||
|
Tysabri
®
royalty stream - change in fair value
|
—
|
|
(57.3
|
)
|
—
|
|
(57.3
|
)
|
|||||||
|
Share-based compensation
|
24.8
|
|
—
|
|
(2.0
|
)
|
22.8
|
|
|||||||
|
Deferred income taxes
|
(141.8
|
)
|
4.4
|
|
17.4
|
|
(a)(b)
|
(120.0
|
)
|
||||||
|
Amortization of financing fees and debt premium
|
—
|
|
—
|
|
(10.2
|
)
|
(10.2
|
)
|
|||||||
|
Other non-cash adjustments
|
17.5
|
|
—
|
|
0.6
|
|
18.1
|
|
|||||||
|
Subtotal
|
477.5
|
|
(167.3
|
)
|
11.5
|
|
321.7
|
|
|||||||
|
Increase (decrease) in cash due to:
|
|||||||||||||||
|
Accounts receivable
|
86.1
|
|
2.6
|
|
(36.2
|
)
|
(b)
|
52.5
|
|
||||||
|
Inventories
|
(70.0
|
)
|
—
|
|
40.4
|
|
(b)
|
(29.6
|
)
|
||||||
|
Accounts payable
|
(199.5
|
)
|
—
|
|
5.4
|
|
(b)
|
(194.1
|
)
|
||||||
|
Payroll and related taxes
|
(38.2
|
)
|
—
|
|
—
|
|
(38.2
|
)
|
|||||||
|
Accrued customer programs
|
27.0
|
|
—
|
|
7.4
|
|
(b)
|
34.4
|
|
||||||
|
Accrued liabilities
|
75.6
|
|
—
|
|
32.5
|
|
(b)
|
108.1
|
|
||||||
|
Accrued income taxes
|
(30.5
|
)
|
—
|
|
(26.3
|
)
|
(a)
|
(56.8
|
)
|
||||||
|
Other
|
(4.8
|
)
|
—
|
|
7.7
|
|
2.9
|
|
|||||||
|
Subtotal
|
(154.3
|
)
|
2.6
|
|
30.9
|
|
(120.8
|
)
|
|||||||
|
Net cash from (for) operating activities
|
323.2
|
|
(164.7
|
)
|
42.4
|
|
200.9
|
|
|||||||
|
Cash Flows From (For) Investing Activities
|
|||||||||||||||
|
Proceeds from royalty rights
|
—
|
|
164.7
|
|
1.6
|
|
166.3
|
|
|||||||
|
Acquisitions of businesses, net of cash acquired
|
(791.6
|
)
|
—
|
|
—
|
|
(791.6
|
)
|
|||||||
|
Additions to property, plant and equipment
|
(77.8
|
)
|
—
|
|
—
|
|
(77.8
|
)
|
|||||||
|
Other investing
|
(5.0
|
)
|
—
|
|
1.3
|
|
(3.7
|
)
|
|||||||
|
Net cash from (for) investing activities
|
(874.4
|
)
|
164.7
|
|
1.6
|
|
(708.1
|
)
|
|||||||
|
Cash Flows From (For) Financing Activities
|
|||||||||||||||
|
Payments on long-term debt
|
(28.3
|
)
|
—
|
|
—
|
|
(28.3
|
)
|
|||||||
|
Borrowings (repayments) of revolving credit agreements and other financing, net
|
762.0
|
|
—
|
|
(44.0
|
)
|
(b)
|
718.0
|
|
||||||
|
Deferred financing fees
|
(0.3
|
)
|
—
|
|
—
|
|
(0.3
|
)
|
|||||||
|
Issuance of ordinary shares
|
4.9
|
|
—
|
|
—
|
|
4.9
|
|
|||||||
|
Repurchase of ordinary shares
|
(500.0
|
)
|
—
|
|
—
|
|
(500.0
|
)
|
|||||||
|
Cash dividends
|
(36.3
|
)
|
—
|
|
—
|
|
(36.3
|
)
|
|||||||
|
Other financing
|
(8.4
|
)
|
—
|
|
—
|
|
(8.4
|
)
|
|||||||
|
Net cash from (for) financing activities
|
193.6
|
|
—
|
|
(44.0
|
)
|
149.6
|
|
|||||||
|
Effect of exchange rate changes on cash and cash equivalents
|
(10.2
|
)
|
—
|
|
—
|
|
(10.2
|
)
|
|||||||
|
Net increase (decrease) in cash and cash equivalents
|
(367.8
|
)
|
—
|
|
—
|
|
(367.8
|
)
|
|||||||
|
Cash and cash equivalents, beginning of period
|
785.6
|
|
—
|
|
—
|
|
785.6
|
|
|||||||
|
Cash and cash equivalents, end of period
|
$
|
417.8
|
|
$
|
—
|
|
$
|
—
|
|
$
|
417.8
|
|
|||
|
(a)
|
Adjustments primarily related to the BCH Deferred Tax Matters as described above.
|
|
(b)
|
Adjustments primarily related to BCH Belgium Distribution Contracts as described above.
|
120
Perrigo Company plc
- Item 8
Note 1
Consolidated Statement of Cash Flows
(in millions)
|
Year Ended
|
|||||||||||||||
|
June 27, 2015
|
|||||||||||||||
|
Adjustments
|
|||||||||||||||
|
Previously Reported
|
Tysabri
®
|
Other
|
Restated
|
||||||||||||
|
Cash Flows From (For) Operating Activities
|
|||||||||||||||
|
Net income
|
$
|
128.0
|
|
$
|
26.3
|
|
$
|
(18.2
|
)
|
$
|
136.1
|
|
|||
|
Adjustments to derive cash flows
|
|||||||||||||||
|
Loss on extinguishment of debt
|
10.5
|
|
—
|
|
—
|
|
10.5
|
|
|||||||
|
Restructuring charges
|
5.1
|
|
—
|
|
—
|
|
5.1
|
|
|||||||
|
Depreciation and amortization
|
548.8
|
|
(290.1
|
)
|
—
|
|
258.7
|
|
|||||||
|
Tysabri
®
royalty stream - change in fair value
|
—
|
|
(78.5
|
)
|
—
|
|
(78.5
|
)
|
|||||||
|
Share-based compensation
|
31.6
|
|
—
|
|
—
|
|
31.6
|
|
|||||||
|
Loss on acquisition-related foreign currency derivatives
|
326.4
|
|
—
|
|
—
|
|
326.4
|
|
|||||||
|
Deferred income taxes
|
(16.4
|
)
|
3.8
|
|
(3.7
|
)
|
(a)
|
(16.3
|
)
|
||||||
|
Amortization of financing fees and debt discount
|
—
|
|
—
|
|
0.2
|
|
0.2
|
|
|||||||
|
Other non-cash adjustments
|
17.0
|
|
—
|
|
(6.8
|
)
|
10.2
|
|
|||||||
|
Subtotal
|
1,051.0
|
|
(338.5
|
)
|
(21.7
|
)
|
690.8
|
|
|||||||
|
Increase (decrease) in cash due to:
|
|||||||||||||||
|
Accounts receivable
|
(81.7
|
)
|
(4.3
|
)
|
34.9
|
|
(b)
|
(51.1
|
)
|
||||||
|
Inventories
|
10.7
|
|
—
|
|
(22.1
|
)
|
(b)
|
(11.4
|
)
|
||||||
|
Accounts payable
|
140.6
|
|
—
|
|
(20.1
|
)
|
(b)
|
120.5
|
|
||||||
|
Payroll and related taxes
|
(30.2
|
)
|
—
|
|
—
|
|
(30.2
|
)
|
|||||||
|
Accrued customer programs
|
69.9
|
|
—
|
|
1.4
|
|
(b)
|
71.3
|
|
||||||
|
Accrued liabilities
|
37.3
|
|
—
|
|
5.5
|
|
(b)
|
42.8
|
|
||||||
|
Accrued income taxes
|
17.5
|
|
—
|
|
4.4
|
|
21.9
|
|
|||||||
|
Other
|
(16.8
|
)
|
—
|
|
17.4
|
|
0.6
|
|
|||||||
|
Subtotal
|
147.3
|
|
(4.3
|
)
|
21.4
|
|
164.4
|
|
|||||||
|
Net cash from (for) operating activities
|
1,198.3
|
|
(342.8
|
)
|
(0.3
|
)
|
855.2
|
|
|||||||
|
Cash Flows From (For) Investing Activities
|
|||||||||||||||
|
Proceeds from royalty rights
|
—
|
|
342.8
|
|
1.8
|
|
344.6
|
|
|||||||
|
Acquisitions of businesses, net of cash acquired
|
(2,177.8
|
)
|
—
|
|
—
|
|
(2,177.8
|
)
|
|||||||
|
Asset acquisitions
|
(4.0
|
)
|
—
|
|
—
|
|
(4.0
|
)
|
|||||||
|
Settlement of acquisition-related foreign currency derivatives
|
(329.9
|
)
|
—
|
|
—
|
|
(329.9
|
)
|
|||||||
|
Additions to property, plant and equipment
|
(137.0
|
)
|
—
|
|
—
|
|
(137.0
|
)
|
|||||||
|
Other investing
|
1.8
|
|
—
|
|
—
|
|
1.8
|
|
|||||||
|
Net cash from (for) investing activities
|
(2,646.9
|
)
|
342.8
|
|
1.8
|
|
(2,302.3
|
)
|
|||||||
|
Cash Flows From (For) Financing Activities
|
|||||||||||||||
|
Issuances of long-term debt
|
2,504.3
|
|
—
|
|
—
|
|
2,504.3
|
|
|||||||
|
Payments on long-term debt
|
(1,823.5
|
)
|
—
|
|
—
|
|
(1,823.5
|
)
|
|||||||
|
Borrowings (repayments) of revolving credit agreements and other financing, net
|
(52.5
|
)
|
—
|
|
(1.5
|
)
|
(b)
|
(54.0
|
)
|
||||||
|
Deferred financing fees
|
(28.1
|
)
|
—
|
|
—
|
|
(28.1
|
)
|
|||||||
|
Issuance of ordinary shares
|
1,043.4
|
|
—
|
|
0.1
|
|
1,043.5
|
|
|||||||
|
Equity issuance costs
|
(35.7
|
)
|
—
|
|
—
|
|
(35.7
|
)
|
|||||||
|
Cash dividends
|
(64.8
|
)
|
—
|
|
—
|
|
(64.8
|
)
|
|||||||
|
Purchase of noncontrolling interest
|
—
|
|
—
|
|
—
|
|
—
|
|
|||||||
|
Other financing
|
(19.2
|
)
|
—
|
|
(0.1
|
)
|
(19.3
|
)
|
|||||||
|
Net cash from (for) financing activities
|
1,523.9
|
|
—
|
|
(1.5
|
)
|
1,522.4
|
|
|||||||
|
Effect of exchange rate changes on cash and cash equivalents
|
(89.2
|
)
|
—
|
|
—
|
|
(89.2
|
)
|
|||||||
|
Net increase (decrease) in cash and cash equivalents
|
(13.9
|
)
|
—
|
|
—
|
|
(13.9
|
)
|
|||||||
|
Cash and cash equivalents, beginning of period
|
799.5
|
|
—
|
|
—
|
|
799.5
|
|
|||||||
|
Cash and cash equivalents, end of period
|
$
|
785.6
|
|
$
|
—
|
|
$
|
—
|
|
$
|
785.6
|
|
|||
(a) Adjustments primarily related to the BCH Deferred Tax Matters as described above.
(b) Adjustments primarily related to BCH Belgium Distribution Contracts as described above.
121
Perrigo Company plc
- Item 8
Note 1
Consolidated Statement of Cash Flows
(in millions)
|
Year Ended
|
|||||||||||||||
|
June 28, 2014
|
|||||||||||||||
|
Adjustments
|
|||||||||||||||
|
Previously Reported
|
Tysabri
®
|
Other
|
Restated
|
||||||||||||
|
Cash Flows From (For) Operating Activities
|
|||||||||||||||
|
Net income
|
$
|
205.3
|
|
$
|
28.6
|
|
$
|
(1.1
|
)
|
$
|
232.8
|
|
|||
|
Adjustments to derive cash flows
|
|||||||||||||||
|
Loss on extinguishment of debt
|
165.8
|
|
—
|
|
—
|
|
165.8
|
|
|||||||
|
Restructuring charges
|
47.0
|
|
—
|
|
—
|
|
47.0
|
|
|||||||
|
Depreciation and amortization
|
358.9
|
|
(152.8
|
)
|
—
|
|
206.1
|
|
|||||||
|
Impairment charges
|
—
|
|
—
|
|
6.0
|
|
6.0
|
|
|||||||
|
Tysabri
®
royalty stream - change in fair value
|
—
|
|
(26.6
|
)
|
—
|
|
(26.6
|
)
|
|||||||
|
Share-based compensation
|
24.6
|
|
—
|
|
—
|
|
24.6
|
|
|||||||
|
Deferred income taxes
|
(53.8
|
)
|
4.1
|
|
—
|
|
(49.7
|
)
|
|||||||
|
Amortization of financing fees and debt discount
|
—
|
|
—
|
|
2.0
|
|
2.0
|
|
|||||||
|
Other non-cash adjustments
|
10.5
|
|
—
|
|
(6.0
|
)
|
4.5
|
|
|||||||
|
Subtotal
|
758.3
|
|
(146.7
|
)
|
0.9
|
|
612.5
|
|
|||||||
|
Increase (decrease) in cash due to:
|
|||||||||||||||
|
Accounts receivable
|
(226.7
|
)
|
86.2
|
|
—
|
|
(140.5
|
)
|
|||||||
|
Inventories
|
83.0
|
|
—
|
|
1.7
|
|
84.7
|
|
|||||||
|
Accounts payable
|
(24.9
|
)
|
—
|
|
—
|
|
(24.9
|
)
|
|||||||
|
Payroll and related taxes
|
(55.5
|
)
|
—
|
|
—
|
|
(55.5
|
)
|
|||||||
|
Accrued customer programs
|
113.1
|
|
—
|
|
—
|
|
113.1
|
|
|||||||
|
Accrued liabilities
|
23.0
|
|
—
|
|
—
|
|
23.0
|
|
|||||||
|
Accrued income taxes
|
(10.7
|
)
|
—
|
|
(0.6
|
)
|
(11.3
|
)
|
|||||||
|
Other
|
33.9
|
|
—
|
|
(2.0
|
)
|
31.9
|
|
|||||||
|
Subtotal
|
(64.8
|
)
|
86.2
|
|
(0.9
|
)
|
20.5
|
|
|||||||
|
Net cash from (for) operating activities
|
693.5
|
|
(60.5
|
)
|
—
|
|
633.0
|
|
|||||||
|
Cash Flows From (For) Investing Activities
|
|||||||||||||||
|
Proceeds from royalty rights
|
—
|
|
60.5
|
|
—
|
|
60.5
|
|
|||||||
|
Acquisitions of businesses, net of cash acquired
|
(1,605.8
|
)
|
—
|
|
—
|
|
(1,605.8
|
)
|
|||||||
|
Proceeds from sale of securities
|
81.4
|
|
—
|
|
—
|
|
81.4
|
|
|||||||
|
Additions to property, plant and equipment
|
(171.6
|
)
|
—
|
|
—
|
|
(171.6
|
)
|
|||||||
|
Other investing
|
(8.8
|
)
|
—
|
|
—
|
|
(8.8
|
)
|
|||||||
|
Net cash from (for) investing activities
|
(1,704.8
|
)
|
60.5
|
|
—
|
|
(1,644.3
|
)
|
|||||||
|
Cash Flows From (For) Financing Activities
|
|||||||||||||||
|
Issuances of long-term debt
|
3,293.6
|
|
—
|
|
—
|
|
3,293.6
|
|
|||||||
|
Payments on long-term debt
|
(2,035.0
|
)
|
—
|
|
(2,035.0
|
)
|
|||||||||
|
Borrowings (repayments) of revolving credit agreements and other financing, net
|
(3.0
|
)
|
—
|
|
—
|
|
(3.0
|
)
|
|||||||
|
Deferred financing fees
|
(48.8
|
)
|
—
|
|
—
|
|
(48.8
|
)
|
|||||||
|
Premium on early debt retirement
|
(133.5
|
)
|
—
|
|
—
|
|
(133.5
|
)
|
|||||||
|
Issuance of ordinary shares
|
9.8
|
|
—
|
|
—
|
|
9.8
|
|
|||||||
|
Cash dividends
|
(46.1
|
)
|
—
|
|
—
|
|
(46.1
|
)
|
|||||||
|
Other financing
|
(9.0
|
)
|
—
|
|
—
|
|
(9.0
|
)
|
|||||||
|
Net cash from (for) financing activities
|
1,028.0
|
|
—
|
|
—
|
|
1,028.0
|
|
|||||||
|
Effect of exchange rate changes on cash and cash equivalents
|
2.9
|
|
—
|
|
—
|
|
2.9
|
|
|||||||
|
Net increase (decrease) in cash and cash equivalents
|
19.6
|
|
—
|
|
—
|
|
19.6
|
|
|||||||
|
Cash and cash equivalents, beginning of period
|
779.9
|
|
—
|
|
—
|
|
779.9
|
|
|||||||
|
Cash and cash equivalents, end of period
|
$
|
799.5
|
|
$
|
—
|
|
$
|
—
|
|
$
|
799.5
|
|
|||
122
Perrigo Company plc
- Item 8
Note 1
Consolidated Statement of Other Comprehensive (Loss) Income
The Consolidated Statement of Comprehensive Income (Loss) was adjusted primarily for a
$36.9 million
increase
in net
income
for the six months ended December 31, 2015,
$8.1 million
increase
in net
income
for the year ended June 27, 2015, and
$27.5 million
increase
in net
income
for the year ended June 28, 2014.
Consolidated Statement of Shareholders' Equity
The Consolidated Statement of Shareholders' Equity was corrected for a
$36.9 million
increase
in net
income
,
$8.1 million
increase
in net
income
, and
$27.5 million
increase
in net
income
for the six months ended December 31, 2015 and for the years ended June 27, 2015 and June 28, 2014, respectively. There was no effect on the beginning balance of Shareholders' Equity at June 29, 2013 as a result of this restatement.
Revenues
We generally record revenues from product sales when the goods are shipped to the customer. For customers with Free on Board destination terms, a provision is recorded to exclude shipments estimated to be in-transit to these customers at the end of the reporting period. A sales allowance is recorded and accounts receivable are reduced as revenues are recognized for estimated losses on credit sales due to customer claims for discounts, price discrepancies, returned goods and other items. Revenue is also reduced for any contractual customer program arrangements and related liabilities are recorded concurrently.
We maintain customer-related accruals and allowances that consist primarily of chargebacks, rebates, sales returns, shelf stock allowances, administrative fees and other incentive programs. Some of these adjustments relate specifically to the
RX
segment while others relate only to the
CHCA
and
CHCI
segments. Certain of these accruals and allowances are recorded in the balance sheet as current liabilities and others are recorded as a reduction in accounts receivable. Changes in these estimates and assumptions related to customer programs may result in additional accruals or allowances. Customer-related accruals and allowances were
$484.3 million
,
$489.4 million
, and
$459.2 million
at
December 31, 2016
,
December 31, 2015
, and
June 27, 2015
, respectively.
Revenues from service and royalty arrangements, including revenues from collaborative agreements, consist primarily of royalty payments, payments for R&D services, up-front fees and milestone payments. If an arrangement requires the delivery or performance of multiple deliverables or service elements, we determine whether the individual elements represent separate units of accounting. If the separate elements represent separate units of accounting, we recognize the revenue associated with each element separately and revenue is allocated among elements based on their relative selling prices. If the elements within a multiple deliverable arrangement are not considered separate units of accounting, the delivery of an individual element is considered not to have occurred if there are undelivered elements that are considered essential to the arrangement.
To the extent such arrangements contain refund clauses triggered by non-performance or other adverse circumstances, revenue is not recognized until all contractual obligations are satisfied. Non-refundable up-front fees are deferred and amortized to revenue over the related performance period. We estimate the performance period based on the specific terms of each collaborative agreement. Revenue associated with R&D services is recognized on a proportional performance basis over the period that we perform the related activities under the terms of the agreement. Revenue resulting from the achievement of contingent milestone events stipulated in the agreements is recognized when the milestone is achieved. Milestones are based upon the occurrence of a substantive element specified in the contract.
Shipping and handling costs billed to customers are included in net sales. Conversely, shipping and handling expenses we incur are included in cost of sales.
Cash and Cash Equivalents
Cash and cash equivalents consist primarily of demand deposits and other short-term investments with maturities of three months or less at the date of purchase. The carrying amount of cash and cash equivalents approximates its fair value.
123
Perrigo Company plc
- Item 8
Note 1
Accounts Receivable
We maintain an allowance for doubtful accounts that reduces our receivables to amounts that are expected to be collected. In estimating the allowance, management considers factors such as current overall and industry-specific economic conditions, statutory requirements, historical and anticipated customer performance, historical experience with write-offs and the level of past-due amounts. Changes in these conditions may result in additional allowances. After all attempts to collect a receivable have failed, the receivable is written off against the allowance.
In addition, included in our accounts receivable balance is
$84.4 million
,
$83.4 million
, and
$80.8 million
related to our Tysabri® royalty stream at December 31, 2016, December 31, 2015, and June 27, 2015, respectively, for amounts earned that have not yet been paid.
Inventories
Inventories are stated at the lower of cost or market. Cost is determined using the first-in first-out method. Costs include material and conversion costs. Inventory related to R&D is expensed at the point when it is determined the materials have no alternative future use.
We maintain reserves for estimated obsolete or unmarketable inventory based on the difference between the cost of the inventory and its estimated net realizable value. In estimating the reserves, management considers factors such as excess or slow-moving inventories, product expiration dating, products on quality hold, current and future customer demand and market conditions. Changes in these conditions may result in additional reserves. See
Note 5
for additional information on our inventory.
Investments
Available for Sale Investments
We determine the appropriate classification of securities as held-to-maturity, available-for-sale, or trading. The classification depends on the purpose for which the financial assets were acquired. Marketable equity securities are classified as available-for-sale. These securities are carried at fair value with unrealized gains and losses included in AOCI. The assessment for impairment of marketable securities classified as available-for-sale is based on established financial methodologies, including quoted market prices for publicly traded securities. If we determine that a loss in the value of an investment is other than temporary, the investment is written down to its estimated fair value. Any such losses are recorded in Other expense, net. See
Note 7
for more information on our available for sale investments.
Cost Method Investments
Non-marketable equity securities are carried at cost, less any write down for impairments, and are adjusted for impairment based on methodologies, an assessment of the impact of general private equity market conditions, and discounted projected future cash flows. Non-marketable equity securities are recorded in Other non-current assets. See
Note 7
for more information on our cost method investments.
Equity Method Investments
The equity method of accounting is used for unconsolidated entities over which we have significant influence; generally this represents ownership interests of at least 20% and not more than 50%. Under the equity method of accounting, we record the investments at carrying value and adjust for a proportionate share of the profits and losses of these entities each period. We evaluate our equity method investments for recoverability. If we determine that a loss in the value of an investment is other than temporary, the investment is written down to its estimated fair value. Any such losses are recorded in Other expense, net. Evaluations of recoverability are based primarily on projected cash flows. Due to uncertainties in the estimation process, actual results could differ from such estimates. Equity method investments are recorded in Other non-current assets. See
Note 7
for more information on our equity method investments.
124
Perrigo Company plc
- Item 8
Note 1
Derivative Instruments
We record derivative instruments on the balance sheet on a gross basis as either an asset or liability measured at fair value. See
Note 8
for a table indicating where each component is recorded on the Consolidated Balance Sheets. Additionally, changes in a derivative's fair value, which are measured at the end of each period, are recognized in earnings unless specific hedge accounting criteria are met. If hedge accounting criteria are met for cash flow hedges, the changes in a derivative’s fair value are recorded in shareholders’ equity as a component of other comprehensive income ("OCI"), net of tax. These deferred gains and losses are recognized in income in the period in which the hedged item and hedging instrument affect earnings. Any ineffective portion of the change in fair value is immediately recognized in earnings.
We are exposed to credit loss in the event of nonperformance by the counterparties on derivative contracts. It is our policy to manage our credit risk on these transactions by dealing only with financial institutions having a long-term credit rating of "A" or better and by distributing the contracts among several financial institutions to diversify credit concentration risk. Should a counterparty default, our maximum exposure to loss is the asset balance of the instrument. The maximum term of our forward currency exchange contracts is
18
months.
Property, Plant and Equipment, net
Property, plant and equipment, net are recorded at cost and are depreciated using the straight-line method. Useful lives for financial reporting range from
2
to
15
years for machinery and equipment and
10
to
45
years for buildings.
Maintenance and repair costs are charged to earnings, while expenditures that increase asset lives are capitalized. Depreciation expense includes amortization of assets recorded under capital leases and totaled
$100.2 million
,
$53.8 million
,
$84.3 million
, and
$77.9 million
, for the
year ended
December 31, 2016
, the
six months ended
December 31, 2015
, and the
years ended
June 27, 2015
and
June 28, 2014
, respectively.
We held the following property, plant and equipment, net (in millions):
|
December 31,
2016 |
December 31,
2015 |
June 27,
2015 |
|||||||||
|
Land
|
$
|
45.0
|
|
$
|
47.5
|
|
$
|
48.7
|
|
||
|
Buildings
|
520.2
|
|
508.2
|
|
528.3
|
|
|||||
|
Machinery and equipment
|
1,094.7
|
|
1,103.3
|
|
1,094.0
|
|
|||||
|
Gross property and equipment
|
1,659.9
|
|
1,659.0
|
|
1,671.0
|
|
|||||
|
Less accumulated depreciation
|
(789.8
|
)
|
(772.8
|
)
|
(738.6
|
)
|
|||||
|
Property and equipment, net
|
$
|
870.1
|
|
$
|
886.2
|
|
$
|
932.4
|
|
||
125
Perrigo Company plc
- Item 8
Note 1
Tsyabri Royalty Stream - At Fair Value
We are accounting for the Tysabri
®
royalty stream as a financial asset and have elected to use the fair value option model. We made the election to account for the Tysabri
®
financial asset using the fair value option as we believe this method is most appropriate for an asset that does not have a par value, a stated interest stream, or a termination date. The fair value of the Tysabri
®
royalty stream is determined by using a discounted cash flow analysis related to the expected future cash flows to be received. This asset is classified as Level 3 assets within the fair value hierarchy, as our valuation estimates utilize significant unobservable inputs, including estimates as to the probability and timing of future sales of the related products. Critical estimates in determining the fair value are the underlying revenue assumptions of Tysabri
®
sales and the discount rates. The revenue assumptions are impacted by product demand and market growth assumptions, inventory target levels, product approval, currency movements and pricing assumptions. Factors that could cause a change in estimates of future cash flows include a change in estimated market size, entry of a competitive product that would erode market share, manufacturing and approval of a biosimilar equivalent product, a change in pricing strategy or reimbursement coverage, a delay in obtaining regulatory approval, a change in dosage of the product, and a change in the number of treatments.
Goodwill and Intangible Assets
Goodwill
Goodwill represents amounts paid for an acquisition in excess of the fair value of net assets received. Goodwill is tested for impairment annually on the first day of our fourth quarter, or more frequently if changes in circumstances or the occurrence of events suggest an impairment exists.
The test for impairment requires us to make several estimates about fair value, most of which are based on projected future cash flows and market valuation multiples. The estimates associated with the goodwill impairment tests are considered critical due to the judgments required in determining fair value amounts, including projected discounted future cash flows. Changes in these estimates may result in the recognition of an impairment loss. Due to the changes in our segment structure, effective in the quarter ended
December 31, 2016
, we performed our annual goodwill testing as of October 2, 2016 for both the new and old segment structures. Our annual impairment test was performed as of September 27, 2015, March 29, 2015, and March 30, 2014, for the
six months ended
December 31, 2015
, and our
years ended
June 27, 2015
and
June 28, 2014
, respectively.
Intangible Assets
We have intangible assets that we have acquired through various business acquisitions and include trademarks, trade names and brands, in-process research and development ("IPR&D"), developed product technology/formulation and product rights, distribution and license agreements, customer relationships and distribution networks, and non-compete agreements. The assets are typically initially valued using one of the following valuation methods:
|
•
|
Relief from royalty method
: This method assumes that if the acquired company did not own the intangible asset or intellectual property, it would be willing to pay a royalty for its use. The benefit of ownership of the intellectual property is valued as the relief from the royalty expense that would otherwise be incurred. We typically use this method for valuing readily transferable intangible assets that have licensing appeal, such as trade names and trademarks and certain technology assets.
|
|
•
|
Multi-period excess earnings method
: This method starts with a forecast of the net cash flows expected to be generated by the asset over its estimated useful life. These cash flows are then adjusted to present value by applying an appropriate discount rate that reflects the risk factors associated with the cash flow streams. We typically use this method for valuing intangible assets such as developed product technology, customer relationships, product formulations and IPR&D.
|
|
•
|
Lost income method
: This method estimates the fair value of an asset by comparing the value of the business, inclusive of the asset, to the hypothetical value of the same business excluding the asset.
|
126
Perrigo Company plc
- Item 8
Note 1
Indefinite-lived intangible assets include IPR&D and certain trademarks, trade names, and brands. IPR&D assets are recognized at fair value and are classified as indefinite-lived assets until the successful completion or abandonment of the associated research and development efforts. If the associated research and development is completed, the IPR&D asset becomes a definite-lived intangible asset and is amortized over the asset's assigned useful life. If it is abandoned, an impairment loss is recorded.
We test indefinite-lived trademarks, trade names, and brands for impairment annually, or more frequently if changes in circumstances or the occurrence of events suggest impairment exists, by comparing the carrying value of the assets to their estimated fair values. An impairment loss is recognized if the carrying amount of the asset is not recoverable and its carrying amount exceeds its fair value.
Definite-lived intangible assets consist of a portfolio of developed product technology/formulation and product rights, distribution and license agreements, customer relationships, non-compete agreements, and certain trademarks, trade names, and brands. The assets are amortized on either a straight-line basis or proportionately to the benefits derived from those relationships or agreements. Useful lives vary by asset type and are determined based on the period over which the intangible asset is expected to contribute directly or indirectly to our future cash flows. We also review all other long-lived assets that have finite lives and that are not held for sale for impairment when indicators of impairment are evident by comparing the carrying value of the assets to their estimated future undiscounted cash flows.
See
Note 3
for further information on our goodwill and intangible assets.
Assets Held for Sale
We classify assets as "held for sale" when management approves and commits to a formal plan of sale with the expectation the sale will be completed within one year. The net assets of the business held for sale are then recorded at the lower of their current carrying value and the fair market value, less costs to sell. See
Note 9
for further information on our assets held for sale.
Deferred Financing Fees
We record deferred financing fees as a reduction of long-term debt.
Share-Based Awards
We measure and record compensation expense for all share-based awards based on estimated grant date fair values, and net of any estimated forfeitures over the vesting period of the awards. Forfeiture rates are estimated at the grant date based on historical experience and adjusted in subsequent periods for any differences in actual forfeitures from those estimates.
We estimate the fair value of stock option awards granted based on the Black-Scholes option pricing model, which requires the use of subjective and complex assumptions. These assumptions include estimating the expected term that awards granted are expected to be outstanding, the expected volatility of our stock price for a period commensurate with the expected term of the related options, and the risk-free rate with a maturity closest to the expected term of the related awards. Restricted stock and restricted stock units are valued based on our stock price on the day the awards are granted. See
Note 12
for further information on our share-based awards.
Income Taxes
Due to a change in accounting guidance, we changed our accounting policy as of December 31, 2015 to record deferred income tax assets and liabilities on the balance sheet as noncurrent based upon the difference between the financial reporting and the tax reporting basis of assets and liabilities using the enacted tax rates. The policy change is applied prospectively, thus the June 27, 2015 financial statements have not been reclassified to reflect the reclassification of deferred tax assets and liabilities from current to noncurrent. To the extent that available evidence raises doubt about the realization of a deferred income tax asset, a valuation allowance is established.
127
Perrigo Company plc
- Item 8
Note 1
We have provided for income taxes for certain earnings of certain foreign subsidiaries which have not been deemed to be permanently reinvested. For those foreign subsidiaries we have deemed to be permanently reinvested we have provided no further tax provision.
We record reserves for uncertain tax positions to the extent it is more likely than not that the tax position will be sustained on audit, based on the technical merits of the position. Periodic changes in reserves for uncertain tax positions are reflected in the provision for income taxes. We include interest and penalties attributable to uncertain tax positions and income taxes as a component of our income tax provision.
Legal Contingencies
We are involved in product liability, patent, commercial, regulatory and other legal proceedings that arise in the normal course of business. We record a liability when a loss is considered probable and the amount can be reasonably estimated. If the reasonable estimate of a probable loss is a range and no amount within that range is a better estimate, the minimum amount in the range is accrued. If a loss is not probable or a probable loss cannot be reasonably estimated, no liability is recorded. We have established reserves for certain of our legal matters, as described in
Note 16
. We also separately record any insurance recoveries that are probable of occurring.
Research and Development
All R&D costs, including payments related to products under development and research consulting agreements, are expensed as incurred. We may continue to make non-refundable payments to third parties for new technologies and for R&D work that has been completed. These payments may be expensed at the time of payment depending on the nature of the payment made. R&D expense was
$184.0 million
,
$88.2 million
,
$187.8 million
, and
$152.5 million
for the
year ended
December 31, 2016
, the
six months ended
December 31, 2015
, and the
years ended
June 27, 2015
and
June 28, 2014
, respectively.
The
year ended
December 31, 2016
included R&D expense related to clinical trials primarily in our CHCA and
RX
segments. The
six months ended
December 31, 2015
included incremental R&D expense attributable to the Omega Pharma Invest N.V. ("Omega") acquisition. The
year ended
June 27, 2015
included incremental R&D expense related to a collaboration agreement entered into as a result the Omega acquisition. The
year ended
June 28, 2014
included incremental R&D expense due to the Sergeant's, Velcera, and Aspen acquisitions, as discussed in
Note 2
, as well as R&D expense related to the novel therapeutic agent for Alzheimer's disease ("ELND005") Phase 2 clinical program in collaboration with Transition Therapeutics Inc. ("Transition") that we assumed in the Elan acquisition. We ended our collaboration with Transition during the third quarter of the year ended
June 28, 2014
and are no longer responsible for ongoing development activities and costs associated with ELND005. See
Note 17
for additional information on collaboration agreements.
We actively collaborate with other pharmaceutical companies to develop, manufacture and market certain products or groups of products. We may choose to enter into these types of agreements to, among other things, leverage our or others’ scientific research and development expertise or utilize our extensive marketing and distribution resources. Our policy on accounting for costs of strategic collaborations determines the timing of the recognition of certain development costs. In addition, this policy determines whether the cost is classified as development expense or capitalized as an asset. Management is required to form judgments with respect to the commercial status of such products in determining whether development costs meet the criteria for immediate expense or capitalization. For example, when we acquire certain products for which there is already an Abbreviated New Drug Application ("ANDA") or New Drug Application ("NDA") approval directly related to the product, and there is net realizable value based on projected sales for these products, we capitalize the amount paid as an intangible asset. If we acquire product rights that are in the development phase and as to which we have no assurance that the third party will successfully complete its development milestones, we expense the amount paid. See
Note 17
for more information on our current collaboration agreements.
Advertising Costs
We expense advertising costs as incurred. Advertising costs were
$155.9 million
,
$77.5 million
,
$55.7 million
, and
$41.4 million
for the
year ended
December 31, 2016
, the
six months ended
December 31, 2015
, and the
years ended
June 27, 2015
,
and
June 28, 2014
, respectively. Advertising costs relate primarily to print advertising, direct mail, on-line advertising and social media communications. For the
year ended
December 31, 2016
,
93%
of advertising expense was attributable to our
CHCI
segment.
Earnings per Share ("EPS")
Basic EPS is calculated using the weighted-average number of ordinary shares outstanding during each period. It excludes both the dilutive effects of additional common shares that would have been outstanding if the shares issued under stock incentive plans had been exercised and the dilutive effect of restricted shares and restricted share units, to the extent those shares and units have not vested. Diluted EPS is calculated including the effects of shares and potential shares issued under stock incentive plans, following the treasury stock method.
Defined Benefit Plans
As part of the Omega acquisition during the
year ended
June 27, 2015
, we assumed the liabilities under a number of defined benefit plans for employees based primarily in the Netherlands, Germany, France and Norway. Omega companies operate various pension plans across each country.
Two significant assumptions, the discount rate and the expected rate of return on plan assets, are important elements of expense and liability measurement. We evaluate these assumptions annually. Other assumptions involve employee demographic factors, such as retirement patterns, mortality, turnover, and the rate of compensation increase.
The liability recognized in the balance sheet in respect of defined benefit pension plans is the present value of the defined benefit obligation at the balance sheet date less the fair value of plan assets. The defined benefit obligation is calculated periodically by independent actuaries using the projected unit credit method. The present value of the defined benefit obligation is determined by discounting the estimated future cash outflows using interest rates of high quality corporate bonds that are denominated in the currency in which the benefits will be paid and that have terms to maturity approximating the terms of the related pension liability.
Actuarial gains and losses are recognized using the corridor method. Under the corridor method, to the extent that any cumulative unrecognized net actuarial gain or loss exceeds 10% of the greater of the present value of the defined benefit obligation and the fair value of the plan assets, that portion is recognized over the expected average remaining working lives of the plan participants. Otherwise, the net actuarial gain or loss is recorded in OCI. We recognize the funded status of benefit plans on the Consolidated Balance Sheets. In addition, we recognize the gains or losses and prior service costs or credits that arise during the period but are not recognized as components of net periodic pension cost of the period as a component of OCI. See
Note 15
for further information on our defined benefit plans.
Recent Accounting Standard Pronouncements
Below are recent accounting standard updates that we are still assessing to determine the effect on our consolidated financial statements. We do not believe that any other recently issued accounting standards could have a material effect on our consolidated financial statements. As new accounting pronouncements are issued, we will adopt those that are applicable under the circumstances.
|
Recently Issued Accounting Standards Adopted
|
||||||
|
Standard
|
Description
|
Date of adoption
|
Effect on the Financial Statements or Other Significant Matters
|
|||
|
Classification of Certain Cash Receipts and Cash Payments
|
This guidance amends and clarifies the current guidance to reduce diversity in practice of the classification of certain cash receipts and payments in the statement of cash flows.
|
December 31, 2016
|
As of December 31, 2016, we reported $2.6 million of contingent consideration payments in the investing section of the statement of cash flows. This adoption did not affect prior years presented.
|
|||
|
Recently Issued Accounting Standards Not Yet Adopted
|
||||||
|
Standard
|
Description
|
Effective Date
|
Effect on the Financial Statements or Other Significant Matters
|
|||
|
Improvements to Employee Share-Based Payment Accounting
|
This guidance is intended to simplify several aspects of the accounting for share-based payment award transactions. It will require all income tax effects of awards to be recorded through the income statement when they vest or settle as opposed to certain amounts being recorded in additional paid-in capital. An entity will also have to elect whether to account for forfeitures as they occur or by estimating the number of awards expected to be forfeited and adjusting the estimate when it is likely to change (as currently required). The guidance will also increase the amount an employer can withhold to cover income taxes on awards.
|
January 1, 2017
|
We will adopt this standard as of January 1, 2017.
|
|||
|
Clarifying the Definition of a Business
|
This update clarifies the definition of a business and addresses whether transactions should be accounted for as asset acquisitions or business combinations (or divestitures). The guidance includes a screen that an acquired set will not be considered a business if substantially all of the fair value of the assets acquired is concentrated in a single tangible or identifiable intangible asset (or group of similar assets).The guidance also includes a framework to determine whether a substantive process is included in a set of acquired assets and activities. In order to have a substantive process, the acquired set should include an organized workforce, among other factors. Further, the guidance removes language stating that a business need not include all of the inputs and processes that the seller used in operating the business.
|
January 1, 2018
|
We are currently evaluating the implications of adoption on our consolidated financial statements.
|
|||
|
Recently Issued Accounting Standards Not Yet Adopted (continued)
|
||||||
|
Standard
|
Description
|
Effective Date
|
Effect on the Financial Statements or Other Significant Matters
|
|||
|
Revenue from Contracts with Customers
|
The core principle of the guidance is that an entity should recognize revenue to depict the transfer of promised goods or services to customers in an amount that reflects the consideration to which the entity expects to be entitled in exchange for those goods or services. To achieve that core principle, an entity should apply the following steps: identify the contract(s) with a customer; identify the performance obligations in the contract; determine the transaction price; allocate the transaction price to the performance obligations in the contract; and recognize revenue when (or as) the entity satisfies a performance obligation. This guidance allows for two adoption methods, full retrospective approach or modified retrospective approach.
|
January 1, 2018
|
We are currently evaluating the possible adoption methodologies and the implications of adoption on our consolidated financial statements. We have completed an initial assessment of the adoption and are in the process of completing a detailed review of our various customer contracts. Based on our initial analysis, we do not expect there to be a material impact on our revenue recognition practices. We are currently still evaluating the overall impact of the new revenue standard. We plan to adopt the new revenue standard effective January 1, 2018 using the modified retrospective approach and we continue to evaluate the effect of the standard on the ongoing financial reporting.
|
|||
|
Intra-Entity Asset Transfers of Assets Other Than Inventory
|
Under the new guidance, the tax impact to the seller on the profit from the transfers and the buyer’s deferred tax benefit on the increased tax basis would be recognized when the transfers occur resulting in the recognition of expense sooner, as opposed to historical guidance. The guidance excludes intra-entity transfers of inventory. For intra-entity transfers of inventory, the FASB decided to retain current GAAP, which requires an entity to recognize the income tax consequences when the inventory has been sold to an outside party.
|
January 1, 2018
|
We are currently evaluating the implications of adoption on our consolidated financial statements and considering whether to early adopt the standard.
|
|||
|
Leases
|
This guidance was issued to increase transparency and comparability among organizations by requiring recognition of lease assets and lease liabilities on the balance sheet and disclosure of key information about leasing arrangements. For leases with a term of 12 months or less, lessees are permitted to make an election to not recognize right-of-use assets and lease liabilities. Upon adoption, lessees will apply the new standard as of the beginning of the earliest comparative period presented in the financial statements, however lessees will be able to exclude leases that expire as of the implementation date. Early adoption is permitted.
|
January 1, 2019
|
We are currently evaluating the implications of adoption on our consolidated financial statements and considering whether to early adopt the standard.
|
|||
|
Measurement of Credit Losses on Financial Instruments
|
This guidance changes the impairment model for most financial assets and certain other instruments, replacing the current "incurred loss" approach with an "expected loss" credit impairment model, which will apply to most financial assets measured at amortized cost and certain other instruments, including trade and other receivables, loans, held-to-maturity debt securities, and off-balance sheet credit exposures such as letters of credit. Early adoption is permitted.
|
January 1, 2020
|
We are currently evaluating the new standard for potential impacts on our receivables, debt, and other financial instruments and considering whether to early adopt the standard.
|
|||
NOTE 2 -
ACQUISITIONS AND DIVESTITURES
All of the below acquisitions, with the exception of the generic Benzaclin™ product purchase, have been accounted for under the acquisition method of accounting based on our analysis of the acquired inputs and processes, and the related assets acquired and liabilities assumed were recorded at fair value as of the acquisition date.
128
Perrigo Company plc
- Item 8
Note 2
Fair value estimates are based on a complex series of judgments about future events and rely heavily on estimates and assumptions. The judgments used to determine the estimated fair value assigned to each class of assets and liabilities assumed, as well as asset lives, can materially impact our results of operations.
The effects of all of the acquisitions described below were included in the Consolidated Financial Statements prospectively from the date of each acquisition. Unless otherwise indicated, acquisition costs incurred were immaterial and were recorded in Administration expense.
Acquisitions Completed During the
Year Ended
December 31, 2016
Generic Benzaclin
™
Product
On
August 2, 2016
, we purchased the remaining
60.9%
product rights to a generic Benzaclin™ product ("Generic Benzaclin™"), which we had developed and marketed in collaboration with Barr Laboratories, Inc. ("Barr"), a subsidiary of Teva Pharmaceuticals, for
$62.0 million
in cash. In September 2007, we entered into an initial development, marketing and commercialization agreement with Barr, in which Barr contributed to the product's development costs and we developed and marketed the product in the U.S. and Israel. Under this agreement, we paid Barr a percentage of net income from the product's sales in these territories, adjusted for Barr's contributions to the product's development costs. By purchasing the remaining product rights from Barr, we are now entitled to 100% of income from sales of the product. Operating results attributable to Generic Benzaclin™ are included within our
RX
segment. The intangible asset acquired is a distribution and license agreement with a
nine
-year useful life.
Tretinoin Product Portfolio
On
January 22, 2016
, we acquired a portfolio of generic dosage forms and strengths of
Retin-A
®
(tretinoin), a topical prescription acne treatment, from Matawan Pharmaceuticals, LLC, for
$416.4 million
in cash ("Tretinoin Products"), which further expanded our standard topical products such as creams, lotions, gels, as well as inhalants and injections ("extended topicals") portfolio. We were the authorized generic distributor of these products from 2005 to 2013. Operating results attributable to the acquisition are included within our
RX
segment. The intangible assets acquired included generic product rights valued using the multi-period excess earnings method and assigned a
20
-year useful life, and non-compete agreements valued using the lost income method and assigned a
five
-year useful life. The goodwill acquired is deductible for tax purposes.
Development-Stage Rx Products
In May 2015, we entered into an agreement with a clinical stage biotechnology company for two specialty pharmaceutical products in development ("Development-Stage Rx Products"). We paid
$18.0 million
for an option to acquire the two products, which was recorded in Research and Development expense. On
March 1, 2016
, to further invest in our specialty "prescription only" ("Rx") portfolio, we exercised the option for both products, which requires us to make contingent payments if we obtain regulatory approval and achieve certain sales milestones. We will also be obligated to make certain royalty payments over periods ranging from
seven
to
ten
years from the launch of each product.
We accounted for the option exercise as a business acquisition within our
RX
segment, recording IPR&D and contingent consideration on the balance sheet. The IPR&D was valued using the multi-period excess earnings method and has an indefinite useful life until such time as the research is completed (at which time it will become a definite-lived intangible asset), or is determined to have no future use (at which time it would be impaired). The contingent consideration is an estimate of the future milestone payments and royalties based on probability-weighted outcomes, sensitivity analysis, and discount rates reflective of the risk involved. The amount of contingent consideration recognized was
$24.9 million
and was recorded in
Other non-current liabilities
.
129
Perrigo Company plc
- Item 8
Note 2
Purchase Price Allocation of Current Year Acquisitions
The purchase accounting allocations for four small product acquisitions in our
CHCA
,
CHCI
, and
RX
segments (included in "All Other" in the table below) were finalized during the three months ended December 31, 2016. Changes to the allocations were due to adjustments to the intangibles assets and contingent consideration valuation assumptions and were not material.
The below table indicates the purchase price allocations for acquisitions completed during the
year ended
December 31, 2016
(in millions):
|
Tretinoin Products
|
Development-Stage Rx Products
|
All Other
(1)
|
|||||||||
|
Restated
|
|||||||||||
|
Purchase price paid
|
$
|
416.4
|
|
$
|
—
|
|
$
|
17.1
|
|
||
|
Contingent consideration
|
—
|
|
24.9
|
|
26.2
|
|
|||||
|
Total purchase consideration
|
$
|
416.4
|
|
$
|
24.9
|
|
$
|
43.3
|
|
||
|
Assets acquired:
|
|||||||||||
|
Cash and cash equivalents
|
$
|
—
|
|
$
|
—
|
|
$
|
3.8
|
|
||
|
Accounts receivable
|
—
|
|
—
|
|
4.9
|
|
|||||
|
Inventories
|
1.4
|
|
—
|
|
7.1
|
|
|||||
|
Prepaid expenses and other current assets
|
—
|
|
—
|
|
0.1
|
|
|||||
|
Property, plant and equipment
|
—
|
|
—
|
|
1.2
|
|
|||||
|
Goodwill
|
1.7
|
|
—
|
|
—
|
|
|||||
|
Definite-lived intangibles
:
|
|||||||||||
|
Distribution and license agreements, supply agreements
|
—
|
|
—
|
|
1.8
|
|
|||||
|
Developed product technology, formulations, and product rights
|
411.0
|
|
—
|
|
18.0
|
|
|||||
|
Customer relationships and distribution networks
|
—
|
|
—
|
|
8.2
|
|
|||||
|
Non-compete agreements
|
2.3
|
|
—
|
|
—
|
|
|||||
|
Indefinite-lived intangibles
:
|
|||||||||||
|
In-process research and development
|
—
|
|
24.9
|
|
4.9
|
|
|||||
|
Total intangible assets
|
$
|
413.3
|
|
$
|
24.9
|
|
$
|
32.9
|
|
||
|
Total assets
|
$
|
416.4
|
|
$
|
24.9
|
|
$
|
50.0
|
|
||
|
Liabilities assumed:
|
|||||||||||
|
Accounts payable
|
$
|
—
|
|
$
|
—
|
|
$
|
2.8
|
|
||
|
Accrued liabilities
|
—
|
|
—
|
|
0.1
|
|
|||||
|
Long-term debt
|
—
|
|
—
|
|
3.3
|
|
|||||
|
Net deferred income tax liabilities
|
—
|
|
—
|
|
0.5
|
|
|||||
|
Total liabilities
|
$
|
—
|
|
$
|
—
|
|
$
|
6.7
|
|
||
|
Net assets acquired
|
$
|
416.4
|
|
$
|
24.9
|
|
$
|
43.3
|
|
||
|
(1)
|
Consists of
four
product acquisitions in our
CHCA
,
CHCI
and
RX
segments
|
130
Perrigo Company plc
- Item 8
Note 2
Acquisitions Completed During the
Six Months Ended
December 31, 2015
Entocort
®
On
December 15, 2015
, we completed our acquisition of Entocort
®
(budesonide) capsules, as well as the authorized generic capsules, for sale within the U.S., from AstraZeneca plc for
$380.2 million
in cash. Entocort
®
is a gastroenterology medicine for patients with mild to moderate Crohn's disease. The acquisition complemented our Rx portfolio. Operating results attributable to the acquisition are included within our
RX
segment. The intangible assets acquired included branded and authorized generic product rights with useful lives of
10
and
15
years, respectively, which were valued using the multi-period excess earnings method.
Naturwohl Pharma GmbH
On
September 15, 2015
, we completed our acquisition of
100%
of Naturwohl Pharma GmbH ("Naturwohl"), a Munich, Germany-based nutritional business known for its leading German dietary supplement brand, Yokebe
®
. The acquisition built on our
CHCI
segment's OTC product portfolio and European commercial infrastructure. The assets were purchased through an all-cash transaction valued at
€133.5 million
(
$150.4 million
). Operating results attributable to Naturwohl are included in the
CHCI
segment. The intangible assets acquired included a trademark with a
20
-year useful life, customer relationships with a
15
-year useful life, non-compete agreements with a
three
-year useful life, and a licensing agreement with a
three
-year useful life. We utilized the relief from royalty method for valuing the trademark, the multi-period excess earnings method for valuing the customer relationships, and the lost income method for valuing the non-compete agreements and the licensing agreement. The goodwill acquired is not deductible for tax purposes.
ScarAway
®
On
August 28, 2015
, we completed our acquisition of ScarAway
®
, a leading U.S. OTC scar management brand portfolio comprised of
five
products, from Enaltus, LLC, for
$26.7 million
in cash. This acquisition served as our entry into the niche branded OTC business in the U.S. Operating results attributable to ScarAway
®
are included in the
CHCA
segment. The intangible assets acquired included a trademark with a
25
-year useful life, non-compete agreements with a
four
-year useful life, developed product technology with an
eight
-year useful life, and customer relationships with a
15
-year useful life. We utilized the relief from royalty method for valuing the trademark and developed product technology, the multi-period excess earnings method for valuing the customer relationships, and the lost income method for valuing the non-compete agreements. The goodwill acquired is deductible for tax purposes.
GlaxoSmithKline
Consumer Healthcare Product Portfolio
On
August 28, 2015
, we completed our acquisition of a portfolio of well-established OTC brands from GlaxoSmithKline Consumer Healthcare (“GSK Products”). This acquisition further leveraged our European market share and expanded our product offerings. The assets were purchased through an all-cash transaction valued at
€200.0 million
(
$223.6 million
). Operating results attributable to the acquired GSK Products are included primarily in the
CHCI
segment. The intangible assets acquired included trademarks with a
20
-year useful life and customer relationships with a
15
-year useful life. We utilized the relief from royalty method for valuing the trademarks and the multi-period excess earnings method for valuing the customer relationships. The goodwill acquired is deductible for tax purposes and recorded primarily in the
CHCI
segment.
131
Perrigo Company plc
- Item 8
Note 2
Purchase Price Allocation of Acquisitions Completed During the
Six Months Ended
December 31, 2015
The purchase accounting allocations for the Entocort
®
and GSK Products acquisitions were finalized during the three months ended April 2, 2016. Changes to the allocations were due to adjustments to the intangible asset valuation assumptions and were not material. The purchase accounting for all other prior year acquisitions was final as of
December 31, 2015
.
The below table indicates the purchase price allocations for acquisitions completed during the
six months ended
December 31, 2015
(in millions):
|
Entocort
®
|
Naturwohl
|
ScarAway
®
|
GSK Products
|
All Other
(1)
|
|||||||||||||||
|
Purchase price paid
|
$
|
380.2
|
|
$
|
150.4
|
|
$
|
26.7
|
|
$
|
223.6
|
|
$
|
15.3
|
|
||||
|
Contingent consideration
|
—
|
|
—
|
|
—
|
|
—
|
|
13.9
|
|
|||||||||
|
Total purchase consideration
|
$
|
380.2
|
|
$
|
150.4
|
|
$
|
26.7
|
|
$
|
223.6
|
|
$
|
29.2
|
|
||||
|
Assets acquired:
|
|||||||||||||||||||
|
Cash and cash equivalents
|
$
|
—
|
|
$
|
4.6
|
|
$
|
—
|
|
$
|
—
|
|
$
|
—
|
|
||||
|
Accounts receivable
|
—
|
|
3.3
|
|
—
|
|
—
|
|
—
|
|
|||||||||
|
Inventories
|
0.2
|
|
1.5
|
|
1.0
|
|
—
|
|
—
|
|
|||||||||
|
Goodwill
|
—
|
|
61.0
|
|
3.5
|
|
32.6
|
|
—
|
|
|||||||||
|
Definite-lived intangibles
:
|
|||||||||||||||||||
|
Distribution and license agreements, supply agreements
|
—
|
|
21.4
|
|
—
|
|
—
|
|
—
|
|
|||||||||
|
Developed product technology, formulations, and product rights
|
380.0
|
|
—
|
|
0.5
|
|
—
|
|
—
|
|
|||||||||
|
Customer relationships and distribution networks
|
—
|
|
25.9
|
|
9.8
|
|
61.5
|
|
—
|
|
|||||||||
|
Trademarks, trade names, and brands
|
—
|
|
64.2
|
|
11.4
|
|
129.5
|
|
—
|
|
|||||||||
|
Non-compete agreements
|
—
|
|
0.3
|
|
0.5
|
|
—
|
|
—
|
|
|||||||||
|
Indefinite-lived intangibles
:
|
|||||||||||||||||||
|
In-process research and development
|
—
|
|
—
|
|
—
|
|
—
|
|
29.2
|
|
|||||||||
|
Total intangible assets
|
380.0
|
|
111.8
|
|
22.2
|
|
191.0
|
|
29.2
|
|
|||||||||
|
Total assets
|
380.2
|
|
182.2
|
|
26.7
|
|
223.6
|
|
29.2
|
|
|||||||||
|
Liabilities assumed:
|
|||||||||||||||||||
|
Accounts payable
|
—
|
|
2.8
|
|
—
|
|
—
|
|
—
|
|
|||||||||
|
Accrued liabilities
|
—
|
|
1.6
|
|
—
|
|
—
|
|
—
|
|
|||||||||
|
Net deferred income tax liabilities
|
—
|
|
27.4
|
|
—
|
|
—
|
|
—
|
|
|||||||||
|
Total liabilities
|
—
|
|
31.8
|
|
—
|
|
—
|
|
—
|
|
|||||||||
|
Net assets acquired
|
$
|
380.2
|
|
$
|
150.4
|
|
$
|
26.7
|
|
$
|
223.6
|
|
$
|
29.2
|
|
||||
|
(1)
|
Consists of
eight
product development acquisitions in our
CHCA
,
CHCI
and
RX
segments.
|
132
Perrigo Company plc
- Item 8
Note 2
Acquisitions Completed During the
Year Ended
June 27, 2015
Gelcaps Exportadora de Mexico, S.A. de C.V.
On
May 12, 2015
, we completed our acquisition of
100%
of Gelcaps Exportadora de Mexico, S.A. de C.V. ("Gelcaps"), the Mexican operations of Durham, North Carolina-based Patheon Inc., for
$37.9 million
in cash. The acquisition added softgel manufacturing technology to our supply chain capabilities and broadened our presence, product portfolio, and customer network in Mexico. Operating results attributable to Gelcaps are included in the
CHCA
segment. The intangible assets acquired included a trademark with a
25
-year useful life and customer relationships with a
20
-year useful life. We utilized the relief from royalty method for valuing the trademark and the multi-period excess earnings method for valuing the customer relationships.
Based on valuation estimates utilizing the comparative sales method, a step-up in the value of inventory of
$0.6 million
was recorded in the opening balance sheet, which was charged to cost of goods sold during the three months ended June 27, 2015. In addition, property, plant and equipment was written up by
$0.9 million
to its estimated fair market value based on a valuation method that included both the cost and market approaches. This additional step-up in value is being depreciated over the estimated remaining useful lives of the assets. The goodwill recorded is not deductible for tax purposes.
Omega Pharma Invest N.V.
On
March 30, 2015
, we completed our acquisition of Omega, a limited liability company incorporated under the laws of Belgium. Omega was a leading European OTC company and is providing us several key benefits, including advancing our growth strategy outside the U.S. by providing access across a larger global platform with critical mass in key European countries, establishing commercial infrastructure in the high barrier-to-entry European OTC marketplace, strengthening our product portfolio while enhancing scale and distribution, and expanding our international management presence.
We purchased
95.77%
of the issued and outstanding share capital of Omega (
685,348,257
shares) from Alychlo N.V. (“Alychlo”) and Holdco I BE N.V. (together with Alychlo, the “Sellers”), limited liability companies incorporated under the laws of Belgium, under the terms of the Share Purchase Agreement dated November 6, 2014 (the "Share Purchase Agreement"). Omega holds the remaining
30,243,983
shares as treasury shares.
The acquisition was a cash and stock transaction made up of the following consideration (in millions except per share data):
|
Perrigo ordinary shares issued
|
5.4
|
|
||
|
Perrigo per share price at transaction close on March 30, 2015
|
$
|
167.64
|
|
|
|
Total value of Perrigo ordinary shares issued
|
$
|
904.9
|
|
|
|
Cash consideration
|
2,078.3
|
|
||
|
Total consideration
|
$
|
2,983.2
|
|
|
The cash consideration shown in the above table was financed by a combination of debt and equity. We issued
$1.6 billion
of debt as described in
Note 10
, and issued
6.8 million
ordinary shares, which raised
$999.3 million
, net of issuance costs.
The Sellers agreed to indemnify us for certain potential future losses. The Sellers’ indemnification and other obligations to us under the Share Purchase Agreement are secured by up to
€120.9 million
(
$127.2 million
as of
December 31, 2016
) in cash that has been escrowed and
1.08 million
of our ordinary shares, which are both being held in escrow to secure such obligations. Under the terms of the Share Purchase Agreement, Alychlo and its affiliates are subject to a
three
-year non-compete in Europe, and the Sellers are subject to a
two
-year non-solicit, in each case subject to certain exceptions. The Share Purchase Agreement contains other customary representations, warranties, and covenants of the parties, thereto. On December 16, 2016, we commenced an arbitral claim against the Sellers in connection with the Sellers' obligations to us under the Share Purchase Agreement. The fact of the claim has been made public, but the proceedings otherwise remain confidential. The sellers deny liability, refer to
Note 16
for additional information.
133
Perrigo Company plc
- Item 8
Note 2
The operating results attributable to Omega are included in the
CHCI
segment. We incurred general transaction costs (legal, banking and other professional fees), financing fees, and debt extinguishment charges in connection with the Omega acquisition. The amounts recorded were not allocated to a reporting segment. The table below details the acquisition costs, as well as losses on hedging activities associated with the acquisition purchase price, and where they were recorded (in millions):
|
Year Ended
|
|||
|
Line item
|
June 27, 2015
|
||
|
Administration
|
$
|
29.7
|
|
|
Interest expense, net
|
23.7
|
|
|
|
Other expense, net
|
324.0
|
|
|
|
Loss on extinguishment of debt
|
9.6
|
|
|
|
Total acquisition-related costs
|
$
|
387.0
|
|
See
Note 8
for further details on losses on the Omega-related hedging activities shown above in Other expense, net, and
Note 10
for details on the loss on extinguishment of debt.
We acquired the following intangible assets: indefinite-lived brands, a definite-lived trade name with an
eight
-year useful life, definite-lived brands with a
22
-year useful life, a distribution network with a
21
-year useful life, and developed product technology with useful lives ranging from
four
to
13
years. We also recorded goodwill, which is not deductible for tax purposes and represents the value we assigned to the expected synergies described above, in our
CHCI
segment. We utilized the multi-period excess earnings method to value the indefinite-lived brands, the definite-lived brands, and distribution network. We utilized the relief from royalty method to value the developed product technology and definite-lived trade name. The weighted-average useful life of all intangible assets acquired is
20.6
years. See
Note 3
for further detail on Goodwill and Other Intangible Assets.
Based on valuation estimates utilizing the comparative sales method, a step-up in the value of inventory of
$15.1 million
was recorded in the opening balance sheet and was charged to cost of goods sold during the three months ended June 27, 2015. In addition, property, plant and equipment were written up
$41.5 million
to their estimated fair market value based on a valuation method that included both the cost and market approaches. This additional step-up in value is being depreciated over the estimated remaining useful lives of the assets. Additionally, the fair value of the debt assumed
on the date of acquisition exceeded par value by
$101.9 million
, which was recorded as part of the carrying value of the underlying debt and will be amortized as a reduction of interest expense over the remaining terms of the respective debt instruments. For more information on the debt we assumed from Omega and our subsequent payments on the debt, see
Note 10
.
Lumara Health, Inc.
On
October 31, 2014
, we acquired a portfolio of women's healthcare products from Lumara Health, Inc., ("Lumara") a privately-held, Chesterfield, Missouri-based specialty pharmaceutical company, for cash consideration of
$83.0 million
. The acquisition of this portfolio further expanded our women's healthcare product offerings. Operating results attributable to the acquired Lumara products are included in the
RX
segment. The intangible assets acquired consisted of
three
product formulations with useful lives ranging from
eight
to
12
years. The assets were valued utilizing the multi-period excess earnings method.
134
Perrigo Company plc
- Item 8
Note 2
Purchase Price Allocation of Acquisitions Completed During the Year Ended
June 27, 2015
The Gelcaps, Omega, and Lumara opening
balance sheets are final. Measurement period adjustments to the Gelcaps opening balance sheet were not material; there were no measurement period adjustments to the Lumara opening balance sheet. Measurement period adjustment made to the Omega opening balance sheet are shown below. In addition, Omega opening balance sheet adjustments made in connection with the restatement described in Note 1 are included in the Restated June 27, 2015 and December 31, 2015 balances and the Restated measurement period adjustments shown below.
|
June 27,
2015 |
Measurement Period Adjustments
|
December 31,
2015 |
|||||||||
|
Restated
|
Restated
|
Restated
|
|||||||||
|
Accounts receivable
|
$
|
227.4
|
|
$
|
(4.5
|
)
|
$
|
222.9
|
|
||
|
Inventories
|
$
|
288.9
|
|
$
|
(11.9
|
)
|
$
|
277.0
|
|
||
|
Property and equipment
|
$
|
121.2
|
|
$
|
9.6
|
|
$
|
130.8
|
|
||
|
Goodwill
|
$
|
1,269.6
|
|
$
|
419.1
|
|
$
|
1,688.7
|
|
||
|
Intangible assets:
|
|||||||||||
|
Developed product technology, formulations, and product rights
|
$
|
36.9
|
|
$
|
(5.5
|
)
|
$
|
31.4
|
|
||
|
Customer relationships and distribution networks
|
$
|
1,342.7
|
|
$
|
(286.4
|
)
|
$
|
1,056.3
|
|
||
|
Definite-lived trademarks, trade names, and brands
|
$
|
282.0
|
|
$
|
5.5
|
|
$
|
287.5
|
|
||
|
Indefinite-lived trademarks, trade names, and brands
|
$
|
2,145.2
|
|
$
|
(141.4
|
)
|
$
|
2,003.8
|
|
||
|
Total intangible assets
|
$
|
3,806.8
|
|
$
|
(427.8
|
)
|
$
|
3,379.0
|
|
||
|
Accrued liabilities
|
$
|
50.0
|
|
$
|
(0.7
|
)
|
$
|
49.3
|
|
||
|
Net deferred income tax liabilities
|
$
|
771.1
|
|
$
|
14.4
|
|
$
|
785.5
|
|
||
|
Other non-current liabilities
|
$
|
88.9
|
|
$
|
(29.0
|
)
|
$
|
59.9
|
|
||
The measurement period changes in the Omega purchase accounting were due primarily to refinements in the underlying valuation assumptions for the intangible assets, including updates to the allocations of projected cash flows to the intangible assets and the related jurisdictional tax rates that were used in those projections, the accounting of intangible assets as definite-lived versus indefinite-lived assets, and finalization of the related deferred taxes. Valuation adjustments made during the measurement period resulted in a
$10.2 million
reduction of amortization expense (recorded primarily in Selling expense) for the
six months ended
December 31, 2015
that related to the year ended June 27, 2015. See
Note 3
for further detail on Goodwill and Other Intangible Assets.
The restatement adjustments impacting the Omega purchase accounting were due primarily to the BCH Belgium Distribution Contracts described in Note 1 and taxes.
See Note 1 for further detail on the restatement.
135
Perrigo Company plc
- Item 8
Note 2
The below table indicates the purchase price allocation for acquisitions completed during the
year ended
June 27, 2015
(in millions):
|
Gelcaps
|
Omega
Restated* |
Lumara
|
|||||||||
|
Total purchase consideration
|
$
|
37.9
|
|
$
|
2,983.2
|
|
$
|
83.0
|
|
||
|
Assets acquired:
|
|||||||||||
|
Cash and cash equivalents
|
$
|
4.6
|
|
$
|
14.7
|
|
$
|
—
|
|
||
|
Accounts receivable
|
7.3
|
|
222.9
|
|
2.9
|
|
|||||
|
Inventories
|
7.2
|
|
277.0
|
|
1.5
|
|
|||||
|
Prepaid expenses and other current assets
|
2.1
|
|
51.2
|
|
0.4
|
|
|||||
|
Property and equipment
|
6.0
|
|
130.8
|
|
0.1
|
|
|||||
|
Goodwill
|
6.0
|
|
1,688.7
|
|
—
|
|
|||||
|
Definite-lived intangibles
:
|
|||||||||||
|
Developed product technology, formulations, and product rights
|
—
|
|
31.4
|
|
82.0
|
|
|||||
|
Customer relationships and distribution networks
|
6.6
|
|
1,056.3
|
|
—
|
|
|||||
|
Trademarks, trade names, and brands
|
—
|
|
287.5
|
|
—
|
|
|||||
|
Indefinite-lived intangibles
:
|
|||||||||||
|
Trademarks, trade names, and brands
|
4.4
|
|
2,003.8
|
|
—
|
|
|||||
|
Total intangible assets
|
11.0
|
|
3,379.0
|
|
82.0
|
|
|||||
|
Other non-current assets
|
0.4
|
|
2.4
|
|
—
|
|
|||||
|
Total assets
|
44.6
|
|
5,766.7
|
|
86.9
|
|
|||||
|
Liabilities assumed:
|
|||||||||||
|
Accounts payable
|
3.3
|
|
225.0
|
|
—
|
|
|||||
|
Short-term debt
|
—
|
|
112.6
|
|
—
|
|
|||||
|
Accrued liabilities
|
1.6
|
|
49.3
|
|
3.9
|
|
|||||
|
Payroll and related taxes
|
—
|
|
51.3
|
|
—
|
|
|||||
|
Accrued customer programs
|
—
|
|
28.9
|
|
—
|
|
|||||
|
Long-term debt
|
—
|
|
1,471.0
|
|
—
|
|
|||||
|
Net deferred income tax liabilities
|
1.4
|
|
785.5
|
|
—
|
|
|||||
|
Other non-current liabilities
|
0.4
|
|
59.9
|
|
—
|
|
|||||
|
Total liabilities
|
6.7
|
|
2,783.5
|
|
3.9
|
|
|||||
|
Net assets acquired
|
$
|
37.9
|
|
$
|
2,983.2
|
|
$
|
83.0
|
|
||
* Includes opening balance sheet adjustments made as part of the restatement described in
Note 1
.
Acquisitions Completed During the
Year Ended
June 28, 2014
Aspen Global Inc.
On
February 28, 2014
, we acquired a basket of value-brand OTC products sold in Australia and New Zealand from Aspen Global Inc. ("Aspen"). The acquisition of this product portfolio broadened our product offering in Australia and New Zealand and furthered our strategy to expand the
CHCI
portfolio internationally. Operating results attributable to the acquired Aspen products are included in the
CHCI
segment.
The intangible assets acquired consisted of trademarks and trade names, customer relationships, and non-compete agreements. Customer relationships were assigned a
15
-year useful life. Trademarks and trade names were assigned a
25
-year useful life and non-compete agreements were assigned a
five
-year useful life. Goodwill is deductible for tax purposes.
136
Perrigo Company plc
- Item 8
Note 2
Fera Pharmaceuticals, LLC
On
February 18, 2014
, we acquired a distribution and license agreement for the marketing and sale of Methazolomide from Fera Pharmaceuticals, LLC ("Fera"), a privately-held specialty pharmaceutical company. The acquisition of this agreement further expanded our ophthalmic offerings. Operating results attributable to this agreement are included in the
RX
segment. The intangible asset acquired was assigned a
15
-year useful life.
Elan Corporation, plc
On
December 18, 2013
, we acquired Elan, which led to our new corporate structure headquartered in Dublin, Ireland. We have utilized this new structure to continue to grow in our core markets and further expand outside of the U.S. The acquisition also provided us with the Tysabri
®
royalty stream, enhancing our investing cash flows, recurring annual operational synergies, related cost reductions, and tax savings. Certain of these synergies resulted from the elimination of redundant public company costs while optimizing back-office support. The jurisdictional mix of income and the new corporate structure are expected to provide tax benefits to the worldwide structure.
The acquisition was a cash and stock transaction as follows (in millions, except per share data):
|
Elan shares outstanding as of December 18, 2013
|
515.7
|
|
||
|
Exchange ratio per share
|
0.07636
|
|
||
|
Total Perrigo shares issued to Elan shareholders
|
39.4
|
|
||
|
Perrigo per share value at transaction close on December 18, 2013
|
$
|
155.34
|
|
|
|
Total value of Perrigo shares issued to Elan shareholders
|
$
|
6,117.2
|
|
|
|
Cash consideration paid at $6.25 per Elan share
|
3,223.2
|
|
||
|
Cash consideration paid for vested Elan stock options and share awards
|
111.5
|
|
||
|
Total consideration
|
$
|
9,451.9
|
|
|
In addition, we paid cash consideration of
$16.1 million
to the Elan stock option and share award holders for the unvested portion of their awards. This amount was charged to earnings during the
year ended
June 28, 2014.
At the completion of the transaction, the holder of each Elan ordinary share and each Elan American Depositary Share received
$6.25
in cash and
0.07636
of a Perrigo ordinary share. As a result of the transaction, based on the number of outstanding shares of Perrigo and Elan as of
December 18, 2013
, former Perrigo and Elan shareholders held approximately
71%
and
29%
, respectively, of Perrigo's ordinary shares immediately after giving effect to the acquisition.
The operating results for Elan are included in the Specialty Sciences segment. During the
year ended
June 28, 2014, we incurred and expensed acquisition-related costs, which were not allocated to a reporting segment. The costs related primarily to general transaction costs (legal, banking and other professional fees), financing fees, and debt extinguishment. See
Note 10
for further details on the loss on extinguishment of debt.
The table below details these transaction costs and where they were recorded (in millions):
|
Year Ended
|
||||
|
Line item
|
June 28, 2014
|
|||
|
Administration expense
|
$
|
108.9
|
|
|
|
Interest, net
|
10.0
|
|
||
|
Other expense, net
|
0.2
|
|
||
|
Loss on extinguishment of debt
|
165.8
|
|
||
|
Total acquisition-related costs
|
$
|
284.9
|
|
|
137
Perrigo Company plc
- Item 8
Note 2
Through the Elan acquisition we acquired rights to a royalty agreement with Biogen Idec Inc. ("Biogen"), in which we are entitled to royalty payments from Biogen based on its Tysabri
®
revenues in all indications and geographies. The royalty was
12%
for the 12-month period ended May 1, 2014, and for periods subsequent to May 1, 2014,
18%
on annual sales up to
$2.0 billion
and
25%
on annual sales above
$2.0 billion
. See
Note 1
and
Note 6
for further details on how we account for this asset.
Additionally, we recorded
$2.3 billion
of goodwill which represents the expected synergies of the combined company, as described above. The goodwill is not deductible for tax purposes. The following table reflects the allocation by reportable segment (in millions):
|
Segment
|
Goodwill*
Restated
|
|||
|
CHCA
|
$
|
1,287.4
|
|
|
|
RX
|
845.1
|
|
||
|
Specialty Sciences
|
199.5
|
|
||
|
Total
|
$
|
2,332.0
|
|
|
* Includes opening balance sheet adjustment made as part of the restatement described in Note 1.
Purchase Price Allocation of Acquisitions Completed During the Year Ended
June 28, 2014
The purchase price allocations for acquisitions completed during the
year ended
June 28, 2014
are final. We finalized the purchase price allocation for Elan during the
year ended
June 27, 2015. Since June 28, 2014, revisions included a
$13.0 million
decrease in net tax-related liabilities, resulting in a corresponding decrease in goodwill.
138
Perrigo Company plc
- Item 8
Note 2
The below table indicates the purchase price allocations
for acquisitions completed during the
year ended
June 28, 2014
(in millions):
|
Elan*
Restated
|
All Other
(1)
|
||||||
|
Purchase price paid
|
$
|
9,451.9
|
|
$
|
71.0
|
|
|
|
Contingent consideration
|
—
|
|
0.8
|
|
|||
|
Total purchase consideration
|
$
|
9,451.9
|
|
$
|
71.8
|
|
|
|
Assets acquired:
|
|||||||
|
Cash and cash equivalents
|
$
|
1,807.3
|
|
$
|
—
|
|
|
|
Investment securities
|
100.0
|
|
—
|
|
|||
|
Accounts receivable
|
40.6
|
|
—
|
|
|||
|
Inventories
|
—
|
|
3.0
|
|
|||
|
Prepaid expenses and other assets
|
38.1
|
|
—
|
|
|||
|
Property and equipment
|
9.2
|
|
—
|
|
|||
|
Tysabri
®
royalty stream - at fair value
|
5,800.0
|
|
—
|
|
|||
|
Goodwill
|
2,332.0
|
|
4.6
|
|
|||
|
Definite-lived intangibles
:
|
|||||||
|
Distribution and license agreements, supply agreements
|
—
|
|
17.8
|
|
|||
|
Customer relationships and distribution networks
|
—
|
|
9.8
|
|
|||
|
Trademarks, trade names, and brands
|
—
|
|
34.8
|
|
|||
|
Non-compete agreements
|
—
|
|
1.8
|
|
|||
|
Total intangible assets
|
—
|
|
64.2
|
|
|||
|
Other non-current assets
|
93.4
|
|
—
|
|
|||
|
Total assets
|
10,220.6
|
|
71.8
|
|
|||
|
Liabilities assumed:
|
|||||||
|
Accounts payable
|
2.0
|
|
—
|
|
|||
|
Accrued liabilities
|
115.5
|
|
—
|
|
|||
|
Deferred tax liabilities
|
632.4
|
|
—
|
|
|||
|
Other non-current liabilities
|
18.8
|
|
—
|
|
|||
|
Total liabilities
|
768.7
|
|
—
|
|
|||
|
Net assets acquired
|
$
|
9,451.9
|
|
$
|
71.8
|
|
|
* Includes opening balance sheet adjustments made as part of the restatement described in
Note 1
.
|
(1)
|
Includes opening balance sheet of the Aspen and Fera (Methazolomide) product acquisitions.
|
Vedants Drug & Fine Chemicals Private Limited
To further improve the long-term cost position of its API business, on
August 6, 2009
, we acquired an
85%
stake in Vedants Drug & Fine Chemicals Private Limited ("Vedants"), an API manufacturing facility in India, for
$11.5 million
in cash. We purchased the remaining
15%
stake in Vedants during the
year ended
June 28, 2014 for
$7.2 million
in cash, which is reflected in the financing section of the consolidated statement of cash flows for the year end June 28, 2014. The transaction was accounted for as an equity transaction and resulted in the elimination of the noncontrolling interest.
139
Perrigo Company plc
- Item 8
Note 2
Actual and Unaudited Pro Forma Impact of Acquisitions
Our Consolidated Financial Statements include operating results from the Tretinoin Products, Entocort
®
, Naturwohl, GSK Products, ScarAway
®
, Omega, Gelcaps, and Lumara acquisitions, as well as from three small product acquisitions, from the date of each acquisition through
December 31, 2016
. Net sales and operating
income
attributable to acquisitions completed in the current year and included in our financial statements totaled
$85.3 million
and
$45.1 million
, respectively, for the
year ended
December 31, 2016
. Net sales and operating
income
attributable to the Entocort
®
, Naturwohl, ScarAway
®
, and GSK acquisitions included in our financial statements for the
six months ended
December 31, 2015
totaled
$51.0 million
and
$20.6 million
, respectively. Net sales and operating
income
attributable to the Omega, Gelcaps, and Lumara acquisitions included in our financial statements for the
year ended
June 27, 2015
totaled
$418.2 million
and
$18.9 million
, respectively.
The following unaudited pro forma information gives effect to the Tretinoin Products, Entocort
®
, Naturwohl, GSK Products, ScarAway
®
, Omega, Gelcaps, Lumara acquisitions, as well as four small product acquisitions, as if the acquisitions had occurred on the first day of the
year ended
June 27, 2015
and had been included in our Results of Operations for all periods presented thereafter (in millions):
|
Year Ended
|
Six Months Ended
|
Year Ended
|
|||||||||
|
December 31, 2016
|
December 31, 2015
|
June 27,
2015 |
|||||||||
|
(Unaudited)
|
Restated
|
Restated
|
|||||||||
|
Net sales
|
$
|
5,288.6
|
|
$
|
2,748.8
|
|
$
|
5,682.5
|
|
||
|
Net income (loss)
|
$
|
(4,011.0
|
)
|
$
|
81.0
|
|
$
|
250.2
|
|
||
The historical consolidated financial information of Perrigo, and the Tretinoin Products, Entocort
®
, Naturwohl, GSK Products, ScarAway
®
, Omega, Gelcaps, and Lumara acquisitions and the four small product acquisitions, has been adjusted in the pro forma information to give effect to pro forma events that are (1) directly attributable to the transactions, (2) factually supportable and (3) expected to have a continuing impact on combined results. In order to reflect the occurrence of the acquisitions on the first day of the
year ended
June 28, 2014
as required, the unaudited pro forma results include adjustments to reflect the incremental amortization expense to be incurred based on the current values of each acquisition's identifiable intangible and tangible assets, along with the reclassification of acquisition-related costs from the period ended
December 31, 2016
to the period ended
June 28, 2014
. The unaudited pro forma results do not reflect future events that have occurred or may occur after the acquisitions.
The decline in the euro relative to the U.S. dollar negatively impacted pro forma net sales attributed to Omega for the
year ended
June 27, 2015
. If the euro to U.S. dollar exchange rate had remained constant from the
year ended
June 28, 2014
to the
year ended
June 27, 2015
, pro forma net sales attributed to Omega would have increased by an estimated
$189.3 million
(unaudited) for the
year ended
June 27, 2015
.
Divestitures Completed During the
Year Ended
December 31, 2016
On
August 5, 2016
, we completed the sale of our U.S. Vitamins, Minerals, and Supplements ("VMS") business within our
CHCA
segment to International Vitamins Corporation ("IVC") for
$61.8 million
inclusive of an estimated working capital adjustment. The assets and liabilities related to this sale were classified as held-for-sale at December 31, 2015. Prior to closing the sale, we determined that the carrying value of the VMS business exceeded its fair value less the cost to sell, resulting in an impairment charge of
$6.2 million
, which was recorded in Impairment charges on the Condensed Consolidated Statements of Operations during the
year ended
December 31, 2016
.
140
Perrigo Company plc
- Item 8
Note 3
NOTE 3 -
GOODWILL AND OTHER INTANGIBLE ASSETS
Goodwill
Changes in the carrying amount of goodwill (restated), by reportable segment, were as follows (in millions):
|
CHCA
|
CHCI
|
RX
|
Specialty Sciences
|
Other
|
Total
|
||||||||||||||||||
|
Balance at June 28, 2014 (restated)
|
$
|
1,827.9
|
|
$
|
248.2
|
|
$
|
1,098.7
|
|
$
|
200.7
|
|
$
|
97.6
|
|
$
|
3,473.1
|
|
|||||
|
Business acquisitions
|
4.8
|
|
1,269.6
|
|
—
|
|
—
|
|
—
|
|
1,274.4
|
|
|||||||||||
|
Impairments
|
(6.8
|
)
|
—
|
|
—
|
|
—
|
|
—
|
|
(6.8
|
)
|
|||||||||||
|
Currency translation adjustment
|
(1.5
|
)
|
12.4
|
|
(8.0
|
)
|
—
|
|
(9.4
|
)
|
(6.5
|
)
|
|||||||||||
|
Purchase accounting adjustments
|
(7.2
|
)
|
—
|
|
(4.7
|
)
|
(1.1
|
)
|
—
|
|
(13.0
|
)
|
|||||||||||
|
Balance at June 27, 2015 (restated)
|
1,817.2
|
|
1,530.2
|
|
1,086.0
|
|
199.6
|
|
88.2
|
|
4,721.2
|
|
|||||||||||
|
Business acquisitions
|
9.7
|
|
87.4
|
|
—
|
|
—
|
|
—
|
|
97.1
|
|
|||||||||||
|
Changes in assets held for sale
|
(13.0
|
)
|
—
|
|
—
|
|
—
|
|
(14.6
|
)
|
(27.6
|
)
|
|||||||||||
|
Currency translation adjustment
|
(0.8
|
)
|
(53.3
|
)
|
(1.9
|
)
|
—
|
|
(2.1
|
)
|
(58.1
|
)
|
|||||||||||
|
Purchase accounting adjustments
|
1.2
|
|
418.9
|
|
—
|
|
—
|
|
—
|
|
420.1
|
|
|||||||||||
|
Balance at December 31, 2015 (restated)
|
1,814.3
|
|
1,983.2
|
|
1,084.1
|
|
199.6
|
|
71.5
|
|
5,152.7
|
|
|||||||||||
|
Business acquisitions
|
—
|
|
—
|
|
1.7
|
|
—
|
|
—
|
|
1.7
|
|
|||||||||||
|
Purchase accounting adjustments
|
17.2
|
|
(16.5
|
)
|
—
|
|
—
|
|
—
|
|
0.7
|
|
|||||||||||
|
Impairments
|
(24.5
|
)
|
(868.4
|
)
|
—
|
|
(199.6
|
)
|
—
|
|
(1,092.5
|
)
|
|||||||||||
|
Changes in assets held for sale
|
4.5
|
|
—
|
|
—
|
|
—
|
|
9.0
|
|
13.5
|
|
|||||||||||
|
Currency translation adjustment
|
(0.9
|
)
|
(27.5
|
)
|
0.8
|
|
—
|
|
0.9
|
|
(26.7
|
)
|
|||||||||||
|
Balance at December 31, 2016
|
$
|
1,810.6
|
|
$
|
1,070.8
|
|
$
|
1,086.6
|
|
$
|
—
|
|
$
|
81.4
|
|
$
|
4,049.4
|
|
|||||
The decrease in goodwill in the
year ended
December 31, 2016
was due primarily to impairment charges recorded in the
CHCI
and
Specialty Sciences
segments as discussed below. The increase in goodwill in the
six months ended
December 31, 2015
was due primarily to purchase accounting adjustments to the Omega acquisition recorded in the
CHCI
segment as described in
Note 2
, as well as the Naturwohl and GSK acquisitions. The increase in goodwill in the
year ended
June 27, 2015
was due primarily to the Omega acquisition recorded in the
CHCI
segment, as described in
Note 2
. We had accumulated goodwill impairments for the year ended June 27, 2015, six months ended December 31, 2015, and year ended December 31, 2016 of
$6.8 million
,
6.8 million
and
$1.1 billion
, respectively. Refer to
Note 6
for additional information on fair value disclosures related to the goodwill impairments.
In connection with the preparation of our financial statements for the three-month periods ending April 2, 2016 and October 2, 2016, we identified indicators of goodwill impairment for certain of our reporting units, which required us to complete interim goodwill impairment testing. Refer to
Note 1
for our impairment process. Step one of the goodwill impairment test involves determining the fair value of the reporting unit using a discounted cash flow technique and comparing it to the reporting unit’s carrying value. The main assumptions supporting the cash flow projections used to determine the reporting units’ fair value include revenue growth based on product line extensions, product life cycle strategies, and geographical expansion within the markets in which the reporting unit distributes products, gross margins consistent with historical trends, and advertising and promotion investments largely consistent with the reporting unit's growth plans. If a reporting unit does not pass step one of the goodwill impairment test, step two is completed. The second step of the goodwill impairment test requires that we determine the implied fair value of the reporting unit’s goodwill, which involves determining the value of the reporting unit’s individual assets and liabilities. If the reporting unit’s carrying value exceeds its book value, an impairment charge is recorded.
In connection with the preparation of our financial statements for the
three months ended
April 2, 2016, we identified indicators of impairment for our Branded Consumer Healthcare - Rest of World ("BCH-ROW") reporting unit, which comprises primarily operations attributable to the Omega acquisition in all geographic regions except for Belgium. The primary impairment indicators included the decline in our 2016 performance expectations and a reduction in our long-range revenue growth forecast. BCH-ROW did not pass step one of goodwill impairment testing. The change in fair value from previous estimates was due primarily to the changes in the market and
141
Perrigo Company plc
- Item 8
Note 3
performance of the brands such that the evaluation of brand prioritization and product extensions or launches in new regions are being more focused to maximize the potential of all brands in the segment's portfolio. Based on our evaluation and initial estimates of the fair values of the assets and liabilities and the deficit of the fair value when compared to the related book value, we recorded
$130.5 million
in impairment charges for the three months ended April 2, 2016 within our CHCI segment.
In connection with the preparation of our financial statements for the
three months ended
October 1, 2016, we identified additional indicators of goodwill impairment in both our BCH-ROW and our Branded Consumer Healthcare - Belgium ("BCH-Belgium") reporting units. With respect to both reporting units, the primary impairment indicators included an additional decline in our 2016 performance expectations for the remainder of the year and a reduction in our long-range revenue growth and margin forecasts due to the factors outlined below. Neither the BCH-ROW nor the BCH-Belgium reporting units passed step one of goodwill impairment testing.
As it relates to the BCH-ROW reporting unit, the changes in fair value from previous estimates were due primarily to (1) changes in the market and performance of certain brands due to moderated new product launch assumptions, (2) execution of certain key product strategies falling short of expectations causing a reduction to baseline forecast models in France, Germany and Italy and (3) certain macro-economic factors continuing to impact the business more than expected in France, Russia and Turkey in addition to unfavorable foreign currency impacts experienced (primarily in the UK related to Brexit.) As it relates to the BCH-Belgium reporting unit, the changes in fair value from previous estimates were due to changes in the forecasts as a result of a reduction in volume with a major wholesaler due to factors consistent with those outlined for the BCH-ROW reporting unit.
Based on our estimates of the fair values of the assets and liabilities and the deficit of the fair value when compared to the related book value, we recorded an impairment charge of
$675.6 million
related to the BCH-ROW reporting unit and
$62.3 million
related to the BCH-Belgium reporting unit for the three months ended October 1, 2016. We continue to monitor the changes in the market and performance of certain brands, the execution of certain key product strategies, certain macro-economic factors, and unfavorable foreign currency impacts and assess the reporting unit for potential impairment should impairment indicators arise, as applicable, and at least annually during our fourth quarter impairment testing.
During the three months ended December 31, 2016, we identified indicators of goodwill impairment in the BCH-Belgium reporting unit related to the early termination of a distribution agreement. We prepared a goodwill impairment test as of December 3, 2016, which was the end of the month in which the impairment indicator occurred. Step one of the goodwill impairment test indicated that the fair value of the BCH-Belgium reporting unit as greater than its net book value. As a result, we did not perform the second step of the goodwill impairment test.
During the three months ended December 31, 2016, we identified indicators of goodwill impairment in the Animal Health reporting unit related to changes in the market and performance of certain brands. We prepared a goodwill impairment test as of October 2, 2016 as part of our annual goodwill impairment testing process. Step one of the goodwill impairment test indicated that the fair value of the Animal Health reporting unit was below its net book value. As a result, we performed the second step of the goodwill impairment test to measure the amount of impairment. We concluded that Animal Health goodwill was impaired by
$24.5 million
, which we recorded in
Impairment charges
on the Consolidated Statement of Operations within our CHCA segment.
During the
three months ended
December 31, 2016
, we identified indicators of goodwill impairment in the
Specialty Sciences
reporting unit related to our decision to review strategic alternatives for the rights to the royalty stream from sales of the multiple sclerosis drug, Tysabri
®
. As a result of the impairment indicators, we prepared a goodwill impairment test as of
December 31, 2016
. Step one of the goodwill impairment test indicated that the fair value of the
Specialty Sciences
reporting unit was below its net book value. As a result, we initiated the second step of the goodwill impairment test to measure the amount of impairment. We concluded that the goodwill was fully impaired and recorded an impairment of
$199.6 million
during the
year ended
December 31, 2016
in
Impairment charges
on the Consolidated Statement of Operations within our
Specialty Sciences
segment.
In addition, because the fair values of the BCH-Belgium, BCH-ROW, and Animal Health reporting units were determined to be less than their respective net book values during the three months ended October 1, 2016 and December 31, 2016, respectively, these reporting units are inherently at risk for future impairments if they experience further deterioration in business performance or market multiples, or increases in discount rates. The reporting units had the following remaining goodwill balances as of December 31, 2016:
142
Perrigo Company plc
- Item 8
Note 3
|
Reporting Unit
|
Goodwill Remaining in Reporting Unit
|
Segment
|
||||
|
Animal Health
|
$
|
178.9
|
|
CHCA
|
||
|
BCH-Belgium
|
$
|
63.2
|
|
CHCI
|
||
|
BCH-ROW
|
$
|
816.5
|
|
CHCI
|
||
The discounted cash flow forecasts used for these reporting units in goodwill impairment testing include assumptions about the expected future impacts of the reduced activity levels and the anticipated future recovery of activity levels in the longer-term. If the duration of the recovery is slower than expected, we may experience further deterioration in our cash flow forecasts that may indicate goodwill in the reporting units may be impaired in future impairment tests. We continue to monitor the progress and assess the reporting units for potential impairment should impairment indicators arise, as applicable, and at least annually during our fourth quarter impairment testing.
No
impairment charges were recorded as a result of the annual goodwill impairment testing during the six months ended
December 31, 2015
. During the
year ended
June 27, 2015
, we performed our annual goodwill impairment testing, which indicated that our
CHCA
Mexico reporting unit's goodwill fair value was below its net book value as of March 28, 2015. As a result, we initiated the second step of the goodwill impairment test to measure the amount of impairment. We concluded that the goodwill was fully impaired and recorded an impairment of
$6.8 million
in the
CHCA
segment during the
year ended
June 27, 2015
in Impairment charges. No other segments were affected by this impairment charge.
No
impairment charge was recorded as a result of the annual goodwill impairment testing during the
year ended
June 28, 2014
.
Intangible Assets
Other intangible assets and the related accumulated amortization consisted of the following (in millions):
|
|
December 31, 2016
|
December 31, 2015
|
June 27, 2015
|
||||||||||||||||||||
|
|
Gross
|
Accumulated
Amortization
|
Gross
|
Accumulated
Amortization
|
Gross
|
Accumulated Amortization
|
|||||||||||||||||
|
Restated
|
Restated
|
Restated
|
Restated
|
||||||||||||||||||||
|
Definite-lived intangibles
:
|
|||||||||||||||||||||||
|
Distribution and license agreements, supply agreements
|
$
|
305.6
|
|
$
|
120.4
|
|
$
|
242.4
|
|
$
|
77.7
|
|
$
|
218.9
|
|
$
|
58.4
|
|
|||||
|
Developed product technology, formulations, and product rights
|
1,418.1
|
|
526.0
|
|
1,387.6
|
|
426.0
|
|
1,029.6
|
|
383.1
|
|
|||||||||||
|
Customer relationships and distribution networks
|
1,489.9
|
|
307.5
|
|
1,520.7
|
|
193.0
|
|
1,750.0
|
|
146.3
|
|
|||||||||||
|
Trademarks, trade names, and brands
|
1,189.3
|
|
55.3
|
|
539.4
|
|
22.8
|
|
340.8
|
|
11.5
|
|
|||||||||||
|
Non-compete agreements
|
14.3
|
|
11.2
|
|
15.2
|
|
12.7
|
|
14.7
|
|
11.9
|
|
|||||||||||
|
Total definite-lived intangibles
|
$
|
4,417.2
|
|
$
|
1,020.4
|
|
$
|
3,705.3
|
|
$
|
732.2
|
|
$
|
3,354.0
|
|
$
|
611.2
|
|
|||||
|
Indefinite-lived intangibles
:
|
|||||||||||||||||||||||
|
Trademarks, trade names, and brands
|
$
|
50.5
|
|
$
|
—
|
|
$
|
1,868.1
|
|
$
|
—
|
|
$
|
2,257.3
|
|
$
|
—
|
|
|||||
|
In-process research and development
|
64.0
|
|
—
|
|
48.2
|
|
—
|
|
5.8
|
|
—
|
|
|||||||||||
|
Total indefinite-lived intangibles
|
114.5
|
|
—
|
|
1,916.3
|
|
—
|
|
2,263.1
|
|
—
|
|
|||||||||||
|
Total other intangible assets
|
$
|
4,531.7
|
|
$
|
1,020.4
|
|
$
|
5,621.6
|
|
$
|
732.2
|
|
$
|
5,617.1
|
|
$
|
611.2
|
|
|||||
Certain intangible assets are denominated in currencies other than the U.S. dollars; therefore, their gross and net carrying values are subject to foreign currency movements.
The decrease in gross amortizable intangible assets during the
year ended
December 31, 2016
was due to the reclassification of Omega indefinite-lived assets to definite-lived assets as described below, offset by current year impairments taken as described below. The increase during the
six months ended
December 31, 2015
was due to the Entocort
®
, GSK, Naturwohl, and ScarAway
®
acquisitions, offset partially by purchase price adjustments to the Omega intangible assets discussed in
Note 2
. The increase during the
year ended
June 27, 2015
was due primarily to the Omega acquisition.
143
Perrigo Company plc
- Item 8
Note 3
Intangible asset impairments taken are as follows (in millions):
|
Year Ended
|
Six Months Ended
|
Year Ended
|
|||||||||||||||||
|
December 31, 2016
|
December 31, 2015
|
June 28, 2014
|
|||||||||||||||||
|
($ in millions)
|
Indefinite-Lived Intangible Assets
|
Definite-Lived Intangible Assets
|
IPR&D
|
Indefinite-Lived Intangible Assets
|
IPR&D
|
||||||||||||||
|
CHCA
|
$
|
0.4
|
|
$
|
—
|
|
$
|
—
|
|
$
|
—
|
|
$
|
—
|
|
||||
|
CHCI
|
849.1
|
|
321.4
|
|
3.5
|
|
185.1
|
|
—
|
|
|||||||||
|
RX
|
—
|
|
342.2
|
|
—
|
|
—
|
|
6.0
|
|
|||||||||
|
Other
|
—
|
|
2.0
|
|
—
|
|
—
|
|
—
|
|
|||||||||
|
$
|
849.5
|
|
$
|
665.6
|
|
$
|
3.5
|
|
$
|
185.1
|
|
$
|
6.0
|
|
|||||
During our impairment testing for the six months ended December 31, 2015, we identified an impairment of certain indefinite-lived intangible assets based on management’s expectations of the prospects for future revenues, profits, and cash flows associated with these assets. The indefinite-lived intangible assets were purchased in conjunction with the Omega acquisition and are included in the
CHCI
segment. The assessment utilized the excess earnings method to determine fair value and resulted in an impairment charge of
$185.1 million
, which represents the difference between the carrying amount of the intangible assets and their estimated fair value. The amount was recorded in Impairment charges on the Consolidated Statements of Operations within the
CHCI
segment. The primary assumptions supporting the fair value of these assets and cash flow projections assume modest revenue growth based on product line extensions, product life cycle strategies, and geographical expansion within the markets in which the
CHCI
segment currently distributes products, and gross margins and advertising and promotion investments largely consistent with historical trends.
In connection with the preparation of our financial statements for the three-month period ended April 2, 2016, we identified additional indicators of impairment associated with certain indefinite-lived intangible assets acquired in conjunction with the Omega acquisition. The primary impairment indicators included the decline in our 2016 performance expectations and a reduction in our long-range revenue growth forecast. The assessment utilized the excess earnings method to determine fair value and resulted in an impairment charge of
$273.4 million
in
Impairment charges
on the Consolidated Statements of Operations within our
CHCI
segment, which represented the difference between the carrying amount of the intangible assets and their estimated fair value. The change in fair value from previous estimates was due primarily to the changes in the market and performance of the brands such that the evaluation of brand prioritization and product extensions or launches in new regions are being more focused to maximize the potential of all brands in the segment's portfolio. The main assumptions supporting the fair value of these assets and cash flow projections included revenue growth based on product line extensions, product life cycle strategies, and geographical expansion within the markets in which the
CHCI
segment distributes products, gross margins consistent with historical trends, and advertising and promotion investments largely consistent with the segment's growth plans.
In connection with the preparation of our financial statements for the three months ended October 1, 2016, we identified additional indicators of impairment associated with certain indefinite-lived and definite-lived intangible brand category assets acquired in conjunction with the Omega acquisition. The primary impairment indicators are discussed above in goodwill. The assessment of the indefinite-lived assets utilized the excess earnings method to determine fair value and resulted in an impairment charge of
$575.7 million
for the three months ended October 1, 2016. With regards to definite-lived assets, it was determined that the carrying value of one asset group was not recoverable based on an assessment of the undiscounted future cash flows expected to be generated by the asset group. Given this, the excess earnings method was utilized to determine fair value of the definite-lived asset and resulted in an impairment charge of
$290.9 million
for the
three months ended
October 1, 2016. Both charges, which represented the difference between the carrying amount of the intangible assets and their estimated fair value, were recorded in
Impairment charges
on the Consolidated Statements of Operations within our
CHCI
segment. The main assumptions supporting the fair value of these assets and cash flow projections are included in the goodwill discussions above.
144
Perrigo Company plc
- Item 8
Note 3
During the three months ended December 31, 2016, we identified impairment indicators in our Entocort
®
product assets which related to the entrance of new market competition and resulting negative impacts on sales volume and pricing. Utilizing a multi-period excess earnings method, we determined that the Entocort
®
product assets were impaired by
$342.2 million
. We recorded this impairment in
Impairment charges
on the Consolidated Statement of Operations within our
RX
segment.
During the three months ended December 31, 2016, we identified impairment indicators in certain definite-lived intangible assets in our Consumer Healthcare International reporting unit, including trademarks and trade names related to our Herron products that we originally acquired through the acquisition of Aspen. After determining the assets were impaired, we utilized the relief from royalty method to quantify the impairment, resulting in a
$30.5 million
impairment. We recorded these impairments in
Impairment charges
on the Consolidated Statement of Operations within our
CHCI
segment.
No
material impairment charges were recorded as a result of the annual intangible asset impairment testing during the
years ended
June 27, 2015
and
June 28, 2014
. We recorded an impairment charge of
$3.5 million
and
$6.0 million
on certain IPR&D assets during the
years ended
December 31, 2016
and
June 28, 2014
, respectively, due to changes in the projected development and regulatory timelines for various projects.
In addition, due to reprioritization of certain brands in the
CHCI
segment and change in performance expectations for the cough/cold/allergy, anti-parasite, personal care, lifestyle, and natural health brands, we reclassified
$364.5 million
and
$674.2 million
of indefinite-lived assets to definite-lived assets with a useful life of
20
years on April 3, 2016 and October 2, 2016, respectively. We began amortizing the assets in the second quarter of 2016 and fourth quarter of 2016, respectively.
The remaining weighted-average useful life for our amortizable intangible assets by asset class at
December 31, 2016
was as follows:
|
Amortizable Intangible Asset Category
|
Remaining Weighted-Average Useful Life (Years)
|
|
|
Distribution and license agreements, supply agreements
|
7
|
|
|
Developed product technology, formulations, and product rights
|
12
|
|
|
Customer relationships and distribution networks
|
18
|
|
|
Trademarks, trade names, and brands
|
20
|
|
|
Non-compete agreements
|
3
|
|
We recorded amortization expense of
$356.8 million
,
$128.6 million
,
$174.5 million
, and
$128.2 million
during the
year ended
December 31, 2016
, the
six months ended
December 31, 2015
, and the
years ended
June 27, 2015
, and
June 28, 2014
, respectively. The increase in amortization expense in the
year ended
December 31, 2016
was due primarily to the incremental amortization expense incurred on the definite-lived intangible assets acquired from the Omega, Entocort
®
,
and Tretinoin Products acquisitions. In addition, we incurred additional amortization in 2016 due to the previously indefinite-lived Omega brands changing classification to definite-lived during the year. The increase in amortization expense in the
six months ended
December 31, 2015
was due primarily to definite-lived assets acquired from Omega. The increase in amortization expense in the
year ended
June 27, 2015
was due primarily to the inclusion of one quarter of amortization expense related to the intangible assets acquired from Omega.
145
Perrigo Company plc
- Item 8
Note 3
Estimated future amortization expense includes the additional amortization related to recently acquired intangible assets subject to amortization. Our estimated future amortization expense is as follows (in millions):
|
Year
|
Amount
|
|||
|
2017
|
$
|
339.5
|
|
|
|
2018
|
324.6
|
|
||
|
2019
|
299.7
|
|
||
|
2020
|
266.0
|
|
||
|
2021
|
237.5
|
|
||
|
Thereafter
|
1,929.5
|
|
||
NOTE 4 -
ACCOUNTS RECEIVABLE FACTORING
We have multiple accounts receivable factoring arrangements with non-related third-party financial institutions (the “Factors”). Pursuant to the terms of the arrangements, we sell to the Factors certain of our accounts receivable balances on a non-recourse basis for credit approved accounts. An administrative fee ranging from
0.14%
to
0.15%
per invoice is charged on the gross amount of accounts receivables assigned to the Factors, and interest is calculated at the applicable EUR LIBOR rate plus 70 basis points. The total amount factored on a non-recourse basis and excluded from accounts receivable were
$50.7 million
,
$64.5 million
, and
$82.9 million
at
December 31, 2016
,
December 31, 2015
and
June 27, 2015
, respectively.
NOTE 5 -
INVENTORIES
Major components of inventory were as follows (in millions):
|
December 31,
2016 |
December 31,
2015 |
June 27,
2015 |
|||||||||
|
Restated
|
Restated
|
||||||||||
|
Finished goods
|
$
|
431.1
|
|
$
|
537.2
|
|
$
|
563.6
|
|
||
|
Work in process
|
165.7
|
|
151.6
|
|
159.1
|
|
|||||
|
Raw materials
|
198.2
|
|
209.9
|
|
213.0
|
|
|||||
|
Total inventories
|
$
|
795.0
|
|
$
|
898.7
|
|
$
|
935.7
|
|
||
NOTE 6 -
FAIR VALUE MEASUREMENTS
Fair value is the price that would be received upon sale of an asset or paid to transfer a liability in an orderly transaction between market participants at the measurement date. The following fair value hierarchy is used in selecting inputs, with the highest priority given to Level 1, as these are the most transparent or reliable.
|
Level 1:
|
Quoted prices for identical instruments in active markets.
|
|
Level 2:
|
Quoted prices for similar instruments in active markets; quoted prices for identical or similar instruments in markets that are not active; and model-derived valuations in which all significant inputs are observable in active markets.
|
|
Level 3:
|
Valuations derived from valuation techniques in which one or more significant inputs are not observable.
|
146
Perrigo Company plc
- Item 8
Note 6
The following table summarizes the valuation of our financial instruments carried at fair value and measured at fair value on a recurring and non-recurring basis by the above pricing categories (in millions):
|
Fair Value
|
||||||||||||||
|
Fair Value Hierarchy
|
December 31,
2016 |
December 31,
2015 |
June 27,
2015 |
|||||||||||
|
Measured at fair value on a recurring basis:
|
||||||||||||||
|
Assets:
|
||||||||||||||
|
Investment securities
|
Level 1
|
$
|
38.2
|
|
$
|
14.9
|
|
$
|
12.7
|
|
||||
|
Foreign currency forward contracts
|
Level 2
|
3.8
|
|
4.8
|
|
12.4
|
|
|||||||
|
Funds associated with Israeli severance liability
|
Level 2
|
15.9
|
|
17.2
|
|
17.3
|
|
|||||||
|
19.7
|
|
22.0
|
|
29.7
|
|
|||||||||
|
Tysabri
®
royalty stream - at fair value (restated)
|
Level 3
|
2,350.0
|
|
5,310.0
|
|
5,420.0
|
|
|||||||
|
Liabilities:
|
||||||||||||||
|
Interest rate swap agreements
|
Level 2
|
—
|
|
0.3
|
|
—
|
|
|||||||
|
Foreign currency forward contracts
|
Level 2
|
5.0
|
|
3.9
|
|
4.6
|
|
|||||||
|
Total level 2 liabilities
|
5.0
|
|
4.2
|
|
4.6
|
|
||||||||
|
Contingent consideration
|
Level 3
|
$
|
69.9
|
|
$
|
17.9
|
|
$
|
—
|
|
||||
|
Measured at fair value on a non-recurring basis:
|
||||||||||||||
|
Assets:
|
||||||||||||||
|
Goodwill
(1)
|
Level 3
|
$
|
1,148.4
|
|
$
|
—
|
|
$
|
—
|
|
||||
|
Indefinite-lived intangible assets
(2)
|
Level 3
|
0.3
|
|
1,031.8
|
|
—
|
|
|||||||
|
Definite-lived intangible assets
(3)
|
Level 3
|
758.0
|
|
—
|
|
—
|
|
|||||||
|
Assets held for sale, net
|
Level 3
|
18.2
|
|
37.5
|
|
—
|
|
|||||||
|
Total level 3 assets
|
$
|
1,924.9
|
|
$
|
1,069.3
|
|
$
|
—
|
|
|||||
|
(1)
|
Goodwill with a carrying amount of
$2.2 billion
was written down to its implied fair value of
$1.1 billion
resulting in a total impairment charge of
$1.1 billion
.
|
|
(2)
|
Indefinite-lived intangible assets with a carrying amount of
$0.7 million
were written down to a fair value of
$0.3 million
resulting in a total impairment charge of
$0.4 million
.
|
|
(3)
|
Definite-lived intangible assets with a carrying amount of
$2.3 billion
were written down to a fair value of
$758.0 million
resulting in a total impairment charge of
$1.5 billion
. Included in this balance are indefinite-lived intangible assets with fair value of
$364.5 million
and
$674.2 million
that were reclassified to definite-lived assets at April 3, 2016 and October 2, 2016, respectively. Total impairment charges recorded on the indefinite-lived intangible assets were
$849.1 million
.
|
There were no transfers among Level 1, 2, and 3 during the
year ended
December 31, 2016
, the
six months ended
December 31, 2015
, or the
year ended
June 27, 2015
. Our policy regarding the recording of transfers between levels is to record any such transfers at the end of the reporting period. See
Note 7
for information on our investment securities. See
Note 8
for a discussion of derivatives.
Foreign Currency Forward Contracts
The fair value of foreign currency forward contracts is determined using a market approach, which utilizes values for comparable derivative instruments.
147
Perrigo Company plc
- Item 8
Note 6
Funds Associated with Israel Severance Liability
Israeli post-employment benefits represent amounts we have deposited in funds managed by financial institutions designated by management to cover post-employment benefits for our Israeli employees as required by Israeli law. The funds are recorded in Other non-current assets and values are determined using prices for recently traded financial instruments with similar underlying terms, as well as directly or indirectly observable inputs, such as interest rates and yield curves, that are observable at commonly quoted intervals.
Tysabri
®
Royalty Stream - at Fair Value
On
December 18, 2013
, we acquired Elan, which had
a royalty agreement with Biogen Idec Inc. ("Biogen"),
whereby Biogen conveyed the right to receive royalties that are typically payable on sales revenue generated by the sale, distribution or other use of the drug Tysabri
®
. Pursuant to the royalty agreement, we were entitled to royalty payments from Biogen based on its Tysabri
®
sales in all indications and geographies. We received royalties of
12%
on worldwide Biogen sales of Tysabri
®
from December 18, 2013 through April 30, 2014. From May 1, 2014 we received royalties of
18%
on annual worldwide Biogen sales of Tysabri
®
up to
$2.0 billion
and
25%
on annual sales above
$2.0 billion
.
We are accounting for the Tysabri
®
royalty stream as a financial asset and have elected to use the fair value option model. We made the election to account for the Tysabri
®
financial asset using the fair value option as we believe this method is most appropriate for an asset that does not have a par value, a stated interest stream, or a termination date.
The financial asset acquired represents a single unit of accounting. The fair value of the financial asset acquired was determined by using a discounted cash flow analysis related to the expected probability weighted future cash flows to be generated by the royalty stream. The financial asset is classified as a Level 3 asset within the fair value hierarchy, as our valuation utilized significant unobservable inputs,
including industry analyst estimates for global Tysabri
®
sales, probability weighted as to the timing and amount of future cash flows along with certain discount rate assumptions. Cash flow forecasts included the estimated effect and timing of future competition, considering patents in effect for Tysabri
®
through 2024 and contractual rights to receive cash flows into perpetuity. The discounted cash flows are based upon the expected royalty stream forecasted into perpetuity using a
20
-year discrete period with a declining rate terminal value. The pre-tax discount rate utilized was
7.72%
and
7.83%
at December 31, 2015, and June 27, 2015, respectively. Significant judgment is required in selecting appropriate discount rates.
In the first quarter of 2016, a competitor's pipeline product, Ocrevus
®
, received breakthrough therapy designation from the FDA.
Breakthrough therapy designation is when a drug intended alone or in combination with one or more other drugs to treat a serious or life threatening disease or condition and preliminary clinical evidence indicates that the drug may demonstrate substantial improvement over existing therapies on one or more clinically significant endpoints, such as substantial treatment effects observed early in clinical development.
In June 2016 the FDA granted priority review with target action date in December 2016. A
priority review is a
designation when the FDA will direct overall attention and resources to the evaluation of applications for drugs that, if approved, would be significant improvements in the safety or effectiveness of the treatment, diagnosis, or prevention of serious conditions when compared to standard applications. The product was approved in the first quarter of 2017.
The product is expected to compete with Tysabri
®
and we expect it will have a significant negative impact on the Tysabri
®
royalty stream. Although the product has not launched, industry analysts believe that based on released clinical study information, Ocrevus
®
will favorably compete against Tysabri
®
in the relapsing, remitting multiple sclerosis market segment due to its high efficacy and convenient dosage form. Given the new market information for Ocrevus
®
, using industry analyst estimates we reduced our first ten year growth forecasts from an average of growth of approximately
3.4%
in the fourth calendar quarter of 2015 to an average decline of approximately minus
2.0%
in the third and fourth calendar quarters of 2016. In November 2016, we announced we were evaluating strategic alternatives for the Tysabri
®
asset which was completed March 27, 2017. As of December 31, 2016, the financial asset was adjusted based on the strategic review and sale process. These effects, combined with the change in discount rate each quarter, led to a reduction in fair value of
$204.4 million
,
$910.8 million
,
$377.4 million
and
$1.1 billion
in the first, second, third and fourth quarters of 2016, respectively.
At December 31, 2015, and June 27, 2015, an evaluation was performed to assess the discount rate and general market conditions potentially affecting the fair value. As of December 31, 2015, had this discount rate had increased or decreased by
0.5%
, the fair value of the asset would have decreased by
$260.0 million
or increased by
148
Perrigo Company plc
- Item 8
Note 6
$270.0 million
, respectively. As of June 27, 2015, had this discount rate increased or decreased by
0.5%
, the fair value of the asset would have decreased by
$260.0 million
or increased by
$290.0 million
, respectively. The estimated fair value of the asset is subject to variation should those cash flows vary significantly from those estimates. Quarterly, we assess the expected future cash flows and to the extent such payments are greater or less than initial estimates, or the timing of such payments is materially different than the original estimates, we will adjust the estimated fair value of the asset. As of December 31, 2015 if the expected royalty cash flows used in the estimation process had increased or decreased by
5.0%
, the fair value of the asset would have increased by
$270.0 million
or decreased by
$280.0 million
, respecti
vely.
As of June 27, 2015 if the expected royalty cash flows used in the estimation process had increased or decreased by
5.0%
, the fair value of the asset would have increased by
$280.0 million
or decreased by
$280.0 million
, respecti
vely. Refer to
Note 22
for additional information on the divestiture.
The following table summarizes the change in our Consolidated Balance Sheet for the Tysabri
®
Royalty Stream, which includes our fair value adjustment that is a Level 3 measurement under ASC 820 and is included in our Consolidated Statement of Operations for the year ended December 31, 2016, six months ended December 31, 2015, and year ended June 27, 2015 (in millions):
|
Year Ended
|
Six Months Ended
|
Year Ended
|
|||||||||
|
December 31,
2016 |
December 31,
2015 |
June 27,
2015 |
|||||||||
|
Restated
|
Restated
|
||||||||||
|
Tysabri
®
Royalty Stream - at fair value
|
|||||||||||
|
Beginning balance
|
$
|
5,310.0
|
|
$
|
5,420.0
|
|
$
|
5,680.0
|
|
||
|
Royalties earned
|
(351.8
|
)
|
(167.3
|
)
|
(338.5
|
)
|
|||||
|
Change in fair value
|
(2,608.2
|
)
|
57.3
|
|
78.5
|
|
|||||
|
Ending balance
|
$
|
2,350.0
|
|
$
|
5,310.0
|
|
$
|
5,420.0
|
|
||
149
Perrigo Company plc
- Item 8
Note 6
Interest Rate Swaps
The fair values of interest rate swaps are determined using a market approach, which utilizes values for comparable swap instruments.
Contingent Consideration
Contingent consideration represents milestone payment obligations obtained through product acquisitions, which are valued using estimates based on probability-weighted outcomes, sensitivity analysis, and discount rates reflective of the risk involved. The estimates are updated quarterly and the liabilities are adjusted to fair value depending on a number of assumptions, including the competitive landscape and regulatory approvals that may impact the future sales of a product. Purchases or additions for the year ended December 31, 2016 included contingent consideration associated with five transactions.
The table below presents a reconciliation for liabilities measured at fair value on a recurring basis using significant unobservable inputs (Level 3) (in millions). Net realized losses in the table were recorded in Administrative expense.
|
Year Ended
|
Six Months Ended
|
Year Ended
|
|||||||||
|
December 31,
2016 |
December 31,
2015 |
June 27,
2015 |
|||||||||
|
Contingent Consideration
|
|||||||||||
|
Beginning balance
|
$
|
17.9
|
|
$
|
—
|
|
$
|
17.4
|
|
||
|
Net realized (gains) losses
|
(2.1
|
)
|
—
|
|
0.9
|
|
|||||
|
Purchases or additions
|
56.7
|
|
17.9
|
|
—
|
|
|||||
|
Foreign currency effect
|
0.1
|
|
—
|
|
—
|
|
|||||
|
Settlements
|
(2.7
|
)
|
—
|
|
(18.3
|
)
|
|||||
|
Ending balance
|
$
|
69.9
|
|
$
|
17.9
|
|
$
|
—
|
|
||
Non-recurring fair value measurements
The non-recurring fair values represent only those assets whose carrying values were adjusted to fair value during the reporting period. We conduct our goodwill and indefinite-lived intangible asset impairment test on the first day of the fourth quarter, unless indications of impairment exists during an interim period.
Goodwill and Indefinite-Lived Intangible Assets
We have
nine
reporting units for which we assess the goodwill in each reporting unit for impairment. We utilize a comparable company market approach, weighted equally with a discounted cash flow analysis, to determine the fair value of the reporting units
.
We utilize either a relief from royalty method or a multi-period excess earnings method to value our indefinite-lived intangible assets. We use a consistent set of projected financial information for the goodwill and indefinite-lived asset impairment tests. The discounted cash flow analysis that we prepared for goodwill impairment testing purposes for the
year ended
December 31, 2016
included long-term growth rates ranging from of
2.0%
to
3.0%
. We also utilized discount rates ranging from
7.0%
to
14.5%
, which were deemed to be commensurate with the required investment return and risk involved in realizing the projected free cash flows of each reporting unit. In addition, we burdened projected free cash flows with the capital spending deemed necessary to support the cash flows of each reporting unit, and applied the tax rates that were applicable to the jurisdictions represented within each reporting unit. We recorded
Impairment charges
on the Consolidated Statements of Operations related to Goodwill and indefinite-lived intangible assets of
$1.1 billion
and
$0.4 million
, respectively, for the
year ended
December 31, 2016
. We recorded
Impairment charges
on the Consolidated Statements of Operations related to indefinite-lived intangible assets of
$185.1 million
for the six months ended
December 31, 2015
. As of December 31, 2016, the remaining goodwill and indefinite-lived asset balances were
$4.0 billion
and
$114.5 million
, respectively. See
Note 3
for an additional detail on impaired goodwill and indefinite-lived intangible assets.
Definite-Lived Intangible Assets
150
Perrigo Company plc
- Item 8
Note 6
When assessing our definite-lived assets for impairment, we utilize either a multi-period excess earnings method or a relief from royalty method to determine the fair value of the asset and use the forecasts that are consistent with those used in the reporting unit analysis. Below is a summary of the various metrics used in our valuations:
|
Year Ended
|
|||||||||
|
December 31, 2016
|
|||||||||
|
Omega - Lifestyle
|
Omega - XLS
|
Entocort
®
- Branded Products
|
Entocort
®
- AG Products
|
Herron Trade names and Trademarks
|
|||||
|
5-year average growth rate
|
2.5%
|
3.2%
|
(31.7)%
|
(30.4)%
|
4.6%
|
||||
|
Long-term growth rates
|
2.0%
|
NA
|
(10.0)%
|
(4.7)%
|
2.5%
|
||||
|
Discount rate
|
9.3%
|
9.5%
|
13.0%
|
10.5%
|
10.8%
|
||||
|
Royalty rate
|
NA
|
4.0%
|
NA
|
NA
|
11.0%
|
||||
|
Valuation method
|
MPEEM
|
Relief from Royalty
|
MPEEM
|
MPEEM
|
Relief from Royalty
|
||||
We recorded
Impairment charges
on the Consolidated Statements of Operations related to definite-lived intangible assets of
$665.6 million
during the year ended
December 31, 2016
. These impairments were primarily recorded in our BCH-ROW and RX goodwill reporting units. See
Note 3
for an additional detail on impaired definite-lived intangible assets. See
Note 6
for additional information on the fair value metrics.
Assets Held for sale
When a group of assets is classified as held-for-sale, the book value is evaluated and adjusted to the lower of its carrying amount or fair value less the cost to sell. See
Note 9
for additional information on the impaired assets held for sale, net.
Fixed Rate Long-term Debt
As of
December 31, 2016
,
December 31, 2015
, and
June 27, 2015
, our fixed rate long-term debt consisted of public bonds, a private placement note, and retail bonds that were assumed with the Omega acquisition. As of
December 31, 2016
, the public bonds and private placement note had a carrying value and fair value of
$4.6 billion
, based on quoted market prices (Level 1). As of
December 31, 2015
, the public bonds and private placement note had a carrying value of
$3.9 billion
and fair value of
$3.8 billion
, based on quoted market prices (Level 1). As of
June 27, 2015
, the public bonds and private placement note had a carrying value and fair value of
$3.9 billion
, based on quoted market prices (Level 1). As of
December 31, 2016
, our retail bonds had a carrying value of
$773.1 million
(excluding a premium of
$49.8 million
) and a fair value of
$825.0 million
. As of
December 31, 2015
, our retail bonds had a carrying value of
$798.3 million
(excluding a premium of
$82.5 million
) and a fair value of
$859.8 million
. As of
June 27, 2015
, our retail bonds had a carrying value of
$820.9 million
(excluding a premium of
$97.1 million
) and a fair value of
$902.4 million
. The fair values for all periods were based on interest rates offered for borrowings of a similar nature and remaining maturities (Level 2).
The carrying amounts of our other financial instruments, consisting of cash and cash equivalents, accounts receivable, accounts payable, short-term debt and variable rate long-term debt, approximate their fair value.
151
Perrigo Company plc
- Item 8
Note 7
NOTE 7 -
INVESTMENTS
Available for Sale Securities
Our available for sale securities are reported in
Prepaid expenses and other current assets
. Unrealized investment gains (losses) on available for sale securities were as follows (in millions):
|
Year Ended
|
Six Months Ended
|
Year Ended
|
|||||||||
|
December 31,
2016 |
December 31,
2015 |
June 27,
2015 |
|||||||||
|
Net unrealized investment gains (losses):
|
|||||||||||
|
Equity securities, at cost less impairments
|
$
|
16.5
|
|
$
|
6.4
|
|
$
|
17.1
|
|
||
|
Gross unrealized gains
|
21.7
|
|
9.3
|
|
5.7
|
|
|||||
|
Gross unrealized losses
|
—
|
|
(0.8
|
)
|
(10.1
|
)
|
|||||
|
Estimated fair value of equity securities
|
$
|
38.2
|
|
$
|
14.9
|
|
$
|
12.7
|
|
||
The factors affecting the assessment of impairments include both general financial market conditions and factors specific to a particular company. We recorded impairment charges of
$1.8 million
and
$10.7 million
during the
year ended
December 31, 2016
and
six months ended
December 31, 2015
, respectively, related to other-than-temporary impairments of marketable equity securities due to prolonged losses incurred on each of the investments. We have evaluated the near-term prospects of the equity securities in relation to the severity and duration of any impairments, and based on that evaluation, we have the ability and intent to hold these investments until a recovery of fair value.
During the
year ended
December 31, 2016
, we sold a number of our investment securities and recorded a gain of
$1.0 million
. The gain was reclassified out of AOCI and into earnings.
Cost Method Investments
Our cost method investments totaled
$6.9 million
,
$6.9 million
, and
$6.8 million
at
December 31, 2016
,
December 31, 2015
, and
June 27, 2015
, respectively, and were included in
Other non-current assets
.
Equity Method Investments
Our equity method investments totaled
$4.6 million
,
$45.5 million
, and
$47.2 million
at
December 31, 2016
,
December 31, 2015
, and
June 27, 2015
, respectively, and were included in
Other non-current assets
.
Due to significant and prolonged losses incurred on one of our equity method investments, we recorded a
$22.3 million
impairment in Other expense, net, during the
year ended
December 31, 2016
. In addition, during the
year ended
December 31, 2016
, one of our equity method investments became publicly traded. As a result, we transferred the
$15.5 million
investment to available for sale and recorded an
$8.7 million
unrealized gain, net of tax, in OCI, as reflected in the available for sale securities table above.
We recorded net
losses
of
$4.1 million
,
$5.4 million
,
$11.6 million
, and
$8.7 million
during the
year ended
December 31, 2016
, the
six months ended
December 31, 2015
, and the
years ended
June 27, 2015
and
June 28, 2014
, respectively, for our proportionate share of equity method investment earnings or losses. In addition, during the
year ended
June 28, 2014
, we sold one of our equity method investments and recorded a loss of
$2.8 million
. All of the losses noted above were recorded in Other expense, net.
NOTE 8 -
DERIVATIVE INSTRUMENTS AND HEDGING ACTIVITIES
We enter into certain derivative financial instruments, when available on a cost-effective basis, to mitigate our risk associated with changes in interest rates and foreign currency exchange rates as follows:
Interest rate risk management -
We are exposed to the impact of interest rate changes through our cash investments and borrowings. We utilize a variety of strategies to manage the impact of changes in interest rates
152
Perrigo Company plc
- Item 8
Note 8
including using a mix of debt maturities along with both fixed-rate and variable-rate debt. In addition, we may enter into treasury-lock agreements and interest rate swap agreements on certain investing and borrowing transactions to manage our exposure to interest rate changes and our overall cost of borrowing.
Foreign currency exchange risk management -
We conduct business in several major currencies other than the U.S. dollar and are subject to risks associated with changing foreign exchange rates. Our objective is to reduce cash flow volatility associated with foreign exchange rate changes on a consolidated basis to allow management to focus its attention on business operations. Accordingly, we enter into various contracts that change in value as foreign exchange rates change to protect the value of existing foreign currency assets and liabilities, commitments, and anticipated foreign currency sales and expenses.
All derivative instruments are managed on a consolidated basis to efficiently net exposures and thus take advantage of any natural offsets. Gains and losses related to the derivative instruments are expected to be offset largely by gains and losses on the original underlying asset or liability. We do not use derivative financial instruments for speculative purposes.
All of our designated derivatives were classified as cash flow hedges as of
December 31, 2016
,
December 31, 2015
, and
June 27, 2015
. Designated derivatives meet hedge accounting criteria, which means the fair value of the hedge is recorded in shareholders’ equity as a component of OCI, net of tax. The deferred gains and losses are recognized in income in the period in which the hedged item affects earnings. Any ineffective portion of the change in fair value of the derivative is immediately recognized in earnings. All of our designated derivatives are assessed for hedge effectiveness quarterly.
We also have economic non-designated derivatives that do not meet hedge accounting criteria. These derivative instruments are adjusted to current market value at the end of each period through earnings. Gains or losses on these instruments are offset substantially by the remeasurement adjustment on the hedged item.
Interest Rate Swaps and Treasury Locks
Interest rate swap agreements are contracts to exchange floating rate for fixed rate payments (or vice versa) over the life of the agreement without the exchange of the underlying notional amounts. The notional amounts of the interest rate swap agreements are used to measure interest to be paid or received and do not represent the amount of exposure to credit loss. The differential paid or received on the interest rate swap agreements is recognized as an adjustment to interest expense.
During the
six months ended
December 31, 2015
, we entered into a forward interest rate swap to hedge against changes in the benchmark interest rate between the date the interest rate swap was entered into and the date of expected future debt issuance. The interest rate swap was designated as a cash flow hedge and had a notional amount totaling
$200.0 million
. The interest rate swap was settled upon the issuance of an aggregate
$1.2 billion
principal amount of senior notes on March 7, 2016 for a cumulative after-tax
loss
of
$7.0 million
in OCI during the
year ended
December 31, 2016
.
During the year ended June 27, 2015, we repaid a
$300.0 million
term loan with floating interest rates priced off the LIBOR yield curve, see
Note 10
. As a result of the term loan repayment on June 24, 2015, the forward interest rate swap agreements with notional amounts totaling
$240.0 million
that were in place to hedge the change in the LIBOR rate were terminated as well. We recorded a loss of
$3.6 million
in Other expense, net, during the year ended June 27, 2015 for the amount remaining in AOCI when the hedges were terminated.
In connection with the Omega acquisition, we assumed a
$20.0 million
private placement note. We also assumed an interest rate swap agreement with a notional amount totaling
$20.0 million
that was in place to hedge the cross currency exchange differences between the U.S. dollar and the euro on the above-mentioned debt. On May 29, 2015, we repaid the loan and the interest rate swap. We also assumed
€500.0 million
(
$544.5 million
) of debt under Omega's revolving credit facility, as well as an interest rate swap agreement with a notional amount of
€135.0 million
(
$147.0 million
) that was in place to hedge the change in the floating rate on that credit facility. On April 8, 2015, we repaid the loan and terminated the interest rate swap. Because both interest rate swaps mentioned above were recorded at fair market value on the date of termination, no gain or loss was recorded. For more information on the acquired debt and termination, see
Note 10
.
153
Perrigo Company plc
- Item 8
Note 8
During the
year ended
June 27, 2015, we entered into forward interest rate swaps and treasury locks (together "Rate Locks") to hedge against changes in the interest rates between the date the Rate Locks were entered into and the date of the issuance of our 2014 Bonds, discussed in
Note 10
. These Rate Locks were designated as cash flow hedges of expected future debt issuances with a notional amount totaling
$750.0 million
. The Rate Locks were settled upon the issuance of an aggregate
$1.6 billion
principal amount of our 2014 Bonds on December 2, 2014 for a cumulative after-tax
loss
of
$5.8 million
in OCI after recording
$1.1 million
of ineffectiveness to Other expense, net, during the
year ended
June 27, 2015
.
During the year ended June 28, 2014, we entered into forward interest rate swap agreements to hedge against changes in the benchmark interest rate between the date the swap agreements were entered into and the date of the issuance of our 2013 Bonds, discussed in
Note 10
. These swaps were designated as cash flow hedges of expected future debt issuances with a notional amount totaling
$725.0 million
. The interest rate swaps were settled upon the issuance of an aggregate
$2.3 billion
principal amount of our 2013 Bonds on December 18, 2013 for a cumulative after-tax
loss
of
$12.8 million
in OCI after recording
$0.5 million
of ineffectiveness to Other expense, net, during the
year ended
June 28, 2014
.
In addition, due to the retirement of the underlying private placement senior notes (described in
Note 10
as the "Private Placement Notes")
on December 23, 2013, we wrote off the amounts remaining in AOCI associated with the cash flow hedges related to the Private Placement Notes, resulting in an after-tax loss of
$2.6 million
recorded to Other expense, net, during the
year ended
June 28, 2014
.
Foreign Currency Derivatives
We enter into foreign currency forward contracts, both designated and non-designated, in order to manage the impact of foreign exchange fluctuations on expected future purchases and related payables denominated in a foreign currency, as well as to hedge the impact of foreign exchange fluctuations on expected future sales and related receivables, and expected future royalties denominated in a foreign currency. Both types of forward contracts have a maximum maturity date of
18
months. The total notional amount for these contracts was
$533.5 million
,
$755.5 million
, and
$452.3 million
as of
December 31, 2016
,
December 31, 2015
, and
June 27, 2015
, respectively.
In November 2014, in order to economically hedge the foreign currency exposure associated with the planned payment of the euro-denominated purchase price of Omega, we entered into non-designated option contracts with a total notional amount of
€2.0 billion
. The option contracts settled in December 2014, resulting in a loss of
$26.4 million
. The option contracts were replaced with non-designated forward contracts that matured during the
three months ended
March 28, 2015. We recorded losses of
$298.1 million
during the
year ended
June 27, 2015
related to the settlement of the forward contracts.
Both losses were recorded primarily in Other expense, net. The losses on the derivatives due to changes in the euro to U.S. dollar exchange rates were economically offset at closing in the final settlement of the euro-denominated Omega purchase price. In June 2015, in order to economically hedge the foreign currency exposure associated with the planned payment of the euro-denominated GSK Products acquisition discussed in
Note 2
, we entered into a non-designated option contract to protect against a strengthening of the euro relative to the U.S. dollar. We recorded losses of
$1.9 million
for the change in fair value of the option contract during the
year ended
June 27, 2015
in Other expense, net. Because these derivatives were economically hedging future acquisitions, the cash outflows associated with their settlement are shown as investing activity on the Consolidated Statements of Cash Flows.
Effects of Derivatives on the Financial Statements
The below tables indicate the effects of all derivative instruments on the Consolidated Financial Statements. All amounts exclude income tax effects and are presented in millions.
154
Perrigo Company plc
- Item 8
Note 8
The balance sheet location and gross fair value of our outstanding derivative instruments were as follows:
|
Asset Derivatives
|
|||||||||||||
|
Fair Value
|
|||||||||||||
|
Balance Sheet Location
|
December 31,
2016 |
December 31,
2015 |
June 27,
2015 |
||||||||||
|
Designated derivatives:
|
|||||||||||||
|
Foreign currency forward contracts
|
Other current assets
|
$
|
3.1
|
|
$
|
3.8
|
|
$
|
3.3
|
|
|||
|
Total designated derivatives
|
$
|
3.1
|
|
$
|
3.8
|
|
$
|
3.3
|
|
||||
|
Non-designated derivatives:
|
|||||||||||||
|
Foreign currency forward contracts
|
Other current assets
|
$
|
0.7
|
|
$
|
1.0
|
|
$
|
9.1
|
|
|||
|
Total non-designated derivatives
|
$
|
0.7
|
|
$
|
1.0
|
|
$
|
9.1
|
|
||||
|
Liability Derivatives
|
|||||||||||||
|
Fair Value
|
|||||||||||||
|
Balance Sheet Location
|
December 31,
2016 |
December 31,
2015 |
June 27,
2015 |
||||||||||
|
Designated derivatives:
|
|||||||||||||
|
Foreign currency forward contracts
|
Accrued liabilities
|
$
|
3.0
|
|
$
|
2.0
|
|
$
|
2.0
|
|
|||
|
Interest rate swap agreements
|
Other non-current liabilities
|
—
|
|
0.3
|
|
—
|
|
||||||
|
Total designated derivatives
|
$
|
3.0
|
|
$
|
2.3
|
|
$
|
2.0
|
|
||||
|
Non-designated derivatives:
|
|||||||||||||
|
Foreign currency forward contracts
|
Accrued liabilities
|
$
|
2.0
|
|
$
|
1.9
|
|
$
|
2.6
|
|
|||
|
Total non-designated derivatives
|
$
|
2.0
|
|
$
|
1.9
|
|
$
|
2.6
|
|
||||
The gains (losses) recorded in OCI for the effective portion of our designated cash flow hedges were as follows:
|
Amount of Gain/(Loss) Recorded in OCI
(Effective Portion) |
||||||||||||||||
|
Year Ended
|
Six Months Ended
|
Year Ended
|
||||||||||||||
|
Designated Cash Flow Hedges
|
December 31,
2016 |
December 31,
2015 |
June 27,
2015 |
June 28,
2014 |
||||||||||||
|
Treasury locks
|
$
|
—
|
|
$
|
—
|
|
$
|
(2.7
|
)
|
$
|
—
|
|
||||
|
Interest rate swap agreements
|
(9.0
|
)
|
(0.3
|
)
|
(10.1
|
)
|
7.2
|
|
||||||||
|
Foreign currency forward contracts
|
2.1
|
|
1.7
|
|
(7.7
|
)
|
15.1
|
|
||||||||
|
$
|
(6.9
|
)
|
$
|
1.4
|
|
$
|
(20.5
|
)
|
$
|
22.3
|
|
|||||
155
Perrigo Company plc
- Item 8
Note 8
The gains (losses) reclassified from AOCI into earnings for the effective portion of our designated cash flow hedges were as follows:
|
Amount of Gain/(Loss) Reclassified from AOCI to Income
(Effective Portion) |
||||||||||||||||||
|
Year Ended
|
Six Months Ended
|
Year Ended
|
||||||||||||||||
|
Designated Cash Flow Hedges
|
Income Statement
Location
|
December 31,
2016 |
December 31,
2015 |
June 27,
2015 |
June 28,
2014 |
|||||||||||||
|
Treasury locks
|
Interest expense, net
|
$
|
(0.1
|
)
|
$
|
—
|
|
$
|
(0.1
|
)
|
$
|
0.2
|
|
|||||
|
Interest rate swap agreements
|
Interest expense, net
|
(2.3
|
)
|
(0.8
|
)
|
(16.4
|
)
|
3.9
|
|
|||||||||
|
Foreign currency forward contracts
|
Net sales (restated)
|
1.3
|
|
(1.8
|
)
|
1.9
|
|
(2.5
|
)
|
|||||||||
|
Cost of sales
|
3.0
|
|
0.8
|
|
(4.2
|
)
|
(6.3
|
)
|
||||||||||
|
Interest expense, net
|
(1.6
|
)
|
(0.4
|
)
|
—
|
|
(0.2
|
)
|
||||||||||
|
Other expense, net (restated)
|
0.4
|
|
1.1
|
|
(4.4
|
)
|
(2.2
|
)
|
||||||||||
|
$
|
0.7
|
|
$
|
(1.1
|
)
|
$
|
(23.2
|
)
|
$
|
(7.1
|
)
|
|||||||
The net of tax amount expected to be reclassified out of AOCI into earnings during the next 12 months is a
$1.0 million
loss
.
The gains (losses) recognized against earnings for the ineffective portion of our designated cash flow hedges were as follows:
|
Amount of Gain/(Loss) Recognized in Income
(Ineffective Portion) |
||||||||||||||||||
|
Year Ended
|
Six Months Ended
|
Year Ended
|
||||||||||||||||
|
Designated Cash Flow Hedges
|
Income Statement
Location
|
December 31,
2016 |
December 31,
2015 |
June 27,
2015 |
June 28,
2014 |
|||||||||||||
|
Treasury locks
|
Other expense, net
|
$
|
—
|
|
$
|
—
|
|
$
|
(0.4
|
)
|
$
|
2.3
|
|
|||||
|
Interest rate swap agreements
|
Other expense, net
|
(0.1
|
)
|
—
|
|
(0.7
|
)
|
(5.4
|
)
|
|||||||||
|
Foreign currency forward contracts
|
Net sales (restated)
|
(0.1
|
)
|
(0.1
|
)
|
(0.1
|
)
|
(0.1
|
)
|
|||||||||
|
Cost of sales
|
(0.1
|
)
|
0.2
|
|
0.2
|
|
0.3
|
|
||||||||||
|
Other expense, net (restated)
|
0.6
|
|
—
|
|
—
|
|
—
|
|
||||||||||
|
Total
|
$
|
0.3
|
|
$
|
0.1
|
|
$
|
(1.0
|
)
|
$
|
(2.9
|
)
|
||||||
The effects of our fair value hedges on the Consolidated Statements of Operations were as follows:
|
Amount of Gain/(Loss) Recognized in Income
|
||||||||||||||||||
|
Year Ended
|
Six Months Ended
|
Year Ended
|
||||||||||||||||
|
Designated Fair Value Hedges
|
Income Statement
Location
|
December 31,
2016 |
December 31,
2015 |
June 27,
2015 |
June 28,
2014 |
|||||||||||||
|
Interest rate swap agreements
|
Other expense, net
|
$
|
—
|
|
$
|
—
|
|
$
|
—
|
|
$
|
0.9
|
|
|||||
|
Fixed-rate debt
|
Other expense, net
|
—
|
|
—
|
|
—
|
|
(4.1
|
)
|
|||||||||
|
Net hedge
|
$
|
—
|
|
$
|
—
|
|
$
|
—
|
|
$
|
(3.2
|
)
|
||||||
156
Perrigo Company plc
- Item 8
Note 8
The effects of our non-designated derivatives on the Consolidated Statements of Operations were as follows:
|
Amount of Gain/(Loss) Recognized in Income
|
||||||||||||||||||
|
Year Ended
|
Six Months Ended
|
Year Ended
|
||||||||||||||||
|
Non-Designated Derivatives
|
Income Statement
Location
|
December 31,
2016 |
December 31,
2015 |
June 27,
2015 |
June 28,
2014 |
|||||||||||||
|
Foreign currency forward contracts
|
Other expense, net
|
$
|
(2.4
|
)
|
$
|
(8.0
|
)
|
$
|
(295.4
|
)
|
$
|
(0.1
|
)
|
|||||
|
Interest expense, net
|
(2.2
|
)
|
(0.7
|
)
|
(3.4
|
)
|
—
|
|
||||||||||
|
Foreign exchange option contracts
|
Other expense, net
|
—
|
|
—
|
|
(26.4
|
)
|
—
|
|
|||||||||
|
Total
|
$
|
(4.6
|
)
|
$
|
(8.7
|
)
|
$
|
(325.2
|
)
|
$
|
(0.1
|
)
|
||||||
NOTE 9 -
ASSETS HELD FOR SALE
During the
six months ended
December 31, 2015
, management committed to a plan to sell our U.S. VMS and India API businesses. As a result, the net assets attributable to both businesses were classified as held-for-sale beginning at December 31, 2015. As described in
Note 2
, we completed the sale of our U.S. VMS business to IVC on August 5, 2016. In connection with this sale, during the year ended December 31, 2016 we recorded an impairment charge of
$6.2 million
. In addition, we announced we had entered into a definitive agreement to sell our India API business to Strides Shasun Limited on December 9, 2016 and the transaction closed on April 6, 217. During the
three months ended
October 1, 2016, management committed to a plan to sell certain fixed assets associated with our Animal Health pet treats plant. Such assets were classified as held-for-sale beginning at October 1, 2016. On
February 1, 2017
, we completed the sale of the animal health pet treats plant fixed assets and received proceeds of
$7.7 million
.
When a group of assets is classified as held-for-sale, the book value is evaluated and adjusted to the lower of its carrying amount or fair value less the cost to sell. At December 31, 2015, we determined that the carrying value of the India API business exceeded its fair value less cost to sell, resulting in an impairment charge of
$29.0 million
. We recorded additional impairment charges totaling
$6.3 million
during the
year ended
December 31, 2016
. The API business is reported primarily in our Other segment.
At October 1, 2016, we determined that the carrying value of the fixed assets associated with our Animal Health pet treats plant exceeded the fair value less the cost to sell. We recorded impairment charges totaling
$3.7 million
during the
year ended
December 31, 2016
. The assets associated with our Animal Health pet treats plant are reported in our
CHCA
segment.
157
Perrigo Company plc
- Item 8
Note 9
The assets held-for-sale were reported within
Prepaid expenses and other current assets
and liabilities held-for-sale were reported in
Accrued liabilities
. The amounts consisted of the following (in millions):
|
December 31,
2016 |
December 31,
2015 |
||||||||||||||
|
CHCA
|
Other
|
CHCA
|
Other
|
||||||||||||
|
Assets held for sale
|
|||||||||||||||
|
Current assets
|
$
|
—
|
|
$
|
5.1
|
|
$
|
55.1
|
|
$
|
13.6
|
|
|||
|
Goodwill
|
—
|
|
5.5
|
|
13.0
|
|
14.5
|
|
|||||||
|
Property, plant and equipment
|
13.5
|
|
33.2
|
|
18.8
|
|
37.4
|
|
|||||||
|
Other assets
|
—
|
|
3.8
|
|
—
|
|
3.2
|
|
|||||||
|
Less: impairment reserves
|
(3.7
|
)
|
(35.3
|
)
|
—
|
|
(29.0
|
)
|
|||||||
|
Total assets held for sale
|
$
|
9.8
|
|
$
|
12.3
|
|
$
|
86.9
|
|
$
|
39.7
|
|
|||
|
Liabilities held for sale
|
|||||||||||||||
|
Current liabilities
|
$
|
0.1
|
|
$
|
1.9
|
|
$
|
30.5
|
|
$
|
0.5
|
|
|||
|
Other liabilities
|
—
|
|
1.9
|
|
—
|
|
1.7
|
|
|||||||
|
Total liabilities held for sale
|
$
|
0.1
|
|
$
|
3.8
|
|
$
|
30.5
|
|
$
|
2.2
|
|
|||
158
Perrigo Company plc
- Item 8
Note 10
NOTE 10 -
INDEBTEDNESS
Total borrowings outstanding are summarized as follows (in millions):
|
December 31,
2016 |
December 31,
2015 |
June 27,
2015 |
|||||||||||||
|
Revolving credit agreements
|
|||||||||||||||
|
2015 Revolver
|
$
|
—
|
|
$
|
380.0
|
|
$
|
—
|
|
||||||
|
2014 Revolver
|
—
|
|
300.0
|
|
—
|
|
|||||||||
|
Total revolving credit agreements
|
—
|
|
680.0
|
|
—
|
|
|||||||||
|
Term loans
|
|||||||||||||||
|
*
|
2014 Term loan due December 5, 2019
|
420.7
|
|
488.8
|
|
530.5
|
|
||||||||
|
Notes and bonds
|
|||||||||||||||
|
Coupon
|
Due
|
||||||||||||||
|
1.300%
|
November 8, 2016
|
(2)
|
—
|
|
500.0
|
|
500.0
|
|
|||||||
|
*
|
4.500%
|
May 23, 2017
|
(3)
|
189.3
|
|
195.5
|
|
201.0
|
|
||||||
|
*
|
5.125%
|
December 12, 2017
|
(3)
|
315.6
|
|
325.8
|
|
335.0
|
|
||||||
|
2.300%
|
November 8, 2018
|
(2)
|
600.0
|
|
600.0
|
|
600.0
|
|
|||||||
|
*
|
5.000%
|
May 23, 2019
|
(3)
|
126.2
|
|
130.3
|
|
134.1
|
|
||||||
|
3.500%
|
March 15, 2021
|
(4)
|
500.0
|
|
—
|
|
—
|
|
|||||||
|
3.500%
|
December 15, 2021
|
(1)
|
500.0
|
|
500.0
|
|
500.0
|
|
|||||||
|
*
|
5.105%
|
July 19, 2023
|
(3)
|
142.0
|
|
146.7
|
|
150.8
|
|
||||||
|
4.000%
|
November 15, 2023
|
(2)
|
800.0
|
|
800.0
|
|
800.0
|
|
|||||||
|
3.900%
|
December 15, 2024
|
(1)
|
700.0
|
|
700.0
|
|
700.0
|
|
|||||||
|
4.375%
|
March 15, 2026
|
(4)
|
700.0
|
|
—
|
|
—
|
|
|||||||
|
5.300%
|
November 15, 2043
|
(2)
|
400.0
|
|
400.0
|
|
400.0
|
|
|||||||
|
4.900%
|
December 15, 2044
|
(1)
|
400.0
|
|
400.0
|
|
400.0
|
|
|||||||
|
Total notes and bonds
|
5,373.1
|
|
4,698.3
|
|
4,720.9
|
|
|||||||||
|
Other financing (restated)
|
3.6
|
|
128.2
|
|
101.7
|
|
|||||||||
|
Unamortized premium (discount), net
|
33.0
|
|
73.4
|
|
87.6
|
|
|||||||||
|
Deferred financing fees
|
(33.1
|
)
|
(36.6
|
)
|
(40.5
|
)
|
|||||||||
|
Total borrowings outstanding
|
5,797.3
|
|
6,032.1
|
|
5,400.2
|
|
|||||||||
|
Current indebtedness (restated)
|
(572.8
|
)
|
(1,060.5
|
)
|
(153.3
|
)
|
|||||||||
|
Total long-term debt less current portion
|
$
|
5,224.5
|
|
$
|
4,971.6
|
|
$
|
5,246.9
|
|
||||||
|
(1)
|
Discussed below collectively as the "2014 Notes."
|
|
(2)
|
Discussed below collectively as the "2013 Notes."
|
|
(3)
|
Debt assumed from Omega.
|
|
(4)
|
Discussed below collectively as the "2016 Notes."
|
|
*
|
Debt denominated in euros subject to fluctuations in the euro-to-U.S. dollar exchange rate.
|
We entered into amendments on March 16, 2017 related to the 2014 Revolver and the 2014 Term Loan providing for additional time to deliver certain financial statements, as well as the modification of certain financial and other covenants. We also entered into additional amendments to the 2014 Revolver and the 2014 Term Loan on April 25, 2017 to modify provisions of such agreements necessary as a result of the correction in accounting related to the Tysabri
®
royalty stream, as well as waivers of any default or event of default that may arise from any restatement of or deficiencies in our financial statements for the periods specified in such amendments and waivers. No default or event of default existed prior to entering into these amendments and waivers. We are in compliance with all covenants under the 2014 Revolver and the 2014 Term Loan as of the date of this Annual Report on Form 10-K.
As a result of the filing of this Annual Report on Form 10-K, as of the filing date, we are in compliance with all covenants, including the financial statement delivery obligations, under the 2013 Indenture, 2014 Indenture and
159
Perrigo Company plc
- Item 8
Note 10
2016 Indenture. However, if we do not file the Quarterly Report on Form 10-Q for the quarterly period ended April 1, 2017 within 15 calendar days after the due date of such report, we would not be in compliance with the financial statement delivery obligations under such indentures. However, after that date, an investor (or investors) holding 25% or more of one of our tranches under the indentures may ask the trustee (or the trustee may take action on its own) to file a notice with us stating we are in default in the financial statements delivery requirement. If such action is taken, we have 90 calendar days from the date of the notice to file our financial statements before we would have an Event of Default under the indentures.
Revolving Credit Agreements
On
December 9, 2015
, our
100%
owned finance subsidiary, Perrigo Finance Unlimited Company (formerly Perrigo Finance plc) ("Perrigo Finance"), entered into a
$750.0 million
revolving credit agreement (the "2015 Revolver"). On March 15, 2016, we used the proceeds of the long-term debt issuance described below under "2016 Notes" to repay the
$750.0 million
then outstanding under the 2015 Revolver and terminated the facility.
On
March 30, 2015
, we assumed a revolving credit facility with
€500.0 million
(
$544.5 million
) outstanding from Omega. On
April 8, 2015
, we repaid the
€500.0 million
(
$539.1 million
) outstanding under the assumed revolving credit facility and terminated the facility.
On
December 5, 2014
, Perrigo Finance entered into a
$600.0 million
revolving credit agreement, which increased to
$1.0 billion
on March 30, 2015 (the "2014 Revolver"). On March 15, 2016, we used the proceeds of the long-term debt issuance described below under "2016 Notes" to repay the
$435.0 million
then outstanding under the 2014 Revolver. There were no borrowings outstanding under the 2014 Revolver as of
December 31, 2016
.
On
September 6, 2013
, Perrigo Company entered into a
$600.0 million
revolving credit agreement (the "2013 Revolver"). On December 5, 2014, we terminated the 2013 Revolver.
Bridge Agreements
In connection with the Omega acquisition, on
November 6, 2014
, we entered into a
€1.75 billion
(
$2.2 billion
) senior unsecured
364
-day bridge loan facility. Upon issuance of our permanent debt financing described below, the Bridge Loan Facility was terminated on December 3, 2014. At no time did we draw upon the Bridge Loan Facility.
Term Loans
On
December 5, 2014
, Perrigo Finance entered into a term loan agreement consisting of a
€500.0 million
(
$614.3 million
) tranche, with the ability to draw an additional
€300.0 million
(
$368.6 million
) tranche, maturing December 5, 2019, and we entered into a
$300.0 million
term loan tranche maturing December 18, 2015, which we repaid in full on June 25, 2015. During the
year ended
December 31, 2016
, we made
$55.0 million
in scheduled principal payments on the euro-denominated term loan.
On
September 6, 2013
, Perrigo Company entered into a
$1.0 billion
term loan agreement (the "2013 Term Loan") (together with the 2013 Revolver, the "2013 Credit Agreements"). The 2013 Term Loan consisted of a
$300.0 million
tranche maturing December 18, 2015 and a
$700.0 million
tranche maturing December 18, 2018. Both tranches were drawn in full on December 18, 2013. Amounts outstanding under the 2013 Credit Agreements bore interest at our option (a) at the alternative base rate or (b) the eurodollar rate plus, in either case, applicable margins as set forth in the 2013 Credit Agreements. Perrigo Company obligations under the 2013 Credit Agreements were guaranteed by Perrigo Company plc, certain U.S. subsidiaries of Perrigo Company plc, Elan, and certain Irish subsidiaries of Elan until November 21, 2014, at which time the terms of the 2013 Credit Agreements were amended to remove all guarantors. On December 5, 2014, we repaid the remaining
$895.0 million
outstanding under our 2013 Term Loan, then terminated it. We recorded a
$10.5 million
loss on extinguishment of debt during the
year ended
June 27, 2015
, which consisted of the Bridge Loan Facility interest expense and deferred financing fees related to the 2013 Credit Agreements, and 2013 Term Loan.
160
Perrigo Company plc
- Item 8
Note 10
Notes and Bonds
2016 Notes
On
March 7, 2016
, Perrigo Finance issued
$500.0 million
in aggregate principal amount of
3.500%
senior notes due 2021 and
$700.0 million
in aggregate principal amount of
4.375%
senior notes due 2026 (together, the "2016 Notes") and received net proceeds of
$1.2 billion
after fees and market discount. Interest on the 2016 Notes is payable semiannually in arrears in March and September of each year, beginning in September 2016. The 2016 Notes are governed by a base indenture and a second supplemental indenture. The 2016 Notes are fully and unconditionally guaranteed on a senior basis by Perrigo, and no other subsidiary of Perrigo guarantees the 2016 Notes. The proceeds were used to repay amounts borrowed under the 2015 Revolver and the 2014 Revolver, as mentioned above. There are no restrictions under the 2016 Notes on our ability to obtain funds from our subsidiaries. Perrigo Finance may redeem the 2016 Notes in whole or in part at any time for cash at the make-whole redemption prices described in the 2016 Notes.
Notes and Bonds Assumed from Omega
In connection with the Omega acquisition, on
March 30, 2015
, we assumed:
|
•
|
$20.0 million
in aggregate principal amount of
6.190%
senior notes due
2016
, which was repaid on May 29, 2015 in full;
|
|
•
|
€135.0 million
(
$147.0 million
) in aggregate principal amount of
5.1045%
senior notes due
2023
(the "2023 Notes");
|
|
•
|
€300.0 million
(
$326.7 million
) in aggregate principal amount of
5.125%
retail bonds due
2017
;
€180.0 million
(
$196.0 million
) in aggregate principal amount of
4.500%
retail bonds due
2017
; and
€120.0 million
(
$130.7 million
) in aggregate principal amount of
5.000%
retail bonds due
2019
(collectively, the "Retail Bonds").
|
The fair value of the 2023 Notes and Retail Bonds
exceeded par value by
€93.6 million
(
$101.9 million
) on the date of the Omega acquisition. As a result, a fair value adjustment was recorded as part of the carrying value of the underlying debt and will be amortized as a reduction of interest expense over the remaining terms of the respective debt instruments. The adjustment does not affect cash interest payments.
2014 Notes
On
December 2, 2014
, Perrigo Finance issued
$500.0 million
in aggregate principal amount of
3.500%
senior notes due
2021
(the "2021 Notes”),
$700.0 million
in aggregate principal amount of
3.900%
senior notes due
2024
(the “2024 Notes”), and
$400.0 million
in aggregate principal amount of
4.900%
senior notes due
2044
(the “2044 Notes” and, together with the 2021 Notes and the 2024 Notes, the “2014 Notes”) and received net proceeds of
$1.6 billion
after fees and market discount. Interest on the 2014 Notes is payable semiannually in arrears in June and December of each year, beginning in June 2015. The 2014 Notes are governed by a base indenture and a first supplemental indenture. The 2014 Notes are fully and unconditionally guaranteed on a senior unsecured basis by Perrigo, and no other subsidiary of Perrigo guarantees the 2014 Notes. There are no restrictions under the 2014 Notes on our ability to obtain funds from our subsidiaries. Perrigo Finance may redeem the 2014 Notes in whole or in part at any time for cash at the make-whole redemption prices described in the 2014 Notes.
2013 Notes
On November 8, 2013, Perrigo Company issued
$500.0 million
aggregate principal amount of its 1.300% senior notes due 2016 (the "1.300% 2016 Notes"),
$600.0 million
aggregate principal amount of its 2.300% senior notes due 2018 (the "2018 Notes"),
$800.0 million
aggregate principal amount of its 4.000% senior notes due 2023 (the "4.000% 2023 Notes") and
$400.0 million
aggregate principal amount of its 5.300% senior notes due 2043 (the "2043 Notes" and, together with the 1.300% 2016 Notes, the 2018 Notes and the 4.000% 2023 Notes, the "2013 Notes") in a private placement with registration rights. We received net proceeds of
$2.3 billion
from the issuance of the 2013 Notes after fees and market discount. On September 29, 2016, we repaid all
$500.0 million
of the 1.300% 2016 Notes outstanding.
161
Perrigo Company plc
- Item 8
Note 10
Interest on the 2013 Notes is payable semiannually in arrears in May and November of each year, beginning in May 2014. The 2013 Notes are governed by a base indenture and a first supplemental indenture (collectively, the "2013 Indenture"). The 2013 Notes are our unsecured and unsubordinated obligations, ranking equally in right of payment to all of our existing and future unsecured and unsubordinated indebtedness. The 2013 Notes are not entitled to mandatory redemption or sinking fund payments. We may redeem the 2013 Notes in whole or in part at any time for cash at the make-whole redemption prices described in the 2013 Indenture. The 2013 Notes were guaranteed on an unsubordinated, unsecured basis by the same entities that guaranteed our then-outstanding credit agreement until November 21, 2014, at which time the 2013 Indenture was amended to remove all guarantors.
On September 2, 2014, we offered to exchange our private placement senior notes for public bonds (the "Exchange Offer"). The Exchange Offer expired on October 1, 2014, at which time substantially all of the private placement notes had been exchanged for bonds registered with the Securities and Exchange Commission. As a result of the changes in the guarantor structure noted above, we are no longer required to present guarantor financial statements.
Other Financing
Overdraft Facilities
We use overdraft facilities to increase the efficiency of our cash utilization and to meet our short-term liquidity needs. We report any balances outstanding in the above table under "Other Financing." We repaid the balances outstanding under our overdraft facilities during the
year ended
December 31, 2016
, but retain the ability to use the facilities in our day-to-day cash operations. The balance outstanding under the facilities was
$82.9 million
at
December 31, 2015
and there were
no
balances outstanding under the facilities at June 27, 2015.
On
March 30, 2015
, we assumed and repaid certain overdraft facilities totaling
€51.4 million
(
$56.0 million
) with the Omega acquisition.
Obligations Resulting from Recourse Factoring
In conjunction with the restatement related to BCH Belgium Distribution Contracts we have included the obligations due to the factors related to recourse amounts factored in Other Financing. The recourse contracts were discontinued during 2016 and no balance remains outstanding at December 31, 2016. The balance outstanding and due to the factor were
$42.2 million
and
$88.7 million
at December 31, 2015 and June 30, 2015.
Debt Extinguishment
As a result of the debt retirements, we recorded a loss of
$165.8 million
during the
year ended
June 28, 2014
(in millions):
|
Make-whole payments
|
$
|
133.5
|
|
|
|
Write-off of financing fees on Bridge Credit Agreements
|
19.0
|
|
||
|
Write-off of deferred financing fees
|
10.5
|
|
||
|
Write-off of unamortized discount
|
2.8
|
|
||
|
Total loss on extinguishment of debt
|
$
|
165.8
|
|
|
162
Perrigo Company plc
- Item 8
Note 10
Future Maturities
The annual future maturities of our short-term and long-term debt, including capitalized leases, are as follows (in millions):
|
Payment Due
|
Amount
|
||||
|
2017
|
$
|
559.0
|
|
||
|
2018
|
666.4
|
|
(1)
|
||
|
2019
|
429.3
|
|
|||
|
2020
|
0.6
|
|
|||
|
2021
|
1,000.1
|
|
|||
|
Thereafter
|
3,141.9
|
|
|||
(1) On May 8, 2017, using proceeds from the sale of Tysabri
®
, we redeemed all of the
$600.0 million
2.300% 2018 Notes.
NOTE 11 -
EARNINGS PER SHARE AND SHAREHOLDERS' EQUITY
Earnings per Share
A reconciliation of the numerators and denominators used in our basic and diluted EPS calculation is as follows (in millions):
|
|
Year Ended
|
Six Months Ended
|
Year Ended
|
||||||||||||
|
|
December 31,
2016 |
December 31,
2015 |
June 27,
2015 |
June 28,
2014 |
|||||||||||
|
Restated
|
Restated
|
Restated
|
|||||||||||||
|
Numerator:
|
|||||||||||||||
|
Net income (loss)
|
$
|
(4,012.8
|
)
|
$
|
42.5
|
|
$
|
136.1
|
|
$
|
232.8
|
|
|||
|
Denominator:
|
|||||||||||||||
|
Weighted average shares outstanding for basic EPS
|
143.3
|
|
145.6
|
|
139.3
|
|
115.1
|
|
|||||||
|
Dilutive effect of share-based awards*
|
—
|
|
0.5
|
|
0.5
|
|
0.5
|
|
|||||||
|
Weighted average shares outstanding for diluted EPS
|
143.3
|
|
146.1
|
|
139.8
|
|
115.6
|
|
|||||||
|
Anti-dilutive share-based awards excluded from computation of diluted EPS*
|
—
|
|
0.1
|
|
0.1
|
|
0.1
|
|
|||||||
* In the period of a net loss, diluted shares equal basic shares.
Shareholders' Equity
On and prior to December 18, 2013, our common stock consisted of common stock of Perrigo Company, a Michigan Corporation, and since December 19, 2013, our common stock has consisted of ordinary shares of Perrigo Company plc, a public limited company incorporated under the laws of Ireland.
Prior to June 6, 2013, our common stock traded on the NASDAQ Global Select Market under the symbol PRGO. Since June 6, 2013, our ordinary shares have traded on the New York Stock Exchange under the symbol PRGO. In association with the acquisition of Agis Industries (1983) Ltd., our ordinary shares have been trading on the Tel Aviv Stock Exchange since March 16, 2005.
Dividends
In January 2003, the Board of Directors adopted a policy of paying quarterly dividends. We paid dividends as follows:
163
Perrigo Company plc
- Item 8
Note 11
|
|
Year Ended
|
Six Months Ended
|
Year Ended
|
||||||||||||
|
|
December 31,
2016 |
December 31,
2015 |
June 27,
2015 |
June 28,
2014 |
|||||||||||
|
Dividends paid (in millions)
|
$
|
83.2
|
|
$
|
36.3
|
|
$
|
64.8
|
|
$
|
46.1
|
|
|||
|
Dividends paid per share
|
$
|
0.58
|
|
$
|
0.25
|
|
$
|
0.46
|
|
$
|
0.39
|
|
|||
The declaration and payment of dividends and the amount paid, if any, are subject to the discretion of the Board of Directors and depend on our earnings, financial condition, capital and surplus requirements and other factors the Board of Directors may consider relevant.
Share Repurchases
On October 22, 2015, the Board of Directors approved a share repurchase plan of up to
$2.0 billion
, of which
$1.5 billion
is still available to be repurchased through December 31, 2018. During the
six months ended
December 31, 2015
, we repurchased
3.3 million
ordinary shares at an average repurchase price of
$151.59
per share, for a total of
$500.0 million
. We did not repurchase any shares under the share repurchase plan during the
year ended
December 31, 2016
.
NOTE 12 -
SHARE-BASED COMPENSATION PLANS
All share-based compensation for employees and directors is granted under the 2013 Long-Term Incentive Plan, as amended (the "Plan"). The Plan has been approved by our shareholders and provides for the granting of awards to our employees and directors. As of
December 31, 2016
, there were
4.7 million
shares available to be granted. The purpose of the Plan is to attract and retain individuals of exceptional talent and encourage these individuals to acquire a vested interest in our success and prosperity. The awards that may be granted under this program include non-qualified stock options, restricted shares, and restricted share units. Restricted shares are generally service-based, requiring a certain length of service before vesting occurs, while restricted share units can be either service-based or performance-based. Performance-based restricted share units require a certain length of service until vesting; however, they contain an additional performance feature, which can vary the amount of shares ultimately paid out based on certain performance criteria specified in the Plan. Awards granted under the Plan vest and may be exercised and/or sold from one to ten years after the date of grant based on a vesting schedule.
Share-based compensation expense was as follows (in millions):
|
Year Ended
|
Six Months Ended
|
Year Ended
|
||||||||||||
|
December 31,
2016 |
December 31,
2015 |
June 27,
2015 |
June 28,
2014 |
|||||||||||
|
$
|
23.0
|
|
$
|
22.8
|
|
$
|
31.6
|
|
$
|
24.6
|
|
|||
As of
December 31, 2016
, unrecognized share-based compensation expense was
$31.0 million
, and the weighted-average period over which the expense is expected to be recognized was approximately
1.9
years. Proceeds from the exercise of stock options and excess income tax benefits attributable to stock options exercised are credited to ordinary shares.
164
Perrigo Company plc
- Item 8
Note 12
Stock Options
A summary of activity related to stock options is presented below (options in thousands):
|
|
Number of
Options |
Weighted-Average
Exercise Price Per Share |
Weighted-
Average Remaining Term in Years |
Aggregate
Intrinsic Value |
||||||||
|
Options outstanding at June 27, 2015
|
857
|
|
$
|
97.49
|
|
|||||||
|
Exercised
|
(72
|
)
|
$
|
69.62
|
|
|||||||
|
Forfeited or expired
|
(2
|
)
|
$
|
131.91
|
|
|||||||
|
Options outstanding at December 31, 2015
|
783
|
|
$
|
99.93
|
|
6.3
|
$
|
35.6
|
|
|||
|
Granted
|
344
|
|
$
|
126.67
|
|
|||||||
|
Exercised
|
(122
|
)
|
$
|
67.68
|
|
|||||||
|
Forfeited or expired
|
(256
|
)
|
$
|
126.54
|
|
|||||||
|
Options outstanding December 31, 2016
|
749
|
|
$
|
108.40
|
|
6.6
|
$
|
5.5
|
|
|||
|
Options exercisable
|
473
|
|
$
|
96.89
|
|
5.2
|
$
|
5.5
|
|
|||
|
Options expected to vest
|
266
|
|
$
|
128.17
|
|
9.0
|
$
|
—
|
|
|||
The aggregate intrinsic value for options exercised was as follows (in millions):
|
Year Ended
|
Six Months Ended
|
Year Ended
|
||||||||||||
|
December 31,
2016 |
December 31,
2015 |
June 27,
2015 |
June 28,
2014 |
|||||||||||
|
$
|
5.2
|
|
$
|
6.7
|
|
$
|
20.7
|
|
$
|
17.8
|
|
|||
The weighted-average fair values per share at the grant date for options granted were
$33.53
,
$39.96
, and
$38.28
for the
years ended
December 31, 2016
,
June 27, 2015
, and
June 28, 2014
, respectively. There were no options granted during the six months ended December 31, 2015. The fair values were estimated using the Black-Scholes option pricing model with the following weighted-average assumptions:
|
|
Year Ended
|
|||||||
|
|
December 31,
2016 |
June 27,
2015 |
June 28,
2014 |
|||||
|
Dividend yield
|
0.5
|
%
|
0.3
|
%
|
0.3
|
%
|
||
|
Volatility, as a percent
|
27.6
|
%
|
27.1
|
%
|
32.7
|
%
|
||
|
Risk-free interest rate
|
1.3
|
%
|
1.7
|
%
|
1.8
|
%
|
||
|
Expected life in years
|
5.5
|
|
5.3
|
|
5.3
|
|
||
The valuation model utilizes historical volatility. The risk-free interest rate is based on the yield of U.S. government securities with a maturity date that coincides with the expected term of the option. The expected life in years is estimated based on past exercise behavior of employees.
Non-Vested Restricted Shares
There were no restricted shares granted, vested or outstanding for the
year ended
December 31, 2016
, the
six months ended
December 31, 2015
, or the
year ended
June 27, 2015
. The weighted-average fair value per share at the date of grant for restricted shares granted was
$145.19
for the
year ended
June 28, 2014
. The total fair value of restricted shares that vested was
$0.9 million
and
$2.3 million
for the
years ended
June 27, 2015
and
June 28, 2014
, respectively.
165
Perrigo Company plc
- Item 8
Note 12
Non-Vested Service-Based Restricted Share Units
A summary of activity related to non-vested service-based restricted share units is presented below (units in thousands):
|
|
Number of
Non-vested Service- Based Share Units |
Weighted-
Average Grant Date Fair Value Per Share |
Weighted-
Average Remaining Term in Years |
Aggregate
Intrinsic Value |
||||||||
|
Non-vested service-based share units outstanding at June 27, 2015
|
283
|
|
$
|
136.48
|
|
|||||||
|
Granted
|
199
|
|
$
|
165.64
|
|
|||||||
|
Vested
|
(94
|
)
|
$
|
125.03
|
|
|||||||
|
Forfeited
|
(6
|
)
|
$
|
164.56
|
|
|||||||
|
Non-vested service-based share units outstanding at December 31, 2015
|
382
|
|
$
|
154.07
|
|
2.2
|
$
|
55.3
|
|
|||
|
Granted
|
298
|
|
$
|
113.26
|
|
|||||||
|
Vested
|
(92
|
)
|
$
|
137.15
|
|
|||||||
|
Forfeited
|
(120
|
)
|
$
|
151.64
|
|
|||||||
|
Non-vested service-based share units outstanding at December 31, 2016
|
468
|
|
$
|
137.53
|
|
1.7
|
$
|
39.0
|
|
|||
The weighted-average fair value per share at the date of grant for service-based restricted share units granted was as follows (in millions):
|
Year Ended
|
Six Months Ended
|
Year Ended
|
||||||||||||
|
December 31,
2016 |
December 31,
2015 |
June 27,
2015 |
June 28,
2014 |
|||||||||||
|
$
|
113.26
|
|
$
|
165.64
|
|
$
|
153.99
|
|
$
|
133.08
|
|
|||
The total fair value of service-based restricted share units that vested was as follows (in millions):
|
Year Ended
|
Six Months Ended
|
Year Ended
|
||||||||||||
|
December 31,
2016 |
December 31,
2015 |
June 27,
2015 |
June 28,
2014 |
|||||||||||
|
$
|
12.6
|
|
$
|
11.7
|
|
$
|
9.1
|
|
$
|
6.8
|
|
|||
166
Perrigo Company plc
- Item 8
Note 12
Non-Vested Performance-Based Restricted Share Units
A summary of activity related to non-vested performance-based restricted share units is presented below (units in thousands):
|
|
Number of
Non-vested Performance- Based Share Units |
Weighted-
Average Grant Date Fair Value Per Share |
Weighted-
Average Remaining Term in Years |
Aggregate
Intrinsic Value |
||||||||
|
Non-vested performance-based share units outstanding at June 27, 2015
|
229
|
|
$
|
129.77
|
|
|||||||
|
Granted
|
55
|
|
$
|
184.49
|
|
|||||||
|
Vested
|
(58
|
)
|
$
|
109.20
|
|
|||||||
|
Forfeited
|
(3
|
)
|
$
|
144.73
|
|
|||||||
|
Non-vested performance-based share units outstanding at December 31, 2015
|
223
|
|
$
|
146.31
|
|
1.5
|
$
|
32.3
|
|
|||
|
Granted
|
159
|
|
$
|
126.37
|
|
|||||||
|
Vested
|
(81
|
)
|
$
|
128.74
|
|
|||||||
|
Forfeited
|
(124
|
)
|
$
|
143.64
|
|
|||||||
|
Non-vested performance-based share units outstanding at December 31, 2016
|
177
|
|
$
|
138.29
|
|
1.7
|
$
|
14.8
|
|
|||
The weighted-average fair value of performance-based restricted share units can fluctuate depending upon the success or failure of the achievement of performance criteria as set forth in the Plan. The weighted-average fair value per share at the date of grant for performance-based restricted share units granted was as follows:
|
Year Ended
|
Six Months Ended
|
Year Ended
|
||||||||||||
|
December 31,
2016 |
December 31,
2015 |
June 27,
2015 |
June 28,
2014 |
|||||||||||
|
$
|
126.37
|
|
$
|
184.49
|
|
$
|
150.14
|
|
$
|
119.85
|
|
|||
The total fair value of performance-based restricted share units that vested was as follows (in millions):
|
Year Ended
|
Six Months Ended
|
Year Ended
|
||||||||||||
|
December 31,
2016 |
December 31,
2015 |
June 27,
2015 |
June 28,
2014 |
|||||||||||
|
$
|
10.4
|
|
$
|
6.4
|
|
$
|
5.1
|
|
$
|
4.6
|
|
|||
167
Perrigo Company plc
- Item 8
Note 13
NOTE 13 -
ACCUMULATED OTHER COMPREHENSIVE INCOME (LOSS)
Changes in our AOCI balances, net of tax, were as follows (in millions):
|
Fair value of derivative financial instruments, net of tax
|
Foreign currency translation adjustments
|
Fair value of investment securities, net of tax
|
Post-retirement and pension liability adjustments, net of tax
|
Total AOCI
|
|||||||||||||||
|
Balance at June 28, 2014 (restated)
|
$
|
(16.1
|
)
|
$
|
164.4
|
|
$
|
2.4
|
|
$
|
(11.1
|
)
|
$
|
139.6
|
|
||||
|
OCI before reclassifications
|
(15.1
|
)
|
(33.5
|
)
|
(5.3
|
)
|
2.9
|
|
(51.0
|
)
|
|||||||||
|
Amounts reclassified from AOCI
|
14.9
|
|
—
|
|
—
|
|
—
|
|
14.9
|
|
|||||||||
|
Other comprehensive income (loss)
|
(0.2
|
)
|
(33.5
|
)
|
(5.3
|
)
|
2.9
|
|
(36.1
|
)
|
|||||||||
|
Balance at June 27, 2015 (restated)
|
(16.3
|
)
|
130.9
|
|
(2.9
|
)
|
(8.2
|
)
|
103.5
|
|
|||||||||
|
OCI before reclassifications
|
1.1
|
|
(135.5
|
)
|
(1.4
|
)
|
6.7
|
|
(129.1
|
)
|
|||||||||
|
Amounts reclassified from AOCI
|
1.0
|
|
—
|
|
10.7
|
|
(1.4
|
)
|
10.3
|
|
|||||||||
|
Other comprehensive income (loss)
|
2.1
|
|
(135.5
|
)
|
9.3
|
|
5.3
|
|
(118.8
|
)
|
|||||||||
|
Balance at December 31, 2015 (restated)
|
(14.2
|
)
|
(4.6
|
)
|
6.4
|
|
(2.9
|
)
|
(15.3
|
)
|
|||||||||
|
OCI before reclassifications
|
(5.4
|
)
|
(63.3
|
)
|
7.4
|
|
(3.2
|
)
|
(64.5
|
)
|
|||||||||
|
Amounts reclassified from AOCI
|
0.1
|
|
—
|
|
1.3
|
|
(3.4
|
)
|
(2.0
|
)
|
|||||||||
|
Other comprehensive income (loss)
|
(5.3
|
)
|
(63.3
|
)
|
8.7
|
|
(6.6
|
)
|
(66.5
|
)
|
|||||||||
|
Balance at December 31, 2016
|
$
|
(19.5
|
)
|
$
|
(67.9
|
)
|
$
|
15.1
|
|
$
|
(9.5
|
)
|
$
|
(81.8
|
)
|
||||
NOTE 14 -
INCOME TAXES
Pre-tax income (loss) and the (benefit) provision for income taxes from continuing operations are summarized as follows (in millions):
|
|
Year Ended
|
Six Months Ended
|
Year Ended
|
||||||||||||
|
|
December 31,
2016 |
December 31,
2015 |
June 27,
2015 |
June 28,
2014 |
|||||||||||
|
Restated
|
Restated
|
Restated
|
|||||||||||||
|
Pre-tax income (loss):
|
|||||||||||||||
|
Ireland
|
$
|
(3,624.1
|
)
|
$
|
(310.2
|
)
|
$
|
(792.8
|
)
|
$
|
(336.6
|
)
|
|||
|
Other
|
(1,224.2
|
)
|
319.1
|
|
1,053.1
|
|
640.2
|
|
|||||||
|
Total pre-tax income (loss)
|
(4,848.3
|
)
|
8.9
|
|
260.3
|
|
303.6
|
|
|||||||
|
(Benefit) Provision for income taxes:
|
|||||||||||||||
|
Current:
|
|||||||||||||||
|
Ireland
|
0.3
|
|
1.6
|
|
(2.2
|
)
|
2.2
|
|
|||||||
|
United States - federal
|
93.0
|
|
58.9
|
|
77.2
|
|
42.8
|
|
|||||||
|
United States - state
|
0.7
|
|
3.0
|
|
6.8
|
|
9.3
|
|
|||||||
|
Other foreign
|
26.7
|
|
53.0
|
|
67.4
|
|
49.1
|
|
|||||||
|
Subtotal
|
120.7
|
|
116.5
|
|
149.2
|
|
103.4
|
|
|||||||
|
Deferred (credit):
|
|||||||||||||||
|
Ireland
|
(549.4
|
)
|
(23.1
|
)
|
11.1
|
|
(20.1
|
)
|
|||||||
|
United States - federal
|
(7.6
|
)
|
(34.4
|
)
|
(19.9
|
)
|
8.4
|
|
|||||||
|
United States - state
|
(5.1
|
)
|
(3.3
|
)
|
(0.8
|
)
|
(5.8
|
)
|
|||||||
|
Other foreign
|
(394.1
|
)
|
(89.3
|
)
|
(15.4
|
)
|
(15.1
|
)
|
|||||||
|
Subtotal
|
(956.2
|
)
|
(150.1
|
)
|
(25.0
|
)
|
(32.6
|
)
|
|||||||
|
Total (benefit) provision for income taxes
|
$
|
(835.5
|
)
|
$
|
(33.6
|
)
|
$
|
124.2
|
|
$
|
70.8
|
|
|||
168
Perrigo Company plc
- Item 8
Note 14
A reconciliation of the provision based on the Federal statutory income tax rate to our effective income tax rate is as follows:
|
|
Year Ended
|
Six Months Ended
|
Year Ended
|
||||||||
|
|
December 31,
2016 |
December 31,
2015 |
June 27,
2015 |
June 28,
2014 |
|||||||
|
|
Restated
|
Restated
|
Restated
|
||||||||
|
Provision at statutory rate
|
12.5
|
%
|
12.5
|
%
|
12.5
|
%
|
12.5
|
%
|
|||
|
Ireland tax on non-trading differences
|
(0.4
|
)
|
(207.4
|
)
|
(9.9
|
)
|
2.6
|
|
|||
|
Expenses not deductible for tax purposes/deductions not expensed for book, net
|
(0.7
|
)
|
394.0
|
|
14.7
|
|
10.9
|
|
|||
|
Goodwill impairment not deductible for tax purposes
|
(2.8
|
)
|
—
|
|
—
|
|
—
|
|
|||
|
U.S. Operations:
|
|||||||||||
|
State income taxes, net of federal benefit
|
0.1
|
|
38.4
|
|
(1.0
|
)
|
(0.2
|
)
|
|||
|
Foreign tax credit
|
—
|
|
—
|
|
—
|
|
0.2
|
|
|||
|
Research and development credit
|
—
|
|
(13.2
|
)
|
(0.7
|
)
|
(0.4
|
)
|
|||
|
Other
|
0.4
|
|
112.3
|
|
4.8
|
|
(0.9
|
)
|
|||
|
Other foreign differences (earnings taxed at other than applicable statutory rate)
|
3.3
|
|
(647.2
|
)
|
(16.1
|
)
|
(14.5
|
)
|
|||
|
Intangible Impairment differences
|
4.8
|
|
(397.6
|
)
|
—
|
|
—
|
|
|||
|
Worldwide operations:
|
|||||||||||
|
Valuation allowance changes
|
0.8
|
|
249.3
|
|
25.7
|
|
2.6
|
|
|||
|
Change in unrecognized taxes
|
(0.8
|
)
|
82.7
|
|
17.7
|
|
13.5
|
|
|||
|
Rate change impacts
|
—
|
|
—
|
|
—
|
|
(3.0
|
)
|
|||
|
Effective income tax rate
|
17.2
|
%
|
(376.2
|
)%
|
47.7
|
%
|
23.3
|
%
|
|||
We have provided for income taxes for certain earnings of certain foreign subsidiaries which have not been deemed to be permanently reinvested. No further provision has been made for income taxes on remaining undistributed earnings of foreign subsidiaries of approximately
$5.6 billion
at
December 31, 2016
, since it is our intention to indefinitely reinvest undistributed earnings of our foreign subsidiaries. Due to the number of legal entities and taxing jurisdictions involved and the complexity of the legal entity structure, the complexity of tax laws in the various jurisdictions, including, but not limited to the rules pertaining to the utilization of foreign tax credits in the U.S. and the impact of income projections to calculations, we believe it is not practicable to estimate, within any reasonable range, the additional income taxes that may be payable on the remittance of such undistributed earnings.
169
Perrigo Company plc
- Item 8
Note 14
Deferred income taxes arise from temporary differences between the financial reporting and the tax reporting basis of assets and liabilities and operating loss and tax credit carryforwards for tax purposes. The components of our net deferred income tax asset (liability) were as follows:
|
December 31,
2016 |
December 31,
2015 |
June 27,
2015 |
|||||||||
|
Restated
|
Restated
|
||||||||||
|
Deferred income tax asset (liability):
|
|||||||||||
|
Depreciation and amortization
|
$
|
(765.2
|
)
|
$
|
(1,550.6
|
)
|
$
|
(1,618.1
|
)
|
||
|
Inventory basis differences
|
27.4
|
|
22.8
|
|
32.6
|
|
|||||
|
Accrued liabilities
|
68.5
|
|
50.8
|
|
69.3
|
|
|||||
|
Allowance for doubtful accounts
|
1.7
|
|
1.3
|
|
0.9
|
|
|||||
|
Research and development
|
61.7
|
|
63.7
|
|
62.8
|
|
|||||
|
Loss carryforwards
|
292.4
|
|
244.2
|
|
232.4
|
|
|||||
|
Share-based compensation
|
18.1
|
|
20.6
|
|
14.3
|
|
|||||
|
Foreign tax credit
|
10.6
|
|
10.6
|
|
10.6
|
|
|||||
|
Federal benefit of unrecognized tax positions
|
24.3
|
|
22.8
|
|
26.3
|
|
|||||
|
Interest carryforwards
|
435.3
|
|
334.6
|
|
259.7
|
|
|||||
|
Other, net
|
3.0
|
|
14.7
|
|
30.1
|
|
|||||
|
Subtotal
|
177.8
|
|
(764.5
|
)
|
(879.1
|
)
|
|||||
|
Valuation allowance
|
(495.6
|
)
|
(536.8
|
)
|
(516.6
|
)
|
|||||
|
Net deferred income tax asset (liability):
|
$
|
(317.8
|
)
|
$
|
(1,301.3
|
)
|
$
|
(1,395.7
|
)
|
||
The above amounts are classified on the Consolidated Balance Sheets as follows (in millions):
|
December 31,
2016 |
December 31,
2015 |
June 27,
2015 |
|||||||||
|
Restated
|
Restated
|
||||||||||
|
Assets
|
$
|
72.1
|
|
$
|
71.4
|
|
$
|
198.3
|
|
||
|
Liabilities
|
(389.9
|
)
|
(1,372.7
|
)
|
(1,594.0
|
)
|
|||||
|
Net deferred income tax (liability) asset
|
$
|
(317.8
|
)
|
$
|
(1,301.3
|
)
|
$
|
(1,395.7
|
)
|
||
At
December 31, 2016
, we had gross carryforwards as follows:
|
December 31, 2016
|
|||||||
|
Gross
Carryforwards (1) |
Gross Valuation Allowances
|
||||||
|
U.S. state net operating losses
|
$
|
248.8
|
|
$
|
193.6
|
|
|
|
Worldwide federal net operating losses excluding U.S. states
|
$
|
997.7
|
|
$
|
787.7
|
|
|
|
Worldwide federal capital losses
|
$
|
19.7
|
|
$
|
19.7
|
|
|
|
U.S. federal credits
|
$
|
265.9
|
|
$
|
265.9
|
|
|
|
U.S. state credits
|
$
|
1,462.6
|
|
$
|
1,458.2
|
|
|
(1)
Utilization of such carryforwards within the applicable statutory periods is uncertain.
In 2016, we released valuation allowances of
$166.0 million
million in Ireland, recorded a valuation allowance at Omega of
$39.0 million
and a recorded a full valuation allowance in the U.S.of
$81.0 million
.
170
Perrigo Company plc
- Item 8
Note 14
The U.S. federal net operating loss carryforwards expire through
2034
and U.S. federal credit carryforwards of
$30.2 million
,
$37.2 million
and
$167.8 million
expire through
2022
,
2025
and
2027
, respectively, with the remaining U.S. credits having no expiration. U.S. state net operating loss carryforwards expire through
2036
, and U.S. state credit carryforwards expire through
2031
. Of the non-U.S. net operating loss carryforwards,
$4.5 million
,
$21.1 million
,
$1.4 million
,
$0.1 million
, and
$7.3 million
expire through
2018
,
2021
,
2023
,
2024
, and
2026
, respectively, while the remaining amounts of non U.S. net operating loss carryforwards and non-U.S. capital loss carryforwards have no expiration. The valuation allowances for these net operating loss carryforwards are adjusted annually, as necessary. After application of the valuation allowances described above, we anticipate no limitations will apply with respect to the realization of our net deferred income tax assets.
The following table summarizes the activity related to amounts recorded for uncertain tax positions, excluding interest and penalties (in millions):
|
Unrecognized
Tax Benefits
|
|||
|
Balance at June 28, 2014
|
$
|
160.1
|
|
|
Additions:
|
|||
|
Positions related to the current year
|
38.9
|
|
|
|
Positions related to prior years
|
128.1
|
|
|
|
Reductions:
|
|||
|
Settlements with taxing authorities
|
(1.4
|
)
|
|
|
Lapse of statutes of limitation
|
(1.7
|
)
|
|
|
Balance at June 27, 2015 (restated)
|
324.0
|
|
|
|
Additions:
|
|||
|
Positions related to the current year
|
22.9
|
|
|
|
Reductions:
|
|||
|
Positions related to prior years
|
(43.5
|
)
|
|
|
Settlements with taxing authorities
|
(15.3
|
)
|
|
|
Balance at December 31, 2015 (restated)
|
288.1
|
|
|
|
Additions:
|
|||
|
Positions related to the current year
|
45.5
|
|
|
|
Positions related to prior years
|
8.6
|
|
|
|
Reductions:
|
|||
|
Settlements with taxing authorities
|
(2.4
|
)
|
|
|
Lapse of statutes of limitation
|
(5.3
|
)
|
|
|
Balance at December 31, 2016
|
$
|
334.5
|
|
We recognize interest and penalties related to uncertain tax positions as a component of income tax expense. The total amount accrued for interest and penalties in the liability for uncertain tax positions was
$63.5 million
,
$52.1 million
, and
$65.7 million
as of
December 31, 2016
,
December 31, 2015
, and
June 27, 2015
, respectively.
The total liability for uncertain tax positions was
$398.0 million
,
$340.3 million
, and
$389.7 million
as of
December 31, 2016
,
December 31, 2015
, and
June 27, 2015
, respectively, before considering the federal tax benefit of certain state and local items, of which
$248.7 million
,
$198.5 million
, and
$186.1 million
, respectively, would impact the effective tax rate in future periods, if recognized.
We file income tax returns in numerous jurisdictions and are therefore subject to audits by tax authorities. Our primary income tax jurisdictions are Ireland, the U.S., Israel, Belgium, France, and the United Kingdom.
Although we believe that our tax estimates are reasonable and that we prepare our tax filings in accordance with all applicable tax laws, the final determination with respect to any tax audit and any related litigation could be materially different from our estimates or from our historical income tax provisions and accruals. The results of an audit or litigation could have a material effect on operating results and/or cash flows in the periods for which that
171
Perrigo Company plc
- Item 8
Note 14
determination is made. In addition, future period earnings may be adversely impacted by litigation costs, settlements, penalties, and/or interest assessments.
In the United States, the Internal Revenue Service ("IRS") audit of our fiscal years ended June 27, 2009 and June 26, 2010 had previously concluded with the issuance of a statutory notice of deficiency on August 27, 2014. While we had previously agreed on certain adjustments and made associated payments of
$8.0 million
(inclusive of interest) in November 2014, the statutory notice of deficiency asserted various additional adjustments, including transfer pricing adjustments. The statutory notice of deficiency's adjustments for fiscal years 2009 and 2010 asserted an incremental tax obligation of approximately
$68.9 million
, inclusive of interest and penalties. We disagree with the IRS’s positions asserted in the statutory notice of deficiency. To contest the IRS's adjustments, in January 2015 we paid the incremental tax obligation (a prerequisite to contesting the proposed adjustments in U.S. district court), and in June 2015, we filed an administrative request for a refund with the IRS. The payment was recorded during the three months ended March 28, 2015 as a deferred charge on the balance sheet given our anticipated action to recover this amount. The IRS subsequently denied our request for a refund. We anticipate filing a complaint in U.S. district court claiming a refund of the paid amounts prior to August 2017.
The IRS issued a statutory notice of deficiency on April 20, 2017 for the IRS audits of our fiscal years ended June 25, 2011 and June 30, 2012. While we agreed to certain adjustments in October 2016 and made minimal associated payments, the statutory notice of deficiency asserted various additional adjustments, including transfer pricing adjustments. The statutory notice of deficiency for fiscal years 2011 and 2012 asserted an incremental tax obligation of approximately
$74.2 million
, inclusive of interest and penalties. We disagree with the IRS's positions asserted in this notice. In anticipation of contesting the IRS's adjustments, in May 2017 we paid the incremental tax obligation (a prerequisite to contesting the proposed adjustments in U.S. district court) and expect to file an administrative request for refund. The payment will be recorded in the second quarter of the year ending December 31, 2017 as a deferred charge on the balance sheet given our anticipated action to recover this amount.
We received notices of proposed adjustments on December 22, 2016 for the IRS audit of Athena Neurosciences, Inc., a subsidiary of Elan Corporation plc, which Perrigo acquired in December 2013, for the years ending December 31, 2011 and December 31, 2012. We disagree with the IRS’s positions asserted in the notices of proposed adjustments and intend to contest them. Additionally, examination of transfer pricing positions is ongoing.
We have ongoing audits in multiple other jurisdictions the resolution of which remains uncertain. These jurisdictions include, but are not limited to, the United States, Israel and Belgium. The IRS notified us in January 2017, that it will be auditing our years ended June 29, 2013 and June 28, 2014. The Israel Tax Authority is currently auditing our years ended June 29, 2013 and June 28, 2014. In the fourth quarter of the year ended December 31, 2016, the Belgium Tax Authority proposed minimal adjustments for the years ending December 31, 2013 and December 31, 2014.
Based on the final resolution of tax examinations, judicial or administrative proceedings, changes in facts or law, expirations of statute of limitations in specific jurisdictions or other resolutions of, or changes in, tax positions, it is reasonably possible that unrecognized tax benefits for certain tax positions taken on previously filed tax returns may change materially from those represented on the financial statements as of
December 31, 2016
. During the next 12 months, it is reasonably possible that such circumstances may occur that would have a material effect on previously unrecognized tax benefits. As a result, the total net amount of unrecognized tax benefits may decrease, which would reduce the provision for taxes on earnings by a range estimated at
$4.3 million
to
$7.0 million
.
Tax Rate Changes
In July 2013, the U.K. passed legislation reducing the statutory rate to
18%
and
17%
effective April 1, 2014 and April 1, 2015, respectively. These rates were applicable to Perrigo as of June 30, 2013 and favorably impacted the effective tax rate in the amount of
$4.7 million
for the year ended June 28, 2014.
For the years ended December 31, 2016 and the six months ended December 31, 2015 statutory rate changes, primarily in Europe, favorably impacted the effective tax rate in the amount of $
4.0 million
and $
27.9 million
, respectively.
172
Perrigo Company plc
- Item 8
Note 14
NOTE 15 -
POST EMPLOYMENT PLANS
Defined Contribution Plans
We have a qualified profit-sharing and investment plan under Section 401(k) of the IRS, which covers substantially all U.S. employees. Our contributions to the plan include an annual nondiscretionary contribution of
3%
of an employee's eligible compensation and a discretionary contribution at the option of the Board of Directors. Additionally, we match a portion of employees' contributions. Our contributions to the plan were as follows (in millions):
|
Year Ended
|
Six Months Ended
|
Year Ended
|
||||||||||||
|
December 31,
2016 |
December 31, 2015
|
June 27,
2015 |
June 28,
2014 |
|||||||||||
|
$
|
23.2
|
|
$
|
15.8
|
|
$
|
24.6
|
|
$
|
25.6
|
|
|||
We also have a defined contribution plan that covers our Ireland employees. We contribute up to
18%
of each participating employee’s annual eligible salary on a monthly basis. In connection with matching contributions under the Irish defined contribution plan, we recorded the following expense (in millions):
|
Year Ended
|
Six Months Ended
|
Year Ended
|
||||||||||||
|
December 31,
2016 |
December 31, 2015
|
June 27,
2015 |
June 28,
2014 |
|||||||||||
|
$
|
0.6
|
|
$
|
0.2
|
|
$
|
0.7
|
|
$
|
0.5
|
|
|||
We assumed a number of defined contribution plans associated with the Omega acquisition and we pay contributions to the pension insurance plans. We recorded the following expenses (in millions):
|
Year Ended
|
Six Months Ended
|
Year Ended
|
||||||||
|
December 31,
2016 |
December 31, 2015
|
June 27, 2015 *
|
||||||||
|
$
|
2.3
|
|
$
|
2.9
|
|
$
|
0.6
|
|
||
|
*
|
Includes Omega activity from March 30, 2015 to June 27, 2015.
|
Pension and Post-Retirement Healthcare Benefit Plans
We assumed the liability of two defined benefit plans (staff and executive plan) for employees based in Ireland with the Elan acquisition in 2013. These plans were closed to new entrants from March 31, 2009, and a defined contribution plan was established for employees in Ireland hired after this date. In January 2013, Elan ceased the future accrual of benefits to the active members of the defined benefit pension plans. Active members became deferred members of the defined benefit plans on January 31, 2013 and became members of the defined contribution plan on February 1, 2013.
As of March 11, 2015, both plans (staff and executive plan) were merged and all plan assets and liabilities were transferred from the executive scheme to the staff scheme as a result of a plan combination. The value of plan assets and liabilities transferred were derived by reference to market conditions and assumptions as of March 11, 2015.
In general, upon retirement, eligible Ireland employees in the staff plan are entitled to a pension calculated at 1/60
th
(1/52
nd
for the executive plan) of their final salary for each year of service, subject to a maximum of 40 years. The investments of the plans at
December 31, 2016
consisted of units held in independently administered funds.
173
Perrigo Company plc
- Item 8
Note 15
In connection with the Omega acquisition, we assumed the liability of a number of defined benefit plans as well as a post-retirement healthcare plan. The defined benefit plans cover employees based primarily in the Netherlands, Germany, France, and Norway. Omega companies operate various pension plans across each country.
Our defined benefit pension plans are managed externally and the related pension costs and liabilities are assessed at least annually in accordance with the advice of a qualified professional actuary. We use a December 31, 2016 measurement date and all plan assets and liabilities are reported as of that date.
We provide certain healthcare benefits to eligible U.S. employees and their dependents who meet certain age and service requirements when they retire. Generally, benefits are provided to eligible retirees after age
65
and to their dependents. Increases in our contribution for benefits are limited to increases in the Consumer Price Index. Additional healthcare cost increases are paid through participant contributions. We accrue the expected costs of such benefits during a portion of the employees’ years of service. The plan is not funded. Under current plan provisions, the plan is not eligible for any U.S. federal subsidy related to the Medicare Modernization Act of 2003 Part D Subsidy.
174
Perrigo Company plc
- Item 8
Note 15
The change in the projected benefit obligation and plan assets consisted of the following (in millions):
|
Pension Benefits
|
Other Benefits
|
||||||||||||||||||||||
|
Year Ended
|
Six Months Ended
|
Year Ended
|
Year Ended
|
Six Months Ended
|
Year Ended
|
||||||||||||||||||
|
December 31,
2016 |
December 31,
2015 |
June 27, 2015 *
|
December 31,
2016 |
December 31,
2015 |
June 27, 2015 *
|
||||||||||||||||||
|
Restated
|
Restated
|
||||||||||||||||||||||
|
Projected benefit obligation at beginning of period
|
$
|
135.0
|
|
$
|
140.3
|
|
$
|
89.0
|
|
$
|
7.0
|
|
$
|
6.0
|
|
$
|
4.6
|
|
|||||
|
Acquisitions
|
—
|
|
5.6
|
|
70.4
|
|
—
|
|
—
|
|
1.0
|
|
|||||||||||
|
Service costs
|
4.1
|
|
2.2
|
|
0.9
|
|
0.6
|
|
0.3
|
|
0.3
|
|
|||||||||||
|
Interest cost
|
3.6
|
|
1.7
|
|
2.4
|
|
0.2
|
|
0.1
|
|
0.2
|
|
|||||||||||
|
Actuarial (gain) loss
|
22.6
|
|
(10.1
|
)
|
(6.8
|
)
|
(1.9
|
)
|
0.5
|
|
—
|
|
|||||||||||
|
Contributions paid
|
0.3
|
|
—
|
|
—
|
|
—
|
|
—
|
|
—
|
|
|||||||||||
|
Benefits paid
|
(1.7
|
)
|
(0.6
|
)
|
(0.9
|
)
|
(0.1
|
)
|
(0.1
|
)
|
(0.1
|
)
|
|||||||||||
|
Foreign currency translation
|
(5.0
|
)
|
(4.1
|
)
|
(14.7
|
)
|
—
|
|
0.1
|
|
—
|
|
|||||||||||
|
Projected benefit obligation at end of period
|
$
|
158.9
|
|
$
|
135.0
|
|
$
|
140.3
|
|
$
|
5.8
|
|
$
|
7.0
|
|
$
|
6.0
|
|
|||||
|
Fair value of plan assets at beginning of period
|
126.7
|
|
128.1
|
|
99.6
|
|
—
|
|
—
|
|
—
|
|
|||||||||||
|
Acquisitions
|
—
|
|
3.2
|
|
43.5
|
|
—
|
|
—
|
|
—
|
|
|||||||||||
|
Actual return on plan assets
|
9.4
|
|
(1.7
|
)
|
0.2
|
|
—
|
|
—
|
|
—
|
|
|||||||||||
|
Benefits paid
|
(1.7
|
)
|
(0.6
|
)
|
(0.1
|
)
|
—
|
|
—
|
|
—
|
|
|||||||||||
|
Employer contributions
|
8.2
|
|
1.4
|
|
2.4
|
|
—
|
|
—
|
|
—
|
|
|||||||||||
|
Contributions paid
|
0.3
|
|
—
|
|
—
|
|
—
|
|
—
|
|
—
|
|
|||||||||||
|
Foreign currency translation
|
(4.7
|
)
|
(3.7
|
)
|
(17.5
|
)
|
—
|
|
—
|
|
—
|
|
|||||||||||
|
Fair value of plan assets at end of period
|
$
|
138.2
|
|
$
|
126.7
|
|
$
|
128.1
|
|
$
|
—
|
|
$
|
—
|
|
$
|
—
|
|
|||||
|
Funded (unfunded) status
|
$
|
(20.7
|
)
|
$
|
(8.3
|
)
|
$
|
(12.2
|
)
|
$
|
(5.8
|
)
|
$
|
(7.0
|
)
|
$
|
(6.0
|
)
|
|||||
|
Presented as:
|
|||||||||||||||||||||||
|
Other non-current assets
|
$
|
10.4
|
|
$
|
16.5
|
|
$
|
12.8
|
|
$
|
—
|
|
$
|
—
|
|
$
|
—
|
|
|||||
|
Other non-current liabilities
|
$
|
(31.1
|
)
|
$
|
(24.8
|
)
|
$
|
(25.0
|
)
|
$
|
(5.8
|
)
|
$
|
(7.0
|
)
|
$
|
(6.0
|
)
|
|||||
|
*
|
Includes Omega activity from March 30, 2015 to June 27, 2015.
|
The total accumulated benefit obligation for the defined benefit pension plans was as follows (in millions):
|
Year Ended
|
Six Months Ended
|
Year Ended
|
||||||||
|
December 31,
2016 |
December 31, 2015
|
June 27, 2015 *
|
||||||||
|
$
|
136.3
|
|
$
|
109.4
|
|
$
|
136.6
|
|
||
|
*
|
Includes Omega activity from March 30, 2015 to June 27, 2015.
|
The following unrecognized actual gains (losses) for the other benefits liability was included in OCI, net of tax (in millions):
|
Year Ended
|
Six Months Ended
|
Year Ended
|
||||||||||||
|
December 31,
2016 |
December 31, 2015
|
June 27,
2015 |
June 27, 2015 *
|
|||||||||||
|
$
|
(0.7
|
)
|
$
|
(0.4
|
)
|
$
|
0.1
|
|
$
|
(0.1
|
)
|
|||
|
*
|
Includes Omega activity from March 30, 2015 to June 27, 2015.
|
175
Perrigo Company plc
- Item 8
Note 15
The unamortized net actuarial loss in AOCI for defined benefit pension and other benefits was as follows (in millions):
|
Year Ended
|
Six Months Ended
|
Year Ended
|
||||||||
|
December 31,
2016 |
December 31, 2015
|
June 27, 2015 *
|
||||||||
|
$
|
9.5
|
|
$
|
2.9
|
|
$
|
8.2
|
|
||
|
*
|
Includes Omega activity from March 30, 2015 to June 27, 2015.
|
The total estimated amount to be recognized from AOCI into net periodic cost during the next year is
$0.8 million
.
At
December 31, 2016
, the total estimated future benefit payments to be paid by the plans for the next five years is approximately
$9.4 million
for pension benefits and
$1.0 million
for other benefits as follows (in millions):
|
Payment Due
|
Pension Benefits
|
Other Benefits
|
||||||
|
2017
|
$
|
1.3
|
|
$
|
0.1
|
|
||
|
2018
|
1.5
|
|
0.2
|
|
||||
|
2019
|
2.3
|
|
0.2
|
|
||||
|
2020
|
2.3
|
|
0.2
|
|
||||
|
2021
|
2.0
|
|
0.3
|
|
||||
|
Thereafter
|
17.1
|
|
1.9
|
|
||||
The expected benefits to be paid are based on the same assumptions used to measure our benefit obligation at
December 31, 2016
, including the expected future employee service. We expect to contribute
$4.8 million
to the defined benefit plans within the next year.
Net periodic pension cost consisted of the following (in millions):
|
Pension Benefits
|
Other Benefits
|
||||||||||||||||||||||
|
Year Ended
|
Six Months Ended
|
Year Ended
|
Year Ended
|
Six Months Ended
|
Year Ended
|
||||||||||||||||||
|
December 31,
2016 |
December 31, 2015
|
June 27, 2015 *
|
December 31,
2016 |
December 31, 2015
|
June 27, 2015 *
|
||||||||||||||||||
|
Service cost
|
$
|
4.1
|
|
$
|
2.2
|
|
$
|
0.9
|
|
$
|
0.6
|
|
$
|
0.3
|
|
$
|
0.3
|
|
|||||
|
Interest cost
|
3.6
|
|
1.7
|
|
2.4
|
|
0.2
|
|
0.1
|
|
0.2
|
|
|||||||||||
|
Expected return on plan assets
|
(3.9
|
)
|
(1.8
|
)
|
(2.7
|
)
|
—
|
|
—
|
|
—
|
|
|||||||||||
|
Net actuarial loss
|
0.5
|
|
0.4
|
|
1.0
|
|
—
|
|
—
|
|
0.1
|
|
|||||||||||
|
Net periodic pension cost
|
$
|
4.3
|
|
$
|
2.5
|
|
$
|
1.6
|
|
$
|
0.8
|
|
$
|
0.4
|
|
$
|
0.6
|
|
|||||
|
*
|
Includes Omega activity from March 30, 2015 to June 27, 2015.
|
176
Perrigo Company plc
- Item 8
Note 15
The weighted-average assumptions used to determine net periodic pension cost and benefit obligation were:
|
Pension Benefits
|
Other Benefits
|
||||||||||||||||
|
Year Ended
|
Six Months Ended
|
Year Ended
|
Year Ended
|
Six Months Ended
|
Year Ended
|
||||||||||||
|
December 31,
2016 |
December 31,
2015 |
June 27, 2015 *
|
December 31,
2016 |
December 31,
2015 |
June 27, 2015 *
|
||||||||||||
|
Discount rate
|
1.76
|
%
|
2.22
|
%
|
2.11
|
%
|
4.00
|
%
|
4.25
|
%
|
4.25
|
%
|
|||||
|
Inflation
|
1.43
|
%
|
2.25
|
%
|
1.93
|
%
|
|||||||||||
|
Expected return on assets
|
2.89
|
%
|
2.93
|
%
|
2.85
|
%
|
|||||||||||
|
*
|
Includes Omega activity from March 30, 2015 to June 27, 2015.
|
The discount rate is based on market yields at the valuation date and chosen with reference to the yields available on high quality corporate bonds, having regard to the duration of the plan's liabilities.
As of
December 31, 2016
, the expected weighted-average long-term rate of return on assets of
2.9%
was calculated based on the assumptions of the following returns for each asset class:
|
Equities
|
6.2
|
%
|
|
Bonds
|
1.6
|
%
|
|
Absolute return fund
|
4.0
|
%
|
|
Insurance contracts
|
2.8
|
%
|
The investment mix of the pension plans' assets is a blended asset allocation, with a diversified portfolio of shares listed and traded on recognized exchanges.
Certain of our plans have target asset allocation ranges, these ranges are Absolute Return Funds (50%-60%), Bonds (20%-30%) Equity (10%-20%).Other plans do not have target asset allocation ranges, for such plans the strategy is to invest 100% in Insurance Contracts.
The purpose of the pension funds is to provide a flow of income for members in retirement. A flow of income delivered through fixed interest bonds provides a costly but close match to this objective. Equities are held within the portfolio as a means of reducing this cost, but holding equities creates a strategic risk because they give a very different pattern of return. Property investments are held to help diversify the portfolio. Investment risk is measured and monitored on an ongoing basis through annual liability measurements, periodic asset/liability studies, and investment portfolio reviews.
The following table sets forth the fair value of the pension plan assets, as of
December 31, 2016
(in millions):
|
Quoted Prices in Active Markets
|
Other Observable Inputs
|
Unobservable Inputs
|
|||||||||||||
|
(Level 1)
|
(Level 2)
|
(Level 3)
|
Total
|
||||||||||||
|
Equities
|
$
|
0.1
|
|
$
|
13.6
|
|
$
|
—
|
|
$
|
13.7
|
|
|||
|
Bonds
|
1.6
|
|
22.8
|
|
—
|
|
24.4
|
|
|||||||
|
Property
|
—
|
|
—
|
|
—
|
|
—
|
|
|||||||
|
Insurance contracts
|
—
|
|
—
|
|
43.4
|
|
43.4
|
|
|||||||
|
Absolute return fund
|
—
|
|
51.5
|
|
—
|
|
51.5
|
|
|||||||
|
Other
|
—
|
|
5.2
|
|
—
|
|
5.2
|
|
|||||||
|
Total
|
$
|
1.7
|
|
$
|
93.1
|
|
$
|
43.4
|
|
$
|
138.2
|
|
|||
177
Perrigo Company plc
- Item 8
Note 15
The following table sets forth the fair value of the pension plan assets, as of
December 31, 2015
(in millions):
|
Quoted Prices in Active Markets
|
Other Observable Inputs
|
Unobservable Inputs
|
|||||||||||||
|
(Level 1)
|
(Level 2)
|
(Level 3)
|
Total
|
||||||||||||
|
Restated
|
Restated
|
Restated
|
Restated
|
||||||||||||
|
Equities
|
$
|
—
|
|
$
|
14.5
|
|
$
|
—
|
|
$
|
14.5
|
|
|||
|
Bonds
|
—
|
|
38.1
|
|
—
|
|
38.1
|
|
|||||||
|
Property
|
—
|
|
—
|
|
0.3
|
|
0.3
|
|
|||||||
|
Insurance contracts
|
—
|
|
—
|
|
34.9
|
|
34.9
|
|
|||||||
|
Absolute return fund
|
—
|
|
33.7
|
|
—
|
|
33.7
|
|
|||||||
|
Other
|
—
|
|
5.2
|
|
—
|
|
5.2
|
|
|||||||
|
Total
|
$
|
—
|
|
$
|
91.5
|
|
$
|
35.2
|
|
$
|
126.7
|
|
|||
The following table sets forth the fair value of the pension plan assets, as of
June 27, 2015
(in millions):
|
Quoted Prices in Active Markets
|
Other Observable Inputs
|
Unobservable Inputs
|
|||||||||||||
|
(Level 1)
|
(Level 2)
|
(Level 3)
|
Total
|
||||||||||||
|
Restated
|
Restated
|
Restated
|
Restated
|
||||||||||||
|
Equities
|
$
|
—
|
|
$
|
15.4
|
|
$
|
—
|
|
$
|
15.4
|
|
|||
|
Bonds
|
—
|
|
38.0
|
|
—
|
|
38.0
|
|
|||||||
|
Property
|
—
|
|
—
|
|
0.4
|
|
0.4
|
|
|||||||
|
Insurance contracts
|
—
|
|
—
|
|
33.9
|
|
33.9
|
|
|||||||
|
Absolute return fund
|
—
|
|
34.8
|
|
—
|
|
34.8
|
|
|||||||
|
Other
|
—
|
|
5.6
|
|
—
|
|
5.6
|
|
|||||||
|
Total
|
$
|
—
|
|
$
|
93.8
|
|
$
|
34.3
|
|
$
|
128.1
|
|
|||
For a discussion of the fair value levels and the valuation methodologies used to measure equities, bonds, and the absolute return fund, see
Note 6
.
The following table sets forth a summary of the changes in the fair value of the Level 3 pension plan assets, which were measured at fair value on a recurring basis (in millions):
|
Year Ended
|
Six Months Ended
|
Year Ended
|
|||||||||
|
December 31,
2016 |
December 31,
2015 |
June 27, 2015 *
|
|||||||||
|
Restated
|
Restated
|
||||||||||
|
Level 3 assets held at beginning of year
|
$
|
35.2
|
|
$
|
34.3
|
|
$
|
0.8
|
|
||
|
Net Transfers
|
7.6
|
|
—
|
|
—
|
|
|||||
|
Acquisitions
|
—
|
|
—
|
|
33.9
|
|
|||||
|
Unrealized gains
|
0.6
|
|
0.9
|
|
(0.4
|
)
|
|||||
|
Level 3 assets held at end of year
|
$
|
43.4
|
|
$
|
35.2
|
|
$
|
34.3
|
|
||
|
*
|
Includes Omega activity from March 30, 2015 to June 27, 2015.
|
All properties in the fund are valued by independent valuation experts by forecasting the returns of the market at regular intervals. The inputs to the forecasts include gross national product growth, interest rates and inflation.
178
Perrigo Company plc
- Item 8
Note 15
The fair value of the insurance contracts is an estimate of the amount that would be received in an orderly sale to a market participant at the measurement date. The amount the plan would receive from the contract holder if the contracts were terminated is the primary input and is unobservable. The insurance contracts are therefore classified as Level 3 investments.
Deferred Compensation Plans
We have non-qualified plans related to deferred compensation and executive retention that allow certain employees and directors to defer compensation subject to specific requirements. Although the plans are not formally funded, we own insurance policies that had a cash surrender value of
$32.7 million
,
$34.6 million
and
$32.7 million
at
December 31, 2016
,
December 31, 2015
, and
June 27, 2015
, respectively, that are intended as a long-term funding source for these plans. The assets, which are recorded in Other non-current assets, are not a committed funding source and may, under certain circumstances, be subject to claims from creditors. The deferred compensation liability of
$29.3 million
,
$34.5 million
, and
$32.3 million
at
December 31, 2016
,
December 31, 2015
, and
June 27, 2015
, respectively, was recorded in Other non-current liabilities.
NOTE 16 -
COMMITMENTS AND CONTINGENCIES
We lease certain assets, principally warehouse facilities and computer equipment, under agreements that expire at various dates through the year ended December 31, 2024. Certain leases contain provisions for renewal and purchase options and require us to pay various related expenses. Future non-cancelable minimum operating lease commitments are as follows (in millions):
|
Due
|
Amount
|
|||
|
2017
|
$
|
40.2
|
|
|
|
2018
|
30.7
|
|
||
|
2019
|
24.1
|
|
||
|
2020
|
16.7
|
|
||
|
2021
|
12.5
|
|
||
|
Thereafter
|
19.8
|
|
||
Rent expense under all leases was
$53.0 million
,
$26.2 million
,
$39.2 million
, and
$34.5 million
for the
year ended
December 31, 2016
, the
six months ended
December 31, 2015
, and the
years ended
June 27, 2015
, and
June 28, 2014
, respectively.
At
December 31, 2016
, we had non-cancelable purchase obligations totaling
$791.6 million
consisting of contractual commitments to purchase materials and services to support operations. The obligations are expected to be paid within one year.
In view of the inherent difficulties of predicting the outcome of various types of legal proceedings, we cannot determine the ultimate resolution of the matters described below. We establish reserves for litigation and regulatory matters when losses associated with the claims become probable and the amounts can be reasonably estimated. The actual costs of resolving legal matters may be substantially higher or lower than the amounts reserved for those matters. For matters where the likelihood or extent of a loss is not probable or cannot be reasonably be estimated as of
December 31, 2016
, we have not recorded a loss reserve. If certain of these matters are determined against the Company, there could be a material adverse effect on our financial condition, results of operations, or cash flows. We currently believe we have valid defenses to the claims in these lawsuits and intend to defend these lawsuits vigorously regardless of whether or not we have a loss reserve. Other than what is disclosed below, we do not expect the outcome of the litigation matters to which we are currently subject to, individually or in the aggregate, have a material adverse effect on our financial condition, results of operations, or cash flows.
179
Perrigo Company plc
- Item 8
Note 16
Price-Fixing Lawsuits
Perrigo has been named as a co-defendant with other manufactures in a number of cases alleging that we and other manufacturers of the same product engaged in anti-competitive behavior to fix or raise the prices of certain drugs starting, in some instances, as early as June 2013. The products in question are Clobetasol, Desonide and Econazole and one complaint involving levothyroxine, a product that Perrigo neither made nor sold. Perrigo was named in a levo case recently, but we certainly would expect to be dismissed from this case since we did not manufacture or distribute that product. At this stage, we cannot reasonably predict the outcome of the liability, if any, associated with these claims.
Securities Litigation
On May 18, 2016, a shareholder filed a securities case against the Company and our former CEO, Joseph Papa, in the U.S. District Court for the District of New Jersey (
Roofers’ Pension Fund v. Papa, et al.)
. The plaintiff purports to represent a class of shareholders for the period from April 21, 2015 through May 11, 2016, inclusive. The complaint alleges violations of Securities Exchange Act sections 10(b) (and Rule 10b‑5) and 14(e) against both defendants and 20(a) control person liability against Mr. Papa. In general, the allegations concern the actions taken by the Company and the former executive to defend against the unsolicited takeover bid by Mylan in the period from April 21, 2015 through November 13, 2015. The plaintiff also alleges that we provided inadequate disclosure concerning alleged integration problems related to the Omega acquisition in the period from April 21, 2015 through May 11, 2016. The case is in an early stage. In February 2017, the court selected the lead plaintiffs and the lead counsel to the putative class. In March 2017, the court entered a scheduling order that sets a deadline for the lead plaintiffs to file an amended complaint. That deadline has not yet passed.
On July 19, 2016, a shareholder filed a securities class action against the Company and our former CEO, Joseph Papa, also in the District of New Jersey (
Wilson v. Papa, et al
.). The plaintiff purports to represent a class of persons who sold put options on the Company shares between April 21, 2015 and May 11, 2016. In general, the allegations and the claims are the same as those made in the Roofers' Pension Fund case described above. Subsequently, this shareholder filed papers in the Roofers' Pension Fund case as one of four candidates seeking to be named lead plaintiff or co-lead plaintiff in that case. The Wilson plaintiff also filed a motion to have the Wilson case consolidated with the Roofers' Pension Fund case. On December 8, 2016, the court consolidated Roofers' Pension Fund case and the Wilson case under the Roofers' Pension Fund case number. In February 2017, the court selected the lead plaintiffs and the lead counsel to the putative class. In March 2017, the court entered a scheduling order that sets a deadline for the lead plaintiffs to file an amended complaint. That deadline has not yet passed.
On May 22, 2016, shareholders filed a securities class action against the Company and five individual defendants: Mr. Papa, our former Executive Vice President and General Manager of the BCH segment Marc Coucke, our Chief Executive Officer John Hendrickson, and our Board members Gary Kunkle, Jr. and Laurie Brlas alleging violations of Israeli law in the District Court of Tel Aviv-Jaffa (
Schwieger et al. v. Perrigo Company plc, et al.).
On June 15, 2016, Perrigo filed a motion to stay the case pending the outcome of the securities class action pending in the New Jersey federal court. The plaintiffs did not oppose the motion. The Israeli court granted the motion on the same day, and the action is stayed.
On March 29, 2017, plaintiff Eyal Keinan commenced an action in the District Court of Tel Aviv-Jaffa asserting securities claims against Perrigo and its auditor Ernst & Young LLP ("EY"). The case is styled
Keinan v. Perrigo Company plc, et al.
The action seeks certification of a class of purchasers of Perrigo shares on the Israeli exchange beginning February 6, 2014. The proposed closing date for the class is not clear though it appears to extend into 2017. In general, the plaintiff asserts that Perrigo improperly accounted for its stream of royalty income from two drugs: Tysabri
®
and Prialt. The court filings contend that the alleged improper accounting caused the audited financial results for Perrigo to be incorrect for the year ended December 31, 2016, six months ended December 31, 2015, and the years ended June 27, 2015 and June 28, 2014 and the other financial data released by the Company over those years to also be inaccurate. The plaintiff maintains that the defendants are liable under Israeli securities law or, in the alternative, under U.S. securities law principles. The plaintiff indicates an initial, preliminary class damages estimate of
686.0 million
NIS (approximately
$187.0 million
). The response from Perrigo and EY is not yet due. Perrigo is consulting Israeli counsel about its response to these allegations.
180
Perrigo Company plc
- Item 8
Note 16
Eltroxin
During October and November 2011, nine applications to certify a class action lawsuit were filed in various courts in Israel related to Eltroxin, a prescription thyroid medication manufactured by a third party and distributed in Israel by our subsidiary, Perrigo Israel Agencies Ltd. The respondents included our subsidiaries, Perrigo Israel Pharmaceuticals Ltd. and/or Perrigo Israel Agencies Ltd., the manufacturers of the product, and various healthcare providers who provide healthcare services as part of the compulsory healthcare system in Israel.
One of the applications was dismissed and the remaining eight applications were consolidated into one application. The applications arose from the 2011 launch of a reformulated version of Eltroxin in Israel. The consolidated application generally alleges that the respondents (a) failed to timely inform patients, pharmacists and physicians about the change in the formulation; and (b) failed to inform physicians about the need to monitor patients taking the new formulation in order to confirm patients were receiving the appropriate dose of the drug. As a result, claimants allege they incurred the following damages: (a) purchases of product that otherwise would not have been made by patients had they been aware of the reformulation; (b) adverse events to some patients resulting from an imbalance of thyroid functions that could have been avoided; and (c) harm resulting from the patients' lack of informed consent prior to the use of the reformulation.
Several hearings on whether or not to certify the consolidated application took place in December 2013 and January 2014. On May 17, 2015, the District Court certified the motion against Perrigo Israel Agencies Ltd. and dismissed it against the remaining respondents, including Perrigo Israel Pharmaceuticals Ltd.
On June 16, 2015, Perrigo submitted a motion for permission to appeal the decision to certify to the Israeli Supreme Court together with a motion to stay the proceedings of the class action until the motion for permission to appeal is adjudicated. Perrigo has filed its statement of defense to the underlying proceedings. The parties are currently engaged in mediation in an attempt to settle the matter. The underlying proceedings have been stayed pending the outcome of the mediation process and, if necessary, a decision on the motion to appeal.
Tysabri
®
Product Liability Lawsuits
Perrigo and collaborator Biogen are co-defendants in product liability lawsuits arising out of the occurrence of Progressive Multifocal Leukoencephalopathy, a serious brain infection, and serious adverse events, including deaths, which occurred in patients taking Tysabri
®
. Perrigo and Biogen will each be responsible for 50% of losses and expenses arising out of any Tysabri
®
product liability claims. During calendar year 2016, one case in the U.S. was settled and two others were dismissed with prejudice. In April 2017, another case was dismissed with prejudice. While the remaining lawsuits will be vigorously defended, management cannot predict how these cases will be resolved. Adverse results in one or more of these lawsuits could result in substantial judgments against the Company.
Texas Medicaid
In June 2013, we received notices from the Office of the Attorney General for the State of Texas, of civil investigative demands to two of our subsidiaries, Perrigo Pharmaceuticals Company and Paddock Laboratories, LLC ("Paddock"), for information under the Texas Medicaid Fraud Prevention Act relating to the submission of prices to Texas Medicaid in claims for reimbursement for drugs. We accrued
$24.0 million
prior to settlement. In addition, we recorded a receivable of
$7.0 million
representing the amount we expected to collect from the previous owners of Paddock. During the six months ended December 31, 2015, we settled the case for
$15.0 million
and the previous owners of Paddock settled their case with the state of Texas. We therefore removed the accrual and the receivable, which resulted in
$2.0 million
of income recorded in Other expense, net, during the six months ended December 31, 2015.
Claim Arising from the Omega Acquisition
On December 16, 2016, Perrigo and Perrigo Ireland 2 brought an arbitral claim ("Claim") against Alychlo NV (Alychlo) and Holdco I BE NV ("Holdco") (together the Sellers) in accordance with clause 26.2 of the Share Purchase Agreement dated November 6, 2014 ("SPA") and the rules of the Belgian Centre for Arbitration and Mediation ("CEPANI"). Perrigo’s Claim relates to the accuracy and completeness of information about Omega
181
Perrigo Company plc
- Item 8
Note 16
Pharma Invest N.V. provided by the Sellers as part of the sale process, the withholding of information by the Sellers during that process and breaches of Sellers’ warranties. Perrigo is seeking monetary damages from the Sellers. The Sellers served their respective responses to the Claim on February 20, 2017. In its response, Alychlo has asserted a counterclaim for monetary damages contending that Perrigo breached the duty of good faith in performing the SPA. There can be no assurance that Perrigo’s Claim will be successful, and Sellers deny liability for the Claim. Perrigo denies that Alychlo is entitled to any relief (including monetary relief) under the counterclaim. The arbitration proceedings are confidential as required by the SPA and the rules of the CEPANI.
NOTE 17 -
COLLABORATION AGREEMENTS AND OTHER CONTRACTUAL ARRANGEMENTS
We actively collaborate with other pharmaceutical companies to develop, manufacture and market certain products or groups of products. These types of agreements are common in the pharmaceutical industry. We may choose to enter into these types of agreements to, among other things, leverage our or others’ scientific research and development expertise or utilize our extensive marketing and distribution resources. Terms of the various collaboration agreements may require us to make or receive milestone payments upon the achievement of certain product research and development objectives and pay or receive royalties on the future sale, if any, of commercial products resulting from the collaboration. Milestone and up-front payments made are generally recorded in research and development expense if the payments relate to drug candidates that have not yet received regulatory approval. Milestone and up-front payments made related to approved drugs will generally be capitalized and amortized to cost of goods sold over the economic life of the product. Royalties received are generally reflected as revenues, and royalties paid are generally reflected as cost of goods sold. We enter into a number of collaboration agreements in the ordinary course of business. Although we do not consider these arrangements to be material, the following is a brief description of notable agreements entered into during the
years ended
December 31, 2016
,
June 27, 2015
, and
June 28, 2014
. We did not enter into any collaborative arrangements during the
six months ended
December 31, 2015
.
Year Ended
December 31, 2016
During the year ended December 31, 2016, we added three additional products to the May 15, 2015 development agreement discussed below that are subject to similar buy-back terms if the products are approved by the FDA. We did not receive any consideration from the clinical stage development company, nor do we expect to incur any expense related to the development of the additional products. The estimated purchase price for these additional products, based on the initial development budget, is approximately
$126.0 million
. If development costs exceed the initial budgeted amounts, the purchase price will increase, but will not exceed approximately
$174.0 million
. If the products are approved by the FDA and we purchase the products, we estimate that one of the acquisitions will occur in 2019 and two of the acquisitions will occur in 2021. There can be no assurance that any such products will be approved by the FDA on the anticipated schedule or at all.
Year Ended
June 27, 2015
On May 15, 2015, we entered into a development agreement wherein we transferred the ownership rights to two pharmaceutical products to a clinical stage development company to fund and conduct development activities for the products. We do not expect to incur any expense related to the development of either product. If the products are approved by the FDA, we will execute a buy-back agreement to purchase each product for a multiple of the development costs incurred. Based on the initial development budget for each product, the estimated purchase price for both products is approximately
$78.0 million
. If development costs exceed the initial budgeted amounts, the purchase price will increase but will not exceed approximately
$105.0 million
. If the products are approved by the FDA and we purchase the products, we estimate the acquisitions will occur in 2019.
On May 1, 2015, we entered into an agreement with a clinical stage biotechnology company for the development of two specialty pharmaceutical products. We paid
$18.0 million
for an option to acquire the two products, which we reported in research and development expense. On March 1, 2016, we exercised the purchase option to acquire both products. We will make additional payments if we obtain regulatory approval and achieve certain sales milestones, and these contingent milestone payments could total
$30.0 million
in aggregate. We will also be obligated to make certain royalty payments over periods ranging from seven to ten years from the launch of each product. Refer to the Development-Stage Rx Products acquisition in Note 2 for additional information regarding the acquisition.
In December 2014, we entered into a collaboration agreement with a clinical stage biotechnology company, pursuant to which the parties will collaborate in the ongoing development of a topical OTC drug product. We will provide assistance including non-clinical, clinical, and manufacturing activities in support of an NDA submission to the FDA. As part of the agreement, we paid
$10.0 million
for an exclusive option to purchase and license certain assets as specified in separate asset purchase and license agreements. The
$10.0 million
fee is reported in Research and development expense. If the product is successful in Phase 3 clinical trials, we are required to make an additional option payment of
$5.0 million
. If we exercise our purchase option, we will be required to pay a purchase price of
$10.0 million
as well as certain contingent milestone payments, which could total
$50.0 million
in aggregate.
Year Ended
June 28, 2014
As a result of the Elan acquisition, we acquired a collaborative arrangement with Transition related to the joint development and commercialization of ELND005 (Scyllo-inositol). During the third quarter of the
year ended
June 27, 2015
, we announced that we had entered into an agreement with Transition to progress the clinical development of ELND005 in a number of important indications including Alzheimer's disease, bipolar disorder and Down syndrome. As part of the agreement, Transition acquired all of the shares of a wholly owned, indirect Irish subsidiary of Perrigo, which had previously been responsible for carrying out all development activities associated with ELND005. Upon closing on February 28, 2014, Transition is solely responsible for all ongoing development activities and costs associated with ELND005. We are eligible to receive milestone payments ranging from
$10.0 million
to
$15.0 million
should ELND005 achieve approval of the ANDA as well as specific worldwide net sales hurdles. If a product were to be commercialized, we would be entitled to receive a royalty of
6.5%
of net sales for the life of the product.
Additional future milestone payments and receipts related to agreements not specifically discussed above are not material.
NOTE 18 -
RESTRUCTURING CHARGES
We periodically take action to reduce redundant expenses and improve operating efficiencies, typically in connection with business acquisitions. The following reflects our restructuring activity (in millions):
|
Balance at June 29, 2013
|
$
|
2.9
|
|
|
Additional charges
|
47.0
|
|
|
|
Payments
|
(28.7
|
)
|
|
|
Non-cash adjustments
|
(4.8
|
)
|
|
|
Balance at June 28, 2014
|
16.4
|
|
|
|
Additional charges
|
5.1
|
|
|
|
Payments
|
(18.5
|
)
|
|
|
Non-cash adjustments
|
(1.4
|
)
|
|
|
Balance at June 27, 2015
|
1.6
|
|
|
|
Additional charges
|
26.9
|
|
|
|
Payments
|
(6.4
|
)
|
|
|
Non-cash adjustments
|
(1.4
|
)
|
|
|
Balance at December 31, 2015
|
20.7
|
|
|
|
Additional charges
|
31.0
|
|
|
|
Payments
|
(35.8
|
)
|
|
|
Non-cash adjustments
|
3.8
|
|
|
|
Balance at December 31, 2016
|
$
|
19.7
|
|
Restructuring activity includes severance, lease exit costs, and asset impairments. The charges incurred during the
six months ended
December 31, 2015
and the
year ended
December 31, 2016
were primarily associated
182
Perrigo Company plc
- Item 8
Note 18
with actions we took to streamline our organization as announced on October 22, 2015. During the
year ended
December 31, 2016
,
$31.0 million
of restructuring expenses were recorded. Of this amount,
$20.9 million
was recorded in our CHCI segment. There were no other material restructuring programs that impacted any other one reportable segment for the
year ended
December 31, 2016
. The charges during the
year ended
June 28, 2014 were due primarily to the Elan acquisition. There were no other material restructuring programs in any of the periods presented. All charges are recorded in Restructuring expense. The remaining
$14.7 million
liability for employee severance benefits will be paid within the next year, while the remaining
$5.0 million
liability for lease exit costs will be incurred over the remaining terms of the applicable leases.
NOTE 19 -
SEGMENT AND GEOGRAPHIC INFORMATION
As discussed in
Note 1
, we changed our reporting segments to better align with our new organizational structure. This structure is consistent with the way our chief operating decision maker makes operating decisions, allocates resources and manages the growth and profitability of the business. Operating segments with similar economic characteristics, including long-term profitability, nature of the products sold and production processes, distribution methods, and classes of customers, are aggregated as reportable segments.
We generated third-party net sales in the following geographic locations
(1)
during each of the periods presented below (in millions):
|
Year Ended
|
Six Months Ended
|
Year Ended
|
|||||||||||||
|
December 31,
2016 |
December 31,
2015 |
June 27,
2015 |
June 28,
2014 |
||||||||||||
|
Restated
|
Restated
|
Restated
|
|||||||||||||
|
Ireland
|
$
|
89.1
|
|
$
|
11.4
|
|
$
|
7.2
|
|
$
|
—
|
|
|||
|
U.S.
|
3,353.0
|
|
1,686.2
|
|
3,303.2
|
|
3,352.0
|
|
|||||||
|
Europe
|
1,493.0
|
|
758.2
|
|
576.4
|
|
219.7
|
|
|||||||
|
All other countries
(2)
|
345.5
|
|
176.4
|
|
340.3
|
|
342.4
|
|
|||||||
|
$
|
5,280.6
|
|
$
|
2,632.2
|
|
$
|
4,227.1
|
|
$
|
3,914.1
|
|
||||
(1)
We attribute net sales to countries based on sales location.
(2)
Includes net sales generated primarily in Israel, Mexico, Australia, and Canada.
The net book value of property, plant and equipment by location was as follows (in millions):
|
December 31,
2016 |
December 31,
2015 |
June 27,
2015 |
|||||||||
|
Ireland
|
$
|
2.7
|
|
$
|
1.3
|
|
$
|
1.4
|
|
||
|
U.S.
|
556.6
|
|
555.0
|
|
558.6
|
|
|||||
|
Europe
|
144.6
|
|
157.2
|
|
153.8
|
|
|||||
|
Israel
|
114.3
|
|
115.7
|
|
119.8
|
|
|||||
|
All other countries
|
51.9
|
|
57.0
|
|
98.8
|
|
|||||
|
$
|
870.1
|
|
$
|
886.2
|
|
$
|
932.4
|
|
|||
Sales to Walmart accounted for
13%
,
13%
,
16%
, and
19%
of consolidated sales for the
year ended
December 31, 2016
, the
six months ended
December 31, 2015
, and for the
years ended
June 27, 2015
and
June 28, 2014
, respectively. Sales to Walmart are reported primarily in our
CHCA
segment.
183
Perrigo Company plc
- Item 8
Note 19
Below is a summary of our results by reporting segment (in millions):
|
CHCA
|
CHCI
(1)
|
RX
|
Specialty Sciences
(2)
|
Other
|
Unallocated
|
Total
|
|||||||||||||||||||||
|
Year Ended December 31, 2016
|
|||||||||||||||||||||||||||
|
Net sales
|
$
|
2,507.1
|
|
$
|
1,652.2
|
|
$
|
1,042.8
|
|
$
|
—
|
|
$
|
78.5
|
|
$
|
—
|
|
$
|
5,280.6
|
|
||||||
|
Operating income (loss)
|
$
|
399.8
|
|
$
|
(2,087.4
|
)
|
$
|
(0.2
|
)
|
$
|
(201.2
|
)
|
$
|
6.1
|
|
$
|
(116.8
|
)
|
$
|
(1,999.7
|
)
|
||||||
|
Operating income (loss) %
|
15.9
|
%
|
(126.3
|
)%
|
—
|
%
|
—
|
%
|
7.8
|
%
|
—
|
%
|
(37.9
|
)%
|
|||||||||||||
|
Total assets
|
$
|
3,351.3
|
|
$
|
4,795.2
|
|
$
|
2,646.4
|
|
$
|
2,775.8
|
|
$
|
301.4
|
|
$
|
—
|
|
$
|
13,870.1
|
|
||||||
|
Capital expenditures
|
$
|
59.1
|
|
$
|
23.7
|
|
$
|
20.4
|
|
$
|
—
|
|
$
|
3.0
|
|
$
|
—
|
|
$
|
106.2
|
|
||||||
|
Property, plant and equip, net
|
$
|
528.3
|
|
$
|
167.2
|
|
$
|
129.7
|
|
$
|
0.4
|
|
$
|
44.5
|
|
$
|
—
|
|
$
|
870.1
|
|
||||||
|
Depreciation/amortization
|
$
|
119.1
|
|
$
|
210.0
|
|
$
|
120.1
|
|
$
|
—
|
|
$
|
7.8
|
|
$
|
—
|
|
$
|
457.0
|
|
||||||
|
Tysabri
®
royalty stream - change in fair value
|
$
|
—
|
|
$
|
—
|
|
$
|
—
|
|
$
|
2,608.2
|
|
$
|
—
|
|
$
|
—
|
|
$
|
2,608.2
|
|
||||||
|
Six Months Ended December 31, 2015 (restated)
|
|||||||||||||||||||||||||||
|
Net sales
|
$
|
1,251.5
|
|
$
|
833.0
|
|
$
|
502.6
|
|
$
|
—
|
|
$
|
45.1
|
|
$
|
—
|
|
$
|
2,632.2
|
|
||||||
|
Operating income (loss)
|
$
|
209.2
|
|
$
|
(148.5
|
)
|
$
|
181.9
|
|
$
|
(6.5
|
)
|
$
|
(19.5
|
)
|
$
|
(149.0
|
)
|
$
|
67.6
|
|
||||||
|
Operating income (loss) %
|
16.7
|
%
|
(17.8
|
)%
|
36.2
|
%
|
—
|
%
|
(43.3
|
)%
|
—
|
%
|
2.6
|
%
|
|||||||||||||
|
Total assets
|
$
|
3,384.8
|
|
$
|
7,083.5
|
|
$
|
2,738.0
|
|
$
|
5,930.2
|
|
$
|
213.1
|
|
$
|
—
|
|
$
|
19,349.6
|
|
||||||
|
Capital expenditures
|
$
|
38.0
|
|
$
|
26.3
|
|
$
|
12.1
|
|
$
|
—
|
|
$
|
1.4
|
|
$
|
—
|
|
$
|
77.8
|
|
||||||
|
Property, plant and equip, net
|
$
|
540.9
|
|
$
|
179.5
|
|
$
|
118.5
|
|
$
|
—
|
|
$
|
47.3
|
|
$
|
—
|
|
$
|
886.2
|
|
||||||
|
Depreciation/amortization
|
$
|
60.9
|
|
$
|
81.9
|
|
$
|
34.3
|
|
$
|
—
|
|
$
|
5.3
|
|
$
|
—
|
|
$
|
182.4
|
|
||||||
|
Tysabri
®
royalty stream - change in fair value
|
$
|
—
|
|
$
|
—
|
|
$
|
—
|
|
$
|
(57.3
|
)
|
$
|
—
|
|
$
|
—
|
|
$
|
(57.3
|
)
|
||||||
|
Year Ended June 27, 2015 (restated)
|
|||||||||||||||||||||||||||
|
Net sales
|
$
|
2,478.8
|
|
$
|
704.6
|
|
$
|
936.0
|
|
$
|
—
|
|
$
|
107.7
|
|
$
|
—
|
|
$
|
4,227.1
|
|
||||||
|
Operating income (loss)
|
$
|
381.9
|
|
$
|
38.2
|
|
$
|
364.7
|
|
$
|
(17.6
|
)
|
$
|
26.8
|
|
$
|
(121.5
|
)
|
$
|
672.5
|
|
||||||
|
Operating income (loss) %
|
15.4
|
%
|
5.4
|
%
|
39.0
|
%
|
—
|
%
|
24.9
|
%
|
—
|
%
|
15.9
|
%
|
|||||||||||||
|
Total assets
|
$
|
3,763.8
|
|
$
|
7,163.0
|
|
$
|
2,373.4
|
|
$
|
6,040.7
|
|
$
|
251.0
|
|
$
|
—
|
|
$
|
19,591.9
|
|
||||||
|
Capital expenditures
|
$
|
76.8
|
|
$
|
13.1
|
|
$
|
41.0
|
|
$
|
0.5
|
|
$
|
5.6
|
|
$
|
—
|
|
$
|
137.0
|
|
||||||
|
Property, plant and equip, net
|
$
|
556.8
|
|
$
|
176.8
|
|
$
|
113.0
|
|
$
|
—
|
|
$
|
85.8
|
|
$
|
—
|
|
$
|
932.4
|
|
||||||
|
Depreciation/amortization
|
$
|
108.4
|
|
$
|
72.5
|
|
$
|
65.7
|
|
$
|
1.5
|
|
$
|
10.6
|
|
$
|
—
|
|
$
|
258.7
|
|
||||||
|
Tysabri
®
royalty stream - change in fair value
|
$
|
—
|
|
$
|
—
|
|
$
|
—
|
|
$
|
(78.5
|
)
|
$
|
—
|
|
$
|
—
|
|
$
|
(78.5
|
)
|
||||||
|
Year Ended June 28, 2014 (restated)
|
|||||||||||||||||||||||||||
|
Net sales
|
$
|
2,581.2
|
|
$
|
331.1
|
|
$
|
864.2
|
|
$
|
—
|
|
$
|
137.6
|
|
$
|
—
|
|
$
|
3,914.1
|
|
||||||
|
Operating income (loss)
|
$
|
402.8
|
|
$
|
17.0
|
|
$
|
341.5
|
|
$
|
(62.5
|
)
|
$
|
46.1
|
|
$
|
(173.5
|
)
|
$
|
571.4
|
|
||||||
|
Operating income (loss) %
|
15.6
|
%
|
5.1
|
%
|
39.5
|
%
|
—
|
%
|
33.5
|
%
|
—
|
%
|
14.6
|
%
|
|||||||||||||
|
Total assets
|
$
|
4,510.2
|
|
$
|
767.0
|
|
$
|
2,189.2
|
|
$
|
6,124.7
|
|
$
|
288.0
|
|
$
|
—
|
|
$
|
13,879.1
|
|
||||||
|
Capital expenditures
|
$
|
119.4
|
|
$
|
10.2
|
|
$
|
31.6
|
|
$
|
—
|
|
$
|
10.4
|
|
$
|
—
|
|
$
|
171.6
|
|
||||||
|
Property, plant and equip, net
|
$
|
530.4
|
|
$
|
59.3
|
|
$
|
92.5
|
|
$
|
2.0
|
|
$
|
95.7
|
|
$
|
—
|
|
$
|
779.9
|
|
||||||
|
Depreciation/amortization
|
$
|
93.2
|
|
$
|
33.4
|
|
$
|
66.5
|
|
$
|
1.6
|
|
$
|
11.4
|
|
$
|
—
|
|
$
|
206.1
|
|
||||||
|
Tysabri
®
royalty stream - change in fair value
|
$
|
—
|
|
$
|
—
|
|
$
|
—
|
|
$
|
(26.6
|
)
|
$
|
—
|
|
$
|
—
|
|
$
|
(26.6
|
)
|
||||||
(1)
CHCI
includes Omega activity subsequent to March 30, 2015.
(2)
Specialty Sciences includes activity subsequent to December 18, 2013.
184
Perrigo Company plc
- Item 8
Note 19
The following is a summary of our net sales by category (in millions):
|
Year Ended
|
Six Months Ended
|
Year Ended
|
|||||||||||||
|
December 31, 2016
|
December 31,
2015 |
June 27,
2015 |
June 28,
2014 |
||||||||||||
|
Restated
|
Restated
|
Restated
|
|||||||||||||
|
CHCA
|
|||||||||||||||
|
Cough/Cold/Allergy/Sinus
(1)
|
$
|
454.6
|
|
$
|
234.6
|
|
$
|
455.6
|
|
$
|
477.6
|
|
|||
|
Analgesics
(1)
|
343.5
|
|
173.1
|
|
375.7
|
|
433.2
|
|
|||||||
|
Gastrointestinal
(1)
|
335.4
|
|
195.8
|
|
384.0
|
|
398.4
|
|
|||||||
|
Infant nutritionals
|
427.0
|
|
200.2
|
|
383.8
|
|
374.8
|
|
|||||||
|
Smoking cessation
|
308.5
|
|
147.5
|
|
284.5
|
|
236.8
|
|
|||||||
|
Vitamins, minerals and dietary supplements
(1)
|
160.4
|
|
105.8
|
|
183.5
|
|
176.9
|
|
|||||||
|
Animal health
|
143.7
|
|
62.3
|
|
157.0
|
|
178.0
|
|
|||||||
|
Other CHCA
(1),(2)
|
334.0
|
|
132.2
|
|
254.7
|
|
305.5
|
|
|||||||
|
Total CHCA
|
2,507.1
|
|
1,251.5
|
|
2,478.8
|
|
2,581.2
|
|
|||||||
|
CHCI
|
|||||||||||||||
|
Branded OTC
|
1,349.2
|
|
665.9
|
|
368.4
|
|
—
|
|
|||||||
|
Other CHCI
(3)
|
303.0
|
|
167.1
|
|
336.2
|
|
331.1
|
|
|||||||
|
Total CHCI
|
1,652.2
|
|
833.0
|
|
704.6
|
|
331.1
|
|
|||||||
|
Generic prescription drugs
|
1,042.8
|
|
502.6
|
|
936.0
|
|
864.2
|
|
|||||||
|
Active pharmaceutical ingredients
|
78.5
|
|
45.1
|
|
107.7
|
|
137.6
|
|
|||||||
|
Total net sales
|
$
|
5,280.6
|
|
$
|
2,632.2
|
|
$
|
4,227.1
|
|
$
|
3,914.1
|
|
|||
(1)
Includes net sales from our OTC contract manufacturing business.
|
(2)
|
Consists primarily of feminine hygiene, diabetes care, dermatological care, branded OTC, and other miscellaneous or otherwise uncategorized product lines and markets, none of which is greater than 10% of the
CHCA
segment.
|
|
(3)
|
Consists primarily of liquids licensed product, cough/cold/allergy, analgesics and other miscellaneous or otherwise uncategorized product lines and markets, none of which is greater than 10% of the CHCI segment.
|
NOTE 20 -
QUARTERLY FINANCIAL DATA (unaudited)
The following table presents unaudited quarterly consolidated operating results for each of our last ten quarters. The information below has been prepared on a basis consistent with our audited consolidated financial statements (in millions, except per share amounts).
|
Year Ended December 31, 2016
|
First
Quarter (2) |
Second
Quarter (3) |
Third
Quarter (4) |
Fourth
Quarter (5) |
|||||||||||
|
Restated
|
Restated
|
Restated
|
|||||||||||||
|
Net sales
|
$
|
1,347.3
|
|
$
|
1,340.5
|
|
$
|
1,261.6
|
|
$
|
1,331.2
|
|
|||
|
Gross profit
|
$
|
533.1
|
|
$
|
546.5
|
|
$
|
484.5
|
|
$
|
487.7
|
|
|||
|
Tysabri
®
royalty stream - change in fair value
|
$
|
204.4
|
|
$
|
910.8
|
|
$
|
377.4
|
|
$
|
1,115.6
|
|
|||
|
Net loss
|
$
|
(529.2
|
)
|
$
|
(534.3
|
)
|
$
|
(1,590.2
|
)
|
$
|
(1,359.1
|
)
|
|||
|
Loss per share
(1)
:
|
|||||||||||||||
|
Basic
|
$
|
(3.70
|
)
|
$
|
(3.73
|
)
|
$
|
(11.10
|
)
|
$
|
(9.48
|
)
|
|||
|
Diluted
|
$
|
(3.70
|
)
|
$
|
(3.73
|
)
|
$
|
(11.10
|
)
|
$
|
(9.48
|
)
|
|||
|
Weighted average shares outstanding
|
|||||||||||||||
|
Basic
|
143.2
|
|
143.2
|
|
143.3
|
|
143.4
|
|
|||||||
|
Diluted
|
143.2
|
|
143.2
|
|
143.3
|
|
143.4
|
|
|||||||
(1)
The sum of individual per share amounts may not equal due to rounding.
|
(2)
|
Includes an
intangible asset impairment charges
of
$273.3 million
, and a
goodwill impairment charge
of
$130.5 million
.
|
185
Perrigo Company plc
- Item 8
Note 20
|
(3)
|
Includes
held-for-sale impairment charges
of
$10.5 million
and
change in fair market value on royalty rights
of
$910.8 million
.
|
|
(4)
|
Includes
intangible asset impairment charges
of
$866.6 million
,
goodwill impairment charges
of
$737.9 million
, and
held-for-sale impairment charges
of
$10.2 million
.
|
|
(5)
|
Includes
intangible asset impairment charges
of
$378.6 million
,
goodwill impairment charges
of
$224.1 million
, and a
reduction in held-for-sale impairment charges
of
$4.5 million
.
|
|
September 26, 2015
(2)
|
December 31, 2015
(3)
|
||||||
|
Six Months Ended December 31, 2015
|
Restated
|
Restated
|
|||||
|
Net sales
|
$
|
1,273.1
|
|
$
|
1,359.1
|
|
|
|
Gross profit
|
$
|
535.2
|
|
$
|
543.7
|
|
|
|
Tysabri
®
royalty stream - change in fair value
|
$
|
(173.8
|
)
|
$
|
116.6
|
|
|
|
Net income (loss)
|
$
|
260.9
|
|
$
|
(218.4
|
)
|
|
|
Income (loss) per share
(1)
:
|
|||||||
|
Basic
|
$
|
1.78
|
|
$
|
(1.51
|
)
|
|
|
Diluted
|
$
|
1.78
|
|
$
|
(1.51
|
)
|
|
|
Weighted-average shares outstanding
|
|||||||
|
Basic
|
146.3
|
|
144.9
|
|
|||
|
Diluted
|
146.9
|
|
144.9
|
|
|||
(1)
The sum of individual per share amounts may not equal due to rounding.
(2)
Includes
Mylan defense-related fees
of
$15.6 million
.
|
(3)
|
Includes an
intangible asset impairment charge
of
$185.1 million
,
Mylan defense-related fees
of
$71.3 million
,
an
impairment charge on our India API held for sale assets
of
$29.0 million
,
restructuring charges
of
$24.7 million
, and an
investment impairment charge
of
$10.7 million
.
|
|
First
Quarter |
Second
Quarter (2) |
Third
Quarter (3) |
Fourth
Quarter (4) |
||||||||||||
|
Year Ended June 27, 2015
|
Restated
|
Restated
|
Restated
|
Restated
|
|||||||||||
|
Net sales
|
$
|
859.6
|
|
$
|
985.1
|
|
$
|
967.2
|
|
$
|
1,415.2
|
|
|||
|
Gross profit
|
$
|
304.1
|
|
$
|
369.7
|
|
$
|
369.4
|
|
$
|
601.0
|
|
|||
|
Tysabri
®
royalty stream - change in fair value
|
$
|
58.9
|
|
$
|
(105.8
|
)
|
$
|
(100.8
|
)
|
$
|
69.2
|
|
|||
|
Net income (loss)
|
$
|
29.4
|
|
$
|
151.1
|
|
$
|
(22.2
|
)
|
$
|
(22.2
|
)
|
|||
|
Income (loss) per share
(1)
:
|
|||||||||||||||
|
Basic
|
$
|
0.22
|
|
$
|
1.11
|
|
$
|
(0.16
|
)
|
$
|
(0.15
|
)
|
|||
|
Diluted
|
$
|
0.22
|
|
$
|
1.10
|
|
$
|
(0.16
|
)
|
$
|
(0.15
|
)
|
|||
|
Weighted-average shares outstanding
|
|||||||||||||||
|
Basic
|
133.9
|
|
136.3
|
|
140.8
|
|
146.3
|
|
|||||||
|
Diluted
|
134.4
|
|
136.8
|
|
140.8
|
|
146.3
|
|
|||||||
(1)
The sum of individual per share amounts may not equal due to rounding.
|
(2)
|
Includes
losses on derivatives
associated with the Omega acquisition of
$64.7 million
,
Omega transaction expenses
of
$17.8 million
, an
R&D payment made in connection with a collaborative agreement
of
$10.0 million
, a
$9.6 million
loss on extinguishment of debt, partially offset by
income from transfer of rights agreement
of
$12.5 million
.
|
|
(3)
|
Includes
losses on derivatives
associated with the Omega acquisition of
$258.2 million
and
Omega financing fees
of
$18.6 million
.
|
|
(4)
|
Includes
acquisition costs
of
$18.5 million
, an initial
payment made in connection with an R&D agreement
of
$18.0 million
, an
inventory step up related to the Omega acquisition
totaling
$15.6 million
, and
$13.4 million
of Mylan defense-related fees.
|
186
Perrigo Company plc
- Item 8
Note 21
NOTE 21 -
TRANSITION PERIOD COMPARATIVE DATA
The following table presents certain financial information (in millions, except per share amounts):
|
|
Six Months Ended
|
||||||
|
|
December 31,
2015 |
December 27,
2014 |
|||||
|
(Unaudited)
|
|||||||
|
Restated
|
Restated
|
||||||
|
Net sales
|
$
|
2,632.2
|
|
$
|
1,844.7
|
|
|
|
Cost of sales
|
1,553.3
|
|
1,170.9
|
|
|||
|
Gross profit
|
1,078.9
|
|
673.8
|
|
|||
|
Operating expenses
|
|||||||
|
Distribution
|
47.9
|
|
29.2
|
|
|||
|
Research and development
|
88.2
|
|
89.8
|
|
|||
|
Selling
|
325.9
|
|
95.3
|
|
|||
|
Administration
|
306.8
|
|
165.6
|
|
|||
|
Impairment charges
|
215.6
|
|
—
|
|
|||
|
Restructuring
|
26.9
|
|
4.2
|
|
|||
|
Total operating expenses
|
1,011.3
|
|
384.1
|
|
|||
|
Operating income
|
67.6
|
|
289.7
|
|
|||
|
Tysabri
®
royalty stream - change in fair value
|
(57.3
|
)
|
(46.9
|
)
|
|||
|
Interest expense, net
|
89.9
|
|
56.7
|
|
|||
|
Other expense, net
|
25.2
|
|
60.3
|
|
|||
|
Loss on extinguishment of debt
|
0.9
|
|
9.6
|
|
|||
|
Income before income taxes
|
8.9
|
|
210.0
|
|
|||
|
Income tax expense (benefit)
|
(33.6
|
)
|
29.4
|
|
|||
|
Net income
|
$
|
42.5
|
|
$
|
180.6
|
|
|
|
Income per share
|
|||||||
|
Basic
|
$
|
0.29
|
|
$
|
1.34
|
|
|
|
Diluted
|
$
|
0.29
|
|
$
|
1.34
|
|
|
|
Weighted-average shares outstanding
|
|||||||
|
Basic
|
145.6
|
|
135.1
|
|
|||
|
Diluted
|
146.1
|
|
135.6
|
|
|||
|
Dividends declared per share
|
$
|
0.25
|
|
$
|
0.21
|
|
|
NOTE 22 -
SUBSEQUENT EVENTS
187
Perrigo Company plc
- Item 8
Note 20
On
March 27, 2017
, we announced the completed divestment of our Tysabri
®
royalty stream to Royalty Pharma for up to
$2.85 billion
, which consists of
$2.2 billion
in cash and up to
$250.0 million
and
$400.0 million
in milestone payments to us if the royalties on global net sales of Tysabri
®
that are received by Royalty Pharma meet specific thresholds in 2018 and 2020, respectively. As a result of this transaction, we will derecognize the Tysabri
®
financial asset in the first quarter of 2017 and we do not expect the disposition to have a material impact on our results.
On
April 6, 2017
, we announced the completed divestment of our India API business to Strides Shasun Limited. Total cash received was
$22.2 million
. The sale is not expected to have a material impact on our operations nor will the transaction result in a significant gain or loss when recorded in the second quarter of 2017.
On April 7, 2017, we issued a notice of redemption to redeem all of the
$600.0 million
in aggregate principal amount of the outstanding
2.300%
senior notes due
November 8, 2018
(the “2.300% 2018 Notes”). On May 8, 2017, using proceeds from the sale of Tysabri
®
, we redeemed all of the 2.300% 2018 Notes.
|
ITEM 9.
|
CHANGES IN AND DISAGREEMENTS WITH ACCOUNTANTS ON ACCOUNTING AND FINANCIAL DISCLOSURE
|
Not applicable.
|
ITEM 9A.
|
CONTROLS AND PROCEDURES
|
(a)
Conclusion Regarding the Effectiveness of Disclosure Controls and Procedures
Our management, with the participation of our Chief Executive Officer and Chief Financial Officer, has evaluated the effectiveness of the design and operation of our disclosure controls and procedures (as defined in Rule 13a-15(e) or 15d-15(e) of the Exchange Act) as of December 31, 2016. Based upon that evaluation, our Chief Executive Officer and Chief Financial Officer have concluded that our disclosure controls and procedures were not effective as of December 31, 2016 because of the material weaknesses in our internal control over financial reporting described in the "Management's Annual Report on Internal Control over Financial Reporting." Notwithstanding these material weaknesses, management concluded that the consolidated financial statements included in this Annual Report present fairly, in all material respects, the financial position of the Company at December 31, 2016 in conformity with GAAP and our external auditors have issued an unqualified opinion on our consolidated financial statements as of and for the year ended December 31, 2016.
(b) Management’s Annual Report on Internal Control over Financial Reporting
MANAGEMENT’S ANNUAL REPORT ON INTERNAL CONTROL OVER FINANCIAL REPORTING
The management of Perrigo Company plc is responsible for establishing and maintaining adequate internal control over financial reporting. Internal control over financial reporting is defined in Rules 13a-15(f) or 15d-15(f) promulgated under the Securities Exchange Act of 1934 as a process designed by, or under the supervision of, our principal executive and principal financial officers and effected by our Board of Directors, management and other personnel, to provide reasonable assurance regarding the reliability of financial reporting and the preparation of financial statements for external purposes in accordance with U.S. generally accepted accounting principles and includes those policies and procedures that:
|
•
|
Pertain to the maintenance of records that in reasonable detail accurately and fairly reflect the transactions and dispositions of our assets;
|
|
•
|
Provide reasonable assurance that transactions are recorded as necessary to permit preparation of financial statements in accordance with U.S. generally accepted accounting principles and that our receipts and expenditures are being made only in accordance with authorizations of our management and directors; and
|
|
•
|
Provide reasonable assurance regarding prevention or timely detection of unauthorized acquisition, use or disposition of our assets that could have a material effect on the financial statements.
|
188
Perrigo Company plc
- Management's Annual Report on Internal Control Over Financial Reporting
All systems of internal control, no matter how well designed, have inherent limitations. Therefore, even those systems deemed to be effective can provide only reasonable assurance with respect to financial statement preparation and presentation. Because of inherent limitations, our internal control over financial reporting may not prevent or detect misstatements. Also, projections of any evaluation of effectiveness to future periods are subject to the risk that controls may become inadequate because of changes in conditions or that the degree of compliance with the policies or procedures may deteriorate. A material weakness is a deficiency, or combination of deficiencies, in internal control over financial reporting, such that there is a reasonable possibility that a material misstatement of a company’s annual or interim consolidated financial statements will not be prevented or detected on a timely basis.
Our management assessed the effectiveness of our internal control over financial reporting as of December 31, 2016. The framework used in carrying out our evaluation was the 2013
Internal Control - Integrated Framework
published by the Committee of Sponsoring Organizations ("COSO") of the Treadway Commission. In evaluating our information technology controls, we also used components of the framework contained in the
Control Objectives for Information and related Technology
("COBIT"), which was developed by the Information Systems Audit and Control Association’s IT Governance Institute, as a complement to the COSO internal control framework.
Management has concluded that our internal control over financial reporting was ineffective as of December 31, 2016. The results of management’s assessment have been reviewed with our Audit Committee.
Tysabri
®
Contingent Payments
We acquired the Tysabri
®
royalty stream in our acquisition of Elan Pharmaceuticals plc (“Elan”) in December 2013, and at the time of the acquisition concluded that the right to receive quarterly royalty payments from Biogen, Inc. should be an intangible asset and such payments recognized as revenue in our financial statements. As discussed in Item 4.02 of our Form 8-K filed on April 25, 2017, during the 2016 year-end close process, and in anticipation of our potential sale of the Tysabri
®
royalty rights and the 2018 adoption of ASC 606
Revenue from Contracts with Customers
, we re-evaluated the historical classification of the Tysabri
®
royalty stream as an intangible asset and concluded that it should have been reflected in the financial statements as a financial asset as of its 2013 acquisition date. As part of this evaluation, management determined that its control over the review of the application of the accounting guidance in ASC 805
Business Combinations
did not operate effectively in the appropriate identification of the assets acquired and liabilities assumed in connection with the Elan acquisition in December 2013.
All originally filed financial statements presented up to the filing of this 2016 Form 10-K included the disclosure of the Elan acquisition with the Tysabri
®
royalty stream presented as an intangible asset. In addition, due to the fact that the asset was historically classified as an intangible asset, we did not design or implement controls around the fair value accounting for the Tysabri
®
royalty stream as a financial asset, so these controls were not in place at any quarter end subsequent to the acquisition, including the date of the annual assessment of internal control. Accordingly, management concluded that these control deficiencies represent material weaknesses.
Income Taxes
Management has determined that we did not design or maintain effective management review controls related to our (1) evaluation of non-routine transactions that impact our effective tax rate on an annual and interim basis and (2) determination of our deferred taxes in connection with business combinations.
During our quarterly and annual Fiscal 2016 close processes, management determined that the design and operating effectiveness of our controls around the evaluation of non-routine events did not operate appropriately. As disclosed in our Form 10-Q for the quarterly period ended April 2, 2016 (the “First Quarter 2016 10-Q”), our management review controls did not operate at a sufficient level of precision to ensure interim income taxes were properly recorded and disclosed in our condensed consolidated financial statements in connection with the recording of an indefinite-lived intangible asset impairment and estimated goodwill impairment as part of the Company’s controls to evaluate non-routine events that occur during a quarterly period and the related income tax impacts. These control deficiencies resulted in a material misstatement in income taxes in the preliminary financial statements for the quarter ended April 2, 2016. Additionally, these controls remained unremediated at December 31, 2016, as in February 2017, we identified that these controls did not appropriately evaluate the need for a valuation allowance. ASC 740,
Income Taxes,
requires a company to record a valuation allowance to reduce a
189
Perrigo Company plc
- Management's Annual Report on Internal Control Over Financial Reporting
deferred tax asset to its net realizable value. Our controls related to consideration of non-routine transactions or events were not designed and did not operate appropriately and identify whether a valuation allowance was needed as they did not identify that we entered into a three year cumulative loss and did not consider the positive and negative evidence in evaluating the potential sources of taxable income in determining whether a valuation allowance was required in the consolidated financial statements.
In February 2017, management identified the existence of tax basis in certain acquired intangible assets (“tax amortization benefits”) that existed at the time of the acquisition of Omega Pharma Invest N.V. ("Omega") on March 30, 2015. Upon evaluating the tax amortization benefits, management concluded that the purchase accounting for Omega should have included the tax basis in the intangible assets in calculating the deferred tax liability in the opening balance sheet. This omission of existing tax basis in calculating the deferred tax liability on the acquisition date indicated that management’s review over the opening balance sheet deferred income tax accounts was not designed or operating appropriately.
Accordingly, management concluded that these control deficiencies represent material weaknesses.
Impairment
In connection with our long-lived asset impairment testing, management determined that the controls around the identification of the relevant asset group under ASC 360,
Impairment and Disposal of Long-lived Assets
did not operate effectively. In determining the level to evaluate the long-lived assets in our Animal Health reporting unit for impairment testing, we inappropriately grouped the assets that constituted the asset group in applying the guidance in ASC 360.
Accordingly, management concluded that this control deficiency represented a material weakness.
The results of management’s assessment have been reviewed with our Audit Committee. Ernst & Young LLP, the independent registered public accounting firm that audited our financial statements included in this Annual Report on Form 10-K, also audited the effectiveness of our internal control over financial reporting, as stated in their report that is included herein.
REMEDIATION PLAN
We are committed to remediating the control deficiencies that gave rise to the material weaknesses described above. Management is responsible for implementing changes and improvements to internal control over financial reporting and for remediating the control deficiencies that gave rise to the material weaknesses.
To remediate the material weakness in internal control over financial reporting related to the acquisition of the Tysabri
®
royalty rights, we plan, with oversight from the Audit Committee, to:
|
•
|
Review the processes and controls in place related to our application of ASC 805 to enhance the effectiveness of the design and operation of those controls to identify assets acquired and liabilities assumed; and
|
|
•
|
Evaluate and enhance management review controls related to business acquisitions.
|
In addition, as part of our restatement process described in
Item 8. Note 1
to the Consolidated Financial Statements, we designed and initiated certain controls around the accounting for the Tysabri
®
royalty stream as a financial asset. These controls that we are implementing include: 1) review procedures related to the fair value estimation process, such as the use of relevant data and key assumptions utilized in the projections of future cash flows and calculation of discount rates and 2) management review controls over key assumptions and methodologies used in the calculations.
Until the remediation actions are fully implemented and the design and operating effectiveness of related internal controls is validated through testing, the material weaknesses described above will continue to exist.
To remediate the material weaknesses in internal control over financial reporting related to income taxes, we plan, with oversight from the Audit Committee, to continue to:
190
Perrigo Company plc
- Management's Annual Report on Internal Control Over Financial Reporting
|
•
|
Review the organization structure, resources, processes and controls in place to measure and record income taxes to enhance the effectiveness of the design and operation of those controls;
|
|
•
|
Evaluate the design and operating effectiveness of our controls related to income taxes for business acquisitions and non-routine transactions on an interim and annual basis;
|
|
•
|
Enhance monitoring activities related to income taxes; and
|
|
•
|
Evaluate and enhance the level of precision in the management review controls related to income taxes.
|
We expect to implement the remediation actions in 2017. Until the remediation actions are fully implemented and the operational effectiveness of related internal controls is validated through testing, the material weaknesses described above will continue to exist.
To remediate the material weakness in internal control over financial reporting related to the identification of assets groups as part of our impairment testing, we plan, with oversight from the Audit Committee, to:
|
•
|
Review the design and operation of our controls related to asset group determination in our impairment process on an interim and annual basis; and
|
|
•
|
Evaluate and enhance the management review controls related to impairment.
|
We expect to implement the remediation actions in 2017. Until the remediation actions are fully implemented and the operational effectiveness of related internal controls is validated through testing, the material weaknesses described above will continue to exist.
We are committed to achieving and maintaining a strong internal control environment and believe the remediation measures will strengthen our internal control over financial reporting and remediate the material weaknesses identified. We intend to review each of the identified material weaknesses and add resources and improve our processes to achieve and maintain a strong control environment. We will continue to monitor the effectiveness of these remediation measures and will make any changes and take such other actions that we deem appropriate given the circumstances.
(c) Changes in Internal Control over Financial Reporting
There were no material changes in our internal control over financial reporting, identified in connection with management's evaluation of internal control over financial reporting, that occurred during the quarter ended December 31, 2016 that have materially affected, or are reasonably likely to materially affect, our internal control over financial reporting.
191
|
ITEM 9B.
|
OTHER INFORMATION
|
Not applicable.
192
Perrigo Company plc
- Report of Independent Registered Public Accounting Firm on Internal Control Over Financial Reporting
REPORT OF INDEPENDENT REGISTERED PUBLIC ACCOUNTING FIRM ON INTERNAL
CONTROL OVER FINANCIAL REPORTING
Board of Directors and Shareholders
Perrigo Company plc
We have audited Perrigo Company plc’s internal control over financial reporting as of December 31, 2016, based on criteria established in Internal Control-Integrated Framework issued by the Committee of Sponsoring Organizations of the Treadway Commission (2013 framework) (the COSO criteria). Perrigo Company plc’s
management is responsible for maintaining effective internal control over financial reporting, and for its assessment of the effectiveness of internal control over financial reporting included in the accompanying Management’s Annual Report on Internal Control Over Financial Reporting
.
Our responsibility is to express an opinion on the company’s internal control over financial reporting based on our audit.
We conducted our audit in accordance with the standards of the Public Company Accounting Oversight Board (United States). Those standards require that we plan and perform the audit to obtain reasonable assurance about whether effective internal control over financial reporting was maintained in all material respects. Our audit included obtaining an understanding of internal control over financial reporting, assessing the risk that a material weakness exists, testing and evaluating the design and operating effectiveness of internal control based on the assessed risk, and performing such other procedures as we considered necessary in the circumstances. We believe that our audit provides a reasonable basis for our opinion.
A company’s internal control over financial reporting is a process designed to provide reasonable assurance regarding the reliability of financial reporting and the preparation of financial statements for external purposes in accordance with generally accepted accounting principles. A company’s internal control over financial reporting includes those policies and procedures that (1) pertain to the maintenance of records that, in reasonable detail, accurately and fairly reflect the transactions and dispositions of the assets of the company; (2) provide reasonable assurance that transactions are recorded as necessary to permit preparation of financial statements in accordance with generally accepted accounting principles, and that receipts and expenditures of the company are being made only in accordance with authorizations of management and directors of the company; and (3) provide reasonable assurance regarding prevention or timely detection of unauthorized acquisition, use, or disposition of the company’s assets that could have a material effect on the financial statements.
Because of its inherent limitations, internal control over financial reporting may not prevent or detect misstatements. Also, projections of any evaluation of effectiveness to future periods are subject to the risk that controls may become inadequate because of changes in conditions, or that the degree of compliance with the policies or procedures may deteriorate.
A material weakness is a deficiency, or combination of deficiencies, in internal control over financial reporting, such that there is a reasonable possibility that a material misstatement of the company’s annual or interim financial statements will not be prevented or detected on a timely basis. Management has identified material weaknesses in controls related to (1) the identification of the type of assets acquired in business combinations, (2) accounting for financial assets (3) accounting for deferred income taxes in business combinations, (4) the ongoing accounting for non-routine components of the Company’s income tax expense calculation related to valuation allowances and the annual effective tax rate and (5) the identification of asset groups when assessing long-lived assets for impairment.
We also have audited, in accordance with the standards of the Public Company Accounting Oversight Board (United States), the consolidated balance sheets of Perrigo Company plc as of December 31, 2016, December 31, 2015 and June 27, 2015, and the related consolidated statements of operations, comprehensive income (loss), shareholders’ equity and cash flows for each of the year ended December 31, 2016, the period from June 28, 2015 to December 31, 2015, and each of the two years in the period ended June 27, 2015. These material weaknesses were considered in determining the nature, timing and extent of audit tests applied in our audit of the 2016
financial statements, and this report does not affect our report dated May 22, 2017, which expressed an unqualified opinion on those financial statements.
In our opinion, because of the effect of the material weakness described above on the achievement of the objectives of the control criteria, Perrigo Company plc has not maintained effective internal control over financial reporting as of December 31, 2016, based on the COSO criteria.
193
Perrigo Company plc
- Report of Independent Registered Public Accounting Firm on Internal Control Over Financial Reporting
/s/ Ernst & Young LLP
Grand Rapids, Michigan
May 22, 2017
194
Perrigo Company plc
- Item 10
|
ITEM 10.
|
DIRECTORS, EXECUTIVE OFFICERS, AND CORPORATE GOVERNANCE
|
Director Experience
Our Board represents a cross-section of business, industry and financial experience. All of our directors bring to the Board of Directors significant leadership experience derived from their professional experience in either the corporate or academic sectors, as well as their service as executives or board members of other corporations or businesses. Certain individual qualifications and skills of our directors that contribute to the effectiveness of our Board of Directors as a whole are described below.
Board Refreshment
The Board is committed to thoughtful board refreshment and ongoing board succession planning. During 2016 and 2017, seven new independent directors have been added to our Board. Geoffrey M. Parker was appointed and began serving in November 2016. Theodore R. Samuels was also appointed in November 2016 and began serving in January 2017. Mr. Parker and Mr. Samuels were identified by the Nominating & Governance Committee with the assistance of an independent search firm. In February 2017, Bradley A. Alford, Jeffrey B. Kindler and Jeffrey C. Smith were appointed to the Board effective immediately under the terms of the agreement between the Company and Starboard Value LP and certain of its affiliates (collectively, “Starboard”). Also, under the Starboard agreement, on May 2, 2017, Adriana Karaboutis and Rolf A. Classon were appointed to the Board effective immediately. The Starboard agreement is discussed in more detail below under the heading Certain Relationships and Related-Party Transactions.
About the Directors
Eleven directors currently serve on our Board of Directors. All directors who are elected will serve until the 2018 Annual General Meeting.
Bradley A. Alford
, 60, has been a director of Perrigo since February 2017. Mr. Alford joined Advent International Corporation, a global private equity firm, in 2014 as an Industry Advisor and moved to Operating Partner in March of 2016. From 2006 to 2013, Mr. Alford was Chairman and Chief Executive Officer of Nestlé USA. Mr. Alford also served as CEO and President of Nestlé Brands Company. He also serves as a director of Avery Dennison Corporation since April 2010, and Conagra Brands, Inc. since July 2015. Throughout his career, Mr. Alford has been focused on developing brands, initiatives to improve processes and facilitate best practices across an organization.
Director Qualifications
:
|
•
|
Leadership experience
- current and previous executive leadership roles within the private and public sectors.
|
|
•
|
Board and corporate governance experience
- board and corporate governance experience from service as a director of public, private and non-profit companies.
|
|
•
|
Industry knowledge
- extensive experience and knowledge in management, operations and supply chain as well as the development and marketing of consumer products.
|
Laurie Brlas
, 59, has been a director of Perrigo since August 2003 and was appointed Chairman of the Board in April 2016. Ms. Brlas served as Executive Vice President and Chief Financial Officer of Newmont Mining Corporation from September 2013 until October 2016, and she retired from Newmont Mining Corporation on December 31, 2016. From 2006 through 2013, Ms. Brlas held various positions with Cliffs Natural Resources, most recently as Executive Vice President and President Global Operations. Prior to this role, she served as Chief Financial Officer. Prior to that, Ms. Brlas served as Senior Vice President and Chief Financial Officer of STERIS Corporation, a provider of healthcare products, from 2000 through 2006. From 1995 through 2000, Ms. Brlas held various positions with Office Max, Inc., most recently as Senior Vice President and Corporate Controller. Since October 2016, Ms. Brlas has served as a director on the board of Calpine, a power company based in Houston, Texas. Ms. Brlas also served as a director for Nova Chemicals from September 2008 to July 2009.
195
Director Qualifications:
|
•
|
Leadership and operating experience
- previous executive leadership roles at Newmont Mining Corporation, Cliffs Natural Resources, Inc., STERIS Corporation, and Office Max.
|
|
•
|
Board and corporate governance experience
- board and corporate governance experience from current and prior service as a director and committee member on public and non-profit boards.
|
|
•
|
Industry Knowledge
- experience in operations and supply chain and FDA regulated industries.
|
Rolf A. Classon
, 71, has been a director of Perrigo since May 2017. Mr. Classon served as Interim President and Chief Executive Officer of Hillenbrand Industries, a global diversified industrial company, from May 2005 until March 2006. From 2002 until June 2004, Mr. Classon served as Chairman of the Executive Committee of Bayer Healthcare AG, a subsidiary of Bayer AG. Mr. Classon served as President of Bayer Diagnostics from 1995 to 2002 and as Executive Vice President from 1991 to 1995. Prior to 1991, Mr. Classon held various management positions with Pharmacia Corporation. Mr. Classon serves as a director of Fresenius Medical Care AG and Co. since May 2012, Tecan Group, Ltd. since April 2009, Catalent, Inc. since July 2014, and Hill-Rom Holdings, Inc. since July 2002. Mr. Classon also served as a director of Aerocrine AB, Stockholm from May 2013 to July 2015 and Auxilium Pharmaceuticals from July 2005 to January 2015.
Director Qualifications:
|
•
|
Leadership and operating experience
- previous executive leadership roles at Hillenbrand Industries, Bayer Healthcare AG, Bayer Diagnostics and Pharmacia Corporation.
|
|
•
|
Board and corporate governance experience
- board and corporate governance experience from current and prior service as a director and committee member on public boards.
|
|
•
|
Industry knowledge
- extensive experience in varying roles within the pharmaceutical industry.
|
Gary M. Cohen,
57, has been a director of Perrigo since January 2003. Since 2006, he has served as Executive Vice President of Becton, Dickinson and Company (“BD”), a provider of medical supplies, devices, laboratory equipment and diagnostic systems. He also served as President of BD Medical, one of three business segments of BD, from 1999 until 2006. Mr. Cohen has been an executive officer of BD in various capacities since 1996. Mr. Cohen presently serves as a director and co-chair of GBCHealth; director, founder and president of Together for Girls, Inc.; and a director of the following additional nonprofit organizations: the Centers for Disease Control and Prevention (CDC) Foundation; the United States Fund for UNICEF; the Federal Drug Agents Foundation; and the Global Partnership to End Violence Against Children. He also serves as chairperson of the CDC Corporate Roundtable on Global Heath Threats and Scientific Advisor for Grand Challenges Canada.
Director Qualifications:
|
•
|
Leadership and operating experience
- currently an Executive Vice President at a global medical technology company as well as years of service in previous executive officer roles of varying degrees.
|
|
•
|
Board and corporate governance experience
- board and corporate governance experience from current and prior service as a director and committee member on public and non-profit company boards.
|
|
•
|
Industry knowledge
- extensive experience in the medical supply and diagnostic equipment industries and in international business.
|
John T. Hendrickson,
54, has served as Chief Executive Officer of Perrigo since April 2016 and has been a director of Perrigo since June 2016. He previously served as President from October 2015 until April 2016, Executive Vice President, Global Operations and Supply Chain from March 2007 until October 2015, and Executive Vice President and General Manger, Perrigo Consumer Healthcare from January 2003 to March 2007. Mr. Hendrickson joined Perrigo in 1989 and has held numerous positions of increasing responsibility, from operations to supply chain to sales.
Director Qualifications:
|
•
|
Leadership, operating and marketing experience
- current Chief Executive Officer and various leadership roles at Perrigo.
|
|
•
|
Board and corporate governance experience
- board and corporate governance experience from current and previous service as a director of private and non-profit companies and organizations.
|
196
|
•
|
Industry knowledge
- extensive experience and knowledge in operations and supply chain as well as the development and marketing of store brand consumer healthcare products.
|
Adriana Karaboutis
, 54, has been a director of Perrigo since May 2017. Ms. Karaboutis served as Executive Vice President, Technology, Business Solutions and Corporate Affairs at Biogen Inc., an independent biotechnology company from December 2015 to February 2017, and as Executive Vice President, Technology and Business Solutions from September 2014 to December 2015. Prior to that, Ms. Karaboutis served as Vice President and Global Chief Information Officer of Dell, Inc., a global technology company, from 2011 to September 2014, and as Vice President of IT, Global Operations and Technology from 2010 to 2011. Ms. Karaboutis spent more than 20 years at General Motors Corporation and Ford Motor Company in various leadership positions, including computer-integrated manufacturing, supply chain operations and information technology. In addition, Ms. Karaboutis has been a director of Advance Auto Parts, Inc. since 2015 and Blue Cross Blue Shield of Massachusetts since 2016.
Director Qualifications
:
|
•
|
Leadership and operating experience
- previous executive leadership roles, including IT and cyber security at Biogen, Inc., and Dell, Inc.
|
|
•
|
Board and corporate governance experience
- board and corporate governance experience from current and prior service as a director and committee member on public boards.
|
Jeffrey B. Kindler
, 61, has been a director of Perrigo since February 2017. Mr. Kindler has been a Venture Partner at Lux Capital, a venture capital firm, since 2012, and has served as CEO of Centrexion Corporation, a privately held bio therapeutics company that develops pain therapies, since 2013. In addition, Mr. Kindler serves as Executive Chairman of vTv, Managing Director at Starboard Capital Partners (unrelated to Starboard Value LP or any of its affiliates), and advisor to a number of healthcare companies. Prior to this, Mr. Kindler was Chairman and CEO of Pfizer, Vice President of Litigation and Legal Policy at General Electric Company, Executive Vice President and General Counsel at McDonald’s, and President at Partner Brands. In addition, Mr. Kindler has served as a director of Intrexon since 2011, also serving as Chair of the Audit Committee, vTv Therapeutics since 2015, and Siga Technologies since 2013, as well as a number of privately held companies.
Director Qualifications
:
|
•
|
Leadership experience
- current and previous executive leadership roles within the private and public sectors.
|
|
•
|
Board and corporate governance experience
- board and corporate governance experience from service as a director of public, private and non-profit companies.
|
|
•
|
Legal experience
- extensive legal experience in both the public and private sectors.
|
Donal O’Connor
, 66, has been a director of Perrigo since November 2014 and was previously a director of Elan Corporation, plc from May 2008 until Perrigo’s acquisition of Elan in December 2013. During Mr. O’Connor’s tenure on Elan’s board of directors, he served on Elan’s Audit and Leadership, Development and Compensation Committees. He was previously a senior partner of PwC in Ireland from 1995 until 2007. He was also a member of PwC Global Board from 2003 to 2008 and was a former chairman of the PwC Eurofirms Board. From December 2008 to May 2012, Mr. O’Connor served as a director for Readymix plc, an Irish concrete manufacturer and supplier, also serving on its audit and remuneration committees. From December 2008 to June 2010, Mr. O’Connor served as the government appointed Chairman of Anglo Irish Bank plc. Mr. O’Connor has been a director of Theravance Biopharma, Inc. since October 2015 and also holds directorships in a number of private Irish companies.
Director Qualifications:
|
•
|
Leadership experience -
former Senior Partner of Pricewaterhouse Coopers.
|
|
•
|
Board and corporate governance experience
- current and prior board and committee experience in the financial, pharmaceutical and other industries.
|
|
•
|
Accounting and financial expertise
- qualified chartered accountant currently designated as an “audit committee financial expert” given his skills and attributes acquired through relevant education and work experience.
|
Geoffrey M. Parker,
52, has been a director of Perrigo since November 2016. Since April 2017, Mr. Parker has served as Chief Financial Officer of Tricida, Inc., a biopharmaceutical company. Mr. Parker previously served as
197
Chief Financial Officer of Anacor Pharmaceuticals, a bio pharmaceutical company, from September 2010 to May 2015. From 1997 to 2009, Mr. Parker led the West Coast Healthcare Investment Banking practice at Goldman Sachs, where he advised leading companies in the biotechnology, life science tools and medical device industries. Mr. Parker has served as a member of the board of directors of Genomic Health, Sunesis Pharmaceuticals and ChemoCentryx since June 2016, March 2016, and December 2009, respectively.
Director Qualifications:
|
•
|
Leadership experience -
former Chief Financial Officer and investment banking executive.
|
|
•
|
Board and corporate governance experience
- current board and committee experience in the health science industry.
|
|
•
|
Accounting and financial expertise
- designated as an “audit committee financial expert” given his skills and attributes acquired through relevant education and work experience.
|
Theodore R. Samuels,
62, has been a director of Perrigo since January 2017. From 1981 to 2017, Mr. Samuels was an investor at Capital Group, a financial services company, and he served as President of Capital Guardian Trust Company, an affiliated company of Capital Group, from 2010 to 2016. While at Capital Group, he also served on The Capital Group Board, Audit Committee and Finance Committee, as well as on numerous management and investment committees. Mr. Samuels has been a director for Stamps.com since January 2017 and a director of Bristol-Myers Squibb since February 2017.
Director Qualifications:
|
•
|
Leadership experience -
former investment management executive and former co-chair of Children’s Hospital Los Angeles.
|
|
•
|
Board and corporate governance experience
- past and current board and committee experience in the financial and health science industries.
|
|
•
|
Accounting and financial expertise
- extensive accounting and financial skills and attributes acquired through relevant education and work experience.
|
Jeffrey C. Smith
, 45, has been a director of Perrigo since February 2017. Mr. Smith is a Managing Member, CEO, and Chief Investment Officer of Starboard Value LP. Mr. Smith has extensive experience in best-in-class corporate governance practices and significantly improving value at underperforming companies. He currently serves as Chairman of the Board of Advance Auto Parts, where he has been as a director since November 2015, and has also been on the board of Yahoo! Inc. since April 2016. Mr. Smith was Chairman of the Board of Darden Restaurants from October 2014 to April 2016. In addition, during the past five years, Mr. Smith has served on the boards of Quantum Corporation, Office Depot, Inc., Regis Corporation and Surmodics, Inc.
Director Qualifications
:
|
•
|
Leadership and operating experience
- current and previous executive leadership roles within the private and public sectors.
|
|
•
|
Board and corporate governance experience
- board and corporate governance experience from service as a director of public and private companies.
|
|
•
|
Accounting and Financial Expertise
- extensive accounting and financial skills and attributes acquired through relevant education and work experience, including involvement in capital markets and investment decision making.
|
Audit Committee
The Audit Committee currently consists of the following independent directors: Donal O’Connor (Chair), Jeffrey B. Kindler, Geoffrey M. Parker and Adriana Karaboutis. The Board of Directors has determined that each member of the Audit Committee (1) meets the audit committee independence requirements of the NYSE listing standards and the rules and regulations of the SEC and (2) is able to read and understand fundamental financial statements, as required by the NYSE listing standards. The Board has also determined that Donal O’Connor, Jeffrey B. Kindler, and Geoffrey M. Parker, have the requisite attributes of an “audit committee financial expert” under the SEC’s rules and that such attributes were acquired through relevant education and work experience.
198
Section 16(a) Beneficial Ownership Reporting Compliance
Section 16(a) of the Securities Exchange Act of 1934 requires that Perrigo’s executive officers, directors and 10% shareholders file reports of ownership and changes of ownership of Perrigo ordinary shares with the SEC. Based on a review of copies of these reports provided to us and written representations from executive officers and directors, we believe that all filing requirements were met during 2016, with the exception of one transaction occurring in 2011 that was included in Ms. Brown’s Form 4 filed in August 2016.
Code of Conduct
Our Code of Conduct acknowledges that a reputation for ethical, moral and legal business conduct is one of Perrigo’s most valuable assets. In addition to acknowledging special ethical and legal obligations for financial reporting, the Code requires that our employees, officers and directors comply with laws and other legal requirements, avoid conflicts of interest, protect corporate opportunities and confidential information, conduct business in an honest and ethical manner and otherwise act with integrity and in Perrigo’s best interest. Our Code of Conduct is available on our website (http://www.perrigo.com) under the heading Investors - Corporate Governance - Code of Conduct, and we will promptly post any amendments to or waivers of the Code on our website. We will mail a copy of our Code of Conduct to any shareholder upon request to our Company Secretary, Todd W. Kingma, at Treasury Building, Lower Grand Canal Street, Dublin 2, Ireland, or at GeneralMeeting@perrigo.com.
|
ITEM 11.
|
EXECUTIVE COMPENSATION
|
Compensation Discussion and Analysis
Introduction
Last year was a year of transformation and strategic change at Perrigo. Many of these changes continue in 2017 and directly impact our compensation programs.
Management Changes
- Following the departure of our former CEO in April 2016 and CFO in March 2017, we appointed John T. Hendrickson as CEO and Ronald L. Winowiecki as Acting CFO. Both have substantially lower total compensation than their predecessors.
Strategic Changes
- Since becoming CEO, John Hendrickson has been committed to disciplined execution and decisive action. He has led a comprehensive strategic, operational and financial review of the business, optimized our organizational effectiveness, and reduced our overall cost structure, all with the goal of stabilizing the business in the near term and creating shareholder value going forward.
Board Changes
- In April 2016, the Board separated the roles of Chairman of the Board and CEO and appointed independent director Laurie Brlas as Chairman of the Board. We also began refreshing our Board through the November 2016 appointments of Geoffrey M. Parker and Theodore R. Samuels. This has continued in 2017 with the appointments of Bradley A. Alford, Jeffrey B. Kindler and Jeffrey C. Smith in February 2017 and Rolf A. Classon and Adriana Karaboutis in May 2017. These new directors bring a great deal of experience and fresh perspective to our board, and their addition also reduced our average director tenure from over 11 years in June 2016 to approximately 3 years today.
Compensation Changes
- Although we have historically received strong shareholder support (nearly 90%) for our executive compensation programs, at the 2016 AGM approximately 56% of the votes cast supported our executive compensation decisions. We recognize that this was an unacceptably low percentage. During 2016, we solicited feedback from the holders of more than 20% of our shares outstanding, including approximately 30% of our institutional holders, and separately engaged in meaningful dialogue about our compensation program with a number of our institutional investors. Through this outreach, we learned that the primary reason for the low support level for say on pay in 2016 was shareholder opposition to the special cash and non-performance-based equity awards provided to executives in 2015 to strengthen retention of key talent in the midst of the unsolicited takeover bid from Mylan. Aside from that issue, the shareholders we spoke with generally supported the overall structure of
199
our executive pay program. Nevertheless, these conversations with shareholders helped us identify opportunities for improvements to our program.
Specifically, in our 2017 executive compensation program, we:
|
•
|
Increased focus on longer-term relative performance comparisons through the addition of a relative TSR metric;
|
|
•
|
Simplified the plan design, aligning it with market practices and our strategic focus - e.g., we removed net operating profit after tax as the primary annual incentive bonus funding mechanism and replaced it with operating income and days of working capital; and
|
|
•
|
Increased the weight of performance-based long-term compensation we provide to executives by eliminating service-based restricted stock units and replaced them with performance shares based on Total Shareholder Return that is measured over a three-year period.
|
We have also taken steps to ensure that we had a fresh perspective in reviewing and assessing our compensation program. For 2017, we appointed a new Remuneration Committee Chair, refreshed the Committee’s membership with four new directors, engaged a new independent consultant, F.W. Cook, and reconstituted our peer group to better reflect our strategic direction moving forward.
The compensation-related changes did not stop at the structural level. We also demonstrated our commitment to pay-for-performance.
|
•
|
The 2016 management incentive bonus plan was funded well below the target level because the metric used to fund that plan, Net Operating Profit after Tax, or NOPAT, was achieved only slightly above the threshold level.
|
|
•
|
Even though the bonus plan was funded at a lower level, our new CEO requested that he not receive any MIB payout for 2016, and the Committee agreed, noting that the decision was not related to personal but overall Company performance. On the same basis, each of our other executive officers received less than the earned amount of his or her annual bonus.
|
|
•
|
Because the Return on Tangible Capital (“ROTC”) in 2016 was below the threshold level, there was zero (0%) vesting credit for the 2016 tranche of the performance-based equity compensation, which will apply to the full three-year vesting credit for the performance-based restricted stock units granted in fiscal 2015, Stub Period 2015, and fiscal 2016.
|
|
•
|
Finally, in 2016, none of our executive officers received a discretionary bonus or special equity award.
|
Simply stated, we have listened to our shareholders and taken action to respond to their valuable input.
This Compensation Discussion and Analysis (“CD&A”) provides information about our executive compensation program, the factors that were considered in making compensation decisions for our named executive officers and how we have modified our programs to meet Perrigo’s needs for the future.
Executive Summary
Our Future and New Executive Compensation Design
The number one goal of the Board is to position Perrigo for success, which means having a leadership team in place that is focused on creating value in the short- and long-term for all shareholders. It is also a priority to ensure our executive pay program is aligned with Perrigo’s strategic priorities and drives value creation for all shareholders.
Based on input received from our shareholders, the Committee recognizes that there are significant opportunities to ensure our executive compensation program is aligned with, and focused on, driving value creation for the benefit of all our shareholders.
To this end, the Committee, working with its independent compensation consultant and management, took the following actions, which are being fully implemented in 2017:
200
|
Program Element
|
Change
|
Rationale
|
|
The Management Incentive Bonus Plan (the “MIB Plan”)
|
Remove net operating profit after tax as the primary funding mechanism.
Use achievement of operating income (“OI”) and days of working capital (“DWC”) goals to fund and calculate actual incentive award payouts.
|
Simplifies the formula and is easier to understand.
Aligns with market practices and supports business plans.
|

|
Program Element
|
Change
|
Rationale
|
|
Long-Term Incentive (“LTI”) Plan compensation for the named executive officers
|
Remove service-based restricted stock units (“RSUs”).
Restructure the mix of equity to 70% performance-based restricted stock units (“PRSUs”) and 30% stock options.
Base 50% of the total LTI opportunity on the achievement of Return on Tangible Capital (“ROTC”) and 20% on Total Shareholder Return (“TSR”) relative to the 2017 Executive Compensation Peer Group over a three-year performance cycle.
The LTI design for all other eligible employees remains unchanged.
|
Responds to shareholder feedback.
Increases the focus on relative performance.
Simplifies approach.
Aligns with market practices.
Adds a 3-year performance measurement period.
Increases the performance-based percentage of LTI compensation to 70% (100%, if including options).
|
201

The Committee believes these changes are consistent with best practices and further align our executives’ compensation with shareholder interests.
Best Compensation Governance and Practices
With these changes, our executive compensation program continues to be grounded in the following policies and practices, which promote sound compensation governance, enhance execution of our pay-for-performance philosophy and further align our named executive officers’ interests with those of our shareholders:
|
What We Do
|
What We Do Not Do
|
|
Place a significant emphasis on variable, at-risk pay
|
Permit hedging or pledging of Perrigo stock
|
|
Align compensation with shareholder returns through long-term performance
|
Provide significant perquisites
|
|
Include clawback provisions in our incentive agreements
|
Reprice options
|
|
Have rigorous stock ownership guidelines
|
Provide “single trigger” change in control cash severance benefits
|
|
Use an independent compensation consultant
|
|
|
Conduct annual risk assessments
|
|
Recap of 2016 Compensation Actions
In making 2016 pay decisions, the Committee took several factors into account, including the business environment, the results of our operations, market practices, the competitive talent market and the design of our pay programs.
Executive Transition/Succession Planning.
During 2016 and early 2017, there were several changes in our executive management team, including:
|
•
|
In April 2016, Joseph C. Papa resigned as Chief Executive Officer and Chairman of the Board.
|
|
•
|
Following Mr. Papa’s resignation, Perrigo’s President, John T. Hendrickson, was appointed Chief Executive Officer.
|
|
•
|
In February 2017, Judy L. Brown resigned as our Executive Vice President, Business Operations and Chief Financial Officer.
|
|
•
|
Ronald L. Winowiecki, Perrigo’s Senior Vice President, Business Finance, was appointed acting Chief Financial Officer following Ms. Brown’s resignation.
|
Perrigo’s named executive officers for 2016 are:
202
|
Named Executive Officer
|
Position
|
|
John T. Hendrickson
|
Chief Executive Officer
|
|
Judy L. Brown
|
Executive Vice President, Business Operations and Chief Financial Officer
|
|
Todd W. Kingma
|
Executive Vice President, General Counsel and Secretary
|
|
Jeffrey R. Needham
|
Executive Vice President and President, Consumer Healthcare Americas
|
|
Sharon Kochan
|
Executive Vice President and President, Consumer Healthcare International
|
|
Joseph C. Papa
|
Former Chairman and Chief Executive Officer
|
Promoting Mr. Hendrickson to Chief Executive Officer.
In connection with Mr. Hendrickson’s promotion to Chief Executive Officer, the Committee approved the following:
|
Program Element
|
Committee Decisions
|
|||
|
Annual Base Salary
|
Increased salary by 28.6% to $900,000
|
|||
|
MIB Plan
|
Increased target incentive opportunity from 80% to 115% of base salary
|
|||
|
LTI Plan
|
Granted the following promotional equity awards on June 21, 2016:
|
|||
|
PRSUs
|
Stock Options
|
RSUs
|
|
$1,205,000
|
$723,000
|
$482,000
|
The total value of the grant was $2,410,000*. These awards, in addition to his regular LTI Plan award granted in February 2016 (please see “2016 LTI Plan Grants” on page 214),
are intended to align Mr. Hendrickson’s total variable pay opportunity for his position with the market as a new CEO.
*The number of stock options and RSUs granted were based on the closing price of Perrigo’s ordinary shares on the date of grant (June 21, 2016). PRSUs and RSUs fully vest on February 26, 2019. Stock options vest 33% on each of February 26, 2017, 2018 and 2019.
2016 Performance Update
|
•
|
Net sales of $5.3 billion.
|
|
•
|
Operating loss of $2.0 billion, which includes impairment charges of $2.6 billion.
|
Rewarding for 2016 Performance.
The Committee’s key compensation decisions, based on the Company’s results in 2016, were highly aligned with the actual performance in the year:
203
|
Program Element
|
Committee Decisions
|
|
Annual Base Salary
|
With the exception of Mr. Hendrickson, the named executive officers’ base salaries increased between
1.5% and 3.6% based on the Committee’s review of the compensation market data and assessment of individual performance, as well as in recognition of increased responsibilities or promotions.
|
|
MIB Plan
|
With the exception of Mr. Hendrickson, the named executive officers received annual incentive awards, based on performance, under the MIB Plan ranging from 0% to 56% of target.
|
|
LTI Plan
|
All of the named executive officers received their target annual LTI Plan award grant for 2016, which consisted of 50% PRSUs that provide no actual value unless threshold ROTC target levels are achieved over 3 years, 30% stock options (vesting over 3 years), and 20% RSUs (vesting over 3 years).
However, based on 2016 performance, there was zero (0%) vesting credit for the 2016 tranche of the performance-based equity compensation, which will apply to the full three-year vesting credit for the PRSUs granted in fiscal 2015, Stub Period 2015, and fiscal 2016.
|
What Guides Our Executive Compensation Program
Our Executive Compensation Principles
Perrigo’s executive compensation program is designed to attract, motivate and retain our executives, including our named executive offers, who are critical to our long-term success. The executive compensation program reflects our core principles:
|
•
|
Pay is linked to performance:
A significant portion of total compensation should be variable ("at-risk") and linked to the attainment of specific performance objectives.
|
|
•
|
Pay is shareholder-aligned:
Compensation should be provided through pay elements (base salaries, annual and long-term incentives) designed to drive sustained business performance, build an internal culture of ownership and create long-term value for our shareholders.
|
|
•
|
Pay opportunities are market-competitive:
Provide compensation at levels that will attract, motivate, and retain highly qualified executives who are focused on the long-term best interests of our shareholders.
|
The core elements of our executive compensation program are summarized in the table below.
|
Element
|
Form
|
What It Does
|
|
Base Salary
|
Cash
(Fixed)
|
Provides a competitive rate of compensation relative to similar positions in pharmaceutical industry and consumer-goods peers and enables us to attract and retain critical executive talent.
|
|
MIB Plan
|
Cash (Variable)
|
Focuses executives on achieving annual financial and operational goals that drive long-term shareholder value.
|
|
LTI Plan
|
Equity (Variable)
|
Provides incentives for executives to execute on longer-term financial/strategic growth goals that drive value creation and support our retention strategy.
|
The charts below show the target compensation of our Chief Executive Officer and our other named executive officers for fiscal 2016. These charts illustrate that a majority of named executive officer compensation is performance-based and variable (88% for our Chief Executive Officer and an average of 75% for our other named executive officers). The weighting of these pay elements is consistent with the market and puts a material, significant portion of the named executive officers’ total direct compensation at risk if Perrigo performance declines.
204

The Decision-Making Process
The Role of the Remuneration Committee.
The Committee, which is composed entirely of independent directors, oversees our executive compensation program. The Committee works very closely with its independent consultant and management to examine the effectiveness of Perrigo’s executive compensation program throughout the year. Details of the Committee’s authority and responsibilities are specified in the Committee’s charter, which may be accessed at
http://perrigo.investorroom.com/corporate-governance
.
Each year, the Committee reviews and approves the elements of compensation for all executive officers, including the named executive officers. The Committee submits its recommendations regarding the Chief Executive Officer’s compensation to the independent directors of the Board for approval.
To assist it in making compensation decisions, the Committee annually reviews compensation tally sheets that contain comprehensive historical, current and projected data on the total compensation and benefits package for each of our named executive officers. These tally sheets also include analyses for various termination events (including terminations with and without cause and for death, disability, retirement or following a change of control) so that the Committee can consider and understand the nature and magnitude of potential payouts and obligations under the various circumstances. These tally sheets, which are prepared by management and reviewed by Meridian, generally contain data that are substantially similar to the data contained in the tables presented below.
The Role of Management.
The Chief Executive Officer makes recommendations to the Committee regarding the compensation of the other named executive officers for the Committee’s approval. The Chief Executive Officer does not participate in the deliberations of the Committee regarding his own compensation. Management is responsible for implementing the executive compensation program as approved by the Committee and the Board.
The Role of the Independent Consultant.
For 2016, the Committee engaged Meridian Compensation Partners LLC as its independent consultant to assist it in considering and analyzing market practices and trends, outside director compensation and management’s compensation recommendations. Perrigo did not retain Meridian to perform any non-executive compensation-related consulting services for Perrigo. For 2017, the Committee engaged FW Cook as its new independent consultant. In addition, management and the Committee periodically review compensation survey data published by Mercer Human Resource Consulting, Willis Towers Watson, Aon Hewitt and the Hay Group.
The Role of Market Comparison Data.
The Committee uses information provided by Meridian regarding the compensation practices of select companies (the “Comparison Group”) as one of the factors in evaluating both the structure of our executive compensation program and target levels of compensation. Management also reviews data periodically from Mercer Human Resource Consulting,
Willis Towers Watson, Main Data Group and Equilar regarding the market positioning for base salary and annual and long-term incentive target levels for all executive roles. The Committee considers this information, together with the factors described in the “Executive Compensation Principles” section above, in determining executive compensation.
205
Over time, the Comparison Group selected by the Committee (following consultation with our independent compensation consultant and management) has focused on comparably sized pharmaceutical and other relevant consumer products peer group companies.
The Committee undertook a detailed review of the existing Comparison Group and, with the assistance of our independent compensation consultant and management, analyzed potential peer company additions and deletions, resulting in the approval of the Comparison Group in April 2015. The Comparison Group was initially used to establish competitive market data for the period between June 28, 2015 to December 31, 2015 (“2015 Stub Period”). Given the change in fiscal year end, this same Comparison Group data was used as a reference point in setting 2016 pay opportunities because no new pay data was available at that time. The Comparison Group consists of the 16
companies listed below:
|
Abbvie, Inc.
|
Mallinckrodt plc
|
|
Allergan plc
|
Mead Johnson Nutrition Co.
|
|
Allergan, Inc.
|
Mylan, Inc.
|
|
Bristol-Myers Squibb Co.
|
Regeneron Pharmaceuticals
|
|
Celgene Corporation
|
Shire plc (ADR)
|
|
Endo International plc
|
United Therapeutics Corporation
|
|
Hospira, Inc.
|
Valeant Pharmaceuticals International
|
|
Jazz Pharmaceuticals plc
|
Zoetis, Inc.
|
Our independent compensation consultant provided information on the pay practices of the Comparison Group to the extent that information was available. In addition to pay data for the Comparison Group, our independent compensation consultant provided compensation data from the Towers Watson Pharmaceutical and Health Sciences Compensation Survey as an additional reference point for the Committee’s consideration.
For fiscal 2017, the Committee undertook a review of the existing Comparison Group. The Committee continued to focus on comparably sized pharmaceutical and consumer goods companies, taking into account consolidation in the pharmaceutical industry, as well as Perrigo’s growth, changing strategy, and business focus. With the assistance of its independent consultant and management, the Committee considered additions and deletions to the existing Comparison Group, and approved a new Comparison Group for fiscal 2017 pay decisions. The new Comparison Group consists of the 16 companies listed below:
|
Baxter International Inc.
|
Church & Dwight Co., Inc.
|
Conagra Brands, Inc.
|
|
The Clorox Company
|
Endo International plc
|
Henry Schein, Inc.
|
|
Jazz Pharmaceuticals plc
|
Mallinckrodt plc
|
Mylan N.V.
|
|
Patterson Companies, Inc.
|
Prestige Brands Holdings, Inc.
|
Zoetis Inc.
|
|
Shire plc
|
Spectrum Brands Holdings, Inc.
|
TreeHouse Foods. Inc.
|
|
Reckitt Benckiser Group plc
|
||
In establishing compensation levels for the named executive officers, the Committee does not focus exclusively on market comparison data for positions with comparable responsibilities. Instead, that data is one factor that the Committee uses when setting compensation levels for each element of our program (salary, target annual cash incentive and equity-based compensation) and for the combined total of these elements. Although Perrigo does not specifically target a stated pay percentile objective, the Committee considers the 50th percentile of market data to be a valuable indication of what is competitive in the market.
In addition to market comparison data, the Committee also considers an individual’s competencies, experience and performance; Company and division financial performance; and the aggregate cost to Perrigo. Ultimately, consideration of market comparison data in setting compensation levels is intended to ensure that our compensation practices are competitive in terms of attracting, rewarding and retaining executives.
206
2016 Executive Compensation Program In Detail
Base Salaries
The Committee approves base salaries for the named executive officers other than the Chief Executive Officer. For the Chief Executive Officer, the Committee submits its recommendation for the Chief Executive Officer’s base salary to the Board for approval. In approving a named executive officers’ base salary, the Committee may consider comparisons among positions internally and externally, proxy and survey data, performance, job experience and unique role responsibilities. To assist the Committee in this process, each year the Chief Executive Officer provides the Committee with base salary recommendations for each of the other named executive officers, as well as summaries of such named executive officers’ individual performance.
The named executive officers are eligible for annual salary increases based on an evaluation of individual performance and the market level of pay for comparable positions at other companies in the Comparison Group. Named executive officers are also eligible for salary adjustments for promotions or changes in job responsibilities.
For 2016, the Committee approved the following base salary adjustments for the named executive officers, other than Mr. Papa whose 2016 compensation is addressed on page 231. With the exception of Mr. Hendrickson’s increase, which was based primarily on his promotion to Chief Executive Officer (please see “Promoting Mr. Hendrickson to Chief Executive Officer” on page 207), the other named executive officers received modest adjustments to better align their salaries with the market.
|
Named Executive Officer
|
2015 Stub Period Annualized Base Salary
|
2016 Base Salary
|
% Increase
|
|
John T. Hendrickson
|
$700,000 (not CEO)
|
$900,000 (CEO)
|
28.6%
|
|
Judy L. Brown
|
$634,500
|
$657,342
|
3.6%
|
|
Todd W. Kingma
|
$511,000
|
$526,330
|
3.0%
|
|
Jeffrey R. Needham
|
$500,000
|
$507,500
|
1.5%
|
|
Sharon Kochan
|
$495,000
|
$502,425
|
1.5%
|
Annual Incentive Award Opportunities
The MIB Plan is designed to motivate and reward the named executive officers for achieving and exceeding specific, financial goals that support our objective of increasing long-term shareholder value. Participants in the MIB Plan include our named executive officers, other management level personnel and other selected individuals. Substantially all other employees participate in other annual incentive plans. MIB Plan awards are paid in cash.
Near the beginning of each performance period, the Board approves the financial plan for that performance period, from which the Committee determines and approves the performance target goals and payout schedules for the MIB Plan. These goals and individual bonus targets, which are stated as a percentage of salary, are then communicated to the participants. The payout schedules reflect a range of potential award opportunities that are set around the targets.
Following the end of the performance period, the Committee reviews Perrigo’s actual results against the performance target goals to determine at what level the MIB Plan awards will be paid. The MIB Plan payout schedules provide for payouts only if performance results meet or exceed our performance goals, excluding any items and events that are non-operational in nature, such as acquisitions.
Individual performance goals are not a formulaic input for determining the bonus opportunity. However, to ensure that awards reflect a named executive officer’s and contribution to our results, the Committee has, or, in the case of the Chief Executive Officer, the independent directors have, the discretion to adjust any named executive officer’s actual award up by as much as 50% or down by as much as 100% based on individual performance, provided that, in the case of any upward adjustment, the maximum incentive award opportunity for any individual executive is capped at 200% of the target award opportunity.
Actual incentive payouts may vary from target levels based on Company, division and individual performance.
207
Target Award Opportunity.
The 2016 target MIB Plan award opportunities for the named executive officers, other than Mr. Papa whose 2016 compensation is addressed on page 231, are shown in the table below. The range of award opportunities is listed in the Grants of Plan-Based Awards for 2016 table on page 221.
|
Named Executive Officer
|
2016 Target Bonus
(as % of Salary)
|
|
Mr. Hendrickson
|
115%
|
|
Ms. Brown
|
75%
|
|
Mr. Kingma
|
60%
|
|
Mr. Needham
|
60%
|
|
Mr. Kochan
|
60%
|
MIB Plan Funding.
Net Operating Profit After Tax (“NOPAT”) was the performance metric for calculating the pool of available funds that could be paid out under the MIB Plan for 2016. For purposes of calculating performance attainment, NOPAT is adjusted for acquisitions, impairments, amortization expense, and other non-operational items as reviewed and approved by the Committee.
Near the beginning of 2016, the Committee approved a matrix of annual incentive funding opportunities for the MIB Plan that corresponded to various levels of NOPAT performance as a percentage of the MIB NOPAT target goal for 2016. The maximum pool of funds available for all 2016 awards under the MIB Plan was capped at 200% of the aggregate target award for all participants and the maximum incentive award opportunity for any individual participant in the MIB Plan was limited to 250% of that individual’s target award (200% for executive officers).
The following chart shows the formula for overall MIB funding for 2016:
|
Performance Level
|
Funding Level
|
|
|
Below Threshold:
|
Below 80% of performance target
|
Zero
|
|
Threshold:
|
At 80% of performance target
|
50% funding of target awards
|
|
Between 80% and 100% of performance target
|
50% funding of target awards plus an additional 2.5% of funding for every 1% (or fraction thereof) above the performance target
|
|
|
Target:
|
At 100% of performance target
|
100% funding of target awards
|
|
Between 100% and 120% of performance target
|
100% funding of target awards plus an additional 5% of funding for every 1% (or fraction thereof) above the performance target
|
|
|
Maximum:
|
At or above 120% of performance target
|
200% funding of target awards
|
Near the beginning of the calendar year, the Board approved the financial plan for that calendar year, from which the Committee determined and approved the performance target goals and payout schedules for the 2016 MIB Plan.
2016 MIB Pool Funding
|
NOPAT Performance Goals ($M)
|
Pool Funding
|
|
|
Maximum
|
$1,884
|
200%
|
|
Target
|
$1,569.6
|
100%
|
|
Threshold
|
$1,256
|
50%
|
|
Actual
|
$1,284.5
|
51.4%
|
208
Under the MIB Plan, the Committee may adjust performance measures to prevent dilution or enlargement of awards by excluding the effects of, among other things, extraordinary, unusual or non-recurring items, assets impairments, and non-cash items. Perrigo’s adjusted MIB NOPAT performance for 2016 was $1,264.7 million, which consisted of a $1,999.7 million
loss from operations as reported in our financial statements, plus $3,264.4 million of net, non-operational adjustments reviewed and approved by the Committee. These adjustments included $2,631.0 million of asset impairments and $363.9 million of amortization expense, as well as charges related to acquisitions and divestitures not included in Perrigo’s original plan for 2016, restructuring charges, and unusual litigation charges. In addition, the Committee removed the non-cash effects of changes in the fair value for the Tysabri
®
royalty stream and included actual Tysabri
®
cash royalties consistent with the annual plan measure, resulting in a $356.2 million adjustment. In addition, tax expense was calculated on net operating profit on a consistent basis for both plan and actual results. Based on the pay-out matrix for the 2016 MIB Plan, this would have funded the MIB pool at 51.4%; however, the Committee used its discretion to decrease MIB pool funding to 51.1%, which correlates to NOPAT prior to recent changes in accounting.
MIB Payouts.
The pool of available funds is allocated among nine
sub-pools covering various geographic groups or business units, including Corporate, using a mathematical formula based on the relative performance of each geographic group or business unit. This allocation determined the actual payout for members of each respective geographic group or business unit, which ranged from a low of 29.99% to a high of 61.17%. Perrigo’s management team, including the named executive officers, participates in the Corporate MIB Plan.
For 2016, the Committee used the following performance metrics to determine how the pool of available MIB funds would be allocated. The table also shows each performance metric’s relative weighting, threshold and target objectives and actual results.
|
Performance Metric
|
Weighting
|
Threshold*
|
Target
|
Actual Results
|
|
Corporate OI
|
80%
|
$1,449.35
|
$1,811.69
|
$1,432.40
|
|
Corporate DWC
|
20%
|
113.49
|
94.57 Days
|
96.3
|
*Threshold must be achieved for participants to receive any payouts relative to those components under the MIB Plan.
Based on the payout matrix for 2016 Corporate MIB Plan and the weighting between the OI and DWC components, the bonus payouts under 2016 Corporate MIB Plan, which included payouts to each named executive officer, were 34.56% of the bonus target.
In assessing individual performance in 2016 for purposes of determining whether adjustments should be made to the MIB payouts, the Committee focused on the personal efforts of participants to help Perrigo meet its financial, strategic and other goals. The Chief Executive Officer provided substantial input to the Committee regarding the personal performance of the other named executive officers in this respect. In the case of the Chief Executive Officer, there was a robust review process carried out by the Committee, which included annual evaluation questionnaires and responses collected and summarized by the Independent Remuneration Consultant and provided to the Committee and Board Chair. After considering Mr. Hendrickson’s request that he not receive any MIB payout for 2016, and noting that the decision was not related to personal performance, the Committee agreed and submitted its recommendation for the CEO’s compensation to the independent directors for their approval. The independent directors in the case of the Chief Executive Officer, and the Committee in the case of the other named executive officers, have the ability to adjust individual MIB payouts based on personal performance. Individual adjustments are based on the assessment of personal performance, segment performance, competencies, experience, contributions to business success and, in some cases, overall Company performance and resulted in actual MIB payouts for 2016 to the named executive officers, other than Mr. Hendrickson, ranging from 0% to 72%
of target. The independent directors accepted the Committee’s recommendation and did not award an MIB payout to Mr. Hendrickson for 2016. The actual MIB payouts awarded to the named executive officers are listed under Non-Equity Incentive Plan Compensation in the Summary Compensation table on page 220.
209
Long-Term Incentive Award Opportunities
Long-term stock-based compensation, which is awarded under our LTI Plan, is intended to motivate and reward executives for creating shareholder value as reflected in the total shareholder return of Perrigo’s ordinary shares. Awards under the LTI Plan may be in the form of stock options, non-statutory stock options, stock appreciation rights or stock awards, including restricted shares or restricted share units, or performance shares or performance units. We provide long-term incentive opportunities solely through stock-based awards.
As a variable component of compensation, the amount realized from stock-based compensation will vary based on the market price of Perrigo’s ordinary shares. In addition, performance-based restricted stock units are only earned if specified financial goals are achieved.
The Committee sets stock-based grant levels based on consideration of a named executive officers’ position, review of market competitive practices (using the market median as a competitive guideline) and the aggregate cost impact to Perrigo. Grants to named executive officers are subject to the approval of the Committee and, in the case of the Chief Executive Officer, the independent directors.
During our regularly scheduled meetings in the First Quarter of the calendar year, the Board approves all regular, annual stock-based awards for the Chief Executive Officer, and the Committee approves all stock-based awards for the other named executive officers, as well as the maximum potential total grants for other employee levels. All regular annual stock-based awards are granted on, and priced at the last reported sale price of Perrigo’s stock on the fifth trading day after the day on which Perrigo publicly releases its year-end earnings for the calendar year.
Stock-based awards may be granted at various times during the year to new hires or to existing non-executive employees under special circumstances (promotions, retention or performance) with the approval of the Chief Executive Officer. Stock-based awards may also be granted during the year to the executive officers other than the Chief Executive Officer with the approval of the Committee and to the Chief Executive Officer with the approval of the independent directors as permitted under the LTI Plan. Such awards are priced at the closing price of Perrigo’s stock on the day the awards are granted.
2016 LTI Plan Grants.
All of the named executive officers received their target annual LTI Plan award grant for 2016, which consisted of 50% PRSUs that provide no actual value unless threshold target levels of return on tangible capital (“ROTC”) are achieved over three years, 30% stock options (vesting over three years), and 20% service-based RSUs (vesting over three years). The table below shows the LTI Plan award values granted for fiscal 2016 for each of the named executive officers, other than Mr. Papa.
|
Named Executive
Officer
|
PRSUs At Target*
|
Stock Options**
|
RSUs*
|
Total Value
|
|
Mr. Hendrickson***
|
9,673
12,494
|
21,943
26,968
|
3,869
4,997
|
$2,500,000
$2,485,000
|
|
Ms. Brown
|
8,125
|
18,432
|
3,250
|
$2,100,000
|
|
Mr. Kingma
|
4,836
|
10,971
|
1,935
|
$1,250,000
|
|
Mr. Needham
|
3,366
|
7,636
|
1,346
|
$870,000
|
|
Mr. Kochan
|
3,289
|
7,461
|
1,315
|
$850,000
|
|
* Except for the promotional grant to Mr. Hendrickson, award amounts for PRSUs and RSUs were determined based on the closing price of Perrigo ordinary shares on the date of grant (February 26, 2016) for all of the named executive officers.
|
||||
|
** Award amounts were calculated based on Black-Scholes values.
|
||||
|
*** Mr. Hendrickson received two grants in fiscal 2016, the annual grant in February 2016 (the first line) and a promotional grant after he became CEO in June 2016 (the second line).
|
||||
A Closer Look at PRSUs
The number of PRSUs to be earned for the 2016 grant is dependent on Perrigo’s performance during three distinct performance periods (for which a separate ROTC goal is established) as follows:
210
|
•
|
January 1, 2016 through December 31, 2016;
|
|
•
|
January 1, 2017 through December 31, 2017; and
|
|
•
|
January 1, 2018 through December 31, 2018
|
Shares can be earned based on the average ROTC over three distinct performance periods, using challenging target ROTC goals that are set by the Board and based on each year’s financial plan. Earned awards, if any, can range from 0% to 200% of the target number of shares granted and will become 100% vested on February 26, 2019 (three years from the grant date).
The Committee has approved using ROTC as the performance measure for PRSUs because it measures our ability to generate profits from the effective use of all tangible capital invested in the business. Tangible capital is defined as Perrigo’s operating assets and liabilities excluding all acquisition-related intangible assets and goodwill. ROTC is calculated by dividing Perrigo’s after tax MIB OI by its tangible capital. Both management and the Board of Directors regularly review both ROTC and return on invested capital (“ROIC”) to measure Perrigo’s ability to provide a return on all assets greater than its cost of capital. The ROIC calculation includes goodwill as well as intangible assets from acquisitions.
Starting in 2017, the Committee approved the addition of a rTSR metric with a three-year measurement period to the performance-based equity mix. This will account for 20% of the total grant and is replacing the 20% which previously was awarded in service-based RSUs. The change means that a total of 70% of LTI awards will be provided in the form of performance-based equity (with the remaining 30% provided in options).
The ROTC target used for PRSUs granted in 2016 was 73.9%. As reflected in the chart below, our 2016 ROTC performance of 62.3% resulted in an actual vesting credit of 0% for 2016, which will be relevant for any performance period that includes 2016. Information regarding the fiscal 2014 grant is included in footnote 5 to the Outstanding Equity Awards at 2016 Year End table on page 224.

Change in Performance Measurement Period for the Fiscal 2015 PRSU Grant
Beginning on January 1, 2016, we changed our fiscal year to begin on January 1 and end on December 31 of each year. As a result of this change, on June 22, 2015, the Board and the Committee approved an amendment to the performance measurement periods applicable to Perrigo’s fiscal 2015 PRSU awards under the LTI Plan. The amendment changed the remaining performance measurement periods on the fiscal 2015 grants to align with Perrigo’s next two financial reporting periods given the change in fiscal year. As amended, the fiscal 2015 grant performance measurement period is as follows:
211
|
FY15 Grant
|
Original Measurement Period
|
As Amended
|
|
Year One
|
June 29, 2014 - June 27, 2015
|
June 29, 2014 - June 27, 2015
|
|
Year Two
|
June 28, 2015 - June 25, 2016
|
June 28, 2015 - December 31, 2015
|
|
Year Three
|
June 26, 2016 - July 1, 2017
|
January 1, 2016 - December 31, 2016
|
The amendment retains the original service requirements, such that the recipients must remain employed with Perrigo through the original vesting date of the applicable grant in order to actually receive these grants.
With respect to the PRSUs that vested in 2016, the vesting credits for fiscal 2016, 2015 Stub Period, and fiscal 2015 were 0%, 68% and 135%, respectively, based on Perrigo’s financial performance. Given these percentages, the full three-year vesting credit for the performance-based restricted stock units granted in fiscal 2015 was 68%.
The actual number of restricted stock units that vested in 2016 for each of our named executive officers is listed under Number of Shares Acquired on Vesting in the Option Exercises and Stock Vested in 2016 table on page 225.
The accounting cost of the stock-based awards is determined at the grant date and accrued over the vesting service period. The ultimate expense for the PRSUs is based on the number of shares earned.
The grant date fair value, as calculated under the applicable accounting standard (FASB ASC Topic 718), for 2016 stock-based grants is presented in the Grants of Plan-Based Awards for 2016 table on page 222.
Former Chief Executive Officer 2016 Compensation
Joseph C. Papa resigned as our Chief Executive Officer on April 24, 2016. Prior to his resignation, he was compensated in accordance with his employment agreement and other benefits consistent with those provided to members of senior management. The details of the agreement relating to Mr. Papa’s employment can be found on page 219. Mr. Papa’s base salary for 2016 was $1,285,000, a 3% increase over his base salary for the 2015 Stub Period, and his 2016 target MIB Plan award opportunity was 120%. In 2016, Mr. Papa also received grants under the LTI Plan consisting of 32,694 PSUs, 74,166 NQSO and 13,077 SRSUs, all of which were forfeited upon his resignation. Further details regarding amounts received by Mr. Papa upon his termination are provided in the section entitled “Potential Payments Upon Termination or Change in Control” beginning on page 226.
Other Policies, Practices and Guidelines
Executive Stock Ownership Guidelines
Consistent with our compensation philosophy of tying a significant portion of the total compensation to performance, our executive compensation program facilitates and encourages long-term ownership of Perrigo stock. Our stock ownership guidelines reinforce that philosophy by requiring executive officers to maintain specific levels of stock ownership.
Each executive officer is required to attain certain target levels of stock ownership. These ownership guidelines are expressed in terms of a multiple of base salary. Beginning in 2017, the Chief Executive Officer’s ownership requirement increased from 5 to 6 times base salary. The current ownership guidelines are as follows:
|
•
|
Chief Executive Officer: 6 times base salary
|
|
•
|
Executive Vice President: 3 times base salary
|
|
•
|
Senior Vice President: 2 times base salary
|
For purposes of determining an executive officer’s stock ownership, at least fifty percent (50%) must consist of (i) shares purchased on the open market, (ii) shares owned jointly with a spouse and/or children, (iii) shares acquired through the exercise of stock options or vesting of restricted shares or restricted stock units, or (iv) shares held through the Perrigo Company Profit-Sharing and Investment Plan. The balance of an executive officer’s stock ownership may be satisfied through (a) unvested but earned performance-based restricted stock shares or restricted share units that have not been forfeited, and (b) unvested service-based restricted shares or restricted share units that have not been forfeited.
212
Until each executive officer attains the applicable target stock ownership level, he or she is required to retain a stated percentage of shares received through our incentive plans, including shares obtained through the exercise of stock options, vesting of restricted shares, payout of performance shares and any other vehicle through which the individual acquires shares. At any time that an executive’s direct stock ownership is below the required levels set forth above, (i) with respect to restricted shares and units, he/she is restricted from selling more than 50% of the net shares received following the vesting of any service-based or performance-based restricted shares or restricted share units under any of the Company’s compensation plans, and (ii) with respect to stock options, he or she is restricted from selling more than 50% of the net value received upon the exercise of any stock option (i.e. after the cost of the option and taxes are remitted), such that at least 50% of the net value received upon the exercise of any stock option must be converted to directly owned shares. In these cases, however, the participants must still adhere to the retention requirements with respect to the remaining shares.
As of the end of 2016, all of our executive officers, including our named executive officers, were in compliance with these guidelines.
Clawback Policy
Our grant documents include a claw-back provision that allows Perrigo to recover incentive compensation paid to an executive if Perrigo’s financial results are later restated due to the individual’s misconduct, including, without limitation, fraud or knowing illegal conduct.
Anti-Hedging and Anti-Pledging Policy
In August 2016, the Board of Directors amended the insider trading policy. As amended, the policy, which already prohibited executive officers and directors from trading in options, warrants, puts and calls or similar instruments on Perrigo securities and holding Perrigo securities in margin accounts, also prohibits executive officers and directors from pledging Perrigo securities as collateral for a loan. In addition, the amended policy prohibits our directors and all employees, including executive officers, from selling Perrigo securities “short,” engaging in “short sales against the box,” and entering into hedging or monetization transactions or similar arrangements with respect to Perrigo securities.
Compensation Risk Assessment
At the Committee’s request, Meridian, the Committee’s independent consultant, conducted an assessment of Perrigo’s compensation policies and practices for 2016 to determine whether any practices might encourage excessive risk taking on the part of executives. This assessment included a review of Perrigo’s pay philosophy, competitive position, annual incentive arrangements (including broad-based incentive plans) and long-term incentive arrangements (including stock option, restricted stock unit and performance share unit design) as well as potential mitigating factors such as stock ownership requirements, caps on incentive plan payouts, and recoupment policies.
After considering Meridian’s assessment, the Committee concluded that our compensation programs are designed and administered with the appropriate balance of risk and reward in relation to our overall business strategy and are not designed in such a way to encourage executives and employees to take unnecessary risks that would be reasonably likely to have a material adverse effect on Perrigo.
Based on our program and the assessment review from Meridian, the Committee determined that any risks arising from our compensation policies and practices are not reasonably likely to have a material adverse effect on Perrigo.
Benefits and Perquisites
Retirement Benefits.
We offer retirement benefit plans to provide financial security and to facilitate employees’ saving for their retirement. We make annual contributions under our Profit Sharing Plan for employees, including the executive officers. We also make matching contributions up to the limits as defined in the applicable regulations under our 401(k) Plan to certain of our employees, including the named executive officers.
213
Executive Perquisites.
We provide a limited number of perquisites to our named executive officers. Benefits and perquisites may include supplemental long-term disability insurance premiums, executive physical exams, limited spousal travel and financial counseling/tax advice.
Non-Qualified Deferred Compensation Plan.
We maintain a Non-Qualified Deferred Compensation Plan (the “Deferred Compensation Plan”) that allows certain executives, including the named executive officers, and other management level personnel to voluntarily elect to defer base salary and earned annual incentive awards. Under that plan, we provide annual profit-sharing contributions and matching contributions that cannot be provided under Perrigo’s Profit-Sharing and Investment Plan (the “Tax-Qualified Plan”) because of the limitations of Sections 415 and 401(a)(17) of the Code. Code Section 415 limits the total annual additions to a participant’s account under the Tax-Qualified Plan to a specified dollar amount, currently $53,000. Code Section 401(a)(17) limits total compensation that can be considered under the Tax-Qualified Plan. This limit is currently $265,000. Due to these limits, certain Perrigo employees would not receive profit-sharing contributions and matching contributions under the Tax-Qualified Plan on their full compensation. Therefore, we provide affected employees who contribute to the the Deferred Compensation Plan, including the named executive officers, a company match and a profit sharing contribution under the Deferred Compensation Plan that they would have been eligible for under the Tax-Qualified Plan but for the limitations under the Code.
Employment Agreements (Severance Benefits)
We typically do not enter into employment agreements with our executives other than our CEO. Based on Mr. Hendrickson’s promotion to CEO during 2016, we entered into an employment agreement with him. The key compensation terms of this agreement are summarized below. Post-employment payments under the CEO’s employment agreement are presented in the section entitled “Potential Payments Upon Termination or Change in Control” beginning on page 226.
In addition, based on Sharon Kochan’s move to Israel during 2016, and based on current Israeli law, we entered into an employment contract with him. The key compensation terms of Mr. Kochan’s agreement are summarized below.
All other executives are subject to our general severance policy in the event of termination other than for cause. Under this policy, executives terminated without cause would receive 52 weeks of base salary, a 52-week waiver of COBRA premiums, a pro-rata bonus payment and can elect career transition assistance up to a maximum of $25,000.
Mr. Hendrickson
Mr. Hendrickson’s employment agreement became effective on August 3, 2016. Consistent with our emphasis on performance-based pay, the majority of Mr. Hendrickson’s annual compensation is stock-based with the ultimate value realized based on Perrigo’s stock price performance. In accordance with his employment agreement, Mr. Hendrickson’s compensation currently includes: a base salary; participation in the MIB Plan; annual grants of stock options, RSUs and PRSUs; and participation in Perrigo’s other employee benefit plans.
The employment agreement has an initial term of three years, which is subject to automatic renewal thereafter for one-year periods unless either party provides 180 days’ prior notice of non-renewal. The agreement contains customary confidentiality obligations, non-competition restrictions for two years from the date of termination of his employment and non-solicitation restrictions for two years from the date of termination of his employment.
If Mr. Hendrickson were involuntarily terminated by us without cause or voluntarily terminated for good reason (as defined in the agreement), he would receive cash severance benefits and continued vesting of certain stock based awards. The circumstances under which severance benefits are triggered and the resulting payouts are generally consistent with market practices.
Mr. Kochan
Mr. Kochan’s employment agreement became effective on September 1, 2016. In accordance with his employment agreement, Mr. Kochan’s compensation currently includes a base salary; participation in the MIB Plan; and annual grants under the LTI Plan.
214
The employment agreement has an indefinite term and will continue unless either party provides 18 months’ prior notice of termination. The agreement contains non-disclosure restrictions for three years from the date of termination of his employment and non-competition and non-solicitation restrictions for six months from the date of termination of his employment.
Further details regarding potential payments under Mr. Hendrickson’s and Mr. Kochan’s agreements upon a termination of employment, including following a change in control, are presented in the section entitled “Potential Payments Upon Termination or Change in Control” beginning on page 226.
Joseph C. Papa (former Chairman and Chief Executive Officer).
Mr. Papa’s employment agreement became effective on October 9, 2006. In accordance with his employment agreement, Mr. Papa’s compensation in 2016 prior to his resignation included: a base salary; participation in the MIB Plan; annual grants of stock options, service-based restricted units and PRSUs; and participation in Perrigo’s other employee benefit plans.
Mr. Papa also served on the Board of Directors pursuant to the terms of his agreement. The agreement contained customary confidentiality obligations, non-competition restrictions for two years from the date of termination of his employment and non-solicitation restrictions for one year from the date of termination of his employment.
Under the agreement, if Mr. Papa were involuntarily terminated by us without cause or voluntarily terminated for good reason (as defined in the agreement), he would receive cash severance benefits and continued vesting of certain stock-based awards. In addition, under the terms of his equity grant agreements, Mr. Papa would receive full vesting of his outstanding stock-based awards upon termination following a change in control.
On November 12, 2015, Mr. Papa’s employment agreement was amended to more closely conform the terms of the agreement applicable in the event of a change in control of Perrigo to those of the broad-based Change in Control Severance Policy for U.S. Employees. Pursuant to our amendment, in the event of a change in control, the term of Mr. Papa’s employment agreement would be automatically extended for an additional two years from the date of such change in control. The non-competition and non-solicitation restrictive covenants would not apply if his employment were terminated without cause or as a result of or in any way related to a change in control.
Although Mr. Papa forfeited his rights relative to any unvested equity compensation, further details regarding actual payments made to Mr. Papa upon his resignation are presented in the section entitled “Potential Payments Upon Termination or Change in Control” beginning on page 226.
Tax Matters
Deductibility of Compensation
Code Section 162(m) limits the deductibility by Perrigo of compensation in excess of $1 million paid to each of the CEO and the next three most highly paid officers (excluding the Chief Financial Officer). Certain “performance-based compensation” is not included in compensation counted for purposes of the limit. The Committee attempts to establish and maintain a compensation program that will optimize the deductibility of compensation. The Committee, however, reserves the right to use its judgment to authorize compensation that may not be fully deductible where merited by the need to respond to changing business conditions or an executive officer’s individual performance.
Stock options and PRSUs are designed to be deductible by Perrigo for federal income tax purposes under Section 162(m) of the Internal Revenue Code (the “Code”). Accordingly, when named executive officers exercise options or receive shares in payment for earned PRSUs, they are taxed at ordinary income rates (subject to withholding), and Perrigo receives a corresponding tax deduction. For certain named executive officers with total compensation exceeding $1 million, the compensation expense associated with service-based restricted stock awards may not be tax deductible by Perrigo for federal income tax purposes under Section 162(m).
215
Summary Compensation Table
The following table summarizes the compensation of our named executive officers for 2016, the 2015 Stub Period and fiscal years 2015 and 2014.
|
Name and Principal
Position
|
Fiscal
Year
|
Salary($)
|
Bonus($)
|
Stock Awards($)
(1)
|
Option Awards($)
(2)
|
Non-Equity Incentive Plan Compensation
($)
(3)
|
All Other Compensation($)
(5)
|
Total
($)
|
|
John T. Hendrickson
Chief Executive Officer |
2016
|
810,521
|
—
|
3,437,040
|
1,473,024
|
—
|
79,312
|
5,799,897
|
|
2015SP
|
283,250
|
—
|
1,450,103
|
—
|
175,822
|
26,908
|
1,936,083
|
|
|
2015
|
490,750
|
—
|
930,677
|
285,023
|
295,912
|
62,730
|
2,065,093
|
|
|
2014
|
470,250
|
—
|
643,937
|
276,234
|
265,328
|
1,299,871
|
2,955,620
|
|
|
Judy L. Brown
Executive Vice President, Chief Financial Officer |
2016
|
651,632
|
—
|
1,469,991
|
630,006
|
—
|
152,800
|
2,904,428
|
|
2015SP
|
312,625
|
375,000
4
|
2,375,083
|
—
|
170,460
|
31,950
|
2,890,118
|
|
|
2015
|
605,950
|
—
|
1,617,124
|
572,404
|
419,968
|
153,904
|
3,369,350
|
|
|
2014
|
563,200
|
—
|
1,206,065
|
517,314
|
340,249
|
3,785,451
|
6,412,279
|
|
|
Todd W. Kingma
Executive Vice President, General Counsel and Secretary |
2016
|
522,498
|
—
|
875,016
|
374,989
|
—
|
92,434
|
1,864,937
|
|
2015SP
|
251,750
|
375,000
4
|
1,475,007
|
—
|
119,601
|
22,837
|
1,869,196
|
|
|
2015
|
490,750
|
—
|
986,231
|
285,023
|
294,812
|
92,914
|
2,149,731
|
|
|
2014
|
470,250
|
—
|
643,937
|
276,234
|
267,855
|
2,400,921
|
4,059,198
|
|
|
Jeffrey R. Needham
Executive Vice President, Consumer Healthcare |
2016
|
505,625
|
—
|
608,932
|
260,998
|
170,000
|
52,869
|
1,598,424
|
|
2015SP
|
248,000
|
—
|
855,146
|
—
|
120,274
|
3,675
|
1,227,095
|
|
|
Sharon Kochan
Executive Vice President |
2016
|
500,587
|
—
|
594,975
|
255,017
|
65,000
|
65,769
|
1,481,347
|
|
2015SP
|
243,150
|
—
|
841,500
|
—
|
110,539
|
3,559
|
1,198,748
|
|
|
2015
|
474,125
|
—
|
575,339
|
240,909
|
279,509
|
47,105
|
1,616,987
|
|
|
2014
|
458,025
|
—
|
559,972
|
240,195
|
243,663
|
1,296,902
|
2,798,756
|
|
|
Joseph C. Papa
Chairman & Chief Executive Officer Resigned April 2016 |
2016
|
464,293
|
—
|
5,914,986
|
2,534,994
|
—
|
196,144
|
9,110,417
|
|
2015SP
|
612,000
|
500,000
4
|
9,599,915
|
—
|
563,995
|
6,544
|
10,782,454
|
|
|
2015
|
1,183,750
|
—
|
5,829,935
|
2,022,335
|
1,410,130
|
167,555
|
10,613,704
|
|
|
2014
|
1,117,500
|
—
|
3,990,351
|
1,711,405
|
1,037,390
|
11,088,894
|
18,945,540
|
|
216
|
1) Represents the full grant date fair value of stock awards granted in the years shown, calculated in accordance with U.S. GAAP. Stock awards include service-based restricted stock units and performance-based restricted stock units. For the performance-based stock awards, the amounts reported were valued using the closing market price of our ordinary shares on the date of grant assuming payout at target performance of 100%. For 2016 these values were as follows: Mr. Hendrickson, $1,250,042 annual grant, $1,205,046 promotional grant; Ms. Brown, $1,049,994 annual grant; Mr. Kingma, $624,956 annual grant; Mr. Needham, $434,988 annual grant; Mr. Kochan, $425,037 annual grant; and Mr. Papa, $4,225,046 annual grant. The 100% target performance is based on the probable outcome of the relevant performance conditions as of the grant date. See the Grants of Plan-Based Awards for Calendar Year 2016 Table for additional information regarding the full grant date fair value for all stock awards.
|
|
2) Represents the full grant date fair value of stock options granted in the fiscal years shown, calculated in accordance with U.S. GAAP. Stock options were valued using the Black-Scholes model. Additional weighted average valuation assumptions related to option awards are included in the stockholders' equity note of the audited financial statements included in our Annual Reports on Form 10-K for the fiscal years ended December 31, 2016 and June 27, 2015 and the transition report on Form 10-KT for the six month period ended December 31, 2015. No stock options were granted during the 2015 Stub Period.
|
|
3) The compensation amounts set forth in the “Non-Equity Incentive Plan Compensation” column represent the Management Incentive Bonus earned for the relevant fiscal year/stub period as described in the Compensation Discussion and Analysis section entitled Elements of Compensation – Annual Incentive Award Opportunities.
|
|
4) One-time cash bonus awarded for recognizing their key contributions related to Mylan's hostile takeover attempt.
|
|
5) The following table describes the compensation amounts set forth in the “All Other Compensation” column of the Summary Compensation Table:
|
|
Name
|
Perquisites and Other Personal Benefits($)
(1)
|
Registrant Contributions to Defined Contribution Plans ($)
(2)
|
Registrant Contributions to Non-Qualified Plans
|
Executive Long-Term Disability ($)
(3)
|
Total ($)
|
|
John T. Hendrickson
|
24,218
|
16,278
|
34,532
|
4,285
|
79,312
|
|
Judy L. Brown
|
62,452
|
16,278
|
70,677
|
3,392
|
152,800
|
|
Todd W. Kingma
|
15,868
|
16,278
|
55,564
|
4,724
|
92,434
|
|
Jeffrey R. Needham
|
—
|
16,278
|
31,039
|
5,552
|
52,869
|
|
Joseph C. Papa
|
—
|
16,278
|
175,503
|
4,362
|
196,144
|
|
1) Represents an allowance for tax/financial planning services; Employees also receive a reimbursement to cover applicable taxes when they work out of their home state and encounter double taxation in states and localities where they would not be eligible to receive a credit for such taxes when filing their tax returns in their home state. For Ms. Brown, full amount represents financial planning services.
|
|||||
|
2) Represents the Company's contributions to 401(k) and Profit-Sharing Plans.
|
|||||
|
3) Represents long-term disability plan premiums paid by the Company.
|
|||||
Grants of Plan-Based Awards for 2016
The following table provides information regarding equity and non-equity awards granted to the named executive officers during 2016.
217
|
Estimated Possible Payouts Under Non-Equity Incentive Plan Awards
(3)
|
Estimated Possible Payouts Under Equity Incentive Plans
(4)
|
All Other Stock
|
All Other Option Awards: Number of Securities Underlying
|
Exercise or Base Price of Option
|
Grant Date Fair Value of Stock and Option
|
|||||||||||||||||||||
|
Name
|
Grant
Date
(1)
|
Award
Date
(2)
|
Threshold ($)
|
Target ($)
|
Maximum ($)
|
Threshold (#)
|
Target (#)
|
Maximum (#)
|
Awards (#)
(5)
|
Options(#
)(6)
|
Awards ($/Sh)
|
Awards($)
(7)
|
||||||||||||||
|
John T. Hendrickson
|
2/26/2016
|
419,839
|
|
839,677
|
|
9
|
|
1,679,354
|
|
—
|
|
—
|
|
—
|
|
—
|
|
—
|
|
—
|
|
—
|
|
|||
|
2/26/2016
|
2/15/2016
|
—
|
|
—
|
|
—
|
|
—
|
|
9,673
|
|
19,346
|
|
—
|
|
—
|
|
—
|
|
1,250,042
|
|
|||||
|
2/26/2016
|
2/15/2016
|
—
|
|
—
|
|
—
|
|
—
|
|
—
|
|
—
|
|
3,869
|
|
—
|
|
—
|
|
499,991
|
|
|||||
|
2/26/2016
|
2/15/2016
|
—
|
|
—
|
|
—
|
|
—
|
|
—
|
|
—
|
|
21,943
|
|
129.23
|
|
750,012
|
|
|||||||
|
6/21/2016
|
8
|
6/13/2016
|
—
|
|
—
|
|
—
|
|
—
|
|
12,494
|
|
24,988
|
|
1,205,046
|
|
||||||||||
|
6/21/2016
|
8
|
6/13/2016
|
—
|
|
—
|
|
—
|
|
—
|
|
—
|
|
—
|
|
4,997
|
|
481,961
|
|
||||||||
|
6/21/2016
|
8
|
6/13/2016
|
—
|
|
—
|
|
—
|
|
—
|
|
—
|
|
—
|
|
26,968
|
|
96.45
|
|
723,012
|
|
||||||
|
Judy L. Brown
|
2/26/2016
|
244,362
|
|
488,724
|
|
977,447
|
|
—
|
|
—
|
|
—
|
|
—
|
|
—
|
|
—
|
|
—
|
|
|||||
|
2/26/2016
|
2/15/2016
|
—
|
|
—
|
|
—
|
|
8,125
|
|
16,250
|
|
—
|
|
—
|
|
—
|
|
1,049,994
|
|
|||||||
|
2/26/2016
|
2/15/2016
|
—
|
|
—
|
|
—
|
|
—
|
|
—
|
|
—
|
|
3,250
|
|
—
|
|
—
|
|
419,998
|
|
|||||
|
2/26/2016
|
2/15/2016
|
—
|
|
—
|
|
—
|
|
—
|
|
—
|
|
—
|
|
—
|
|
18,432
|
|
129.23
|
|
630,006
|
|
|||||
|
Todd W. Kingma
|
2/26/2016
|
156,749
|
|
313,499
|
|
626,997
|
|
—
|
|
—
|
|
—
|
|
—
|
|
—
|
|
—
|
|
—
|
|
|||||
|
2/26/2016
|
2/15/2016
|
—
|
|
—
|
|
—
|
|
—
|
|
4,836
|
|
9,672
|
|
—
|
|
—
|
|
—
|
|
624,956
|
|
|||||
|
2/26/2016
|
2/15/2016
|
—
|
|
—
|
|
—
|
|
—
|
|
—
|
|
—
|
|
1,935
|
|
—
|
|
—
|
|
250,060
|
|
|||||
|
2/26/2016
|
2/15/2016
|
—
|
|
—
|
|
—
|
|
—
|
|
—
|
|
—
|
|
—
|
|
10,971
|
|
129.23
|
|
374,989
|
|
|||||
|
Jeffrey R. Needham
|
2/26/2016
|
151,687
|
|
303,375
|
|
606,750
|
|
—
|
|
—
|
|
—
|
|
—
|
|
—
|
|
—
|
|
—
|
|
|||||
|
2/26/2016
|
2/15/2016
|
—
|
|
—
|
|
—
|
|
—
|
|
3,366
|
|
6,732
|
|
—
|
|
—
|
|
—
|
|
434,988
|
|
|||||
|
2/26/2016
|
2/15/2016
|
—
|
|
—
|
|
—
|
|
1,346
|
|
—
|
|
—
|
|
173,944
|
|
|||||||||||
|
2/26/2016
|
2/15/2016
|
—
|
|
—
|
|
—
|
|
—
|
|
—
|
|
—
|
|
—
|
|
7,636
|
|
129.23
|
|
260,998
|
|
|||||
|
Sharon Kochan
|
2/26/2016
|
150,176
|
|
300,352
|
|
600,704
|
|
—
|
|
—
|
|
—
|
|
—
|
|
—
|
|
—
|
|
—
|
|
|||||
|
2/26/2016
|
2/15/2016
|
—
|
|
—
|
|
—
|
|
—
|
|
3,289
|
|
6,578
|
|
—
|
|
—
|
|
—
|
|
425,037
|
|
|||||
|
2/26/2016
|
2/15/2016
|
—
|
|
—
|
|
—
|
|
—
|
|
—
|
|
—
|
|
1,315
|
|
—
|
|
—
|
|
169,937
|
|
|||||
|
2/26/2016
|
2/15/2016
|
—
|
|
—
|
|
—
|
|
—
|
|
—
|
|
—
|
|
—
|
|
7,461
|
|
129.23
|
|
255,017
|
|
|||||
|
Joseph C. Papa
|
2/26/2016
|
278,576
|
|
557,152
|
|
1,114,304
|
|
—
|
|
—
|
|
—
|
|
—
|
|
—
|
|
—
|
|
—
|
|
|||||
|
2/26/2016
|
2/15/2016
|
—
|
|
—
|
|
—
|
|
—
|
|
32,694
|
|
65,388
|
|
—
|
|
—
|
|
—
|
|
4,225,046
|
|
|||||
|
2/26/2016
|
2/15/2016
|
—
|
|
—
|
|
—
|
|
—
|
|
—
|
|
—
|
|
13,077
|
|
—
|
|
—
|
|
1,689,941
|
|
|||||
|
2/26/2016
|
2/15/2016
|
—
|
|
—
|
|
—
|
|
—
|
|
—
|
|
—
|
|
—
|
|
74,166
|
|
129.23
|
|
2,534,994
|
|
|||||
|
1) Actual date of grant.
|
|
2) Date on which the Remuneration Committee approved the award.
|
|
3) These columns show the dollar range of payout targets for fiscal 2016 performance under the Management Incentive Bonus Plan as described in the section titled Elements of Compensation - Annual Incentive Award Opportunities in the Compensation Discussion and Analysis. The target values are based on a percentage of each executive's salary. Beginning in fiscal year 2010, the maximum incentive award opportunity for any individual participant was 200% of the target award. In addition, the Remuneration Committee, or the Board in the case of the CEO, had the discretion to adjust any named executive officer's award up by as much as 50% or down by as much as 100% based on individual performance. The actual payments for fiscal 2016 non-equity incentive awards are shown in the Summary Compensation Table in the column titled "Non-Equity Incentive Plan Compensation."
|
|
4) These columns show the range of performance-based restricted stock units that were granted in fiscal 2016 and that could be earned in Calendar Year 2019 under the LTIP, depending on whether specific financial goals are achieved in each of the three applicable performance periods, as described in the section titled Elements of Compensation - Stock-Based Compensation in the Compensation Discussion and Analysis. Earned awards, if any, can range from 0% to 200% of the target grant. The U.S. GAAP value of the 2016 fiscal performance-based restricted stock units granted on February 26, 2016 was $129.23 per share. These awards, to the extent earned, vest three years from the grant date. Off-cycle grants annotated accordingly.
|
|
5) This column shows the service-based restricted stock units granted during 2016 fiscal year under the LTIP as described in the section titled Elements of Compensation - Stock-Based Compensation in the Compensation Discussion and Analysis. The U.S. GAAP value of the 2016 fiscal year service-based restricted stock units granted on February 26, 2016 was $129.23 per share. Annual awards vest three years from the grant date. Off-cycle grants are annotated accordingly.
|
|
6) This column shows the non-qualified stock options granted during 2016 fiscal year under the LTIP as described in the section titled Elements of Compensation - Stock-Based Compensation in the Compensation Discussion and Analysis. The U.S. GAAP value of the 2016 fiscal year non-qualified stock options granted on February 26, 2016 was $129.23 per share and a Black-Scholes value of $34.18. Annual awards vest ratably over three years beginning on the first anniversary of the grant date. Off-cycle grants are annotated accordingly.
|
|
7) Amounts are computed in accordance with U.S. GAAP and are included in the Summary Compensation Table in the applicable columns titled "Stock Awards" and "Option Awards." For performance-based restricted stock units, the amounts disclosed are computed based on a target performance of 100%, which is the probable outcome of the relevant performance conditions as of the grant date.
|
|
8) Additional grant provided to Mr. Hendrickson as a promotional award in connentation with promotion to CEO during fiscal year 2016.
|
|
9) Prorated target based on 80% of salary through the date of Mr. Hendrickson's promotion to CEO and 115% thereafter.
|
218
Outstanding Equity Awards at 2016 Year End
The following table sets forth information detailing the outstanding equity awards held at December 31, 2016 by each of our named executive officers, other than Mr. Papa who held no equity awards as of that date.
219
|
Option Awards
|
Stock Awards
|
|||||||||||||||||||
|
Name
|
Option / Stock Award Grant Date
(1)
|
Number of Securities Underlying Unexercised Options (#) Exercisable
(2)
|
Number of Securities Underlying Unexercised Options (#) Unexercisable
(2)
|
Option Exercise Price ($)
|
Option Expiration Date
|
Number of Units of Stock That Have Not Vested (#)
(3)
|
Market Value of Units of Stock That Have Not Vested ($)
(4)
|
Equity Incentive Plan Awards: Number of Unearned Units That Have Not Vested (#)
(5)
|
Equity Incentive Plan Awards: Market or Payout Value of Unearned Units That Have Not Vested ($)
(4)
|
|||||||||||
|
John T. Hendrickson
|
8/22/2013
|
2,394
|
|
—
|
|
119.78
|
|
8/22/2023
|
|
—
|
|
—
|
|
—
|
|
—
|
|
|||
|
8/21/2014
|
4,756
|
|
—
|
|
147.75
|
|
8/21/2024
|
|
1,316
|
|
109,531
|
|
2,227
|
|
125,417
|
|
||||
|
6/29/2015
|
—
|
|
—
|
|
—
|
|
—
|
|
2,987
|
|
248,608
|
|
1,673
|
|
77,963
|
|
||||
|
11/5/2015
|
—
|
|
—
|
|
—
|
|
—
|
|
2,181
|
|
181,525
|
|
—
|
|
—
|
|
||||
|
2/26/2016
|
—
|
|
21,943
|
|
129.23
|
|
2/26/2026
|
|
3,869
|
|
322,017
|
|
6,481
|
|
361,402
|
|
||||
|
6/21/2016
|
—
|
|
26,968
|
|
96.45
|
|
6/21/2026
|
|
4,997
|
|
415,900
|
|
8,371
|
|
466,800
|
|
||||
|
Judy L. Brown
|
8/23/2012
|
7,474
|
|
—
|
|
108.62
|
|
8/23/2022
|
|
—
|
|
—
|
|
—
|
|
—
|
|
|||
|
8/22/2013
|
10,888
|
|
—
|
|
119.78
|
|
8/22/2023
|
|
—
|
|
—
|
|
—
|
|
—
|
|
||||
|
8/21/2014
|
9,550
|
|
4,775
|
|
147.75
|
|
8/21/2024
|
|
2,644
|
|
220,060
|
|
4,472
|
|
251,863
|
|
||||
|
6/29/2015
|
—
|
|
—
|
|
—
|
|
—
|
|
5,431
|
|
452,022
|
|
3,041
|
|
141,754
|
|
||||
|
12/28/2015
|
—
|
|
—
|
|
—
|
|
—
|
|
2,571
|
|
213,984
|
|
—
|
|
—
|
|
||||
|
2/26/2016
|
—
|
|
18,432
|
|
129.23
|
|
2/26/2026
|
|
3,250
|
|
270,498
|
|
5,444
|
|
303,566
|
|
||||
|
Todd W. Kingma
|
8/19/2010
|
2,476
|
|
—
|
|
58.82
|
|
8/18/2020
|
|
—
|
|
—
|
|
—
|
|
—
|
|
|||
|
8/23/2011
|
10,064
|
|
—
|
|
90.65
|
|
8/23/2021
|
|
—
|
|
—
|
|
—
|
|
—
|
|
||||
|
8/23/2012
|
8,576
|
|
—
|
|
108.62
|
|
8/23/2022
|
|
—
|
|
—
|
|
—
|
|
—
|
|
||||
|
8/22/2013
|
7,182
|
|
—
|
|
119.78
|
|
8/22/2023
|
|
—
|
|
—
|
|
—
|
|
—
|
|
||||
|
8/21/2014
|
4,756
|
|
2,377
|
|
147.75
|
|
8/21/2024
|
|
1,316
|
|
109,531
|
|
2,227
|
|
125,417
|
|
||||
|
6/29/2015
|
—
|
|
—
|
|
—
|
|
—
|
|
2,987
|
|
248,608
|
|
1,673
|
|
77,963
|
|
||||
|
12/28/2015
|
—
|
|
—
|
|
—
|
|
—
|
|
2,571
|
|
213,984
|
|
—
|
|
—
|
|
||||
|
2/26/2016
|
—
|
|
10,971
|
|
129.23
|
|
2/26/2026
|
|
1,935
|
|
161,050
|
|
3,240
|
|
180,682
|
|
||||
|
Jeffrey R. Needham
|
8/23/2012
|
1,962
|
|
—
|
|
108.62
|
|
8/23/2022
|
|
—
|
|
—
|
|
—
|
|
—
|
|
|||
|
8/22/2013
|
4,163
|
|
—
|
|
119.78
|
|
8/22/2023
|
|
—
|
|
—
|
|
—
|
|
—
|
|
||||
|
8/21/2014
|
4,020
|
|
2,009
|
|
147.75
|
|
8/21/2024
|
|
1,113
|
|
92,635
|
|
1,882
|
|
105,982
|
|
||||
|
5/14/2015
|
—
|
|
—
|
|
—
|
|
—
|
|
515
|
|
42,863
|
|
||||||||
|
6/29/2015
|
—
|
|
—
|
|
—
|
|
—
|
|
2,322
|
|
193,260
|
|
1,300
|
|
60,606
|
|
||||
|
2/26/2016
|
—
|
|
7,636
|
|
129.23
|
|
2/26/2026
|
|
1,346
|
|
112,028
|
|
2,255
|
|
125,760
|
|
||||
|
Sharon Kochan
|
8/23/2012
|
5,886
|
|
—
|
|
108.62
|
|
8/23/2022
|
|
—
|
|
—
|
|
—
|
|
—
|
|
|||
|
8/22/2013
|
6,245
|
|
—
|
|
119.78
|
|
8/22/2023
|
|
—
|
|
—
|
|
—
|
|
—
|
|
||||
|
8/21/2014
|
4,020
|
|
2,009
|
|
147.75
|
|
8/21/2024
|
|
1,113
|
|
92,635
|
|
1,882
|
|
105,982
|
|
||||
|
6/29/2015
|
—
|
|
—
|
|
—
|
|
—
|
|
2,285
|
|
190,181
|
|
1,280
|
|
59,641
|
|
||||
|
2/26/2016
|
—
|
|
7,461
|
|
129.23
|
|
2/26/2026
|
|
1,315
|
|
109,447
|
|
2,204
|
|
122,883
|
|
||||
220
|
1) For better understanding of this table, this column has been added to show the grant date of all stock options and equity awards outstanding at fiscal year end.
|
|
2) All stock option awards vest one-third per year over three years beginning on the anniversary of the grant.
|
|
3) Service-based restricted stock units cliff vest respective to the vesting anniversary provided in the grant agreement.
|
|
4) The market value of these unvested awards was calculated using the closing price of our ordinary shares as of December 31, 2016, which was $83.23.
|
|
5) Performance-based restricted stock units are earned and vest, if at all, three years from the grant date, depending on our performance over a two and a half periods for fiscal 2014 and 2015 grants and three full periods for fiscal 2016, more fully described in the section entitled "Long-Term Incentive Award Opportunities" in the Compensation Discussion and Analysis. As of December 31, 2016, the number of unearned units for the fiscal 2015 award, granted on August 21, 2014, was calculated using vesting credits of 135%, 68% and 0% for fiscal years 2015, 2015 SP and 2016, respectively, based on our actual performance. The number of unearned units for the 2015 SP award, granted on June 29, 2015, was calculated using a vesting credit of 68%, 0% and 100% for fiscal years 2015 SP, 2016 and target for 2017. The number of unearned units for the fiscal 2016 award, granted on February 26, 2016, was calculated using a vesting credit of 0% for fiscal 2016 and a targeted vesting credit of 100% for calendar years 2017 and 2018.
|
Option Exercises and Stock Vested in 2016
The following table provides information for each named executive officer concerning the exercise of stock options and the vesting of restricted stock during 2016.
|
|
Option Awards
|
|
Stock Awards
|
||
|
Name
|
Number of Shares Acquired on Exercise (#)
|
Value Realized on Exercise ($)
(1)
|
|
Number of Shares Acquired on Vesting (#)
(2)
|
Value Realized on Vesting ($)
(3)
|
|
|
|
|
|
|
|
|
John T. Hendrickson
|
—
|
—
|
|
7,298
|
672,265
|
|
Judy L. Brown
|
33,289
|
1,706,662
|
|
12,193
|
1,122,119
|
|
Todd W. Kingma
|
—
|
—
|
|
7,298
|
672,265
|
|
Jeffrey R. Needham
|
—
|
—
|
|
5,213
|
479,394
|
|
Sharon Kochan
|
—
|
—
|
|
5,890
|
542,240
|
|
|
|
|
|
|
|
|
Joseph C. Papa
|
46,293
|
200,513
|
|
—
|
—
|
|
|
|
|
|
|
|
|
1) The value realized on exercise was calculated using the difference between the exercise price of the option and the closing price of our ordinary shares on the day the awards were exercised.
|
|||||
|
2) Represents service-based restricted stock and units and performance-based restricted stock units issued under the LTIP.
|
|||||
|
3) The value realized on vesting was calculated using the closing price of our ordinary shares on the day the awards vested.
|
|||||
Non-Qualified Deferred Compensation in 2016
The Deferred Compensation Plan allows participants to defer as much as 80% of base salary and 100% of incentive compensation. Participation in the plan is limited to the executive officers (including the named executive officers) and other management level personnel. Amounts deferred under the Deferred Compensation Plan earn a return based on measurement funds made available to participants, which are determined by the Retirement Plan Committee. These measurement funds mirror the investment choices available in our 401(k) Plan, with the exception of Company stock, which is not an investment option in the Deferred Compensation Plan. Participants elect the form and timing of distributions of their Deferred Compensation Plan deferrals prior to the year in which it is deferred. Participants may change their distribution elections, however, changes must be made 12 months in advance and are subject to a five year delay. Participants may elect in-service distributions to be paid in a lump sum up to five annual instalments; in-service deferrals must remain in the Deferred Compensation Plan for at least three years prior to distribution. Participants may elect to receive their retirement/termination distributions in a lump sum
221
or annual instalments (up to 15 years) upon separation from service. If a participant’s in-service distribution was not paid prior to a separation from service, the in-service distribution will be paid according to their retirement/termination distribution election. All participants with an account balance subject to Section 409A of the Internal Revenue Code may not begin receiving retirement/termination distributions earlier than the first day of the seventh month following a separation from service.
The following table sets forth information relating to the Deferred Compensation Plan.
|
Name
|
Executive Contributions in Last FY ($)
(1)
|
Perrigo Contributions in Last FY ($)
(2)
|
Aggregate Earnings (Losses) in Last FY ($)
|
Aggregate Withdrawals/ Distributions ($)
|
Aggregate Balance at Last FYE ($)
(3)
|
|
John T. Hendrickson
|
295,903
|
34,532
|
92,658
|
75,249
|
1,389,000
|
|
Judy L. Brown
|
59,553
|
70,677
|
99,515
|
—
|
1,483,898
|
|
Todd W. Kingma
|
34,370
|
55,564
|
90,924
|
—
|
1,654,460
|
|
Jeffrey R. Needham
|
31,295
|
31,039
|
83,423
|
—
|
1,130,793
|
|
Sharon Kochan
|
105,474
|
30,496
|
64,227
|
—
|
978,322
|
|
Joseph C. Papa
|
102,829
|
175,503
|
436,370
|
5,572,489
|
—
|
|
1) Of the total amounts shown in this column, the following amounts are included in the Summary Compensation Table as 2016 salary: Mr. Hendrickson, $243,156; Ms. Brown, $39,098; Mr. Kingma, $10,450; Mr. Needham, $25,281; Mr. Kochan, $83,366; and Mr. Papa, $46,429; and the following additional amounts are included for 2016 in the Summary Compensation Table in the column entitled Non-Equity Incentive Plan Compensation: Mr. Hendrickson, $52,746; Ms. Brown, $20,455; Mr. Kingma, $23,920; Mr. Needham $6,014; Mr. Kochan, $22,108 and Mr. Papa, $56,400.
|
|
2) These amounts are included in the Summary Compensation Table as All Other Compensation.
|
|
3) In addition to the amounts in footnote 1, this column includes the following amounts included in the Summary Compensation Table in the columns entitled (i) Salary (for stub period 2015): Mr. Hendrickson, $55,075; Ms. Brown, $18,758; Mr. Kingma, $5,035; Mr. Needham, $12,400; Mr. Kochan, 36,473; and Mr. Papa, $61,200; (ii) Non-Equity Incentive Plan Compensation (for stub period 2015): Mr. Hendrickson, $88,774; Ms. Brown, $95,396; Mr. Kingma, $133,962; Mr. Needham $14,056; Mr. Kochan, $55,902; and Mr. Papa, $191,013; (iii) Salary (for fiscal year 2015): Mr. Hendrickson, $89,600; Ms. Brown, $25,980; Mr. Kingma, $9,960; Mr. Needham, $23,826; Mr. Kochan, $59,352 and Mr. Papa, $112,538 (iv) Non-Equity Incentive Plan Compensation (for fiscal year 2015): Mr. Hendrickson, $106,131; Ms. Brown, $40,000; Mr. Kingma, $40,178; Mr. Needham, $11,856; Mr. Kochan, $24,366; and Mr. Papa, $93,365 (v) Salary (for fiscal year 2014): Mr. Hendrickson, $80,000; Ms. Brown, $15,000; Mr. Kingma $10,000; Mr. Needham $22,514; Mr. Kochan, $45,802 and Mr. Papa, $89,575, (vi) Non-Equity Incentive Plan Compensation (for fiscal year 2014): Mr. Hendrickson, $25,026; Ms. Brown, $40,000; Mr. Kingma, $37,540; Mr. Needham, $10,934; Mr Kochan, $24,392 and Mr. Papa, $66,722.
|
Potential Payments Upon Termination or Change in Control
All of our current named executive officers participate in our MIB Plan, LTI Plan, and our Deferred Compensation Plan. In addition, all of our current named executive officers, other than Mr. Hendrickson and Mr. Kochan, are covered by our U.S. Severance Policy and our Change in Control Severance Policy for U.S. Employees. These plans and policies may require us to provide compensation to these officers in the event of a termination of employment or a change-in-control of Perrigo. Mr. Hendrickson also would receive compensation under his employment agreement in the event of a termination of employment or a change-in-control of Perrigo; however, any severance benefits payable under that agreement will only occur in the event of a termination of employment that, when following a change-in-control of Perrigo, results in a “double trigger” for severance benefits.
Mr. Kochan also would receive compensation under his employment agreement in the event of a termination of employment or a change-in-control of Perrigo. Upon termination of employment, Mr. Kochan would receive severance benefits payable under the agreement as if he was eligible to participate in our Change in Control Severance Policy for U.S. Employees. The Remuneration Committee retains discretion to provide, and in the past has provided, additional benefits to executive officers upon termination or resignation if it determines the circumstances so warrant.
The following table sets forth the expected benefits to be received by each current named executive officer, in addition to the amounts shown in the Non-Qualified Deferred Compensation in 2016 table on page 42
in the event of his or her termination resulting from various scenarios and assuming a termination date of December 30, 2016,
222
the last business day of 2016, and a stock price of $83.23 our closing stock price on that date. Assumptions and explanations of the numbers included in the table below are set forth in the footnotes to, and in additional text following, the table.
|
Name and Benefits
|
Change in Control ($)
|
Death, Disability, Retirement ($)
|
Termination for Cause or Without Good Reason ($)
|
Termination Without Cause or for Good Reason ($)
|
Involuntary Termination for Economic Reasons ($)
|
|||||
|
John T. Hendrickson
|
||||||||||
|
Cash Severance
(1)
|
6,840,000
|
|
1,035,000
|
|
—
|
|
3,870,000
|
|
3,870,000
|
|
|
Equity Awards
|
||||||||||
|
Service-Based Restricted Stock
|
1,381,500
|
|
1,381,500
|
|
—
|
|
314,730
|
|
314,730
|
|
|
Performance-Based Restricted Stock
(3)
|
2,560,050
|
|
2,560,050
|
|
—
|
|
—
|
|
—
|
|
|
Stock Options
|
—
|
|
—
|
|
—
|
|
—
|
|
—
|
|
|
Other Benefits
(4)
|
50,000
|
|
—
|
|
—
|
|
50,000
|
|
50,000
|
|
|
Total Estimated Incremental Value
|
10,831,550
|
|
4,976,550
|
|
—
|
|
4,234,730
|
|
4,234,730
|
|
|
Judy L. Brown
|
||||||||||
|
Cash Severance
(2)
|
2,793,704
|
|
493,007
|
|
—
|
|
1,150,349
|
|
1,150,349
|
|
|
Equity Awards
|
||||||||||
|
Service-Based Restricted Stock
|
1,250,640
|
|
1,250,640
|
|
—
|
|
—
|
|
469,350
|
|
|
Performance-Based Restricted Stock
(3)
|
1,814,850
|
|
1,814,850
|
|
—
|
|
—
|
|
—
|
|
|
Stock Options
|
—
|
|
—
|
|
—
|
|
—
|
|
—
|
|
|
Other Benefits
(4)
|
25,000
|
|
—
|
|
—
|
|
25,000
|
|
25,000
|
|
|
Total Estimated Incremental Value
|
5,884,194
|
|
3,558,497
|
|
—
|
|
1,175,349
|
|
1,644,699
|
|
|
Todd W. Kingma
|
||||||||||
|
Cash Severance
(2)
|
2,000,054
|
|
315,798
|
|
—
|
|
842,128
|
|
842,128
|
|
|
Equity Awards
|
—
|
|
||||||||
|
Service-Based Restricted Stock
|
792,810
|
|
792,810
|
|
—
|
|
—
|
|
349,830
|
|
|
Performance-Based Restricted Stock
(3)
|
1,000,260
|
|
1,000,260
|
|
—
|
|
—
|
|
—
|
|
|
Stock Options
|
77,202
|
|
77,202
|
|
—
|
|
—
|
|
77,202
|
|
|
Other Benefits
(4)
|
25,000
|
|
—
|
|
—
|
|
25,000
|
|
25,000
|
|
|
Total Estimated Incremental Value
|
3,895,326
|
|
2,186,070
|
|
—
|
|
867,128
|
|
1,294,160
|
|
|
Jeffrey R. Needham
|
||||||||||
|
Cash Severance
(2)
|
1,928,500
|
|
304,500
|
|
—
|
|
812,000
|
|
812,000
|
|
|
Equity Awards
|
||||||||||
|
Service-Based Restricted Stock
|
476,640
|
|
476,640
|
|
—
|
|
—
|
|
146,520
|
|
|
Performance-Based Restricted Stock
(3)
|
762,210
|
|
762,210
|
|
—
|
|
—
|
|
—
|
|
|
Stock Options
|
—
|
|
—
|
|
—
|
|
—
|
|
—
|
|
|
Other Benefits
(4)
|
25,000
|
|
—
|
|
—
|
|
25,000
|
|
25,000
|
|
|
Total Estimated Incremental Value
|
3,192,350
|
|
1,543,350
|
|
—
|
|
837,000
|
|
983,520
|
|
|
Sharon Kochan
|
||||||||||
|
Cash Severance
(2)
|
1,909,215
|
|
301,455
|
|
—
|
|
803,880
|
|
803,880
|
|
|
Equity Awards
|
||||||||||
|
Service-Based Restricted Stock
|
424,170
|
|
424,170
|
|
—
|
|
—
|
|
100,170
|
|
223
|
Performance-Based Restricted Stock
(3)
|
751,950
|
|
751,950
|
|
—
|
|
—
|
|
—
|
|
|
Stock Options
|
—
|
|
—
|
|
—
|
|
—
|
|
—
|
|
|
Other Benefits
(4)
|
25,000
|
|
—
|
|
—
|
|
25,000
|
|
25,000
|
|
|
Total Estimated Incremental Value
|
3,110,335
|
|
1,477,575
|
|
—
|
|
828,880
|
|
929,050
|
|
|
1) Mr. Hendrickson will receive cash severance representing 156 weeks of salary, 156 weeks of target bonus, and a pro rata bonus payment he would have received for the fiscal year if he leaves Perrigo for a change in control. If termination is without cause or for good reason, or involuntary termination for economic reasons Mr. Hendrickson will receive cash severance representing 24 months of salary, 12 months of annual target bonus, and a pro rata bonus payment he would have received for the fiscal year in which his termination occurs. Cash severance represents any earned prorated bonus if his employment is terminated because of death, disability or retirement.
|
|
2) Ms. Brown, Mr. Kingma, Mr. Needham and Mr. Kochan will receive cash severance of 104 weeks annual salary and a bonus prorated for the actual bonus payout they would have received if employment is terminated due to a change in control. They will receive cash severance of 52 weeks annual salary and a bonus prorated for the actual payout they would have received if employment is terminated without cause or involuntary termination for economic reasons. They will receive any earned prorated bonus if their employment is terminated because of death, disability or retirement.
|
|
3) Performance-based restricted stock units were valued based on a full three-year vesting credit of 135%, 68% and 0% for the fiscal 2015, 2015 Stub Period and fiscal 2016 grants, respectively. The full three-year vesting credit was calculated based on the actual average vesting performance for the 2015-2016 fiscal year grants of 68% based on our fiscal ROTC performance. The 2015 Stub Period and 2016 full three-year vesting credit used a target performance of 100% for performance in any future fiscal year.
|
|
4) Other Benefits for Ms. Brown include outplacement/career transition services up to $25,000, and for Messrs. Hendrickson, Kingma, Needham and Kochan include outplacement/career transition services up to $25,000 and 12 months of Company paid COBRA payments.
|
Employment Agreement with Chief Executive Officer
Under Mr. Hendrickson’s employment agreement, his employment may be terminated during the term of this agreement under the following circumstances:
|
•
|
upon Mr. Hendrickson’s death or disability;
|
|
•
|
by Perrigo with or without cause (as defined in the agreement);
|
|
•
|
by mutual agreement; or
|
|
•
|
by Mr. Hendrickson with good reason (as defined in the agreement).
|
If during the term of this agreement Mr. Hendrickson’s employment is terminated by us without cause or by him for good reason and he agrees to a release of claims against Perrigo, he will also be entitled to compensation and benefits earned to that date, as well as:
|
•
|
a prorated annual bonus for the year of termination (determined based on actual performance);
|
|
•
|
payment of an amount equal to 24 months of his then-current salary and target bonus, payable in a lump sum;
|
|
•
|
a payment of health insurance premiums for 18 months, followed by a cash payment equal to the cost of such premiums for another six months, but only if Mr. Hendrickson is not entitled to health insurance coverage from another employer-provided plan;
|
|
•
|
continued vesting for a period of 24 months of all equity incentive awards granted to him, and in the case of performance-based restricted stock, based on actual Company performance, provided that any portion of such awards that does not vest pursuant to the above is forfeited and no option may be exercised later than the expiration of the option term as specified in the award agreement; and
|
|
•
|
reimbursement of career transition assistance services, up to a value of $50,000.
|
If any such termination without cause or for good reason occurs within 24 months following a change of control, Mr. Hendrickson will be entitled to the same benefits as listed above, except he will be entitled to a cash payment of an amount equal to 36 months of his then-current salary and target bonus rather than 24 months.
If Mr. Hendrickson is terminated for cause, he will receive compensation and benefits earned to date, including payment for unused vacation days. If Mr. Hendrickson’s employment is terminated for death or disability, he will receive compensation and benefits earned to date, including payment for unused vacation days, as well as a prorated annual bonus for the year of termination (determined based on actual performance).
224
Payments Under the Management Incentive Bonus Plan
Generally, no portion of the payments under the MIB Plan is considered earned or payable for a particular year unless the named executive officer is employed by us and in good standing on the last day of the fiscal year. The MIB Plan, however, may require us to make payments to named executive officers who are no longer employed by us on the last day of the following fiscal year under the circumstances:
|
•
|
retirement at age 65 or older;
|
|
•
|
retirement at age 60 or older with at least 10 years of service;
|
|
•
|
early retirement of a named executive officer under an early retirement plan;
|
|
•
|
permanent disability as determined by the Remuneration Committee; or
|
|
•
|
death.
|
Under all circumstances listed above, the named executive officer, or his or her estate in the case of death, will be entitled to a pro rata portion of any payment under the MIB Plan for that fiscal year, computed to the date of the termination.
A named executive officer eligible to receive a post-termination payment under the MIB Plan will be paid in a lump sum within a reasonable time after the close of the fiscal year in which termination occurred.
Payments Under the Long-Term Incentive Plan
If a named executive officer terminates employment with us due to death, disability or retirement, his or her (i) outstanding options will immediately vest in full and (ii) RSUs and PSRUs will be free of any restriction period. The outstanding options may be exercised in whole or in part by the participant or his or her fiduciary, beneficiary or conservator, as applicable, at any time prior to their respective expiration dates.
If a named executive officer is involuntarily terminated for economic reasons, he or she may exercise his or her options, to the extent vested, at any time prior to the earlier of (i) the date that is 30 days after the date that is 24 months after the termination date, or (ii) their respective expiration dates. Any options, RSUs and PRSUs that are not vested on the termination date, but are scheduled to vest during the 24-month period following the termination date according to the vesting schedule in effect before termination, will vest as if the participant had continued to provide services to us during the 24-month period. Any unvested options, RSUs and PRSUs that are not scheduled to vest during that 24-month period will be forfeited on the termination date. If a named executive officer dies after the termination date while his or her options remain exercisable, the fiduciary of the named executive officer’s estate or his or her beneficiary may exercise the options (to the extent that those options were vested and exercisable prior to the named executive officer’s death) at any time prior to the later of the date that is (i) 30 days after the date that is 24 months after the named executive officer’s termination date, or (ii) 12 months after the date of death, but in no event later than the respective expiration dates of the options.
Upon an event of termination for any reason during the restriction period, restricted shares and stock units still subject to restriction generally will be forfeited by the named executive officer and reacquired by Perrigo. We may in our sole discretion waive in whole or in part any or all remaining restrictions with regard to a named executive officer’s shares, except for restricted share awards that are intended to comply with certain performance-based compensation requirements.
If a named executive officer is terminated for cause, any restricted shares or units subject to a restriction period will be forfeited and his or her right to exercise his or her options will terminate. If within 60 days after a named executive officer is terminated for any reason, we discover circumstances that would have permitted us to terminate a named executive officer for cause, any shares, cash or other property paid or delivered to the named executive officer will be forfeited and the named executive officer must repay those amounts to Perrigo.
If the named executive officer is terminated for any reason other than those described above, the named executive officer will have the right to exercise his or her options at any time prior to the earlier of (i) the date that is three months after the termination date, or (ii) their respective expiration dates, but only to the extent that those options were vested prior to the termination date. Any options or RSUs and PRSUs that are not vested at the termination date will be forfeited on the termination date. If a named executive officer dies after the termination date while his or her options remain exercisable, the fiduciary of the named executive officer’s estate or his or her beneficiary may
225
exercise the options (to the extent that those options were vested and exercisable prior to the executive officer’s death) at any time prior to the earlier of (i) 12 months after the date of death, or (ii) their respective expiration dates.
In the event of a change in control (as defined in the LTI Plan), options and restricted stock units outstanding under the LTI Plan as of the date of the change in control that have not vested will become vested and the options will become fully exercisable. The restrictions and deferral limitations applicable to any restricted shares and units will lapse and such restricted shares and service-vesting restricted stock units will become free of all restrictions and limitations and will become fully vested and transferable. In addition, upon a change in control, all performance awards will be considered to be earned and payable in full, and any deferral or other restriction will lapse and the performance awards will be immediately settled and distributed. The restrictions and deferral limitations and other conditions applicable to any other stock unit awards or any other awards will lapse and those other stock unit awards and other awards will become free of all restrictions, limitations or conditions and will become fully vested and transferable to the full extent of the original grant.
Payments Under the Non-Qualified Deferred Compensation Plan
If a named executive officer is terminated for any reason other than death, he or she will receive a termination benefit under the Deferred Compensation Plan equal to his or her vested account balance. The
Non-Qualified Deferred Compensation in 2016 table on page 226 reflects account balances as of the end of 2016.
This termination benefit will be paid to the named executive officer in a lump sum or under an annual installment method of up to 15 years, based on the named executive officer’s choice when he or she began participation in the plan or as he or she subsequently changed the election. If the named executive officer did not make an election with respect to method of payment for a termination benefit, he or she will be deemed to have elected to be paid in a lump sum. A lump sum payment of the termination benefit will be made, or annual installments will commence, as of the first day of the seventh month following the date the named executive officer terminates his or her employment with us.
A named executive officer’s beneficiary will receive a survivor benefit equal to the named executive officer’s vested account balance if the named executive officer dies before he or she commences payment under the Deferred Compensation Plan. The survivor benefit will be paid to the named executive officer’s beneficiary in a lump sum payment as soon as administratively practicable, but in no event later than the last day of the calendar year in which the named executive officer’s death occurs or, if later, by the 1
st
day of the third month following the named executive officer’s death.
Payments Under the Change in Control Severance Policy for U.S. Employees
On June 14, 2016, we amended and restated our broad-based change in control severance policy for U.S. employees to make immaterial changes. The amended and restated policy provides that upon a qualifying termination of employment within two years following a change in control, a named executive officer, other than Mr. Hendrickson, would receive a lump sum severance payment equal to two times the sum of his or her base salary and target bonus opportunity, and a prorated annual bonus for the year of termination, based on actual performance.
In addition, the named executive officer would receive payment of health insurance premiums for 18 months, followed by a cash payment equal to the cost of such premiums for another six months, but only if he or she is not otherwise entitled to health insurance coverage under another employer-provided plan.
Payments Under the U.S. Severance Policy
On June 14, 2016, we amended and restated our broad-based severance policy for U.S. employees, which applies to terminations of employment not in connection with a change in control to (i) clarify the calculation of severance pay and modify the severance pay formulas applicable to certain classes of eligible employees (ii) reflect the transfer of sponsorship of the policy to Perrigo and to rename the policy, and (iii) make certain other desired changes. The amended and restated severance policy provides that, upon a qualifying termination of employment not within two years following a change in control, a named executive officer, other than Mr. Hendrickson, would receive a lump sum severance payment equal to 52 weeks of his or her base salary, payable in installments, and a pro-rata bonus payment for the year in which the termination occurs, based on actual performance.
226
In addition, the named executive officer would receive payment of health insurance premiums for 12 months, but only if he or she is not entitled to health insurance coverage under another employer-provided plan.
Payments Made to Mr. Papa in Connection with his Resignation
In connection with his resignation, Mr. Papa received payments as provided under his employment agreement, including $24,617 in base salary through the date of his resignation and $74,135 in lieu of accrued vacation. In addition, Mr. Papa received $5,572,490 in previously earned compensation he had deferred.
REMUNERATION COMMITTEE REPORT
The Remuneration Committee of our Board of Directors consists of four directors, each of whom is independent, as defined under SEC rules and the NYSE standards.
The Remuneration Committee has reviewed and discussed the “Compensation Discussion and Analysis” with management. Based on the review and discussions, the Remuneration Committee recommended to the Board of Directors that the “Compensation Discussion and Analysis” be included in this proxy statement and incorporated by reference into Perrigo’s Annual Report on Form 10-K for the fiscal year ended December 31, 2016.
|
THE REMUNERATION COMMITTEE
|
|
|
Jeffrey B. Kindler, Chair
|
|
|
Geoffrey M. Parker
|
|
|
Theodore R. Samuels
|
|
|
Jeffrey C. Smith
|
|
DIRECTOR COMPENSATION
The Remuneration Committee reviews and makes a recommendation to the Board regarding non-employee director compensation. In determining the level and mix of compensation for non-employee directors, the Remuneration Committee considers peer and other market data, practices and trends as well as information and analyses provided by Meridian, its independent consultant.
In 2016, all of our non-employee directors were paid an annual cash retainer, and a supplemental annual cash retainer was also paid to committee chairs, the Chairman, and non-chair committee members all as described below.
|
Chairman Annual Cash Retainer:
|
$150,000
|
|
Director Annual Cash Retainer
|
$75,000
|
|
Committee Member Retainer:
|
|
|
Audit
|
$12,500
|
|
Remuneration
|
$12,500
|
|
Nominating & Governance
|
$ 8,000
|
|
Committee Chair Retainer:
|
|
|
Audit
|
$25,000
|
|
Remuneration
|
$25,000
|
|
Nominating & Governance
|
$16,000
|
227
Prior to April 25, 2016, the Lead Independent Director also received an annual cash retainer of $30,000.
Our non-employee directors also receive annual equity awards in the form of restricted stock units vesting on the earlier of one year after the grant date or the date of the next AGM. These grants are intended to directly link an element of director compensation to shareholders’ interests.
For 2016, our Chairman of the Board and non-employee directors received equity awards in the form of restricted stock units having a value of approximately $375,000 and $300,000, respectively. These awards vest on the earlier of one year from the grant date or the date of the next AGM, and their grant date fair value is based on $91.94, the closing price of the Company’s ordinary shares on the grant date.
To align with market and peer practices, in 2017, we eliminated our non-employee director travel stipend of $10,000 per international trip to compensate directors for the time spent traveling to attend board meetings in other countries. We also eliminated the $1,000 per day for activities requiring travel in furtherance of Board or Perrigo business (other than to and from regularly scheduled Board and committee meetings).
Directors who are Perrigo employees receive no compensation for their services as directors.
The following table summarizes the 2016 compensation of our non-employee directors who served during the year.
Director Compensation
|
Name
|
Fees Earned or Paid in Cash ($)
|
Stock Awards ($)
(1)
|
Option Awards ($)
(2)
|
All Other Compensation
|
Total ($)
|
|||||
|
Laurie Brlas
|
189,036
|
375,000
|
—
|
—
|
564,036
|
|||||
|
Gary M. Cohen
|
132,000
|
300,000
|
—
|
—
|
432,000
|
|||||
|
Jacqualyn A. Fouse
|
47,868
|
300,000
|
—
|
—
|
347,868
|
|||||
|
Ellen R. Hoffing
|
153,500
|
300,000
|
—
|
—
|
453,500
|
|||||
|
Michael J. Jandernoa
|
116,000
|
300,000
|
—
|
—
|
416,000
|
|||||
|
Gerald K. Kunkle, Jr.
|
128,430
|
300,000
|
—
|
—
|
428,430
|
|||||
|
Herman Morris, Jr.
|
132,390
|
300,000
|
—
|
—
|
432,390
|
|||||
|
Donal O'Connor
|
106,036
|
300,000
|
—
|
—
|
406,036
|
|||||
|
Shlomo Yanai
|
143,500
|
300,000
|
—
|
—
|
443,500
|
|||||
|
Geoffrey M. Parker
|
21,301
|
45,205
|
—
|
—
|
66,506
|
|||||
|
1) Represents the grant date fair value of 3,263 service- based restricted stock units granted to each non-employee director on May 19, 2016 calculated in accordance with U.S. GAAP. The grant date fair value is based on $91.94 per share, the closing price of Perrigo Company plc ordinary shares on the NYSE on the grant date. For Ms. Brlas also includes the grant date fair value of 778 service-based restricted stock units granted for her service as Chairman of the Board on June 21, 2016 calculated in accordance with U.S. GAAP. The grant date fair value is based on $96.45 per share, the closing price of Perrigo Company plc ordinary shares on the NYSE on the grant date. The shares vest on the earlier of one year after the grant date or at the AGM.
|
||||||||||
|
2) As of December 31, 2016, there were no unvested stock options held by non-employee directors.
|
||||||||||
|
ITEM 12.
|
SECURITY OWNERSHIP OF CERTAIN BENEFICIAL OWNERS AND MANAGEMENT AND RELATED STOCKHOLDER MATTERS
|
Directors, Nominees and Executive Officers
The following table shows how many Perrigo ordinary shares the directors, nominees, and named executive officers, individually and collectively, beneficially owned as of May 10, 2017. The percent of class owned is based on 143,392,302 Perrigo ordinary shares outstanding as of that date. The named executive officers are the individuals listed in the Summary Compensation table on page 220.
228
Beneficial ownership is a technical term broadly defined by the SEC to mean more than ownership in the usual sense. In general, beneficial ownership includes any shares a shareholder can vote or transfer and stock options that are exercisable currently or become exercisable within 60 days. Except as otherwise noted, the shareholders named in this table have sole voting and investment power for all shares shown as beneficially owned by them.
|
Ordinary Shares Beneficially Owned
|
Options Exercisable Within 60 days
|
Total
|
Percent
of Class
|
||||
|
Directors
|
|
|
|
|
|||
|
Bradley A. Alford
|
—
|
|
—
|
|
—
|
|
*
|
|
Laurie Brlas
|
10,457
|
|
7,225
|
|
17,682
|
|
*
|
|
Rolf A. Classon
|
—
|
|
—
|
|
—
|
|
*
|
|
Gary M. Cohen
|
13,351
|
|
10,278
|
|
23,629
|
|
*
|
|
John T Hendrickson
(1)
|
14,774
|
|
23,455
|
|
38,229
|
|
*
|
|
Adriana Karaboutis
|
—
|
|
—
|
|
—
|
|
*
|
|
Jeffrey B. Kindler
|
—
|
|
—
|
|
—
|
|
*
|
|
Donal O'Connor
|
2,810
|
|
—
|
|
2,810
|
|
*
|
|
Geoffrey M. Parker
|
2,650
|
|
—
|
|
2,650
|
|
*
|
|
Theodore R. Samuels
|
2,759
|
|
—
|
|
2,759
|
|
*
|
|
Jeffrey C. Smith
(2)
|
9,641,425
|
|
—
|
|
|
6.7%
|
|
|
Named Executive Officers Other Than Directors
|
|
|
|
|
|||
|
Judy L. Brown
|
10,007
|
|
34,056
|
|
44,063
|
|
*
|
|
Todd W. Kingma
(3)
|
16,560
|
|
43,187
|
|
59,747
|
|
*
|
|
Jeffrey R. Needham
|
10,904
|
|
12,691
|
|
23,595
|
|
*
|
|
Sharon Kochan
|
9,594
|
|
18,638
|
|
28,232
|
|
*
|
|
Joseph C. Papa
(4)
|
118,515
|
|
—
|
|
118,515
|
|
*
|
|
Directors and Executive Officers as a Group (22 Persons)
(5)
|
9,742,572
|
|
145,991
|
|
9,888,563
|
|
6.9%
|
|
* Less than 1%.
|
|
|
|
|
|||
|
(1) Shares owned include 9,879 shares owned by the John T. Hendrickson Trust, of which Mr. Hendrickson is the trustee.
|
|||||||
|
(2) Represents shares held by certain funds and managed accounts for which Starboard Value LP serves as manager or investment manager. Mr. Smith serves as a Managing Member, Chief Executive Officer, and Chief Investment Officer of Starboard Value LP. Mr. Smith has shared voting and shared dispositive power over Starboard’s shares.
|
|||||||
|
(3) Shares owned include 2,000 shares in the Todd Kingma Charitable Remainder Uni-Trust.
|
|||||||
|
(4) Ownership of ordinary shares as of the date of Mr. Papa’s resignation and options as of May 10, 2017.
|
|||||||
|
(5) See footnotes 1 through 3. Includes directors and executive officers as of May 10, 2017. Of these shares, 9,641,425 are beneficially owned indirectly by Jeffrey Smith.
|
|||||||
Other Principal Shareholders
The following table shows all shareholders other than directors, nominees and named executive officers that we know to be beneficial owners of more than 5% of Perrigo’s ordinary shares. The percent of class owned is based on 143,392,302 Perrigo ordinary shares outstanding as of May 10, 2017.
229
|
Name and Address
of Beneficial Owner
|
Ordinary Shares
Beneficially Owned
|
Percent
of Class
|
|
The Vanguard Group
(1)
100 Vanguard Blvd.
Malvern, PA 19355
|
14,574,768
|
10.17%
|
|
BlackRock Inc.
(2)
55 East 52nd Street
New York, NY 10055
|
11,617,204
|
8.48%
|
|
Starboard Value LP
(3)
777 Third Avenue, 18
th
Floor
New York, NY 10055
|
9,641,425
|
6.72%
|
|
1)
|
The Vanguard Group, Inc. has sole voting power with respect to 226,541 of the shares, shared voting power with respect to 26,691 of the shares, shared dispositive power with respect to 249,174 of the shares and sole dispositive power with respect to 14,325,514 shares. This information is based on a Schedule 13G/A filed with the SEC on April 10, 2017.
|
|
2)
|
BlackRock Inc. has sole voting power with respect to 10,295,073 of the shares shared voting power with respect to none of the shares and sole dispositive power with respect to all of the shares. This information is based on a Schedule 13G/A filed with the SEC on January 25, 2017.
|
|
3)
|
Based on a Schedule 13D/A filed with the SEC on February 7, 2017, pursuant to which (a) each of Starboard Value LP, Starboard Value GP LLC, Starboard Principal Co LP and Starboard Principal Co GP LLC reported sole voting and dispositive power with respect to 9,641,425 shares; (b) Starboard Value and Opportunity Master Fund Ltd reported sole voting and dispositive power with respect to 3,287,856 shares; (c) each of Starboard Value A LP and Starboard Value A GP LLC reported sole voting and dispositive power with respect 2,366,741 shares; (d) each of Starboard Leaders Kilo LLC and Starboard Leaders Fund LP, Value reported sole voting and dispositive power with respect to 2,001,138 shares; (e) Starboard Value and Opportunity S LLC reported sole voting and dispositive power with respect to 372,738 shares; (f) each of Starboard Leaders Select III LP and Starboard Leaders Select III GP LLC Value reported sole voting and dispositive power with respect 365,603 shares; (g) each of Starboard Value and Opportunity C LP, Starboard Value R LP and Starboard Value R GP LLC reported sole voting and dispositive power with respect to 209,418 shares; and (h) each of Jeffrey C. Smith, Mark R. Mitchell and Peter A. Feld reported shared voting and dispositive power with respect to 9,641,425 shares.
|
Equity Compensation Plan Information
The table below provides information about Perrigo’s ordinary shares that may be issued upon the exercise of options and rights under all of our equity compensation plans as of December 31, 2016. Shareholder-approved plans include our LTI Plan, as well as our Employee Stock Option Plan and Non-Qualified Stock Option Plan for Directors, which were replaced by our LTI Plan.
|
ITEM 13.
|
CERTAIN RELATIONSHIPS AND RELATED TRANSACTIONS, AND DIRECTOR INDEPENDENCE
|
Certain Relationships and Related-Party Transactions
Our Code of Conduct precludes our directors, officers and employees from engaging in any type of activity, such as related-party transactions, that might create an actual or perceived conflict of interest. In addition, our Board of Directors adopted a Related-Party Transaction Policy that requires that all covered related-party transactions be approved or ratified by the Nominating & Governance Committee. Under that policy, each executive officer, director or director nominee must promptly notify the Chair of the Nominating & Governance Committee and our General Counsel in writing of any actual or prospective related-party transaction covered by the policy. The Nominating & Governance Committee, with input from our Legal Department, reviews the relevant facts and approves or disapproves the transaction. In reaching its decision, the Nominating & Governance Committee considers the factors outlined in the policy, a copy of which is available on our website (http://www.perrigo.com) under the heading Investors - Corporate Governance - Related-Party Transaction Policy.
230
Perrigo Company plc
- Item 13
In addition, on an annual basis, each director and executive officer completes a Directors’ and Officers’ Questionnaire that requires disclosure of any transactions with Perrigo in which he or she, or any member of his or her immediate family, has a direct or indirect material interest in Perrigo. The Nominating & Governance Committee reviews the information provided in response to these questionnaires.
Related-party transactions since the beginning of 2016 are described below. Other than the Starboard Agreement, these related-party transactions involved Marc Coucke, who is no longer a director or officer of the Company. Each of the transactions was reviewed and approved in accordance with our policy. The Nominating & Governance Committee determined that the terms of these transactions are no less favorable to us than would be the case with an unrelated third party.
Agreement with Starboard Value LP
On February 6, 2017, we entered into an agreement with Starboard (the “Starboard Agreement”), which was intended to define the ongoing relationship between Perrigo and Starboard in its capacity as a significant shareholder. As of February 6, 2017, Starboard beneficially owned approximately 6.7% of Perrigo’s outstanding ordinary shares. Pursuant to the Starboard Agreement, we (i) accepted the resignation of Michael J. Jandernoa, Gerald K. Kunkle, Jr., Herman Morris, Jr. and Shlomo Yanai from the Perrigo board of directors, and (ii) appointed Jeffrey C. Smith of Starboard and two other independent directors, Bradley A. Alford and Jeffrey B. Kindler, to the Board to fill three of the resultant vacancies. Pursuant to the Starboard Agreement, Starboard had the right to recommend to the Board two additional nominees to serve as independent directors. Upon Starboard’s recommendation, on May 2, 2017, the Board appointed Adriana Karaboutis and Rolf A. Classon as directors and accepted the resignation of Ellen R. Hoffing effective upon Ms. Karaboutis’ and Mr. Classon’s appointments.
With respect to the AGM, Starboard agreed to, among other things, vote in favor of Perrigo’s director nominees and, subject to certain conditions, vote in accordance with the Board’s recommendation on all other proposals. Starboard also agreed not to submit director nominations or proposals at the AGM. In addition, we agreed to nominate Messrs. Alford, Kindler, Smith, and Classon as well as Ms. Karaboutis for re-election at the AGM.
Under the terms of the Starboard Agreement, until the earlier of (i) 15 business days prior to the deadline for the submission of shareholder nominations for the 2018 AGM and (ii) the date that is 100 days prior to the first anniversary of the AGM, Starboard agreed not to, among other things: (a) solicit proxies; (b) join any “group” or voting arrangement; (c) propose certain extraordinary transactions or encourage third parties to do so; (d) call or seek to call an extraordinary general meeting of Perrigo’s shareholders; (e) seek board representation other than as provided in the Starboard Agreement; or (f) influence third parties with respect to the voting or disposition of Perrigo ordinary shares. Starboard also agreed to customary confidentiality restrictions.
Omega Acquisition
On March 30, 2015, we acquired Omega Pharma Invest NV (“Omega”) from Alychlo NV (“Alychlo”) and Holdco I BE NV for nearly $3.0 billion in equity and cash, with $1.4 billion of existing Omega debt assumed by us in the transaction. Marc Coucke, the founder and Chief Executive Officer of Omega, and his spouse are the principal shareholders of Alychlo, which received all of the equity consideration in the acquisition that represented a value of approximately $2.26 billion at that time. Following the acquisition, Mr. Coucke was appointed as acting as permanent representative of Mylecke Management, Art & Invest NV (“Mylecke”), serving as Executive Vice President, General Manager, Omega.
Under the terms of the acquisition agreement, Mr. Coucke is subject to a non-compete until the later of March 30, 2020, or three years after the date he ceases to be a service provider, consultant, manager, or director of the Company or any of its subsidiaries, subject to certain exceptions. In addition, the equity consideration shares are subject to a lock-up agreement, and the Company has granted Alychlo registration rights in connection with the issuance of those shares.
On April 28, 2016, the Company announced the resignation of Mr. Coucke as the Executive Vice President, General Manager of Branded Consumer Healthcare business. On April 27, 2016, the Company, Omega, Perrigo Ireland 2 Ltd., Mylecke, Alychlo and Mr. Coucke entered into a “Mutual Agreement” to memorialize the terms and conditions
231
Perrigo Company plc
- Item 13
of Mr. Coucke’s resignation and the termination and amendments of certain arrangements that the Company had previously entered into with Mr. Coucke or entities affiliated with Mr. Coucke, including, among other things, (i) the Consultancy Agreement referenced below, (ii) certain non-compete covenants in the Agreement for the Sale and Purchase of 685,348,257 Shares of Omega Pharma Invest N.V., dated as of November 6, 2014, (iii) the Non-Compete Agreement between the Company and Mr. Coucke dated March 30, 2015, and (iv) the Lock-up Agreement dated March 30, 2015.
On December 30, 2016, an Omega subsidiary sold the assets of the Etixx brand to Alychlo for €3.0 million plus the assumption of certain liabilities. As part of this transaction, Mr. Coucke’s non-compete was modified to permit him to market the Etixx brand.
Consultancy Agreement
On November 5, 2014, Omega entered into a Consultancy Agreement with Mylecke, represented by Marc Coucke, which we assumed in connection with the Omega acquisition. Under this agreement, Mr. Coucke served as Executive Vice President, General Manager, Branded Consumer Healthcare. The Consultancy Agreement required Mr. Coucke to, upon request, assist the Omega business in Belgium. The Consultancy Agreement provided for annual fixed reimbursement of €1,200,000; eligibility for an annual bonus, the amount and criteria to be determined by the Board of Directors, and reimbursement for reasonable out-of-pocket expenses. No bonus was awarded to Mr. Coucke in 2016. On April 27, 2016, the parties mutually agreed to terminate the Consultancy Agreement.
Trademark License Agreement
On October 23, 2015, Alychlo and Omega Pharma Belgium N.V. (“Omega Pharma Belgium”) entered into a Trademark License Agreement. Mr. Coucke and his spouse are the principal shareholders of Alychlo. Pursuant to the Trademark License Agreement, Alychlo granted Omega Pharma Belgium a non-exclusive right to use certain K-Protect trademarks in connection with the production and sale of certain products in Belgium and France that are sold pursuant to a Distribution Agreement, dated June 26, 2015, between Omega Pharma Belgium and WIN S.A. Under the Distribution Agreement, Omega Pharma Belgium is WIN S.A.’s sole and exclusive distributor for certain food supplements in specified European countries. Distribution began in November 2015, and net sales of the products in fiscal 2016 were €260,739. Pursuant to the Trademark License Agreement, Omega Pharma Belgium is required to pay a royalty of 10% of net sales on products using K-Protect trademarks. The Distribution Agreement expires in October 2020, after which it will be renewed for five-year terms if between six and eight months prior to the end of any term either party gives notice of renewal and the other party does not object.
Distribution Agreement and Consent to Assignment
On October 30, 2015, Pharco S.A. (“Old Pharco”) and Omega entered into a Consent to Assignment pursuant to which Old Pharco assigned to Pharco Innovations N.V. (“New Pharco”) all of Old Pharco’s rights under a Distribution Agreement, dated October 24, 2015, between Old Pharco and Omega. Mr. Coucke has an ownership interest in Old Pharco and is an 80% shareholder of New Pharco. Under the terms of the Distribution Agreement, Omega is New Pharco’s exclusive distributor of certain products in Belgium and Luxembourg. New Pharco will supply products to Omega on a consignment basis and pay Omega a distribution fee based on 20% of the net sales of the products, which were €1,370,982 in fiscal 2016. In connection with the sale of the Etixx brand to Alychlo, Omega agreed to give up its option to purchase the products at a price based on annual sales. The Distribution Agreement expires in October 2019, after which it will be renewed for five-year terms if between six and eight months prior to the end of any term either party gives notice of renewal and the other party does not object.
Sponsorship Agreement
On September 14, 2015, Omega Pharma Belgium entered into a sponsorship agreement with KV Oostende, a Belgian professional soccer club owned by Mr. Coucke. Under the three-year agreement, Omega Pharma Belgium pays an annual sponsorship fee of €250,000 for advertising and promotional activities.
232
Perrigo Company plc
- Item 13
DIRECTOR INDEPENDENCE
Our Corporate Governance Guidelines provide that a substantial majority of our directors should meet NYSE independence requirements. A director will not be considered independent unless the Board of Directors determines that the director meets the NYSE independence requirements and has no relationship that, in the opinion of the Board, would interfere with the exercise of independent judgment in carrying out the responsibilities of a director. Based on its most recent annual review of director independence, the Board of Directors has determined that ten of our current eleven
directors are independent, including Bradley A. Alford, Laurie Brlas, Rolf A. Classon, Gary M. Cohen, Adriana Karaboutis, Jeffrey B. Kindler, Donal O’Connor, Geoffrey M. Parker, Theodore R. Samuels and Jeffrey C. Smith. John T. Hendrickson is not independent under these standards because he is currently serving as an officer of Perrigo.
In making its independence determination, the Board of Directors has broadly considered all relevant facts and circumstances and concluded that there are no material relationships that would impair these directors’ independence.
|
ITEM 14.
|
PRINCIPAL ACCOUNTING FEES AND SERVICES
|
During the 2015 Stub Period and calendar year 2016, we retained EY to perform auditing and other services for us and paid them the following amounts for these services:
|
2015 Stub Period
|
Calendar Year 2016
|
|||||||
|
Audit Fees
|
$
|
9,808,483
|
|
Audit Fees
|
$
|
14,817,000
|
|
|
|
Audit-Related Fees
(1)
|
1,262,180
|
|
Audit-Related Fees
(1)
|
25,000
|
|
|||
|
Tax Compliance
|
$
|
543,230
|
|
Tax Compliance
|
$
|
1,536,000
|
|
|
|
Tax Consulting & Advisory
|
946,533
|
|
Tax Consulting & Advisory
|
2,664,000
|
|
|||
|
Total Tax Fees
|
$
|
1,489,763
|
|
Total Tax Fees
|
$
|
4,200,000
|
|
|
|
All Other Fees
|
—
|
|
All Other Fees
|
—
|
|
|||
|
Total Fees
|
$
|
12,560,426
|
|
Total Fees
|
$
|
19,042,000
|
|
|
|
(1) Mainly represents attest services provided to the Company in connection with the requirements of the Irish Takeover Panel.
|
||||||||
The Audit Committee maintains a policy pursuant to which it reviews and pre-approves audit and permitted non-audit services (including the fees and terms thereof) to be provided by our auditor, except for the de minimis exceptions for non-audit services described in Section 10A(i)(1)(B) of the Securities Exchange Act of 1934 that are approved by the Audit Committee prior to the completion of our audit. The Chair of the Audit Committee, or any other member or members designated by the Audit Committee, is authorized to pre-approve non-audit services, provided that any pre-approval shall be reported to the full Audit Committee at its next scheduled meeting. All audit and other services performed by our auditor in calendar year 2017 were approved in accordance with the Audit Committee’s policy.
233
Perrigo Company plc
- Item 15
Exhibits
|
Item 15.
|
Exhibits and Financial Statement Schedules.
|
|
(a)
|
The following documents are filed or incorporated by reference as part of this Form 10-K:
|
|
1.
|
All financial statements. See Index to Consolidated Financial Statements.
|
|
2.
|
Financial Schedules.
|
Schedule II – Valuation and Qualifying Accounts.
Schedules other than the one listed are omitted because the required information is included in the footnotes, immaterial or not applicable.
3. Exhibits:
|
2.1
|
Transaction Agreement, dated as of July 28, 2013, among Perrigo Company, Elan Corporation, plc, Perrigo Company plc, Habsont Limited and Leopard Company (incorporated by reference from Annex A to the joint proxy statement/prospectus included in the Company's Registration Statement on Form S-4/A filed on October 8, 2013) (File No. 333-190859).
|
|
2.2
|
Part A of Appendix I to Rule 2.5 Announcement (Conditions to the Implementation of the Scheme and the Acquisition) (incorporated by reference from Annex B to the joint proxy statement/prospectus included in the Company's Registration Statement on Form S-4/A filed on October 8, 2013) (File No. 333-190859).
|
|
2.3
+
|
Asset Purchase Agreement, dated as of February 5, 2013, by and among Elan Pharma International Limited, Elan Pharmaceuticals, Inc. and Biogen Idec International Holding Ltd (incorporated by reference from Exhibit 4(c) (31) of Elan Corporation, plc’s Annual Report on Form 20-F for the year ended December 31, 2012) (File No. 001-13896).
|
|
2.4
|
Agreement for the Sale and Purchase of 685,348,257 Shares Of Omega Pharma Invest N.V., dated as of November 6, 2014, by and among the Company, Alychlo N.V. and Holdco I BE N.V. (incorporated by reference from Exhibit 10.1 to the Company's Current Report on Form 8-K filed on November 12, 2014) (File No. 001-36353).
|
|
2.5
|
Amendment Agreement dated March 27, 2015 to the Agreement for the Sale and Purchase of 685,348,257 Shares Of Omega Pharma Invest N.V., dated as of November 6, 2014, by and among the Company, Alychlo N.V. and Holdco I BE N.V. (incorporated by reference from Exhibit 2.3 to the Company’s Quarterly Report on Form 10-Q filed on April 29, 2015) (File No. 001-36353).
|
|
2.6
|
Assignment Letter dated March 17, 2015 regarding the Agreement for the Sale and Purchase of 685,348,257 Shares Of Omega Pharma Invest N.V., dated as of November 6, 2014, by and among the Company, Alychlo N.V. and Holdco I BE N.V. (incorporated by reference from Exhibit 2.1 to the Company’s Quarterly Report on Form 10-Q filed on April 29, 2015) (File No. 001-36353).
|
|
2.7
|
Closing Letter dated March 17, 2015 regarding the Agreement for the Sale and Purchase of 685,348,257 Shares Of Omega Pharma Invest N.V., dated as of November 6, 2014, by and among the Company, Alychlo N.V. and Holdco I BE N.V. (incorporated by reference from Exhibit 2.2 to the Company’s Quarterly Report on Form 10-Q filed on April 29, 2015) (File No. 001-36353).
|
|
3.1
|
Certificate of Incorporation of Perrigo Company plc (formerly known as Perrigo Company Limited) (incorporated by reference from Exhibit 4.1 to the Company’s Registration Statement on Form S-8 filed December 19, 2013) (File No. 333-192946).
|
|
3.2
|
Memorandum and Articles of Association of Perrigo Company plc, as amended (incorporated by reference from Exhibit 3.2 to the Company’s Transition Report on Form 10-KT filed on February 25, 2016) (File No. 001-36353).
|
|
4.1
|
Indenture dated as of November 8, 2013, among the Company, the guarantors named therein and Wells Fargo Bank, N.A., as Trustee (incorporated by reference from Exhibit 4.1 to the Company's Current Report on Form 8-K filed on November 12, 2013) (File No. 333-190859).
|
|
4.2
|
First Supplemental Indenture, dated December 18, 2013 to the Indenture dated as of November 8, 2013, among the Company, the guarantors named therein and Wells Fargo Bank, N.A., as Trustee (incorporated by reference from Exhibit 4.1 to the Company's Current Report on Form 8-K filed on December 19, 2013) (File No. 333-190859).
|
234
Perrigo Company plc
- Item 15
Exhibits
|
4.4
|
Base Indenture dated as of December 2, 2014, between Perrigo Finance Unlimited Company, formerly known as Perrigo Finance plc, the Company and Wells Fargo Bank, National Association, as trustee (incorporated by reference from Exhibit 4.1 to the Company's Current Report on Form 8-K filed on December 2, 2014) (File No. 001-36353).
|
|
4.5
|
First Supplemental Indenture dated as of December 2, 2014, between Perrigo Finance Unlimited Company, formerly known as Perrigo Finance plc, the Company and Wells Fargo Bank, National Association, as trustee (incorporated by reference from Exhibit 4.2 to the Company's Current Report on Form 8-K filed on December 2, 2014) (File No. 001-36353).
|
|
4.6
|
Supplemental Indenture No. 2, dated as of March 10, 2016, among Perrigo Finance Unlimited Company, the Company and Wells Fargo Bank, National Association, as trustee (incorporated by reference from Exhibit 4.1 to the Company’s Current Report on Form 8-K filed on March 10, 2016) (File No. 001-36353).
|
|
4.7
|
Form of 3.500% Senior Notes due 2021 (included as Exhibit A-1 to the First Supplemental Indenture dated as of December 2, 2014, between Perrigo Finance Unlimited Company, formerly known as Perrigo Finance plc, the Company and Wells Fargo Bank, National Association, as trustee) (incorporated by reference from Exhibit 4.2 to the Company’s Current Report on Form 8-K filed on December 2, 2014) (File No. 001-36353).
|
|
4.8
|
Form of 3.900% Senior Notes due 2024 (included as Exhibit A-2 to the First Supplemental Indenture dated as of December 2, 2014, between Perrigo Finance Unlimited Company, formerly known as Perrigo Finance plc, the Company and Wells Fargo Bank, National Association, as trustee) (incorporated by reference from Exhibit 4.2 to the Company’s Current Report on Form 8-K filed on December 2, 2014) (File No. 001-36353).
|
|
4.9
|
Form of 4.900% Senior Notes due 2044 (included as Exhibit A-3 to the First Supplemental Indenture dated as of December 2, 2014, between Perrigo Finance Unlimited Company, formerly known as Perrigo Finance plc, the Company and Wells Fargo Bank, National Association, as trustee) (incorporated by reference from Exhibit 4.2 to the Company’s Current Report on Form 8-K filed on December 2, 2014) (File No. 001-36353).
|
|
4.10
|
Form of Global Note representing the 2021 Notes (included in Exhibit 4.6).
|
|
4.11
|
Form of Global Note representing the 2026 Notes (included in Exhibit 4.6).
|
|
4.12
|
Prospectus, dated November 27, 2012, in connection with the public offering of Omega Pharma Invest N.V. of EUR 300,000,000 of 5.125% retail bonds due 2017 (incorporated by reference from Exhibit 4.2 to the Company’s Current Report on Form 8-K filed on April 3, 2015) (File No. 001-36353).
|
|
4.13
|
Prospectus, dated April 23, 2012, in connection with the public offering of Omega Pharma Invest N.V. of EUR 180,000,000 of 4.500% retail bonds due 2017 and EUR 120,000,000 of 5.000% retail bonds due 2019 (incorporated by reference from Exhibit 4.3 to the Company’s Current Report on Form 8-K filed on April 3, 2015) (File No. 001-36353).
|
|
10.1
|
Senior Unsecured Credit Facilities Commitment Letter by and among the Company, J.P. Morgan Securities LLC, JPMorgan Chase Bank, N.A. and Barclays Bank PLC dated as of November 6, 2014 (incorporated by reference from Exhibit 10.3 to the Company's Current Report on Form 8-K filed on November 12, 2014) (File No. 001-36353).
|
|
10.2
|
Revolving Credit Agreement by and among Perrigo Finance Unlimited Company, formerly known as Perrigo Finance plc, the Company, JP Morgan Chase Bank, N.A., Barclays Bank PLC, and the other lenders party thereto, dated as of December 5, 2014 (incorporated by reference from Exhibit 10.1 to the Company's Current Report on Form 8-K filed on December 9, 2014) (File No. 001-36353).
|
|
10.3
|
Amendment to the Revolving Credit Agreement, dated February 26, 2016, by and among Perrigo Finance Unlimited Company, formerly known as Perrigo Finance plc, the Company, JPMorgan Chase Bank, N.A., Barclays Bank PLC, and the other lenders party thereto, dated as of December 5, 2014 (incorporated by reference from Exhibit 10.1 to the Company’s Quarterly Report on Form 10-Q filed on May 16, 2016) (File No. 001-36353).
|
|
10.4
|
Amendment No. 2, dated September 9, 2016, to the Revolving Credit Agreement by and among Perrigo Finance Unlimited Company, the Company, JPMorgan Chase Bank, N.A. and the other lenders party thereto, dated as of December 5, 2014, as amended by Amendment No. 1, dated as of February 26, 2016 (incorporated by reference from Exhibit 10.1 to the Company’s Current Report on Form 8-K filed on September 9, 2016) (File No. 001-36353).
|
235
Perrigo Company plc
- Item 15
Exhibits
|
10.5
|
Amendment No. 3, dated December 8, 2016, to the Revolving Credit Agreement by and among Perrigo Finance Unlimited Company, the Company, JPMorgan Chase Bank, N.A. and the other lenders party thereto, dated as of December 5, 2014, as amended by Amendment No. 1, dated as of February 26, 2016, as further amended by Amendment No. 2, dated as of September 9, 2016 (filed herewith).
|
|
10.6
|
Term Loan Credit Agreement by and among Perrigo Finance Unlimited Company, formerly known as Perrigo Finance plc, the Company, JP Morgan Chase Bank, N.A., Barclays Bank PLC, and the other lenders party thereto, dated as of December 5, 2014 (incorporated by reference from Exhibit 10.2 to the Company's Current Report on Form 8-K filed on December 9, 2014) (File No. 001-36353).
|
|
10.7
|
Amendment to the Term Loan Credit Agreement, dated February 26, 2016, by and among Perrigo Finance Unlimited Company, formerly known as Perrigo Finance plc, the Company, JPMorgan Chase Bank, N.A., Barclays Bank PLC, and the other lenders party thereto, dated as of December 5, 2014 (incorporated by reference from Exhibit 10.2 to the Company’s Quarterly Report on Form 10-Q filed on May 16, 2016) (File No. 001-36353).
|
|
10.8
|
Amendment No. 2, dated September 9, 2016, to the Term Loan Credit Agreement by and among Perrigo Finance Unlimited Company, the Company, JPMorgan Chase Bank, N.A. and the other lenders party thereto, dated as of December 5, 2014, as amended by Amendment No. 1, dated as of February 26, 2016 (incorporated by reference from Exhibit 10.2 to the Company’s Current Report on Form 8-K filed on September 9, 2016) (File No. 001-36353).
|
|
10.9
|
Amendment No. 3, dated December 8, 2016, to the Term Loan Credit Agreement by and among Perrigo Finance Unlimited Company, the Company, JPMorgan Chase Bank, N.A. and the other lenders party thereto, dated as of December 5, 2014, as amended by Amendment No. 1, dated as of February 26, 2016, as further amended by Amendment No. 2, dated as of September 9, 2016 (filed herewith).
|
|
10.10*
|
Annual Incentive Plan, adopted November 4, 2008 (incorporated by reference from Perrigo Company’s Proxy Statement for its 2008 Annual Meeting of Shareholders filed on October 1, 2008) (File No. 000-19725).
|
|
10.11*
|
Amendment No. 1 to Annual Incentive Plan, effective as of June 22, 2015 (incorporated by reference from Exhibit 10.10 to the Company's Annual Report on Form 10-K filed on August 13, 2015) (File No. 001-36353).
|
|
10.12*
|
Amendment No. 2 to the Perrigo Company Annual Incentive Plan, effective June 14, 2016 (incorporated by reference from Exhibit 10.3 to the Company’s Current Report on Form 8-K filed on June 17, 2016) (File No. 001-36353).
|
|
10.13*
|
2003 Long-Term Incentive Plan, effective October 29, 2003, as amended (incorporated by reference from the Appendix to Perrigo Company’s Proxy Statement for its 2003 Annual Meeting of Shareholders filed on September 26, 2003) (File No. 000-19725).
|
|
10.14*
|
Amendment to the 2003 Long-Term Incentive Plan, effective as of October 28, 2005 (incorporated by reference from Exhibit 10(a) to Perrigo Company’s Current Report on Form 8-K filed on November 3, 2005) (File No. 000-19725).
|
|
10.15*
|
2003 Long-Term Incentive Plan, as amended as of February 7, 2007 (incorporated by reference from Exhibit 10(a) to Perrigo Company’s Quarterly Report on Form 10-Q filed on May 8, 2007) (File No. 000-19725).
|
|
10.16*
|
2008 Long-Term Incentive Plan, adopted November 4, 2008 (incorporated by reference from Exhibit 10(b) to Perrigo Company's Quarterly Report on Form 10-Q filed on February 3, 2009) (File No. 000-19725).
|
|
10.17*
|
2013 Long-Term Incentive Plan (incorporated by reference from Annex J to the Company’s Registration Statement on Form S-4/A filed on October 8, 2013) (File No. 333-190859).
|
|
10.18*
|
Amendment No. 1 to the 2013 Long-Term Incentive Plan, dated as of January 29, 2014 (incorporated by reference from Exhibit 10.12 to the Company’s Quarterly Report on Form 10-Q filed on February 6, 2014) (File No. 333-190859).
|
|
10.19*
|
Amendment No. 2 to the 2013 Long-Term Incentive Plan, effective as of July 9, 2015 (incorporated by reference from Exhibit 10.17 to the Company's Annual Report on Form 10-K, filed on August 13, 2015) (File No. 001-36353).
|
|
10.20*
|
Nonqualified Deferred Compensation Plan, as amended as of October 10, 2007 and effective January 1, 2007 (incorporated by reference from Exhibit 10.1 to Perrigo Company’s Current Report on Form 8-K filed on October 11, 2007) (File No. 000-19725).
|
|
10.21*
|
Amendment One to the Nonqualified Deferred Compensation Plan, dated December 3, 2009 (incorporated by reference from Exhibit 10.14 to the Company's Annual Report on Form 10-K filed on August 14, 2014) (File No. 001-36353).
|
236
Perrigo Company plc
- Item 15
Exhibits
|
10.22*
|
Amendment Two to the Nonqualified Deferred Compensation Plan, dated as of October 10, 2012, (incorporated by reference from Exhibit 10.1 to Perrigo Company’s Quarterly Report on Form 10-Q filed on February 1, 2013) (File No. 000-19725).
|
|
10.23*
|
Amendment Three to the Nonqualified Deferred Compensation Plan, dated as of November 13, 2013 (incorporated by reference from Exhibit 10.9 to the Company’s Quarterly Report on Form 10-Q filed on February 6, 2014) (File No. 333-190859).
|
|
10.24*
|
Amendment Four to the Nonqualified Deferred Compensation Plan, dated as of January 31, 2014 (incorporated by reference from Exhibit 10.13 to the Company’s Quarterly Report on Form 10-Q filed on February 6, 2014) (File No. 333-190859).
|
|
10.25*
|
Amendment Five to the Nonqualified Deferred Compensation Plan, dated as of August 17, 2015 (incorporated by reference from Exhibit 10.2 to the Company's Quarterly Report on Form 10-Q filed on November 2, 2015) (File No. 001-36353).
|
|
10.26*
|
Forms of Non-Qualified Stock Option Agreement pursuant to Perrigo Company’s 2008 Long-Term Incentive Plan (incorporated by reference from Exhibit 10.49 to Perrigo Company’s Annual Report on Form 10-K filed on August 18, 2009) (File No. 000-19725).
|
|
10.27*
|
Form of Non-Qualified Stock Option Agreement under Perrigo Company's 2003 Long-Term Incentive Plan (incorporated by reference from Exhibit 10(a) to Perrigo Company’s Quarterly Report on Form 10-Q filed on February 2, 2005) (File No. 000-19725).
|
|
10.28*
|
Forms of Non-Qualified Stock Option Agreement pursuant to Perrigo Company’s 2008 Long-Term Incentive Plan (incorporated by reference from Exhibit 10(c) to Perrigo Company’s Quarterly Report on Form 10-Q filed on February 3, 2009) (File No. 000-19725).
|
|
10.29*
|
Form of Long-Term Incentive Award Agreement under Perrigo Company's 2003 Long-Term Incentive Plan (incorporated by reference from Exhibit 10.1 to Perrigo Company’s Current Report on Form 8-K filed on August 22, 2006) (File No. 000-19725).
|
|
10.30*
|
Form of Long-Term Incentive Award Agreement under Perrigo Company's 2003 Long-Term Incentive Plan (incorporated by reference from Exhibit 10(a) to Perrigo Company’s Quarterly Report on Form 10-Q filed on February 1, 2007) (File No. 000-19725).
|
|
10.31*
|
Form of 2006 Long-Term Incentive Award Agreement, for Approved Section 102 Awards under Perrigo Company’s 2003 Long-Term Incentive Plan (incorporated by reference from Exhibit 10(f) to Perrigo Company’s Quarterly Report on Form 10-Q filed on May 8, 2007) (File No. 000-19725).
|
|
10.32*
|
Form of 2006 Long-Term Incentive Award Agreement under Perrigo Company’s 2003 Long-Term Incentive Plan (incorporated by reference from Exhibit 10(g) to Perrigo Company’s Quarterly Report on Form 10-Q filed on May 8, 2007) (File No. 000-19725).
|
|
10.33*
|
Forms of Restricted Stock Unit Award Agreement pursuant to Perrigo Company’s 2008 Long-Term Incentive Plan (incorporated by reference from Exhibit 10.50 to Perrigo Company’s Annual Report on Form 10-K filed on August 18, 2009) (File No. 000-19725).
|
|
10.34*
|
Forms of Restricted Stock Unit Award Agreement pursuant to Perrigo Company’s 2008 Long-Term Incentive Plan (incorporated by reference from Exhibit 10.52 to Perrigo Company's Annual Report on Form 10-K filed on August 16, 2011) (File No. 000-19725).
|
|
10.35*
|
Forms of Grant Agreement under the Company's 2013 Long-Term Incentive Plan (incorporated by reference from Exhibit 10.11 to the Company’s Quarterly Report on Form 10-Q filed on February 6, 2014) (File No. 333-190859).
|
|
10.36*
|
Forms of Restricted Stock Unit Award Agreement (Service-Based) under the Company’s 2013 Long-Term Incentive Plan (incorporated by reference from Exhibit 99.1 to the Company’s Current Report on Form 8-K filed on November 12, 2014) (File No. 001-36353).
|
|
10.37*
|
Forms of Service-Based and Performance-Based Restricted Stock Unit Award Agreements under the Company's 2013 Long-Term Incentive Plan (incorporated by reference from Exhibit 99.1 to the Company’s Current Report on Form 8-K filed on June 22, 2015) (File No. 001-36353).
|
|
10.38*
|
Forms of Amendments to Performance-Based Restricted Stock Unit Award Agreements under the Company's 2013 Long-Term Incentive Plan (incorporated by reference from Exhibit 99.1 to the Company’s Current Report on Form 8-K filed on June 26, 2015) (File No. 001-36353).
|
|
10.39*
|
Forms of Service-Based and Performance-Based Restricted Stock Unit Award Agreements under the Company's 2013 Long-Term Incentive Plan (incorporated by reference from Exhibit 99.1 to the Company's Current Report on Form 8-K filed on August 12, 2015) (File No. 001-36353).
|
237
Perrigo Company plc
- Item 15
Exhibits
|
10.40*
|
Form of Performance-Based Restricted Stock Unit Award Agreement for Non-U.S. Participants under the Company's 2013 Long-Term Incentive Plan (incorporated by reference from Exhibit 10.1 to the Company's Quarterly Report on Form 10-Q filed on November 2, 2015) (File No. 001-36353).
|
|
10.41*
|
Forms of Amendments to Performance-Based Restricted Stock Unit Award Agreements under the Company's 2013 Long-Term Incentive Plan (incorporated by reference from Exhibit 10.4 to the Company's Current Report on Form 8-K filed on November 13, 2015) (File No. 001-36353).
|
|
10.42*
|
Forms of Service-Based Restricted Stock Unit Award Agreements under the Company's 2013 Long-Term Incentive Plan (incorporated by reference from Exhibit 10.41 to the Company’s Transition Report on Form 10-KT filed on February 25, 2016) (File No. 001-36353).
|
|
10.43*
|
Employment Agreement, dated as of September 8, 2006, by and between Perrigo Company and Joseph C. Papa (incorporated by reference from Exhibit 10.1 to Perrigo Company’s Current Report on Form 8-K, filed on September 12, 2006) (File No. 000-19725).
|
|
10.44*
|
Amendment No. 1, dated as November 12, 2015, to the Employment Agreement, dated as of September 8, 2006, by and between Perrigo Company and Joseph C. Papa (incorporated by reference from Exhibit 10.1 to the Company's Current Report on Form 8-K filed on November 13, 2015) (File No. 001-36353).
|
|
10.45*
|
Amendment No.2, effective as of October 22, 2015, to the Employment Agreement, dated as of September 8, 2006, by and between Perrigo Company and Joseph C. Papa (incorporated by reference from Exhibit 10.44 to the Company’s Transition Report on Form 10-KT filed on February 25, 2016) (File No. 001-36353).
|
|
10.46*
|
Amendment No. 3, effective as of April 24, 2016, to the Employment Agreement, effective as of October 9, 2006, by and between Perrigo Company and Joseph C. Papa (incorporated by reference from Exhibit 10.1 to the Company’s Current Report on Form 8-K filed on April 25, 2016) (File No. 001-36353).
|
|
10.47*
|
Amendment No. 4, effective as of May 6, 2016, to the Employment Agreement, effective as of October 9, 2006, by and between Perrigo Company and Joseph C. Papa (incorporated by reference from Exhibit 10.5 to the Company’s Quarterly Report on Form 10-Q filed on May 16, 2016) (File No. 001-36353).
|
|
10.48*
|
Employment Agreement, dated as of August 3, 2016, by and among the Company, Perrigo Management Company and John T. Hendrickson (incorporated by reference from Exhibit 10.1 to the Company’s Current Report on Form 8-K filed on August 5, 2016) (File No. 001-36353).
|
|
10.49
|
Employment agreement, dated October 25, 2016, by and between Perrigo Israel Pharmaceuticals Ltd. and Sharon Kochan (filed herewith).
|
|
10.50*
|
Consultancy Agreement, between Omega Pharma Invest N.V. and Mylecke Management, Art & Invest N.V., represented by Marc Coucke, dated November 5, 2014, incorporated by reference from Exhibit 10.1 to the Company’s Current Report on Form 8-K filed on April 3, 2015 (File No. 001-36353).
|
|
10.51*
|
Form of Perrigo Company plc Director Indemnity Agreement (incorporated by reference from Exhibit 10.1 to the Company’s Current Report on Form 8-K filed on December 19, 2013) (File No. 333-190859).
|
|
10.52*
|
Form of Perrigo Company plc Officer Indemnity Agreement (incorporated by reference from Exhibit 10.2 to the Company’s Current Report on Form 8-K filed on December 19, 2013) (File No. 333-190859).
|
|
10.53*
|
Form of Perrigo Company Indemnity Agreement (incorporated by reference from Exhibit 10.3 to the Company’s Current Report on Form 8-K filed on December 19, 2013) (File No. 333-190859).
|
|
10.54*
|
Perrigo Company plc U.S. Severance Policy, as amended and restated effective June 14, 2016 (incorporated by reference from Exhibit 10.1 to the Company’s Current Report on Form 8-K filed on June 17, 2016) (File No. 001-36353).
|
|
10.55*
|
Perrigo Company plc Change in Control Severance Policy for U.S. Employees, as amended and restated effective June 14, 2016 (incorporated by reference from Exhibit 10.2 to the Company’s Current Report on Form 8-K filed on June 17, 2016) (File No. 001-36353).
|
|
10.56
|
Mutual Agreement dated April 27, 2016 among the Company, Omega Pharma NV, Perrigo Ireland 2 Ltd, Mylecke Management, Art & Invest NV, Alychlo NV and Marc Coucke (incorporated by reference from Exhibit 10.1 to the Company’s Current Report on Form 8-K filed on April 28, 2016) (File No. 001-36353).
|
|
10.57
|
Amendment dated April 27, 2016 to the Non-Compete Agreement between the Company and Marc Coucke dated March 30, 2015 (incorporated by reference from Exhibit 10.3 to the Company’s Current Report on Form 8-K filed on April 28, 2016) (File No. 001-36353).
|
|
10.58
|
Amendment dated April 27, 2016 to the Lock-up Agreement between the Company and Alychlo NV dated March 30, 2015 (incorporated by reference from Exhibit 10.4 to the Company’s Current Report on Form 8-K filed on April 28, 2016) (File No. 001-36353).
|
238
Perrigo Company plc
- Item 15
Exhibits
|
10.59
|
Amendment dated April 27, 2016 to the Agreement for the Sale and Purchase of 685,348,257 Shares Of Omega Pharma Invest NV, dated as of November 6, 2014, by and among the Company, Alychlo NV and Holdco I BE NV (incorporated by reference from Exhibit 10.2 to the Company’s Current Report on Form 8-K filed on April 28, 2016) (File No. 001-36353).
|
|
10.60
|
Amendment 1 to Non-Compete Agreement, dated December 30, 2016, by and between Perrigo Ireland 2 Ltd. and Marc Coucke (filed herewith).
|
|
10.61
|
Amendment 2 to Non-Compete Agreement, dated December 30, 2016, by and between Perrigo Ireland 2 Ltd. and Marc Coucke (filed herewith).
|
|
21
|
Subsidiaries of the Registrant.
|
|
23
|
Consent of Ernst & Young LLP.
|
|
24
|
Power of Attorney (see signature page).
|
|
31
|
Rule 13a-14(a) Certifications.
|
|
32
|
Section 1350 Certifications.
|
|
101.INS
|
XBRL Instance Document.
|
|
101.SCH
|
XBRL Taxonomy Extension Schema Document.
|
|
101.CAL
|
XBRL Taxonomy Extension Calculation Linkbase Document.
|
|
101.DEF
|
XBRL Taxonomy Extension Definition Linkbase Document.
|
|
101.LAB
|
XBRL Taxonomy Extension Label Linkbase Document.
|
|
101.PRE
|
XBRL Taxonomy Extension Presentation Linkbase Document.
|
|
+
|
Confidential treatment has been requested for portions of this agreement. A completed copy of the agreement, including the redacted portions, has been filed separately with the SEC.
|
|
*
|
Denotes management contract or compensatory plan or arrangement.
|
|
(b)
|
Exhibits.
|
The response to this portion of Item 15 is submitted as a separate section of this Report. See Item 15(a)(3) above.
|
(c)
|
Financial Statement Schedules.
|
The response to this portion of Item 15 is submitted as a separate section of this Report. See Item 15(a)(2) above.
239
Perrigo Company plc
SCHEDULE II – VALUATION AND QUALIFYING ACCOUNTS
PERRIGO COMPANY PLC
(in millions)
|
Year Ended
|
Six Months Ended
|
Year Ended
|
||||||||||
|
Allowance for doubtful accounts
|
December 31,
2016 |
December 31,
2015 |
June 27,
2015 |
|||||||||
|
Balance at beginning of period
|
$
|
4.5
|
|
$
|
2.6
|
|
$
|
2.7
|
|
|||
|
Net bad debt expenses
(1)
|
2.1
|
|
2.5
|
|
0.6
|
|
||||||
|
Additions/(deductions)
(2)
|
(0.3
|
)
|
(0.6
|
)
|
(0.7
|
)
|
||||||
|
Balance at end of period
|
$
|
6.3
|
|
$
|
4.5
|
|
$
|
2.6
|
|
|||
|
(1)
|
Includes effects of changes in foreign exchange rates.
|
|
(2)
|
Uncollectible accounts written off, net of recoveries. Also includes effects of changes in foreign exchange rates.
|
240
SIGNATURES
Pursuant to the requirements of Section 13 or 15(d) of the Securities Exchange Act of 1934, the Registrant has duly caused this Annual Report on Form 10-K for the
year ended
December 31, 2016
to be signed on its behalf by the undersigned, thereunto duly authorized in the City of Dublin, Ireland on
May 22, 2017
.
|
PERRIGO COMPANY PLC
|
|
|
By:
|
/s/ John T. Hendrickson
|
|
John T. Hendrickson
|
|
|
Chief Executive Officer
|
|
|
(Principal Executive Officer)
|
|
POWER OF ATTORNEY
Each person whose signature appears below hereby appoints John T. Hendrickson, Ronald L. Winowiecki and Todd W. Kingma and each of them severally, acting alone and without the other, his true and lawful attorney-in-fact with authority to execute in the name of each such person, and to file with the Securities and Exchange Commission, together with any exhibits thereto and other documents therewith, any and all amendments to this Annual Report on Form 10-K for the
year ended
December 31, 2016
necessary or advisable to enable Perrigo Company plc to comply with the Securities Exchange Act of 1934, or any rules, regulations and requirements of the Securities and Exchange Commission in respect thereof, which amendments may make such other changes in the report as the aforesaid attorney-in-fact executing the same deems appropriate.
Pursuant to the requirements of the Securities Exchange Act of 1934, this Annual Report on Form 10-K for the
year ended
December 31, 2016
has been signed below by the following persons on behalf of the Registrant and in the capacities indicated on
May 22, 2017
.
241
|
Signature
|
|
Title
|
|
/s/ John T. Hendrickson
|
Chief Executive Officer, Director
|
|
|
John T. Hendrickson
|
(Principal Executive Officer)
|
|
|
/s/ Ronald L. Winowiecki
|
Acting Chief Financial Officer
|
|
|
Ronald L. Winowiecki
|
(Principal Accounting and Financial Officer)
|
|
|
/s/ Laurie Brlas
|
Chairman
|
|
|
Laurie Brlas
|
||
|
/s/ Bradley A. Alford
|
Director
|
|
|
Bradley A. Alford
|
||
|
/s/ Rolf A. Classon
|
Director
|
|
|
Rolf A. Classon
|
||
|
/s/ Adriana Karaboutis
|
Director
|
|
|
Adriana Karaboutis
|
||
|
/s/ Gary M. Cohen
|
Director
|
|
|
Gary M. Cohen
|
||
|
/s/ Jeffrey B. Kindler
|
Director
|
|
|
Jeffrey B. Kindler
|
||
|
/s/ Donal O'Connor
|
Director
|
|
|
Donal O'Connor
|
||
|
/s/ Geoffrey M. Parker
|
Director
|
|
|
Geoffrey M. Parker
|
||
|
/s/ Theodore R. Samuels
|
Director
|
|
|
Theodore R. Samuels
|
||
|
/s/ Jeffrey C. Smith
|
Director
|
|
|
Jeffrey C. Smith
|
||
242
TABLE OF CONTENTS
Part IItem 1. BusinessItem 1A. Risk FactorsItem 1B. Unresolved Staff CommentsItem 2. PropertiesItem 3. Legal ProceedingsItem 4. Mine Safety DisclosuresPart IIItem 5. Market For Registrant's Common Equity, Related Stockholder Matters and Issuer Purchases Of Equity SecuritiesItem 6. Selected Financial DataItem 7. Management's Discussion and Analysis Of Financial Condition and Results Of OperationsItem 7A. Quantitative and Qualitative Disclosures About Market RiskItem 8. Financial Statements and Supplementary DataNote 1 - Summary Of Significant Accounting PoliciesNote 2 - Acquisitions and DivestituresNote 3 - Goodwill and Other Intangible AssetsNote 4 - Accounts Receivable FactoringNote 5 - InventoriesNote 6 - Fair Value MeasurementsNote 7 - InvestmentsNote 8 - Derivative Instruments and Hedging ActivitiesNote 9 - Assets Held For SaleNote 10 - IndebtednessNote 11 - Earnings Per Share and Shareholders' EquityNote 12 - Share-based Compensation PlansNote 13 - Accumulated Other Comprehensive Income (loss)Note 14 - Income TaxesNote 15 - Post Employment PlansNote 16 - Commitments and ContingenciesNote 17 - Collaboration Agreements and Other Contractual ArrangementsNote 18 - Restructuring ChargesNote 19 - Segment and Geographic InformationNote 20 - Quarterly Financial Data (unaudited)Note 21 - Transition Period Comparative DataNote 22 - Subsequent EventsItem 9. Changes in and Disagreements with Accountants on Accounting and Financial DisclosureItem 9A. Controls and ProceduresItem 9B. Other InformationPart IIIItem 10. Directors, Executive Officers, and Corporate GovernanceItem 11. Executive CompensationItem 12. Security Ownership Of Certain Beneficial Owners and Management and Related Stockholder MattersItem 13. Certain Relationships and Related Transactions, and Director IndependenceItem 14. Principal Accounting Fees and ServicesPart IVItem 15. Exhibits and Financial Statement Schedules