PERRIGO CO PLC
10-Ks and 10-Qs
|
|
|
|
|
|
|
|
|
|
|
|
|
|
|
|
|
|
|
|
|
|
|
|
|
|
|
|
|
|
|
|
|
|
|
|
|
|
|
|
|
|
|
|
UNITED STATES
SECURITIES AND EXCHANGE COMMISSION
WASHINGTON, D.C. 20549
_______________________________________________
FORM 10-Q
_______________________________________________
|
[X]
|
QUARTERLY REPORT PURSUANT TO SECTION 13 OR 15(d) OF THE SECURITIES EXCHANGE ACT OF 1934
|
OR
|
[ ]
|
TRANSITION REPORT PURSUANT TO SECTION 13 OR 15(d) OF THE SECURITIES EXCHANGE ACT OF 1934
|
Commission file number 001-36353
_______________________________________________
Perrigo Company plc
(Exact name of registrant as specified in its charter)
_______________________________________________
|
Ireland
|
|
Not Applicable
|
|
(State or other jurisdiction of
incorporation or organization)
|
|
(I.R.S. Employer
Identification No.)
|
|
Treasury Building, Lower Grand Canal Street, Dublin 2, Ireland
|
|
-
|
|
(Address of principal executive offices)
|
|
(Zip Code)
|
(Registrant’s telephone number, including area code)
Not Applicable
(Former name, former address and former fiscal year, if changed since last report)
________________________________________
Indicate by check mark whether the registrant (1) has filed all reports required to be filed by Section 13 or 15(d) of the Securities Exchange Act of 1934 during the preceding 12 months (or for such shorter period that the registrant was required to file such report), and (2) has been subject to such filing requirements for the past 90 days. YES [X] NO [ ]
Indicate by check mark whether the registrant has submitted electronically and posted on its corporate Web site, if any, every Interactive Data File required to be submitted and posted pursuant to Rule 405 of Regulation S-T (§232.405 of this chapter) during the preceding 12 months (or for such shorter period that the registrant was required to submit and post such files). YES [X] NO [ ]
Indicate by check mark whether the registrant is a large accelerated filer, an accelerated filer, a non-accelerated filer, or a smaller reporting company. See definitions of “large accelerated filer”, “accelerated filer”, and “smaller reporting company” in Rule 12b-2 of the Exchange Act.
|
Large accelerated filer [X]
|
|
Accelerated filer [ ]
|
|
Non-accelerated filer [ ]
|
|
Smaller reporting company [ ]
|
|
(Do not check if a smaller reporting company)
|
|
|
Indicate by check mark whether the registrant is a shell company (as defined in Rule 12b-2 of the Exchange Act). [ ] YES [X] NO
As of
August 5, 2016
, there were
143,280,822
ordinary shares outstanding.
PERRIGO COMPANY PLC
FORM 10-Q
INDEX
|
PAGE
NUMBER
|
||
|
PART I. FINANCIAL INFORMATION
|
||
|
1
|
||
|
2
|
||
|
3
|
||
|
4
|
||
|
5
|
||
|
6
|
||
|
7
|
||
|
8
|
||
|
9
|
||
|
10
|
||
|
11
|
||
|
12
|
||
|
13
|
||
|
14
|
||
|
15
|
||
|
16
|
||
|
17
|
||
|
18
|
||
|
PART II. OTHER INFORMATION
|
||
Cautionary Note Regarding Forward-Looking Statements
Certain statements in this report are “forward-looking statements” within the meaning of Section 21E of the Securities Exchange Act of 1934, as amended, and are subject to the safe harbor created thereby. These statements relate to future events or our future financial performance and involve known and unknown risks, uncertainties and other factors that may cause our, or our industry's, actual results, levels of activity, performance or achievements to be materially different from those expressed or implied by any forward-looking statements.
In particular, statements about our expectations, beliefs, plans, objectives, assumptions, future events or future performance contained in this report, including certain statements contained in “Management’s Discussion and Analysis of Financial Condition and Results of Operations” are forward-looking statements. In some cases, forward-looking statements can be identified by terminology such as “may,” “will,” “could,” “would,” “should,” “expect,” “plan,” “anticipate,” “intend,” “believe,” “estimate,” “predict,” “potential” or the negative of those terms or other comparable terminology.
Please see Item 1A of our Form 10-KT for the transition period from
June 28, 2015
to
December 31, 2015
and Part II, Item 1A of our Form 10-Q for the three months ended April 2, 2016 and this Form 10-Q for a discussion of certain important risk factors that relate to forward-looking statements contained in this report. We have based these forward-looking statements on our current expectations, assumptions, estimates and projections. While we believe these expectations, assumptions, estimates and projections are reasonable, such forward-looking statements are only predictions and involve known and unknown risks and uncertainties, many of which are beyond our control, including the timing, amount and cost of share repurchases, future impairment charges, our ability to achieve our guidance, and the ability to execute and achieve the desired benefits of announced initiatives. These and other important factors, including those discussed in our Form 10-KT for the transition period from
June 28, 2015
to
December 31, 2015
, our Form 10-Q for the three months ended April 2, 2016, and in this Form 10-Q under "Risk Factors" and in any subsequent filings with the Securities and Exchange Commission, may cause actual results, performance or achievements to differ materially from those expressed or implied by these forward-looking statements. The forward-looking statements in this report are made only as of the date hereof, and unless otherwise required by applicable securities laws, we disclaim any intention or obligation to update or revise any forward-looking statements, whether as a result of new information, future events, or otherwise.
TRADEMARKS, TRADENAMES AND SERVICE MARKS
This report contains trademarks, trade names and service marks that are the property of Perrigo Company plc, as well as, for informational purposes, trademarks, trade names, and service marks that are the property of other organizations. Solely for convenience, certain trademarks, trade names, and service marks referred to in this report appear without the
®
,
™ and
SM
symbols, but those references are not intended to indicate that we or the applicable owner, as the case may be, will not assert, to the fullest extent under applicable law, our or their rights to such trademarks, trade names, and service marks.
1
Perrigo Company plc
- Item 1
PERRIGO COMPANY PLC
(in millions, except per share amounts)
(unaudited)
|
|
Three Months Ended
|
Six Months Ended
|
|||||||||||||
|
|
July 2,
2016 |
June 27,
2015 |
July 2,
2016 |
June 27,
2015 |
|||||||||||
|
Net sales
|
$
|
1,481.0
|
|
$
|
1,531.6
|
|
$
|
2,864.2
|
|
$
|
2,580.8
|
|
|||
|
Cost of sales
|
913.8
|
|
903.5
|
|
1,774.1
|
|
1,573.8
|
|
|||||||
|
Gross profit
|
567.2
|
|
628.1
|
|
1,090.1
|
|
1,007.0
|
|
|||||||
|
Operating expenses
|
|||||||||||||||
|
Distribution
|
22.5
|
|
23.7
|
|
44.3
|
|
38.4
|
|
|||||||
|
Research and development
|
47.0
|
|
62.6
|
|
92.2
|
|
98.0
|
|
|||||||
|
Selling
|
171.6
|
|
174.9
|
|
352.4
|
|
223.7
|
|
|||||||
|
Administration
|
101.8
|
|
140.1
|
|
208.2
|
|
219.7
|
|
|||||||
|
Impairment charges (credits)
|
(19.8
|
)
|
—
|
|
447.2
|
|
—
|
|
|||||||
|
Restructuring
|
5.8
|
|
(0.1
|
)
|
11.3
|
|
1.0
|
|
|||||||
|
Total operating expenses
|
328.9
|
|
401.2
|
|
1,155.6
|
|
580.8
|
|
|||||||
|
Operating income (loss)
|
238.3
|
|
226.9
|
|
(65.5
|
)
|
426.2
|
|
|||||||
|
Interest expense, net
|
57.4
|
|
45.9
|
|
108.6
|
|
89.2
|
|
|||||||
|
Other expense, net
|
29.3
|
|
22.7
|
|
33.1
|
|
281.3
|
|
|||||||
|
Loss on extinguishment of debt
|
—
|
|
0.9
|
|
0.4
|
|
0.9
|
|
|||||||
|
Income (loss) before income taxes
|
151.6
|
|
157.4
|
|
(207.6
|
)
|
54.8
|
|
|||||||
|
Income tax expense (benefit)
|
(42.7
|
)
|
101.0
|
|
(67.3
|
)
|
93.2
|
|
|||||||
|
Net income (loss)
|
$
|
194.3
|
|
$
|
56.4
|
|
$
|
(140.3
|
)
|
$
|
(38.4
|
)
|
|||
|
Income (loss) per share
|
|||||||||||||||
|
Basic
|
$
|
1.36
|
|
$
|
0.39
|
|
$
|
(0.98
|
)
|
$
|
(0.27
|
)
|
|||
|
Diluted
|
$
|
1.35
|
|
$
|
0.38
|
|
$
|
(0.98
|
)
|
$
|
(0.27
|
)
|
|||
|
Weighted-average shares outstanding
|
|||||||||||||||
|
Basic
|
143.2
|
|
146.3
|
|
143.2
|
|
143.5
|
|
|||||||
|
Diluted
|
143.6
|
|
146.8
|
|
143.2
|
|
143.5
|
|
|||||||
|
Dividends declared per share
|
$
|
0.145
|
|
$
|
0.125
|
|
$
|
0.29
|
|
$
|
0.25
|
|
|||
See accompanying Notes to the Condensed Consolidated Financial Statements
2
Perrigo Company plc
- Item 1
PERRIGO COMPANY PLC
CONDENSED CONSOLIDATED STATEMENTS OF COMPREHENSIVE INCOME (LOSS)
(in millions)
(unaudited)
|
Three Months Ended
|
Six Months Ended
|
||||||||||||||
|
July 2,
2016 |
June 27,
2015 |
July 2,
2016 |
June 27,
2015 |
||||||||||||
|
Net income (loss)
|
$
|
194.3
|
|
$
|
56.4
|
|
$
|
(140.3
|
)
|
$
|
(38.4
|
)
|
|||
|
Other comprehensive income (loss):
|
|||||||||||||||
|
Foreign currency translation adjustments
|
(106.2
|
)
|
118.6
|
|
44.8
|
|
90.7
|
|
|||||||
|
Change in fair value of derivative financial instruments, net of tax
|
(1.3
|
)
|
4.8
|
|
(7.0
|
)
|
5.5
|
|
|||||||
|
Change in fair value of investment securities, net of tax
|
2.4
|
|
(6.1
|
)
|
8.5
|
|
(4.9
|
)
|
|||||||
|
Change in post-retirement and pension liability adjustments, net of tax
|
(0.3
|
)
|
4.1
|
|
0.5
|
|
3.7
|
|
|||||||
|
Other comprehensive income (loss), net of tax
|
(105.4
|
)
|
121.4
|
|
46.8
|
|
95.0
|
|
|||||||
|
Comprehensive income (loss)
|
$
|
88.9
|
|
$
|
177.8
|
|
$
|
(93.5
|
)
|
$
|
56.6
|
|
|||
See accompanying Notes to the Condensed Consolidated Financial Statements
3
Perrigo Company plc
- Item 1
PERRIGO COMPANY PLC
(in millions)
|
(Unaudited)
|
|||||||
|
July 2,
2016 |
December 31,
2015 |
||||||
|
Assets
|
|||||||
|
Cash and cash equivalents
|
$
|
641.8
|
|
$
|
417.8
|
|
|
|
Accounts receivable, net of allowance for doubtful accounts of $4.0 million, and $3.0 million, respectively
|
1,199.1
|
|
1,193.1
|
|
|||
|
Inventories
|
894.6
|
|
844.4
|
|
|||
|
Prepaid expenses and other current assets
|
297.3
|
|
289.1
|
|
|||
|
Total current assets
|
3,032.8
|
|
2,744.4
|
|
|||
|
Property and equipment, net
|
888.6
|
|
886.2
|
|
|||
|
Goodwill and other indefinite-lived intangible assets
|
6,627.1
|
|
7,281.2
|
|
|||
|
Other intangible assets, net
|
8,679.3
|
|
8,190.5
|
|
|||
|
Non-current deferred income taxes
|
100.6
|
|
54.6
|
|
|||
|
Other non-current assets
|
205.2
|
|
237.0
|
|
|||
|
Total non-current assets
|
16,500.8
|
|
16,649.5
|
|
|||
|
Total assets
|
$
|
19,533.6
|
|
$
|
19,393.9
|
|
|
|
Liabilities and Shareholders’ Equity
|
|||||||
|
Liabilities
|
|||||||
|
Accounts payable
|
$
|
514.1
|
|
$
|
554.9
|
|
|
|
Payroll and related taxes
|
98.4
|
|
125.3
|
|
|||
|
Accrued customer programs
|
354.2
|
|
398.0
|
|
|||
|
Accrued liabilities
|
295.7
|
|
308.4
|
|
|||
|
Accrued income taxes
|
72.5
|
|
85.2
|
|
|||
|
Current indebtedness
|
758.1
|
|
1,018.3
|
|
|||
|
Total current liabilities
|
2,093.0
|
|
2,490.1
|
|
|||
|
Long-term debt, less current portion
|
5,652.5
|
|
4,971.6
|
|
|||
|
Non-current deferred income taxes
|
1,473.7
|
|
1,563.7
|
|
|||
|
Other non-current liabilities
|
414.7
|
|
332.4
|
|
|||
|
Total non-current liabilities
|
7,540.9
|
|
6,867.7
|
|
|||
|
Total liabilities
|
9,633.9
|
|
9,357.8
|
|
|||
|
Commitments and contingencies - Note 14
|
|||||||
|
Shareholders’ equity
|
|||||||
|
Preferred shares, $0.0001 par value, 10 million shares authorized
|
—
|
|
—
|
|
|||
|
Ordinary shares, €0.001 par value, 10 billion shares authorized
|
8,144.0
|
|
8,144.6
|
|
|||
|
Accumulated other comprehensive income
|
31.3
|
|
(15.5
|
)
|
|||
|
Retained earnings
|
1,725.0
|
|
1,907.6
|
|
|||
|
Total controlling interest
|
9,900.3
|
|
10,036.7
|
|
|||
|
Noncontrolling interest
|
(0.6
|
)
|
(0.6
|
)
|
|||
|
Total shareholders’ equity
|
9,899.7
|
|
10,036.1
|
|
|||
|
Total liabilities and shareholders' equity
|
$
|
19,533.6
|
|
$
|
19,393.9
|
|
|
|
Supplemental Disclosures of Balance Sheet Information
|
|||||||
|
Preferred shares, issued and outstanding
|
—
|
|
—
|
|
|||
|
Ordinary shares, issued and outstanding
|
143.2
|
|
143.1
|
|
|||
See accompanying Notes to the Condensed Consolidated Financial Statements
4
Perrigo Company plc
- Item 1
PERRIGO COMPANY PLC
(in millions)
(unaudited)
|
Six Months Ended
|
|||||||
|
|
July 2,
2016 |
June 27,
2015 |
|||||
|
Cash Flows From (For) Operating Activities
|
|||||||
|
Net income (loss)
|
$
|
(140.3
|
)
|
$
|
(38.4
|
)
|
|
|
Adjustments to derive cash flows
|
|||||||
|
Depreciation and amortization
|
369.3
|
|
295.0
|
|
|||
|
Loss on acquisition-related foreign currency derivatives
|
—
|
|
300.0
|
|
|||
|
Share-based compensation
|
7.6
|
|
15.5
|
|
|||
|
Impairment charges
|
447.2
|
|
—
|
|
|||
|
Loss on extinguishment of debt
|
0.4
|
|
0.9
|
|
|||
|
Non-cash restructuring charges
|
11.3
|
|
1.0
|
|
|||
|
Deferred income taxes
|
(157.1
|
)
|
21.9
|
|
|||
|
Other non-cash adjustments
|
28.2
|
|
12.1
|
|
|||
|
Subtotal
|
566.6
|
|
608.0
|
|
|||
|
Increase (decrease) in cash due to:
|
|||||||
|
Accounts receivable
|
42.3
|
|
(77.2
|
)
|
|||
|
Inventories
|
(50.3
|
)
|
28.4
|
|
|||
|
Accounts payable
|
(41.1
|
)
|
187.5
|
|
|||
|
Payroll and related taxes
|
(39.2
|
)
|
(3.8
|
)
|
|||
|
Accrued customer programs
|
(45.3
|
)
|
18.1
|
|
|||
|
Accrued liabilities
|
(9.8
|
)
|
(14.8
|
)
|
|||
|
Accrued income taxes
|
21.8
|
|
(14.9
|
)
|
|||
|
Other
|
(45.4
|
)
|
(0.6
|
)
|
|||
|
Subtotal
|
(167.0
|
)
|
122.7
|
|
|||
|
Net cash from (for) operating activities
|
399.6
|
|
730.7
|
|
|||
|
Cash Flows From (For) Investing Activities
|
|||||||
|
Acquisitions of businesses, net of cash acquired
|
(419.7
|
)
|
(2,098.8
|
)
|
|||
|
Additions to property and equipment
|
(57.1
|
)
|
(89.0
|
)
|
|||
|
Settlement of acquisition-related foreign currency derivatives
|
—
|
|
(303.5
|
)
|
|||
|
Other investing
|
(1.0
|
)
|
1.0
|
|
|||
|
Net cash from (for) investing activities
|
(477.8
|
)
|
(2,490.3
|
)
|
|||
|
Cash Flows From (For) Financing Activities
|
|||||||
|
Issuances of long-term debt
|
1,190.3
|
|
—
|
|
|||
|
Payments on long-term debt
|
(28.7
|
)
|
(889.0
|
)
|
|||
|
Borrowings (repayments) of revolving credit agreements and other financing, net
|
(803.9
|
)
|
(50.4
|
)
|
|||
|
Deferred financing fees
|
(2.4
|
)
|
(3.3
|
)
|
|||
|
Issuance of ordinary shares
|
3.5
|
|
4.0
|
|
|||
|
Cash dividends
|
(41.6
|
)
|
(35.9
|
)
|
|||
|
Other financing
|
(11.7
|
)
|
(10.6
|
)
|
|||
|
Net cash from (for) financing activities
|
305.5
|
|
(985.2
|
)
|
|||
|
Effect of exchange rate changes on cash
|
(3.3
|
)
|
(65.7
|
)
|
|||
|
Net increase (decrease) in cash and cash equivalents
|
224.0
|
|
(2,810.5
|
)
|
|||
|
Cash and cash equivalents, beginning of period
|
417.8
|
|
3,596.1
|
|
|||
|
Cash and cash equivalents, end of period
|
$
|
641.8
|
|
$
|
785.6
|
|
|
|
Supplemental Disclosures of Cash Flow Information
|
|||||||
|
Cash paid/received during the year for:
|
|||||||
|
Interest paid
|
$
|
89.5
|
|
$
|
86.3
|
|
|
|
Interest received
|
$
|
0.7
|
|
$
|
0.7
|
|
|
|
Income taxes paid
|
$
|
38.0
|
|
$
|
110.2
|
|
|
|
Income taxes refunded
|
$
|
0.3
|
|
$
|
2.1
|
|
|
See accompanying Notes to the Condensed Consolidated Financial Statements
5
Perrigo Company plc
- Item 1
Note 1
NOTE 1 –
SUMMARY OF SIGNIFICANT ACCOUNTING POLICIES
a. General Information
The Company
Perrigo Company plc was incorporated under the laws of Ireland on June 28, 2013 and became the successor registrant of Perrigo Company, a Michigan corporation, on December 18, 2013 in connection with the acquisition of Elan Corporation, plc ("Elan"). Unless the context requires otherwise, the terms "Perrigo," the "Company," "we," "our," "us," and similar pronouns used herein refer to Perrigo Company plc, its subsidiaries, and all predecessors of Perrigo Company plc and its subsidiaries. We are a leading global over-the-counter ("OTC") consumer goods and specialty pharmaceutical company, offering patients and customers high quality products at affordable prices. From our beginning in 1887 as a packager of home remedies, we have grown to become the world's largest manufacturer of OTC healthcare products and supplier of infant formulas for the store brand market. We are also a leading provider of generic extended topical prescription products, and we receive royalties from sales of the multiple sclerosis drug Tysabri
®
. We provide “Quality Affordable Healthcare Products
®
” across a wide variety of product categories and geographies, primarily in North America, Europe, and Australia, as well as in other markets, including Israel, China, and Latin America.
Basis of Presentation
The accompanying unaudited Condensed Consolidated Financial Statements have been prepared in accordance with U.S. generally accepted accounting principles ("GAAP") for interim financial information and with the instructions to Article 10 of Regulation S-X. Accordingly, they do not include all of the information and footnotes required by GAAP for complete financial statements. The unaudited Condensed Consolidated Financial Statements should be read in conjunction with the consolidated financial statements and footnotes included in our Transition Report on Form 10-KT for the transition period from
June 28, 2015
to
December 31, 2015
. In the opinion of management, all adjustments (consisting of normal recurring accruals and other adjustments) considered necessary for a fair presentation have been included. The Condensed Consolidated Financial Statements include our accounts and the accounts of all majority-owned subsidiaries. All intercompany transactions and balances have been eliminated in consolidation.
Our fiscal year previously consisted of a 52- or 53-week year ending on or around June 30 of each year with each quarter ending on the Saturday closest to each calendar quarter-end. Beginning on January 1, 2016, we changed our fiscal year to begin on January 1 and end on December 31 of each year. We will continue to cut off our quarterly accounting periods on the Saturday closest to the end of the calendar quarter, with the fourth quarter ending on December 31 of each year.
During the three months ended April 2, 2016, we identified certain errors in our consolidated financial statements for the transition period of June 28, 2015 to December 31, 2015, primarily related to the accrual estimates associated with product returns and tax-related items in our Branded Consumer Healthcare ("BCH") segment. These errors were corrected during the three months ended April 2, 2016 by increasing the consolidated operating loss by
$14.5 million
, which when combined with tax-related items, increased the consolidated net loss by
$13.7 million
within the Condensed Consolidated Statements of Operations. We concluded that these errors were not material to the consolidated financial statements for the transition period of June 28, 2015 to December 31, 2015 and are not expected to be material to the consolidated financial statements for the year ending December 31, 2016.
6
Perrigo Company plc
- Item 1
Note 1
b. Recent Accounting Standard Pronouncements
Below are recent accounting standard updates that we are still assessing to determine the effect on our consolidated financial statements. We do not believe that any other recently issued accounting standards could have a material effect on our consolidated financial statements. As new accounting pronouncements are issued, we will adopt those that are applicable under the circumstances.
|
Recently Issued Accounting Standards Not Yet Adopted
|
||||||
|
Standard
|
Description
|
Effective Date
|
Effect on the Financial Statements or Other Significant Matters
|
|||
|
Improvements to Employee Share-Based Payment Accounting
|
This guidance is intended to simplify several aspects of the accounting for share-based payment award transactions. It will require all income tax effects of awards to be recorded through the income statement when they vest or settle as opposed to certain amounts being recorded in additional paid-in capital. An entity will also have to elect whether to account for forfeitures as they occur or by estimating the number of awards expected to be forfeited and adjusting the estimate when it is likely to change (as currently required). The guidance will also increase the amount an employer can withhold to cover income taxes on awards. Early adoption is permitted.
|
January 1, 2017
|
We are currently evaluating the implications of adoption on our consolidated financial statements and considering whether to early adopt the standard.
|
|||
|
Revenue from Contracts with Customers
|
The core principle of the guidance is that an entity should recognize revenue to depict the transfer of promised goods or services to customers in an amount that reflects the consideration to which the entity expects to be entitled in exchange for those goods or services. To achieve that core principle, an entity should apply the following steps: identify the contract(s) with a customer; identify the performance obligations in the contract; determine the transaction price; allocate the transaction price to the performance obligations in the contract; and recognize revenue when (or as) the entity satisfies a performance obligation. This guidance allows for two adoption methods, full retrospective approach or modified retrospective approach. Early adoption is not permitted.
|
January 1, 2018
|
We are currently evaluating the possible adoption methodologies and the implications of adoption on our consolidated financial statements.
|
|||
|
Leases
|
This guidance was issued to increase transparency and comparability among organizations by requiring recognition of lease assets and lease liabilities on the balance sheet and disclosure of key information about leasing arrangements. For leases with a term of 12 months or less, lessees are permitted to make an election to not recognize right-of-use assets and lease liabilities. Upon adoption, lessees will apply the new standard as of the beginning of the earliest comparative period presented in the financial statements, however lessees will be able to exclude leases that expire as of the implementation date. Early adoption is permitted.
|
January 1, 2019
|
We are currently evaluating the implications of adoption on our consolidated financial statements and considering whether to early adopt the standard.
|
|||
7
Perrigo Company plc
- Item 1
Note 1
|
Recently Issued Accounting Standards Not Yet Adopted (continued)
|
||||||
|
Standard
|
Description
|
Effective Date
|
Effect on the Financial Statements or Other Significant Matters
|
|||
|
Measurement of Credit Losses on Financial Instruments
|
This guidance changes the impairment model for most financial assets and certain other instruments, replacing the current "incurred loss" approach with an "expected loss" credit impairment model, which will apply to most financial assets measured at amortized cost and certain other instruments, including trade and other receivables, loans, held-to-maturity debt securities,and off-balance sheet credit exposures such as letters of credit. Early adoption is permitted.
|
January 1, 2020
|
We are currently evaluating the new standard for potential impacts on our receivables, debt, and other financial instruments.
|
|||
NOTE 2 –
ACQUISITIONS
All of the below acquisitions have been accounted for under the acquisition method of accounting based on our analysis of the acquired inputs and processes, and the related assets acquired and liabilities assumed were recorded at fair value as of the acquisition date.
Fair value estimates are based on a complex series of judgments about future events and rely heavily on estimates and assumptions. The judgments used to determine the estimated fair value assigned to each class of assets and liabilities assumed, as well as asset lives, can materially impact our results of operations.
The effects of all of the acquisitions described below are included in the Condensed Consolidated Financial Statements prospectively from the date of each acquisition. Unless otherwise indicated, acquisition costs incurred were immaterial and were recorded in Administration expense.
Current Year Acquisitions
Tretinoin Product Portfolio
On
January 22, 2016
, we acquired a portfolio of generic dosage forms and strengths of
Retin-A
®
(tretinoin), a topical prescription acne treatment, from Matawan Pharmaceuticals, LLC, for
$416.4 million
in cash ("Tretinoin Products"), which further expanded our extended topicals portfolio. We were the authorized generic distributor of these products from 2005 to 2013. Operating results attributable to the acquisition are included within our Prescription Pharmaceuticals ("Rx") segment. The intangible assets acquired included generic product rights valued using the multi-period excess earnings method and assigned a
20
-year useful life, and non-compete agreements valued using the lost income method and assigned a
five
-year useful life. The goodwill acquired is deductible for tax purposes.
Development-Stage Rx Products
In May 2015, we entered into an agreement with a clinical stage biotechnology company for two specialty pharmaceutical products in development ("Development-Stage Rx Products"). We paid
$18.0 million
for an option to acquire the two products, which was recorded in Research and Development expense. On
March 1, 2016
, to further invest in our specialty Rx portfolio, we exercised the option for both products, which requires us to make contingent payments if we obtain regulatory approval and achieve certain sales milestones. We will also be obligated to make certain royalty payments over periods ranging from
seven
to
ten
years from the launch of each product.
We accounted for the option exercise as a business acquisition within our Rx segment, recording in-process research and development assets ("IPR&D"), goodwill, and contingent consideration on the balance sheet. The IPR&D was valued using the multi-period excess earnings method and has an indefinite useful life until such time as the research is completed (at which time it will become a definite-lived intangible asset), or is determined to have no future use (at which time it would be impaired). The contingent consideration is an estimate of the future milestone payments and royalties based on probability-weighted outcomes, sensitivity analysis, and discount rates reflective of the risk involved. The preliminary amount of contingent consideration recognized as of the acquisition date was
$24.9 million
and is recorded in
Other non-current liabilities
. The amount is subject to change as the valuation assumptions are refined over the measurement period. Once the purchase accounting has been finalized,
8
Perrigo Company plc
- Item 1
Note 2
the contingent consideration will continue to be updated quarterly to adjust the liability to fair value depending on a number of assumptions, including the competitive landscape and regulatory approvals that may impact future sales of the products.
Purchase Price Allocation of Current Year Acquisitions
The purchase accounting allocations for the Development-Stage Rx Products acquisition and one small product acquisition (included in "All Other" in the table below) are preliminary a
nd are
based on the valuation information, estimates, and assumptions available at
July 2, 2016
. As we finalize the fair value estimate, additional purchase price adjustments may be recorded during the measurement period to contingent consideration and intangible assets.
The below table indicates the purchase price allocation for acquisitions completed in the current year (in millions):
|
Tretinoin Products
|
Development-Stage Rx Products*
|
All Other
(1)
*
|
|||||||||
|
Purchase price paid
|
$
|
416.4
|
|
$
|
—
|
|
$
|
0.3
|
|
||
|
Contingent consideration
|
—
|
|
24.9
|
|
5.6
|
|
|||||
|
Total purchase consideration
|
$
|
416.4
|
|
$
|
24.9
|
|
$
|
5.9
|
|
||
|
Assets acquired:
|
|||||||||||
|
Inventories
|
$
|
1.4
|
|
$
|
—
|
|
$
|
—
|
|
||
|
Goodwill
|
1.7
|
|
—
|
|
—
|
|
|||||
|
Definite-lived intangibles
:
|
|||||||||||
|
Developed product technology, formulations, and product rights
|
411.0
|
|
—
|
|
—
|
|
|||||
|
Non-compete agreements
|
2.3
|
|
—
|
|
—
|
|
|||||
|
Indefinite-lived intangibles
:
|
|||||||||||
|
In-process research and development
|
—
|
|
24.9
|
|
5.9
|
|
|||||
|
Total intangible assets
|
413.3
|
|
24.9
|
|
5.9
|
|
|||||
|
Total assets
|
$
|
416.4
|
|
$
|
24.9
|
|
$
|
5.9
|
|
||
* Opening balance sheet is preliminary
|
(1)
|
Consists of
one
product acquisition in the CHC segment
|
Prior Year Acquisitions
Entocort
®
On
December 15, 2015
, we completed our acquisition of Entocort
®
(budesonide) capsules, as well as the authorized generic capsules, for sale within the U.S., from AstraZeneca plc for
$380.2 million
in cash. Entocort
®
is a gastroenterology medicine for patients with mild to moderate Crohn's disease and the acquisition complemented our Rx portfolio. Operating results attributable to the acquisition are included within our Rx segment. The intangible assets acquired included the branded and authorized generic product rights with useful lives of
10
and
15
years, respectively, which were valued using the multi-period excess earnings method.
9
Perrigo Company plc
- Item 1
Note 2
Naturwohl Pharma GmbH
On
September 15, 2015
, we completed our acquisition of
100%
of Naturwohl Pharma GmbH ("Naturwohl"), a Munich, Germany-based nutritional business known for its leading German dietary supplement brand, Yokebe
®
. The acquisition built on our Branded Consumer Healthcare ("BCH") segment's OTC product portfolio and European commercial infrastructure. The assets were purchased through an all-cash transaction valued at
€133.5 million
(
$150.4 million
). Operating results attributable to Naturwohl are included in the BCH segment. The intangible assets acquired included a trademark with a
20
-year useful life, customer relationships with a
15
-year useful life, non-compete agreements with a
three
-year useful life, and a licensing agreement with a
three
-year useful life. We utilized the relief from royalty method for valuing the trademark, the multi-period excess earnings method for valuing the customer relationships, and the lost income method for valuing the non-compete agreements and the licensing agreement. The goodwill acquired is not deductible for tax purposes.
ScarAway
®
On
August 28, 2015
, we completed our acquisition of ScarAway
®
, a leading U.S. OTC scar management brand portfolio comprised of five products, from Enaltus, LLC, for
$26.7 million
in cash. This acquisition served as our entry into the niche branded OTC business in the U.S. Operating results attributable to ScarAway
®
are included in the Consumer Healthcare ("CHC") segment. The intangible assets acquired included a trademark with a
25
-year useful life, non-compete agreements with a
four
-year useful life, developed product technology with an
eight
-year useful life, and customer relationships with a
15
-year useful life. We utilized the relief from royalty method for valuing the trademark and developed product technology, the multi-period excess earnings method for valuing the customer relationships, and the lost income method for valuing the non-compete agreements. The goodwill acquired is deductible for tax purposes.
GlaxoSmithKline
Consumer Healthcare Product Portfolio
On
August 28, 2015
, we completed our acquisition of a portfolio of well-established OTC brands from GlaxoSmithKline Consumer Healthcare (“GSK Products”). This acquisition further leveraged our European market share and expanded our product offerings. The assets were purchased through an all-cash transaction valued at
€200.0 million
(
$223.6 million
). Operating results attributable to the acquired GSK Products are included primarily in the BCH segment. The intangible assets acquired included trademarks with a
20
-year useful life and customer relationships with a
15
-year useful life. We utilized the relief from royalty method for valuing the trademarks and the multi-period excess earnings method for valuing the customer relationships. The goodwill acquired is deductible for tax purposes and recorded primarily in the BCH segment.
Gelcaps Exportadora de Mexico, S.A. de C.V.
On
May 12, 2015
, we completed our acquisition of
100%
of Gelcaps Exportadora de Mexico, S.A. de C.V. ("Gelcaps"), the Mexican operations of Durham, North Carolina-based Patheon Inc., for
$37.9 million
in cash. The acquisition added softgel manufacturing technology to our supply chain capabilities and broadened our presence, product portfolio, and customer network in Mexico. Operating results attributable to Gelcaps are included in the CHC segment. The intangible assets acquired included a trademark with a
25
-year useful life and customer relationships with a
20
-year useful life. We utilized the relief from royalty method for valuing the trademark and the multi-period excess earnings method for valuing the customer relationships.
Based on valuation estimates utilizing the comparative sales method, a step-up in the value of inventory of
$0.6 million
was recorded in the opening balance sheet, which was charged to cost of goods sold during the three months ended June 27, 2015. In addition, property, plant and equipment were written up by
$0.9 million
to their estimated fair market value based on a valuation method that included both the cost and market approaches. This additional step-up in value is being depreciated over the estimated remaining useful lives of the assets. The goodwill recorded is not deductible for tax purposes.
Omega Pharma Invest N.V.
On
March 30, 2015
, we completed our acquisition of Omega Pharma Invest N.V. ("Omega"), a limited liability company incorporated under the laws of Belgium. Omega was a leading European OTC company and is
10
Perrigo Company plc
- Item 1
Note 2
providing us several key benefits, including advancing our growth strategy outside the U.S. by providing access across a larger global platform with critical mass in key European countries, establishing commercial infrastructure in the high barrier-to-entry European OTC marketplace, strengthening our product portfolio while enhancing scale and distribution, and expanding our international management capabilities.
We purchased
95.77%
of the issued and outstanding share capital of Omega (
685,348,257
shares) from Alychlo N.V. (“Alychlo”) and Holdco I BE N.V. (together with Alychlo, the “Sellers”), limited liability companies incorporated under the laws of Belgium, under the terms of the Share Purchase Agreement dated November 6, 2014 (the "Share Purchase Agreement"). Omega holds the remaining
30,243,983
shares as treasury shares.
The acquisition was a cash and stock transaction made up of the following consideration (in millions except per share data):
|
Perrigo ordinary shares issued
|
5.4
|
|
||
|
Perrigo per share price at transaction close on March 30, 2015
|
$
|
167.64
|
|
|
|
Total value of Perrigo ordinary shares issued
|
$
|
904.9
|
|
|
|
Cash consideration
|
2,078.3
|
|
||
|
Total consideration
|
$
|
2,983.2
|
|
|
The cash consideration shown in the above table was financed by a combination of debt and equity. We issued
$1.6 billion
of debt as described in
Note 10
, and issued
6.8 million
ordinary shares, which raised
$999.3 million
, net of issuance costs.
The Sellers agreed to indemnify us for certain potential future losses. The Sellers’ indemnification and other obligations to us under the Share Purchase Agreement are secured up to
€248.0 million
(
$277.0 million
). Under the terms of the Share Purchase Agreement, Alychlo and its affiliates are subject to a
three
-year non-compete in Europe, and the Sellers are subject to a
two
-year non-solicit, in each case subject to certain exceptions. The Share Purchase Agreement contains other customary representations, warranties, and covenants of the parties thereto.
The operating results attributable to Omega are included in the BCH segment. We incurred general transaction costs (legal, banking and other professional fees), financing fees, and debt extinguishment charges in connection with the Omega acquisition. The amounts recorded were not allocated to a reporting segment. The table below details the acquisition costs, as well as losses on hedging activities associated with the acquisition purchase price, and where they were recorded for the three and six months ended June 27, 2015 (in millions):
|
Three Months Ended
|
Six Months Ended
|
|||||||
|
Line item
|
June 27, 2015
|
|||||||
|
Administration
|
$
|
16.1
|
|
$
|
18.1
|
|
||
|
Interest expense, net
|
—
|
|
18.7
|
|
||||
|
Other expense, net
|
—
|
|
258.2
|
|
||||
|
Total acquisition-related costs
|
$
|
16.1
|
|
$
|
295.0
|
|
||
See
Note 8
for further details on losses on the Omega-related hedging activities shown above in Other expense, net, and
Note 10
for details on the loss on extinguishment of debt.
We acquired the following intangible assets: indefinite-lived brands, a definite-lived trade name with an
eight
-year useful life, definite-lived brands with a
22
-year useful life, a distribution network with a
21
-year useful life, and developed product technology with useful lives ranging from
four
to
13
years. We also recorded goodwill, which is not deductible for tax purposes and represents the value we assigned to the expected synergies described above, in our BCH segment. We utilized the multi-period excess earnings method to value the indefinite-lived brands, the definite-lived brands, and distribution network. We utilized the relief from royalty method to value the developed product technology and definite-lived trade name.
Based on valuation estimates utilizing the comparative sales method, a step-up in the value of inventory of
$15.1 million
was recorded in the opening balance sheet and was charged to cost of goods sold during the three
11
Perrigo Company plc
- Item 1
Note 2
months ended June 27, 2015. In addition, property, plant and equipment were written up
$41.5 million
to their estimated fair market value based on a valuation method that included both the cost and market approaches. This additional step-up in value is being depreciated over the estimated remaining useful lives of the assets. Additionally, the fair value of the debt assumed
on the date of acquisition exceeded par value by
$101.9 million
, which was recorded as part of the carrying value of the underlying debt and will be amortized as a reduction of interest expense over the remaining terms of the respective debt instruments. For more information on the debt we assumed from Omega and our subsequent payments on the debt, see
Note 10
.
12
Perrigo Company plc
- Item 1
Note 2
Purchase Price Allocation of Prior Year Acquisitions
The purchase accounting allocations for the Entocort
®
and GSK Products acquisitions were finalized during the three months ended April 2, 2016. Changes to the allocations were due to adjustments to the intangible asset valuation assumptions. The purchase accounting for all other prior year acquisitions was final as of
December 31, 2015
.
The below table indicates the purchase price allocation for acquisitions completed during the
year ended
December 31, 2015
(in millions):
|
Entocort
®
|
Naturwohl
|
ScarAway
®
|
GSK Products
|
Gelcaps
|
Omega
|
All Other
(1)
|
|||||||||||||||||||||
|
Purchase price paid
|
$
|
380.2
|
|
$
|
150.4
|
|
$
|
26.7
|
|
$
|
223.6
|
|
$
|
37.9
|
|
$
|
2,983.2
|
|
$
|
15.3
|
|
||||||
|
Contingent consideration
|
—
|
|
—
|
|
—
|
|
—
|
|
—
|
|
—
|
|
13.9
|
|
|||||||||||||
|
Total purchase consideration
|
$
|
380.2
|
|
$
|
150.4
|
|
$
|
26.7
|
|
$
|
223.6
|
|
$
|
37.9
|
|
$
|
2,983.2
|
|
$
|
29.2
|
|
||||||
|
Assets acquired:
|
|||||||||||||||||||||||||||
|
Cash and cash equivalents
|
$
|
—
|
|
$
|
4.6
|
|
$
|
—
|
|
$
|
—
|
|
$
|
4.6
|
|
$
|
14.7
|
|
$
|
—
|
|
||||||
|
Accounts receivable
|
—
|
|
3.3
|
|
—
|
|
—
|
|
7.3
|
|
260.1
|
|
—
|
|
|||||||||||||
|
Inventories
|
0.2
|
|
1.5
|
|
1.0
|
|
—
|
|
7.2
|
|
202.5
|
|
—
|
|
|||||||||||||
|
Prepaid expenses and other current assets
|
—
|
|
—
|
|
—
|
|
—
|
|
2.1
|
|
39.2
|
|
—
|
|
|||||||||||||
|
Property and equipment
|
—
|
|
—
|
|
—
|
|
—
|
|
6.0
|
|
130.8
|
|
—
|
|
|||||||||||||
|
Goodwill
|
—
|
|
61.0
|
|
3.5
|
|
32.6
|
|
6.0
|
|
1,900.4
|
|
—
|
|
|||||||||||||
|
Definite-lived intangibles
:
|
|||||||||||||||||||||||||||
|
Distribution and license agreements, supply agreements
|
—
|
|
21.4
|
|
—
|
|
—
|
|
—
|
|
—
|
|
—
|
|
|||||||||||||
|
Developed product technology, formulations, and product rights
|
380.0
|
|
—
|
|
0.5
|
|
—
|
|
—
|
|
27.2
|
|
—
|
|
|||||||||||||
|
Customer relationships and distribution networks
|
—
|
|
25.9
|
|
9.8
|
|
61.5
|
|
6.6
|
|
1,056.3
|
|
—
|
|
|||||||||||||
|
Trademarks, trade names, and brands
|
—
|
|
64.2
|
|
11.4
|
|
129.5
|
|
—
|
|
287.5
|
|
—
|
|
|||||||||||||
|
Non-compete agreements
|
—
|
|
0.3
|
|
0.5
|
|
—
|
|
—
|
|
—
|
|
—
|
|
|||||||||||||
|
Indefinite-lived intangibles
:
|
|||||||||||||||||||||||||||
|
Trademarks, trade names, and brands
|
—
|
|
—
|
|
—
|
|
—
|
|
4.4
|
|
2,003.8
|
|
—
|
|
|||||||||||||
|
In-process research and development
|
—
|
|
—
|
|
—
|
|
—
|
|
—
|
|
—
|
|
29.2
|
|
|||||||||||||
|
Total intangible assets
|
380.0
|
|
111.8
|
|
22.2
|
|
191.0
|
|
11.0
|
|
3,374.8
|
|
29.2
|
|
|||||||||||||
|
Other non-current assets
|
—
|
|
—
|
|
—
|
|
—
|
|
0.4
|
|
2.4
|
|
—
|
|
|||||||||||||
|
Total assets
|
380.2
|
|
182.2
|
|
26.7
|
|
223.6
|
|
44.6
|
|
5,924.9
|
|
29.2
|
|
|||||||||||||
|
Liabilities assumed:
|
|||||||||||||||||||||||||||
|
Accounts payable
|
—
|
|
2.8
|
|
—
|
|
—
|
|
3.3
|
|
243.1
|
|
—
|
|
|||||||||||||
|
Short-term debt
|
—
|
|
—
|
|
—
|
|
—
|
|
—
|
|
24.6
|
|
—
|
|
|||||||||||||
|
Accrued liabilities
|
—
|
|
1.6
|
|
—
|
|
—
|
|
1.6
|
|
43.9
|
|
—
|
|
|||||||||||||
|
Payroll and related taxes
|
—
|
|
—
|
|
—
|
|
—
|
|
—
|
|
51.3
|
|
—
|
|
|||||||||||||
|
Accrued customer programs
|
—
|
|
—
|
|
—
|
|
—
|
|
—
|
|
39.8
|
|
—
|
|
|||||||||||||
|
Long-term debt
|
—
|
|
—
|
|
—
|
|
—
|
|
—
|
|
1,471.0
|
|
—
|
|
|||||||||||||
|
Net deferred income tax liabilities
|
—
|
|
27.4
|
|
—
|
|
—
|
|
1.4
|
|
1,014.5
|
|
—
|
|
|||||||||||||
|
Other non-current liabilities
|
—
|
|
—
|
|
—
|
|
—
|
|
0.4
|
|
53.5
|
|
—
|
|
|||||||||||||
|
Total liabilities
|
—
|
|
31.8
|
|
—
|
|
—
|
|
6.7
|
|
2,941.7
|
|
—
|
|
|||||||||||||
|
Net assets acquired
|
$
|
380.2
|
|
$
|
150.4
|
|
$
|
26.7
|
|
$
|
223.6
|
|
$
|
37.9
|
|
$
|
2,983.2
|
|
$
|
29.2
|
|
||||||
|
(1)
|
Consists of
eight
product acquisitions in the CHC, BCH, and Rx segments
|
13
Perrigo Company plc
- Item 1
Note 2
Actual and Unaudited Pro Forma Impact of Acquisitions
Our Condensed Consolidated Financial Statements include operating results from the acquisitions of the Tretinoin Products, Entocort
®
, Naturwohl, GSK Products, ScarAway
®
, Omega, and Gelcaps, and two small product acquisitions (included in "All Other" in the above table) from the date of each acquisition through
July 2, 2016
. Net sales and operating
income
attributable to acquisitions completed in the current year and included in our financial statements totaled
$13.4 million
and
$7.5 million
, respectively, for the
three months ended
July 2, 2016
and totaled
$29.2 million
and
$18.9 million
, respectively, for the
six months ended
July 2, 2016
.
The following unaudited pro forma information gives effect to the acquisitions of the Tretinoin Products, Entocort
®
, Naturwohl, GSK Products, ScarAway
®
, Omega, and Gelcaps, and two small product acquisitions, as if the acquisitions had occurred on the first day of the
six months ended
June 27, 2015
and had been included in our Results of Operations for all periods presented thereafter (in millions):
|
Three Months Ended
|
Six Months Ended
|
||||||||||||||
|
(Unaudited)
|
July 2,
2016 |
June 27,
2015 |
July 2,
2016 |
June 27,
2015 |
|||||||||||
|
Net sales
|
$
|
1,481.0
|
|
$
|
1,627.9
|
|
$
|
2,867.5
|
|
$
|
3,005.2
|
|
|||
|
Net income (loss)
|
$
|
194.3
|
|
$
|
87.3
|
|
$
|
(138.8
|
)
|
$
|
11.9
|
|
|||
The historical consolidated financial information of Perrigo, and the Tretinoin Products, Entocort
®
, Naturwohl, GSK Products, ScarAway
®
, Omega, and Gelcaps, and two small product acquisitions, has been adjusted in the pro forma information to give effect to pro forma events that are (1) directly attributable to the transactions, (2) factually supportable and (3) expected to have a continuing impact on combined results. In order to reflect the occurrence of the acquisitions on the first day of the
six months ended
June 27, 2015
as required, the unaudited pro forma results include adjustments to reflect the incremental amortization expense to be incurred based on the current values of each acquisition's identifiable intangible and tangible assets, along with the reclassification of acquisition-related costs from the
six months ended
July 2, 2016
to the
six months ended
June 27, 2015
. The unaudited pro forma results do not reflect future events that have occurred or may occur after the acquisitions.
NOTE 3 –
GOODWILL AND OTHER INTANGIBLE ASSETS
Goodwill
Changes in the carrying amount of goodwill, by reportable segment, were as follows (in millions):
|
Reporting Segments:
|
December 31, 2015
|
Business acquisitions
|
Impairments
|
Changes in assets held for sale
|
Currency translation adjustment
|
July 2,
2016 |
||||||||||||||||||
|
CHC
|
$
|
1,890.0
|
|
$
|
—
|
|
$
|
—
|
|
$
|
4.5
|
|
$
|
(5.7
|
)
|
$
|
1,888.8
|
|
||||||
|
BCH
|
1,980.5
|
|
—
|
|
(163.3
|
)
|
—
|
|
74.6
|
|
1,891.8
|
|
||||||||||||
|
Rx
|
1,222.2
|
|
1.7
|
|
—
|
|
—
|
|
(13.0
|
)
|
1,210.9
|
|
||||||||||||
|
Specialty Sciences
|
200.7
|
|
—
|
|
—
|
|
—
|
|
—
|
|
200.7
|
|
||||||||||||
|
Other
|
71.5
|
|
—
|
|
—
|
|
7.2
|
|
0.9
|
|
79.6
|
|
||||||||||||
|
Total goodwill
|
$
|
5,364.9
|
|
$
|
1.7
|
|
$
|
(163.3
|
)
|
$
|
11.7
|
|
$
|
56.8
|
|
$
|
5,271.8
|
|
||||||
In connection with the preparation of our financial statements for the three-month period ended April 2, 2016, we identified indicators of goodwill impairment in our BCH - rest of world (“BCH - ROW”) reporting unit, which comprises primarily operations attributable to the Omega acquisition in all geographic regions except for Belgium. The primary impairment indicators included the decline in our 2016 performance expectations and a reduction in our long-range revenue growth forecast. Step one of the goodwill impairment test involved determining the fair value of the reporting unit using a discounted cash flow technique and comparing it to the reporting unit’s carrying value. The main assumptions supporting the cash flow projections used to determine the reporting unit’s fair value included revenue growth based on product line extensions, product life cycle strategies, and geographical expansion within the markets in which the reporting unit distributes products, gross margins consistent with historical trends, and advertising and promotion investments largely consistent with the reporting unit's growth plans. The BCH-ROW
14
Perrigo Company plc
- Item 1
Note 3
reporting unit did not pass step one of goodwill impairment testing. The change in fair value from previous estimates was due primarily to the changes in the market and performance of the brands such that the evaluation of brand prioritization and product extensions or launches in new regions are being more focused to maximize the potential of all brands in the segment's portfolio.
The second step of the goodwill impairment test required that we determine the implied fair value of the BCH - ROW reporting unit’s goodwill, which involved determining the value of the reporting unit’s individual assets and liabilities. Due to the complex and time-consuming nature of step two, based on our evaluation and initial estimates of the fair values of the assets and liabilities and the deficit of the fair value when compared to the related book value, we recorded an estimated impairment charge of
$193.6 million
in
Impairment charges (credits)
on the Condensed Consolidated Statements of Operations for the three months ended April 2, 2016. We finalized the step two fair value calculation during the three months ended July 2, 2016, which resulted in a
$30.3 million
reduction to the estimated impairment charge recorded last quarter.
While no impairment charges were recorded as a result of the goodwill impairment testing for the transition period of
June 28, 2015
to
December 31, 2015
, our Specialty Sciences reporting unit's fair value exceeded the carrying value by less than 10%. Management evaluated the primary source of cash flow in this segment, the Tysabri
®
royalty stream, based on a combination of factors including independent external research, information provided from our royalty partner, and internal estimates. Based on this information, management’s assessment of future cash flow from this royalty stream has been reduced primarily due to anticipated new competitors entering the market and unfavorable currency exchange effects. Future performance different from the assumptions utilized in our quantitative analysis may further reduce the fair value of the reporting unit, which may result in the fair value no longer exceeding the carrying value. In February 2016, a competitor's pipeline product, Ocrevus
®
, received breakthrough therapy designation from the FDA and could potentially be approved in 2016. The product would compete with Tysabri
®
and could have a significant negative impact on the royalty we receive from Biogen Idec Inc. ("Biogen") and the performance of the Specialty Sciences segment. We continue to monitor the progress of all potential competing products and assess the reporting unit for potential impairment should impairment indicators arise, as applicable, and at least annually during our fourth quarter impairment testing.
During the
three months ended
June 27, 2015
, we performed our annual goodwill impairment testing, which indicated that our CHC Mexico reporting unit's goodwill fair value was below its net book value as of March 28, 2015. As a result, we initiated the second step of the goodwill impairment test to measure the amount of impairment. We concluded that the goodwill was fully impaired and recorded an impairment of
$6.8 million
in the CHC segment during the
three months ended
June 27, 2015
in Other expense, net.
15
Perrigo Company plc
- Item 1
Note 3
Intangible Assets
Other intangible assets and related accumulated amortization consisted of the following (in millions):
|
|
July 2, 2016
|
December 31, 2015
|
|||||||||||||
|
|
Gross
|
Accumulated Amortization
|
Gross
|
Accumulated Amortization
|
|||||||||||
|
Definite-lived intangibles
:
|
|||||||||||||||
|
Distribution and license agreements, supply agreements
|
$
|
6,056.7
|
|
$
|
831.5
|
|
$
|
6,053.4
|
|
$
|
667.2
|
|
|||
|
Developed product technology, formulations, and product rights
|
1,784.6
|
|
492.1
|
|
1,383.5
|
|
426.0
|
|
|||||||
|
Customer relationships and distribution networks
|
1,545.7
|
|
256.6
|
|
1,520.7
|
|
193.0
|
|
|||||||
|
Trademarks, trade names, and brands
|
911.4
|
|
42.6
|
|
539.4
|
|
22.8
|
|
|||||||
|
Non-compete agreements
|
14.6
|
|
10.9
|
|
15.2
|
|
12.7
|
|
|||||||
|
Total definite-lived intangibles
|
$
|
10,313.0
|
|
$
|
1,633.7
|
|
$
|
9,512.2
|
|
$
|
1,321.7
|
|
|||
|
Indefinite-lived intangibles
:
|
|||||||||||||||
|
Trademarks, trade names, and brands
|
$
|
1,288.4
|
|
$
|
—
|
|
$
|
1,868.1
|
|
$
|
—
|
|
|||
|
In-process research and development
|
66.9
|
|
—
|
|
48.2
|
|
—
|
|
|||||||
|
Total indefinite-lived intangibles
|
1,355.3
|
|
—
|
|
1,916.3
|
|
—
|
|
|||||||
|
Total other intangible assets
|
$
|
11,668.3
|
|
$
|
1,633.7
|
|
$
|
11,428.5
|
|
$
|
1,321.7
|
|
|||
Certain intangible assets are denominated in currencies other than the U.S. dollar; therefore, their gross and net carrying values are subject to foreign currency movements.
We recorded amortization expense of
$161.7 million
and
$142.6 million
for the
three months ended
July 2, 2016
and
June 27, 2015
, respectively, and
$319.7 million
and
$250.4 million
for the
six months ended
July 2, 2016
and
June 27, 2015
, respectively. The increase in amortization expense for the 2016 six-month period was due primarily to the incremental amortization expense incurred on the definite-lived intangible assets acquired from Omega.
During our impairment testing for the transition period of
June 28, 2015
to
December 31, 2015
, we identified an impairment of certain indefinite-lived intangible assets purchased in conjunction with the Omega acquisition based on management’s expectations of the prospects for future revenues, profits, and cash flows associated with these assets. The assessment resulted in an impairment charge of
$185.1 million
within our BCH segment, which represented the difference between the carrying amount of the intangible assets and their estimated fair value. See our Transition Report on Form 10-KT filed on February 25, 2016 for a further discussion of this impairment charge.
In connection with the preparation of our financial statements for the three-month period ended April 2, 2016, we identified indicators of impairment associated with certain indefinite-lived intangible assets acquired in conjunction with the Omega acquisition. The primary impairment indicators included the decline in our 2016 performance expectations and a reduction in our long-range revenue growth forecast. The assessment utilized the excess earnings method to determine fair value and resulted in an impairment charge of
$273.4 million
in
Impairment charges (credits)
on the Condensed Consolidated Statements of Operations within our BCH segment, which represented the difference between the carrying amount of the intangible assets and their estimated fair value. The change in fair value from previous estimates was due primarily to the changes in the market and performance of the brands such that the evaluation of brand prioritization and product extensions or launches in new regions are being more focused to maximize the potential of all brands in the segment's portfolio. The main assumptions supporting the fair value of these assets and cash flow projections included revenue growth based on product line extensions, product life cycle strategies, and geographical expansion within the markets in which the BCH segment distributes products, gross margins consistent with historical trends, and advertising and promotion investments largely consistent with the segment's growth plans.
The carrying value for certain intangible assets and goodwill equals estimated and implied fair values, respectively, and as a result, any further deterioration in those assets' fair value would lead to a further impairment
16
Perrigo Company plc
- Item 1
Note 3
charge. Future performance different from the assumptions utilized in our quantitative analyses may result in additional changes in the fair value. We will continue to monitor and assess these assets for potential impairment should further impairment indicators arise, as applicable, and at least annually during our fourth quarter annual impairment testing.
In addition, due to the reprioritization of certain brands in the BCH segment and change in performance expectations for our impaired lifestyle brands previously recorded as indefinite-lived assets, we reclassified the remaining asset balance of
$364.5 million
to definite-lived assets with a useful life of
20
years and began amortizing the asset during the three months ended July 2, 2016.
NOTE 4 -
ACCOUNTS RECEIVABLE FACTORING
We have multiple accounts receivable factoring arrangements with non-related third-party financial institutions (the “Factors”). Pursuant to the terms of the arrangements, we sell to the Factors certain of our accounts receivable balances on a non-recourse basis for credit approved accounts. An administrative fee ranging from
0.14%
to
0.15%
per invoice is charged on the gross amount of accounts receivables assigned to the Factors, plus interest is calculated at the applicable EUR LIBOR rate plus 70 basis points. The total amount factored and excluded from accounts receivable was
$54.7 million
and
$106.7 million
at
July 2, 2016
and
December 31, 2015
, respectively.
NOTE 5 –
INVENTORIES
Major components of inventory were as follows (in millions):
|
July 2,
2016 |
December 31,
2015 |
||||||
|
Finished goods
|
$
|
523.4
|
|
$
|
483.4
|
|
|
|
Work in process
|
148.6
|
|
151.4
|
|
|||
|
Raw materials
|
222.6
|
|
209.6
|
|
|||
|
Total inventories
|
$
|
894.6
|
|
$
|
844.4
|
|
|
NOTE 6 –
FAIR VALUE MEASUREMENTS
Fair value is the price that would be received upon sale of an asset or paid to transfer a liability in an orderly transaction between market participants at the measurement date. The following fair value hierarchy is used in selecting inputs, with the highest priority given to Level 1, as these are the most transparent or reliable.
|
Level 1:
|
Quoted prices for identical instruments in active markets.
|
|
Level 2:
|
Quoted prices for similar instruments in active markets; quoted prices for identical or similar instruments in markets that are not active; and model-derived valuations in which all significant inputs are observable in active markets.
|
|
Level 3:
|
Valuations derived from valuation techniques in which one or more significant inputs are not observable.
|
17
Perrigo Company plc
- Item 1
Note 6
The following table summarizes the valuation of our financial instruments carried at fair value and measured at fair value on a recurring basis by the above pricing categories (in millions):
|
Fair Value
|
||||||||||
|
Fair Value Hierarchy
|
July 2,
2016 |
December 31,
2015 |
||||||||
|
Measured at fair value on a recurring basis:
|
||||||||||
|
Assets:
|
||||||||||
|
Investment securities
|
Level 1
|
$
|
40.0
|
|
$
|
14.9
|
|
|||
|
Foreign currency forward contracts
|
Level 2
|
$
|
4.3
|
|
$
|
4.8
|
|
|||
|
Funds associated with Israeli post-employment benefits
|
Level 2
|
16.3
|
|
17.2
|
|
|||||
|
Total level 2 assets
|
$
|
20.6
|
|
$
|
22.0
|
|
||||
|
Liabilities:
|
||||||||||
|
Interest rate swap agreements
|
Level 2
|
$
|
—
|
|
$
|
0.3
|
|
|||
|
Foreign currency forward contracts
|
Level 2
|
2.8
|
|
3.9
|
|
|||||
|
Total level 2 liabilities
|
$
|
2.8
|
|
$
|
4.2
|
|
||||
|
Contingent consideration
|
Level 3
|
$
|
44.9
|
|
$
|
17.9
|
|
|||
There were no transfers between Level 1, 2, and 3 during the
three and six months ended
July 2, 2016
and
June 27, 2015
. Our policy regarding the recording of transfers between levels is to record any such transfers at the end of the reporting period. See
Note 7
for information on our investment securities. See
Note 8
for a discussion of derivatives.
Israeli post-employment benefits represent amounts we have deposited in funds managed by financial institutions designated by management to cover post-employment benefits for our Israeli employees as required by Israeli law. The funds are recorded in Other non-current assets and values are determined using prices for recently traded financial instruments with similar underlying terms, as well as directly or indirectly observable inputs, such as interest rates and yield curves, that are observable at commonly quoted intervals.
Contingent consideration represents milestone payment obligations obtained through product acquisitions, which are valued using estimates based on probability-weighted outcomes, sensitivity analysis, and discount rates reflective of the risk involved. The estimates are updated quarterly and the liabilities are adjusted to fair value depending on a number of assumptions, including the competitive landscape and regulatory approvals that may impact the future sales of a product.
The table below presents a reconciliation for liabilities measured at fair value on a recurring basis using significant unobservable inputs (Level 3) (in millions). Net realized losses in the table were recorded in Administrative expense.
|
Three Months Ended
|
Six Months Ended
|
||||||||||||||
|
July 2,
2016 |
June 27,
2015 |
July 2,
2016 |
June 27,
2015 |
||||||||||||
|
Contingent Consideration
|
|||||||||||||||
|
Beginning balance:
|
$
|
48.0
|
|
$
|
12.4
|
|
$
|
17.9
|
|
$
|
12.4
|
|
|||
|
Net realized (gains) losses
|
(0.1
|
)
|
0.9
|
|
—
|
|
0.9
|
|
|||||||
|
Purchases or additions
|
1.0
|
|
—
|
|
30.5
|
|
—
|
|
|||||||
|
Impairments
|
(3.8
|
)
|
(13.3
|
)
|
(3.8
|
)
|
(13.3
|
)
|
|||||||
|
Foreign currency effect
|
(0.2
|
)
|
—
|
|
0.3
|
|
—
|
|
|||||||
|
Ending balance:
|
$
|
44.9
|
|
$
|
—
|
|
$
|
44.9
|
|
$
|
—
|
|
|||
18
Perrigo Company plc
- Item 1
Note 6
Certain assets are required to be recorded at fair value on a non-recurring basis when events and circumstances indicate that the carrying value may not be recoverable. The following table summarizes the valuation of our financial instruments carried at fair value by the above pricing categories (in millions):
|
Fair Value
|
||||||||||
|
Fair Value Hierarchy
|
July 2,
2016 |
December 31,
2015 |
||||||||
|
Measured at fair value on a non-recurring basis:
|
||||||||||
|
Assets:
|
||||||||||
|
Goodwill
(1)
|
Level 3
|
$
|
1,792.6
|
|
$
|
—
|
|
|||
|
Indefinite-lived intangible assets
(2)
|
Level 3
|
$
|
1,082.0
|
|
$
|
1,031.8
|
|
|||
|
Assets held for sale, net
|
Level 3
|
70.1
|
|
37.5
|
|
|||||
|
Total level 3 assets
|
$
|
2,944.7
|
|
$
|
1,069.3
|
|
||||
|
(1)
|
Goodwill with a carrying amount of
$1,955.9 million
was written down to its implied fair value of
$1,792.6 million
, resulting in total impairment charges of
$163.3 million
for the
six months ended
July 2, 2016
, which are included in
Impairment charges (credits)
on the Condensed Consolidated Statements of Operations. The implied fair value is as of April 2, 2016, the date of the goodwill impairment test.
|
|
(2)
|
Intangible assets estimated fair value at July 2, 2016 is as of April 2, 2016, the date the impairment was taken.
|
The non-recurring fair values included in the table above represent only those assets whose carrying values were adjusted to fair value during the reporting period. See
Note 3
for a more detailed discussion of the impaired goodwill and indefinite-lived intangible assets and the valuation methods used, and
Note 9
for information on the impaired assets held for sale, net.
As of
July 2, 2016
and
December 31, 2015
, our fixed rate long-term debt consisted of public bonds, a private placement note, and retail bonds. As of
July 2, 2016
, the public bonds and private placement note had a carrying value of
$5.1 billion
and a fair value of
$5.2 billion
, based on quoted market prices (Level 1). As of
December 31, 2015
, the public bonds and private placement note had a carrying value of
$3.9 billion
and fair value of
$3.8 billion
, based on quoted market prices (Level 1). As of
July 2, 2016
, our retail bonds had a carrying value of
$818.6 million
(excluding a premium of
$67.5 million
) and a fair value of
$885.3 million
. As of
December 31, 2015
, our retail bonds had a carrying value of
$798.3 million
(excluding a premium of
$82.5 million
) and a fair value of
$859.8 million
. The fair value of our related bonds for both periods was based on interest rates offered for borrowings of a similar nature and remaining maturities (Level 2).
The carrying amounts of our other financial instruments, consisting of cash and cash equivalents, accounts receivable, accounts payable, short-term debt and variable rate long-term debt, approximate their fair value.
NOTE 7 –
INVESTMENTS
Available for Sale Securities
Our available for sale securities are reported in
Prepaid expenses and other current assets
. Unrealized investment gains (losses) on available for sale securities were as follows (in millions):
|
July 2,
2016 |
December 31, 2015
|
||||||
|
Equity securities, at cost less impairments
|
$
|
20.2
|
|
$
|
6.4
|
|
|
|
Gross unrealized gains
|
19.8
|
|
9.3
|
|
|||
|
Gross unrealized losses
|
—
|
|
(0.8
|
)
|
|||
|
Estimated fair value of equity securities
|
$
|
40.0
|
|
$
|
14.9
|
|
|
The factors affecting the assessment of impairments include both general financial market conditions and factors specific to a particular company. We recorded impairment charges of
$1.7 million
related to other-than-temporary impairments of our marketable equity securities during the
three months ended
July 2, 2016
due to prolonged losses incurred on each of the investments.
19
Perrigo Company plc
- Item 1
Note 7
Cost Method Investments
Our cost method investments totaled
$7.0 million
and
$6.9 million
at
July 2, 2016
and
December 31, 2015
, respectively, and are included in
Other non-current assets
.
Equity Method Investments
Our equity method investments totaled
$4.8 million
and
$45.5 million
at
July 2, 2016
and
December 31, 2015
, respectively, and are included in
Other non-current assets
. We recorded a net
loss
of
$1.6 million
and
$3.9 million
during the
three and six months ended
July 2, 2016
, respectively, and a net
loss
of
$3.3 million
and
$3.6 million
during the
three and six months ended
June 27, 2015
, respectively, for our proportionate share of the equity method investment earnings or losses. The losses were recorded in Other expense, net.
In addition, due to significant and prolonged losses incurred on one of our equity method investments, we recorded a
$22.3 million
impairment in Other expense, net, during the
three months ended
July 2, 2016
.
During the
six months ended
July 2, 2016
, one of our equity method investments became publicly traded. As a result, we transferred the
$15.5 million
investment to available for sale and recorded an
$8.7 million
unrealized gain, net of tax, in Other Comprehensive Income ("OCI"), as reflected in the table above.
NOTE 8 –
DERIVATIVE INSTRUMENTS AND HEDGING ACTIVITIES
We enter into certain derivative financial instruments, when available on a cost-effective basis, to mitigate our risk associated with changes in interest rates and foreign currency exchange rates as follows:
Interest rate risk management -
We are exposed to the impact of interest rate changes through our cash investments and borrowings. We utilize a variety of strategies to manage the impact of changes in interest rates including using a mix of debt maturities along with both fixed-rate and variable-rate debt. In addition, we may enter into treasury-lock agreements and interest rate swap agreements on certain investing and borrowing transactions to manage our exposure to interest rate changes and our overall cost of borrowing.
Foreign currency exchange risk management -
We conduct business in several major currencies other than the U.S. dollar and are subject to risks associated with changing foreign exchange rates. Our objective is to reduce cash flow volatility associated with foreign exchange rate changes on a consolidated basis to allow management to focus its attention on business operations. Accordingly, we enter into various contracts that change in value as foreign exchange rates change to protect the value of existing foreign currency assets and liabilities, commitments, and anticipated foreign currency sales and expenses.
All derivative instruments are managed on a consolidated basis to efficiently net exposures and thus take advantage of any natural offsets. Gains and losses related to the derivative instruments are expected to be offset largely by gains and losses on the original underlying asset or liability. We do not use derivative financial instruments for speculative purposes.
All of our designated derivatives were classified as cash flow hedges as of
July 2, 2016
and
December 31, 2015
. Designated derivatives meet hedge accounting criteria, which means the fair value of the hedge is recorded in shareholders’ equity as a component of OCI, net of tax. The deferred gains and losses are recognized in income in the period in which the hedged item affects earnings. Any ineffective portion of the change in fair value of the derivative is immediately recognized in earnings. All of our designated derivatives are assessed for hedge effectiveness quarterly.
We also have economic non-designated derivatives that do not meet hedge accounting criteria. These derivative instruments are adjusted to current market value at the end of each period through earnings. Gains or losses on these instruments are offset substantially by the remeasurement adjustment on the hedged item.
20
Perrigo Company plc
- Item 1
Note 8
Interest Rate Swaps and Treasury Locks
Interest rate swap agreements are contracts to exchange floating rate for fixed rate payments (or vice versa) over the life of the agreement without the exchange of the underlying notional amounts. The notional amounts of the interest rate swap agreements are used to measure interest to be paid or received and do not represent the amount of exposure to credit loss. The differential paid or received on the interest rate swap agreements is recognized as an adjustment to interest expense.
During the
six months ended
December 31, 2015
, we entered into a forward interest rate swap to hedge against changes in the benchmark interest rate between the date the interest rate swap was entered into and the date of expected future debt issuance. The interest rate swap was designated as a cash flow hedge and had a notional amount totaling
$200.0 million
. The interest rate swap was settled upon the issuance of an aggregate
$1.2 billion
principal amount of senior notes on March 7, 2016 for a cumulative after-tax
loss
of
$7.0 million
in OCI during the
six months ended
July 2, 2016
.
In connection with the Omega acquisition, we assumed a
$20.0 million
private placement note. We also assumed an interest rate swap agreement with a notional amount totaling
$20.0 million
that was in place to hedge the cross currency exchange differences between the U.S. dollar and the euro on the above-mentioned debt. On May 29, 2015, we repaid the loan and the interest rate swap. We also assumed
€500.0 million
(
$544.5 million
) of debt under Omega's revolving credit facility, as well as an interest rate swap agreement with a notional amount of
€135.0 million
(
$147.0 million
) that was in place to hedge the change in the floating rate on that credit facility. On April 8, 2015, we repaid the loan and terminated the interest rate swap. Because both interest rate swaps mentioned above were recorded at fair market value on the date of termination, no gain or loss was recorded. For more information on the acquired debt and termination, see
Note 10
.
During the
three months ended
June 27, 2015
, we repaid a
$300.0 million
term loan with floating interest rates priced off the LIBOR yield curve, see
Note 10
. As a result of the term loan repayment on June 25, 2015, the forward interest rate swap agreements with notional amounts totaling
$240.0 million
that were in place to hedge the change in the LIBOR rate were terminated as well. We recorded a loss of
$3.6 million
in Other expense, net, during the
three months ended
June 27, 2015
for the amount remaining in Accumulated Other Comprehensive Income ("AOCI") when the hedges were terminated.
Foreign Currency Derivatives
We enter into foreign currency forward contracts, both designated and non-designated, in order to manage the impact of foreign exchange fluctuations on expected future purchases and related payables denominated in a foreign currency, as well as to hedge the impact of foreign exchange fluctuations on expected future sales and related receivables denominated in a foreign currency. Both types of forward contracts have a maximum maturity date of
15
months. The total notional amount for these contracts was
$500.4 million
and
$755.5 million
as of
July 2, 2016
and
December 31, 2015
, respectively.
In order to economically hedge the foreign currency exposure associated with the planned payment of the euro-denominated purchase price of Omega, we entered into non-designated forward contracts that matured during the
three months ended
March 28, 2015. We recorded losses of
$259.8 million
during the
three months ended
March 28, 2015 related to the settlement of the forward contracts in Other expense, net. The losses on the derivatives due to changes in the euro-to-U.S. dollar exchange rates were economically offset at closing in the final settlement of the euro-denominated Omega purchase price. In June 2015, in order to economically hedge the foreign currency exposure associated with the planned payment of the euro-denominated GSK Products acquisition discussed in
Note 2
, we entered into a non-designated option contract to protect against a strengthening of the euro relative to the U.S. dollar. We recorded losses of
$1.9 million
for the change in fair value of the option contract during the three months ended June 27, 2015 in Other expense, net. Because these derivatives were economically hedging future acquisitions, the cash outflows associated with their settlement are shown as investing activity on the Consolidated Statements of Cash Flows.
21
Perrigo Company plc
- Item 1
Note 8
Effects of Derivatives on the Financial Statements
The below tables indicate the effects of all derivative instruments on the Condensed Consolidated Financial Statements. All amounts exclude income tax effects and are presented in millions.
The balance sheet location and gross fair value of our outstanding derivative instruments were as follows:
|
Asset Derivatives
|
|||||||||
|
Balance Sheet Location
|
Fair Value
|
||||||||
|
|
July 2,
2016 |
December 31, 2015
|
|||||||
|
Designated derivatives:
|
|||||||||
|
Foreign currency forward contracts
|
Other current assets
|
$
|
2.6
|
|
$
|
3.8
|
|
||
|
Total designated derivatives
|
$
|
2.6
|
|
$
|
3.8
|
|
|||
|
Non-designated derivatives:
|
|||||||||
|
Foreign currency forward contracts
|
Other current assets
|
$
|
1.7
|
|
$
|
1.0
|
|
||
|
Total non-designated derivatives
|
$
|
1.7
|
|
$
|
1.0
|
|
|||
|
Liability Derivatives
|
|||||||||
|
Balance Sheet Location
|
Fair Value
|
||||||||
|
|
July 2,
2016 |
December 31, 2015
|
|||||||
|
Designated derivatives:
|
|||||||||
|
Foreign currency forward contracts
|
Accrued liabilities
|
$
|
1.0
|
|
$
|
2.0
|
|
||
|
Interest rate swap agreements
|
Other non-current liabilities
|
—
|
|
0.3
|
|
||||
|
Total designated derivatives
|
$
|
1.0
|
|
$
|
2.3
|
|
|||
|
Non-designated derivatives:
|
|||||||||
|
Foreign currency forward contracts
|
Accrued liabilities
|
$
|
1.8
|
|
$
|
1.9
|
|
||
|
Total non-designated derivatives
|
$
|
1.8
|
|
$
|
1.9
|
|
|||
The gains (losses) recognized in OCI for the effective portion of our designated cash flow hedges were as follows:
|
Amount of Gain/(Loss) Recorded in OCI
(Effective Portion) |
||||||||||||||||
|
Three Months Ended
|
Six Months Ended
|
|||||||||||||||
|
Designated Cash Flow Hedges
|
July 2,
2016 |
June 27,
2015 |
July 2,
2016 |
June 27,
2015 |
||||||||||||
|
Interest rate swap agreements
|
$
|
—
|
|
$
|
(14.0
|
)
|
$
|
(9.0
|
)
|
$
|
(12.0
|
)
|
||||
|
Foreign currency forward contracts
|
(0.3
|
)
|
2.7
|
|
1.3
|
|
(1.1
|
)
|
||||||||
|
Total
|
$
|
(0.3
|
)
|
$
|
(11.3
|
)
|
$
|
(7.7
|
)
|
$
|
(13.1
|
)
|
||||
22
Perrigo Company plc
- Item 1
Note 8
The gains (losses) reclassified from AOCI into earnings for the effective portion of our designated cash flow hedges were as follows:
|
Amount of Gain/(Loss) Reclassified from AOCI to Income
(Effective Portion) |
||||||||||||||||||
|
Three Months Ended
|
Six Months Ended
|
|||||||||||||||||
|
Designated Cash Flow Hedges
|
Income Statement Location
|
July 2,
2016 |
June 27,
2015 |
July 2,
2016 |
June 27,
2015 |
|||||||||||||
|
Treasury locks
|
Interest expense, net
|
$
|
—
|
|
$
|
(0.1
|
)
|
$
|
—
|
|
$
|
(0.1
|
)
|
|||||
|
Interest rate swap agreements
|
Interest expense, net
|
(0.6
|
)
|
(19.1
|
)
|
(1.1
|
)
|
(18.2
|
)
|
|||||||||
|
Foreign currency forward contracts
|
Net sales
|
0.2
|
|
2.0
|
|
0.8
|
|
1.9
|
|
|||||||||
|
Cost of sales
|
0.6
|
|
(1.8
|
)
|
0.9
|
|
(4.6
|
)
|
||||||||||
|
Interest expense, net
|
(0.6
|
)
|
—
|
|
(0.9
|
)
|
—
|
|
||||||||||
|
Other expense, net
|
1.4
|
|
(0.2
|
)
|
1.5
|
|
(0.5
|
)
|
||||||||||
|
Total
|
$
|
1.0
|
|
$
|
(19.2
|
)
|
$
|
1.2
|
|
$
|
(21.5
|
)
|
||||||
The net of tax amount expected to be reclassified out of AOCI into earnings during the next 12 months is a
$1.0 million
loss
.
The gains (losses) recognized against earnings for the ineffective portion of our designated cash flow hedges were as follows:
|
Amount of Gain/(Loss) Recognized in Income
(Ineffective Portion) |
||||||||||||||||||
|
Three Months Ended
|
Six Months Ended
|
|||||||||||||||||
|
Designated Cash Flow Hedges
|
Income Statement
Location
|
July 2,
2016 |
June 27,
2015 |
July 2,
2016 |
June 27,
2015 |
|||||||||||||
|
Interest rate swap agreements
|
Other expense, net
|
$
|
—
|
|
$
|
—
|
|
$
|
(0.1
|
)
|
$
|
—
|
|
|||||
|
Foreign currency forward contracts
|
Net sales
|
(0.1
|
)
|
—
|
|
0.1
|
|
(0.3
|
)
|
|||||||||
|
Cost of sales
|
(0.1
|
)
|
0.1
|
|
—
|
|
0.1
|
|
||||||||||
|
Other expense, net
|
0.6
|
|
—
|
|
0.6
|
|
—
|
|
||||||||||
|
Total
|
$
|
0.4
|
|
$
|
0.1
|
|
$
|
0.6
|
|
$
|
(0.2
|
)
|
||||||
The effects of our non-designated derivatives on the Condensed Consolidated Statements of Operations were as follows:
|
Amount of Gain/(Loss) Recognized in Income
|
||||||||||||||||||
|
Three Months Ended
|
Six Months Ended
|
|||||||||||||||||
|
Non-Designated Derivatives
|
Income Statement Location
|
July 2,
2016 |
June 27,
2015 |
July 2,
2016 |
June 27,
2015 |
|||||||||||||
|
Foreign currency forward contracts
|
Other expense, net
|
$
|
(1.6
|
)
|
$
|
5.2
|
|
$
|
(8.5
|
)
|
$
|
(250.5
|
)
|
|||||
|
Interest expense, net
|
(0.6
|
)
|
(1.0
|
)
|
(0.5
|
)
|
(3.5
|
)
|
||||||||||
|
Total
|
$
|
(2.2
|
)
|
$
|
4.2
|
|
$
|
(9.0
|
)
|
$
|
(254.0
|
)
|
||||||
NOTE 9 –
ASSETS HELD FOR SALE
During the
six months ended
December 31, 2015
, management committed to a plan to sell our U.S. Vitamins, Minerals, and Supplements ("VMS") and India Active Pharmaceutical Ingredients ("API") businesses. The VMS business is reported in our CHC segment and the API business is reported in our Other segment. When a group of assets is classified as held for sale, the book value is evaluated and adjusted to the lower of its carrying amount or fair value less cost to sell. At December 31, 2015, we determined that the carrying value of the India API business exceeded its fair value less cost to sell, resulting in an impairment charge of
$29.0 million
. During the
three months ended
July 2, 2016
, we recorded an additional impairment charge to the India API business of
23
Perrigo Company plc
- Item 1
Note 9
$4.3 million
. In addition, during the
three months ended
July 2, 2016
, we determined that the carrying value of the U.S. VMS business exceeded its fair value less cost to sell, resulting in an impairment charge of
$6.2 million
.
Assets and liabilities associated with the U.S. VMS and India API held for sale businesses were classified as held for sale at
July 2, 2016
and
December 31, 2015
. The assets held for sale were reported within
Prepaid expenses and other current assets
and liabilities held for sale were reported in
Accrued liabilities
. The amounts consisted of the following (in millions):
|
July 2,
2016 |
December 31,
2015 |
||||||||||||||
|
CHC
|
Other
|
CHC
|
Other
|
||||||||||||
|
Assets held for sale
|
|||||||||||||||
|
Current assets
|
$
|
59.4
|
|
$
|
6.8
|
|
$
|
55.1
|
|
$
|
13.6
|
|
|||
|
Goodwill
|
8.5
|
|
7.3
|
|
13.0
|
|
14.5
|
|
|||||||
|
Property, plant and equipment
|
18.9
|
|
34.0
|
|
18.8
|
|
37.4
|
|
|||||||
|
Other assets
|
0.9
|
|
3.2
|
|
—
|
|
3.2
|
|
|||||||
|
Less: impairment reserves
|
(6.2
|
)
|
(32.5
|
)
|
—
|
|
(29.0
|
)
|
|||||||
|
Total assets held for sale
|
$
|
81.5
|
|
$
|
18.8
|
|
$
|
86.9
|
|
$
|
39.7
|
|
|||
|
Liabilities held for sale
|
|||||||||||||||
|
Current liabilities
|
$
|
27.0
|
|
$
|
1.1
|
|
$
|
30.5
|
|
$
|
0.5
|
|
|||
|
Other liabilities
|
—
|
|
2.1
|
|
—
|
|
1.7
|
|
|||||||
|
Total liabilities held for sale
|
$
|
27.0
|
|
$
|
3.2
|
|
$
|
30.5
|
|
$
|
2.2
|
|
|||
24
Perrigo Company plc
- Item 1
Note 10
NOTE 10 –
INDEBTEDNESS
Total borrowings outstanding are summarized as follows (in millions):
|
July 2,
2016 |
December 31,
2015 |
||||||||||
|
Revolving credit agreements
|
|||||||||||
|
2015 Revolver
|
$
|
—
|
|
$
|
380.0
|
|
|||||
|
2014 Revolver
|
—
|
|
300.0
|
|
|||||||
|
Total revolving credit agreements
|
—
|
|
680.0
|
|
|||||||
|
Term loans
|
|||||||||||
|
*
|
2014 Term loan due December 5, 2019
|
473.3
|
|
488.8
|
|
||||||
|
Notes and Bonds
|
|||||||||||
|
Coupon
|
Due
|
||||||||||
|
1.300%
|
November 8, 2016
|
(2)
|
500.0
|
|
500.0
|
|
|||||
|
*
|
4.500%
|
May 23, 2017
|
(3)
|
200.5
|
|
195.5
|
|
||||
|
*
|
5.125%
|
December 12, 2017
|
(3)
|
334.1
|
|
325.8
|
|
||||
|
2.300%
|
November 8, 2018
|
(2)
|
600.0
|
|
600.0
|
|
|||||
|
*
|
5.000%
|
May 23, 2019
|
(3)
|
133.6
|
|
130.3
|
|
||||
|
3.500%
|
March 15, 2021
|
(4)
|
500.0
|
|
—
|
|
|||||
|
3.500%
|
December 15, 2021
|
(1)
|
500.0
|
|
500.0
|
|
|||||
|
*
|
5.105%
|
July 19, 2023
|
(3)
|
150.4
|
|
146.7
|
|
||||
|
4.000%
|
November 15, 2023
|
(2)
|
800.0
|
|
800.0
|
|
|||||
|
3.900%
|
December 15, 2024
|
(1)
|
700.0
|
|
700.0
|
|
|||||
|
4.375%
|
March 15, 2026
|
(4)
|
700.0
|
|
—
|
|
|||||
|
5.300%
|
November 15, 2043
|
(2)
|
400.0
|
|
400.0
|
|
|||||
|
4.900%
|
December 15, 2044
|
(1)
|
400.0
|
|
400.0
|
|
|||||
|
Total notes and bonds
|
5,918.6
|
|
4,698.3
|
|
|||||||
|
Other financing
|
4.6
|
|
86.0
|
|
|||||||
|
Unamortized premium (discount), net
|
49.5
|
|
73.4
|
|
|||||||
|
Deferred financing fees
|
(35.4
|
)
|
(36.6
|
)
|
|||||||
|
Total borrowings outstanding
|
6,410.6
|
|
5,989.9
|
|
|||||||
|
Current indebtedness
|
(758.1
|
)
|
(1,018.3
|
)
|
|||||||
|
Total long-term debt less current portion
|
$
|
5,652.5
|
|
$
|
4,971.6
|
|
|||||
|
(1)
|
Discussed below collectively as the "2014 Notes."
|
|
(2)
|
Discussed below collectively as the "2013 Notes."
|
|
(3)
|
Debt assumed from Omega.
|
|
(4)
|
Discussed below collectively as the "2016 Notes."
|
|
*
|
Debt denominated in euros subject to fluctuations in the euro-to-U.S. dollar exchange rate.
|
We were in compliance with all covenants under our debt agreements as of
July 2, 2016
.
Revolving Credit Agreements
On
December 9, 2015
, our 100% owned finance subsidiary, Perrigo Finance Unlimited Company (formerly Perrigo Finance plc) ("Perrigo Finance"), entered into a
$750.0 million
revolving credit agreement (the "2015 Revolver"). On March 15, 2016, we used the proceeds of the long-term debt issuance described below under "2016 Notes" to repay the
$750.0 million
then outstanding under the 2015 Revolver and terminated the facility.
On
March 30, 2015
, we assumed a revolving credit facility with
€500.0 million
(
$544.5 million
) outstanding from Omega. On
April 8, 2015
, the
€500.0 million
(
$539.1 million
) outstanding under the assumed revolving credit facility was repaid and the facility was terminated.
25
Perrigo Company plc
- Item 1
Note 10
On
December 5, 2014
, Perrigo Finance entered into a
$600.0 million
revolving credit agreement, which we increased to
$1.0 billion
on March 30, 2015 (the "2014 Revolver"). On March 15, 2016, we used the proceeds of the long-term debt issuance described below under "2016 Notes" to repay the
$435.0 million
then outstanding under the 2014 Revolver. There were no borrowings outstanding under the 2014 Revolver as of
July 2, 2016
.
Term Loans
On
December 5, 2014
, Perrigo Finance entered into a term loan agreement consisting of a
€500.0 million
(
$614.3 million
) tranche, with the ability to draw an additional
€300.0 million
(
$368.6 million
) tranche, maturing December 5, 2019, and we entered into a
$300.0 million
term loan tranche maturing December 18, 2015, which we repaid in full on June 25, 2015. During the
six months ended
July 2, 2016
, we made
$27.9 million
in scheduled principal payments on the euro-denominated term loan.
Notes and Bonds
2016 Notes
On
March 7, 2016
, Perrigo Finance issued
$500.0 million
in aggregate principal amount of
3.500%
senior notes due 2021 and
$700.0 million
in aggregate principal amount of
4.375%
senior notes due 2026 (together, the "2016 Notes") and received net proceeds of
$1.2 billion
after fees and market discount. Interest on the 2016 Notes is payable semiannually in arrears in March and September of each year, beginning in September 2016. The 2016 Notes are governed by a base indenture and a second supplemental indenture (collectively, the "2016 Indenture"). The 2016 Notes are fully and unconditionally guaranteed on a senior basis by Perrigo, and no other subsidiary of Perrigo guarantees the 2016 Notes. The proceeds were used to repay amounts borrowed under the 2015 Revolver and the 2014 Revolver, as mentioned above. There are no restrictions under the 2016 Notes on our ability to obtain funds from our subsidiaries. Perrigo Finance may redeem the 2016 Notes in whole or in part at any time for cash at the make-whole redemption prices described in the 2016 Indenture.
Notes and Bonds Assumed from Omega
In connection with the Omega acquisition, on
March 30, 2015
, we assumed:
|
•
|
$20.0 million
in aggregate principal amount of
6.19%
senior notes due
2016
, which was repaid on May 29, 2015 in full;
|
|
•
|
€135.0 million
(
$147.0 million
) in aggregate principal amount of
5.1045%
senior notes due
2023
(the "2023 Notes");
|
|
•
|
€300.0 million
(
$326.7 million
) in aggregate principal amount of
5.125%
retail bonds due
2017
;
€180.0 million
(
$196.0 million
) in aggregate principal amount of
4.500%
retail bonds due
2017
; and
€120.0 million
(
$130.7 million
) in aggregate principal amount of
5.000%
retail bonds due
2019
(collectively, the "Retail Bonds").
|
The fair value of the 2023 Notes and Retail Bonds
exceeded par value by
€93.6 million
(
$101.9 million
) on the date of the Omega acquisition. As a result, a fair value adjustment was recorded as part of the carrying value of the underlying debt and will be amortized as a reduction of interest expense over the remaining terms of the respective debt instruments. The adjustment does not affect cash interest payments.
2014 Notes
On
December 2, 2014
, Perrigo Finance issued
$500.0 million
in aggregate principal amount of
3.500%
senior notes due
2021
(the "2021 Notes”),
$700.0 million
in aggregate principal amount of
3.900%
senior notes due
2024
(the “2024 Notes”), and
$400.0 million
in aggregate principal amount of
4.900%
senior notes due
2044
(the “2044 Notes” and, together with the 2021 Notes and the 2024 Notes, the “2014 Notes”) and received net proceeds of
$1.6 billion
after fees and market discount. Interest on the 2014 Notes is payable semiannually in arrears in June and December of each year, beginning in June 2015. The 2014 Notes are governed by a base indenture and a first supplemental indenture (collectively, the "2014 Indenture"). The 2014 Notes are fully and unconditionally guaranteed on a senior unsecured basis by Perrigo, and no other subsidiary of Perrigo guarantees the 2014 Notes.
26
Perrigo Company plc
- Item 1
Note 10
There are no restrictions under the 2014 Notes on our ability to obtain funds from our subsidiaries. Perrigo Finance may redeem the 2014 Notes in whole or in part at any time for cash at the make-whole redemption prices described in the 2014 Indenture.
2013 Notes
On November 8, 2013, Perrigo Company issued
$500.0 million
aggregate principal amount of its 1.300% senior notes due 2016 (the "1.300% 2016 Notes"),
$600.0 million
aggregate principal amount of its 2.300% senior notes due 2018 (the "2018 Notes"),
$800.0 million
aggregate principal amount of its 4.000% senior notes due 2023 (the "4.000% 2023 Notes") and
$400.0 million
aggregate principal amount of its 5.300% senior notes due 2043 (the "2043 Notes" and, together with the 1.300% 2016 Notes, the 2018 Notes and the 4.000% 2023 Notes, the "2013 Notes") in a private placement with registration rights. We received net proceeds of
$2.3 billion
from the issuance of the 2013 Notes after fees and market discount. We plan to prepay the 1.300% 2016 Notes in September 2016. See
Part II, Item 5
.
Interest on the 2013 Notes is payable semiannually in arrears in May and November of each year, beginning in May 2014. The 2013 Notes are governed by a base indenture and a first supplemental indenture (collectively, the "2013 Indenture"). The 2013 Notes are our unsecured and unsubordinated obligations, ranking equally in right of payment to all of our existing and future unsecured and unsubordinated indebtedness. The 2013 Notes are not entitled to mandatory redemption or sinking fund payments. We may redeem the 2013 Notes in whole or in part at any time for cash at the make-whole redemption prices described in the 2013 Indenture. The 2013 Notes were guaranteed on an unsubordinated, unsecured basis by the same entities that guaranteed our then-outstanding credit agreement until November 21, 2014, at which time the 2013 Indenture was amended to remove all guarantors.
Other Financing
Overdraft Facilities
On
March 30, 2015
, we assumed and repaid certain overdraft facilities totaling
€51.4 million
(
$56.0 million
) with the Omega acquisition. Our BCH segment uses overdraft facilities to increase the efficiency of its cash utilization and meet its short-term liquidity needs. We repaid the balance outstanding under these overdraft facilities during the three months ended July 2, 2016, but retain the ability to use these facilities in our day-to-day cash operations. The balance outstanding under the facilities was
$82.9 million
at
December 31, 2015
and is shown in the above table under "Other Financing".
27
Perrigo Company plc
- Item 1
Note 11
NOTE 11 –
EARNINGS PER SHARE AND SHAREHOLDERS' EQUITY
Earnings per Share
A reconciliation of the numerators and denominators used in the basic and diluted earnings per share ("EPS") calculation is as follows (in millions):
|
|
Three Months Ended
|
Six Months Ended
|
|||||||||||||
|
|
July 2,
2016 |
June 27,
2015 |
July 2,
2016 |
June 27,
2015 |
|||||||||||
|
Numerator:
|
|||||||||||||||
|
Net income (loss)
|
$
|
194.3
|
|
$
|
56.4
|
|
$
|
(140.3
|
)
|
$
|
(38.4
|
)
|
|||
|
Denominator:
|
|||||||||||||||
|
Weighted average shares outstanding for basic EPS
|
143.2
|
|
146.3
|
|
143.2
|
|
143.5
|
|
|||||||
|
Dilutive effect of share-based awards*
|
0.4
|
|
0.5
|
|
—
|
|
—
|
|
|||||||
|
Weighted average shares outstanding for diluted EPS
|
143.6
|
|
146.8
|
|
143.2
|
|
143.5
|
|
|||||||
|
Anti-dilutive share-based awards excluded from computation of diluted EPS*
|
1.0
|
|
—
|
|
—
|
|
—
|
|
|||||||
* In the period of a net loss, diluted shares equal basic shares.
Shareholders' Equity
Shares
We issued
19,000
and
57,000
shares related to the exercise and vesting of share-based compensation during the
three months ended
July 2, 2016
and
June 27, 2015
, respectively. We issued
98,000
and
92,000
shares related to the exercise and vesting of share-based compensation during the
six months ended
July 2, 2016
and
June 27, 2015
, respectively.
Share Repurchases
In October 2015, the Board of Directors approved a share repurchase plan of up to
$2.0 billion
, of which
$1.5 billion
is still available to be repurchased through December 31, 2018. We did not repurchase any shares under the share repurchase plan during the
six months ended
July 2, 2016
.
NOTE 12 –
ACCUMULATED OTHER COMPREHENSIVE INCOME (LOSS)
Changes in our AOCI balances, net of tax were as follows (in millions):
|
Foreign currency translation adjustments
|
Fair value of derivative financial instruments, net of tax
|
Fair value of investment securities, net of tax
|
Post-retirement and pension liability adjustments, net of tax
|
Total AOCI
|
|||||||||||||||
|
Balance at December 31, 2015
|
$
|
(4.4
|
)
|
$
|
(14.2
|
)
|
$
|
6.3
|
|
$
|
(3.2
|
)
|
$
|
(15.5
|
)
|
||||
|
OCI before reclassifications
|
44.8
|
|
(5.6
|
)
|
7.2
|
|
0.5
|
|
46.9
|
|
|||||||||
|
Amounts reclassified from AOCI
|
—
|
|
(1.4
|
)
|
1.3
|
|
—
|
|
(0.1
|
)
|
|||||||||
|
Other comprehensive income (loss)
|
44.8
|
|
(7.0
|
)
|
8.5
|
|
0.5
|
|
46.8
|
|
|||||||||
|
Balance at July 2, 2016
|
$
|
40.4
|
|
$
|
(21.2
|
)
|
$
|
14.8
|
|
$
|
(2.7
|
)
|
$
|
31.3
|
|
||||
28
Perrigo Company plc
- Item 1
Note 13
NOTE 13 –
INCOME TAXES
The effective tax rate for the
three months ended
July 2, 2016
was a benefit of
28.2%
on income compared to
64.1%
for the
three months ended
June 27, 2015
. The effective tax rate for the
six months ended
July 2, 2016
was a benefit of
32.4%
on a net loss reported in the period compared to
170.2%
on income for the six months ended June 27, 2015. Income taxes recorded through July 2, 2016 were estimated using the discrete method. Due to sensitivity to small changes to forecasted annual pre-tax earnings, which created results with significant variations in the customary relationship between income tax expense and pre-tax income for the interim periods, we determined that using the discrete method is more appropriate than using the annual effective tax rate method.
Our tax rate is subject to adjustment over the balance of the prior fiscal year ended due to, among other things: income tax rate changes by governments; the jurisdictions in which our profits are determined to be earned and taxed; changes in the valuation of our deferred tax assets and liabilities; adjustments to estimated taxes upon finalization of various tax returns; adjustments to our interpretation of transfer pricing standards; changes in available tax credits, grants and other incentives; changes in stock-based compensation expense; changes in tax laws or the interpretation of such tax laws (for example, proposals for fundamental U.S. international tax reform); changes in U.S. GAAP; expiration of or the inability to renew tax rulings or tax holiday incentives; and the repatriation of earnings with respect to which we have not previously provided for taxes.
Israel passed legislation in January 2016, effective immediately, reducing the tax rate from
26.5%
to
25%
. The impact on our effective tax rate was minimal.
The total liability for uncertain tax positions was
$353.4 million
and
$334.7 million
as of
July 2, 2016
and
December 31, 2015
, respectively, before considering the federal tax benefit of certain state and local items.
We recognize interest and penalties related to uncertain tax positions as a component of income tax expense. The total amount accrued for interest and penalties in the liability for uncertain tax positions was
$55.3 million
and
$52.1 million
as of
July 2, 2016
and
December 31, 2015
, respectively.
We file income tax returns in numerous jurisdictions and are therefore subject to audits by tax authorities. Our primary income tax jurisdictions are Ireland, the U.S., Israel, Belgium, France, and the U.K.
Although we believe that the tax estimates are reasonable and that we prepare our tax filings in accordance with all applicable tax laws, the final determination with respect to any tax audit and any related litigation could be materially different from estimates or from historical income tax provisions and accruals. The results of an audit or litigation could have a material effect on our operating results and/or cash flows in the periods for which that determination is made. In addition, future period earnings may be adversely impacted by litigation costs, settlements, penalties, and/or interest assessments.
The IRS audit of our fiscal years ended June 27, 2009 and June 26, 2010 had previously concluded with the issuance of a statutory notice of deficiency on August 27, 2014. While we had previously agreed on certain adjustments and made associated payments of
$8.0 million
, inclusive of interest in November 2014, the statutory notice of deficiency asserted various additional positions, including transfer pricing, relative to the same audit of fiscal years ended June 27, 2009 and June 26, 2010. The statutory notice asserted an incremental tax obligation of approximately
$68.9 million
, inclusive of interest and penalties. We disagree with the IRS’s positions asserted in the notice of deficiency. In January 2015, we paid this amount, a prerequisite to being able to contest the IRS’s positions in U.S. Federal court, and in June 2015, we filed a request for a refund. The IRS denied our request for a refund. We anticipate filing a complaint in federal district court claiming a refund for these amounts in the first quarter of 2017. The payment was recorded during the three months ended March 28, 2015 as a deferred charge on the balance sheet given our anticipated action to recover this amount. An unfavorable resolution of this matter could have a material impact on our consolidated financial statements in future periods.
We have ongoing audits in multiple jurisdictions for which tax returns are not yet settled. These jurisdictions include, but are not limited to, the United States and Belgium. The IRS is auditing our fiscal years ended June 25, 2011 and June 30, 2012, and may make adjustments consistent with their claims for the 2009 - 2010 audit period. In February 2016, the Belgium Tax Authority notified us that all Belgium locations will be audited for the years ended
29
Perrigo Company plc
- Item 1
Note 13
December 31, 2013 and December 31, 2014. At this time, we cannot predict the outcome of any audit or related litigation.
NOTE 14 –
COMMITMENTS AND CONTINGENCIES
In view of the inherent difficulties of predicting the outcome of various types of legal proceedings, we cannot determine the ultimate resolution of the matters described below. We establish reserves for litigation and regulatory matters when losses associated with the claims become probable and the amounts can be reasonably estimated. The actual costs of resolving legal matters may be substantially higher or lower than the amounts reserved for those matters. For matters where the likelihood or extent of a loss is not probable or cannot be reasonably be estimated as of
July 2, 2016
, we have not recorded a loss reserve. If certain of these matters are determined against us, it could have a material adverse effect on our financial condition, results of operations, or cash flows. We currently believe we have valid defenses to the claims in these lawsuits and intend to defend these lawsuits vigorously regardless of whether or not we have a loss reserve. Other than what is disclosed below, we do not expect the outcome of the litigation matters to which we are currently subject to, individually or in the aggregate, have a material adverse effect on our financial condition, results of operations, or cash flows.
Securities Litigation
On May 18, 2016, a shareholder filed a securities case against the Company and our former CEO, Joseph Papa, in the District of New Jersey (
Roofers’ Pension Fund v. Papa, et al.)
. The plaintiff purports to represent a class of shareholders for the period from April 21, 2015 through May 11, 2016, inclusive. The complaint alleges violations of Securities Exchange Act sections 10(b) (and Rule 10b‑5) and 14(e) against both defendants and 20(a) control person liability against Mr. Papa. In general, the allegations concern the actions taken by us and the former executive to defend against the hostile takeover bid by Mylan in the period from April 21, 2015 through November 13, 2015. The plaintiff also alleges that we provided inadequate disclosure concerning alleged integration problems related to the Omega acquisition in the period from April 21, 2015 through May 11, 2016. The case is in an early stage. Four different plaintiff groups have sought appointment as lead plaintiff/lead counsel. The court will decide in the near term who will represent the purported class. Once the court has chosen a lead plaintiff, the plaintiff will likely file an amended complaint and the defendants will then have an opportunity to make a motion to dismiss the case.
A substantially similar case making virtually the same allegations for the same class period against the same defendants was filed in the Southern District of New York on June 21, 2016 (
AMI - Gov’t Employees Provident Fund Mgmt Co. v. Papa, et al.)
. The plaintiff in the
AMI
case voluntarily dismissed its action on July 12, 2016.
On May 22, 2016, shareholders filed a securities class action against us and five individual defendants Mr. Papa, our former Executive Vice President and General Manager of the BCH segment Marc Coucke, our Chief Executive Officer John Hendrickson and our Board members Gary Kunkle, Jr. and Laurie Brlas alleging violations of Israeli law in the District Court of Tel Aviv-Jaffa (
Schwieger et al. v. Perrigo Company plc, et al.).
On June 15, 2016, Perrigo filed a motion to stay the case pending the outcome of the securities class action pending in the New Jersey federal court. The plaintiffs did not oppose the motion. The Israeli court granted the motion on the same day, and the action is stayed.
Eltroxin
During October and November 2011, nine applications to certify a class action lawsuit were filed in various courts in Israel related to Eltroxin, a prescription thyroid medication manufactured by a third party and distributed in Israel by our subsidiary, Perrigo Israel Agencies Ltd. The respondents included our subsidiaries, Perrigo Israel Pharmaceuticals Ltd. and/or Perrigo Israel Agencies Ltd., the manufacturers of the product, and various healthcare providers who provide healthcare services as part of the compulsory healthcare system in Israel.
One of the applications was dismissed and the remaining eight applications were consolidated into one application. The applications arose from the 2011 launch of a reformulated version of Eltroxin in Israel. The consolidated application generally alleges that the respondents: (a) failed to timely inform patients, pharmacists and physicians about the change in the formulation; and (b) failed to inform physicians about the need to monitor patients taking the new formulation in order to confirm patients were receiving the appropriate dose of the drug. As
30
Perrigo Company plc
- Item 1
Note 14
a result, claimants allege they incurred the following damages: (a) purchases of product that otherwise would not have been made by patients had they been aware of the reformulation; (b) adverse events to some patients resulting from an imbalance of thyroid functions that could have been avoided; and (c) harm resulting from the patients' lack of informed consent prior to the use of the reformulation.
Several hearings on whether or not to certify the consolidated application took place in December 2013 and January 2014. On May 17, 2015, the District Court certified the motion against Perrigo Israel Agencies Ltd. and dismissed it against the remaining respondents, including Perrigo Israel Pharmaceuticals Ltd.
On June 16, 2015, Perrigo submitted a motion for permission to appeal the decision to certify to the Israeli Supreme Court together with a motion to stay the proceedings of the class action until the motion for permission to appeal is adjudicated. Perrigo has filed its statement of defense to the underlying proceedings and the underlying proceedings have been stayed pending a decision on the motion to appeal. The hearing on Perrigo’s motion to appeal the decision to certify the class action was held on July 11, 2016. At this stage, we cannot reasonably predict the outcome or the liability, if any, associated with this claim.
Tysabri
®
Product Liability Lawsuits
Perrigo and collaborator Biogen are co-defendants in product liability lawsuits arising out of the occurrence of Progressive Multifocal Leukoencephalopathy, a serious brain infection, and serious adverse events, including deaths, which occurred in patients taking Tysabri
®
. Perrigo and Biogen will each be responsible for 50% of losses and expenses arising out of any Tysabri
®
product liability claims. While these lawsuits will be vigorously defended, management cannot predict how these cases will be resolved. Adverse results in one or more of these lawsuits could result in substantial judgments against us.
NOTE 15 –
COLLABORATION AGREEMENTS AND OTHER CONTRACTUAL ARRANGEMENTS
In May 2015, we entered into a development agreement wherein we transferred the ownership rights to two pharmaceutical products to a clinical stage development company to fund and conduct development activities for the products. We do not expect to incur any expense related to the development of either product. If the products are approved by the FDA, we will execute a buy-back agreement to purchase each product for a multiple of the development costs incurred. Based on the initial development budget for each product, the estimated purchase price for both products is approximately
$78.0 million
. If development costs exceed the initial budgeted amounts, the purchase price will increase but will not exceed approximately
$105.0 million
. If the products are approved by the FDA and we purchase the products, we estimate the acquisitions will occur in 2019 and 2020.
In June 2016, we added an additional product to the May 2015 development agreement that is subject to similar buy-back terms if the product is approved by the FDA. The estimated purchase price for this additional product, based on the initial development budget, is approximately
$42.0 million
. If development costs exceed the initial budgeted amounts, the purchase price will increase, but will not exceed approximately
$57.0 million
. If the product is approved by the FDA and we purchase the product, we estimate the acquisition will occur in 2020. There can be no assurance that any such products will be approved by the FDA on the anticipated schedule or at all.
31
Perrigo Company plc
- Item 1
Note 16
NOTE 16 –
RESTRUCTURING CHARGES
We periodically take action to reduce redundant expenses and improve operating efficiencies, typically in connection with business acquisitions. The following reflects our restructuring activity (in millions):
|
Three Months Ended
|
Six Months Ended
|
||||||||||||||
|
July 2,
2016 |
June 27,
2015 |
July 2,
2016 |
June 27,
2015 |
||||||||||||
|
Beginning balance
|
$
|
13.0
|
|
$
|
3.6
|
|
$
|
20.7
|
|
$
|
3.2
|
|
|||
|
Additional charges
|
5.8
|
|
(0.1
|
)
|
11.3
|
|
1.0
|
|
|||||||
|
Payments
|
(6.6
|
)
|
(1.9
|
)
|
(24.8
|
)
|
(2.6
|
)
|
|||||||
|
Non-cash adjustments
|
—
|
|
—
|
|
5.0
|
|
—
|
|
|||||||
|
Ending balance
|
$
|
12.2
|
|
$
|
1.6
|
|
$
|
12.2
|
|
$
|
1.6
|
|
|||
Restructuring activity includes severance, lease exit costs, and asset impairments. The charges incurred during the
three and six months ended
July 2, 2016
were primarily associated with actions we took to streamline our organization as announced on October 22, 2015 and did not materially impact any one reportable segment. There were no other material restructuring programs in any of the periods presented. All charges are recorded in Restructuring expense. The remaining
$7.0 million
liability for employee severance benefits will be paid within the next year, while cash expenditures related to the remaining
$5.2 million
liability for lease exit costs will be incurred over the remaining terms of the applicable leases.
NOTE 17 –
SEGMENT INFORMATION
Our reporting segments are as follows:
|
•
|
CHC
is focused primarily on the global sale of OTC store brand products including cough, cold, allergy and sinus, analgesic, gastrointestinal, smoking cessation, infant formula and food, VMS, animal health, and diagnostic products.
|
|
•
|
BCH
develops, manufactures, markets and distributes many well-known European OTC brands in the natural health and vitamins, cough, cold and allergy, smoking cessation, personal care and derma-therapeutics, lifestyle, and anti-parasite categories.
|
|
•
|
Rx
develops, manufactures and markets a portfolio of generic and specialty pharmaceutical prescription drugs primarily for the U.S. and U.K. markets.
|
|
•
|
Specialty Sciences
is comprised primarily of royalties received from assets focused on the management of multiple sclerosis (Tysabri
®
).
|
We also have an
Other
reporting segment that consists of our API business, which does not meet the quantitative threshold required to be a separately reportable segment. Our segments reflect the way in which our chief operating decision maker reviews our operating results and allocates resources.
32
Perrigo Company plc
- Item 1
Note 17
The below tables show select financial measures by reporting segment (in millions):
|
Total Assets
|
July 2,
2016 |
December 31, 2015
|
||||||
|
CHC
|
$
|
4,021.9
|
|
$
|
4,007.8
|
|
||
|
BCH
|
6,211.2
|
|
6,324.0
|
|
||||
|
Rx
|
3,340.1
|
|
3,015.5
|
|
||||
|
Specialty Sciences
|
5,758.4
|
|
5,833.5
|
|
||||
|
Other
|
202.0
|
|
213.1
|
|
||||
|
Total
|
$
|
19,533.6
|
|
$
|
19,393.9
|
|
||
|
Three Months Ended
|
|||||||||||||||||||||||
|
July 2, 2016
|
June 27, 2015
|
||||||||||||||||||||||
|
Net Sales
|
Operating Income (Loss)
|
Intangible Asset Amortization
|
Net Sales
|
Operating Income (Loss)
|
Intangible Asset Amortization
|
||||||||||||||||||
|
CHC
|
$
|
686.3
|
|
$
|
111.2
|
|
$
|
19.0
|
|
$
|
746.4
|
|
$
|
143.3
|
|
$
|
16.6
|
|
|||||
|
BCH
|
393.7
|
|
38.4
|
|
39.5
|
|
401.2
|
|
26.6
|
|
34.2
|
|
|||||||||||
|
Rx
|
293.3
|
|
96.8
|
|
29.9
|
|
278.3
|
|
99.5
|
|
18.5
|
|
|||||||||||
|
Specialty Sciences
|
89.9
|
|
13.3
|
|
72.8
|
|
83.6
|
|
6.4
|
|
72.8
|
|
|||||||||||
|
Other
|
17.8
|
|
(1.3
|
)
|
0.5
|
|
22.1
|
|
1.9
|
|
0.5
|
|
|||||||||||
|
Unallocated
|
—
|
|
(20.1
|
)
|
—
|
|
—
|
|
(50.8
|
)
|
—
|
|
|||||||||||
|
Total
|
$
|
1,481.0
|
|
$
|
238.3
|
|
$
|
161.7
|
|
$
|
1,531.6
|
|
$
|
226.9
|
|
$
|
142.6
|
|
|||||
|
Six Months Ended
|
|||||||||||||||||||||||
|
July 2, 2016
|
June 27, 2015
|
||||||||||||||||||||||
|
Net Sales
|
Operating Income (Loss)
|
Intangible Asset Amortization
|
Net Sales
|
Operating Income (Loss)
|
Intangible Asset Amortization
|
||||||||||||||||||
|
CHC
|
$
|
1,386.6
|
|
$
|
213.6
|
|
$
|
38.8
|
|
$
|
1,431.3
|
|
$
|
247.6
|
|
$
|
32.8
|
|
|||||
|
BCH*
|
711.3
|
|
(444.3
|
)
|
74.9
|
|
401.2
|
|
26.6
|
|
34.2
|
|
|||||||||||
|
Rx
|
550.0
|
|
184.2
|
|
59.4
|
|
529.9
|
|
199.5
|
|
36.9
|
|
|||||||||||
|
Specialty Sciences
|
177.9
|
|
26.3
|
|
145.6
|
|
165.5
|
|
11.9
|
|
145.6
|
|
|||||||||||
|
Other
|
38.4
|
|
4.1
|
|
1.0
|
|
52.9
|
|
12.4
|
|
0.9
|
|
|||||||||||
|
Unallocated
|
—
|
|
(49.4
|
)
|
—
|
|
—
|
|
(71.8
|
)
|
—
|
|
|||||||||||
|
Total*
|
$
|
2,864.2
|
|
$
|
(65.5
|
)
|
$
|
319.7
|
|
$
|
2,580.8
|
|
$
|
426.2
|
|
$
|
250.4
|
|
|||||
|
*
|
The BCH segment was created on March 30, 2015 as a result of the Omega acquisition, thus data for the six months ended June 27, 2015 includes only three months of results from operations attributable to Omega.
|
On
August 5, 2016
we closed the sale of our U.S. VMS business to International Vitamins Corporation for
$58.6 million
in cash inclusive of an estimated working capital adjustment. During the three months ended July 2, 2016 we recorded an impairment of
$6.2 million
to bring the carrying value of the assets held for sale in line with the expected sales price. See
Note 9
for more information.
33
Perrigo Company plc
- Item 2
Executive Overview
ITEM 2.
MANAGEMENT'S DISCUSSION AND ANALYSIS OF FINANCIAL CONDITION AND RESULTS OF OPERATIONS
EXECUTIVE OVERVIEW
This Management’s Discussion and Analysis of Financial Condition and Results of Operations should be read in conjunction with the financial statements included in this Form 10-Q and our Form 10-KT for the transition period from June 28, 2015 to December 31, 2015. These historical financial statements may not be indicative of our future performance. This discussion contains a number of forward-looking statements, all of which are based on our current expectations and could be affected by the uncertainties and risks referred to under “Risk Factors” in Item 1A of our Form 10-KT for the transition period from June 28, 2015 to December 31, 2015 and Part II, Item 1A of our Form 10-Q for the three months ended April 2, 2016 and this Form 10-Q.
Perrigo Company plc was incorporated under the laws of Ireland on June 28, 2013 and became the successor registrant of Perrigo Company, a Michigan corporation, on December 18, 2013 in connection with the acquisition of Elan Corporation, plc ("Elan"). Unless the context requires otherwise, the terms "Perrigo," the "Company," "we," "our," "us," and similar pronouns used herein refer to Perrigo Company plc, its subsidiaries, and all predecessors of Perrigo Company plc and its subsidiaries.
We are a leading global over-the-counter ("OTC") consumer goods and specialty pharmaceutical company, offering patients and customers high quality products at affordable prices. From our beginning in 1887 as a packager of home remedies, we have grown to become the world's largest manufacturer of OTC healthcare products and supplier of infant formulas for the store brand market. We are also a leading provider of generic extended topical prescription products, and we receive royalties from sales of the multiple sclerosis drug Tysabri.
®
We provide “Quality Affordable Healthcare Products
®
” across a wide variety of product categories and geographies, primarily in North America, Europe, and Australia, as well as in other markets, including Israel, China, and Latin America.
Our reporting segments are as follows:
|
•
|
Consumer Healthcare
(
"CHC"
) is focused primarily on the global sale of OTC store brand products including cough, cold, allergy and sinus, analgesic, gastrointestinal, smoking cessation, infant formula and food, Vitamins, Minerals and Supplements ("VMS"), animal health, and diagnostic products.
|
|
•
|
Branded Consumer Healthcare
(
"BCH"
) develops, manufactures, markets and distributes many well-known European OTC brands in the natural health and vitamins, cough, cold and allergy, smoking cessation, personal care and derma-therapeutics, lifestyle, and anti-parasite categories.
|
|
•
|
Prescription Pharmaceuticals
(
"Rx"
) develops, manufactures and markets a portfolio of generic and specialty pharmaceutical prescription drugs primarily for the U.S. and U.K. markets.
|
|
•
|
Specialty Sciences
is comprised primarily of royalties received from assets focused on the management of multiple sclerosis (Tysabri
®
).
|
We also have an "Other" segment comprised of our active pharmaceutical ingredients ("API") business, which develops, manufactures, and markets active API used worldwide by both generic and branded pharmaceutical companies. For results by segment, see "Segment Results" below and
Item 1. Note 17
.
Leadership Changes
On July 20, 2016, we appointed John Wesolowski Acting General Manager, Rx Pharmaceuticals, and accepted the resignation of Doug Boothe, Executive Vice President and General Manager, Rx Pharmaceuticals.
On April 27, 2016, Sharon Kochan's role as Executive Vice President and General Manager, International, was expanded to lead the BCH segment following the resignation of Marc Coucke as Executive Vice President and General Manager of the BCH segment.
34
Perrigo Company plc
- Item 2
Executive Overview
On April 24, 2016, we named Laurie Brlas as Chairman of the Board of Directors, promoted John T. Hendrickson from President to Chief Executive Officer, and accepted the resignation of Joseph C. Papa as Chairman and Chief Executive Officer.
Interim Impairment Testing
In connection with the preparation of our financial statements for the three-month period ended April 2, 2016, we identified indicators of impairment associated with certain indefinite-lived intangible assets and goodwill acquired in conjunction with the Omega acquisition. The primary impairment indicators included the decline in our 2016 performance expectations and a reduction in our long-range revenue growth forecast.
The assessment for indefinite-lived intangible asset impairment utilized the excess earnings method to determine fair value and resulted in an impairment charge of
$273.4 million
for the three months ended April 2, 2016, which represented the difference between the carrying amount of the intangible assets and their estimated fair value.
The assessment for goodwill impairment indicated that a portion of the goodwill acquired in the Omega acquisition was impaired as the reporting unit's fair value did not exceed its carrying value. Based on our evaluation and initial estimates of the fair value of the reporting unit, we recorded an estimated impairment charge of
$193.6 million
for the three months ended April 2, 2016. We finalized the fair value calculation during the three months ended July 2, 2016, which resulted in a
$30.3 million
reduction to the estimated impairment charges recorded last quarter.
For both the intangible assets and goodwill, the change in estimated and implied fair value, respectively, from previous estimates was due primarily to the changes in the market and performance of the brands such that the evaluation of brand prioritization and product extensions or launches in new regions are being more focused to maximize the potential of all brands in the segment's portfolio. Both the indefinite-lived intangible asset impairment and goodwill impairment were recorded within
Impairment charges (credits)
on the Condensed Consolidated Statements of Operations within our BCH segment. The carrying value for certain intangible assets and goodwill equals fair value, and as a result, any further deterioration in those assets' fair value would lead to a further impairment charge. Future performance different from the assumptions utilized in our quantitative analyses may result in additional changes in the fair value. We will continue to monitor and assess these assets for potential impairment should further impairment indicators arise, as applicable, and at least annually during our fourth quarter annual impairment testing.
In addition, due to the reprioritization of certain brands in the BCH segment and change in performance expectations for our impaired lifestyle brands previously recorded as indefinite-lived assets, we reclassified the remaining asset balance of
$364.5 million
to definite-lived assets with a useful life of
20
years and began amortizing the asset during the three months ended July 2, 2016.
See
Item 1. Note 3
for more information.
35
Perrigo Company plc
- Item 2
Executive Overview
2016 Year-to-Date Highlights
|
•
|
We closed the sale of our U.S. VMS business to International Vitamins Corporation ("IVC") on August 5, 2016;
|
|
•
|
Consistent with previously announced actions, we added a number of positions and processes to our Dublin headquarters across a range of corporate functions, including supply chain/global operations, procurement, enterprise risk management, and corporate finance, leveraging the strength of our global platform;
|
|
•
|
We continued restructuring associated primarily with actions we took to streamline our organization as announced on October 22, 2015;
|
|
•
|
We issued $1.2 billion of senior notes and repaid borrowings under revolving credit facilities;
|
|
•
|
We issued a notice of redemption to prepay $500.0 million of senior notes in September 2016;
|
|
•
|
We completed the acquisition of a generic Retin-A
®
portfolio, further enhancing our Rx extended topicals strategy; and
|
|
•
|
We completed the acquisition of two development-stage specialty Rx products to further invest in our specialty Rx portfolio.
|
RESULTS OF OPERATIONS
CONSOLIDATED
Recent Trends and Developments
|
•
|
We have experienced a reduction in pricing expectations during 2016 in comparison to historical patterns in our U.S. businesses, in particular in our Rx segment, due to industry and competitive pressures in the sector. The reduced pricing is attributable to a variety of factors including increased focus from customers to capture supply chain productivity savings, low raw material commodity pricing, competition in specific product categories, and the loss of exclusivity on certain products and consolidation of certain customers in the Rx segment. We expect this pricing environment to continue to impact us at least through the remainder of 2016.
|
|
•
|
Our expectations for the BCH segment continue to be impacted by market dynamics in the lifestyle and natural health/vitamins categories. Factors impacting these categories include softness in key markets due to current macro-economic factors, change in timing of certain advertising and promotional campaigns compared to the prior year, and lower sell-in during the current year due to the re-staging of certain products.The BCH segment has established a brand prioritization strategy to address these market dynamics, with an objective to balance the cost of advertising and promotion investments with expected contributions from category sales.
|
|
•
|
Our expectations for 2016 new product sales are consistent with those communicated in our first quarter Form 10-Q, but continue to remain lower than anticipated as of December 31, 2015. Several new product launches have been delayed due to the regulatory approval process for certain new products in the U.S. and modifications to market share penetration and timing assumptions for new products in our Rx and BCH segments.
|
36
Perrigo Company plc
- Item 2
Consolidated
Consolidated Results
|
|
Three Months Ended
|
% Change
|
Six Months Ended
|
% Change
|
|||||||||||||||||
|
($ in millions)
|
June 27,
2015 |
July 2,
2016 |
June 27,
2015 |
July 2,
2016 |
|||||||||||||||||
|
Net sales
|
$
|
1,531.6
|
|
$
|
1,481.0
|
|
(3
|
)%
|
$
|
2,580.8
|
|
$
|
2,864.2
|
|
11
|
%
|
|||||
|
Gross profit
|
$
|
628.1
|
|
$
|
567.2
|
|
(10
|
)%
|
$
|
1,007.0
|
|
$
|
1,090.1
|
|
8
|
%
|
|||||
|
Gross profit %
|
41.0
|
%
|
38.3
|
%
|
39.0
|
%
|
38.1
|
%
|
|||||||||||||
|
Operating expenses
|
$
|
401.2
|
|
$
|
328.9
|
|
(18
|
)%
|
$
|
580.8
|
|
$
|
1,155.6
|
|
99
|
%
|
|||||
|
Operating expenses %
|
26.2
|
%
|
22.2
|
%
|
22.5
|
%
|
40.3
|
%
|
|||||||||||||
|
Operating income (loss)
|
$
|
226.9
|
|
$
|
238.3
|
|
5
|
%
|
$
|
426.2
|
|
$
|
(65.5
|
)
|
(115
|
)%
|
|||||
|
Operating income (loss) %
|
14.8
|
%
|
16.1
|
%
|
16.5
|
%
|
(2.3
|
)%
|
|||||||||||||
|
Interest and other, net
|
$
|
69.5
|
|
$
|
86.7
|
|
25
|
%
|
$
|
371.4
|
|
$
|
142.1
|
|
(62
|
)%
|
|||||
|
Income tax expense (benefit)
|
$
|
101.0
|
|
$
|
(42.7
|
)
|
(142
|
)%
|
$
|
93.2
|
|
$
|
(67.3
|
)
|
(172
|
)%
|
|||||
|
Net income (loss)
|
$
|
56.4
|
|
$
|
194.3
|
|
244
|
%
|
$
|
(38.4
|
)
|
$
|
(140.3
|
)
|
(265
|
)%
|
|||||
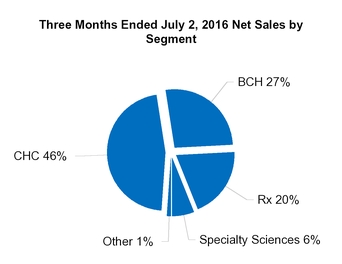
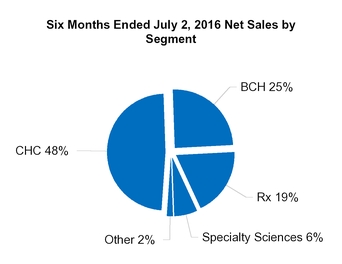
The decline in consolidated sales for the three months ended July 2, 2016 as compared to the prior year period was due primarily to lower sales in the CHC segment's cough/cold, analgesics, and OTC contract manufacturing categories. This decrease was offset partially by higher sales in the Rx segment due to contributions from acquisitions and new products. Consolidated operating income for the three months ended July 2, 2016 increased from the prior year period due primarily to lower operating expenses due in part to the
$30.3 million
goodwill impairment reduction described above under "Interim Impairment Testing" and in
Item 1. Note 3
and cost containment measures, offset partially by lower gross profit due primarily to reduced pricing in the Rx segment and product mix in the BCH segment.
The most significant change in our consolidated six-month year-over-year results is the addition of Omega Pharma Invest N.V. ("Omega"). Omega was acquired on March 30, 2015; thus, results for the six months ended
June 27, 2015
included only three months of operations attributable to Omega. In addition, the operating and net losses for the six months ended
July 2, 2016
were due primarily to goodwill and intangible asset impairment charges totaling
$436.7 million
, as described above under "Interim Impairment Testing" and in
Item 1. Note 3
. The net loss for the prior year period included a
$259.8 million
loss on derivatives we used to economically hedge fluctuations in the euro-denominated purchase price of the Omega acquisition as described in
Item 1. Note 8
.
Further details and analysis of our financial results for the
three and six months ended
July 2, 2016
and
June 27, 2015
are provided below by reporting segment and line item.
37
Perrigo Company plc
- Item 2
CHC
CONSUMER HEALTHCARE
Recent Trends and Developments
|
•
|
On June 20, 2016, we announced the sale of our U.S. VMS business to IVC, which closed on August 5, 2016.
As of
July 2, 2016
, the net assets of our U.S. VMS business were classified as "held for sale" as discussed in
Item 1. Note 9
. Sales attributable to the U.S. VMS business totaled $42.1 million and $39.6 million for the three months ended
July 2, 2016
and
June 27, 2015
, respectively, and $89.2 million and $77.1 million for the six months ended
July 2, 2016
and
June 27, 2015
, respectively.
|
|
•
|
We have experienced a reduction in pricing expectations in certain categories within our CHC segment in 2016 due to various factors, including increased focus from customers to capture supply chain productivity savings, low raw material commodity pricing, and competition in specific product categories. We expect this pricing environment to continue to impact our CHC segment at least through the remainder of 2016.
|
Segment Results
Three Month Comparison
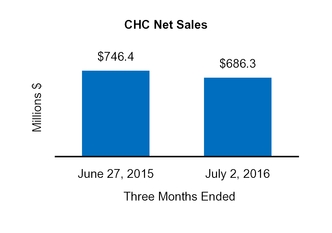
|
|
Three Months Ended
|
||||||
|
($ in millions)
|
June 27, 2015
|
July 2,
2016 |
|||||
|
Net sales
|
$
|
746.4
|
|
$
|
686.3
|
|
|
|
Gross profit
|
$
|
258.3
|
|
$
|
230.3
|
|
|
|
Gross profit %
|
34.6
|
%
|
33.5
|
%
|
|||
|
Operating income
|
$
|
143.3
|
|
$
|
111.2
|
|
|
|
Operating income %
|
19.2
|
%
|
16.2
|
%
|
|||
Three Months Ended
July 2, 2016
vs.
Three Months Ended
June 27, 2015
Net sales
decreased
$60.1 million
, or
8%
, over the prior year period due to:
|
•
|
A net decrease in sales of existing products of
$83.5 million
due to:
|
|
•
|
Strong sales in our infant health and smoking cessation categories, more than offset by
|
|
•
|
Weaker sales in the cough/cold category due to timing of promotions and a weaker allergy season;
|
|
•
|
Pricing pressure primarily in the analgesics category due to increased competition; and
|
|
•
|
Lower sales in the OTC contract manufacturing and animal health categories;
|
|
•
|
Discontinued products of
$12.0 million
due primarily to a label refresh within the infant formula category; and
|
|
•
|
Unfavorable foreign currency movement of
$6.0 million
; offset partially by
|
|
•
|
New product sales of
$32.4 million
related primarily to several new infant formula and food products and the launches of fluticasone nasal spray (generic equivalent to Flonase
®
), guaifenesin extended release (generic equivalent to Mucinex
®
ER); and
|
|
•
|
Incremental net sales of
$11.4 million
from acquisitions (primarily the Gelcaps Exportadora de Mexico, S.A. de C.V. ("Gelcaps") and ScarAway
®
acquisitions).
|
38
Perrigo Company plc
- Item 2
CHC
Operating income
decreased
$32.1 million
, or
22%
, as a result of:
|
•
|
A decrease
of
$28.0 million
in gross profit due to:
|
|
•
|
Decreased sales of existing and discontinued products as described above; and
|
|
•
|
Increased intangible asset amortization expense associated primarily with the Gelcaps and ScarAway
®
acquisitions; offset partially by
|
|
•
|
Margin contributions from new products and strong performance in the infant health and smoking cessation categories; and
|
|
•
|
Continued manufacturing and supply chain efficiencies.
|
|
•
|
An increase of
$4.1 million
in operating expenses due to:
|
|
•
|
A
$6.2 million
impairment charge recorded on the VMS held-for-sale business and
|
|
•
|
Increased research and development investments due to timing of clinical trials; offset partially by
|
|
•
|
Decreased selling and administrative expenses due to cost containment actions taken during the prior year.
|
Six
Month Comparison
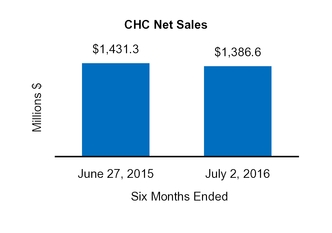
|
|
|||||||
|
Six Months Ended
|
|||||||
|
($ in millions)
|
June 27,
2015 |
July 2,
2016 |
|||||
|
Net sales
|
$
|
1,431.3
|
|
$
|
1,386.6
|
|
|
|
Gross profit
|
$
|
470.2
|
|
$
|
444.1
|
|
|
|
Gross profit %
|
32.9
|
%
|
32.0
|
%
|
|||
|
Operating income
|
$
|
247.6
|
|
$
|
213.6
|
|
|
|
Operating income %
|
17.3
|
%
|
15.4
|
%
|
|||
Six Months Ended
July 2, 2016
vs.
Six Months Ended
June 27, 2015
Net sales
decreased
$44.7 million
, or
3%
, over the prior year period due to:
|
•
|
A net
$66.1 million
decrease in existing product sales due to:
|
|
•
|
Strong sales in our infant health and smoking cessation categories; more than offset by
|
|
•
|
Weaker sales in the cough/cold category due to a mild cold and flu season, weaker allergy season, and timing of promotions;
|
|
•
|
Decreased sales of analgesics due to a mild cold and flu season and pricing pressure due to increased competition; and
|
|
•
|
Lower sales in the OTC contract manufacturing and animal health categories;
|
|
•
|
Discontinued products of
$49.9 million
related primarily to a label refresh within the infant formula category; and
|
|
•
|
Unfavorable foreign currency movement of
$12.6 million
; offset partially by
|
|
•
|
New product sales of
$63.2 million
related primarily to several new infant formula and food products, fluticasone nasal spray (generic equivalent to Flonase
®
), guaifenesin extended release (generic equivalent to Mucinex
®
ER), and several new animal health products; and
|
|
•
|
Incremental net sales of
$24.2 million
due primarily to the Gelcaps and ScarAway
®
acquisitions.
|
39
Perrigo Company plc
- Item 2
CHC
Operating income
decreased
$34.0 million
, or
14%
, as a result of:
|
•
|
A decrease
of
$26.1 million
in gross profit due to:
|
|
•
|
Decreased sales of existing and discontinued products in the first half of 2016 as described above; and
|
|
•
|
Increased intangible asset amortization expense associated primarily with the Gelcaps and ScarAway
®
acquisitions; offset partially by
|
|
•
|
Margin contributions from new products and strong performance in the infant health and smoking cessation categories; and
|
|
•
|
Continued manufacturing and supply chain efficiencies.
|
|
•
|
An increase
of
$7.9 million
in operating expenses due to:
|
|
•
|
A
$6.2 million
impairment charge recorded on the VMS held-for-sale business; and
|
|
•
|
Increased research and development investments due to timing of clinical trials; offset partially by
|
|
•
|
Decreased selling and administrative expenses due to cost containment actions taken during the prior year.
|
Recent Trends and Developments
|
•
|
Our expectations for the BCH segment continue to be impacted by market dynamics in the lifestyle and natural health/vitamins categories. Factors impacting these categories include softness in key markets due to current macro-economic factors, change in timing of certain advertising and promotional campaigns compared to the prior year, and lower sell-in during the current year due to the re-staging of certain products.The BCH segment has established a brand prioritization strategy to address these market dynamics, with an objective to balance the cost of advertising and promotion investments with expected contributions from category sales.
|
|
•
|
Our expectations for 2016 new product sales are consistent with those communicated in our first quarter Form 10-Q, but continue to remain lower than anticipated as of December 31, 2015. Several new product launches have been delayed due to modifications to market share penetration and timing assumptions for new products in Europe.
|
|
•
|
We continue to make progress on our previously announced restructuring plans to right-size the BCH business due to the impact of market dynamics on sales volumes. In addition, we made several strategic leadership changes during 2016, with additional hiring continuing.
|
Segment Results
Three Month Comparison
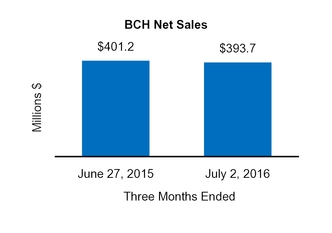
|
|
Three Months Ended
|
||||||
|
($ in millions)
|
June 27,
2015 |
July 2,
2016 |
|||||
|
Net sales
|
$
|
401.2
|
|
$
|
393.7
|
|
|
|
Gross profit
|
$
|
190.1
|
|
$
|
173.1
|
|
|
|
Gross profit %
|
47.4
|
%
|
44.0
|
%
|
|||
|
Operating income
|
$
|
26.6
|
|
$
|
38.4
|
|
|
|
Operating income %
|
6.6
|
%
|
9.8
|
%
|
|||
40
Perrigo Company plc
- Item 2
BCH
Three Months Ended
July 2, 2016
vs.
Three Months Ended
June 27, 2015
Net sales
decreased
$7.5 million
, or
2%
, over the prior year period due to:
|
•
|
Decreased sales volumes of existing products totaling
$65.4 million
due primarily to:
|
|
•
|
Weaker current year sales in the lifestyle category due in large part to a product launch in the prior year period and the natural health/vitamins category due primarily to timing of promotional activities and the planned divestment of the Etixx
®
brand in addition to
|
|
•
|
Lower sales in France due to market dynamics; offset largely by
|
|
•
|
New product sales of
$28.3 million
; and
|
|
•
|
Incremental net sales of
$29.1 million
from the Naturwohl Pharma GmbH ("Naturwohl") and GlaxoSmithKline
Consumer Healthcare Product Portfolio ("GSK Products") acquisitions.
|
Operating income
increased
$11.8 million
, or
44%
, as a result of:
|
•
|
A decrease
of
$17.0 million
in gross profit due to decreased sales of existing products in the lifestyle and natural health/vitamins categories as noted above, offset by
|
|
•
|
A decrease
of
$28.8 million
in operating expenses due to:
|
|
•
|
The
$30.3 million
reduction to the first quarter estimated goodwill impairment charge recorded in the current quarter; and
|
|
•
|
Decreased advertising and promotional investment due to previously announced strategic initiatives to better align promotional investments with sales; offset partially by
|
|
•
|
Restructuring expense totaling
$4.8 million
in the current quarter related to strategic organizational enhancements.
|
Six
Month Comparison*
* The BCH segment was created on March 30, 2015 as a result of the Omega acquisition, thus comparative prior year data for the six months ended June 27, 2015 includes only three months of results from operations.

|
Six Months Ended
|
|||||||
|
($ in millions)
|
June 27, 2015*
|
July 2,
2016 |
|||||
|
Net sales
|
$
|
401.2
|
|
$
|
711.3
|
|
|
|
Gross profit
|
$
|
190.1
|
|
$
|
329.7
|
|
|
|
Gross profit %
|
47.4
|
%
|
46.3
|
%
|
|||
|
Operating income (loss)
|
$
|
26.6
|
|
$
|
(444.3
|
)
|
|
|
Operating income (loss) %
|
6.6
|
%
|
(62.5
|
)%
|
|||
Six Months Ended
July 2, 2016
vs.
Six Months Ended
June 27, 2015
Net sales
increased
$310.1 million
, or
77%
, over the prior year period due to:
|
•
|
An additional three months of results from operations attributable to Omega;
|
|
•
|
New products totaling
$59.5 million
; and
|
|
•
|
Sales from the Naturwohl and GSK Products acquisitions totaling
$66.7 million
; offset partially by
|
|
•
|
Decreased sales volumes of existing products due primarily to:
|
|
•
|
Weaker current year sales in the lifestyle category due in large part to a product launch in the prior year period and the natural health/vitamins category due primarily to timing of promotional activities and the planned divestment of the Etixx
®
brand in addition to
|
|
•
|
Lower sales in France due to market dynamics.
|
41
Perrigo Company plc
- Item 2
BCH
Operating income
decreased
$470.9 million
due to:
|
•
|
A
$139.6 million
increase in gross profit due to an additional three months of operations attributable to Omega offset by
|
|
•
|
An increase
of
$610.5 million
in operating expenses due to:
|
|
•
|
Intangible asset and goodwill impairment charges totaling
$436.7 million
recorded during the six months ended July 2, 2016 described above under "Interim Impairment Testing";
|
|
•
|
An additional three months of operations; and
|
|
•
|
Restructuring charges totaling
$7.1 million
related to strategic organizational enhancements; offset partially by
|
|
•
|
Cost control measures employed to mitigate lower forecasted sales and operating income.
|
Recent Trends and Developments
|
•
|
We continue to experience a significant reduction in pricing expectations in our Rx segment due to industry and competitive pressures in the sector. This softness in pricing is attributed to various factors, including increased focus from customers to capture supply chain productivity savings, low raw material commodity pricing, competition in specific products, and consolidation of certain customers. We expect this softness to continue to impact us at least through the remainder of 2016.
|
|
•
|
On January 22, 2016, we acquired a portfolio of generic dosage forms and strengths of Retin-A
®
(tretinoin), a topical prescription acne treatment, from Matawan Pharmaceuticals, LLC, for
$416.4 million
in cash ("Tretinoin Products").
|
|
•
|
On March 1, 2016, we completed the acquisition of two development-stage specialty Rx products to further invest in our specialty Rx portfolio.
|
Segment Results
Three Month Comparison
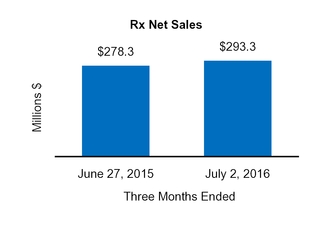
|
|
Three Months Ended
|
||||||
|
($ in millions)
|
June 27, 2015
|
July 2,
2016 |
|||||
|
Net sales
|
$
|
278.3
|
|
$
|
293.3
|
|
|
|
Gross profit
|
$
|
161.4
|
|
$
|
139.3
|
|
|
|
Gross profit %
|
58.0
|
%
|
47.5
|
%
|
|||
|
Operating income
|
$
|
99.5
|
|
$
|
96.8
|
|
|
|
Operating income %
|
35.7
|
%
|
33.0
|
%
|
|||
42
Perrigo Company plc
- Item 2
Rx
Three Months Ended
July 2, 2016
vs.
Three Months Ended
June 27, 2015
Net sales
increased
$15.0 million
, or
5%
, due to:
|
•
|
Sales attributable to the Entocort
®
and Tretinoin Products acquisitions totaling
$43.7 million
; and
|
|
•
|
New product sales of
$25.6 million
due primarily to sales of benzoyl peroxide 5%-clindamycin 1% gel (a generic version of Benzaclin™); offset partially by
|
|
•
|
Decreased sales of existing products of
$50.3 million
due to lower sales volume of certain products, pricing pressure across the portfolio, and the lack of exclusive market position for two key products versus the prior year;
|
|
•
|
Discontinued products of
$2.8 million
; and
|
|
•
|
Unfavorable foreign exchange movement of
$1.1 million
.
|
Segment operating income
decreased
$2.7 million
, or
3%
, as a result of:
|
•
|
A decrease
of
$22.1 million
in gross profit due primarily to the pricing pressure noted above as well as higher amortization expense from the Entocort
®
and Tretinoin Products acquisitions; offset largely by
|
|
•
|
A decrease
of
$19.4 million
in operating expenses due primarily to the absence of an
$18.0 million
R&D payment made in connection with a research and development contractual arrangement in the prior year.
|
Six
Month Comparison
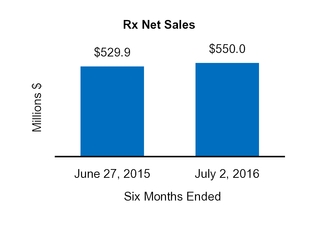
|
|
|||||||
|
Six Months Ended
|
|||||||
|
($ in millions)
|
June 27,
2015 |
July 2,
2016 |
|||||
|
Net sales
|
$
|
529.9
|
|
$
|
550.0
|
|
|
|
Gross profit
|
$
|
303.1
|
|
$
|
266.6
|
|
|
|
Gross profit %
|
57.2
|
%
|
48.5
|
%
|
|||
|
Operating income
|
$
|
199.5
|
|
$
|
184.2
|
|
|
|
Operating income %
|
37.6
|
%
|
33.5
|
%
|
|||
Six Months Ended
July 2, 2016
vs.
Six Months Ended
June 27, 2015
Net sales
increased
$20.1 million
, or
4%
, due to:
|
•
|
Net sales attributable to the Entocort
®
and Tretinoin Products acquisitions totaling
$89.3 million
; and
|
|
•
|
New product sales of
$36.8 million
due primarily to to sales of benzoyl peroxide 5%-clindamycin 1% gel (a generic version of Benzaclin™); offset partially by
|
|
•
|
Decreased sales of existing products of
$100.4 million
due to declined sales volume of certain products, pricing pressure across the portfolio, and the lack of exclusive market position for two key products versus the prior year;
|
|
•
|
Discontinued products of
$3.5 million
; and
|
|
•
|
Unfavorable foreign exchange movement of
$2.0 million
.
|
Segment operating income
decreased
$15.3 million
, or
8%
, as a result of:
|
•
|
A decrease
of
$36.5 million
in gross profit due primarily to the pricing pressure noted above, as well as higher amortization expense from the Entocort
®
and Tretinoin Products acquisitions; offset partially by
|
|
•
|
A decrease
of
$21.2 million
in operating expenses due primarily to the absence of an
$18.0 million
research and development payment made in connection with a research and development contractual arrangement in the prior year.
|
43
Perrigo Company plc
- Item 2
Specialty Sciences
SPECIALTY SCIENCES
In February 2016, a competitor's pipeline product, Ocrevus
®
, received breakthrough therapy designation from the FDA and could potentially be approved in 2016. The product would compete with Tysabri
®
and could have a significant negative impact on the royalty we receive from Biogen Idec, Inc. ("Biogen") and the performance of the Specialty Sciences segment. We continue to monitor the progress of all potential competing products.
Segment Results
Three Month Comparison
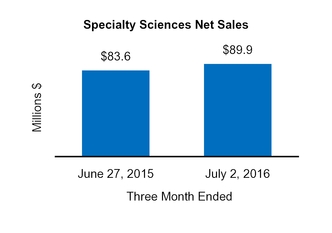
|
|
Three Months Ended
|
||||||
|
($ in millions)
|
June 27, 2015
|
July 2,
2016 |
|||||
|
Net sales
|
$
|
83.6
|
|
$
|
89.9
|
|
|
|
Gross profit
|
$
|
11.1
|
|
$
|
17.0
|
|
|
|
Gross profit %
|
13.3
|
%
|
19.0
|
%
|
|||
|
Operating income
|
$
|
6.4
|
|
$
|
13.3
|
|
|
|
Operating income %
|
7.7
|
%
|
14.8
|
%
|
|||
Three Months Ended
July 2, 2016
vs.
Three Months Ended
June 27, 2015
Net sales
increased
$6.3 million
due to an increase in royalties received from Biogen's sales of Tysabri
®
. Operating income
increased
$6.9 million
due to the increased royalties as well a
$1.0 million
reduction in operating expenses due to lower legal costs in the current year.
Six
Month Comparison
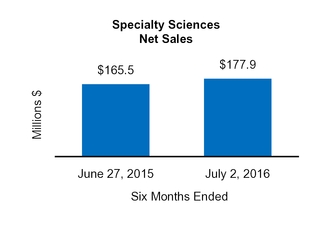
|
|
|||||||
|
Six Months Ended
|
|||||||
|
($ in millions)
|
June 27,
2015 |
July 2,
2016 |
|||||
|
Net sales
|
$
|
165.5
|
|
$
|
177.9
|
|
|
|
Gross profit
|
$
|
20.4
|
|
$
|
32.3
|
|
|
|
Gross profit %
|
12.4
|
%
|
18.2
|
%
|
|||
|
Operating income
|
$
|
11.9
|
|
$
|
26.3
|
|
|
|
Operating income %
|
7.2
|
%
|
14.8
|
%
|
|||
Six Months Ended
July 2, 2016
vs.
Six Months Ended
June 27, 2015
Net sales
increased
$12.4 million
due to an increase in royalties received from Biogen's sales of Tysabri
®
, offset partially by
$1.1 million
of unfavorable foreign exchange movement. Operating income
increased
$14.4 million
due to the increased royalties as well a
$2.5 million
reduction in operating expenses due primarily to the lack of restructuring and lower legal costs in the current year.
44
Perrigo Company plc
- Item 2
Other
OTHER
Recent Trends and Developments
We are pursuing the sale of our API business based in India and expect the sale to take place during 2016. On
July 2, 2016
, the net assets of our India API business were classified as "held for sale" as discussed in
Item 1. Note 9.
Segment Results
Three Month Comparison
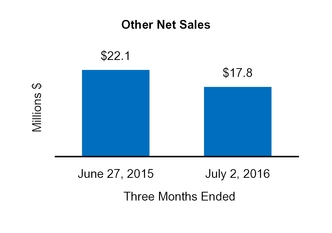
|
|
Three Months Ended
|
||||||
|
($ in millions)
|
June 27, 2015
|
July 2,
2016 |
|||||
|
Net sales
|
$
|
22.1
|
|
$
|
17.8
|
|
|
|
Gross profit
|
$
|
7.2
|
|
$
|
7.5
|
|
|
|
Gross profit %
|
32.8
|
%
|
42.4
|
%
|
|||
|
Operating income (loss)
|
$
|
1.9
|
|
$
|
(1.3
|
)
|
|
|
Operating income (loss) %
|
8.4
|
%
|
(7.1
|
)%
|
|||
Three Months Ended
July 2, 2016
vs.
Three Months Ended
June 27, 2015
Net sales decreased
$4.3 million
due primarily to increased competition on certain products, in particular, U.S. sales of Temozolomide. The operating loss in the current year period was due primarily to a
$4.3 million
impairment charge recorded on the India API held-for-sale business, offset partially by reduced operating expenses.
Six
Month Comparison
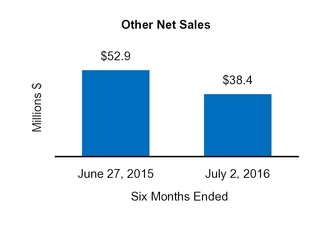
|
|
|||||||
|
Six Months Ended
|
|||||||
|
($ in millions)
|
June 27,
2015 |
July 2,
2016 |
|||||
|
Net sales
|
$
|
52.9
|
|
$
|
38.4
|
|
|
|
Gross profit
|
$
|
23.2
|
|
$
|
17.4
|
|
|
|
Gross profit %
|
43.6
|
%
|
45.3
|
%
|
|||
|
Operating income
|
$
|
12.4
|
|
$
|
4.1
|
|
|
|
Operating income %
|
23.3
|
%
|
10.8
|
%
|
|||
Six Months Ended
July 2, 2016
vs.
Six Months Ended
June 27, 2015
Net sales
decreased
$14.5 million
due primarily to competition on certain products, in particular, U.S. sales of Temozolomide. Operating income
decreased
$8.3 million
due primarily to a
$5.8 million
decrease in gross profit due to increased competition, and a
$4.3 million
impairment charge recorded on the India API held-for-sale business, offset partially by a reduction in operating expenses.
45
Perrigo Company plc
- Item 2
Unallocated, Interest, Other, and Taxes
Unallocated Expenses
Unallocated expenses are comprised of certain corporate expenses not allocated to the segments and are recorded in operating income. Unallocated expenses were
$20.1 million
for the
three months ended
July 2, 2016
, compared to
$50.7 million
for the
three months ended
June 27, 2015
,
a decrease
of
$30.6 million
. The reduction in unallocated expense was due primarily to fees incurred in the prior year period:
$16.1 million
of Omega acquisition-related fees and
$13.4 million
of fees related to our defense against the hostile takeover bid by Mylan N.V. ("Mylan"). In addition, we experienced a
$15.0 million
year-over-year reduction in share-based compensation due primarily to the resignation of Joseph C. Papa, which was offset by a
$12.8 million
increase in legal and professional fees in the current period.
Unallocated expenses were
$49.4 million
for the
six months ended
July 2, 2016
compared to
$71.8 million
for the prior year period, a
decrease
of
$22.4 million
. The reduction in unallocated expense was due primarily to fees incurred in the prior year period:
$18.1 million
of Omega acquisition-related fees and
$13.4 million
of legal and professional fees related to our defense against the hostile takeover bid by Mylan. In addition, we experienced a
$10.9 million
reduction in share-based compensation due primarily to the resignation of Joseph C. Papa, which was offset by a
$12.8 million
increase in legal and professional fees and
$11.2 million
of integration and restructuring related expense incurred in the current period.
Interest and Other (Consolidated)
Interest Expense, Net
Interest expense, net was
$57.4 million
for the
three months ended
July 2, 2016
, compared to
$45.9 million
for the prior year period. The
$11.5 million
increase
was due to interest incurred in the current year on the
$1.2 billion
senior notes issued on March 7, 2016.
Interest expense, net was
$108.6 million
for the
six months ended
July 2, 2016
, compared to
$89.2 million
for the prior year period. The
$19.4 million
increase
was due to interest incurred on the debt assumed in the Omega acquisition, borrowings on our revolving credit agreements during the
six months ended
July 2, 2016
, and the issuance of
$1.2 billion
of senior notes on March 7, 2016. See the "
Borrowings and Capital Resources
" section below and
Item 1. Note 10
for more information.
Other Expense, Net
Other expense, net
, was
$29.3 million
for the
three months ended
July 2, 2016
, compared to
$22.7 million
in the prior year period. The
$6.6 million
increase was due to a
$22.3 million
impairment charge on an equity method investment recorded in the current year period, offset partially by the absence of a
$6.8 million
goodwill impairment charge recorded in Other expense, net in the prior year, and the absence of
$5.5 million
of losses associated with an acquisition-related derivative and the termination of an interest rate swap recorded in the prior year. See Item 1. Notes 3, 7, and 8, for more information on the goodwill impairment charge, equity method investment loss, and derivative loss, respectively.
Other expense, net
, was
$33.1 million
for the
six months ended
July 2, 2016
, compared to
$281.3 million
in the prior year period. The
$248.2 million
decrease was due primarily to the absence of the
$259.8 million
loss we incurred in the prior year period on the derivatives we used to economically hedge fluctuations in the euro-denominated purchase price of the Omega and GSK Products acquisitions, offset partially by a gain of $12.5 million from the transfer of a rights agreement in the prior year. The losses on the derivatives due to the changes in the EUR/USD exchange rate prior to their settlement economically offset the final settlement of the euro-denominated Omega purchase price paid on March 30, 2015.
46
Perrigo Company plc
- Item 2
Unallocated, Interest, Other, and Taxes
Income Taxes (Consolidated)
The effective tax rate for the
three months ended
July 2, 2016
was a benefit of
28.2%
on income compared to
64.1%
for the
three months ended
June 27, 2015
. The effective tax rate for the
six months ended
July 2, 2016
was a benefit of
32.4%
on a net loss reported in the period compared to
170.2%
on income for the six months ended June 27, 2015. Income taxes recorded through July 2, 2016 were estimated using the discrete method. Due to sensitivity to small changes to forecasted annual pre-tax earnings, which created results with significant variations in the customary relationship between income tax expense and pre-tax income for the interim periods, we determined that using the discrete method is more appropriate than using the annual effective tax rate method.
Our tax rate is subject to adjustment over the balance of the prior fiscal year ended due to, among other things: income tax rate changes by governments; the jurisdictions in which our profits are determined to be earned and taxed; changes in the valuation of our deferred tax assets and liabilities; adjustments to estimated taxes upon finalization of various tax returns; adjustments to our interpretation of transfer pricing standards; changes in available tax credits, grants and other incentives; changes in stock-based compensation expense; changes in tax laws or the interpretation of such tax laws (for example, proposals for fundamental U.S. international tax reform); changes in U.S. GAAP; expiration of or the inability to renew tax rulings or tax holiday incentives; and the repatriation of earnings with respect to which we have not previously provided for taxes.
Although we believe that the tax estimates are reasonable and that we prepare our tax filings in accordance with all applicable tax laws, the final determination with respect to any tax audit and any related litigation could be materially different from estimates or from historical income tax provisions and accruals. The results of an audit or litigation could have a material effect on our operating results and/or cash flows in the periods for which that determination is made. In addition, future period earnings may be adversely impacted by litigation costs, settlements, penalties, and/or interest assessments.
The IRS audit of our fiscal years ended June 27, 2009 and June 26, 2010 had previously concluded with the issuance of a statutory notice of deficiency on August 27, 2014. While we had previously agreed on certain adjustments and made associated payments of
$8.0 million
, inclusive of interest in November 2014, the statutory notice of deficiency asserted various additional positions, including transfer pricing, relative to the same audit of fiscal years ended June 27, 2009 and June 26, 2010. The statutory notice asserted an incremental tax obligation of approximately
$68.9 million
, inclusive of interest and penalties. We disagree with the IRS’s positions asserted in the notice of deficiency. In January 2015, we paid this amount, a prerequisite to being able to contest the IRS’s positions in U.S. Federal court, and in June 2015, we filed a request for a refund. The IRS denied our request for a refund. We anticipate filing a complaint in federal district court claiming a refund for these amounts in the first quarter of 2017. The payment was recorded during the three months ended March 28, 2015 as a deferred charge on the balance sheet given our anticipated action to recover this amount. An unfavorable resolution of this matter could have a material impact on our consolidated financial statements in future periods.
We have ongoing audits in multiple jurisdictions for which tax returns are not yet settled. These jurisdictions include, but are not limited to, the United States and Belgium. The IRS is auditing our fiscal years ended June 25, 2011 and June 30, 2012, and may make adjustments consistent with their claims for the 2009 - 2010 audit period. In February 2016, the Belgium Tax Authority notified us that all Belgium locations will be audited for the years ended December 31, 2013 and December 31, 2014. At this time, we cannot predict the outcome of any audit or related litigation.
47
Perrigo Company plc
- Item 2
Financial Condition, Liquidity and Capital Resources
FINANCIAL CONDITION, LIQUIDITY, AND CAPITAL RESOURCES
Cash and Cash Equivalents
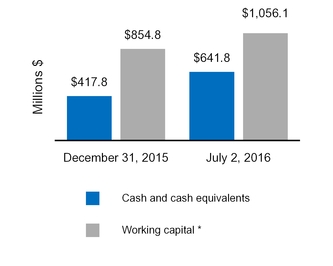
*
Working capital represents current assets less current liabilities, excluding cash and cash equivalents, and current indebtedness.
Cash, cash equivalents, and cash flows from operations are expected to be sufficient to finance our known and/or foreseeable liquidity and capital expenditures. In addition, we have the ability to borrow under our credit facilities. Although our lenders have made commitments to make funds available to us in a timely fashion under our revolving credit agreements and overdraft facilities, if economic conditions worsen or new information becomes publicly available impacting the institutions’ credit rating or capital ratios, these lenders may be unable or unwilling to lend money pursuant to our existing credit facilities.
Operating Activities
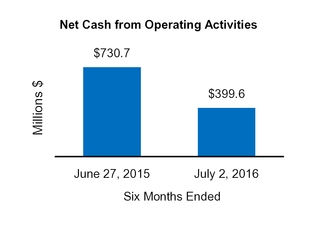
We generated
$399.6 million
of cash from operating activities during the
six months ended
July 2, 2016
, a
$331.1 million
decrease
over the comparable prior year period due primarily to increased working capital, as noted above, as a result of the following:
|
•
|
Changes in accounts payable, which contributed to a
$41.1 million
outflow in the first six months of 2016 compared to a
$187.5 million
inflow in the first six months of 2015. The primary reasons for the outflow in 2016 were the addition of Omega operations in the current year period and changes to the Omega accounts payable structure as discussed below.
|
|
•
|
Changes in inventories, which led to a
$50.3 million
outflow in the first six months of 2016 compared to a
$28.4 million
inflow during the first six months of 2015. The current year outflow was due to increased
|
48
Perrigo Company plc
- Item 2
Financial Condition, Liquidity and Capital Resources
inventory levels attributable to both tactical build-up in certain areas of the business and lower than forecasted sales in certain international markets.
|
•
|
Changes in accrued customer-related programs, which led to a
$45.3 million
outflow in the first six months of 2016 compared to a
$18.1 million
inflow for the first six months of 2015. The primary reason for the outflow in 2016 is the pricing dynamics in the Rx segment.
|
|
•
|
Changes in accrued payroll and related taxes, which contributed to a
$39.2 million
outflow in the first six months of 2016 compared to a
$3.8 million
outflow in the first six months of 2015. The primary reasons for the increased outflow in 2016 were severance payments related to the restructuring activities and the addition of Omega operations in the current year period.
|
Offset partially by:
|
•
|
Changes in accounts receivable, which contributed to a
$42.3 million
inflow in the first six months of 2016 compared to
$77.2 million
outflow in 2015. The inflow in the first six months of 2016 was due to reduced accounts receivable due to lower sales volumes, offset partially by a reduction of factoring in the current period.
|
|
•
|
Changes in accrued income taxes, which provided a
$21.8 million
inflow in the first six months of 2016 compared to a
$14.9 million
outflow in the first six months of 2015. The six months ended June 27, 2015 included a $68.9 million incremental tax payment made in the first quarter in connection with the contested IRS audit described above under "Income Taxes".
|
Operating cash flow was also impacted by decreased net earnings after adjusting for non-cash items such as impairment charges and depreciation and amortization.
Our operating cash flow for the current year period was unfavorably impacted by actions we took to establish a more normalized cash flow pattern within our BCH segment. Generally our BCH segment has seasonally stronger sales and cash flow inflows in the second and fourth quarters and stronger cash outflows in the first and third quarters. In the past, accounts payable terms with suppliers were structured to take account of this seasonality. This payment structure had a favorable impact on operating cash flow during the prior year period as only the second quarter inflow from these payment structures was included. In order to establish a more sustainable cash flow pattern during the year, we changed these payment structures during the
six months ended
July 2, 2016
, which had a one-time unfavorable impact on operating cash flow.
Investing Activities
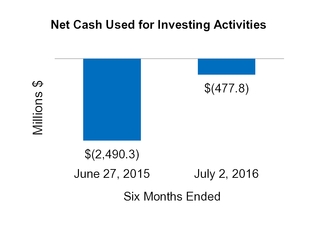
Cash used for investing activities totaled
$477.8 million
for the
six months ended
July 2, 2016
, compared to
$2.5 billion
in the prior year period. The cash used in the current year was due primarily to the Tretinoin Products acquisition, which used
$416.4 million
in cash. In the comparable prior year period, cash used for investing activities consisted primarily of a
$2.1 billion
outflow for business acquisitions, mainly attributable to Omega, as well as a
$303.5 million
outflow related to the cash settlement of non-designated foreign currency derivatives we used to
49
Perrigo Company plc
- Item 2
Financial Condition, Liquidity and Capital Resources
hedge the euro-denominated Omega and GSK Products purchase prices. Cash used for capital expenditures totaled
$57.1 million
during
six months ended
July 2, 2016
compared to
$89.0 million
in the prior period year. The decrease in cash used for capital expenditures over the prior year period was due primarily to several large infrastructure projects nearing completion.
Financing Activities
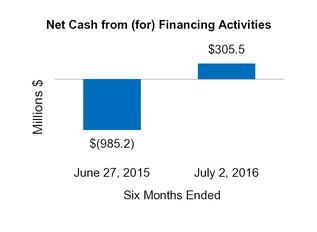
Cash generated from financing activities totaled
$305.5 million
for the
six months ended
July 2, 2016
, compared to cash used for financing activities of
$985.2 million
for the comparable prior year period. The primary contributor to the cash generation in the current year period was the borrowing of
$1.2 billion
of long-term debt. This was offset in part by net repayments on our revolving credit agreements and other short-term financing totaling
$803.9 million
. In the prior year period, the cash used for financing activities was due primarily to payments of
$889.0 million
on long-term debt, which included the repayment of debt assumed from Omega and a $300.0 million legacy Perrigo term loan. For more information see "Borrowings and Capital Resources" below and
Item 1. Note 10
.
The declaration and payment of dividends, if any, is subject to the discretion of our Board of Directors and will depend on our earnings, financial condition, availability of distributable reserves, capital and surplus requirements, and other factors our Board of Directors may consider relevant.
In October 2015, the Board of Directors approved a share repurchase plan of up to $2.0 billion, of which $1.5 billion is still available to be repurchased through December 31, 2018. We did not repurchase any shares under the share repurchase plan during the
six months ended
July 2, 2016
. The timing and amount of future repurchases, if any, will depend upon several factors, including market and business conditions, the trading price of our ordinary shares, available cash flow, and other investment opportunities.
50
Perrigo Company plc
- Item 2
Financial Condition, Liquidity and Capital Resources
Borrowings and Capital Resources
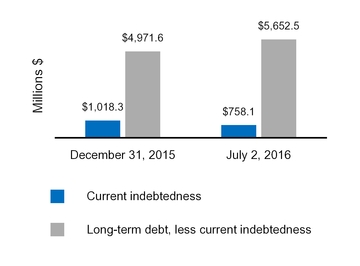
Overdraft Facilities
Our BCH segment uses overdraft facilities to increase the efficiency of its cash utilization and meet its short-term liquidity needs. We repaid the balance outstanding under these overdraft facilities during the three months ended July 2, 2016, but retain the ability to use these facilities in our day-to-day cash operations. The balance outstanding under the facilities was
$82.9 million
at
December 31, 2015
.
Accounts Receivable Factoring
We have multiple accounts receivable factoring arrangements with non-related third-party financial institutions (the “Factors”). Pursuant to the terms of the arrangements, we sell to the Factors certain of our accounts receivable balances on a non-recourse basis for credit approved accounts. An administrative fee ranging from
0.14%
to
0.15%
per invoice is charged on the gross amount of accounts receivables assigned to the Factors, plus interest is calculated at the applicable EUR LIBOR rate plus 70 basis points. The total amount factored and excluded from accounts receivable on the Condensed Consolidated Balance Sheets was
$54.7 million
and
$106.7 million
at
July 2, 2016
and
December 31, 2015
, respectively.
Revolving Credit Agreements
On December 9, 2015, our 100% owned finance subsidiary, Perrigo Finance Unlimited Company (formerly Perrigo Finance plc) ("Perrigo Finance"), entered into a
$750.0 million
revolving credit agreement (the "2015 Revolver"). At December 31, 2015,
$380.0 million
was outstanding under the 2015 Revolver. On March 15, 2016, we used the proceeds of the debt issuance described below under "Long-Term Debt" to repay the
$750.0 million
then outstanding under the 2015 Revolver and terminated the facility.
On
December 5, 2014
, Perrigo Finance entered into a
$600.0 million
revolving credit agreement, which we increased to
$1.0 billion
on March 30, 2015 (the "2014 Revolver"). At December 31, 2015,
$300.0 million
was outstanding under the 2014 Revolver. On March 15, 2016, we used the proceeds of the debt issuance described below under "Long-Term Debt" to repay the
$435.0 million
then outstanding under the 2014 Revolver. There were no borrowings outstanding under the 2014 Revolver as of
July 2, 2016
.
51
Perrigo Company plc
- Item 2
Financial Condition, Liquidity and Capital Resources
Long-Term Debt
On March 7, 2016, Perrigo Finance issued
$500.0 million
in aggregate principal amount of
3.500%
senior notes due 2021 and
$700.0 million
in aggregate principal amount of
4.375%
senior notes due 2026 (together, the "2016 Notes") and received net proceeds of
$1.2 billion
after fees and market discount, which were used to repay the amounts outstanding under the 2015 Revolver and 2014 Revolver mentioned above.
We had
$5.9 billion
and
$4.7 billion
outstanding under our notes and bonds, and
$473.3 million
and
$488.8 million
outstanding under our term loan, as of
July 2, 2016
and
December 31, 2015
, respectively. We expect to prepay our 1.300%
$500.0 million
senior note due November 2016 in September 2016.
We were in compliance with all covenants under our debt agreements as of
July 2, 2016
.
See
Item 1. Note 10
for more information on all of the above debt facilities.
Credit Ratings
Our credit ratings on
July 2, 2016
were Baa3 (stable) and BBB- (stable) by Moody's Investors Service and Standard and Poor's ("S&P") Global Ratings, respectively. On August 10, 2016, Moody’s affirmed our Baa3 credit rating and changed our outlook to negative from stable.
Credit rating agencies review their ratings periodically and, therefore, the credit rating assigned to us by each agency may be subject to revision at any time. Accordingly, we are not able to predict whether current credit ratings will remain as disclosed above. Factors that can affect our credit ratings include changes in operating performance, the economic environment, our financial position, and changes in business strategy. If changes in our credit ratings were to occur, they could impact, among other things, future borrowing costs, access to capital markets, and vendor financing terms.
Contractual Obligations and Commitments
Other than the obligations related to the changes to our debt structure in relation to the 2016 Notes, as discussed in
Note 10
of the Notes to the Condensed Consolidated Financial Statements, there were no material changes in contractual obligations as of
July 2, 2016
from those provided in our Transition Report on Form 10-KT for the transition period from June 28, 2015 to December 31, 2015. See below for a revised schedule of our enforceable and legally binding obligations as of
July 2, 2016
related to our short and long-term debt arrangements.
|
|
Payment Due by Period (in millions)
|
||||||||||||||||||
|
2016
(1)
|
2017 - 2018
|
2019 - 2020
|
After 2020
|
Total
|
|||||||||||||||
|
Short and long-term debt
(2)
|
$
|
660.5
|
|
$
|
1,682.1
|
|
$
|
811.6
|
|
$
|
5,508.4
|
|
$
|
8,662.6
|
|
||||
(1)
Reflects remaining six months of 2016.
|
(2)
|
Short and long-term debt includes interest payments, which were calculated using the effective interest rate at
July 2, 2016
.
|
ITEM 3.
QUANTITATIVE AND QUALITATIVE DISCLOSURES ABOUT MARKET RISK
There have been no material changes to our quantitative or qualitative disclosures found in Item 7A, "Quantitative and Qualitative Disclosures about Market Risk," of our Transition Report on Form 10-KT for the transition period from
June 28, 2015
to
December 31, 2015
.
ITEM 4.
CONTROLS AND PROCEDURES
Conclusion Regarding the Effectiveness of Disclosure Controls and Procedures
Our management, with the participation of our Chief Executive Officer and Chief Financial Officer, has evaluated the effectiveness of the design and operation of our disclosure controls and procedures (as defined in Rule 13a-15(e) or 15d-15(e) of the Exchange Act) as of
July 2, 2016
. Based upon that evaluation, our Chief Executive Officer and Chief Financial Officer have concluded that our disclosure controls and procedures were not effective as of
July 2, 2016
because of the material weakness in our internal control over financial reporting described below.
52
Perrigo Company plc
- Item 4
Controls and Procedures
All systems of internal control, no matter how well designed, have inherent limitations. Therefore, even those systems deemed to be effective can provide only reasonable assurance with respect to financial statement preparation and presentation. A material weakness is a deficiency, or combination of deficiencies, in internal control over financial reporting, such that there is a reasonable possibility that a material misstatement of a company’s annual or interim consolidated financial statements will not be prevented or detected on a timely basis.
Evaluation of Disclosure Controls and Procedures
We conducted an evaluation of the effectiveness of our internal control over financial reporting based upon the framework established in the 2013 Internal Control - Integrated Framework issued by the Committee of Sponsoring Organizations of the Treadway Commission (“COSO”).
In connection with the preparation of our financial statements for the quarter ended April 2, 2016, management determined that we did not design and maintain effective management review controls that operated at a sufficient level of precision to ensure interim income taxes were properly recorded and disclosed in our consolidated financial statements in connection with the recording of an indefinite-lived intangible asset impairment and an estimated goodwill impairment. These control deficiencies resulted in a material misstatement in income taxes in the preliminary financial statements for the quarter ended April 2, 2016. The material misstatement in interim income taxes was corrected prior to the filing of the Form 10-Q for the quarter ended April 2, 2016. These control deficiencies did not result in a misstatement of the consolidated financial statements for the transition period from June 28, 2015 to December 31, 2015, and would have no effect on the accounting for income taxes for the fiscal year ending December 31, 2016. However, these control deficiencies created a reasonable possibility that a material misstatement to the interim consolidated financial statements would not be prevented or detected on a timely basis. Accordingly, management concluded that these control deficiencies represented a material weakness.
Remediation Plan for the Material Weakness
To remediate the material weakness in internal control over financial reporting described above, with oversight from the Audit Committee, we have:
|
•
|
Reviewed the processes and controls in place to measure and record income taxes to enhance the efficiency and effectiveness of the design and operation of those controls;
|
|
•
|
Enhanced monitoring activities related to income taxes by adding additional internal controls and checklists; and
|
|
•
|
Evaluated and enhanced the level of precision in the management review controls related to income taxes by adding additional levels of review.
|
We are in the process of testing and evaluating the design and operating effectiveness of the control procedures and are assessing the effectiveness of the remediation plan, which we began implementing during the three months ended July 2, 2016. Until the remediation actions are fully implemented and the operational effectiveness of related internal controls is validated through testing, the material weakness described above will continue to exist. We are committed to achieving and maintaining a strong internal control environment and believe the remediation measures will strengthen our internal control over financial reporting and remediate the material weakness identified. We will continue to monitor the effectiveness of these remediation measures and will make any changes and take such other actions that we deem appropriate given the circumstances.
Changes in Internal Control over Financial Reporting
As discussed above under the heading entitled "Remediation of Material Weakness," there were changes in our internal control over financial reporting during the three months ended
July 2, 2016
that have materially affected, or are reasonably likely to materially affect, our internal control over financial reporting.
ITEM 1.
LEGAL PROCEEDINGS
Refer to
Part I, Item 1. Note 14
to the Condensed Consolidated Financial Statements.
53
Perrigo Company plc
- Item 1A
Risk Factors
ITEM 1A.
RISK FACTORS
Our Transition Report on Form 10-KT for the transition period from
June 28, 2015
to
December 31, 2015
includes a detailed discussion of our risk factors and our Quarterly Report on Form 10-Q for the three months ended April 2, 2016 contained certain additional risk factors. At the time of this filing, there have been no material changes to the risk factors that were included in the Form 10-KT other than those described below.
We are dependent on the services of certain key executive and scientific employees. We recently replaced our chief executive officer and the general managers of both our BCH and Rx segments. Our inability to successfully manage the transition with respect to these key executives, or the failure to attract and retain other key executive and scientific employees, may have a material adverse impact on our results of operations.
As previously disclosed in the "Risk Factors" section of our recent Form 10-KT, we are dependent on the services of certain key employees, and our future success will depend in large part upon our ability to attract and retain highly skilled employees.
|
•
|
In April 2016, we announced that our former Chairman and Chief Executive Officer, Joseph C. Papa, resigned from the Company and that John T. Hendrickson, formerly our President, was appointed to serve as our new Chief Executive Officer. Mr. Hendrickson was later appointed to serve as a member of our Board of Directors.
|
|
•
|
In April 2016, we announced that the former Executive Vice President and General Manager of our BCH segment, Marc Coucke, resigned from the Company and that our current Executive Vice President and General Manager, International, Sharon Kochan, would undertake expanded responsibilities that include providing leadership and strategic direction to our BCH segment.
|
|
•
|
We recently announced the resignation of Doug Boothe, Executive Vice President and General Manager, Rx Pharmaceuticals, and the appointment of John Wesolowski, Acting General Manager, Rx Pharmaceuticals.
|
If this management transition is not successful, or if we are unable to attract or retain other key qualified employees, our future operating results may be adversely impacted.
Publishing earnings guidance subjects us to risks, including increased stock volatility that could lead to potential lawsuits by investors.
Because we publish earnings guidance, we are subject to a number of risks. For a variety of reasons discussed under “Cautionary Note Regarding Forward-Looking Statements”, this Item 1A, and Item 1A of our Transition Report on Form 10-KT for the transition period from
June 28, 2015
to
December 31, 2015
, actual results may vary from the guidance we provide investors from time to time, such that our stock price may decline following, among other things, any earnings releases or guidance that do not meet market expectations.
On February 18, 2016, we announced our results for the fourth quarter and calendar year ended December 31, 2015, as well as our updated guidance for calendar year 2016, and on April 25, 2016 we announced our preliminary financial results for the first quarter ended April 2, 2016, as well as our updated guidance for calendar year 2016. Our stock price declined following each such announcement, resulting in a decrease in our market capitalization. Additionally, we announced updated guidance on August 10, 2016. It has become increasingly commonplace for investors to file lawsuits against companies following a rapid decrease in market capitalization. These types of lawsuits can be costly and divert management attention and other resources away from our business, regardless of their merits, and could result in adverse settlements or judgments.
We are or may become involved in shareholder class action lawsuits and may experience unfavorable outcomes of such proceedings.
We are a defendant to a securities lawsuit in which the complaint alleges violations of Securities Exchange Act sections 10(b) (and Rule 10b‑5) and 14(e) against both Perrigo and our former Chief Executive Officer, Joseph
54
Perrigo Company plc
- Item 1A
Risk Factors
C. Papa, and 20(a) control person liability against Mr. Papa. In general, the allegations concern the actions taken by the Company and former executive to defend against the hostile takeover bid by Mylan in the period April 21, 2015 through November 13, 2015. The plaintiff also alleges that we provided inadequate disclosure concerning alleged integration problems as a result of the Omega acquisition in the period April 21, 2015 through May 11, 2016.
We along with certain of our current and former executive officers and board members are also defendants in a securities class action suit where the plaintiff allege violations of Israeli law in the District Court of Tel Aviv-Jaffa
.
On June 15, 2016, Perrigo filed a motion to stay the case pending the outcome of the securities class action pending in the New Jersey federal court. The plaintiffs did not oppose the motion. The Israeli court granted the motion on the same day, and the action is stayed.
We intend to vigorously defend against these lawsuits, however, we cannot predict how the cases will be resolved. Adverse results in the cases could result in substantial monetary judgments. See
Part I. Item 1. Note 14
for more information on the above mentioned lawsuits.
We may not be able to improve operating results in our business segments.
|
•
|
We have experienced a reduction in pricing expectations during 2016 in comparison to historical patterns in our U.S. businesses, in particular in our Rx segment, due to industry and competitive pressures in the sector. The reduced pricing is attributable to a variety of factors including increased focus from customers to capture supply chain productivity savings, low raw material commodity pricing, competition in specific product categories, loss of exclusivity on certain products, and consolidation of certain customers in the Rx segment. We expect this pricing environment to continue to impact us at least through the remainder of 2016.
|
|
•
|
Our expectations for the BCH segment continue to be impacted by market dynamics in the lifestyle and natural health/vitamins categories. Factors impacting these categories include softness in key markets due to current macro-economic factors, change in timing of certain advertising and promotional campaigns compared to the prior year, and lower sell-in during the current year due to the re-staging of certain products.The BCH segment has established a brand prioritization strategy to address these market dynamics, with an objective to balance the cost of advertising and promotion investments with expected contributions from category sales.
|
|
•
|
Our expectations for 2016 new product sales are consistent with those communicated in our first quarter Form 10-Q, but continue to remain lower than anticipated as of December 31, 2015. Several new product launches have been delayed due to the regulatory approval process for certain new products in the U.S. and modifications to market share penetration and timing assumptions for new products in our Rx and BCH segments.
|
There can be no assurance that we will not continue to experience challenges related to our segments, and these challenges could have a material impact on our business, cash flows, and results of operations, result in impairment charges and the market value of our ordinary shares and/or debt securities
may decline.
We have acquired significant intangible assets and goodwill that could become impaired or subject us to losses and may result in an adverse impact on our results of operations.
We have recorded significant intangible assets and goodwill on our balance sheet as a result of previous acquisitions, which could become impaired and lead to material charges in the future. We regularly review our intangible assets and goodwill for impairment. Goodwill and indefinite-lived intangible assets are subject to impairment review on an annual basis and whenever impairment indicators are present.
During our impairment testing for the transition period of
June 28, 2015
to
December 31, 2015
, we identified an impairment of certain indefinite-lived intangible assets purchased in conjunction with the Omega acquisition based on management’s expectations of the prospects for future revenues, profits, and cash flows associated with these assets. The assessment resulted in an impairment charge of
$185.1 million
within our BCH segment, which represented the difference between the carrying amount of the intangible assets and their estimated fair value. See our Transition Report on Form 10-KT filed February 25, 2016 for a further discussion of this impairment charge.
55
Perrigo Company plc
- Item 1A
Risk Factors
In connection with the preparation of our financial statements for the three-month period ended April 2, 2016, we identified indicators of impairment associated with certain indefinite-lived intangible assets acquired in conjunction with the Omega acquisition. The primary impairment indicators included the decline in our 2016 performance expectations and a reduction in our long-range revenue growth forecast. The assessment utilized the excess earnings method to determine fair value and resulted in an impairment charge of
$273.4 million
in Impairment charges on the Condensed Consolidated Statements of Operations within our BCH segment, which represented the difference between the carrying amount of the intangible assets and their estimated fair value. The change in fair value from previous estimates was due primarily to the changes in the market and performance of the brands such that the evaluation of brand prioritization and product extensions or launches in new regions are being more focused to maximize the potential of all brands in the segment's portfolio. The main assumptions supporting the fair value of these assets and cash flow projections included revenue growth based on product line extensions, product life cycle strategies, and geographical expansion within the markets in which the BCH segment distributes products, gross margins consistent with historical trends, and advertising and promotion investments largely consistent with the segment's growth plans.
In connection with the preparation of our financial statements for the three-month period ended April 2, 2016, we identified indicators of goodwill impairment in our BCH - rest of world (“BCH - ROW”) reporting unit, which comprises primarily operations attributable to the Omega acquisition in all geographic regions except for Belgium. The primary impairment indicators included the decline in our 2016 performance expectations and a reduction in our long-range revenue growth forecast. Step one of the goodwill impairment test involved determining the fair value of the reporting unit using a discounted cash flow technique and comparing it to the reporting unit’s carrying value. The main assumptions supporting the cash flow projections used to determine the reporting unit’s fair value included revenue growth based on product line extensions, product life cycle strategies, and geographical expansion within the markets in which the reporting unit distributes products, gross margins consistent with historical trends, and advertising and promotion investments largely consistent with the reporting unit's growth plans. The BCH-ROW reporting unit did not pass step one of goodwill impairment testing. The change in fair value from previous estimates was due primarily to the changes in the market and performance of the brands such that the evaluation of brand prioritization and product extensions or launches in new regions are being more focused to maximize the potential of all brands in the segment's portfolio.
The second step of the goodwill impairment test required that we determine the implied fair value of the BCH - ROW reporting unit’s goodwill, which involved determining the value of the reporting unit’s individual assets and liabilities. Due to the complex and time-consuming nature of step two, based on our evaluation and initial estimates of the fair values of the assets and liabilities and the deficit of the fair value when compared to the related book value, we recorded an estimated impairment charge of
$193.6 million
in Impairment charges on the Condensed Consolidated Statements of Operations for the three months ended April 2, 2016. We finalized the step two fair value calculation during the three months ended July 2, 2016, which resulted in a
$30.3 million
reduction to the estimated impairment charge recorded last quarter.
While no impairment charges were recorded as a result of the goodwill impairment testing for the transition period of
June 28, 2015
to
December 31, 2015
, our Specialty Sciences reporting unit's fair value exceeded the carrying value by less than 10%. Management evaluated the primary source of cash flow in this segment, the Tysabri
®
royalty stream, based on a combination of factors including independent external research, information provided from our royalty partner, and internal estimates. Based on this information, management’s assessment of future cash flow from this royalty stream has been reduced primarily due to anticipated new competitors entering the market and unfavorable currency exchange effects. In February 2016, a competitor's pipeline product, Ocrevus
®
, received breakthrough therapy designation from the FDA and could potentially be approved in 2016. The product would compete with Tysabri
®
and could have a significant negative impact on the royalty we receive from Biogen Idec Inc. and the performance of the Specialty Sciences segment. We continue to monitor the progress of all potential competing products and assess the reporting unit for potential impairment should impairment indicators arise, as applicable, and at least annually during our fourth quarter impairment testing.
We perform an impairment analysis on intangible assets subject to amortization when there is an indication that the carrying amount of any individual asset may not be recoverable. Any significant change in market conditions, estimates or judgments used to determine expected future cash flows that indicates a reduction in carrying value may give rise to impairment in the period that the change becomes known. The carrying value for certain intangible assets and goodwill equals fair value, as such, any further deterioration in those assets' fair value
56
Perrigo Company plc
- Item 1A
Risk Factors
would lead to a further impairment charge. Future performance different from the assumptions utilized in our quantitative analyses may result in additional changes in the fair value. We will continue to monitor and assess these assets for potential impairment should further impairment indicators arise, as applicable, and at least annually during our fourth quarter annual impairment testing.
See
Part I. Item 1. Note 3
for more information on the above impairment charges.
We identified a material weakness in our internal controls over financial reporting; failure to remediate the material weakness could negatively impact our business and the price of our ordinary shares.
In connection with the preparation of our financial statements for the three-month period ended April 2, 2016, we concluded that a material weakness existed in our internal controls over financial reporting, as described under
Part II. Item 4. “Controls and Procedures.”
More specifically, we did not design and maintain effective management review controls that operated at a sufficient level of precision to ensure interim income taxes are properly recorded and disclosed in our consolidated financial statements in connection with the recording of an indefinite-lived intangible asset impairment and an estimated goodwill impairment for the three months ended April 2, 2016. In response to the identified material weakness, and with oversight from our Audit Committee, we are focused on improving our internal controls over financial reporting and remedying the identified material weakness.
To remediate the material weakness in internal control over financial reporting described above, with oversight from the Audit Committee, we have:
|
•
|
Reviewed the processes and controls in place to measure and record income taxes to enhance the efficiency and effectiveness of the design and operation of those controls;
|
|
•
|
Enhanced monitoring activities related to income taxes by adding additional internal controls and checklists; and
|
|
•
|
Evaluated and enhanced the level of precision in the management review controls related to income taxes by adding additional levels of review.
|
We are in the process of testing and evaluating the design and operating effectiveness of the control procedures and are assessing the effectiveness of the remediation plan, which we began implementing during the three months ended July 2, 2016. Until the remediation actions are fully implemented and the operational effectiveness of related internal controls is validated through testing, the material weakness described above will continue to exist. We will continue to monitor the effectiveness of these remediation measures and will make any changes and take such other actions that we deem appropriate given the circumstances. We cannot assure you that we will be able to remediate this material weakness on a timely basis or at all. Failure to remediate this material weakness or difficulties encountered during implementation of these remediation efforts could result in material misstatements in or a future restatement of our financial statements, a failure to meet our reporting obligations, or the loss of investor confidence in our reported financial information, any of which could negatively impact our business and the price of our ordinary shares.
Our global operations could be negatively impacted by the economic and political instability caused by the United Kingdom ("UK") vote to leave the European Union ("EU").
The UK held a referendum on June 23, 2016 on its membership in the EU. A majority of UK voters voted to exit the EU (“Brexit”), and negotiations will commence to determine the future terms of the UK’s relationship with the EU, subject to a negotiation period that could last up to two years after the UK government formally initiates the withdraw process, including the terms of trade between the UK and the EU. Brexit has created significant instability and volatility in the global financial markets and could adversely affect European or worldwide economic or market conditions. Although it is unknown what those terms will be, they may impair the ability of our operations in the EU to transact business in the future in the UK, and similarly the ability of our UK operations to transact business in the future in the EU. Specifically, it is possible that there will be greater restrictions on imports and exports between the UK and EU countries and increased regulatory complexities. These changes may adversely affect our operations and financial results. In addition, Brexit could lead to legal uncertainty and potentially divergent national laws and regulations as the UK determines which EU laws to replace or replicate. Further, among other things, Brexit could reduce consumer spending in the UK and the EU, which could result in decreased demand for our products. Any of
57
Perrigo Company plc
- Item 1A
Risk Factors
these effects of Brexit, and others we cannot anticipate, could adversely affect our business, business opportunities, results of operations, financial condition and cash flows.
I
TEM 5.
OTHER INFORMATION
On August 9, 2016, we issued a notice of redemption to redeem all of the $500.0 million in aggregate principal amount of then outstanding 1.300% senior notes due 2016 (the “1.300% 2016 Notes”). We expect to redeem all of the 1.300% 2016 Notes on September 29, 2016 using available cash on hand.
ITEM 6.
EXHIBITS
|
Exhibit
Number
|
Description
|
|
|
3.1
|
Certificate of Incorporation of Perrigo Company plc (formerly known as Perrigo Company Limited) (incorporated by reference from Exhibit 4.1 to the Company's Registration Statement on Form S-8 filed on December 19, 2013).
|
|
|
3.2
|
Memorandum and Articles of Association of Perrigo Company plc, as amended (incorporated by reference from Exhibit 3.2 to the Company's Transition Report on Form 10-KT filed on February 25, 2016).
|
|
|
10.1
|
Amendment No. 3, effective as of April 24, 2016, to the Employment Agreement, effective as of October 9, 2006, by and between Perrigo Company and Joseph C. Papa (incorporated by reference from Exhibit 10.1 to the Company’s Current Report on Form 8-K filed on April 25, 2016).
|
|
|
10.2
|
Mutual Agreement dated April 27, 2016 among the Company, Omega Pharma NV, Perrigo Ireland 2 Ltd, Mylecke Management, Art & Invest NV, Alychlo NV and Marc Coucke (incorporated by reference from Exhibit 10.1 to the Company’s Current Report on Form 8-K filed on April 28, 2016).
|
|
|
10.3
|
Amendment dated April 27, 2016 to the Agreement for the Sale and Purchase of 685,348,257 Shares Of Omega Pharma Invest NV, dated as of November 6, 2014, by and among the Company, Alychlo NV and Holdco I BE NV (incorporated by reference from Exhibit 10.2 to the Company’s Current Report on Form 8-K filed on April 28, 2016).
|
|
|
10.4
|
Amendment dated April 27, 2016 to the Non-Compete Agreement between the Company and Marc Coucke dated March 30, 2015 (incorporated by reference from Exhibit 10.3 to the Company’s Current Report on Form 8-K filed on April 28, 2016).
|
|
|
10.5
|
Amendment dated April 27, 2016 to the Lock-up Agreement between the Company and Alychlo NV dated March 30, 2015 (incorporated by reference from Exhibit 10.4 to the Company’s Current Report on Form 8-K filed on April 28, 2016).
|
|
|
10.6
|
Amendment No. 4, effective as of May 6, 2016, to the Employment Agreement, effective as of October 9, 2006, by and between Perrigo Company and Joseph C. Papa (incorporated by reference from Exhibit 10.5 to the Company’s Quarterly Report on Form 10-Q filed on May 16, 2016).
|
|
|
10.7
|
Waiver to Note Purchase Agreement, between Omega Pharma NV and the Prudential Insurance Company of America, dated May 16, 2016, in connection with the Note Purchase Agreement, dated May 19, 2011 (as amended by the First Amendment and Consent to the Note Purchase Agreement, dated as of October 7, 2011), with respect to the issuance and sale of EUR 135,043,889 aggregate principal amount of Omega’s 5.1045% senior notes due 2023 (incorporated by reference from Exhibit 10.7 to the Company’s Quarterly Report on Form 10-Q filed on May 16, 2016).
|
|
|
10.8
|
Amendment dated May 23, 2016 to the Waiver to Note Purchase Agreement, between Omega Pharma NV and the Prudential Insurance Company of America, dated May 16, 2016, in connection with the Note Purchase Agreement, dated May 19, 2011 (as amended by the First Amendment and Consent to the Note Purchase Agreement, dated as of October 7, 2011), with respect to the issuance and sale of EUR 135,043,889 aggregate principal amount of Omega’s 5.1045% senior notes due 2023 (filed herewith).
|
|
|
10.9
|
Perrigo Company plc U.S. Severance Policy, as amended and restated effective June 14, 2016 (incorporated by reference from Exhibit 10.1 to the Company’s Current Report on Form 8-K filed on June 17, 2016).
|
|
58
Perrigo Company plc
- Part II - Item 6
Exhibits
|
10.10
|
Perrigo Company plc Change in Control Severance Policy for U.S. Employees, as amended and restated effective June 14, 2016 (incorporated by reference from Exhibit 10.2 to the Company’s Current Report on Form 8-K filed on June 17, 2016).
|
|
|
10.11
|
Amendment No. 2 to the Perrigo Company Annual Incentive Plan, effective June 14, 2016 (incorporated by reference from Exhibit 10.3 to the Company’s Current Report on Form 8-K filed on June 17, 2016).
|
|
|
10.12
|
Second Waiver to Note Purchase Agreement, between Omega Pharma NV and the Prudential Insurance Company of America, dated June 7, 2016, in connection with the Note Purchase Agreement, dated May 19, 2011 (as amended by the First Amendment and Consent to the Note Purchase Agreement, dated as of October 7, 2011 and the Waiver to Note Purchase Agreement, dated as of May 16, 2016, as amended by a letter agreement dated May 23, 2016), with respect to the issuance and sale of EUR 135,043,889 aggregate principal amount of Omega’s 5.1045% senior notes due 2023 (filed herewith).
|
|
|
31.1
|
Rule 13a-14(a) Certification by John T. Hendrickson, Chief Executive Officer (filed herewith).
|
|
|
31.2
|
Rule 13a-14(a) Certification by Judy L. Brown, Executive Vice President, Business Operations and Chief Financial Officer (filed herewith).
|
|
|
32
|
Certification Pursuant to 18 United States Code 1350 and Rule 13a-14(b) of the Securities Exchange Act of 1934 (furnished herewith).
|
|
|
101.INS
|
XBRL Instance Document.
|
|
|
101.SCH
|
XBRL Taxonomy Extension Schema Document.
|
|
|
101.CAL
|
XBRL Taxonomy Extension Calculation Linkbase Document.
|
|
|
101.DEF
|
XBRL Taxonomy Extension Definition Linkbase Document.
|
|
|
101.LAB
|
XBRL Taxonomy Extension Label Linkbase Document.
|
|
|
101.PRE
|
XBRL Taxonomy Extension Presentation Linkbase Document.
|
|
59
SIGNATURES
Pursuant to the requirements of the Securities Exchange Act of 1934, the registrant has duly caused this report to be signed on its behalf by the undersigned thereunto duly authorized.
|
PERRIGO COMPANY PLC
|
|||
|
(Registrant)
|
|||
|
Date:
|
August 10, 2016
|
By: /s/ John T. Hendrickson
|
|
|
John T. Hendrickson
|
|||
|
Chief Executive Officer
|
|||
|
(Principal Executive Officer)
|
|||
|
Date:
|
August 10, 2016
|
By: /s/ Judy L. Brown
|
|
|
Judy L. Brown
|
|||
|
Executive Vice President, Business Operations and Chief Financial Officer
|
|||
|
(Principal Accounting and Financial Officer)
|
|||
60
TABLE OF CONTENTS
Part I. Financial InformationItem 1. Financial Statements (unaudited)Note 1 Summary Of Significant Accounting PoliciesNote 2 AcquisitionsNote 3 Goodwill and Other Intangible AssetsNote 4 - Accounts Receivable FactoringNote 5 InventoriesNote 6 Fair Value MeasurementsNote 7 InvestmentsNote 8 Derivative Instruments and Hedging ActivitiesNote 9 Assets Held For SaleNote 10 IndebtednessNote 11 Earnings Per Share and Shareholders' EquityNote 12 Accumulated Other Comprehensive Income (loss)Note 13 Income TaxesNote 14 Commitments and ContingenciesNote 15 Collaboration Agreements and Other Contractual ArrangementsNote 16 Restructuring ChargesNote 17 Segment InformationNote 18 Subsequent EventsItem 2. Management's Discussion and Analysis Of Financial Condition and Results Of OperationsItem 3. Quantitative and Qualitative Disclosures About Market RiskItem 4. Controls and ProceduresPart II. Other InformationPart IIItem 1. Legal ProceedingsItem 1A. Risk FactorsItem 5. Other InformationItem 6. Exhibits