PERRIGO CO PLC
10-Ks and 10-Qs
|
|
|
|
|
|
|
|
|
|
|
|
|
|
|
|
|
|
|
|
|
|
|
|
|
|
|
|
|
|
|
|
|
|
|
|
|
|
|
|
|
|
|
|
UNITED STATES
SECURITIES AND EXCHANGE COMMISSION
WASHINGTON, D.C. 20549
_______________________________________________
FORM 10-Q
_______________________________________________
|
[X]
|
QUARTERLY REPORT PURSUANT TO SECTION 13 OR 15(d) OF THE SECURITIES EXCHANGE ACT OF 1934
|
OR
|
[ ]
|
TRANSITION REPORT PURSUANT TO SECTION 13 OR 15(d) OF THE SECURITIES EXCHANGE ACT OF 1934
|
Commission file number 001-36353
_______________________________________________
Perrigo Company plc
(Exact name of registrant as specified in its charter)
_______________________________________________
|
Ireland
|
|
Not Applicable
|
|
(State or other jurisdiction of
incorporation or organization)
|
|
(I.R.S. Employer
Identification No.)
|
|
Treasury Building, Lower Grand Canal Street, Dublin 2, Ireland
|
|
-
|
|
(Address of principal executive offices)
|
|
(Zip Code)
|
(Registrant’s telephone number, including area code)
Not Applicable
(Former name, former address and former fiscal year, if changed since last report)
________________________________________
Indicate by check mark whether the registrant (1) has filed all reports required to be filed by Section 13 or 15(d) of the Securities Exchange Act of 1934 during the preceding 12 months (or for such shorter period that the registrant was required to file such report), and (2) has been subject to such filing requirements for the past 90 days. YES [X] NO [ ]
Indicate by check mark whether the registrant has submitted electronically and posted on its corporate Web site, if any, every Interactive Data File required to be submitted and posted pursuant to Rule 405 of Regulation S-T (§232.405 of this chapter) during the preceding 12 months (or for such shorter period that the registrant was required to submit and post such files). YES [X] NO [ ]
Indicate by check mark whether the registrant is a large accelerated filer, an accelerated filer, a non-accelerated filer, a smaller reporting company, or an emerging growth company. See definitions of “large accelerated filer”, “accelerated filer”, “smaller reporting company”, and "emerging growth company" in Rule 12b-2 of the Exchange Act.
|
Large accelerated filer
|
[X]
|
Accelerated filer
|
[ ]
|
Non-accelerated filer
|
[ ]
|
(Do not check if smaller reporting company)
|
||||
|
Smaller reporting company
|
[ ]
|
Emerging growth company
|
[ ]
|
|||||||
|
If an emerging growth company, indicate by check mark if the registrant has elected not to use the extended transition period for complying with any new or revised financial accounting standards provided pursuant to Section 13(a) of the Exchange Act.
|
[ ]
|
|||||||||
Indicate by check mark whether the registrant is a shell company (as defined in Rule 12b-2 of the Exchange Act). [ ] YES [X] NO
As of
November 3, 2017
, there were
140,840,721
ordinary shares outstanding.
PERRIGO COMPANY PLC
FORM 10-Q
INDEX
|
PAGE
NUMBER
|
||
|
PART I. FINANCIAL INFORMATION
|
||
|
1
|
||
|
2
|
||
|
3
|
||
|
4
|
||
|
5
|
||
|
6
|
||
|
7
|
||
|
8
|
||
|
9
|
||
|
10
|
||
|
11
|
||
|
12
|
||
|
13
|
||
|
14
|
||
|
15
|
||
|
16
|
||
|
PART II. OTHER INFORMATION
|
||
CAUTIONARY NOTE REGARDING FORWARD-LOOKING STATEMENTS
Certain statements in this report are “forward-looking statements” within the meaning of Section 21E of the Securities Exchange Act of 1934, as amended, and are subject to the safe harbor created thereby. These statements relate to future events or our future financial performance and involve known and unknown risks, uncertainties and other factors that may cause our, or our industry’s actual results, levels of activity, performance or achievements to be materially different from those expressed or implied by any forward-looking statements. In particular, statements about our expectations, beliefs, plans, objectives, assumptions, future events or future performance contained in this report, including certain statements contained in “Management’s Discussion and Analysis of Financial Condition and Results of Operations” are forward-looking statements. In some cases, forward-looking statements can be identified by terminology such as “may,” “will,” “could,” “would,” “should,” “expect,” “plan,” “anticipate,” “intend,” “believe,” “estimate,” “predict,” “potential” or the negative of those terms or other comparable terminology.
Please see Item 1A of our Form 10-K for the year ended December 31, 2016 for a discussion of certain important risk factors that relate to forward-looking statements contained in this report and Part II, Item 1A of this Form 10-Q. We have based these forward-looking statements on our current expectations, assumptions, estimates and projections. While we believe these expectations, assumptions, estimates and projections are reasonable, such forward-looking statements are only predictions and involve known and unknown risks and uncertainties, many of which are beyond our control, including: the timing, amount and cost of any share repurchases; future impairment charges; the success of management transition; customer acceptance of new products; competition from other industry participants, some of whom have greater marketing resources or larger market shares in certain product categories than we do; pricing pressures from customers and consumers; potential third-party claims and litigation, including litigation relating to our restatement of previously-filed financial information; potential impacts of ongoing or future government investigations and regulatory initiatives; resolution of uncertain tax positions; the impact of U.S. tax reform legislation; general economic conditions; fluctuations in currency exchange rates and interest rates; the consummation of announced acquisitions or dispositions, and our ability to realize the desired benefits thereof; and the ability to execute and achieve the desired benefits of announced cost-reduction efforts and other initiatives. In addition, we may identify and be unable to remediate one or more material weaknesses in our internal control over financial reporting. Furthermore, we and/or our subsidiaries may incur additional tax liabilities in respect of 2016 and prior years as a result of any restatement or may be found to have breached certain provisions of Irish company legislation in respect of prior financial statements and if so may incur additional expenses and penalties.
These and other important factors, including those discussed in our Form 10-K for the year ended December 31, 2016, in this report under “Risk Factors” and in any subsequent filings with the United States Securities and Exchange Commission, may cause actual results, performance or achievements to differ materially from those expressed or implied by these forward-looking statements. The forward-looking statements in this report are made only as of the date hereof, and unless otherwise required by applicable securities laws, we disclaim any intention or obligation to update or revise any forward-looking statements, whether as a result of new information, future events, or otherwise.
TRADEMARKS, TRADE NAMES AND SERVICE MARKS
This report contains trademarks, trade names and service marks that are the property of Perrigo Company plc, as well as, for informational purposes, trademarks, trade names, and service marks that are the property of other organizations. Solely for convenience, certain trademarks, trade names, and service marks referred to in this report appear without the
®
,
™ and
SM
symbols, but those references are not intended to indicate that we or the applicable owner, as the case may be, will not assert, to the fullest extent under applicable law, our or their rights to such trademarks, trade names, and service marks.
1
Perrigo Company plc
- Item 1
PERRIGO COMPANY PLC
(in millions, except per share amounts)
(unaudited)
|
|
Three Months Ended
|
Nine Months Ended
|
|||||||||||||
|
|
September 30,
2017 |
October 1,
2016 |
September 30,
2017 |
October 1,
2016 |
|||||||||||
|
Net sales
|
$
|
1,231.3
|
|
$
|
1,261.6
|
|
$
|
3,663.1
|
|
$
|
3,949.3
|
|
|||
|
Cost of sales
|
733.5
|
|
777.1
|
|
2,196.4
|
|
2,385.2
|
|
|||||||
|
Gross profit
|
497.8
|
|
484.5
|
|
1,466.7
|
|
1,564.1
|
|
|||||||
|
Operating expenses
|
|||||||||||||||
|
Distribution
|
21.5
|
|
21.6
|
|
64.2
|
|
65.9
|
|
|||||||
|
Research and development
|
38.4
|
|
50.2
|
|
120.8
|
|
142.5
|
|
|||||||
|
Selling
|
143.5
|
|
154.6
|
|
454.1
|
|
506.9
|
|
|||||||
|
Administration
|
123.3
|
|
105.4
|
|
326.9
|
|
317.2
|
|
|||||||
|
Impairment charges
|
7.8
|
|
1,614.4
|
|
47.4
|
|
2,028.8
|
|
|||||||
|
Restructuring
|
3.8
|
|
6.6
|
|
54.7
|
|
17.9
|
|
|||||||
|
Other operating income
|
(2.9
|
)
|
—
|
|
(41.0
|
)
|
—
|
|
|||||||
|
Total operating expenses
|
335.4
|
|
1,952.8
|
|
1,027.1
|
|
3,079.2
|
|
|||||||
|
Operating income (loss)
|
162.4
|
|
(1,468.3
|
)
|
439.6
|
|
(1,515.1
|
)
|
|||||||
|
Change in financial assets
|
2.6
|
|
377.4
|
|
24.2
|
|
1,492.6
|
|
|||||||
|
Interest expense, net
|
34.7
|
|
54.6
|
|
133.1
|
|
163.2
|
|
|||||||
|
Other (income) expense, net
|
(3.6
|
)
|
1.0
|
|
(1.1
|
)
|
32.4
|
|
|||||||
|
Loss on extinguishment of debt
|
—
|
|
0.7
|
|
135.2
|
|
1.1
|
|
|||||||
|
Income (loss) before income taxes
|
128.7
|
|
(1,902.0
|
)
|
148.2
|
|
(3,204.4
|
)
|
|||||||
|
Income tax expense (benefit)
|
84.2
|
|
(311.8
|
)
|
101.8
|
|
(550.7
|
)
|
|||||||
|
Net income (loss)
|
$
|
44.5
|
|
$
|
(1,590.2
|
)
|
$
|
46.4
|
|
$
|
(2,653.7
|
)
|
|||
|
Earnings (loss) per share
|
|||||||||||||||
|
Basic
|
0.31
|
|
(11.10
|
)
|
$
|
0.33
|
|
$
|
(18.53
|
)
|
|||||
|
Diluted
|
$
|
0.31
|
|
$
|
(11.10
|
)
|
$
|
0.32
|
|
$
|
(18.53
|
)
|
|||
|
Weighted-average shares outstanding
|
|||||||||||||||
|
Basic
|
141.3
|
|
143.3
|
|
142.5
|
|
143.2
|
|
|||||||
|
Diluted
|
141.7
|
|
143.3
|
|
142.8
|
|
143.2
|
|
|||||||
|
Dividends declared per share
|
$
|
0.160
|
|
$
|
0.145
|
|
$
|
0.480
|
|
$
|
0.435
|
|
|||
See accompanying Notes to the Condensed Consolidated Financial Statements
2
Perrigo Company plc
- Item 1
PERRIGO COMPANY PLC
CONDENSED CONSOLIDATED STATEMENTS OF COMPREHENSIVE INCOME (LOSS)
(in millions)
(unaudited)
|
Three Months Ended
|
Nine Months Ended
|
||||||||||||||
|
September 30,
2017 |
October 1,
2016 |
September 30,
2017 |
October 1,
2016 |
||||||||||||
|
Net income (loss)
|
$
|
44.5
|
|
$
|
(1,590.2
|
)
|
$
|
46.4
|
|
$
|
(2,653.7
|
)
|
|||
|
Other comprehensive income:
|
|||||||||||||||
|
Foreign currency translation adjustments
|
69.9
|
|
27.5
|
|
289.9
|
|
71.5
|
|
|||||||
|
Change in fair value of derivative financial instruments, net of tax
|
0.1
|
|
3.6
|
|
8.7
|
|
(3.5
|
)
|
|||||||
|
Change in fair value of investment securities, net of tax
|
(8.1
|
)
|
9.8
|
|
(24.4
|
)
|
18.4
|
|
|||||||
|
Change in post-retirement and pension liability, net of tax
|
(1.2
|
)
|
(0.2
|
)
|
(1.2
|
)
|
0.4
|
|
|||||||
|
Other comprehensive income, net of tax
|
60.7
|
|
40.7
|
|
273.0
|
|
86.8
|
|
|||||||
|
Comprehensive income (loss)
|
$
|
105.2
|
|
$
|
(1,549.5
|
)
|
$
|
319.4
|
|
$
|
(2,566.9
|
)
|
|||
See accompanying Notes to the Condensed Consolidated Financial Statements
3
Perrigo Company plc
- Item 1
PERRIGO COMPANY PLC
(in millions, except share and per share amounts)
(unaudited)
|
September 30,
2017 |
December 31,
2016 |
||||||
|
Assets
|
|||||||
|
Cash and cash equivalents
|
$
|
775.9
|
|
$
|
622.3
|
|
|
|
Accounts receivable, net of allowance for doubtful accounts of $6.2 million and $6.3 million, respectively
|
1,076.6
|
|
1,176.0
|
|
|||
|
Inventories
|
821.9
|
|
795.0
|
|
|||
|
Prepaid expenses and other current assets
|
297.4
|
|
212.0
|
|
|||
|
Total current assets
|
2,971.8
|
|
2,805.3
|
|
|||
|
Property, plant and equipment, net
|
822.3
|
|
870.1
|
|
|||
|
Financial assets
|
—
|
|
2,350.0
|
|
|||
|
Goodwill and other indefinite-lived intangible assets
|
4,255.4
|
|
4,163.9
|
|
|||
|
Other intangible assets, net
|
3,347.4
|
|
3,396.8
|
|
|||
|
Non-current deferred income taxes
|
22.4
|
|
72.1
|
|
|||
|
Other non-current assets
|
423.3
|
|
211.9
|
|
|||
|
Total non-current assets
|
8,870.8
|
|
11,064.8
|
|
|||
|
Total assets
|
$
|
11,842.6
|
|
$
|
13,870.1
|
|
|
|
Liabilities and Shareholders’ Equity
|
|||||||
|
Accounts payable
|
$
|
477.1
|
|
$
|
471.7
|
|
|
|
Payroll and related taxes
|
133.4
|
|
115.8
|
|
|||
|
Accrued customer programs
|
368.8
|
|
380.3
|
|
|||
|
Accrued liabilities
|
274.6
|
|
263.3
|
|
|||
|
Accrued income taxes
|
61.5
|
|
32.4
|
|
|||
|
Current indebtedness
|
417.1
|
|
572.8
|
|
|||
|
Total current liabilities
|
1,732.5
|
|
1,836.3
|
|
|||
|
Long-term debt, less current portion
|
3,275.7
|
|
5,224.5
|
|
|||
|
Non-current deferred income taxes
|
357.7
|
|
389.9
|
|
|||
|
Other non-current liabilities
|
434.9
|
|
461.8
|
|
|||
|
Total non-current liabilities
|
4,068.3
|
|
6,076.2
|
|
|||
|
Total liabilities
|
5,800.8
|
|
7,912.5
|
|
|||
|
Commitments and contingencies - Note 14
|
|||||||
|
Shareholders’ equity
|
|||||||
|
Controlling interest:
|
|||||||
|
Preferred shares, $0.0001 par value, 10 million shares authorized
|
—
|
|
—
|
|
|||
|
Ordinary shares, €0.001 par value, 10 billion shares authorized
|
7,900.1
|
|
8,135.0
|
|
|||
|
Accumulated other comprehensive income (loss)
|
191.2
|
|
(81.8
|
)
|
|||
|
Retained earnings (accumulated deficit)
|
(2,049.6
|
)
|
(2,095.1
|
)
|
|||
|
Total controlling interest
|
6,041.7
|
|
5,958.1
|
|
|||
|
Noncontrolling interest
|
0.1
|
|
(0.5
|
)
|
|||
|
Total shareholders’ equity
|
6,041.8
|
|
5,957.6
|
|
|||
|
Total liabilities and shareholders' equity
|
$
|
11,842.6
|
|
$
|
13,870.1
|
|
|
|
Supplemental Disclosures of Balance Sheet Information
|
|||||||
|
Ordinary shares, issued and outstanding (in millions)
|
140.8
|
|
143.4
|
|
|||
See accompanying Notes to the Condensed Consolidated Financial Statements
4
Perrigo Company plc
- Item 1
PERRIGO COMPANY PLC
(in millions)
(unaudited)
|
Nine Months Ended
|
|||||||
|
|
September 30,
2017 |
October 1,
2016 |
|||||
|
Cash Flows From (For) Operating Activities
|
|||||||
|
Net income (loss)
|
$
|
46.4
|
|
$
|
(2,653.7
|
)
|
|
|
Adjustments to derive cash flows
|
|||||||
|
Depreciation and amortization
|
333.1
|
|
338.4
|
|
|||
|
Share-based compensation
|
28.1
|
|
15.3
|
|
|||
|
Impairment charges
|
47.4
|
|
2,028.8
|
|
|||
|
Change in financial assets
|
24.2
|
|
1,492.6
|
|
|||
|
Loss on extinguishment of debt
|
135.2
|
|
1.1
|
|
|||
|
Restructuring charges
|
54.7
|
|
17.9
|
|
|||
|
Deferred income taxes
|
(16.3
|
)
|
(674.1
|
)
|
|||
|
Amortization of debt premium
|
(18.4
|
)
|
(24.6
|
)
|
|||
|
Other non-cash adjustments, net
|
(27.2
|
)
|
34.5
|
|
|||
|
Subtotal
|
607.2
|
|
576.2
|
|
|||
|
Increase (decrease) in cash due to:
|
|||||||
|
Accounts receivable
|
38.4
|
|
113.0
|
|
|||
|
Inventories
|
(28.3
|
)
|
25.1
|
|
|||
|
Accounts payable
|
(6.0
|
)
|
(57.7
|
)
|
|||
|
Payroll and related taxes
|
(36.7
|
)
|
(40.0
|
)
|
|||
|
Accrued customer programs
|
(15.8
|
)
|
(73.7
|
)
|
|||
|
Accrued liabilities
|
(18.8
|
)
|
(90.0
|
)
|
|||
|
Accrued income taxes
|
(61.5
|
)
|
5.2
|
|
|||
|
Other, net
|
3.5
|
|
(9.4
|
)
|
|||
|
Subtotal
|
(125.2
|
)
|
(127.5
|
)
|
|||
|
Net cash from operating activities
|
482.0
|
|
448.7
|
|
|||
|
Cash Flows From (For) Investing Activities
|
|||||||
|
Proceeds from royalty rights
|
86.4
|
|
259.5
|
|
|||
|
Acquisitions of businesses, net of cash acquired
|
—
|
|
(436.8
|
)
|
|||
|
Asset acquisitions
|
—
|
|
(65.1
|
)
|
|||
|
Additions to property, plant and equipment
|
(55.2
|
)
|
(84.6
|
)
|
|||
|
Net proceeds from sale of business and other assets
|
46.7
|
|
58.5
|
|
|||
|
Proceeds from sale of the Tysabri
®
financial asset
|
2,200.0
|
|
—
|
|
|||
|
Other investing, net
|
(5.8
|
)
|
(1.0
|
)
|
|||
|
Net cash from (for) investing activities
|
2,272.1
|
|
(269.5
|
)
|
|||
|
Cash Flows From (For) Financing Activities
|
|||||||
|
Issuances of long-term debt
|
—
|
|
1,190.3
|
|
|||
|
Payments on long-term debt
|
(2,243.7
|
)
|
(545.8
|
)
|
|||
|
Borrowings (repayments) of revolving credit agreements and other financing, net
|
—
|
|
(803.6
|
)
|
|||
|
Deferred financing fees
|
(4.2
|
)
|
(2.8
|
)
|
|||
|
Premium on early debt retirement
|
(116.1
|
)
|
(0.6
|
)
|
|||
|
Issuance of ordinary shares
|
0.5
|
|
8.2
|
|
|||
|
Repurchase of ordinary shares
|
(191.5
|
)
|
—
|
|
|||
|
Cash dividends
|
(68.7
|
)
|
(62.4
|
)
|
|||
|
Other financing
|
2.7
|
|
(17.4
|
)
|
|||
|
Net cash (for) financing activities
|
(2,621.0
|
)
|
(234.1
|
)
|
|||
|
Effect of exchange rate changes on cash and cash equivalents
|
20.5
|
|
(0.2
|
)
|
|||
|
Net increase (decrease) in cash and cash equivalents
|
153.6
|
|
(55.1
|
)
|
|||
|
Cash and cash equivalents, beginning of period
|
622.3
|
|
417.8
|
|
|||
|
Cash and cash equivalents, end of period
|
$
|
775.9
|
|
$
|
362.7
|
|
|
See accompanying Notes to the Condensed Consolidated Financial Statements
5
Perrigo Company plc
- Item 1
Note 1
NOTE 1 –
SUMMARY OF SIGNIFICANT ACCOUNTING POLICIES
General Information
The Company
Perrigo Company plc was incorporated under the laws of Ireland on June 28, 2013 and became the successor registrant of Perrigo Company, a Michigan corporation, on December 18, 2013 in connection with the acquisition of Elan Corporation, plc ("Elan"). Unless the context requires otherwise, the terms "Perrigo," the "Company," "we," "our," "us," and similar pronouns used herein refer to Perrigo Company plc, its subsidiaries, and all predecessors of Perrigo Company plc and its subsidiaries.
We are a leading global healthcare company, delivering value to our customers and consumers by providing Quality Affordable Healthcare Products
®
. Founded in 1887 as a packager of home remedies, we have built a unique business model that is best described as the convergence of a fast-moving consumer goods company, a high-quality pharmaceutical manufacturing organization and a world-class supply chain network. We believe we are one of the world's largest manufacturers of over-the-counter (“OTC”) healthcare products and suppliers of infant formulas for the store brand market. We also are a leading provider of branded OTC products throughout Europe and the U.S., as well as a leading producer of generic standard topical products such as creams, lotions, and gels, as well as inhalants and injections ("extended topical") prescription drugs. We are headquartered in Ireland, and sell our products primarily in North America and Europe, as well as in other markets, including Australia, Israel and China.
Basis of Presentation
The accompanying unaudited Condensed Consolidated Financial Statements have been prepared in accordance with U.S. generally accepted accounting principles ("GAAP") for interim financial information and with the instructions to Article 10 of Regulation S-X. Accordingly, they do not include all of the information and footnotes required by GAAP for complete financial statements. The unaudited Condensed Consolidated Financial Statements should be read in conjunction with the consolidated financial statements and footnotes included in our Annual Report on Form 10-K for the year ended
December 31, 2016
. In the opinion of management, all adjustments (consisting of normal recurring accruals and other adjustments) considered necessary for a fair presentation of the unaudited Condensed Consolidated Financial Statements have been included and include our accounts and the accounts of all majority-owned subsidiaries. All intercompany transactions and balances have been eliminated in consolidation.
6
Perrigo Company plc
- Item 1
Note 1
Recent Accounting Standard Pronouncements
Below are recent accounting standard updates that we are still assessing to determine the effect on our Condensed Consolidated Financial Statements. We do not believe that any other recently issued accounting standards could have a material effect on our Condensed Consolidated Financial Statements. As new accounting pronouncements are issued, we will adopt those that are applicable under the circumstances.
|
Recently Issued Accounting Standards Adopted
|
||||||
|
Standard
|
Description
|
Date of adoption
|
Effect on the Financial Statements or Other Significant Matters
|
|||
|
Clarifying the Definition of a Business
|
This update clarifies the definition of a business and addresses whether transactions should be accounted for as asset acquisitions or business combinations (or divestitures). The guidance includes an initial threshold that an acquired set of assets will not be considered a business if substantially all of the fair value of the assets acquired is concentrated in a single tangible or identifiable intangible asset (or group of similar assets). If the acquired set does not pass the initial threshold, then the guidance requires that, to be a business, the set must include an input and a substantive process that together significantly contribute to the ability to create outputs. Different factors are considered to determine whether the set includes a substantive process, such as the inclusion of an organized workforce. Further, the guidance removes language stating that a business need not include all of the inputs and processes that the seller used in operating the business.
|
January 1, 2017
|
We early adopted this new standard and will apply it prospectively when determining whether transactions should be accounted for as asset acquisitions (divestitures) or business combinations (divestitures). During the nine months ended September 30, 2017, we applied the new guidance when determining whether certain product divestitures represented sales of assets or businesses.
|
|||
|
Improvements to Employee Share-Based Payment Accounting
|
This guidance is intended to simplify several aspects of the accounting for share-based payment award transactions. It will require all income tax effects of awards to be recorded through the income statement when the awards vest or settle as opposed to certain amounts being recorded in additional paid-in capital. An entity will also have to elect whether to account for forfeitures as they occur or by estimating the number of awards expected to be forfeited and adjusting the estimate when it is likely to change (as currently required). The guidance will also increase the amount an employer can withhold to cover income taxes on awards.
|
January 1, 2017
|
We adopted this standard as of January 1, 2017. We elected to estimate the number of awards expected to be forfeited and adjust the estimate when it is likely to change, consistent with past practice. We did not change the amounts that we withhold to cover income taxes on awards. As the requirement to record all income tax effects of vested or settled awards through the income statement is prospective in nature, there was no cumulative effect of adopting the standard on our balance sheet.
|
|||
7
Perrigo Company plc
- Item 1
Note 1
|
Recently Issued Accounting Standards Not Yet Adopted
|
||||||
|
Standard
|
Description
|
Effective Date
|
Effect on the Financial Statements or Other Significant Matters
|
|||
|
Revenue from Contracts with Customers
|
The core principle of the guidance is that an entity should recognize revenue to depict the transfer of promised goods or services to customers in an amount that reflects the consideration to which the entity expects to be entitled in exchange for those goods or services. To achieve that core principle, an entity should apply the following steps: identify the contract(s) with a customer; identify the performance obligations in the contract; determine the transaction price; allocate the transaction price to the performance obligations in the contract; and recognize revenue when (or as) the entity satisfies a performance obligation. This guidance allows for two adoption methods, full retrospective approach or modified retrospective approach.
|
January 1, 2018
|
We continue to evaluate the implications of adoption of the new revenue standard on our Consolidated Financial Statements. We have completed an initial assessment and are in the process of quantifying the adoption impact, if any, related to certain topics identified through our evaluation process. Our assessment of the new revenue standard has been focused on, but has not been limited to, the concepts of over-time versus point-in-time revenue recognition patterns, variable consideration, and identification of performance obligations. We will not complete our final assessment and quantification of the impact of the new revenue standard on our Consolidated Financial Statements until the adoption date. Our analysis indicates that certain contract manufacturing and private label arrangements may require revenue recognition over-time in situations in which we produce products that have no alternative use and we have an enforceable right to payment for performance completed to date, inclusive of a reasonable profit margin. This may result in an acceleration of revenue recognition for certain contractual arrangements as compared to recognition under current accounting literature. We plan to adopt the new revenue standard effective January 1, 2018 using the modified retrospective method.
|
|||
|
Intra-Entity Asset Transfers of Assets Other Than Inventory
|
Under the new guidance, the tax impact to the seller on the profit from the transfers and the buyer’s deferred tax benefit on the increased tax basis would be recognized when the transfers occur, resulting in the recognition of expense sooner than under historical guidance. The guidance excludes intra-entity transfers of inventory. For intra-entity transfers of inventory, the Financial Accounting Standards Board ("FASB") decided to retain current GAAP, which requires an entity to recognize the income tax consequences when the inventory has been sold to an outside party.
|
January 1, 2018
|
We are currently evaluating the implications of adoption on our Consolidated Financial Statements.
|
|||
|
Financial Instruments - Recognition and Measurement of Financial Assets and Liabilities
|
The objective of this simplification update is to improve the decision usefulness of financial instrument reporting, and it principally affects accounting for equity investments currently classified as available for sale and financial liabilities where the fair value option has been elected. Entities will have to measure many equity investments at fair value and recognize changes in fair value in net income rather than other comprehensive income as required under current U.S. GAAP.
|
January 1, 2018
|
We have identified certain investments that will require an adjustment, however, at this time, we are unable to estimate the impact of adopting this standard as the significance of the impact will depend upon our equity investments as of the date of adoption.
|
|||
8
Perrigo Company plc
- Item 1
Note 1
|
Recently Issued Accounting Standards Not Yet Adopted (continued)
|
||||||
|
Standard
|
Description
|
Effective Date
|
Effect on the Financial Statements or Other Significant Matters
|
|||
|
Leases
|
This guidance was issued to increase transparency and comparability among organizations by requiring recognition of lease assets and lease liabilities on the balance sheet and disclosure of key information about leasing arrangements. For leases with a term of 12 months or less, lessees are permitted to make an election to not recognize right-of-use assets and lease liabilities. Upon adoption, lessees will apply the new standard as of the beginning of the earliest comparative period presented in the financial statements, however lessees will be able to exclude leases that expire as of the implementation date. Early adoption is permitted.
|
January 1, 2019
|
We are currently evaluating the implications of adoption on our Consolidated Financial Statements and have commenced the first step of identifying a task force to take the lead in implementing the new Lease standard.
|
|||
|
Derivatives and Hedging
|
This update was issued to enable entities to better portray the economics of their risk management activities in the financial statements and enhance the transparency and understandability of hedge results. In addition, the amendments simplify the application of hedge accounting in certain situations. Under the new rule, the entity’s ability to hedge non-financial and financial risk components is expanded. The guidance eliminates the requirement to separately measure and report hedge ineffectiveness and also eases certain documentation and assessment requirements. Early adoption is permitted.
|
January 1, 2019
|
We are currently evaluating the implications of adoption on our Consolidated Financial Statements.
|
|||
|
Measurement of Credit Losses on Financial Instruments
|
This guidance changes the impairment model for most financial assets and certain other instruments, replacing the current "incurred loss" approach with an "expected loss" credit impairment model, which will apply to most financial assets measured at amortized cost and certain other instruments, including trade and other receivables, loans, held-to-maturity debt securities, and off-balance sheet credit exposures such as letters of credit. Early adoption is permitted.
|
January 1, 2020
|
We are currently evaluating the new standard for potential impacts on our receivables, debt, and other financial instruments.
|
|||
|
Intangibles - Goodwill and Other Simplifying the Test for Goodwill
|
The objective of this update is to reduce the cost and complexity of subsequent goodwill accounting by simplifying the impairment test by removing the Step 2 requirement to perform a hypothetical purchase price allocation when the carrying value of a reporting unit exceeds its fair value. If a reporting unit’s carrying value exceeds its fair value, an entity would record an impairment charge based on that difference, limited to the amount of goodwill attributed to that reporting unit. The proposal would not change the guidance on completing Step 1 of the goodwill impairment test. The proposed guidance would be applied prospectively. Early adoption is permitted.
|
January 1, 2020
|
We are currently evaluating the implications of adoption on our Consolidated Financial Statements.
|
|||
9
Perrigo Company plc
- Item 1
Note 2
NOTE 2 –
DIVESTITURES
Current Year Divestitures
On
January 3, 2017
, we sold certain Abbreviated New Drug Applications ("ANDAs") for
$15.0 million
to a third party, which was recorded as a gain in
Other operating income
on the Condensed Consolidated Statements of Operations in our Prescription Pharmaceuticals ("RX") segment.
On
February 1, 2017
, we completed the sale of the animal health pet treats plant fixed assets within our Consumer Healthcare Americas ("
CHCA
") segment, which were previously classified as held-for sale. We received
$7.7 million
in proceeds, which resulted in an immaterial loss.
On
April 6, 2017
, we completed the sale of our India Active Pharmaceutical Ingredients ("API") business to Strides Shasun Limited. We received
$22.2 million
of proceeds, inclusive of an estimated working capital adjustment, which resulted in an immaterial gain recorded in our Other segment. Prior to closing the sale, we determined that the carrying value of the India API business exceeded its fair value less the cost to sell, resulting in an impairment charge of
$35.3 million
, which was recorded in
Impairment charges
on the Consolidated Statements of Operations for the year ended December 31, 2016.
On
August 25, 2017
, we completed the sale of our Russian business, which was previously classified as held-for-sale, to Alvogen Pharma LLC and Alvogen CEE Kft. The total sale price was
€12.7 million
(
$15.1 million
), inclusive of an estimated working capital adjustment, which resulted in an immaterial gain recorded in our
Consumer Healthcare International
("
CHCI
") segment. Prior to closing the sale, we determined that the carrying value of the Russian business exceeded its fair value less the cost to sell, resulting in an impairment charge of
$3.7 million
, which was recorded in
Impairment charges
on the Condensed Consolidated Statements of Operations for the three months ended July 1, 2017.
Prior Year Divestitures
On
August 5, 2016
, we completed the sale of our U.S. Vitamins, Minerals, and Supplements ("VMS") business within our
CHCA
segment to International Vitamins Corporation ("IVC") for
$61.8 million
inclusive of an estimated working capital adjustment. Prior to closing the sale, we determined that the carrying value of the VMS business exceeded its fair value less the cost to sell, resulting in an impairment charge of
$6.2 million
, which was recorded in
Impairment charges
on the Condensed Consolidated Statements of Operations for the year ended December 31, 2016.
NOTE 3 –
GOODWILL AND OTHER INTANGIBLE ASSETS
Goodwill
Changes in the carrying amount of goodwill, by reportable segment, were as follows (in millions):
|
Reporting Segments:
|
December 31,
2016 |
Business divestitures
|
Re-class to assets held-for-sale
|
Currency translation adjustment
|
September 30,
2017 |
|||||||||||||||
|
CHCA
|
$
|
1,810.6
|
|
$
|
—
|
|
$
|
—
|
|
$
|
2.9
|
|
$
|
1,813.5
|
|
|||||
|
CHCI
|
1,070.8
|
|
(4.1
|
)
|
—
|
|
122.3
|
|
1,189.0
|
|
||||||||||
|
RX
|
1,086.6
|
|
—
|
|
—
|
|
6.5
|
|
1,093.1
|
|
||||||||||
|
Other
|
81.4
|
|
—
|
|
(32.6
|
)
|
7.6
|
|
56.4
|
|
||||||||||
|
Total goodwill
|
$
|
4,049.4
|
|
$
|
(4.1
|
)
|
$
|
(32.6
|
)
|
$
|
139.3
|
|
$
|
4,152.0
|
|
|||||
As discussed in our Form 10-K for the year ended December 31, 2016, during the three months ended April 2, 2016 and October 1, 2016, we identified indicators of impairment for our Branded Consumer Healthcare - Rest of World ("BCH-ROW") reporting unit and recorded impairment charges of
$130.5 million
and
$675.6 million
, respectively. In addition, during the three months ended October 1, 2016, we identified impairment indicators in our Branded Consumer Healthcare - Belgium ("BCH-Belgium") reporting unit and recorded impairment charges of
$62.3 million
. The impairment charges for both reporting units were recorded within our CHCI segment.
10
Perrigo Company plc
- Item 1
Note 3
Intangible Assets
Other intangible assets and related accumulated amortization consisted of the following (in millions):
|
|
September 30, 2017
|
December 31, 2016
|
|||||||||||||
|
|
Gross
|
Accumulated Amortization
|
Gross
|
Accumulated Amortization
|
|||||||||||
|
Definite-lived intangibles
:
|
|||||||||||||||
|
Distribution and license agreements, supply agreements
|
$
|
310.2
|
|
$
|
157.5
|
|
$
|
305.6
|
|
$
|
120.4
|
|
|||
|
Developed product technology, formulations, and product rights
|
1,355.4
|
|
568.8
|
|
1,418.1
|
|
526.0
|
|
|||||||
|
Customer relationships and distribution networks
|
1,623.7
|
|
424.5
|
|
1,489.9
|
|
307.5
|
|
|||||||
|
Trademarks, trade names, and brands
|
1,317.5
|
|
111.0
|
|
1,189.3
|
|
55.3
|
|
|||||||
|
Non-compete agreements
|
14.7
|
|
12.3
|
|
14.3
|
|
11.2
|
|
|||||||
|
Total definite-lived intangibles
|
$
|
4,621.5
|
|
$
|
1,274.1
|
|
$
|
4,417.2
|
|
$
|
1,020.4
|
|
|||
|
Indefinite-lived intangibles
:
|
|||||||||||||||
|
Trademarks, trade names, and brands
|
$
|
52.0
|
|
$
|
—
|
|
$
|
50.5
|
|
$
|
—
|
|
|||
|
In-process research and development
|
51.4
|
|
—
|
|
64.0
|
|
—
|
|
|||||||
|
Total indefinite-lived intangibles
|
103.4
|
|
—
|
|
114.5
|
|
—
|
|
|||||||
|
Total other intangible assets
|
$
|
4,724.9
|
|
$
|
1,274.1
|
|
$
|
4,531.7
|
|
$
|
1,020.4
|
|
|||
Certain intangible assets are denominated in currencies other than the U.S. dollar; therefore, their gross and accumulated amortization balances are subject to foreign currency movements.
We recorded amortization expense of
$88.5 million
and
$89.7 million
for the
three months ended
September 30, 2017
and
October 1, 2016
, respectively, and
$261.3 million
and
$263.9 million
for the
nine months ended
September 30, 2017
and
October 1, 2016
, respectively.
We recorded an impairment charge within our
RX
segment of
$12.7 million
on certain In Process Research and Development ("IPR&D") assets during the nine months ended
September 30, 2017
due to changes in the projected development and regulatory timelines for various projects. During the
nine months ended
September 30, 2017
, we recorded a decrease in the contingent consideration liability associated with certain IPR&D assets in
Other operating income
on the Condensed Consolidated Statements of Operations (refer to
Note 6
).
During the three months ended July 1, 2017, we identified impairment indicators for our Lumara Health, Inc. ("Lumara") product assets. The primary impairment indicators included the decline in our 2017 performance expectations and a reduction in our long-range revenue growth forecast. The assessment utilized the multi-period excess earnings method to determine fair value and resulted in an impairment charge of
$18.5 million
in
Impairment charges
on the Condensed Consolidated Statements of Operations within our
RX
segment, which represented the difference between the carrying amount of the intangible assets and their estimated fair value.
As discussed in our Form 10-K for the year ended December 31, 2016, during the three months ended April 2, 2016, we identified indicators of impairment associated with certain indefinite-lived intangible assets acquired in conjunction with our acquisition of Omega Pharma Invest N.V. ("Omega") and recorded an impairment charge of
$273.4 million
. In addition, during the three months ended October 1, 2016, we identified indicators of impairment associated with certain indefinite-lived and definite-lived intangible brand category assets acquired in conjunction with the Omega acquisition. As a result of these additional indicators, we recorded impairment charges of
$575.7 million
on our indefinite-lived assets and
$290.9 million
on our definite-lived assets. The impairment charges for both the indefinite-lived assets and definite-lived assets were recorded within our CHCI segment.
In addition, due to reprioritization of certain brands in the
CHCI
segment and change in performance expectations for the cough/cold/allergy, anti-parasite, personal care, lifestyle, and natural health brands, we
11
Perrigo Company plc
- Item 1
Note 3
reclassified
$364.5 million
and
$674.4 million
of indefinite-lived assets to definite-lived assets with useful lives of
20
years, which we began amortizing during the second and third quarters of 2016, respectively.
NOTE 4 -
ACCOUNTS RECEIVABLE FACTORING
We have multiple accounts receivable factoring arrangements with non-related third-party financial institutions (the “Factors”). Pursuant to the terms of the arrangements, we sell to the Factors certain of our accounts receivable balances on a non-recourse basis for credit approved accounts. An administrative fee ranging from
0.14%
to
0.15%
per invoice is charged on the gross amount of accounts receivables assigned to the Factors, and interest is calculated at the applicable EUR LIBOR rate plus 70 basis points. The total amount factored on a non-recourse basis and excluded from accounts receivable was
$24.3 million
and
$50.7 million
at
September 30, 2017
and
December 31, 2016
, respectively.
NOTE 5 –
INVENTORIES
Major components of inventory were as follows (in millions):
|
September 30,
2017 |
December 31,
2016 |
||||||
|
Finished goods
|
$
|
471.4
|
|
$
|
431.1
|
|
|
|
Work in process
|
146.8
|
|
165.7
|
|
|||
|
Raw materials
|
203.7
|
|
198.2
|
|
|||
|
Total inventories
|
$
|
821.9
|
|
$
|
795.0
|
|
|
NOTE 6 –
FAIR VALUE MEASUREMENTS
Fair value is the price that would be received upon sale of an asset or paid to transfer a liability in an orderly transaction between market participants at the measurement date. The following fair value hierarchy is used in selecting inputs, with the highest priority given to Level 1, as these are the most transparent or reliable.
|
Level 1:
|
Quoted prices for identical instruments in active markets.
|
|
Level 2:
|
Quoted prices for similar instruments in active markets; quoted prices for identical or similar instruments in markets that are not active; and model-derived valuations in which all significant inputs are observable in active markets.
|
|
Level 3:
|
Valuations derived from valuation techniques in which one or more significant inputs are not observable.
|
12
Perrigo Company plc
- Item 1
Note 6
The following table summarizes the valuation of our financial instruments carried at fair value and measured at fair value on a recurring and non-recurring basis by the above pricing categories (in millions):
|
Fair Value
|
||||||||||
|
Fair Value Hierarchy
|
September 30,
2017 |
December 31,
2016 |
||||||||
|
Measured at fair value on a recurring basis:
|
||||||||||
|
Assets:
|
||||||||||
|
Investment securities
|
Level 1
|
$
|
6.1
|
|
$
|
38.2
|
|
|||
|
Foreign currency forward contracts
|
Level 2
|
$
|
13.1
|
|
$
|
3.8
|
|
|||
|
Funds associated with Israeli severance liability
|
Level 2
|
16.1
|
|
15.9
|
|
|||||
|
Total level 2 assets
|
$
|
29.2
|
|
$
|
19.7
|
|
||||
|
Royalty Pharma contingent milestone payments
|
Level 3
|
$
|
143.2
|
|
$
|
—
|
|
|||
|
Financial assets
|
Level 3
|
—
|
|
2,350.0
|
|
|||||
|
Total level 3 assets
|
$
|
143.2
|
|
$
|
2,350.0
|
|
||||
|
Liabilities:
|
||||||||||
|
Foreign currency forward contracts
|
Level 2
|
$
|
3.3
|
|
$
|
5.0
|
|
|||
|
Contingent consideration
|
Level 3
|
$
|
44.9
|
|
$
|
69.9
|
|
|||
|
Measured at fair value on a non-recurring basis:
|
||||||||||
|
Assets:
|
||||||||||
|
Goodwill
(1)
|
Level 3
|
$
|
—
|
|
$
|
1,148.4
|
|
|||
|
Indefinite-lived intangible assets
(2)
|
Level 3
|
13.3
|
|
0.3
|
|
|||||
|
Definite-lived intangible assets
(3)
|
Level 3
|
11.5
|
|
758.0
|
|
|||||
|
Assets held for sale, net
|
Level 3
|
95.1
|
|
18.2
|
|
|||||
|
Total level 3 assets
|
$
|
119.9
|
|
$
|
1,924.9
|
|
||||
|
(1)
|
As of December 31, 2016, goodwill with a carrying amount of
$2.2 billion
was written down to its implied fair value of
$1.1 billion
.
|
|
(2)
|
As of September 30, 2017, indefinite-lived intangible assets with a carrying amount of
$26.0 million
were written down to a fair value of
$13.3 million
. As of December 31, 2016, indefinite-lived intangible assets with a carrying amount of
$0.7 million
were written down to a fair value of
$0.3 million
.
|
|
(3)
|
As of July 1, 2017, definite-lived intangible assets with a carrying amount of
$31.1 million
were written down to a fair value of
$11.5 million
. As of December 31, 2016, definite-lived intangible assets with a carrying amount of
$2.3 billion
were written down to a fair value of
$758.0 million
. Included in this balance are indefinite-lived intangible assets with a fair value of
$364.5 million
and
$674.2 million
that were reclassified to definite-lived assets at April 3, 2016 and October 2, 2016, respectively.
|
There were no transfers among Level 1, 2, and 3 during the
three and nine months ended
September 30, 2017
or the year ended
December 31, 2016
. Our policy regarding the recording of transfers between levels is to record any such transfers at the end of the reporting period (refer to
Note 7
for information on our investment securities and
Note 8
for a discussion of derivatives).
13
Perrigo Company plc
- Item 1
Note 6
Foreign Currency Forward Contracts
The fair value of foreign currency forward contracts is determined using a market approach, which utilizes values for comparable derivative instruments.
Funds Associated with Israel Severance Liability
Israeli labor laws and agreements require us to pay benefits to employees dismissed or retiring under certain circumstances. Severance pay is calculated on the basis of the most recent employee salary levels and the length of employee service. Our Israeli subsidiaries also provide retirement bonuses to certain managerial employees. We make regular deposits to retirement funds and purchase insurance policies to partially fund these liabilities. The funds are determined using prices for recently traded financial instruments with similar underlying terms, as well as directly or indirectly observable inputs, such as interest rates and yield curves, that are observable at commonly quoted intervals.
Royalty Pharma Contingent Milestone Payments and Financial Assets
On
December 18, 2013
, we acquired Elan, which had
a royalty agreement with Biogen Idec Inc. ("Biogen"),
whereby Biogen conveyed the right to receive royalties that are typically payable on sales revenue generated by the sale, distribution or other use of the drug Tysabri
®
. Pursuant to the royalty agreement, we were entitled to royalty payments from Biogen based on its Tysabri
®
sales in all indications and geographies. We received royalties of
12%
on worldwide Biogen sales of Tysabri
®
from December 18, 2013 through April 30, 2014. From May 1, 2014, we received royalties of
18%
on annual worldwide Biogen sales of Tysabri
®
up to
$2.0 billion
and
25%
on annual sales above
$2.0 billion
.
We accounted for the Tysabri
®
royalty stream as a financial asset and elected to use the fair value option model. We made the election to account for the Tysabri
®
financial asset using the fair value option as we believed this method was most appropriate for an asset that did not have a par value, a stated interest stream, or a termination date.
The financial asset acquired represented a single unit of accounting. The fair value of the financial asset acquired was determined by using a discounted cash flow analysis related to the expected probability weighted future cash flows to be generated by the royalty stream. The financial asset was classified as a Level 3 asset within the fair value hierarchy, as our valuation utilized significant unobservable inputs,
including industry analyst estimates for global Tysabri
®
sales, probability weighted as to the timing and amount of future cash flows along with certain discount rate assumptions. Cash flow forecasts included the estimated effect and timing of future competition, considering patents in effect for Tysabri
®
through 2024 and contractual rights to receive cash flows into perpetuity. The discounted cash flows were based upon the expected royalty stream forecasted into perpetuity using a
20
-year discrete period with a declining rate terminal value.
In the first quarter of 2016, a competitor's pipeline product, Ocrevus
®
, received breakthrough therapy designation from the U.S. Food and Drug Administration ("FDA").
Breakthrough therapy designation is granted when a drug is intended alone or in combination with one or more other drugs to treat a serious or life threatening disease or condition and preliminary clinical evidence indicates that the drug may demonstrate substantial improvement over existing therapies on one or more clinically significant endpoints, such as substantial treatment effects observed early in clinical development.
In June 2016, the FDA granted priority review with a target action date in December 2016. A
priority review is a
designation when the FDA will direct overall attention and resources to the evaluation of applications for drugs that, if approved, would be significant improvements in the safety or effectiveness of the treatment, diagnosis, or prevention of serious conditions when compared to standard applications. The product was approved late in the first quarter of 2017.
The product is expected to compete with Tysabri
®
, and we expected it to have a significant negative impact on the Tysabri
®
royalty stream. Industry analysts believe that, based on released clinical study information, Ocrevus
®
will compete favorably against Tysabri
®
in the relapsing, remitting multiple sclerosis market segment due to its high efficacy and convenient dosage form.
14
Perrigo Company plc
- Item 1
Note 6
Given the new market information for Ocrevus
®
, we used industry analyst estimates to reduce our first ten year growth forecasts from an average of growth of approximately
3.4%
in the fourth calendar quarter of 2015 to an average decline of approximately minus
2.0%
in the third and fourth calendar quarters of 2016. In November 2016, we announced we were evaluating strategic alternatives for the Tysabri
®
asset. As of December 31, 2016, the financial asset was adjusted based on the strategic review and sale process. These effects, combined with the change in discount rate each quarter, led to a reduction in fair value of
$204.4 million
,
$910.8 million
,
$377.4 million
and
$1.1 billion
in the first, second, third and fourth quarters of 2016, respectively.
On
March 27, 2017
, we announced the completed divestment of our Tysabri
®
financial asset to Royalty Pharma for up to
$2.85 billion
, which consists of
$2.2 billion
in cash and up to
$250.0 million
and
$400.0 million
in milestone payments if the royalties on global net sales of Tysabri
®
that are received by Royalty Pharma meet specific thresholds in 2018 and 2020, respectively. As a result of this transaction, we transferred the entire financial asset to Royalty Pharma and recorded a
$17.1 million
gain during the
three months ended
July 1, 2017. We elected to account for the contingent milestone payments using the fair value option method, and these were recorded at an estimated fair value of
$143.2 million
as of
September 30, 2017
. We chose the fair value option as we believe it will help investors understand the potential future cash flows we may receive associated with the two contingent milestones.
We valued the contingent milestone payments using a modified Black-Scholes Option Pricing Model ("BSOPM"). Key inputs in the BSOPM are the estimated volatility and rate of return of royalties on global net sales of Tysabri
®
that are received by Royalty Pharma over time until payment of the contingent milestone payments is completed. Volatility and the estimated fair value of the milestones have a positive relationship such that higher volatility translates to a higher estimated fair value of the contingent milestone payments. In the valuation of contingent milestone payments performed, we assumed volatility of
30.0%
and a rate of return of
8.05%
as of July 1, 2017 and volatility of
30.0%
and a rate of return of
8.06%
as of
September 30, 2017
. We assess volatility and rate of return inputs quarterly by analyzing certain market volatility benchmarks and the risk associated with Royalty Pharma achieving the underlying projected royalties. During the
three and nine months ended
September 30, 2017
, the fair value of the Royalty Pharma contingent milestone payments decreased
$2.9 million
and
$42.1 million
, respectively, as a result of the decrease in the estimated projected Tysabri
®
revenues due to the launch of Ocrevus
®
late in the first quarter of 2017.
Our accounts receivable balance at December 31, 2016 included
$84.4 million
related to the Tysabri
®
financial asset.
The table below presents a reconciliation for the
Royalty Pharma contingent milestone payments
measured at fair value on a recurring basis using significant unobservable inputs (Level 3) (in millions). Change in fair value in the table was recorded in
Change in financial assets
on the Condensed Consolidated Statements of Operations.
|
Three Months Ended
|
Nine Months Ended
|
||||||
|
September 30,
2017 |
September 30,
2017 |
||||||
|
Royalty Pharma Contingent Milestone Payments
|
|||||||
|
Beginning balance
|
$
|
145.8
|
|
$
|
—
|
|
|
|
Additions
|
—
|
|
184.5
|
|
|||
|
Foreign currency effect
|
0.3
|
|
0.8
|
|
|||
|
Change in fair value
|
(2.9
|
)
|
(42.1
|
)
|
|||
|
Ending balance
|
$
|
143.2
|
|
$
|
143.2
|
|
|
Contingent Consideration
Contingent consideration represents milestone payment obligations obtained through product acquisitions, which are valued using estimates based on probability-weighted outcomes, sensitivity analysis, and discount rates reflective of the risk involved. The estimates are updated quarterly and the liabilities are adjusted to fair value depending on a number of assumptions, including the competitive landscape and regulatory approvals that may impact the future sales of a product. We reduced a contingent consideration liability associated with certain IPR&D assets (refer to
Note 3
) and recorded a corresponding gain of
$17.0 million
during the nine months ended
September 30, 2017
. The liability decrease relates to a reduction of the probability of achievement assumptions and
15
Perrigo Company plc
- Item 1
Note 6
anticipated cash flows. Purchases or additions for the nine months ended
October 1, 2016
included contingent consideration associated with five transactions.
The table below presents a reconciliation for liabilities measured at fair value on a recurring basis using significant unobservable inputs (Level 3) (in millions). Net realized losses in the table were recorded in
Other (income) expense, net
on the Condensed Consolidated Statements of Operations.
|
Three Months Ended
|
Nine Months Ended
|
||||||||||||||
|
September 30,
2017 |
October 1,
2016 |
September 30,
2017 |
October 1,
2016 |
||||||||||||
|
Contingent Consideration
|
|||||||||||||||
|
Beginning balance
|
$
|
49.7
|
|
$
|
44.9
|
|
$
|
69.9
|
|
$
|
17.9
|
|
|||
|
Net realized losses
|
(2.9
|
)
|
(0.4
|
)
|
(18.5
|
)
|
(4.0
|
)
|
|||||||
|
Purchases or additions
|
—
|
|
30.6
|
|
—
|
|
61.1
|
|
|||||||
|
Foreign currency effect
|
0.2
|
|
—
|
|
1.5
|
|
0.1
|
|
|||||||
|
Settlements
|
(2.1
|
)
|
(0.1
|
)
|
(8.0
|
)
|
(0.1
|
)
|
|||||||
|
Ending balance
|
$
|
44.9
|
|
$
|
75.0
|
|
$
|
44.9
|
|
$
|
75.0
|
|
|||
Goodwill and Indefinite-Lived Intangible Assets
We have
seven
reporting units for which we assess goodwill for impairment. We utilize a comparable company market approach, weighted equally with a discounted cash flow analysis, to determine the fair value of the reporting units
.
We utilize either a relief from royalty method or a multi-period excess earnings method ("MPEEM") to value our indefinite-lived intangible assets, and use a consistent set of projected financial information for the goodwill and indefinite-lived asset impairment tests. The discounted cash flow analysis that we prepared for goodwill impairment testing purposes for the
year ended
December 31, 2016
included long-term growth rates ranging from
2.0%
to
3.0%
. We also utilized discount rates ranging from
7.0%
to
14.5%
, which were deemed to be commensurate with the required investment return and risk involved in realizing the projected free cash flows of each reporting unit. In addition, we burdened projected free cash flows with the capital spending deemed necessary to support the cash flows of each reporting unit, and applied the tax rates that were applicable to the jurisdictions represented within each reporting unit. We recorded impairment charges on the Condensed Consolidated Statements of Operations related to goodwill in the BCH-ROW reporting unit and indefinite-lived intangible assets of
$130.5 million
and
$273.4 million
, respectively, for the three months ended April 2, 2016. For the three months ended October 1, 2016, we recorded impairment charges related to goodwill on the Condensed Consolidated Statements of Operations of
$675.6 million
in the BCH-ROW reporting unit and
$62.3 million
in the BCH-Belgium reporting unit, as well as indefinite-lived intangible asset impairments of
$575.7 million
(refer to
Note 3
).
Definite-Lived Intangible Assets
When assessing our definite-lived assets for impairment, we utilize either a MPEEM or a relief from royalty method to determine the fair value of the asset and use the forecasts that are consistent with those used in the reporting unit analysis. Below is a summary of the various metrics used in our valuations:
|
Nine Months Ended
|
|
|
September 30, 2017
|
|
|
Lumara
|
|
|
5-year average growth rate
|
(4.1)%
|
|
Discount rate
|
13.5%
|
|
Valuation method
|
MPEEM
|
16
Perrigo Company plc
- Item 1
Note 6
|
Year Ended
|
|||||||||
|
December 31, 2016
|
|||||||||
|
Omega - Lifestyle
|
Omega - XLS
|
Entocort
®
- Branded Products
|
Entocort
®
- AG Products
|
Herron Trade Names and Trademarks
|
|||||
|
5-year average growth rate
|
2.5%
|
3.2%
|
(31.7)%
|
(30.4)%
|
4.6%
|
||||
|
Long-term growth rates
|
2.0%
|
NA
|
(10.0)%
|
(4.7)%
|
2.5%
|
||||
|
Discount rate
|
9.3%
|
9.5%
|
13.0%
|
10.5%
|
10.8%
|
||||
|
Royalty rate
|
NA
|
4.0%
|
NA
|
NA
|
11.0%
|
||||
|
Valuation method
|
MPEEM
|
Relief from Royalty
|
MPEEM
|
MPEEM
|
Relief from Royalty
|
||||
We recorded
Impairment charges
on the Condensed Consolidated Statements of Operations related to definite-lived intangible assets of
$18.5 million
and
$290.9 million
for the nine months ended
September 30, 2017
and October 1, 2016, respectively (refer to
Note 3
).
Assets Held For Sale
When a group of assets is classified as held-for-sale, the book value is evaluated and adjusted to the lower of its carrying amount or fair value less the cost to sell (refer to
Note 9
).
As of
September 30, 2017
and
December 31, 2016
, our fixed rate long-term debt consisted of public bonds, a private placement note, and retail bonds. As of
September 30, 2017
, the public bonds had a carrying value of
$2.6 billion
and a fair value of
$2.7 billion
. As of
December 31, 2016
, the public bonds had a carrying value and fair value of
$4.6 billion
. The fair values of our public bonds for both periods were based on quoted market prices
(Level 1).
As of
September 30, 2017
, our retail bonds and private placement note had a carrying value of
$655.8 million
(excluding a premium of
$35.6 million
) and a fair value of
$699.2 million
. As of
December 31, 2016
, our retail bonds and private placement note had a carrying value of
$773.1 million
(excluding a premium of
$49.8 million
) and a fair value of
$825.0 million
. The fair values of our retail bonds and private placement note for both periods were based on interest rates offered for borrowings of a similar nature and remaining maturities (Level 2).
The carrying amounts of our other financial instruments, consisting of cash and cash equivalents, accounts receivable, accounts payable, short-term debt and variable rate long-term debt, approximate their fair value.
NOTE 7 –
INVESTMENTS
Available for Sale Securities
Our available for sale securities are reported in
Prepaid expenses and other current assets
. Unrealized investment gains/(losses) on available for sale securities were as follows (in millions):
|
September 30,
2017 |
December 31, 2016
|
||||||
|
Equity securities, at cost less impairments
|
$
|
15.5
|
|
$
|
16.5
|
|
|
|
Gross unrealized gains
|
—
|
|
21.7
|
|
|||
|
Gross unrealized losses
|
(9.4
|
)
|
—
|
|
|||
|
Estimated fair value of equity securities
|
$
|
6.1
|
|
$
|
38.2
|
|
|
The factors affecting the assessment of impairments include both general financial market conditions and factors specific to a particular company. During the
nine months ended
October 1, 2016
, we recorded an impairment charge of
$1.8 million
, which related to other-than-temporary impairments of marketable equity securities due to prolonged losses incurred on each of the investments.
17
Perrigo Company plc
- Item 1
Note 7
We have evaluated the near-term prospects of the equity securities in relation to the severity and duration of any impairments, and based on that evaluation, we have the ability and intent to hold these investments until a recovery of fair value.
During the
nine months ended
September 30, 2017
, we sold a number of our investment securities and recorded a gain of
$1.6 million
. The gain was reclassified out of Accumulated Other Comprehensive Income (loss) ("AOCI") and into earnings.
Cost Method Investments
Our cost method investments totaled
$7.2 million
and
$6.9 million
at
September 30, 2017
and
December 31, 2016
, respectively, and are included in
Other non-current assets
.
Equity Method Investments
Our equity method investments totaled
$4.8 million
and
$4.6 million
at
September 30, 2017
and
December 31, 2016
, respectively, and are included in
Other non-current assets
. We recorded net
losses
of
$0.1 million
and net
gain
s of
$0.2 million
during the
three and nine months ended
September 30, 2017
, respectively, and net
gain
s of
$0.1 million
and net
loss
es
of
$3.8 million
during the
three and nine months ended
October 1, 2016
, respectively, for our proportionate share of the equity method investment earnings or losses. The gains and losses were recorded in
Other (income) expense, net
on the Condensed Consolidated Statements of Operations.
During the
nine months ended
October 1, 2016
, one of our equity method investments became publicly traded. As a result, we transferred the
$15.5 million
investment to available for sale and recorded an
$8.7 million
unrealized gain, net of tax in Other Comprehensive Income ("OCI"). In addition, due to significant and prolonged losses incurred on one of our equity method investments, we recorded a
$22.3 million
impairment charge in
Other (income) expense, net
on the Condensed Consolidated Statements of Operations.
NOTE 8 –
DERIVATIVE INSTRUMENTS AND HEDGING ACTIVITIES
We enter into certain derivative financial instruments, when available on a cost-effective basis, to mitigate our risk associated with changes in interest rates and foreign currency exchange rates as follows:
Interest rate risk management -
We are exposed to the impact of interest rate changes through our cash investments and borrowings. We utilize a variety of strategies to manage the impact of changes in interest rates, including using a mix of debt maturities along with both fixed-rate and variable-rate debt. In addition, we may enter into treasury-lock agreements and interest rate swap agreements on certain investing and borrowing transactions to manage our exposure to interest rate changes and our overall cost of borrowing.
Foreign currency exchange risk management -
We conduct business in several major currencies other than the U.S. dollar and are subject to risks associated with changing foreign exchange rates. Our objective is to reduce cash flow volatility associated with foreign exchange rate changes on a consolidated basis to allow management to focus its attention on business operations. Accordingly, we enter into various contracts that change in value as foreign exchange rates change to protect the value of existing foreign currency assets and liabilities, commitments, and anticipated foreign currency sales and expenses.
All derivative instruments are managed on a consolidated basis to efficiently net exposures and thus take advantage of any natural offsets. Gains and losses related to the derivative instruments are expected to be offset largely by gains and losses on the original underlying asset or liability. We do not use derivative financial instruments for speculative purposes.
All of our designated derivatives were classified as cash flow hedges as of
September 30, 2017
and
December 31, 2016
. Designated derivatives meet hedge accounting criteria, which means the fair value of the hedge is recorded in shareholders’ equity as a component of OCI, net of tax. The deferred gains and losses are recognized in income in the period in which the hedged item affects earnings. Any ineffective portion of the change
18
Perrigo Company plc
- Item 1
Note 8
in fair value of the derivative is immediately recognized in earnings. All of our designated derivatives are assessed for hedge effectiveness quarterly.
We also have economic non-designated derivatives that do not meet hedge accounting criteria. These derivative instruments are adjusted to current market value at the end of each period through earnings. Gains or losses on these instruments are offset substantially by the remeasurement adjustment on the hedged item.
Interest Rate Swaps and Treasury Locks
Interest rate swap agreements are contracts to exchange floating rate for fixed rate payments (or vice versa) over the life of the agreement without the exchange of the underlying notional amounts. The notional amounts of the interest rate swap agreements are used to measure interest to be paid or received and do not represent the amount of exposure to credit loss. The differential paid or received on the interest rate swap agreements is recognized as an adjustment to interest expense.
During the three months ended July 1, 2017, we repaid
$584.4 million
of senior notes with an interest rate of 4.000% due 2023 and
$309.5 million
of senior notes with an interest rate of 5.300% due 2043 (refer to
Note 10
). As a result of the senior note repayments on June 15, 2017, the proportionate amount remaining in OCI related to the pre-issuance hedge was reclassified to earnings. Accordingly, we recorded a loss of
$5.9 million
in Other expense, net, on the Condensed Consolidated Statements of Operations during the three months ended July 1, 2017 for the amount remaining in OCI.
During the
six months ended
December 31, 2015
, we entered into a forward interest rate swap to hedge against changes in the benchmark interest rate between the date the interest rate swap was entered into and the date of expected future debt issuance. The interest rate swap was designated as a cash flow hedge and had a notional amount totaling
$200.0 million
. The interest rate swap was settled upon the issuance of an aggregate
$1.2 billion
principal amount of senior notes on March 7, 2016 for a cumulative after-tax
loss
of
$7.0 million
in OCI during the three months ended April 2, 2016.
Foreign Currency Derivatives
We enter into foreign currency forward contracts, both designated and non-designated, in order to manage the impact of foreign exchange fluctuations on expected future purchases and related payables denominated in a foreign currency, as well as to hedge the impact of foreign exchange fluctuations on expected future sales and related receivables denominated in a foreign currency. Both types of forward contracts have a maximum maturity date of
18
months. The total notional amount for these contracts was
$578.3 million
and
$533.5 million
as of
September 30, 2017
and
December 31, 2016
, respectively.
Effects of Derivatives on the Financial Statements
The below tables indicate the effects of all derivative instruments on the Condensed Consolidated Financial Statements. All amounts exclude income tax effects and are presented in millions.
The balance sheet location and gross fair value of our outstanding derivative instruments were as follows:
|
Asset Derivatives
|
|||||||||
|
Balance Sheet Location
|
Fair Value
|
||||||||
|
|
September 30,
2017 |
December 31,
2016 |
|||||||
|
Designated derivatives:
|
|||||||||
|
Foreign currency forward contracts
|
Other current assets
|
$
|
4.6
|
|
$
|
3.1
|
|
||
|
Non-designated derivatives:
|
|||||||||
|
Foreign currency forward contracts
|
Other current assets
|
$
|
8.5
|
|
$
|
0.7
|
|
||
19
Perrigo Company plc
- Item 1
Note 8
|
Liability Derivatives
|
|||||||||
|
Balance Sheet Location
|
Fair Value
|
||||||||
|
|
September 30,
2017 |
December 31,
2016 |
|||||||
|
Designated derivatives:
|
|||||||||
|
Foreign currency forward contracts
|
Accrued liabilities
|
$
|
2.6
|
|
$
|
3.0
|
|
||
|
Non-designated derivatives:
|
|||||||||
|
Foreign currency forward contracts
|
Accrued liabilities
|
$
|
0.7
|
|
$
|
2.0
|
|
||
The gains (losses) recorded in OCI for the effective portion of our designated cash flow hedges were as follows:
|
Amount of Gain/(Loss) Recorded in OCI
(Effective Portion) |
||||||||||||||||
|
Three Months Ended
|
Nine Months Ended
|
|||||||||||||||
|
Designated Cash Flow Hedges
|
September 30,
2017 |
October 1,
2016 |
September 30,
2017 |
October 1,
2016 |
||||||||||||
|
Interest rate swap agreements
|
$
|
—
|
|
$
|
—
|
|
$
|
—
|
|
$
|
(9.0
|
)
|
||||
|
Foreign currency forward contracts
|
1.1
|
|
3.4
|
|
6.3
|
|
4.7
|
|
||||||||
|
Total
|
$
|
1.1
|
|
$
|
3.4
|
|
$
|
6.3
|
|
$
|
(4.3
|
)
|
||||
The gains (losses) reclassified from AOCI into earnings for the effective portion of our designated cash flow hedges were as follows:
|
Amount of Gain/(Loss) Reclassified from AOCI into Earnings
(Effective Portion) |
||||||||||||||||||
|
Three Months Ended
|
Nine Months Ended
|
|||||||||||||||||
|
Designated Cash Flow Hedges
|
Income Statement Location
|
September 30,
2017 |
October 1,
2016 |
September 30,
2017 |
October 1,
2016 |
|||||||||||||
|
Treasury locks
|
Interest expense, net
|
$
|
—
|
|
$
|
—
|
|
$
|
—
|
|
$
|
(0.1
|
)
|
|||||
|
Interest rate swap agreements
|
Interest expense, net
|
(0.4
|
)
|
(0.6
|
)
|
(1.7
|
)
|
(1.7
|
)
|
|||||||||
|
Other (income) expense, net
|
—
|
|
—
|
|
(5.9
|
)
|
—
|
|
||||||||||
|
Foreign currency forward contracts
|
Net sales
|
—
|
|
(0.1
|
)
|
0.9
|
|
0.3
|
|
|||||||||
|
Cost of sales
|
1.8
|
|
0.9
|
|
3.5
|
|
1.8
|
|
||||||||||
|
Interest expense, net
|
(0.7
|
)
|
(0.4
|
)
|
(1.8
|
)
|
(1.3
|
)
|
||||||||||
|
Other (income) expense, net
|
(1.2
|
)
|
(1.2
|
)
|
(1.7
|
)
|
0.7
|
|
||||||||||
|
Total
|
$
|
(0.5
|
)
|
$
|
(1.4
|
)
|
$
|
(6.7
|
)
|
$
|
(0.3
|
)
|
||||||
The net of tax amount expected to be reclassified from AOCI into earnings during the next 12 months is a
$2.8 million
gain
.
20
Perrigo Company plc
- Item 1
Note 8
The gains (losses) recognized against earnings for the ineffective portion of our designated cash flow hedges were as follows:
|
Amount of Gain/(Loss) Recognized against Earnings
(Ineffective Portion) |
||||||||||||||||||
|
Three Months Ended
|
Nine Months Ended
|
|||||||||||||||||
|
Designated Cash Flow Hedges
|
Income Statement
Location
|
September 30,
2017 |
October 1,
2016 |
September 30,
2017 |
October 1,
2016 |
|||||||||||||
|
Interest rate swap agreements
|
Other (income) expense, net
|
$
|
—
|
|
$
|
—
|
|
$
|
—
|
|
$
|
(0.1
|
)
|
|||||
|
Foreign currency forward contracts
|
Net sales
|
0.2
|
|
—
|
|
0.1
|
|
0.1
|
|
|||||||||
|
Cost of sales
|
0.1
|
|
—
|
|
0.1
|
|
—
|
|
||||||||||
|
Other (income) expense, net
|
—
|
|
—
|
|
1.0
|
|
0.6
|
|
||||||||||
|
Total
|
$
|
0.3
|
|
$
|
—
|
|
$
|
1.2
|
|
$
|
0.6
|
|
||||||
The effects of our non-designated derivatives on the Condensed Consolidated Statements of Operations were as follows:
|
Amount of Gain/(Loss) Recognized against Earnings
|
||||||||||||||||||
|
Three Months Ended
|
Nine Months Ended
|
|||||||||||||||||
|
Non-Designated Derivatives
|
Income Statement Location
|
September 30,
2017 |
October 1,
2016 |
September 30,
2017 |
October 1,
2016 |
|||||||||||||
|
Foreign currency forward contracts
|
Other (income) expense, net
|
$
|
10.1
|
|
$
|
(0.2
|
)
|
$
|
(3.8
|
)
|
$
|
(8.7
|
)
|
|||||
|
Interest expense, net
|
(1.8
|
)
|
(1.0
|
)
|
(2.9
|
)
|
(1.5
|
)
|
||||||||||
|
Total
|
$
|
8.3
|
|
$
|
(1.2
|
)
|
$
|
(6.7
|
)
|
$
|
(10.2
|
)
|
||||||
NOTE 9 –
ASSETS HELD FOR SALE
Our India API business was classified as held-for-sale beginning as of December 31, 2015. We recorded an impairment charge totaling
$6.3 million
during the year ended December 31, 2016 after determining the carrying value of the India API business exceeded its fair value less the cost to sell. The India API business is reported in our Other segment. On
April 6, 2017
, we completed the sale of our India API business (refer to
Note 2
).
During the
three months ended
October 1, 2016, management committed to a plan to sell certain fixed assets associated with our animal health pet treats plant. Such assets were classified as held-for-sale beginning at October 1, 2016. On
February 1, 2017
, we completed the sale of our animal health pet treats plant fixed assets (refer to
Note 2
). We determined that the carrying value of the fixed assets associated with our animal health pet treats plant exceeded the fair value less the cost to sell. We recorded impairment charges totaling
$3.7 million
during the
year ended
December 31, 2016. The assets associated with our animal health pet treats plant are reported in our
CHCA
segment.
During the
three months ended
September 30, 2017, management committed to a plan to sell our Israel API business. The business was classified as held-for-sale beginning at September 30, 2017. We determined that the carrying value of the Israel API business exceeded its fair value less the cost to sell. We recorded impairment charges totaling
$3.3 million
during the three months ended September 30, 2017. The Israel API business is reported in our
Other
segment.
21
Perrigo Company plc
- Item 1
Note 9
The assets held-for-sale are reported within
Prepaid expenses and other current assets
and liabilities held-for-sale are reported in
Accrued liabilities
. The amounts consist of the following (in millions):
|
September 30,
2017 |
December 31,
2016 |
||||||||||
|
Other
|
CHCA
|
Other
|
|||||||||
|
Assets held for sale
|
|||||||||||
|
Current assets
|
$
|
44.0
|
|
$
|
—
|
|
$
|
5.1
|
|
||
|
Goodwill
|
32.6
|
|
—
|
|
5.5
|
|
|||||
|
Intangible assets
|
5.5
|
|
—
|
|
—
|
|
|||||
|
Property, plant and equipment
|
45.9
|
|
13.5
|
|
33.2
|
|
|||||
|
Other assets
|
3.1
|
|
—
|
|
3.8
|
|
|||||
|
Less: impairment reserves
|
(3.3
|
)
|
(3.7
|
)
|
(35.3
|
)
|
|||||
|
Total assets held for sale
|
$
|
127.8
|
|
$
|
9.8
|
|
$
|
12.3
|
|
||
|
Liabilities held for sale
|
|||||||||||
|
Current liabilities
|
$
|
7.6
|
|
$
|
0.1
|
|
$
|
1.9
|
|
||
|
Other liabilities
|
25.1
|
|
—
|
|
1.9
|
|
|||||
|
Total liabilities held for sale
|
$
|
32.7
|
|
$
|
0.1
|
|
$
|
3.8
|
|
||
NOTE 10 –
INDEBTEDNESS
Total borrowings outstanding are summarized as follows (in millions):
|
September 30,
2017 |
December 31,
2016 |
||||||||||
|
Term loans
|
|||||||||||
|
2014 term loan due December 5, 2019
|
(1)
|
$
|
428.3
|
|
$
|
420.7
|
|
||||
|
Notes and Bonds
|
|||||||||||
|
Coupon
|
Due
|
||||||||||
|
4.500%
|
May 23, 2017
|
(1)(2)
|
—
|
|
189.3
|
|
|||||
|
5.125%
|
December 12, 2017
|
(1)(2)
|
354.5
|
|
315.6
|
|
|||||
|
2.300%
|
November 8, 2018
|
|
—
|
|
600.0
|
|
|||||
|
5.000%
|
May 23, 2019
|
(1)(2)
|
141.8
|
|
126.2
|
|
|||||
|
3.500%
|
March 15, 2021
|
|
280.4
|
|
500.0
|
|
|||||
|
3.500%
|
December 15, 2021
|
|
309.6
|
|
500.0
|
|
|||||
|
5.105%
|
July 19, 2023
|
(1)(2)
|
159.5
|
|
142.0
|
|
|||||
|
4.000%
|
November 15, 2023
|
|
215.6
|
|
800.0
|
|
|||||
|
3.900%
|
December 15, 2024
|
|
700.0
|
|
700.0
|
|
|||||
|
4.375%
|
March 15, 2026
|
|
700.0
|
|
700.0
|
|
|||||
|
5.300%
|
November 15, 2043
|
|
90.5
|
|
400.0
|
|
|||||
|
4.900%
|
December 15, 2044
|
|
303.9
|
|
400.0
|
|
|||||
|
Total notes and bonds
|
3,255.8
|
|
5,373.1
|
|
|||||||
|
Other financing
|
2.9
|
|
3.6
|
|
|||||||
|
Unamortized premium (discount), net
|
24.8
|
|
33.0
|
|
|||||||
|
Deferred financing fees
|
(19.0
|
)
|
(33.1
|
)
|
|||||||
|
Total borrowings outstanding
|
3,692.8
|
|
5,797.3
|
|
|||||||
|
Current indebtedness
|
(417.1
|
)
|
(572.8
|
)
|
|||||||
|
Total long-term debt less current portion
|
$
|
3,275.7
|
|
$
|
5,224.5
|
|
|||||
|
(1)
|
Debt denominated in Euros subject to fluctuations in the euro-to-U.S. dollar exchange rate.
|
|
(2)
|
Debt assumed from Omega.
|
22
Perrigo Company plc
- Item 1
Note 10
During the three months ended April 1, 2017, we entered into amendments to the 2014 Revolver (as defined below) and the 2014 term loan to modify provisions of such agreements necessary as a result of the correction in accounting related to the Tysabri
®
financial asset, as well as waivers of any default or event of default that may have arisen from any restatement of or deficiencies in our financial statements for the periods specified in such amendments and waivers. We are in compliance with all covenants under our debt agreements as of
September 30, 2017
.
Revolving Credit Agreements
We have a revolving credit agreement with a borrowing capacity of
$1.0 billion
(the "2014 Revolver"). There were no borrowings outstanding under the 2014 Revolver as of
September 30, 2017
and
December 31, 2016
.
Other Financing
Overdraft Facilities
We have overdraft facilities available that we use to support our cash management operations. We report any balances outstanding in the above table under "Other financing". There were no balances outstanding under the facilities at
September 30, 2017
and
December 31, 2016
.
Debt Repayments and Related Extinguishment
During the
nine months ended
September 30, 2017
, we reduced our outstanding debt through a variety of transactions (in millions):
|
Date
|
Series
|
Transaction Type
|
Principal Retired
|
|||||
|
April 1, 2017
|
2014 term loan due December 5, 2019
|
Scheduled quarterly payment
|
$
|
13.3
|
|
|||
|
July 1, 2017
|
2014 term loan due December 5, 2019
|
Scheduled quarterly payment
|
14.3
|
|
||||
|
September 30, 2017
|
2014 term loan due December 5, 2019
|
Scheduled quarterly payment
|
14.8
|
|
||||
|
May 8, 2017
|
$600.0 2.300% senior notes due 2018
|
Early redemption
|
600.0
|
|
||||
|
May 23, 2017
|
€180.0 4.500% retail bonds due 2017
|
Scheduled maturity
|
201.3
|
|
||||
|
June 15, 2017
|
$500.0 3.500% senior notes due 2021
|
Tender offer
|
190.4
|
|
||||
|
June 15, 2017
|
$500.0 3.500% senior notes due 2021
|
Tender offer
|
219.6
|
|
||||
|
June 15, 2017
|
$800.0 4.000% senior notes due 2023
|
Tender offer
|
584.4
|
|
||||
|
June 15, 2017
|
$400.0 5.300% senior notes due 2043
|
Tender offer
|
309.5
|
|
||||
|
June 15, 2017
|
$400.0 4.900% senior notes due 2044
|
Tender offer
|
96.1
|
|
||||
|
$
|
2,243.7
|
|
||||||
As a result of the of the early redemption and tender offer transactions discussed above, we recorded a loss of
$135.2 million
during the three months ended July 1, 2017 in
Loss on extinguishment of debt
(in millions):
|
Premium on debt repayment
|
$
|
116.1
|
|
|
|
Transaction costs
|
3.8
|
|
||
|
Write-off of deferred financing fees
|
10.6
|
|
||
|
Write-off of remaining discount on bond
|
4.7
|
|
||
|
Total loss on extinguishment of debt
|
$
|
135.2
|
|
|
23
Perrigo Company plc
- Item 1
Note 11
NOTE 11 –
EARNINGS PER SHARE AND SHAREHOLDERS' EQUITY
Earnings per Share
A reconciliation of the numerators and denominators used in the basic and diluted earnings per share ("EPS") calculation is as follows (in millions):
|
|
Three Months Ended
|
Nine Months Ended
|
|||||||||||||
|
|
September 30,
2017 |
October 1,
2016 |
September 30,
2017 |
October 1,
2016 |
|||||||||||
|
Numerator:
|
|||||||||||||||
|
Net income (loss)
|
$
|
44.5
|
|
$
|
(1,590.2
|
)
|
$
|
46.4
|
|
$
|
(2,653.7
|
)
|
|||
|
Denominator:
|
|||||||||||||||
|
Weighted average shares outstanding for basic EPS
|
141.3
|
|
143.3
|
|
142.5
|
|
143.2
|
|
|||||||
|
Dilutive effect of share-based awards*
|
0.4
|
|
—
|
|
0.3
|
|
—
|
|
|||||||
|
Weighted average shares outstanding for diluted EPS
|
141.7
|
|
143.3
|
|
142.8
|
|
143.2
|
|
|||||||
|
Anti-dilutive share-based awards excluded from
computation of diluted EPS*
|
1.0
|
|
—
|
|
0.8
|
|
—
|
|
|||||||
* In the period of a net loss, diluted shares equal basic shares.
Shareholders' Equity
Shares
We issued shares related to the exercise and vesting of share-based compensation as follows:
|
Three Months Ended
|
Nine Months Ended
|
|||||||||
|
September 30,
2017 |
October 1,
2016 |
September 30,
2017 |
October 1,
2016 |
|||||||
|
99,800
|
|
185,000
|
|
146,100
|
|
283,000
|
|
|||
Share Repurchases
On October 22, 2015, the Board of Directors approved a share repurchase plan of up to
$2.0 billion
(the "2015 Authorization"). During the
three and nine months ended
September 30, 2017
, we repurchased
1.9 million
and
2.7 million
ordinary shares at an average repurchase price of
$71.73
and
$71.72
per share, for a total of
$133.3 million
and
$191.5 million
, respectively. As of
September 30, 2017
, there was
$1.3 billion
still available to be repurchased through December 31, 2018 under the 2015 Authorization. We did not repurchase any shares under the share repurchase plan during the
nine months ended
October 1, 2016
.
24
Perrigo Company plc
- Item 1
Note 12
NOTE 12 –
ACCUMULATED OTHER COMPREHENSIVE INCOME (LOSS)
Changes in our AOCI balances, net of tax were as follows (in millions):
|
Foreign currency translation adjustments
|
Fair value of derivative financial instruments, net of tax
|
Fair value of investment securities, net of tax
|
Post-retirement and pension liability adjustments, net of tax
|
Total AOCI
|
|||||||||||||||
|
Balance at December 31, 2016
|
$
|
(67.9
|
)
|
$
|
(19.5
|
)
|
$
|
15.1
|
|
$
|
(9.5
|
)
|
$
|
(81.8
|
)
|
||||
|
OCI before reclassifications
|
289.9
|
|
4.4
|
|
(22.8
|
)
|
(1.2
|
)
|
270.3
|
|
|||||||||
|
Amounts reclassified from AOCI
|
—
|
|
4.3
|
|
(1.6
|
)
|
—
|
|
2.7
|
|
|||||||||
|
Other comprehensive income (loss)
|
289.9
|
|
8.7
|
|
(24.4
|
)
|
(1.2
|
)
|
273.0
|
|
|||||||||
|
Balance at September 30, 2017
|
$
|
222.0
|
|
$
|
(10.8
|
)
|
$
|
(9.3
|
)
|
$
|
(10.7
|
)
|
$
|
191.2
|
|
||||
NOTE 13 –
INCOME TAXES
The effective tax rates were as follows:
|
Three Months Ended
|
Nine Months Ended
|
|||||||||
|
September 30,
2017 |
October 1,
2016 |
September 30,
2017 |
October 1,
2016 |
|||||||
|
65.5
|
%
|
16.4
|
%
|
68.7
|
%
|
17.2
|
%
|
|||
The effective tax rate for the
nine months ended
September 30, 2017
was negatively impacted by non-deductible fees related to our debt cancellation, discrete tax items, and additional valuation allowances recorded against deferred tax assets.
Our tax rate is subject to adjustment over the balance of the fiscal year due to, among other things: the jurisdictions in which our profits are determined to be earned and taxed; changes in the valuation of our deferred tax assets and liabilities; adjustments to estimated taxes upon finalization of various tax returns; adjustments based on differing interpretations of the applicable transfer pricing standards; changes in available tax credits, grants and other incentives; changes in stock-based compensation expense; changes in tax laws or the interpretation of such tax laws (for example, proposals for fundamental U.S. international tax reform); changes in U.S. GAAP; and expiration of or the inability to renew tax rulings or tax holiday incentives.
The total liability for uncertain tax positions was
$454.9 million
and
$398.0 million
as of
September 30, 2017
and
December 31, 2016
, respectively, before considering the federal tax benefit of certain state and local items.
We recognize interest and penalties related to uncertain tax positions as a component of income tax expense. The total amount accrued for interest and penalties in the liability for uncertain tax positions was
$79.0 million
and
$63.5 million
as of
September 30, 2017
and
December 31, 2016
, respectively.
We file income tax returns in numerous jurisdictions and are therefore subject to audits by tax authorities. Our primary income tax jurisdictions are Ireland, the United States, Israel, Belgium, France, and the United Kingdom.
On August 15, 2017, we filed a complaint in the United States District Court for the Western District of Michigan to recover $
163.6 million
of Federal income tax, penalties, and interest assessed and collected by the Internal Revenue Service (“IRS”), plus statutory interest thereon from the dates of payment, for the fiscal years ended June 27, 2009, June 26, 2010, June 25, 2011, and June 30, 2012 (the “2009 tax year,” “2010 tax year,” “2011 tax year,” and “2012 tax year,” respectively). The IRS audits of those years culminated in the issuances of two statutory notices of deficiency: (1) on August 27, 2014 for the 2009 and 2010 tax years and (2) on April 20, 2017 for the 2011 and 2012 tax years. The statutory notices of deficiency both included un-agreed income adjustments related principally to transfer pricing adjustments regarding the purchase, distribution, and sale of store-brand OTC pharmaceutical products in the United States. In addition, the statutory notice of deficiency for the 2011 and 2012 tax years included the capitalization of certain expenses that were deducted when paid or incurred in defending
25
Perrigo Company plc
- Item 1
Note 13
against certain patent infringement lawsuits. We fully paid the assessed amounts of tax, interest, and penalties set forth in the statutory notices and filed timely claims for refund on June 11, 2015 and June 7, 2017 for the 2009-2010 tax years and 2011-2012 tax years, respectively. Our claims for refund were disallowed by certified letters dated August 18, 2015 and July 11, 2017, for the 2009-2010 tax years and 2011-2012 tax years, respectively. The complaint was timely, based upon the refund claim denials, and seeks refunds of tax, interest, and penalties of
$37.2 million
for the 2009 tax year, $
61.5 million
for the 2010 tax year, $
40.2 million
for the 2011 tax year, and $
24.7 million
for the 2012 tax year. The amounts sought in the complaint for the 2009 and 2010 tax years were recorded as deferred charges on our balance sheet during the three months ended March 28, 2015, and the amounts sought in the complaint for the 2011 and 2012 tax years were recorded as deferred charges on our balance sheet during the three months ended July 1, 2017.
On December 22, 2016, we received a notice of proposed adjustment for the IRS audit of Athena Neurosciences, Inc. (“Athena”), a subsidiary of Elan acquired in 1996, for the years ended December 31, 2011, December 31, 2012, and December 31, 2013. Perrigo acquired Elan in December 2013. This proposed adjustment relates to the deductibility of litigation costs. We disagree with the IRS’s position asserted in the notice of proposed adjustment and intend to contest it.
On July 11, 2017, we received a draft notice of proposed adjustment associated with transfer pricing positions for the IRS audit of Athena for the years ended December 31, 2011, December 31, 2012, and December 31, 2013. Athena was the originator of the patents associated with Tysabri
®
prior to the acquisition of Athena by Elan in 1996. The amount of adjustments that may be asserted by the IRS in the final notice of proposed adjustment cannot be quantified at this time; however, based on the draft notice received, the amount to be assessed may be material. We disagree with the IRS’s position as asserted in the draft notice of proposed adjustment and intend to contest it.
We have ongoing audits in multiple other jurisdictions the resolution of which remains uncertain. These jurisdictions include, but are not limited to, the United States, Israel and France. In addition to the matters discussed above, the IRS is currently auditing our fiscal years ended June 29, 2013, June 28, 2014, and June 27, 2015. The Israel Tax Authority is currently auditing our fiscal years ended June 29, 2013 and June 28, 2014. The French Tax Authority is currently auditing the years ended December 2014, December 2015, and December 2016.
NOTE 14 –
COMMITMENTS AND CONTINGENCIES
In view of the inherent difficulties of predicting the outcome of various types of legal proceedings, we cannot determine the ultimate resolution of the matters described below. We establish reserves for litigation and regulatory matters when losses associated with the claims become probable and the amounts can be reasonably estimated. The actual costs of resolving legal matters may be substantially higher or lower than the amounts reserved for those matters. For matters where the likelihood or extent of a loss is not probable or cannot be reasonably estimated as of
September 30, 2017
, we have not recorded a loss reserve. If certain of these matters are determined against us, there could be a material adverse effect on our financial condition, results of operations, or cash flows. We currently believe we have valid defenses to the claims in these lawsuits and intend to defend these lawsuits vigorously regardless of whether or not we have a loss reserve. Other than what is disclosed below, we do not expect the outcome of the litigation matters to which we are currently subject individually or in the aggregate, to have a material adverse effect on our financial condition, results of operations, or cash flows.
Antitrust Violations
We have been named as a counterclaim co-defendant in the lawsuit
Fera Pharmaceuticals, LLC v. Akorn, Inc., et al.
, in which Akorn, Inc. (“Akorn”) alleges tortious interference and antitrust violations against us and Fera Pharmaceuticals, LLC (“Fera”). This litigation arises from our acquisition of bacitracin ophthalmic ointment from Fera in 2013. Akorn asserts claims under Sections 1 and 2 of the Sherman Antitrust Act alleging that we and Fera conspired to monopolize, attempted to monopolize, and did unlawfully monopolize the market for sterile bacitracin ophthalmic ointment in the United States through the use of an exclusive agreement with a supplier of sterile bacitracin active pharmaceutical ingredient. The lawsuit is currently pending in the Southern District of New York. Trial was rescheduled from January 2018 to February 2018. Akorn seeks damages, injunctive relief, and attorney’s fees. Any award of antitrust damages would be subject to trebling under antitrust laws. An estimate of any possible loss cannot be determined at this time.
26
Perrigo Company plc
- Item 1
Note 14
We believe the claims are without merit and intend to defend them vigorously. We have preserved our indemnification rights against Fera for potential liability, defense costs, and expenses incurred as a result of this litigation.
Price-Fixing Lawsuits
We have been named as a co-defendant with other manufacturers in a number of cases alleging that we and other manufacturers of the same product engaged in anti-competitive behavior to fix or raise the prices of certain drugs starting, in some instances, as early as June 2013. The products in question are Clobetasol, Desonide, and Econazole. These complaints, along with complaints filed against other companies alleging price fixing with respect to 15 other drugs, have been consolidated for pretrial proceedings as part of a case captioned
In re Generic Pharmaceuticals Pricing Antitrust Litigation,
MDL No. 2724. Pursuant to the court’s schedule staging various cases in phases, we have moved to dismiss the complaints relating to Clobetasol and Econazole. At this stage, we cannot reasonably predict the outcome of the liability, if any, associated with these claims.
Securities Litigation
In the United States
On May 18, 2016, a shareholder filed a securities case against us and our former CEO, Joseph Papa, in the U.S. District Court for the District of New Jersey (
Roofers’ Pension Fund v. Papa, et al.)
. The plaintiff purported to represent a class of shareholders for the period from April 21, 2015 through May 11, 2016, inclusive. The original complaint alleged violations of Securities Exchange Act sections 10(b) (and Rule 10b‑5) and 14(e) against both defendants and 20(a) control person liability against Mr. Papa. In general, the allegations concerned the actions taken by us and the former executive to defend against the unsolicited takeover bid by Mylan in the period from April 21, 2015 through November 13, 2015. The plaintiff also alleged that the defendants provided inadequate disclosure concerning alleged integration problems related to the Omega acquisition in the period from April 21, 2015 through May 11, 2016. On July 19, 2016, a different shareholder filed a securities class action against us and our former CEO, Joseph Papa, also in the District of New Jersey (
Wilson v. Papa, et al
.). The plaintiff purported to represent a class of persons who sold put options on our shares between April 21, 2015 and May 11, 2016. In general, the allegations and the claims were the same as those made in the original complaint filed in the
Roofers' Pension Fund
case described above. On December 8, 2016, the court consolidated
Roofers' Pension Fund
case and the
Wilson
case under the Roofers' Pension Fund case number. In February 2017, the court selected the lead plaintiffs for the consolidated case and the lead counsel to the putative class. In March 2017, the court entered a scheduling order.
On June 21, 2017, the court-appointed lead plaintiffs filed an amended complaint that superseded the original complaints in the
Roofers’ Pension Fund
case and the
Wilson
case. The lead plaintiffs seek to represent a class of shareholders for the period April 21, 2015 through May 3, 2017, and identifies three subclasses - shareholders who traded during the entire period on the U.S. exchanges; shareholders who traded during the entire period on the Tel Aviv exchange; and shareholders who traded during the period while the Mylan tender offer was pending (April 21, 2015 through November 13, 2015). The amended complaint names as defendants us and 11 current or former directors and officers of Perrigo (Mses. Judy Brown, Laurie Brlas, Jacqualyn Fouse, Ellen Hoffing, and Messrs. Joe Papa, Marc Coucke, Gary Cohen, Michael Jandernoa, Gerald Kunkle, Herman Morris, and Donal O’Connor). The amended complaint alleges violations of Securities Exchange Act sections 10(b) (and Rule 10b‑5) and 14(e) against all defendants and 20(a) control person liability against the 11 individuals. In general, the allegations concern the actions taken by us and the former executives to defend against the unsolicited takeover bid by Mylan in the period from April 21, 2015 through November 13, 2015 and the allegedly inadequate disclosure throughout the entire class period related to purported integration problems related to the Omega acquisition, alleges incorrect reporting of organic growth at the Company, alleges price fixing activities with respect to six generic prescription pharmaceuticals, and alleges improper accounting for the Tysabri
®
royalty stream. The amended complaint does not include an estimate of damages. In August 2017, the defendants filed motions to dismiss the amended complaint. The plaintiffs filed their opposition in October 2017. The defendants filed replies in support of the motions to dismiss in November 2017. The court has not indicated whether there will be oral argument of the motions or whether the court will decide the motions on the papers. We intend to defend the lawsuit vigorously.
27
Perrigo Company plc
- Item 1
Note 14
On November 1, 2017, Carmignac Gestion, S.A., filed a securities lawsuit against us and three individuals (former Chairman and CEO Joseph Papa, former CFO Judy Brown, and former Executive Vice President and Board member Marc Coucke). This lawsuit is not a securities class action. The case is styled
Carmignac Gestion, S.A. v. Perrigo Company plc, et al.
, and was filed in the U.S. District Court for the District of New Jersey. The complaint asserts claims under Securities Exchange Act sections 10(b) (and Rule 10b-5), 14(e), and 18 against all defendants as well as 20(a) control person liability against the individual defendants. In general, the plaintiff’s allegations focus on events during the period from April 2015 through April 2016. Plaintiff contends that the defendants provided inadequate disclosure throughout the period concerning the valuation and integration of Omega, the financial guidance provided by us during that period, our reporting about the generic prescription pharmaceutical business and its prospects, and the activities surrounding the efforts to defeat the Mylan tender offer during 2015. Many of the allegations in this newly-filed case overlap with the allegations of the June 2017 amended complaint in the
Roofers’ Pension Fund
case described above. The plaintiff does not provide an estimate of damages. We intend to defend the lawsuit vigorously.
In Israel
Because our shares are traded on the Tel Aviv exchange under a dual trading arrangement, we are subject to securities litigation in Israel. Three cases are currently pending. We are consulting Israeli counsel about our response to these allegations and we intend to defend these cases vigorously.
On May 22, 2016, shareholders filed a securities class action against us and five individual defendants: Our former CEO Mr. Papa, our former Executive Vice President and General Manager of the BCH segment Marc Coucke, our Chief Executive Officer John Hendrickson, our former Board member Gary Kunkle, Jr., and our Board member Laurie Brlas alleging violations of Israeli law in the District Court of Tel Aviv-Jaffa (
Schweiger et al. v. Perrigo Company plc, et al.).
On June 15, 2016, we filed a motion to stay the case pending the outcome of the securities class action pending in the New Jersey Federal Court. The plaintiffs did not oppose the motion. The Israeli court granted the motion on the same day, and the
Schweiger
action is stayed. We intend to defend the lawsuit vigorously when and if the stay is lifted. In October 2017, the Schweiger plaintiffs dismissed their claims without prejudice because of the pendency of another class action case filed in Israel (see discussion below of the
Israel Elec. Corp. Employees’ Educ. Fund
case). The court approved the voluntary dismissal.
On March 29, 2017, plaintiff Eyal Keinan commenced an action in the District Court of Tel Aviv-Jaffa asserting securities claims against two defendants: Perrigo and its auditor Ernst & Young LLP ("EY"). The case is styled
Keinan v. Perrigo Company plc, et al.
The action seeks certification of a class of purchasers of Perrigo shares on the Israeli exchange beginning February 6, 2014. The proposed closing date for the class is not clear from the complaint though it appears to extend into 2017. In general, the plaintiff asserts that we improperly accounted for our stream of royalty income from two drugs: Tysabri
®
and Prialt. The court filings contend that the alleged improper accounting caused the audited financial results for Perrigo to be incorrect for the six month period ended December 31, 2015, and the years ended June 27, 2015 and June 28, 2014 and the other financial data released by us over those years and 2016 to also be inaccurate. The plaintiff maintains that the defendants are liable under Israeli securities law or, in the alternative, under U.S. securities law. The plaintiff indicates an initial, preliminary class damages estimate of
686.0 million
NIS (approximately
$192.0 million
at 1 NIS =
$0.28 cent
). The response from the defendants is not yet due. We intend to defend the lawsuit vigorously.
On June 28, 2017, a plaintiff filed a complaint in Tel Aviv District Court styled
Israel Elec. Corp. Employees’ Educ. Fund v. Perrigo Company plc, et al.
The lead plaintiff seeks to represent a class of shareholders who traded in Perrigo stock on the Tel Aviv exchange during the period April 24, 2015 through May 3, 2017. The amended complaint names as defendants the Company, EY (the Company’s auditor), and 11 current or former directors and officers of Perrigo (Mses. Judy Brown, Laurie Brlas, Jacqualyn Fouse, Ellen Hoffing, and Messrs. Joe Papa, Marc Coucke, Gary Cohen, Michael Jandernoa, Gerald Kunkle, Herman Morris, and Donal O’Connor). The complaint alleges violations under U.S. securities laws of Securities Exchange Act sections 10(b) (and Rule 10b‑5) and 14(e) against all defendants and 20(a) control person liability against the 11 individuals or, in the alternative, under Israeli securities laws. In general, the allegations concern the actions taken by us and our former executives to defend against the unsolicited takeover bid by Mylan in the period from April 21, 2015 through November 13, 2015 and the allegedly inadequate disclosure concerning purported integration problems related to the Omega acquisition, alleges incorrect reporting of organic growth at the Company, alleges price fixing activities with respect to six
28
Perrigo Company plc
- Item 1
Note 14
generic prescription pharmaceuticals, and alleges improper accounting for the Tysabri
®
royalty stream. The plaintiff indicates an initial, preliminary class damages estimate of
2.7 billion
NIS (approximately
$760.0 million
at 1 NIS =
$0.28 cent
). We intend to defend the lawsuit vigorously.
On July 12, 2017, the plaintiff in the
Israel Elec. Corp. Employees’ Educ. Fund v. Perrigo Company plc, et al.
case filed a motion to have all three cases pending in Israel either consolidated or the other two cases dismissed so that the Israel Elec. Corp. Educ. Fund plaintiff can proceed as the sole plaintiff. That motion is pending. In October 2017, the Schweiger plaintiffs (see description above) voluntarily dismissed their securities class action without prejudice as part of their response to the motion filed by the Israel Elec. Corp. Educ. Fund plaintiff. A variety of other procedural motions are also pending at this time having to do with the timing of any response by defendants. The court has scheduled an initial conference on November 9, 2017 to address the motion filed by the Israel Elec. Corp. Educ. Fund plaintiff. The court has indicated that other procedural motions will be addressed after it has decided the Israel Elec. Corp. Educ. Fund plaintiff’s motion.
Eltroxin
During October and November 2011, nine applications to certify a class action lawsuit were filed in various courts in Israel related to Eltroxin, a prescription thyroid medication manufactured by a third party and distributed in Israel by our subsidiary, Perrigo Israel Agencies Ltd. The respondents included our subsidiaries, Perrigo Israel Pharmaceuticals Ltd. and/or Perrigo Israel Agencies Ltd., the manufacturers of the product, and various healthcare providers who provide healthcare services as part of the compulsory healthcare system in Israel.
One of the applications was dismissed and the remaining eight applications were consolidated into one application. The applications arose from the 2011 launch of a reformulated version of Eltroxin in Israel. The consolidated application generally alleges that the respondents (a) failed to timely inform patients, pharmacists and physicians about the change in the formulation; and (b) failed to inform physicians about the need to monitor patients taking the new formulation in order to confirm patients were receiving the appropriate dose of the drug. As a result, claimants allege they incurred the following damages: (a) purchases of product that otherwise would not have been made by patients had they been aware of the reformulation; (b) adverse events to some patients resulting from an imbalance of thyroid functions that could have been avoided; and (c) harm resulting from the patients' lack of informed consent prior to the use of the reformulation.
Several hearings on whether or not to certify the consolidated application took place in December 2013 and January 2014. On May 17, 2015, the District Court certified the motion against Perrigo Israel Agencies Ltd. and dismissed it against the remaining respondents, including Perrigo Israel Pharmaceuticals Ltd.
On June 16, 2015, we submitted a motion for permission to appeal the decision to certify to the Israeli Supreme Court together with a motion to stay the proceedings of the class action until the motion for permission to appeal is adjudicated. We have filed our statement of defense to the underlying proceedings. The parties are currently engaged in mediation in an attempt to settle the matter. The underlying proceedings have been stayed pending the outcome of the mediation process and, if necessary, a decision on the motion to appeal.
Tysabri
®
Product Liability Lawsuits
We and our collaborator Biogen are co-defendants in product liability lawsuits arising out of the occurrence of Progressive Multifocal Leukoencephalopathy, a serious brain infection, and serious adverse events, including deaths, which occurred in patients taking Tysabri
®
. Each co-defendant would be responsible for 50% of losses and expenses arising out of any Tysabri
®
product liability claims. During calendar year 2016, one case in the U.S. was settled and two others were dismissed with prejudice. In 2017, seven other cases were dismissed with prejudice. While we intend to vigorously defend the remaining lawsuits, management cannot predict how these cases will be resolved. Adverse results in one or more of these lawsuits could result in substantial judgments against us.
Claim Arising from the Omega Acquisition
On December 16, 2016, we and Perrigo Ireland 2 brought an arbitral claim ("Claim") against Alychlo NV ("Alychlo") and Holdco I BE NV ("Holdco") (together the Sellers) in accordance with clause 26.2 of the Share Purchase Agreement dated November 6, 2014 ("SPA") and the rules of the Belgian Centre for Arbitration and
29
Perrigo Company plc
- Item 1
Note 14
Mediation ("CEPANI"). Our Claim relates to the accuracy and completeness of information about Omega provided by the Sellers as part of the sale process, the withholding of information by the Sellers during that process and breaches of Sellers’ warranties. We are seeking monetary damages from the Sellers. The Sellers served their respective responses to the Claim on February 20, 2017. In its response, Alychlo has asserted a counterclaim for monetary damages contending that we breached the duty of good faith in performing the SPA. There can be no assurance that our Claim will be successful, and Sellers deny liability for the Claim. We deny that Alychlo is entitled to any relief (including monetary relief) under the counterclaim. The arbitration proceedings are confidential as required by the SPA and the rules of the CEPANI.
NOTE 15 –
RESTRUCTURING CHARGES
We periodically take action to reduce redundant expenses and improve operating efficiencies. The following reflects our restructuring activity (in millions):
|
Three Months Ended
|
Nine Months Ended
|
||||||||||||||
|
September 30,
2017 |
October 1,
2016 |
September 30,
2017 |
October 1,
2016 |
||||||||||||
|
Beginning balance
|
$
|
39.7
|
|
$
|
12.2
|
|
$
|
19.7
|
|
$
|
20.7
|
|
|||
|
Additional charges
|
3.8
|
|
6.6
|
|
54.7
|
|
17.9
|
|
|||||||
|
Payments
|
(17.8
|
)
|
(8.6
|
)
|
(47.6
|
)
|
(33.3
|
)
|
|||||||
|
Non-cash adjustments
|
0.4
|
|
0.1
|
|
(0.7
|
)
|
5.0
|
|
|||||||
|
Ending balance
|
$
|
26.1
|
|
$
|
10.3
|
|
$
|
26.1
|
|
$
|
10.3
|
|
|||
Restructuring activity includes severance, lease exit costs, and asset impairments. The charges incurred during the
three and nine months ended
September 30, 2017
were primarily associated with actions we took to streamline our organization as announced on February 21, 2017. During the
three and nine months ended
September 30, 2017
,
$3.8 million
and
$54.7 million
of restructuring expenses were recorded, respectively. Of the amount recorded during the nine months ended
September 30, 2017
,
$27.2 million
was related to the CHCA segment. There were no other material restructuring programs that significantly impacted any other reportable segments. All charges are recorded in
Restructuring
on the Condensed Consolidated Statements of Operations. The remaining
$22.4 million
liability for employee severance benefits is expected to be paid within the next year, while the remaining
$3.7 million
liability for lease exit costs is expected to be incurred over the remaining terms of the applicable leases.
NOTE 16 –
SEGMENT INFORMATION
Our reporting segments are as follows:
|
•
|
CHCA
,
comprises our U.S., Mexico and Canada consumer healthcare business (OTC, contract, infant formula and animal health categories).
|
|
•
|
CHCI
,
comprises our legacy Branded Consumer Healthcare segment and now includes our consumer focused businesses in the U.K., Australia, and Israel. This segment also includes our U.K. liquid licensed products business.
|
|
•
|
RX
,
comprises our U.S. Prescription Pharmaceuticals business.
|
We also have an "
Other
" reporting segment that consists of our legacy API business, which does not meet the quantitative threshold required to be a separately reportable segment. Effective January 1, 2017, due to the sale of the Tysabri
®
financial asset, all legal expenses associated with the former Specialty Sciences segment were moved to unallocated expenses. Our segments reflect the way in which our chief operating decision maker reviews our operating results and allocates resources.
30
Perrigo Company plc
- Item 1
Note 16
The below tables show select financial measures by reporting segment (in millions):
|
Total Assets
|
||||||||
|
September 30,
2017 |
December 31,
2016 |
|||||||
|
CHCA
|
$
|
3,833.7
|
|
$
|
3,351.3
|
|
||
|
CHCI
|
5,114.2
|
|
4,795.2
|
|
||||
|
RX
|
2,597.0
|
|
2,646.4
|
|
||||
|
Specialty Sciences
|
—
|
|
2,775.8
|
|
||||
|
Other
|
297.7
|
|
301.4
|
|
||||
|
Total
|
$
|
11,842.6
|
|
$
|
13,870.1
|
|
||
|
Three Months Ended
|
|||||||||||||||||||||||
|
September 30, 2017
|
October 1, 2016
|
||||||||||||||||||||||
|
Net
Sales
|
Operating Income (Loss)
|
Intangible Asset Amortization
|
Net
Sales
|
Operating Income (Loss)
|
Intangible Asset Amortization
|
||||||||||||||||||
|
CHCA
|
$
|
598.8
|
|
$
|
124.3
|
|
$
|
16.9
|
|
$
|
611.2
|
|
$
|
99.0
|
|
$
|
17.6
|
|
|||||
|
CHCI
|
365.4
|
|
4.6
|
|
50.2
|
|
377.4
|
|
(1,615.5
|
)
|
44.4
|
|
|||||||||||
|
RX
|
250.6
|
|
82.1
|
|
21.0
|
|
251.9
|
|
74.4
|
|
27.2
|
|
|||||||||||
|
Specialty Sciences
|
—
|
|
—
|
|
—
|
|
—
|
|
3.2
|
|
—
|
|
|||||||||||
|
Other
|
16.5
|
|
(0.4
|
)
|
0.4
|
|
21.1
|
|
(1.5
|
)
|
0.5
|
|
|||||||||||
|
Unallocated
|
—
|
|
(48.2
|
)
|
—
|
|
—
|
|
(27.9
|
)
|
—
|
|
|||||||||||
|
Total
|
$
|
1,231.3
|
|
$
|
162.4
|
|
$
|
88.5
|
|
$
|
1,261.6
|
|
$
|
(1,468.3
|
)
|
$
|
89.7
|
|
|||||
|
Nine Months Ended
|
|||||||||||||||||||||||
|
September 30, 2017
|
October 1, 2016
|
||||||||||||||||||||||
|
Net
Sales
|
Operating Income (Loss)
|
Intangible Asset Amortization
|
Net
Sales
|
Operating Income (Loss)
|
Intangible Asset Amortization
|
||||||||||||||||||
|
CHCA
|
$
|
1,786.4
|
|
$
|
303.6
|
|
$
|
51.1
|
|
$
|
1,880.2
|
|
$
|
316.4
|
|
$
|
53.3
|
|
|||||
|
CHCI
|
1,116.8
|
|
8.7
|
|
143.4
|
|
1,232.7
|
|
(2,011.3
|
)
|
130.6
|
|
|||||||||||
|
RX
|
708.4
|
|
239.6
|
|
65.6
|
|
776.9
|
|
258.3
|
|
78.6
|
|
|||||||||||
|
Specialty Sciences
|
—
|
|
—
|
|
—
|
|
—
|
|
(1.9
|
)
|
—
|
|
|||||||||||
|
Other
|
51.5
|
|
9.4
|
|
1.2
|
|
59.5
|
|
2.6
|
|
1.4
|
|
|||||||||||
|
Unallocated
|
—
|
|
(121.7
|
)
|
—
|
|
—
|
|
(79.2
|
)
|
—
|
|
|||||||||||
|
Total
|
$
|
3,663.1
|
|
$
|
439.6
|
|
$
|
261.3
|
|
$
|
3,949.3
|
|
$
|
(1,515.1
|
)
|
$
|
263.9
|
|
|||||
ITEM 2.
MANAGEMENT'S DISCUSSION AND ANALYSIS OF FINANCIAL CONDITION AND RESULTS OF OPERATIONS
EXECUTIVE OVERVIEW
This Management’s Discussion and Analysis of Financial Condition and Results of Operations should be read in conjunction with the financial statements included in this Form 10-Q and our Form 10-K for the year ended December 31, 2016 (the “2016 Form 10-K”). These historical financial statements may not be indicative of our future performance. This discussion contains a number of forward-looking statements, all of which are based on our current expectations and could be affected by the uncertainties and risks referred to under “Risk Factors” in Item 1A of our 2016 Form 10-K and Part II, Item 1A of this Form 10-Q.
Perrigo Company plc was incorporated under the laws of Ireland on June 28, 2013 and became the successor registrant of Perrigo Company, a Michigan corporation, on December 18, 2013 in connection with the acquisition of Elan Corporation, plc ("Elan"). Unless the context requires otherwise, the terms "Perrigo," the "Company," "we," "our," "us," and similar pronouns used herein refer to Perrigo Company plc, its subsidiaries, and all predecessors of Perrigo Company plc and its subsidiaries.
31
Perrigo Company plc
- Item 2
Executive Overview
We are a leading global healthcare company that delivers value to our customers and consumers by providing Quality Affordable Healthcare Products
®
. Founded in 1887 as a packager of home remedies, we have built a unique business model that is best described as the convergence of a fast-moving consumer goods company, a high-quality pharmaceutical manufacturing organization and a world-class supply chain network. We believe we are one of the world's largest manufacturers of over-the-counter (“OTC”) healthcare products and suppliers of infant formulas for the store brand market. We also are a leading provider of branded OTC products throughout Europe and the U.S., as well as a leading producer of generic standard topical products such as creams, lotions, and gels, as well as inhalants and injections ("extended topical") prescription drugs. We are headquartered in Ireland, and sell our products primarily in North America and Europe, as well as in other markets, including Australia, Israel and China.
Our reporting segments are as follows:
|
•
|
Consumer Healthcare Americas
(
"CHCA"
), comprises our U.S., Mexico and Canada consumer healthcare business (OTC, contract, infant formula and animal health categories).
|
|
•
|
Consumer Healthcare International
(
"
CHCI
"
),
comprises our legacy Branded Consumer Healthcare segment and now includes our consumer focused businesses in the U.K., Australia, and Israel. This segment also includes our U.K. liquid licensed products business.
|
|
•
|
Prescription Pharmaceuticals
(
"
RX
"
),
comprises our U.S. Prescription Pharmaceuticals business.
|
We also have an "
Other
" reporting segment, which comprises our legacy Active Pharmaceutical Ingredients ("API") business,
which does not meet the quantitative threshold required to be a separately reportable segment. Effective January 1, 2017, due to the sale of the Tysabri
®
financial asset, all legal expenses associated with our former Specialty Sciences segment were moved to unallocated expenses. For results by segment, see "Segment Results" below and
Item 1. Note 16
.
2017 Year-to-Date Highlights
|
•
|
On
March 27, 2017
, we completed the sale of our Tysabri
®
financial asset, effective January 1, 2017, to Royalty Pharma for up to
$2.85 billion
, which consists of
$2.2 billion
in cash and up to
$250.0 million
and
$400.0 million
in milestone payments if the royalties on global net sales of Tysabri
®
that are received by Royalty Pharma meet specific thresholds in 2018 and 2020, respectively. As a result of this transaction, we derecognized the Tysabri
®
financial asset and recorded a
$17.1 million
gain (refer to
Item 1. Note 6
).
|
|
•
|
On
April 6, 2017
, we completed the sale of our India API business to Strides Shasun Limited for
$22.2 million
, inclusive of an estimated working capital adjustment. The sale did not have a material impact on our operations (refer to
Item 1. Note 2
).
|
|
•
|
On
August 4, 2017
, we signed a definitive agreement for the sale of our Israel API business to SK Capital for
$110.0 million
in cash, inclusive of a net debt adjustment. We expect to finalize the sale within the next three months. The sale is not expected to have a material impact on our operations (refer to
Item 1. Note 9
).
|
|
•
|
We completed
$2.2 billion
of debt repayments during the
nine months ended
September 30, 2017
(refer to
Item 1. Note 10
).
|
|
•
|
On
August 25, 2017
, we completed the sale of our Russian business to Alvogen Pharma LLC and Alvogen CEE Kft. for
€12.7 million
(
$15.1 million
), inclusive of an estimated working capital adjustment. The sale did not have a material impact on our operations (refer to
Item 1. Note 2
).
|
32
Perrigo Company plc
- Item 2
Consolidated
RESULTS OF OPERATIONS
CONSOLIDATED
Consolidated Results
|
|
Three Months Ended
|
Nine Months Ended
|
|||||||||||||
|
($ in millions)
|
October 1,
2016 |
September 30,
2017 |
October 1,
2016 |
September 30,
2017 |
|||||||||||
|
Net sales
|
$
|
1,261.6
|
|
$
|
1,231.3
|
|
$
|
3,949.3
|
|
$
|
3,663.1
|
|
|||
|
Gross profit
|
$
|
484.5
|
|
$
|
497.8
|
|
$
|
1,564.1
|
|
$
|
1,466.7
|
|
|||
|
Gross profit %
|
38.4
|
%
|
40.4
|
%
|
39.6
|
%
|
40.0
|
%
|
|||||||
|
Operating expenses
|
$
|
1,952.8
|
|
$
|
335.4
|
|
$
|
3,079.2
|
|
$
|
1,027.1
|
|
|||
|
Operating expenses %
|
154.8
|
%
|
27.2
|
%
|
78.0
|
%
|
28.0
|
%
|
|||||||
|
Operating income (loss)
|
$
|
(1,468.3
|
)
|
$
|
162.4
|
|
$
|
(1,515.1
|
)
|
$
|
439.6
|
|
|||
|
Operating income (loss) %
|
(116.4
|
)%
|
13.2
|
%
|
(38.4
|
)%
|
12.0
|
%
|
|||||||
|
Change in financial assets
|
$
|
377.4
|
|
$
|
2.6
|
|
$
|
1,492.6
|
|
$
|
24.2
|
|
|||
|
Interest and other, net
|
$
|
55.6
|
|
$
|
31.1
|
|
$
|
195.6
|
|
$
|
132.0
|
|
|||
|
Loss on extinguishment of debt
|
$
|
0.7
|
|
$
|
—
|
|
$
|
1.1
|
|
$
|
135.2
|
|
|||
|
Income tax expense (benefit)
|
$
|
(311.8
|
)
|
$
|
84.2
|
|
$
|
(550.7
|
)
|
$
|
101.8
|
|
|||
|
Net income (loss)
|
$
|
(1,590.2
|
)
|
$
|
44.5
|
|
$
|
(2,653.7
|
)
|
$
|
46.4
|
|
|||
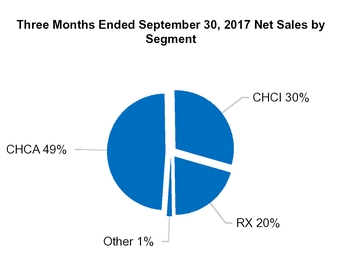
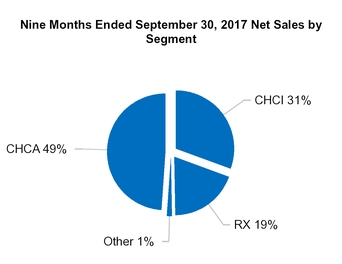
The
$30.3 million
decrease in consolidated net sales for the
three months ended
September 30, 2017
as compared to the prior year period was due to discontinued products of
$6.2 million
, lower sales in the CHCA segment, due primarily to the absence of
$21.0 million
of sales related to the U.S. Vitamins, Minerals, and Supplements ("VMS") business, lower sales in the CHCI segment due primarily to the absence of
$41.7 million
of sales as a result of the cancellation of certain distribution contracts, and lower sales in the RX segment driven by lower net sales of Entocort
®
in the amount of
$10.2 million
and pricing pressures across the portfolio. These decreases were partially offset by new product sales of
$55.4 million
and favorable foreign currency translation of
$13.0 million
. Consolidated operating income for the
three months ended
September 30, 2017
increased due primarily to the absence of asset impairment charges in the amount of
$1.6 billion
taken in the prior year period (refer to
Item 1. Note 3
).
The
$286.2 million
decrease in consolidated net sales for the
nine months ended
September 30, 2017
as compared to the prior year period was due to discontinued products of
$18.4 million
, lower sales in the CHCA segment due primarily to the absence of
$110.1 million
of sales related to the U.S. VMS business, lower sales in the CHCI segment due primarily to the absence of
$118.4 million
of sales as a result of the cancellation of certain distribution contracts, and lower sales in the RX segment driven by lower net sales of Entocort
®
in the amount of
$61.4 million
and pricing pressures across the portfolio. These decreases were partially offset by new product sales
33
Perrigo Company plc
- Item 2
Consolidated
of
$155.8 million
. Consolidated operating income for the
nine months ended
September 30, 2017
increased due primarily to the absence of asset impairment charges in the amount of
$2.0 billion
taken in the prior year period (refer to
Item 1. Note 3
).
Further details and analysis of our financial results for the
three and nine months ended
September 30, 2017
are described below by reporting segment and line item. Refer to the "
Unallocated Expenses
," "
Interest, Other and Change in financial assets (Consolidated)
," and "
Income Taxes (Consolidated)
" sections below for discussions related to our expenses.
Restructuring
On February 21, 2017, we approved a workforce reduction plan as part of a larger cost optimization strategy across the Company. We expect to reduce our global workforce by approximately 750 employees, which includes some actions already taken and 235 employees who have elected to participate in a voluntary early retirement program. This represents a reduction of approximately 14% of our global non-production workforce. The changes to our workforce will vary by country, based on legal requirements and required consultations with works councils and other employee representatives, as appropriate.
In connection with this plan, we estimate that we will recognize total pre-tax restructuring charges of approximately $55.0 million to $65.0 million, consisting of one-time termination benefits, severance arrangements, and other termination costs. We expect to incur the majority of the remaining charges in 2017, with the balance to be recognized during the first quarter of the year ending December 31, 2018. During the
three and nine months ended
September 30, 2017
, we recognized
$3.8 million
and
$54.7 million
, respectively, of restructuring expenses due primarily to this cost optimization strategy.
Our cost optimization strategy is expected to yield approximately $130.0 million in savings per annum by mid-2018. This is in addition to the savings that our supply chain organization continues to generate for both our North American and International segments.
CONSUMER HEALTHCARE AMERICAS
Recent Trends and Developments
|
•
|
We continue to experience a reduction in pricing expectations within our
CHCA
segment, primarily in the cough/cold, animal health, and analgesics categories due to various factors, including increased focus from customers to capture supply chain productivity savings and competition in specific product categories. We expect this pricing environment to continue to impact our
CHCA
segment for the foreseeable future.
|
|
•
|
We completed the sale of the animal health pet treats plant fixed assets on
February 1, 2017
and received
$7.7 million
in proceeds (refer to
Item 1. Note 2
).
|
34
Perrigo Company plc
- Item 2
CHCA
Segment Results
Three Month Comparison
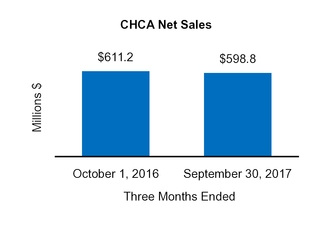
|
|
Three Months Ended
|
||||||
|
($ in millions)
|
October 1,
2016 |
September 30,
2017 |
|||||
|
Net sales
|
$
|
611.2
|
|
$
|
598.8
|
|
|
|
Gross profit
|
$
|
199.2
|
|
$
|
206.1
|
|
|
|
Gross profit %
|
32.6
|
%
|
34.4
|
%
|
|||
|
Operating income
|
$
|
99.0
|
|
$
|
124.3
|
|
|
|
Operating income %
|
16.2
|
%
|
20.8
|
%
|
|||
Three Months Ended
September 30, 2017
vs.
Three Months Ended
October 1, 2016
Net sales
decreased
$12.4 million
, or
2%
, over the prior year period due to:
|
•
|
New product sales of
$13.2 million
related primarily to the launches of Esomemprazole Magnesium (store brand equivalent to Nexium
®
); and
|
|
•
|
Favorable foreign currency translation movement of
$1.4 million
; more than offset by
|
|
•
|
The absence of
$21.0 million
in sales attributable to the U.S. VMS business, which was sold in August 2016 (refer to
Item 1. Note 2
);
|
|
•
|
A net decrease in sales of existing products of
$3.2 million
due primarily to:
|
|
•
|
Higher sales in the gastrointestinal and animal health categories and in our Mexico business;
|
|
•
|
Pricing pressures in the cough/cold, and analgesics categories; and
|
|
•
|
Lower volumes in the nicotine replacement category; and
|
|
•
|
Discontinued products of
$2.7 million
.
|
Operating income
increased
$25.3 million
, or
26%
, as a result of:
|
•
|
An increase
of
$6.9 million
in gross profit due to:
|
|
•
|
Favorable product mix in certain categories; and
|
|
•
|
Positive contributions from supply chain efficiencies; offset partially by
|
|
•
|
The absence of $3.4 million in gross profit as a result of the sale of the U.S. VMS business (refer to
Item 1. Note 2
)
;
and
|
|
•
|
Pricing pressures in certain categories as discussed above.
|
|
•
|
A decrease of
$18.4 million
in operating expenses due to:
|
|
•
|
Decreased restructuring expense of $4.8 million related primarily to the cost reduction initiatives taken in the prior year (refer to
Item 1. Note 15
);
|
|
•
|
Decreased selling and administrative expenses of $4.8 million due primarily to timing of promotions related to our animal health category and savings related to our previously announced strategic initiatives;
|
|
•
|
Decreased Research and Development ("R&D") expenses of $4.5 million due to timing of clinical trials; and
|
|
•
|
The absence of a $3.4 million impairment charge related to held-for-sale assets associated with our animal health pet treats plant (refer to
Item 1. Note 9
); offset partially by
|
|
•
|
A $2.0 million gain related to contingent consideration (refer to
Item 1. Note 6
).
|
|
•
|
Gross profit as a percentage of net sales was
1.8%
higher
due primarily to favorable product mix and supply chain efficiencies as discussed above.
|
35
Perrigo Company plc
- Item 2
CHCA
|
•
|
Operating income as a percentage of net sales was
4.6%
higher
due primarily to favorable product mix as discussed above and decreased operating expenses.
|
Nine
Month Comparison
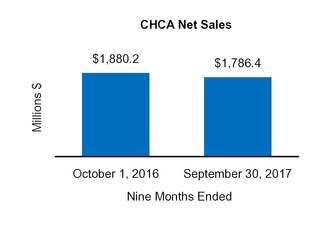
|
|
|||||||
|
Nine Months Ended
|
|||||||
|
($ in millions)
|
October 1,
2016 |
September 30,
2017 |
|||||
|
Net sales
|
$
|
1,880.2
|
|
$
|
1,786.4
|
|
|
|
Gross profit
|
$
|
615.1
|
|
$
|
598.3
|
|
|
|
Gross profit %
|
32.7
|
%
|
33.5
|
%
|
|||
|
Operating income
|
$
|
316.4
|
|
$
|
303.6
|
|
|
|
Operating income %
|
16.8
|
%
|
17.0
|
%
|
|||
Nine Months Ended
September 30, 2017
vs.
Nine Months Ended
October 1, 2016
Net sales
decreased
$93.8 million
, or
5%
, over the prior year period due to:
|
•
|
New product sales of
$51.2 million
related primarily to the launches of fluticasone nasal spray (store brand equivalent to Flonase
®
), smoking cessation products and Esomemprazole Magnesium (store brand equivalent to Nexium
®
); more than offset by
|
|
•
|
The absence of
$110.1 million
in sales attributable to the U.S. VMS business (refer to
Item 1. Note 2
);
|
|
•
|
A net decrease in sales of existing products of
$22.6 million
due to:
|
|
•
|
Higher sales in the cough/cold category and Mexico business; more than offset by
|
|
•
|
Lower sales in our infant nutrition and animal health categories;
|
|
•
|
Pricing pressures in the cough/cold, analgesics, and gastrointestinal categories; and
|
|
•
|
Lower volumes in the nicotine replacement category;
|
|
•
|
Discontinued products of
$11.1 million
; and
|
|
•
|
Unfavorable foreign currency translation movement of
$1.1 million
.
|
Operating income
decreased
$12.8 million
, or
4%
, as a result of:
|
•
|
A decrease
of
$16.8 million
in gross profit due to:
|
|
•
|
Favorable product mix in certain categories; and
|
|
•
|
Positive contributions from supply chain efficiencies; more than offset by
|
|
•
|
The absence of $17.6 million in gross profit as a result of the sale of the U.S. VMS business (refer to
Item 1. Note 2
); and
|
|
•
|
Pricing pressures in certain categories as discussed above.
|
|
•
|
A decrease
of
$4.0 million
in operating expenses due to:
|
|
•
|
Decreased selling and administrative expenses of $10.8 million due primarily to timing of promotions related to our animal health category and savings related to our cost reduction initiatives taken in the prior year;
|
|
•
|
The absence of a $9.6 million impairment charge related to the U.S. VMS business (refer to
Item 1. Note 2
) and held-for-sale assets associated with our animal health pet treats plant (refer to
Item 1. Note 9
); and
|
|
•
|
Decreased R&D expenses of $7.6 million due to timing of clinical trials, reduced spending on infant formula clinical trials and lower costs related to our cost reduction initiatives; offset partially by
|
|
•
|
A $2.9 million gain related to contingent consideration (refer to
Item 1. Note 6
);
|
|
•
|
Increased restructuring expenses of $21.5 million related primarily to strategic organizational enhancements (refer to
Item 1. Note 15
); and
|
|
•
|
A $4.1 million impairment charge recorded on idle property, plant and equipment.
|
36
Perrigo Company plc
- Item 2
CHCI
CONSUMER HEALTHCARE INTERNATIONAL
Recent Trends and Developments
As part of our strategic initiatives, management continues to drive improvements and evaluate the overall cost structures within our
CHCI
segment in the following ways:
|
•
|
On December 8, 2016, we announced the cancellation of the unprofitable EuroGenerics NV distribution agreement in Belgium. The cancellation, combined with the exit of certain OTC distribution agreements, is expected to reduce net sales by approximately $210.0 million in 2017.
|
|
•
|
We continue to make progress on our previously announced restructuring plans to right-size the
Omega
business due to the impact of market dynamics on sales volumes. Management continues to evaluate the overall cost structure relative to current and expected market dynamics. During the
three and nine months ended
September 30, 2017
, we recognized
$3.6 million
and
$13.2 million
of restructuring expense in the
CHCI
segment, respectively.
|
|
•
|
Management continues to evaluate the most effective business model for each country, aligning our sales infrastructure and actively integrating sales strategies with promotional programs.
|
|
•
|
On
August 25, 2017
, we completed the sale of our Russian business, which was previously classified as held-for-sale, to Alvogen Pharma LLC and Alvogen CEE Kft. The total sale price was
€12.7 million
(
$15.1 million
), inclusive of an estimated working capital adjustment, which resulted in an immaterial gain in the segment (refer to
Item 1. Note 2
).
|
The combination of these actions is expected to improve the segment's focus on higher value OTC products, reduce selling costs and improve operating margins in the segment.
Segment Results
Three Month Comparison
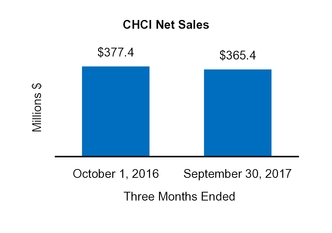
|
|
Three Months Ended
|
||||||
|
($ in millions)
|
October 1,
2016 |
September 30,
2017 |
|||||
|
Net sales
|
$
|
377.4
|
|
$
|
365.4
|
|
|
|
Gross profit
|
$
|
155.2
|
|
$
|
165.9
|
|
|
|
Gross profit %
|
41.1
|
%
|
45.4
|
%
|
|||
|
Operating income (loss)
|
$
|
(1,615.5
|
)
|
$
|
4.6
|
|
|
|
Operating income (loss) %
|
(428.1
|
)%
|
1.2
|
%
|
|||
Three Months Ended
September 30, 2017
vs.
Three Months Ended
October 1, 2016
Net sales
decreased
$12.0 million
, or
3%
, over the prior year period due primarily to:
|
•
|
Favorable foreign currency translation movement of
$11.6 million
;
|
|
•
|
New product sales of
$11.4 million
; and
|
|
•
|
A net increase in sales of existing products of
$8.9 million
due to increased sales primarily in the cough/cold, allergy, analgesics, and lifestyle categories; more than offset by
|
37
Perrigo Company plc
- Item 2
CHCI
|
•
|
The absence of
$41.7 million
in sales attributable to the cancellation of unprofitable distribution contracts; and
|
|
•
|
Discontinued products of
$3.2 million
.
|
Operating income
increased
$1.6 billion
, as a result of:
|
•
|
An increas
e
of
$10.7 million
in gross profit due primarily to:
|
|
•
|
Favorable foreign currency translation movement;
|
|
•
|
Improved product mix for sales of existing products; and
|
|
•
|
Operational efficiencies across the organization.
|
|
•
|
A decrease
of
$1.6 billion
in operating expenses due primarily to:
|
|
•
|
The absence of $1.6 billion of impairment charges on certain indefinite-lived and definite-lived intangible brand category assets and goodwill impairments in the Branded Consumer Healthcare - Rest of World ("BCH-ROW") and Branded Consumer Healthcare - Belgium ("BCH-Belgium")
|
reporting units recorded in the prior year period (refer to
Item 1. Note 3
); and
|
•
|
A decrease of $4.6 million in selling and administrative expenses due to previously announced strategic initiatives to better align promotional investments with sales and cost reduction initiatives taken in the current year; offset partially by
|
|
•
|
Increased restructuring charges totaling $1.2 million related to strategic organizational enhancements (refer to
Item 1. Note 15
).
|
|
•
|
Gross profit as a percentage of net sales was
4.3%
higher
due primarily to improved product mix primarily driven by the cancellation of certain unprofitable distribution contracts, as described above.
|
|
•
|
Operating income as a percentage of net sales was
429.3%
higher
due primarily to the absence of $1.6 billion of intangible asset and goodwill impairment charges as discussed above (refer to
Item 1. Note 3
).
|
Nine
Month Comparison
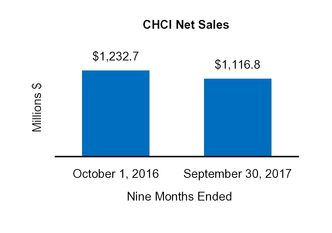
|
Nine Months Ended
|
|||||||
|
($ in millions)
|
October 1,
2016 |
September 30,
2017 |
|||||
|
Net sales
|
$
|
1,232.7
|
|
$
|
1,116.8
|
|
|
|
Gross profit
|
$
|
542.1
|
|
$
|
509.4
|
|
|
|
Gross profit %
|
44.0%
|
45.6
|
%
|
||||
|
Operating income (loss)
|
$
|
(2,011.3
|
)
|
$
|
8.7
|
|
|
|
Operating income (loss) %
|
(163.2
|
)%
|
0.8
|
%
|
|||
Nine Months Ended
September 30, 2017
vs.
Nine Months Ended
October 1, 2016
Net sales
decreased
$115.9 million
, or
9%
, over the prior year period due primarily to:
|
•
|
New product sales of
$50.4 million
; more than offset by
|
|
•
|
The absence of
$118.4 million
in sales attributable to the cancellation of unprofitable distribution contracts;
|
|
•
|
Unfavorable foreign currency translation movement of
$25.2 million
;
|
|
•
|
A decrease in sales of existing products of
$17.4 million
primarily in the anti-parasites and vitamins categories; and
|
|
•
|
Discontinued products of
$5.0 million
.
|
38
Perrigo Company plc
- Item 2
CHCI
Operating income
increased
$2.0 billion
due to:
|
•
|
A decrease of
$32.7 million
in gross profit due primarily to:
|
|
•
|
Improved product mix for sales of existing products; and
|
|
•
|
Operational efficiencies across the organization; more than offset by
|
|
•
|
Lower margins in our U.K. store brand business; and
|
|
•
|
Unfavorable foreign currency translation movement.
|
|
•
|
A decrease
of
$2.1 billion
in operating expenses due primarily to:
|
|
•
|
The absence of $2.0 billion of impairment charges on certain indefinite-lived and definite-lived intangible brand category assets and goodwill impairments in the BCH-ROW and BCH-Belgium
|
reporting units recorded in the prior year period (refer to
Item 1. Note 3
); and
|
•
|
A decrease in selling and administrative expenses of $48.5 million due to previously announced strategic initiatives to better align promotional investments with sales and cost reduction initiatives taken in the current year; offset partially by
|
|
•
|
A $4.8 million impairment charge recorded related to the Russian business (refer to
Item 1. Note 2
) and In-Process Research and Development ("IPR&D"); and
|
|
•
|
Increased restructuring expense of $2.8 million related to strategic organizational enhancements (refer to
Item 1. Note 15
).
|
|
•
|
Gross profit as a percentage of net sales was
1.6%
higher
due primarily to improved product mix primarily driven by the cancellation of certain unprofitable distribution contracts, as described above.
|
|
•
|
Operating income as a percentage of net sales was
164.0%
higher
due primarily to the absence of $2.0 billion of intangible asset and goodwill impairment charges as discussed above (refer to
Item 1. Note 3
).
|
Recent Trends and Developments
|
•
|
We continue to experience a significant reduction in pricing expectations from historical levels in our
RX
segment due to industry and competitive pressures. This softness in pricing is attributable to various factors, including increased focus from customers to capture supply chain productivity savings, low raw material commodity pricing, competition in specific products, and consolidation of certain customers. We expect this softness to continue to impact the segment for the foreseeable future, and we are forecasting a high single digit pricing decline in this segment for the year ending December 31, 2017.
|
|
•
|
On November 10, 2016, we announced that as part of our portfolio review process we are conducting a comprehensive internal evaluation of the
RX
segment's market position, growth opportunities, and interdependencies with our manufacturing and shared service operations to determine if strategic alternatives should be explored.
|
|
•
|
During the three months ended December 31, 2016, the U.S. market for Entocort
®
(Budesonide) capsules, including both brand and authorized generic capsules, experienced significant and unexpected increased competition, which reduced our future revenue stream. We expect our net sales in the
RX
segment for the year ending December 31, 2017 will be negatively impacted by approximately $67.0 million.
|
|
•
|
During the
nine months ended
September 30, 2017
, we sold various Abbreviated New Drug Applications ("ANDAs") for a total gain of $23.0 million.
|
39
Perrigo Company plc
- Item 2
RX
Segment Results
Three Month Comparison
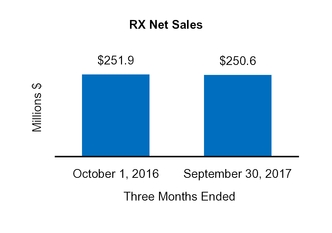
|
|
Three Months Ended
|
||||||
|
($ in millions)
|
October 1,
2016 |
September 30,
2017 |
|||||
|
Net sales
|
$
|
251.9
|
|
$
|
250.6
|
|
|
|
Gross profit
|
$
|
120.9
|
|
$
|
116.7
|
|
|
|
Gross profit %
|
48.0
|
%
|
46.6
|
%
|
|||
|
Operating income
|
$
|
74.4
|
|
$
|
82.1
|
|
|
|
Operating income %
|
29.5
|
%
|
32.8
|
%
|
|||
Three Months Ended
September 30, 2017
vs.
Three Months Ended
October 1, 2016
Net sales
decreased
$1.3 million
, or
1%
, due to:
|
•
|
New product sales of
$30.8 million
due primarily to the sale of Scopolamine and Testosterone 2% topical (store brand equivalent to Axiron
®
); more than offset by
|
|
•
|
Decreased sales of existing products of
$21.5 million
due primarily to pricing pressure across the portfolio; and
|
|
•
|
Lower Entocort
®
sales of
$10.2 million
.
|
Segment operating income
increased
$7.7 million
, or
10%
, as a result of:
|
•
|
A decrease
of
$4.2 million
in gross profit due primarily to:
|
|
•
|
Lower Entocort
®
sales as discussed above; and
|
|
•
|
Pricing pressure as discussed above.
|
|
•
|
A decrease
of
$11.9 million
in operating expenses due primarily to:
|
|
•
|
Decreased selling and administrative expenses of $8.4 million due primarily to the prior year specialty pharmaceuticals sales force restructuring initiative; and
|
|
•
|
Decreased R&D expenses of $7.3 million due to timing of clinical trials, lower legal spend, and lower ongoing costs on certain projects; offset partially by
|
|
•
|
A $4.0 million impairment charge on certain fixed assets in the current period.
|
|
•
|
Gross profit as a percentage of net sales was
1.4%
lower
due primarily to lower sales of Entocort
®
and pricing pressures.
|
|
•
|
Operating income as a percentage of net sales was
3.3%
higher
due primarily to decreased costs related to R&D spend and restructuring initiatives taken in the prior year; offset partially by lower sales of Entocort
®
.
|
40
Perrigo Company plc
- Item 2
RX
Nine
Month Comparison
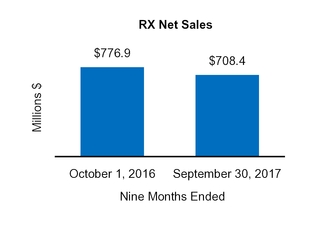
|
|
|||||||
|
Nine Months Ended
|
|||||||
|
($ in millions)
|
October 1,
2016 |
September 30,
2017 |
|||||
|
Net sales
|
$
|
776.9
|
|
$
|
708.4
|
|
|
|
Gross profit
|
$
|
380.2
|
|
$
|
332.1
|
|
|
|
Gross profit %
|
48.9
|
%
|
46.9
|
%
|
|||
|
Operating income
|
$
|
258.3
|
|
$
|
239.6
|
|
|
|
Operating income %
|
33.3
|
%
|
33.8
|
%
|
|||
Nine Months Ended
September 30, 2017
vs.
Nine Months Ended
October 1, 2016
Net sales
decreased
$68.5 million
, or
9%
, due to:
|
•
|
New product sales of
$53.2 million
due primarily to sales of Scopolamine and Testosterone 2% topical (store brand equivalent to Axiron
®
); more than offset by
|
|
•
|
Lower Entocort
®
sales of
$61.4 million
;
|
|
•
|
Decreased sales of existing products of
$58.0 million
due to decreased sales volume of certain products and pricing pressure across the portfolio; and
|
|
•
|
Discontinued products of
$2.3 million
.
|
Operating income
decreased
$18.7 million
, or
7%
, as a result of:
|
•
|
A decrease
of
$48.1 million
in gross profit due primarily to:
|
|
•
|
Lower Entocort
®
sales as noted above; and
|
|
•
|
Pricing pressure as discussed above.
|
|
•
|
A decrease
of
$29.4 million
in operating expenses due to:
|
|
•
|
A $23.0 million gain on sales of certain ANDAs;
|
|
•
|
A $17.0 million gain related to contingent consideration (refer to
Item 1. Note 6
);
|
|
•
|
Decreased selling and administrative expenses of $18.3 million due primarily to the prior year specialty pharmaceuticals sales force restructuring initiative; and
|
|
•
|
Decreased R&D expenses of $14.1 million due to timing of clinical trials, lower legal spend, and lower ongoing costs on certain projects; offset partially by
|
|
•
|
Impairment charges related to certain definite-lived intangible assets, certain fixed assets and IPR&D of $34.8 million (refer to
Item 1. Note 3
); and
|
|
•
|
Increased restructuring expenses of $5.9 million related to strategic organizational enhancements (refer to
Item 1. Note 15
).
|
|
•
|
Gross profit as a percentage of net sales was
2.0%
lower
due primarily to lower sales of Entocort
®
as discussed above.
|
41
Perrigo Company plc
- Item 2
Other
OTHER
Recent Trends and Developments
On
April 6, 2017
, we completed the sale of our India API business to Strides Shasun Limited. We received
$22.2 million
of proceeds, inclusive of an estimated working capital adjustment, which resulted in an immaterial gain. Prior to closing the sale, we determined that the carrying value of the India API business exceeded its fair value less the cost to sell, resulting in an impairment charge of
$35.3 million
, which was recorded in
Impairment charges
on the Consolidated Statements of Operations for the year ended December 31, 2016 (refer to
Item 1. Note 2
).
On
August 4, 2017
, we signed a definitive agreement for the sale of our Israel API business to SK Capital for
$110.0 million
in cash, inclusive of a net debt adjustment. We expect to finalize the sale within the next three months, and the sale is not expected to have a material impact on our operations (refer to
Item 1. Note 9
).
Segment Results
Three Month Comparison
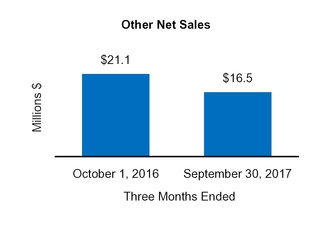
|
|
Three Months Ended
|
||||||
|
($ in millions)
|
October 1,
2016 |
September 30,
2017 |
|||||
|
Net sales
|
$
|
21.1
|
|
$
|
16.5
|
|
|
|
Gross profit
|
$
|
9.4
|
|
$
|
9.1
|
|
|
|
Gross profit %
|
44.5
|
%
|
55.5
|
%
|
|||
|
Operating income (loss)
|
$
|
(1.5
|
)
|
$
|
(0.4
|
)
|
|
|
Operating income (loss)%
|
(7.4
|
)%
|
(2.4
|
)%
|
|||
Three Months Ended
September 30, 2017
vs.
Three Months Ended
October 1, 2016
Net sales
decreased
$4.6 million
due primarily to increased competition on certain products. Operating loss decreased
$1.1 million
due primarily to a
$1.4 million
decrease
in operating expenses. The decrease in operating expenses related to the absence of a $6.5 million impairment charge recorded on the India API business in the prior year; offset partially by a
$3.3 million
impairment charge recorded on the Israel API business in the current period (refer to
Item 1. Note 9
).
42
Perrigo Company plc
- Item 2
Other
Nine
Month Comparison
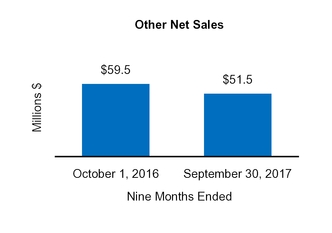
|
|
|||||||
|
Nine Months Ended
|
|||||||
|
($ in millions)
|
October 1,
2016 |
September 30,
2017 |
|||||
|
Net sales
|
$
|
59.5
|
|
$
|
51.5
|
|
|
|
Gross profit
|
$
|
26.8
|
|
$
|
27.8
|
|
|
|
Gross profit %
|
45.0
|
%
|
54.1
|
%
|
|||
|
Operating income
|
$
|
2.6
|
|
$
|
9.4
|
|
|
|
Operating income %
|
4.4
|
%
|
18.2
|
%
|
|||
Nine Months Ended
September 30, 2017
vs.
Nine Months Ended
October 1, 2016
Net sales
decreased
$8.0 million
due primarily to competition on certain products. Operating income
increased
$6.8 million
due to a
$1.0 million
increase in gross profit driven by favorable product mix and a
$5.8 million
decrease in operating expenses. The decrease in operating expenses related primarily to the absence of a $10.8 million impairment charge recorded on the India API business in the prior year; offset partially by a
$3.3 million
impairment charge recorded on the Israel API business in the current period (refer to
Item 1. Note 9
).
Unallocated Expenses
Unallocated expenses are comprised of certain corporate services not allocated to our reporting segments and are recorded above Operating income on the Condensed Consolidated Statements of Operations. Unallocated expenses were as follows (in millions):
|
Three Months Ended
|
Nine Months Ended
|
|||||||||||||
|
October 1,
2016 |
September 30,
2017 |
October 1,
2016 |
September 30,
2017 |
|||||||||||
|
$
|
27.7
|
|
$
|
48.2
|
|
$
|
79.1
|
|
$
|
120.8
|
|
|||
Effective January 1, 2017, due to the sale of the Tysabri
®
financial asset, all legal expenses associated with the former Specialty Sciences segment were moved to unallocated expenses.
The
increase
of
$20.5 million
in unallocated expenses during the
three months ended
September 30, 2017
compared to the prior year period was due primarily to an increase in share-based compensation expense of $4.7 million driven primarily by the resignation of certain executives, which had a favorable impact on the prior year period, and an increase of $15.6 million of administrative expenses driven by consulting fees and employee-related expenses.
The
increase
of
$41.7 million
in unallocated expenses during the
nine months ended
September 30, 2017
compared to the prior year period was due to an increase of $26.9 million of administrative expenses driven by consulting fees and employee-related expenses, $8.8 million in share-based compensation driven primarily by the resignation of certain executives, which had a favorable impact on the prior year period, and $5.9 million of restructuring expenses related to our
cost reduction initiatives.
43
Perrigo Company plc
- Item 2
Unallocated, Interest, Other, and Taxes
Interest, Other and Change in financial assets (Consolidated)
|
Three Months Ended
|
Nine Months Ended
|
||||||||||||||
|
($ in millions)
|
October 1,
2016 |
September 30,
2017 |
October 1,
2016 |
September 30,
2017 |
|||||||||||
|
Change in financial assets
|
$
|
377.4
|
|
$
|
2.6
|
|
$
|
1,492.6
|
|
$
|
24.2
|
|
|||
|
Interest expense, net
|
$
|
54.6
|
|
$
|
34.7
|
|
$
|
163.2
|
|
$
|
133.1
|
|
|||
|
Other (income) expense, net
|
$
|
1.0
|
|
$
|
(3.6
|
)
|
$
|
32.4
|
|
$
|
(1.1
|
)
|
|||
|
Loss on extinguishment of debt
|
$
|
0.7
|
|
$
|
—
|
|
$
|
1.1
|
|
$
|
135.2
|
|
|||
Change in Financial Assets
On
December 18, 2013
, we acquired Elan, which had
a royalty agreement with Biogen Idec Inc. ("Biogen"),
whereby Biogen conveyed the right to receive royalties that are typically payable on sales revenue generated by the sale, distribution or other use of the drug Tysabri
®
. Pursuant to the royalty agreement, we were entitled to royalty payments from Biogen based on its Tysabri
®
sales in all indications and geographies. We received royalties of
12%
on worldwide Biogen sales of Tysabri
®
from December 18, 2013 through April 30, 2014. From May 1, 2014, we received royalties of
18%
on annual worldwide Biogen sales of Tysabri
®
up to
$2.0 billion
and
25%
on annual sales above
$2.0 billion
.
We accounted for the Tysabri
®
royalty stream as a financial asset and elected to use the fair value option model. We made the election to account for the Tysabri
®
financial asset using the fair value option as we believed this method was most appropriate for an asset that did not have a par value, a stated interest stream, or a termination date.
The financial asset acquired represented a single unit of accounting. The fair value of the financial asset acquired was determined by using a discounted cash flow analysis related to the expected probability weighted future cash flows to be generated by the royalty stream. The financial asset was classified as a Level 3 asset within the fair value hierarchy, as our valuation utilized significant unobservable inputs,
including industry analyst estimates for global Tysabri
®
sales, probability weighted as to the timing and amount of future cash flows along with certain discount rate assumptions. Cash flow forecasts included the estimated effect and timing of future competition, considering patents in effect for Tysabri
®
through 2024 and contractual rights to receive cash flows into perpetuity. The discounted cash flows were based upon the expected royalty stream forecasted into perpetuity using a
20
-year discrete period with a declining rate terminal value.
In the first quarter of 2016, a competitor's pipeline product, Ocrevus
®
, received breakthrough therapy designation from the U.S. Food and Drug Administration ("FDA").
Breakthrough therapy designation is granted when a drug is intended alone or in combination with one or more other drugs to treat a serious or life threatening disease or condition and preliminary clinical evidence indicates that the drug may demonstrate substantial improvement over existing therapies on one or more clinically significant endpoints, such as substantial treatment effects observed early in clinical development.
In June 2016, the FDA granted priority review with a target action date in December 2016. A
priority review is a
designation when the FDA will direct overall attention and resources to the evaluation of applications for drugs that, if approved, would be significant improvements in the safety or effectiveness of the treatment, diagnosis, or prevention of serious conditions when compared to standard applications. The product was approved late in the first quarter of 2017.
The product is expected to compete with Tysabri
®
, and we expected it to have a significant negative impact on the Tysabri
®
royalty stream. Industry analysts believe that, based on released clinical study information, Ocrevus
®
will compete favorably against Tysabri
®
in the relapsing, remitting multiple sclerosis market segment due to its high efficacy and convenient dosage form.
Given the new market information for Ocrevus
®
, we used industry analyst estimates to reduce our first ten year growth forecasts from an average of growth of approximately
3.4%
in the fourth calendar quarter of 2015 to an average decline of approximately minus
2.0%
in the third and fourth calendar quarters of 2016. In November 2016, we announced we were evaluating strategic alternatives for the Tysabri
®
asset. As of December 31, 2016, the financial asset was adjusted based on the strategic review and sale process. These effects, combined with the change in discount rate each quarter, led to a reduction in fair value of
$204.4 million
,
$910.8 million
,
$377.4 million
and
$1.1 billion
in the first, second, third and fourth quarters of 2016, respectively.
On
March 27, 2017
, we announced the completed divestment of our Tysabri
®
financial asset to Royalty Pharma for up to
$2.85 billion
, which consists of
$2.2 billion
in cash and up to
$250.0 million
and
$400.0 million
in
44
Perrigo Company plc
- Item 2
Unallocated, Interest, Other, and Taxes
milestone payments if the royalties on global net sales of Tysabri
®
that are received by Royalty Pharma meet specific thresholds in 2018 and 2020, respectively. As a result of this transaction, we transferred the entire financial asset to Royalty Pharma and recorded a
$17.1 million
gain during the
three months ended
July 1, 2017. We elected to account for the contingent milestone payments using the fair value option method, and these were recorded at an estimated fair value of
$143.2 million
as of
September 30, 2017
. We chose the fair value option as we believe it will help investors understand the potential future cash flows we may receive associated with the two contingent milestones.
We valued the contingent milestone payments using a modified Black-Scholes Option Pricing Model ("BSOPM"). Key inputs in the BSOPM are the estimated volatility and rate of return of royalties on global net sales of Tysabri
®
that are received by Royalty Pharma over time until payment of the contingent milestone payments is completed. Volatility and the estimated fair value of the milestones have a positive relationship such that higher volatility translates to a higher estimated fair value of the contingent milestone payments. In the valuation of contingent milestone payments performed, we assumed volatility of
30.0%
and a rate of return of
8.05%
as of July 1, 2017 and a volatility of
30.0%
and a rate of return of
8.06%
as of
September 30, 2017
. We assess volatility and rate of return inputs quarterly by analyzing certain market volatility benchmarks and the risk associated with Royalty Pharma achieving the underlying projected royalties. During the
three and nine months ended
September 30, 2017
, the fair value of the Royalty Pharma contingent milestone payments decreased
$2.9 million
and
$42.1 million
, respectively, as a result of the decrease in the estimated projected Tysabri
®
revenues due to the launch of Ocrevus
®
late in the first quarter of 2017 (refer to
Item 1. Note 6
).
Interest Expense, Net
Interest expense, net
was
$34.7 million
and
$133.1 million
during the
three and nine months ended
September 30, 2017
, respectively, compared to
$54.6 million
and
$163.2 million
for the
three and nine months ended
October 1, 2016
, respectively. The
$19.9 million
and
$30.1 million
decreases were the result of the early debt repayments made during the
nine months ended
September 30, 2017
(refer to the "
Borrowings and Capital Resources
" section below and
Item 1. Note 10
).
Other (Income) Expense, Net
Other (income) expense, net
was
$3.6 million
income for the
three months ended
September 30, 2017
, compared to
$1.0 million
expense for the
three months ended
October 1, 2016
. The
$4.6 million
decrease in expense was due primarily to $2.6 million of favorable changes in revaluation of monetary assets and liabilities held in foreign currencies.
Other (income) expense, net
was
$1.1 million
income during the
nine months ended
September 30, 2017
, compared to
$32.4 million
expense for the
nine months ended
October 1, 2016
. The
$33.5 million
decrease in expenses was due primarily to the absence of a
$22.3 million
equity investment impairment (refer to
Item 1. Note 7
), $6.7 million of favorable changes in revaluation of monetary assets and liabilities held in foreign currencies, and a $4.2 million reduction in equity method losses, partially offset by a
$5.9 million
loss related to the pre-issuance hedge reclassification (refer to
Item 1. Note 8
).
Loss on Extinguishment of Debt
During the
nine months ended
September 30, 2017
, we recorded a
$135.2 million
loss on extinguishment of debt, which consisted of tender premium on debt repayments, transaction costs, write-off of deferred financing fees, and bond discounts related to the $500.0 million 3.500% senior notes due December 2021, $500.0 million 3.500% senior notes due March 2021, $400.0 million 4.900% senior notes due 2044, $800.0 million 4.000% senior notes due 2023, and $400.0 million 5.300% senior notes due 2043 (refer to
Item 1. Note 10
).
45
Perrigo Company plc
- Item 2
Unallocated, Interest, Other, and Taxes
Income Taxes (Consolidated)
The effective tax rates were as follows:
|
Three Months Ended
|
Nine Months Ended
|
|||||||||
|
October 1,
2016 |
September 30,
2017 |
October 1,
2016 |
September 30,
2017 |
|||||||
|
16.4
|
%
|
65.5
|
%
|
17.2
|
%
|
68.7
|
%
|
|||
The effective tax rate for the
nine months ended
September 30, 2017
was negatively impacted by non-deductible fees related to our debt cancellation, discrete tax items, and additional valuation allowances recorded against deferred tax assets.
Our tax rate is subject to adjustment over the balance of the fiscal year due to, among other things: the jurisdictions in which our profits are determined to be earned and taxed; changes in the valuation of our deferred tax assets and liabilities; adjustments to estimated taxes upon finalization of various tax returns; adjustments based on differing interpretations of the applicable transfer pricing standards; changes in available tax credits, grants and other incentives; changes in stock-based compensation expense; changes in tax laws or the interpretation of such tax laws (for example, proposals for fundamental U.S. international tax reform); changes in U.S. GAAP; and expiration of or the inability to renew tax rulings or tax holiday incentives.
On August 15, 2017, we filed a complaint in the United States District Court for the Western District of Michigan to recover $
163.6 million
of Federal income tax, penalties, and interest assessed and collected by the Internal Revenue Service (“IRS”), plus statutory interest thereon from the dates of payment, for the fiscal years ended June 27, 2009, June 26, 2010, June 25, 2011, and June 30, 2012 (the “2009 tax year,” “2010 tax year,” “2011 tax year,” and “2012 tax year,” respectively). The IRS audits of those years culminated in the issuances of two statutory notices of deficiency: (1) on August 27, 2014 for the 2009 and 2010 tax years and (2) on April 20, 2017 for the 2011 and 2012 tax years. The statutory notices of deficiency both included un-agreed income adjustments related principally to transfer pricing adjustments regarding the purchase, distribution, and sale of store-brand OTC pharmaceutical products in the United States. In addition, the statutory notice of deficiency for the 2011 and 2012 tax years included the capitalization of certain expenses that were deducted when paid or incurred in defending against certain patent infringement lawsuits. We fully paid the assessed amounts of tax, interest, and penalties set forth in the statutory notices and filed timely claims for refund on June 11, 2015 and June 7, 2017 for the 2009-2010 tax years and 2011-2012 tax years, respectively. Our claims for refund were disallowed by certified letters dated August 18, 2015 and July 11, 2017, for the 2009-2010 tax years and 2011-2012 tax years, respectively. The complaint was timely, based upon the refund claim denials, and seeks refunds of tax, interest, and penalties of
$37.2 million
for the 2009 tax year, $
61.5 million
for the 2010 tax year, $
40.2 million
for the 2011 tax year, and $
24.7 million
for the 2012 tax year. The amounts sought in the complaint for the 2009 and 2010 tax years were recorded as deferred charges on our balance sheet during the three months ended March 28, 2015, and the amounts sought in the complaint for the 2011 and 2012 tax years were recorded as deferred charges on our balance sheet during the three months ended July 1, 2017.
On December 22, 2016, we received a notice of proposed adjustment for the IRS audit of Athena Neurosciences, Inc. (“Athena”), a subsidiary of Elan acquired in 1996, for the years ended December 31, 2011, December 31, 2012, and December 31, 2013. Perrigo acquired Elan in December 2013. This proposed adjustment relates to the deductibility of litigation costs.
On July 11, 2017, we received a draft notice of proposed adjustment associated with transfer pricing positions for the IRS audit of Athena for the years ended December 31, 2011, December 31, 2012, and December 31, 2013. Athena was the originator of the patents associated with Tysabri
®
prior to the acquisition of Athena by Elan in 1996. The amount of adjustments that may be asserted by the IRS in the final notice of proposed adjustment cannot be quantified at this time; however, based on the draft notice received, the amount to be assessed may be material. We disagree with the IRS’s position as asserted in the draft notice of proposed adjustment and intend to contest it.
46
Perrigo Company plc
- Item 2
Unallocated, Interest, Other, and Taxes
We have ongoing audits in multiple other jurisdictions the resolution of which remains uncertain. These jurisdictions include, but are not limited to, the United States, Israel and France. In addition to the matters discussed above, the IRS is currently auditing our fiscal years ended June 29, 2013, June 28, 2014, and June 27, 2015. The Israel Tax Authority is currently auditing our fiscal years ended June 29, 2013 and June 28, 2014. The French Tax Authority is currently auditing the years ended December 2014, December 2015, and December 2016.
FINANCIAL CONDITION, LIQUIDITY, AND CAPITAL RESOURCES
Cash and Cash Equivalents
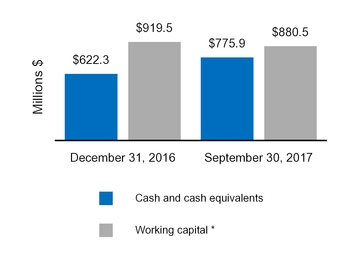
*
Working capital represents current assets less current liabilities, excluding cash and cash equivalents, and current indebtedness.
Cash, cash equivalents, cash flows from operations, and borrowings available under our credit facilities are expected to be sufficient to finance the known and/or foreseeable liquidity and capital expenditures. Although our lenders have made commitments to make funds available to us in a timely fashion under our revolving credit agreements and overdraft facilities, if economic conditions worsen or new information becomes publicly available impacting the institutions’ credit rating or capital ratios, these lenders may be unable or unwilling to lend money pursuant to our existing credit facilities.
47
Perrigo Company plc
- Item 2
Financial Condition, Liquidity and Capital Resources
Operating Activities
|
Nine Months Ended
|
|||||||||||
|
(in millions)
|
October 1,
2016 |
September 30,
2017 |
Increase/(Decrease)
|
||||||||
|
Cash Flows From (For) Operating Activities
|
|||||||||||
|
Net income (loss)
|
$
|
(2,653.7
|
)
|
$
|
46.4
|
|
$
|
2,700.1
|
|
||
|
Non-cash adjustments
|
3,229.9
|
|
560.8
|
|
(2,669.1
|
)
|
|||||
|
Subtotal
|
576.2
|
|
607.2
|
|
31.0
|
|
|||||
|
Increase (decrease) in cash due to:
|
|||||||||||
|
Accounts receivable
|
113.0
|
|
38.4
|
|
(74.6
|
)
|
|||||
|
Inventories
|
25.1
|
|
(28.3
|
)
|
(53.4
|
)
|
|||||
|
Accounts payable
|
(57.7
|
)
|
(6.0
|
)
|
51.7
|
|
|||||
|
Payroll and related taxes
|
(40.0
|
)
|
(36.7
|
)
|
3.3
|
|
|||||
|
Accrued customer programs
|
(73.7
|
)
|
(15.8
|
)
|
57.9
|
|
|||||
|
Accrued liabilities
|
(90.0
|
)
|
(18.8
|
)
|
71.2
|
|
|||||
|
Accrued income taxes
|
5.2
|
|
(61.5
|
)
|
(66.7
|
)
|
|||||
|
Other, net
|
(9.4
|
)
|
3.5
|
|
12.9
|
|
|||||
|
Subtotal
|
$
|
(127.5
|
)
|
$
|
(125.2
|
)
|
$
|
2.3
|
|
||
|
Net cash from operating activities
|
$
|
448.7
|
|
$
|
482.0
|
|
|
$
|
33.3
|
|
|
We generated
$482.0 million
of cash from operating activities during the
nine months ended
September 30, 2017
, a
$33.3 million
increase
over the prior year period, due to the following:
|
•
|
Increased net earnings after adjustments for items such as deferred income taxes, impairment charges, restructuring charges, changes in our financial assets, loss on extinguishment of debt, and depreciation and amortization;
|
|
•
|
Changes in accrued liabilities due to deferred revenue associated with BCH-Belgium distribution contracts and the absence of accruals related to the sale of our U.S. VMS business;
|
|
•
|
Changes in accrued customer-related programs due primarily to the pricing dynamics in the
RX
segment; and
|
|
•
|
Changes in accounts payable due primarily to changes to the Omega accounts payable structure that occurred in the prior year period; offset primarily by
|
|
•
|
Changes in accounts receivable due primarily to timing of receipt of payments and the absence of receivables related to the sale of our U.S. VMS business;
|
|
•
|
Changes in inventory due to the build up of inventory levels to support customer demands in the current period; offset by improved inventory management in the comparable prior year period; and
|
|
•
|
Changes in accrued income taxes due primarily to a U.S. Federal tax obligation payment made in the current year period, offset by expected tax refunds (refer to
Item 1. Note 13
).
|
48
Perrigo Company plc
- Item 2
Financial Condition, Liquidity and Capital Resources
Investing Activities
|
Nine Months Ended
|
|||||||||||
|
($ in millions)
|
October 1,
2016 |
September 30,
2017 |
Increase/(Decrease)
|
||||||||
|
Cash Flows From (For) Investing Activities
|
|||||||||||
|
Proceeds from royalty rights
|
$
|
259.5
|
|
$
|
86.4
|
|
$
|
(173.1
|
)
|
||
|
Acquisitions of businesses, net of cash acquired
|
(436.8
|
)
|
—
|
|
436.8
|
|
|||||
|
Asset acquisitions
|
(65.1
|
)
|
—
|
|
65.1
|
|
|||||
|
Additions to property, plant and equipment
|
(84.6
|
)
|
(55.2
|
)
|
29.4
|
|
|||||
|
Net proceeds from sale of business and other assets
|
58.5
|
|
46.7
|
|
(11.8
|
)
|
|||||
|
Proceeds from sale of the Tysabri
®
financial asset
|
—
|
|
2,200.0
|
|
2,200.0
|
|
|||||
|
Other investing, net
|
(1.0
|
)
|
(5.8
|
)
|
(4.8
|
)
|
|||||
|
Net cash from (for) investing activities
|
$
|
(269.5
|
)
|
$
|
2,272.1
|
|
$
|
2,541.6
|
|
||
Cash generated from investing activities totaled
$2.3 billion
for the
nine months ended
September 30, 2017
, compared to cash used of
$269.5 million
in the prior year period. The inflow in the current year was due primarily to the completed divestment of our Tysabri
®
financial asset to Royalty Pharma, for which we received
$2.2 billion
in cash at closing (refer to
Item 1. Note 6
). The outflow in the prior year was due primarily to the acquisition of a portfolio of generic dosage forms and strengths of Retin-A
®
("Tretinoin"), a topical prescription acne treatment from Mattawan Pharmaceuticals, LLC, which used
$416.4 million
in cash. The prior year outflow was offset partially by proceeds from royalty rights of
$259.5 million
. Cash used for capital expenditures totaled
$55.2 million
during the
nine months ended
September 30, 2017
compared to
$84.6 million
in the prior year period. The decrease in cash used for capital expenditures was due primarily to the decrease in the number of projects in the current year compared to the prior year period.
Financing Activities
|
Nine Months Ended
|
|||||||||||
|
($ in millions)
|
October 1,
2016 |
September 30,
2017 |
Increase/(Decrease)
|
||||||||
|
Cash Flows From (For) Financing Activities
|
|||||||||||
|
Issuances of long-term debt
|
$
|
1,190.3
|
|
$
|
—
|
|
$
|
(1,190.3
|
)
|
||
|
Borrowings (repayments) of revolving credit agreements and other financing, net
|
(803.6
|
)
|
—
|
|
803.6
|
|
|||||
|
Payments on long-term debt
|
(545.8
|
)
|
(2,243.7
|
)
|
(1,697.9
|
)
|
|||||
|
Deferred financing fees
|
(2.8
|
)
|
(4.2
|
)
|
(1.4
|
)
|
|||||
|
Premium on early debt retirement
|
(0.6
|
)
|
(116.1
|
)
|
(115.5
|
)
|
|||||
|
Issuance of ordinary shares
|
8.2
|
|
0.5
|
|
(7.7
|
)
|
|||||
|
Repurchase of ordinary shares
|
—
|
|
(191.5
|
)
|
(191.5
|
)
|
|||||
|
Cash dividends
|
(62.4
|
)
|
(68.7
|
)
|
(6.3
|
)
|
|||||
|
Other financing
|
(17.4
|
)
|
2.7
|
|
20.1
|
|
|||||
|
Net cash (for) financing activities
|
$
|
(234.1
|
)
|
$
|
(2,621.0
|
)
|
$
|
(2,386.9
|
)
|
||
Cash used for financing activities totaled
$2.6 billion
for the
nine months ended
September 30, 2017
, compared to
$234.1 million
for the comparable prior year period. In the current year period, cash used for financing included
$2.2 billion
of repayments on long-term debt and
$116.1 million
of discounts on early debt retirement related to the current year debt extinguishment and
$191.5 million
in share repurchases, as discussed below. In the prior year period, the cash used for financing activities was due primarily to borrowings of
$1.2 billion
of long-term debt, more than offset by net repayments on our revolving credit agreements and other short-term financing of
$803.6 million
and net repayments on our long-term debt of
$545.8 million
(refer to "
Borrowings and Capital Resources
" below and
Item 1. Note 10
).
49
Perrigo Company plc
- Item 2
Financial Condition, Liquidity and Capital Resources
The declaration and payment of dividends, if any, is subject to the discretion of our Board of Directors and will depend on our earnings, financial condition, availability of distributable reserves, capital and surplus requirements, and other factors our Board of Directors may consider relevant.
On October 22, 2015, the Board of Directors approved a share repurchase plan of up to
$2.0 billion
(the "2015 Authorization"). During the
three and nine months ended
September 30, 2017
, we repurchased
1.9 million
and
2.7 million
ordinary shares at an average repurchase price of
$71.73
and
$71.72
per share, for a total of
$133.3 million
and
$191.5 million
, respectively. As of
September 30, 2017
, there was
$1.3 billion
still available to be repurchased through December 31, 2018 under the 2015 Authorization. We did not repurchase any shares under the share repurchase plan during the
nine months ended
October 1, 2016
.
Borrowings and Capital Resources
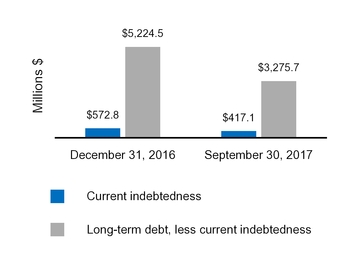
Overdraft Facilities
We have overdraft facilities available that we use to support our cash management operations. There were no balances outstanding under the facilities at
September 30, 2017
and
December 31, 2016
.
Accounts Receivable Factoring
We have multiple accounts receivable factoring arrangements with non-related third-party financial institutions (the “Factors”). Pursuant to the terms of the arrangements, we sell to the Factors certain of our accounts receivable balances on a non-recourse basis for credit approved accounts. An administrative fee ranging from
0.14%
to
0.15%
per invoice is charged on the gross amount of accounts receivables assigned to the Factors, and interest is calculated at the applicable EUR LIBOR rate plus 70 basis points. The total amount factored on a non-recourse basis and excluded from accounts receivable was
$24.3 million
and
$50.7 million
at
September 30, 2017
and
December 31, 2016
, respectively.
Revolving Credit Agreements
On
December 9, 2015
, our 100% owned finance subsidiary, Perrigo Finance Unlimited Company (formerly Perrigo Finance plc) ("Perrigo Finance"), entered into a
$750.0 million
revolving credit agreement (the "2015 Revolver"). On March 15, 2016, we used the proceeds of the long-term debt issuance described below to repay the
$750.0 million
then outstanding under the 2015 Revolver and terminated the facility.
On
December 5, 2014
, Perrigo Finance entered into a
$600.0 million
revolving credit agreement, which increased to
$1.0 billion
on March 30, 2015 (the "2014 Revolver"). On March 15, 2016, we used the proceeds of the long-term debt issuance described below to repay the
$435.0 million
then outstanding under the 2014 Revolver. There were no borrowings outstanding under the 2014 Revolver as of
September 30, 2017
.
50
Perrigo Company plc
- Item 2
Financial Condition, Liquidity and Capital Resources
Term Loans and Notes
On March 7, 2016, Perrigo Finance issued
$500.0 million
in aggregate principal amount of
3.500%
senior notes due 2021 and
$700.0 million
in aggregate principal amount of
4.375%
senior notes due 2026 (together, the "2016 Notes") and received net proceeds of
$1.2 billion
after fees and market discount, which were used to repay the amounts outstanding under the 2015 Revolver and 2014 Revolver mentioned above.
We had
$3.3 billion
and
$5.4 billion
outstanding under our notes and bonds, and
$428.3 million
and
$420.7 million
outstanding under our term loan, as of
September 30, 2017
and
December 31, 2016
, respectively. On September 29, 2016, we repaid the 1.300% senior notes due 2016 in full.
On
December 5, 2014
, Perrigo Finance entered into a term loan agreement consisting of a
€500.0 million
(
$614.3 million
) tranche, with the ability to draw an additional
€300.0 million
(
$368.6 million
) tranche, maturing December 5, 2019, and we entered into a
$300.0 million
term loan tranche maturing December 18, 2015, which we repaid in full on June 25, 2015.
Debt Repayments
During the
nine months ended
September 30, 2017
, we reduced our outstanding debt through a variety of transactions (in millions):
|
Date
|
Series
|
Transaction Type
|
Principal Retired
|
|||||
|
April 1, 2017
|
2014 term loan due December 5, 2019
|
Scheduled quarterly payment
|
$
|
13.3
|
|
|||
|
July 1, 2017
|
2014 term loan due December 5, 2019
|
Scheduled quarterly payment
|
14.3
|
|
||||
|
September 30, 2017
|
2014 term loan due December 5, 2019
|
Scheduled quarterly payment
|
14.8
|
|
||||
|
May 8, 2017
|
$600.0 2.300% senior notes due 2018
|
Early redemption
|
600.0
|
|
||||
|
May 23, 2017
|
€180.0 4.500% retail bonds due 2017
|
Scheduled maturity
|
201.3
|
|
||||
|
June 15, 2017
|
$500.0 3.500% senior notes due 2021
|
Tender offer
|
190.4
|
|
||||
|
June 15, 2017
|
$500.0 3.500% senior notes due 2021
|
Tender offer
|
219.6
|
|
||||
|
June 15, 2017
|
$800.0 4.000% senior notes due 2023
|
Tender offer
|
584.4
|
|
||||
|
June 15, 2017
|
$400.0 5.300% senior notes due 2043
|
Tender offer
|
309.5
|
|
||||
|
June 15, 2017
|
$400.0 4.900% senior notes due 2044
|
Tender offer
|
96.1
|
|
||||
|
$
|
2,243.7
|
|
||||||
As previously disclosed, during the three months ended April 1, 2017 we entered into amendments to the 2014 Revolver and the 2014 term loan to modify provisions of such agreements necessary as a result of the correction in accounting related to the Tysabri
®
financial asset, as well as waivers of any default or event of default that may have arisen from any restatement of or deficiencies in our financial statements for the periods specified in such amendments and waivers. We are in compliance with all covenants under our debt agreements as of
September 30, 2017
.
See
Item 1. Note 10
for more information on all of the above debt facilities.
Credit Ratings
Our credit ratings on
September 30, 2017
were Baa3 (stable) and BBB- (stable) by Moody's Investors Service and Standard and Poor's Global Ratings, respectively.
Credit rating agencies review their ratings periodically and, therefore, the credit rating assigned to us by each agency may be subject to revision at any time. Accordingly, we are not able to predict whether current credit ratings will remain as disclosed above. Factors that can affect our credit ratings include changes in operating performance, the economic environment, our financial position, and changes in business strategy. If changes in our credit ratings were to occur, they could impact, among other things, future borrowing costs, access to capital markets, and vendor financing terms.
51
Perrigo Company plc
- Item 2
Financial Condition, Liquidity and Capital Resources
Contractual Obligations and Commitments
Other than the obligations related to the changes to our debt structure in relation to the repayments, as discussed in
Item 1. Note 10
, there were no material changes in contractual obligations as of
September 30, 2017
from those provided in our 2016 Form 10-K. See below for a revised schedule of our enforceable and legally binding obligations as of
September 30, 2017
related to our short and long-term debt arrangements.
|
|
Payment Due by Period (in millions)
|
||||||||||||||||||
|
2017
(1)
|
2018 - 2019
|
2020 - 2021
|
After 2021
|
Total
|
|||||||||||||||
|
Short and long-term debt
(2)
|
$
|
406.5
|
|
$
|
811.5
|
|
$
|
812.5
|
|
$
|
2,859.6
|
|
$
|
4,890.1
|
|
||||
(1)
Reflects remaining three months of 2017.
|
(2)
|
Short and long-term debt includes interest payments, which were calculated using the effective interest rate at
September 30, 2017
.
|
ITEM 3.
QUANTITATIVE AND QUALITATIVE DISCLOSURES ABOUT MARKET RISK
There have been no material changes to our quantitative or qualitative disclosures found in Item 7A, "Quantitative and Qualitative Disclosures about Market Risk," of our Annual Report on Form 10-K for the year ended
December 31, 2016
.
ITEM 4.
CONTROLS AND PROCEDURES
Conclusion Regarding the Effectiveness of Disclosure Controls and Procedures
Our management, with the participation of our Chief Executive Officer and Chief Financial Officer, has evaluated the effectiveness of the design and operation of our disclosure controls and procedures (as defined in Rule 13a-15(e) or 15d-15(e) of the Exchange Act) as of
September 30, 2017
. Based upon that evaluation, our Chief Executive Officer and Chief Financial Officer have concluded that our disclosure controls and procedures were not effective as of
September 30, 2017
because of the material weaknesses in our internal control over financial reporting described below.
All systems of internal control, no matter how well designed, have inherent limitations. Therefore, even those systems deemed to be effective can provide only reasonable assurance with respect to financial statement preparation and presentation. A material weakness is a deficiency, or combination of deficiencies, in internal control over financial reporting, such that there is a reasonable possibility that a material misstatement of a company’s annual or interim consolidated financial statements will not be prevented or detected on a timely basis.
Evaluation of the Effectiveness of Internal Control over Financial Reporting
We conducted an evaluation of the effectiveness of our internal control over financial reporting based upon the framework established in the 2013 Internal Control - Integrated Framework issued by the Committee of Sponsoring Organizations of the Treadway Commission (“COSO”).
52
Perrigo Company plc
- Item 4
Controls and Procedures
Tysabri
®
Contingent Payments
We acquired the Tysabri
®
royalty stream in our acquisition of Elan Pharmaceuticals plc (“Elan”) in December 2013, and at the time of the acquisition, concluded that the right to receive quarterly royalty payments from Biogen Idec Inc. should be an intangible asset and such payments recognized as revenue in our financial statements. As discussed in Item 4.02 of our Form 8-K filed on April 25, 2017, during the 2016 year-end close process, and in anticipation of our potential sale of the Tysabri
®
royalty rights and the 2018 adoption of ASC 606
Revenue from Contracts with Customers
, we re-evaluated the historical classification of the Tysabri
®
royalty stream as an intangible asset and concluded that it should have been reflected in the financial statements as a financial asset as of its 2013 acquisition date. As part of this evaluation, management determined that its control over the review of the application of the accounting guidance in ASC 805
Business Combinations
did not operate effectively in the appropriate identification of the assets acquired and liabilities assumed in connection with the Elan acquisition in December 2013.
All of our originally filed financial statements through the filing of the Form 10-Q for the quarter ended October 1, 2016, as originally filed on November 10, 2016, included the disclosure of the Elan acquisition with the Tysabri
®
royalty stream presented as an intangible asset. In addition, due to the fact that the asset was historically classified as an intangible asset, we did not design or implement controls around the fair value accounting for the Tysabri
®
royalty stream as a financial asset, so these controls were not in place at any quarter end subsequent to the acquisition, including the date of the quarterly and annual assessment of internal control. Accordingly, management concluded that these control deficiencies represent material weaknesses. As discussed in our Form 10-Q for the quarter ended July 1, 2017, the material weakness related to the fair value accounting for the Tysabri
®
royalty stream as a financial asset was remediated during that period. See below for our discussion of the remediation efforts related to our acquisition of the Tysabri
®
royalty rights.
Income Taxes
Management has determined that we did not design or maintain effective management review controls related to our (1) evaluation of non-routine transactions that impact our effective tax rate on an annual and interim basis and (2) determination of our deferred taxes in connection with business combinations.
During our quarterly and annual fiscal 2016 close processes, management determined that the design and operating effectiveness of our controls around the evaluation of non-routine events did not operate appropriately. As disclosed in our Form 10-Q for the quarterly period ended April 2, 2016, our management review controls did not operate at a sufficient level of precision to ensure interim income taxes were properly recorded and disclosed in our condensed consolidated financial statements in connection with the recording of an indefinite-lived intangible asset impairment and estimated goodwill impairment as part of the Company’s controls to evaluate non-routine events that occur during a quarterly period and the related income tax impacts. These control deficiencies resulted in a material misstatement in income taxes in the preliminary financial statements for the quarter ended April 2, 2016. Additionally, these controls remained unremediated as of September 30, 2017, as they were in February 2017 when we identified that these controls did not appropriately evaluate the need for a valuation allowance. ASC 740,
Income Taxes,
requires a company to record a valuation allowance to reduce a deferred tax asset to its net realizable value. Our controls related to consideration of non-routine transactions or events were not designed and did not operate appropriately and identify whether a valuation allowance was needed as they did not identify that we entered into a three year cumulative loss and did not consider the positive and negative evidence in evaluating the potential sources of taxable income in determining whether a valuation allowance was required in the consolidated financial statements.
In February 2017, management identified the existence of tax basis in certain acquired intangible assets (“tax amortization benefits”) that existed at the time of the acquisition of Omega Pharma Invest N.V. (“Omega”) on March 30, 2015. Upon evaluating the tax amortization benefits, management concluded that the purchase accounting for Omega should have included the tax basis in the intangible assets in calculating the deferred tax liability in the opening balance sheet. This omission of existing tax basis in calculating the deferred tax liability on the acquisition date indicated that management’s review over the opening balance sheet deferred income tax accounts was not designed or operating appropriately.
Accordingly, management concluded that these control deficiencies represent material weaknesses.
53
Perrigo Company plc
- Item 4
Controls and Procedures
Impairment
In connection with our long-lived asset impairment testing, management determined that the controls around the identification of the relevant asset group under ASC 360,
Impairment and Disposal of Long-lived Assets
, did not operate effectively. In determining the level to evaluate the long-lived assets in our animal health reporting unit for impairment testing, we inappropriately grouped the assets that constituted the asset group in applying the guidance in ASC 360.
Accordingly, management concluded that this control deficiency represented a material weakness.
Remediation Plan for the Material Weaknesses
We are committed to remediating the control deficiencies that gave rise to the material weaknesses described above. Management is responsible for implementing changes and improvements to internal control over financial reporting and for remediating the control deficiencies that gave rise to the material weaknesses.
Tysabri
®
Contingent Payments
To remediate the material weakness related to the acquisition of the Tysabri
®
royalty rights, we, with oversight from the Audit committee, designed certain controls around the identification of assets acquired and liabilities assumed in our business combination process. As part of the re-design of the controls, we: (1) considered our controls around the review of the related contracts and agreements and our application of ASC 805 to identify the type of assets acquired and liabilities assumed and (2) evaluated and enhanced management review controls related to business acquisitions. Based on the evaluation of the design and changes to our business acquisition process performed during the second and third quarters of 2017 on these newly implemented controls, we have concluded that these controls have been designed and implemented appropriately. As a result, we consider this material weakness to be remediated as of September 30, 2017.
Income Taxes
To remediate the material weaknesses in internal control over financial reporting related to income taxes, we have, with oversight from the Audit Committee, completed the review of the organizational structure, resources, processes and controls in place to measure and record income taxes to enhance the effectiveness of the design and operation of those controls. In addition, we continue to:
|
•
|
Evaluate the design and operating effectiveness of our controls related to income taxes for business acquisitions and non-routine transactions on an interim and annual basis;
|
|
•
|
Enhance monitoring activities related to income taxes; and
|
|
•
|
Evaluate and enhance the level of precision in the management review controls related to income taxes.
|
We have begun to implement the remediation actions and expect to complete the implementation as part of our 2017 fiscal year closing process. Until the remediation actions are fully implemented and the operational effectiveness of related internal controls is validated through testing, the material weaknesses related to income taxes described above will continue to exist.
Impairment
We, with oversight from the Audit Committee, designed and initiated certain controls around the financial reporting related to the identification of asset groups as part of our impairment testing. Controls we implemented include: (1) reviewing the design and operation of our controls related to asset group determination in our impairment process on an interim and annual basis and (2) evaluating and enhancing the management review controls related to impairment. Based on the testing performed during the second and third quarters of 2017 on these newly implemented controls around the identification of asset groups as part of our impairment testing, we have concluded that these controls have been designed appropriately and are operating effectively. As a result, we consider this material weakness to be remediated as of September 30, 2017.
54
Perrigo Company plc
- Item 4
Controls and Procedures
We are committed to achieving and maintaining a strong internal control environment and believe the remediation measures will strengthen our internal control over financial reporting and remediate the material weaknesses identified. We continue to review the remaining un-remediated material weaknesses and intend to add resources and improve our processes to achieve and maintain a strong control environment. We will continue to monitor the effectiveness of our remediation measures and will make any changes and take such other actions that we deem appropriate given the circumstances.
Changes in Internal Control over Financial Reporting
Other than as described above under "Remediation Plan for Material Weaknesses," there have been no changes in our internal control over financial reporting during the three months ended
September 30, 2017
that have materially affected, or are reasonably likely to materially affect, our internal control over financial reporting.
ITEM 1.
LEGAL PROCEEDINGS
Refer to
Part I, Item 1. Note 14
of the Notes to the Condensed Consolidated Financial Statements.
ITEM 1A.
RISK FACTORS
Our Annual Report on Form 10-K for the year ended December 31, 2016 includes a detailed discussion of our risk factors. At the time of this filing, there have been no material changes to the risk factors that were included in the Form 10-K, other than described below.
We identified material weaknesses in our internal controls over financial reporting; failure to remediate the material weaknesses could negatively impact our business and the price of our ordinary shares.
In connection with our review of certain material misstatements related to the characterization of the Tysabri
®
royalty stream acquired in the Elan transaction, as well as material misstatements related to the calculation of deferred tax liabilities that existed at the time of the acquisition of Omega, and the evaluation of long-lived assets in our animal health reporting unit for impairment testing, in each case contained in certain of our historical financial statements, we concluded that there were material weaknesses in our internal control over financial reporting that contributed to those misstatements. As a result of the material weaknesses, which existed at December 31, 2016 and some of which remained at
September 30, 2017
, we have concluded that we did not maintain, in all material respects, effective internal control over financial reporting as of December 31, 2016, April 1, 2017, July 1, 2017 or September 30, 2017, based on criteria established in Internal Control - Integrated Framework (2013) issued by the Committee of Sponsoring Organizations of the Treadway Commission (“COSO”). The failure to maintain effective control over financial reporting in turn resulted in material deficiencies in our disclosure controls and procedures.
We have identified and begun the implementation of actions, and continue to identify and implement, actions to improve the effectiveness of our internal control over financial reporting and disclosure controls and procedures, but there can be no assurance that such remediation efforts will be successful. We have also incurred and will continue to incur substantial accounting, legal, consulting, and other costs in connection with identifying and remediating the material weaknesses. Failure to remediate the material weaknesses could have a negative impact on our business and the market for our ordinary shares. For more information on our material weaknesses and the status of our remediation efforts, See
Part I, Item 4 - Controls and Procedures
.
We are currently involved in a search for a new Chief Executive Officer and a subsequent search for a permanent Chief Financial Officer. If these searches are delayed, our business could be negatively impacted.
On June 5, 2017, we announced the forthcoming retirement of John T. Hendrickson as our Chief Executive Officer. Mr. Hendrickson will continue to serve as our Chief Executive Officer and a member of our Board until such time as a successor has been appointed. Our Board of Directors has initiated a Chief Executive Officer search process and has retained an executive search and leadership advisory firm to assist with the process of identifying and evaluating candidates.
55
Perrigo Company plc
- Item 1A
Risk Factors
In addition, on February 21, 2017, we announced the resignation of Judy L. Brown as our Executive Vice President, Business Operations and Chief Financial Officer, effective February 27, 2017. Since that time, Ronald L. Winowiecki has served as our acting Chief Financial Officer. Although Mr. Winowiecki remains a key candidate for our permanent Chief Financial Officer, our Board of Directors has suspended its Chief Financial Officer search during its search for Mr. Hendrickson’s successor as Chief Executive Officer. There are no assurances concerning the timing or outcome of our search for a new Chief Executive Officer or subsequent search for a permanent Chief Financial Officer. If there are any delays in this process, or if any transition is not successful, our business could be negatively impacted.
The resolution of uncertain tax positions could be unfavorable, which could have an adverse effect on our business.
Although we believe that our tax estimates are reasonable and that our tax filings are prepared in accordance with all applicable tax laws, the final determination with respect to any tax audit and any related litigation could be materially different from our estimates or from our historical income tax provisions and accruals. The results of an audit or litigation could have a material effect on operating results or cash flows in the periods for which that determination is made. In addition, future period earnings may be adversely impacted by litigation costs, settlements, penalties or interest assessments.
|
•
|
On August 15, 2017, we filed a complaint in the United States District Court for the Western District of Michigan to recover $
163.6 million
of Federal income tax, penalties, and interest assessed and collected by the Internal Revenue Service (“IRS”), plus statutory interest thereon from the dates of payment, for the fiscal years ended June 27, 2009, June 26, 2010, June 25, 2011, and June 30, 2012 (the “2009 tax year,” “2010 tax year,” “2011 tax year,” and “2012 tax year,” respectively). The IRS audits of those years culminated in the issuances of two statutory notices of deficiency: (1) on August 27, 2014 for the 2009 and 2010 tax years and (2) on April 20, 2017 for the 2011 and 2012 tax years. The statutory notices of deficiency both included un-agreed income adjustments related principally to transfer pricing adjustments regarding the purchase, distribution, and sale of store-brand OTC pharmaceutical products in the United States. In addition, the statutory notice of deficiency for the 2011 and 2012 tax years included the capitalization of certain expenses that were deducted when paid or incurred in defending against certain patent infringement lawsuits. We fully paid the assessed amounts of tax, interest, and penalties set forth in the statutory notices and filed timely claims for refund on June 11, 2015 and June 7, 2017 for the 2009-2010 tax years and 2011-2012 tax years, respectively. Our claims for refund were disallowed by certified letters dated August 18, 2015 and July 11, 2017, for the 2009-2010 tax years and 2011-2012 tax years, respectively. The complaint was timely, based upon the refund claim denials, and seeks refunds of tax, interest, and penalties of
$37.2 million
for the 2009 tax year, $
61.5 million
for the 2010 tax year, $
40.2 million
for the 2011 tax year and $
24.7 million
for the 2012 tax year. The amounts sought in the complaint for the 2009 and 2010 tax years were recorded as deferred charges on our balance sheet during the three months ended March 28, 2015, and the amounts sought in the complaint for the 2011 and 2012 tax years were recorded as deferred charges on our balance sheet in the second quarter of the year ending December 31, 2017.
|
|
•
|
On December 22, 2016, we received a notice of proposed adjustment for the IRS audit of Athena Neurosciences, Inc. (“Athena”), a subsidiary of Elan Corporation plc (“Elan”) acquired in 1996, for the years ended December 31, 2011, December 31, 2012 and December 31, 2013. We acquired Elan in December 2013. This proposed amendment relates to the deductibility of litigation costs. We disagree with the IRS’s position asserted in the notice of proposed adjustment and intend to contest it.
|
On July 11, 2017, we received a draft notice of proposed adjustment associated with transfer pricing positions for the IRS audit of Athena for the years ended December 31, 2011, December 31, 2012 and December 31, 2013. Athena was the originator of the patents associated with Tysabri
®
prior to the acquisition of Athena by Elan in 1996. The amount of adjustments that may be asserted by the IRS in the final notice of proposed adjustment cannot be quantified at this time; however, based on the draft notice received, the amount to be assessed may be material. We disagree with the IRS’s position as asserted in the draft notice of proposed adjustment and intend to contest it.
56
Perrigo Company plc
- Item 1A
Risk Factors
There are numerous other income tax jurisdictions for which tax returns are not yet settled, none of which are individually significant. At this time, we cannot predict the outcome of any audit or related litigation. Unfavorable resolutions of the audit matters discussed above could have a material impact on our consolidated financial statements in future periods.
ITEM 2.
UNREGISTERED SALES OF EQUITY SECURITIES AND USE OF PROCEEDS
Share repurchase activity during the
three months ended
September 30, 2017
was as follows:
|
Total Number of Shares Purchased
|
Average Price Paid per Share
|
Total Number of Shares Purchased as Part of Publicly Announced Plans
|
Value of Shares Available for Purchase
(1)
|
||||||||||
|
July 2 - July 31, 2017
|
484,860
|
|
$
|
72.27
|
|
484,860
|
|
||||||
|
August 1 - August 31, 2017
|
1,354,721
|
|
$
|
71.46
|
|
1,354,721
|
|
||||||
|
September 1 - September 30, 2017
|
19,124
|
|
$
|
77.50
|
|
19,124
|
|
||||||
|
Total
|
1,858,705
|
|
$
|
1.30
|
billion
|
||||||||
(1)
The remaining
$1.30 billion
in the table represents the amount available to be repurchased under our 2015 Authorization as of
September 30, 2017
.
ITEM 5.
OTHER INFORMATION
Our Board of Directors has established May 4, 2018 as the date of our 2018 Annual General Meeting of Shareholders (the “2018 Annual Meeting”). Because the date of the 2018 Annual Meeting will be more than 30 days before the anniversary of our 2017 Annual General Meeting of Shareholders, we are informing shareholders of the change in accordance with Rule 14a-5(f) under the Securities Exchange Act of 1934, as amended (the “Exchange Act”).
For shareholders who wish to present a proposal to be considered for inclusion in our proxy materials for the 2018 Annual Meeting, we have set a new deadline for the receipt of those proposals in accordance with Rule 14a-8 under the Exchange Act. To be considered timely, shareholders must submit their proposals, in writing, to our Company Secretary at our principal executive offices located at Treasury Building, Lower Grand Canal Street, Dublin 2, Ireland by December 19, 2017, which we have determined to be a reasonable time before we expect to begin to print and mail our proxy materials. Shareholder proposals must also comply with all applicable requirements of Rule 14a-8.
Because the 2018 Annual Meeting will be more than 30 days before the anniversary of the 2017 Annual General Meeting of Shareholders, our Articles of Association (the “Articles”) provide that shareholders who wish to bring a proposal or nominate a director at the 2018 Annual Meeting, but who are not requesting that the proposal or nomination be included in our proxy materials, must notify our Company Secretary, in writing, not earlier than the close of business on February 3, 2018 and not later than the close of business on February 23, 2018. Shareholders are advised to review the Articles, which contain additional requirements about advance notice of shareholder proposals and director nominations.
57
Perrigo Company plc
- Part II - Item 6
Exhibits
ITEM 6.
EXHIBITS
|
Exhibit
Number
|
Description
|
|
|
3.1
|
||
|
3.2
|
||
|
10.1
|
||
|
10.2
|
||
|
10.3
|
||
|
10.4
|
||
|
10.5
|
||
|
31.1
|
||
|
31.2
|
||
|
32
|
||
|
101.INS
|
XBRL Instance Document.
|
|
|
101.SCH
|
XBRL Taxonomy Extension Schema Document.
|
|
|
101.CAL
|
XBRL Taxonomy Extension Calculation Linkbase Document.
|
|
|
101.DEF
|
XBRL Taxonomy Extension Definition Linkbase Document.
|
|
|
101.LAB
|
XBRL Taxonomy Extension Label Linkbase Document.
|
|
|
101.PRE
|
XBRL Taxonomy Extension Presentation Linkbase Document.
|
|
58
SIGNATURES
Pursuant to the requirements of the Securities Exchange Act of 1934, the registrant has duly caused this report to be signed on its behalf by the undersigned thereunto duly authorized.
|
PERRIGO COMPANY PLC
|
|||
|
(Registrant)
|
|||
|
Date:
|
November 9, 2017
|
By: /s/ John T. Hendrickson
|
|
|
John T. Hendrickson
|
|||
|
Chief Executive Officer
|
|||
|
(Principal Executive Officer)
|
|||
|
Date:
|
November 9, 2017
|
By: /s/ Ronald L. Winowiecki
|
|
|
Ronald L. Winowiecki
|
|||
|
Acting Chief Financial Officer
|
|||
|
(Principal Accounting and Financial Officer)
|
|||
59
TABLE OF CONTENTS
Part I. Financial InformationItem 1. Financial Statements (unaudited)Note 1 Summary Of Significant Accounting PoliciesNote 2 DivestituresNote 3 Goodwill and Other Intangible AssetsNote 4 - Accounts Receivable FactoringNote 5 InventoriesNote 6 Fair Value MeasurementsNote 7 InvestmentsNote 8 Derivative Instruments and Hedging ActivitiesNote 9 Assets Held For SaleNote 10 IndebtednessNote 11 Earnings Per Share and Shareholders' EquityNote 12 Accumulated Other Comprehensive Income (loss)Note 13 Income TaxesNote 14 Commitments and ContingenciesNote 15 Restructuring ChargesNote 16 Segment InformationItem 2. Management's Discussion and Analysis Of Financial Condition and Results Of OperationsItem 3. Quantitative and Qualitative Disclosures About Market RiskItem 4. Controls and ProceduresPart II. Other InformationPart IIItem 1. Legal ProceedingsItem 1A. Risk FactorsItem 2. Unregistered Sales Of Equity Securities and Use Of ProceedsItem 5. Other InformationItem 6. Exhibits